UNITED STATES
SECURITIES AND EXCHANGE COMMISSION
Washington, D.C. 20549
FORM N-CSR
CERTIFIED SHAREHOLDER REPORT OF REGISTERED
MANAGEMENT INVESTMENT COMPANIES
Investment Company Act file number | 811-07185 | |||||||
| ||||||||
Morgan Stanley Select Dimensions Investment Series | ||||||||
(Exact name of registrant as specified in charter) | ||||||||
| ||||||||
522 Fifth Avenue, New York, New York |
| 10036 | ||||||
(Address of principal executive offices) |
| (Zip code) | ||||||
| ||||||||
Sara Furber 522 Fifth Avenue, New York, New York 10036 | ||||||||
(Name and address of agent for service) | ||||||||
| ||||||||
Registrant’s telephone number, including area code: | 212-296-6990 |
| ||||||
| ||||||||
Date of fiscal year end: | December 31, 2010 |
| ||||||
| ||||||||
Date of reporting period: | December 31, 2010 |
| ||||||
Item 1 - Report to Shareholders
MORGAN STANLEY
SELECT DIMENSIONS INVESTMENT SERIES
Annual Report
DECEMBER 31, 2010
The Portfolios are intended to be the funding vehicle for variable annuity contracts and variable life insurance policies offered by the separate accounts of certain life insurance companies.
Morgan Stanley Select Dimensions Investment Series
Table of Contents
| Letter to the Shareholders | 1 | ||||||
| Expense Example | 15 | ||||||
| Portfolio of Investments: | |||||||
| Money Market | 19 | ||||||
| Flexible Income | 21 | ||||||
| Global Infrastructure | 44 | ||||||
| Capital Growth | 47 | ||||||
| Focus Growth | 50 | ||||||
| Capital Opportunities | 52 | ||||||
| Mid Cap Growth | 54 | ||||||
| Financial Statements: | |||||||
| Statements of Assets and Liabilities | 58 | ||||||
| Statements of Operations | 60 | ||||||
| Statements of Changes in Net Assets | 62 | ||||||
| Notes to Financial Statements | 68 | ||||||
| Financial Highlights | 94 | ||||||
| Report of Independent Registered Public Accounting Firm | 102 | ||||||
| Trustee and Officer Information | 103 | ||||||
| Federal Tax Notice | 109 | ||||||
Morgan Stanley Select Dimensions Investment Series
Letter to the Shareholders n December 31, 2010
Dear Shareholder:
Macroeconomic concerns and policy makers' responses to them drove gains in the financial markets in 2010. Investors watched the developed world's slow recovery and deflation risk and the emerging world's accelerating economies and mounting inflationary pressures for signs that either side could be dampening global growth. Governments and central banks in the developed world continued to bolster economies and asset prices with stimulative measures and accommodative monetary conditions. In contrast, rising commodity prices and food shortages contributed to inflationary pressures in the emerging markets. China shifted toward a tightening stance and other emerging market central banks were expected to follow, as economic growth in the emerging markets continued to outpace the global average.
Domestic Equity Overview
The U.S. equity market advanced during the 12-month period. By one measure, the S&P 500® Index, the market was up 15.06% for the year. Intensifying worries about Europe's debt burden and mixed economic data in the U.S. caused the market to retreat early in the year and again in the summer, but these declines were more than offset by rallies in the spring (as the European Union and International Monetary Fund announced a bailout package for Greece and U.S. industrial production improved) and in the late summer (on the anticipation of the Federal Reserve's second round of Treasury assets purchases, known as QE2). The U.S. economy still faced some considerable challenges. Although corporate earnings continued to beat expectations and profit margins were healthy, companies were slow to hire. Concerns about the housing market and debt at the state and local level also weighed on investors' outlooks. Nevertheless, the market ended the year higher, bolstered by the general perception that a double-dip recession was likely averted.
Consumer discretionary, industrials and materials were among the best performing sectors, as investors sought stocks with exposure to the global economic recovery and/or emerging markets demand. The defensively oriented health care and utilities sectors lagged significantly, though all sectors within the S&P 500® Index had positive returns during the period.
Fixed Income Overview
Over the course of 2010, 2-, 5-, 10-, and 30-year Treasury yields declined by 55, 68, 55, and 29 basis points, respectively. Bond investors anticipated that the Federal Reserve (the "Fed") would start to raise short term rates in 2010, but the uneven economic performance of the U.S. economy led the Fed to leave its target federal funds rate unchanged for the second consecutive year.
The Federal Reserve Bank expanded its asset purchase program in November of 2010 and will buy an additional $600 billion in Treasuries, with the result that total Fed purchases over the next six months will amount to between $850 billion and $900 billion, effectively doubling the Fed's holdings of Treasuries. The
Morgan Stanley Select Dimensions Investment Series
Letter to the Shareholders n December 31, 2010 continued
aim of this new round of quantitative easing (QE2) is to support credit markets, with the hope that this will in turn spur increased economic activity.
Investors' increasing risk appetite was reflected in the generally strong performance of the corporate bond sector over the course of the year. Investment-grade credit bonds rallied, with overall credit spreads versus Treasuries ending the year 14 basis points tighter. The financials sector led investment-grade performance for the year, despite experiencing significant spread widening in the second quarter amid concerns about the indebtedness of some peripheral European countries, regulatory reforms in the U.S. financial sector and the Gulf oil spill. The energy sector lagged for the period. The high yield market performed even more strongly than investment grade debt.
The housing market remained weak in 2010 and foreclosure rates continued to climb. The government's Home Affordability Modification Program (HAMP) and other private programs designed to keep distressed mortgages from being sold in the market at distressed prices and to help homeowners keep their homes have not been as successful as expected. Furthermore, although calls for a nationwide moratorium on foreclosures were rejected, in October several large banks halted repossessions while they internally reviewed allegations of improper loan filings. Banks will therefore have to hold foreclosed homes for longer and the supply of homes for sale may be reduced, as foreclosures represent 30% of existing home sales. With the 30-year fixed mortgage rate reaching a historic low during the fourth quarter of 2010, refinancing activity picked up slightly despite tighter underwriting standards. Against this backdrop, the mortgage sector performed well, with higher coupon and long maturity (30-year) issues outperforming for the 12-month period.
With the Fed maintaining its target federal funds rate near zero percent during the 12-month period, money market yields remained relatively depressed. The Fed was widely expected to keep monetary policy accomodative for an extended period, likely postponing any interest rate hikes until later in 2011 or possibly in 2012.
International Equity Overview
International equities gained moderately for the year, with emerging markets outpacing developed markets (as measured by the MSCI Emerging Markets Index which returned 18.88% and MSCI EAFE Index which returned 7.75%, respectively). While emerging market equities as a whole performed well, China was a notable exception, with one of the lower returns of only 4.63% for the period. Markets in Southeast Asia and Latin America were among the top global performers for the year. The developed markets' advance was hampered primarily by Europe, as the region's sovereign debt crisis caused considerable volatility throughout the period. Not surprisingly, markets in the most heavily indebted countries were among the weakest performers, including Greece, Ireland, Italy, Portugal and Spain. Conversely, Germany, the eurozone's largest economy, benefited from strong Gross Domestic Product (GDP) growth, low unemployment and robust consumer confidence.
2
Morgan Stanley Select Dimensions Investment Series
Letter to the Shareholders n December 31, 2010 continued
As in the U.S., international sector performance was led by groups most likely to benefit from global economic recovery, including industrials, materials, consumer discretionary and technology.
Flexible Income Portfolio
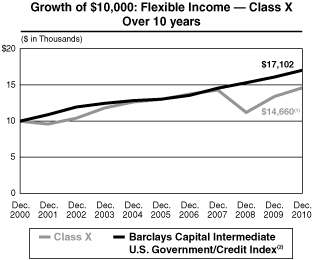
For the 12-month period ended December 31, 2010, Select Dimensions — Flexible Income Portfolio Class X shares produced a total return of 9.08%, outperforming the Barclays Capital Intermediate U.S. Government/Credit Index (the "Index"), which returned 5.89%. For the same period, the Portfolio's Class Y shares returned 8.85%. Past performance is no guarantee of future results.
The performance of the Portfolio's two share classes varies because each has different expenses. The Portfolio's total returns assume the reinvestment of all distributions but do not reflect the deduction of any charges by your insurance company. Such costs would lower performance.
During the year, the Portfolio was positioned based on our expectations for a continued outperformance of business cycle sensitive sectors, with positions in emerging market debt, high yield credit and non-agency mortgages (segments not represented in the Index), as well as an overweight to investment grade credit. We believe the combination of low U.S. Treasury yields and the stimulative monetary and fiscal policy may continue to tighten spreads of non-government sectors in the near term.
The Portfolio's allocation to investment-grade credit was the main driver of outperformance for the year.
Performance data quoted represents past performance, which is no guarantee of future results and current performance may be lower or higher than the figures shown. For most recent month-end performance figures, please contact the issuing insurance company or speak with your Financial Advisor. Investment return and principal value will fluctuate. When you sell Portfolio shares, they may be worth less than their original cost. Total returns do not reflect the deduction of taxes that a shareholder would pay on Portfolio distributions or the redemption of Portfolio shares. Performance for Class Y shares will vary from the performance of Class X shares due to differences in expenses. Performance assumes reinvestment of all distributions for the underlying portfolio based on net asset value (NAV). It does not reflect the deduction of insurance expenses, an annual contract maintenance fee, or surrender charges. If performance information included the effect of these additional charges, the total returns would be lower.
Average Annual Total Returns as of December 31, 2010
| 1 Year | 5 Years | 10 Years | Since Inception* | ||||||||||||||||
| Class X | 9.08 | % | 2.38 | % | 3.90 | % | 3.80 | % | |||||||||||
| Class Y | 8.85 | % | 2.15 | % | 3.64 | % | 3.01 | % | |||||||||||
(1) Ending value on December 31, 2010 for the underlying portfolio. This figure does not reflect the deduction of any account fees or sales charges.
(2) The Barclays Capital Intermediate U.S. Government/Credit Index tracks the performance of U.S. government and corporate obligations, including U.S. government agency and Treasury securities, and corporate and Yankee bonds with maturities of 1 to 10 years. The Index is unmanaged and its returns do not include any sales charges or fees. Such costs would lower performance. It is not possible to invest directly in an index.
* Inception dates of November 9, 1994 for Class X and July 24, 2000 for Class Y.
3
Morgan Stanley Select Dimensions Investment Series
Letter to the Shareholders n December 31, 2010 continued
Within the corporate sector, the Portfolio's positioning in financials was most beneficial to relative performance.
The Portfolio's allocation to high yield corporate credit and emerging market debt, sectors that are not represented in the Index, contributed to relative returns as spreads in both sectors tightened over the year. The Portfolio also maintained a tactical position in non-agency mortgages, which was beneficial to performance. This sector is also not represented in the Index.
With regard to the Portfolio's yield curve positioning, we employed tactical strategies involving interest rates swaps that were designed to take advantage of anomalies across the swap curve. For example, we positioned the Portfolio to benefit from a flattening between the short and intermediate points of the yield curve. Another trade involved paying fixed rates on longer maturity swaps versus holding similar duration Treasuries. Overall, interest-rate trades detracted slightly from relative performance. The Portfolio was underweight the agency sector, which also slightly dampened performance.
There is no guarantee that any sectors mentioned will continue to perform as discussed above or that securities in such sectors will be held by the Portfolio in the future.
Global Infrastructure Portfolio
For the 12-month period ended December 31, 2010, Select Dimensions — Global Infrastructure Portfolio Class X shares produced a total return of 7.13%, underperforming the Dow Jones Brookfield Global Infrastructure Index (the "Index"), which
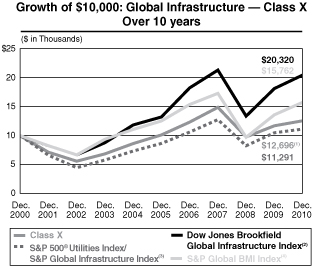
Performance data quoted represents past performance, which is no guarantee of future results and current performance may be lower or higher than the figures shown. For most recent month-end performance figures, please contact the issuing insurance company or speak with your Financial Advisor. Investment return and principal value will fluctuate. When you sell Portfolio shares, they may be worth less than their original cost. Total returns do not reflect the deduction of taxes that a shareholder would pay on Portfolio distributions or the redemption of Portfolio shares. Performance for Class Y shares will vary from the performance of Class X shares due to differences in expenses. Performance assumes reinvestment of all distributions for the underlying portfolio based on net asset value (NAV). It does not reflect the deduction of insurance expenses, an annual contract maintenance fee, or surrender charges. If performance information included the effect of these additional charges, the total returns would be lower.
Average Annual Total Returns as of December 31, 2010
| 1 Year | 5 Years | 10 Years | Since Inception* | ||||||||||||||||
| Class X | 7.13 | % | 4.19 | % | 2.42 | % | 8.74 | % | |||||||||||
| Class Y | 6.81 | % | 3.92 | % | 2.16 | % | 1.33 | % | |||||||||||
(1) Ending value on December 31, 2010 for the underlying portfolio. This figure does not reflect the deduction of any account fees or sales charges.
(2) The Dow Jones Brookfield Global Infrastructure IndexSM is a float-adjusted market capitalization weighted index that measures the stock performance of companies that exhibit strong infrastructure characteristics. The Index intends to measure all sectors of the infrastructure market. The Index was first published in July 2008; however, back-tested hypothetical performance information is available for this Index since December 31, 2002. Returns are calculated using the return data of the S&P Global BMI Index through December 31, 2002 and the return data of the Dow Jones Brookfield Global Infrastructure Index for periods thereafter. The Index is unmanaged and its returns do not include any sales charges or fees. Such costs would lower performance. It is not possible to invest directly in an index. The Portfolio's secondary benchmark was changed in March 2010 from the S&P 500 Utilities Index/S&P Global Infrastructure Index to the Dow Jones Brookfield Global Infrastructure Index to more accurately reflect the Portfolio's investable universe.
(3) The S&P 500® Utilities Index/S&P Global Infrastructure Index is a custom index represented by the performance of the S&P 500® Utilities Index for periods from the Fund's inception to and including November 5, 2008 (the date the Portfolio completed implementation of the change to its principal investment strategy), and the performance of the S&P Global Infrastructure Index for periods thereafter. The Index is unmanaged and its returns do not include any sales charges or fees. Such costs would lower performance. It is not possible to invest directly in an index.
(4) The Standard & Poor's Global BMI Index (S&P Global BMI Index) is a broad market index designed to capture exposure to equities in all countries in the world that meet minimum size and liquidity requirements. As of the date of this Report, there are approximately 11,000 index members representing 27 developed and 26 emerging market countries. The Index is unmanaged and its returns do not include any sales charges or fees. Such costs would lower performance. It is not possible to invest directly in an index.
* Inception dates of November 9, 1994 for Class X and July 24, 2000 for Class Y.
4
Morgan Stanley Select Dimensions Investment Series
Letter to the Shareholders n December 31, 2010 continued
returned 12.46%, and the S&P Global BMI Index, which returned 15.11%, and outperforming the S&P 500® Utilities Index/S&P Global Infrastructure Index, which returned 5.77%. For the same period, the Portfolio's Class Y shares returned 6.81%. Past performance is no guarantee of future results.
The performance of the Portfolio's two share classes varies because each has different expenses. The Portfolio's total returns assume the reinvestment of all distributions but do not reflect the deduction of any charges by your insurance company. Such costs would lower performance.
Infrastructure shares appreciated 12.46% during 2010, as measured by the Dow Jones Brookfield Global Infrastructure Index. Among the major infrastructure sectors, the gas midstream, pipeline companies, transmission and distribution, and communications sectors exhibited relative outperformance, while the toll roads, European regulated utilities and gas distribution utilities sectors underperformed the Index.
Despite consisting of companies with good cash flow resilience over the various ups and downs of the economic cycle, the listed infrastructure universe witnessed market conditions in 2010 which were dominated by macroeconomic considerations, in particular concerns about the health of the European financial system. Because of this, sectors with a high concentration of companies within the European region, in particular the toll roads and European regulated utilities, underperformed the broader infrastructure market — even though on a fundamental basis conditions broadly improved relative to 2009. Toward the end of the year, concerns about Europe were replaced with a focus on Asia, as politicians and central banks within the region attempted to control inflation brought on by rapid economic growth and the spillover effects of loose monetary policy within the U.S. and Western Europe. Within infrastructure, this shift in investor focus to concerns over inflation in Asia was realized most acutely within the gas distribution utilities sector, where increases in natural gas prices were put on hold for certain residential customers of Chinese gas utilities in order to mute inflationary pressures on that customer segment. Gas prices are typically a pass-through cost item within a gas distribution utility's cost structure, so this near-term inability to pass through energy costs should likely have a negative near-term impact on cash flows for these stocks.
Away from macroeconomic considerations within the gas distribution utilities, toll roads, and European regulated utilities sectors, positive underlying fundamentals within energy infrastructure provided support for gas midstream companies, and to a more moderate extent, pipeline companies. Relative outperformance for companies in the gas midstream sector was attributable to the resilient demand for and favorable economics associated with drilling for natural gas liquids and crude oil. New drilling by exploration and production companies in liquids-rich areas throughout North America was significant in 2010, and early
5
Morgan Stanley Select Dimensions Investment Series
Letter to the Shareholders n December 31, 2010 continued
indications are that this positive fundamental backdrop will continue in 2011. We believe much of the future impact of these positive fundamental trends are already reflected in stock prices; however, we acknowledge that gas midstream and pipeline companies are likely to further benefit in 2011 as they attempt to accommodate exploration and production company needs to gather, process, and transport new product. Furthermore, we note that on a stock-specific basis, a select few of these companies remain quite attractively valued.
Finally, we attribute strong transmission and distribution sector performance to merger and acquisition activity, the impact of favorable weather trends relative to last year, and increases in cash flow resulting from recent rate case rulings. Uncertainty about the U.S. economy over much of the year also provided support for this sector, as investors looked for high yielding companies with stable growth prospects. The communications sector benefited primarily due strong fundamental growth trends, as wireless communications and satellite television providers continued to utilize wireless tower companies and fixed satellite operators to build out capacity for new content (data services associated with cellular phones for wireless communications companies and digital television services for the satellite television providers).
Portfolio performance over this time period reflected a number of changes coincident with our assumption of portfolio management responsibilities at the end of March 2010: the two most important being (1) a change in the Portfolio's sector benchmark to the Dow Jones Brookfield Global Infrastructure Index and (2) a shift in Portfolio holdings to reflect our fundamental, value-driven investment strategy. Holdings in the Portfolio now generally reflect companies with "core" infrastructure characteristics such as asset ownership/control, high barriers to entry, and cash flow stability. Furthermore, holdings of companies with exposure to commodity price fluctuations have been significantly reduced. While these changes have had a negative impact on short-term performance, we anticipate the changes in Portfolio strategy and company constituents should provide investors with a more attractive risk/return profile over the long run.
We have maintained our core investment philosophy as an infrastructure value investor. This results in the ownership of stocks whose share prices provide infrastructure exposure at the best valuation relative to their underlying assets and growth prospects. Our current research leads us to an overweighting in the Portfolio to a group of companies in the communications and toll roads sectors, and an underweighting to companies in the European regulated utilities, gas distribution utilities, transmission and distribution, and water sectors.
There is no guarantee that any sectors mentioned will continue to perform as discussed above or that securities in such sectors will be held by the Portfolio in the future.
6
Morgan Stanley Select Dimensions Investment Series
Letter to the Shareholders n December 31, 2010 continued
Capital Growth Portfolio
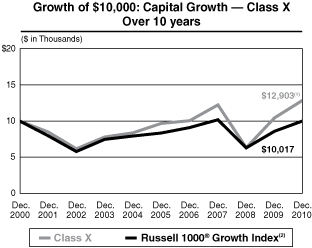
For the 12-month period ended December 31, 2010, Select Dimensions — Capital Growth Portfolio Class X shares produced a total return of 23.70%, outperforming the Russell 1000® Growth Index (the "Index"), which returned 16.71%. For the same period, the Portfolio's Class Y shares returned 23.35%. Past performance is no guarantee of future results.
The performance of the Portfolio's two share classes varies because each has different expenses. The Portfolio's total returns assume the reinvestment of all distributions but do not reflect the deduction of any charges by your insurance company. Such costs would lower performance.
Our emphasis on high-quality companies with sustainable competitive advantages led to positive results versus broad market. Throughout the year, concerns about the U.S. economy and the financial conditions of several debt-ridden European nations intensified worries about the global economy's recovery and led to increased volatility in the marketplace. We were confident in the long-term prospects of the positions we held in the Portfolio, given these companies' attractive valuations and strong balance sheets. Our focus on free cash flow yield and rising return on capital led us to invest in high-quality names which outperformed despite the volatility in the market place. Going forward, we maintain our three- to five-year outlook and continue seeking to capitalize on compelling opportunities to upgrade the portfolio.
Performance data quoted represents past performance, which is no guarantee of future results and current performance may be lower or higher than the figures shown. For most recent month-end performance figures, please contact the issuing insurance company or speak with your Financial Advisor. Investment return and principal value will fluctuate. When you sell Portfolio shares, they may be worth less than their original cost. Total returns do not reflect the deduction of taxes that a shareholder would pay on Portfolio distributions or the redemption of Portfolio shares. Performance for Class Y shares will vary from the performance of Class X shares due to differences in expenses. Performance assumes reinvestment of all distributions for the underlying portfolio based on net asset value (NAV). It does not reflect the deduction of insurance expenses, an annual contract maintenance fee, or surrender charges. If performance information included the effect of these additional charges, the total returns would be lower.
Average Annual Total Returns as of December 31, 2010
| 1 Year | 5 Years | 10 Years | Since Inception* | ||||||||||||||||
| Class X | 23.70 | % | 5.97 | % | 2.58 | % | 7.29 | % | |||||||||||
| Class Y | 23.35 | % | 5.71 | % | 2.32 | % | 0.20 | % | |||||||||||
(1) Ending value on December 31, 2010 for the underlying portfolio. This figure does not reflect the deduction of any account fees or sales charges.
(2) The Russell 1000® Growth Index measures the performance of the large-cap growth segment of the U.S. equity universe. It includes those Russell 1000® Index companies with higher price-to-book ratios and higher forecasted growth values. The Russell 1000® Index is an index of approximately 1,000 of the largest U.S. companies based on a combination of market capitalization and current index membership. The Index is unmanaged and its returns do not include any sales charges or fees. Such costs would lower performance. It is not possible to invest directly in an index.
* Inception dates of November 9, 1994 for Class X and July 24, 2000 for Class Y.
7
Morgan Stanley Select Dimensions Investment Series
Letter to the Shareholders n December 31, 2010 continued
Stock selection and an underweight in technology had the largest positive effect on relative performance. Exposure to the computer technology industry drove gains. Both stock selection and an overweight in consumer discretionary were advantageous to relative performance, with outperformance from the casinos and gambling industry. The health care sector was another source of relative strength, due to stock selection and an underweight in the sector. The medical equipment industry was the sector's leading contributor.
Conversely, stock selection and an underweight in the materials and processing sector offset relative gains elsewhere. Within the sector, the fertilizer industry was the most detrimental to returns. Stock selection and an underweight in the energy sector also dampened relative performance, primarily due to exposure to natural gas producers. Finally, an overweight in financial services was disadvantageous. However this was somewhat mitigated by good stock selection in the sector, particularly in diversified conglomerates.
There is no guarantee that any sectors mentioned will continue to perform as discussed above or that securities in such sectors will be held by the Portfolio in the future.
Focus Growth Portfolio
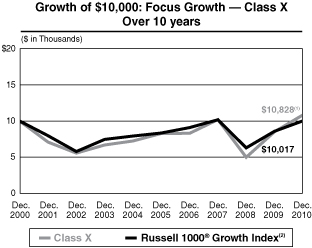
For the 12-month period ended December 31, 2010, Select Dimensions — Focus Growth Portfolio Class X shares produced a total return of 27.41%, outperforming the Russell 1000® Growth Index
Performance data quoted represents past performance, which is no guarantee of future results and current performance may be lower or higher than the figures shown. For most recent month-end performance figures, please contact the issuing insurance company or speak with your Financial Advisor. Investment return and principal value will fluctuate. When you sell Portfolio shares, they may be worth less than their original cost. Total returns do not reflect the deduction of taxes that a shareholder would pay on Portfolio distributions or the redemption of Portfolio shares. Performance for Class Y shares will vary from the performance of Class X shares due to differences in expenses. Performance assumes reinvestment of all distributions for the underlying portfolio based on net asset value (NAV). It does not reflect the deduction of insurance expenses, an annual contract maintenance fee, or surrender charges. If performance information included the effect of these additional charges, the total returns would be lower.
Average Annual Total Returns as of December 31, 2010
| 1 Year | 5 Years | 10 Years | Since Inception* | ||||||||||||||||
| Class X | 27.41 | % | 5.56 | % | 0.80 | % | 9.61 | % | |||||||||||
| Class Y | 27.07 | % | 5.29 | % | 0.54 | % | 0.08 | % | |||||||||||
(1) Ending value on December 31, 2010 for the underlying portfolio. This figure does not reflect the deduction of any account fees or sales charges.
(2) The Russell 1000® Growth Index measures the performance of the large-cap growth segment of the U.S. equity universe. It includes those Russell 1000® Index companies with higher price-to-book ratios and higher forecasted growth values. The Russell 1000® Index is an index of approximately 1,000 of the largest U.S. companies based on a combination of market capitalization and current index membership. The Index is unmanaged and its returns do not include any sales charges or fees. Such costs would lower performance. It is not possible to invest directly in an index.
* Inception dates of November 9, 1994 for Class X and July 24, 2000 for Class Y.
8
Morgan Stanley Select Dimensions Investment Series
Letter to the Shareholders n December 31, 2010 continued
(the "Index"), which returned 16.71%. For the same period, the Portfolio's Class Y shares returned 27.07%. Past performance is no guarantee of future results.
The performance of the Portfolio's two share classes varies because each has different expenses. The Portfolio's total returns assume the reinvestment of all distributions but do not reflect the deduction of any charges by your insurance company. Such costs would lower performance.
Our emphasis on high-quality companies with sustainable competitive advantages led to positive results versus broad market. Throughout the year, concerns about the U.S. economy and the financial conditions of several debt-ridden European nations intensified worries about the global economy's recovery and led to increased volatility in the marketplace. We were confident in the long-term prospects of the positions we held in the Portfolio, given these companies' attractive valuations and strong balance sheets. Our focus on free cash flow yield and rising return on capital led us to invest in high-quality names which outperformed despite the volatility in the market place. Going forward, we maintain our three- to five-year outlook and continue seeking to capitalize on compelling opportunities to upgrade the portfolio.
Relative outperformance was largely driven by stock selection in the technology sector, despite the negative influence of an overweight. Exposure to the computer services, software and systems industry drove gains. Stock selection in consumer discretionary was also advantageous to relative performance, with outperformance from the casinos and gambling industry. The health care sector was another source of relative strength, due to stock selection and an underweight in the sector. The medical equipment industry was the sector's leading contributor.
Conversely, stock selection and an underweight in the materials and processing sector had the largest negative effect on relative results. Within the sector, the fertilizer industry was the most detrimental to returns. Stock selection and an underweight in the energy sector also dampened relative performance, primarily due to exposure to natural gas producers. An underweight and stock selection in the consumer staples sector were a drag on returns, with weakness from the brewers and distillers segment of the beverages industry.
There is no guarantee that any sectors mentioned will continue to perform as discussed above or that securities in such sectors will be held by the Portfolio in the future.
9
Morgan Stanley Select Dimensions Investment Series
Letter to the Shareholders n December 31, 2010 continued
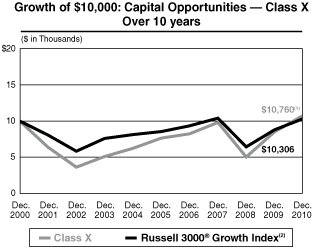
Capital Opportunities Portfolio
For the 12-month period ended December 31, 2010, Select Dimensions — Capital Opportunities Portfolio Class X shares produced a total return of 26.99%, outperforming the Russell 3000® Growth Index (the "Index"), which returned 17.64%. For the same period, the Portfolio's Class Y shares returned 26.71%. Past performance is no guarantee of future results.
The performance of the Portfolio's two share classes varies because each has different expenses. The Portfolio's total returns assume the reinvestment of all distributions but do not reflect the deduction of any charges by your insurance company. Such costs would lower performance.
Our emphasis on high-quality companies with sustainable competitive advantages led to positive results versus broad market. Throughout the year, concerns about the U.S. economy and the financial conditions of several debt-ridden European nations intensified worries about the global economy's recovery and led to increased volatility in the marketplace. We were confident in the long-term prospects of the positions we held in the Portfolio, given these companies' attractive valuations and strong balance sheets. Our focus on free cash flow yield and rising return on capital led us to invest in high-quality names which outperformed despite the volatility in the market place. Going forward, we maintain our three- to five-year outlook and continue seeking to capitalize on compelling opportunities to upgrade the portfolio.
Performance data quoted represents past performance, which is no guarantee of future results and current performance may be lower or higher than the figures shown. For most recent month-end performance figures, please contact the issuing insurance company or speak with your Financial Advisor. Investment return and principal value will fluctuate. When you sell Portfolio shares, they may be worth less than their original cost. Total returns do not reflect the deduction of taxes that a shareholder would pay on Portfolio distributions or the redemption of Portfolio shares. Performance for Class Y shares will vary from the performance of Class X shares due to differences in expenses. Performance assumes reinvestment of all distributions for the underlying portfolio based on net asset value (NAV). It does not reflect the deduction of insurance expenses, an annual contract maintenance fee, or surrender charges. If performance information included the effect of these additional charges, the total returns would be lower.
Average Annual Total Returns as of December 31, 2010
| 1 Year | 5 Years | 10 Years | Since Inception* | ||||||||||||||||
| Class X | 26.99 | % | 7.18 | % | 0.74 | % | 4.44 | % | |||||||||||
| Class Y | 26.71 | % | 6.91 | % | 0.48 | % | –3.86 | % | |||||||||||
(1) Ending value on December 31, 2010 for the underlying portfolio. This figure does not reflect the deduction of any account fees or sales charges.
(2) The Russell 3000® Growth Index measures the performance of the broad growth segment of the U.S. equity universe. It includes those Russell 3000® Index companies with higher price-to-book ratios and higher forecasted growth values. The Russell 3000® Index measures the performance of the largest 3000 U.S. companies representing approximately 98% of the investable U.S. equity market. The Index is unmanaged and its returns do not include any sales charges or fees. Such costs would lower performance. It is not possible to invest directly in an index.
* Inception dates of January 21, 1997 for Class X and July 24, 2000 for Class Y.
10
Morgan Stanley Select Dimensions Investment Series
Letter to the Shareholders n December 31, 2010 continued
Stock selection in technology had the largest positive effect on relative performance, although an overweight slightly detracted. Exposure to the computer services, software and systems industry drove gains. Stock selection in consumer discretionary was advantageous to relative performance, led by the casinos and gambling industry, although the Portfolio's overweight had a negative impact on performance. Stock selection in materials and processing was favorable to relative performance, primarily due to the diversified metals and minerals industry.
In contrast, relative gains were dampened by both stock selection and an underweight in the energy sector. Within the sector, our exposure to natural gas producers was the primary cause for the underperformance. An overweight in financial services detracted from performance, but relative weakness was partially offset by positive results from our stock selection. The financial data and systems industry was the most disadvantageous to relative performance within the sector.
There is no guarantee that any sectors mentioned will continue to perform as discussed above or that securities in such sectors will be held by the Portfolio in the future.
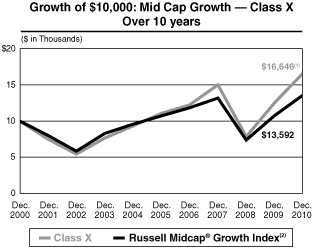
Mid Cap Growth Portfolio
For the 12-month period ended December 31, 2010, Select Dimensions — Mid Cap Growth Portfolio Class X shares produced a total return of 32.79%, outperforming the Russell Midcap® Growth Index
Performance data quoted represents past performance, which is no guarantee of future results and current performance may be lower or higher than the figures shown. For most recent month-end performance figures, please contact the issuing insurance company or speak with your Financial Advisor. Investment return and principal value will fluctuate. When you sell Portfolio shares, they may be worth less than their original cost. Total returns do not reflect the deduction of taxes that a shareholder would pay on Portfolio distributions or the redemption of Portfolio shares. Performance for Class Y shares will vary from the performance of Class X shares due to differences in expenses. Performance assumes reinvestment of all distributions for the underlying portfolio based on net asset value (NAV). It does not reflect the deduction of insurance expenses, an annual contract maintenance fee, or surrender charges. If performance information included the effect of these additional charges, the total returns would be lower.
Average Annual Total Returns as of December 31, 2010
| 1 Year | 5 Years | 10 Years | Since Inception* | ||||||||||||||||
| Class X | 32.79 | % | 8.53 | % | 5.23 | % | 11.02 | % | |||||||||||
| Class Y | 32.47 | % | 8.26 | % | 4.96 | % | 3.36 | % | |||||||||||
(1) Ending value on December 31, 2010 for the underlying portfolio. This figure does not reflect the deduction of any account fees or sales charges.
(2) The Russell Midcap® Growth Index measures the performance of the mid-cap growth segment of the U.S. equity universe. It includes those Russell Midcap® Index companies with higher price-to-book ratios and higher forecasted growth values. The Russell Midcap® Index is a subset of the Russell 1000® Index and includes approximately 800 of the smallest securities in the Russell 1000® Index, which in turn consists of approximately 1,000 of the largest U.S. securities based on a combination of market capitalization and current index membership. The Index is unmanaged and its returns do not include any sales charges or fees. Such costs would lower performance. It is not possible to invest directly in an index.
* Inception dates of November 9, 1994 for Class X and July 24, 2000 for Class Y.
11
Morgan Stanley Select Dimensions Investment Series
Letter to the Shareholders n December 31, 2010 continued
(the "Index"), which returned 26.38%. For the same period, the Portfolio's Class Y shares returned 32.47%. Past performance is no guarantee of future results.
The performance of the Portfolio's two share classes varies because each has different expenses. The Portfolio's total returns assume the reinvestment of all distributions but do not reflect the deduction of any charges by your insurance company. Such costs would lower performance.
Our emphasis on high-quality companies with sustainable competitive advantages led to positive results versus broad market. Throughout the year, concerns about the U.S. economy and the financial conditions of several debt-ridden European nations intensified worries about the global economy's recovery and led to increased volatility in the marketplace. We were confident in the long-term prospects of the positions we held in the Portfolio, given these companies' attractive valuations and strong balance sheets. Our focus on free cash flow yield and rising return on capital led us to invest in high-quality names which outperformed despite the volatility in the market place. Going forward, we maintain our three- to five-year outlook and continue seeking to capitalize on compelling opportunities to upgrade the portfolio.
Stock selection in technology had by far the largest positive effect on relative performance. Within the sector, the computer services, software and systems industry was the most additive. Both stock selection and an overweight in consumer discretionary were advantageous to relative performance, led by the hotel/motel industry. Stock selection in the materials and processing sector also benefited results, particularly in the diversified chemicals industry.
However, relative performance was hampered by stock selection and an underweight in the energy sector. Exposure to natural gas producers was the primary cause of the underperformance there. Both stock selection and an overweight in financial services dampened relative performance, with particularly weak results from the financial data and systems industry. Relative returns were also diminished by stock selection in producer durables, although an overweight in the sector was slightly beneficial. Within the sector, the commercial services industry was the most disadvantageous to performance.
There is no guarantee that any sectors mentioned will continue to perform as discussed above or that securities in such sectors will be held by the Portfolio in the future.
Money Market Portfolio
An investment in a money market fund is not insured or guaranteed by the Federal Deposit Insurance Corporation or any other government agency. Although money market funds seek to preserve the value of an investment at $1.00 per share, it is possible to lose money by investing in such funds.
12
Morgan Stanley Select Dimensions Investment Series
Letter to the Shareholders n December 31, 2010 continued
As of December 31, 2010, Select Dimensions — Money Market Portfolio had net assets of approximately $100 million with an average portfolio maturity of 24 days. For the seven-day period ended December 31, 2010, the Portfolio's Class X shares provided an effective annualized yield of 0.01% (subsidized) and –0.25% (non-subsidized) and a current yield of 0.01% (subsidized) and –0.25% (non-subsidized), while its 30-day moving average yield for December was 0.01% (subsidized) and –0.26% (non-subsidized). Yield quotations more closely reflect the current earnings of the Portfolio. The non-subsidized yield reflects what the yield would have been had a fee and/or expense waiver not been in place during the period shown. For the 12-month period ended December 31, 2010, the Portfolio's Class X shares returned 0.01%. Past performance is no guarantee of future results.
For the seven-day period ended December 31, 2010, the Portfolio's Class Y shares provided an effective annualized yield of 0.01% (subsidized) and –0.50% (non-subsidized) and a current yield of 0.01% (subsidized) and –0.51% (non-subsidized), while its 30-day moving average yield for December was 0.01% (subsidized) and –0.51% (non-subsidized). Yield quotations more closely reflect the current earnings of the Portfolio. The non-subsidized yield reflects what the yield would have been had a fee and/or expense waiver not been in place during the period shown. For the 12-month period ended December 31, 2010, the Portfolio's Class Y shares returned 0.01%. Past performance is no guarantee of future results.
The performance of the Portfolio's two share classes varies because each has different expenses. The Portfolio's total returns assume the reinvestment of all distributions but do not reflect the deduction of any charges by your insurance company. Such costs would lower performance.
During the reporting period, three-month London Interbank Offered Rate ("LIBOR") levels dropped significantly. In early July, the market had begun to stabilize from the European debt crisis of May/June, when fears of a Greece default and contagion drove three-month LIBOR approximately 30 basis points higher to just under 0.54%. As European banking system stress tests were completed and the European Central Bank subsequently extended full allotment, three-month tender auctions through year-end, three-month LIBOR levels gradually fell back to 0.285% by November, with a slight rise back up to 0.302% by year-end.
With LIBOR and LIBOR/OIS spreads again trading back down to tight levels, we found very little value in the money market curve. Our strategy in managing the Portfolio remained consistent with our long-term focus on capital preservation and very high liquidity and as in the past, we adhered to a conservative approach. During the reporting period, we continued to emphasize purchasing high-quality corporate, financial, and banking obligations. We focused on maintaining high levels of liquidity and a prudent
13
Morgan Stanley Select Dimensions Investment Series
Letter to the Shareholders n December 31, 2010 continued
weighted average maturity and weighted average life to guard the Portfolio against the uncertainty caused by volatility in the financial markets. We continue to review all eligible securities on our purchase list in an attempt to ensure that they continue to meet our high standards of minimal credit risk.
There is no guarantee that any sectors mentioned will continue to perform as discussed above or that securities in such sectors will be held by the Portfolio in the future.
We appreciate your ongoing support of Morgan Stanley Select Dimensions Investment Series and look forward to continuing to serve your investment needs.
Very truly yours,

Sara Furber
President and Principal Executive Officer
14
Morgan Stanley Select Dimensions Investment Series
Expense Example n December 31, 2010
As a shareholder of the Portfolio, you incur two types of costs: (1) insurance company charges; and (2) ongoing costs, including advisory fees; distribution and service (12b-1) fees; and other Portfolio expenses. This example is intended to help you understand your ongoing costs (in dollars) of investing in the Portfolio and to compare these costs with the ongoing costs of investing in other mutual funds.
The example is based on an investment of $1,000 invested at the beginning of the period and held for the entire period 07/01/10 – 12/31/10.
Actual Expenses
The first line of the table below provides information about actual account values and actual expenses. You may use the information in this line, together with the amount you invested, to estimate the expenses that you paid over the period. Simply divide your account value by $1,000 (for example, an $8,600 account value divided by $1,000 = 8.6), then multiply the result by the number in the first line under the heading entitled "Expenses Paid During Period" to estimate the expenses you paid on your account during this period.
Hypothetical Example for Comparison Purposes
The second line of the table below provides information about hypothetical expenses based on the Portfolio's actual expense ratio and an assumed rate of return of 5% per year before expenses, which is not the Portfolio's actual return. The hypothetical account values and expenses may not be used to estimate the actual ending account balance or expenses you paid for the period. You may use this information to compare the ongoing cost of investing in the Portfolio and other funds. To do so, compare this 5% hypothetical example with the 5% hypothetical examples that appear in the shareholder reports of the other funds.
Please note that the expenses shown in the table are meant to highlight your ongoing costs only and do not reflect any insurance company charges. Therefore, the second line of the table is useful in comparing ongoing costs, and will not help you determine the relative total cost of owning different funds. In addition, if these insurance company charges were included, your costs would have been higher.
15
Morgan Stanley Select Dimensions Investment Series
Expense Example n December 31, 2010 continued
Money Market
| Beginning Account Value | Ending Account Value | Expenses Paid During Period@ | |||||||||||||
| 07/01/10 | 12/31/10 | 07/01/10 – 12/31/10 | |||||||||||||
| Class X | |||||||||||||||
| Actual (0.01% return) | $ | 1,000.00 | $ | 1,000.10 | $ | 1.81 | |||||||||
| Hypothetical (5% annual return before expenses) | $ | 1,000.00 | $ | 1,023.39 | $ | 1.84 | |||||||||
| Class Y | |||||||||||||||
| Actual (0.01% return) | $ | 1,000.00 | $ | 1,000.10 | $ | 1.81 | |||||||||
| Hypothetical (5% annual return before expenses) | $ | 1,000.00 | $ | 1,023.39 | $ | 1.84 | |||||||||
@ Expenses are equal to the Portfolio's annualized expense ratios of 0.36% and 0.36% for Class X and Class Y shares, respectively, multiplied by the average account value over the period, multiplied by 184/365 (to reflect the one-half year period). If the Portfolio had borne all of its expenses, the annualized expense ratios would have been 0.61% and 0.86% for class X and Class Y shares, respectively.
Flexible Income
| Beginning Account Value | Ending Account Value | Expenses Paid During Period@ | |||||||||||||
| 07/01/10 | 12/31/10 | 07/01/10 – 12/31/10 | |||||||||||||
| Class X | |||||||||||||||
| Actual (5.43% return) | $ | 1,000.00 | $ | 1,054.30 | $ | 5.07 | |||||||||
| Hypothetical (5% annual return before expenses) | $ | 1,000.00 | $ | 1,020.27 | $ | 4.99 | |||||||||
| Class Y | |||||||||||||||
| Actual (5.29% return) | $ | 1,000.00 | $ | 1,052.90 | $ | 6.36 | |||||||||
| Hypothetical (5% annual return before expenses) | $ | 1,000.00 | $ | 1,019.00 | $ | 6.26 | |||||||||
@ Expenses are equal to the Portfolio's annualized expense ratios of 0.98% and 1.23% for Class X and Class Y shares, respectively, multiplied by the average account value over the period, multiplied by 184/365 (to reflect the one-half year period).
Global Infrastructure
| Beginning Account Value | Ending Account Value | Expenses Paid During Period@ | |||||||||||||
| 07/01/10 | 12/31/10 | 07/01/10 – 12/31/10 | |||||||||||||
| Class X | |||||||||||||||
| Actual (22.01% return) | $ | 1,000.00 | $ | 1,220.10 | $ | 4.59 | |||||||||
| Hypothetical (5% annual return before expenses) | $ | 1,000.00 | $ | 1,021.07 | $ | 4.18 | |||||||||
| Class Y | |||||||||||||||
| Actual (21.81% return) | $ | 1,000.00 | $ | 1,218.10 | $ | 5.98 | |||||||||
| Hypothetical (5% annual return before expenses) | $ | 1,000.00 | $ | 1,019.81 | $ | 5.45 | |||||||||
@ Expenses are equal to the Portfolio's annualized expense ratios of 0.82% and 1.07% for Class X and Class Y shares, respectively, multiplied by the average account value over the period, multiplied by 184/365 (to reflect the one-half year period).
16
Morgan Stanley Select Dimensions Investment Series
Expense Example n December 31, 2010 continued
Capital Growth
| Beginning Account Value | Ending Account Value | Expenses Paid During Period@ | |||||||||||||
| 07/01/10 | 12/31/10 | 07/01/10 – 12/31/10 | |||||||||||||
| Class X | |||||||||||||||
| Actual (30.63% return) | $ | 1,000.00 | $ | 1,306.30 | $ | 5.46 | |||||||||
| Hypothetical (5% annual return before expenses) | $ | 1,000.00 | $ | 1,020.47 | $ | 4.79 | |||||||||
| Class Y | |||||||||||||||
| Actual (30.46% return) | $ | 1,000.00 | $ | 1,304.60 | $ | 6.91 | |||||||||
| Hypothetical (5% annual return before expenses) | $ | 1,000.00 | $ | 1,019.21 | $ | 6.06 | |||||||||
@ Expenses are equal to the Portfolio's annualized expense ratios of 0.94% and 1.19% for Class X and Class Y shares, respectively, multiplied by the average account value over the period, multiplied by 184/365 (to reflect the one-half year period).
Focus Growth
| Beginning Account Value | Ending Account Value | Expenses Paid During Period@ | |||||||||||||
| 07/01/10 | 12/31/10 | 07/01/10 – 12/31/10 | |||||||||||||
| Class X | |||||||||||||||
| Actual (34.86% return) | $ | 1,000.00 | $ | 1,348.60 | $ | 4.38 | |||||||||
| Hypothetical (5% annual return before expenses) | $ | 1,000.00 | $ | 1,021.48 | $ | 3.77 | |||||||||
| Class Y | |||||||||||||||
| Actual (34.65% return) | $ | 1,000.00 | $ | 1,346.50 | $ | 5.86 | |||||||||
| Hypothetical (5% annual return before expenses) | $ | 1,000.00 | $ | 1,020.21 | $ | 5.04 | |||||||||
@ Expenses are equal to the Portfolio's annualized expense ratios of 0.74% and 0.99% for Class X and Class Y shares, respectively, multiplied by the average account value over the period, multiplied by 184/365 (to reflect the one-half year period).
Capital Opportunities
| Beginning Account Value | Ending Account Value | Expenses Paid During Period@ | |||||||||||||
| 07/01/10 | 12/31/10 | 07/01/10 – 12/31/10 | |||||||||||||
| Class X | |||||||||||||||
| Actual (38.23% return) | $ | 1,000.00 | $ | 1,382.30 | $ | 6.91 | |||||||||
| Hypothetical (5% annual return before expenses) | $ | 1,000.00 | $ | 1,019.41 | $ | 5.85 | |||||||||
| Class Y | |||||||||||||||
| Actual (38.10% return) | $ | 1,000.00 | $ | 1,381.00 | $ | 8.40 | |||||||||
| Hypothetical (5% annual return before expenses) | $ | 1,000.00 | $ | 1,018.15 | $ | 7.12 | |||||||||
@ Expenses are equal to the Portfolio's annualized expense ratios of 1.15% and 1.40% for Class X and Class Y shares, respectively, multiplied by the average account value over the period, multiplied by 184/365 (to reflect the one-half year period).
17
Morgan Stanley Select Dimensions Investment Series
Expense Example n December 31, 2010 continued
Mid Cap Growth
| Beginning Account Value | Ending Account Value | Expenses Paid During Period@ | |||||||||||||
| 07/01/10 | 12/31/10 | 07/01/10 – 12/31/10 | |||||||||||||
| Class X | |||||||||||||||
| Actual (31.18% return) | $ | 1,000.00 | $ | 1,311.80 | $ | 4.66 | |||||||||
| Hypothetical (5% annual return before expenses) | $ | 1,000.00 | $ | 1,021.17 | $ | 4.08 | |||||||||
| Class Y | |||||||||||||||
| Actual (31.01% return) | $ | 1,000.00 | $ | 1,310.10 | $ | 6.11 | |||||||||
| Hypothetical (5% annual return before expenses) | $ | 1,000.00 | $ | 1,019.91 | $ | 5.35 | |||||||||
@ Expenses are equal to the Porfolio's annualized expense ratios of 0.80% and 1.05% for Class X and Class Y shares, respectively, multiplied by the average account value over the period, multiplied by 184/365 (to reflect the one-half year period).
18
Money Market
Portfolio of Investments n December 31, 2010
| PRINCIPAL AMOUNT IN THOUSANDS | ANNUALIZED YIELD ON DATE OF PURCHASE | MATURITY DATE | VALUE | ||||||||||||||||
| Commercial Paper (41.9%) | |||||||||||||||||||
| Asset-Backed - Corporate (5.0%) | |||||||||||||||||||
| $ | 5,000 | Atlantis One Funding (a) | 0.15 | % | 01/03/11 | $ | 4,999,958 | ||||||||||||
| Domestic Banks (10.0%) | |||||||||||||||||||
| 5,000 | JP Morgan Chase & Co. | 0.01 | 01/03/11 | 4,999,997 | |||||||||||||||
| 5,000 | Wells Fargo & Co. | 0.03 | 01/03/11 | 4,999,992 | |||||||||||||||
| 9,999,989 | |||||||||||||||||||
| International Banks (26.9%) | |||||||||||||||||||
| 4,500 | ABN Amro Funding USA LLC (a) | 0.31 - 0.35 | 02/04/11 - 03/15/11 | 4,497,651 | |||||||||||||||
| 500 | BNZ International Funding (a) | 0.42 | 06/07/11 | 499,084 | |||||||||||||||
| 5,000 | BPCE SA (a) | 0.39 - 0.64 | 01/04/11 - 03/15/11 | 4,997,521 | |||||||||||||||
| 5,000 | Credit Suisse - New York Branch | 0.25 | 01/24/11 | 4,999,201 | |||||||||||||||
| 5,000 | Deutsche Bank Financial LLC | 0.25 | 01/21/11 | 4,999,306 | |||||||||||||||
| 5,000 | Nordea North America, Inc. | 0.27 | 01/13/11 | 4,999,550 | |||||||||||||||
| 2,000 | Sumitomo Mitsui Banking Corp. (a) | 0.30 | 01/26/11 | 1,999,583 | |||||||||||||||
| 26,991,896 | |||||||||||||||||||
| Total Commercial Paper (Cost $41,991,843) | 41,991,843 | ||||||||||||||||||
| Floating Rate Notes (22.9%) | |||||||||||||||||||
| International Banks | |||||||||||||||||||
| 5,000 | Barclays Bank PLC | 0.44 | (b) | 01/19/11(c) | 5,000,000 | ||||||||||||||
| 5,000 | BNP Paribas | 0.65 | (b) | 03/23/11(c) | 5,000,000 | ||||||||||||||
| 4,000 | Lloyds TSB Bank PLC | 0.46 | (b) | 01/31/11(c) | 4,000,000 | ||||||||||||||
| 4,000 | Royal Bank of Scotland PLC | 0.49 | (b) | 02/10/11(c) | 4,000,000 | ||||||||||||||
| 5,000 | Societe Generale | 1.49 | (b) | 02/07/11(c) | 5,000,000 | ||||||||||||||
| Total Floating Rate Notes (Cost $23,000,000) | 23,000,000 | ||||||||||||||||||
| Certificates of Deposit (19.9%) | |||||||||||||||||||
| International Banks | |||||||||||||||||||
| 5,000 | Bank of Montreal - Chicago | 0.23 | 01/14/11 | 5,000,000 | |||||||||||||||
| 5,000 | Credit AG CIB | 0.31 | 02/04/11 | 5,000,000 | |||||||||||||||
| 5,000 | Credit Industriel et Commercial | 0.50 | 01/05/11 | 5,000,000 | |||||||||||||||
| 5,000 | Svenska Handelsbanken NY | 0.28 | 02/01/11 | 5,000,042 | |||||||||||||||
| Total Certificates of Deposit (Cost $20,000,042) | 20,000,042 | ||||||||||||||||||
See Notes to Financial Statements
19
Money Market
Portfolio of Investments n December 31, 2010 continued
| PRINCIPAL AMOUNT IN THOUSANDS | ANNUALIZED YIELD ON DATE OF PURCHASE | MATURITY DATE | VALUE | ||||||||||||||||
| Repurchase Agreements (15.6%) | |||||||||||||||||||
| $ | 10,635 | Barclays Capital LLC (dated 12/31/10; proceeds $10,635,222; fully collateralized by U.S. Government Obligations; U.S. Treasury Notes 0.00% - 1.88% due 07/15/13 - 02/15/24; valued at $10,847,701) | 0.25 | % | 01/03/11 | $ | 10,635,000 | ||||||||||||
| 5,000 | BNP Paribas Securities (dated 12/31/10; proceeds $5,000,071; fully collateralized by a U.S. Government Agency; Federal National Mortgage Association 4.50% due 09/01/40; valued at $5,150,001) | 0.17 | 01/03/11 | 5,000,000 | |||||||||||||||
| Total Repurchase Agreements (Cost $15,635,000) | 15,635,000 | ||||||||||||||||||
| Total Investments (Cost $100,626,885) (d) | 100.3 | % | 100,626,885 | ||||||||||||||||
| Liabilities in Excess of Other Assets | (0.3 | ) | (341,752 | ) | |||||||||||||||
| Net Assets | 100.0 | % | $ | 100,285,133 | |||||||||||||||
(a) Resale is restricted to qualified institutional investors.
(b) Rate shown is the rate in effect at December 31, 2010.
(c) Date of next interest rate reset.
(d) Cost is the same for federal income tax purposes.
MATURITY SCHEDULE†
| 1 - 30 Days | 64 | % | |||||
| 31 - 60 Days | 25 | ||||||
| 61 - 90 Days | 10 | ||||||
| 91 - 120 Days | — | ||||||
| 121 + Days | 1 | ||||||
| 100 | % | ||||||
† As a percentage of total investments.
See Notes to Financial Statements
20
Flexible Income
Portfolio of Investments n December 31, 2010
| PRINCIPAL AMOUNT IN THOUSANDS | COUPON RATE | MATURITY DATE | VALUE | ||||||||||||||||
| Foreign Government & Corporate Bonds (18.8%) | |||||||||||||||||||
| Argentina (0.6%) | |||||||||||||||||||
| Foreign Government Obligations | |||||||||||||||||||
| $ | 161 | Argentina Bonos | 7.00 | % | 10/03/15 | $ | 155,367 | ||||||||||||
| 8 | Argentina Government International Bond | 8.28 | 12/31/33 | 7,285 | |||||||||||||||
| 18 | Argentina Government International Bond (Series NY) | 2.50 | (a) | 12/31/38 | 7,919 | ||||||||||||||
| Total Argentina | 170,571 | ||||||||||||||||||
| Australia (0.4%) | |||||||||||||||||||
| Commercial Banks - Non-U.S. Government Guaranteed | |||||||||||||||||||
| 100 | National Australia Bank Ltd. (144A) (b) | 3.375 | 07/08/14 | 105,716 | |||||||||||||||
| Belgium (0.1%) | |||||||||||||||||||
| Food - Retail | |||||||||||||||||||
| 34 | Delhaize Group SA (144A) (b) | 5.70 | 10/01/40 | 32,477 | |||||||||||||||
| Bermuda (0.1%) | |||||||||||||||||||
| Energy Equipment & Services | |||||||||||||||||||
| 20 | Weatherford International Ltd. | 9.625 | 03/01/19 | 25,702 | |||||||||||||||
| Brazil (1.5%) | |||||||||||||||||||
| Foreign Government Obligations | |||||||||||||||||||
| 200 | Banco Nacional de Desenvolvimento Economico e Social (144A) (b) | 6.369 | 06/16/18 | 218,760 | |||||||||||||||
| 150 | Brazilian Government International Bond | 5.875 | 01/15/19 | 167,250 | |||||||||||||||
| 10 | Brazilian Government International Bond | 7.125 | 01/20/37 | 11,975 | |||||||||||||||
| Total Brazil | 397,985 | ||||||||||||||||||
| Canada (1.0%) | |||||||||||||||||||
| Diversified Minerals (0.5%) | |||||||||||||||||||
| 105 | Teck Resources Ltd. | 10.25 | 05/15/16 | 130,076 | |||||||||||||||
| Pipelines (0.4%) | |||||||||||||||||||
| 120 | Kinder Morgan Finance Co. ULC | 5.70 | 01/05/16 | 122,100 | |||||||||||||||
| Real Estate Operation/Development (0.1%) | |||||||||||||||||||
| 20 | Brookfield Asset Management, Inc. | 5.80 | 04/25/17 | 20,459 | |||||||||||||||
| Total Canada | 272,635 | ||||||||||||||||||
See Notes to Financial Statements
21
Flexible Income
Portfolio of Investments n December 31, 2010 continued
| PRINCIPAL AMOUNT IN THOUSANDS | COUPON RATE | MATURITY DATE | VALUE | ||||||||||||||||
| Cayman Islands (0.6%) | |||||||||||||||||||
| Aerospace/Defense (0.2%) | |||||||||||||||||||
| $ | 45 | Systems 2001 Asset Trust (144A) (b) | 6.664 | % | 09/15/13 | $ | 49,880 | ||||||||||||
| Diversified Minerals (0.2%) | |||||||||||||||||||
| 50 | Vale Overseas Ltd. | 5.625 | 09/15/19 | 53,505 | |||||||||||||||
| 5 | Vale Overseas Ltd. | 6.875 | 11/10/39 | 5,550 | |||||||||||||||
| 59,055 | |||||||||||||||||||
| Oil Company - Integrated (0.2%) | |||||||||||||||||||
| 55 | Petrobras International Finance Co. | 5.75 | 01/20/20 | 57,341 | |||||||||||||||
| Total Cayman Islands | 166,276 | ||||||||||||||||||
| Dominican Republic (0.0%) | |||||||||||||||||||
| Foreign Government Obligation | |||||||||||||||||||
| 5 | Dominican Republic International Bond | 9.04 | 01/23/18 | 6,230 | |||||||||||||||
| France (0.2%) | |||||||||||||||||||
| Multimedia (0.1%) | |||||||||||||||||||
| 40 | Vivendi SA (144A) (b) | 6.625 | 04/04/18 | 44,607 | |||||||||||||||
| Telephone - Integrated (0.1%) | |||||||||||||||||||
| 15 | France Telecom SA | 8.50 | 03/01/31 | 20,448 | |||||||||||||||
| Total France | 65,055 | ||||||||||||||||||
| Ghana (0.4%) | |||||||||||||||||||
| Foreign Government Obligation | |||||||||||||||||||
| 100 | Republic of Ghana (144A) (b) | 8.50 | 10/04/17 | 112,750 | |||||||||||||||
| Hungary (0.1%) | |||||||||||||||||||
| Foreign Government Obligation | |||||||||||||||||||
| HUF | 5,910 | Hungary Government Bond (Series A) | 7.50 | 11/12/20 | 27,580 | ||||||||||||||
| Indonesia (1.1%) | |||||||||||||||||||
| Foreign Government Obligations (1.0%) | |||||||||||||||||||
| $ | 100 | Indonesia Government International Bond | 7.75 | 01/17/38 | 122,500 | ||||||||||||||
| 100 | Indonesia Government International Bond (144A) (b) | 11.625 | 03/04/19 | 148,750 | |||||||||||||||
| 271,250 | |||||||||||||||||||
| Paper & Related Products (0.1%) | |||||||||||||||||||
| 264 | Tjiwi Kimia Finance BV | 0.00 | 04/28/27 | 9,227 | |||||||||||||||
| 19 | Tjiwi Kimia Finance BV | 3.291 | (a) | 04/28/15 | 4,625 | ||||||||||||||
| 107 | Tjiwi Kimia Finance BV | 3.292 | (a) | 04/30/18 | 20,811 | ||||||||||||||
| 34,663 | |||||||||||||||||||
| Total Indonesia | 305,913 | ||||||||||||||||||
See Notes to Financial Statements
22
Flexible Income
Portfolio of Investments n December 31, 2010 continued
| PRINCIPAL AMOUNT IN THOUSANDS | COUPON RATE | MATURITY DATE | VALUE | ||||||||||||||||
| Ireland (0.5%) | |||||||||||||||||||
| Electric - Integrated (0.3%) | |||||||||||||||||||
| $ | 75 | Iberdrola Finance Ireland Ltd. (144A) (b) | 5.00 | % | 09/11/19 | $ | 72,042 | ||||||||||||
| Foreign Government Obligation (0.2%) | |||||||||||||||||||
| EUR | 68 | Ireland Government Bond | 5.40 | 03/13/25 | 65,077 | ||||||||||||||
| Total Ireland | 137,119 | ||||||||||||||||||
| Kazakhstan (0.4%) | |||||||||||||||||||
| Oil Company - Exploration & Production (0.4%) | |||||||||||||||||||
| $ | 100 | KazMunayGas National Co. (144A) (b) | 9.125 | 07/02/18 | 117,500 | ||||||||||||||
| Luxembourg (1.1%) | |||||||||||||||||||
| Electric - Integrated (0.4%) | |||||||||||||||||||
| 100 | Enel Finance International SA (144A) (b) | 5.125 | 10/07/19 | 99,275 | |||||||||||||||
| Metals & Mining (0.2%) | |||||||||||||||||||
| 40 | ArcelorMittal | 9.85 | 06/01/19 | 50,629 | |||||||||||||||
| Satellite Telecommunication (0.4%) | |||||||||||||||||||
| 95 | Intelsat Jackson Holdings SA | 9.50 | 06/15/16 | 100,700 | |||||||||||||||
| 23 | Intelsat Luxembourg SA | 11.50 | (c) | 02/04/17 | 25,062 | ||||||||||||||
| 125,762 | |||||||||||||||||||
| Telephone - Integrated (0.1%) | |||||||||||||||||||
| 25 | Telecom Italia Capital SA | 6.999 | 06/04/18 | 26,509 | |||||||||||||||
| Total Luxembourg | 302,175 | ||||||||||||||||||
| Mexico (1.6%) | |||||||||||||||||||
| Foreign Government Obligations (0.9%) | |||||||||||||||||||
| MXN | 723 | Mexican Bonos (Series M) | 8.00 | 06/11/20 | 62,992 | ||||||||||||||
| $ | 20 | Mexico Government International Bond | 6.05 | 01/11/40 | 20,550 | ||||||||||||||
| 100 | Mexico Government International Bond (Series A) | 6.75 | 09/27/34 | 113,000 | |||||||||||||||
| 44 | Mexico Government International Bond (Series E) | 5.95 | 03/19/19 | 49,280 | |||||||||||||||
| 245,822 | |||||||||||||||||||
| Food - Baking (0.4%) | |||||||||||||||||||
| 100 | Grupo Bimbo SAB de CV (144A) (b) | 4.875 | 06/30/20 | 100,891 | |||||||||||||||
| Oil Company - Integrated (0.3%) | |||||||||||||||||||
| 60 | Petroleos Mexicanos | 5.50 | 01/21/21 | 61,050 | |||||||||||||||
| 15 | Petroleos Mexicanos | 8.00 | 05/03/19 | 18,150 | |||||||||||||||
| 79,200 | |||||||||||||||||||
| Total Mexico | 425,913 | ||||||||||||||||||
See Notes to Financial Statements
23
Flexible Income
Portfolio of Investments n December 31, 2010 continued
| PRINCIPAL AMOUNT IN THOUSANDS | COUPON RATE | MATURITY DATE | VALUE | ||||||||||||||||
| Netherlands (1.1%) | |||||||||||||||||||
| Electric - Generation (0.5%) | |||||||||||||||||||
| $ | 130 | Intergen N.V. (144A) (b) | 9.00 | % | 06/30/17 | $ | 138,450 | ||||||||||||
| Multi-line Insurance (0.3%) | |||||||||||||||||||
| 75 | Aegon N.V. | 4.625 | 12/01/15 | 77,385 | |||||||||||||||
| Telephone - Integrated (0.3%) | |||||||||||||||||||
| 25 | Deutsche Telekom International Finance BV | 8.75 | 06/15/30 | 33,689 | |||||||||||||||
| 45 | Telefonica Europe BV | 8.25 | 09/15/30 | 52,418 | |||||||||||||||
| 86,107 | |||||||||||||||||||
| Total Netherlands | 301,942 | ||||||||||||||||||
| Peru (0.5%) | |||||||||||||||||||
| Foreign Government Obligations | |||||||||||||||||||
| 40 | Peruvian Government International Bond | 7.125 | 03/30/19 | 48,000 | |||||||||||||||
| 10 | Peruvian Government International Bond | 7.35 | 07/21/25 | 12,215 | |||||||||||||||
| 56 | Peruvian Government International Bond | 8.75 | 11/21/33 | 77,140 | |||||||||||||||
| Total Peru | 137,355 | ||||||||||||||||||
| Philippines (0.4%) | |||||||||||||||||||
| Foreign Government Obligation | |||||||||||||||||||
| 87 | Philippine Government International Bond | 8.875 | 03/17/15 | 107,662 | |||||||||||||||
| Russia (1.6%) | |||||||||||||||||||
| Foreign Government Obligations | |||||||||||||||||||
| 100 | Russian Foreign Bond - Eurobond | 5.00 | 04/29/20 | 100,500 | |||||||||||||||
| 147 | Russian Foreign Bond - Eurobond | 7.50 | 03/31/30 | 170,265 | |||||||||||||||
| 90 | Russian Foreign Bond - Eurobond | 12.75 | 06/24/28 | 157,050 | |||||||||||||||
| Total Russia | 427,815 | ||||||||||||||||||
| South Africa (0.1%) | |||||||||||||||||||
| Foreign Government Obligation | |||||||||||||||||||
| ZAR | 260 | South Africa Government Bond (Series R208) | 6.75 | 03/31/21 | 35,741 | ||||||||||||||
| Switzerland (0.5%) | |||||||||||||||||||
| Commercial Banks | |||||||||||||||||||
| $ | 110 | Credit Suisse | 5.30 | 08/13/19 | 116,391 | ||||||||||||||
| 5 | Credit Suisse | 6.00 | 02/15/18 | 5,369 | |||||||||||||||
| 20 | Credit Suisse AG | 5.40 | 01/14/20 | 20,462 | |||||||||||||||
| Total Switzerland | 142,222 | ||||||||||||||||||
See Notes to Financial Statements
24
Flexible Income
Portfolio of Investments n December 31, 2010 continued
| PRINCIPAL AMOUNT IN THOUSANDS | COUPON RATE | MATURITY DATE | VALUE | ||||||||||||||||
| Turkey (1.3%) | |||||||||||||||||||
| Foreign Government Obligations | |||||||||||||||||||
| TRY | 80 | Turkey Government Bond | 10.50 | % | 01/15/20 | $ | 58,005 | ||||||||||||
| $ | 100 | Turkey Government International Bond | 5.625 | 03/30/21 | 104,500 | ||||||||||||||
| 100 | Turkey Government International Bond | 6.75 | 04/03/18 | 114,500 | |||||||||||||||
| 17 | Turkey Government International Bond | 6.875 | 03/17/36 | 19,040 | |||||||||||||||
| 15 | Turkey Government International Bond | 8.00 | 02/14/34 | 18,863 | |||||||||||||||
| 19 | Turkey Government International Bond | 11.875 | 01/15/30 | 32,727 | |||||||||||||||
| Total Turkey | 347,635 | ||||||||||||||||||
| Ukraine (0.4%) | |||||||||||||||||||
| Foreign Government Obligation | |||||||||||||||||||
| 100 | Ukraine Government International Bond | 6.75 | 11/14/17 | 100,200 | |||||||||||||||
| United Kingdom (2.5%) | |||||||||||||||||||
| Advertising Services (0.4%) | |||||||||||||||||||
| 100 | WPP Finance | 8.00 | 09/15/14 | 115,138 | |||||||||||||||
| Commercial Banks (1.0%) | |||||||||||||||||||
| 65 | Barclays Bank PLC | 6.75 | 05/22/19 | 73,537 | |||||||||||||||
| 100 | Royal Bank of Scotland PLC (The) | 4.875 | 03/16/15 | 102,389 | |||||||||||||||
| 100 | Standard Chartered PLC (144A) (b) | 3.85 | 04/27/15 | 103,059 | |||||||||||||||
| 278,985 | |||||||||||||||||||
| Diversified Minerals (0.5%) | |||||||||||||||||||
| 100 | Anglo American Capital PLC (144A) (b) | 9.375 | 04/08/19 | 134,721 | |||||||||||||||
| Telephone - Integrated (0.4%) | |||||||||||||||||||
| 100 | Virgin Media Finance PLC | 9.125 | 08/15/16 | 107,000 | |||||||||||||||
| Tobacco (0.2%) | |||||||||||||||||||
| 30 | BAT International Finance PLC (144A) (b) | 9.50 | 11/15/18 | 39,537 | |||||||||||||||
| Total United Kingdom | 675,381 | ||||||||||||||||||
| Uruguay (0.0%) | |||||||||||||||||||
| Foreign Government Obligation | |||||||||||||||||||
| 10 | Uruguay Government International Bond | 8.00 | 11/18/22 | 12,425 | |||||||||||||||
See Notes to Financial Statements
25
Flexible Income
Portfolio of Investments n December 31, 2010 continued
| PRINCIPAL AMOUNT IN THOUSANDS | COUPON RATE | MATURITY DATE | VALUE | ||||||||||||||||
| Venezuela (0.7%) | |||||||||||||||||||
| Foreign Government Obligations | |||||||||||||||||||
| $ | 20 | Venezuela Government International Bond | 6.00 | % | 12/09/20 | $ | 11,600 | ||||||||||||
| 150 | Venezuela Government International Bond | 7.65 | 04/21/25 | 94,875 | |||||||||||||||
| 50 | Venezuela Government International Bond | 8.50 | 10/08/14 | 42,500 | |||||||||||||||
| 34 | Venezuela Government International Bond | 9.25 | 09/15/27 | 25,500 | |||||||||||||||
| 25 | Venezuela Government International Bond | 10.75 | 09/19/13 | 24,187 | |||||||||||||||
| Total Venezuela | 198,662 | ||||||||||||||||||
| Total Foreign Government & Corporate Bonds (Cost $4,862,989) | 5,158,637 | ||||||||||||||||||
| Domestic Corporate Bonds (59.4%) | |||||||||||||||||||
| Advanced Materials/Products (0.1%) | |||||||||||||||||||
| 40 | Hexcel Corp. | 6.75 | 02/01/15 | 41,000 | |||||||||||||||
| Advertising Agencies (0.2%) | |||||||||||||||||||
| 45 | Omnicom Group, Inc. | 4.45 | 08/15/20 | 44,119 | |||||||||||||||
| Advertising Services (0.5%) | |||||||||||||||||||
| 145 | inVentiv Health, Inc. (144A) (b) | 10.00 | 08/15/18 | 145,725 | |||||||||||||||
| Aerospace/Defense - Equipment (0.8%) | |||||||||||||||||||
| 200 | TransDigm, Inc. (144A) (b) | 7.75 | 12/15/18 | 208,000 | |||||||||||||||
| Agricultural Operations (0.2%) | |||||||||||||||||||
| 35 | Bunge Ltd. Finance Corp. | 8.50 | 06/15/19 | 41,102 | |||||||||||||||
| Apparel Manufacturers (0.4%) | |||||||||||||||||||
| 100 | Levi Strauss & Co. | 7.625 | 05/15/20 | 103,750 | |||||||||||||||
| Auto - Cars/Light Trucks (0.2%) | |||||||||||||||||||
| 30 | Daimler Finance North America LLC | 7.30 | 01/15/12 | 31,883 | |||||||||||||||
| 25 | Nissan Motor Acceptance Corp. (144A) (b) | 4.50 | 01/30/15 | 25,982 | |||||||||||||||
| 57,865 | |||||||||||||||||||
| Auto Parts: Original Equipment Manufacturer (0.7%) | |||||||||||||||||||
| 30 | Tenneco, Inc. (144A) (b) | 6.875 | 12/15/20 | 30,825 | |||||||||||||||
| 80 | Tenneco, Inc. | 8.125 | 11/15/15 | 85,200 | |||||||||||||||
| 70 | TRW Automotive, Inc. (144A) (b) | 8.875 | 12/01/17 | 78,750 | |||||||||||||||
| 194,775 | |||||||||||||||||||
| Beverages (0.2%) | |||||||||||||||||||
| 45 | Anheuser-Busch InBev Worldwide, Inc. (144A) (b) | 5.375 | 11/15/14 | 49,622 | |||||||||||||||
| Beverages - Wine/Spirits (1.1%) | |||||||||||||||||||
| 285 | Constellation Brands, Inc. | 7.25 | 05/15/17 | 303,169 | |||||||||||||||
See Notes to Financial Statements
26
Flexible Income
Portfolio of Investments n December 31, 2010 continued
| PRINCIPAL AMOUNT IN THOUSANDS | COUPON RATE | MATURITY DATE | VALUE | ||||||||||||||||
| Building - Residential/Commercial (0.8%) | |||||||||||||||||||
| $ | 75 | DR Horton, Inc. | 6.50 | % | 04/15/16 | $ | 77,437 | ||||||||||||
| 145 | Lennar Corp. | 6.95 | 06/01/18 | 138,475 | |||||||||||||||
| 215,912 | |||||||||||||||||||
| Building Product - Cement/Aggregation (0.3%) | |||||||||||||||||||
| 20 | CRH America, Inc. | 6.00 | 09/30/16 | 21,367 | |||||||||||||||
| 25 | Holcim US Finance Sarl & Cie SCS (144A) (b) | 6.00 | 12/30/19 | 26,006 | |||||||||||||||
| 40 | Lafarge SA (144A) (b) | 5.50 | 07/09/15 | 41,607 | |||||||||||||||
| 88,980 | |||||||||||||||||||
| Building Product - Wood (0.3%) | |||||||||||||||||||
| 70 | Masco Corp. | 6.125 | 10/03/16 | 71,624 | |||||||||||||||
| Building Societies (0.5%) | |||||||||||||||||||
| 120 | Nationwide Building Society (144A) (b) | 6.25 | 02/25/20 | 125,266 | |||||||||||||||
| Cable/Satellite TV (2.6%) | |||||||||||||||||||
| 130 | Charter Communications Operating LLC/Charter Communications Operating Capital (144A) (b) | 10.875 | 09/15/14 | 145,925 | |||||||||||||||
| 305 | CSC Holdings LLC | 8.625 | 02/15/19 | 346,175 | |||||||||||||||
| 40 | DirecTV Holdings LLC/DirecTV Financing Co., Inc. | 7.625 | 05/15/16 | 44,399 | |||||||||||||||
| 65 | DISH DBS Corp. | 6.625 | 10/01/14 | 67,600 | |||||||||||||||
| 90 | DISH DBS Corp. | 7.00 | 10/01/13 | 96,525 | |||||||||||||||
| 700,624 | |||||||||||||||||||
| Capital Markets (0.5%) | |||||||||||||||||||
| 135 | Goldman Sachs Group, Inc. (The) | 6.15 | 04/01/18 | 148,880 | |||||||||||||||
| Casino Gaming (2.1%) | |||||||||||||||||||
| 110 | Caesars Entertainment Operating Co., Inc. | 11.25 | 06/01/17 | 124,300 | |||||||||||||||
| 90 | Las Vegas Sands Corp. | 6.375 | 02/15/15 | 92,363 | |||||||||||||||
| 195 | MGM Mirage | 6.75 | 04/01/13 | 194,805 | |||||||||||||||
| 145 | Wynn Las Vegas LLC/Wynn Las Vegas Capital Corp. | 7.75 | 08/15/20 | 157,687 | |||||||||||||||
| 569,155 | |||||||||||||||||||
| Cellular Telecommunications (0.2%) | |||||||||||||||||||
| 50 | Nextel Communications, Inc. (Series E) | 6.875 | 10/31/13 | 50,375 | |||||||||||||||
| Chemicals (0.3%) | |||||||||||||||||||
| 80 | Mosaic Co. (The) (144A) (b) | 7.625 | 12/01/16 | 86,101 | |||||||||||||||
| Chemicals - Diversified (0.5%) | |||||||||||||||||||
| 121 | Lyondell Chemical Co. (144A) (b) | 8.00 | 11/01/17 | 134,159 | |||||||||||||||
See Notes to Financial Statements
27
Flexible Income
Portfolio of Investments n December 31, 2010 continued
| PRINCIPAL AMOUNT IN THOUSANDS | COUPON RATE | MATURITY DATE | VALUE | ||||||||||||||||
| Chemicals - Specialty (1.1%) | |||||||||||||||||||
| $ | 40 | Albemarle Corp. | 4.50 | % | 12/15/20 | $ | 39,447 | ||||||||||||
| 65 | Ashland, Inc. | 9.125 | 06/01/17 | 75,238 | |||||||||||||||
| 95 | Nalco Co. (144A) (b) | 6.625 | 01/15/19 | 97,612 | |||||||||||||||
| 80 | Nalco Co. | 8.25 | 05/15/17 | 87,100 | |||||||||||||||
| 299,397 | |||||||||||||||||||
| Coal (0.5%) | |||||||||||||||||||
| 35 | Foundation PA Coal Co. LLC | 7.25 | 08/01/14 | 35,787 | |||||||||||||||
| 90 | Massey Energy Co. | 6.875 | 12/15/13 | 91,575 | |||||||||||||||
| 127,362 | |||||||||||||||||||
| Commercial Banks (0.7%) | |||||||||||||||||||
| 70 | PNC Funding Corp. | 5.125 | 02/08/20 | 73,093 | |||||||||||||||
| 35 | PNC Funding Corp. | 6.70 | 06/10/19 | 40,363 | |||||||||||||||
| 75 | Regions Financial Corp. | 5.75 | 06/15/15 | 73,477 | |||||||||||||||
| 186,933 | |||||||||||||||||||
| Commercial Services (2.0%) | |||||||||||||||||||
| 430 | ServiceMaster Co. (The) (144A) (b) | 10.75 | (c) | 07/15/15 | 462,250 | ||||||||||||||
| 80 | Ticketmaster Entertainment LLC | 10.75 | 08/01/16 | 87,000 | |||||||||||||||
| 549,250 | |||||||||||||||||||
| Computer Services (0.5%) | |||||||||||||||||||
| 95 | SunGard Data Systems, Inc. (144A) (b) | 7.375 | 11/15/18 | 95,950 | |||||||||||||||
| 30 | SunGard Data Systems, Inc. | 10.625 | 05/15/15 | 33,225 | |||||||||||||||
| 129,175 | |||||||||||||||||||
| Consulting Services (0.1%) | |||||||||||||||||||
| 35 | SAIC, Inc. (144A) (b) | 5.95 | 12/01/40 | 35,615 | |||||||||||||||
| Consumer Products - Miscellaneous (1.1%) | |||||||||||||||||||
| 280 | Jarden Corp. | 7.50 | 05/01/17 | 296,450 | |||||||||||||||
| Containers - Paper/Plastic (0.3%) | |||||||||||||||||||
| 75 | Graphic Packaging International, Inc. | 7.875 | 10/01/18 | 78,937 | |||||||||||||||
| Data Processing Services (0.6%) | |||||||||||||||||||
| 85 | Fidelity National Information Services, Inc. (144A) (b) | 7.625 | 07/15/17 | 89,887 | |||||||||||||||
| 11 | First Data Corp. (144A) (b) | 8.25 | 01/15/21 | 10,615 | |||||||||||||||
| 40 | First Data Corp. (144A) (b) | 8.875 | 08/15/20 | 42,400 | |||||||||||||||
| 3 | First Data Corp. | 9.875 | 09/24/15 | 2,873 | |||||||||||||||
| 11 | First Data Corp. (144A) (b) | 12.625 | 01/15/21 | 10,560 | |||||||||||||||
| 156,335 | |||||||||||||||||||
See Notes to Financial Statements
28
Flexible Income
Portfolio of Investments n December 31, 2010 continued
| PRINCIPAL AMOUNT IN THOUSANDS | COUPON RATE | MATURITY DATE | VALUE | ||||||||||||||||
| Decision Support Software (0.3%) | |||||||||||||||||||
| $ | 100 | Vangent, Inc. | 9.625 | % | 02/15/15 | $ | 91,000 | ||||||||||||
| Dialysis Centers (0.5%) | |||||||||||||||||||
| 145 | DaVita, Inc. | 6.375 | 11/01/18 | 144,637 | |||||||||||||||
| Distribution/Wholesale (0.1%) | |||||||||||||||||||
| 35 | Ingram Micro, Inc. | 5.25 | 09/01/17 | 35,469 | |||||||||||||||
| Diversified Financial Services (3.4%) | |||||||||||||||||||
| 175 | Ally Financial, Inc. (144A) (b) | 6.25 | 12/01/17 | 175,219 | |||||||||||||||
| 70 | Ally Financial, Inc. | 6.875 | 09/15/11 | 72,275 | |||||||||||||||
| 215 | Ally Financial, Inc. (144A) (b) | 7.50 | 09/15/20 | 226,556 | |||||||||||||||
| 25 | Citigroup, Inc. (See Note 6) | 8.125 | 07/15/39 | 31,905 | |||||||||||||||
| 160 | Citigroup, Inc. (See Note 6) | 8.50 | 05/22/19 | 198,941 | |||||||||||||||
| 5 | General Electric Capital Corp. | 5.625 | 05/01/18 | 5,461 | |||||||||||||||
| 210 | General Electric Capital Corp. (Series G) | 6.00 | 08/07/19 | 234,041 | |||||||||||||||
| 944,398 | |||||||||||||||||||
| Diversified Manufactured Operation (0.2%) | |||||||||||||||||||
| 45 | Cooper US, Inc. | 5.25 | 11/15/12 | 48,352 | |||||||||||||||
| Diversified Operation/Commercial Service (1.1%) | |||||||||||||||||||
| 285 | ARAMARK Corp. | 8.50 | 02/01/15 | 299,250 | |||||||||||||||
| E-Commerce/Services (0.7%) | |||||||||||||||||||
| 40 | Expedia, Inc. | 5.95 | 08/15/20 | 40,400 | |||||||||||||||
| 140 | Expedia, Inc. | 8.50 | 07/01/16 | 154,000 | |||||||||||||||
| 194,400 | |||||||||||||||||||
| Electric - Generation (1.3%) | |||||||||||||||||||
| 80 | AES Corp. (The) | 7.75 | 03/01/14 | 85,800 | |||||||||||||||
| 85 | AES Corp. (The) | 8.00 | 06/01/20 | 90,525 | |||||||||||||||
| 20 | Edison Mission Energy | 7.00 | 05/15/17 | 15,950 | |||||||||||||||
| 67 | Homer City Funding LLC | 8.137 | 10/01/19 | 63,650 | |||||||||||||||
| 87 | Midwest Generation LLC (Series B) | 8.56 | 01/02/16 | 87,641 | |||||||||||||||
| 343,566 | |||||||||||||||||||
| Electric - Integrated (2.4%) | |||||||||||||||||||
| 90 | CMS Energy Corp. | 6.25 | 02/01/20 | 92,298 | |||||||||||||||
| 30 | Ipalco Enterprises, Inc. | 8.625 | 11/14/11 | 31,275 | |||||||||||||||
| 245 | Mirant Americas Generation LLC | 8.50 | 10/01/21 | 246,225 | |||||||||||||||
| 60 | PPL Energy Supply LLC | 6.50 | 05/01/18 | 66,904 | |||||||||||||||
| 45 | Progress Energy, Inc. | 7.05 | 03/15/19 | 53,474 | |||||||||||||||
| 15 | Public Service Co. of Colorado | 5.125 | 06/01/19 | 16,386 | |||||||||||||||
| 150 | Puget Energy, Inc. (144A) (b) | 6.50 | 12/15/20 | 147,787 | |||||||||||||||
| 654,349 | |||||||||||||||||||
See Notes to Financial Statements
29
Flexible Income
Portfolio of Investments n December 31, 2010 continued
| PRINCIPAL AMOUNT IN THOUSANDS | COUPON RATE | MATURITY DATE | VALUE | ||||||||||||||||
| Electric Utilities (0.2%) | |||||||||||||||||||
| $ | 40 | FirstEnergy Solutions Corp. | 6.05 | % | 08/15/21 | $ | 41,171 | ||||||||||||
| Electronic Equipment, Instruments & Components (0.1%) | |||||||||||||||||||
| 10 | Corning, Inc. | 6.625 | 05/15/19 | 11,560 | |||||||||||||||
| 15 | Corning, Inc. | 7.25 | 08/15/36 | 17,124 | |||||||||||||||
| 28,684 | |||||||||||||||||||
| Electronic Measuring Instrument (0.1%) | |||||||||||||||||||
| 15 | Agilent Technologies, Inc. | 5.50 | 09/14/15 | 16,310 | |||||||||||||||
| Electronics - Military (0.5%) | |||||||||||||||||||
| 145 | L-3 Communications Corp. | 5.875 | 01/15/15 | 148,444 | |||||||||||||||
| Finance - Auto Loans (0.8%) | |||||||||||||||||||
| 210 | Ford Motor Credit Co. LLC | 7.00 | 04/15/15 | 225,877 | |||||||||||||||
| Finance - Consumer Loans (0.2%) | |||||||||||||||||||
| 60 | SLM Corp. (MTN) | 8.00 | 03/25/20 | 60,933 | |||||||||||||||
| Finance - Credit Card (0.6%) | |||||||||||||||||||
| 130 | American Express Co. | 8.125 | 05/20/19 | 162,004 | |||||||||||||||
| Finance - Investment Banker/Broker (0.7%) | |||||||||||||||||||
| 25 | Bear Stearns Cos. LLC (The) | 7.25 | 02/01/18 | 29,669 | |||||||||||||||
| 100 | Merrill Lynch & Co., Inc. | 6.11 | 01/29/37 | 90,546 | |||||||||||||||
| 80 | TD Ameritrade Holding Corp. | 5.60 | 12/01/19 | 83,923 | |||||||||||||||
| 204,138 | |||||||||||||||||||
| Finance - Other Services (0.2%) | |||||||||||||||||||
| 60 | NASDAQ OMX Group, Inc. (The) | 5.55 | 01/15/20 | 60,729 | |||||||||||||||
| Finance - Rental/Leasing Company (1.0%) | |||||||||||||||||||
| 275 | International Lease Finance Corp. | 8.25 | 12/15/20 | 283,594 | |||||||||||||||
| Food - Canned (0.5%) | |||||||||||||||||||
| 125 | TreeHouse Foods, Inc. | 7.75 | 03/01/18 | 135,781 | |||||||||||||||
| Food - Meat Products (0.6%) | |||||||||||||||||||
| 75 | JBS USA LLC/JBS USA Finance, Inc. | 11.625 | 05/01/14 | 88,125 | |||||||||||||||
| 85 | Smithfield Foods, Inc. | 7.00 | 08/01/11 | 87,550 | |||||||||||||||
| 175,675 | |||||||||||||||||||
| Food - Miscellaneous/Diversified (0.2%) | |||||||||||||||||||
| 25 | ConAgra Foods, Inc. | 7.00 | 10/01/28 | 28,099 | |||||||||||||||
| 20 | ConAgra Foods, Inc. | 8.25 | 09/15/30 | 25,008 | |||||||||||||||
| 53,107 | |||||||||||||||||||
See Notes to Financial Statements
30
Flexible Income
Portfolio of Investments n December 31, 2010 continued
| PRINCIPAL AMOUNT IN THOUSANDS | COUPON RATE | MATURITY DATE | VALUE | ||||||||||||||||
| Food - Retail (1.2%) | |||||||||||||||||||
| $ | 285 | SUPERVALU, Inc. | 8.00 | % | 05/01/16 | $ | 274,313 | ||||||||||||
| 45 | Woolworths Ltd. (144A) (b) | 4.00 | 09/22/20 | 43,663 | |||||||||||||||
| 317,976 | |||||||||||||||||||
| Food Products (0.2%) | |||||||||||||||||||
| 50 | Kraft Foods, Inc. | 5.375 | 02/10/20 | 53,911 | |||||||||||||||
| Health Care Providers & Services (0.3%) | |||||||||||||||||||
| 75 | Healthsouth Corp. | 10.75 | 06/15/16 | 81,187 | |||||||||||||||
| Hotels & Motels (0.1%) | |||||||||||||||||||
| 30 | Hyatt Hotels Corp. (144A) (b) | 6.875 | 08/15/19 | 32,850 | |||||||||||||||
| Independent Power Producer (0.4%) | |||||||||||||||||||
| 115 | NRG Energy, Inc. | 8.50 | 06/15/19 | 119,312 | |||||||||||||||
| Insurance (0.4%) | |||||||||||||||||||
| 35 | MetLife, Inc. | 7.717 | 02/15/19 | 43,038 | |||||||||||||||
| 30 | Principal Financial Group, Inc. | 8.875 | 05/15/19 | 37,801 | |||||||||||||||
| 35 | Prudential Financial, Inc. (MTN) | 6.625 | 12/01/37 | 39,035 | |||||||||||||||
| 119,874 | |||||||||||||||||||
| Media (0.5%) | |||||||||||||||||||
| 30 | CBS Corp. | 8.875 | 05/15/19 | 37,801 | |||||||||||||||
| 40 | Time Warner Cable, Inc. | 6.75 | 07/01/18 | 46,697 | |||||||||||||||
| 15 | Time Warner, Inc. | 4.875 | 03/15/20 | 15,651 | |||||||||||||||
| 30 | Time Warner, Inc. | 5.875 | 11/15/16 | 33,904 | |||||||||||||||
| 134,053 | |||||||||||||||||||
| Medical - Biomedical/Genetics (0.2%) | |||||||||||||||||||
| 40 | Life Technologies Corp. | 6.00 | 03/01/20 | 42,921 | |||||||||||||||
| Medical - Drugs (0.6%) | |||||||||||||||||||
| 100 | Axcan Intermediate Holdings, Inc. | 12.75 | 03/01/16 | 103,250 | |||||||||||||||
| 70 | Endo Pharmaceuticals Holdings, Inc. (144A) (b) | 7.00 | 12/15/20 | 71,750 | |||||||||||||||
| 175,000 | |||||||||||||||||||
| Medical - Hospitals (2.4%) | |||||||||||||||||||
| 85 | Capella Healthcare, Inc. (144A) (b) | 9.25 | 07/01/17 | 90,312 | |||||||||||||||
| 45 | CHS/Community Health Systems, Inc. | 8.875 | 07/15/15 | 47,363 | |||||||||||||||
| 95 | HCA, Inc. | 5.75 | 03/15/14 | 94,050 | |||||||||||||||
| 125 | HCA, Inc. | 7.69 | 06/15/25 | 120,625 | |||||||||||||||
| 50 | LifePoint Hospitals, Inc. (144A) (b) | 6.625 | 10/01/20 | 49,875 | |||||||||||||||
| 35 | Select Medical Corp. | 6.237 | (a) | 09/15/15 | 32,550 | ||||||||||||||
| 15 | Select Medical Corp. | 7.625 | 02/01/15 | 15,075 | |||||||||||||||
| 20 | Tenet Healthcare Corp. (144A) (b) | 8.00 | 08/01/20 | 20,350 | |||||||||||||||
See Notes to Financial Statements
31
Flexible Income
Portfolio of Investments n December 31, 2010 continued
| PRINCIPAL AMOUNT IN THOUSANDS | COUPON RATE | MATURITY DATE | VALUE | ||||||||||||||||
| $ | 15 | Tenet Healthcare Corp. | 9.25 | % | 02/01/15 | $ | 16,050 | ||||||||||||
| 90 | Tenet Healthcare Corp. | 10.00 | 05/01/18 | 105,300 | |||||||||||||||
| 75 | UHS Escrow Corp. (144A) (b) | 7.00 | 10/01/18 | 77,250 | |||||||||||||||
| 668,800 | |||||||||||||||||||
| Medical Labs & Testing Services (0.1%) | |||||||||||||||||||
| 25 | Laboratory Corp. of America Holdings | 3.125 | 05/15/16 | 24,738 | |||||||||||||||
| Medical Products (0.3%) | |||||||||||||||||||
| 91 | Fresenius Medical Care Capital Trust IV | 7.875 | 06/15/11 | 93,047 | |||||||||||||||
| Metal - Copper (0.2%) | |||||||||||||||||||
| 15 | Southern Copper Corp. | 5.375 | 04/16/20 | 15,240 | |||||||||||||||
| 25 | Southern Copper Corp. | 6.75 | 04/16/40 | 26,012 | |||||||||||||||
| 41,252 | |||||||||||||||||||
| Metals & Mining (0.1%) | |||||||||||||||||||
| 20 | Freeport-McMoRan Copper & Gold, Inc. | 8.375 | 04/01/17 | 22,152 | |||||||||||||||
| Multi-line Insurance (0.2%) | |||||||||||||||||||
| 60 | Hartford Financial Services Group, Inc. (See Note 6) | 5.50 | 03/30/20 | 60,974 | |||||||||||||||
| Multiline Retail (0.2%) | |||||||||||||||||||
| 15 | JC Penney Co., Inc. | 5.65 | 06/01/20 | 14,438 | |||||||||||||||
| 36 | JC Penney Corp., Inc. | 6.375 | 10/15/36 | 32,940 | |||||||||||||||
| 47,378 | |||||||||||||||||||
| Multimedia (0.5%) | |||||||||||||||||||
| 50 | NBC Universal, Inc. (144A) (b) | 5.15 | 04/30/20 | 51,927 | |||||||||||||||
| 65 | News America, Inc. | 7.85 | 03/01/39 | 81,187 | |||||||||||||||
| 133,114 | |||||||||||||||||||
| Office Electronics (0.1%) | |||||||||||||||||||
| 10 | Xerox Corp. | 5.625 | 12/15/19 | 10,738 | |||||||||||||||
| 20 | Xerox Corp. | 6.35 | 05/15/18 | 22,579 | |||||||||||||||
| 33,317 | |||||||||||||||||||
| Oil Companies - Exploration & Production (5.0%) | |||||||||||||||||||
| 55 | Anadarko Petroleum Corp. | 6.95 | 06/15/19 | 61,807 | |||||||||||||||
| 155 | Denbury Resources, Inc. | 9.75 | 03/01/16 | 173,600 | |||||||||||||||
| 100 | Energy XXI Gulf Coast, Inc. (144A) (b) | 9.25 | 12/15/17 | 104,250 | |||||||||||||||
| 25 | EQT Corp. | 8.125 | 06/01/19 | 29,133 | |||||||||||||||
| 95 | Hilcorp Energy I LP/Hilcorp Finance Co. (144A) (b) | 7.75 | 11/01/15 | 98,563 | |||||||||||||||
| 33 | Pemex Project Funding Master Trust | 6.625 | 06/15/35 | 33,742 | |||||||||||||||
| 25 | Pemex Project Funding Master Trust | 6.625 | 06/15/38 | 25,518 | |||||||||||||||
| 150 | Petrohawk Energy Corp. | 7.25 | 08/15/18 | 152,250 | |||||||||||||||
See Notes to Financial Statements
32
Flexible Income
Portfolio of Investments n December 31, 2010 continued
| PRINCIPAL AMOUNT IN THOUSANDS | COUPON RATE | MATURITY DATE | VALUE | ||||||||||||||||
| $ | 20 | Plains Exploration & Production Co. | 7.75 | % | 06/15/15 | $ | 20,950 | ||||||||||||
| 110 | Plains Exploration & Production Co. | 10.00 | 03/01/16 | 123,475 | |||||||||||||||
| 95 | QEP Resources, Inc. | 6.875 | 03/01/21 | 100,225 | |||||||||||||||
| 150 | Range Resources Corp. | 6.75 | 08/01/20 | 155,437 | |||||||||||||||
| 170 | SandRidge Energy, Inc. | 8.625 | (c) | 04/01/15 | 174,887 | ||||||||||||||
| 125 | Sandridge Energy, Inc. | 8.75 | 01/15/20 | 129,063 | |||||||||||||||
| 1,382,900 | |||||||||||||||||||
| Paper & Related Products (1.4%) | |||||||||||||||||||
| 70 | Boise Paper Holdings LLC/Boise Finance Co. | 9.00 | 11/01/17 | 76,825 | |||||||||||||||
| 40 | Georgia-Pacific LLC (144A) (b) | 5.40 | 11/01/20 | 39,622 | |||||||||||||||
| 90 | Georgia-Pacific LLC (144A) (b) | 8.25 | 05/01/16 | 102,037 | |||||||||||||||
| 35 | Glatfelter | 7.125 | 05/01/16 | 36,444 | |||||||||||||||
| 40 | International Paper Co. | 7.95 | 06/15/18 | 47,667 | |||||||||||||||
| 70 | Verso Paper Holdings LLC/Verso Paper, Inc. (Series B) | 9.125 | 08/01/14 | 72,450 | |||||||||||||||
| 375,045 | |||||||||||||||||||
| Pipelines (0.9%) | |||||||||||||||||||
| 20 | CenterPoint Energy Resources Corp. | 6.25 | 02/01/37 | 20,991 | |||||||||||||||
| 50 | Energy Transfer Partners LP | 9.00 | 04/15/19 | 62,735 | |||||||||||||||
| 130 | Williams Cos., Inc. (The) | 7.875 | 09/01/21 | 153,731 | |||||||||||||||
| 237,457 | |||||||||||||||||||
| REIT - Diversified (0.5%) | |||||||||||||||||||
| 80 | Digital Realty Trust LP (144A) (b) | 4.50 | 07/15/15 | 80,574 | |||||||||||||||
| 55 | Duke Realty LP | 6.75 | 03/15/20 | 59,772 | |||||||||||||||
| 10 | Vornado Realty LP | 4.25 | 04/01/15 | 10,105 | |||||||||||||||
| 150,451 | |||||||||||||||||||
| REIT - Health Care (0.4%) | |||||||||||||||||||
| 50 | Health Care, Inc. | 6.125 | 04/15/20 | 52,726 | |||||||||||||||
| 50 | Healthcare Realty Trust, Inc. | 5.75 | 01/15/21 | 50,102 | |||||||||||||||
| 102,828 | |||||||||||||||||||
| REIT - Office Property (0.1%) | |||||||||||||||||||
| 30 | BioMed Realty LP (144A) (b) | 6.125 | 04/15/20 | 31,732 | |||||||||||||||
| Resorts/Theme Parks (0.0%) | |||||||||||||||||||
| 299 | Resort at Summerlin LP (Series B) (d)(e)(f)(g) | 13.00 | (c) | 12/15/07 | 0 | ||||||||||||||
| Retail - Discount (0.5%) | |||||||||||||||||||
| 100 | Dollar General Corp. | 10.625 | 07/15/15 | 109,250 | |||||||||||||||
| 35 | Wal-Mart Stores, Inc. | 5.25 | 09/01/35 | 35,344 | |||||||||||||||
| 144,594 | |||||||||||||||||||
See Notes to Financial Statements
33
Flexible Income
Portfolio of Investments n December 31, 2010 continued
| PRINCIPAL AMOUNT IN THOUSANDS | COUPON RATE | MATURITY DATE | VALUE | ||||||||||||||||
| Retail - Drug Store (0.3%) | |||||||||||||||||||
| $ | 77 | CVS Pass-Through Trust | 6.036 | % | 12/10/28 | $ | 78,749 | ||||||||||||
| Retail - Mail Order (0.2%) | |||||||||||||||||||
| 50 | QVC, Inc. (144A) (b) | 7.125 | 04/15/17 | 52,625 | |||||||||||||||
| Retail - Perfume & Cosmetics (0.5%) | |||||||||||||||||||
| 140 | Sally Holdings LLC/Sally Capital, Inc. | 9.25 | 11/15/14 | 147,700 | |||||||||||||||
| Retail - Restaurants (0.1%) | |||||||||||||||||||
| 30 | Yum! Brands, Inc. | 6.875 | 11/15/37 | 34,159 | |||||||||||||||
| Satellite Telecommunication (0.5%) | |||||||||||||||||||
| 120 | Intelsat Corp. | 9.25 | 06/15/16 | 130,200 | |||||||||||||||
| Schools (0.2%) | |||||||||||||||||||
| 55 | Duke University | 5.15 | 04/01/19 | 59,984 | |||||||||||||||
| Semiconductor Equipment (0.1%) | |||||||||||||||||||
| 35 | KLA-Tencor Corp. | 6.90 | 05/01/18 | 38,556 | |||||||||||||||
| Special Purpose Entity (1.4%) | |||||||||||||||||||
| 160 | AIG SunAmerica Global Financing VI (144A) (b) | 6.30 | 05/10/11 | 163,200 | |||||||||||||||
| 17 | CA FM Lease Trust (144A) (b)(e) | 8.50 | 07/15/17 | 19,199 | |||||||||||||||
| 50 | Harley-Davidson Funding Corp. (144A) (b) | 6.80 | 06/15/18 | 52,745 | |||||||||||||||
| 150 | NSG Holdings LLC/NSG Holdings, Inc. (144A) (b) | 7.75 | 12/15/25 | 140,250 | |||||||||||||||
| 375,394 | |||||||||||||||||||
| Specialty Retail (0.2%) | |||||||||||||||||||
| 65 | Home Depot, Inc. | 5.875 | 12/16/36 | 67,838 | |||||||||||||||
| Super-Regional Banks - U.S. (0.3%) | |||||||||||||||||||
| 70 | KeyCorp (MTN) | 6.50 | 05/14/13 | 76,042 | |||||||||||||||
| Telecommunication Services (0.7%) | |||||||||||||||||||
| 75 | Qwest Corp. | 8.375 | 05/01/16 | 89,250 | |||||||||||||||
| 100 | Sable International Finance Ltd. (144A) (b) | 7.75 | 02/15/17 | 106,250 | |||||||||||||||
| 195,500 | |||||||||||||||||||
| Telephone - Integrated (2.0%) | |||||||||||||||||||
| 105 | Cincinnati Bell, Inc. | 8.375 | 10/15/20 | 101,062 | |||||||||||||||
| 110 | Frontier Communications Corp. | 9.00 | 08/15/31 | 113,575 | |||||||||||||||
| 90 | Qwest Communications International, Inc. (144A) (b) | 7.125 | 04/01/18 | 93,600 | |||||||||||||||
| 70 | Sprint Capital Corp. | 6.90 | 05/01/19 | 69,475 | |||||||||||||||
| 65 | Verizon Communications, Inc. | 6.35 | 04/01/19 | 75,143 | |||||||||||||||
| 100 | Windstream Corp. | 7.875 | 11/01/17 | 105,625 | |||||||||||||||
| 558,480 | |||||||||||||||||||
See Notes to Financial Statements
34
Flexible Income
Portfolio of Investments n December 31, 2010 continued
| PRINCIPAL AMOUNT IN THOUSANDS | COUPON RATE | MATURITY DATE | VALUE | ||||||||||||||||
| Therapeutics (0.5%) | |||||||||||||||||||
| $ | 145 | Warner Chilcott Co. LLC/Warner Chilcott Finance LLC (144A) (b) | 7.75 | % | 09/15/18 | $ | 147,175 | ||||||||||||
| Tobacco (0.1%) | |||||||||||||||||||
| 20 | Altria Group, Inc. | 9.25 | 08/06/19 | 26,142 | |||||||||||||||
| Transport - Rail (0.2%) | |||||||||||||||||||
| 15 | CSX Corp. | 6.15 | 05/01/37 | 16,182 | |||||||||||||||
| 30 | Union Pacific Corp. | 6.125 | 02/15/20 | 34,295 | |||||||||||||||
| 50,477 | |||||||||||||||||||
| Transport - Services (0.2%) | |||||||||||||||||||
| 20 | Ryder System, Inc. (MTN) | 5.85 | 11/01/16 | 22,000 | |||||||||||||||
| 25 | Ryder System, Inc. (MTN) | 7.20 | 09/01/15 | 28,701 | |||||||||||||||
| 50,701 | |||||||||||||||||||
| Total Domestic Corporate Bonds (Cost $15,531,571) | 16,308,110 | ||||||||||||||||||
| Asset-Backed Securities (1.4%) | |||||||||||||||||||
| 100 | Ally Master Owner Trust 2010-3 A (144A) (b) | 2.88 | 04/15/15 | 102,471 | |||||||||||||||
| 125 | Ford Credit Floorplan Master Owner Trust 2010-3 A2 (144A) (b) | 1.96 | (a) | 02/15/17 | 128,816 | ||||||||||||||
| 20 | Specialty Underwriting & Residential Finance 2004-BC2 A2 | 0.531 | (a) | 05/25/35 | 16,951 | ||||||||||||||
| 125 | Westlake Automobile Receivables Trust 2010-1A B (144A) (b) | 5.00 | 05/15/15 | 125,520 | |||||||||||||||
| Total Asset-Backed Securities (Cost $369,524) | 373,758 | ||||||||||||||||||
| U.S. Government Agencies & Obligations (10.2%) | |||||||||||||||||||
| U.S. Government Agencies (3.7%) | |||||||||||||||||||
| Federal Home Loan Mortgage Corp. | |||||||||||||||||||
| 200 | 2.875 | 02/09/15 | 208,428 | ||||||||||||||||
| 150 | 3.00 | 07/28/14 | 158,036 | ||||||||||||||||
| 200 | 6.75 | 03/15/31 | 256,866 | ||||||||||||||||
| Federal National Mortgage Association | |||||||||||||||||||
| 100 | 4.375 | 10/15/15 | 110,194 | ||||||||||||||||
| 200 | 5.00 | 05/11/17 | 224,579 | ||||||||||||||||
| 56 | 356 25 (IO) | 7.00 | 12/01/34 | 10,560 | |||||||||||||||
| 101 | 356 30 (IO) | 8.00 | 06/01/35 | 21,353 | |||||||||||||||
| 48 | 356 47 (IO) | 6.50 | 12/01/29 | 6,068 | |||||||||||||||
| 47 | 356 49 (IO) | 7.00 | 11/01/19 | 7,108 | |||||||||||||||
| 1,003,192 | |||||||||||||||||||
See Notes to Financial Statements
35
Flexible Income
Portfolio of Investments n December 31, 2010 continued
| PRINCIPAL AMOUNT IN THOUSANDS | COUPON RATE | MATURITY DATE | VALUE | ||||||||||||||||
| U.S. Government Obligations (6.5%) | |||||||||||||||||||
| U.S. Treasury Bonds | |||||||||||||||||||
| $ | 250 | 3.50 | % | 02/15/39 | $ | 215,469 | |||||||||||||
| 60 | 4.25 | 05/15/39 | 59,119 | ||||||||||||||||
| 240 | 4.375 | 11/15/39 | 241,313 | ||||||||||||||||
| 910 | 7.50 | 11/15/24 | 1,275,137 | ||||||||||||||||
| 1,791,038 | |||||||||||||||||||
| Total U.S. Government Agencies & Obligations (Cost $2,747,822) | 2,794,230 | ||||||||||||||||||
| U.S. Government Agencies - Mortgage-Backed Securities (0.7%) | |||||||||||||||||||
| Federal National Mortgage Association (0.7%) | |||||||||||||||||||
| 47 | 6.50 | 07/01/29 | 53,209 | ||||||||||||||||
| 16 | 6.50 | 05/01/31 | 18,139 | ||||||||||||||||
| 54 | 6.50 | 03/01/32 | 60,365 | ||||||||||||||||
| 8 | 6.50 | 11/01/33 | 9,329 | ||||||||||||||||
| 34 | 7.00 | 02/01/33 | 38,874 | ||||||||||||||||
| 3 | 8.00 | 02/01/12 | 3,032 | ||||||||||||||||
| 182,948 | |||||||||||||||||||
| Government National Mortgage Association (0.0%) | |||||||||||||||||||
| 1 | 8.00 | 06/15/26 | 809 | ||||||||||||||||
| Total U.S. Government Agencies - Mortgage-Backed Securities (Cost $169,823) | 183,757 | ||||||||||||||||||
| Municipal Bonds (1.0%) | |||||||||||||||||||
| 35 | Chicago Transit Authority (Series B) | 6.20 | 12/01/40 | 32,227 | |||||||||||||||
| 15 | City of Chicago O'Hare Int'l Airport (Series B) | 6.395 | 01/01/40 | 14,643 | |||||||||||||||
| 30 | City of New York (Series G-1) | 5.968 | 03/01/36 | 30,056 | |||||||||||||||
| 75 | Illinois State Toll Highway Authority 2009 (Series A) | 6.184 | 01/01/34 | 74,040 | |||||||||||||||
| 15 | Municipal Electric Authority of Georgia Plant Vogtle Units 3 & 4 (Series 2010 J) | 6.637 | 04/01/57 | 14,779 | |||||||||||||||
| 20 | Municipal Electric Authority of Georgia Plant Vogtle | 6.655 | 04/01/57 | 19,497 | |||||||||||||||
| 30 | New York City Transitional Finance Authority | 5.267 | 05/01/27 | 28,866 | |||||||||||||||
| 40 | State of California - Various Purpose | 5.95 | 04/01/16 | 42,375 | |||||||||||||||
| 25 | State of California - Various Purpose | 6.65 | 03/01/22 | 26,327 | |||||||||||||||
| Total Municipal Bonds (Cost $286,581) | 282,810 | ||||||||||||||||||
See Notes to Financial Statements
36
Flexible Income
Portfolio of Investments n December 31, 2010 continued
| PRINCIPAL AMOUNT IN THOUSANDS | COUPON RATE | MATURITY DATE | VALUE | ||||||||||||||||
| Collateralized Mortgage Obligations (6.2%) | |||||||||||||||||||
| Private Issues (4.9%) | |||||||||||||||||||
| $ | 156 | Banc of America Alternative Loan Trust 2005-12 5A1 | 5.25 | % | 01/25/21 | $ | 152,221 | ||||||||||||
| 95 | Countrywide Alternative Loan Trust 2006-8T1 1A3 | 6.00 | 04/25/36 | 76,733 | |||||||||||||||
| 190 | Countrywide Home Loan Mortgage Pass-Through Trust 2007-13 A10 | 6.00 | 08/25/37 | 161,530 | |||||||||||||||
| First Horizon Alternative Mortgage Securities | |||||||||||||||||||
| 95 | 2005-FA8 2A1 | 5.00 | 11/25/20 | 97,401 | |||||||||||||||
| 86 | 2006-FA5 A3 | 6.25 | 08/25/36 | 67,174 | |||||||||||||||
| 125 | GMAC Mortgage Corp. Loan Trust 2010-1 A (144A) (b) | 4.25 | 07/25/40 | 126,121 | |||||||||||||||
| 99 | GS Mortgage Securities Corp. 2008-2R 1A1 (144A) (b) | 7.50 | (a) | 09/25/36 | 87,970 | ||||||||||||||
| 79 | JP Morgan Mortgage Trust 2005-A8 3A1 | 5.225 | (a) | 11/25/35 | 70,615 | ||||||||||||||
| 100 | Lehman Mortgage Trust 2006-1 3A5 | 5.50 | 02/25/36 | 91,639 | |||||||||||||||
| 52 | Mastr Adjustable Rate Mortgages Trust 2006-OA1 3A3 | 1.268 | (a) | 04/25/46 | 1,767 | ||||||||||||||
| Residential Accredit Loans, Inc. | |||||||||||||||||||
| 97 | 2005-QS3 1A21 | 0.761 | (a) | 03/25/35 | 74,999 | ||||||||||||||
| 117 | 2006-QS4 A4 | 6.00 | 04/25/36 | 85,926 | |||||||||||||||
| 186 | Structured Adjustable Rate Mortgage Loan Trust 2004-10 1A1 | 2.746 | (a) | 08/25/34 | 168,098 | ||||||||||||||
| 100 | WaMu Mortgage Pass-Through Certificates 2005-AR10 1A3 | 2.77 | (a) | 09/25/35 | 80,819 | ||||||||||||||
| 1,343,013 | |||||||||||||||||||
| U.S. Government Agencies (1.3%) | |||||||||||||||||||
| Federal Home Loan Mortgage Corp. | |||||||||||||||||||
| 298 | 3339 TI (IO) | 5.88 | (a) | 07/15/37 | 42,991 | ||||||||||||||
| 399 | 3747 SA (IO) | 6.24 | (a) | 10/15/40 | 58,753 | ||||||||||||||
| Federal National Mortgage Association | |||||||||||||||||||
| 691 | 2010-136 SA (IO) | 5.739 | (a) | 12/25/40 | 101,606 | ||||||||||||||
| 150 | 2010-130 SE (IO) | 6.289 | (a) | 11/25/40 | 23,744 | ||||||||||||||
| 284 | 2009-8 BS (IO) | 6.439 | (a) | 02/25/24 | 32,527 | ||||||||||||||
| 596 | Government National Mortgage Association 2010-115 AS (IO) | 5.789 | (a) | 09/20/40 | 96,066 | ||||||||||||||
| 355,687 | |||||||||||||||||||
| Total Collateralized Mortgage Obligations (Cost $1,646,390) | 1,698,700 | ||||||||||||||||||
See Notes to Financial Statements
37
Flexible Income
Portfolio of Investments n December 31, 2010 continued
| NUMBER OF SHARES | VALUE | ||||||||||||||||||
| Preferred Stock (0.3%) | |||||||||||||||||||
| Diversified Financial Services | |||||||||||||||||||
| 82 | Ally Financial, Inc. $70.00 (144A) (b) (Cost $34,389) | $ | 77,498 | ||||||||||||||||
| Common Stocks (0.0%) | |||||||||||||||||||
| Communications Equipment (0.0%) | |||||||||||||||||||
| 563 | Orbcomm, Inc. (h) | 1,458 | |||||||||||||||||
| Diversified Telecommunication Services (0.0%) | |||||||||||||||||||
| 109 | XO Holdings, Inc. (g)(h) | 75 | |||||||||||||||||
| Electric Utilities (0.0%) | |||||||||||||||||||
| 13 | PNM Resources, Inc. (g) | 169 | |||||||||||||||||
| Wireless Telecommunication Services (0.0%) | |||||||||||||||||||
| 49 | USA Mobility, Inc. (g) | 871 | |||||||||||||||||
| Total Common Stocks (Cost $637) | 2,573 | ||||||||||||||||||
| PRINCIPAL AMOUNT IN THOUSANDS | COUPON RATE | MATURITY DATE | |||||||||||||||||
| Short-Term Investments (1.5%) | |||||||||||||||||||
| U.S. Government Obligation (i)(j) (0.8%) | |||||||||||||||||||
| $ | 230 | U.S. Treasury Bill (Cost $229,978) | 0.134 | % | 01/27/11 | 229,978 | |||||||||||||
| NUMBER OF SHARES (000) | |||||||||||||||||||
| Investment Company (0.7%) | |||||||||||||||||||
| 206 | Morgan Stanley Institutional Liquidity Funds - Money Market Portfolio - Institutional Class (See Note 6) (Cost $205,676) | 205,676 | |||||||||||||||||
| Total Short-Term Investments (Cost $435,654) | 435,654 | ||||||||||||||||||
| Total Investments (Cost $26,085,380) (k)(l) | 99.5 | % | 27,315,727 | ||||||||||||||||
| Other Assets in Excess of Liabilities | 0.5 | 143,379 | |||||||||||||||||
| Net Assets | 100.0 | % | $ | 27,459,106 | |||||||||||||||
See Notes to Financial Statements
38
Flexible Income
Portfolio of Investments n December 31, 2010 continued
IO Interest Only Security.
MTN Medium Term Note.
REIT Real Estate Investment Trust.
(a) Floating rate security. Rate shown is the rate in effect at December 31, 2010.
(b) Resale is restricted to qualified institutional investors.
(c) Payment-in-kind security.
(d) Non-income producing security; bond in default.
(e) At December 31, 2010, the Portfolio held fair valued securities valued at $19,199, representing 0.1% of net assets. These securities have been fair valued as determined in good faith under procedures established by and under the general supervision of the Fund's Trustees.
(f) Issuer in bankruptcy.
(g) Acquired through exchange offer.
(h) Non-income producing security.
(i) Purchased on a discount basis. The interest rates shown have been adjusted to reflect a money market equivalent yield.
(j) A portion of this security has been physically segregated in connection with open futures and swap contracts.
(k) Securities have been designated as collateral in connection with open futures, forward foreign currency and swap contracts.
(l) The aggregate cost for federal income tax purposes is $26,193,846. The aggregate gross unrealized appreciation is $1,729,778 and the aggregate gross unrealized depreciation is $613,197 resulting in net unrealized appreciation of $1,116,581.
See Notes to Financial Statements
39
Flexible Income
Portfolio of Investments n December 31, 2010 continued
FOREIGN CURRENCY EXCHANGE CONTRACTS OPEN AT DECEMBER 31, 2010:
| COUNTERPARTY | CONTRACTS TO DELIVER | IN EXCHANGE FOR | DELIVERY DATE | UNREALIZED APPRECIATION (DEPRECIATION) | |||||||||||||||
| JP Morgan Securities, Inc. | CLP | 15,238,080 | $ | 32,449 | 01/03/11 | $ | (105 | ) | |||||||||||
| JP Morgan Securities, Inc. | COP | 57,470,400 | $ | 28,881 | 01/03/11 | (1,074 | ) | ||||||||||||
| JP Morgan Securities, Inc. | MXN | 29,241 | $ | 2,352 | 01/03/11 | (16 | ) | ||||||||||||
| JP Morgan Securities, Inc. | $ | 31,338 | CLP | 15,238,080 | 01/03/11 | 1,216 | |||||||||||||
| JP Morgan Securities, Inc. | $ | 29,933 | COP | 57,470,400 | 01/03/11 | 23 | |||||||||||||
| JP Morgan Securities, Inc. | BRL | 53,000 | $ | 31,435 | 01/04/11 | (465 | ) | ||||||||||||
| JP Morgan Securities, Inc. | $ | 30,530 | BRL | 53,000 | 01/04/11 | 1,371 | |||||||||||||
| JP Morgan Securities, Inc. | $ | 63,332 | KRW | 72,571,760 | 01/06/11 | 594 | |||||||||||||
| JP Morgan Securities, Inc. | $ | 30,971 | THB | 929,760 | 01/07/11 | (135 | ) | ||||||||||||
| JP Morgan Securities, Inc. | $ | 67,534 | INR | 3,051,168 | 01/10/11 | 580 | |||||||||||||
| JP Morgan Securities, Inc. | $ | 32,390 | CLP | 15,238,080 | 01/31/11 | 87 | |||||||||||||
| JP Morgan Securities, Inc. | $ | 31,232 | BRL | 53,000 | 02/02/11 | 450 | |||||||||||||
| UBS Securities Japan Ltd. | EUR | 54,953 | $ | 72,659 | 03/16/11 | (757 | ) | ||||||||||||
| JP Morgan Securities, Inc. | $ | 293,219 | CNY | 1,920,000 | 05/16/11 | (1,673 | ) | ||||||||||||
| Net Unrealized Appreciation | $ | 96 | |||||||||||||||||
Currency Abbreviations:
BRL Brazilian Real.
CLP Chilean Peso.
CNY Chinese Yuan Renminbi.
COP Colombian Peso.
EUR Euro.
HUF Hungarian Forint.
INR Indian Rupee.
KRW South Korean Won.
MXN Mexican New Peso.
THB Thai Baht.
TRY Turkish Lira.
ZAR South African Rand.
See Notes to Financial Statements
40
Flexible Income
Portfolio of Investments n December 31, 2010 continued
FUTURES CONTRACTS OPEN AT DECEMBER 31, 2010:
| NUMBER OF CONTRACTS | LONG/SHORT | DESCRIPTION, DELIVERY MONTH AND YEAR | UNDERLYING FACE AMOUNT AT VALUE | UNREALIZED APPRECIATION (DEPRECIATION) | |||||||||||||||
| 29 | Long | U.S. Treasury Notes 5 Year, March 2011 | $ | 3,413,844 | $ | (28,172 | ) | ||||||||||||
| 1 | Short | U.S. Treasury Bonds 30 Year, March 2011 | (122,125 | ) | (315 | ) | |||||||||||||
| 1 | Short | Euro-Bund, March 2011 | (167,453 | ) | 1,102 | ||||||||||||||
| 2 | Short | U.S. Ultra Bond, March 2011 | (254,188 | ) | 7,808 | ||||||||||||||
| 3 | Short | U.S. Treasury Notes 2 Year, March 2011 | (656,719 | ) | (756 | ) | |||||||||||||
| 22 | Short | U.S. Treasury Notes 10 Year, March 2011 | (2,649,625 | ) | 41,591 | ||||||||||||||
| Net Unrealized Appreciation | $ | 21,258 | |||||||||||||||||
See Notes to Financial Statements
41
Flexible Income
Portfolio of Investments n December 31, 2010 continued
INTEREST RATE SWAP CONTRACTS OPEN AT DECEMBER 31, 2010:
| SWAP COUNTERPARTY | NOTIONAL AMOUNT (000) | FLOATING RATE INDEX | PAY/RECEIVE FLOATING RATE | FIXED RATE | TERMINATION DATE | UNREALIZED APPRECIATION (DEPRECIATION) | |||||||||||||||||||||
| Bank of America, N.A. | $ | 390 | 3 Month LIBOR | Receive | 4.058 | % | 12/09/40 | $ | 3,998 | ||||||||||||||||||
| Bank of America, N.A. *** | 1,620 | 3 Month LIBOR | Pay | 4.795 | 12/09/20 | (2,641 | ) | ||||||||||||||||||||
| Bank of America, N.A. *** | EUR | 2,023 | 6 Month EURIBOR | Pay | 3.81 | 11/08/25 | (69,963 | ) | |||||||||||||||||||
| Bank of America, N.A. *** | $ | 1,935 | 3 Month LIBOR | Receive | 4.828 | 11/08/25 | 20,550 | ||||||||||||||||||||
| Bank of America, N.A. *** | EUR | 2,510 | 6 Month EURIBOR | Receive | 3.33 | 11/08/30 | 58,832 | ||||||||||||||||||||
| Bank of America, N.A. *** | $ | 2,425 | 3 Month LIBOR | Pay | 4.75 | 11/08/30 | (3,735 | ) | |||||||||||||||||||
| Credit Suisse Group | 2,615 | 3 Month LIBOR | Receive | 0.80 | 10/28/13 | 27,850 | |||||||||||||||||||||
| Credit Suisse Group | CAD | 849 | 3 Month CDOR | Receive | 2.18 | 09/08/15 | 15,709 | ||||||||||||||||||||
| Credit Suisse Group | 611 | 3 Month CDOR | Receive | 2.208 | 09/08/15 | 10,544 | |||||||||||||||||||||
| Credit Suisse Group | $ | 1,095 | 3 Month LIBOR | Pay | 2.098 | 10/28/17 | (47,337 | ) | |||||||||||||||||||
| Credit Suisse Group *** | CAD | 1,000 | 3 Month CDOR | Pay | 4.065 | 09/08/20 | (10,391 | ) | |||||||||||||||||||
| Credit Suisse Group *** | 720 | 3 Month CDOR | Pay | 4.123 | 09/08/20 | (5,828 | ) | ||||||||||||||||||||
| Deutsche Bank AG | $ | 400 | 3 Month LIBOR | Receive | 4.39 | 12/20/40 | (19,332 | ) | |||||||||||||||||||
| Deutsche Bank AG *** | 1,620 | 3 Month LIBOR | Pay | 5.29 | 12/20/20 | 28,658 | |||||||||||||||||||||
| UBS AG | 390 | 3 Month LIBOR | Receive | 4.00 | 12/07/40 | 7,944 | |||||||||||||||||||||
| UBS AG *** | 1,620 | 3 Month LIBOR | Pay | 4.65 | 12/07/20 | (11,875 | ) | ||||||||||||||||||||
| Net Unrealized Appreciation | $ | 2,983 | |||||||||||||||||||||||||
CDOR Canadian Dealer Offered Rate.
EURIBOR Euro Interbank Offered Rate.
LIBOR London Interbank Offered Rate.
*** Forward interest rate swap. Periodic payments on specified notional amount with future effective date, unless terminated earlier.
Currency Abbreviations:
CAD Canadian Dollar.
EUR Euro.
See Notes to Financial Statements
42
Flexible Income
Portfolio of Investments n December 31, 2010 continued
ZERO COUPON SWAP CONTRACTS OPEN AT DECEMBER 31, 2010:
| SWAP COUNTERPARTY | NOTIONAL AMOUNT (000) | FLOATING RATE INDEX | PAY/RECEIVE FLOATING RATE | TERMINATION DATE | UNREALIZED APPRECIATION (DEPRECIATION) | ||||||||||||||||||
| Barclays Bank PLC ^ | $ | 920 | 3 Month LIBOR | Receive | 11/15/21 | $ | (100,002 | ) | |||||||||||||||
| Deutsche Bank AG ^ | 750 | 3 Month LIBOR | Receive | 11/15/21 | (68,832 | ) | |||||||||||||||||
| Deutsche Bank AG ^^ | 750 | 3 Month LIBOR | Pay | 11/15/21 | 1,219 | ||||||||||||||||||
| JPMorgan Chase Bank N.A. New York ^ | 535 | 3 Month LIBOR | Receive | 11/15/19 | (59,368 | ) | |||||||||||||||||
| UBS AG ^ | 255 | 3 Month LIBOR | Receive | 11/15/19 | (26,779 | ) | |||||||||||||||||
| Net Unrealized Depreciation | $ | (253,762 | ) | ||||||||||||||||||||
LIBOR London Interbank Offered Rate.
^ Portfolio will make the payments of $412,031, $323,462, $203,364, and $95,443 respectively on termination date.
^^ Portfolio will receive the payment of $250,453 on termination date.
SUMMARY OF INVESTMENTS
| PORTFOLIO COMPOSITION | VALUE | PERCENT OF TOTAL INVESTMENTS | |||||||||
| Domestic Corporate Bonds | $ | 16,308,110 | 59.7 | % | |||||||
| Foreign Government & Corporate Bonds | 5,158,637 | 18.9 | |||||||||
| U.S. Government Agencies & Obligations | 2,794,230 | 10.2 | |||||||||
| Collateralized Mortgage Obligations | 1,698,700 | 6.2 | |||||||||
| Short-Term Investments | 435,654 | 1.6 | |||||||||
| Asset-Backed Securities | 373,758 | 1.4 | |||||||||
| Municipal Bonds | 282,810 | 1.0 | |||||||||
| U.S. Government Agencies - Mortgage-Backed Securities | 183,757 | 0.7 | |||||||||
| Preferred Stock | 77,498 | 0.3 | |||||||||
| Common Stocks | 2,573 | 0.0 | |||||||||
| $ | 27,315,727 | + | 100.0 | % | |||||||
+ Does not include open foreign currency exchange contracts with net unrealized appreciation of $96. Does not include open long/short futures contracts with an underlying face amount of $7,263,954 and net unrealized appreciation of $21,258. Also does not include open swap contracts with net unrealized depreciation of $250,779.
See Notes to Financial Statements
43
Global Infrastructure
Portfolio of Investments n December 31, 2010
| NUMBER OF SHARES | VALUE | ||||||||||
| Common Stocks (98.0%) Australia (4.1%) | |||||||||||
| Airports | |||||||||||
| 115,848 | MAP Group (Stapled Securities) (a) | $ | 354,282 | ||||||||
| Diversified | |||||||||||
| 62,700 | DUET Group (Stapled Securities) (a)(b) | 108,058 | |||||||||
| Oil & Gas Storage & Transportation | |||||||||||
| 43,100 | APA Group (Stapled Securities) (a) | 178,535 | |||||||||
| Toll Roads | |||||||||||
| 93,500 | Transurban Group (Stapled Securities) (a)(b) | 489,634 | |||||||||
| Transmission & Distribution | |||||||||||
| 124,057 | Spark Infrastructure Group | 144,015 | |||||||||
| Total Australia | 1,274,524 | ||||||||||
| Brazil (0.6%) | |||||||||||
| Water | |||||||||||
| 3,200 | Cia de Saneamento Basico do Estado de Sao Paulo (ADR) | 169,216 | |||||||||
| Canada (13.9%) | |||||||||||
| Oil & Gas Storage & Transportation | |||||||||||
| 32,840 | Enbridge, Inc. | 1,858,500 | |||||||||
| 59,290 | TransCanada Corp. | 2,265,340 | |||||||||
| 4,123,840 | |||||||||||
| Transmission & Distribution | |||||||||||
| 4,610 | Fortis, Inc. | 157,546 | |||||||||
| Total Canada | 4,281,386 | ||||||||||
| China (5.3%) | |||||||||||
| Oil & Gas Storage & Transportation | |||||||||||
| 81,000 | Beijing Enterprises Holdings Ltd. (c) | 502,290 | |||||||||
| 136,000 | China Gas Holdings Ltd. (c)(e) | 59,315 | |||||||||
| NUMBER OF SHARES | VALUE | ||||||||||
| 84,000 | ENN Energy Holdings Ltd. (c) | $ | 251,801 | ||||||||
| 813,406 | |||||||||||
| Ports | |||||||||||
| 106,370 | China Merchants Holdings International Co., Ltd. (c) | 420,126 | |||||||||
| Toll Roads | |||||||||||
| 331,000 | Jiangsu Expressway Co., Ltd. (H Shares) (c) | 379,001 | |||||||||
| Total China | 1,612,533 | ||||||||||
| France (6.7%) | |||||||||||
| Airports | |||||||||||
| 2,300 | Aeroports de Paris (ADP) | 181,552 | |||||||||
| Communications | |||||||||||
| 9,637 | Eutelsat Communications | 352,729 | |||||||||
| 44,385 | SES SA | 1,056,644 | |||||||||
| 1,409,373 | |||||||||||
| Toll Roads | |||||||||||
| 53,150 | Groupe Eurotunnel SA | 467,344 | |||||||||
| Total France | 2,058,269 | ||||||||||
| Germany (0.8%) | |||||||||||
| Airports | |||||||||||
| 3,666 | Fraport AG Frankfurt Airport Services Worldwide | 231,032 | |||||||||
| Hong Kong (2.9%) | |||||||||||
| Oil & Gas Storage & Transportation | |||||||||||
| 381,600 | Hong Kong & China Gas Co., Ltd. | 899,407 | |||||||||
| Italy (5.4%) | |||||||||||
| Oil & Gas Storage & Transportation | |||||||||||
| 91,489 | Snam Rete Gas SpA | 454,798 | |||||||||
| Toll Roads | |||||||||||
| 40,605 | Atlantia SpA | 828,563 | |||||||||
See Notes to Financial Statements
44
Global Infrastructure
Portfolio of Investments n December 31, 2010 continued
| NUMBER OF SHARES | VALUE | ||||||||||
| Transmission & Distribution | |||||||||||
| 88,400 | Terna Rete Elettrica Nazionale SpA | $ | 373,290 | ||||||||
| Total Italy | 1,656,651 | ||||||||||
| Mexico (1.6%) | |||||||||||
| Airports | |||||||||||
| 7,100 | Grupo Aeroportuario del Pacifico SAB de CV (ADR) | 288,331 | |||||||||
| 3,600 | Grupo Aeroportuario del Sureste SAB de CV (ADR) | 203,220 | |||||||||
| Total Mexico | 491,551 | ||||||||||
| Netherlands (0.4%) | |||||||||||
| Oil & Gas Storage & Transportation | |||||||||||
| 2,800 | Koninklijke Vopak N.V. | 132,268 | |||||||||
| New Zealand (0.5%) | |||||||||||
| Airports | |||||||||||
| 91,670 | Auckland International Airport Ltd. | 155,715 | |||||||||
| Spain (6.4%) | |||||||||||
| Diversified | |||||||||||
| 34,593 | Ferrovial SA | 343,697 | |||||||||
| Oil & Gas Storage & Transportation | |||||||||||
| 9,893 | Enagas | 197,178 | |||||||||
| Toll Roads | |||||||||||
| 80,082 | Abertis Infraestructuras SA | 1,439,877 | |||||||||
| Total Spain | 1,980,752 | ||||||||||
| Switzerland (0.5%) | |||||||||||
| Airports | |||||||||||
| 384 | Flughafen Zuerich AG | 156,886 | |||||||||
| United Kingdom (11.0%) | |||||||||||
| Transmission & Distribution | |||||||||||
| 253,400 | National Grid PLC | 2,184,755 | |||||||||
| NUMBER OF SHARES | VALUE | ||||||||||
| Water | |||||||||||
| 26,800 | Pennon Group PLC | $ | 267,415 | ||||||||
| 15,500 | Severn Trent PLC | 357,172 | |||||||||
| 60,500 | United Utilities Group PLC | 558,404 | |||||||||
| 1,182,991 | |||||||||||
| Total United Kingdom | 3,367,746 | ||||||||||
| United States (37.9%) | |||||||||||
| Communications | |||||||||||
| 36,000 | American Tower Corp. (Class A) (d) | 1,859,040 | |||||||||
| 28,520 | Crown Castle International Corp. (d) | 1,250,031 | |||||||||
| 14,170 | SBA Communications Corp. (Class A) (d) | 580,120 | |||||||||
| 3,689,191 | |||||||||||
| Diversified | |||||||||||
| 66,290 | Centerpoint Energy, Inc. | 1,042,079 | |||||||||
| Oil & Gas Storage & Transportation | |||||||||||
| 3,090 | AGL Resources, Inc. | 110,777 | |||||||||
| 6,970 | Atmos Energy Corp. | 217,464 | |||||||||
| 7,806 | Kinder Morgan Management LLC (d) | 522,065 | |||||||||
| 2,080 | New Jersey Resources Corp. | 89,669 | |||||||||
| 23,280 | NiSource, Inc. | 410,194 | |||||||||
| 9,570 | Oneok, Inc. | 530,848 | |||||||||
| 13,840 | Southern Union Co. | 333,129 | |||||||||
| 2,720 | Southwest Gas Corp. | 99,742 | |||||||||
| 62,265 | Spectra Energy Corp. | 1,556,002 | |||||||||
| 3,869,890 | |||||||||||
| Transmission & Distribution | |||||||||||
| 13,610 | Consolidated Edison, Inc. | 674,648 | |||||||||
| 14,390 | ITC Holdings Corp. | 891,892 | |||||||||
| 19,980 | Northeast Utilities | 636,963 | |||||||||
| 3,980 | NorthWestern Corp. | 114,743 | |||||||||
| 8,670 | NSTAR | 365,787 | |||||||||
| 2,684,033 | |||||||||||
See Notes to Financial Statements
45
Global Infrastructure
Portfolio of Investments n December 31, 2010 continued
| NUMBER OF SHARES | VALUE | ||||||||||
| Water | |||||||||||
| 6,430 | American Water Works Co., Inc. | $ | 162,614 | ||||||||
| 9,260 | Aqua America, Inc. | 208,165 | |||||||||
| 370,779 | |||||||||||
| Total United States | 11,655,972 | ||||||||||
| Total Common Stocks (Cost $26,672,572) | 30,123,908 | ||||||||||
| NUMBER OF SHARES (000) | |||||||||||
| Short-Term Investment (1.7%) | |||||||||||
| Investment Company | |||||||||||
| 510 | Morgan Stanley Institutional Liquidity Funds - Money Market Portfolio - Institutional Class (See Note 6) (Cost $510,304) | 510,304 | |||||||||
| Total Investments (Cost $27,182,876) (f) | 99.7 | % | 30,634,212 | ||||||||
| Other Assets in Excess of Liabilities | 0.3 | 91,251 | |||||||||
| Net Assets | 100.0 | % | $ | 30,725,463 | |||||||
ADR American Depositary Receipt.
(a) Comprised of securities in separate entities that are traded as a single stapled security.
(b) Consists of one or more class of securities traded together as a unit; stocks with attached warrants.
(c) Security trades on the Hong Kong exchange.
(d) Non-income producing security.
(e) Illiquid security.
(f) The aggregate cost for federal income tax purposes is $27,279,476. The aggregate gross unrealized appreciation is $3,791,613 and the aggregate gross unrealized depreciation is $436,877 resulting in net unrealized appreciation of $3,354,736.
| SUMMARY OF INVESTMENTS INDUSTRY | VALUE | PERCENT OF TOTAL INVESTMENTS | |||||||||
| Oil & Gas Storage & Transportation | $ | 10,669,322 | 34.8 | % | |||||||
| Transmission & Distribution | 5,543,639 | 18.1 | |||||||||
| Communications | 5,098,564 | 16.6 | |||||||||
| Toll Roads | 3,604,419 | 11.8 | |||||||||
| Water | 1,722,986 | 5.6 | |||||||||
| Airports | 1,571,018 | 5.1 | |||||||||
| Diversified | 1,493,834 | 4.9 | |||||||||
| Investment Company | 510,304 | 1.7 | |||||||||
| Ports | 420,126 | 1.4 | |||||||||
| $ | 30,634,212 | 100.0 | % | ||||||||
See Notes to Financial Statements
46
Capital Growth
Portfolio of Investments n December 31, 2010
| NUMBER OF SHARES | VALUE | ||||||||||
| Common Stocks (97.7%) | |||||||||||
| Air Freight & Logistics (3.9%) | |||||||||||
| 5,606 | C.H. Robinson Worldwide, Inc. | $ | 449,545 | ||||||||
| 12,597 | Expeditors International of Washington, Inc. | 687,796 | |||||||||
| 1,137,341 | |||||||||||
| Beverages (1.9%) | |||||||||||
| 9,545 | Anheuser-Busch InBev (ADR) (Belgium) | 544,924 | |||||||||
| Capital Markets (1.7%) | |||||||||||
| 29,562 | Charles Schwab Corp. (The) | 505,806 | |||||||||
| Chemicals (3.0%) | |||||||||||
| 12,654 | Monsanto Co. | 881,224 | |||||||||
| Commercial Services & Supplies (2.9%) | |||||||||||
| 35,395 | Edenred (France) (a) | 837,896 | |||||||||
| Communications Equipment (1.0%) | |||||||||||
| 13,991 | Cisco Systems, Inc. (a) | 283,038 | |||||||||
| Computers & Peripherals (7.8%) | |||||||||||
| 7,041 | Apple, Inc. (a) | 2,271,145 | |||||||||
| Construction Materials (1.1%) | |||||||||||
| 3,424 | Martin Marietta Materials, Inc. | 315,830 | |||||||||
| Distributors (3.1%) | |||||||||||
| 158,000 | Li & Fung Ltd. (Bermuda) (b) | 916,761 | |||||||||
| Diversified Financial Services (6.5%) | |||||||||||
| 98,165 | BM&F Bovespa SA (Brazil) | 776,450 | |||||||||
| 1,541 | CME Group, Inc. | 495,817 | |||||||||
| 21,381 | Leucadia National Corp. | 623,897 | |||||||||
| 1,896,164 | |||||||||||
| Food & Staples Retailing (1.6%) | |||||||||||
| 6,580 | Costco Wholesale Corp. | 475,142 | |||||||||
| Food Products (2.8%) | |||||||||||
| 13,133 | Mead Johnson Nutrition Co. | 817,529 | |||||||||
| NUMBER OF SHARES | VALUE | ||||||||||
| Health Care Equipment & Supplies (2.0%) | |||||||||||
| 2,285 | Intuitive Surgical, Inc. (a) | $ | 588,959 | ||||||||
| Hotels, Restaurants & Leisure (9.4%) | |||||||||||
| 26,181 | Las Vegas Sands Corp. (a) | 1,203,017 | |||||||||
| 19,410 | Starbucks Corp. | 623,643 | |||||||||
| 4,595 | Wynn Resorts Ltd. | 477,145 | |||||||||
| 9,093 | Yum! Brands, Inc. | 446,012 | |||||||||
| 2,749,817 | |||||||||||
| Information Technology Services (2.9%) | |||||||||||
| 20,676 | Teradata Corp. (a) | 851,024 | |||||||||
| Internet & Catalog Retail (9.6%) | |||||||||||
| 13,059 | Amazon.com, Inc. (a) | 2,350,620 | |||||||||
| 2,608 | NetFlix, Inc. (a) | 458,225 | |||||||||
| 2,808,845 | |||||||||||
| Internet Software & Services (13.4%) | |||||||||||
| 10,567 | Baidu, Inc. (ADR) (Cayman Islands) (a) | 1,020,033 | |||||||||
| 28,286 | eBay, Inc. (a) | 787,199 | |||||||||
| 2,902 | Google, Inc. (Class A) (a) | 1,723,701 | |||||||||
| 17,900 | Tencent Holdings Ltd. (Cayman Islands) (b) | 388,960 | |||||||||
| 3,919,893 | |||||||||||
| Life Sciences Tools & Services (3.0%) | |||||||||||
| 14,032 | Illumina, Inc. (a) | 888,787 | |||||||||
| Media (2.2%) | |||||||||||
| 10,728 | Naspers Ltd. (Class N) (South Africa) | 631,792 | |||||||||
| Oil, Gas & Consumable Fuels (4.0%) | |||||||||||
| 6,361 | Range Resources Corp. | 286,118 | |||||||||
| 18,776 | Ultra Petroleum Corp. (Canada) (a) | 896,929 | |||||||||
| 1,183,047 | |||||||||||
See Notes to Financial Statements
47
Capital Growth
Portfolio of Investments n December 31, 2010 continued
| NUMBER OF SHARES | VALUE | ||||||||||
| Pharmaceuticals (1.4%) | |||||||||||
| 5,967 | Allergan, Inc. | $ | 409,754 | ||||||||
| Professional Services (1.5%) | |||||||||||
| 254 | SGS SA (Registered Shares) (Switzerland) | 426,231 | |||||||||
| Real Estate Management & Development (4.3%) | |||||||||||
| 37,737 | Brookfield Asset Management, Inc. (Class A) (Canada) | 1,256,265 | |||||||||
| Semiconductors & Semiconductor Equipment (0.9%) | |||||||||||
| 1,978 | First Solar, Inc. (a) | 257,417 | |||||||||
| Software (3.8%) | |||||||||||
| 6,233 | Salesforce.com, Inc. (a) | 822,756 | |||||||||
| 3,333 | VMware, Inc. (Class A) (a) | 296,337 | |||||||||
| 1,119,093 | |||||||||||
| Tobacco (2.0%) | |||||||||||
| 10,262 | Philip Morris International, Inc. | 600,635 | |||||||||
| Total Common Stocks (Cost $20,410,916) | 28,574,359 | ||||||||||
| Convertible Preferred Stocks (0.6%) | |||||||||||
| Alternative Energy | |||||||||||
| 54,420 | Better Place, Inc. (Cost $163,260) (a)(c)(d) | 163,260 | |||||||||
| NUMBER OF SHARES (000) | VALUE | ||||||||||
| Short-Term Investment (1.9%) | |||||||||||
| Investment Company | |||||||||||
| 567 | Morgan Stanley Institutional Liquidity Funds - Money Market Portfolio - Institutional Class (See Note 6) (Cost $567,179) | $ | 567,179 | ||||||||
| Total Investments (Cost $21,141,355) (e) | 100.2 | % | 29,304,798 | ||||||||
| Liabilities in Excess of Other Assets | (0.2 | ) | (57,151 | ) | |||||||
| Net Assets | 100.0 | % | $ | 29,247,647 | |||||||
ADR American Depositary Receipt.
(a) Non-income producing security.
(b) Security trades on the Hong Kong exchange.
(c) Illiquid security. Resale is restricted to qualified institutional investors.
(d) At December 31, 2010, the Portfolio held fair valued securities valued at $163,260, representing 0.6% of net assets. These securities have been fair valued as determined in good faith under procedures established by and under the general supervision of the Fund's Trustees.
(e) The aggregate cost for federal income tax purposes is $21,336,956. The aggregate gross unrealized appreciation is $9,146,954 and the aggregate gross unrealized depreciation is $1,179,112 resulting in net unrealized appreciation of $7,967,842.
See Notes to Financial Statements
48
Capital Growth
Summary of Investments n December 31, 2010
| INDUSTRY | VALUE | PERCENT OF TOTAL INVESTMENTS | |||||||||
| Internet Software & Services | $ | 3,919,893 | 13.4 | % | |||||||
| Internet & Catalog Retail | 2,808,845 | 9.6 | |||||||||
| Hotels, Restaurants & Leisure | 2,749,817 | 9.4 | |||||||||
| Computers & Peripherals | 2,271,145 | 7.7 | |||||||||
| Diversified Financial Services | 1,896,164 | 6.5 | |||||||||
| Real Estate Management & Development | 1,256,265 | 4.3 | |||||||||
| Oil, Gas & Consumable Fuels | 1,183,047 | 4.0 | |||||||||
| Air Freight & Logistics | 1,137,341 | 3.9 | |||||||||
| Software | 1,119,093 | 3.8 | |||||||||
| Distributors | 916,761 | 3.1 | |||||||||
| Life Sciences Tools & Services | 888,787 | 3.0 | |||||||||
| Chemicals | 881,224 | 3.0 | |||||||||
| Computers - Integrated System | 851,024 | 2.9 | |||||||||
| INDUSTRY | VALUE | PERCENT OF TOTAL INVESTMENTS | |||||||||
| Commercial Services & Supplies | $ | 837,896 | 2.9 | % | |||||||
| Food Products | 817,529 | 2.8 | |||||||||
| Media | 631,792 | 2.2 | |||||||||
| Tobacco | 600,635 | 2.0 | |||||||||
| Health Care Equipment & Supplies | 588,959 | 2.0 | |||||||||
| Investment Company | 567,179 | 1.9 | |||||||||
| Beverages | 544,924 | 1.9 | |||||||||
| Capital Markets | 505,806 | 1.7 | |||||||||
| Food & Staples Retailing | 475,142 | 1.6 | |||||||||
| Professional Services | 426,231 | 1.4 | |||||||||
| Pharmaceuticals | 409,754 | 1.4 | |||||||||
| Construction Materials | 315,830 | 1.1 | |||||||||
| Communications Equipment | 283,038 | 1.0 | |||||||||
| Semiconductors & Semiconductor Equipment | 257,417 | 0.9 | |||||||||
| Alternative Energy | 163,260 | 0.6 | |||||||||
| $ | 29,304,798 | 100.0 | % | ||||||||
See Notes to Financial Statements
49
Focus Growth
Portfolio of Investments n December 31, 2010
| NUMBER OF SHARES | VALUE | ||||||||||
| Common Stocks (95.1%) | |||||||||||
| Air Freight & Logistics (2.6%) | |||||||||||
| 45,180 | Expeditors International of Washington, Inc. | $ | 2,466,828 | ||||||||
| Beverages (2.2%) | |||||||||||
| 35,392 | Anheuser-Busch InBev (ADR) (Belgium) | 2,020,529 | |||||||||
| Chemicals (3.7%) | |||||||||||
| 50,261 | Monsanto Co. | 3,500,176 | |||||||||
| Commercial Services & Supplies (3.2%) | |||||||||||
| 127,809 | Edenred (France) (a) | 3,025,586 | |||||||||
| Computers & Peripherals (9.0%) | |||||||||||
| 26,039 | Apple, Inc. (a) | 8,399,140 | |||||||||
| Distributors (3.6%) | |||||||||||
| 578,000 | Li & Fung Ltd. (Bermuda) (b) | 3,353,721 | |||||||||
| Diversified Financial Services (5.4%) | |||||||||||
| 357,933 | BM&F Bovespa SA (Brazil) | 2,831,121 | |||||||||
| 77,492 | Leucadia National Corp. | 2,261,216 | |||||||||
| 5,092,337 | |||||||||||
| Food Products (3.2%) | |||||||||||
| 47,749 | Mead Johnson Nutrition Co. | 2,972,375 | |||||||||
| Hotels, Restaurants & Leisure (8.9%) | |||||||||||
| 98,080 | Las Vegas Sands Corp. (a) | 4,506,776 | |||||||||
| 69,974 | Starbucks Corp. | 2,248,265 | |||||||||
| 32,870 | Yum! Brands, Inc. | 1,612,273 | |||||||||
| 8,367,314 | |||||||||||
| Information Technology Services (3.2%) | |||||||||||
| 73,579 | Teradata Corp. (a) | 3,028,512 | |||||||||
| Internet & Catalog Retail (10.9%) | |||||||||||
| 47,522 | Amazon.com, Inc. (a) | 8,553,960 | |||||||||
| 9,419 | NetFlix, Inc. (a) | 1,654,918 | |||||||||
| 10,208,878 | |||||||||||
| NUMBER OF SHARES | VALUE | ||||||||||
| Internet Software & Services (17.1%) | |||||||||||
| 39,186 | Baidu, Inc. (ADR) (Cayman Islands) (a) | $ | 3,782,625 | ||||||||
| 102,045 | eBay, Inc. (a) | 2,839,912 | |||||||||
| 87,824 | Facebook, Inc. (a)(c)(d) | 1,747,698 | |||||||||
| 10,644 | Google, Inc. (Class A) (a) | 6,322,217 | |||||||||
| 64,800 | Tencent Holdings Ltd. (Cayman Islands) (b) | 1,408,079 | |||||||||
| 16,100,531 | |||||||||||
| Life Sciences Tools & Services (3.4%) | |||||||||||
| 50,810 | Illumina, Inc. (a) | 3,218,305 | |||||||||
| Media (2.4%) | |||||||||||
| 38,788 | Naspers Ltd. (Class N) (South Africa) | 2,284,297 | |||||||||
| Oil, Gas & Consumable Fuels (4.5%) | |||||||||||
| 88,335 | Ultra Petroleum Corp. (Canada) (a) | 4,219,763 | |||||||||
| Professional Services (1.4%) | |||||||||||
| 800 | SGS SA (Registered Shares) (Switzerland) | 1,342,460 | |||||||||
| Real Estate Management & Development (4.8%) | |||||||||||
| 134,144 | Brookfield Asset Management, Inc. (Class A) (Canada) | 4,465,654 | |||||||||
| Software (3.2%) | |||||||||||
| 22,765 | Salesforce.com, Inc. (a) | 3,004,980 | |||||||||
| Tobacco (2.4%) | |||||||||||
| 38,008 | Philip Morris International, Inc. | 2,224,608 | |||||||||
| Total Common Stocks (Cost $65,726,986) | 89,295,994 | ||||||||||
| Convertible Preferred Stock (0.5%) | |||||||||||
| Alternative Energy | |||||||||||
| 166,815 | Better Place, Inc. (Cost $500,445) (a)(c)(d) | 500,445 | |||||||||
See Notes to Financial Statements
50
Focus Growth
Portfolio of Investments n December 31, 2010 continued
| NUMBER OF SHARES (000) | VALUE | ||||||||||
| Short-Term Investment (4.6%) | |||||||||||
| Investment Company | |||||||||||
| 4,357 | Morgan Stanley Institutional Liquidity Funds - Money Market Portfolio - Institutional Class (See Note 6) (Cost $4,357,343) | $ | 4,357,343 | ||||||||
| Total Investments (Cost $70,584,774) (e) | 100.2 | % | 94,153,782 | ||||||||
| Liabilities in Excess of Other Assets | (0.2 | ) | (204,353 | ) | |||||||
| Net Assets | 100.0 | % | $ | 93,949,429 | |||||||
ADR American Depositary Receipt.
(a) Non-income producing security.
(b) Security trades on the Hong Kong exchange.
(c) Illiquid security. Resale is restricted to qualified institutional investors.
(d) At December 31, 2010, the Portfolio held fair valued securities valued at $2,248,143, representing 2.4% of net assets. These securities have been fair valued as determined in good faith under procedures established by and under the general supervision of the Fund's Trustees.
(e) The aggregate cost for federal income tax purposes is $70,676,752. The aggregate gross unrealized appreciation is $28,318,804 and the aggregate gross unrealized depreciation is $4,841,774 resulting in net unrealized appreciation of $23,477,030.
| SUMMARY OF INVESTMENTS INDUSTRY | VALUE | PERCENT OF TOTAL INVESTMENTS | |||||||||
| Internet Software & Services | $ | 16,100,531 | 17.1 | % | |||||||
| Internet & Catalog Retail | 10,208,878 | 10.8 | |||||||||
| Computers & Peripherals | 8,399,140 | 8.9 | |||||||||
| Hotels, Restaurants & Leisure | 8,367,314 | 8.9 | |||||||||
| Diversified Financial Services | 5,092,337 | 5.4 | |||||||||
| Real Estate Management & Development | 4,465,654 | 4.8 | |||||||||
| Investment Company | 4,357,343 | 4.6 | |||||||||
| Oil, Gas & Consumable Fuels | 4,219,763 | 4.5 | |||||||||
| Chemicals | 3,500,176 | 3.7 | |||||||||
| Distributors | 3,353,721 | 3.6 | |||||||||
| Life Sciences Tools & Services | 3,218,305 | 3.4 | |||||||||
| Information Technology Services | 3,028,512 | 3.2 | |||||||||
| Commercial Services & Supplies | 3,025,586 | 3.2 | |||||||||
| Software | 3,004,980 | 3.2 | |||||||||
| Food Products | 2,972,375 | 3.2 | |||||||||
| Air Freight & Logistics | 2,466,828 | 2.6 | |||||||||
| Media | 2,284,297 | 2.4 | |||||||||
| Tobacco | 2,224,608 | 2.4 | |||||||||
| Beverages | 2,020,529 | 2.2 | |||||||||
| Professional Services | 1,342,460 | 1.4 | |||||||||
| Alternative Energy | 500,445 | 0.5 | |||||||||
| $ | 94,153,782 | 100.0 | % | ||||||||
See Notes to Financial Statements
51
Capital Opportunities
Portfolio of Investments n December 31, 2010
| NUMBER OF SHARES | VALUE | ||||||||||
| Common Stocks (97.6%) | |||||||||||
| Air Freight & Logistics (2.3%) | |||||||||||
| 9,911 | Expeditors International of Washington, Inc. | $ | 541,141 | ||||||||
| Capital Markets (3.2%) | |||||||||||
| 9,114 | Greenhill & Co., Inc. | 744,432 | |||||||||
| Chemicals (3.0%) | |||||||||||
| 9,930 | Monsanto Co. | 691,525 | |||||||||
| Commercial Services & Supplies (2.8%) | |||||||||||
| 27,181 | Edenred (France) (a) | 643,448 | |||||||||
| Computers & Peripherals (7.1%) | |||||||||||
| 5,142 | Apple, Inc. (a) | 1,658,603 | |||||||||
| Distributors (3.1%) | |||||||||||
| 122,974 | Li & Fung Ltd. (Bermuda) (b) | 713,530 | |||||||||
| Diversified Financial Services (7.6%) | |||||||||||
| 76,213 | BM&F Bovespa SA (Brazil) | 602,817 | |||||||||
| 17,272 | Leucadia National Corp. | 503,997 | |||||||||
| 17,144 | MSCI, Inc. (Class A) (a) | 667,930 | |||||||||
| 1,774,744 | |||||||||||
| Food Products (2.5%) | |||||||||||
| 9,461 | Mead Johnson Nutrition Co. | 588,947 | |||||||||
| Health Care Technology (2.3%) | |||||||||||
| 13,067 | athenahealth, Inc. (a) | 535,486 | |||||||||
| Hotels, Restaurants & Leisure (9.5%) | |||||||||||
| 14,688 | Ctrip.com International Ltd. (ADR) (Cayman Islands) (a) | 594,130 | |||||||||
| 20,537 | Las Vegas Sands Corp. (a) | 943,675 | |||||||||
| 14,100 | PF Chang's China Bistro, Inc. | 683,286 | |||||||||
| 2,221,091 | |||||||||||
| Information Technology Services (2.9%) | |||||||||||
| 16,274 | Teradata Corp. (a) | 669,838 | |||||||||
| Internet & Catalog Retail (9.9%) | |||||||||||
| 9,540 | Amazon.com, Inc. (a) | 1,717,200 | |||||||||
| 3,308 | NetFlix, Inc. (a) | 581,216 | |||||||||
| 2,298,416 | |||||||||||
| NUMBER OF SHARES | VALUE | ||||||||||
| Internet Software & Services (9.8%) | |||||||||||
| 7,504 | Baidu, Inc. (ADR) (Cayman Islands) (a) | $ | 724,361 | ||||||||
| 2,119 | Google, Inc. (Class A) (a) | 1,258,622 | |||||||||
| 14,000 | Tencent Holdings Ltd. (Cayman Islands) (b) | 304,215 | |||||||||
| 2,287,198 | |||||||||||
| Life Sciences Tools & Services (5.4%) | |||||||||||
| 11,828 | Illumina, Inc. (a) | 749,185 | |||||||||
| 7,862 | Techne Corp. | 516,298 | |||||||||
| 1,265,483 | |||||||||||
| Media (2.1%) | |||||||||||
| 8,351 | Naspers Ltd. (Class N) (South Africa) | 491,806 | |||||||||
| Metals & Mining (5.3%) | |||||||||||
| 588,393 | Lynas Corp. Ltd. (Australia) (a) | 1,239,723 | |||||||||
| Oil, Gas & Consumable Fuels (4.6%) | |||||||||||
| 8,257 | Range Resources Corp. | 371,400 | |||||||||
| 14,793 | Ultra Petroleum Corp. (Canada) (a) | 706,661 | |||||||||
| 1,078,061 | |||||||||||
| Professional Services (5.2%) | |||||||||||
| 11,353 | CoStar Group, Inc. (a) | 653,479 | |||||||||
| 16,512 | Verisk Analytics, Inc. (Class A) (a) | 562,729 | |||||||||
| 1,216,208 | |||||||||||
| Real Estate Management & Development (4.3%) | |||||||||||
| 29,697 | Brookfield Asset Management, Inc. (Class A) (Canada) | 988,613 | |||||||||
| Semiconductors & Semiconductor Equipment (1.9%) | |||||||||||
| 20,168 | Tessera Technologies, Inc. (a) | 446,721 | |||||||||
See Notes to Financial Statements
52
Capital Opportunities
Portfolio of Investments n December 31, 2010 continued
| NUMBER OF SHARES | VALUE | ||||||||||
| Software (2.8%) | |||||||||||
| 4,839 | Salesforce.com, Inc. (a) | $ | 638,748 | ||||||||
| Total Common Stocks (Cost $15,317,164) | 22,733,762 | ||||||||||
| Convertible Preferred Stock (0.5%) | |||||||||||
| Alternative Energy | |||||||||||
| 40,264 | Better Place, Inc. (Cost $120,792) (a)(c)(d) | 120,792 | |||||||||
| NUMBER OF SHARES (000) | |||||||||||
| Short-Term Investment (2.1%) | |||||||||||
| Investment Company | |||||||||||
| 489 | Morgan Stanley Institutional Liquidity Funds - Money Market Portfolio - Institutional Class (See Note 6) (Cost $489,005) | 489,005 | |||||||||
| Total Investments (Cost $15,926,961) (e) | 100.2 | % | 23,343,559 | ||||||||
| Liabilities in Excess of Other Assets | (0.2 | ) | (55,401 | ) | |||||||
| Net Assets | 100.0 | % | $ | 23,288,158 | |||||||
ADR American Depositary Receipt.
(a) Non-income producing security.
(b) Security trades on the Hong Kong exchange.
(c) Illiquid security. Resale is restricted to qualified institutional investors.
(d) At December 31, 2010, the Portfolio held fair valued securities valued at $120,792, representing 0.5% of net assets. These securities have been fair valued as determined in good faith under procedures established by and under the general supervision of the Fund's Trustees.
(e) The aggregate cost for federal income tax purposes is $15,948,744. The aggregate gross unrealized appreciation is $8,100,117 and the aggregate gross unrealized depreciation is $705,302 resulting in net unrealized appreciation of $7,394,815.
| SUMMARY OF INVESTMENTS INDUSTRY | VALUE | PERCENT OF TOTAL INVESTMENTS | |||||||||
| Internet & Catalog Retail | $ | 2,298,416 | 9.9 | % | |||||||
| Internet Software & Services | 2,287,198 | 9.8 | |||||||||
| Hotels, Restaurants & Leisure | 2,221,091 | 9.5 | |||||||||
| Diversified Financial Services | 1,774,744 | 7.6 | |||||||||
| Computers & Peripherals | 1,658,603 | 7.1 | |||||||||
| Life Sciences Tools & Services | 1,265,483 | 5.4 | |||||||||
| Metals & Mining | 1,239,723 | 5.3 | |||||||||
| Professional Services | 1,216,208 | 5.2 | |||||||||
| Oil, Gas & Consumable Fuels | 1,078,061 | 4.6 | |||||||||
| Real Estate Management & Development | 988,613 | 4.2 | |||||||||
| Capital Markets | 744,432 | 3.2 | |||||||||
| Distributors | 713,530 | 3.1 | |||||||||
| Chemicals | 691,525 | 3.0 | |||||||||
| Information Technology Services | 669,838 | 2.9 | |||||||||
| Commercial Services & Supplies | 643,448 | 2.8 | |||||||||
| Software | 638,748 | 2.7 | |||||||||
| Food Products | 588,947 | 2.5 | |||||||||
| Air Freight & Logistics | 541,141 | 2.3 | |||||||||
| Health Care Technology | 535,486 | 2.3 | |||||||||
| Media | 491,806 | 2.1 | |||||||||
| Investment Company | 489,005 | 2.1 | |||||||||
| Semiconductors & Semiconductor Equipment | 446,721 | 1.9 | |||||||||
| Alternative Energy | 120,792 | 0.5 | |||||||||
| $ | 23,343,559 | 100.0 | % | ||||||||
See Notes to Financial Statements
53
Mid Cap Growth
Portfolio of Investments n December 31, 2010
| NUMBER OF SHARES | VALUE | ||||||||||
| Common Stocks (97.5%) | |||||||||||
| Air Freight & Logistics (3.7%) | |||||||||||
| 6,732 | C.H. Robinson Worldwide, Inc. | $ | 539,839 | ||||||||
| 13,966 | Expeditors International of Washington, Inc. | 762,544 | |||||||||
| 1,302,383 | |||||||||||
| Biotechnology (0.6%) | |||||||||||
| 5,208 | Ironwood Pharmaceuticals, Inc. (a) | 53,903 | |||||||||
| 14,664 | Ironwood Pharmaceuticals, Inc. (a)(b) | 151,772 | |||||||||
| 205,675 | |||||||||||
| Capital Markets (2.5%) | |||||||||||
| 6,142 | Greenhill & Co., Inc. | 501,679 | |||||||||
| 6,156 | T. Rowe Price Group, Inc. | 397,308 | |||||||||
| 898,987 | |||||||||||
| Chemicals (4.7%) | |||||||||||
| 17,840 | Intrepid Potash, Inc. (a) | 665,254 | |||||||||
| 16,531 | Nalco Holding Co. | 528,000 | |||||||||
| 11,770 | Rockwood Holdings, Inc. (a) | 460,442 | |||||||||
| 1,653,696 | |||||||||||
| Commercial Services & Supplies (5.4%) | |||||||||||
| 26,104 | Covanta Holding Corp. | 448,728 | |||||||||
| 38,614 | Edenred (France) (a) | 914,098 | |||||||||
| 6,592 | Stericycle, Inc. (a) | 533,425 | |||||||||
| 1,896,251 | |||||||||||
| Construction Materials (1.3%) | |||||||||||
| 5,084 | Martin Marietta Materials, Inc. | 468,948 | |||||||||
| Diversified Consumer Services (1.4%) | |||||||||||
| 4,606 | New Oriental Education & Technology Group (ADR) (Cayman Islands) (a) | 484,689 | |||||||||
| Diversified Financial Services (5.7%) | |||||||||||
| 4,151 | IntercontinentalExchange, Inc. (a) | 494,592 | |||||||||
| 19,348 | Leucadia National Corp. | 564,575 | |||||||||
| NUMBER OF SHARES | VALUE | ||||||||||
| 5,251 | Moody's Corp. | $ | 139,361 | ||||||||
| 20,643 | MSCI, Inc. (Class A) (a) | 804,251 | |||||||||
| 2,002,779 | |||||||||||
| Food Products (2.3%) | |||||||||||
| 13,064 | Mead Johnson Nutrition Co. | 813,234 | |||||||||
| Health Care Equipment & Supplies (4.9%) | |||||||||||
| 9,907 | Gen-Probe, Inc. (a) | 578,073 | |||||||||
| 6,509 | IDEXX Laboratories, Inc. (a) | 450,553 | |||||||||
| 2,730 | Intuitive Surgical, Inc. (a) | 703,658 | |||||||||
| 1,732,284 | |||||||||||
| Hotels, Restaurants & Leisure (7.2%) | |||||||||||
| 6,727 | Betfair Group PLC (United Kingdom) (a) | 101,104 | |||||||||
| 2,731 | Chipotle Mexican Grill, Inc. (Class A) (a) | 580,775 | |||||||||
| 20,840 | Ctrip.com International Ltd. (ADR) (Cayman Islands) (a) | 842,978 | |||||||||
| 9,719 | Wynn Resorts Ltd. | 1,009,221 | |||||||||
| 2,534,078 | |||||||||||
| Household Durables (1.7%) | |||||||||||
| 18,728 | Gafisa SA (ADR) (Brazil) | 272,118 | |||||||||
| 477 | NVR, Inc. (a) | 329,616 | |||||||||
| 601,734 | |||||||||||
| Information Technology Services (4.0%) | |||||||||||
| 14,719 | Gartner, Inc. (a) | 488,671 | |||||||||
| 22,068 | Teradata Corp. (a) | 908,319 | |||||||||
| 1,396,990 | |||||||||||
| Internet & Catalog Retail (5.8%) | |||||||||||
| 4,909 | NetFlix, Inc. (a) | 862,511 | |||||||||
| 2,932 | Priceline.com, Inc. (a) | 1,171,481 | |||||||||
| 2,033,992 | |||||||||||
| Internet Software & Services (2.2%) | |||||||||||
| 9,260 | Akamai Technologies, Inc. (a) | 435,683 | |||||||||
See Notes to Financial Statements
54
Mid Cap Growth
Portfolio of Investments n December 31, 2010 continued
| NUMBER OF SHARES | VALUE | ||||||||||
| 180,000 | Alibaba.com Ltd. (Cayman Islands) (c) | $ | 322,818 | ||||||||
| 758,501 | |||||||||||
| Life Sciences Tools & Services (4.3%) | |||||||||||
| 16,821 | Illumina, Inc. (a) | 1,065,442 | |||||||||
| 6,764 | Techne Corp. | 444,192 | |||||||||
| 1,509,634 | |||||||||||
| Machinery (2.0%) | |||||||||||
| 5,887 | Schindler Holding AG (Switzerland) | 696,366 | |||||||||
| Media (5.2%) | |||||||||||
| 8,482 | Discovery Communications, Inc. Ser C (a) | 311,205 | |||||||||
| 24,977 | Groupe Aeroplan, Inc. (Canada) | 343,393 | |||||||||
| 8,824 | Morningstar, Inc. | 468,378 | |||||||||
| 11,952 | Naspers Ltd. (Class N) (South Africa) | 703,875 | |||||||||
| 1,826,851 | |||||||||||
| Metals & Mining (2.3%) | |||||||||||
| 133,034 | Lynas Corp. Ltd. (Australia) (a) | 280,298 | |||||||||
| 10,363 | Molycorp, Inc. (a) | 517,114 | |||||||||
| 797,412 | |||||||||||
| Multiline Retail (2.1%) | |||||||||||
| 9,794 | Dollar Tree, Inc. (a) | 549,248 | |||||||||
| 2,486 | Sears Holdings Corp. (a) | 183,342 | |||||||||
| 732,590 | |||||||||||
| Oil, Gas & Consumable Fuels (3.8%) | |||||||||||
| 11,717 | Range Resources Corp. | 527,031 | |||||||||
| 17,045 | Ultra Petroleum Corp. (Canada) (a) | 814,239 | |||||||||
| 1,341,270 | |||||||||||
| Personal Products (1.5%) | |||||||||||
| 17,937 | Natura Cosmeticos SA (Brazil) | 515,311 | |||||||||
| NUMBER OF SHARES | VALUE | ||||||||||
| Professional Services (5.7%) | |||||||||||
| 6,667 | IHS, Inc. (Class A) (a) | $ | 535,960 | ||||||||
| 24,556 | Intertek Group PLC (United Kingdom) | 679,559 | |||||||||
| 23,403 | Verisk Analytics, Inc. (Class A) (a) | 797,574 | |||||||||
| 2,013,093 | |||||||||||
| Semiconductors & Semiconductor Equipment (1.8%) | |||||||||||
| 16,002 | ARM Holdings PLC (ADR) (United Kingdom) | 332,042 | |||||||||
| 2,202 | First Solar, Inc. (a) | 286,568 | |||||||||
| 618,610 | |||||||||||
| Software (11.4%) | |||||||||||
| 11,603 | Autodesk, Inc. (a) | 443,234 | |||||||||
| 4,483 | Citrix Systems, Inc. (a) | 306,682 | |||||||||
| 5,884 | Factset Research Systems, Inc. | 551,684 | |||||||||
| 13,509 | Red Hat, Inc. (a) | 616,686 | |||||||||
| 6,332 | Rovi Corp. (a) | 392,647 | |||||||||
| 6,893 | Salesforce.com, Inc. (a) | 909,876 | |||||||||
| 15,496 | Solera Holdings, Inc. | 795,255 | |||||||||
| 4,016,064 | |||||||||||
| Textiles, Apparel & Luxury Goods (1.2%) | |||||||||||
| 6,443 | Lululemon Athletica, Inc. (a) | 440,830 | |||||||||
| Trading Companies & Distributors (1.4%) | |||||||||||
| 8,142 | Fastenal Co. | 487,787 | |||||||||
| Wireless Telecommunication Services (1.4%) | |||||||||||
| 4,994 | Millicom International Cellular SA (Luxembourg) | 477,426 | |||||||||
| Total Common Stocks (Cost $28,235,968) | 34,257,465 | ||||||||||
See Notes to Financial Statements
55
Mid Cap Growth
Portfolio of Investments n December 31, 2010 continued
| NUMBER OF SHARES | VALUE | ||||||||||
| Convertible Preferred Stocks (1.2%) | |||||||||||
| Alternative Energy (0.5%) | |||||||||||
| 56,056 | Better Place, Inc. (a)(d)(e) | $ | 168,168 | ||||||||
| Consumer Discretionary (0.7%) | |||||||||||
| 8,291 | Groupon, Inc. (Series G) (a)(d)(e) | 261,913 | |||||||||
| Total Convertible Preferred Stocks (Cost $430,081) | 430,081 | ||||||||||
| NUMBER OF SHARES (000) | |||||||||||
| Short-Term Investment (1.5%) | |||||||||||
| Investment Company | |||||||||||
| 516 | Morgan Stanley Institutional Liquidity Funds - Money Market Portfolio - Institutional Class (See Note 6) (Cost $516,425) | 516,425 | |||||||||
| Total Investments (Cost $29,182,474) (f) | 100.2 | % | 35,203,971 | ||||||||
| Liabilities in Excess of Other Assets | (0.2 | ) | (57,160 | ) | |||||||
| Net Assets | 100.0 | % | $ | 35,146,811 | |||||||
ADR American Depositary Receipt.
(a) Non-income producing security.
(b) Super voting rights at a ratio of 10:1.
(c) Security trades on the Hong Kong exchange.
(d) At December 31, 2010, the Portfolio held fair valued securities valued at $430,081, representing 1.2% of net assets. These securities have been fair valued as determined in good faith under procedures established by and under the general supervision of the Fund's Trustees.
(e) Illiquid security. Resale is restricted to qualified institutional investors.
(f) The aggregate cost for federal income tax purposes is $29,223,195. The aggregate gross unrealized appreciation is $7,833,212 and the aggregate gross unrealized depreciation is $1,852,436 resulting in net unrealized appreciation of $5,980,776.
| SUMMARY OF INVESTMENTS INDUSTRY | VALUE | PERCENT OF TOTAL INVESTMENTS | |||||||||
| Software | $ | 4,016,064 | 11.4 | % | |||||||
| Hotels, Restaurants & Leisure | 2,534,078 | 7.2 | |||||||||
| Internet & Catalog Retail | 2,033,992 | 5.8 | |||||||||
| Professional Services | 2,013,093 | 5.7 | |||||||||
| Diversified Financial Services | 2,002,779 | 5.7 | |||||||||
| Commercial Services & Supplies | 1,896,251 | 5.4 | |||||||||
| Media | 1,826,851 | 5.2 | |||||||||
| Health Care Equipment & Supplies | 1,732,284 | 4.9 | |||||||||
| Chemicals | 1,653,696 | 4.7 | |||||||||
| Life Sciences Tools & Services | 1,509,634 | 4.3 | |||||||||
| Information Technology Services | 1,396,990 | 4.0 | |||||||||
| Oil, Gas & Consumable Fuels | 1,341,270 | 3.8 | |||||||||
| Air Freight & Logistics | 1,302,383 | 3.7 | |||||||||
| Capital Markets | 898,987 | 2.5 | |||||||||
| Food Products | 813,234 | 2.3 | |||||||||
| Metals & Mining | 797,412 | 2.3 | |||||||||
| Internet Software & Services | 758,501 | 2.1 | |||||||||
| Multiline Retail | 732,590 | 2.1 | |||||||||
| Machinery | 696,366 | 2.0 | |||||||||
| Semiconductors & Semiconductor Equipment | 618,610 | 1.8 | |||||||||
| Household Durables | 601,734 | 1.7 | |||||||||
| Investment Company | 516,425 | 1.5 | |||||||||
| Personal Products | 515,311 | 1.5 | |||||||||
| Trading Companies & Distributors | 487,787 | 1.4 | |||||||||
| Diversified Consumer Services | 484,689 | 1.4 | |||||||||
| Wireless Telecommunication Services | 477,426 | 1.3 | |||||||||
| Construction Materials | 468,948 | 1.3 | |||||||||
| Textiles, Apparel & Luxury Goods | 440,830 | 1.2 | |||||||||
| Consumer Discretionary | 261,913 | 0.7 | |||||||||
| Biotechnology | 205,675 | 0.6 | |||||||||
| Alternative Energy | 168,168 | 0.5 | |||||||||
| $ | 35,203,971 | 100.0 | % | ||||||||
See Notes to Financial Statements
56
(This page has been intentionally left blank.)
Morgan Stanley Select Dimensions Investment Series
Financial Statements
Statements of Assets and Liabilities
December 31, 2010
| Money Market | Flexible Income | Global Infrastructure | Capital Growth | ||||||||||||||||
| Assets: | |||||||||||||||||||
| Investments in securities, at value* | $ | 100,626,885 | (1) | $ | 26,818,231 | $ | 30,123,908 | $ | 28,737,619 | ||||||||||
| Investment in affiliates, at value** | — | 497,496 | 510,304 | 567,179 | |||||||||||||||
| Unrealized appreciation on open swap contracts | — | 175,304 | — | — | |||||||||||||||
| Unrealized appreciation on open foreign currency exchange contracts | — | 4,321 | — | — | |||||||||||||||
| Cash | 5,358 | 1,821 | (2) | — | — | ||||||||||||||
| Due from broker | — | 20,000 | — | — | |||||||||||||||
| Receivable for: | |||||||||||||||||||
| Interest | 33,219 | 411,883 | — | — | |||||||||||||||
| Dividends | — | — | 129,697 | 11,960 | |||||||||||||||
| Foreign withholding taxes reclaimed | — | 554 | 12,877 | 3,889 | |||||||||||||||
| Shares of beneficial interest sold | 4 | — | 1,125 | — | |||||||||||||||
| Periodic interest on open swap contracts | — | 11,634 | — | — | |||||||||||||||
| Interest and dividends from affiliates | — | 3,339 | 95 | 67 | |||||||||||||||
| Principal paydowns | — | 25 | — | — | |||||||||||||||
| Swap contracts termination | — | 40,475 | — | — | |||||||||||||||
| Prepaid expenses and other assets | 3,829 | 3,552 | 5,145 | 3,014 | |||||||||||||||
| Total Assets | 100,669,295 | 27,988,635 | 30,783,151 | 29,323,728 | |||||||||||||||
| Liabilities: | |||||||||||||||||||
| Unrealized depreciation on open swap contracts | — | 426,083 | — | — | |||||||||||||||
| Unrealized depreciation on open foreign currency exchange contracts | — | 4,225 | — | — | |||||||||||||||
| Payable to bank | — | — | 752 | (2) | 329 | ||||||||||||||
| Payable for: | |||||||||||||||||||
| Shares of beneficial interest redeemed | 316,891 | 1,252 | 568 | 26,675 | |||||||||||||||
| Investment advisory fee | 15,388 | 7,390 | 14,749 | 12,473 | |||||||||||||||
| Administration fee | 4,388 | 1,866 | 2,082 | 2,006 | |||||||||||||||
| Distribution fee | — | 3,129 | 1,878 | 3,752 | |||||||||||||||
| Periodic interest on open swap contracts | — | 17,158 | — | — | |||||||||||||||
| Variation margin | — | 3,304 | — | — | |||||||||||||||
| Transfer agent fee | 167 | 176 | 167 | 167 | |||||||||||||||
| Investments purchased | — | 97 | — | — | |||||||||||||||
| Accrued expenses and other payables | 47,328 | 64,849 | 37,492 | 30,679 | |||||||||||||||
| Total Liabilities | 384,162 | 529,529 | 57,688 | 76,081 | |||||||||||||||
| Net Assets | $ | 100,285,133 | $ | 27,459,106 | $ | 30,725,463 | $ | 29,247,647 | |||||||||||
| Composition of Net Assets: | |||||||||||||||||||
| Paid-in-capital | $ | 100,279,906 | $ | 47,604,414 | $ | 24,847,798 | $ | 24,485,017 | |||||||||||
| Net unrealized appreciation | — | 1,000,593 | 3,452,867 | 8,163,878 | |||||||||||||||
| Accumulated undistributed net investment income (net investment loss) | 5,298 | 1,525,185 | 777,511 | (20,717 | ) | ||||||||||||||
| Accumulated net realized gain (loss) | (71 | ) | (22,671,086 | ) | 1,647,287 | (3,380,531 | ) | ||||||||||||
| Net Assets | $ | 100,285,133 | $ | 27,459,106 | $ | 30,725,463 | $ | 29,247,647 | |||||||||||
| * Cost | $ | 100,626,885 | $ | 25,630,974 | $ | 26,672,572 | $ | 20,574,176 | |||||||||||
| ** Affiliated Cost | $ | — | $ | 454,406 | $ | 510,304 | $ | 567,179 | |||||||||||
| Class X Shares: | |||||||||||||||||||
| Net Assets | $ | 32,428,833 | $ | 12,718,953 | $ | 21,842,740 | $ | 11,710,354 | |||||||||||
| Shares Outstanding (unlimited shares authorized, $.01 par value) | 32,427,463 | 2,048,989 | 972,988 | 501,996 | |||||||||||||||
| Net Asset Value Per Share | $ | 1.00 | $ | 6.21 | $ | 22.45 | $ | 23.33 | |||||||||||
| Class Y Shares: | |||||||||||||||||||
| Net Assets | $ | 67,856,300 | $ | 14,740,153 | $ | 8,882,723 | $ | 17,537,293 | |||||||||||
| Shares Outstanding (unlimited shares authorized, $.01 par value) | 67,852,443 | 2,389,586 | 396,488 | 766,664 | |||||||||||||||
| Net Asset Value Per Share | $ | 1.00 | $ | 6.17 | $ | 22.40 | $ | 22.87 | |||||||||||
(1) Including repurchase agreements of $15,635,000.
(2) Including foreign currency valued at $2,368, $9,675 and $2,697, respectively with a cost of $2,363, $9,518 and $2,696, respectively.
See Notes to Financial Statements
58
| Focus Growth | Capital Opportunities | Mid Cap Growth | |||||||||||||
| Assets: | |||||||||||||||
| Investments in securities, at value* | $ | 89,796,439 | $ | 22,854,554 | $ | 34,687,546 | |||||||||
| Investment in affiliates, at value** | 4,357,343 | 489,005 | 516,425 | ||||||||||||
| Unrealized appreciation on open swap contracts | — | — | — | ||||||||||||
| Unrealized appreciation on open foreign currency exchange contracts | — | — | — | ||||||||||||
| Cash | — | — | 2,553 | (2) | |||||||||||
| Due from broker | — | — | — | ||||||||||||
| Receivable for: | |||||||||||||||
| Interest | — | — | — | ||||||||||||
| Dividends | 38,030 | 2,871 | 10,512 | ||||||||||||
| Foreign withholding taxes reclaimed | — | — | — | ||||||||||||
| Shares of beneficial interest sold | — | 15,576 | — | ||||||||||||
| Periodic interest on open swap contracts | — | — | — | ||||||||||||
| Interest and dividends from affiliates | 662 | 59 | 113 | ||||||||||||
| Principal paydowns | — | — | — | ||||||||||||
| Swap contracts termination | — | — | — | ||||||||||||
| Prepaid expenses and other assets | 7,184 | 2,723 | 2,419 | ||||||||||||
| Total Assets | 94,199,658 | 23,364,788 | 35,219,568 | ||||||||||||
| Liabilities: | |||||||||||||||
| Unrealized depreciation on open swap contracts | — | — | — | ||||||||||||
| Unrealized depreciation on open foreign currency exchange contracts | — | — | — | ||||||||||||
| Payable to bank | — | — | — | ||||||||||||
| Payable for: | |||||||||||||||
| Shares of beneficial interest redeemed | 154,525 | 22,843 | 27,485 | ||||||||||||
| Investment advisory fee | 43,411 | 13,097 | 12,369 | ||||||||||||
| Administration fee | 6,470 | 1,571 | 2,393 | ||||||||||||
| Distribution fee | 4,765 | 2,756 | 2,312 | ||||||||||||
| Periodic interest on open swap contracts | — | — | — | ||||||||||||
| Variation margin | — | — | — | ||||||||||||
| Transfer agent fee | 208 | 167 | 167 | ||||||||||||
| Investments purchased | — | — | — | ||||||||||||
| Accrued expenses and other payables | 40,850 | 36,196 | 28,031 | ||||||||||||
| Total Liabilities | 250,229 | 76,630 | 72,757 | ||||||||||||
| Net Assets | $ | 93,949,429 | $ | 23,288,158 | $ | 35,146,811 | |||||||||
| Composition of Net Assets: | |||||||||||||||
| Paid-in-capital | $ | 78,959,510 | $ | 18,180,494 | $ | 31,513,265 | |||||||||
| Net unrealized appreciation | 23,569,069 | 7,416,613 | 6,021,502 | ||||||||||||
| Accumulated undistributed net investment income (net investment loss) | (100,200 | ) | (21,959 | ) | 61,897 | ||||||||||
| Accumulated net realized gain (loss) | (8,478,950 | ) | (2,286,990 | ) | (2,449,853 | ) | |||||||||
| Net Assets | $ | 93,949,429 | $ | 23,288,158 | $ | 35,146,811 | |||||||||
| * Cost | $ | 66,227,431 | $ | 15,437,956 | $ | 28,666,049 | |||||||||
| ** Affiliated Cost | $ | 4,357,343 | $ | 489,005 | $ | 516,425 | |||||||||
| Class X Shares: | |||||||||||||||
| Net Assets | $ | 72,166,142 | $ | 10,229,999 | $ | 24,318,536 | |||||||||
| Shares Outstanding (unlimited shares authorized, $.01 par value) | 3,221,720 | 617,725 | 688,188 | ||||||||||||
| Net Asset Value Per Share | $ | 22.40 | $ | 16.56 | $ | 35.34 | |||||||||
| Class Y Shares: | |||||||||||||||
| Net Assets | $ | 21,783,287 | $ | 13,058,159 | $ | 10,828,275 | |||||||||
| Shares Outstanding (unlimited shares authorized, $.01 par value) | 984,999 | 809,725 | 312,555 | ||||||||||||
| Net Asset Value Per Share | $ | 22.12 | $ | 16.13 | $ | 34.64 | |||||||||
59
Morgan Stanley Select Dimensions Investment Series
Financial Statements continued
Statements of Operations
For the year ended December 31, 2010
| Money Market | Flexible Income | Global Infrastructure | Capital Growth | ||||||||||||||||
| Net Investment Income: | |||||||||||||||||||
| Income | |||||||||||||||||||
| Dividends† | — | $ | 5,782 | $ | 1,126,688 | $ | 279,654 | ||||||||||||
| Interest† | $ | 364,432 | 1,510,437 | — | — | ||||||||||||||
| Interest and dividends from affiliates | — | 18,459 | 627 | 1,068 | |||||||||||||||
| Total Income | 364,432 | 1,534,678 | 1,127,315 | 280,722 | |||||||||||||||
| †Net of foreign withholding taxes | — | 896 | 81,847 | 9,970 | |||||||||||||||
| Expenses | |||||||||||||||||||
| Investment advisory fee | 536,857 | 93,005 | 179,101 | 139,884 | |||||||||||||||
| Administration fee | 59,651 | 23,251 | 25,137 | 22,381 | |||||||||||||||
| Distribution fee (Class Y shares) | 206,483 | 39,186 | 22,842 | 41,802 | |||||||||||||||
| Professional fees | 51,112 | 85,039 | 29,302 | 54,503 | |||||||||||||||
| Shareholder reports and notices | 29,387 | 8,169 | 14,338 | 7,747 | |||||||||||||||
| Custodian fees | 10,777 | 10,486 | 25,762 | 10,292 | |||||||||||||||
| Trustees' fees and expenses | 4,409 | 1,523 | 1,547 | 1,432 | |||||||||||||||
| Transfer agent fees and expenses | 2,000 | 2,010 | 2,000 | 2,000 | |||||||||||||||
| Other | 12,173 | 39,279 | 15,196 | 11,147 | |||||||||||||||
| Total Expenses | 912,849 | 301,948 | 315,225 | 291,188 | |||||||||||||||
| Less: amounts waived | (560,365 | ) | — | — | — | ||||||||||||||
| Less: rebate from Morgan Stanley affiliated cash sweep (Note 6) | — | (577 | ) | (464 | ) | (728 | ) | ||||||||||||
| Net Expenses | 352,484 | 301,371 | 314,761 | 290,460 | |||||||||||||||
| Net Investment Income (Loss) | 11,948 | 1,233,307 | 812,554 | (9,738 | ) | ||||||||||||||
| Net Realized and Unrealized Gain (Loss): | |||||||||||||||||||
| Net Realized Gain (Loss) on: | |||||||||||||||||||
| Investments | 1,731 | (1,291,415 | ) | 2,351,632 | 1,111,995 | ||||||||||||||
| Investments in affiliates | — | — | — | — | |||||||||||||||
| Futures contracts | — | (72,239 | ) | — | — | ||||||||||||||
| Swap contracts | — | (300,725 | ) | — | — | ||||||||||||||
| Options written | — | — | (8,037 | ) | — | ||||||||||||||
| Foreign currency exchange contracts | — | (7,313 | ) | (32,381 | ) | — | |||||||||||||
| Foreign currency translation | — | 3,175 | 5,797 | (8,083 | ) | ||||||||||||||
| Net Realized Gain (Loss) | 1,731 | (1,668,517 | ) | 2,317,011 | 1,103,912 | ||||||||||||||
| Change in Unrealized Appreciation/Depreciation on: | |||||||||||||||||||
| Investments | — | 3,126,816 | (1,207,646 | ) | 4,867,967 | ||||||||||||||
| Investments in affiliates | — | 22,002 | — | — | |||||||||||||||
| Futures contracts | — | (100,943 | ) | — | — | ||||||||||||||
| Swap contracts | — | (100,479 | ) | — | — | ||||||||||||||
| Options written | — | — | 9,657 | — | |||||||||||||||
| Foreign currency exchange contracts | — | (597 | ) | (23,217 | ) | — | |||||||||||||
| Foreign currency translation | — | (329 | ) | (2,525 | ) | 403 | |||||||||||||
| Net Change in Unrealized Appreciation/Depreciation | — | 2,946,470 | (1,223,731 | ) | 4,868,370 | ||||||||||||||
| Net Gain | 1,731 | 1,277,953 | 1,093,280 | 5,972,282 | |||||||||||||||
| Net Increase | $ | 13,679 | $ | 2,511,260 | $ | 1,905,834 | $ | 5,962,544 | |||||||||||
See Notes to Financial Statements
60
| Focus Growth | Capital Opportunities | Mid Cap Growth | |||||||||||||
| Net Investment Income: | |||||||||||||||
| Income | |||||||||||||||
| Dividends† | $ | 620,566 | $ | 162,117 | $ | 352,403 | |||||||||
| Interest† | — | 15 | 8 | ||||||||||||
| Interest and dividends from affiliates | 3,172 | 791 | 1,861 | ||||||||||||
| Total Income | 623,738 | 162,923 | 354,272 | ||||||||||||
| †Net of foreign withholding taxes | 30,118 | 5,466 | 8,930 | ||||||||||||
| Expenses | |||||||||||||||
| Investment advisory fee | 479,039 | 141,832 | 129,819 | ||||||||||||
| Administration fee | 70,318 | 16,935 | 24,728 | ||||||||||||
| Distribution fee (Class Y shares) | 53,054 | 29,948 | 22,812 | ||||||||||||
| Professional fees | 53,894 | 41,254 | 46,991 | ||||||||||||
| Shareholder reports and notices | 22,203 | 5,422 | 10,423 | ||||||||||||
| Custodian fees | 15,307 | 10,787 | 19,339 | ||||||||||||
| Trustees' fees and expenses | 3,038 | 1,248 | 1,626 | ||||||||||||
| Transfer agent fees and expenses | 2,499 | 2,000 | 2,000 | ||||||||||||
| Other | 9,707 | 9,318 | 9,930 | ||||||||||||
| Total Expenses | 709,059 | 258,744 | 267,668 | ||||||||||||
| Less: amounts waived | — | — | — | ||||||||||||
| Less: rebate from Morgan Stanley affiliated cash sweep (Note 6) | (2,141 | ) | (627 | ) | (1,297 | ) | |||||||||
| Net Expenses | 706,918 | 258,117 | 266,371 | ||||||||||||
| Net Investment Income (Loss) | (83,180 | ) | (95,194 | ) | 87,901 | ||||||||||
| Net Realized and Unrealized Gain (Loss): | |||||||||||||||
| Net Realized Gain (Loss) on: | |||||||||||||||
| Investments | 7,294,283 | 2,189,155 | 2,737,584 | ||||||||||||
| Investments in affiliates | — | — | — | ||||||||||||
| Futures contracts | — | — | — | ||||||||||||
| Swap contracts | — | — | — | ||||||||||||
| Options written | — | — | — | ||||||||||||
| Foreign currency exchange contracts | — | — | — | ||||||||||||
| Foreign currency translation | (60,186 | ) | (1,396 | ) | (24,170 | ) | |||||||||
| Net Realized Gain (Loss) | 7,234,097 | 2,187,759 | 2,713,414 | ||||||||||||
| Change in Unrealized Appreciation/Depreciation on: | |||||||||||||||
| Investments | 14,442,375 | 3,019,007 | 6,205,139 | ||||||||||||
| Investments in affiliates | — | — | — | ||||||||||||
| Futures contracts | — | — | — | ||||||||||||
| Swap contracts | — | — | — | ||||||||||||
| Options written | — | — | — | ||||||||||||
| Foreign currency exchange contracts | — | — | — | ||||||||||||
| Foreign currency translation | (7 | ) | (4 | ) | (13 | ) | |||||||||
| Net Change in Unrealized Appreciation/Depreciation | 14,442,368 | 3,019,003 | 6,205,126 | ||||||||||||
| Net Gain | 21,676,465 | 5,206,762 | 8,918,540 | ||||||||||||
| Net Increase | $ | 21,593,285 | $ | 5,111,568 | $ | 9,006,441 | |||||||||
61
Morgan Stanley Select Dimensions Investment Series
Financial Statements continued
Statements of Changes in Net Assets
| Money Market | Flexible Income | Global Infrastructure | |||||||||||||||||||||||||
| For The Year Ended December 31, 2010 | For The Year Ended December 31, 2009 | For The Year Ended December 31, 2010 | For The Year Ended December 31, 2009 | For The Year Ended December 31, 2010 | For The Year Ended December 31, 2009 | ||||||||||||||||||||||
| Increase (Decrease) in Net Assets: | |||||||||||||||||||||||||||
| Operations: | |||||||||||||||||||||||||||
| Net investment income (loss) | $ | 11,948 | $ | 31,169 | $ | 1,233,307 | $ | 1,648,525 | $ | 812,554 | $ | 896,923 | |||||||||||||||
| Net realized gain (loss) | 1,731 | 3,679 | (1,668,517 | ) | (2,725,228 | ) | 2,317,011 | 1,937,269 | |||||||||||||||||||
| Net change in unrealized appreciation/depreciation | — | — | 2,946,470 | 6,510,732 | (1,223,731 | ) | 2,606,306 | ||||||||||||||||||||
| Net Increase | 13,679 | 34,848 | 2,511,260 | 5,434,029 | 1,905,834 | 5,440,498 | |||||||||||||||||||||
| Dividends and Distributions to Shareholders from: | |||||||||||||||||||||||||||
| Net investment income | |||||||||||||||||||||||||||
| Class X shares | (3,673 | ) | (10,917 | ) | (837,953 | ) | (1,003,665 | ) | (542,666 | ) | (820,899 | ) | |||||||||||||||
| Class Y shares | (8,275 | ) | (20,411 | ) | (947,382 | ) | (1,132,621 | ) | (198,117 | ) | (310,320 | ) | |||||||||||||||
| Net realized gain | |||||||||||||||||||||||||||
| Class X shares | — | — | — | — | (992,833 | ) | — | ||||||||||||||||||||
| Class Y shares | — | — | — | — | (407,171 | ) | — | ||||||||||||||||||||
| Total Dividends and Distributions | (11,948 | ) | (31,328 | ) | (1,785,335 | ) | (2,136,286 | ) | (2,140,787 | ) | (1,131,219 | ) | |||||||||||||||
| Net decrease from transactions in shares of beneficial interest | (41,502,801 | ) | (74,002,763 | ) | (3,547,601 | ) | (3,417,770 | ) | (4,325,030 | ) | (6,206,557 | ) | |||||||||||||||
| Net Increase (Decrease) | (41,501,070 | ) | (73,999,243 | ) | (2,821,676 | ) | (120,027 | ) | (4,559,983 | ) | (1,897,278 | ) | |||||||||||||||
| Net Assets: | |||||||||||||||||||||||||||
| Beginning of period | 141,786,203 | 215,785,446 | 30,280,782 | 30,400,809 | 35,285,446 | 37,182,724 | |||||||||||||||||||||
| End of Period | $ | 100,285,133 | $ | 141,786,203 | $ | 27,459,106 | $ | 30,280,782 | $ | 30,725,463 | $ | 35,285,446 | |||||||||||||||
| Accumulated Undistributed Net Investment Income (Loss) | $ | 5,298 | $ | 3,496 | $ | 1,525,185 | $ | 1,682,126 | $ | 777,511 | $ | 528,597 | |||||||||||||||
See Notes to Financial Statements
62
| Capital Growth | Focus Growth | ||||||||||||||||||
| For The Year Ended December 31, 2010 | For The Year Ended December 31, 2009 | For The Year Ended December 31, 2010 | For The Year Ended December 31, 2009 | ||||||||||||||||
| Increase (Decrease) in Net Assets: | |||||||||||||||||||
| Operations: | |||||||||||||||||||
| Net investment income (loss) | $ | (9,738 | ) | $ | (10,641 | ) | $ | (83,180 | ) | $ | 37,227 | ||||||||
| Net realized gain (loss) | 1,103,912 | 581,297 | 7,234,097 | (623,054 | ) | ||||||||||||||
| Net change in unrealized appreciation/depreciation | 4,868,370 | 12,096,576 | 14,442,368 | 41,344,950 | |||||||||||||||
| Net Increase | 5,962,544 | 12,667,232 | 21,593,285 | 40,759,123 | |||||||||||||||
| Dividends and Distributions to Shareholders from: | |||||||||||||||||||
| Net investment income | |||||||||||||||||||
| Class X shares | — | — | (32,429 | ) | (70,533 | ) | |||||||||||||
| Class Y shares | — | — | — | — | |||||||||||||||
| Net realized gain | |||||||||||||||||||
| Class X shares | — | — | — | — | |||||||||||||||
| Class Y shares | — | — | — | — | |||||||||||||||
| Total Dividends and Distributions | — | — | (32,429 | ) | (70,533 | ) | |||||||||||||
| Net decrease from transactions in shares of beneficial interest | (6,326,474 | ) | (4,628,983 | ) | (17,590,923 | ) | (13,636,540 | ) | |||||||||||
| Net Increase (Decrease) | (363,930 | ) | 8,038,249 | 3,969,933 | 27,052,050 | ||||||||||||||
| Net Assets: | |||||||||||||||||||
| Beginning of period | 29,611,577 | 21,573,328 | 89,979,496 | 62,927,446 | |||||||||||||||
| End of Period | $ | 29,247,647 | $ | 29,611,577 | $ | 93,949,429 | $ | 89,979,496 | |||||||||||
| Accumulated Undistributed Net Investment Income (Loss) | $ | (20,717 | ) | $ | (27,090 | ) | $ | (100,200 | ) | $ | (91,045 | ) | |||||||
63
Morgan Stanley Select Dimensions Investment Series
Financial Statements continued
Statements of Changes in Net Assets continued
| Capital Opportunities | Mid Cap Growth | ||||||||||||||||||
| For The Year Ended December 31, 2010 | For The Year Ended December 31, 2009 | For The Year Ended December 31, 2010 | For The Year Ended December 31, 2009 | ||||||||||||||||
| Increase (Decrease) in Net Assets: | |||||||||||||||||||
| Operations: | |||||||||||||||||||
| Net investment income (loss) | $ | (95,194 | ) | $ | (69,602 | ) | $ | 87,901 | $ | 13,617 | |||||||||
| Net realized gain (loss) | 2,187,759 | (69,171 | ) | 2,713,414 | (192,181 | ) | |||||||||||||
| Net change in unrealized appreciation/depreciation | 3,019,003 | 9,763,648 | 6,205,126 | 11,842,434 | |||||||||||||||
| Net Increase | 5,111,568 | 9,624,875 | 9,006,441 | 11,663,870 | |||||||||||||||
| Dividends and Distributions to Shareholders from: | |||||||||||||||||||
| Net investment income | |||||||||||||||||||
| Class X shares | — | — | (29,523 | ) | — | ||||||||||||||
| Class Y shares | — | — | — | — | |||||||||||||||
| Net realized gain | |||||||||||||||||||
| Class X shares | — | — | — | — | |||||||||||||||
| Class Y shares | — | — | — | — | |||||||||||||||
| Total Dividends and Distributions | — | — | (29,523 | ) | — | ||||||||||||||
| Net decrease from transactions in shares of beneficial interest | (3,879,238 | ) | (2,884,300 | ) | (3,407,109 | ) | (3,578,703 | ) | |||||||||||
| Net Increase | 1,232,330 | 6,740,575 | 5,569,809 | 8,085,167 | |||||||||||||||
| Net Assets: | |||||||||||||||||||
| Beginning of period | 22,055,828 | 15,315,253 | 29,577,002 | 21,491,835 | |||||||||||||||
| End of Period | $ | 23,288,158 | $ | 22,055,828 | $ | 35,146,811 | $ | 29,577,002 | |||||||||||
| Accumulated Undistributed Net Investment Income (Loss) | $ | (21,959 | ) | $ | (24,930 | ) | $ | 61,897 | $ | 11,008 | |||||||||
See Notes to Financial Statements
64
Morgan Stanley Select Dimensions Investment Series
Financial Statements continued
Statements of Changes in Net Assets continued
Summary of Transactions in Shares of Beneficial Interest
| Money Market | Flexible Income | ||||||||||||||||||
| For The Year Ended December 31, 2010 | For The Year Ended December 31, 2009 | For The Year Ended December 31, 2010 | For The Year Ended December 31, 2009 | ||||||||||||||||
| Class X Shares | |||||||||||||||||||
| Shares | |||||||||||||||||||
| Sold | 5,757,479 | 23,532,252 | 53,531 | 122,598 | |||||||||||||||
| Reinvestment of dividends and distributions | 3,673 | 10,917 | 144,226 | 181,167 | |||||||||||||||
| Redeemed | (14,103,994 | ) | (24,962,965 | ) | (439,460 | ) | (713,172 | ) | |||||||||||
| Net Decrease - Class X | (8,342,842 | ) | (1,419,796 | ) | (241,703 | ) | (409,407 | ) | |||||||||||
| Amount | |||||||||||||||||||
| Sold | $ | 5,757,479 | $ | 23,532,252 | $ | 328,959 | $ | 702,112 | |||||||||||
| Reinvestment of dividends and distributions | 3,673 | 10,917 | 837,953 | 1,003,665 | |||||||||||||||
| Redeemed | (14,103,994 | ) | (24,962,965 | ) | (2,707,210 | ) | (4,093,617 | ) | |||||||||||
| Net Decrease - Class X | $ | (8,342,842 | ) | $ | (1,419,796 | ) | $ | (1,540,298 | ) | $ | (2,387,840 | ) | |||||||
| Class Y Shares | |||||||||||||||||||
| Shares | |||||||||||||||||||
| Sold | 22,638,817 | 21,918,415 | 142,135 | 281,684 | |||||||||||||||
| Reinvestment of dividends and distributions | 8,275 | 20,411 | 163,907 | 205,557 | |||||||||||||||
| Redeemed | (55,807,051 | ) | (94,521,793 | ) | (623,896 | ) | (662,492 | ) | |||||||||||
| Net Decrease - Class Y | (33,159,959 | ) | (72,582,967 | ) | (317,854 | ) | (175,251 | ) | |||||||||||
| Amount | |||||||||||||||||||
| Sold | $ | 22,638,817 | $ | 21,918,415 | $ | 863,174 | $ | 1,600,793 | |||||||||||
| Reinvestment of dividends and distributions | 8,275 | 20,411 | 947,382 | 1,132,621 | |||||||||||||||
| Redeemed | (55,807,051 | ) | (94,521,793 | ) | (3,817,859 | ) | (3,763,344 | ) | |||||||||||
| Net Decrease - Class Y | $ | (33,159,959 | ) | $ | (72,582,967 | ) | $ | (2,007,303 | ) | $ | (1,029,930 | ) | |||||||
See Notes to Financial Statements
65
Morgan Stanley Select Dimensions Investment Series
Financial Statements continued
Statements of Changes in Net Assets continued
Summary of Transactions in Shares of Beneficial Interest
| Global Infrastructure | Capital Growth | Focus Growth | |||||||||||||||||||||||||
| For The Year Ended December 31, 2010 | For The Year Ended December 31, 2009 | For The Year Ended December 31, 2010 | For The Year Ended December 31, 2009 | For The Year Ended December 31, 2010 | For The Year Ended December 31, 2009 | ||||||||||||||||||||||
| Class X Shares | |||||||||||||||||||||||||||
| Shares | |||||||||||||||||||||||||||
| Sold | 11,492 | 40,541 | 2,702 | 31,329 | 43,098 | 46,132 | |||||||||||||||||||||
| Reinvestment of dividends and distributions | 83,678 | 42,358 | — | — | 1,816 | 5,295 | |||||||||||||||||||||
| Redeemed | (222,273 | ) | (308,662 | ) | (123,516 | ) | (167,913 | ) | (684,557 | ) | (943,893 | ) | |||||||||||||||
| Net Decrease - Class X | (127,103 | ) | (225,763 | ) | (120,814 | ) | (136,584 | ) | (639,643 | ) | (892,466 | ) | |||||||||||||||
| Amount | |||||||||||||||||||||||||||
| Sold | $ | 252,287 | $ | 802,001 | $ | 52,085 | $ | 474,904 | $ | 869,653 | $ | 680,683 | |||||||||||||||
| Reinvestment of dividends and distributions | 1,535,499 | 820,899 | — | — | 32,429 | 70,533 | |||||||||||||||||||||
| Redeemed | (4,746,483 | ) | (6,042,158 | ) | (2,488,117 | ) | (2,353,678 | ) | (13,127,780 | ) | (12,485,193 | ) | |||||||||||||||
| Net Decrease - Class X | $ | (2,958,697 | ) | $ | (4,419,258 | ) | $ | (2,436,032 | ) | $ | (1,878,774 | ) | $ | (12,225,698 | ) | $ | (11,733,977 | ) | |||||||||
| Class Y Shares | |||||||||||||||||||||||||||
| Shares | |||||||||||||||||||||||||||
| Sold | 14,004 | 27,618 | 38,641 | 105,217 | 28,751 | 125,006 | |||||||||||||||||||||
| Reinvestment of dividends and distributions | 33,004 | 16,029 | — | — | — | — | |||||||||||||||||||||
| Redeemed | (107,162 | ) | (137,348 | ) | (235,362 | ) | (299,590 | ) | (310,572 | ) | (257,529 | ) | |||||||||||||||
| Net Decrease - Class Y | (60,154 | ) | (93,701 | ) | (196,721 | ) | (194,373 | ) | (281,821 | ) | (132,523 | ) | |||||||||||||||
| Amount | |||||||||||||||||||||||||||
| Sold | $ | 302,815 | $ | 544,472 | $ | 704,857 | $ | 1,488,379 | $ | 540,408 | $ | 1,546,171 | |||||||||||||||
| Reinvestment of dividends and distributions | 605,288 | 310,320 | — | — | — | — | |||||||||||||||||||||
| Redeemed | (2,274,436 | ) | (2,642,091 | ) | (4,595,299 | ) | (4,238,588 | ) | (5,905,633 | ) | (3,448,734 | ) | |||||||||||||||
| Net Decrease - Class Y | $ | (1,366,333 | ) | $ | (1,787,299 | ) | $ | (3,890,442 | ) | $ | (2,750,209 | ) | $ | (5,365,225 | ) | $ | (1,902,563 | ) | |||||||||
See Notes to Financial Statements
66
| Capital Opportunities | Mid Cap Growth | ||||||||||||||||||
| For The Year Ended December 31, 2010 | For The Year Ended December 31, 2009 | For The Year Ended December 31, 2010 | For The Year Ended December 31, 2009 | ||||||||||||||||
| Class X Shares | |||||||||||||||||||
| Shares | |||||||||||||||||||
| Sold | 8,366 | 41,405 | 11,847 | 12,864 | |||||||||||||||
| Reinvestment of dividends and distributions | — | — | 1,037 | — | |||||||||||||||
| Redeemed | (126,854 | ) | (183,294 | ) | (124,390 | ) | (177,705 | ) | |||||||||||
| Net Decrease - Class X | (118,488 | ) | (141,889 | ) | (111,506 | ) | (164,841 | ) | |||||||||||
| Amount | |||||||||||||||||||
| Sold | $ | 116,813 | $ | 465,679 | $ | 368,371 | $ | 271,252 | |||||||||||
| Reinvestment of dividends and distributions | — | — | 29,523 | — | |||||||||||||||
| Redeemed | (1,717,896 | ) | (1,852,397 | ) | (3,677,621 | ) | (3,567,865 | ) | |||||||||||
| Net Decrease - Class X | $ | (1,601,083 | ) | $ | (1,386,718 | ) | $ | (3,279,727 | ) | $ | (3,296,613 | ) | |||||||
| Class Y Shares | |||||||||||||||||||
| Shares | |||||||||||||||||||
| Sold | 48,202 | 144,491 | 78,762 | 51,866 | |||||||||||||||
| Reinvestment of dividends and distributions | — | — | — | — | |||||||||||||||
| Redeemed | (216,786 | ) | (306,112 | ) | (82,285 | ) | (70,409 | ) | |||||||||||
| Net Decrease - Class Y | (168,584 | ) | (161,621 | ) | (3,523 | ) | (18,543 | ) | |||||||||||
| Amount | |||||||||||||||||||
| Sold | $ | 630,278 | $ | 1,449,714 | $ | 2,315,177 | $ | 1,151,962 | |||||||||||
| Reinvestment of dividends and distributions | — | — | — | — | |||||||||||||||
| Redeemed | (2,908,433 | ) | (2,947,296 | ) | (2,442,559 | ) | (1,434,052 | ) | |||||||||||
| Net Decrease - Class Y | $ | (2,278,155 | ) | $ | (1,497,582 | ) | $ | (127,382 | ) | $ | (282,090 | ) | |||||||
67
Morgan Stanley Select Dimensions Investment Series
Notes to Financial Statements n December 31, 2010
1. Organization and Accounting Policies
Morgan Stanley Select Dimensions Investment Series (the "Fund") is registered under the Investment Company Act of 1940 as amended (the "Act"), as a diversified (except Focus Growth is non-diversified, effective August 8, 2007), open-end management investment company. The Fund is offered exclusively to life insurance companies in connection with particular life insurance and/or annuity contracts they offer. The Fund, which consists of 7 separate portfolios ("Portfolios"), was organized on June 2, 1994, as a Massachusetts business trust and commenced operations on November 9, 1994, with the exception of Capital Opportunities which commenced operations on January 21, 1997.
On July 24, 2000, the Fund commenced offering one additional class of shares (Class Y shares). The two classes are identical except that Class Y shares incur distribution expenses. Class X shares are generally available to holders of contracts offered before May 1, 2000. Class Y shares are available to holders of contracts offered on or after July 24, 2000.
The investment objectives of each Portfolio are as follows:
| PORTFOLIO | INVESTMENT OBJECTIVE | ||||||
| Money Market | Seeks high current income, preservation of capital and liquidity. | ||||||
| Flexible Income | Seeks, as a primary objective, to earn a high level of current income and, as a secondary objective, to maximize total return, but only to the extent consistent with its primary objective. | ||||||
| Global Infrastructure | Seeks both capital appreciation and current income. | ||||||
| Capital Growth | Seeks long-term capital growth. | ||||||
| Focus Growth | Seeks long-term capital growth. | ||||||
| Capital Opportunities | Seeks long-term capital growth. | ||||||
| Mid Cap Growth | Seeks long-term capital growth. | ||||||
On June 1, 2010, Invesco Ltd., a leading independent global investment management company, completed its purchase of substantially all of the retail asset management business of Morgan Stanley Investment Management (the "Transaction"). In contemplation of the Transaction, the Trustees of the Fund approved an Agreement and Plan of Reorganization (the "Reorganization") with respect to the Balanced, Dividend Growth and Equally-Weighted S&P 500 Portfolios (each a "affected Portfolio"), pursuant to which substantially all of the assets of each affected Portfolio would be combined with those of a newly organized
68
Morgan Stanley Select Dimensions Investment Series
Notes to Financial Statements n December 31, 2010 continued
mutual fund advised by an affiliate of Invesco Ltd. (the "New Fund"). On May 11, 2010, the Reorganization was approved by the shareholders of each affected Portfolio at a special meeting of shareholders. On June 1, 2010, the Reorganization was completed and shareholders of each affected Portfolio received shares of the New Fund in exchange for their shares of each affected Portfolio. Accordingly, the financial statements of each affected Portfolio are no longer contained in this report but may be found in the report of their corresponding New Funds.
The following is a summary of significant accounting policies:
A. Valuation of Investments — Money Market: Portfolio securities are valued at amortized cost, which approximates market value, in accordance with Rule 2a-7 under the Act. All remaining Portfolios: (1) an equity portfolio security listed or traded on the New York Stock Exchange ("NYSE") or American Stock Exchange or other domestic exchange is valued at its last sale price prior to the time when assets are valued; if there were no sales that day, the security is valued at the mean between the last reported bid and ask price; (2) an equity portfolio security listed or traded on the Nasdaq is valued at the Nasdaq Official Closing Price; if there were no sales that day, the security is valued at the mean between the last reported bid and ask price; (3) all other domestic securities for which over-the-counter market quotations are readily available are valued at the mean between the last reported bid and ask price. In cases where a security is traded on more than one domestic exchange, the security is valued on the exchange designated as the primary market; (4) for equity securities traded on foreign exchanges, the last reported sale price or the latest bid price may be used if there were no sales on a particular day; (5) futures are valued at the latest price published by the commodities exchange on which they trade; (6) swaps are marked-to-market daily based upon quotations from market makers; (7) listed options are valued at the latest sale price on the exchange on which they are listed unless no sales of such options have taken place that day, in which case they are valued at the mean between their latest bid and ask price; (8) when market quotations are not readily available, including circumstances under which Morgan Stanley Investment Advisors Inc. (the "Investment Adviser") or Morgan Stanley Investment Management Limited or Morgan Stanley Investment Management Company (each, a "Sub-Adviser"), each a wholly owned subsidiary of Morgan Stanley, determines that the latest sale price, the bid price or the mean between the last reported bid and ask price do not reflect a security's market value, portfolio securities are valued at their fair value as determined in good faith under procedures established by and under the general supervision of the Fund's Trustees. Occasionally, developments affecting the closing prices of securities and other assets may occur between the times at which valuations of such securities are determined (that is, close of the foreign market on which the securities trade) and the close of business on the NYSE. If developments occur during such periods that are expected to materially
69
Morgan Stanley Select Dimensions Investment Series
Notes to Financial Statements n December 31, 2010 continued
affect the value of such securities, such valuations may be adjusted to reflect the estimated fair value of such securities as of the close of the NYSE, as determined in good faith by the Fund's Trustees or by the Investment Adviser using a pricing service and/or procedures approved by the Trustees of the Fund; (9) certain portfolio securities may be valued by an outside pricing service approved by the Fund's Trustees; (10) investments in open-end mutual funds, including the Morgan Stanley Institutional Liquidity Funds, are valued at the net asset value as of the close of each business day; and (11) short-term debt securities having a maturity date of more than sixty days at time of purchase are valued on a mark-to-market basis until sixty days prior to maturity and thereafter at amortized cost based on their value on the 61st day. Short-term debt securities having a maturity date of sixty days or less at the time of purchase are valued at amortized cost, which approximates market value.
B. Accounting for Investments — Security transactions are accounted for on the trade date (date the order to buy or sell is executed). Realized gains and losses on security transactions are determined by the identified cost method. Dividend income and other distributions are recorded on the ex-dividend date except for certain dividends on foreign securities which are recorded as soon as the Fund is informed after the ex-dividend date. Interest income is accrued daily as earned except where collection is not expected. Discounts are accreted and premiums are amortized over the life of the respective securities and are included in interest income.
C. Repurchase Agreements — The Fund invests directly with institutions in repurchase agreements. The Fund's custodian receives the collateral, which is marked-to-market daily to determine that the value of the collateral does not decrease below the repurchase price plus accrued interest as earned. If such a decrease occurs, additional collateral will be requested and, when received, will be added to the account to maintain full collateralization.
D. Multiple Class Allocations — Investment income, expenses (other than distribution fees), and realized and unrealized gains and losses are allocated to each class of shares based upon the relative net asset value on the date such items are recognized. Distribution fees are charged directly to the respective class.
E. Foreign Currency Translation — The books and records of the Fund are maintained in U.S. dollars as follows: (1) the foreign currency market value of investment securities, other assets and liabilities and forward foreign currency contracts are translated at the exchange rates prevailing at the end of the period; and (2) purchases, sales, income and expenses are translated at the exchange rates prevailing on the respective dates of such transactions. The resultant exchange gains and losses are recorded as realized and unrealized gains/losses on foreign currency exchange contracts and foreign currency translation. Pursuant to
70
Morgan Stanley Select Dimensions Investment Series
Notes to Financial Statements n December 31, 2010 continued
U.S. federal income tax regulations, certain foreign exchange gains/losses included in realized and unrealized gains/losses are included in or are a reduction of ordinary income for federal income tax purposes. The Fund does not isolate that portion of the results of operations arising as a result of changes in the foreign exchange rates from the changes in the market prices of the securities held.
F. Federal Income Tax Policy — It is the Fund's policy to comply with the requirements of Subchapter M of the Internal Revenue Code applicable to regulated investment companies and to distribute substantially all of its taxable income to its shareholders. Therefore, no federal income tax provision is required. The Fund files tax returns with the U.S. Internal Revenue Service, New York State and New York City. The Fund recognizes the tax effects of a tax position taken or expected to be taken in a tax return only if it is more likely than not to be sustained based solely on its technical merits as of the reporting date. The more-likely-than-not threshold must continue to be met in each reporting period to support continued recognition of the benefit. The difference between the tax benefit recognized in the financial statements for a tax position taken and the tax benefit claimed in the income tax return is referred to as an unrecognized tax benefit. There are no unrecognized tax benefits in the accompanying financial statements. If applicable, the Fund recognizes interest accrued related to unrecognized tax benefits in interest expense and penalties in other expenses in the Statements of Operations. Each of the tax years filed in the four-year period ended December 31, 2010 remains subject to examination by taxing authorities.
G. Dividends and Distributions to Shareholders — The Fund records dividends and distributions to its shareholders on the ex-dividend date.
H. Expenses — Direct expenses are charged to the respective Portfolio and general Fund expenses are allocated on the basis of relative net assets or equally among the Portfolios.
I. Use of Estimates — The preparation of financial statements in accordance with generally accepted accounting principles in the United States ("GAAP") requires management to make estimates and assumptions that affect the reported amounts and disclosures. Actual results could differ from those estimates.
J. Indemnifications — The Fund enters into contracts that contain a variety of indemnifications. The Fund's maximum exposure under these arrangements is unknown. However, the Fund has not had prior claims or losses pursuant to these contracts and expects the risk of loss to be remote.
71
Morgan Stanley Select Dimensions Investment Series
Notes to Financial Statements n December 31, 2010 continued
2. Fair Valuation Measurements
Financial Accounting Standards Board ("FASB") Accounting Standards Codification ("ASC") 820, Fair Value Measurements and Disclosures ("ASC 820"), defines fair value as the price that the Fund would receive to sell an investment or pay to transfer a liability in a timely transaction with an independent buyer in the principal market, or in the absence of a principal market the most advantageous market for the investment or liability. ASC 820 establishes a three-tier hierarchy to distinguish between (1) inputs that reflect the assumptions market participants would use in pricing an asset or liability developed based on market data obtained from sources independent of the reporting entity (observable inputs) and (2) inputs that reflect the reporting entity's own assumptions about the assumptions market participants would use in pricing an asset or liability developed based on the best information available in the circumstances (unobservable inputs) and to establish classification of fair value measurements for disclosure purposes. Various inputs are used in determining the value of the Fund's investments. The inputs are summarized in the three broad levels listed below.
• Level 1 — unadjusted quoted prices in active markets for identical investments
• Level 2 — other significant observable inputs (including quoted prices for similar investments, interest rates, prepayment speeds, credit risk, etc.)
• Level 3 — significant unobservable inputs including the Fund's own assumptions in determining the fair value of investments. Factors considered in making this determination may include, but are not limited to, information obtained by contacting the issuer, analysts, or the appropriate stock exchange (for exchange-traded securities), analysis of the issuer's financial statements or other available documents and, if necessary, available information concerning other securities in similar circumstances
The inputs or methodology used for valuing securities are not necessarily an indication of the risk associated with investing in those securities and the determination of the significance of a particular input to the fair value measurement in its entirety requires judgment and considers factors specific to each security.
72
Morgan Stanley Select Dimensions Investment Series
Notes to Financial Statements n December 31, 2010 continued
The following is a summary of the inputs used as of December 31, 2010 in valuing the Fund's investments carried at fair value:
| Fair Value Measurements at December 31, 2010 Using | |||||||||||||||||||
| Investment Type | Total | Unadjusted Quoted Prices In Active Market for Identical Investments (Level 1) | Other Significant Observable Inputs (Level 2) | Significant Unobservable Inputs (Level 3) | |||||||||||||||
| Money Market | |||||||||||||||||||
| Short-Term Investments | |||||||||||||||||||
| Commercial Paper | $ | 41,991,843 | — | $ | 41,991,843 | — | |||||||||||||
| Floating Rate Notes — Corporate | 23,000,000 | — | 23,000,000 | — | |||||||||||||||
| Certificates of Deposit | 20,000,042 | — | 20,000,042 | — | |||||||||||||||
| Repurchase Agreements | 15,635,000 | — | 15,635,000 | — | |||||||||||||||
| Total | $ | 100,626,885 | — | $ | 100,626,885 | — | |||||||||||||
| Flexible Income | |||||||||||||||||||
| Assets: | |||||||||||||||||||
| Foreign Government Agencies & Obligations | $ | 2,770,476 | — | $ | 2,770,476 | — | |||||||||||||
| Corporate Bonds | 18,696,271 | — | �� | 18,677,072 | $ | 19,199 | |||||||||||||
| Asset-Backed Securities | 373,758 | — | 373,758 | — | |||||||||||||||
| U.S. Government Agencies & Obligations | 2,794,230 | — | 2,794,230 | — | |||||||||||||||
| U.S. Government Agencies — Mortgage-Backed Securities | 183,757 | — | 183,757 | — | |||||||||||||||
| Municipal Bonds | 282,810 | — | 282,810 | — | |||||||||||||||
| Collateralized Mortgage Obligations | 1,698,700 | — | 1,698,700 | — | |||||||||||||||
| Preferred Stock | 77,498 | — | 77,498 | — | |||||||||||||||
| Common Stocks | |||||||||||||||||||
| Communications Equipment | 1,458 | $ | 1,458 | — | — | ||||||||||||||
| Diversified Telecommunication Services | 75 | 75 | — | — | |||||||||||||||
| Electric Utilities | 169 | 169 | — | — | |||||||||||||||
| Wireless Telecommunication Services | 871 | 871 | — | — | |||||||||||||||
| Total Common Stocks | 2,573 | 2,573 | — | — | |||||||||||||||
| Short-Term Investments | |||||||||||||||||||
| U.S. Government Obligation | 229,978 | — | 229,978 | — | |||||||||||||||
| Investment Company | 205,676 | 205,676 | — | — | |||||||||||||||
| Total Short-Term Investments | 435,654 | 205,676 | 229,978 | — | |||||||||||||||
73
Morgan Stanley Select Dimensions Investment Series
Notes to Financial Statements n December 31, 2010 continued
| Fair Value Measurements at December 31, 2010 Using | |||||||||||||||||||
| Investment Type | Total | Unadjusted Quoted Prices In Active Market for Identical Investments (Level 1) | Other Significant Observable Inputs (Level 2) | Significant Unobservable Inputs (Level 3) | |||||||||||||||
| Foreign Currency Exchange Contracts | $ | 4,321 | — | $ | 4,321 | — | |||||||||||||
| Futures | 50,501 | $ | 50,501 | — | — | ||||||||||||||
| Interest Rate Swaps | 174,085 | — | 174,085 | — | |||||||||||||||
| Zero Coupon Swaps | 1,219 | — | 1,219 | — | |||||||||||||||
| Total | $ | 27,545,853 | $ | 258,750 | $ | 27,267,904 | $ | 19,199 | |||||||||||
| Liabilities: | |||||||||||||||||||
| Foreign Currency Exchange Contracts | $ | (4,225 | ) | — | $ | (4,225 | ) | — | |||||||||||
| Futures | (29,243 | ) | $ | (29,243 | ) | — | — | ||||||||||||
| Interest Rate Swaps | (171,102 | ) | — | (171,102 | ) | — | |||||||||||||
| Zero Coupon Swaps | (254,981 | ) | — | (254,981 | ) | — | |||||||||||||
| Total | $ | (459,551 | ) | $ | (29,243 | ) | $ | (430,308 | ) | — | |||||||||
| Global Infrastructure | |||||||||||||||||||
| Common Stocks | |||||||||||||||||||
| Airports | $ | 1,571,018 | $ | 1,571,018 | — | — | |||||||||||||
| Communications | 5,098,564 | 5,098,564 | — | — | |||||||||||||||
| Diversified | 1,493,834 | 1,493,834 | — | — | |||||||||||||||
| Oil & Gas Storage & Transportation | 10,669,322 | 10,610,007 | 59,315 | — | |||||||||||||||
| Ports | 420,126 | 420,126 | — | — | |||||||||||||||
| Toll Roads | 3,604,419 | 3,604,419 | — | — | |||||||||||||||
| Transmission & Distribution | 5,543,639 | 5,543,639 | — | — | |||||||||||||||
| Water | 1,722,986 | 1,722,986 | — | — | |||||||||||||||
| Total Common Stocks | 30,123,908 | 30,064,593 | 59,315 | — | |||||||||||||||
| Short-Term Investment — | |||||||||||||||||||
| Investment Company | 510,304 | 510,304 | — | — | |||||||||||||||
| Total | $ | 30,634,212 | $ | 30,574,897 | $ | 59,315 | — | ||||||||||||
| Capital Growth | |||||||||||||||||||
| Common Stocks | |||||||||||||||||||
| Air Freight & Logistics | $ | 1,137,341 | $ | 1,137,341 | — | — | |||||||||||||
| Beverages | 544,924 | 544,924 | — | — | |||||||||||||||
| Capital Markets | 505,806 | 505,806 | — | — | |||||||||||||||
| Chemicals | 881,224 | 881,224 | — | — | |||||||||||||||
| Commercial Services & Supplies | 837,896 | 837,896 | — | — | |||||||||||||||
74
Morgan Stanley Select Dimensions Investment Series
Notes to Financial Statements n December 31, 2010 continued
| Fair Value Measurements at December 31, 2010 Using | |||||||||||||||||||
| Investment Type | Total | Unadjusted Quoted Prices In Active Market for Identical Investments (Level 1) | Other Significant Observable Inputs (Level 2) | Significant Unobservable Inputs (Level 3) | |||||||||||||||
| Communications Equipment | $ | 283,038 | $ | 283,038 | — | — | |||||||||||||
| Computers & Peripherals | 2,271,145 | 2,271,145 | — | — | |||||||||||||||
| Construction Materials | 315,830 | 315,830 | — | — | |||||||||||||||
| Distributors | 916,761 | 916,761 | — | — | |||||||||||||||
| Diversified Financial Services | 1,896,164 | 1,896,164 | — | — | |||||||||||||||
| Food & Staples Retailing | 475,142 | 475,142 | — | — | |||||||||||||||
| Food Products | 817,529 | 817,529 | — | — | |||||||||||||||
| Health Care Equipment & Supplies | 588,959 | 588,959 | — | — | |||||||||||||||
| Hotels, Restaurants & Leisure | 2,749,817 | 2,749,817 | — | — | |||||||||||||||
| Information Technology Services | 851,024 | 851,024 | — | — | |||||||||||||||
| Internet & Catalog Retail | 2,808,845 | 2,808,845 | — | — | |||||||||||||||
| Internet Software & Services | 3,919,893 | 3,919,893 | — | — | |||||||||||||||
| Life Sciences Tools & Services | 888,787 | 888,787 | — | — | |||||||||||||||
| Media | 631,792 | 631,792 | — | — | |||||||||||||||
| Oil, Gas & Consumable Fuels | 1,183,047 | 1,183,047 | — | — | |||||||||||||||
| Pharmaceuticals | 409,754 | 409,754 | — | — | |||||||||||||||
| Professional Services | 426,231 | 426,231 | — | — | |||||||||||||||
| Real Estate Management & Development | 1,256,265 | 1,256,265 | — | — | |||||||||||||||
| Semiconductors & Semiconductor Equipment | 257,417 | 257,417 | — | — | |||||||||||||||
| Software | 1,119,093 | 1,119,093 | — | — | |||||||||||||||
| Tobacco | 600,635 | 600,635 | — | — | |||||||||||||||
| Total Common Stocks | 28,574,359 | 28,574,359 | — | — | |||||||||||||||
| Convertible Preferred Stocks | 163,260 | — | — | $ | 163,260 | ||||||||||||||
| Short-Term Investment — | |||||||||||||||||||
| Investment Company | 567,179 | 567,179 | — | — | |||||||||||||||
| Total | $ | 29,304,798 | $ | 29,141,538 | — | $ | 163,260 | ||||||||||||
| Focus Growth | |||||||||||||||||||
| Common Stocks | |||||||||||||||||||
| Air Freight & Logistics | $ | 2,466,828 | $ | 2,466,828 | — | — | |||||||||||||
| Beverages | 2,020,529 | 2,020,529 | — | — | |||||||||||||||
| Chemicals | 3,500,176 | 3,500,176 | — | — | |||||||||||||||
| Commercial Services & Supplies | 3,025,586 | 3,025,586 | — | — | |||||||||||||||
| Computers & Peripherals | 8,399,140 | 8,399,140 | — | — | |||||||||||||||
75
Morgan Stanley Select Dimensions Investment Series
Notes to Financial Statements n December 31, 2010 continued
| Fair Value Measurements at December 31, 2010 Using | |||||||||||||||||||
| Investment Type | Total | Unadjusted Quoted Prices In Active Market for Identical Investments (Level 1) | Other Significant Observable Inputs (Level 2) | Significant Unobservable Inputs (Level 3) | |||||||||||||||
| Distributors | $ | 3,353,721 | $ | 3,353,721 | — | — | |||||||||||||
| Diversified Financial Services | 5,092,337 | 5,092,337 | — | — | |||||||||||||||
| Food Products | 2,972,375 | 2,972,375 | — | — | |||||||||||||||
| Hotels, Restaurants & Leisure | 8,367,314 | 8,367,314 | — | — | |||||||||||||||
| Information Technology Services | 3,028,512 | 3,028,512 | — | — | |||||||||||||||
| Internet & Catalog Retail | 10,208,878 | 10,208,878 | — | — | |||||||||||||||
| Internet Software & Services | 16,100,531 | 14,352,833 | — | $ | 1,747,698 | ||||||||||||||
| Life Sciences Tools & Services | 3,218,305 | 3,218,305 | — | — | |||||||||||||||
| Media | 2,284,297 | 2,284,297 | — | — | |||||||||||||||
| Oil, Gas & Consumable Fuels | 4,219,763 | 4,219,763 | — | — | |||||||||||||||
| Professional Services | 1,342,460 | 1,342,460 | — | — | |||||||||||||||
| Real Estate Management & Development | 4,465,654 | 4,465,654 | — | — | |||||||||||||||
| Software | 3,004,980 | 3,004,980 | — | — | |||||||||||||||
| Tobacco | 2,224,608 | 2,224,608 | — | — | |||||||||||||||
| Total Common Stocks | 89,295,994 | 87,548,296 | — | 1,747,698 | |||||||||||||||
| Convertible Preferred Stock | 500,445 | — | — | 500,445 | |||||||||||||||
| Short-Term Investment — | |||||||||||||||||||
| Investment Company | 4,357,343 | 4,357,343 | — | — | |||||||||||||||
| Total | $ | 94,153,782 | $ | 91,905,639 | — | $ | 2,248,143 | ||||||||||||
| Capital Opportunities | |||||||||||||||||||
| Common Stocks | |||||||||||||||||||
| Air Freight & Logistics | $ | 541,141 | $ | 541,141 | — | — | |||||||||||||
| Capital Markets | 744,432 | 744,432 | — | — | |||||||||||||||
| Chemicals | 691,525 | 691,525 | — | — | |||||||||||||||
| Commercial Services & Supplies | 643,448 | 643,448 | — | — | |||||||||||||||
| Computers & Peripherals | 1,658,603 | 1,658,603 | — | — | |||||||||||||||
| Distributors | 713,530 | 713,530 | — | — | |||||||||||||||
| Diversified Financial Services | 1,774,744 | 1,774,744 | — | — | |||||||||||||||
| Food Products | 588,947 | 588,947 | — | — | |||||||||||||||
| Health Care Technology | 535,486 | 535,486 | — | — | |||||||||||||||
| Hotels, Restaurants & Leisure | 2,221,091 | 2,221,091 | — | — | |||||||||||||||
| Information Technology Services | 669,838 | 669,838 | — | — | |||||||||||||||
| Internet & Catalog Retail | 2,298,416 | 2,298,416 | — | — | |||||||||||||||
| Internet Software & Services | 2,287,198 | 2,287,198 | — | — | |||||||||||||||
| Life Sciences Tools & Services | 1,265,483 | 1,265,483 | — | — | |||||||||||||||
76
Morgan Stanley Select Dimensions Investment Series
Notes to Financial Statements n December 31, 2010 continued
| Fair Value Measurements at December 31, 2010 Using | |||||||||||||||||||
| Investment Type | Total | Unadjusted Quoted Prices In Active Market for Identical Investments (Level 1) | Other Significant Observable Inputs (Level 2) | Significant Unobservable Inputs (Level 3) | |||||||||||||||
| Media | $ | 491,806 | $ | 491,806 | — | — | |||||||||||||
| Metals & Mining | 1,239,723 | 1,239,723 | — | — | |||||||||||||||
| Oil, Gas & Consumable Fuels | 1,078,061 | 1,078,061 | — | — | |||||||||||||||
| Professional Services | 1,216,208 | 1,216,208 | — | — | |||||||||||||||
| Real Estate Management & Development | 988,613 | 988,613 | — | — | |||||||||||||||
| Semiconductors & Semiconductor Equipment | 446,721 | 446,721 | — | — | |||||||||||||||
| Software | 638,748 | 638,748 | — | — | |||||||||||||||
| Total Common Stocks | 22,733,762 | 22,733,762 | — | — | |||||||||||||||
| Convertible Preferred Stock | 120,792 | — | — | $ | 120,792 | ||||||||||||||
| Short-Term Investment — | |||||||||||||||||||
| Investment Company | 489,005 | 489,005 | — | — | |||||||||||||||
| Total | $ | 23,343,559 | $ | 23,222,767 | — | $ | 120,792 | ||||||||||||
| Mid Cap Growth | |||||||||||||||||||
| Common Stocks | |||||||||||||||||||
| Air Freight & Logistics | $ | 1,302,383 | $ | 1,302,383 | — | — | |||||||||||||
| Biotechnology | 205,675 | 205,675 | — | — | |||||||||||||||
| Capital Markets | 898,987 | 898,987 | — | — | |||||||||||||||
| Chemicals | 1,653,696 | 1,653,696 | — | — | |||||||||||||||
| Commercial Services & Supplies | 1,896,251 | 1,896,251 | — | — | |||||||||||||||
| Construction Materials | 468,948 | 468,948 | — | — | |||||||||||||||
| Diversified Consumer Services | 484,689 | 484,689 | — | — | |||||||||||||||
| Diversified Financial Services | 2,002,779 | 2,002,779 | — | — | |||||||||||||||
| Food Products | 813,234 | 813,234 | — | — | |||||||||||||||
| Health Care Equipment & Supplies | 1,732,284 | 1,732,284 | — | — | |||||||||||||||
| Hotels, Restaurants & Leisure | 2,534,078 | 2,534,078 | — | — | |||||||||||||||
| Household Durables | 601,734 | 601,734 | — | — | |||||||||||||||
| Information Technology Services | 1,396,990 | 1,396,990 | — | — | |||||||||||||||
| Internet & Catalog Retail | 2,033,992 | 2,033,992 | — | — | |||||||||||||||
| Internet Software & Services | 758,501 | 758,501 | — | — | |||||||||||||||
| Life Sciences Tools & Services | 1,509,634 | 1,509,634 | — | — | |||||||||||||||
| Machinery | 696,366 | 696,366 | — | — | |||||||||||||||
| Media | 1,826,851 | 1,826,851 | — | — | |||||||||||||||
77
Morgan Stanley Select Dimensions Investment Series
Notes to Financial Statements n December 31, 2010 continued
| Fair Value Measurements at December 31, 2010 Using | |||||||||||||||||||
| Investment Type | Total | Unadjusted Quoted Prices In Active Market for Identical Investments (Level 1) | Other Significant Observable Inputs (Level 2) | Significant Unobservable Inputs (Level 3) | |||||||||||||||
| Metals & Mining | $ | 797,412 | $ | 797,412 | — | — | |||||||||||||
| Multiline Retail | 732,590 | 732,590 | — | — | |||||||||||||||
| Oil, Gas & Consumable Fuels | 1,341,270 | 1,341,270 | — | — | |||||||||||||||
| Personal Products | 515,311 | 515,311 | — | — | |||||||||||||||
| Professional Services | 2,013,093 | 2,013,093 | — | — | |||||||||||||||
| Semiconductors & Semiconductor Equipment | 618,610 | 618,610 | — | — | |||||||||||||||
| Software | 4,016,064 | 4,016,064 | — | — | |||||||||||||||
| Textiles, Apparel & Luxury Goods | 440,830 | 440,830 | — | — | |||||||||||||||
| Trading Companies & Distributors | 487,787 | 487,787 | — | — | |||||||||||||||
| Wireless Telecommunication Services | 477,426 | 477,426 | — | — | |||||||||||||||
| Total Common Stocks | 34,257,465 | 34,257,465 | — | — | |||||||||||||||
| Convertible Preferred Stocks | 430,081 | — | — | $ | 430,081 | ||||||||||||||
| Short-Term Investment — | |||||||||||||||||||
| Investment Company | 516,425 | 516,425 | — | — | |||||||||||||||
| Total | $ | 35,203,971 | $ | 34,773,890 | — | $ | 430,081 | ||||||||||||
Transfers between investment levels may occur as the markets fluctuate and/or the availability of data used in an investment's valuation changes. The Fund recognizes transfers between the levels as of the end of the period. As of December 31, 2010, securities transferred from Level 2 to Level 1. At December 31, 2009, the fair value of certain securities were adjusted due to developments which occurred between the time of the close of the foreign markets on which they trade and the close of business on the NYSE which resulted in their Level 2 classification. The values of the transfers were as follows:
| GLOBAL INFRASTRUCTURE | CAPITAL GROWTH | FOCUS GROWTH | CAPITAL OPPORTUNITIES | MID CAP GROWTH | |||||||||||||||
| $ | 6,708,677 | $ | 2,508,402 | $ | 7,592,921 | $ | 1,620,562 | $ | 1,002,377 | ||||||||||
78
Morgan Stanley Select Dimensions Investment Series
Notes to Financial Statements n December 31, 2010 continued
Following is a reconciliation of investments in which significant unobservable inputs (Level 3) were used in determining fair value:
| Flexible Income | Capital Growth | Focus Growth | Capital Opportunities | Mid Cap Growth | |||||||||||||||||||
| Beginning Balance | $ | 12 | — | — | — | $ | 322,608 | ||||||||||||||||
| Net purchases (sales) | 0 | $ | 163,260 | $ | 1,995,110 | $ | 120,792 | 430,081 | |||||||||||||||
| Amortization of discount | — | — | — | — | — | ||||||||||||||||||
| Transfers in | 19,199 | — | — | — | — | ||||||||||||||||||
| Transfers out | — | — | — | — | (151,772 | )‡ | |||||||||||||||||
| Change in unrealized appreciation (depreciation) | 2,674,510 | — | 253,033 | — | (170,836 | ) | |||||||||||||||||
| Realized gains (losses) | (2,674,522 | ) | — | — | — | — | |||||||||||||||||
| Ending Balance | $ | 19,199 | $ | 163,260 | $ | 2,248,143 | $ | 120,792 | $ | 430,081 | |||||||||||||
| Net change in unrealized appreciation/ depreciation from investments still held as of December 31, 2010 | — | — | $ | 253,033 | — | — | |||||||||||||||||
‡ A security that was fair valued under procedures established by and under the general supervision of the Fund's Trustees at December 31, 2009 was valued using an unadjusted quoted price at December 31, 2010.
3. Derivatives
Certain Portfolios used derivative instruments for a variety of purposes, including hedging, risk management, portfolio management or to earn income. Derivatives are financial instruments whose value is based on the value of another underlying asset, interest rate, index or financial instrument. A derivative instrument often has risks similar to its underlying instrument and may have additional risks, including imperfect correlation between the value of the derivative and the underlying instrument, risks of default by the other party to certain transactions, magnification of losses incurred due to changes in the market value of the securities, instruments, indices or interest rates to which they relate, and risks that the transactions may not be liquid. The use of derivatives involves risks that are different from, and possibly greater than, the risks associated with other portfolio investments. Derivatives may involve the use of highly specialized instruments that require investment techniques and risk analyses different from those associated with other portfolio investments. All of a Portfolio's holdings, including derivative instruments, are marked-to-market each day with the change in value reflected in unrealized appreciation (depreciation). Upon disposition, a realized gain or loss is recognized.
Certain derivative transactions may give rise to a form of leverage. Leverage associated with derivative transactions may cause the Portfolios to liquidate portfolio positions when it may not be advantageous to do so to satisfy its obligations or to meet earmarking or segregation requirements, pursuant to applicable
79
Morgan Stanley Select Dimensions Investment Series
Notes to Financial Statements n December 31, 2010 continued
Securities and Exchange Commission rules and regulations, or may cause the Portfolios to be more volatile than if the Portfolios had not been leveraged. Although the Investment Adviser and/or Sub-Adviser seek to use derivatives to further the Portfolio's investment objectives, there is no assurance that the use of derivatives will achieve this result.
Following is a description of the derivative instruments and techniques that the Portfolios used during the period and their associated risks:
Foreign Currency Exchange Contracts In connection with their investments in foreign securities, certain Portfolios entered into contracts with banks, brokers or dealers to purchase or sell foreign currencies at a future date. A foreign currency exchange contract ("currency contracts") is a negotiated agreement between the contracting parties to exchange a specified amount of currency at a specified future time at a specified rate. The rate can be higher or lower than the spot rate between the currencies that are the subject of the currency contract. Currency contracts are used to protect against uncertainty in the level of future foreign currency exchange rates or to gain or modify exposure to a particular currency. In addition, certain Portfolios used cross currency hedging or proxy hedging with respect to currencies in which a Portfolio has or expects to have portfolio or currency exposure. Cross currency hedges involve the sale of one currency against the positive exposure to a different currency and may be used for hedging purposes or to establish an active exposure to the exchange rate between any two currencies. Hedging a Portfolio's currency risks involves the risk of mismatching a Portfolio's objectives under a currency contract with the value of securities denominated in a particular currency. Furthermore, such transactions reduce or preclude the opportunity for gain if the value of the currency should move in the direction opposite to the position taken. There is an additional risk to the effect that currency contracts create exposure to currencies in which a Portfolio's securities are not denominated. Unanticipated changes in currency prices may result in poorer overall performance for a Portfolio than if it had not entered into such currency contracts. A currency contract is marked-to-market daily and the change in market value is recorded by a Portfolio as unrealized gain or (loss). A Portfolio records realized gains (losses) when the currency contract is closed equal to the difference between the value of the currency contract at the time it was opened and the value at the time it was closed.
During the year ended December 31, 2010, the value of foreign currency exchange contracts purchased and sold were as follows:
| PORTFOLIO | PURCHASES | SALES | |||||||||
| Flexible Income | $ | 1,802,389 | $ | 1,506,348 | |||||||
| Global Infrastructure | 35,359,431 | 44,087,601 | |||||||||
80
Morgan Stanley Select Dimensions Investment Series
Notes to Financial Statements n December 31, 2010 continued
Futures A futures contract is a standardized agreement between two parties to buy or sell a specific quantity of an underlying instrument at a specific price at a specific future time. The value of a futures contract tends to increase and decrease in tandem with the value of the underlying instrument. Futures contracts are bilateral agreements, with both the purchaser and the seller equally obligated to complete the transaction. Depending on the terms of the particular contract, futures contracts are settled through either physical delivery of the underlying instrument on the settlement date or by payment of a cash settlement amount on the settlement date. During the period the futures contract is open, payments are received from or made to the broker based upon changes in the value of the contract (the variation margin). A decision as to whether, when and how to use futures involves the exercise of skill and judgment and even a well conceived futures transaction may be unsuccessful because of market behavior or unexpected events. In addition to the derivatives risks discussed above, the prices of futures can be highly volatile, using futures can lower total return, and the potential loss from futures can exceed a Portfolio's initial investment in such contracts.
Transactions in futures contracts for the year ended December 31, 2010, were as follows:
| Flexible Income: | |||||||
| NUMBER OF CONTRACTS | |||||||
| Futures, outstanding at beginning of the period | 54 | ||||||
| Futures opened | 652 | ||||||
| Futures closed | (648 | ) | |||||
| Futures, outstanding at end of the period | 58 | ||||||
Options When a Portfolio buys an option, it buys a legal contract giving it the right to buy or sell a specific amount of the underlying instrument or futures contract on the underlying instrument such as a security, currency or index, at an agreed upon price typically in exchange for a premium paid by the Portfolio. When a Portfolio sells an option, it sells to another party the right to buy from or sell to a Portfolio a specific amount of the underlying instrument or futures contract on the underlying instrument at an agreed upon price typically in exchange for a premium received by a Portfolio. A decision as to whether, when and how to use options involves the exercise of skill and judgment and even a well conceived option transaction may be unsuccessful because of market behavior or unexpected events. The prices of options can be highly volatile and the use of options can lower total returns.
When a Portfolio writes a call or put option, an amount equal to the premium received is included in the Portfolio's Statement of Assets and Liabilities as a liability which is subsequently marked-to-market to reflect the current market value of the option written. If a written option either expires or the Portfolio enters into a closing purchase transaction, the Portfolio realizes a gain or loss without regard to any
81
Morgan Stanley Select Dimensions Investment Series
Notes to Financial Statements n December 31, 2010 continued
unrealized gain or loss on the underlying security and the liability related to such option is extinguished. If a written call option is exercised, the Portfolio realizes a gain or loss from the sale of the underlying security or currency and the proceeds from such sale are increased by the premium originally received. If a written put option is exercised, the amount of the premium originally received reduces the cost of the security which the Portfolio purchases upon exercise of the option. By writing a covered call option, the Portfolio, in exchange for the premium, foregoes the opportunity for capital appreciation above the exercise price, should the market price of the underlying security increase. By writing a put option, the Portfolio, in exchange for the premium, accepts the risk of having to purchase a security at an exercise price that is above the current market price.
Transactions in options for the year ended December 31, 2010, were as follows:
| Global Infrastructure: | |||||||||||
| NUMBER OF CONTRACTS | PREMIUM | ||||||||||
| Options written, outstanding at beginning of period | 244 | $ | 12,220 | ||||||||
| Options written | 498 | 13,887 | |||||||||
| Options expired | (269 | ) | (9,999 | ) | |||||||
| Options closed | (473 | ) | (16,108 | ) | |||||||
| Options written, outstanding at end of period | — | — | |||||||||
Swaps A swap agreement is an agreement between two parties pursuant to which the parties exchange payments at specified dates on the basis of a specified notional amount, with the payments calculated by reference to specified securities, indexes, reference rates, currencies or other instruments. Most swap agreements provide that when the period payment dates for both parties are the same, the payments are made on a net basis (i.e., the two payment streams are netted out, with only the net amount paid by one party to the other). A Portfolio's obligations or rights under a swap agreement entered into on a net basis will generally be equal only to the net amount to be paid or received under the agreement, based on the relative values of the positions held by each counterparty. Swap agreements are not entered into or traded on exchanges and there is no central clearing or guaranty function for swaps. Therefore, swaps are subject to credit risk or the risk of default or non-performance by the counterparty. Swaps could result in losses if interest rate or foreign currency exchange rates or credit quality changes are not correctly anticipated by a Portfolio or if the reference index, security or investments do not perform as expected.
82
Morgan Stanley Select Dimensions Investment Series
Notes to Financial Statements n December 31, 2010 continued
A Portfolio's use of swaps during the period included those based on the credit of an underlying security that are commonly referred to as credit default swaps. Where a Portfolio is the buyer of a credit default swap agreement, it would be entitled to receive the par (or other agreed-upon) value of a referenced debt obligation from the counterparty to the agreement only in the event of a default by a third party on the debt obligation. If no default occurs, a Portfolio would have paid to the counterparty a periodic stream of payments over the term of the agreement and received no benefit from the agreement. When a Portfolio is the seller of a credit default swap agreement, it receives the stream of payments but is obligated to pay upon default of the referenced debt obligation. The current credit rating of each individual issuer is listed in the table following the Portfolio of Investments and serves as an indicator of the current status of the payment/performance risk of the credit derivative. Alternatively, for credit default swaps on an index of credits, the quoted market prices and current values serve as an indicator of the current status of the payment/performance risk of the credit derivative. Generally, lower credit ratings and increasing market values, in absolute terms, represent a deterioration of the credit and a greater likelihood of an adverse credit event of the issuer.
When a Portfolio has an unrealized loss on a swap agreement, the Portfolio will instruct the custodian to pledge cash or liquid securities as collateral with a value approximately equal to the amount of the unrealized loss. Collateral pledges are monitored and subsequently adjusted if and when the swap valuations fluctuate. Cash collateral is included with "Due from (to) broker" on the Statements of Assets and Liabilities. Cash collateral has been offset against open swap agreements under the provisions of FASB ASC 210, Balance Sheet ("ASC 210"). For cash collateral received, the Portfolio pays a monthly fee to the counterparty based on the effective rate for Federal Funds. This fee, when paid, is included within realized gain (loss) on swap contracts on the Statements of Operations.
Upfront payments received or paid by a Portfolio will be reflected as an asset or liability on the Statements of Assets and Liabilities.
83
Morgan Stanley Select Dimensions Investment Series
Notes to Financial Statements n December 31, 2010 continued
Transactions in swap contracts for the year ended December 31, 2010, were as follows:
| Flexible Income: | |||||||||||||||||||
| NOTIONAL AMOUNT SEK (000'S) | NOTIONAL AMOUNT CAD (000'S) | NOTIONAL AMOUNT EUR (000'S) | NOTIONAL AMOUNT USD (000'S) | ||||||||||||||||
| Swaps, outstanding at beginning of period | — | — | — | $ | 15,825 | ||||||||||||||
| Swaps opened | 11,500 | 4,580 | 4,533 | 30,717 | |||||||||||||||
| Swaps closed | (11,500 | ) | (1,400 | ) | — | (29,222 | ) | ||||||||||||
| Swaps, outstanding at end of period | — | 3,180 | 4,533 | $ | 17,320 | ||||||||||||||
Currency Abbreviations:
CAD Canadian Dollar.
EUR Euro.
SEK Swedish Krona.
USD United States Dollar.
FASB ASC 815, Derivatives and Hedging: Overall ("ASC 815"), is intended to improve financial reporting about derivative instruments by requiring enhanced disclosures to enable investors to better understand how and why a Portfolio uses derivative instruments, how these derivative instruments are accounted for and their effects on a Portfolio's financial position and results of operations.
The following table sets forth the fair value of each Portfolio's derivative contracts by primary risk exposure as of December 31, 2010.
| PORTFOLIO | PRIMARY RISK EXPOSURE | ASSET DERIVATIVES STATEMENTS OF ASSETS AND LIABILITIES LOCATION | FAIR VALUE | LIABILITY DERIVATIVES STATEMENTS OF ASSETS AND LIABILITIES LOCATION | FAIR VALUE | ||||||||||||||||||
| Flexible Income | Interest Rate | Variation margin | $ | 50,501 | † | Variation margin | $ | (29,243 | )† | ||||||||||||||
| Risk | Unrealized appreciation on open swap contracts | 175,304 | Unrealized depreciation on open swap contracts | (426,083 | ) | ||||||||||||||||||
| Foreign Currency Risk | Unrealized appreciation on open foreign currency exchange contracts | 4,321 | Unrealized depreciation on open foreign currency exchange contracts | (4,225 | ) | ||||||||||||||||||
| $ | 230,126 | $ | (459,551 | ) | |||||||||||||||||||
† Includes cumulative appreciation/depreciation of futures contracts as reported in the Portfolio of Investments. Only current day's variation margin is reported within the Statement of Assets and Liabilities.
84
Morgan Stanley Select Dimensions Investment Series
Notes to Financial Statements n December 31, 2010 continued
The following tables set forth by primary risk exposure each Portfolio's realized gains (losses) and change in unrealized appreciation (depreciation) by type of derivative contract for the year ended December 31, 2010 in accordance with ASC 815.
AMOUNT OF REALIZED GAIN (LOSS) ON DERIVATIVE CONTRACTS
| PORTFOLIO | PRIMARY RISK EXPOSURE | FUTURES | SWAPS | OPTIONS WRITTEN | FOREIGN CURRENCY EXCHANGE | ||||||||||||||||||
| Flexible Income | Interest Rate Risk | $ | (72,239 | ) | $ | (272,113 | ) | — | — | ||||||||||||||
| Credit Risk | — | (28,612 | ) | — | — | ||||||||||||||||||
| Foreign Currency Risk | — | — | — | $ | (7,313 | ) | |||||||||||||||||
| Total | $ | (72,239 | ) | $ | (300,725 | ) | — | $ | (7,313 | ) | |||||||||||||
| Global Infrastructure | Equity Risk | — | — | $ | (8,037 | ) | — | ||||||||||||||||
| Foreign Currency Risk | — | — | — | $ | (32,381 | ) | |||||||||||||||||
| Total | — | — | $ | (8,037 | ) | $ | (32,381 | ) | |||||||||||||||
CHANGE IN UNREALIZED APPRECIATION (DEPRECIATION) ON DERIVATIVE CONTRACTS
| PORTFOLIO | PRIMARY RISK EXPOSURE | FUTURES | SWAPS | OPTIONS WRITTEN | FOREIGN CURRENCY EXCHANGE | ||||||||||||||||||
| Flexible Income | Interest Rate Risk | $ | (100,943 | ) | $ | (124,001 | ) | — | — | ||||||||||||||
| Credit Risk | — | 23,522 | — | — | |||||||||||||||||||
| Foreign Currency Risk | — | — | — | $ | (597 | ) | |||||||||||||||||
| Total | $ | (100,943 | ) | $ | (100,479 | ) | — | $ | (597 | ) | |||||||||||||
| Global Infrastructure | Equity Risk | — | — | $ | 9,657 | — | |||||||||||||||||
| Foreign Currency Risk | — | — | — | $ | (23,217 | ) | |||||||||||||||||
| Total | — | — | $ | 9,657 | $ | (23,217 | ) | ||||||||||||||||
4. Investment Advisory/Administration and Sub-Advisory Agreements
Pursuant to an Investment Advisory Agreement with the Investment Adviser and Sub-Adviser, the Fund pays an advisory fee, accrued daily and payable monthly, by applying the annual rates listed below to each Portfolio's net assets determined at the close of each business day.
Money Market — 0.45% to the portion of the daily net assets not exceeding $250 million; 0.375% to the portion of the daily net assets exceeding $250 million but not exceeding $750 million; 0.325% to the portion of the daily net assets exceeding $750 million but not exceeding $1.25 billion; 0.30% to the portion of the daily net assets exceeding $1.25 billion but not exceeding $1.5 billion and 0.275% to the portion of the daily net assets in excess of $1.5 billion.
85
Morgan Stanley Select Dimensions Investment Series
Notes to Financial Statements n December 31, 2010 continued
Flexible Income — 0.32%.
Global Infrastructure — 0.57% to the portion of the daily net assets not exceeding $500 million; 0.47% to the portion of the daily net assets exceeding $500 million but not exceeding $1 billion; 0.445% to the portion of the daily net assets exceeding $1 billion but not exceeding $1.5 billion; 0.42% to the portion of the daily net assets exceeding $1.5 billion but not exceeding $2.5 billion; 0.395% to the portion of the daily net assets exceeding $2.5 billion but not exceeding $3.5 billion; 0.37% to the portion of the daily net assets exceeding $3.5 billion but not exceeding $5 billion and 0.345% to the portion of the daily net assets in excess of $5 billion.
Under the Sub-Advisory Agreement between the Investment Adviser and the Sub-Adviser, the Sub-Adviser provides Global Infrastructure with investment advisory services, subject to the overall supervision of the Investment Adviser and the Fund's Officers and Trustees. The Investment Adviser pays the Sub-Adviser on a monthly basis a portion of the net advisory fees the Investment Adviser receives from Global Infrastructure.
Capital Growth — 0.50% to the portion of the daily net assets not exceeding $1 billion; 0.45% to the portion of the daily net assets exceeding $1 billion but not exceeding $2 billion; 0.40% to the portion of the daily net assets exceeding $2 billion but not exceeding $3 billion and 0.35% to the portion of the daily net assets in excess of $3 billion.
Focus Growth — 0.545% to the portion of the daily net assets not exceeding $250 million; 0.42% to the portion of the daily net assets exceeding $250 million but not exceeding $2.5 billion; 0.395% to the portion of the daily net assets exceeding $2.5 billion but not exceeding $3.5 billion; 0.37% to the portion of the daily net assets exceeding $3.5 billion but not exceeding $4.5 billion and 0.345% to the portion of the daily net assets in excess of $4.5 billion.
Capital Opportunities — 0.67% to the portion of the daily net assets not exceeding $500 million; 0.645% to the portion of the daily net assets exceeding $500 million but not exceeding $2 billion; 0.62% to the portion of the daily net assets exceeding $2 billion but not exceeding $3 billion and 0.595% to the portion of the daily net assets in excess of $3 billion.
Mid Cap Growth — 0.42% to the portion of the daily net assets not exceeding $500 million and 0.395% to the portion of the daily net assets in excess of $500 million.
Pursuant to an Administration Agreement with Morgan Stanley Services Company Inc. (the "Administrator"), an affiliate of the Investment Adviser, each Portfolio pays an administration fee, accrued daily and payable monthly, by applying the annual rate of 0.08% (Money Market 0.05%) to each Portfolio's daily net assets.
86
Morgan Stanley Select Dimensions Investment Series
Notes to Financial Statements n December 31, 2010 continued
Under a Sub-Administration Agreement between the Administrator and State Street Bank and Trust Company ("State Street"), State Street provides certain administrative services to the Fund. For such services, the Administrator pays State Street a portion of the fee the Administrator receives from the Fund.
5. Plan of Distribution
Shares of the Fund are distributed by Morgan Stanley Distributors Inc. (the "Distributor"), an affiliate of the Investment Adviser, Administrator and Sub-Adviser. The Fund has adopted a Plan of Distribution (the "Plan") pursuant to Rule 12b-1 under the Act. Under the Plan, Class Y shares of each Portfolio bear a distribution fee which is accrued daily and paid monthly at the annual rate of 0.25% of the average daily net assets of the class.
The Distributor, Investment Adviser and Administrator have agreed to waive all or a portion of the Money Market Portfolio's distribution fee, investment advisory fee and administration fee, respectively, to the extent that total expenses exceed total income of the Money Market Portfolio on a daily basis. For the year ended December 31, 2010, the Distributor waived $206,483 and the Investment Adviser waived $353,882. These fee waivers and/or expense reimbursements are expected to continue until such time that the Board of Trustees acts to discontinue such waivers and/or expense reimbursements when it deems such action is appropriate.
6. Security Transactions and Transactions with Affiliates
Each Portfolio (except Money Market) may invest in Morgan Stanley Institutional Liquidity Funds – Money Market Portfolio – Institutional Class, an open-end management investment company managed by an affiliate of the Investment Adviser. Investment Advisory fees paid by the Portfolios are reduced by an amount equal to the advisory and administrative services fees paid by Morgan Stanley Institutional Liquidity Funds – Money Market Portfolio – Institutional Class with respect to assets invested by the Portfolio in Morgan Stanley Institutional Liquidity Funds – Money Market Portfolio – Institutional Class. For the year ended December 31, 2010, the tables below identifies, for each Portfolio that invested in Morgan Stanley Institutional Liquidity Funds – Money Market Portfolio – Institutional Class, the amount by which that Portfolio's advisory fees were reduced in relation to that Portfolio's investment in Morgan Stanley Institutional Liquidity Funds – Money Market Portfolio – Institutional Class.
In addition, the table also identifies the income distributions earned, if any, by each Portfolio for that Portfolio's investment in Morgan Stanley Institutional Liquidity Funds – Money Market Portfolio – Institutional Class.
Income distributions are included in "interest and dividends from affiliates" in the Statements of Operations.
87
Morgan Stanley Select Dimensions Investment Series
Notes to Financial Statements n December 31, 2010 continued
| PORTFOLIO | INCOME DISTRIBUTION EARNED | ADVISORY FEE REDUCTION | |||||||||
| Flexible Income | $ | 761 | $ | 577 | |||||||
| Global Infrastructure | 627 | 464 | |||||||||
| Capital Growth | 1,068 | 728 | |||||||||
| Focus Growth | 3,172 | 2,141 | |||||||||
| Capital Opportunities | 791 | 627 | |||||||||
| Mid Cap Growth | 1,861 | 1,297 | |||||||||
During the year ended December 31, 2010, each Portfolio's cost of purchases and proceeds from sales of investments in Morgan Stanley Institutional Liquidity Funds – Money Market Portfolio – Institutional Class were as follows:
| PORTFOLIO | PURCHASES | SALES | |||||||||
| Flexible Income | $ | 15,335,874 | $ | 16,408,653 | |||||||
| Global Infrastructure | 10,221,058 | 9,740,818 | |||||||||
| Capital Growth | 8,854,848 | 8,433,176 | |||||||||
| Focus Growth | 28,200,334 | 25,654,612 | |||||||||
| Capital Opportunities | 6,400,488 | 6,456,022 | |||||||||
| Mid Cap Growth | 11,609,982 | 11,855,524 | |||||||||
Purchases and sales/prepayments/maturities of portfolio securities, excluding short-term investments (except Money Market), for the year ended December 31, 2010 were as follows:
| U.S. GOVERNMENT SECURITIES | OTHER | ||||||||||||||||||
| PURCHASES | SALES/PREPAYMENTS MATURITIES | PURCHASES | SALES/PREPAYMENTS MATURITIES | ||||||||||||||||
| Money Market | — | — | $ | 15,154,475,259 | $ | 15,195,972,763 | |||||||||||||
| Flexible Income | $ | 8,891,985 | $ | 14,862,788 | 16,990,179 | 14,214,303 | |||||||||||||
| Global Infrastructure | — | — | 45,332,599 | 51,540,965 | |||||||||||||||
| Capital Growth | — | — | 8,983,723 | 15,666,729 | |||||||||||||||
| Focus Growth | — | — | 38,030,576 | 58,176,796 | |||||||||||||||
| Capital Opportunities | — | — | 5,544,661 | 9,463,731 | |||||||||||||||
| Mid Cap Growth | — | — | 13,096,781 | 16,152,522 | |||||||||||||||
88
Morgan Stanley Select Dimensions Investment Series
Notes to Financial Statements n December 31, 2010 continued
The following Portfolio had transactions with Hartford Financial Services Group, Inc. common stock, an affiliate of the Fund:
| PORTFOLIO | PURCHASES | INCOME | VALUE | ||||||||||||
| Flexible Income | $ | 56,962 | $ | 2,066 | $ | 60,974 | |||||||||
The following Portfolio had transactions with Citigroup, Inc. and its affiliated broker/dealers which are affiliates of the Investment Adviser, Distributor, Sub-Advisers and Administrator for the year ended December 31, 2010:
| PORTFOLIO | INCOME | VALUE | |||||||||
| Flexible Income | $ | 15,632 | $ | 230,846 | |||||||
The following Portfolios had transactions with other Morgan Stanley funds for the year ended December 31, 2010:
| PORTFOLIO | PURCHASES | SALES | REALIZED GAIN (LOSS) | ||||||||||||
| Capital Growth | $ | 195,554 | $ | 30,504 | $ | (59,117 | ) | ||||||||
| Focus Growth | 1,021,415 | 396,541 | 68,574 | ||||||||||||
| Capital Opportunities | 193,099 | 384,094 | 168,692 | ||||||||||||
| Mid Cap Growth | 73,275 | 189,958 | (47,964 | ) | |||||||||||
For the year ended December 31, 2010, the following Portfolios incurred brokerage commissions with Morgan Stanley & Co., Inc. and its affiliated broker/dealers which are affiliates of the Investment Adviser, Sub-Advisers, Administrator and Distributor, for portfolio transactions executed on behalf of each Portfolio:
| GLOBAL INFRASTRUCTURE | FOCUS GROWTH | CAPITAL OPPORTUNITIES | MID CAP GROWTH | ||||||||||||
| $ | 137 | $ | 1,782 | $ | 235 | $ | 606 | ||||||||
For the year ended December 31, 2010, the following Portfolios incurred brokerage commissions with Citigroup, Inc., and its affiliated broker/dealers which are affiliates of the Investment Adviser, Sub-Advisers, Administrator and Distributor, for portfolio transactions executed on behalf of each Portfolio:
| GLOBAL INFRASTRUCTURE | CAPITAL GROWTH | FOCUS GROWTH | CAPITAL OPPORTUNITIES | MID CAP GROWTH | |||||||||||||||
| $ | 83 | $ | 136 | $ | 573 | $ | 112 | $ | 276 | ||||||||||
Morgan Stanley Services Company Inc., an affiliate of the Investment Adviser, Sub-Advisers and Distributor, is the Fund's transfer agent.
89
Morgan Stanley Select Dimensions Investment Series
Notes to Financial Statements n December 31, 2010 continued
7. Purposes of and Risks Relating to Certain Financial Instruments
Certain Portfolios may invest in mortgage securities, including securities issued by Federal National Mortgage Association ("FNMA") and Federal Home Loan Mortgage Corporation ("FHLMC"). These are fixed income securities that derive their value from or represent interests in a pool of mortgages or mortgage securities. An unexpectedly high rate of defaults on the mortgages held by a mortgage pool may adversely affect the value of a mortgage backed security and could result in losses to the Portfolio. The risk of such defaults is generally higher in the case of mortgage pools that include subprime mortgages. Subprime mortgages refer to loans made to borrowers with weakened credit histories or with a lower capacity to make timely payments on their mortgages. The securities issued by FNMA and FHLMC that are held by the Portfolios are not backed by subprime mortgages.
Additionally, securities issued by FNMA and FHLMC are not backed by or entitled to the full faith and credit of the United States; rather, they are supported by the right of the issuer to borrow from the U.S. Department of the Treasury.
The Federal Housing Finance Agency ("FHFA") serves as conservator of FNMA and FHLMC and the U.S. Department of the Treasury has agreed to provide capital as needed to ensure FNMA and FHLMC continue to provide liquidity to the housing and mortgage markets.
8. Federal Income Tax Status
The amount of dividends and distributions from net investment income and net realized capital gains are determined in accordance with federal income tax regulations which may differ from GAAP. These "book/tax" differences are either considered temporary or permanent in nature. To the extent these differences are permanent in nature, such amounts are reclassified within the capital accounts based on their federal tax-basis treatment; temporary differences do not require reclassification. Dividends and distributions which exceed net investment income and net realized capital gains for tax purposes are reported as distributions of paid-in-capital.
90
Morgan Stanley Select Dimensions Investment Series
Notes to Financial Statements n December 31, 2010 continued
The tax character of distributions paid for the years ended December 31, 2009 and December 31, 2010 for all portfolios was the same as the book character shown on the Statements of Changes except as follows:
| MONEY MARKET | GLOBAL INFRASTRUCTURE | ||||||||||
| FOR THE YEAR ENDED DECEMBER 31, 2010 | FOR THE YEAR ENDED DECEMBER 31, 2010 | ||||||||||
| Ordinary income | $ | 11,764 | $ | 1,004,960 | |||||||
| Long-term capital gains | 184 | 1,135,827 | |||||||||
| Total distributions | $ | 11,948 | $ | 2,140,787 | |||||||
As of December 31, 2010, the tax-basis components of accumulated earnings (losses) were as follows:
| MONEY MARKET | FLEXIBLE INCOME | GLOBAL INFRASTRUCTURE | CAPITAL GROWTH | FOCUS GROWTH | |||||||||||||||||||
| Undistributed ordinary income | $ | 6,487 | $ | 1,629,669 | $ | 794,790 | $ | — | $ | — | |||||||||||||
| Undistributed long-term gains | — | — | 1,802,878 | — | — | ||||||||||||||||||
| Net accumulated earnings | 6,487 | 1,629,669 | 2,597,668 | — | — | ||||||||||||||||||
| Foreign tax credit pass-through | — | — | 73,130 | — | — | ||||||||||||||||||
| Capital loss carryforward | — | (22,631,297 | ) | — | (3,205,346 | ) | (8,478,656 | ) | |||||||||||||||
| Post-October losses | — | (4,002 | ) | (72,384 | ) | — | (7,588 | ) | |||||||||||||||
| Temporary differences | (1,260 | ) | (12,105 | ) | (77,016 | ) | (301 | ) | (928 | ) | |||||||||||||
| Net unrealized appreciation | — | 872,427 | 3,356,267 | 7,968,277 | 23,477,091 | ||||||||||||||||||
| Total accumulated earnings (losses) | $ | 5,227 | $ | (20,145,308 | ) | $ | 5,877,665 | $ | 4,762,630 | $ | 14,989,919 | ||||||||||||
| CAPITAL OPPORTUNITIES | MID CAP GROWTH | ||||||||||
| Undistributed ordinary income | $ | — | $ | 96,594 | |||||||
| Undistributed long-term gains | — | — | |||||||||
| Net accumulated earnings | — | 96,594 | |||||||||
| Capital loss carryforward | (2,262,631 | ) | (2,331,608 | ) | |||||||
| Post-October losses | (24,312 | ) | (111,894 | ) | |||||||
| Temporary differences | (223 | ) | (327 | ) | |||||||
| Net unrealized appreciation | 7,394,830 | 5,980,781 | |||||||||
| Total accumulated earnings | $ | 5,107,664 | $ | 3,633,546 | |||||||
91
Morgan Stanley Select Dimensions Investment Series
Notes to Financial Statements n December 31, 2010 continued
As of December 31, 2010, the following Portfolios had a net capital loss carryforward which may be used to offset future capital gains to the extent provided by regulations.
| (AMOUNTS IN THOUSANDS) | |||||||||||||||||||||||||||||||||||
| AVAILABLE THROUGH DECEMBER 31, | 2011 | 2012 | 2013 | 2014 | 2016 | 2017 | 2018 | TOTAL | |||||||||||||||||||||||||||
| Flexible Income | $ | 6,161 | $ | 1,199 | $ | 562 | $ | 939 | $ | 4,961 | $ | 6,610 | $ | 2,199 | $ | 22,631 | |||||||||||||||||||
| Capital Growth | 3,145 | 60 | — | — | — | — | — | 3,205 | |||||||||||||||||||||||||||
| Focus Growth | — | — | — | — | 4,859 | 3,620 | — | 8,479 | |||||||||||||||||||||||||||
| Capital Opportunities | — | — | — | — | 1,929 | 334 | 2,263 | ||||||||||||||||||||||||||||
| Mid Cap Growth | — | — | — | — | — | 2,332 | — | 2,332 | |||||||||||||||||||||||||||
During the year ended December 31, 2010, the following Portfolios utilized net capital loss carryforwards: Capital Growth — $1,080,715; Focus Growth — $7,242,626; Capital Opportunities — $2,166,316; Mid Cap Growth — $2,757,007.
At December 31, 2010, the primary reason(s) for significant temporary/permanent book/tax differences were as follows:
| TEMPORARY DIFFERENCES | PERMANENT DIFFERENCES | ||||||||||||||||||
| POST- OCTOBER LOSSES | LOSS DEFERRALS FROM WASH SALES | FOREIGN CURRENCY GAINS/LOSSES | NET OPERATING LOSS | ||||||||||||||||
| Money Market | |||||||||||||||||||
| Flexible Income | • | • | • | ||||||||||||||||
| Global Infrastructure | • | • | • | ||||||||||||||||
| Capital Growth | • | • | • | ||||||||||||||||
| Focus Growth | • | • | • | • | |||||||||||||||
| Capital Opportunities | • | • | • | • | |||||||||||||||
| Mid Cap Growth | • | • | • | ||||||||||||||||
Additionally, the following Portfolios had other temporary differences: Flexible Income and Global Infrastructure — gain/loss from the mark-to-market of futures and/or options contracts; Flexible Income — interest on bonds in default and capital loss deferrals on straddles; Global Infrastructure — mark-to-market of passive foreign investment companies ("PFICs") and foreign tax credit pass-through; The following Portfolios had other permanent differences: Flexible Income — reclassification of net gains/losses on paydowns and gains on swaps; Global Infrastructure — tax adjustments on PFICs sold by the Portfolio; Flexible Income, Capital Growth, Focus Growth, Capital Opportunities and Mid Cap Growth — expired capital loss carryforward. The following Portfolios had temporary and/or permanent differences attributable to book amortization of premiums on debt securities: Flexible Income.
92
Morgan Stanley Select Dimensions Investment Series
Notes to Financial Statements n December 31, 2010 continued
The permanent differences resulted in the following reclassifications among the Portfolios' components of net assets at December 31, 2010:
| ACCUMULATED UNDISTRIBUTED NET INVESTMENT INCOME (LOSS) | ACCUMULATED NET REALIZED GAIN (LOSS) | PAID-IN-CAPITAL | |||||||||||||
| Money Market | $ | 1,802 | $ | (1,802 | ) | — | |||||||||
| Flexible Income | 395,087 | 6,386,911 | $ | (6,781,998 | ) | ||||||||||
| Global Infrastructure | 177,143 | (177,143 | ) | — | |||||||||||
| Capital Growth | 16,111 | 15,317,643 | (15,333,754 | ) | |||||||||||
| Focus Growth | 106,454 | 67,550,457 | (67,656,911 | ) | |||||||||||
| Capital Opportunities | 98,165 | 55,430,859 | (55,529,024 | ) | |||||||||||
| Mid Cap Growth | (7,489 | ) | 8,177,485 | (8,169,996 | ) | ||||||||||
9. Expense Offset
The Fund has entered into an arrangement with State Street Bank and Trust Company (the "Custodian"), whereby credits realized on uninvested cash balances were used to offset a portion of the Portfolio's expenses. If applicable, these custodian credits are shown as "Expense Offset" in the Statements of Operations.
10. Accounting Pronouncement
On January 21, 2010, the FASB issued Accounting Standards Update ("ASU") 2010-06. The ASU amends ASC 820 to add new requirements for disclosures about significant transfers into and out of Levels 1 and 2, which the Fund has adopted and made the required disclosures in the Fair Valuation Measurements footnote. In addition, separate disclosures for purchases, sales, issuances and settlements relating to Level 3 measurements is required for fiscal years and interim periods beginning after December 15, 2010.
93
Morgan Stanley Select Dimensions Investment Series
Financial Highlights
| FOR THE YEAR ENDED DECEMBER 31 | NET ASSET VALUE BEGINNING OF PERIOD | NET INVESTMENT INCOME(a) | NET REALIZED AND UNREALIZED GAIN (LOSS) | TOTAL FROM INVESTMENT OPERATIONS | DIVIDENDS TO SHAREHOLDERS | DISTRIBUTIONS TO SHAREHOLDERS | TOTAL DIVIDENDS AND DISTRIBUTIONS | ||||||||||||||||||||||||
| MONEY MARKET CLASS X SHARES | |||||||||||||||||||||||||||||||
| 2006 | $ | 1.00 | $ | 0.040 | — | $ | 0.040 | $ | (0.040 | ) | — | $ | (0.040 | ) | |||||||||||||||||
| 2007 | 1.00 | 0.050 | — | 0.050 | (0.050 | ) | — | (0.050 | ) | ||||||||||||||||||||||
| 2008 | 1.00 | 0.020 | — | 0.020 | (0.020 | ) | — | (0.020 | ) | ||||||||||||||||||||||
| 2009 | 1.00 | 0.000 | (d) | — | 0.000 | (d) | (0.000 | )(d) | — | (0.000 | )(d) | ||||||||||||||||||||
| 2010 | 1.00 | 0.000 | (d) | — | 0.000 | (d) | (0.000 | )(d) | — | (0.000 | )(d) | ||||||||||||||||||||
| CLASS Y SHARES | |||||||||||||||||||||||||||||||
| 2006 | 1.00 | 0.040 | — | 0.040 | (0.040 | ) | — | (0.040 | ) | ||||||||||||||||||||||
| 2007 | 1.00 | 0.050 | — | 0.050 | (0.050 | ) | — | (0.050 | ) | ||||||||||||||||||||||
| 2008 | 1.00 | 0.020 | — | 0.020 | (0.020 | ) | — | (0.020 | ) | ||||||||||||||||||||||
| 2009 | 1.00 | 0.000 | (d) | — | 0.000 | (d) | (0.000 | )(d) | — | (0.000 | )(d) | ||||||||||||||||||||
| 2010 | 1.00 | 0.000 | (d) | — | 0.000 | (d) | (0.000 | )(d) | — | (0.000 | )(d) | ||||||||||||||||||||
| FLEXIBLE INCOME CLASS X SHARES | |||||||||||||||||||||||||||||||
| 2006 | 7.35 | 0.46 | $ | (0.04 | ) | 0.42 | (0.47 | ) | — | (0.47 | ) | ||||||||||||||||||||
| 2007 | 7.30 | 0.48 | (0.21 | ) | 0.27 | (0.44 | ) | $ | (0.01 | )(g) | (0.45 | ) | |||||||||||||||||||
| 2008 | 7.12 | 0.41 | (1.93 | ) | (1.52 | ) | (0.14 | ) | — | (0.14 | ) | ||||||||||||||||||||
| 2009 | 5.46 | 0.32 | 0.73 | 1.05 | (0.43 | ) | — | (0.43 | ) | ||||||||||||||||||||||
| 2010 | 6.08 | 0.27 | 0.25 | 0.52 | (0.39 | ) | — | (0.39 | ) | ||||||||||||||||||||||
| CLASS Y SHARES | |||||||||||||||||||||||||||||||
| 2006 | 7.33 | 0.44 | (0.05 | ) | 0.39 | (0.45 | ) | — | (0.45 | ) | |||||||||||||||||||||
| 2007 | 7.27 | 0.46 | (0.20 | ) | 0.26 | (0.42 | ) | (0.01 | )(g) | (0.43 | ) | ||||||||||||||||||||
| 2008 | 7.10 | 0.39 | (1.93 | ) | (1.54 | ) | (0.13 | ) | — | (0.13 | ) | ||||||||||||||||||||
| 2009 | 5.43 | 0.31 | 0.72 | 1.03 | (0.42 | ) | — | (0.42 | ) | ||||||||||||||||||||||
| 2010 | 6.04 | 0.25 | 0.26 | 0.51 | (0.38 | ) | — | (0.38 | ) | ||||||||||||||||||||||
See Notes to Financial Statements
94
| RATIOS TO AVERAGE NET ASSETS(c) | |||||||||||||||||||||||||||||||
| FOR THE YEAR ENDED DECEMBER 31 | NET ASSET VALUE END OF PERIOD | TOTAL RETURN(b) | NET ASSETS END OF PERIOD (000'S) | EXPENSES | NET INVESTMENT INCOME | REBATE FROM MORGAN STANLEY AFFILIATE | PORTFOLIO TURNOVER RATE | ||||||||||||||||||||||||
| MONEY MARKET CLASS X SHARES | |||||||||||||||||||||||||||||||
| 2006 | $ | 1.00 | 4.59 | % | $ | 46,731 | 0.58 | % | 4.56 | % | — | N/A | |||||||||||||||||||
| 2007 | 1.00 | 4.93 | 38,036 | 0.58 | 4.79 | — | N/A | ||||||||||||||||||||||||
| 2008 | 1.00 | 2.38 | 42,190 | 0.58 | 2.34 | — | N/A | ||||||||||||||||||||||||
| 2009 | 1.00 | 0.03 | 40,771 | 0.39 | (e)(f) | 0.03 | (e)(f) | — | N/A | ||||||||||||||||||||||
| 2010 | 1.00 | 0.01 | 32,429 | 0.30 | (f) | 0.01 | (f) | — | N/A | ||||||||||||||||||||||
| CLASS Y SHARES | |||||||||||||||||||||||||||||||
| 2006 | 1.00 | 4.34 | 74,239 | 0.83 | 4.31 | — | N/A | ||||||||||||||||||||||||
| 2007 | 1.00 | 4.67 | 84,724 | 0.83 | 4.54 | — | N/A | ||||||||||||||||||||||||
| 2008 | 1.00 | 2.13 | 173,595 | 0.83 | 1.91 | — | N/A | ||||||||||||||||||||||||
| 2009 | 1.00 | 0.01 | 101,015 | 0.40 | (e)(f) | 0.02 | (e)(f) | — | N/A | ||||||||||||||||||||||
| 2010 | 1.00 | 0.01 | 67,856 | 0.30 | (f) | 0.01 | (f) | — | N/A | ||||||||||||||||||||||
| FLEXIBLE INCOME CLASS X SHARES | |||||||||||||||||||||||||||||||
| 2006 | 7.30 | 5.76 | 29,166 | 0.56 | 6.30 | — | 52 | % | |||||||||||||||||||||||
| 2007 | 7.12 | 3.89 | 24,135 | 0.61 | 6.62 | — | 51 | ||||||||||||||||||||||||
| 2008 | 5.46 | (21.62 | ) | 14,743 | 0.67 | (h) | 6.48 | (h) | 0.01 | % | 73 | ||||||||||||||||||||
| 2009 | 6.08 | 19.77 | 13,924 | 0.92 | (h) | 5.58 | (h) | 0.01 | 165 | ||||||||||||||||||||||
| 2010 | 6.21 | 9.08 | 12,719 | 0.90 | (h) | 4.38 | (h) | 0.00 | (i) | 91 | |||||||||||||||||||||
| CLASS Y SHARES | |||||||||||||||||||||||||||||||
| 2006 | 7.27 | 5.68 | 25,765 | 0.81 | 6.05 | — | 52 | ||||||||||||||||||||||||
| 2007 | 7.10 | 3.64 | 25,381 | 0.86 | 6.37 | — | 51 | ||||||||||||||||||||||||
| 2008 | 5.43 | (21.89 | ) | 15,658 | 0.92 | (h) | 6.23 | (h) | 0.01 | 73 | |||||||||||||||||||||
| 2009 | 6.04 | 19.45 | 16,357 | 1.17 | (h) | 5.33 | (h) | 0.01 | 165 | ||||||||||||||||||||||
| 2010 | 6.17 | 8.85 | 14,740 | 1.15 | (h) | 4.13 | (h) | 0.00 | (i) | 91 | |||||||||||||||||||||
95
Morgan Stanley Select Dimensions Investment Series
Financial Highlights continued
| FOR THE YEAR ENDED DECEMBER 31 | NET ASSET VALUE BEGINNING OF PERIOD | NET INVESTMENT INCOME (LOSS)(a) | NET REALIZED AND UNREALIZED GAIN (LOSS) | TOTAL FROM INVESTMENT OPERATIONS | DIVIDENDS TO SHAREHOLDERS | DISTRIBUTIONS TO SHAREHOLDERS | TOTAL DIVIDENDS AND DISTRIBUTIONS | ||||||||||||||||||||||||
| GLOBAL INFRASTRUCTURE CLASS X SHARES | |||||||||||||||||||||||||||||||
| 2006 | $ | 21.43 | $ | 0.46 | $ | 3.88 | $ | 4.34 | $ | (0.48 | ) | — | $ | (0.48 | ) | ||||||||||||||||
| 2007 | 25.29 | 0.51 | 4.49 | 5.00 | (0.52 | ) | — | (0.52 | ) | ||||||||||||||||||||||
| 2008 | 29.77 | 0.58 | (10.37 | ) | (9.79 | ) | (0.15 | ) | — | (0.15 | ) | ||||||||||||||||||||
| 2009 | 19.83 | 0.54 | 3.00 | 3.54 | (0.69 | ) | — | (0.69 | ) | ||||||||||||||||||||||
| 2010 | 22.68 | 0.56 | 0.72 | 1.28 | (0.53 | ) | $ | (0.98 | ) | (1.51 | ) | ||||||||||||||||||||
| CLASS Y SHARES | |||||||||||||||||||||||||||||||
| 2006 | 21.42 | 0.40 | 3.87 | 4.27 | (0.42 | ) | — | (0.42 | ) | ||||||||||||||||||||||
| 2007 | 25.27 | 0.45 | 4.48 | 4.93 | (0.45 | ) | — | (0.45 | ) | ||||||||||||||||||||||
| 2008 | 29.75 | 0.52 | (10.36 | ) | (9.84 | ) | (0.13 | ) | — | (0.13 | ) | ||||||||||||||||||||
| 2009 | 19.78 | 0.49 | 3.00 | 3.49 | (0.64 | ) | — | (0.64 | ) | ||||||||||||||||||||||
| 2010 | 22.63 | 0.51 | 0.71 | 1.22 | (0.47 | ) | (0.98 | ) | (1.45 | ) | |||||||||||||||||||||
| CAPITAL GROWTH CLASS X SHARES | |||||||||||||||||||||||||||||||
| 2006 | 17.51 | (0.01 | ) | 0.70 | 0.69 | — | — | — | |||||||||||||||||||||||
| 2007 | 18.20 | 0.08 | 3.91 | 3.99 | — | — | — | ||||||||||||||||||||||||
| 2008 | 22.19 | (0.04 | ) | (10.74 | ) | (10.78 | ) | (0.06 | ) | — | (0.06 | ) | |||||||||||||||||||
| 2009 | 11.35 | (0.02 | ) | 7.49 | 7.51 | — | — | — | |||||||||||||||||||||||
| 2010 | 18.86 | 0.02 | 4.45 | 4.47 | — | — | — | ||||||||||||||||||||||||
| CLASS Y SHARES | |||||||||||||||||||||||||||||||
| 2006 | 17.33 | (0.05 | ) | 0.69 | 0.64 | — | — | — | |||||||||||||||||||||||
| 2007 | 17.97 | 0.03 | 3.86 | 3.89 | — | — | — | ||||||||||||||||||||||||
| 2008 | 21.86 | (0.08 | ) | (10.59 | ) | (10.67 | ) | (0.00 | )(j) | — | (0.00 | )(j) | |||||||||||||||||||
| 2009 | 11.19 | (0.02 | ) | 7.37 | 7.35 | — | — | — | |||||||||||||||||||||||
| 2010 | 18.54 | (0.03 | ) | 4.36 | 4.33 | — | — | — | |||||||||||||||||||||||
See Notes to Financial Statements
96
| RATIOS TO AVERAGE NET ASSETS(c) | |||||||||||||||||||||||||||||||
| FOR THE YEAR ENDED DECEMBER 31 | NET ASSET VALUE END OF PERIOD | TOTAL RETURN(b) | NET ASSETS END OF PERIOD (000'S) | EXPENSES | NET INVESTMENT INCOME (LOSS) | REBATE FROM MORGAN STANLEY AFFILIATE | PORTFOLIO TURNOVER RATE | ||||||||||||||||||||||||
| GLOBAL INFRASTRUCTURE CLASS X SHARES | |||||||||||||||||||||||||||||||
| 2006 | $ | 25.29 | 20.50 | % | $ | 52,982 | 0.74 | % | 2.02 | % | — | 21 | % | ||||||||||||||||||
| 2007 | 29.77 | 19.86 | 48,582 | 0.75 | 1.83 | — | 8 | ||||||||||||||||||||||||
| 2008 | 19.83 | (33.02 | ) | 26,297 | 0.84 | (h) | 2.28 | (h) | 0.00 | (i)% | 77 | ||||||||||||||||||||
| 2009 | 22.68 | 18.47 | 24,953 | 1.42 | (h) | 2.75 | (h) | 0.00 | (i) | 279 | |||||||||||||||||||||
| 2010 | 22.45 | 7.13 | 21,843 | 0.93 | (h) | 2.66 | (h) | 0.00 | (i) | 148 | |||||||||||||||||||||
| CLASS Y SHARES | |||||||||||||||||||||||||||||||
| 2006 | 25.27 | 20.17 | 17,495 | 0.99 | 1.77 | — | 21 | ||||||||||||||||||||||||
| 2007 | 29.75 | 19.59 | 18,763 | 1.00 | 1.58 | — | 8 | ||||||||||||||||||||||||
| 2008 | 19.78 | (33.19 | ) | 10,886 | 1.09 | (h) | 2.03 | (h) | 0.00 | (i) | 77 | ||||||||||||||||||||
| 2009 | 22.63 | 18.18 | 10,332 | 1.67 | (h) | 2.50 | (h) | 0.00 | (i) | 279 | |||||||||||||||||||||
| 2010 | 22.40 | 6.81 | 8,883 | 1.18 | (h) | 2.41 | (h) | 0.00 | (i) | 148 | |||||||||||||||||||||
| CAPITAL GROWTH CLASS X SHARES | |||||||||||||||||||||||||||||||
| 2006 | 18.20 | 3.94 | 23,975 | 0.71 | (0.04 | ) | — | 61 | |||||||||||||||||||||||
| 2007 | 22.19 | 21.92 | 21,863 | 0.70 | 0.38 | — | 55 | ||||||||||||||||||||||||
| 2008 | 11.35 | (48.70 | ) | 8,621 | 0.81 | (h) | (0.21 | )(h) | 0.00 | (i) | 42 | ||||||||||||||||||||
| 2009 | 18.86 | 66.17 | 11,748 | 0.91 | (h) | 0.11 | (h) | 0.00 | (i) | 19 | |||||||||||||||||||||
| 2010 | 23.33 | 23.70 | 11,710 | 0.89 | (h) | 0.11 | (h) | 0.00 | (i) | 33 | |||||||||||||||||||||
| CLASS Y SHARES | |||||||||||||||||||||||||||||||
| 2006 | 17.97 | 3.75 | 27,009 | 0.96 | (0.29 | ) | — | 61 | |||||||||||||||||||||||
| 2007 | 21.86 | 21.58 | 27,644 | 0.95 | 0.13 | — | 55 | ||||||||||||||||||||||||
| 2008 | 11.19 | (48.81 | ) | 12,953 | 1.06 | (h) | (0.46 | )(h) | 0.00 | (i) | 42 | ||||||||||||||||||||
| 2009 | 18.54 | 65.68 | 17,864 | 1.16 | (h) | (0.14 | )(h) | 0.00 | (i) | 19 | |||||||||||||||||||||
| 2010 | 22.87 | 23.35 | 17,537 | 1.14 | (h) | (0.14 | )(h) | 0.00 | (i) | 33 | |||||||||||||||||||||
97
Morgan Stanley Select Dimensions Investment Series
Financial Highlights continued
| FOR THE YEAR ENDED DECEMBER 31 | NET ASSET VALUE BEGINNING OF PERIOD | NET INVESTMENT INCOME (LOSS)(a) | NET REALIZED AND UNREALIZED GAIN (LOSS) | TOTAL FROM INVESTMENT OPERATIONS | DIVIDENDS TO SHAREHOLDERS | DISTRIBUTIONS TO SHAREHOLDERS | TOTAL DIVIDENDS AND DISTRIBUTIONS | ||||||||||||||||||||||||
| FOCUS GROWTH CLASS X SHARES | |||||||||||||||||||||||||||||||
| 2006 | $ | 17.19 | $ | (0.03 | ) | $ | 0.09 | $ | 0.06 | $ | 0.00 | (j) | — | $ | 0.00 | (j) | |||||||||||||||
| 2007 | 17.25 | 0.08 | 3.85 | 3.93 | — | — | — | ||||||||||||||||||||||||
| 2008 | 21.18 | (0.03 | ) | (10.83 | ) | (10.86 | ) | (0.07 | ) | — | (0.07 | ) | |||||||||||||||||||
| 2009 | 10.25 | 0.01 | 7.35 | 7.36 | (0.02 | ) | — | (0.02 | ) | ||||||||||||||||||||||
| 2010 | 17.59 | (0.01 | ) | 4.83 | 4.82 | (0.01 | ) | — | (0.01 | ) | |||||||||||||||||||||
| CLASS Y SHARES | |||||||||||||||||||||||||||||||
| 2006 | 17.10 | (0.07 | ) | 0.09 | 0.02 | — | — | — | |||||||||||||||||||||||
| 2007 | 17.12 | 0.04 | 3.81 | 3.85 | — | — | — | ||||||||||||||||||||||||
| 2008 | 20.97 | (0.08 | ) | (10.73 | ) | (10.81 | ) | (0.01 | ) | — | (0.01 | ) | |||||||||||||||||||
| 2009 | 10.15 | (0.02 | ) | 7.27 | 7.25 | — | — | — | |||||||||||||||||||||||
| 2010 | 17.40 | (0.05 | ) | 4.77 | 4.72 | — | — | — | |||||||||||||||||||||||
| CAPITAL OPPORTUNITIES CLASS X SHARES | |||||||||||||||||||||||||||||||
| 2006 | 11.71 | (0.04 | ) | 0.95 | 0.91 | — | — | — | |||||||||||||||||||||||
| 2007 | 12.62 | 0.04 | 2.41 | 2.45 | — | — | — | ||||||||||||||||||||||||
| 2008 | 15.07 | (0.05 | ) | (7.34 | ) | (7.39 | ) | — | — | — | |||||||||||||||||||||
| 2009 | 7.68 | (0.02 | ) | 5.38 | 5.36 | — | — | — | |||||||||||||||||||||||
| 2010 | 13.04 | (0.04 | ) | 3.56 | 3.52 | — | — | — | |||||||||||||||||||||||
| CLASS Y SHARES | |||||||||||||||||||||||||||||||
| 2006 | 11.55 | (0.07 | ) | 0.94 | 0.87 | — | — | — | |||||||||||||||||||||||
| 2007 | 12.42 | 0.00 | 2.37 | 2.37 | — | — | — | ||||||||||||||||||||||||
| 2008 | 14.79 | (0.08 | ) | (7.19 | ) | (7.27 | ) | — | — | — | |||||||||||||||||||||
| 2009 | 7.52 | (0.05 | ) | 5.26 | 5.21 | — | — | — | |||||||||||||||||||||||
| 2010 | 12.73 | (0.07 | ) | 3.47 | 3.40 | — | — | — | |||||||||||||||||||||||
See Notes to Financial Statements
98
| RATIOS TO AVERAGE NET ASSETS(c) | |||||||||||||||||||||||||||||||
| FOR THE YEAR ENDED DECEMBER 31 | NET ASSET VALUE END OF PERIOD | TOTAL RETURN(b) | NET ASSETS END OF PERIOD (000'S) | EXPENSES | NET INVESTMENT INCOME (LOSS) | REBATE FROM MORGAN STANLEY AFFILIATE | PORTFOLIO TURNOVER RATE | ||||||||||||||||||||||||
| FOCUS GROWTH CLASS X SHARES | |||||||||||||||||||||||||||||||
| 2006 | $ | 17.25 | 0.37 | % | $ | 137,081 | 0.69 | % | (0.15 | )% | — | 98 | % | ||||||||||||||||||
| 2007 | 21.18 | 22.78 | 125,826 | 0.72 | 0.44 | — | 48 | ||||||||||||||||||||||||
| 2008 | 10.25 | (51.43 | ) | 48,722 | 0.70 | (h) | (0.19 | )(h) | 0.01 | % | 31 | ||||||||||||||||||||
| 2009 | 17.59 | 71.83 | 67,932 | 0.77 | (h) | 0.10 | (h) | 0.00 | (i) | 11 | |||||||||||||||||||||
| 2010 | 22.40 | 27.41 | 72,166 | 0.75 | (h) | (0.04 | )(h) | 0.00 | (i) | 44 | |||||||||||||||||||||
| CLASS Y SHARES | |||||||||||||||||||||||||||||||
| 2006 | 17.12 | 0.12 | 36,895 | 0.94 | (0.40 | ) | — | 98 | |||||||||||||||||||||||
| 2007 | 20.97 | 22.49 | 38,526 | 0.97 | 0.19 | — | 48 | ||||||||||||||||||||||||
| 2008 | 10.15 | (51.57 | ) | 14,206 | 0.95 | (h) | (0.44 | )(h) | 0.01 | 31 | |||||||||||||||||||||
| 2009 | 17.40 | 71.43 | 22,047 | 1.02 | (h) | (0.15 | )(h) | 0.00 | (i) | 11 | |||||||||||||||||||||
| 2010 | 22.12 | 27.07 | 21,783 | 1.00 | (h) | (0.29 | )(h) | 0.00 | (i) | 44 | |||||||||||||||||||||
| CAPITAL OPPORTUNITIES CLASS X SHARES | |||||||||||||||||||||||||||||||
| 2006 | 12.62 | 7.86 | 19,112 | 0.90 | (0.32 | ) | — | 59 | |||||||||||||||||||||||
| 2007 | 15.07 | 19.32 | 17,108 | 0.94 | 0.26 | — | 57 | ||||||||||||||||||||||||
| 2008 | 7.68 | (49.04 | ) | 6,744 | 1.04 | (h) | (0.37 | )(h) | 0.00 | (i) | 33 | ||||||||||||||||||||
| 2009 | 13.04 | 69.79 | 9,601 | 1.23 | (h) | (0.24 | )(h) | 0.00 | (i) | 23 | |||||||||||||||||||||
| 2010 | 16.56 | 26.99 | 10,230 | 1.08 | (h) | (0.31 | )(h) | 0.00 | (i) | 27 | |||||||||||||||||||||
| CLASS Y SHARES | |||||||||||||||||||||||||||||||
| 2006 | 12.42 | 7.53 | 16,127 | 1.15 | (0.57 | ) | — | 59 | |||||||||||||||||||||||
| 2007 | 14.79 | 19.08 | 18,362 | 1.19 | 0.01 | — | 57 | ||||||||||||||||||||||||
| 2008 | 7.52 | (49.15 | ) | 8,571 | 1.29 | (h) | (0.62 | )(h) | 0.00 | (i) | 33 | ||||||||||||||||||||
| 2009 | 12.73 | 69.28 | 12,455 | 1.48 | (h) | (0.49 | )(h) | 0.00 | (i) | 23 | |||||||||||||||||||||
| 2010 | 16.13 | 26.71 | 13,058 | 1.33 | (h) | (0.56 | )(h) | 0.00 | (i) | 27 | |||||||||||||||||||||
99
Morgan Stanley Select Dimensions Investment Series
Financial Highlights continued
| FOR THE YEAR ENDED DECEMBER 31 | NET ASSET VALUE BEGINNING OF PERIOD | NET INVESTMENT INCOME (LOSS)(a) | NET REALIZED AND UNREALIZED GAIN (LOSS) | TOTAL FROM INVESTMENT OPERATIONS | DIVIDENDS TO SHAREHOLDERS | DISTRIBUTIONS TO SHAREHOLDERS | TOTAL DIVIDENDS AND DISTRIBUTIONS | ||||||||||||||||||||||||
| MID CAP GROWTH CLASS X SHARES | |||||||||||||||||||||||||||||||
| 2006 | $ | 23.76 | $ | 0.12 | $ | 2.40 | $ | 2.52 | — | — | — | ||||||||||||||||||||
| 2007 | 26.28 | 0.16 | 5.87 | 6.03 | $ | (0.12 | ) | — | $ | (0.12 | ) | ||||||||||||||||||||
| 2008 | 32.19 | (0.05 | ) | (15.34 | ) | (15.39 | ) | (0.19 | ) | — | (0.19 | ) | |||||||||||||||||||
| 2009 | 16.61 | 0.03 | 10.01 | 10.04 | — | — | — | ||||||||||||||||||||||||
| 2010 | 26.65 | 0.10 | 8.63 | 8.73 | (0.04 | ) | — | (0.04 | ) | ||||||||||||||||||||||
| CLASS Y SHARES | |||||||||||||||||||||||||||||||
| 2006 | 23.43 | 0.05 | 2.38 | 2.43 | — | — | — | ||||||||||||||||||||||||
| 2007 | 25.86 | 0.09 | 5.76 | 5.85 | (0.04 | ) | — | (0.04 | ) | ||||||||||||||||||||||
| 2008 | 31.67 | (0.11 | ) | (15.10 | ) | (15.21 | ) | (0.12 | ) | — | (0.12 | ) | |||||||||||||||||||
| 2009 | 16.34 | (0.03 | ) | 9.84 | 9.81 | — | — | — | |||||||||||||||||||||||
| 2010 | 26.15 | 0.03 | 8.46 | 8.49 | — | — | — | ||||||||||||||||||||||||
(a) The per share amounts were computed using an average number of shares outstanding during the period.
(b) Calculated based on the net asset value as of the last business day of the period. Performance shown does not reflect fees and expenses imposed by your insurance company. If performance information included the effect of these charges, the total returns would be lower.
(c) Reflects overall Portfolio ratios for investment income and non-class specific expenses.
(d) Amount is less than $0.001.
(e) Reflects fees paid in connection with the U.S. Treasury's Temporary Guarantee Program for Money Market Funds. This fee had an effect of 0.03% for the year ended 2009.
(f) If the Portfolio had borne all expenses that were reimbursed or waived by the Distributor, Investment Adviser and Administrator, the annualized expense and net investment loss ratios would have been as follows:
| PERIOD ENDED | EXPENSE RATIO | NET INVESTMENT LOSS RATIO | |||||||||
| December 31, 2010 | |||||||||||
| Class X | 0.59 | % | (0.29 | )% | |||||||
| Class Y | 0.84 | (0.54 | ) | ||||||||
| December 31, 2009 | |||||||||||
| Class X | 0.59 | (0.17 | ) | ||||||||
| Class Y | 0.84 | (0.42 | ) | ||||||||
See Notes to Financial Statements
100
| RATIOS TO AVERAGE NET ASSETS(c) | |||||||||||||||||||||||||||||||
| FOR THE YEAR ENDED DECEMBER 31 | NET ASSET VALUE END OF PERIOD | TOTAL RETURN(b) | NET ASSETS END OF PERIOD (000'S) | EXPENSES | NET INVESTMENT INCOME (LOSS) | REBATE FROM MORGAN STANLEY AFFILIATE | PORTFOLIO TURNOVER RATE | ||||||||||||||||||||||||
| MID CAP GROWTH CLASS X SHARES | |||||||||||||||||||||||||||||||
| 2006 | $ | 26.28 | 10.69 | % | $ | 41,466 | 0.63 | % | 0.47 | % | — | 65 | % | ||||||||||||||||||
| 2007 | 32.19 | 22.94 | 38,069 | 0.67 | 0.54 | — | 78 | ||||||||||||||||||||||||
| 2008 | 16.61 | (48.06 | ) | 16,023 | 0.74 | (h) | (0.19 | )(h) | 0.01 | % | 43 | ||||||||||||||||||||
| 2009 | 26.65 | 60.45 | 21,310 | 0.84 | (h) | 0.12 | (h) | 0.00 | (i) | 36 | |||||||||||||||||||||
| 2010 | 35.34 | 32.79 | 24,319 | 0.79 | (h) | 0.36 | (h) | 0.00 | (i) | 44 | |||||||||||||||||||||
| CLASS Y SHARES | |||||||||||||||||||||||||||||||
| 2006 | 25.86 | 10.42 | 10,192 | 0.88 | 0.22 | — | 65 | ||||||||||||||||||||||||
| 2007 | 31.67 | 22.65 | 12,788 | 0.92 | 0.29 | — | 78 | ||||||||||||||||||||||||
| 2008 | 16.34 | (48.20 | ) | 5,469 | 0.99 | (h) | (0.44 | )(h) | 0.01 | 43 | |||||||||||||||||||||
| 2009 | 26.15 | 60.04 | 8,267 | 1.09 | (h) | (0.13 | )(h) | 0.00 | (i) | 36 | |||||||||||||||||||||
| 2010 | 34.64 | 32.47 | 10,828 | 1.04 | (h) | 0.11 | (h) | 0.00 | (i) | 44 | |||||||||||||||||||||
(g) Distribution from paid-in-capital.
(h) The ratios reflect the rebate of certain Portfolio expenses in connection with investments in a Morgan Stanley affiliate during the period. The effect of the rebate on the ratios is disclosed in the above table as "Rebate from Morgan Stanley affiliate."
(i) Amount is less than 0.005%.
(j) Includes dividends of less than $0.001.
101
Morgan Stanley Select Dimensions Investment Series
Report of Independent Registered Public Accounting Firm
To the Shareholders and Board of Trustees of
Morgan Stanley Select Dimensions Investment Series:
We have audited the accompanying statements of assets and liabilities of Morgan Stanley Select Dimensions Investment Series (the "Fund"), comprised of the Money Market Portfolio, Flexible Income Portfolio, Global Infrastructure Portfolio, Capital Growth Portfolio, Focus Growth Portfolio, Capital Opportunities Portfolio and Mid Cap Growth Portfolio (the "Portfolios"), including the portfolios of investments, as of December 31, 2010, and the related statements of operations for the year then ended, the statements of changes in net assets for each of the two years in the period then ended, and the financial highlights for each of the five years in the period then ended. These financial statements and financial highlights are the responsibility of the Fund's management. Our responsibility is to express an opinion on these financial statements and financial highlights based on our audits.
We conducted our audits in accordance with the standards of the Public Company Accounting Oversight Board (United States). Those standards require that we plan and perform the audits to obtain reasonable assurance about whether the financial statements and financial highlights are free of material misstatement. The Fund is not required to have, nor were we engaged to perform, an audit of its internal control over financial reporting. Our audits included consideration of internal control over financial reporting as a basis for designing audit procedures that are appropriate in the circumstances, but not for the purpose of expressing an opinion on the effectiveness of the Fund's internal control over financial reporting. Accordingly, we express no such opinion. An audit also includes examining, on a test basis, evidence supporting the amounts and disclosures in the financial statements, assessing the accounting principles used and significant estimates made by management, as well as evaluating the overall financial statement presentation. Our procedures included confirmation of securities owned as of December 31, 2010, by correspondence with the custodians and brokers; where replies were not received from brokers, we performed other auditing procedures. We believe that our audits provide a reasonable basis for our opinion.
In our opinion, the financial statements and financial highlights referred to above present fairly, in all material respects, the financial position of each of the Portfolios of Morgan Stanley Select Dimensions Investment Series as of December 31, 2010, the results of their operations for the year then ended, the changes in their net assets for each of the two years in the period then ended, and the financial highlights for each of the five years in the period then ended, in conformity with accounting principles generally accepted in the United States of America.
Deloitte & Touche LLP
New York, New York
February 25, 2011
102
Morgan Stanley Select Dimensions Investment Series
Trustee and Officer Information (unaudited)
Independent Trustees:
| Name, Age and Address of Independent Trustee | Position(s) Held with Registrant | Term of Office and Length of Time Served* | Principal Occupation(s) During Past 5 Years | Number of Portfolios in Fund Complex Overseen by Independent Trustee** | Other Directorships Held by Independent Trustee*** | ||||||||||||||||||
| Frank L. Bowman (66) c/o Kramer Levin Naftalis & Frankel LLP Counsel to the Independent Trustees 1177 Avenue of the Americas New York, NY 10036 | Trustee | Since August 2006 | President, Strategic Decisions, LLC (consulting) (since February 2009); Director or Trustee of various Retail Funds and Institutional Funds (since August 2006); Chairperson of the Insurance Sub-Committee of the Compliance and Insurance Committee (since February 2007); served as President and Chief Executive Officer of the Nuclear Energy Institute (policy organization) through November 2008; retired as Admiral, U.S. Navy in January 2005 after serving over 8 years as Director of the Naval Nuclear Propulsion Program and Deputy Administrator — Naval Reactors in the National Nuclear Security Administration at the U.S. Department of Energy (1996-2004); served as Chief of Naval Personnel (July 1994-September 1996); Knighted as Honorary Knight Commander of the Most Excellent Order of the British Empire; Awarded the Officer de l'Orde National du Mérite by the French Government; elected to the National Academy of Engineering (2009). | 102 | Director of BP p.l.c.; Director of Naval and Nuclear Technologies LLP; Director of Armed Services YMCA of the USA and the Naval Submarine League. | ||||||||||||||||||
103
Morgan Stanley Select Dimensions Investment Series
Trustee and Officer Information (unaudited) continued
| Name, Age and Address of Independent Trustee | Position(s) Held with Registrant | Term of Office and Length of Time Served* | Principal Occupation(s) During Past 5 Years | Number of Portfolios in Fund Complex Overseen by Independent Trustee** | Other Directorships Held by Independent Trustee*** | ||||||||||||||||||
| Michael Bozic (70) c/o Kramer Levin Naftalis & Frankel LLP Counsel to the Independent Trustees 1177 Avenue of the Americas New York, NY 10036 | Trustee | Since April 1994 | Private investor; Chairperson of the Compliance and Insurance Committee (since October 2006); Director or Trustee of the Retail Funds (since April 1994) and Institutional Funds (since July 2003); formerly, Chairperson of the Insurance Committee (July 2006-September 2006); Vice Chairman of Kmart Corporation (December 1998-October 2000), Chairman and Chief Executive Officer of Levitz Furniture Corporation (November 1995-November 1998) and President and Chief Executive Officer of Hills Department Stores (May 1991-July 1995); variously Chairman, Chief Executive Officer, President and Chief Operating Officer (1987-1991) of the Sears Merchandise Group of Sears, Roebuck & Co. | 104 | Director of various business organizations. | ||||||||||||||||||
| Kathleen A. Dennis (57) c/o Kramer Levin Naftalis & Frankel LLP Counsel to the Independent Trustees 1177 Avenue of the Americas New York, NY 10036 | Trustee | Since August 2006 | President, Cedarwood Associates (mutual fund and investment management consulting) (since July 2006); Chairperson of the Money Market and Alternatives Sub-Committee of the Investment Committee (since October 2006) and Director or Trustee of various Retail Funds and Institutional Funds (since August 2006); formerly, Senior Managing Director of Victory Capital Management (1993-2006). | 102 | Director of various non-profit organizations. | ||||||||||||||||||
104
Morgan Stanley Select Dimensions Investment Series
Trustee and Officer Information (unaudited) continued
| Name, Age and Address of Independent Trustee | Position(s) Held with Registrant | Term of Office and Length of Time Served* | Principal Occupation(s) During Past 5 Years | Number of Portfolios in Fund Complex Overseen by Independent Trustee** | Other Directorships Held by Independent Trustee*** | ||||||||||||||||||
| Dr. Manuel H. Johnson (62) c/o Johnson Smick Group, Inc. 888 16th Street, N.W. Suite 740 Washington, D.C. 20006 | Trustee | Since July 1991 | Senior Partner, Johnson Smick International, Inc. (consulting firm); Chairperson of the Investment Committee (since October 2006) and Director or Trustee of the Retail Funds (since July 1991) and Institutional Funds (since July 2003); Co-Chairman and a founder of the Group of Seven Council (G7C) (international economic commission); formerly, Chairperson of the Audit Committee (July 1991-September 2006), Vice Chairman of the Board of Governors of the Federal Reserve System and Assistant Secretary of the U.S. Treasury. | 104 | Director of NVR, Inc. (home construction); Director of Evergreen Energy; Director of Greenwich Capital Holdings. | ||||||||||||||||||
| Joseph J. Kearns (68) c/o Kearns & Associates LLC PMB754 23852 Pacific Coast Highway Malibu, CA 90265 | Trustee | Since August 1994 | President, Kearns & Associates LLC (investment consulting); Chairperson of the Audit Committee (since October 2006) and Director or Trustee of the Retail Funds (since July 2003) and Institutional Funds (since August 1994); formerly, Deputy Chairperson of the Audit Committee (July 2003-September 2006) and Chairperson of the Audit Committee of the Institutional Funds (October 2001-July 2003 and since August 1994 for certain predecessor Funds); CFO of the J. Paul Getty Trust. | 105 | Director of Electro Rent Corporation (equipment leasing) and The Ford Family Foundation. | ||||||||||||||||||
105
Morgan Stanley Select Dimensions Investment Series
Trustee and Officer Information (unaudited) continued
| Name, Age and Address of Independent Trustee | Position(s) Held with Registrant | Term of Office and Length of Time Served* | Principal Occupation(s) During Past 5 Years | Number of Portfolios in Fund Complex Overseen by Independent Trustee** | Other Directorships Held by Independent Trustee*** | ||||||||||||||||||
| Michael F. Klein (52) c/o Kramer Levin Naftalis & Frankel LLP Counsel to the Independent Trustees 1177 Avenue of the Americas New York, NY 10036 | Trustee | Since August 2006 | Managing Director, Aetos Capital, LLC (since March 2000) and Co-President, Aetos Alternatives Management, LLC (since January 2004); Chairperson of the Fixed Income Sub-Committee of the Investment Committee (since October 2006) and Director or Trustee of various Retail Funds and Institutional Funds (since August 2006); formerly, Managing Director, Morgan Stanley & Co. Inc. and Morgan Stanley Dean Witter Investment Management, President, Morgan Stanley Institutional Funds (June 1998-March 2000) and Principal, Morgan Stanley & Co. Inc. and Morgan Stanley Dean Witter Investment Management (August 1997-December 1999). | 102 | Director of certain investment funds managed or sponsored by Aetos Capital, LLC. Director of Sanitized AG and Sanitized Marketing AG (specialty chemicals). | ||||||||||||||||||
| Michael E. Nugent (74) c/o Triumph Capital, L.P. 445 Park Avenue New York, NY 10022 | Chairperson of the Board and Trustee | Chairperson of the Boards since July 2006 and Director since July 1991 | General Partner, Triumph Capital, L.P. (private investment partnership); Chairperson of the Boards of the Retail Funds and Institutional Funds (since July 2006); Director or Trustee of the Retail Funds (since July 1991) and Institutional Funds (since July 2001); formerly, Chairperson of the Insurance Committee (until July 2006). | 104 | None. | ||||||||||||||||||
| W. Allen Reed (63) c/o Kramer Levin Naftalis & Frankel LLP Counsel to the Independent Trustees 1177 Avenue of the Americas New York, NY 10036 | Trustee | Since August 2006 | Chairperson of the Equity Sub-Committee of the Investment Committee (since October 2006) and Director or Trustee of various Retail Funds and Institutional Funds (since August 2006); formerly, President and CEO of General Motors Asset Management; Chairman and Chief Executive Officer of the GM Trust Bank and Corporate Vice President of General Motors Corporation (August 1994-December 2005). | 102 | Director of Temple-Inland Industries (packaging and forest products); Director of Legg Mason, Inc. and Director of the Auburn University Foundation; formerly, Director of iShares, Inc. (2001-2006). | ||||||||||||||||||
106
Morgan Stanley Select Dimensions Investment Series
Trustee and Officer Information (unaudited) continued
| Name, Age and Address of Independent Trustee | Position(s) Held with Registrant | Term of Office and Length of Time Served* | Principal Occupation(s) During Past 5 Years | Number of Portfolios in Fund Complex Overseen by Independent Trustee** | Other Directorships Held by Independent Trustee | ||||||||||||||||||
| Fergus Reid (78) c/o Joe Pietryka, Inc. 85 Charles Colman Blvd. Pawling, NY 12564 | Trustee | Since June 1992 | Chairman, Joe Pietryka, Inc.; Chairperson of the Governance Committee and Director or Trustee of the Retail Funds (since July 2003) and Institutional Funds (since June 1992). | 105 | Trustee and Director of certain investment companies in the JPMorgan Funds complex managed by JP Morgan Investment Management Inc. | ||||||||||||||||||
Interested Trustee:
| Name, Age and Address of Interested Trustee | Position(s) Held with Registrant | Term of Office and Length of Time Served* | Principal Occupation(s) During Past 5 Years | Number of Portfolios in Fund Complex Overseen by Interested Trustee** | Other Directorships Held by Interested Trustee*** | ||||||||||||||||||
| James F. Higgins (63) c/o Morgan Stanley Services Company Inc. Harborside Financial Center 201 Plaza Two Jersey City, NJ 07311 | Trustee | Since June 2000 | Director or Trustee of the Retail Funds (since June 2000) and Institutional Funds (since July 2003); Senior Advisor of Morgan Stanley (since August 2000). | 103 | Director of AXA Financial, Inc. and The Equitable Life Assurance Society of the United States (financial services). | ||||||||||||||||||
* This is the earliest date the Trustee began serving the funds advised by Morgan Stanley Investment Advisors Inc. (the "Investment Adviser") (the "Retail Funds") or the funds advised by Morgan Stanley Investment Management Inc. and Morgan Stanley AIP GP LP (the "Institutional Funds").
** The Fund Complex includes all open-end and closed-end funds (including all of their portfolios) advised by the Investment Adviser (as of December 31, 2010) and any funds that have an investment adviser that is an affiliated person of the Investment Adviser (including, but not limited to, Morgan Stanley Investment Management Inc.).
*** This includes any directorships at public companies and registered investment companies held by the Trustee at any time during the past five years.
107
Morgan Stanley Select Dimensions Investment Series
Trustee and Officer Information (unaudited) continued
Executive Officers:
| Name, Age and Address of Executive Officer | Position(s) Held with Registrant | Term of Office and Length of Time Served* | Principal Occupation(s) During Past 5 Years | ||||||||||||
| Sara Furber (36) 522 Fifth Avenue New York, NY 10036 | President and Principal Executive Officer – Equity and Fixed Income Funds | Since September 2010 | President and Principal Executive Officer (since September 2010) of the Equity and Fixed Income Funds in the Fund Complex; Managing Director and Director of the Adviser and various entities affiliated with the Adviser (since July 2010). Formerly, Chief Operating Officer for Global Corporate and Investment Banking at Bank of America Merrill Lynch (January 2009 to April 2010); Head of Merrill Lynch & Co. Investor Relations (July 2007 to December 2008); with senior roles in Strategy and Business Development as well as within Merrill Lynch's Global Credit & Commitments organization prior to July 2007. | ||||||||||||
| Mary Ann Picciotto (37) c/o Morgan Stanley Services Company Inc. Harborside Financial Center 201 Plaza Two Jersey City, NJ 07311 | Chief Compliance Officer | Since May 2010 | Executive Director of the Investment Adviser and various entities affiliated with the Investment Adviser; Chief Compliance Officer of the Retail Funds and Institutional Funds (since May 2010); Chief Compliance Officer of the Investment and Morgan Stanley Investment Management Inc. (since April 2007). | ||||||||||||
| Stefanie V. Chang Yu (44) 522 Fifth Avenue New York, NY 10036 | Vice President | Since December 1997 | Managing Director of the Investment Adviser and various entities affiliated with the Investment Adviser; Vice President of the Retail Funds (since July 2002) and Institutional Funds (since December 1997). Formerly, Secretary of the Investment Adviser and various entities affiliated with the Investment Adviser. | ||||||||||||
| Francis J. Smith (45) c/o Morgan Stanley Services Company Inc. Harborside Financial Center 201 Plaza Two Jersey City, NJ 07311 | Treasurer and Principal Financial Officer | Treasurer since July 2003 and Principal Financial Officer since September 2002 | Executive Director of the Investment Adviser and various entities affiliated with the Investment Adviser; Treasurer and Principal Financial Officer of the Retail Funds (since July 2003) and Institutional Funds (since March 2010). | ||||||||||||
| Mary E. Mullin (43) 522 Fifth Avenue New York, NY 10036 | Secretary | Since June 1999 | Executive Director of the Investment Adviser and various entities affiliated with the Investment Adviser; Secretary of the Retail Funds (since July 2003) and Institutional Funds (since June 1999). | ||||||||||||
* This is the earliest date the Officer began serving the Retail Funds or Institutional Funds.
108
Morgan Stanley Select Dimensions Investment Series
Federal Tax Notice n December 31, 2010 (unaudited)
For Federal income tax purposes, the following information is furnished with respect to the distributions paid by each applicable Portfolio during the taxable year ended December 31, 2010. For corporate shareholders, the following percentages of dividends paid by each Portfolio qualified for the dividends received deduction. Additionally, the following percentages of each Portfolio's dividends was attributable to qualifying U.S. Government obligations. (Please consult your tax advisor to determine if any portion of the dividends you received is exempt from state income tax.)
| FUND | DIVIDENDS RECEIVED DEDUCTION % | QUALIFYING U.S. GOVT. INCOME % | |||||||||
| Capital Growth Portfolio | 0.00 | % | 0.00 | % | |||||||
| Capital Opportunities Portfolio | 0.00 | % | 0.00 | % | |||||||
| Flexible Income Portfolio | 0.00 | % | 9.50 | % | |||||||
| Focus Growth Portfolio | 100.00 | % | 0.00 | % | |||||||
| Global Infrastructure Portfolio | 22.06 | % | 0.00 | % | |||||||
| Mid Cap Growth Portfolio | 100.00 | % | 0.00 | % | |||||||
| Money Market Portfolio | 0.00 | % | 4.76 | % | |||||||
Each of the applicable Portfolios designated and paid the following amounts as a long-term capital gain distribution:
| FUND | AMOUNT | ||||||
| Global Infrastructure Portfolio | $ | 1,135,827 | |||||
| Money Market Portfolio | 184 | ||||||
For Federal income tax purposes, the following information is furnished with respect to the earnings of each applicable Portfolio for the taxable year ended December 31, 2010. The Global Infrastructure Portfolio intends to pass through foreign tax credits of $69,572 and has derived net income from sources within foreign countries amounting to $665,423.
109
(This page has been intentionally left blank.)
(This page has been intentionally left blank.)
(This page has been intentionally left blank.)
| Trustees | |||||||||||
| Frank L. Bowman | Joseph J. Kearns | ||||||||||
| Michael Bozic | Michael F. Klein | ||||||||||
| Kathleen A. Dennis | Michael E. Nugent | ||||||||||
| James F. Higgins | W. Allen Reed | ||||||||||
| Dr. Manuel H. Johnson | Fergus Reid | ||||||||||
| Officers | |||||||||||
| Michael E. Nugent Chairperson of the Board | |||||||||||
| Sara Furber President and Principal Executive Officer | |||||||||||
| Mary Ann Picciotto Chief Compliance Officer | |||||||||||
| Stefanie V. Chang Yu Vice President | |||||||||||
| Francis J. Smith Treasurer and Principal Financial Officer | |||||||||||
| Mary E. Mullin Secretary | |||||||||||
| Transfer Agent | Custodian | ||||||||||
| Morgan Stanley Services Company Inc. P.O. Box 219886 Kansas City, Missouri 64121-9886 | State Street Bank and Trust Co. One Lincoln Street Boston, Massachusetts 02111 | ||||||||||
| Independent Registered Public Accounting Firm | Legal Counsel | ||||||||||
| Deloitte & Touche LLP Two World Financial Center New York, New York 10281 | Dechert LLP 1095 Avenue of the Americas New York, New York 10036 | ||||||||||
| Counsel to the Independent Trustees | Investment Adviser | ||||||||||
| Kramer Levin Naftalis & Frankel LLP 1177 Avenue of the Americas New York, New York 10036 | Morgan Stanley Investment Advisors Inc. 522 Fifth Avenue New York, New York 10036 | ||||||||||
| Sub-Adviser (Global Infrastructure) | |||||||||||
| Morgan Stanley Investment Management Limited 25 Cabot Square, London, E14 4QA England | |||||||||||
| Morgan Stanley Investment Management Company 23 Church Street 16-01 Capital Square 049481 Singapore | |||||||||||
This report is submitted for the general information of shareholders of the Fund. For more detailed information about the Fund, its fees and expenses and other pertinent information, please read its Prospectus. The Fund's Statement of Additional Information contains additional information about the Fund, including its trustees. It is available without charge, by calling (800) 869-NEWS.
This report is not authorized for distribution to prospective investors in the Fund unless preceded or accompanied by an effective Prospectus. Read the Prospectus carefully before investing.
Morgan Stanley Distributors Inc., member FINRA.
#40474
SELDIMANN
IU11-00316P-Y12/10
Item 2. Code of Ethics.
(a) The Fund has adopted a code of ethics (the “Code of Ethics”) that applies to its principal executive officer, principal financial officer, principal accounting officer or controller, or persons performing similar functions, regardless of whether these individuals are employed by the Fund or a third party.
(b) No information need be disclosed pursuant to this paragraph.
(c) Not applicable.
(d) Not applicable.
(e) Not applicable.
(f)
(1) The Fund’s Code of Ethics is attached hereto as Exhibit 12 A.
(2) Not applicable.
(3) Not applicable.
Item 3. Audit Committee Financial Expert.
The Fund’s Board of Trustees has determined that Joseph J. Kearns, an “independent” Trustee, is an “audit committee financial expert” serving on its audit committee. Under applicable securities laws, a person who is determined to be an audit committee financial expert will not be deemed an “expert” for any purpose, including without limitation for the purposes of Section 11 of the Securities Act of 1933, as a result of being designated or identified as an audit committee financial expert. The designation or identification of a person as an audit committee financial expert does not impose on such person any duties, obligations, or liabilities that are greater than the duties, obligations, and liabilities imposed on such person as a member of the audit committee and Board of Trustees in the absence of such designation or identification
Item 4. Principal Accountant Fees and Services.
(a)(b)(c)(d) and (g). Based on fees billed for the periods shown:
2010
|
| Registrant |
| Covered Entities(1) |
| ||
Audit Fees |
| $ | 143,500 |
| N/A |
| |
|
|
|
|
|
| ||
Non-Audit Fees |
|
|
|
|
| ||
Audit-Related Fees |
| $ |
| (2) | $ | 6,501,000 | (2) |
Tax Fees |
| $ | 31,596 | (3) | $ | 1,350,000 | (4) |
All Other Fees |
| $ |
|
| $ |
|
|
Total Non-Audit Fees |
| $ | 31,596 |
| $ | 7,851,000 |
|
|
|
|
|
|
| ||
Total |
| $ | 175,096 |
| $ | 7,851,000 |
|
2009
|
| Registrant |
| Covered Entities(1) |
| ||
Audit Fees |
| $ | 207,200 |
| N/A |
| |
|
|
|
|
|
| ||
Non-Audit Fees |
|
|
|
|
| ||
Audit-Related Fees |
| $ | — | (2) | $ | 6,909,000 | (2) |
Tax Fees |
| $ | 42,660 | (3) | $ | 1,350,000 | (4) |
All Other Fees |
| $ |
|
| $ |
| (5) |
Total Non-Audit Fees |
| $ | 42,660 |
| $ | 7,922,000 |
|
|
|
|
|
|
| ||
Total |
| $ | 249,860 |
| $ | 7,922,000 |
|
N/A- Not applicable, as not required by Item 4.
(1) Covered Entities include the Adviser (excluding sub-advisors) and any entity controlling, controlled by or under common control with the Adviser that provides ongoing services to the Registrant.
(2) Audit-Related Fees represent assurance and related services provided that are reasonably related to the performance of the audit of the financial statements of the Covered Entities’ and funds advised by the Adviser or its affiliates, specifically data verification and agreed-upon procedures related to asset securitizations and agreed-upon procedures engagements.
(3) Tax Fees represent tax compliance, tax planning and tax advice services provided in connection with the preparation and review of the Registrant’s tax returns.
(4) Tax Fees represent tax compliance, tax planning and tax advice services provided in connection with the review of Covered Entities’ tax returns.
(5) All other fees represent project management for future business applications and improving business and operational processes.
(e)(1) The audit committee’s pre-approval policies and procedures are as follows:
APPENDIX A
AUDIT COMMITTEE
AUDIT AND NON-AUDIT SERVICES
PRE-APPROVAL POLICY AND PROCEDURES
OF THE
MORGAN STANLEY RETAIL AND INSTITUTIONAL FUNDS
AS ADOPTED AND AMENDED JULY 23, 2004,(1)
1. Statement of Principles
The Audit Committee of the Board is required to review and, in its sole discretion, pre-approve all Covered Services to be provided by the Independent Auditors to the Fund and Covered Entities in order to assure that services performed by the Independent Auditors do not impair the auditor’s independence from the Fund.
The SEC has issued rules specifying the types of services that an independent auditor may not provide to its audit client, as well as the audit committee’s administration of the engagement of the independent auditor. The SEC’s rules establish two different approaches to pre-approving services, which the SEC considers to be equally valid. Proposed services either: may be pre-approved without consideration of specific case-by-case services by the Audit Committee (“general pre-approval”); or require the specific pre-approval of the Audit Committee or its delegate (“specific pre-approval”). The Audit Committee believes that the combination of these two approaches in this Policy will result in an effective and efficient procedure to pre-approve services performed by the Independent Auditors. As set forth in this Policy, unless a type of service has received general pre-approval, it will require specific pre-approval by the Audit Committee (or by any member of the Audit Committee to which pre-approval authority has been delegated) if it is to be provided by the Independent Auditors. Any proposed services exceeding pre-approved cost levels or budgeted amounts will also require specific pre-approval by the Audit Committee.
The appendices to this Policy describe the Audit, Audit-related, Tax and All Other services that have the general pre-approval of the Audit Committee. The term of any general pre-approval is 12 months from the date of pre-approval, unless the Audit Committee considers and provides a different period and states otherwise. The Audit Committee will annually review and pre-approve the services that may be provided by the Independent Auditors without obtaining specific pre-approval from the Audit Committee. The Audit Committee will add to or subtract from the list of general pre-approved services from time to time, based on subsequent determinations.
(1) This Audit Committee Audit and Non-Audit Services Pre-Approval Policy and Procedures (the “Policy”), adopted as of the date above, supersedes and replaces all prior versions that may have been adopted from time to time.
The purpose of this Policy is to set forth the policy and procedures by which the Audit Committee intends to fulfill its responsibilities. It does not delegate the Audit Committee’s responsibilities to pre-approve services performed by the Independent Auditors to management.
The Fund’s Independent Auditors have reviewed this Policy and believes that implementation of the Policy will not adversely affect the Independent Auditors’ independence.
2. Delegation
As provided in the Act and the SEC’s rules, the Audit Committee may delegate either type of pre-approval authority to one or more of its members. The member to whom such authority is delegated must report, for informational purposes only, any pre-approval decisions to the Audit Committee at its next scheduled meeting.
3. Audit Services
The annual Audit services engagement terms and fees are subject to the specific pre-approval of the Audit Committee. Audit services include the annual financial statement audit and other procedures required to be performed by the Independent Auditors to be able to form an opinion on the Fund’s financial statements. These other procedures include information systems and procedural reviews and testing performed in order to understand and place reliance on the systems of internal control, and consultations relating to the audit. The Audit Committee will approve, if necessary, any changes in terms, conditions and fees resulting from changes in audit scope, Fund structure or other items.
In addition to the annual Audit services engagement approved by the Audit Committee, the Audit Committee may grant general pre-approval to other Audit services, which are those services that only the Independent Auditors reasonably can provide. Other Audit services may include statutory audits and services associated with SEC registration statements (on Forms N-1A, N-2, N-3, N-4, etc.), periodic reports and other documents filed with the SEC or other documents issued in connection with securities offerings.
The Audit Committee has pre-approved the Audit services in Appendix B.1. All other Audit services not listed in Appendix B.1 must be specifically pre-approved by the Audit Committee (or by any member of the Audit Committee to which pre-approval has been delegated).
4. Audit-related Services
Audit-related services are assurance and related services that are reasonably related to the performance of the audit or review of the Fund’s financial statements and, to the extent they are Covered Services, the Covered Entities or that are traditionally performed by the Independent Auditors. Because the Audit Committee believes that the provision of Audit-related services does not impair the independence of the auditor and is consistent with the SEC’s rules on auditor independence, the Audit Committee may grant general pre-approval to Audit-related services. Audit-related services include, among others, accounting consultations related to accounting, financial reporting or disclosure matters
not classified as “Audit services”; assistance with understanding and implementing new accounting and financial reporting guidance from rulemaking authorities; agreed-upon or expanded audit procedures related to accounting and/or billing records required to respond to or comply with financial, accounting or regulatory reporting matters; and assistance with internal control reporting requirements under Forms N-SAR and/or N-CSR.
The Audit Committee has pre-approved the Audit-related services in Appendix B.2. All other Audit-related services not listed in Appendix B.2 must be specifically pre-approved by the Audit Committee (or by any member of the Audit Committee to which pre-approval has been delegated).
5. Tax Services
The Audit Committee believes that the Independent Auditors can provide Tax services to the Fund and, to the extent they are Covered Services, the Covered Entities, such as tax compliance, tax planning and tax advice without impairing the auditor’s independence, and the SEC has stated that the Independent Auditors may provide such services.
Pursuant to the preceding paragraph, the Audit Committee has pre-approved the Tax Services in Appendix B.3. All Tax services in Appendix B.3 must be specifically pre-approved by the Audit Committee (or by any member of the Audit Committee to which pre-approval has been delegated).
6. All Other Services
The Audit Committee believes, based on the SEC’s rules prohibiting the Independent Auditors from providing specific non-audit services, that other types of non-audit services are permitted. Accordingly, the Audit Committee believes it may grant general pre-approval to those permissible non-audit services classified as All Other services that it believes are routine and recurring services, would not impair the independence of the auditor and are consistent with the SEC’s rules on auditor independence.
The Audit Committee has pre-approved the All Other services in Appendix B.4. Permissible All Other services not listed in Appendix B.4 must be specifically pre-approved by the Audit Committee (or by any member of the Audit Committee to which pre-approval has been delegated).
7. Pre-Approval Fee Levels or Budgeted Amounts
Pre-approval fee levels or budgeted amounts for all services to be provided by the Independent Auditors will be established annually by the Audit Committee. Any proposed services exceeding these levels or amounts will require specific pre-approval by the Audit Committee. The Audit Committee is mindful of the overall relationship of fees for audit and non-audit services in determining whether to pre-approve any such services.
8. Procedures
All requests or applications for services to be provided by the Independent Auditors that do not require specific approval by the Audit Committee will be submitted to the Fund’s Chief Financial Officer and must include a detailed description of the services to be
rendered. The Fund’s Chief Financial Officer will determine whether such services are included within the list of services that have received the general pre-approval of the Audit Committee. The Audit Committee will be informed on a timely basis of any such services rendered by the Independent Auditors. Requests or applications to provide services that require specific approval by the Audit Committee will be submitted to the Audit Committee by both the Independent Auditors and the Fund’s Chief Financial Officer, and must include a joint statement as to whether, in their view, the request or application is consistent with the SEC’s rules on auditor independence.
The Audit Committee has designated the Fund’s Chief Financial Officer to monitor the performance of all services provided by the Independent Auditors and to determine whether such services are in compliance with this Policy. The Fund’s Chief Financial Officer will report to the Audit Committee on a periodic basis on the results of its monitoring. Both the Fund’s Chief Financial Officer and management will immediately report to the chairman of the Audit Committee any breach of this Policy that comes to the attention of the Fund’s Chief Financial Officer or any member of management.
9. Additional Requirements
The Audit Committee has determined to take additional measures on an annual basis to meet its responsibility to oversee the work of the Independent Auditors and to assure the auditor’s independence from the Fund, such as reviewing a formal written statement from the Independent Auditors delineating all relationships between the Independent Auditors and the Fund, consistent with Independence Standards Board No. 1, and discussing with the Independent Auditors its methods and procedures for ensuring independence.
10. Covered Entities
Covered Entities include the Fund’s investment adviser(s) and any entity controlling, controlled by or under common control with the Fund’s investment adviser(s) that provides ongoing services to the Fund(s). Beginning with non-audit service contracts entered into on or after May 6, 2003, the Fund’s audit committee must pre-approve non-audit services provided not only to the Fund but also to the Covered Entities if the engagements relate directly to the operations and financial reporting of the Fund. This list of Covered Entities would include:
Morgan Stanley Retail Funds
Morgan Stanley Investment Advisors Inc.
Morgan Stanley & Co. Incorporated
Morgan Stanley DW Inc.
Morgan Stanley Investment Management Inc.
Morgan Stanley Investment Management Limited
Morgan Stanley Investment Management Private Limited
Morgan Stanley Asset & Investment Trust Management Co., Limited
Morgan Stanley Investment Management Company
Morgan Stanley Services Company, Inc.
Morgan Stanley Distributors Inc.
Morgan Stanley Trust FSB
Morgan Stanley Institutional Funds
Morgan Stanley Investment Management Inc.
Morgan Stanley Investment Advisors Inc.
Morgan Stanley Investment Management Limited
Morgan Stanley Investment Management Private Limited
Morgan Stanley Asset & Investment Trust Management Co., Limited
Morgan Stanley Investment Management Company
Morgan Stanley & Co. Incorporated
Morgan Stanley Distribution, Inc.
Morgan Stanley AIP GP LP
Morgan Stanley Alternative Investment Partners LP
(e)(2) Beginning with non-audit service contracts entered into on or after May 6, 2003, the audit committee also is required to pre-approve services to Covered Entities to the extent that the services are determined to have a direct impact on the operations or financial reporting of the Registrant. 100% of such services were pre-approved by the audit committee pursuant to the Audit Committee’s pre-approval policies and procedures (attached hereto).
(f) Not applicable.
(g) See table above.
(h) The audit committee of the Board of Trustees has considered whether the provision of services other than audit services performed by the auditors to the Registrant and Covered Entities is compatible with maintaining the auditors’ independence in performing audit services.
Item 5. Audit Committee of Listed Registrants.
(a) The Fund has a separately-designated standing audit committee established in accordance with Section 3(a)(58)(A) of the Exchange Act whose members are:
Joseph Kearns, Michael Nugent and Allen Reed.
(b) Not applicable.
Item 6. Schedule of Investments
(a) Refer to Item 1.
(b) Not applicable.
Item 7. Disclosure of Proxy Voting Policies and Procedures for Closed-End Management Investment Companies.
Applicable only to reports filed by closed-end funds.
Item 8. Portfolio Managers of Closed-End Management Investment Companies
Applicable only to reports filed by closed-end funds.
Item 9. Closed-End Fund Repurchases
Applicable only to reports filed by closed-end funds.
Item 10. Submission of Matters to a Vote of Security Holders
Not applicable.
Item 11. Controls and Procedures
(a) The Fund’s principal executive officer and principal financial officer have concluded that the Fund’s disclosure controls and procedures are sufficient to ensure that information required to be disclosed by the Fund in this Form N-CSR was recorded, processed, summarized and reported within the time periods specified in the Securities and Exchange Commission’s rules and forms, based upon such officers’ evaluation of these controls and procedures as of a date within 90 days of the filing date of the report.
(b) There were no changes in the registrant’s internal control over financial reporting that occurred during the second fiscal quarter of the period covered by this report that has materially affected, or is reasonably likely to materially affect, the registrant’s internal control over financial reporting.
Item 12. Exhibits
(a) The Code of Ethics for Principal Executive and Senior Financial Officers is attached hereto.
(b) A separate certification for each principal executive officer and principal financial officer of the registrant are attached hereto as part of EX-99.CERT.
SIGNATURES
Pursuant to the requirements of the Securities Exchange Act of 1934 and the Investment Company Act of 1940, the registrant has duly caused this report to be signed on its behalf by the undersigned, thereunto duly authorized.
Morgan Stanley Select Dimensions Investment Series
/s/ Sara Furber |
|
Sara Furber |
|
Principal Executive Officer |
|
February 17, 2011 |
|
Pursuant to the requirements of the Securities Exchange Act of 1934 and the Investment Company Act of 1940, this report has been signed by the following persons on behalf of the registrant and in the capacities and on the dates indicated.
/s/ Sara Furber |
|
Sara Furber |
|
Principal Executive Officer |
|
February 17, 2011 |
|
|
|
/s/ Francis Smith |
|
Francis Smith |
|
Principal Financial Officer |
|
February 17, 2011 |
|