UNITED STATES
SECURITIES AND EXCHANGE COMMISSION
Washington, D.C. 20549
FORM N-CSR
CERTIFIED SHAREHOLDER REPORT OF REGISTERED
MANAGEMENT INVESTMENT COMPANIES
Investment Company Act file number | 811-8748 |
|
Wanger Advisors Trust |
(Exact name of registrant as specified in charter) |
|
One Financial Center, Boston, Massachusetts | | 02111 |
(Address of principal executive offices) | | (Zip code) |
|
James R. Bordewick, Jr., Esq. Columbia Management Advisors, LLC One Financial Center Boston, MA 02111 |
(Name and address of agent for service) |
|
Registrant’s telephone number, including area code: | 1-617-426-3750 | |
|
Date of fiscal year end: | December 31, 2006 | |
|
Date of reporting period: | June 30, 2006 | |
| | | | | | | | |
Form N-CSR is to be used by management investment companies to file reports with the Commission not later than 10 days after the transmission to stockholders of any report that is required to be transmitted to stockholders under Rule 30e-1 under the Investment Company Act of 1940 (17 CFR 270.30e-1). The Commission may use the information provided on Form N-CSR in its regulatory, disclosure review, inspection, and policymaking roles.
A registrant is required to disclose the information specified by Form N-CSR, and the Commission will make this information public. A registrant is not required to respond to the collection of information contained in Form N-CSR unless the Form displays a currently valid Office of Management and Budget (“OMB”) control number. Please direct comments concerning the accuracy of the information collection burden estimate and any suggestions for reducing the burden to Secretary, Securities and Exchange Commission, 450 Fifth Street, NW, Washington, DC 20549-0609. The OMB has reviewed this collection of information under the clearance requirements of 44 U.S.C. § 3507.
Item 1. Reports to Stockholders
Wanger U.S. Smaller Companies
2006 Semiannual Report


Wanger U.S. Smaller Companies
2006 Semiannual Report
Table of Contents
| | 1 | | | Understanding Your Expenses | |
|
| | 2 | | | Understanding Our Investment Style | |
|
| | 4 | | | Performance Review | |
|
| | 6 | | | Statement of Investments | |
|
| | 13 | | | Statement of Assets and Liabilities | |
|
| | 13 | | | Statement of Operations | |
|
| | 14 | | | Statements of Changes in Net Assets | |
|
| | 15 | | | Financial Highlights | |
|
| | 16 | | | Notes to Financial Statements | |
|
| | 19 | | | Management Fee Evaluation of the Senior Officer | |
|
| | 24 | | | Board of Trustees and Management of Wanger Advisors Trust | |
|
Columbia Wanger Asset Management, L.P. ("Columbia WAM") is one of the leading global small-cap equity managers in the United States with more than 30 years of small- and mid-cap investment experience. Columbia WAM manages more than $30 billion in equities and is the investment adviser to Wanger U.S. Smaller Companies, Wanger International Small Cap, Wanger Select, Wanger International Select and the Columbia Acorn Family of Funds. Columbia Management Group, LLC ("Columbia Management") is the primary investment management division of Bank of America Corporation. Columbia Management entities furnish investment management services and advises institutional and mutual fund portfolios. Columbia WAM is an SEC-registered investment adviser and indirect, wholly owned subsidiary of Bank of America Corporation.
For more complete information about our funds, including the Columbia Acorn Funds, our fees, risks associated with investing, or expenses, call 1-888-4-WANGER for a prospectus. Read it carefully before you invest or send money. This report is not an offer of the shares of the Columbia Acorn Fund Family.
The discussion in the report of portfolio companies is for illustration only and is not a recommendation of individual stocks. The information is believed to be accurate, but the information and the views of the portfolio managers may change at any time without notice and the portfolio managers may alter a fund's portfolio holdings based on these views and the fund's circumstances at that time.
Wanger U.S. Smaller Companies 2006 Semiannual Report
Understanding Your Expenses
As a Fund shareholder, you incur two types of costs. There are transaction costs, which generally include sales charges on purchases and may include redemption or exchange fees. There are also ongoing costs, which generally include investment advisory and other Fund expenses. The information on this page is intended to help you understand your ongoing costs of investing in the Fund and to compare these costs with the ongoing costs of investing in other mutual funds.
Analyzing the Fund's expenses
To illustrate these ongoing costs, we have provided an example and calculated the expenses paid by investors in the Fund during the reporting period. The information in the following table is based on an initial investment of $1,000.00, which is invested at the beginning of the reporting period and held for the entire period. Expense information is calculated two ways and each method provides you with different information. The amount listed in the "actual" column is calculated using actual operating expenses and total return for the Fund. The amount listed in the "hypothetical" column assumes that the return each year is 5% before expenses and then applies the Fund's actual expense ratio for the period to the hypothetical return. You should not use the hypothetical account values and expenses to estimate either your actual account balance at the end of the period or the expenses you paid during the reporting period. See the "Co mpare with other funds" information for details on using the hypothetical data.
Estimating your actual expenses
To estimate the expenses that you paid over the period, first you will need your account balance at the end of the period.
1. Divide your ending account balance by $1,000.00. For example, if an account balance was $8,600.00 at the end of the period, the result would be 8.6.
2. In the section of the table below titled "Expenses paid during period," you will find a dollar amount in the column labeled "Actual." Multiply this amount by the result from step 1. Your answer is an estimate of the expenses you paid on your account during the period.
January 1, 2006 – June 30, 2006
| | | Account value at the
beginning of the period ($) | | Account value at the
end of the period ($) | | Expenses paid during
period ($) | | Fund's annualized
expense ratio (%)* | |
| | | Actual | | Hypothetical | | Actual | | Hypothetical | | Actual | | Hypothetical | | | |
Wanger U.S. Smaller
Companies | | | 1,000.00 | | | | 1,000.00 | | | | 1,019.98 | | | | 1,020.13 | | | | 4.71 | | | | 4.71 | | | | 0.94 | | |
*For the six months ended June 30, 2006.
Expenses paid during the period are equal to the Fund's annualized expense ratio, multiplied by the average account value over the period, then multiplied by the number of days in the Fund's most recent fiscal half-year and divided by 365.
It is important to note that the expense amounts shown in the table are meant to highlight only ongoing costs of investing in the Fund. As a shareholder of the Fund, you do not incur any transaction costs, such as sales charges, redemption or exchange fees. Expenses paid during the period do not include any insurance charges imposed by your insurance company's separate account. The hypothetical example provided is useful in comparing ongoing costs only and will not help you determine the relative total costs of owning different funds whose shareholders may incur transaction costs.
Compare with other funds
Since all mutual funds are required to include the same hypothetical calculations about expenses in shareholder reports, you can use this information to compare the ongoing cost of investing in the Fund with other funds. To do so, compare the 5% hypothetical example with the 5% hypothetical examples of other funds. As you compare hypothetical examples of other funds, it is important to note that hypothetical examples are meant to highlight the ongoing cost of investing in a fund and do not reflect any transactional costs, such as sales charges or redemption or exchange fees, that may be incurred by shareholders of other funds. Expenses paid during the period do not include any insurance charges imposed by your insurance company's separate accounts.
1
Wanger U.S. Smaller Companies 2006 Semiannual Report

Understanding Our Investment Style
Why Small and Mid Caps?
Our mission is simple: Invest in good quality, reasonably priced smaller companies that have growth potential and competitive advantages, and hold on to them. We like small companies because they are generally less complicated. Big companies typically have lots of divisions, while most small companies have one division. An added benefit is that sometimes these small companies are undiscovered, which may mean they are undervalued and a potentially good investment. Managers of small companies tend to focus on customers and are acutely aware of competitors. Small-cap stocks are often exciting businesses run by accessible managers, so in addition to the above virtues, they are fun for us to follow.
Though we like small-caps, we don't force sales of successful stocks simply because they appreciated beyond some arbitrary small-cap definition (other small-cap managers may sell at $2 billion capitalizations, for example). The funds we manage could not make strong gains if we simply sold due to size. We let our winners run.
While style classifications can be helpful, we are not style purists. For example, small-cap stocks have outperformed large caps for more than five years, and we think on average they are no longer cheap based on historical valuation. Our analysts have been finding more value among mid-cap names that have the same attributes we like in small caps.
Why Growth-at-a-Reasonable-Price?
At Columbia Wanger Asset Management, we define growth investing styles using the terms Hard Core Value, Growth-at-a-Reasonable-Price (GARP) and Momentum. These terms help define the different ways that an investor can look for returns.
Hard Core Value investors usually buy very cheap stocks, as measured by comparing the stock valuation to the underlying asset values. While this strategy works for a number of competitors who are very good at it, Hard Core Value is not for us. We believe that too often the stocks are very cheap because the underlying businesses are lousy. Successful investing in Hard Core Value largely depends on predicting (or hastening) events such as takeovers, spinouts or turnarounds. Until such an event occurs the stock may be a diminishing asset.
In implementing our Growth-at-a-Reasonable-Price style, our 21 analysts first search for good, growing businesses. We view what we do as investing in companies rather than stocks, and we try to analyze companies as if we were buying the whole business rather than just a fraction of ownership. We define "good, growing businesses" as companies that have sustainable competitive advantages, fine managements, growing markets, and opportunities for market-share gains. Once we've found a good business that has been growing, we follow the company closely and determine if it sells at what we believe is a "reasonable price."
A stock is at a reasonable price if it sells at (or hopefully below) what we believe is its true value. Most growth companies ("growth stock" is a misnomer) are valued by the market based on price-to-earnings (PE) ratios, and comparisons between growth companies are often based on PE-to-growth (PEG) ratios. While that approach makes theoretical sense, reported earnings are often poor measures of underlying economic profits. For example, the costs of employee stock options were not required to be an accounting expense until 2006, so underlying earnings of many companies were overstated. In other cases, companies may have higher free cash flows than suggested by reported earnings. We ask our analysts to look beyond reported earnings and adjust for many factors when using PE ratios or related dividend discount model valuations. Our analysts also use value discipline techniques, calculating potential sell-out or break-up values, whe n it is appropriate to do so.
Often we determine that the stock of a good business that has been growing is not selling at a reasonable price. In those cases we wait—and there have been times that we've waited for years. If valuation is borderline, we can purchase an initial small position and later increase the position or sell the stock depending on fundamentals or valuation. Valuation matters because it enables our shareholders to potentially benefit in two ways: (1) from growth of the underlying business and (2) from growth of a valuation multiplier, such as a PE ratio.
The remaining growth style definition is Momentum. Momentum players (I hesitate to say "investors") look for stocks that have been rising, along with fast earnings growth, and preferably earnings estimate increases. Many Momentum players completely ignore valuation. (Economists label luxury goods as those where demand rises when prices increase, so momentum players are the ultimate luxury goods buyers!) Because Momentum players buy at any price when earnings are good and often sell at any price when earnings are disappointing, we often like to sell our winners to them and sometimes buy their losers—at our dream prices. Momentum can work, especially in bubbles, but it's not for us. It's too far from our mission of investing in good businesses and targeting rational returns.
Just as individual stocks can graduate from small to mid to large caps, they can also move from Hard Core Value to Growth-at-a-Reasonable-Price and then to Momentum. We love to buy stocks in companies not yet recognized as growth businesses. If we can
2
Wanger U.S. Smaller Companies 2006 Semiannual Report
find good companies that we believe are mistakenly priced at Hard Core Value levels, even better. Often our best performing stocks were those that were undiscovered when we bought them, and as they grew, became investor favorites because of their strong business models. We are often challenged (in a good way) when stocks rise to Momentum valuations. The challenge then becomes when to sell. We try to resist significant selling unless we think fundamentals will deteriorate or valuations are entirely inappropriate vs. fundamentals.
Having a sensible investment style is very useful, but it is not enough for long-term success. Other factors, such as our process and the people who make up our investment team, will be discussed in future columns.


Charles P. McQuaid
President and Chief Investment Officer
Columbia Wanger Asset Management, L.P.
The views expressed in "Understanding Our Investment Style" are those of the author. These views are not guarantees of future performance and involve certain risks, uncertainties and assumptions that are difficult to predict so actual outcomes and results may differ significantly from the views expressed. These views are subject to change at any time based upon economic, market or other conditions and the respective parties disclaim any responsibility to update such views. These views may not be relied on as investment advice and, because investment decisions for a Wanger Advisors Fund are based on numerous factors, may not be relied on as an indication of trading intent on behalf of any particular Wanger Advisors Fund. References to specific company securities should not be construed as a recommendation or investment advice.
Mid- and small-cap stocks are often more volatile and less liquid than the stocks of larger companies. Small companies may have a shorter history of operations than larger companies and may have a less diversified product line, making them more susceptible to market pressure. Investments in foreign securities have special risks, including political or economic instability, higher costs, different regulations, accounting standards, trading practices and levels of information, and currency exchange rate fluctuations.
3
Wanger U.S. Smaller Companies 2006 Semiannual Report

Performance Review Wanger U.S. Smaller Companies

Robert A. Mohn
Portfolio Manager
Performance data quoted represents past performance and current performance may be lower or higher. Past performance is no guarantee of future results. The investment return and principal value will fluctuate so that shares, when redeemed, may be worth more or less than the original cost. For monthly performance updates call 1-888-4-WANGER.
Wanger U.S. Smaller Companies ended the six months up 2.00% (without insurance charges) vs. an 8.21% gain for the Russell 2000 Index. At the end of 2005, Fund returns were well ahead of the index, but market conditions so far in 2006 have provided a headwind to Fund performance. Historically, we have done well in strong markets coming up from the bottom. Alternately, we tend to lag when more speculative stocks spike up in a fully-valued market. That was the market condition the Fund faced going into 2006. The Fund was underrepresented in high-octane names, particularly in the technology and metals sectors and therefore did not get the full benefit of a first quarter surge in small caps. In the final three months of the period, small caps pulled back drastically and the Fund and index were both down over 4.50%.
Eight of the Fund's stocks received takeover offers during the six month period. Two stocks that were impacted, Serologicals and Western Gas Resources, were fairly sizeable positions in the Fund and contributed positively to Fund returns as the stocks bounced on the acquisition news. Serologicals, a producer of biological products and solutions, gained 59% for the six months. Western Gas Resources, a coal seam gas producer and processor, increased 27% year-to-date through June 30.
Other winners for the half year included FMC Technologies, up 57%. FMC makes deep-water oil and gas production systems and has been enjoying robust demand for its products as offshore drilling activity has increased. Genlyte Group, a maker of commercial lighting fixtures, gained 35% for the annual period thanks to improving demand for its product from commercial developers and strong earnings gains. Time Warner Telecom, a provider of fiber-optic data and telephone services, was up 50% for the six months as revenue growth accelerated. Crown Castle International, an owner of cellular communication towers, gained 28% for the half year. Its business has been booming as cellular phone companies grab for more wireless capacity in order to beam internet sites, TV shows and other fun stuff to your cell phone.
Other big percentage winners included Vaalco Energy, an oil and gas producer, up 130% for the half year on higher energy prices. While several Fund retail stocks faltered in the period, Christopher & Banks was the exception. Up 55% for the six months, Christopher & Banks experienced a turnaround as new merchandise was positively received and same-store sales flipped from negative to positive.
On the downside, Neurocrine Biosciences' stock collapsed when the FDA withheld full approval for the high dosage of its sleep medication Indiplon. We sold out of the stock, taking a 65% loss for the six months. Interestingly enough, Neurocrine stock fell an additional 50% after we got out. As mentioned, several retail names were down in the Fund. Chico's FAS, a women's specialty retailer, fell 41% in the half year as new merchandise failed to move and sales came in short. Oxford Industries, a maker of branded and private label apparel, fell 28% for the six months on disappointing sales in its menswear lines.
Two technology names, Avid Technology and CNET Networks also hurt Fund performance. Avid suffered indigestion from an acquisition it made last year and announced delays in new product upgrades. The stock was off 40% for the six months. CNET Networks, a provider of software product reviews and niche technology websites, was off 46% for the half year. CNET's business is driven by new product launches, and two highly anticipated product launches, Microsoft's Vista and Sony's PlayStation 3, were tardy.
The second quarter's pull back in small-cap stocks allowed us to add to positions in fast-growing stocks whose prices fell within our valuation criteria. We continue to take advantage of the many opportunities today's volatile markets offer.
Wanger U.S. Smaller Companies is a diversified fund that invests primarily in the stocks of small- and medium-size U.S. companies. Small-cap stocks are often more volatile and less liquid than the stocks of larger companies. Small companies may have a shorter history of operations than larger companies and may have a less diversified product line, making them more susceptible to market pressure.
As of 6/30/06, the Fund's positions in the stocks mentioned were: Serologicals, 0.9%; Western Gas Resources, 1.1%; FMC Technologies, 2.0%; Genlyte Group, 2.0%; Time Warner Telecom, 1.2%; Crown Castle International, 1.1%; Vaalco Energy, 0.3%; Christopher & Banks, 0.7%; Neurocrine Biosciences, 0.0%; Chico's FAS, 0.7%; Oxford Industries, 1.0%; Avid Technology, 1.8%; CNET Networks, 0.7%.
See next page for index definitions.
4
Wanger U.S. Smaller Companies 2006 Semiannual Report
Growth of a $10,000 Investment in
Wanger U.S. Smaller Companies
Total return for each period,
May 3, 1995 (inception date) through June 30, 2006
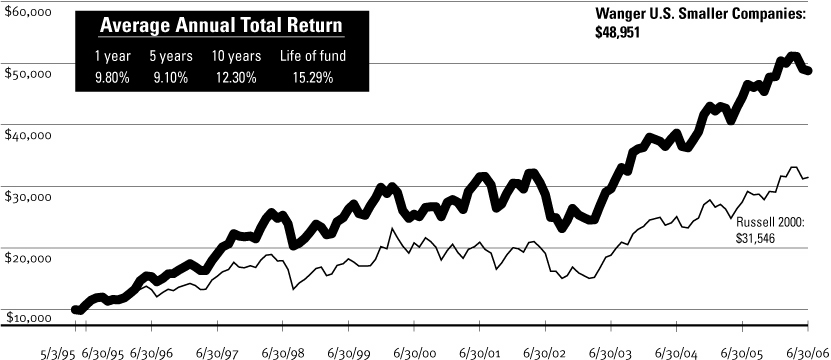
This graph compares the results of $10,000 invested in Wanger U.S. Smaller Companies on May 3, 1995 (the date the Fund began operations) through June 30, 2006, with the Russell 2000. Dividends and capital gains are reinvested. Performance shown here is past performance, which cannot guarantee future results. Current performance may be higher or lower. The investment return and principal value of an investment in the Fund will fluctuate so that Fund shares, when redeemed, may be worth more or less than their original cost. Performance changes over time. Current returns for the Fund may be different than that shown. For monthly performance updates, please contact us at 1-888-4-WANGER.
Results as of June 30, 2006
| | | 2nd quarter | | Year-to-date | | 1 year | |
Wanger U.S. Smaller
Companies | | | -4.58 | % | | | 2.00 | % | | | 9.80 | % | |
| Russell 2000 | | | -5.02 | | | | 8.21 | | | | 14.58 | | |
| S&P MidCap 400 | | | -3.14 | | | | 4.24 | | | | 12.98 | | |
| S&P 500 | | | -1.44 | | | | 2.71 | | | | 8.63 | | |
NAV as of 6/30/06: $34.38
Performance numbers reflect all Fund expenses but do not include any insurance charge imposed by your insurance company's separate accounts. If performance included the effect of these additional charges, it would be lower.
Due to ongoing market volatility, performance is subject to substantial short-term fluctuations.
The Russell 2000 Index is formed by taking the 3,000 largest U.S. companies and then eliminating the largest 1,000, leaving a mainly small company index. The S&P MidCap 400 is a market value-weighted index of 400 U.S. stocks that are in the next tier down from the S&P 500. The S&P 500 is a broad market-weighted average of blue-chip U.S. companies. All indexes are unmanaged and include reinvested dividends. It is not possible to invest directly in an index.
Portfolio characteristics and holdings are subject to change periodically and may not be representative of current characteristics and holdings.
Top 5 Industries
As a % of net assets, as of 6/30/06
| Information | | | 29.6 | % | |
| Consumer Goods & Services | | | 18.3 | | |
| Industrial Goods | | | 11.9 | | |
| Energy/Minerals | | | 11.6 | | |
| Health Care | | | 10.6 | | |
Top 10 Holdings
As a % of net assets, as of 6/30/06
1. ITT Educational Services
Post-secondary Degree Programs | | 3.9%
| |
2. FMC Technologies
Oil & Gas Well Head Manufacturer | | 2.0
| |
3. Genlyte Group
Commercial Lighting Fixtures | | 2.0
| |
4. Lincare Holdings
Home Health Care Services | | 2.0
| |
5. AmeriCredit
Auto Lending | | 1.9
| |
6. Avid Technology
Digital Nonlinear Editing Software & Systems | | 1.8
| |
7. Alltel
Cellular & Wireline Telephone Services | | 1.7
| |
8. Esco Technologies
Automatic Electric Meter Readers | | 1.6
| |
9. Global Payments
Credit Card Processor | | 1.5
| |
10. Tellabs
Telecommunications Equipment | | 1.5
| |
5
Wanger U.S. Smaller Companies 2006 Semiannual Report
Wanger U.S. Smaller Companies
Statement of Investments (Unaudited) June 30, 2006
Number of
Shares | | | | Value | |
| | | Common Stocks – 91.2% | | | | | |
| | | Information Group – 29.6% | |
| | | Business Software – 7.8% | |
874,900
| | Avid Technology (b)
Digital Nonlinear Editing Software & Systems | | | $29,160,417
| | |
668,437
| | Kronos (b)
Labor Management Solutions | | | 24,204,104
| | |
535,800
| | Micros Systems (b)
Information Systems for Restaurants & Hotels | | | 23,403,744
| | |
2,280,000
| | Novell (b)
Directory, Operating System & Identity
Management Software | | | 15,116,400
| | |
580,000
| | JDA Software Group (b)
Application/Software & Services for Retailers | | | 8,137,400
| | |
330,800
| | SSA Global Technologies (b)
Enterprise Resource Planning Software | | | 6,410,904
| | |
304,000
| | Concur Technologies (b)
Web Enabled Cost & Expense Management Software | | | 4,702,880
| | |
192,000
| | Progress Software (b)
Application Development Software | | | 4,494,720
| | |
327,200
| | Parametric Technology (b)
Engineering Software & Services | | | 4,158,712
| | |
279,100
| | webMethods (b)
Enterprise Applications Integration Tools | | | 2,754,717
| | |
820,000
| | Indus International (b)
Enterprise Asset Management Software | | | 2,345,200
| | |
51,300
| | MRO Software (b)
Enterprise Maintenance Software | | | 1,029,591
| | |
47,400
| | Witness Systems (b)
Customer Experience Management Software | | | 956,058
| | |
| | | | | | 126,874,847 | | |
| | | Mobile Communications – 5.0% | |
435,192
| | Alltel
Cellular & Wireline Telephone Services | | | 27,778,305
| | |
640,000
| | American Tower (b)
Communications Towers in USA & Mexico | | | 19,916,800
| | |
495,000
| | Crown Castle International (b)
Communications Towers | | | 17,097,300
| | |
2,033,000
| | Dobson Communications (b)
Rural & Small City Cellular Telephone Services | | | 15,715,090
| | |
100,000
| | Openwave Systems (b)
Internet Software for Mobile Devices | | | 1,154,000
| | |
| | | | | | 81,661,495 | | |
Number of
Shares | | | | Value | |
| | | Financial Processors – 2.5% | |
516,880
| | Global Payments (b)
Credit Card Processor | | | $25,094,524
| | |
321,000
| | SEI Investments
Mutual Fund Administration & Investment Management | | | 15,690,480
| | |
| | | | | | 40,785,004 | | |
| | | Computer Hardware and Related
Equipment – 2.4% | |
1,155,000
| | Symbol Technologies
Mobile Computers & Barcode Scanners | | | 12,462,450
| | |
122,800
| | Amphenol
Electronic Connectors | | | 6,871,888
| | |
206,400
| | Nice Systems (Israel) (b)
Audio & Video Recording Solutions | | | 5,808,096
| | |
81,600
| | Rogers (b)
PCB Laminates & High-performance Foams | | | 4,597,344
| | |
415,800
| | Seachange International (b)
Systems for Video On Demand & Ad Insertion | | | 2,893,968
| | |
120,000
| | Intermec (b)
Bar Code & Wireless LAN Systems | | | 2,752,800
| | |
90,000
| | Netgear (b)
Networking Products for Small Business & Home | | | 1,948,500
| | |
50,000
| | Avocent (b)
Computer Control Switches | | | 1,312,500
| | |
301,205
| | SensAble Technologies Series C Pfd. (b) (c)
Sensory Devices for Computer Based Sculpting | | | 3
| | |
1,581,292
| | SensAble Technologies (b) (c)
Sensory Devices for Computer Based Sculpting | | | 16
| | |
| | | | | | 38,647,565 | | |
| | | Business Information and Marketing
Services – 1.7% | |
485,000
| | Ceridian (b)
HR Services & Payment Processing | | | 11,853,400
| | |
443,200
| | Navigant Consulting (b)
Financial Consulting Firm | | | 10,038,480
| | |
65,000
| | Getty Images (b)
Photographs for Publications & Electronic Media | | | 4,128,150
| | |
170,000
| | InfoUSA (b)
Business Data for Sales Leads | | | 1,752,700
| | |
| | | | | | 27,772,730 | | |
See accompanying notes to financial statements.
6
Wanger U.S. Smaller Companies 2006 Semiannual Report
Wanger U.S. Smaller Companies
Statement of Investments (Unaudited) June 30, 2006
Number of
Shares | | | | Value | |
| | | Telecommunications Equipment – 1.7% | |
1,830,000
| | Tellabs (b)
Telecommunications Equipment | | | $24,357,300
| | |
210,000
| | Andrew (b)
Wireless Infrastructure Equipment | | | 1,860,600
| | |
100,000
| | Symmetricom (b)
Network Timing & Synchronization Devices | | | 707,000
| | |
| | | | | | 26,924,900 | | |
| | | Internet Related – 1.3% | |
1,420,000
| | CNET Networks (b)
Internet Advertising on Niche Websites | | | 11,331,600
| | |
530,000
| | Valueclick (b)
Internet Advertising | | | 8,135,500
| | |
310,000
| | SkillSoft (b)
Web-based Learning Solutions (E-Learning) | | | 1,897,200
| | |
| | | | | | 21,364,300 | | |
| | | Telephone Services – 1.3% | |
1,291,000
| | Time Warner Telecom (b)
Fiber Optic Telephone/Data Service Provider | | | 19,171,350
| | |
65,000
| | Commonwealth Telephone
Rural Phone Franchises & Competing Telco | | | 2,155,400
| | |
| | | | | | 21,326,750 | | |
| | | Semiconductors and Related Equipment – 1.1% | |
615,500
| | Integrated Device Technology (b)
Communications Semiconductors | | | 8,727,790
| | |
670,000
| | Entegris (b)
Semiconductor Wafer Shipping & Handling Products | | | 6,385,100
| | |
70,000
| | Littelfuse (b)
Little Fuses | | | 2,406,600
| | |
125,900
| | IXYS (b)
Power Semiconductors | | | 1,208,640
| | |
| | | | | | 18,728,130 | | |
| | | CATV – 1.0% | |
740,000
| | Discovery Holding (b)
CATV Programming | | | 10,826,200
| | |
1,780,000
| | Gemstar-TV Guide International (b)
TV Program Guides & CATV Programming | | | 6,265,600
| | |
| | | | | | 17,091,800 | | |
Number of
Shares | | | | Value | |
| | | Instrumentation – 0.9% | |
145,000
| | Mettler Toledo International (b)
Laboratory Equipment | | | $8,782,650
| | |
125,000
| | Trimble Navigation (b)
GPS-based Instruments | | | 5,580,000
| | |
| | | | | | 14,362,650 | | |
| | | Radio – 0.8% | |
561,900
| | Salem Communications (b)
Radio Stations for Religious Programming | | | 7,310,319
| | |
260,000
| | Cumulus Media (b)
Radio Stations in Small Cities | | | 2,774,200
| | |
515,000
| | Spanish Broadcasting System (b)
Spanish Language Radio Stations | | | 2,631,650
| | |
| | | | | | 12,716,169 | | |
| | | TV Broadcasting – 0.6% | |
1,030,000
| | Entravision Communications (b)
Spanish Language TV, Radio & Outdoor | | | 8,827,100
| | |
138,500
| | Gray Television
Mid Market Affiliated TV Stations | | | 801,915
| | |
| | | | | | 9,629,015 | | |
| | | Computer Services – 0.5% | |
753,000
| | RCM Technologies (b)(d)
Technology & Engineering Services | | | 3,780,060
| | |
705,500
| | Answerthink (b)
IT Integration & Best Practice Research | | | 2,843,165
| | |
45,000
| | SRA International (b)
Government IT Services | | | 1,198,350
| | |
| | | | | | 7,821,575 | | |
| | | Gaming Equipment – 0.4% | |
205,000
| | Bally Technologies (b)
Slot Machines & Software | | | 3,376,350
| | |
98,500
| | Shuffle Master (b)
Card Shufflers & Casino Games | | | 3,228,830
| | |
| | | | | | 6,605,180 | | |
| | | Contract Manufacturing – 0.4% | |
176,000
| | Plexus (b)
Electronic Manufacturing Services | | | 6,020,960
| | |
See accompanying notes to financial statements.
7
Wanger U.S. Smaller Companies 2006 Semiannual Report
Wanger U.S. Smaller Companies
Statement of Investments (Unaudited) June 30, 2006
Number of
Shares | | | | Value | |
| | | Television Programming – 0.2% | |
460,000
| | Lions Gate Entertainment (b)
Film & TV Studio | | | $3,933,000
| | |
| | | Publishing – 0.0% | |
13,850
| | Triple Crown Media (b)
Newspapers, Paging & Collegiate Sports Marketing | | | 120,080
| | |
| | | | | Information Group – Total | | | 482,386,150 | | |
| | | Consumer Goods & Services – 18.3% | |
| | | Retail – 6.4% | |
431,000
| | Abercrombie & Fitch
Teen Apparel Retailer | | | 23,890,330 |
| |
635,000
| | Petco Animal Supplies (b)
Pet Supplies & Services | | | 12,973,050 |
| |
450,000
| | Chico's FAS (b)
Women's Specialty Retail | | | 12,141,000 |
| |
409,150
| | Christopher & Banks
Women's Apparel Retailer | | | 11,865,350 |
| |
265,000
| | AnnTaylor Stores (b)
Women's Apparel Retailer | | | 11,495,700 |
| |
190,000
| | Michaels Stores
Craft & Hobby Specialty Retailer | | | 7,835,600 |
| |
390,000
| | Urban Outfitters (b)
Apparel & Home Specialty Retailer | | | 6,821,100 |
| |
163,000
| | Genesco (b)
Multi-concept Branded Footwear Retailer | | | 5,520,810 |
| |
125,000
| | J Crew Group (b)
Multi-channel Branded Retailer | | | 3,431,250 |
| |
445,000
| | Restoration Hardware (b)
Home Furnishing Retailer | | | 3,195,100 |
| |
110,000
| | Aeropostale (b)
Mall-based Teen Retailer | | | 3,177,900 |
| |
150,000
| | Gaiam (b)
Healthy Living Catalogs & E-Commerce | | | 2,103,000 |
| |
| | | | | | | | 104,450,190 | | |
| | | Other Consumer Services – 4.7% | |
972,000
| | ITT Educational Services (b)
Post-secondary Degree Programs | | | 63,967,320 |
| |
426,500
| | Central Parking
Owner, Operator, Manager of Parking Lots & Garages | | | 6,824,000 |
| |
Number of
Shares | | | | Value | |
| | | Other Consumer Services – 4.7% (continued) | |
| | 150,000 | | | Weight Watchers International
Weight Loss Programs | | | $6,133,500
| | |
| | | | | | | | 76,924,820 | | |
| | | Apparel – 2.6% | |
| | 394,200 | | | Oxford Industries
Branded & Private Label Apparel | | | 15,535,422
| | |
| | 459,000
| | | Coach (b)
Designer & Retailer of Branded Leather Accessories | | | 13,724,100
| | |
| | 480,200
| | | Carter's (b)
Children's Branded Apparel | | | 12,691,686
| | |
| | | | | | | | 41,951,208 | | |
| | | Leisure Products – 2.2% | |
| | 366,300 | | | International Speedway
Largest Motorsports Racetrack Owner & Operator | | | 16,985,331
| | |
| | 248,200
| | | Speedway Motorsports
Motorsport Racetrack Owner & Operator | | | 9,367,068
| | |
| | 390,000
| | | Callaway Golf
Premium Golf Clubs & Balls | | | 5,066,100
| | |
| | 106,000
| | | Polaris Industries
Leisure Vehicles & Related Products | | | 4,589,800
| | |
| | | | | | | | 36,008,299 | | |
| | | Nondurables – 0.8% | |
| | 288,000
| | | Scotts Miracle-Gro
Consumer Lawn & Garden Products | | | 12,188,160
| | |
| | 100,000
| | | Prestige Brands Holdings (b)
OTC, Household & Personal Care Products | | | 997,000
| | |
| | | | | | | | 13,185,160 | | |
| | | Furniture and Textiles – 0.8% | |
| | 130,000
| | | HNI
Office Furniture & Fireplaces | | | 5,895,500
| | |
| | 152,000
| | | Herman Miller
Office Furniture | | | 3,917,040
| | |
| | 33,000
| | | Mohawk Industries (b)
Carpet & Flooring | | | 2,321,550
| | |
| | | | | | | | 12,134,090 | | |
| | | Restaurants – 0.4% | |
| | 337,500
| | | Sonic (b)
Quick Service Restaurant | | | 7,016,625
| | |
See accompanying notes to financial statements.
8
Wanger U.S. Smaller Companies 2006 Semiannual Report
Wanger U.S. Smaller Companies
Statement of Investments (Unaudited) June 30, 2006
Number of
Shares | | | | Value | |
| | | Travel – 0.3% | |
38,200
| | Kerzner International (Bahamas) (b)
Destination Resorts & Casinos | | | $3,028,496
| | |
45,000
| | Vail Resorts (b)
Ski Resort Operator & Developer | | | 1,669,500
| | |
| | | | | | 4,697,996 | | |
| | | Other Durable Goods – 0.1% | |
40,000
| | Cavco Industries (b)
Higher End Manufactured Homes | | | 1,777,600
| | |
| | | Consumer Goods & Services – Total | | | 298,145,988 | | |
| | | Industrial Goods – 11.9% | |
| | | Machinery – 6.1% | |
492,300
| | Esco Technologies (b)
Automatic Electric Meter Readers | | | 26,313,435
| | |
690,600
| | Pentair
Pumps, Water Treatment & Tools | | | 23,611,614
| | |
365,100
| | Nordson
Dispensing Systems for Adhesives & Coatings | | | 17,955,618
| | |
275,000
| | Ametek
Aerospace/Industrial Instruments | | | 13,029,500
| | |
177,300
| | Donaldson
Industrial Air Filtration | | | 6,005,151
| | |
196,000
| | Clarcor
Mobile & Industrial Filters | | | 5,838,840
| | |
189,900
| | K&F Industries Holdings (b)
Aircraft Wheels, Brakes & Fuel Tank Bladders | | | 3,366,927
| | |
132,000
| | Goodman Global (b)
HVAC Equipment Manufacturer | | | 2,003,760
| | |
50,000
| | Kaydon
Specialized Friction & Motion Control Products | | | 1,865,500
| | |
| | | | | | 99,990,345 | | |
| | | Electrical Components – 2.0% | |
453,000
| | Genlyte Group (b)
Commercial Lighting Fixtures | | | 32,810,790
| | |
| | | Construction – 0.8% | |
191,400
| | Florida Rock Industries
Aggregates & Concrete | | | 9,506,838
| | |
35,000
| | Martin Marietta Materials
Aggregates | | | 3,190,250
| | |
| | | | | | 12,697,088 | | |
Number of
Shares | | | | Value | |
| | | Industrial Distribution – 0.6% | |
100,000
| | Aviall (b)
Aircraft Replacement Parts Distributor | | | $4,752,000
| | |
113,000
| | NuCo2 (b)
Bulk Co2 Gas Distribution to Restaurants | | | 2,716,520
| | |
50,000
| | Airgas
Industrial Gas Distributor | | | 1,862,500
| | |
| | | | | | 9,331,020 | | |
| | | Specialty Chemicals – 0.6% | |
407,500
| | Spartech
Plastics Distribution & Compounding | | | 9,209,500
| | |
| | | Outsourcing Services (other than ECM) – 0.5% | |
450,000
| | Quanta Services (b)
Electrical & Telecom Construction Services | | | 7,798,500
| | |
| | | Industrial Materials – 0.5% | |
191,300
| | Mine Safety Appliances
Safety Equipment | | | 7,690,260
| | |
| | | Other Industrial Services – 0.4% | |
130,000
| | Forward Air
Freight Transportation Between Airports | | | 5,294,900
| | |
63,000
| | UTI Worldwide
Global Logistics & Freight Forwarding | | | 1,589,490
| | |
| | | | | | 6,884,390 | | |
| | | Waste Management – 0.3% | |
122,800
| | Waste Connections (b)
Solid Waste Management | | | 4,469,920
| | |
| | | Steel – 0.1% | |
75,000
| | Gibraltar Industries
Steel Processing | | | 2,175,000
| | |
| | | Industrial Goods – Total | | | 193,056,813 | | |
| | | Energy/Minerals – 11.6% | |
| | | Oil Services – 6.5% | |
490,700
| | FMC Technologies (b)
Oil & Gas Well Head Manufacturer | | | 33,102,622
| | |
965,000
| | Chicago Bridge & Iron
Engineering & Construction
for Petrochemicals & LNG | | | 23,304,750
| | |
See accompanying notes to financial statements.
9
Wanger U.S. Smaller Companies 2006 Semiannual Report
Wanger U.S. Smaller Companies
Statement of Investments (Unaudited) June 30, 2006
Number of
Shares | | | | Value | |
| | | Oil Services – 6.5% (cont) | |
580,000
| | Pride International (b)
Offshore Drilling Contractor | | | $18,113,400
| | |
625,000
| | Hanover Compressor (b)
Natural Gas Compressor Rental & Fabrication | | | 11,737,500
| | |
142,500
| | CARBO Ceramics
Natural Gas Well Stimulants | | | 7,001,025
| | |
112,000
| | Atwood Oceanics (b)
Contract Drilling | | | 5,555,200
| | |
205,000
| | Key Energy Services (b)
Well Worker Services | | | 3,126,250
| | |
457,900
| | Newpark Resources (b)
Drilling Fluid Services | | | 2,816,085
| | |
11,000
| | Helmerich & Payne
Contract Driller | | | 662,860
| | |
| | | | | | 105,419,692 | | |
| | | Oil and Gas Producers – 4.6% | |
400,000
| | Ultra Petroleum (b)
Natural Gas Producer | | | 23,708,000
| | |
296,000
| | Western Gas Resources
Oil & Coal Seam Gas Producer | | | 17,715,600
| | |
416,000
| | Equitable Resources
Natural Gas Producer & Utility | | | 13,936,000
| | |
195,000
| | Quicksilver Resources (b)
Natural Gas & Coal Seam Gas Producer | | | 7,177,950
| | |
193,600
| | Southwestern Energy (b)
Natural Gas Producer | | | 6,032,576
| | |
450,000
| | Vaalco Energy (b)
Oil & Gas Producer | | | 4,392,000
| | |
71,500
| | McMoRan Exploration (b)
Natural Gas Producer & Developer | | | 1,258,400
| | |
| | | | | | 74,220,526 | | |
| | | Oil Refining/Marketing/Distribution – 0.5% | |
185,000
| | Atmos Energy
Dallas Natural Gas Utility | | | 5,163,350
| | |
94,000
| | Oneok
Natural Gas Distribution Pipeline,
Processing & Trading | | | 3,199,760
| | |
| | | | | | 8,363,110 | | |
| | | Energy/Minerals – Total | | | 188,003,328 | | |
Number of
Shares | | | | Value | |
| | | Health Care – 10.6% | |
| | | Health Care Services – 4.4% | |
866,000
| | Lincare Holdings (b)
Home Health Care Services | | | $32,769,440
| | |
258,709
| | Coventry Health Care (b)
HMO | | | 14,213,472
| | |
180,000
| | LCA-Vision
Lasik Surgery Centers | | | 9,523,800
| | |
170,000
| | Charles River Laboratories (b)
Pharmaceutical Research | | | 6,256,000
| | |
205,000
| | United Surgical Partners (b)
Outpatient Surgery Center | | | 6,164,350
| | |
175,000
| | PRA International (b)
Contract Research Organization | | | 3,897,250
| | |
| | | | | | 72,824,312 | | |
| | | Medical Equipment – 2.9% | |
412,000
| | Edwards Lifesciences (b)
Heart Valves | | | 18,717,159
| | |
137,227
| | Advanced Medical Optics (b)
Medical Devices for Eye Care | | | 6,957,409
| | |
190,000
| | Arrow International
Disposable Catheters | | | 6,245,300
| | |
105,000
| | Vital Signs
Anesthesia, Respiratory & Sleep Products | | | 5,200,650
| | |
188,175
| | Intermagnetics General (b)
MRI Equipment Manufacturer | | | 5,076,962
| | |
93,500
| | Orthofix International (b)
Bone Fixation & Stimulation Devices | | | 3,565,155
| | |
75,000
| | PSS World Medical (b)
Medical Supplies Distributor | | | 1,323,750
| | |
| | | | | | 47,086,385 | | |
| | | Hospital/Laboratory Supplies – 2.3% | |
466,000
| | Serologicals (b)
Biomanufacturing & Life Science Research | | | 14,651,040
| | |
235,700
| | ICU Medical (b)
Intravenous Therapy Products | | | 9,955,968
| | |
157,300
| | Diagnostic Products
Immunodiagnostic Kits | | | 9,150,141
| | |
70,700
| | Techne (b)
Cytokines, Antibodies, Other Reagents for Life Sciences | | | 3,600,044
| | |
| | | | | | 37,357,193 | | |
See accompanying notes to financial statements.
10
Wanger U.S. Smaller Companies 2006 Semiannual Report
Wanger U.S. Smaller Companies
Statement of Investments (Unaudited) June 30, 2006
Number of
Shares | | | | Value | |
| | | Biotechnology/Drug Delivery – 1.0% | |
270,000
| | Nektar Therapeutics (b)
Drug Delivery Technologies | | | $4,951,800
| | |
293,000
| | Intermune (b)
Drugs for Hepatitis C, Pulmonary Fibrosis & Cancer | | | 4,819,850
| | |
372,500
| | Ligand Pharmaceuticals (b)
Drugs for Pain, Cancer, Osteoporosis, Diabetes | | | 3,147,625
| | |
315,000
| | Decode genetics (b)
Drugs for Heart Attack, Asthma & Vascular Disease | | | 1,949,850
| | |
50,000
| | Momenta Pharmaceuticals (b)
Sugar Analysis Technology for Drug Design | | | 635,500
| | |
250,000
| | Locus Discovery, Series D Pfd. (c)
High Throughput Rational Drug Design | | | 68,250
| | |
| | | | | | 15,572,875 | | |
| | | Health Care – Total | | | 172,840,765 | | |
| | | Finance – 6.8% | |
| | | Insurance – 3.1% | |
670,500
| | HCC Insurance Holdings
Specialty Insurance | | | 19,739,520
| | |
36,500
| | Markel (b)
Specialty Insurance | | | 12,665,500
| | |
276,000
| | Leucadia National
Insurance Holding Company | | | 8,056,440
| | |
105,000
| | Philadelphia Consolidated Holdings (b)
Specialty Insurance | | | 3,187,800
| | |
87,000
| | Delphi Financial Group
Group Employee Benefit Products & Services | | | 3,163,320
| | |
75,000
| | Endurance Specialty Holdings
Commercial Lines Insurance/Reinsurance | | | 2,400,000
| | |
77,000
| | United America Indemnity (b)
Specialty Insurance | | | 1,604,680
| | |
1,600
| | Eastern Insurance Holdings (b)
Workers Comp & Specialty Insurance | | | 20,480
| | |
| | | | | | 50,837,740 | | |
| | | Finance Companies – 2.5% | |
1,135,400
| | AmeriCredit (b)
Auto Lending | | | 31,700,368
| | |
217,100
| | World Acceptance (b)
Personal Loans | | | 7,711,392
| | |
| | | | | | 39,411,760 | | |
Number of
Shares | | | | Value | |
| | | Banks – 1.0% | |
284,500
| | TCF Financial
Great Lakes Bank | | | $7,525,025
| | |
146,975
| | Chittenden
Vermont & Western Massachusetts Banks | | | 3,799,304
| | |
95,000
| | Greene County Bancshares
Tennessee Bank | | | 2,941,200
| | |
35,000
| | Associated Banc-Corp
Midwest Bank | | | 1,103,550
| | |
20,000
| | First Financial BankShares
West Texas Bank | | | 730,800
| | |
30,000
| | West Bancorporation
Des Moines Commercial Bank | | | 560,100
| | |
| | | | | | 16,659,979 | | |
| | | Savings and Loans – 0.2% | |
110,200
| | Anchor Bancorp Wisconsin
Wisconsin Thrift | | | 3,324,734
| | |
| | | Finance – Total | | | 110,234,213 | | |
| | | Other Industries – 2.4% | |
| | | Real Estate – 1.4% | |
560,000
| | DiamondRock Hospitality
Hotel Owner | | | 8,293,600
| | |
340,000
| | Highland Hospitality
Hotel Owner | | | 4,787,200
| | |
77,500
| | Gaylord Entertainment (b)
Convention Hotels | | | 3,382,100
| | |
150,000
| | Kite Realty Group Trust
Community Shopping Centers | | | 2,338,500
| | |
90,000
| | American Campus Communities
Student Housing | | | 2,236,500
| | |
100,000
| | Crescent Real Estate Equities
Class 'A' Office Buildings | | | 1,856,000
| | |
| | | | | | 22,893,900 | | |
| | | Transportation – 0.5% | |
480,800
| | Heartland Express
Regional Trucker | | | 8,601,512
| | |
See accompanying notes to financial statements.
11
Wanger U.S. Smaller Companies 2006 Semiannual Report
Wanger U.S. Smaller Companies
Statement of Investments (Unaudited) June 30, 2006
Number of Shares
or Principal Amount | | | | Value | |
| | | Regulated Utilities – 0.5% | |
| | 345,000
| | | Northeast Utilities
Utility | | | $7,131,150
| | |
| | | | | Other Industries – Total | | | 38,626,562 | | |
| | | | | Total Common Stock (Cost: $963,921,066) – 91.2% | | | 1,483,293,819 | | |
| Short-Term Obligations – 8.8% | | | |
| $ | 66,000,000 | | | Verizon Global Funding
5.28% – 5.30% Due 7/05/06 – 7/06/06 | | | 65,956,797 | | |
| | 45,000,000 | | | Conocophillips 5.30%
Due 7/03/06 – 7/07/06 | | | 44,974,972 | | |
| | 30,000,000 | | | Countrywide Financial Funding
5.30% Due 7/10/06 | | | 29,960,250 | | |
| | 3,029,000 | | | Repurchase Agreement with State
Street Bank & Trust dated 06/30/06,
due 07/03/06 at 4.93% collateralized by
a Federal Home Loan Bank Note,
maturing 05/22/08, market value
$3,090,000 (repurchase proceeds:
$3,030,244) | | | 3,029,000 | | |
| | | | | (Amortized Cost: $143,921,019) | | | 143,921,019 | | |
| | | | | Total Investments (Cost: $1,107,842,085) – 100.0% (a) | | | 1,627,214,838 | | |
| | | | | Cash and Other Assets Less Liabilities – 0.0% | | | (486,370 | ) | |
| | | | | Total Net Assets – 100.0% | | $ | 1,626,728,468 | | |
Notes to Statements of Investments
(a) At June 30, 2006, for federal income tax purposes cost of investments was $1,107,842,085 and net unrealized appreciation was $519,372,753 consisting of gross unrealized appreciation of $583,357,636 and gross unrealized depreciation of $63,984,883.
(b) Non-income producing security.
(c) Denotes a restricted security, which is subject to restrictions on resale under federal securities laws. These securities are valued in good faith by the Board of Trustees. At June 30, 2006, these securities amounted to $68,269 which represents less than 0.01% of net assets.
Additional information on these securities is as follows:
Security | | Acquisition
Dates | |
Shares | |
Cost | |
Value | |
Locus Discovery,
Series D Pfd. | | 9/5/01 | | | 250,000 | | | $ | 1,000,000 | | | $ | 68,250 | | |
SensAble Technologies
Series C Pfd. | | 4/4/00 | | | 301,205 | | | | 1,000,000 | | | | 3 | | |
SensAble Technologies
Series, common | | 6/28/04 | | | 1,581,292 | | | | 0 | | | | 16 | | |
| | | | | | | | | $ | 2,000,000 | | | $ | 68,269 | | |
(d) An affiliate may include any company in which the Fund owns five percent or more of its outstanding voting shares. On June 30, 2006, the Fund held five percent or more of the outstanding voting securities of the following company:
The aggregate cost and value of this company at June 30, 2006, was $5,474,962 and $3,780,060 respectively. Investments in affiliate companies represent 0.23% of total net assets at June 30, 2006. Investment activity and income amounts related to affiliates during the six months ended June 30, 2006, were as follows:
| Dividend Income | | $ | — | | |
| Net realized gain or loss | | | — | | |
| Change in unrealized gain or loss | | | (60,240 | ) | |
| Purchases | | | — | | |
| Proceeds from sales | | | — | | |
At June 30, 2006, the Fund held investments in the following sectors:
| Sector | | % of
Net Assets | |
| Information Group | | | 29.6 | % | |
| Consumer Goods & Services | | | 18.3 | | |
| Industrial Goods | | | 11.9 | | |
| Energy/Minerals | | | 11.6 | | |
| Health Care | | | 10.6 | | |
| Finance | | | 6.8 | | |
| Other Industries | | | 2.4 | | |
| Short-Term Obligations | | | 8.8 | | |
| Cash and Other Assets Less Liabilities | | | – | | |
| | | | 100.0 | % | |
See accompanying notes to financial statements.
12
Wanger U.S. Smaller Companies Fund 2006 Semiannual Report
Statement of Assets and Liabilities
June 30, 2006 (Unaudited)
| Assets: | |
| Unaffiliated investments, at cost | | $ | 1,102,367,123 | | |
| Affiliated investments, at cost (See Note 4) | | | 5,474,962 | | |
| Unaffiliated investments, at value | | $ | 1,623,434,778 | | |
| Affiliated investments, at value (See Note 4) | | | 3,780,060 | | |
| Cash | | | 21,812 | | |
| Receivable for: | |
| Investments sold | | | 1,414,341 | | |
| Fund shares sold | | | 2,548,832 | | |
| Interest | | | 415 | | |
| Dividends | | | 464,232 | | |
| Foreign tax reclaims | | | 2,895 | | |
| Total Assets | | | 1,631,667,365 | | |
| Liabilities: | |
| Payable for: | |
| Investments purchased | | | 3,405,530 | | |
| Fund shares repurchased | | | 150,796 | | |
| Investment advisory fee | | | 1,163,706 | | |
| Transfer agent fee | | | 28 | | |
| Trustees' fees | | | 2,135 | | |
| Other liabilities | | | 216,702 | | |
| Total Liabilities | | | 4,938,897 | | |
| Net Assets | | $ | 1,626,728,468 | | |
| Composition of Net Assets: | |
| Paid-in capital | | $ | 1,109,309,181 | | |
| Accumulated net investment loss | | | (445,767 | ) | |
| Accumulated net realized loss | | | (1,575,147 | ) | |
| Net unrealized appreciation on: | |
| Investments | | | 519,372,753 | | |
| Liquidated Security | | | 67,448 | | |
| Net Assets | | $ | 1,626,728,468 | | |
| Fund Shares outstanding | | | 47,317,862 | | |
Net asset value, offering price and redemption
price per share | | $ | 34.38 | | |
Statement of Operations
For the Six Months Ended June 30, 2006 (Unaudited)
| Investment Income: | |
| Dividends (net of foreign taxes withheld of $9,480) | | $ | 3,548,822 | | |
| Interest income | | | 3,581,195 | | |
| Total Investment Income | | | 7,130,017 | | |
| Expenses: | |
| Investment advisory fee | | | 7,223,144 | | |
| Transfer agent fee | | | 249 | | |
| Trustees' fees | | | 69,498 | | |
| Custody fee | | | 26,602 | | |
| Non-recurring costs (See Note 8) | | | 3,624 | | |
| Chief compliance officer expenses (See Note 4) | | | 20,055 | | |
| Other expenses | | | 195,108 | | |
| Total Expenses | | | 7,538,280 | | |
Non-recurring costs assumed by Investment
Adviser (See Note 8) | | | (3,624 | ) | |
| Custody earnings credit | | | (3,977 | ) | |
| Net Expenses | | | 7,530,679 | | |
| Net Investment Loss | | | (400,662 | ) | |
Net Realized and Unrealized Gain (Loss) on
Portfolio Positions: | |
| Net realized loss on investments | | | (1,113,412 | ) | |
Net change in unrealized appreciation
(depreciation) on: | |
| Unaffiliated Investments | | | 28,585,651 | | |
| Affiliated Investments (see note 4) | | | (60,240 | ) | |
| Liquidated Security | | | 7,298 | | |
Net change in unrealized
appreciation (depreciation) | | | 28,532,709 | | |
| Net Gain | | | 27,419,297 | | |
| Net Increase in Net Assets from Operations | | $ | 27,018,635 | | |
See accompanying notes to financial statements.
13
Wanger U.S. Smaller Companies Fund 2006 Semiannual Report
Statement of Changes in Net Assets
| Increase (Decrease) in Net Assets: | | (Unaudited)
Six months
Ended
June 30,
2006 | | Year Ended
December 31,
2005 | |
| From Operations: | |
| Net investment income (loss) | | $ | (400,662 | ) | | $ | 3,637,119 | | |
| Net realized gain (loss) on investments | | | (1,113,412 | ) | | | 55,808,347 | | |
Net change in unrealized appreciation
on investments | | | 28,532,709 | | | | 84,085,468 | | |
| Net Increase in Net Assets from Operations | | | 27,018,635 | | | | 143,530,934 | | |
| Distributions Declared to Shareholders: | |
| From net investment income: | | | (3,589,922 | ) | | | — | | |
| From net realized gains: | | | (50,639,120 | ) | | | — | | |
| Total Distributions Declared to Shareholders | | | (54,229,042 | ) | | | — | | |
| Share Transactions: | |
| Subscriptions | | | 156,774,798 | | | | 281,666,708 | | |
| Distributions reinvested | | | 54,229,042 | | | | — | | |
| Redemptions | | | (50,760,087 | ) | | | (85,055,673 | ) | |
| Net Increase from Share Transactions | | | 160,243,753 | | | | 196,611,035 | | |
| Total Increase in Net Assets | | | 133,033,346 | | | | 340,141,969 | | |
| Net Assets: | |
| Beginning of period | | | 1,493,695,122 | | | | 1,153,553,153 | | |
| End of period | | $ | 1,626,728,468 | | | $ | 1,493,695,122 | | |
| Undistributed (Accumulated) Net Investment Income (Loss) | | $ | (445,767 | ) | | $ | 3,544,817 | | |
See accompanying notes to financial statements.
14
Wanger U.S. Smaller Companies Fund 2006 Semiannual Report
Financial Highlights
| | | (Unaudited)
Six Months Ended
June 30, | | Year Ended December 31, | |
| Selected data for a share outstanding throughout each period | | 2006 | | 2005 | | 2004 | | 2003 | | 2002 | | 2001 | |
| Net Asset Value, Beginning of Period | | $ | 34.90 | | | $ | 31.37 | | | $ | 26.51 | | | $ | 18.51 | | | $ | 22.25 | | | $ | 19.99 | | |
| Income from Investment Operations: | |
| Net investment income (loss) (a) | | | (0.01 | ) | | | 0.09 | | | | (0.14 | ) | | | (0.11 | ) | | | (0.10 | ) | | | (0.04 | ) | |
| Net realized and unrealized gain (loss) on investments | | | 0.72 | | | | 3.44 | | | | 5.00 | | | | 8.11 | | | | (3.64 | ) | | | 2.31 | | |
| Total from Investment Operations | | | 0.71 | | | | 3.53 | | | | 4.86 | | | | 8.00 | | | | (3.74 | ) | | | 2.27 | | |
| Less Distributions Declared to Shareholders: | |
| From net investment income | | | (0.08 | ) | | | — | | | | — | | | | — | | | | — | | | | (0.01 | ) | |
| From net realized capital gains | | | (1.15 | ) | | | — | | | | — | | | | — | | | | — | | | | — | | |
| Total Distributions Declared to Shareholders | | | (1.23 | ) | | | — | | | | — | | | | — | | | | — | | | | (0.01 | ) | |
| Net Asset Value, End of Period | | $ | 34.38 | | | $ | 34.90 | | | $ | 31.37 | | | $ | 26.51 | | | $ | 18.51 | | | $ | 22.25 | | |
| Total Return (b) | | | 2.00 | %(c) | | | 11.25 | %(d) | | | 18.33 | % | | | 43.22 | % | | | (16.81 | )% | | | 11.39 | % | |
| Ratios to Average Net Assets/Supplemental Data: | |
| Expenses | | | 0.94 | %(e)(f) | | | 0.95 | %(f) | | | 1.00 | %(f) | | | 0.99 | %(f) | | | 1.05 | %(f) | | | 0.99 | % | |
| Net investment income (loss) | | | (0.05 | )%(e)(f) | | | 0.29 | %(f) | | | (0.49 | )%(f) | | | (0.48 | )%(f) | | | (0.47 | )%(f) | | | (0.20 | )% | |
| Waiver | | | — | | | | 0.00 | %(g) | | | — | | | | — | | | | — | | | | — | | |
| Portfolio turnover rate | | | 7 | %(c) | | | 11 | % | | | 15 | % | | | 10 | % | | | 16 | % | | | 18 | % | |
| Net assets, end of period (000's) | | $ | 1,626,728 | | | $ | 1,493,695 | | | $ | 1,153,553 | | | $ | 822,658 | | | $ | 471,726 | | | $ | 498,186 | | |
(a) Net investment income (loss) per share was based upon the average shares outstanding during the period.
(b) Total return at net asset value assuming all distributions are reinvested.
(c) Not annualized.
(d) Had the Investment Adviser not waived a portion of expenses, total return would have been reduced.
(e) Annualized.
(f) The benefits derived from custody fees paid indirectly had no impact.
(g) Rounds to less than 0.01%.
See accompanying notes to financial statements.
15
Wanger U.S. Smaller Companies Fund 2006 Semiannual Report
Notes to Financial Statements (Unaudited)
1. Nature of Operations
Wanger U.S. Smaller Companies (the "Fund") is a series of Wanger Advisors Trust (the "Trust"), an open-end management investment company organized as a Massachusetts business trust. The investment objective of the Fund is to seek long-term growth of capital. The Fund is available only for allocation to certain life insurance company separate accounts established for the purpose of funding qualified and non-qualified variable annuity contracts, and variable life insurance policies and may also be offered directly to certain types of pension plans and retirement arrangements.
2. Significant Accounting Policies
Security valuation
Securities of the Fund are valued at market value or, if a market quotation for a security is not readily available or is deemed not to be reliable because of events or circumstances that have occurred between the market quotation and the time as of which the security is to be valued, the security is valued at a fair value determined in accordance with procedures established by the Board of Trustees. Securities traded on securities exchanges or in over-the-counter markets in which transaction prices are reported are valued at the last sales price at the time of valuation. If a security is traded principally on the Nasdaq Stock Market Inc., the Nasdaq Official Closing Price will be applied. Securities for which there are no reported sales on the valuation date are valued at the latest bid quotation. Short-term debt obligations having a maturity of 60 days or less from the valuation date are valued on an amortized cost basis, whic h approximates fair value. Securities for which quotations are not readily available and any other assets are valued as determined in good faith under consistently applied procedures established by and under the general supervision of the Board of Trustees. The Trust has retained an independent statistical fair value pricing service to assist in the fair valuation process for securities principally traded in a foreign market in order to adjust for possible changes in value that may occur between the close of the foreign exchange and the time at which fund shares are priced. If a security is valued at a "fair value," that value may be different from the last quoted market price for the security.
Repurchase agreements
The Fund may engage in repurchase agreement transactions. The Fund, through its custodians, receives delivery of underlying securities collateralizing each repurchase agreement. The Fund's investment adviser determines that the value of the underlying securities is at all times at least equal to the repurchase price including interest. In the event of default or bankruptcy by the other party to the agreement, realization and/or retention of the collateral may be subject to legal proceedings.
Security transactions and investment income
Security transactions are accounted for on the trade date (date the order to buy or sell is executed) and dividend income is recorded on the ex-dividend date, except that certain dividends from foreign securities are recorded as soon as the information is available to the Fund. Interest income is recorded on an accrual basis and includes amortization of discounts on short-term debt obligations and on long-term debt obligations when required for federal income tax purposes. Realized gains and losses from security transactions are reported on an identified cost basis.
The Fund estimates components of distributions from Real Estate Investment Trusts ("REITS"). Distributions received in excess of income are recorded as a reduction of the cost of the related investments. Results of operations for the year reflect a change in estimate of these components using more current tax reporting received from REIT investments. The change in estimate has no impact on the Fund's net assets.
Restricted Securities
Restricted securities are securities that may only be resold upon registration under federal securities laws or in transactions exempt from registration. In some cases, the issuer of restricted securities has agreed to register such securities for resale at the issuer's expense either upon demand by the Fund or in connection with another registered offering of the securities. Many restricted securities may be resold in the secondary market in transactions exempt from registration. Such restricted securities may be determined to be liquid under criteria established by the Board of Trustees. The Fund will not incur any registration costs upon such resale.
Use of Estimates
The preparation of financial statements in conformity with accounting principles generally accepted in the United States of America ("GAAP") requires management to make estimates and assumptions that affect the amounts reported in the financial statements and accompanying notes. Actual results may differ from those estimated.
Fund share valuation
Fund shares are sold and redeemed on a continuing basis at net asset value. Net asset value per share is determined daily as of the close of trading on the New York Stock Exchange (the "Exchange") on each day the Exchange is open for trading by dividing the total value of the Fund's investments and other assets, less liabilities, by the number of Fund shares outstanding.
Custody fees/Credits
Custody fees are reduced based on the Fund's cash balances maintained with the custodian. The Fund could have invested a portion of the assets utilized in connection with the expense offset arrangement in an income-producing asset if it had not entered into such an agreement. The amount is disclosed as a reduction of total expenses in the Statement of Operations.
Indemnification
In the normal course of business, the Fund enters into contracts that contain a variety of representations and warranties which provide general indemnities. The Fund's maximum exposure under these arrangements is unknown, as this would involve future claims against the Fund. Also under the Trust's organizational documents, the Trustees and Officers of the Trust are indemnified against certain liabilities that may arise out of their duties to the Trust. However based on experience, the Fund expects the risk of loss due to these warranties and indemnities to be minimal.
Federal income taxes
The Fund has complied with the provisions of the Internal Revenue Code available to regulated investment companies and, in the manner provided therein, distributes all its taxable income, as well as any net realized gain on sales of investments and foreign currency transactions reportable for federal income tax purposes. Accordingly, the Fund paid no federal income taxes and no federal income tax provision was required.
Distributions to shareholders
Distributions to shareholders are recorded on the ex-date.
3. Federal Tax Information
Capital losses carryforwards of $5,327,851 were utilized during the year ended December 31, 2005.
4. Transactions With Affiliates
Columbia Wanger Asset Management, L.P., ("Columbia WAM") a wholly owned subsidiary of Columbia Management Group, Inc. ("CM"), which in turn is an indirect wholly owned subsidiary of Bank of America Corporation ("BOA"),
16
Wanger U.S. Smaller Companies Fund 2006 Semiannual Report
Notes to Financial Statements (Unaudited)
furnishes continuing investment supervision to the Fund and is responsible for the overall management of the Fund's business affairs.
Under the Fund's investment management agreement, fees are accrued daily and paid monthly to Columbia WAM at the annual rates shown in the table below:
| Average Daily Net Assets | | Annual Fee Rate | |
| For the first $100 million | | | 0.99 | % | |
| Next $150 million | | | 0.94 | % | |
| In excess of $250 million | | | 0.89 | % | |
For the six months ended June 30, 2006, the Fund's annualized effective investment advisory fee rate was 0.90%.
Certain officers and trustees of the Trust are also officers of Columbia WAM. On June 7, 2006, the board of trustees of Wanger Advisors Trust nominated for election as trustees to the Wanger Advisors Trust board 11 individuals (each a "Nominee" and collectively the "Nominees"). Two of the Nominees are currently trustees of the Trust and the remaining nine Nominees are currently trustees of the Columbia Acorn Trust. A special meeting of the shareholders has been scheduled for September 11, 2006 to vote on the election of the Nominees. Notice of the special meeting, a proxy statement and a proxy card has been mailed to all shareholders of record as of the close of business on July 14, 2006. The Trust makes no direct payments to its officers and trustees who are affiliated with Columbia WAM. For the six months ended June 30, 2006, the Fund paid $69,498 to trustees not affiliated with Columbia WAM.
The Board of Trustees appointed a Chief Compliance Officer to the Fund in accordance with federal securities regulations. The Fund will pay its pro-rata share of the expenses associated with the Office of the Chief Compliance Officer. These expenses are disclosed separately as "Chief compliance officer expenses" in the Statement of Operations.
Columbia Management Distributors, Inc., a wholly owned subsidiary of BOA, serves as the principal underwriter of the Trust and receives no compensation for its services.
Columbia Management Services, Inc. (the "Transfer Agent"), a wholly owned subsidiary of BOA, provides shareholder services to the Fund and has subcontracted with Boston Financial Data Services ("BFDS") to serve as subtransfer agent. For such services, the Transfer Agent receives a fee, paid monthly, at the annual rate of $21.00 per open account. During the period covered by this report, the Transfer Agent has voluntarily waived its right to reimbursement for certain out-of-pocket expenses.
Columbia WAM has delegated to Columbia Management Advisors, LLC, an indirect wholly owned subsidiary of BOA, responsibility to provide certain administrative services to the Fund.
An affiliate may include any company in which a fund owns five percent or more of its outstanding voting shares. On June 30, 2006, the Fund held five percent or more of the outstanding voting securities of one or more companies. Details of investments in those affiliated companies are presented on page 12.
During the six months ended June 30, 2006, the Fund engaged in purchase and sales transactions with funds that have a common investment adviser (or affiliated investment advisers), common Directors/Trustees, and/or common Officers. These purchase and sale transactions complied with provisions of Rule 17a-7 under the Investment Company Act of 1940 and were $5,335 and $0, respectively.
5. Borrowing Arrangements
The Trust participates in a $150,000,000 credit facility, which was entered into to facilitate portfolio liquidity. Interest is charged to each participating fund based on its borrowings at a rate per annum equal to the Federal Funds rate plus 0.50%. In addition, a commitment fee of 0.10% per annum is accrued and apportioned among the participating funds based on their pro-rata portion of the unutilized line of credit. The commitment fee is included in "Other expenses" on the Statement of Operations. No amounts were borrowed under this facility for the six months ended June 30, 2006.
6. Fund Share Transactions
Proceeds and payments on Fund shares as shown in the statement of changes in net assets are in respect of the following numbers of shares:
| | | Six months ended
June 30, 2006 | | Year ended
December 31, 2005 | |
| Shares sold | | | 4,390,839 | | | | 8,661,418 | | |
Shares issued in reinvestment
of dividend distributions | | | 1,565,955 | | | | — | | |
| Less shares redeemed | | | 1,439,076 | | | | 2,637,907 | | |
| Net increase in shares outstanding | | | 4,517,718 | | | | 6,023,511 | | |
7. Investment Transactions
The aggregate cost of purchases and proceeds from sales other than short-term obligations for the six months ended June 30, 2006 were $209,722,034 and $97,255,928.
8. Legal Proceedings
Columbia WAM, Columbia Acorn Trust, another mutual fund family advised by Columbia WAM, and the trustees of Colombia Acorn Trust, are named as defendants in class and derivative complaints which have been consolidated in a Multi-District Action in the federal district court for the District of Maryland (the "MDL Action"). These lawsuits contend that defendants permitted certain investors to market time their trades in certain Columbia Acorn Funds. The MDL Action is ongoing. However, all claims against Columbia Acorn Trust and the independent trustees of Columbia Acorn Trust have been dismissed.
The Columbia Acorn Trust and Columbia WAM are also defendants in a class action lawsuit that alleges, in summary, that the Columbia Acorn Trust and Columbia WAM exposed shareholders of Columbia Acorn International fund to trading by market timers by allegedly (a) failing to properly evaluate daily whether a significant event affecting the value of that fund's securities had occurred after foreign markets had closed but before the calculation of the funds' net asset value ("NAV"); (b) failing to implement the fund's portfolio valuation and share pricing policies and procedures; and (c) failing to know and implement applicable rules and regulations concerning the calculation of NAV (the "Fair Valuation Lawsuit"). The Seventh Circuit ruled that the plaintiffs' state law claims were preempted under federal law resulting in the dismissal of plaintiffs' complaint. Plaintiffs appealed the Seventh Circuit's ruling to the United States S upreme Court.
On March 21, 2005, a class action complaint was filed against the Columbia Acorn Trust and Columbia WAM seeking to rescind the Contingent Deferred Sales Charges assessed upon redemption of Class B shares of Columbia Acorn Funds due to the alleged market timing of the Columbia Acorn Funds. In addition to the rescission of sales charges, plaintiffs seek recovery of actual damages, attorneys' fees and costs. The case has been transferred to the MDL Action in the federal district court of Maryland.
On April 4, 2006, all of the parties to the MDL Action executed a letter settlement agreement intended to fully resolve all of the lawsuits consolidated in the MDL Action as well as the Fair Valuation Lawsuit. The settlement has not yet been finalized or approved by the court.
Columbia WAM, the Columbia Acorn Funds and the trustees of Columbia Acorn Trust are also defendants in a consolidated lawsuit filed in the federal district court of Massachusetts alleging that Columbia WAM used fund assets to make undisclosed payments to brokers as an incentive for the brokers to market the Columbia Acorn Funds over the other mutual funds to investors. The complaint alleges Columbia WAM and the Trustees of the Trust breached certain common laws duties and federal laws.
17
Wanger U.S. Smaller Companies Fund 2006 Semiannual Report
Notes to Financial Statements (Unaudited)
On November 30, 2005, the court dismissed all of the claims alleged against all of the parties in the consolidated complaint. Plaintiffs timely filed a notice of appeal of the district court's dismissal order with the First Circuit Court of Appeals. The parties subsequently executed a settlement term sheet to fully resolve all claims in the litigation. The settlement has not yet been finalized or approved by the court.
The Columbia Acorn Trust and Columbia WAM intend to defend these suits vigorously.
As a result of these matters or any adverse publicity or other developments resulting from them, there may be increased redemptions or reduced sales of Fund shares, which could increase transaction costs or operating expenses, or have other adverse consequences for the Funds.
In connection with the events described in detail above, various parties have filed suit against certain funds, their Boards and/or BOA (and affiliated entities). These suits are ongoing. However, based on currently available information, the Columbia Acorn Trust believes that the likelihood that these lawsuits will have a material adverse impact on any fund is remote, and Columbia WAM believes that the lawsuits are not likely to materially affect its ability to provide investment management services to the Funds.
For the six months ended June 30, 2006, CM has assumed $3,624 in consulting services and legal fees incurred by the Fund in connection with these matters.
18
Wanger U.S. Smaller Companies 2006 Semiannual Report
[Excerpts from:]
Wanger Advisors Trust
Management Fee Evaluation of the Senior Officer
Prepared Pursuant to the New York Attorney General's
Assurance of Discontinuance
2006
19
Wanger U.S. Smaller Companies 2006 Semiannual Report
Introduction
The New York Attorney General's Assurance of Discontinuance ("Order") entered into by Columbia Management Advisors, Inc. ("CMAI") and Columbia Management Distributors, Inc., ("CMDI" and collectively with "CMAI," "CMG") in February 2005, allows CMAI to manage or advise a mutual fund, including the Wanger Advisors Trust's family of funds (the "WAT Funds" or "WAT" or "Trust"), only if the trustees of the WAT Funds appoint a "Senior Officer" to perform specified duties and responsibilities. One of these responsibilities includes "managing the process by which proposed management fees (including but not limited to, advisory fees) to be charged the [WAT Funds] are negotiated so that they are negotiated in a manner which is at arms' length and reasonable and consistent with this Assurance of Discontinuance."
The Order also provides that the Board of Trustees of the WAT Funds ("Board") must determine the reasonableness of proposed "management fees" by using either an annual competitive bidding process supervised by the Senior Officer or Independent Fee Consultant, or by obtaining "an annual independent written evaluation prepared by or under the direction of the Senior Officer or the Independent Fee Consultant."
"Management fees" are only part of the costs and expenses paid by mutual fund shareholders. The expenses can vary depending upon the class of shares held but usually include: (1) investment management or advisory fees to compensate analysts and portfolio managers for stock research and portfolio management, as well as the cost of operating a trading desk; (2) administrative expenses incurred to prepare registration statements and tax returns, calculate the Funds' net asset values, maintain effective compliance procedures and perform recordkeeping services; (3) transfer agency costs for establishing accounts, accepting and disbursing funds, as well as overseeing trading in Fund shares; and (4) custodial expenses incurred to hold the securities purchased by the Funds.
Columbia Wanger Asset Management, L.P. ("CWAM"), the adviser to the WAT Funds, has proposed that the Trust enter into an agreement that "bundles" the first two categories listed above: advisory and administrative services. The fees paid under this agreement are referred to as "management fees." Other fund expenses are governed by separate agreements, in particular agreements with two CWAM affiliates: CMDI, the broker-dealer that underwrites and distributes the WAT Funds' shares, and Columbia Management Services, Inc. ("CMSI"), the Funds' transfer agent. In conformity with the terms of the Order, this evaluation, therefore, addresses only the advisory and administrative contract between CWAM and the Trust, and does not extend to the other agreements.
According to the Order, the Senior Officer's evaluation must consider at least the following:
(1) Management fees (including components thereof) charged to institutional and other clients of CWAM for like services;
(2) Management fees (including any components thereof) charged by other mutual fund companies for like services;
(3) Costs to CWAM and its affiliates of supplying services pursuant to the management fee agreements, excluding any intra-corporate profit;
(4) Profit margins of CWAM and its affiliates from supplying such services;
(5) Possible economies of scale as the WAT Funds grow larger; and
(6) The nature and quality of CWAM's services, including the performance of each WAT Fund.
On November 17, 2004, the Board appointed me Senior Officer under the Order. The Board also determined not to pursue a competitive bidding process and instead, charged me with the responsibility of evaluating the WAT Funds' proposed advisory and administrative fee contract with CWAM in conformity with the requirements of the Order. This Report is an annual evaluation required under the Order. In discharging their responsibilities, the independent Trustees have also consulted independent, outside counsel.
2005 Evaluation
This is the second annual evaluation prepared in connection with the Order. The first annual evaluation ("2005 Evaluation") was issued on July 25, 2005. This evaluation follows the same structure as the 2005 Evaluation. Some areas are given more emphasis here, while others are given less. Still, the fundamental information gathered for this evaluation is the largely the same as last year. I have noted in this Report where methodologies diverged significantly.
This evaluation was performed in cooperation and regular communication with the Compliance/Contract Renewal Committee of the Board.
Process and Independence
The objectives of the Order are to insure the independent evaluation of the advisory fees paid by the WAT Funds as well as to insure that all relevant factors are considered. In my view, the contract renewal process has been conducted at arms-length and with independence in gathering, considering and evaluating all relevant data. At the outset of the process, the Trustees sought and obtained from CWAM and CMG a comprehensive compilation of data regarding Fund performance and expense, adviser profitability, and other information. In advance of the contract renewal process, the Board also explored CWAM's potential capacity restraints as they relate to the larger Columbia Acorn Fund complex managed by CWAM. The adviser's capacity to manage increasing assets is an issue posed by the size of the Columbia Acorn Fund, but impacts the domestic WAT Funds as well. Performance and expense data was obtained from both Morningstar and Lipper, the leading consultants in this area. The rankings prepared by Morningstar and Lipper were independent and were not influenced by the adviser. CWAM itself identified what it considers its competition in formulating its own peer group, and the Trustees considered that data as well.
20
Wanger U.S. Smaller Companies 2006 Semiannual Report
My evaluation of the advisory contract was shaped, as it was last year, by my experience as WAT's Chief Compliance Officer ("CCO"). As CCO, I report solely to the Board and have no reporting obligation to or employment relationship with CMG or its affiliates, except for administrative purposes. This too contributes to the independence of this evaluation. I have commented on compliance matters in evaluating the quality of service provided by CWAM.
Since the 2005 Evaluation was issued, the Board has considered the recommendations and conclusions of that Report. In connection with the July 2005 contract renewal, the Board added a breakpoint of 10 basis points for Wanger International Small Cap for assets in excess of $500 million. Since that fund now has assets of $1.2 billion, management fees were reduced as a result. The Board has also gathered data on payments made by CWAM to insurance company partners as part of the Board's on-going consideration of whether to institute Rule 12b-1 fees for the WAT Funds. Finally, it has gathered and considered data from CWAM regarding its capacity to invest fund assets effectively.
This Report, its supporting materials and the data contained in other materials submitted to the Compliance/Contract Committee of the Board, in my view, provide a thorough factual basis upon which the Board, in consultation with independent counsel as it deems appropriate, may conduct management fee negotiations that are in the best interests of the WAT Funds' shareholders.
Finally, it should be noted that in June 2006, the WAT and Columbia Acorn Boards agreed in principle to merge, subject to appropriate shareholder approval. In view of this development, the WAT Trustees are considering the extension of the existing advisory contract for an interim period that would facilitate a review of the agreement by the combined board following the proposed merger for the remainder of the renewal period (through July 2007). Regardless of how the WAT Trustees ultimately choose to proceed in this respect, this Report provides the WAT Board with sufficient information to make an informed decision at this time regarding the advisory contract.
The Fee Reductions Mandated under the Order
Under the terms of the Order, CMG agreed to secure certain management fee reductions for the mutual funds advised by its affiliate investment advisers. In some instances, breakpoints were also established. Although neither CWAM nor the Trust was a party to the Order, CWAM offered and the Board accepted certain advisory fee reductions last year. By the terms of the Order, these fees may not be increased before November 30, 2009. I have used these advisory fee levels in my evaluation because they are the fees in the current agreements that CWAM proposes should be continued. Hence, these fee levels are the starting point of an evaluation.
Conclusions
My review of the data and other material above leads to the following conclusions with respect to the factors identified in the Order.
1. Performance. The domestic Funds generally have achieved outstanding performance. The Wanger US Smaller Companies and Wanger Select both rank very favorably against their peers. The international Funds have not, however, performed nearly as well as the domestic Funds, and continue to lag their benchmarks and peers. Management is taking steps to improve the performance of these funds.
2. Management Fees relative to Peers. The management fee rankings for the domestic funds are below their peers and hence less favorable to shareholders than competitors' funds. The international Funds fare much better, but the Morningstar and Lipper rankings diverge sharply.
3. Administrative Fees. The WAT Funds pay a bundled fee that combines advisory fees and administrative expense, so ranking these fees separately was not possible.
4. Management Fees relative to Institutional and Other Mutual Fund Accounts. CWAM's focus is on its mutual funds. It does not actively seek to manage separate or institutional accounts. The few institutional accounts it does manage vary in rate structures. Some pay advisory fees commensurate with or higher than the WAT Funds. In a few instances, however, institutional accounts pay lower advisory fees than do the WAT Funds.
5. Costs to CWAM and its Affiliates. CWAM's direct costs do not appear excessive, and in some areas have declined in the past year. Indirect costs allocated to CWAM by its parent organization, however, have increased substantially. CWAM's affiliates report operating losses and therefore do not appear to profit from CWAM's advisory agreement with the WAT Funds.
6. Profit Margins. CWAM's firm-wide, pre-marketing expense profit margins are at the top of the industry, though these comparisons are hampered by limited industry data. High profit margins are not unexpected for firms that manage large, successful funds and have provided outstanding investment performance for investors.
7. Economies of Scale. Economies of scale do exist at CWAM and will expand as the assets under management increase. They are, however, only partially reflected in the management fee schedule for the Funds. If the WAT Funds' assets continue to grow, under the Funds' current fee schedules, shareholders might not benefit in a manner generally commensurate with CWAM's increased profits.
21
Wanger U.S. Smaller Companies 2006 Semiannual Report
8. Nature and Quality of Services. This category includes a variety of considerations that are difficult to quantify, yet can have a significant bearing on the performance of the WAT Funds. Several areas merit comment.
a. Capacity. CWAM's assets under management have continued to grow, posing ever greater challenges in deploying assets effectively. While trends here merit continued monitoring, CWAM appears to be managing assets effectively.
b. Compliance. CWAM has a reasonably designed compliance program that protects shareholders.
c. Administrative Services. The WAT Funds benefit from a variety of administrative services that are performed by CWAM and CMAI.
In my opinion, the process of negotiating an advisory contract for the WAT Funds has been conducted thoroughly and at arms' length. Further, the Trustees have sufficient information to evaluate management's proposal, and negotiate contract terms that are in the best interests of fund shareholders.
Recommendations
I believe the Trustees should:
1. Continue to consider ways to restructure the advisory fee beyond the current breakpoint schedule to reflect more fully economies of scale.
2. Monitor the performance of the international funds.
3. Continue to monitor CWAM's capacity limitations to insure that CWAM's expanding assets under management do not impair investment performance.
4. Consider unbundling of advisory and administrative fees.
5. Continue their consideration of whether to implement a plan under Rule 12b-1.
Robert P. Scales
July 24, 2006
22
Wanger U.S. Smaller Companies 2006 Semiannual Report
This page intentionally left blank.
23
Wanger U.S. Smaller Companies 2006 Semiannual Report

Wanger Advisors Trust
Trustees
Patricia H. Werhane, Chairperson
Jerome L. Duffy
Kathryn A. Krueger, M.D.
Ralph Wanger
Officers
Charles P. McQuaid
President
Ben Andrews
Vice President
Michael G. Clarke
Assistant Treasurer
Jeffrey R. Coleman
Assistant Treasurer
J. Kevin Connaughton
Assistant Treasurer
John M. Kunka
Assistant Treasurer
Joseph C. LaPalm
Vice President
Bruce H. Lauer
Vice President, Treasurer and Secretary
Louis J. Mendes III
Vice President
Robert A. Mohn
Vice President
Christopher J. Olson
Vice President
Michelle H. Rhee
Assistant Secretary
Linda K. Roth-Wiszowaty
Assistant Secretary
Robert P. Scales
Chief Compliance Officer, Senior Vice President and General Counsel
Transfer Agent,
Dividend Disbursing Agent
Columbia Management Services, Inc.
P.O. Box 8081
Boston, Massachusetts
02266-8081
Distributor
Columbia Management Distributors, Inc.
One Financial Center
Boston, Massachusetts
02111-2621
Investment Adviser
Columbia Wanger Asset Management, L.P.
227 West Monroe Street, Suite 3000
Chicago, Illinois 60606
1-888-4-WANGER
(1-888-492-6437)
Legal Counsel
Bell, Boyd & Lloyd LLC
Chicago, Illinois
This report, including the schedules of investments and financial statements, is submitted for the general information of the shareholders of the Wanger Advisors Trust. This report is not authorized for distribution unless preceded or accompanied by a prospectus.
A description of the Fund's proxy voting policies and procedures is available (i) on the Fund's website, www.columbiafunds.com; (ii) on the Securities and Exchange Commission's website at www.sec.gov, and (iii) without charge, upon request, by calling 888-492-6437. Information regarding how the Fund voted proxies relating to portfolio securities during the 12-month period ended June 30, 2006, is available from the SEC's website.
The Fund files a complete schedule of portfolio holdings with the SEC for the first and third quarters of each fiscal year on Form N-Q. The Fund's Form N-Q is available on the SEC's website at www.sec.gov and may be reviewed and copied at the SEC's Public Reference Room in Washington, D.C. Information on the operation of the Pubic Reference Room may be obtained by calling 800-SEC-0330.
24
Wanger Advisors Trust
SHC-44/112005-0606 06/27477
Wanger International Small Cap
2006 Semiannual Report


Wanger International Small Cap
2006 Semiannual Report
| | | Table of Contents | |
| | 1 | | | Understanding Your Expenses | |
|
| | 2 | | | Understanding Our Investment Style | |
|
| | 4 | | | Performance Review | |
|
| | 6 | | | Statement of Investments | |
|
| | 13 | | | Statement of Assets and Liabilities | |
|
| | 13 | | | Statement of Operations | |
|
| | 14 | | | Statements of Changes in Net Assets | |
|
| | 15 | | | Financial Highlights | |
|
| | 16 | | | Notes to Financial Statements | |
|
| | 19 | | | Management Fee Evaluation of the Senior Officer | |
|
| | 24 | | | Board of Trustees and Management of Wanger Advisors Trust | |
|
Columbia Wanger Asset Management, L.P. ("Columbia WAM") is one of the leading global small-cap equity managers in the United States with more than 30 years of small- and mid-cap investment experience. Columbia WAM manages more than $30 billion in equities and is the investment adviser to Wanger U.S. Smaller Companies, Wanger International Small Cap, Wanger Select, Wanger International Select and the Columbia Acorn Family of Funds. Columbia Management Group, LLC ("Columbia Management") is the primary investment management division of Bank of America Corporation. Columbia Management entities furnish investment management services and advises institutional and mutual fund portfolios. Columbia WAM is an SEC-registered investment adviser and indirect, wholly owned subsidiary of Bank of America Corporation.
For more complete information about our funds, including the Columbia Acorn Funds, our fees, risks associated with investing, or expenses, call 1-888-4-WANGER for a prospectus. Read it carefully before you invest or send money. This report is not an offer of the shares of the Columbia Acorn Fund Family.
The discussion in the report of portfolio companies is for illustration only and is not a recommendation of individual stocks. The information is believed to be accurate, but the information and the views of the portfolio managers may change at any time without notice and the portfolio managers may alter a fund's portfolio holdings based on these views and the fund's circumstances at that time.
Wanger International Small Cap 2006 Semiannual Report
Understanding Your Expenses
As a Fund shareholder, you incur two types of costs. There are transaction costs, which generally include sales charges on purchases and may include redemption or exchange fees. There are also ongoing costs, which generally include investment advisory and other Fund expenses. The information on this page is intended to help you understand your ongoing costs of investing in the Fund and to compare these costs with the ongoing costs of investing in other mutual funds.
Analyzing the Fund's expenses
To illustrate these ongoing costs, we have provided an example and calculated the expenses paid by investors in the Fund during the reporting period. The information in the following table is based on an initial investment of $1,000.00, which is invested at the beginning of the reporting period and held for the entire period. Expense information is calculated two ways and each method provides you with different information. The amount listed in the "actual" column is calculated using actual operating expenses and total return for the Fund. The amount listed in the "hypothetical" column assumes that the return each year is 5% before expenses and then applies the Fund's actual expense ratio for the period to the hypothetical return. You should not use the hypothetical account values and expenses to estimate either your actual account balance at the end of the period or the expenses you paid during the reporting period. See the "Co mpare with other funds" information for details on using the hypothetical data.
Estimating your actual expenses
To estimate the expenses that you paid over the period, first you will need your account balance at the end of the period.
1. Divide your ending account balance by $1,000.00. For example, if an account balance was $8,600.00 at the end of the period, the result would be 8.6.
2. In the section of the table below titled "Expenses paid during period," you will find a dollar amount in the column labeled "Actual." Multiply this amount by the result from step 1. Your answer is an estimate of the expenses you paid on your account during the period.
January 1, 2006 – June 30, 2006
| | | Account value at the
beginning of the period ($) | | Account value at the
end of the period ($) | | Expenses paid during
period ($) | | Fund's annualized
expense ratio (%)* | |
| | | Actual | | Hypothetical | | Actual | | Hypothetical | | Actual | | Hypothetical | | | |
| Wanger International Small Cap | | | 1,000.00 | | | | 1,000.00 | | | | 1,150.95 | | | | 1,019.74 | | | | 5.44 | | | | 5.11 | | | | 1.02 | | |
*For the six months ended June 30, 2006.
Expenses paid during the period are equal to the Fund's annualized expense ratio, multiplied by the average account value over the period, then multiplied by the number of days in the Fund's most recent fiscal half-year and divided by 365.
It is important to note that the expense amounts shown in the table are meant to highlight only ongoing costs of investing in the Fund. As a shareholder of the Fund, you do not incur any transaction costs, such as sales charges, redemption or exchange fees. Expenses paid during the period do not include any insurance charges imposed by your insurance company's separate account. The hypothetical example provided is useful in comparing ongoing costs only and will not help you determine the relative total costs of owning different funds whose shareholders may incur transaction costs.
Compare with other funds
Since all mutual funds are required to include the same hypothetical calculations about expenses in shareholder reports, you can use this information to compare the ongoing cost of investing in the Fund with other funds. To do so, compare the 5% hypothetical example with the 5% hypothetical examples of other funds. As you compare hypothetical examples of other funds, it is important to note that hypothetical examples are meant to highlight the ongoing cost of investing in a fund and do not reflect any transactional costs, such as sales charges or redemption or exchange fees, that may be incurred by shareholders of other funds. Expenses paid during the period do not include any insurance charges imposed by your insurance company's separate accounts.
1
Wanger International Small Cap 2006 Semiannual Report

Understanding Our Investment Style
Why Small and Mid Caps?
Our mission is simple: Invest in good quality, reasonably priced smaller companies that have growth potential and competitive advantages, and hold on to them. We like small companies because they are generally less complicated. Big companies typically have lots of divisions, while most small companies have one division. An added benefit is that sometimes these small companies are undiscovered, which may mean they are undervalued and a potentially good investment. Managers of small companies tend to focus on customers and are acutely aware of competitors. Small-cap stocks are often exciting businesses run by accessible managers, so in addition to the above virtues, they are fun for us to follow.
Though we like small-caps, we don't force sales of successful stocks simply because they appreciated beyond some arbitrary small-cap definition (other small-cap managers may sell at $2 billion capitalizations, for example). The funds we manage could not make strong gains if we simply sold due to size. We let our winners run.
While style classifications can be helpful, we are not style purists. For example, small-cap stocks have outperformed large caps for more than five years, and we think on average they are no longer cheap based on historical valuation. Our analysts have been finding more value among mid-cap names that have the same attributes we like in small caps.
Why Growth-at-a-Reasonable-Price?
At Columbia Wanger Asset Management, we define growth investing styles using the terms Hard Core Value, Growth-at-a-Reasonable-Price (GARP) and Momentum. These terms help define the different ways that an investor can look for returns.
Hard Core Value investors usually buy very cheap stocks, as measured by comparing the stock valuation to the underlying asset values. While this strategy works for a number of competitors who are very good at it, Hard Core Value is not for us. We believe that too often the stocks are very cheap because the underlying businesses are lousy. Successful investing in Hard Core Value largely depends on predicting (or hastening) events such as takeovers, spinouts or turnarounds. Until such an event occurs the stock may be a diminishing asset.
In implementing our Growth-at-a-Reasonable-Price style, our 21 analysts first search for good, growing businesses. We view what we do as investing in companies rather than stocks, and we try to analyze companies as if we were buying the whole business rather than just a fraction of ownership. We define "good, growing businesses" as companies that have sustainable competitive advantages, fine managements, growing markets, and opportunities for market-share gains. Once we've found a good business that has been growing, we follow the company closely and determine if it sells at what we believe is a "reasonable price."
A stock is at a reasonable price if it sells at (or hopefully below) what we believe is its true value. Most growth companies ("growth stock" is a misnomer) are valued by the market based on price-to-earnings (PE) ratios, and comparisons between growth companies are often based on PE-to-growth (PEG) ratios. While that approach makes theoretical sense, reported earnings are often poor measures of underlying economic profits. For example, the costs of employee stock options were not required to be an accounting expense until 2006, so underlying earnings of many companies were overstated. In other cases, companies may have higher free cash flows than suggested by reported earnings. We ask our analysts to look beyond reported earnings and adjust for many factors when using PE ratios or related dividend discount model valuations. Our analysts also use value discipline techniques, calculating potential sell-out or break-up values, whe n it is appropriate to do so.
Often we determine that the stock of a good business that has been growing is not selling at a reasonable price. In those cases we wait—and there have been times that we've waited for years. If valuation is borderline, we can purchase an initial small position and later increase the position or sell the stock depending on fundamentals or valuation. Valuation matters because it enables our shareholders to potentially benefit in two ways: (1) from growth of the underlying business and (2) from growth of a valuation multiplier, such as a PE ratio.
The remaining growth style definition is Momentum. Momentum players (I hesitate to say "investors") look for stocks that have been rising, along with fast earnings growth, and preferably earnings estimate increases. Many Momentum players completely ignore valuation. (Economists label luxury goods as those where demand rises when prices increase, so momentum players are the ultimate luxury goods buyers!) Because Momentum players buy at any price when earnings are good and often sell at any price when earnings are disappointing, we often like to sell our winners to them and sometimes buy their losers—at our dream prices. Momentum can work, especially in bubbles, but it's not for us. It's too far from our mission of investing in good businesses and targeting rational returns.
Just as individual stocks can graduate from small to mid to large caps, they can also move from Hard Core Value to Growth-at-a-Reasonable-Price and then to Momentum. We love to buy stocks in companies not yet recognized as growth businesses. If we can find good companies that we believe are
2
Wanger International Small Cap 2006 Semiannual Report
mistakenly priced at Hard Core Value levels, even better. Often our best performing stocks were those that were undiscovered when we bought them, and as they grew, became investor favorites because of their strong business models. We are often challenged (in a good way) when stocks rise to Momentum valuations. The challenge then becomes when to sell. We try to resist significant selling unless we think fundamentals will deteriorate or valuations are entirely inappropriate vs. fundamentals.
Having a sensible investment style is very useful, but it is not enough for long-term success. Other factors, such as our process and the people who make up our investment team, will be discussed in future columns.


Charles P. McQuaid
President and Chief Investment Officer
Columbia Wanger Asset Management, L.P.
The views expressed in "Understanding Our Investment Style" are those of the author. These views are not guarantees of future performance and involve certain risks, uncertainties and assumptions that are difficult to predict so actual outcomes and results may differ significantly from the views expressed. These views are subject to change at any time based upon economic, market or other conditions and the respective parties disclaim any responsibility to update such views. These views may not be relied on as investment advice and, because investment decisions for a Wanger Advisors Fund are based on numerous factors, may not be relied on as an indication of trading intent on behalf of any particular Wanger Advisors Fund. References to specific company securities should not be construed as a recommendation or investment advice.
Mid- and small-cap stocks are often more volatile and less liquid than the stocks of larger companies. Small companies may have a shorter history of operations than larger companies and may have a less diversified product line, making them more susceptible to market pressure. Investments in foreign securities have special risks, including political or economic instability, higher costs, different regulations, accounting standards, trading practices and levels of information, and currency exchange rate fluctuations.
3
Wanger International Small Cap 2006 Semiannual Report

Performance Review Wanger International Small Cap
 | |  | |
|
Louis J. Mendes III
Co-Portfolio Manager | | Christopher J. Olson
Co-Portfolio Manager | |
|
Performance data quoted represents past performance and current performance may be lower or higher. Past performance is no guarantee of future results. The investment return and principal value will fluctuate so that shares, when redeemed, may be worth more or less than the original cost. For monthly performance updates call 1-888-4-WANGER.
Wanger International Small Cap gained 15.09% (without insurance charges) for the six months, outperforming a 10.57% return for the S&P/Citigroup EMI Global ex-US Index. The Fund's half year return also easily topped the 10.16% return of the large-cap oriented MSCI EAFE Index.
With a 104% gain in the period, France's Vallourec, a maker of seamless tubes used by oil and gas producers, benefited from strong earnings growth and increased demand for its product. Perusahaan Gas Negara, an Indonesian gas pipeline operator, was also strong in the first half of the year. The stock gained 71% as confidence in gas pricing and volumes over the next few years increased. Tullow Oil rounded out the list of energy stock winners. An exploration and development company based in the United Kingdom, Tullow Oil was up 53% for the half year.
Other winners included USG People, a Dutch provider of temporary staffing that gained 82% on strong earnings growth. Debt Free Direct, a UK provider of consumer debt reduction services, gained 84% as over- indebted consumers flocked to the company to deal with their increasing financial burdens. Fund holdings in stock exchanges in Asia also posted strong gains in the period. Hong Kong Exchanges and Clearing, the Hong Kong equity and derivatives operator, gained 56% and Osaka Securities, the Osaka securities exchange and a new position in the Fund this period, posted a 76% gain. Both stocks were up due to an increasing focus on consolidation within the industry.
Underperformers in the quarter included Hong Kong power tool manufacturer Techtronic Industries. The stock was off 43% for the six month period due to continued poor sentiment on the outlook for U.S. housing and its potential impact on power tool sales. Canada's Railpower Technologies fell 61% in the first half of the year due to concerns with its latest battery and generation pack technologies. In Japan, fund manager Sparx Asset Management fell in sympathy with the overall correction in Japanese financial stocks. The stock was off 26% in Wanger International Small Cap. African retailer Edgars Consolidated Stores fell 25% due to worries that rising interest rates may slow down consumption.
Concerns regarding ongoing increases in global interest rates seem to have conspired with historically high valuations to finally change investor appetite for international risk, particularly in international small-cap equities. Notably, the second quarter was also the first in 10 in which the large-cap EAFE index outperformed the small-cap S&P/Citigroup EMI Global ex-US index. As in the U.S. market, overseas investors generally perceive larger cap stocks to be less risky than their small cap counterparts. As we have mentioned in earlier reports, small-cap international stocks have been strong performers in both absolute terms and relative to their large cap counterparts and no longer offer the valuation discount that they did before. While still finding compelling ideas in the sub $5 billion market-cap universe, we have been selectively adding mid-cap stocks in the $5 billion to $10 billion range where valuations as a group are more attractive. Despite the increase in volatility in international small-cap equities, we believe there remain ample opportunities for new acorns to be discovered.
Wanger International Small Cap is a diversified fund that invests primarily in the stocks of non-U.S. companies with capitalizations of less than $5 billion at the time of initial purchase. Investments in foreign securities have special risks, including political or economic instability, higher costs, different regulations, accounting standards, trading practices and levels of information, and currency exchange rate fluctuations. Small-cap stocks are often more volatile and less liquid than the stocks of larger companies. Small companies may have a shorter history of operations than larger companies and may have a less diversified product line, making them more susceptible to market pressure.
As of 6/30/06, the Fund's positions in the stocks mentioned were: Vallourec, 0.0%; Perusahaan Gas Negara, 0.5%; Tullow Oil, 1.0%; USG People, 1.0%; Debt Free Direct, 1.2%; Hong Kong Exchanges and Clearing, 0.9%; Osaka Securities, 0.3%; Techtronic Industries, 0.4%; Railpower Technologies, 0.1%; Sparx Asset Management, 0.8%; Edgars Consolidated Stores, 0.5%.
See next page for index definitions.
4
Wanger International Small Cap 2006 Semiannual Report
Growth of a $10,000 Investment in
Wanger International Small Cap
Total return for each period,
May 3, 1995 (inception date) through June 30, 2006
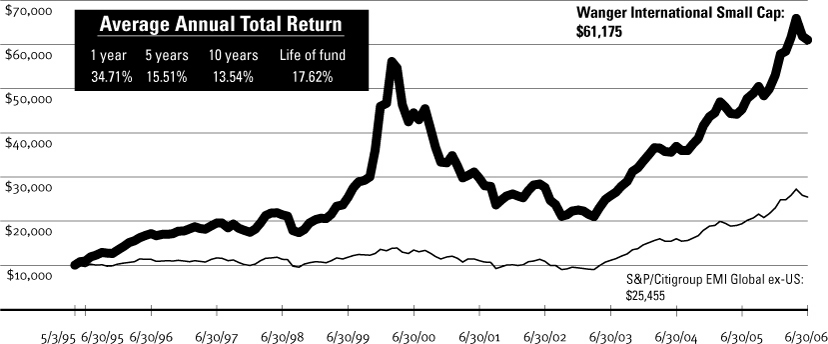
This graph compares the results of $10,000 invested in Wanger International Small Cap on May 3, 1995 (the date the Fund began operations) through June 30, 2006, to the S&P/Citigroup EMI Global ex-US Index, with dividends and capital gains reinvested. Performance shown here is past performance, which cannot guarantee future results. Current performance may be higher or lower. The investment return and principal value of an investment in the Fund will fluctuate so that Fund shares, when redeemed, may be worth more or less than their original cost. Performance changes over time. Current returns for the Fund may be different than that shown. For monthly performance updates, please contact us at 1-888-4-WANGER.
Results to June 30, 2006
| | | 2nd quarter | | Year-to-date | | 1 year | |
| Wanger International Small Cap | | | -0.88 | % | | | 15.09 | % | | | 34.71 | % | |
| S&P/Citigroup EMI Global ex-US | | | -1.70 | | | | 10.57 | | | | 31.22 | | |
| MSCI EAFE | | | 0.70 | | | | 10.16 | | | | 26.56 | | |
Lipper International Small Cap
Funds Index | | | -2.72 | | | | 10.26 | | | | 31.71 | | |
NAV as of 6/30/06: $35.05
Performance numbers reflect all Fund expenses but do not include any insurance charge imposed by your insurance company's separate accounts. If performance included the effect of these additional charges, it would be lower.
Due to ongoing market volatility, performance is subject to substantial short-term fluctuations.
The S&P/Citigroup EMI Global ex-U.S. is an index of the bottom 20% of institutionally investable capital of developed and emerging countries, selected by the index sponsor, outside the United States. MSCI EAFE is Morgan Stanley's Europe, Australasia and Far East Index, an index of companies throughout the world in proportion to world stock market capitalization, excluding the U.S. and Canada. Lipper Indexes include the largest funds tracked by Lipper, Inc. in the named category. The Lipper International Small Cap Funds Index is made up of the 10 largest non-U.S. funds investing in small-cap companies. All indexes are unmanaged and returns include reinvested dividends. It is not possible to invest directly in an index.
Portfolio characteristics and holdings are subject to change periodically and may not be representative of current characteristics and holdings.
Top 5 Countries
As a % of net assets, as of 6/30/06
| Japan | | | 14.9 | % | |
| United Kingdom | | | 12.2 | | |
| France | | | 10.0 | | |
| Germany | | | 7.6 | | |
| Ireland | | | 7.1 | | |
Top 10 Holdings
As a % of net assets, as of 6/30/06
1. Bank of Ireland
Irish Commercial Bank – Ireland | | 1.5%
| |
2. Hexagon
Measurement Equipment & Polymers – Sweden | | 1.4
| |
3. Debt Free Direct
Consumer Debt Reduction & Management – United Kingdom | | 1.2
| |
4. Atwood Oceanics
Contract Drilling – United States | | 1.1
| |
5. C&C Group
Beverage Company – Ireland | | 1.1
| |
6. Anglo Irish Bank
Small Business & Middle Market Banking – Ireland | | 1.0
| |
7. IAWS
Baked Goods – Ireland | | 1.0
| |
8. Jupiter Telecommunications
Cable Service Provider in Japan – Japan | | 1.0
| |
9. SES Global
Satellite Broadcasting Services – France | | 1.0
| |
10. Charles Taylor
Insurance Services – United Kingdom | | 1.0
| |
5
Wanger International Small Cap 2006 Semiannual Report
Wanger International Small Cap
Statement of Investments (Unaudited) June 30, 2006
Number of
Shares | | | | Value | |
| | | Common Stocks – 93.5% | | | | | |
| | | Europe – 58.0% | |
| | | United Kingdom – 12.2% | | | | | |
1,800,000
| | Debt Free Direct
Consumer Debt Reduction & Management Solutions | | | $14,716,560
| | |
1,700,000
| | Charles Taylor Group
Insurance Services | | | 12,095,201
| | |
1,000,000
| | Paragon Group
UK Buy-To-Let Finance Company | | | 12,068,633
| | |
1,700,000
| | Tullow Oil
Oil & Gas Producer | | | 11,987,038
| | |
2,000,000
| | Metal Bulletin
Publisher of Metals & Finance Journals | | | 11,270,849
| | |
600,000
| | Northern Rock
Lowest Cost Mortgage Bank in UK | | | 11,081,539
| | |
2,500,000
| | RPS Group
Environmental Consulting & Planning | | | 10,008,700
| | |
625,000
| | Expro International Group
Oilfield Services | | | 7,841,854
| | |
350,000
| | Northgate
Light Commercial Vehicle Rental Specialist | | | 6,769,770
| | |
320,034
| | Kensington Group
UK Non-Conforming Mortgage Company | | | 6,085,216
| | |
1,400,000
| | Taylor Nelson Sofres
Market Research | | | 6,021,641
| | |
900,000
| | Workspace Group
UK Real Estate | | | 6,017,209
| | |
1,200,000
| | BBA Group
Aviation Support Services & Non-Woven Materials | | | 5,863,547
| | |
850,000
| | Ulster Television
Irish Television & Radio Station Operator | | | 5,344,176
| | |
1,480,000
| | Begbies Traynor
Financial Restructuring & Corporate Recovery Services | | | 4,907,878
| | |
450,000
| | Keller Group (b)
International Ground Engineering Specialist | | | 4,834,659
| | |
215,000
| | Randgold Resources (b)
Gold Mining in Western Africa | | | 4,515,000
| | |
225,000
| | Viridian
Northern Ireland Electric Utility | | | 3,975,984
| | |
398,926
| | Bloomsbury Publishing
Book Publisher | | | 2,388,572
| | |
263,618
| | Vitec Group
Supports for Lighting & Cameras | | | 2,119,314
| | |
| | | | | | 149,913,340 | | |
Number of
Shares | | | | Value | |
| | | France – 10.0% | | | | | |
850,000
| | SES Global
Satellite Broadcasting Services | | | $12,107,762
| | |
220,000
| | April Group
Insurance Policy Construction | | | 11,809,748
| | |
200,000
| | Carbone Lorraine
Advanced Industrial Materials | | | 10,996,968
| | |
130,000
| | Iliad
High Speed Internet Service Provider | | | 10,827,857
| | |
140,000
| | Rubis
Tank Storage & LPG Supplier | | | 9,794,988
| | |
171,056
| | Trigano
Leisure Vehicles & Camping Equipment | | | 9,079,699
| | |
70,000
| | Neopost
Postage Meter Machines | | | 7,968,631
| | |
45,000
| | Ciments Francais
Leading French & Emerging Markets Cement Producer | | | 7,481,033
| | |
110,000
| | Eurofins Scientific (b)
Food Screening & Testing | | | 7,161,081
| | |
81,000
| | Imerys
Industrial Minerals Producer | | | 6,471,793
| | |
230,000
| | Legrand (b)
Electrical Components | | | 6,469,795
| | |
90,000
| | Norbert Dentressangle
Transport | | | 6,331,306
| | |
60,000
| | Essilor International
Eyeglass Lenses | | | 6,033,353
| | |
42,000
| | Bacou Dalloz
Safety Equipment | | | 5,001,258
| | |
100,000
| | Foncia Groupe
Real Estate Services | | | 4,411,427
| | |
| | | | | | 121,946,699 | | |
| | | Germany – 7.6% | | | | | |
90,000
| | Wincor Nixdorf
Retail POS Systems & ATM Machines | | | 11,491,246
| | |
680,000
| | Depfa Bank
Investment Banker to Public Authorities | | | 11,272,399
| | |
55,000
| | Rational
Commercial Oven Manufacturer | | | 8,982,180
| | |
260,000
| | CTS Eventim
Event Ticket Sales | | | 7,972,024
| | |
See accompanying notes to financial statements.
6
Wanger International Small Cap 2006 Semiannual Report
Wanger International Small Cap
Statement of Investments (Unaudited) June 30, 2006
Number of
Shares | | | | Value | |
| | | Germany – 7.6% (cont) | | | | | |
322,000
| | Deutsche Beteiligungs
Private Equity Investment Management | | | $6,713,708
| | |
150,000
| | Rhoen Klinikum
Healthcare Services | | | 6,680,261
| | |
155,000
| | Hugo Boss Designs
Fashion Apparel | | | 6,524,719
| | |
6,700
| | Porsche
Specialty Automobile Manufacturer | | | 6,465,205
| | |
125,000
| | Vossloh
Rail Infrastructure & Diesel Locomotives | | | 6,337,879
| | |
90,000
| | Grenke Leasing
Financing for IT Equipment | | | 5,985,824
| | |
163,000
| | GFK
Market Research Services | | | 5,941,954
| | |
300,000
| | Takkt
Mail Order Retailer of Office & Warehouse Durables | | | 4,768,268
| | |
70,000
| | Bilfinger Berger
Construction & Related Services | | | 3,799,448
| | |
| | | | | | 92,935,115 | | |
| | | Ireland – 7.1% | | | | | |
1,000,000
| | Bank of Ireland
Irish Commercial Bank | | | 17,900,743
| | |
1,525,000
| | C&C Group
Beverage Company | | | 13,244,154
| | |
800,000
| | Anglo Irish Bank
Small Business & Middle Market Banking | | | 12,465,331
| | |
700,000
| | IAWS
Baked Goods | | | 12,341,838
| | |
2,480,698
| | United Drug
Irish Pharmaceutical Wholesaler & Outsourcer | | | 10,622,793
| | |
650,000
| | Grafton Group
Builders Materials Wholesaling & DIY Retailing | | | 8,181,939
| | |
400,000
| | Kingspan Group
Building Insulation & Environmental Containers | | | 6,983,552
| | |
330,000
| | Paddy Power
Irish Betting Services | | | 5,715,482
| | |
| | | | | | 87,455,832 | | |
Number of
Shares | | | | Value | |
| | | Netherlands – 6.1% | | | | | |
158,000
| | USG People
Temporary Staffing Services | | | $12,094,093
| | |
270,000
| | Fugro
Survey & GPS Services | | | 11,640,586
| | |
335,999
| | Ten Cate
Advanced Textiles & Industrial Fabrics | | | 9,864,207
| | |
190,000
| | IM Tech
Engineering & Technical Services | | | 9,171,883
| | |
105,000
| | OPG Groep
Healthcare Supplies & Pharmacies | | | 9,120,712
| | |
115,063
| | Aalberts Industries
Flow Control & Heat Treatment | | | 8,458,454
| | |
118,000
| | Smit Internationale
Harbor & Offshore Towage & Marine Services | | | 8,301,502
| | |
310,000
| | Unit 4 Agresso (b)
Business & Security Software | | | 6,235,340
| | |
| | | | | | 74,886,777 | | |
| | | Switzerland – 3.8% | | | | | |
85,000
| | Synthes
Products for Orthopedic Surgery | | | 10,241,042
| | |
8,000
| | Geberit
Plumbing Supplies | | | 9,243,159
| | |
8,000
| | Sika
Chemicals for Construction & Industrial Applications | | | 8,887,088
| | |
100,000
| | Kuehne & Nagel
Freight Forwarding/Logistics | | | 7,279,698
| | |
8,000
| | Givaudan
Fragrances & Flavors | | | 6,291,175
| | |
90,000
| | Logitech (b)
Branded Peripheral Computer Devices | | | 3,469,753
| | |
8,266
| | BKW Energie
Electric Utility | | | 723,756
| | |
| | | | | | 46,135,671 | | |
| | | Sweden – 2.9% | | | | | |
457,380
| | Hexagon
Measurement Equipment & Polymers | | | 16,650,650
| | |
384,100
| | Sweco
Engineering Consultants | | | 10,504,286
| | |
830,000
| | Tele2
European Mobile Operator & Services Reseller | | | 8,375,361
| | |
| | | | | | 35,530,297 | | |
See accompanying notes to financial statements.
7
Wanger International Small Cap 2006 Semiannual Report
Wanger International Small Cap
Statement of Investments (Unaudited) June 30, 2006
Number of
Shares | | | | Value | |
| | | Italy – 2.5% | | | | | |
3,000,000
| | Cir Compagnie
Italian Holding Company | | | $8,538,057
| | |
1,000,000
| | Amplifon
Hearing Aid Retailer | | | 8,499,491
| | |
660,000
| | Davide Campari
Spirits & Wines | | | 6,836,824
| | |
573,000
| | GranitiFiandre
Innovative Stoneware | | | 6,166,936
| | |
| | | | | | 30,041,308 | | |
| | | Denmark – 1.1% | | | | | |
107,000
| | Novozymes
Industrial Enzymes | | | 7,211,625
| | |
125,000
| | Thrane & Thrane
Mobile Transceivers for Satellite Communications | | | 6,463,236
| | |
| | | | | | 13,674,861 | | |
| | | Finland – 0.9% | | | | | |
1,208,000
| | SysOpen Digia (c)
Software for Smart Phones | | | 5,477,911
| | |
488,000
| | Jaakko Poyry
Engineering Consultants | | | 5,246,785
| | |
| | | | | | 10,724,696 | | |
| | | Spain – 0.9% | | | | | |
230,000
| | Red Electrica
Spanish Power Grid | | | 7,930,878
| | |
40,000
| | Bankinter
Mortgage Lender | | | 2,574,448
| | |
| | | | | | 10,505,326 | | |
| | | Greece – 0.8% | | | | | |
380,000
| | Intralot
Lottery & Gaming Systems & Services | | | 10,168,037
| | |
| | | Czech Republic – 0.7% | | | | | |
56,000
| | Komercni Banka
Leading Czech Universal Bank | | | 8,193,537
| | |
| | | Poland – 0.6% | | | | | |
295,800
| | Central European Distribution (b)
Vodka Production & Alcohol Distribution | | | 7,442,328
| | |
Number of
Shares | | | | Value | |
| | | Russia – 0.4% | | | | | |
181,900
| | RosBusinessConsulting (b)
Financial Information, Media & IT Services in Russia | | | $4,802,160
| | |
| | | Austria – 0.4% | | | | | |
100,000
| | Wienerberger
Bricks & Clay Roofing Tiles | | | 4,751,568
| | |
| | | Europe – Total | | | 709,107,552 | | |
| | | Asia – 20.5% | | | | | |
| | | Japan – 14.9% | | | | | |
17,500
| | Jupiter Telecommunications (b)
Cable Service Provider in Japan | | | 12,131,388
| | |
2,460
| | Kenedix
Real Estate Investment Management | | | 10,652,605
| | |
190,000
| | Daito Trust Construction
Apartment Builder | | | 10,564,197
| | |
1,250,000
| | Kansai Paint
Paint Producer in Japan, India, China & Southeast Asia | | | 10,002,033
| | |
9,250
| | Sparx Asset Management
Fund Management | | | 9,667,689
| | |
375,000
| | JSR
Films & Chemicals for LCD Screens & Electronics | | | 9,517,066
| | |
242,000
| | Ito En
Bottled Tea & Other Beverages | | | 8,877,836
| | |
129,000
| | USS
Used Car Auctioneer | | | 8,540,577
| | |
200,000
| | Aeon Mall
Suburban Shopping Mall Developer, Owner & Operator | | | 8,393,215
| | |
230,000
| | Hoya
Opto-Electrical Components & Eyeglass Lenses | | | 8,222,343
| | |
152,600
| | Hogy Medical
Disposable Surgical Products | | | 8,019,530
| | |
1,960
| | Risa Partners
NPL & Real Estate Related Investment | | | 7,788,645
| | |
300,000
| | Ushio
Industrial Light Sources | | | 6,352,676
| | |
600,000
| | Chiba Bank
Regional Bank | | | 5,631,901
| | |
183,000
| | Park24
Parking Lot Operator | | | 5,375,233
| | |
192,900
| | As One
Scientific Supplies Distributor | | | 5,307,010
| | |
See accompanying notes to financial statements.
8
Wanger International Small Cap 2006 Semiannual Report
Wanger International Small Cap
Statement of Investments (Unaudited) June 30, 2006
Number of
Shares | | | | Value | |
| | | Japan – 14.9% (cont) | | | | | |
325,000
| | T. Hasegawa
Industrial Flavors & Fragrances | | | $4,638,877
| | |
180,000
| | Sato
Bar Code Printers & Supplies | | | 4,169,228
| | |
670,400
| | Hiroshima Bank
Regional Bank | | | 4,097,495
| | |
520,000
| | Bank of Fukuoka
Regional Bank | | | 3,974,645
| | |
265,900
| | Toyo Technica
Value Added Reseller of Imported Instrumentation | | | 3,668,556
| | |
550
| | Japan Pure Chemical
Precious Metal Plating Chemicals for Electronics | | | 3,570,720
| | |
290
| | Osaka Securities Exchange
Osaka Securities Exchange | | | 3,445,884
| | |
146,000
| | Yusen Air & Sea Service
Airfreight Logistics | | | 3,431,087
| | |
440,000
| | Kamigumi
Port Cargo Handling & Logistics | | | 3,344,257
| | |
160,000
| | FCC
Auto/Motorcycle Clutches | | | 3,176,694
| | |
162,500
| | Ain Pharmaciez
Dispensing Pharmacy/Drugstore Operator | | | 2,701,101
| | |
106,200
| | Kintetsu World Express
Airfreight Logistics | | | 2,521,325
| | |
680
| | Advance Create
Independent Insurance Distributor | | | 1,974,069
| | |
73,500
| | Nagaileben
Medical/Healthcare Related Clothes | | | 1,653,907
| | |
15,200
| | Shimano
Bicycle Components & Fishing Tackle | | | 465,870
| | |
| | | | | | 181,877,659 | | |
| | | Taiwan – 2.4% | | | | | |
6,020,300
| | Phoenixtec Power
Uninterruptible Power Supplies | | | 6,119,205
| | |
2,099,159
| | Advantech
Embedded Computers | | | 6,025,711
| | |
1,000,000
| | Novatek Microelectronics
LCD Related IC Designer | | | 4,816,946
| | |
2,600,000
| | Wah Lee Industrial
Distributor of Chemicals, Materials & Equipment | | | 4,768,416
| | |
Number of
Shares | | | | Value | |
| | | Taiwan – 2.4% (cont) | | | | | |
4,000,000
| | Far EasTone Telecommunications
Taiwan's 3rd Largest Mobile Operator | | | $4,474,138
| | |
2,236,339
| | Springsoft
Electronic Design Automation Software | | | 3,449,653
| | |
| | | | | | 29,654,069 | | |
| | | Hong Kong – 1.4% | | | | | |
1,650,000
| | Hong Kong Exchanges and Clearing
Hong Kong Equity & Derivatives Market Operator | | | 10,604,747
| | |
4,000,000
| | Techtronic Industries
Power Tools & Motorized Appliances | | | 5,406,358
| | |
6,052,000
| | Linmark Group
Global Sourcing Agent of Consumer Goods | | | 952,876
| | |
| | | | | | 16,963,981 | | |
| | | India – 0.6% | | | | | |
300,000
| | Housing Development Finance
Indian Mortgage Lender | | | 7,384,763
| | |
| | | China – 0.5% | | | | | |
15,000,000
| | Global Bio-Chem Technology
Refiner of Corn-based Commodities | | | 6,342,760
| | |
| | | Indonesia – 0.5% | | | | | |
5,000,000
| | Perusahaan Gas Negara
Gas Pipeline Operator | | | 6,064,167
| | |
| | | Singapore – 0.2% | | | | | |
2,108,000
| | Comfort Del Gro
Taxi & Mass Transit Service | | | 2,031,652
| | |
| | | Asia – Total | | | 250,319,051 | | |
| | | Other Countries – 11.1% | | | | | |
| | | Canada – 5.2% | | | | | |
362,700
| | Alliance Atlantis Communication (b)
CATV Channels, TV/Movie Production/Distribution | | | 10,624,644
| | |
465,000
| | Rona (b)
Leading Canadian Do-it-yourself Retailer | | | 8,351,922
| | |
430,000
| | Shawcor
Oil & Gas Pipeline Products | | | 6,390,486
| | |
73,000
| | Potash
World's Largest Producer of Potash | | | 6,275,810
| | |
See accompanying notes to financial statements.
9
Wanger International Small Cap 2006 Semiannual Report
Wanger International Small Cap
Statement of Investments (Unaudited) June 30, 2006
Number of
Shares | | | | Value | |
| | | Canada – 5.2% (cont) | | | | | |
4,100,700
| | UrAsia Energy (b)
Uranium Mining in Kazakhstan | | | $10,285,730
| | |
350,000
| | Van Houtte
Coffee Services & Equipment | | | 5,819,224
| | |
1,000,000
| | Northern Orion Resources (b)
Copper & Gold Mining in Argentina | | | 4,909,075
| | |
300,000
| | Kinross Gold (b)
Gold Mining | | | 3,270,626
| | |
120,000
| | Enerflex Systems
Natural Gas Compressor Rental & Fabrication | | | 2,993,819
| | |
250,000
| | Ivanhoe Mines (b)
Copper Mine Project in Mongolia | | | 1,693,093
| | |
741,555
| | Railpower Technologies 144A (b)(d)
Hybrid Locomotives | | | 1,594,313
| | |
347,900
| | Railpower Technologies (b)
Hybrid Locomotives | | | 747,971
| | |
| | | | | | 62,956,713 | | |
| | | Australia – 2.9% | | | | | |
900,000
| | Billabong International
Action Sports Apparel Brand Manager | | | 10,275,073
| | |
1,420,000
| | Jubilee Mines
Nickel Mining in Australia | | | 8,512,452
| | |
1,300,000
| | ABC Learning Center
Childcare Centers | | | 6,186,690
| | |
100,000
| | Perpetual Trustees
Mutual Fund Management | | | 5,438,287
| | |
1,403,100
| | Sino Gold (b)
Gold Mining in The People's Republic of China | | | 5,237,178
| | |
| | | | | | 35,649,680 | | |
| | | South Africa – 1.4% | | | | | |
60,500
| | Impala Platinum
Platinum Group Metals Mining & Refining | | | 11,120,286
| | |
1,500,000
| | Edgars Consolidated Stores
Retail Conglomerate | | | 6,046,819
| | |
| | | | | | 17,167,105 | | |
Number of
Shares | | | | Value | |
| | | United States – 1.1% | |
270,000
| | Atwood Oceanics (b)
Contract Drilling | | | $13,392,000
| | |
| | | New Zealand – 0.5% | |
2,000,000
| | Sky City Entertainment
Casino/Entertainment Complex | | | 6,573,667
| | |
| | | Other Countries – Total | | | 135,739,165 | | |
| | | Latin America – 3.9% | |
| | | Brazil – 2.6% | |
1,780,000
| | Suzano
Brazilian Pulp & Paper Producer | | | 10,461,888
| | |
900,000
| | Natura Cosmeticos
Direct Retailer of Cosmetics | | | 9,432,568
| | |
242,000
| | Porto Seguro (b)
Auto & Life Insurance | | | 4,134,078
| | |
156,700
| | Ultrapar
Specialty Chemicals & Liquid Propane Gas Distribution | | | 2,467,090
| | |
361,600
| | American Banknote
Manufacturer of Smart Cards | | | 2,337,319
| | |
96,100
| | Dignosticos (b)
Medical Diagnostic Services | | | 1,907,890
| | |
50,600
| | Localiza Rent A Car
Car Rental | | | 969,528
| | |
| | | | | | 31,710,361 | | |
| | | Mexico – 1.3% | |
1,500,000
| | Consorcio ARA
Affordable Housing Builder | | | 6,176,566 | | |
154,200
| | Grupo Aeroportuario Del Surest
Cancun/Cozumel Airport Operator | | | 5,179,578 | | |
1,800,000
| | URBI Desarrollo (b)
Affordable Housing Builder | | | 4,174,143 | | |
30,000
| | Grupo Aeroportuario Del Pacifia
Mexican Airport Operator | | | 955,500 | | |
| | | | | | 16,485,787 | | |
| | Latin America – Total | | | 48,196,148 | | |
| | | Total Common Stocks (Cost: $841,151,703) – 93.5% | | | 1,143,361,916 | | |
See accompanying notes to financial statements.
10
Wanger International Small Cap 2006 Semiannual Report
Wanger International Small Cap
Statement of Investments (Unaudited) June 30, 2006
| Principal Amount | | | | Value | |
| Short-Term Obligations – 5.2% | | | |
| $ | 30,000,000 | | | Countrywide Financial Funding
5.25% Due 7/05/06 | | $ | 29,982,500 | | |
| | 30,000,000 | | | Conocophillips 5.30% Due 7/03/06 | | | 29,991,167 | | |
| | 3,832,000 | | | Repurchase Agreement with State
Street Bank & Trust Dated 06/30/06,
due 07/03/06 at 4.93% collateralized by
a Federal Home Loan Bank Note, maturing
05/22/08 Market Value $3,910,000
(repurchase proceeds: $3,833,574) | | | 3,832,000 | | |
| | | (Amortized Cost: $63,805,667) | | | 63,805,667 | | |
| | | Total Investments
(Cost of $904,957,370) – 98.7% (a)(e) | | | 1,207,167,583 | | |
| | | Cash and Other Assets Less Liabilities – 1.3% | | | 16,312,528 | | |
| | | Total Net Assets – 100% | | $ | 1,223,480,111 | | |
Notes to Statement of Investments:
(a) At June 30, 2006, for federal income tax purposes cost of investments was $904,957,370 and net unrealized appreciation was $302,210,213 consisting of gross unrealized appreciation of $337,725,727 and gross unrealized depreciation of $35,515,514.
(b) Non-income producing security.
(c) An affiliate may include any company in which the Fund owns five percent or more of its outstanding voting shares. On June 30, 2006, the Fund held five percent or more of the outstanding voting securities of the following company:
The aggregate cost and value of this company at June 30, 2006, was $6,418,835 and $5,477,911 respectively. Investments in affiliate companies represent 0.45% of total net assets at June 30, 2006. Investment activity and income amounts related to affiliates during the six months ended June 30, 2006, were as follows:
| Dividend Income | | $ | — | | |
| Net realized gain or loss | | $ | — | | |
| Change in unrealized gain or loss | | $ | (1,180,408 | ) | |
| Purchases | | $ | — | | |
| Proceeds from sales | | $ | — | | |
(d) Denotes a restricted security, which is subject to restrictions on resale under federal securities laws. These securities are valued in good faith by the Board of Trustees. At June 30, 2006, these securities amounted to $1,594,313 which represents 0.13% of net assets.
Additional information on these securities is as follows:
Acquisition
Security | | Shares/
Dates | | Par | | Cost | | Value | |
Railpower
Technologies 144A | | | 11/10 - 11/18/05 | | | | 741,555 | | | $ | 3,355,583 | | | $ | 1,594,313 | | |
(e) On June 30, 2006, the Fund's total investments were denominated in currencies as follows:
| Currency | | Value | | % of Net
Assets | |
| Euro Dollars | | $ | 443,415,356 | | | | 36.2 | % | |
| Japanese Yen | | | 181,877,659 | | | | 14.9 | | |
| British Pounds | | | 145,398,340 | | | | 11.9 | | |
| US Dollars | | | 106,368,043 | | | | 8.7 | | |
Other currencies less than
5% of total net assets | | | 330,108,185 | | | | 27.0 | | |
| | | $ | 1,207,167,583 | | | | 98.7 | % | |
See accompanying notes to financial statements.
11
Wanger International Small Cap 2006 Semiannual Report
Wanger International Small Cap
Portfolio Diversification (Unaudited) June 30, 2006
At June 30, 2006, the Fund's portfolio investments as a percent of net assets was diversified as follows:
| | | Value | | Percent | |
| Industrial Goods/Services | |
| Specialty Chemicals | | $ | 52,585,674 | | | | 4.3 | % | |
| Other Industrial Services | | | 50,317,403 | | | | 4.1 | | |
| Construction | | | 47,657,616 | | | | 3.9 | | |
| Industrial Materials | | | 38,268,172 | | | | 3.1 | | |
| Machinery | | | 29,800,202 | | | | 2.4 | | |
| Conglomerates | | | 25,109,104 | | | | 2.1 | | |
| Outsourcing & Training Services | | | 17,957,639 | | | | 1.5 | | |
| Industrial Distribution | | | 13,488,949 | | | | 1.1 | | |
| Electrical Compoments | | | 12,822,471 | | | | 1.0 | | |
| | | | 288,007,230 | | | | 23.5 | | |
| Consumer Goods/Services | |
| Beverage | | | 34,778,038 | | | | 2.8 | | |
| Retail | | | 33,992,548 | | | | 2.8 | | |
| Apparels | | | 17,752,668 | | | | 1.5 | | |
| Durable Goods | | | 17,633,441 | | | | 1.4 | | |
| Goods Distribution | | | 15,982,905 | | | | 1.3 | | |
| Consumer Services | | | 15,973,350 | | | | 1.3 | | |
| Gaming | | | 15,883,519 | | | | 1.3 | | |
| Food | | | 12,341,838 | | | | 1.0 | | |
| Non Durable Goods | | | 9,432,568 | | | | 0.8 | | |
| Leisure Products | | | 9,079,699 | | | | 0.7 | | |
| Entertainment | | | 7,972,024 | | | | 0.7 | | |
| Casinos | | | 6,573,667 | | | | 0.5 | | |
| Travel | | | 969,528 | | | | 0.1 | | |
| | | | 198,365,793 | | | | 16.2 | | |
| Finance | |
| Banks | | | 74,617,590 | | | | 6.1 | | |
| Finance Companies | | | 53,979,765 | | | | 4.4 | | |
| Insurance | | | 30,013,096 | | | | 2.5 | | |
| Money Management | | | 21,819,684 | | | | 1.8 | | |
| Savings & Loans | | | 9,959,212 | | | | 0.8 | | |
| Credit Cards | | | 2,337,319 | | | | 0.2 | | |
| | | | 192,726,666 | | | | 15.8 | | |
| | | Value | | Percent | |
| Information Technology | |
Computer Hardware and Related
Equipment | | $ | 27,105,916 | | | | 2.2 | % | |
Business Information & Marketing
Services | | | 21,972,295 | | | | 1.8 | | |
| Business Software | | | 15,162,904 | | | | 1.2 | | |
| Publishing | | | 13,659,421 | | | | 1.1 | | |
| Semiconductors and Related Equipment | | | 13,039,289 | | | | 1.1 | | |
| Satellite Broadcasting | | | 12,107,763 | | | | 1.0 | | |
| Cable Television | | | 12,131,389 | | | | 1.0 | | |
| Internet Related | | | 10,827,857 | | | | 0.9 | | |
| Financial Processors | | | 10,604,747 | | | | 0.9 | | |
| Television Programming | | | 10,624,644 | | | | 0.9 | | |
| Telephone Services | | | 8,375,361 | | | | 0.7 | | |
| Telecommunication Equipment | | | 6,463,236 | | | | 0.5 | | |
| Computer Services | | | 4,802,160 | | | | 0.4 | | |
| Mobile Communications | | | 4,474,138 | | | | 0.4 | | |
| Television Broadcasting | | | 5,344,176 | | | | 0.4 | | |
| Electronics Distribution | | | 4,768,416 | | | | 0.4 | | |
| Instrumentation | | | 3,668,556 | | | | 0.3 | | |
| | | | 185,132,268 | | | | 15.2 | | |
| Energy/Minerals | |
| Mining | | | 55,819,250 | | | | 4.6 | | |
| Oil Services | | | 42,258,745 | | | | 3.4 | | |
Agricultural Commodities
(includes Forestry) | | | 16,804,647 | | | | 1.4 | | |
| Refining/Marketing/Distribution | | | 15,859,155 | | | | 1.3 | | |
| Oil/Gas Producers | | | 11,987,038 | | | | 1.0 | | |
| | | | 142,728,835 | | | | 11.7 | | |
| Other | |
| Real Estate | | | 34,809,171 | | | | 2.8 | | |
| Transportation | | | 26,143,795 | | | | 2.1 | | |
| Regulated Utilities | | | 21,168,670 | | | | 1.7 | | |
| | | | 82,121,636 | | | | 6.6 | | |
| HealthCare | |
| Medical Equipment | | | 16,274,395 | | | | 1.3 | | |
| Services | | | 15,800,973 | | | | 1.3 | | |
| Hospital/ Laboratory Supplies | | | 11,581,327 | | | | 1.0 | | |
| Pharmaceuticals | | | 10,622,793 | | | | 0.9 | | |
| | | | 54,279,488 | | | | 4.5 | | |
| Total Common Stocks | | | 1,143,361,916 | | | | 93.5 | | |
| Short-Term Obligations | | | 63,805,667 | | | | 5.2 | | |
| Total Investments | | | 1,207,167,583 | | | | 98.7 | | |
Cash and Other Assets
Less Liabilities | | | 16,312,528 | | | | 1.3 | | |
| Net Assets | | $ | 1,223,480,111 | | | | 100.0 | % | |
See accompanying notes to financial statements.
12
Wanger International Small Cap 2006 Semiannual Report
Statement of Assets and Liabilities
June 30, 2006 (Unaudited)
| Assets: | |
| Unaffiliated investments, at cost | | $ | 898,538,535 | | |
| Affiliated investments, at cost (see Note 4) | | | 6,418,835 | | |
| Unaffiliated investments, at value | | $ | 1,201,689,672 | | |
| Affiliated investments, at value (see Note 4) | | | 5,477,911 | | |
| Cash | | | 94 | | |
| Foreign currency (cost of $4,816,113) | | | 4,813,136 | | |
| Receivable for: | |
| Investments sold | | | 9,243,262 | | |
| Fund shares sold | | | 1,046,013 | | |
| Interest | | | 525 | | |
| Dividends | | | 2,454,706 | | |
| Foreign tax reclaims | | | 301,803 | | |
| Total Assets | | | 1,225,027,122 | | |
| Liabilities: | |
| Payable for: | |
| Investments purchased | | | 86,141 | | |
| Fund shares repurchased | | | 249,215 | | |
| Investment advisory fee | | | 880,387 | | |
| Transfer agent fee | | | 33 | | |
| Custody fee | | | 75,936 | | |
| Reports to shareholders | | | 208,628 | | |
| Other liabilities | | | 46,671 | | |
| Total Liabilities | | | 1,547,011 | | |
| Net Assets | | $ | 1,223,480,111 | | |
| Composition of Net Assets: | |
| Paid-in capital | | $ | 809,365,639 | | |
| Undistributed net investment income | | | 3,470,424 | | |
| Accumulated net realized gain | | | 108,387,318 | | |
| Net unrealized appreciation on: | |
| Investments | | | 302,210,213 | | |
| Foreign currency translations | | | 46,517 | | |
| Net Assets | | $ | 1,223,480,111 | | |
| Fund Shares Outstanding | | | 34,910,169 | | |
Net asset value, offering price and redemption
price per share | | $ | 35.05 | | |
Statement of Operations
For the Six Months Ended June 30, 2006 (Unaudited)
| Investment Income: | |
| Dividend income (net of foregin taxes $1,181,451) | | $ | 13,276,370 | | |
| Interest income | | | 661,611 | | |
| Total Investment Income | | | 13,937,981 | | |
| Expenses: | |
| Investment advisory fee | | | 5,318,333 | | |
| Transfer agent fee | | | 156 | | |
| Trustees' fees | | | 41,538 | | |
| Custody fee | | | 335,725 | | |
| Non-recurring costs (See Note 8) | | | 2,620 | | |
| Chief compliance officer expenses (See Note 4) | | | 14,310 | | |
| Other expenses | | | 208,300 | | |
| Total Expenses | | | 5,920,982 | | |
Non-recurring costs assumed by Investment
Adviser (See Note 8) | | | (2,620 | ) | |
| Custody earnings credit | | | (3,457 | ) | |
| Net Expenses | | | 5,914,905 | | |
| Net Investment Income | | | 8,023,076 | | |
Net Realized and Unrealized Gain (Loss) on
Portfolio Positions and Foreign Currency: | |
| Net realized gain (loss) on: | |
| Investments | | | 115,981,763 | | |
| Foreign currency transactions | | | (294,662 | ) | |
| Net realized gain | | | 115,687,101 | | |
Net change in unrealized appreciation
(depreciation) on: | |
| Unaffiliated Investments | | | 26,379,305 | | |
| Affiliated Investments (See Note 4) | | | (1,180,408 | ) | |
| Foreign currency translations | | | (4,936 | ) | |
Net change in unrealized
appreciation (depreciation) | | | 25,193,961 | | |
| Net Gain | | | 140,881,062 | | |
| Net Increase in Net Assets from Operations | | $ | 148,904,138 | | |
See accompanying notes to financial statements.
13
Wanger International Small Cap 2006 Semiannual Report
Statements of Changes in Net Assets
| Increase (Decrease) in Net Assets: | | (Unaudited)
Six Months
Ended
June 30,
2006 | | Year Ended
December 31,
2005 | |
| From Operations: | |
| Net investment income | | $ | 8,023,076 | | | $ | 6,925,101 | | |
| Net realized gain on investments and foreign currency transactions | | | 115,687,101 | | | | 49,977,164 | | |
Net change in unrealized appreciation
on investments and foreign currency transactions | | | 25,193,961 | | | | 99,148,485 | | |
| Net Increase in Net Assets from Operations | | | 148,904,138 | | | | 156,050,750 | | |
| Distributions Declared to Shareholders: | |
| From net investment income | | | (6,400,167 | ) | | | (6,966,978 | ) | |
| Share Transactions: | |
| Subscriptions | | | 150,109,792 | | | | 260,306,767 | | |
| Distributions reinvested | | | 6,400,167 | | | | 6,966,978 | | |
| Redemptions | | | (48,791,223 | ) | | | (49,872,795 | ) | |
| Net Increase from Share Transactions | | | 107,718,736 | | | | 217,400,950 | | |
| Total Increase in Net Assets | | | 250,222,707 | | | | 366,484,722 | | |
| Net Assets: | |
| Beginning of period | | | 973,257,404 | | | | 606,772,682 | | |
| End of period | | $ | 1,223,480,111 | | | $ | 973,257,404 | | |
| Undistributed Net Investment Income | | $ | 2,856,296 | | | $ | 1,847,515 | | |
See accompanying notes to financial statements.
14
Wanger International Small Cap 2006 Semiannual Report
Financial Highlights
| | | (Unaudited)
Six Months Ended
June 30, | | Year Ended December 31, | |
| Selected data for a share outstanding throughout each period | | 2006 | | 2005 | | 2004 | | 2003 | | 2002 | | 2001 | |
| Net Asset Value, Beginning of Period | | $ | 30.63 | | | $ | 25.46 | | | $ | 19.68 | | | $ | 13.27 | | | $ | 15.40 | | | $ | 28.53 | | |
Income from Investment Operations:
| Net investment income (a) | | | 0.24 | | | | 0.25 | | | | 0.13 | | | | 0.13 | | | | 0.07 | | | | 0.02 | | |
Net realized and unrealized gain (loss) on investments and
foreign currency transactions | | | 4.37 | | | | 5.20 | | | | 5.80 | | | | 6.33 | | | | (2.20 | ) | | | (5.12 | ) | |
| Total from Investment Operations | | | 4.61 | | | | 5.45 | | | | 5.93 | | | | 6.46 | | | | (2.13 | ) | | | (5.10 | ) | |
Less Distributions Declared to Shareholders:
| From net investment income | | | (0.19 | ) | | | (0.28 | ) | | | (0.15 | ) | | | (0.05 | ) | | | — | | | | — | | |
From net realized gain and unrealized gain reportable for
federal income taxes | | | — | | | | — | | | | — | | | | — | | | | — | | | | (8.03 | ) | |
| Total Distributions Declared to Shareholders | | | (0.19 | ) | | | (0.28 | ) | | | (0.15 | ) | | | (0.05 | ) | | | — | | | | (8.03 | ) | |
| Net Asset Value, End of Period | | $ | 35.05 | | | $ | 30.63 | | | $ | 25.46 | | | $ | 19.68 | | | $ | 13.27 | | | $ | 15.40 | | |
| Total Return (b) | | | 15.09 | %(c) | | | 21.53 | %(d) | | | 30.27 | % | | | 48.86 | % | | | (13.83 | )% | | | (21.27 | )% | |
Ratios to Average Net Assets/Supplemental Data:
| Expenses(e) | | | 1.02 | %(f) | | | 1.13 | % | | | 1.36 | % | | | 1.41 | % | | | 1.47 | % | | | 1.43 | % | |
| Net investment income(e) | | | 1.39 | %(f) | | | 0.92 | % | | | 0.59 | % | | | 0.85 | % | | | 0.46 | % | | | 0.10 | % | |
| Waiver | | | — | | | | 0.02 | % | | | — | | | | — | | | | — | | | | — | | |
| Portfolio turnover rate | | | 29 | %(c) | | | 24 | % | | | 47 | % | | | 45 | % | | | 54 | % | | | 56 | % | |
| Net assets, end of period (000's) | | $ | 1,223,480 | | | $ | 973,257 | | | $ | 606,773 | | | $ | 380,726 | | | $ | 216,084 | | | $ | 230,626 | | |
(a) Net investment income per share was based upon the average shares outstanding during the period.
(b) Total return at net asset value assuming all distributions are reinvested.
(c) Not annualized.
(d) Had the Investment Adviser not waived a portion of expenses, total return would have been reduced.
(e) The benefits derived from custody fees paid indirectly had no impact.
(f) Annualized.
See accompanying notes to financial statements.
15
Wanger International Small Cap 2006 Semiannual Report
Notes to Financial Statements (Unaudited)
1. Nature of Operations
Wanger International Small Cap (the "Fund") is a series of Wanger Advisors Trust (the "Trust"), an open-end management investment company organized as a Massachusetts business trust. The investment objective of the Fund is to seek long-term growth of capital. The Fund is available only for allocation to certain life insurance company separate accounts established for the purpose of funding qualified and non-qualified variable annuity contracts, and variable life insurance policies and may also be offered directly to certain types of pension plans and retirement arrangements.
2. Significant Accounting Policies
Security valuation
Securities of the Fund are valued at market value or, if a market quotation for a security is not readily available or is deemed not to be reliable because of events or circumstances that have occurred between the market quotation and the time as of which the security is to be valued, the security is valued at a fair value determined in accordance with procedures established by the Board of Trustees. Securities traded on securities exchanges or in over-the-counter markets in which transaction prices are reported are valued at the last sales price at the time of valuation. If a security is traded principally on the Nasdaq Stock Market Inc., the Nasdaq Official Closing Price will be applied. Securities for which there are no reported sales on the valuation date are valued at the latest bid quotation. Short-term debt obligations having a maturity of 60 days or less from the valuation date are valued on an amortized cost basis, whic h approximates fair value. Securities for which quotations are not readily available and any other assets are valued as determined in good faith under consistently applied procedures established by and under the general supervision of the Board of Trustees. The Trust has retained an independent statistical fair value pricing service to assist in the fair valuation process for securities principally traded in a foreign market in order to adjust for possible changes in value that may occur between the close of the foreign exchanges and the time at which fund shares are priced. If a security is valued at a "fair value," that value may be different from the last quoted market price for the security.
Repurchase agreements
The Fund may engage in repurchase agreement transactions. The Fund, through its custodians, receives delivery of underlying securities collateralizing each repurchase agreement. The Fund's investment adviser determines that the value of the underlying securities is at all times at least equal to the repurchase price including interest. In the event of default or bankruptcy by the other party to the agreement, realization and/or retention of the collateral may be subject to legal proceedings.
Foreign currency translations
Values of investments denominated in foreign currencies are converted into U.S. dollars using the spot market rate of exchange at the time of valuation. Purchases and sales of investments and dividend and interest income are translated into U.S. dollars using the spot market rate of exchange prevailing on the respective dates of such transactions. The gain or loss resulting from changes in foreign exchange rates is included with net realized and unrealized gain or loss from investments, as appropriate.
Security transactions and investment income
Security transactions are accounted for on the trade date (date the order to buy or sell is executed) and dividend income is recorded on the ex-dividend date, except that certain dividends from foreign securities are recorded as soon as the information is available to the Fund. Interest income is recorded on the accrual basis and includes amortization of discounts on short-term debt obligations and on long-term debt obligations when required for federal income tax purposes. Realized gains and losses from security transactions are reported on an identified cost basis.
Restricted Securities
Restricted securities are securities that may only be resold upon registration under federal securities laws or in transactions exempt from registration. In some cases, the issuer of restricted securities has agreed to register such securities for resale at the issuer's expense either upon demand by the Fund or in connection with another registered offering of the securities. Many restricted securities may be resold in the secondary market in transactions exempt from registration. Such restricted securities may be determined to be liquid under criteria established by the Board of Trustees. The Fund will not incur any registration costs upon such resale.
Use of Estimates
The preparation of financial statements in conformity with accounting principles generally accepted in the United States of America ("GAAP") requires management to make estimates and assumptions that affect the amounts reported in the financial statements and accompanying notes. Actual results may differ from those estimated.
Fund share valuation
Fund shares are sold and redeemed on a continuing basis at net asset value. Net asset value per share is determined daily as of the close of trading on the New York Stock Exchange (the "Exchange") on each day the Exchange is open for trading by dividing the total value of the Fund's investments and other assets, less liabilities, by the number of Fund shares outstanding.
Custody fees/Credits
Custody fees are reduced based on the Fund's cash balances maintained with the custodian. The Fund could have invested a portion of the assets utilized in connection with the expense offset arrangement in an income-producing asset if it had not entered in to such an agreement. The amount is disclosed as a reduction of total expenses in the Statement of Operations.
Indemnification
In the normal course of business, the Fund enters into contracts that contain a variety of representations and warranties which provide general indemnities. The Fund's maximum exposure under these arrangements is unknown, as this would involve future claims against the Fund. Also under the Trust's organizational documents, the Trustees and Officers of the Trust are indemnified against certain liabilities that may arise out of their duties to the Trust. However based on experience, the Fund expects the risk of loss due to these warranties and indemnities to be minimal.
Federal income taxes
The Fund has complied with the provisions of the Internal Revenue Code available to regulated investment companies and, in the manner provided therein, distribute all its taxable income, as well as any net realized gain on sales of investments and foreign currency transactions reportable for federal income tax purposes. Accordingly, the Fund paid no federal income taxes and no federal income tax provision was required.
Foreign Capital Gains Taxes
Realized gains in certain countries may be subject to foreign taxes at the fund level, at rates ranging from 10%-15%. The Fund accrues for such foreign taxes on net realized and unrealized gains at the appropriate rate for each jurisdiction.
Distributions to shareholders
Distributions to shareholders are recorded on the ex-date.
16
Wanger International Small Cap 2006 Semiannual Report
Notes to Financial Statements (Unaudited)
3. Federal Tax Information
The tax character of distributions paid during the year ended December 31, 2005 was as follows:
| | | December 31, 2005 | |
| Distributions paid from: | |
| Ordinary Income* | | $ | 6,966,978 | | |
* For tax purposes short-term capital gains distributions, if any, are considered ordinary income distributions.
The following capital loss carryforwards, determined as of December 31, 2005, may be available to reduce taxable income arising from future net realized gains on investments, if any, to the extent permitted by the Internal Revenue Code:
Year of
Expiration | | Capital Loss
Carryforwards | |
| 2010 | | $ | 4,559,033 | | |
| 2011 | | | 2,734,494 | | |
| Total | | $ | 7,293,527 | | |
Expired capital loss carryforwards, if any, are recorded as reduction of paid in capital. Capital loss carryforwards of $49,979,639 were utilized during the year ended December 31, 2005.
4. Transactions With Affiliates
Columbia Wanger Asset Management, L.P., ("Columbia WAM") a wholly-owned subsidiary of Columbia Management Group, Inc. ("CM"), which in turn is an indirect wholly owned subsidiary of Bank of America Corporation ("BOA"), furnishes continuing investment supervision to the Fund and is responsible for the overall management of the Fund's business affairs.
Under the Fund's investment management agreement, fees are accrued daily and paid monthly to Columbia WAM at the annual rates shown in the table below:
| Average Daily Net Assets | | Annual Fee Rate | |
| For the first $100 million | | | 1.15 | % | |
| Next $150 million | | | 1.00 | % | |
| Next $250 million | | | 0.95 | % | |
| In excess of $500 million | | | 0.85 | % | |
For the six months ended June 30, 2006, the Fund's annualized the effective investment advisory fee rate was 0.92%
Certain officers and trustees of the Trust are also officers of Columbia WAM. On June 7, 2006, the board of trustees of Wanger Advisors Trust nominated for election as trustees to the Wanger Advisors Trust board 11 individuals (each a "Nominee" and collectively the "Nominees"). Two of the Nominees are currently trustees of the Trust and the remaining nine Nominees are currently trustees of the Columbia Acorn Trust. A special meeting of the shareholders has been scheduled for September 11, 2006 to vote on the election of the Nominees. Notice of the special meeting, a proxy statement and a proxy card has been mailed to all shareholders of record as of the close of business on July 14, 2006. The Trust makes no direct payments to its officers and trustees who are affiliated with Columbia WAM. For the six months ended June 30, 2006, the Fund paid $41,538 to trustees not affiliated with Columbia WAM.
The Board of Trustees appointed a Chief Compliance Officer to the Fund in accordance with federal securities regulations. The Fund will pay its pro-rata share of the expenses associated with the Office of the Chief Compliance Officer. These expenses are disclosed separately as "Chief compliance officer expenses" in the Statement of Operations.
Columbia Management Distributors, Inc., a wholly owned subsidiary of BOA, serves as the principal underwriter of the Trust and receives no compensation for its services.
Columbia Management Services, Inc. (the "Transfer Agent"), a wholly owned subsidiary of BOA, provides shareholder services to the Fund and has subcontracted with Boston Financial Data Services ("BFDS") to serve as subtransfer agent. For such services, the Transfer Agent receives a fee, paid monthly, at the annual rate of $21.00 per open account. During the period covered by this report, the Transfer Agent has voluntarily waived its right to reimbursement for certain out-of-pocket expenses.
Columbia WAM has delegated to Columbia Management Advisors, LLC, an indirect wholly owned subsidiary of BOA, responsibility to provide certain administrative services to the Fund. An affiliate may include any company in which a fund owns five percent or more of its outstanding voting shares. On June 30, 2006, the Fund held five percent or more of the outstanding voting securities of one or more companies. Details of investments in those affiliated companies are presented on page 11.
During the six months ended June 30, 2006, the Fund engaged in purchases and sales transactions with funds that have a common investment adviser (or affiliated investment advisers), common Directors/Trustees, and/or common Officers. These purchase and sale transactions complied with the provisions of Rule 17a-7 under the Investment Company Act of 1940 and were $2,780,457 and $9,752,322, respectively.
5. Borrowing Arrangements
The Trust participates in a $150,000,000 credit facility, which was entered into to facilitate portfolio liquidity. Interest is charged to each participating fund based on its borrowings at a rate per annum equal to the Federal Funds rate plus 0.50%. In addition, a commitment fee of 0.10% per annum is accrued and apportioned among the participating funds based on their pro-rata portion of the unutilized line of credit. The commitment fee is included in "Other expenses" on the Statement of Operations. No amounts were borrowed under this facility for the six months ended June 30, 2006.
6. Fund Share Transactions
Proceeds and payments on Fund shares as shown in the statement of changes in net assets are in respect of the following numbers of shares:
| | | Six months ended
June 30, 2006 | | Year ended
December 31, 2005 | |
| Shares sold | | | 4,345,845 | | | | 9,532,675 | | |
Shares issued in reinvestment
of dividend distributions | | | 192,371 | | | | 252,061 | | |
| Less shares redeemed | | | 1,405,360 | | | | 1,842,378 | | |
| Net increase in shares outstanding | | | 3,132,856 | | | | 7,942,358 | | |
7. Investment Transactions
The aggregate cost of purchases and proceeds from sales other than short-term obligations for the six months ended June 30, 2006 were $373,032,927 and $328,946,786, respectively.
8. Legal Proceedings
Columbia WAM, Columbia Acorn Trust, another mutual fund family advised by Columbia WAM, and the trustees of Colombia Acorn Trust, are named as defendants in class and derivative complaints which have been consolidated in a Multi-District Action in the federal district court for the District of Maryland (the "MDL Action"). These lawsuits contend that defendants permitted certain investors to market time their trades in certain Columbia Acorn Funds. The MDL Action is ongoing. However, all claims against Columbia Acorn Trust and the independent trustees of Columbia Acorn Trust have been dismissed.
17
Wanger International Small Cap 2006 Semiannual Report
Notes to Financial Statements (Unaudited)
The Columbia Acorn Trust and Columbia WAM are also defendants in a class action lawsuit that alleges, in summary, that the Columbia Acorn Trust and Columbia WAM exposed shareholders of Columbia Acorn International fund to trading by market timers by allegedly (a) failing to properly evaluate daily whether a significant event affecting the value of that fund's securities had occurred after foreign markets had closed but before the calculation of the funds' net asset value ("NAV"); (b) failing to implement the fund's portfolio valuation and share pricing policies and procedures; and (c) failing to know and implement applicable rules and regulations concerning the calculation of NAV (the "Fair Valuation Lawsuit").The Seventh Circuit ruled that the plaintiffs' state law claims were preempted under federal law resulting in the dismissal of plaintiffs' complaint. Plaintiffs appealed the Seventh Circuit's ruling to the United States Su preme Court.
On March 21, 2005, a class action complaint was filed against the Columbia Acorn Trust and Columbia WAM seeking to rescind the Contingent Deferred Sales Charges assessed upon redemption of Class B shares of Columbia Acorn Funds due to the alleged market timing of the Columbia Acorn Funds. In addition to the rescission of sales charges, plaintiffs seek recovery of actual damages, attorneys' fees and costs. The case has been transferred to the MDL Action in the federal district court of Maryland.
On April 4, 2006, all of the parties to the MDL Action executed a letter settlement agreement intended to fully resolve all of the lawsuits consolidated in the MDL Action as well as the Fair Valuation Lawsuit. The settlement has not yet been finalized or approved by the court.
Columbia WAM, the Columbia Acorn Funds and the trustees of Columbia Acorn Trust are also defendants in a consolidated lawsuit filed in the federal district court of Massachusetts alleging that Columbia WAM used fund assets to make undisclosed payments to brokers as an incentive for the brokers to market that Columbia Acorn Funds over the other mutual funds to investors. The complaint alleges Columbia WAM and the Trustees of the Trust breached certain common laws duties and federal laws.
On November 30, 2005, the court dismissed all of the claims alleged against all of the parties in the consolidated complaint. Plaintiffs timely filed a notice of appeal of the district court's dismissal order with the First Circuit Court of Appeals. The parties subsequently executed a settlement term sheet to fully resolve all claims in the litigation. The settlement has not yet been finalized or approved by the court.
The Columbia Acorn Trust and Columbia WAM intend to defend these suits vigorously.
As a result of these matters or any adverse publicity or other developments resulting from them, there may be increased redemptions or reduced sales of Fund shares, which could increase transaction costs or operating expenses, or have other adverse consequences for the Funds.
In connection with the events described in detail above, various parties have filed suit against certain funds, their Boards and/or BOA (and affiliated entities). These suits are ongoing. However, based on currently available information, the Columbia Acorn Trust believes that the likelihood that these lawsuits will have a material adverse impact on any fund is remote, and Columbia WAM believes that the lawsuits are not likely to materially affect its ability to provide investment management services to the Funds.
For the six months ended June 30, 2006, CMG has assumed $2,620 in consulting services and legal fees incurred by the Fund in connection with these matters.
18
Wanger International Small Cap 2006 Semiannual Report
[Excerpts from:]
Wanger Advisors Trust
Management Fee Evaluation of the Senior Officer
Prepared Pursuant to the New York Attorney General's
Assurance of Discontinuance
2006
19
Wanger International Small Cap 2006 Semiannual Report
Introduction
The New York Attorney General's Assurance of Discontinuance ("Order") entered into by Columbia Management Advisors, Inc. ("CMAI") and Columbia Management Distributors, Inc., ("CMDI" and collectively with "CMAI," "CMG") in February 2005, allows CMAI to manage or advise a mutual fund, including the Wanger Advisors Trust's family of funds (the "WAT Funds" or "WAT" or "Trust"), only if the trustees of the WAT Funds appoint a "Senior Officer" to perform specified duties and responsibilities. One of these responsibilities includes "managing the process by which proposed management fees (including but not limited to, advisory fees) to be charged the [WAT Funds] are negotiated so that they are negotiated in a manner which is at arms' length and reasonable and consistent with this Assurance of Discontinuance."
The Order also provides that the Board of Trustees of the WAT Funds ("Board") must determine the reasonableness of proposed "management fees" by using either an annual competitive bidding process supervised by the Senior Officer or Independent Fee Consultant, or by obtaining "an annual independent written evaluation prepared by or under the direction of the Senior Officer or the Independent Fee Consultant."
"Management fees" are only part of the costs and expenses paid by mutual fund shareholders. The expenses can vary depending upon the class of shares held but usually include: (1) investment management or advisory fees to compensate analysts and portfolio managers for stock research and portfolio management, as well as the cost of operating a trading desk; (2) administrative expenses incurred to prepare registration statements and tax returns, calculate the Funds' net asset values, maintain effective compliance procedures and perform recordkeeping services; (3) transfer agency costs for establishing accounts, accepting and disbursing funds, as well as overseeing trading in Fund shares; and (4) custodial expenses incurred to hold the securities purchased by the Funds.
Columbia Wanger Asset Management, L.P. ("CWAM"), the adviser to the WAT Funds, has proposed that the Trust enter into an agreement that "bundles" the first two categories listed above: advisory and administrative services. The fees paid under this agreement are referred to as "management fees." Other fund expenses are governed by separate agreements, in particular agreements with two CWAM affiliates: CMDI, the broker-dealer that underwrites and distributes the WAT Funds' shares, and Columbia Management Services, Inc. ("CMSI"), the Funds' transfer agent. In conformity with the terms of the Order, this evaluation, therefore, addresses only the advisory and administrative contract between CWAM and the Trust, and does not extend to the other agreements.
According to the Order, the Senior Officer's evaluation must consider at least the following:
(1) Management fees (including components thereof) charged to institutional and other clients of CWAM for like services;
(2) Management fees (including any components thereof) charged by other mutual fund companies for like services;
(3) Costs to CWAM and its affiliates of supplying services pursuant to the management fee agreements, excluding any intra-corporate profit;
(4) Profit margins of CWAM and its affiliates from supplying such services;
(5) Possible economies of scale as the WAT Funds grow larger; and
(6) The nature and quality of CWAM's services, including the performance of each WAT Fund.
On November 17, 2004, the Board appointed me Senior Officer under the Order. The Board also determined not to pursue a competitive bidding process and instead, charged me with the responsibility of evaluating the WAT Funds' proposed advisory and administrative fee contract with CWAM in conformity with the requirements of the Order. This Report is an annual evaluation required under the Order. In discharging their responsibilities, the independent Trustees have also consulted independent, outside counsel.
2005 Evaluation
This is the second annual evaluation prepared in connection with the Order. The first annual evaluation ("2005 Evaluation") was issued on July 25, 2005. This evaluation follows the same structure as the 2005 Evaluation. Some areas are given more emphasis here, while others are given less. Still, the fundamental information gathered for this evaluation is the largely the same as last year. I have noted in this Report where methodologies diverged significantly.
This evaluation was performed in cooperation and regular communication with the Compliance/Contract Renewal Committee of the Board.
Process and Independence
The objectives of the Order are to insure the independent evaluation of the advisory fees paid by the WAT Funds as well as to insure that all relevant factors are considered. In my view, the contract renewal process has been conducted at arms-length and with independence in gathering, considering and evaluating all relevant data. At the outset of the process, the Trustees sought and obtained from CWAM and CMG a comprehensive compilation of data regarding Fund performance and expense, adviser profitability, and other information. In advance of the contract renewal process, the Board also explored CWAM's potential capacity restraints as they relate to the larger Columbia Acorn Fund complex managed by CWAM. The adviser's capacity to manage increasing assets is an issue posed by the size of the Columbia Acorn Fund, but impacts the domestic WAT Funds as well. Performance and expense data was obtained from both Morningstar and Lipper, the leading consultants in this area. The rankings prepared by Morningstar and Lipper were independent and were not influenced by the adviser. CWAM itself identified what it considers its competition in formulating its own peer group, and the Trustees considered that data as well.
20
Wanger International Small Cap 2006 Semiannual Report
My evaluation of the advisory contract was shaped, as it was last year, by my experience as WAT's Chief Compliance Officer ("CCO"). As CCO, I report solely to the Board and have no reporting obligation to or employment relationship with CMG or its affiliates, except for administrative purposes. This too contributes to the independence of this evaluation. I have commented on compliance matters in evaluating the quality of service provided by CWAM.
Since the 2005 Evaluation was issued, the Board has considered the recommendations and conclusions of that Report. In connection with the July 2005 contract renewal, the Board added a breakpoint of 10 basis points for Wanger International Small Cap for assets in excess of $500 million. Since that fund now has assets of $1.2 billion, management fees were reduced as a result. The Board has also gathered data on payments made by CWAM to insurance company partners as part of the Board's on-going consideration of whether to institute Rule 12b-1 fees for the WAT Funds. Finally, it has gathered and considered data from CWAM regarding its capacity to invest fund assets effectively.
This Report, its supporting materials and the data contained in other materials submitted to the Compliance/Contract Committee of the Board, in my view, provide a thorough factual basis upon which the Board, in consultation with independent counsel as it deems appropriate, may conduct management fee negotiations that are in the best interests of the WAT Funds' shareholders.
Finally, it should be noted that in June 2006, the WAT and Columbia Acorn Boards agreed in principle to merge, subject to appropriate shareholder approval. In view of this development, the WAT Trustees are considering the extension of the existing advisory contract for an interim period that would facilitate a review of the agreement by the combined board following the proposed merger for the remainder of the renewal period (through July 2007). Regardless of how the WAT Trustees ultimately choose to proceed in this respect, this Report provides the WAT Board with sufficient information to make an informed decision at this time regarding the advisory contract.
The Fee Reductions Mandated under the Order
Under the terms of the Order, CMG agreed to secure certain management fee reductions for the mutual funds advised by its affiliate investment advisers. In some instances, breakpoints were also established. Although neither CWAM nor the Trust was a party to the Order, CWAM offered and the Board accepted certain advisory fee reductions last year. By the terms of the Order, these fees may not be increased before November 30, 2009. I have used these advisory fee levels in my evaluation because they are the fees in the current agreements that CWAM proposes should be continued. Hence, these fee levels are the starting point of an evaluation.
Conclusions
My review of the data and other material above leads to the following conclusions with respect to the factors identified in the Order.
1. Performance. The domestic Funds generally have achieved outstanding performance. The Wanger US Smaller Companies and Wanger Select both rank very favorably against their peers. The international Funds have not, however, performed nearly as well as the domestic Funds, and continue to lag their benchmarks and peers. Management is taking steps to improve the performance of these funds.
2. Management Fees relative to Peers. The management fee rankings for the domestic funds are below their peers and hence less favorable to shareholders than competitors' funds. The international Funds fare much better, but the Morningstar and Lipper rankings diverge sharply.
3. Administrative Fees. The WAT Funds pay a bundled fee that combines advisory fees and administrative expense, so ranking these fees separately was not possible.
4. Management Fees relative to Institutional and Other Mutual Fund Accounts. CWAM's focus is on its mutual funds. It does not actively seek to manage separate or institutional accounts. The few institutional accounts it does manage vary in rate structures. Some pay advisory fees commensurate with or higher than the WAT Funds. In a few instances, however, institutional accounts pay lower advisory fees than do the WAT Funds.
5. Costs to CWAM and its Affiliates. CWAM's direct costs do not appear excessive, and in some areas have declined in the past year. Indirect costs allocated to CWAM by its parent organization, however, have increased substantially. CWAM's affiliates report operating losses and therefore do not appear to profit from CWAM's advisory agreement with the WAT Funds.
6. Profit Margins. CWAM's firm-wide, pre-marketing expense profit margins are at the top of the industry, though these comparisons are hampered by limited industry data. High profit margins are not unexpected for firms that manage large, successful funds and have provided outstanding investment performance for investors.
7. Economies of Scale. Economies of scale do exist at CWAM and will expand as the assets under management increase. They are, however, only partially reflected in the management fee schedule for the Funds. If the WAT Funds' assets continue to grow, under the Funds' current fee schedules, shareholders might not benefit in a manner generally commensurate with CWAM's increased profits.
21
Wanger International Small Cap 2006 Semiannual Report
8. Nature and Quality of Services. This category includes a variety of considerations that are difficult to quantify, yet can have a significant bearing on the performance of the WAT Funds. Several areas merit comment.
a. Capacity. CWAM's assets under management have continued to grow, posing ever greater challenges in deploying assets effectively. While trends here merit continued monitoring, CWAM appears to be managing assets effectively.
b. Compliance. CWAM has a reasonably designed compliance program that protects shareholders.
c. Administrative Services. The WAT Funds benefit from a variety of administrative services that are performed by CWAM and CMAI.
In my opinion, the process of negotiating an advisory contract for the WAT Funds has been conducted thoroughly and at arms' length. Further, the Trustees have sufficient information to evaluate management's proposal, and negotiate contract terms that are in the best interests of fund shareholders.
Recommendations
I believe the Trustees should:
1. Continue to consider ways to restructure the advisory fee beyond the current breakpoint schedule to reflect more fully economies of scale.
2. Monitor the performance of the international funds.
3. Continue to monitor CWAM's capacity limitations to insure that CWAM's expanding assets under management do not impair investment performance.
4. Consider unbundling of advisory and administrative fees.
5. Continue their consideration of whether to implement a plan under Rule 12b-1.
Robert P. Scales
July 24, 2006
22
Wanger International Select 2006 Semiannual Report
This page intentionally left blank.
23
Wanger International Small Cap 2006 Semiannual Report

Wanger Advisors Trust
Trustees
Patricia H. Werhane, Chairperson
Jerome L. Duffy
Kathryn A. Krueger, M.D.
Ralph Wanger
Officers
Charles P. McQuaid
President
Ben Andrews
Vice President
Michael G. Clarke
Assistant Treasurer
Jeffrey R. Coleman
Assistant Treasurer
J. Kevin Connaughton
Assistant Treasurer
John M. Kunka
Assistant Treasurer
Joseph C. LaPalm
Vice President
Bruce H. Lauer
Vice President, Treasurer and Secretary
Louis J. Mendes III
Vice President
Robert A. Mohn
Vice President
Christopher J. Olson
Vice President
Michelle H. Rhee
Assistant Secretary
Linda K. Roth-Wiszowaty
Assistant Secretary
Robert P. Scales
Chief Compliance Officer, Senior Vice President and General Counsel
Transfer Agent,
Dividend Disbursing Agent
Columbia Management Services, Inc.
P.O. Box 8081
Boston, Massachusetts
02266-8081
Distributor
Columbia Management Distributors, Inc.
One Financial Center
Boston, Massachusetts
02111-2621
Investment Adviser
Columbia Wanger Asset Management, L.P.
227 West Monroe Street, Suite 3000
Chicago, Illinois 60606
1-888-4-WANGER
(1-888-492-6437)
Legal Counsel
Bell, Boyd & Lloyd LLC
Chicago, Illinois
This report, including the schedules of investments and financial statements, is submitted for the general information of the shareholders of the Wanger Advisors Trust. This report is not authorized for distribution unless preceded or accompanied by a prospectus.
A description of the Fund's proxy voting policies and procedures is available (i) on the Fund's website, www.columbiafunds.com; (ii) on the Securities and Exchange Commission's website at www.sec.gov, and (iii) without charge, upon request, by calling 888-492-6437. Information regarding how the Fund voted proxies relating to portfolio securities during the 12-month period ended June 30, 2006, is available from the SEC's website.
The Fund files a complete schedule of portfolio holdings with the SEC for the first and third quarters of each fiscal year on Form N-Q. The Fund's Form N-Q is available on the SEC's website at www.sec.gov and may be reviewed and copied at the SEC's Public Reference Room in Washington, D.C. Information on the operation of the Pubic Reference Room may be obtained by calling 800-SEC-0330.
24
Wanger Advisors Trust
SHC-44/111956-0606 06/27479
Wanger Select
2006 Semiannual Report


Wanger Select
2006 Semiannual Report
| | | Table of Contents | |
| | 1 | | | Understanding Your Expenses | |
|
| | 2 | | | Understanding Our Investment Style | |
|
| | 4 | | | Performance Review | |
|
| | 6 | | | Statement of Investments | |
|
| | 8 | | | Statement of Assets and Liabilities | |
|
| | 8 | | | Statement of Operations | |
|
| | 9 | | | Statements of Changes in Net Assets | |
|
| | 10 | | | Financial Highlights | |
|
| | 11 | | | Notes to Financial Statements | |
|
| | 14 | | | Management Fee Evaluation of the Senior Officer | |
|
| | 20 | | | Board of Trustees and Management of Wanger Advisors Trust | |
|
Columbia Wanger Asset Management, L.P. ("Columbia WAM") is one of the leading global small-cap equity managers in the United States with more than 30 years of small- and mid-cap investment experience. Columbia WAM manages more than $30 billion in equities and is the investment adviser to Wanger U.S. Smaller Companies, Wanger International Small Cap, Wanger Select, Wanger International Select and the Columbia Acorn Family of Funds. Columbia Management Group, LLC ("Columbia Management") is the primary investment management division of Bank of America Corporation. Columbia Management entities furnish investment management services and advises institutional and mutual fund portfolios. Columbia WAM is a SEC-registered investment adviser and indirect, wholly owned subsidiary of Bank of America Corporation.
For more complete information about our funds, including the Columbia Acorn Funds, our fees, risks associated with investing, or expenses, call 1-888-4-WANGER for a prospectus. Read it carefully before you invest or send money. This report is not an offer of the shares of the Columbia Acorn Fund Family.
The discussion in the report of portfolio companies is for illustration only and is not a recommendation of individual stocks. The information is believed to be accurate, but the information and the views of the portfolio managers may change at any time without notice and the portfolio managers may alter a fund's portfolio holdings based on these views and the fund's circumstances at that time.
Wanger Select 2006 Semiannual Report
Understanding Your Expenses
As a Fund shareholder, you incur two types of costs. There are transaction costs, which generally include sales charges on purchases and may include redemption or exchange fees. There are also ongoing costs, which generally include investment advisory and other Fund expenses. The information on this page is intended to help you understand your ongoing costs of investing in the Fund and to compare these costs with the ongoing costs of investing in other mutual funds.
Analyzing the Fund's expenses
To illustrate these ongoing costs, we have provided an example and calculated the expenses paid by investors in the Fund during the reporting period. The information in the following table is based on an initial investment of $1,000.00, which is invested at the beginning of the reporting period and held for the entire period. Expense information is calculated two ways and each method provides you with different information. The amount listed in the "actual" column is calculated using actual operating expenses and total return for the Fund. The amount listed in the "hypothetical" column assumes that the return each year is 5% before expenses and then applies the Fund's actual expense ratio for the period to the hypothetical return. You should not use the hypothetical account values and expenses to estimate either your actual account balance at the end of the period or the expenses you paid during the reporting period. See the "Co mpare with other funds" information for details on using the hypothetical data.
Estimating your actual expenses
To estimate the expenses that you paid over the period, first you will need your account balance at the end of the period.
1. Divide your ending account balance by $1,000.00. For example, if an account balance was $8,600.00 at the end of the period, the result would be 8.6.
2. In the section of the table below titled "Expenses paid during period,"you will find a dollar amount in the column labeled "Actual." Multiply this amount by the result from step 1. Your answer is an estimate of the expenses you paid on your account during the period.
January 1, 2006 – June 30, 2006
| | | Account value at the
beginning of the period ($) | | Account value at the
end of the period ($) | | Expenses paid during
period ($) | | Fund's annualized
expense ratio (%)* | |
| | | Actual | | Hypothetical | | Actual | | Hypothetical | | Actual | | Hypothetical | | | |
| Wanger Select | | | 1,000.00 | | | | 1,000.00 | | | | 1,055.09 | | | | 1,020.13 | | | | 4.79 | | | | 4.71 | | | | 0.94 | | |
*For the six months ended June 30, 2006.
Expenses paid during the period are equal to the Fund's annualized expense ratio, multiplied by the average account value over the period, then multiplied by the number of days in the Fund's most recent fiscal half-year and divided by 365.
Had the investment adviser not waived a portion of expenses, total return would have been reduced.
It is important to note that the expense amounts shown in the table are meant to highlight only ongoing costs of investing in the Fund. As a shareholder of the Fund, you do not incur any transaction costs, such as sales charges, redemption or exchange fees. Expenses paid during the period do not include any insurance charges imposed by your insurance company's separate account. The hypothetical example provided is useful in comparing ongoing costs only and will not help you determine the relative total costs of owning different funds whose shareholders may incur transaction costs.
Compare with other funds
Since all mutual funds are required to include the same hypothetical calculations about expenses in shareholder reports, you can use this information to compare the ongoing cost of investing in the Fund with other funds. To do so, compare the 5% hypothetical example with the 5% hypothetical examples of other funds. As you compare hypothetical examples of other funds, it is important to note that hypothetical examples are meant to highlight the ongoing cost of investing in a fund and do not reflect any transactional costs, such as sales charges or redemption or exchange fees, that may be incurred by shareholders of other funds. Expenses paid during the period do not include any insurance charges imposed by your insurance company's separate accounts.
1
Wanger Select 2006 Semiannual Report

Understanding Our Investment Style
Why Small and Mid Caps?
Our mission is simple: Invest in good quality, reasonably priced smaller companies that have growth potential and competitive advantages, and hold on to them. We like small companies because they are generally less complicated. Big companies typically have lots of divisions, while most small companies have one division. An added benefit is that sometimes these small companies are undiscovered, which may mean they are undervalued and a potentially good investment. Managers of small companies tend to focus on customers and are acutely aware of competitors. Small-cap stocks are often exciting businesses run by accessible managers, so in addition to the above virtues, they are fun for us to follow.
Though we like small-caps, we don't force sales of successful stocks simply because they appreciated beyond some arbitrary small-cap definition (other small-cap managers may sell at $2 billion capitalizations, for example). The funds we manage could not make strong gains if we simply sold due to size. We let our winners run.
While style classifications can be helpful, we are not style purists. For example, small-cap stocks have outperformed large caps for more than five years, and we think on average they are no longer cheap based on historical valuation. Our analysts have been finding more value among mid-cap names that have the same attributes we like in small caps.
Why Growth-at-a-Reasonable-Price?
At Columbia Wanger Asset Management, we define growth investing styles using the terms Hard Core Value, Growth-at-a-Reasonable-Price (GARP) and Momentum. These terms help define the different ways that an investor can look for returns.
Hard Core Value investors usually buy very cheap stocks, as measured by comparing the stock valuation to the underlying asset values. While this strategy works for a number of competitors who are very good at it, Hard Core Value is not for us. We believe that too often the stocks are very cheap because the underlying businesses are lousy. Successful investing in Hard Core Value largely depends on predicting (or hastening) events such as takeovers, spinouts or turnarounds. Until such an event occurs the stock may be a diminishing asset.
In implementing our Growth-at-a-Reasonable-Price style, our 21 analysts first search for good, growing businesses. We view what we do as investing in companies rather than stocks, and we try to analyze companies as if we were buying the whole business rather than just a fraction of ownership. We define "good, growing businesses" as companies that have sustainable competitive advantages, fine managements, growing markets, and opportunities for market-share gains. Once we've found a good business that has been growing, we follow the company closely and determine if it sells at what we believe is a "reasonable price."
A stock is at a reasonable price if it sells at (or hopefully below) what we believe is its true value. Most growth companies ("growth stock" is a misnomer) are valued by the market based on price-to-earnings (PE) ratios, and comparisons between growth companies are often based on PE-to-growth (PEG) ratios. While that approach makes theoretical sense, reported earnings are often poor measures of underlying economic profits. For example, the costs of employee stock options were not required to be an accounting expense until 2006, so underlying earnings of many companies were overstated. In other cases, companies may have higher free cash flows than suggested by reported earnings. We ask our analysts to look beyond reported earnings and adjust for many factors when using PE ratios or related dividend discount model valuations. Our analysts also use value discipline techniques, calculating potential sell-out or break-up values, whe n it is appropriate to do so.
Often we determine that the stock of a good business that has been growing is not selling at a reasonable price. In those cases we wait—and there have been times that we've waited for years. If valuation is borderline, we can purchase an initial small position and later increase the position or sell the stock depending on fundamentals or valuation. Valuation matters because it enables our shareholders to potentially benefit in two ways: (1) from growth of the underlying business and (2) from growth of a valuation multiplier, such as a PE ratio.
The remaining growth style definition is Momentum. Momentum players (I hesitate to say "investors") look for stocks that have been rising, along with fast earnings growth, and preferably earnings estimate increases. Many Momentum players completely ignore valuation. (Economists label luxury goods as those where demand rises when prices increase, so momentum players are the ultimate luxury goods buyers!) Because Momentum players buy at any price when earnings are good and often sell at any price when earnings are disappointing, we often like to sell our winners to them and sometimes buy their losers—at our dream prices. Momentum can work, especially in bubbles, but it's not for us. It's too far from our mission of investing in good businesses and targeting rational returns.
Just as individual stocks can graduate from small to mid to large caps, they can also move from Hard Core Value to Growth-at-a-Reasonable-Price and then to Momentum. We love to buy stocks in companies not yet recognized as growth businesses. If we can find good companies that we believe are
2
Wanger Select 2006 Semiannual Report
mistakenly priced at Hard Core Value levels, even better. Often our best performing stocks were those that were undiscovered when we bought them, and as they grew, became investor favorites because of their strong business models. We are often challenged (in a good way) when stocks rise to Momentum valuations. The challenge then becomes when to sell. We try to resist significant selling unless we think fundamentals will deteriorate or valuations are entirely inappropriate vs. fundamentals.
Having a sensible investment style is very useful, but it is not enough for long-term success. Other factors, such as our process and the people who make up our investment team, will be discussed in future columns.


Charles P. McQuaid
President and Chief Investment Officer
Columbia Wanger Asset Management, L.P.
The views expressed in "Understanding Our Investment Style" are those of the author. These views are not guarantees of future performance and involve certain risks, uncertainties and assumptions that are difficult to predict so actual outcomes and results may differ significantly from the views expressed. These views are subject to change at any time based upon economic, market or other conditions and the respective parties disclaim any responsibility to update such views. These views may not be relied on as investment advice and, because investment decisions for a Wanger Advisors Fund are based on numerous factors, may not be relied on as an indication of trading intent on behalf of any particular Wanger Advisors Fund. References to specific company securities should not be construed as a recommendation or investment advice.
Mid- and small-cap stocks are often more volatile and less liquid than the stocks of larger companies. Small companies may have a shorter history of operations than larger companies and may have a less diversified product line, making them more susceptible to market pressure. Investments in foreign securities have special risks, including political or economic instability, higher costs, different regulations, accounting standards, trading practices and levels of information, and currency exchange rate fluctuations.
3
Wanger Select 2006 Semiannual Report

Performance Review Wanger Select

Ben Andrews
Portfolio Manager
Performance data quoted represents past performance and current performance may be lower or higher. Past performance is no guarantee of future results. The investment return and principal value will fluctuate so that shares, when redeemed, may be worth more or less than the original cost. For monthly performance updates call 1-888-4-WANGER.
For the semiannual period through June 30, Wanger Select was up 5.51% (without insurance charges), 1.27% greater than its S&P MidCap 400 benchmark and 2.80% greater than the S&P 500's year-to-date gain of 2.71%. The Fund was down 2.08% in the second quarter vs. a 3.14% decline of the S&P MidCap 400 Index.
Focusing on the stocks that drove Wanger Select's performance for the six months, the Fund had one stock that was consistently up and one stock that was consistently down for the half year. The Fund's up stock was Expeditors International of Washington, a freight forwarding company. Expeditors gained more than 66% for the semiannual period and added 1.6% to the Fund's overall portfolio return. On the negative side, Avid Technology cost the Fund approximately 1.6% of overall performance year-to-date. Avid's acquisition of Pinnacle Systems did not initially meet expectations. I recently met with Avid's divisional head of Pinnacle and I also met with an Avid customer. Though it's clear that we put Avid into the Fund too early, our confidence has consistently grown as well as the Fund's share position. We believe Avid is putting the right management and products in place to build on its leading market share in consumer video, broadc ast, storage and audio.
We sold out of five existing positions in the six months and purchased two new positions. Three of the sales were made because we believed company fundamentals were beginning to weaken (Coventry Health Care, Associated Banc-Corp and Tektronix). TCF Financial was sold as new competition dampened growth prospects for the bank. IAC/Interactive, a smaller position in the Fund, was sold because we felt it was expensive. Petco Animal Supplies was added because we believe the humanization of pets trend is powerful and the demand is great in this category. Sanmina-SCI, a provider of electronics contract manufacturing services (EMS) was also added during the half year. Columbia WAM owned and sold Sanmina pre-2000 before the EMS industry got overheated. Numerous EMS companies purchased manufacturing assets or other EMS players at ridiculously high prices during the Internet bubble. Sanmina was no exception during this phase; it purchased several companies in 2000 and 2001. Since the acquisitions, Sanmina has struggled to improve its operating margins, but we believe the company is now on track to improve its bottom line.
U.S. stocks began to decline in the weeks following the period end. The main fear is that rising global interest rates could curtail economic growth. The small-cap Russell 2000 Index, which had been up more than 16% early in the second quarter, lost almost all of this gain just following the period end in mid-July. At the end of the third quarter last year, smaller cap stocks were somewhat expensive compared to their larger cap peers. At that point, we were finding better value in larger mid-cap names. In the first few months of this year, small caps got even more expensive before taking the mid-year dive. This recent sell-off has corrected some of the excess and we are now finding some interesting stock ideas to watch among the smaller end of the Fund's investment range. We're not ready to load up on these ideas yet, but we believe that they have a lot of promise and could be drivers of the Fund's portfolio next year. Could the economy slow down in the next few quarters and make some of these ideas less promising? Sure. But it's been our experience that the market usually overreacts to a slowing economy making new investment ideas more attractive.
Wanger Select is a non-diversified fund that invests primarily in the stocks of medium- to larger-size U.S. companies. Each stock may represent a significant part of its overall portfolio. The performance of each of these larger holdings will have a greater impact on Wanger Select's total return and may make the Fund's returns more volatile than a more diversified fund. Wanger Select is a non-diversified fund. The performance of each of its holdings will have a greater impact on the Fund's total return, and may make the Fund's returns more volatile than a more diversified fund. Mid-cap stocks tend to be more volatile and may be less liquid than the stocks of larger companies.
As of 6/30/06, the Fund's positions in the stocks mentioned were: Expeditors International of Washington; 3.8%; Avid Technology, 2.8%; Coventry Health Care, 0.0%; Associated Banc-Corp, 0.0%; Tektronix, 0.0%; TCF Financial, 0.0%; IAC/Interactive, 0.0%; Petco Animal Supplies, 1.4%; Sanmina-SCI, 1.0%.
See next page for index definitions.
4
Wanger Select 2006 Semiannual Report
Growth of a $10,000 Investment in
Wanger Select
Total return for each period,
February 1, 1999 (inception date) through June 30, 2006
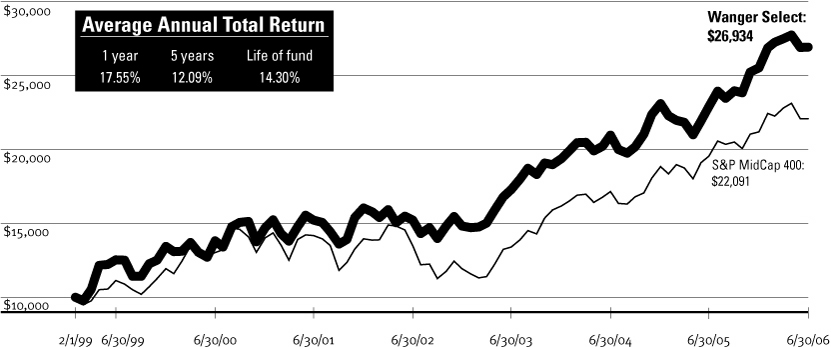
This graph compares the results of $10,000 invested in Wanger Select on February 1, 1999 (the date the Fund began operations) through June 30, 2006, to the S&P MidCap 400 Index, with dividends and capital gains reinvested. Part of the performance shown is due to the Fund's purchase of securities in IPOs. The impact of IPO purchases declines as a Fund grows large. Performance results reflect any voluntary waivers or reimbursements of Fund expenses by the Advisor or its affiliates. Absent these waivers or reimbursement arrangements, performance results would have been lower.
Performance shown here is past performance, which cannot guarantee future results. Current performance may be higher or lower. The investment return and principal value of an investment in the Fund will fluctuate so that Fund shares, when redeemed, may be worth more or less than their original cost. Performance changes over time. Current returns for the Fund may be different than that shown. For monthly performance updates, please contact us at 1-888-4-WANGER.
Results to June 30, 2006
| | | 2nd quarter | | Year-to-date | | 1 year | |
| Wanger Select | | | -2.08 | % | | | 5.51 | % | | | 17.55 | % | |
| S&P MidCap 400 | | | -3.14 | | | | 4.24 | | | | 12.98 | | |
| S&P 500 | | | -1.44 | | | | 2.71 | | | | 8.63 | | |
| Lipper Mid-Cap Growth Index | | | -4.64 | | | | 4.40 | | | | 15.46 | | |
NAV as of 6/30/06: $23.05
Performance numbers reflect all Fund expenses but do not include any insurance charge imposed by your insurance company's separate accounts. If performance included the effect of these additional charges, it would be lower.
Due to ongoing market volatility, performance is subject to substantial short-term fluctuations.
The S&P MidCap 400 is a market value-weighted index of 400 U.S. stocks that are in the next tier down from the S&P 500. The S&P 500 is a broad market-weighted average of blue-chip U.S. companies. The Lipper Mid-Cap Growth Index measures the performance of the 30 largest mid-cap growth funds tracked by Lipper. All indexes are unmanaged and include reinvested dividends. It is not possible to invest directly in an index.
Portfolio characteristics and holdings are subject to change periodically and may not be representative of current characteristics and holdings.
Top 5 Industries
As a % of net assets, as of 6/30/06
| Consumer Goods & Services | | | 29.4 | % | |
| Information Group | | | 28.5 | | |
| Industrial Goods | | | 13.7 | | |
| Energy/Minerals | | | 11.4 | | |
| Finance | | | 9.2 | | |
Top 10 Holdings
As a % of net assets, as of 6/30/06
1. Tellabs
Telecommunications Equipment | | 6.7%
| |
2. ITT Educational Services
Post-secondary Degree Programs | | 5.5
| |
3. Liberty Global
CATV Holding Company | | 4.7
| |
4. Safeway
Supermarkets | | 4.6
| |
5. UrAsia Energy
Uranium Mining in Kazakhstan | | 4.1
| |
6. Abercrombie & Fitch
Teen Apparel Retailer | | 4.0
| |
7. Expeditors International of Washington
International Freight Forwarder | | 3.8
| |
8. American Tower
Communication Towers in USA & Mexico | | 3.7
| |
9. Harley-Davidson
Motorcycles & Related Merchandise | | 3.1
| |
10. Pride International
Offshore Drilling Contractor | | 3.1
| |
5
Wanger Select 2006 Semiannual Report
Wanger Select
Statement of Investments (Unaudited) June 30, 2006
Number of
Shares | | | | Value | |
| | | Common Stocks – 94.0% | | | | | |
| | | Consumer Goods & Services – 29.4% | |
| | | Other Consumer Services – 11.7% | |
115,000
| | ITT Educational Services (b)
Post-secondary Degree Programs | | | $7,568,150
| | |
248,000
| | Safeway
Supermarkets | | | 6,448,000
| | |
53,000
| | Weight Watchers International
Weight Loss Programs | | | 2,167,170
| | |
| | | | | | 16,183,320 | | |
| | | Retail – 7.9% | |
100,000
| | Abercrombie & Fitch
Teen Apparel Retailer | | | 5,543,000
| | |
60,000
| | Costco Wholesale
Warehouse Superstores | | | 3,427,800
| | |
96,000
| | Petco Animal Supplies (b)
Pet Supplies & Services | | | 1,961,280
| | |
| | | | | | 10,932,080 | | |
| | | Leisure Products – 4.9% | |
79,500
| | Harley-Davidson
Motorcycles & Related Merchandise | | | 4,363,755
| | |
53,000
| | International Speedway
Largest Motorsports Racetrack
Owner & Operator | | | 2,457,610
| | |
| | | | | | 6,821,365 | | |
| | | Travel – 2.5% | |
235,300
| | Expedia (b)
Online Travel Services Company | | | 3,522,441
| | |
| | | Apparel – 2.4% | |
113,000
| | Coach (b)
Designer & Retailer of Branded Leather
Accessories | | | 3,378,700
| | |
| | | Consumer Goods & Services – Total | | | 40,837,906 | | |
| | | Information Group – 28.5% | |
| | | Telecommunications Equipment – 6.7% | |
699,000
| | Tellabs (b)
Telecommunications Equipment | | | 9,303,690
| | |
| | | CATV – 6.7% | |
316,524
| | Liberty Global (b)
CATV Holding Company | | | 6,591,134
| | |
Number of
Shares | | | | Value | |
| | | CATV – 6.7% (cont) | |
183,000
| | Discovery Holding (b)
CATV Programming | | | $2,677,290
| | |
| | | | | | 9,268,424 | | |
| | | Business Software – 4.7% | |
118,000
| | Avid Technology (b)
Digital Nonlinear Editing Software &
Systems | | | 3,932,940
| | |
394,000
| | Novell (b)
Directory, Operating System & Identity
Management Software | | | 2,612,220
| | |
| | | | | | 6,545,160 | | |
| | | Mobile Communications – 3.7% | |
163,500
| | American Tower (b)
Communications Towers in USA & Mexico | | | 5,088,120
| | |
| | | Internet Related – 2.6% | |
600,000
| | SkillSoft (b)
Web-based Learning Solutions (E-Learning) | | | 3,672,000
| | |
| | | Financial Processors – 1.8% | |
51,100
| | SEI Investments
Mutual Fund Administration & Investment
Management | | | 2,497,768
| | |
| | | Publishing – 1.1% | |
49,600
| | Tribune Company
Newspapers & TV Stations | | | 1,608,528
| | |
| | | Contract Manufacturing – 1.0% | |
292,000
| | Sanmina (b)
Backplane & Electronic Manufacturing Services | | | 1,343,200
| | |
| | | Computer Services – 0.2% | |
86,500
| | Answerthink (b)
IT Integration & Best Practice Research | | | 348,595
| | |
| | | Information Group – Total | | | 39,675,485 | | |
| | | Industrial Goods – 13.7% | |
| | | Other Industrial Services – 3.8% | |
94,000
| | Expeditors International of Washington
International Freight Forwarder | | | 5,264,940
| | |
| | | Outsourcing Services – 2.7% | |
214,000
| | Quanta Services (b)
Electrical & Telecom Construction Services | | | 3,708,620
| | |
See accompanying notes to financial statements.
6
Wanger Select 2006 Semiannual Report
Wanger Select
Statement of Investments (Unaudited) June 30, 2006
Number of
Shares | | | | Value | |
| | | Steel – 2.5% | |
169,000
| | Worthington Industries
Steel Processing | | | $3,540,550
| | |
| | | Waste Management – 2.4% | |
92,000
| | Waste Management
U.S. Garbage Collection & Disposal | | | 3,300,960
| | |
| | | Industrial Materials – 2.3% | |
80,000
| | Mine Safety Appliances
Safety Equipment | | | 3,216,000
| | |
| | | Industrial Goods – Total | | | 19,031,070 | | |
| | | Energy/Minerals – 11.4% | |
| | | Mining – 6.2% | |
2,245,000
| | UrAsia Energy (Canada) (b)
Uranium Mining in Kazakhstan | | | 5,631,103
| | |
35,000
| | Potash (Canada)
World's Largest Producer of Potash | | | 3,008,950
| | |
| | | | | | 8,640,053 | | |
| | | Oil Services – 5.2% | |
138,000
| | Pride International (b)
Offshore Drilling Contractor | | | 4,309,740
| | |
43,000
| | FMC Technologies (b)
Oil & Gas Well Head Manufacturer | | | 2,900,780
| | |
| | | | | | 7,210,520 | | |
| | | Energy/Minerals – Total | | | 15,850,573 | | |
| | | Finance – 9.2% | |
| | | Money Management – 5.1% | |
227,500
| | Janus Capital Group
Manages Mutual Funds | | | 4,072,250
| | |
69,500
| | Nuveen Investments
Specialty Mutual Funds | | | 2,991,975
| | |
| | | | | | 7,064,225 | | |
| | | Insurance – 4.1% | |
129,900
| | Conseco (b)
Life, Long Term Care & Medical
Supplement Insurance | | | 3,000,690
| | |
Number of Shares
or Principal Amount | | | | Value | |
| | | Insurance – 4.1% (cont) | |
7,900
| | Markel (b)
Specialty Insurance | | | $2,741,300
| | |
| | | | | | 5,741,990 | | |
| | | Finance – Total | | | 12,806,215 | | |
| | | Health Care – 1.8% | |
| | | Healthcare Services – 1.8% | |
65,000
| | Lincare Holdings (b)
Home Healthcare Services | | | 2,459,600
| | |
| | | Health Care – Total | | | 2,459,600 | | |
| | | Total Common Stocks (Cost: $104,142,477) – 94.0% | | | 130,660,849 | | |
| Short-Term Obligation – 3.6% | |
| $ | 4,944,000 | | | Repurchase Agreement with
State Street Bank & Trust
dated 06/30/06, due 07/03/06 at
4.93% collateralized by a Federal
Home Loan Bank Note, maturing 05/22/08
market value $5,045,000 (repurchase
proceeds: $4,946,031) | | | 4,944,000 | | |
| | | (Cost: $4,944,000) | | | 4,944,000 | | |
| | | Total Investments (Cost: $109,086,477) – 97.6% (a) | | | 135,604,849 | | |
| | | Cash and Other Assets Less Liabilities – 2.4% | | | 3,334,849 | | |
| | | Total Net Assets – 100% | | $ | 138,939,698 | | |
Notes to Statement of Investments:
(a) At June 30, 2006, cost for federal income tax purposes is $109,086,477. The net unrealized appreciation was $26,518,372 consisting of gross unrealized appreciation of $30,661,062 and gross unrealized depreciation of $4,142,690.
(b) Non-income producing security
At June 30, 2006, the Fund held investments in the following sectors:
| Sector | | % of
Net Assets | |
| Consumer Goods & Services | | | 29.4 | % | |
| Information Group | | | 28.5 | | |
| Industrial Goods | | | 13.7 | | |
| Energy/Minerals | | | 11.4 | | |
| Finance | | | 9.2 | | |
| Health Care | | | 1.8 | | |
| Short-Term Obligations | | | 3.6 | | |
| Cash and Other Assets Less Liabilities | | | 2.4 | | |
| | | | 100.0 | % | |
See accompanying notes to financial statements.
7
Wanger Select 2006 Semiannual Report
Statement of Assets and Liabilities
June 30, 2006 (Unaudited)
| Assets: | |
| Investments, at cost | | $ | 109,086,477 | | |
| Investments, at value | | $ | 135,604,849 | | |
| Cash | | | 72 | | |
| Receivable for: | |
| Investments sold | | | 3,246,811 | | |
| Fund shares sold | | | 292,648 | | |
| Interest | | | 677 | | |
| Dividends | | | 23,535 | | |
| Other assets | | | 397 | | |
| Total Assets | | | 139,168,989 | | |
| Liabilities: | |
| Payable to custodian bank | | | 33 | | |
| Payable for: | |
| Investments purchased | | | 16,000 | | |
| Fund shares repurchased | | | 84,292 | | |
| Investment advisory fee | | | 93,658 | | |
| Transfer agent fee | | | 39 | | |
| Trustees' fees | | | 372 | | |
| Audit fee | | | 13,828 | | |
| Reports to shareholders | | | 21,069 | | |
| Total Liabilities | | | 229,291 | | |
| Net Assets | | $ | 138,939,698 | | |
| Composition of Net Assets: | |
| Paid-in capital | | $ | 110,629,104 | | |
| Accumulated net investment loss | | | (745,523 | ) | |
| Accumulated net realized gain | | | 2,537,745 | | |
| Net unrealized appreciation investments | | | 26,518,372 | | |
| Net Assets | | $ | 138,939,698 | | |
| Fund Shares outstanding | | | 6,027,973 | | |
Net asset value, offering price and redemption
price per share | | $ | 23.05 | | |
Statement of Operations
For the Six Months Ended June 30, 2006 (Unaudited)
| Investment Income: | |
| Dividend Income | | $ | 376,063 | | |
| Interest income | | | 117,052 | | |
| Total Investment Income | | | 493,115 | | |
| Expenses: | |
| Investment advisory fee | | | 534,548 | | |
| Transfer agent fee | | | 125 | | |
| Trustees' fees | | | 4,983 | | |
| Custody fee | | | 4,515 | | |
| Chief compliance officer expenses (See Note 4) | | | 1,547 | | |
| Non-recurring costs (See note 8) | | | 284 | | |
| Other expenses | | | 42,468 | | |
| Total Expenses | | | 588,470 | | |
Non-recurring costs assumed by
Investment Adviser (See Note 8) | | | (284 | ) | |
| Custody earnings credit | | | (1,022 | ) | |
| Net Expenses | | | 587,164 | | |
| Net Investment Loss | | | (94,049 | ) | |
Net Realized and Unrealized Gain (Loss) on
Portfolio Positions and Foreign Currency: | |
| Net realized gain (loss) on: | |
| Investments | | | 2,546,934 | | |
| Foreign currency transactions | | | (1,939 | ) | |
| Net realized gain | | | 2,544,995 | | |
Net change in unrealized appreciation
on investments | | | 2,945,135 | | |
| Net Gain | | | 5,490,130 | | |
| Net Increase in Net Assets from Operations | | $ | 5,396,081 | | |
See accompanying notes to financial statements.
8
Wanger Select 2006 Semiannual Report
Statements of Changes in Net Assets
| Increase (Decrease) in Net Assets: | | (Unaudited)
Six months
ended
June 30,
2006 | | Year ended
December 31,
2005 | |
| From Operations: | |
| Net investment loss | | $ | (94,049 | ) | | $ | (174,644 | ) | |
| Net realized gain on investments and foreign currency transactions | | | 2,544,995 | | | | 3,974,336 | | |
Net change in unrealized appreciation
on investments | | | 2,945,135 | | | | 5,887,592 | | |
| Net Increase in Net Assets from Operations | | | 5,396,081 | | | | 9,687,284 | | |
| Distributions Declared to Shareholders: | |
| From net investment income | | | (466,512 | ) | | | — | | |
| From net realized gains | | | (3,873,384 | ) | | | (5,786,576 | ) | |
| Total Distributions Declared to Shareholders | | | (4,339,896 | ) | | | (5,786,576 | ) | |
| Share Transactions: | |
| Subscriptions | | | 42,100,605 | | | | 25,483,902 | | |
| Distributions reinvested | | | 4,339,896 | | | | 5,786,576 | | |
| Redemptions | | | (11,230,679 | ) | | | (14,962,504 | ) | |
| Net Increase from Share Transactions | | | 35,209,822 | | | | 16,307,974 | | |
| Total Increase in Net Assets | | | 36,266,007 | | | | 20,208,682 | | |
| Net Assets: | |
| Beginning of period | | | 102,673,691 | | | | 82,465,009 | | |
| End of period | | $ | 138,939,698 | | | $ | 102,673,691 | | |
| Accumulated Net Investment Loss | | $ | (745,523 | ) | | $ | (184,962 | ) | |
See accompanying notes to financial statements.
9
Wanger Select 2006 Semiannual Report
Financial Highlights
| | | (Unaudited)
Six Months Ended
June 30, | | Year Ened December 31, | |
| Selected data for a share outstanding throughout each period | | 2006 | | 2005 | | 2004 | | 2003 | | 2002 | | 2001 | |
| Net Asset Value, Beginning of Period | | $ | 22.66 | | | $ | 22.11 | | | $ | 18.55 | | | $ | 14.19 | | | $ | 15.36 | | | $ | 14.08 | | |
| Income from Investment Operations: | |
| Net investment loss (a) | | | (0.02 | ) | | | (0.04 | ) | | | (0.10 | ) | | | (0.11 | ) | | | (0.09 | ) | | | (0.05 | ) | |
| Net realized and unrealized gain (loss) on investments | | | 1.25 | | | | 2.12 | | | | 3.68 | | | | 4.47 | | | | (1.08 | ) | | | 1.33 | | |
| Total from Investment Operations | | | 1.23 | | | | 2.08 | | | | 3.58 | | | | 4.36 | | | | (1.17 | ) | | | 1.28 | | |
| Less Distributions Declared to Shareholders: | |
| From net investment income | | | (0.09 | ) | | | — | | | | — | | | | — | | | | — | | | | — | | |
| From net realized capital gains | | | (0.75 | ) | | | (1.53 | ) | | | (0.02 | ) | | | — | | | | — | | | | — | | |
| Total Distributions Declared to Shareholders | | | (0.84 | ) | | | (1.53 | ) | | | (0.02 | ) | | | — | | | | — | | | | — | | |
| Net Asset Value, End of Period | | $ | 23.05 | | | $ | 22.66 | | | $ | 22.11 | | | $ | 18.55 | | | $ | 14.19 | | | $ | 15.36 | | |
| Total Return (b) | | | 5.51 | %(c) | | | 10.49 | %(d) | | | 19.31 | % | | | 30.73 | % | | | (7.62 | )% | | | 9.09 | % | |
| Ratios to Average Net Assets: | |
| Expenses (e) | | | 0.94 | %(f) | | | 0.96 | % | | | 1.10 | % | | | 1.15 | % | | | 1.18 | % | | | 1.33 | % | |
| Net investment loss (e) | | | (0.15 | )%(f) | | | (0.20 | )% | | | (0.49 | )% | | | (0.65 | )% | | | (0.62 | )% | | | (0.34 | )% | |
| Waiver | | | — | | | | 0.02 | % | | | — | | | | — | | | | — | | | | — | | |
| Portfolio turnover rate | | | 13 | %(c) | | | 26 | % | | | 36 | % | | | 21 | % | | | 45 | % | | | 76 | % | |
| Net assets, end of period (000's) | | $ | 138,940 | | | $ | 102,674 | | | $ | 82,465 | | | $ | 52,112 | | | $ | 26,124 | | | $ | 21,429 | | |
(a) Net investment loss per share was based upon the average shares outstanding during the period.
(b) Total return at net asset value assuming all distributions reinvested.
(c) Not annualized.
(d) Had the Investment Adviser not waived a portion of expenses, total return would have been reduced.
(e) The benefits derived from custody fees paid indirectly had no impact.
(f) Annualized.
See accompanying notes to financial statements.
10
Wanger Select 2006 Semiannual Report
Notes to Financial Statements (Unaudited)
1. Nature of Operations
Wanger Select (the "Fund"), is a series of Wanger Advisors Trust (the "Trust"), an open-end management investment company organized as a Massachusetts business trust. The investment objective of the Fund is to seek long-term growth of capital. The Fund is available only for allocation to certain life insurance company separate accounts established for the purpose of funding qualified and non-qualified variable annuity contracts, and variable life insurance policies and may also be offered directly to certain types of pension plans and retirement arrangements.
2. Significant Accounting Policies
Security valuation
Securities of the Fund are valued at market value or, if a market quotation for a security is not readily available or is deemed not to be reliable because of events or circumstances that have occurred between the market quotation and the time as of which the security is to be valued, the security is valued at a fair value determined in accordance with procedures established by the Board of Trustees. Securities traded on securities exchanges or in over-the-counter markets in which transaction prices are reported are valued at the last sales price at the time of valuation. If a security is traded principally on the Nasdaq Stock Market Inc., the Nasdaq Official Closing Price will be applied. Securities for which there are no reported sales on the valuation date are valued at the latest bid quotation. Short-term debt obligations having a maturity of 60 days or less from the valuation date are valued on an amortized cost basis, whic h approximates fair value. Securities for which quotations are not readily available and any other assets are valued as determined in good faith under consistently applied procedures established by and under the general supervision of the Board of Trustees. The Trust has retained an independent statistical fair value pricing service to assist in the fair valuation process for securities principally traded in a foreign market in order to adjust for possible changes in value that may occur between the close of the foreign exchange and the time at which fund shares are priced. If a security is valued at a "fair value," that value may be different from the last quoted market price for the security.
Repurchase agreements
The Fund may engage in repurchase agreement transactions. The Fund, through its custodians, receives delivery of underlying securities collateralizing each repurchase agreement. The Fund's investment adviser determines that the value of the underlying securities is at all times at least equal to the repurchase price including interest. In the event of default or bankruptcy by the other party to the agreement, realization and/or retention of the collateral may be subject to legal proceedings.
Security transactions and investment income
Security transactions are accounted for on the trade date (date the order to buy or sell is executed) and dividend income is recorded on the ex-dividend date, except that certain dividends from foreign securities are recorded as soon as the information is available to the Fund. Interest income is recorded on an accrual basis and includes amortization of discounts on short-term debt obligations and on long-term debt obligations when required for federal income tax purposes. Realized gains and losses from security transactions are reported on an identified cost basis.
Use of Estimates
The preparation of financial statements in conformity with accounting principles generally accepted in the United States of America ("GAAP") requires management to make estimates and assumptions that affect the amounts reported in the financial statements and accompanying notes. Actual results may differ from those estimated.
Fund share valuation
Fund shares are sold and redeemed on a continuing basis at net asset value. Net asset value per share is determined daily as of the close of trading on the New York Stock Exchange (the "Exchange") on each day the Exchange is open for trading by dividing the total value of the Fund's investments and other assets, less liabilities, by the number of Fund shares outstanding.
Indemnification
In the normal course of business, the Fund enters into contracts that contain a variety of representations and warranties which provide general indemnities. The Fund's maximum exposure under these arrangements is unknown, as this would involve future claims against the Fund. Also under the Trust's organizational documents, the Trustees and Officers of the Trust are indemnified against certain liabilities that may arise out of their duties to the Trust. However based on experience, the Fund expects the risk of loss due to these warranties and indemnities to be minimal.
Custody fees/Credits
Custody fees are reduced based on the Fund's cash balances maintained with the custodian. The Fund could have invested a portion of the assets utilized in connection with the expense offset arrangement in an income-producing asset if it had not entered into such agreement. The amount is disclosed as a reduction of total expenses in the Statement of Operations.
Federal income taxes
The Fund has complied with the provisions of the Internal Revenue Code available to regulated investment companies and, in the manner provided therein, distributes all their taxable income, as well as any net realized gain on sales of investments and foreign currency transactions reportable for federal income tax purposes. Accordingly, the Fund paid no federal income taxes and no federal income tax provision was required.
Distributions to shareholders
Distributions to shareholders are recorded on the ex-date.
3. Federal Tax Information
The tax character of distributions paid during the year ended December 31, 2005 was as follows:
| | | December 31, 2005 | |
| Distributions paid from: | |
| Ordinary Income* | | $ | 557,324 | | |
| Long-Term Capital Gain | | | 5,229,252 | | |
* For tax purposes short-term capital gains distributions, if any, are considered ordinary income distributions.
4. Transactions With Affiliates
Columbia Wanger Asset Management, L.P., ("Columbia WAM") a wholly owned subsidiary of Columbia Management Group, Inc. ("CM"), which in turn is an indirect wholly owned subsidiary of Bank of America Corporation ("BOA"), furnishes continuing investment supervision to each Fund and is responsible for the overall management of each Fund's business affairs.
Under the Fund's investment management agreement, fees are accrued daily and paid monthly to Columbia WAM at the annual rate of 0.85% of average daily net assets.
The investment advisory agreement also provides that through April 30, 2007 Columbia WAM will reimburse the Fund to the extent that ordinary operating expenses (computed based on net custodian fees) exceed an annual percentage of 1.35% of average daily net assets. There was no reimbursement for the six months ended June 30, 2006.
11
Wanger Select 2006 Semiannual Report
Notes to Financial Statements (Unaudited)
Certain officers and trustees of the Trust are also officers of Columbia WAM. On June 7, 2006, the board of trustees of Wanger Advisors Trust nominated for election as trustees to the Wanger Advisors Trust board 11 individuals (each a "Nominee" and collectively the "Nominees"). Two of the Nominees are currently trustees of the Trust and the remaining nine Nominees are currently trustees of the Columbia Acorn Trust. A special meeting of the shareholders has been scheduled for September 11, 2006 to vote on the election of the Nominees. Notice of the special meeting, a proxy statement and a proxy card has been mailed to all shareholders of record as of the close of business on July 14, 2006. The Trust makes no direct payments to its officers and trustees who are affiliated with Columbia WAM. For the six months ended June 30, 2006, the Fund paid $4,983 to trustees not affiliated with Columbia WAM.
The Board of Trustees appointed a Chief Compliance Officer to the Fund in accordance with federal securities regulations. The Fund will pay its pro-rata share of the expenses associated with the Office of the Chief Compliance Officer. These expenses are disclosed separately as "Chief compliance officer expenses" in the Statement of Operations.
Columbia Management Distributors, Inc. (formerly Columbia Funds Distributor, Inc.), a wholly-owned subsidiary of BOA, serves as the principal underwriter of the Trust and receives no compensation for its services.
Columbia Management Services, Inc. (formerly Columbia Funds Services, Inc.) (the "Transfer Agent"), a wholly-owned subsidiary of BOA, provides shareholder services to the Fund and has subcontracted with Boston Financial Data Services ("BFDS") to serve as subtransfer agent. For such services, the Transfer Agent receives a fee, paid monthly, at the annual rate of $21.00 per open account. During the period covered by this report, the Transfer Agent has voluntarily waived its right to reimbursement for certain out-of-pocket expenses.
Columbia WAM has delegated to Columbia Management Advisors, LLC, an indirect wholly owned subsidiary of BOA, responsibility to provide certain administrative services to the Fund.
During the six months ended June 30, 2006, the Fund engaged in purchase and sales transactions with funds that have a common investment adviser (or affiliated investment advisers), common Directors/Trustees, and/or common Officers. These purchase and sale transactions complied with the provisions of Rule 17a-7 under the Investment Company Act of 1940 and were $0 and $20,440, respectively.
5. Borrowing Arrangements
The Trust participates in a $150,000,000 credit facility, which was entered into to facilitate portfolio liquidity. Interest is charged to each participating fund based on its borrowings at rate per annual equal to the Federal Funds rate plus 0.50%. In addition, a commitment fee of 0.10% per annum is accrued and apportioned among the participating funds based on their pro-rata portion of the unutilized line of credit. The commitment fee is included in "Other expenses" on the Statement of Operations. No amounts were borrowed under this facility for the six months ended June 30, 2006.
6. Fund Share Transactions
Proceeds and payments on Fund shares as shown in the statement of changes in net assets are in respect of the following numbers of shares:
| | | Six months ended
June 30, 2006 | | Year ended
December 31, 2005 | |
| Shares sold | | | 1,785,693 | | | | 1,226,585 | | |
Shares issued in reinvestment
of dividend distributions | | | 191,438 | | | | 294,782 | | |
| Less shares redeemed | | | 479,500 | | | | 720,738 | | |
| Net increase in shares outstanding | | | 1,497,631 | | | | 800,629 | | |
7. Investment Transactions
The aggregate cost of purchases and proceeds from sales other than short-term obligations for the six months ended June 30, 2006 were $44,507,625 and $15,437,785.
8. Legal Proceedings
Columbia WAM, Columbia Acorn Trust, another mutual fund family advised by Columbia WAM, and the trustees of Colombia Acorn Trust, are named as defendants in class and derivative complaints which have been consolidated in a Multi-District Action in the federal district court for the District of Maryland (the "MDL Action"). These lawsuits contend that defendants permitted certain investors to market time their trades in certain Columbia Acorn Funds. The MDL Action is ongoing. However, all claims against Columbia Acorn Trust and the independent trustees of Columbia Acorn Trust have been dismissed.
The Columbia Acorn Trust and Columbia WAM are also defendants in a class action lawsuit that alleges, in summary, that the Columbia Acorn Trust and Columbia WAM exposed shareholders of Columbia Acorn International fund to trading by market timers by allegedly (a) failing to properly evaluate daily whether a significant event affecting the value of that fund's securities had occurred after foreign markets had closed but before the calculation of the funds' net asset value ("NAV"); (b) failing to implement the fund's portfolio valuation and share pricing policies and procedures; and (c) failing to know and implement applicable rules and regulations concerning the calculation of NAV (the "Fair Valuation Lawsuit"). The Seventh Circuit ruled that the plaintiffs' state law claims were preempted under federal law resulting in the dismissal of plaintiffs' complaint. Plaintiffs appealed the Seventh Circuit's ruling to the United States S upreme Court.
On March 21, 2005, a class action complaint was filed against the Columbia Acorn Trust and Columbia WAM seeking to rescind the Contingent Deferred Sales Charges assessed upon redemption of Class B shares of Columbia Acorn Funds due to the alleged market timing of the Columbia Acorn Funds. In addition to the rescission of sales charges, plaintiffs seek recovery of actual damages, attorneys' fees and costs. The case has been transferred to the MDL Action in the federal district court of Maryland.
On April 4, 2006, all of the parties to the MDL Action executed a letter settlement agreement intended to fully resolve all of the lawsuits consolidated in the MDL Action as well as the Fair Valuation Lawsuit. The settlement has not yet been finalized or approved by the court.
Columbia WAM, the Columbia Acorn Funds and the trustees of Columbia Acorn Trust are also defendants in a consolidated lawsuit filed in the federal district court of Massachusetts alleging that Columbia WAM used fund assets to make undisclosed payments to brokers as an incentive for the brokers to market that Columbia Acorn Funds over the other mutual funds to investors. The complaint alleges Columbia WAM and the Trustees of the Trust breached certain common laws duties and federal laws.
On November 30, 2005, the court dismissed all of the claims alleged against all of the parties in the consolidated complaint. Plaintiffs timely filed a notice of appeal of the district court's dismissal order with the First Circuit Court of Appeals. The parties subsequently executed a settlement term sheet to fully resolve all claims in the litigation. The settlement has not yet been finalized or approved by the court.
The Columbia Acorn Trust and Columbia WAM intend to defend these suits vigorously.
As a result of these matters or any adverse publicity or other developments resulting from them, there may be increased redemptions or reduced sales of Fund shares, which could increase transaction costs or operating expenses, or have other adverse consequences for the Funds.
In connection with the events described in detail above, various parties have filed suit against certain funds, their Boards and/or BOA (and affiliated entities). These suits are ongoing. However, based on currently available
12
Wanger Select 2006 Semiannual Report
Notes to Financial Statements (Unaudited)
information, the Columbia Acorn Trust believes that the likelihood that these lawsuits will have a material adverse impact on any fund is remote, and Columbia WAM believes that the lawsuits are not likely to materially affect its ability to provide investment management services to the Funds.
For the six months ended June 30, 2006, CM has assumed $284 in consulting services and legal fees incurred by the Fund in connection with these matters.
13
Wanger Select 2006 Semiannual Report
[Excerpts from:]
Wanger Advisors Trust
Management Fee Evaluation of the Senior Officer
Prepared Pursuant to the New York Attorney General's
Assurance of Discontinuance
2006
14
Wanger Select 2006 Semiannual Report
Introduction
The New York Attorney General's Assurance of Discontinuance ("Order") entered into by Columbia Management Advisors, Inc. ("CMAI") and Columbia Management Distributors, Inc., ("CMDI" and collectively with "CMAI," "CMG") in February 2005, allows CMAI to manage or advise a mutual fund, including the Wanger Advisors Trust's family of funds (the "WAT Funds" or "WAT" or "Trust"), only if the trustees of the WAT Funds appoint a "Senior Officer" to perform specified duties and responsibilities. One of these responsibilities includes "managing the process by which proposed management fees (including but not limited to, advisory fees) to be charged the [WAT Funds] are negotiated so that they are negotiated in a manner which is at arms' length and reasonable and consistent with this Assurance of Discontinuance."
The Order also provides that the Board of Trustees of the WAT Funds ("Board") must determine the reasonableness of proposed "management fees" by using either an annual competitive bidding process supervised by the Senior Officer or Independent Fee Consultant, or by obtaining "an annual independent written evaluation prepared by or under the direction of the Senior Officer or the Independent Fee Consultant."
"Management fees" are only part of the costs and expenses paid by mutual fund shareholders. The expenses can vary depending upon the class of shares held but usually include: (1) investment management or advisory fees to compensate analysts and portfolio managers for stock research and portfolio management, as well as the cost of operating a trading desk; (2) administrative expenses incurred to prepare registration statements and tax returns, calculate the Funds' net asset values, maintain effective compliance procedures and perform recordkeeping services; (3) transfer agency costs for establishing accounts, accepting and disbursing funds, as well as overseeing trading in Fund shares; and (4) custodial expenses incurred to hold the securities purchased by the Funds.
Columbia Wanger Asset Management, L.P. ("CWAM"), the adviser to the WAT Funds, has proposed that the Trust enter into an agreement that "bundles" the first two categories listed above: advisory and administrative services. The fees paid under this agreement are referred to as "management fees." Other fund expenses are governed by separate agreements, in particular agreements with two CWAM affiliates: CMDI, the broker-dealer that underwrites and distributes the WAT Funds' shares, and Columbia Management Services, Inc. ("CMSI"), the Funds' transfer agent. In conformity with the terms of the Order, this evaluation, therefore, addresses only the advisory and administrative contract between CWAM and the Trust, and does not extend to the other agreements.
According to the Order, the Senior Officer's evaluation must consider at least the following:
(1) Management fees (including components thereof) charged to institutional and other clients of CWAM for like services;
(2) Management fees (including any components thereof) charged by other mutual fund companies for like services;
(3) Costs to CWAM and its affiliates of supplying services pursuant to the management fee agreements, excluding any intra-corporate profit;
(4) Profit margins of CWAM and its affiliates from supplying such services;
(5) Possible economies of scale as the WAT Funds grow larger; and
(6) The nature and quality of CWAM's services, including the performance of each WAT Fund.
On November 17, 2004, the Board appointed me Senior Officer under the Order. The Board also determined not to pursue a competitive bidding process and instead, charged me with the responsibility of evaluating the WAT Funds' proposed advisory and administrative fee contract with CWAM in conformity with the requirements of the Order. This Report is an annual evaluation required under the Order. In discharging their responsibilities, the independent Trustees have also consulted independent, outside counsel.
2005 Evaluation
This is the second annual evaluation prepared in connection with the Order. The first annual evaluation ("2005 Evaluation") was issued on July 25, 2005. This evaluation follows the same structure as the 2005 Evaluation. Some areas are given more emphasis here, while others are given less. Still, the fundamental information gathered for this evaluation is the largely the same as last year. I have noted in this Report where methodologies diverged significantly.
This evaluation was performed in cooperation and regular communication with the Compliance/Contract Renewal Committee of the Board.
Process and Independence
The objectives of the Order are to insure the independent evaluation of the advisory fees paid by the WAT Funds as well as to insure that all relevant factors are considered. In my view, the contract renewal process has been conducted at arms-length and with independence in gathering, considering and evaluating all relevant data. At the outset of the process, the Trustees sought and obtained from CWAM and CMG a comprehensive compilation of data regarding Fund performance and expense, adviser profitability, and other information. In advance of the contract renewal process, the Board also explored CWAM's potential capacity restraints as they relate to the larger Columbia Acorn Fund complex managed by CWAM. The adviser's capacity to manage increasing assets is an issue posed by the size of the Columbia Acorn Fund, but impacts the domestic WAT Funds as well. Performance and expense data was obtained from both Morningstar and Lipper, the leading consultants in this area. The rankings prepared by Morningstar and Lipper were independent and were not influenced by the adviser. CWAM itself identified what it considers its competition in formulating its own peer group, and the Trustees considered that data as well.
My evaluation of the advisory contract was shaped, as it was last year, by my experience as WAT's Chief Compliance Officer ("CCO"). As CCO, I report solely to the Board and have no reporting obligation to or employment relationship with CMG or its affiliates, except for administrative purposes. This too contributes to the independence of this evaluation. I have commented on compliance matters in evaluating the quality of service provided by CWAM.
15
Wanger Select 2006 Semiannual Report
Since the 2005 Evaluation was issued, the Board has considered the recommendations and conclusions of that Report. In connection with the July 2005 contract renewal, the Board added a breakpoint of 10 basis points for Wanger International Small Cap for assets in excess of $500 million. Since that fund now has assets of $1.2 billion, management fees were reduced as a result. The Board has also gathered data on payments made by CWAM to insurance company partners as part of the Board's on-going consideration of whether to institute Rule 12b-1 fees for the WAT Funds. Finally, it has gathered and considered data from CWAM regarding its capacity to invest fund assets effectively.
This Report, its supporting materials and the data contained in other materials submitted to the Compliance/Contract Committee of the Board, in my view, provide a thorough factual basis upon which the Board, in consultation with independent counsel as it deems appropriate, may conduct management fee negotiations that are in the best interests of the WAT Funds' shareholders.
Finally, it should be noted that in June 2006, the WAT and Columbia Acorn Boards agreed in principle to merge, subject to appropriate shareholder approval. In view of this development, the WAT Trustees are considering the extension of the existing advisory contract for an interim period that would facilitate a review of the agreement by the combined board following the proposed merger for the remainder of the renewal period (through July 2007). Regardless of how the WAT Trustees ultimately choose to proceed in this respect, this Report provides the WAT Board with sufficient information to make an informed decision at this time regarding the advisory contract.
The Fee Reductions Mandated under the Order
Under the terms of the Order, CMG agreed to secure certain management fee reductions for the mutual funds advised by its affiliate investment advisers. In some instances, breakpoints were also established. Although neither CWAM nor the Trust was a party to the Order, CWAM offered and the Board accepted certain advisory fee reductions last year. By the terms of the Order, these fees may not be increased before November 30, 2009. I have used these advisory fee levels in my evaluation because they are the fees in the current agreements that CWAM proposes should be continued. Hence, these fee levels are the starting point of an evaluation.
Conclusions
My review of the data and other material above leads to the following conclusions with respect to the factors identified in the Order.
1. Performance. The domestic Funds generally have achieved outstanding performance. The Wanger US Smaller Companies and Wanger Select both rank very favorably against their peers. The international Funds have not, however, performed nearly as well as the domestic Funds, and continue to lag their benchmarks and peers. Management is taking steps to improve the performance of these funds.
2. Management Fees relative to Peers. The management fee rankings for the domestic funds are below their peers and hence less favorable to shareholders than competitors' funds. The international Funds fare much better, but the Morningstar and Lipper rankings diverge sharply.
3. Administrative Fees. The WAT Funds pay a bundled fee that combines advisory fees and administrative expense, so ranking these fees separately was not possible.
4. Management Fees relative to Institutional and Other Mutual Fund Accounts. CWAM's focus is on its mutual funds. It does not actively seek to manage separate or institutional accounts. The few institutional accounts it does manage vary in rate structures. Some pay advisory fees commensurate with or higher than the WAT Funds. In a few instances, however, institutional accounts pay lower advisory fees than do the WAT Funds.
5. Costs to CWAM and its Affiliates. CWAM's direct costs do not appear excessive, and in some areas have declined in the past year. Indirect costs allocated to CWAM by its parent organization, however, have increased substantially. CWAM's affiliates report operating losses and therefore do not appear to profit from CWAM's advisory agreement with the WAT Funds.
6. Profit Margins. CWAM's firm-wide, pre-marketing expense profit margins are at the top of the industry, though these comparisons are hampered by limited industry data. High profit margins are not unexpected for firms that manage large, successful funds and have provided outstanding investment performance for investors.
7. Economies of Scale. Economies of scale do exist at CWAM and will expand as the assets under management increase. They are, however, only partially reflected in the management fee schedule for the Funds. If the WAT Funds' assets continue to grow, under the Funds' current fee schedules, shareholders might not benefit in a manner generally commensurate with CWAM's increased profits.
8. Nature and Quality of Services. This category includes a variety of considerations that are difficult to quantify, yet can have a significant bearing on the performance of the WAT Funds. Several areas merit comment.
a. Capacity. CWAM's assets under management have continued to grow, posing ever greater challenges in deploying assets effectively. While trends here merit continued monitoring, CWAM appears to be managing assets effectively.
b. Compliance. CWAM has a reasonably designed compliance program that protects shareholders.
c. Administrative Services. The WAT Funds benefit from a variety of administrative services that are performed by CWAM and CMAI.
16
Wanger Select 2006 Semiannual Report
In my opinion, the process of negotiating an advisory contract for the WAT Funds has been conducted thoroughly and at arms' length. Further, the Trustees have sufficient information to evaluate management's proposal, and negotiate contract terms that are in the best interests of fund shareholders.
Recommendations
I believe the Trustees should:
1. Continue to consider ways to restructure the advisory fee beyond the current breakpoint schedule to reflect more fully economies of scale.
2. Monitor the performance of the international funds.
3. Continue to monitor CWAM's capacity limitations to insure that CWAM's expanding assets under management do not impair investment performance.
4. Consider unbundling of advisory and administrative fees.
5. Continue their consideration of whether to implement a plan under Rule 12b-1.
Robert P. Scales
July 24, 2006
17
Wanger Select 2006 Semiannual Report
This page intentionally left blank.
18
Wanger Select 2006 Semiannual Report
This page intentionally left blank.
19
Wanger Select 2006 Semiannual Report

Wanger Advisors Trust
Trustees
Patricia H. Werhane, Chairperson
Jerome L. Duffy
Kathryn A. Krueger, M.D.
Ralph Wanger
Officers
Charles P. McQuaid
President
Ben Andrews
Vice President
Michael G. Clarke
Assistant Treasurer
Jeffrey R. Coleman
Assistant Treasurer
J. Kevin Connaughton
Assistant Treasurer
John M. Kunka
Assistant Treasurer
Joseph C. LaPalm
Vice President
Bruce H. Lauer
Vice President, Treasurer and Secretary
Louis J. Mendes III
Vice President
Robert A. Mohn
Vice President
Christopher J. Olson
Vice President
Michelle H. Rhee
Assistant Secretary
Linda K. Roth-Wiszowaty
Assistant Secretary
Robert P. Scales
Chief Compliance Officer, Senior Vice President and General Counsel
Transfer Agent,
Dividend Disbursing Agent
Columbia Management Services, Inc.
P.O. Box 8081
Boston, Massachusetts
02266-8081
Distributor
Columbia Management Distributors, Inc.
One Financial Center
Boston, Massachusetts
02111-2621
Investment Adviser
Columbia Wanger Asset Management, L.P.
227 West Monroe Street, Suite 3000
Chicago, Illinois 60606
1-888-4-WANGER
(1-888-492-6437)
Legal Counsel
Bell, Boyd & Lloyd LLC
Chicago, Illinois
This report, including the schedules of investments and financial statements, is submitted for the general information of the shareholders of the Wanger Advisors Trust.
This report is not authorized for distribution unless preceded or accompanied by a prospectus.
A description of the Fund's proxy voting policies and procedures is available (i) on the Fund's website, www.columbiafunds.com; (ii) on the Securities and Exchange Commission's website at www.sec.gov, and (iii) without charge, upon request, by calling 888-492-6437. Information regarding how the Fund voted proxies relating to portfolio securities during the 12-month period ended June 30, 2006, is available from the SEC's website.
The Fund files a complete schedule of portfolio holdings with the SEC for the first and third quarters of each fiscal year on Form N-Q. The Fund's Form N-Q is available on the SEC's website at www.sec.gov and may be reviewed and copied at the SEC's Public Reference Room in Washington, D.C. Information on the operation of the Pubic Reference Room may be obtained by calling 800-SEC-0330.
20
Wanger Advisors Trust
SHC-44/111957-0606 06/27378
Wanger International Select
2006 Semiannual Report


Wanger International Select
2006 Semiannual Report
Table of Contents
| | 1 | | | Understanding Your Expenses | |
|
| | 2 | | | Understanding Our Investment Style | |
|
| | 4 | | | Performance Review | |
|
| | 6 | | | Statement of Investments | |
|
| | 9 | | | Statement of Assets and Liabilities | |
|
| | 9 | | | Statement of Operations | |
|
| | 10 | | | Statements of Changes in Net Assets | |
|
| | 11 | | | Financial Highlights | |
|
| | 12 | | | Notes to Financial Statements | |
|
| | 15 | | | Management Fee Evaluation of the Senior Officer | |
|
| | 20 | | | Board of Trustees and Management of Wanger Advisors Trust | |
|
Columbia Wanger Asset Management, L.P. ("Columbia WAM") is one of the leading global small-cap equity managers in the United States with more than 30 years of small- and mid-cap investment experience. Columbia WAM manages more than $30 billion in equities and is the investment adviser to Wanger U.S. Smaller Companies, Wanger International Small Cap, Wanger Select, Wanger International Select and the Columbia Acorn Family of Funds. Columbia Management Group, LLC ("Columbia Management") is the primary investment management division of Bank of America Corporation. Columbia Management entities furnish investment management services and advises institutional and mutual fund portfolios. Columbia WAM is an SEC-registered investment adviser and indirect, wholly owned subsidiary of Bank of America Corporation.
For more complete information about our funds, including the Columbia Acorn Funds, our fees, risks associated with investing, or expenses, call 1-888-4-WANGER for a prospectus. Read it carefully before you invest or send money. This report is not an offer of the shares of the Columbia Acorn Fund Family.
The discussion in the report of portfolio companies is for illustration only and is not a recommendation of individual stocks. The information is believed to be accurate, but the information and the views of the portfolio managers may change at any time without notice and the portfolio managers may alter a fund's portfolio holdings based on these views and the fund's circumstances at that time.
Wanger International Select 2006 Semiannual Report
Understanding Your Expenses
As a Fund shareholder, you incur two types of costs. There are transaction costs, which generally include sales charges on purchases and may include redemption or exchange fees. There are also ongoing costs, which generally include investment advisory and other Fund expenses. The information on this page is intended to help you understand your ongoing costs of investing in the Fund and to compare these costs with the ongoing costs of investing in other mutual funds.
Analyzing the Fund's expenses
To illustrate these ongoing costs, we have provided an example and calculated the expenses paid by investors in the Fund during the reporting period. The information in the following table is based on an initial investment of $1,000.00, which is invested at the beginning of the reporting period and held for the entire period. Expense information is calculated two ways and each method provides you with different information. The amount listed in the "actual" column is calculated using actual operating expenses and total return for the Fund. The amount listed in the "hypothetical" column assumes that the return each year is 5% before expenses and then applies the Fund's actual expense ratio for the period to the hypothetical return. You should not use the hypothetical account values and expenses to estimate either your actual account balance at the end of the period or the expenses you paid during the reporting period. See the "Co mpare with other funds" information for details on using the hypothetical data.
Estimating your actual expenses
To estimate the expenses that you paid over the period, first you will need your account balance at the end of the period.
1. Divide your ending account balance by $1,000.00. For example, if an account balance was $8,600.00 at the end of the period, the result would be 8.6.
2. In the section of the table below titled "Expenses paid during period," you will find a dollar amount in the column labeled "Actual." Multiply this amount by the result from step 1. Your answer is an estimate of the expenses you paid on your account during the period.
January 1, 2006 – June 30, 2006
| | | Account value at the
beginning of the period ($) | | Account value at the
end of the period ($) | | Expenses paid during
period ($) | | Fund's annualized
expense ratio (%)* | |
| | | Actual | | Hypothetical | | Actual | | Hypothetical | | Actual | | Hypothetical | | | |
| Wanger International Select | | | 1,000.00 | | | | 1,000.00 | | | | 1,120.40 | | | | 1,018.70 | | | | 6.47 | | | | 6.16 | | | | 1.23 | | |
*For the six months ended June 30, 2006.
Expenses paid during the period are equal to the Fund's annualized expense ratio, multiplied by the average account value over the period, then multiplied by the number of days in the Fund's most recent fiscal half-year and divided by 365.
Had the investment adviser not waived a portion of expenses, total return would have been reduced.
It is important to note that the expense amounts shown in the table are meant to highlight only ongoing costs of investing in the Fund. As a shareholder of the Fund, you do not incur any transaction costs, such as sales charges, redemption or exchange fees. Expenses paid during the period do not include any insurance charges imposed by your insurance company's separate account. The hypothetical example provided is useful in comparing ongoing costs only and will not help you determine the relative total costs of owning different funds whose shareholders may incur transaction costs.
Compare with other funds
Since all mutual funds are required to include the same hypothetical calculations about expenses in shareholder reports, you can use this information to compare the ongoing cost of investing in the Fund with other funds. To do so, compare the 5% hypothetical example with the 5% hypothetical examples of other funds. As you compare hypothetical examples of other funds, it is important to note that hypothetical examples are meant to highlight the ongoing cost of investing in a fund and do not reflect any transactional costs, such as sales charges or redemption or exchange fees, that may be incurred by shareholders of other funds. Expenses paid during the period do not include any insurance charges imposed by your insurance company's separate accounts.
1
Wanger International Select 2006 Semiannual Report

Understanding Our Investment Style
Why Small and Mid Caps?
Our mission is simple: Invest in good quality, reasonably priced smaller companies that have growth potential and competitive advantages, and hold on to them. We like small companies because they are generally less complicated. Big companies typically have lots of divisions, while most small companies have one division. An added benefit is that sometimes these small companies are undiscovered, which may mean they are undervalued and a potentially good investment. Managers of small companies tend to focus on customers and are acutely aware of competitors. Small-cap stocks are often exciting businesses run by accessible managers, so in addition to the above virtues, they are fun for us to follow.
Though we like small-caps, we don't force sales of successful stocks simply because they appreciated beyond some arbitrary small-cap definition (other small-cap managers may sell at $2 billion capitalizations, for example). The funds we manage could not make strong gains if we simply sold due to size. We let our winners run.
While style classifications can be helpful, we are not style purists. For example, small-cap stocks have outperformed large caps for more than five years, and we think on average they are no longer cheap based on historical valuation. Our analysts have been finding more value among mid-cap names that have the same attributes we like in small caps.
Why Growth-at-a-Reasonable-Price?
At Columbia Wanger Asset Management, we define growth investing styles using the terms Hard Core Value, Growth-at-a-Reasonable-Price (GARP) and Momentum. These terms help define the different ways that an investor can look for returns.
Hard Core Value investors usually buy very cheap stocks, as measured by comparing the stock valuation to the underlying asset values. While this strategy works for a number of competitors who are very good at it, Hard Core Value is not for us. We believe that too often the stocks are very cheap because the underlying businesses are lousy. Successful investing in Hard Core Value largely depends on predicting (or hastening) events such as takeovers, spinouts or turnarounds. Until such an event occurs the stock may be a diminishing asset.
In implementing our Growth-at-a-Reasonable-Price style, our 21 analysts first search for good, growing businesses. We view what we do as investing in companies rather than stocks, and we try to analyze companies as if we were buying the whole business rather than just a fraction of ownership. We define "good, growing businesses" as companies that have sustainable competitive advantages, fine managements, growing markets, and opportunities for market-share gains. Once we've found a good business that has been growing, we follow the company closely and determine if it sells at what we believe is a "reasonable price."
A stock is at a reasonable price if it sells at (or hopefully below) what we believe is its true value. Most growth companies ("growth stock" is a misnomer) are valued by the market based on price-to-earnings (PE) ratios, and comparisons between growth companies are often based on PE-to-growth (PEG) ratios. While that approach makes theoretical sense, reported earnings are often poor measures of underlying economic profits. For example, the costs of employee stock options were not required to be an accounting expense until 2006, so underlying earnings of many companies were overstated. In other cases, companies may have higher free cash flows than suggested by reported earnings. We ask our analysts to look beyond reported earnings and adjust for many factors when using PE ratios or related dividend discount model valuations. Our analysts also use value discipline techniques, calculating potential sell-out or break-up values, whe n it is appropriate to do so.
Often we determine that the stock of a good business that has been growing is not selling at a reasonable price. In those cases we wait—and there have been times that we've waited for years. If valuation is borderline, we can purchase an initial small position and later increase the position or sell the stock depending on fundamentals or valuation. Valuation matters because it enables our shareholders to potentially benefit in two ways: (1) from growth of the underlying business and (2) from growth of a valuation multiplier, such as a PE ratio.
The remaining growth style definition is Momentum. Momentum players (I hesitate to say "investors") look for stocks that have been rising, along with fast earnings growth, and preferably earnings estimate increases. Many Momentum players completely ignore valuation. (Economists label luxury goods as those where demand rises when prices increase, so momentum players are the ultimate luxury goods buyers!) Because Momentum players buy at any price when earnings are good and often sell at any price when earnings are disappointing, we often like to sell our winners to them and sometimes buy their losers—at our dream prices. Momentum can work, especially in bubbles, but it's not for us. It's too far from our mission of investing in good businesses and targeting rational returns.
Just as individual stocks can graduate from small to mid to large caps, they can also move from Hard Core Value to Growth-at-a-Reasonable-Price and then to Momentum. We love to buy stocks in companies not yet recognized as growth businesses. If we can find good companies that we believe are
2
Wanger International Select 2006 Semiannual Report
mistakenly priced at Hard Core Value levels, even better. Often our best performing stocks were those that were undiscovered when we bought them, and as they grew, became investor favorites because of their strong business models. We are often challenged (in a good way) when stocks rise to Momentum valuations. The challenge then becomes when to sell. We try to resist significant selling unless we think fundamentals will deteriorate or valuations are entirely inappropriate vs. fundamentals.
Having a sensible investment style is very useful, but it is not enough for long-term success. Other factors, such as our process and the people who make up our investment team, will be discussed in future columns.


Charles P. McQuaid
President and Chief Investment Officer
Columbia Wanger Asset Management, L.P.
The views expressed in "Understanding Our Investment Style" are those of the author. These views are not guarantees of future performance and involve certain risks, uncertainties and assumptions that are difficult to predict so actual outcomes and results may differ significantly from the views expressed. These views are subject to change at any time based upon economic, market or other conditions and the respective parties disclaim any responsibility to update such views. These views may not be relied on as investment advice and, because investment decisions for a Wanger Advisors Fund are based on numerous factors, may not be relied on as an indication of trading intent on behalf of any particular Wanger Advisors Fund. References to specific company securities should not be construed as a recommendation or investment advice.
Mid- and small-cap stocks are often more volatile and less liquid than the stocks of larger companies. Small companies may have a shorter history of operations than larger companies and may have a less diversified product line, making them more susceptible to market pressure. Investments in foreign securities have special risks, including political or economic instability, higher costs, different regulations, accounting standards, trading practices and levels of information, and currency exchange rate fluctuations.
3
Wanger International Select 2006 Semiannual Report

Performance Review Wanger International Select

Christopher J. Olson
Portfolio Manager
Performance data quoted represents past performance and current performance may be lower or higher. Past performance is no guarantee of future results. The investment return and principal value will fluctuate so that shares, when redeemed, may be worth more or less than the original cost. For monthly performance updates call 1-888-4-WANGER.
Wanger International Select ended the six-month period up 12.04% (without insurance charges), outperforming the 10.29% gain of the S&P/Citigroup World ex-US Cap Range $2-10B Index.
Strong contributors to performance in the period included Sweden's Gambro, a producer of renal and blood-care products. The stock increased 43% in 2006 before it was acquired by Swedish investment companies Investor AB and EQT in June. Hong Kong Exchanges and Clearing, the Hong Kong equities and derivatives operator and a major holding in the Fund, was up more than 56% for the semiannual period as it continued to benefit from growing trading volumes and new stock listings from China. Geberit, a Swiss manufacturer of plumbing supplies, gained 48% in the first half of the year thanks to improving demand in its key German market. C&C Group, an Irish beverage and snack company, was added to the Fund in the first quarter and was among its top five contributors for the half year with a 25% gain. The company has made significant inroads into the UK alcoholic beverage market with its hard cider offering that is so popular in Ireland . After an impressive run and another 53% gain in the period, we opted to sell the Fund's position in Argentine seamless tube manufacturer Tenaris as we looked to rotate into other energy-related ideas.
Most laggards for the six months had one thing in common: Japan. After a strong Japan rally in the fourth quarter of 2005, corporate governance issues at a few small firms roiled the local markets and contributed to a general sell-off in the first half of 2006. Jupiter Telecommunications, the largest cable service provider in Japan, was off 13% as higher costs and taxes held back earnings growth. Fund manager Sparx Asset Management fell 31% in Wanger International Select despite significant earnings upgrades and increases in assets under management. Aeon Mall, a suburban shopping mall developer and operator, fell 12%. Outside of Japan, France's SES Global, a provider of satellite broadcasting services, fell 17% in the first half of 2006 due to higher than expected start-up costs for new activities.
While increasing interest rates, higher oil prices and geopolitical concerns have all contributed to rising volatility in the equity markets, earnings for companies in Wanger International Select's portfolio have generally come in as expected or on the higher side of expectations. As a result, we are seeing more value emerging due to the recent drop in the market. However, things can quickly change and we will continue to monitor the fundamental outlook for the Fund's holdings closely.
Wanger International Select is a diversified fund that invests in the stocks of medium- to larger-size companies with market capitalizations of $2 to $25 billion at the time of initial purchase. Prior to 2/1/02, Wanger International Select was a non-diversified fund, meaning that the performance of its holdings would have a greater impact on Wanger International Select's total return and may make the Fund's returns more volatile than a more diversified international fund. Mid-cap stocks tend to be more volatile and may be less liquid than the stocks of larger companies. Investments in foreign securities have special risks, including political or economic instability, higher costs, different regulations, accounting standards, trading practices and levels of information, and curr ency exchange rate fluctuations.
As of 6/30/06, the Fund's positions in the stocks mentioned were: Gambro, 0.0%; Hong Kong Exchanges and Clearing, 3.6%; Geberit, 2.5%; C&C Group, 3.7%; Tenaris, 0.0%; Jupiter Telecommunications, 3.5%; Sparx Asset Management, 1.5%; Aeon Mall, 2.3%; SES Global, 2.4%.
See next page for index definitions.
4
Wanger International Select 2006 Semiannual Report
Growth of a $10,000 Investment in
Wanger International Select
Total return for each period,
February 1, 1999 (inception date) through June 30, 2006
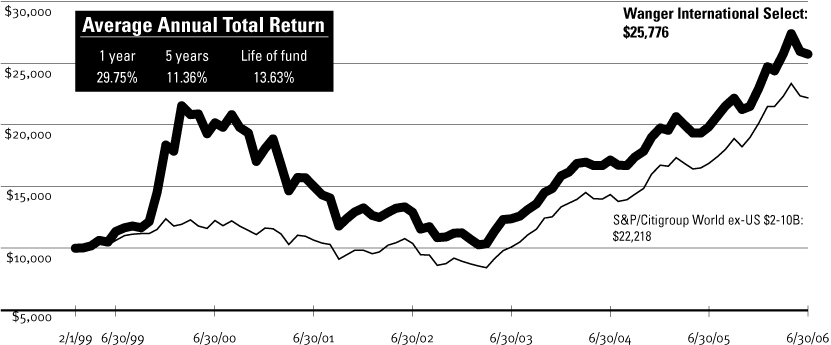
This graph compares the results of $10,000 invested in Wanger International Select on February 1, 1999 (the date the Fund began operations) through June 30, 2006, to the S&P/Citigroup World ex-US Cap Range $2-10B Index, with dividends and capital gains reinvested. Performance results reflect any voluntary waivers or reimbursements of Fund expenses by the Advisor or its affiliates. Absent these waivers or reimbursement arrangements, performance results would have been lower.
Performance shown here is past performance, which cannot guarantee future results. Current performance may be higher or lower. The investment return and principal value of an investment in the Fund will fluctuate so that Fund shares, when redeemed, may be worth more or less than their original cost. Performance changes over time. Current returns for the Fund may be different than that shown. For monthly performance updates, please contact us at 1-888-4-WANGER.
Results to June 30, 2006
| | | 2nd quarter | | Year-to-date | | 1 year | |
| Wanger International Select | | | -0.09 | % | | | 12.04 | % | | | 29.75 | % | |
S&P/Citigroup World ex-US
Cap Range $2-10B | | | -0.61 | | | | 10.29 | | | | 31.69 | | |
| MSCI EAFE | | | 0.70 | | | | 10.16 | | | | 26.56 | | |
| Lipper International Funds Index | | | -0.52 | | | | 9.30 | | | | 27.26 | | |
NAV as of 6/30/06: $21.93
Performance numbers reflect all Fund expenses but do not include any insurance charge imposed by your insurance company's separate accounts. If performance included the effect of these additional charges, it would be lower.
Due to ongoing market volatility, performance is subject to substantial short-term fluctuations.
The S&P/Citigroup World ex-U.S. Cap Range $2-10B is a subset of the broad market, selected by the index sponsor, representing the mid-cap developed market, excluding the United States. MSCI EAFE is Morgan Stanley's Europe, Australasia and Far East Index, a widely recognized international benchmark that comprises 20 major markets in Europe, Australia and the Far East. Lipper Indexes include the largest funds tracked by Lipper, Inc. in the named category. The Lipper International Funds Index is made up of the 30 largest non-U.S. funds. All indexes are unmanaged and returns include reinvested dividends. It is not possible to invest directly in an index.
Portfolio characteristics and holdings are subject to change periodically and may not be representative of current characteristics and holdings.
Top 5 Countries
As a % of net assets, as of 6/30/06
| Japan | | | 26.1 | % | |
| Ireland | | | 16.9 | | |
| Switzerland | | | 10.8 | | |
| France | | | 8.5 | | |
| Canada | | | 7.4 | | |
Top 10 Holdings
As a % of net assets, as of 6/30/06
1. Bank of Ireland
Irish Commercial Bank – Ireland | | | 4.9 | % | |
2. Daito Trust Construction
Apartment Builder – Japan | | | 3.8 | | |
3. C&C Group
Beverage Company – Ireland | | | 3.7 | | |
4. IAWS
Baked Goods – Ireland | | | 3.7 | | |
5. Hong Kong Exchanges and Clearing
Hong Kong Equity & Derivatives Operator – Hong Kong | | | 3.6 | | |
6. Jupiter Telecommunications
Cable Service Provider in Japan – Japan | | | 3.6 | | |
7. Anglo Irish Bank
Small Business & Middle Market Banking – Ireland | | | 3.5 | | |
8. Northern Rock
Lowest Cost Mortgage Bank in UK – United Kingdom | | | 3.2 | | |
9. Synthes
Products for Orthopedic Surgery – Switzerland | | | 3.1 | | |
10. Hoya
Opto-electrical Components & Eyeglass Lenses – Japan | | | 3.1 | | |
5
Wanger International Select 2006 Semiannual Report
Wanger International Select
Statement of Investments (Unaudited) June 30, 2006
Number of
Shares | | | | Value | |
| | | Common Stocks – 99.4% | | | | | |
| | | Europe – 57.8% | |
| | | Ireland – 16.9% | |
140,000
| | Bank of Ireland
Irish Commercial Bank | | | $2,506,105
| | |
220,000
| | C&C Group
Beverage Company | | | 1,910,632
| | |
107,000
| | IAWS Group
Baked Goods | | | 1,886,538
| | |
115,000
| | Anglo Irish Bank
Small Business & Middle Market Banking | | | 1,791,891
| | |
50,000
| | Grafton Group
Builders Materials Wholesaling & Do-it-yourself Retailing | | | 629,380
| | |
| | | | | | 8,724,546 | | |
| | | Switzerland – 10.8% | |
13,400
| | Synthes
Products for Orthopedic Surgery | | | 1,614,470
| | |
19,500
| | Kuehne & Nagel
Freight Forwarding/Logistics | | | 1,419,541
| | |
1,100
| | Geberit
Plumbing Supplies | | | 1,270,934
| | |
3,750
| | Swatch Group
Watch & Electronics Manufacturer | | | 632,555
| | |
10,300
| | Schindler Holding
Elevator Manufacturer & Service Provider | | | 533,356
| | |
1,100
| | BKW Energie
Electric Utility | | | 96,314
| | |
| | | | | | 5,567,170 | | |
| | | France – 8.5% | |
11,400
| | Neopost
Postage Meter Machines | | | 1,297,748
| | |
88,100
| | SES Global
Satellite Broadcasting Services | | | 1,254,934
| | |
11,000
| | Essilor International
Eyeglass Lenses | | | 1,106,115
| | |
9,000
| | Imerys
Industrial Minerals Producer | | | 719,088
| | |
| | | | | | 4,377,885 | | |
| | | Germany – 6.6% | |
94,000
| | Depfa Bank
Investment Banker to Public Authorities | | | 1,558,243
| | |
Number of
Shares | | | | Value | |
| | | Germany – 6.6% (cont) | |
1,500
| | Porsche
Specialty Automobile Manufacturer | | | $1,447,434
| | |
3,100
| | Deutsche Boerse
Trading, Clearing, Settlement Services for Financial Markets | | | 421,499
| | |
| | | | | | 3,427,176 | | |
| | | Sweden – 3.4% | |
115,000
| | Tele2
European Mobile Operator & Services Reseller | | | 1,160,442
| | |
16,000
| | Hexagon
Measurement Equipment & Polymers | | | 582,471
| | |
| | | | | | 1,742,913 | | |
| | | United Kingdom – 3.2% | |
90,000
| | Northern Rock
Lowest Cost Mortgage Bank in UK | | | 1,662,231
| | |
| | | Denmark – 2.9% | |
21,900
| | Novozymes
Industrial Enzymes | | | 1,476,024
| | |
| | | Spain – 2.7% | |
41,000
| | Red Electrica
Spanish Power Grid | | | 1,413,765
| | |
| | | Czech Republic – 1.9% | |
6,600
| | Komercni Banka
Leading Czech Universal Bank | | | 965,667
| | |
| | | Netherlands – 0.9% | |
6,000
| | USG People
Temporary Staffing Services | | | 459,269
| | |
| | | Europe – Total | | | 29,816,646 | | |
| | | Asia – 30.6% | |
| | | Japan – 26.1% | |
35,000
| | Daito Trust Construction
Apartment Builder | | | 1,946,037
| | |
2,650
| | Jupiter Telecommunications (b)
Cable Service Provider in Japan | | | 1,837,039
| | |
45,000
| | Hoya
Opto-Electrical Components & Eyeglass Lenses | | | 1,608,719
| | |
28,000
| | Aeon Mall
Suburban Shopping Mall Developer, Owner & Operator | | | 1,175,050
| | |
135,000
| | Kansai Paint
Paint Producer in Japan, India, China & Southeast Asia | | | 1,080,220
| | |
See accompanying notes to financial statements.
6
Wanger International Select 2006 Semiannual Report
Wanger International Select
Statement of Investments (Unaudited) June 30, 2006
Number of
Shares | | | | Value | |
| | | Japan – 26.1% (cont) | |
220
| | Kenedix
Real Estate Investment Management | | | $952,672
| | |
37,000
| | JSR
Films & Chemicals for LCD Screens & Electronics | | | 939,017
| | |
13,700
| | USS
Used Car Auctioneer | | | 907,022
| | |
40,000
| | Ushio
Industrial Light Sources | | | 847,023
| | |
750
| | Sparx Asset Management
Fund Management | | | 783,867
| | |
110,000
| | Hiroshima Bank
Regional Bank | | | 672,322
| | |
18,000
| | Ito En
Bottled Tea & Other Beverages | | | 660,335
| | |
2,600
| | Shimano
Bicycle Components & Fishing Tackle | | | 79,688
| | |
| | | | | | 13,489,011 | | |
| | | Hong Kong – 3.6% | |
290,000
| | Hong Kong Exchanges and Clearing
Hong Kong Equity & Derivatives Market Operator | | | 1,863,865
| | |
| | | Singapore – 0.9% | |
500,000
| | Comfort Del Gro
Taxi & Mass Transit Service | | | 481,891
| | |
| | | Asia – Total | | | 15,834,767 | | |
| | | Other Countries – 11.0% | |
| | | Canada – 7.4% | |
15,700
| | Potash
World's Largest Producer of Potash | | | 1,349,729
| | |
36,000
| | Alliance Atlantis Communication (b)
CATV Channels, TV/Movie Production/Distribution | | | 1,054,555
| | |
47,400
| | RONA (b)
Leading Canadian DIY Retailer | | | 851,357
| | |
50,000
| | Kinross Gold (b)
Gold Mining | | | 545,104
| | |
| | | | | | 3,800,745 | | |
| | | United States – 2.5% | |
26,300
| | Atwood Oceanics (b)
Contract Drilling | | | 1,304,480
| | |
Number of Shares
or Principal Amount | | | | Value | |
| | | South Africa – 1.1% | |
3,000
| | Impala Platinum Holdings
Platinum Group Metals Mining & Refining | | | $551,420
| | |
| | | Other Countries – Total | | | 5,656,645 | | |
| | | Total Common Stocks (Cost: $39,912,074) – 99.4% | | | 51,308,058 | | |
| Short-Term Obligation – 0.7% | |
| | 373,000 | | | Repurchase Agreement with State
Street Bank & Trust dated 06/30/06,
due 07/03/06 at 4.93% collateralized by a
Federal Home Loan Bank Note, maturing
12/12/08 market value $384,150 (repurchase
proceeds: $373,153) | | | 373,000 | | |
| | | (Cost: $373,000) | | | 373,000 | | |
| | | Total Investments (Cost: $40,285,074) – 100.1% (a) (c) | | | 51,681,058 | | |
| | | Cash and Other Assets Less Liabilities – (0.1%) | | | (51,011 | ) | |
| | | Total Net Assets – 100.0% | | $ | 51,630,047 | | |
Notes to Statements of Investments:
(a) At June 30, 2006, cost for federal income tax purposes is $40,285,074. The net unrealized appreciation was $11,395,984 consisting of gross unrealized appreciation of $13,005,364 and gross unrealized depreciation of $1,609,380.
(b) Non-income producing security.
(c) On June 30, 2006, the Fund's total investments were denominated in currencies as follows:
| Currency | | Value | | % of Net
Assets | |
| Euro Dollars | | $ | 18,402,641 | | | | 35.6 | % | |
| Japanese Yen | | | 13,489,011 | | | | 26.1 | | |
| Swiss Francs | | | 5,567,170 | | | | 10.8 | | |
| US Dollars | | | 3,027,209 | | | | 5.9 | | |
Other currencies less than
5% of total net assets | | | 11,195,027 | | | | 21.7 | % | |
| | | $ | 51,681,058 | | | | 100.1 | % | |
See accompanying notes to financial statements.
7
Wanger International Select 2006 Semiannual Report
Wanger International Select
Portfolio Diversification (Unaudited) June 30, 2006
At June 30, 2006, the Fund's portfolio investments as a percent of net assets was diversified as follows:
| | | Value | | Percent | |
| Industrial Goods/Services | |
| Speciality Chemicals | | $ | 3,495,261 | | | | 6.8 | % | |
| Construction | | | 3,216,970 | | | | 6.2 | | |
| Other Industrial Services | | | 1,952,897 | | | | 3.8 | | |
| Machinery | | | 1,297,748 | | | | 2.5 | | |
| Electrical Components | | | 847,023 | | | | 1.6 | | |
| Industrial Materials | | | 719,088 | | | | 1.4 | | |
| Industrial Distribution | | | 629,380 | | | | 1.2 | | |
| Conglomerates | | | 582,471 | | | | 1.1 | | |
| Outsourcing & Training Services | | | 459,269 | | | | 0.9 | | |
| | | | 13,200,107 | | | | 25.5 | | |
| Finance | |
| Other Finance Companies | | | 9,156,458 | | | | 17.8 | | |
| Money Management | | | 783,867 | | | | 1.5 | | |
| | | | 9,940,325 | | | | 19.3 | | |
| Consumer Goods/Services | |
| Beverage | | | 2,570,967 | | | | 4.9 | | |
| Durables Goods | | | 2,159,677 | | | | 4.2 | | |
| Retail | | | 2,026,407 | | | | 3.9 | | |
| Food | | | 1,886,538 | | | | 3.7 | | |
| Consumer Goods Distribution | | | 907,022 | | | | 1.8 | | |
| | | | 9,550,611 | | | | 18.5 | | |
| | | Value | | Percent | |
| Information Technology | |
| Financial Processors | | $ | 2,285,364 | | | | 4.4 | % | |
| Cable Television | | | 1,837,039 | | | | 3.6 | | |
| Computer Hardware & Related Equipment | | | 1,608,719 | | | | 3.1 | | |
| Satellite Broadcasting | | | 1,254,934 | | | | 2.5 | | |
| Telephone Services | | | 1,160,442 | | | | 2.2 | | |
| Television Programming | | | 1,054,555 | | | | 2.0 | | |
| | | | 9,201,053 | | | | 17.8 | | |
| Energy/Minerals | |
| Mining | | | 2,446,252 | | | | 4.8 | | |
| Oil Services | | | 1,304,480 | | | | 2.5 | | |
| | | | 3,750,732 | | | | 7.3 | | |
| Other Industries | |
| Regulated Utilities | | | 1,510,079 | | | | 2.9 | | |
| Real Estate | | | 952,672 | | | | 1.9 | | |
| Transportation | | | 481,894 | | | | 0.9 | | |
| | | | 2,944,645 | | | | 5.7 | | |
| HealthCare | |
| Medical Equipment | | | 2,720,585 | | | | 5.3 | | |
| Total Common Stocks | | | 51,308,058 | | | | 99.4 | | |
| Short-Term Obligations | | | 373,000 | | | | 0.7 | | |
| Total Investments | | | 51,681,058 | | | | 100.1 | | |
Cash and Other Assets
Less Liabilities | | | (51,011 | ) | | | (0.1 | ) | |
| Net Assets | | $ | 51,630,047 | | | | 100.0 | % | |
See accompanying notes to financial statements.
8
Wanger International Select 2006 Semiannual Report
Statement of Assets and Liabilities
June 30, 2006 (Unaudited)
| Assets: | |
| Investments, at cost | | $ | 40,285,074 | | |
| Investments, at value | | $ | 51,681,058 | | |
| Cash | | | 93 | | |
| Foreign currency (cost of $93,712) | | | 95,015 | | |
| Receivable for: | |
| Investments sold | | | 161,057 | | |
| Fund shares sold | | | 4,568 | | |
| Interest | | | 51 | | |
| Dividends | | | 97,778 | | |
| Foreign tax reclaims | | | 18,309 | | |
| Total Assets | | | 52,057,929 | | |
| Liabilities: | |
| Payable for: | |
| Investments purchased | | | 144,081 | | |
| Fund shares repurchased | | | 199,621 | | |
| Investment advisory fee | | | 41,731 | | |
| Transfer agent fee | | | 11 | | |
| Trustees' fees | | | 662 | | |
| Custody fee | | | 7,415 | | |
| Other Liabilities | | | 34,361 | | |
| Total Liabilities | | | 427,882 | | |
| Net Assets | | $ | 51,630,047 | | |
| Composition of Net Assets: | |
| Paid-in capital | | $ | 35,317,126 | | |
| Overdistributed net investment income | | | (188,328 | ) | |
| Accumulated net realized gain | | | 5,102,100 | | |
| Net unrealized appreciation (depreciation) on: | | | | | |
| Investments | | | 11,395,984 | | |
| Foreign currency translations | | | 3,165 | | |
| Net Assets | | $ | 51,630,047 | | |
| Fund Shares outstanding | | | 2,353,938 | | |
Net asset value, offering price and redemption
price per share | | $ | 21.93 | | |
Statement of Operations
For the Six Months Ended June 30, 2006 (Unaudited)
| Investment Income: | |
| Dividend income (net of foreign taxes of $49,766) | | $ | 554,337 | | |
| Interest income | | | 49,737 | | |
| Total Investment Income | | | 604,074 | | |
| Expenses: | |
| Investment advisory fee | | | 268,215 | | |
| Transfer agent fee | | | 72 | | |
| Trustees' fees | | | 2,659 | | |
| Custody fee | | | 23,273 | | |
| Chief compliance officer expenses (See Note 4) | | | 709 | | |
| Non-recurring costs (See Note 8) | | | 122 | | |
| Other expenses | | | 38,328 | | |
| Total Expenses | | | 333,378 | | |
Non-recurring costs assumed by Investment Adviser
(See Note 8) | | | (122 | ) | |
| Custody earnings credit | | | (448 | ) | |
| Net Expenses | | | 332,808 | | |
| Net Investment Income | | | 271,266 | | |
Net Realized and Unrealized Gain (Loss) on
Portfolio Positions and Foreign Currency: | |
| Net realized gain (loss) on: | |
| Investments | | | 6,106,115 | | |
| Foreign currency transactions | | | (10,245 | ) | |
| Net realized gain | | | 6,095,870 | | |
Net change in unrealized appreciation
(depreciation) on: | |
| Investments | | | (567,991 | ) | |
| Foreign currency translations | | | 4,780 | | |
| Net change in unrealized depreciation | | | (563,211 | ) | |
| Net Gain | | | 5,532,659 | | |
| Net Increase in Net Assets from Operations | | $ | 5,803,925 | | |
See accompanying notes to financial statements.
9
Wanger International Select 2006 Semiannual Report
Statements of Changes in Net Assets
| Increase (Decrease) in Net Assets: | | (Unaudited)
Six Months
Ended
June 30,
2006 | | Year Ended
December 31,
2005 | |
| From Operations: | |
| Net investment income | | $ | 271,266 | | | $ | 299,187 | | |
| Net realized gain on investments and foreign currency transactions | | | 6,095,870 | | | | 3,589,539 | | |
Net change in unrealized appreciation (depreciation)
on investments and foreign currency transactions | | | (563,211 | ) | | | 2,219,669 | | |
| Net Increase in Net Assets from Operations | | | 5,803,925 | | | | 6,108,395 | | |
| Distributions Declared to Shareholders: | |
| From net investment income | | | (154,737 | ) | | | (770,742 | ) | |
| Total Distributions Declared to Shareholders | | | (154,737 | ) | | | (770,742 | ) | |
| Share Transactions: | |
| Subscriptions | | | 13,641,854 | | | | 12,185,603 | | |
| Distributions reinvested | | | 154,737 | | | | 770,742 | | |
| Redemptions | | | (11,842,007 | ) | | | (9,499,381 | ) | |
| Net Increase from Share Transactions | | | 1,954,584 | | | | 3,456,964 | | |
| Total Increase in Net Assets | | | 7,603,772 | | | | 8,794,617 | | |
| Net Assets: | |
| Beginning of period | | | 44,026,275 | | | | 35,231,658 | | |
| End of period | | $ | 51,630,047 | | | $ | 44,026,275 | | |
| Overdistributed Net Investment Income | | $ | (188,328 | ) | | $ | (304,857 | ) | |
See accompanying notes to financial statements.
10
Wanger International Select 2006 Semiannual Report
Financial Highlights
| | | (Unaudited)
Six Months Ended
June 30, | | Year Ended December 31, | |
| Selected data for a share outstanding throughout each period | | 2006 | | 2005 | | 2004 | | 2003 | | 2002 | | 2001 | |
| Net Asset Value, Beginning of Period | | $ | 19.63 | | | $ | 17.19 | | | $ | 13.87 | | | $ | 9.86 | | | $ | 11.64 | | | $ | 17.29 | | |
| Income from Investment Operations: | |
| Net investment income (loss) (a) | | | 0.11 | | | | 0.13 | | | | 0.04 | | | | 0.04 | | | | 0.04 | | | | (0.03 | ) | |
Net realized and unrealized gain (loss) on investments and
foreign currency transactions | | | 2.25 | | | | 2.66 | | | | 3.33 | | | | 4.01 | | | | (1.82 | ) | | | (4.46 | ) | |
| Total from Investment Operations | | | 2.36 | | | | 2.79 | | | | 3.37 | | | | 4.05 | | | | (1.78 | ) | | | (4.49 | ) | |
| Less Distributions Declared to Shareholders: | |
| From net investment income | | | (0.06 | ) | | | (0.35 | ) | | | (0.05 | ) | | | (0.04 | ) | | | — | | | | (0.02 | ) | |
| From net realized capital gains | | | — | | | | — | | | | — | | | | — | | | | — | | | | (1.14 | ) | |
| Total Distributions Declared to Shareholders | | | (0.06 | ) | | | (0.35 | ) | | | (0.05 | ) | | | (0.04 | ) | | | — | | | | (1.16 | ) | |
| Net Asset Value, End of Period | | $ | 21.93 | | | $ | 19.63 | | | $ | 17.19 | | | $ | 13.87 | | | $ | 9.86 | | | $ | 11.64 | | |
| Total Return (b) | | | 12.04 | %(c) | | | 16.43 | %(d) | | | 24.34 | % | | | 41.24 | %(d) | | | (15.29 | )%(d) | | | (26.61 | )% | |
| Ratios to Average Net Assets: | |
| Expenses(e) | | | 1.23 | %(f) | | | 1.32 | % | | | 1.43 | % | | | 1.45 | % | | | 1.45 | % | | | 1.45 | % | |
| Net investment income (loss)(e) | | | 1.00 | %(f) | | | 0.76 | % | | | 0.29 | % | | | 0.39 | % | | | 0.35 | % | | | (0.20 | )% | |
| Waiver/Reimbursement | | | — | | | | 0.00 | %(g) | | | — | | | | 0.09 | % | | | 0.10 | % | | | — | | |
| Portfolio turnover rate | | | 34 | %(c) | | | 48 | % | | | 71 | % | | | 59 | % | | | 113 | % | | | 72 | % | |
| Net assets, end of period (000's) | | $ | 51,630 | | | $ | 44,026 | | | $ | 35,232 | | | $ | 26,928 | | | $ | 14,083 | | | $ | 15,431 | | |
(a) Net investment income (loss) per share was based upon the average shares outstanding during the period.
(b) Total return at net asset value assuming all distributions reinvested.
(c) Not annualized.
(d) Had the Investment Adviser not waived a portion of expenses, total return would have been reduced.
(e) The benefits derived from custody fees paid indirectly had no impact.
(f) Annualized
(g) Rounds to less than 0.01%.
See accompanying notes to financial statements.
11
Wanger International Select 2006 Semiannual Report
Notes to Financial Statements (Unaudited)
1. Nature of Operations
Wanger International Select (the "Fund") is a series of Wanger Advisors Trust (the "Trust"), an open-end management investment company organized as a Massachusetts business trust. The investment objective of the Fund is to seek long-term growth of capital. The Fund is available only for allocation to certain life insurance company separate accounts established for the purpose of funding qualified and non-qualified variable annuity contracts, and variable life insurance policies and may also be offered directly to certain types of pension plans and retirement arrangements.
2. Significant Accounting Policies
Security valuation
Securities of the Fund are valued at market value or, if a market quotation for a security is not readily available or is deemed not to be reliable because of events or circumstances that have occurred between the market quotation and the time as of which the security is to be valued, the security is valued at a fair value determined in accordance with procedures established by the Board of Trustees. Securities traded on securities exchanges or in over-the-counter markets in which transaction prices are reported are valued at the last sales price at the time of valuation. If a security is traded principally on the Nasdaq Stock Market Inc., the Nasdaq Official Closing Price will be applied. Securities for which there are no reported sales on the valuation date are valued at the latest bid quotation. Short-term debt obligations having a maturity of 60 days or less from the valuation date are valued on an amortized cost basis, whic h approximates fair value. Securities for which quotations are not readily available and any other assets are valued as determined in good faith under consistently applied procedures established by and under the general supervision of the Board of Trustees. The Trust has retained an independent statistical fair value pricing service to assist in the fair valuation process for securities principally traded in a foreign market in order to adjust for possible changes in value that may occur between the close of the foreign exchange and the time at which Fund shares are priced. If a security is valued at a "fair value," that value may be different from the last quoted market price for the security.
Repurchase agreements
The Fund may engage in repurchase agreement transactions. The Fund, through its custodians, receives delivery of underlying securities collateralizing each repurchase agreement. The Fund's investment adviser determines that the value of the underlying securities is at all times at least equal to the repurchase prices including interest. In the event of default or bankruptcy by the other party to the agreement, realization and/or retention of the collateral may be subject to legal proceedings.
Foreign currency translations
Values of investments denominated in foreign currencies are converted into U.S. dollars using the spot market rate of exchange at the time of valuation. Purchases and sales of investments and dividend and interest income are translated into U.S. dollars using the spot market rate of exchange prevailing on the respective dates of such transactions. The gain or loss resulting from changes in foreign exchange rates is included with net realized and unrealized gain or loss from investments, as appropriate.
Security transactions and investment income
Security transactions are accounted for on the trade date (date the order to buy or sell is executed) and dividend income is recorded on the ex-dividend date, except that certain dividends from foreign securities are recorded as soon as the information is available to the Fund. Interest income is recorded on an accrual basis and includes amortization of discounts on short-term debt obligations and on long-term debt obligations when required for federal income tax purposes. Realized gains and losses from security transactions are reported on an identified cost basis.
Use of Estimates
The preparation of financial statements in conformity with accounting principles generally accepted in the United States of America ("GAAP") requires management to make estimates and assumptions that affect the amounts reported in the financial statements and accompanying notes. Actual results may differ from those estimated.
Fund share valuation
Fund shares are sold and redeemed on a continuing basis at net asset value. Net asset value per share is determined daily as of the close of trading on the New York Stock Exchange (the "Exchange") on each day the Exchange is open for trading by dividing the total value of the Fund's investments and other assets, less liabilities, by the number of Fund shares outstanding.
Custody fees/Credits
Custody fees are reduced based on the Fund's cash balances maintained with the custodian. The Fund could have invested a portion of the assets utilized in connection with the expense offset arrangement in an income-producing asset if it had not entered into such an agreement. The amount is disclosed as a reduction of total expenses in the Statement of Operations.
Federal income taxes
The Fund has complied with the provisions of the Internal Revenue Code available to regulated investment companies and, in the manner provided therein, distributes all its taxable income, as well as any net realized gain on sales of investments and foreign currency transactions reportable for federal income tax purposes. Accordingly, the Fund paid no federal income taxes and no federal income tax provision was required.
Indemnification
In the normal course of business, the Fund enters into contracts that contain a variety of representations and warranties which provide general indemnities. The Fund's maximum exposure under these arrangements is unknown, as this would involve future claims against the Fund. Also under the Trust's organizational documents, the Trustees and Officers of the Trust are indemnified against certain liabilities that may arise out of their duties to the Trust. However based on experience, the Fund expects the risk of loss due to these warranties and indemnities to be minimal.
Foreign Capital Gains Taxes
Realized gains in certain countries may be subject to foreign taxes at the fund level, at rates ranging from 10%-15%. The Fund accrues for such foreign taxes on net realized and unrealized gains at the appropriate rate for each jurisdiction.
Distributions to shareholders
Distributions to shareholders are recorded on the ex-date.
3. Federal Tax Information
The tax character of distributions paid during the year ended December 31, 2005 was as follows:
| | | December 31, 2005 | |
| Distributions paid from: | |
| Ordinary Income* | | $ | 770,742 | | |
* For tax purposes short-term capital gains distributions, if any, are considered ordinary income distributions.
12
Wanger International Select 2006 Semiannual Report
Notes to Financial Statements (Unaudited)
The following capital loss carryforwards, determined as of December 31, 2005, may be available to reduce taxable income arising from future net realized gains on investments, if any, to the extent permitted by the Internal Revenue Code:
Year of
Expiration | | Capital Loss
Carryforwards | |
| | 2010 | | | $ | 11,505 | | |
| | 2011 | | | | 982,004 | | |
| Total | | $ | 993,509 | | |
Expired capital loss carryforwards, if any, are recorded as reduction of paid-in capital. Capital loss carryforwards of $3,581,121 were utilized during the year ended December 31, 2005 for the Fund.
4. Transactions With Affiliates
Columbia Wanger Asset Management, L.P., ("Columbia WAM") a wholly-owned subsidiary of Columbia Management, Inc. ("CM"), which in turn is an indirect wholly owned subsidiary of Bank of America Corporation ("BOA"), furnishes continuing investment supervision to the Fund and is responsible for the overall management of the Fund's business affairs.
Under the Fund's investment management agreement, fees are accrued daily and paid monthly to Columbia WAM at the annual rate of 0.99% of average daily net assets.
The investment advisory agreement also provides that through April 30, 2007 Columbia WAM will reimburse the Fund to the extent that ordinary operating expenses (computed based on net custodian fees) exceed an annual percentage of 1.45% of average daily net assets. There was no reimbursement for the six months ended June 30, 2006.
Certain officers and trustees of the Trust are also officers of Columbia WAM. On June 7, 2006, the board of trustees of Wanger Advisors Trust nominated for election as trustees to the Wanger Advisors Trust board 11 individuals (each a "Nominee" and collectively the "Nominees"). Two of the Nominees are currently trustees of the Trust and the remaining nine Nominees are currently trustees of the Columbia Acorn Trust. A special meeting of the shareholders has been scheduled for September 11, 2006 to vote on the election of the Nominees. Notice of the special meeting, a proxy statement and a proxy card has been mailed to all shareholders of record as of the close of business on July 14, 2006. The Trust makes no direct payments to its officers and trustees who are affiliated with Columbia WAM. For the six months ended June 30, 2006, the Fund paid $2,659 to trustees not affiliated with Columbia WAM.
The Board of Trustees appointed a Chief Compliance Officer to the Fund in accordance with federal securities regulations. The Fund will pay its pro-rata share of the expenses associated with the Office of the Chief Compliance Officer. These expenses are disclosed separately as "Chief compliance officer expenses" in the Statement of Operations.
Columbia Management Distributors, Inc., a wholly owned subsidiary of BOA, serves as the principal underwriter of the Trust and receives no compensation for its services.
Columbia Management Services, Inc. (the "Transfer Agent"), a wholly owned subsidiary of BOA, provides shareholder services to the Fund and has contracted with Boston Financial Data Services ("BFDS") to serve as subtransfer agent. For such services, the Transfer Agent receives a fee, paid monthly, at the annual rate of $21.00 per open account. During the period covered by this report, the Transfer Agent has voluntarily waived its right to reimbursement for certain out-of-pocket expenses.
Columbia WAM has delegated to Columbia Management Advisors, LLC, an indirect wholly owned subsidiary of BOA, responsibility to provide certain administrative services to the Fund.
During the six months ended June 30, 2006, the Fund did not engage in any purchase and sales transactions with funds that have a common investment adviser (or affiliated investment advisers), common Directors/Trustees, and/or common Officers.
5. Borrowing Arrangements
The Trust participates in a $150,000,000 credit facility, which was entered into to facilitate portfolio liquidity. Interest is charged to each participating fund based on its borrowings at rate per annual equal to the Federal Funds rate plus 0.50%. In addition, a commitment fee of 0.10% per annum is accrued and apportioned among the participating funds based on their pro-rata portion of the unutilized line of credit. The commitment fee is included in "Other expenses" on the Statement of Operations. No amounts were borrowed under this facility for the six months ended June 30, 2006.
6. Fund Share Transactions
Proceeds and payments on Fund shares as shown in the statement of changes in net assets are in respect of the following numbers of shares:
| | | Six months ended
June 30, 2006 | | Year ended
December 31, 2005 | |
| Shares sold | | | 643,875 | | | | 688,890 | | |
Shares issued in reinvestment
of dividend distributions | | | 7,483 | | | | 43,155 | | |
| Less shares redeemed | | | 540,590 | | | | 537,836 | | |
| Net increase in shares outstanding | | | 110,768 | | | | 194,209 | | |
7. Investment Transactions
The aggregate cost of purchases and proceeds from sales other than short-term obligations for the six months ended June 30, 2006 were $20,318,607 and $17,526,627.
8. Legal Proceedings
Columbia WAM, Columbia Acorn Trust, another mutual fund family advised by Columbia WAM, and the trustees of Colombia Acorn Trust, are named as defendants in class and derivative complaints which have been consolidated in a Multi-District Action in the federal district court for the District of Maryland (the "MDL Action"). These lawsuits contend that defendants permitted certain investors to market time their trades in certain Columbia Acorn Funds. The MDL Action is ongoing. However, all claims against Columbia Acorn Trust and the independent trustees of Columbia Acorn Trust have been dismissed.
The Columbia Acorn Trust and Columbia WAM are also defendants in a class action lawsuit that alleges, in summary, that the Columbia Acorn Trust and Columbia WAM exposed shareholders of Columbia Acorn International fund to trading by market timers by allegedly (a) failing to properly evaluate daily whether a significant event affecting the value of that fund's securities had occurred after foreign markets had closed but before the calculation of the funds' net asset value ("NAV"); (b) failing to implement the fund's portfolio valuation and share pricing policies and procedures; and (c) failing to know and implement applicable rules and regulations concerning the calculation of NAV (the "Fair Valuation Lawsuit"). The Seventh Circuit ruled that the plaintiffs' state law claims were preempted under federal law resulting in the dismissal of plaintiffs' complaint. Plaintiffs appealed the Seventh Circuit's ruling to the United States S upreme Court.
On March 21, 2005, a class action complaint was filed against the Columbia Acorn Trust and Columbia WAM seeking to rescind the Contingent Deferred Sales Charges assessed upon redemption of Class B shares of Columbia Acorn Funds due to the alleged market timing of the Columbia Acorn Funds. In addition to the rescission of sales charges, plaintiffs seek
13
Wanger International Select 2006 Semiannual Report
Notes to Financial Statements (Unaudited)
recovery of actual damages, attorneys' fees and costs. The case has been transferred to the MDL Action in the federal district court of Maryland.
On April 4, 2006, all of the parties to the MDL Action executed a letter settlement agreement intended to fully resolve all of the lawsuits consolidated in the MDL Action as well as the Fair Valuation Lawsuit. The settlement has not yet been finalized or approved by the court.
Columbia WAM, the Columbia Acorn Funds and the trustees of Columbia Acorn Trust are also defendants in a consolidated lawsuit filed in the federal district court of Massachusetts alleging that Columbia WAM used fund assets to make undisclosed payments to brokers as an incentive for the brokers to market that Columbia Acorn Funds over the other mutual funds to investors. The complaint alleges Columbia WAM and the Trustees of the Trust breached certain common laws duties and federal laws.
On November 30, 2005, the court dismissed all of the claims alleged against all of the parties in the consolidated complaint. Plaintiffs timely filed a notice of appeal of the district court's dismissal order with the First Circuit Court of Appeals. The parties subsequently executed a settlement term sheet to fully resolve all claims in the litigation. The settlement has not yet been finalized or approved by the court.
The Columbia Acorn Trust and Columbia WAM intend to defend these suits vigorously.
As a result of these matters or any adverse publicity or other developments resulting from them, there may be increased redemptions or reduced sales of Fund shares, which could increase transaction costs or operating expenses, or have other adverse consequences for the Funds.
In connection with the events described in detail above, various parties have filed suit against certain funds, their Boards and/or BOA (and affiliated entities). These suits are ongoing. However, based on currently available information, the Columbia Acorn Trust believes that the likelihood that these lawsuits will have a material adverse impact on any fund is remote, and Columbia WAM believes that the lawsuits are not likely to materially affect its ability to provide investment management services to the Funds.
For the six months ended June 30, 2006, CMG has assumed $122 in consulting services and legal fees incurred by the Fund in connection with these matters.
14
Wanger International Select 2006 Semiannual Report
[Excerpts from:]
Wanger Advisors Trust
Management Fee Evaluation of the Senior Officer
Prepared Pursuant to the New York Attorney General's
Assurance of Discontinuance
2006
15
Wanger International Select 2006 Semiannual Report
Introduction
The New York Attorney General's Assurance of Discontinuance ("Order") entered into by Columbia Management Advisors, Inc. ("CMAI") and Columbia Management Distributors, Inc., ("CMDI" and collectively with "CMAI," "CMG") in February 2005, allows CMAI to manage or advise a mutual fund, including the Wanger Advisors Trust's family of funds (the "WAT Funds" or "WAT" or "Trust"), only if the trustees of the WAT Funds appoint a "Senior Officer" to perform specified duties and responsibilities. One of these responsibilities includes "managing the process by which proposed management fees (including but not limited to, advisory fees) to be charged the [WAT Funds] are negotiated so that they are negotiated in a manner which is at arms' length and reasonable and consistent with this Assurance of Discontinuance."
The Order also provides that the Board of Trustees of the WAT Funds ("Board") must determine the reasonableness of proposed "management fees" by using either an annual competitive bidding process supervised by the Senior Officer or Independent Fee Consultant, or by obtaining "an annual independent written evaluation prepared by or under the direction of the Senior Officer or the Independent Fee Consultant."
"Management fees" are only part of the costs and expenses paid by mutual fund shareholders. The expenses can vary depending upon the class of shares held but usually include: (1) investment management or advisory fees to compensate analysts and portfolio managers for stock research and portfolio management, as well as the cost of operating a trading desk; (2) administrative expenses incurred to prepare registration statements and tax returns, calculate the Funds' net asset values, maintain effective compliance procedures and perform recordkeeping services; (3) transfer agency costs for establishing accounts, accepting and disbursing funds, as well as overseeing trading in Fund shares; and (4) custodial expenses incurred to hold the securities purchased by the Funds.
Columbia Wanger Asset Management, L.P. ("CWAM"), the adviser to the WAT Funds, has proposed that the Trust enter into an agreement that "bundles" the first two categories listed above: advisory and administrative services. The fees paid under this agreement are referred to as "management fees." Other fund expenses are governed by separate agreements, in particular agreements with two CWAM affiliates: CMDI, the broker-dealer that underwrites and distributes the WAT Funds' shares, and Columbia Management Services, Inc. ("CMSI"), the Funds' transfer agent. In conformity with the terms of the Order, this evaluation, therefore, addresses only the advisory and administrative contract between CWAM and the Trust, and does not extend to the other agreements.
According to the Order, the Senior Officer's evaluation must consider at least the following:
(1) Management fees (including components thereof) charged to institutional and other clients of CWAM for like services;
(2) Management fees (including any components thereof) charged by other mutual fund companies for like services;
(3) Costs to CWAM and its affiliates of supplying services pursuant to the management fee agreements, excluding any intra-corporate profit;
(4) Profit margins of CWAM and its affiliates from supplying such services;
(5) Possible economies of scale as the WAT Funds grow larger; and
(6) The nature and quality of CWAM's services, including the performance of each WAT Fund.
On November 17, 2004, the Board appointed me Senior Officer under the Order. The Board also determined not to pursue a competitive bidding process and instead, charged me with the responsibility of evaluating the WAT Funds' proposed advisory and administrative fee contract with CWAM in conformity with the requirements of the Order. This Report is an annual evaluation required under the Order. In discharging their responsibilities, the independent Trustees have also consulted independent, outside counsel.
2005 Evaluation
This is the second annual evaluation prepared in connection with the Order. The first annual evaluation ("2005 Evaluation") was issued on July 25, 2005. This evaluation follows the same structure as the 2005 Evaluation. Some areas are given more emphasis here, while others are given less. Still, the fundamental information gathered for this evaluation is the largely the same as last year. I have noted in this Report where methodologies diverged significantly.
This evaluation was performed in cooperation and regular communication with the Compliance/Contract Renewal Committee of the Board.
Process and Independence
The objectives of the Order are to insure the independent evaluation of the advisory fees paid by the WAT Funds as well as to insure that all relevant factors are considered. In my view, the contract renewal process has been conducted at arms-length and with independence in gathering, considering and evaluating all relevant data. At the outset of the process, the Trustees sought and obtained from CWAM and CMG a comprehensive compilation of data regarding Fund performance and expense, adviser profitability, and other information. In advance of the contract renewal process, the Board also explored CWAM's potential capacity restraints as they relate to the larger Columbia Acorn Fund complex managed by CWAM. The adviser's capacity to manage increasing assets is an issue posed by the size of the Columbia Acorn Fund, but impacts the domestic WAT Funds as well. Performance and expense data was obtained from both Morningstar and Lipper, the leading consultants in this area. The rankings prepared by Morningstar and Lipper were independent and were not influenced by the adviser. CWAM itself identified what it considers its competition in formulating its own peer group, and the Trustees considered that data as well.
16
Wanger International Select 2006 Semiannual Report
My evaluation of the advisory contract was shaped, as it was last year, by my experience as WAT's Chief Compliance Officer ("CCO"). As CCO, I report solely to the Board and have no reporting obligation to or employment relationship with CMG or its affiliates, except for administrative purposes. This too contributes to the independence of this evaluation. I have commented on compliance matters in evaluating the quality of service provided by CWAM.
Since the 2005 Evaluation was issued, the Board has considered the recommendations and conclusions of that Report. In connection with the July 2005 contract renewal, the Board added a breakpoint of 10 basis points for Wanger International Small Cap for assets in excess of $500 million. Since that fund now has assets of $1.2 billion, management fees were reduced as a result. The Board has also gathered data on payments made by CWAM to insurance company partners as part of the Board's on-going consideration of whether to institute Rule 12b-1 fees for the WAT Funds. Finally, it has gathered and considered data from CWAM regarding its capacity to invest fund assets effectively.
This Report, its supporting materials and the data contained in other materials submitted to the Compliance/Contract Committee of the Board, in my view, provide a thorough factual basis upon which the Board, in consultation with independent counsel as it deems appropriate, may conduct management fee negotiations that are in the best interests of the WAT Funds' shareholders.
Finally, it should be noted that in June 2006, the WAT and Columbia Acorn Boards agreed in principle to merge, subject to appropriate shareholder approval. In view of this development, the WAT Trustees are considering the extension of the existing advisory contract for an interim period that would facilitate a review of the agreement by the combined board following the proposed merger for the remainder of the renewal period (through July 2007). Regardless of how the WAT Trustees ultimately choose to proceed in this respect, this Report provides the WAT Board with sufficient information to make an informed decision at this time regarding the advisory contract.
The Fee Reductions Mandated under the Order
Under the terms of the Order, CMG agreed to secure certain management fee reductions for the mutual funds advised by its affiliate investment advisers. In some instances, breakpoints were also established. Although neither CWAM nor the Trust was a party to the Order, CWAM offered and the Board accepted certain advisory fee reductions last year. By the terms of the Order, these fees may not be increased before November 30, 2009. I have used these advisory fee levels in my evaluation because they are the fees in the current agreements that CWAM proposes should be continued. Hence, these fee levels are the starting point of an evaluation.
Conclusions
My review of the data and other material above leads to the following conclusions with respect to the factors identified in the Order.
1. Performance. The domestic Funds generally have achieved outstanding performance. The Wanger US Smaller Companies and Wanger Select both rank very favorably against their peers. The international Funds have not, however, performed nearly as well as the domestic Funds, and continue to lag their benchmarks and peers. Management is taking steps to improve the performance of these funds.
2. Management Fees relative to Peers. The management fee rankings for the domestic funds are below their peers and hence less favorable to shareholders than competitors' funds. The international Funds fare much better, but the Morningstar and Lipper rankings diverge sharply.
3. Administrative Fees. The WAT Funds pay a bundled fee that combines advisory fees and administrative expense, so ranking these fees separately was not possible.
4. Management Fees relative to Institutional and Other Mutual Fund Accounts. CWAM's focus is on its mutual funds. It does not actively seek to manage separate or institutional accounts. The few institutional accounts it does manage vary in rate structures. Some pay advisory fees commensurate with or higher than the WAT Funds. In a few instances, however, institutional accounts pay lower advisory fees than do the WAT Funds.
5. Costs to CWAM and its Affiliates. CWAM's direct costs do not appear excessive, and in some areas have declined in the past year. Indirect costs allocated to CWAM by its parent organization, however, have increased substantially. CWAM's affiliates report operating losses and therefore do not appear to profit from CWAM's advisory agreement with the WAT Funds.
6. Profit Margins. CWAM's firm-wide, pre-marketing expense profit margins are at the top of the industry, though these comparisons are hampered by limited industry data. High profit margins are not unexpected for firms that manage large, successful funds and have provided outstanding investment performance for investors.
7. Economies of Scale. Economies of scale do exist at CWAM and will expand as the assets under management increase. They are, however, only partially reflected in the management fee schedule for the Funds. If the WAT Funds' assets continue to grow, under the Funds' current fee schedules, shareholders might not benefit in a manner generally commensurate with CWAM's increased profits.
17
Wanger International Select 2006 Semiannual Report
8. Nature and Quality of Services. This category includes a variety of considerations that are difficult to quantify, yet can have a significant bearing on the performance of the WAT Funds. Several areas merit comment.
a. Capacity. CWAM's assets under management have continued to grow, posing ever greater challenges in deploying assets effectively. While trends here merit continued monitoring, CWAM appears to be managing assets effectively.
b. Compliance. CWAM has a reasonably designed compliance program that protects shareholders.
c. Administrative Services. The WAT Funds benefit from a variety of administrative services that are performed by CWAM and CMAI.
In my opinion, the process of negotiating an advisory contract for the WAT Funds has been conducted thoroughly and at arms' length. Further, the Trustees have sufficient information to evaluate management's proposal, and negotiate contract terms that are in the best interests of fund shareholders.
Recommendations
I believe the Trustees should:
1. Continue to consider ways to restructure the advisory fee beyond the current breakpoint schedule to reflect more fully economies of scale.
2. Monitor the performance of the international funds.
3. Continue to monitor CWAM's capacity limitations to insure that CWAM's expanding assets under management do not impair investment performance.
4. Consider unbundling of advisory and administrative fees.
5. Continue their consideration of whether to implement a plan under Rule 12b-1.
Robert P. Scales
July 24, 2006
18
Wanger International Select 2006 Semiannual Report
This page intentionally left blank.
19
Wanger International Select 2006 Semiannual Report

Wanger Advisors Trust
Trustees
Patricia H. Werhane, Chairperson
Jerome L. Duffy
Kathryn A. Krueger, M.D.
Ralph Wanger
Officers
Charles P. McQuaid
President
Ben Andrews
Vice President
Michael G. Clarke
Assistant Treasurer
Jeffrey R. Coleman
Assistant Treasurer
J. Kevin Connaughton
Assistant Treasurer
John M. Kunka
Assistant Treasurer
Joseph C. LaPalm
Vice President
Bruce H. Lauer
Vice President, Treasurer and Secretary
Louis J. Mendes III
Vice President
Robert A. Mohn
Vice President
Christopher J. Olson
Vice President
Michelle H. Rhee
Assistant Secretary
Linda K. Roth-Wiszowaty
Assistant Secretary
Robert P. Scales
Chief Compliance Officer, Senior Vice President and General Counsel
Transfer Agent,
Dividend Disbursing Agent
Columbia Management Services, Inc.
P.O. Box 8081
Boston, Massachusetts
02266-8081
Distributor
Columbia Management Distributors, Inc.
One Financial Center
Boston, Massachusetts
02111-2621
Investment Adviser
Columbia Wanger Asset Management, L.P.
227 West Monroe Street, Suite 3000
Chicago, Illinois 60606
1-888-4-WANGER
(1-888-492-6437)
Legal Counsel
Bell, Boyd & Lloyd LLC
Chicago, Illinois
This report, including the schedules of investments and financial statements, is submitted for the general information of the shareholders of the Wanger Advisors Trust. This report is not authorized for distribution unless preceded or accompanied by a prospectus.
A description of the Fund's proxy voting policies and procedures is available (i) on the Fund's website, www.columbiafunds.com; (ii) on the Securities and Exchange Commission's website at www.sec.gov, and (iii) without charge, upon request, by calling 888-492-6437. Information regarding how the Fund voted proxies relating to portfolio securities during the 12-month period ended June 30, 2006, is available from the SEC's website.
The Fund files a complete schedule of portfolio holdings with the SEC for the first and third quarters of each fiscal year on Form N-Q. The Fund's Form N-Q is available on the SEC's website at www.sec.gov and may be reviewed and copied at the SEC's Public Reference Room in Washington, D.C. Information on the operation of the Pubic Reference Room may be obtained by calling 800-SEC-0330.
20
Wanger Advisors Trust
SHC-44/111958-0606 06/27266
Item 2. Code of Ethics.
Not applicable at this time.
Item 3. Audit Committee Financial Expert.
Not applicable at this time.
Item 4. Principal Accountant Fees and Services.
Not applicable at this time.
Item 5. Audit Committee of Listed Registrants.
Not applicable.
Item 6. Schedule of Investments
The registrant’s “Schedule I – Investments in securities of unaffiliated issuers” (as set forth in 17 CFR 210.12-12) is included in Item 1 of this Form N-CSR.
Item 7. Disclosure of Proxy Voting Policies and Procedures for Closed-End Management Investment Companies.
Not applicable.
Item 8. Portfolio Managers of Closed-End Management Investment Companies.
Not applicable.
Item 9. Purchases of Equity Securities by Closed-End Management Investment Company and Affiliated Purchasers.
Not applicable.
Item 10. Submission of Matters to a Vote of Security Holders.
There have not been any material changes to the procedures by which shareholders may recommend nominees to the registrant’s board of directors, since those procedures were last disclosed in response to the requirements of Item 7(d)(2)(ii)(G) of Schedule 14A or this Item.
Item 11. Controls and Procedures.
(a) The registrant’s principal executive officer and principal financial officers, based on their evaluation of the registrant’s disclosure controls and procedures as of a date within 90 days of the filing of this report, have concluded that such controls and procedures are adequately designed to ensure that information required to be disclosed by the registrant in Form N-CSR is accumulated and communicated to the registrant’s management, including the principal executive officer and principal financial officer, or persons performing similar functions, as appropriate to allow timely decisions regarding required disclosure.
(b) There were no changes in the registrant’s internal control over financial reporting that occurred during the registrant’s second fiscal quarter of the period covered by this report that has materially affected, or is reasonably likely to materially affect, the registrant’s internal control over financial reporting.
Item 12. Exhibits.
(a)(1) Code of ethics required to be disclosed under Item 2 of Form N-CSR: Not applicable at this time.
(a)(2) Certifications pursuant to Rule 30a-2(a) under the Investment Company Act of 1940 (17 CFR 270.30a-2(a)) attached hereto as Exhibit 99.CERT.
(a)(3) Not applicable.
(b) Certification pursuant to Rule 30a-2(b) under the Investment Company Act of 1940 (17 CFR 270.30a-2(b)) attached hereto as Exhibit 99.906CERT.
SIGNATURES
Pursuant to the requirements of the Securities Exchange Act of 1934 and the Investment Company Act of 1940, the registrant has duly caused this report to be signed on its behalf by the undersigned, thereunto duly authorized.
(registrant) | | Wanger Advisors Trust |
|
|
By (Signature and Title) | | /S/ Charles P. McQuaid |
| | Charles P. McQuaid, President |
|
|
Date | | August 25, 2006 |
| | | | |
Pursuant to the requirements of the Securities Exchange Act of 1934 and the Investment Company Act of 1940, this report has been signed below by the following persons on behalf of the registrant and in the capacities and on the dates indicated.
By (Signature and Title) | | /S/ Charles P. McQuaid |
| | Charles P. McQuaid, President |
|
|
Date | | August 25, 2006 |
|
|
By (Signature and Title) | | /S/ Bruce H. Lauer |
| | Bruce H. Lauer, Treasurer |
|
|
Date | | August 25, 2006 |
| | | |