UNITED STATES
SECURITIES AND EXCHANGE COMMISSION
Washington, D.C. 20549
FORM N-CSR
CERTIFIED SHAREHOLDER REPORT OF REGISTERED
MANAGEMENT INVESTMENT COMPANIES
Investment Company Act file number | 811-8748 |
|
Wanger Advisors Trust |
(Exact name of registrant as specified in charter) |
|
One Financial Center, Boston, Massachusetts | | 02111 |
(Address of principal executive offices) | | (Zip code) |
|
James R. Bordewick, Jr., Esq. Columbia Management Advisors, LLC One Financial Center Boston, MA 02111 |
(Name and address of agent for service) |
|
Registrant’s telephone number, including area code: | 1-617-426-3750 | |
|
Date of fiscal year end: | December 31, 2007 | |
|
Date of reporting period: | June 30, 2007 | |
| | | | | | | | |
Form N-CSR is to be used by management investment companies to file reports with the Commission not later than 10 days after the transmission to stockholders of any report that is required to be transmitted to stockholders under Rule 30e-1 under the Investment Company Act of 1940 (17 CFR 270.30e-1). The Commission may use the information provided on Form N-CSR in its regulatory, disclosure review, inspection, and policymaking roles.
A registrant is required to disclose the information specified by Form N-CSR, and the Commission will make this information public. A registrant is not required to respond to the collection of information contained in Form N-CSR unless the Form displays a currently valid Office of Management and Budget ("OMB") control number. Please direct comments concerning the accuracy of the information collection burden estimate and any suggestions for reducing the burden to Secretary, Securities and Exchange Commission, 450 Fifth Street, NW, Washington, DC 20549-0609. The OMB has reviewed this collection of information under the clearance requirements of 44 U.S.C. § 3507.
Item 1. Reports to Stockholders.
Wanger International Select
2007 Semiannual Report


Wanger International Select
2007 Semiannual Report
| | | Table of Contents | |
| | 1 | | | Understanding Your Expenses | |
|
| | 2 | | | Doomsayers vs. Doomslayers | |
|
| | 5 | | | Performance Review | |
|
| | 7 | | | Statement of Investments | |
|
| | 11 | | | Statement of Assets and Liabilities | |
|
| | 11 | | | Statement of Operations | |
|
| | 12 | | | Statement of Changes in Net Assets | |
|
| | 13 | | | Financial Highlights | |
|
| | 14 | | | Notes to Financial Statements | |
|
| | 17 | | | Management Fee Evaluation of the Senior Officer | |
|
Columbia Wanger Asset Management, L.P. ("Columbia WAM") is one of the leading global small- and mid-cap equity managers in the United States with more than 37 years of small- and mid-cap investment experience. As of June 30, 2007, Columbia WAM manages more than $38.2 billion in assets and is the investment adviser to Wanger U.S. Smaller Companies, Wanger International Small Cap, Wanger Select, Wanger International Select and the Columbia Acorn Family of Funds. Columbia Management Group, LLC ("Columbia Management") is the investment management division of Bank of America Corporation. Columbia Management entities furnish investment management services and products for institutional and individual investors. Columbia Funds are distributed by Columbia Management Distributors, Inc., member of FINRA, SIPC, part of Columbia Management and an affiliate of Bank of America Corporation. Columbia WAM is an SEC-registered investment adviser and indirect, wholly owned subsidiary of Bank of America Corporation.
Please consider the investment objectives, risks, charges and expenses for the Fund carefully before investing. Contact 1-888-4-WANGER for a prospectus, which contains this and other important information about the Fund. You should read it carefully before you invest.
The views expressed in "Doomsayers vs. Doomslayers" and in the Performance Review reflect the current views of the respective parties. These views are not guarantees of future performance and involve certain risks, uncertainties and assumptions that are difficult to predict so actual outcomes and results may differ significantly from the views expressed. These views are subject to change at any time based upon economic, market or other conditions and the respective parties disclaim any responsibility to update such views. These views may not be relied on as investment advice and, because investment decisions for a Columbia Fund are based on numerous factors, may not be relied on as an indication of trading intent on behalf of any particular Columbia Fund. References to specific company securities should not be construed as a recommendation or investment advice.
Wanger International Select 2007 Semiannual Report
Understanding Your Expenses
As a Fund shareholder, you incur two types of costs. There are transaction costs, which generally include sales charges on purchases and may include redemption or exchange fees. There are also ongoing costs, which generally include investment advisory and other Fund expenses. The information on this page is intended to help you understand your ongoing costs of investing in the Fund and to compare these costs with the ongoing costs of investing in other mutual funds.
Analyzing your Fund's expenses
To illustrate these ongoing costs, we have provided an example and calculated the expenses paid by investors in the Fund during the reporting period. The information in the following table is based on an initial, hypothetical investment of $1,000.00, which is invested at the beginning of the reporting period and held for the entire period. Expense information is calculated two ways and each method provides you with different information. The amount listed in the "actual" column is calculated using actual operating expenses and total return for the Fund. The amount listed in the "hypothetical" column assumes that the return each year is 5% before expenses and then applies the Fund's actual expense ratio for the period to the hypothetical return. You should not use the hypothetical account values and expenses to estimate either your actual account balance at the end of the period or the expenses you paid during the reporting perio d. See the "Compare with other funds" information for details on using the hypothetical data.
Estimating your actual expenses
To estimate the expenses that you actually paid over the period, first you will need your account balance at the end of the period.
1. Divide your ending account balance by $1,000.00. For example, if an account balance was $8,600.00 at the end of the period, the result would be 8.6.
2. In the section of the table below titled "Expenses paid during the period," you will find a dollar amount in the column labeled "Actual." Multiply this amount by the result from step 1. Your answer is an estimate of the expenses you paid on your account during the period.
January 1, 2007 – June 30, 2007
| | | Account value at the
beginning of the period ($) | | Account value at the
end of the period ($) | | Expenses paid during
period ($) | | Fund's annualized
expense ratio (%)* | |
| | | Actual | | Hypothetical | | Actual | | Hypothetical | | Actual | | Hypothetical | | Actual | |
| Wanger International Select | | | 1,000.00 | | | | 1,000.00 | | | | 1,121.49 | | | | 1,018.99 | | | | 6.15 | | | | 5.86 | | | | 1.17 | | |
*For the six months ended June 30, 2007.
Expenses paid during the period are equal to the Fund's annualized expense ratio, multiplied by the average account value over the period, then multiplied by the number of days in the Fund's most recent fiscal half-year and divided by 365.
It is important to note that the expense amounts shown in the table are meant to highlight only ongoing costs of investing in the Fund. As a shareholder of the Fund, you do not incur any transaction costs, such as sales charges, redemption or exchange fees. Expenses paid during the period do not include any insurance charges imposed by your insurance company's separate account. The hypothetical example provided is useful in comparing ongoing costs only and will not help you determine the relative total costs of owning different funds whose shareholders may incur transaction costs.
Compare with other funds
Since all mutual funds are required to include the same hypothetical calculations about expenses in shareholder reports, you can use this information to compare the ongoing cost of investing in the Fund with other funds. To do so, compare the 5% hypothetical example with the 5% hypothetical examples of other funds. As you compare hypothetical examples of other funds, it is important to note that hypothetical examples are meant to highlight the ongoing cost of investing in a fund and do not reflect any transaction costs, such as sales charges, redemption fees or exchange fees that may be incurred by shareholders of other funds. Expenses paid during the period do not include any insurance charges imposed by your insurance company's separate accounts.
1
Wanger International Select 2007 Semiannual Report

Doomsayers vs. Doomslayers
Bad news seems to attract more attention than good news. Tabloid newspapers and the evening news thrive on sensational stories. "If it bleeds, it leads!" the media says, so disasters and doomsayers make headlines while good news is ignored.
Global warming is the current source of much concern and, therefore, much media and political focus. However, declarations of impending disaster for the planet and its inhabitants aren't new.
Doomsayers – Creating Concerns
In 1798, Thomas Malthus wrote An Essay on the Principal of Population.1 He noted that unchecked populations grow geometrically. For illustration, he modeled a population doubling every 25 years. In contrast, he postulated food supplies growing arithmetically. In 1998 therefore, the calculated population would be 256-times its 1798 level while food production would be nine times as large as in 1798. The poor would be "reduced to severe distress" and the actual population increase would revolve around the relatively slow increase in food production.
Moving forward 170 years, Paul Ehrlich's 1968 book, The Population Bomb,2 predicted imminent disaster and became the best-selling environmental tract of all time. He wrote, "The battle to feed all of humanity is over. In the 1970s and 1980s hundreds of millions of people will starve to death in spite of any crash programs embarked upon now." He stated that the world's population roughly doubled every thousand years from about 8000 BC to 1650, then doubled again in 200 years and again in 80 years, and appeared to be doubling over 35 years at the time of the book's publication.
Ehrlich's book also addressed pollution. "In Los Angeles and similar cities the human population has exceeded the carrying capacity of the environment—at least with respect to the ability of the atmosphere to remove waste." He stated, "It seems unlikely that much improvement can be expected...in air pollution until a major shift in the economy takes place." He recommended a shift away from gasoline-powered cars. To his credit, Ehrlich did mention that successful pollution control was possible.
Limits to Growth3 was first published in 1972, and became another best-selling doomsday book. It added resource depletion as a concern in addition to population growth and pollution. Using sophisticated computer models introduced by MIT professor Jay Forrester, the authors predicted long-term disaster: "If present growth trends...continue unchanged, the limits to growth on this planet will be reached sometime within the next one hundred years." (It's better to make a prediction that can be proven right but not wrong within your lifetime.) "The most probable result will be a rather sudden and uncontrollable decline in both population and industrial capacity." The authors recognized the need for more study, but "end(ed) on a note of urgency."
Adding another worry, the April 28, 1975 issue of Newsweek included an article titled, "The Cooling World."4 It quoted studies showing a temperature drop from 1945 to 1968 and then a sudden large increase in snow cover in the northern hemisphere. The article stated, "There are ominous signs that the earth's weather patterns have begun to change dramatically, and that these changes may portend a drastic decline in food production—with serious political implications for just about every nation on Earth."
The Newsweek story went on to report, "Meteorologists disagree about the cause and extent of the trend...but are almost unanimous in the view that the trend will reduce agricultural productivity for the rest of the century." The underlying prediction: "Resulting famines could be catastrophic."
In 2004, three of the original four Limits to Growth authors published Limits to Growth, The 30-Year Update.5 The authors offered a somewhat more positive tone but predicted that growth would not continue much past the year 2010.
The authors stated that the world population increase had slowed to a 1.2% growth rate, or a 60 year doubling period. That represents 75 million persons per year, or the equivalent of adding the population of "six Calcuttas." They did concede that air and water pollution has dropped in many developed countries, and agreed that the ozone hole over Antarctica will disappear by mid-century.
The authors also admitted that more hydrocarbon deposits were proven than used in the previous 30 years, and despite increased demand, the ratios of reserves to production increased. Consequently, while in 1970 world oil reserves were to be depleted by 2002, the update suggested depletion by 2037. Natural gas depletion was deferred from 2009 to 2065. Data on critical industrial metals were also updated. Assuming increases in consumption, depletion of copper and zinc reserves were postponed at least 20 years. The authors also noted that huge potential additional supplies were not yet in reserve statistics.
But the update also reiterated ominous food scarcity themes and said per-capita grain production peaked in the mid-80s. There is a widespread persistence of hunger, as "the number of hungry people has remained constant as the population has grown." The authors continued to believe that improved technology would not offset the effects of exponential growth.
As I mentioned, today's environmental doomsday headline grabber is global
2
Wanger International Select 2007 Semiannual Report
warming. In 2006 an Oscar-winning documentary called, "An Inconvenient Truth" highlighted the potential consequences of higher temperatures, predicting rising ocean levels, animal species extinctions, and food and water shortages. Its creator suggested how people could cut carbon dioxide emissions in order to reduce the problem.
Doomslayers – Presenting the Facts
Are conditions bad and likely to get worse? Julian Simon, a University of Maryland business school professor, became obsessed with data about population growth and prosperity. He found Ehrlich's books and comments to be "a juggernaut of environmentalist hysteria."6 He noted that virtually all data series indicated that the human condition had improved. In 1980, he became the first self-proclaimed doomslayer, and published a fact-filled, footnoted article in Science magazine: "Resources, Population, Environment: An Oversupply of False Bad News."7 Simon went so far as to challenge Ehrlich's theory that overpopulation and depletion would cause prices of raw materials to rise. Ehrlich accepted a 10-year wager with Simon and the battle lines were drawn. Between 1980 and 1990, the world's population saw its largest 10-year increase ever, but materials prices fell. In October 1990, Simon accepted a check from Ehrlich!
Determined to report the facts, Simon went on to publish five books showing data that the doomsayers were wrong. He died in 1998 leaving behind manuscripts that resulted in a sixth book completed in 2000 by Stephen Moore: It's Getting Better all the Time, 100 Greatest Trends of the Last 100 Years.8 In his introduction, Moore wrote, "The central premise of this book is that there has been more improvement in the human condition in the past 100 years than in all of the previous centuries..." Here is a sampling of the book's facts that support its title:
• Since data collection began, life expectancies rose, infant mortality fell, some diseases were eradicated while mortality from others dropped. Job-related fatalities fell since data became available in the 1930s, long before OSHA's creation.
• Per-capita income and wealth rose despite shorter work weeks. Educational attainment jumped. Income disparities by gender and race receded. Most low income people acquired items previously considered "luxuries" and many achieved mid- or high-income status.
• Emissions per unit of GDP fell since the 1930s (prior to regulations) and absolute air quality improved since the data series started in the 1970s. The quality of surface water rose. Forests in the USA have increased in size and density since at least the 1950s. Energy prices relative to wages have plummeted since 1900.
In what could be considered an addendum to Simon's work, the Cato Institute earlier this year published The Improving State of the World.9 Its data also refutes most of what the doomsayers have said:
• Worldwide food supplies per capita increased 24% from 1961 to 2002. "Between 1969-71 and 2000-02, increases in food supplies reduced chronic undernourishment in developing countries from 956 million to 815 million (or from 37 to 17 percent) despite an 83% growth in their population."
• The environment in the developed world is notably cleaner than it was 40 years ago. Air and water pollution is down. Developing countries are increasingly addressing pollution and are making progress in many areas.
• Improved developing world health, wealth, food supplies, and the start of improved environments, are due to globalization. Trade increases wealth and disseminates technology.
• The long-term price trend of virtually every commodity that is used today has been downward over the past two centuries, in terms of both inflation-adjusted dollars and also in terms of minutes worked for purchase.
Investment Discipline – Embracing the Facts
Doomsayers sometimes sell a lot of books, magazines or movies, which in turn generate discussion and possibly action. Potential disasters such as stratospheric ozone depletion can be averted as a result. But often, doomsayers' predictions have turned out to be wrong and then largely forgotten. Mankind has a tremendous ability to solve problems, especially via democratic and capitalistic systems.
While doomsayers often are proven wrong, researching to find the elements of truth behind their claims can provide investment opportunities. When problems are real and are about to be addressed, there is usually money to be made, or lost.
Though the prices of basic materials have indeed fallen over the long run, our international portfolio managers detected an up cycle of accelerating demand and strong prices. We hired an analyst, Fritz Kaegi, to specialize in that group. He confirmed that companies had underinvested in several areas, and believed prices and profits could stay strong for a while. We've discussed some resulting investments in fund shareholder reports.
The world has not run out of oil; predictions of $100 oil proved to be wrong, or at least decades too early. Energy stocks have been
3
Wanger International Select 2007 Semiannual Report
cyclical for a long time. Our funds now have significant investments in energy as we believe this up cycle will persist. Our energy analyst, Bill Doyle, is especially positive on oil service companies.
Doomsayers will come and go; some will raise valid concerns, which, if history repeats itself, will be successfully addressed. We expect to continue to sort through the rhetoric, determine the facts, and work to invest appropriately.


Charles P. McQuaid
President and Chief Investment Officer
Columbia Wanger Asset Management, L.P.
1 Source: Wired.com, "The Doomslayer" by Ed Regis, February 1997.
2 Ehrlich, Paul, The Population Bomb (Buccaneer Books, Inc, 1968, 1971)
3 Meadows, Donella H; Meadows, Dennis L; Randers, Jorgen; Behrens III, William W, The Limits to Growth (New York: Universe Books, 1972)
4 Reprinted in the The American Spectator, May/June 2002. Originally printed in Newsweek, "The Cooling World," reported by Peter Gwynne, April 28, 1975.
5 Meadows, Donella; Randers, Jorgen; Meadows, Dennis, Limits to Growth – The 30-Year Update, (Vermont: Chelsea Green Publishing Company, 2004)
6 Source: Wired.com, "The Doomslayer" by Ed Regis, February 1997.
7 Science, 27 June 1980, Vol. 208, no. 4451.
8 Moore, Stephen; Simon, Julian, It's Getting Better All the Time: 100 Greatest Trends of the Last 100 Years (Washington, DC: Cato Institute, 2000). Bullet pointed data applies to the United States.
9 Goklany, Indur M, The Improving State of the World: Why We're Living Longer, Healthier, More Comfortable Lives on a Cleaner Planet (Washington DC: Cato Institute, 2007)
Author's Note:
The author considers himself to be a disciple of Julian Simon. However, the author also has recycled and conserved energy for years. He has replaced numerous incandescent light bulbs with compact fluorescents. His wife happily drives a hybrid vehicle. And he has not emitted tons of carbon dioxide by flying in a private jet to Davos in order to tell other people to conserve.
4
Wanger International Select 2007 Semiannual Report

Performance Review Wanger International Select

Christopher J. Olson
Portfolio Manager
Performance data quoted represents past performance and current performance may be lower or higher. Past performance is no guarantee of future results. The investment return and principal value of an investment in the Fund will fluctuate so that shares, when redeemed, may be worth more or less than the original cost. For daily and month-end performance updates, please call 1-888-4-WANGER.
Wanger International Select climbed 12.15% during the six-month period, slightly ahead of the 12.04% gain of the S&P/Citigroup World ex-US Cap Range $2-10B Index. The period started with some volatility as the equity markets initially reacted negatively to a brief stock market plunge in China before rebounding to even higher levels.
A new addition to the Fund, Japan's Nintendo, increased 48% as sales of its Wii gaming system and other gaming software broke records. Canada's Potash Corporation of Saskatchewan, the worlds' largest producer of potash, gained 66% for the half year as increasing crop prices bode well for fertilizer prices. Offshore drilling contractor Atwood Oceanics gained 40% on continued strong demand for its deepwater drilling rigs around the world. Sweden's Hexagon, a manufacturer of measurement equipment and polymers, increased 34% on strong earnings news.
In the second half of the period, increased liquidity and favorable earnings news boosted the performance of Asian markets, excluding Japan. The Fund's equity and derivatives market operators, Hong Kong Exchanges and Clearing and Singapore Exchange, both benefited from increased trading volumes. Hong Kong Exchanges and Clearing increased 32% and Singapore Exchange gained 76% during the six-month period.
Laggards included Kenedix, a Japanese real estate investment management company. The stock fell 18% due to the rise in interest rates in Japan and concerns that the real estate sector would suffer. Last year Irish beverage company C&C Group was a star performer for Wanger International Select but the stock has cooled in 2007. Company earnings and sales have declined due to increased competition and very poor summer weather. The stock fell 20%. Banca Italease, an Italian leasing and factoring company, fell 47% in the period and was sold out of the Fund as the company seriously misjudged the amount of exposure it had to interest rate derivatives, which could result in a required capital increase for the firm. Hoya, a Japanese maker of eyeglass lenses and opto-electrical components, dropped 15% due to unexpected production issues and price erosion in its LCD photomask business. We continue to believe the company has a sound bus iness and should perform well in the future.
International investments involve greater potential risks, including less regulation, currency fluctuations, economic instability and political developments. Investments in small- and mid-cap companies may be subject to greater volatility and price fluctuations because they may be thinly traded and less liquid. By maintaining a relatively concentrated portfolio, the fund may be subject to greater risk than a fund that is more fully diversified.
Fund's Positions in Mentioned Holdings
as of 6/30/07
| Nintendo | | | 5.1 | % | |
| Atwood Oceanics | | | 3.3 | % | |
| Potash Corporation of Saskatchewan | | | 3.3 | % | |
| Hong Kong Exchanges and Clearing | | | 3.1 | % | |
| Hexagon | | | 2.9 | % | |
| Kenedix | | | 2.5 | % | |
| Hoya | | | 2.3 | % | |
| Singapore Exchange | | | 1.9 | % | |
| C&C Group | | | 0.2% | | |
| Banca Italease | | | 0.0 | % | |
Portfolio holdings are subject to change periodically and may not be representative of current characteristics and holdings.
5
Wanger International Select 2007 Semiannual Report
Growth of a $10,000 Investment in
Wanger International Select
Total return for each period,
February 1, 1999 (inception date) through June 30, 2007

This graph compares the results of $10,000 invested in Wanger International Select on February 1, 1999 (the date the Fund began operations) through June 30, 2007, to the S&P/Citigroup World ex-US Cap Range $2-10B Index, with dividends and capital gains reinvested. Performance results reflect any voluntary waivers or reimbursements of Fund expenses by the Adviser or any of its affiliates. Absent these waivers or reimbursement arrangements, performance results would have been lower. Performance shown here is past performance, which cannot guarantee future results. Current performance may be higher or lower. The investment return and principal value of an investment in the Fund will fluctuate so that Fund shares, when redeemed, may be worth more or less than their original cost. Performance changes over time. Current returns for the Fund may be different than that shown. For daily and month-end performance updates, please co ntact us at 1-888-4-WANGER.
Results to June 30, 2007
| | | 2nd quarter | | Year to date | | 1 year | |
| Wanger International Select | | | 7.53 | % | | | 12.15 | % | | | 36.14 | % | |
S&P/Citigroup World ex-US
Cap Range $2-10B | | | 6.08 | | | | 12.04 | | | | 29.92 | | |
| MSCI EAFE Index | | | 6.40 | | | | 10.74 | | | | 27.00 | | |
NAV as of 6/30/07: $25.85
Performance numbers reflect all Fund expenses but do not include any insurance charge imposed by your insurance company's separate accounts. If performance included the effect of these additional charges, it would be lower.
Wanger International Select annual operating expense ratio is 1.19%. Annual operating expense ratio is as stated in the Fund's prospectus that is current as of the date of this report. Differences in expense ratios disclosed elsewhere in this report may result from including fee waivers and reimbursements as well as different time periods used in calculating the ratios.
The graph and table do not reflect taxes that a shareholder would pay on Fund distributions or the sale of Fund shares.
The S&P/Citigroup World ex-U.S. Cap Range $2-10B is a subset of the broad market selected by the index sponsor representing the mid-cap developed market excluding the United States. MSCI EAFE Index is Morgan Stanley's Europe, Australasia and Far East Index, a free float-adjusted market capitalization index that is designed to measure developed market equity performance, excluding the U.S. and Canada. It is not possible to invest directly in an index.
Portfolio characteristics and holdings are subject to change periodically and may not be representative of current characteristics and holdings.
Top 5 Countries
As a % of net assets, as of 6/30/07
| Japan | | | 24.7 | % | |
| Switzerland | | | 12.4 | | |
| Netherlands | | | 10.4 | | |
| Ireland | | | 7.7 | | |
| Canada | | | 5.0 | | |
Top 10 Holdings
As a % of net assets, as of 6/30/07
1. Nintendo (Japan)
Entertainment Software & Hardware | | 5.1%
| |
2. Fugro (Netherlands)
Oilfield Services | | 3.7
| |
3. CRH (Ireland)
Global Building Materials | | 3.5
| |
4. Atwood Oceanics (United States)
Offshore Drilling Contractor | | 3.3
| |
5. Potash Corp. of Saskatchewan (Canada)
World's Largest Producer of Postash | | 3.3
| |
6. Zumtobel (Austria)
Lighting Systems | | 3.2
| |
7. Synthes (Switzerland)
Products for Orthopedic Surgery | | 3.1
| |
8. SES Global (France)
Satellite Broadcasting Services | | 3.1
| |
9. Hong Kong Exchanges and Clearing (Hong Kong)
Hong Kong Equity & Derivatives Market Operator | | 3.1
| |
10. Smith & Nephew (United Kingdom)
Medical Equipment & Supplies | | 3.0
| |
6
Wanger International Select 2007 Semiannual Report
Wanger International Select
Statement of Investments (Unaudited) June 30, 2007
Number of
Shares | | | | Value | |
| | | Common Stocks – 96.0% | |
| | | Europe – 53.5% | |
| | | Switzerland – 12.4% | |
| | 18,200 | | | Synthes
Products for Orthopedic Surgery | | $ | 2,184,342 | | |
| | 22,000 | | | Kuehne & Nagel
Freight Forwarding/Logistics | | | 2,026,314 | | |
| | 5,300 | | | Nobel Biocare Holding
Dental Implants & Ceramic Crowns | | | 1,730,574 | | |
| | 7,600 | | | Geberit
Plumbing Supplies | | | 1,296,726 | | |
| | 2,550 | | | Swatch Group
Watch & Electronics Manufacturer | | | 724,155 | | |
| | 9,000 | | | Schindler
Elevator Manufacturer & Service Provider | | | 596,690 | | |
| | | | | | | | 8,558,801 | | |
| | | Netherlands – 10.4% | |
| | 40,338 | | | Fugro
Oilfield Services | | | 2,559,989 | | |
| | 25,000 | | | Stork
Industrial Services & Food Processing Equipment | | | 1,622,742 | | |
| | 38,619 | | | Aalberts Industries
Flow Control & Heat Treatment | | | 1,060,374 | | |
| | 18,000 | | | SBM Offshore
Builds & Leases Offshore Vessels to
Process & Store Crude Oil | | | 686,129 | | |
| | 12,255 | | | USG People
Temporary Staffing Services | | | 575,725 | | |
| | 8,400 | | | Boskalis Westminster
Dredging & Maritime Contractor | | | 333,946 | | |
| | 12,868 | | | Wavin
Largest European Plastic Pipe Systems Company | | | 309,548 | | |
| | | | | | | | 7,148,453 | | |
| | | Ireland – 7.7% | |
| | 48,617 | | | CRH
Global Building Materials | | | 2,399,202 | | |
| | 250,000 | | | United Drug
Irish Pharmaceutical Wholesaler & Outsourcer | | | 1,365,165 | | |
| | 50,000 | | | IAWS Group
Baked Goods | | | 1,047,345 | | |
| | 20,000 | | | Bank of Ireland
Irish Commercial Bank | | | 405,278 | | |
Number of
Shares | | | | Value | |
| | 7,800 | | | C&C Group
Beverage Company | | $ | 104,625 | | |
| | | | | | | | 5,321,615 | | |
| | | United Kingdom – 4.5% | |
| | 170,000 | | | Smith & Nephew
Medical Equipment & Supplies | | | 2,103,727 | | |
| | 55,000 | | | Informa Group
Global Publisher & Event Organizer | | | 611,402 | | |
| | 20,100 | | | Intertek Testing
Testing, Inspection, Certification Services | | | 394,082
| | |
| | | | | | | | 3,109,211 | | |
| | | Germany – 3.7% | |
| | 12,700 | | | Wincor Nixdorf
Retail POS Systems & ATM Machines | | | 1,177,112 | | |
| | 410 | | | Porsche
Specialty Automobile Manufacturer | | | 729,914 | | |
| | 5,550 | | | Deutsche Boerse
Trading, Clearing, Settlement Services
for Financial Markets | | | 628,831 | | |
| | | | | | | | 2,535,857 | | |
| | | Austria – 3.2% | |
| | 60,000 | | | Zumtobel (a)
Lighting Systems | | | 2,238,076 | | |
| | | France – 3.1% | |
| | 100,000 | | | SES Global
Satellite Broadcasting Services | | | 2,155,510 | | |
| | | Sweden – 2.9% | |
| | 105,000 | | | Hexagon
Measurement Equipment & Polymers | | | 2,013,665 | | |
| | | Greece – 2.0% | |
| | 43,000 | | | Intralot
Lottery & Gaming Systems & Services | | | 1,385,203 | | |
| | | Spain – 1.9% | |
| | 28,000 | | | Red Electrica de Espana
Spanish Power Grid | | | 1,312,063 | | |
| | | Denmark – 1.7% | |
| | 10,000 | | | Novozymes
Industrial Enzymes | | | 1,159,212
| | |
| | | | | Total Europe | | | 36,937,666 | | |
See accompanying notes to financial statements.
7
Wanger International Select 2007 Semiannual Report
Wanger International Select
Statement of Investments (Unaudited) June 30, 2007
Number of
Shares | | | | Value | |
| | | Asia – 29.7% | |
| | | Japan – 24.7% | |
| | 9,600 | | | Nintendo
Entertainment Software & Hardware | | $ | 3,506,123 | | |
| | 2,350 | | | Jupiter Telecommunications (a)
Largest Cable Service Provider in Japan | | | 1,937,798 | | |
| | 27,000 | | | Ibiden
Electronic Parts & Ceramics | | | 1,738,552 | | |
| | 920 | | | Kenedix
Real Estate Investment Management | | | 1,711,208 | | |
| | 47,000 | | | Hoya
Opto-electrical Components & Eyeglass Lenses | | | 1,555,556 | | |
| | 50,500 | | | Aeon Mall
Suburban Shopping Mall Developer,
Owner & Operator | | | 1,549,117 | | |
| | 173,000 | | | Kansai Paint
Paint Producer in Japan, India,
China & Southeast Asia | | | 1,511,189 | | |
| | 45,900 | | | JSR
Films & Chemicals for LCD Screens & Electronics | | | 1,105,437 | | |
| | 30,000 | | | Ushio
Industrial Light Sources | | | 664,725 | | |
| | 13,500 | | | Daito Trust Construction
Apartment Builder | | | 642,325 | | |
| | 10,000 | | | USS
Used Car Auctioneer | | | 636,500 | | |
| | 50,000 | | | Park24
Parking Lot Operator | | | 502,013 | | |
| | | | | | | | 17,060,543 | | |
| | | Hong Kong – 3.1% | |
| | 150,000 | | | Hong Kong Exchanges and Clearing
Hong Kong Equity & Derivatives Market Operator | | | 2,122,282 | | |
| | | Singapore – 1.9% | |
| | 210,000 | | | Singapore Exchange
Singapore Equity & Derivatives Market Operator | | | 1,341,201 | | |
| | | | | Total Asia | | | 20,524,026 | | |
Number of Shares
or Principal Amount | | | | Value | |
| | | Other Countries – 12.8% | |
| | | Canada – 5.0% | |
| | 29,000 | | | Potash Corporation of Saskatchewan
World's Largest Producer of Potash | | $ | 2,261,130 | | |
| | 56,900 | | | RONA (a)
Leading Canadian Do-it-yourself Retailer | | | 1,188,477 | | |
| | | | | | | | 3,449,607 | | |
| | | South Africa – 4.5% | |
| | 53,700 | | | Impala Platinum Holdings
Platinum Group Metals Mining & Refining | | | 1,628,026 | | |
| | 58,000 | | | Naspers
Media & Education in Africa & Other
Emerging Markets | | | 1,485,684 | | |
| | | | | | | | 3,113,710 | | |
| | | United States – 3.3% | |
| | 33,500 | | | Atwood Oceanics (a)
Offshore Drilling Contractor | | | 2,298,770 | | |
| | | | | Total Other Countries | | | 8,862,087 | | |
| Total Common Stocks (Cost: $48,232,444) – 96.0% | | | 66,323,779 | | |
| Short-Term Obligation – 3.6% | | | |
| $ | 2,509,000 | | | Repurchase Agreement with
Fixed Income Clearing Corp.,
dated 06/29/07, due 07/02/07
at 5.05%, collateralized by
a U.S. Government Agency
Obligation maturing 07/18/11,
market value $2,561,363
(repurchase proceeds $2,510,056) | | | 2,509,000 | | |
| Total Short-Term Obligation (Cost: $2,509,000) | | | 2,509,000 | | |
| Total Investments (Cost: $50,741,444) – 99.6% (b)(c) | | | 68,832,779 | | |
| Cash and Other Assets Less Liabilities – 0.4% | | | 255,195 | | |
| Total Net Assets – 100% | | | 69,087,974 | | |
See accompanying notes to financial statements.
8
Wanger International Select 2007 Semiannual Report
Wanger International Select
Statement of Investments (Unaudited) June 30, 2007
Notes to Statement of Investments:
(a) Non-income producing security.
(b) At June 30, 2007, for federal income tax purposes cost of investments was $50,741,444 and net unrealized appreciation was $18,091,335 consisting of gross unrealized appreciation of $19,272,849 and gross unrealized depreciation of $1,181,514.
(c) On June 30, 2007, the Fund's total investments were denominated in currencies as follows:
| Currency | | Value | | % of Net
Assets | |
| Euro Dollars | | $ | 22,096,776 | | | | 32.0 | | |
| Japanese Yen | | | 17,060,543 | | | | 24.7 | | |
| Swiss Francs | | | 8,558,802 | | | | 12.4 | | |
| U.S. Dollars | | | 7,068,900 | | | | 10.2 | | |
Other currencies less than
5% of total net assets | | | 14,047,758 | | | | 20.3 | | |
| | | $ | 68,832,779 | | | | 99.6 | | |
See accompanying notes to financial statements.
9
Wanger International Select 2007 Semiannual Report
Wanger International Select
Portfolio Diversification June 30, 2007
At June 30, 2007, the Fund's portfolio investments as a percent of net assets was diversified as follows:
| | | Value | | Percent | |
| Industrial Goods & Services | |
| Conglomerates | | $ | 6,435,333 | | | | 9.3 | % | |
| Construction | | | 4,338,253 | | | | 6.3 | | |
| Specialty Chemicals | | | 4,085,386 | | | | 5.9 | | |
| Other Industrial Services | | | 3,017,086 | | | | 4.4 | | |
| Electrical Components | | | 2,902,801 | | | | 4.2 | | |
| Outsourcing & Training Services | | | 575,725 | | | | 0.8 | | |
| | | | 21,354,584 | | | | 30.9 | | |
| Information Technology | |
| Financial Processors | | | 4,092,314 | | | | 5.9 | | |
| Domestic Consumer Software | | | 3,506,123 | | | | 5.1 | | |
| Satellite Broadcasting | | | 2,155,510 | | | | 3.1 | | |
| Cable Television | | | 1,937,798 | | | | 2.8 | | |
| Semiconductors & Related Equipment | | | 1,555,556 | | | | 2.3 | | |
| Television Broadcasting | | | 1,485,684 | | | | 2.1 | | |
| Computer Hardware & Related Equipment | | | 1,177,112 | | | | 1.7 | | |
| Publishing | | | 611,402 | | | | 0.9 | | |
| | | | 16,521,499 | | | | 23.9 | | |
| Energy & Minerals | |
| Oil Services | | | 5,878,834 | | | | 8.5 | | |
| Mining | | | 3,889,156 | | | | 5.6 | | |
| | | | 9,767,990 | | | | 14.1 | | |
| | | Value | | Percent | |
| Consumer Goods & Services | |
| Retail | | $ | 2,737,594 | | | | 4.0 | % | |
| Durables Goods | | | 1,454,069 | | | | 2.1 | | |
| Casinos | | | 1,385,203 | | | | 2.0 | | |
| Food | | | 1,151,970 | | | | 1.7 | | |
| Consumer Goods Distribution | | | 636,500 | | | | 0.9 | | |
| Other Consumer Services | | | 502,013 | | | | 0.7 | | |
| | | | 7,867,349 | | | | 11.4 | | |
| Health Care | |
| Medical Equipment | | | 6,018,643 | | | | 8.7 | | |
| Pharmaceuticals | | | 1,365,165 | | | | 2.0 | | |
| | | | 7,383,808 | | | | 10.7 | | |
| Other Industries | |
| Real Estate | | | 1,711,208 | | | | 2.5 | | |
| Regulated Utilities | | | 1,312,063 | | | | 1.9 | | |
| | | | 3,023,271 | | | | 4.4 | | |
| Finance | |
| Banks | | | 405,278 | | | | 0.6 | | |
| | | | 405,278 | | | | 0.6 | | |
| Total Common Stocks | | | 66,323,779 | | | | 96.0 | | |
| Short-Term Obligation | | | 2,509,000 | | | | 3.6 | | |
| Total Investments | | | 68,832,779 | | | | 99.6 | | |
Cash & Other Assets
Less Liabilities | | | 255,195 | | | | 0.4 | | |
| Net Assets | | $ | 69,087,974 | | | | 100.0 | | |
See accompanying notes to financial statements.
10
Wanger International Select 2007 Semiannual Report
Statement of Assets and Liabilities
June 30, 2007 (Unaudited)
| Assets: | | | | | |
| Investments, at cost | | $ | 50,741,444 | | |
| Investments, at value | | $ | 68,832,779 | | |
| Cash | | | 649 | | |
| Foreign currency (cost of $58,285) | | | 58,293 | | |
| Receivable for: | |
| Investments sold | | | 552,288 | | |
| Fund shares sold | | | 22,121 | | |
| Interest | | | 704 | | |
| Dividends | | | 34,268 | | |
| Foreign tax reclaims | | | 21,255 | | |
| Other Assets | | | 6 | | |
| Total Assets | | | 69,522,363 | | |
| Liabilities: | |
| Payable for: | |
| Fund shares repurchased | | | 347,226 | | |
| Investment advisory fee | | | 55,675 | | |
| Transfer agent fee | | | 11 | | |
| Trustees' fees | | | 115 | | |
| Audit fee | | | 11,802 | | |
| Custody fee | | | 3,784 | | |
| Reports to shareholders | | | 13,143 | | |
| Deferred Trustees' fees | | | 1,434 | | |
| Other Liabilities | | | 1,199 | | |
| Total Liabilities | | | 434,389 | | |
| Net Assets | | $ | 69,087,974 | | |
| Composition of Net Assets: | |
| Paid-in capital | | $ | 42,460,565 | | |
| Overdistributed net investment income | | | (186,369 | ) | |
| Accumulated net realized gain | | | 8,722,231 | | |
| Net unrealized appreciation on: | |
| Investments | | | 18,091,335 | | |
| Foreign currency translations | | | 212 | | |
| Net Assets | | $ | 69,087,974 | | |
| Fund Shares outstanding | | | 2,672,212 | | |
| Net asset value per share | | $ | 25.85 | | |
Statement of Operations
For the Six Months Ended June 30, 2007 (Unaudited)
| Investment Income: | | | | | |
| Dividends (net of foreign taxes withheld of $42,727) | | $ | 586,985 | | |
| Interest | | | 45,779 | | |
| Total Investment Income | | | 632,764 | | |
| Expenses: | |
| Investment advisory fee | | | 323,671 | | |
| Transfer agent fee | | | 73 | | |
| Trustees' fees | | | 1,846 | | |
| Custody fee | | | 19,423 | | |
| Chief compliance officer expenses (See Note 4) | | | 4,509 | | |
| Other expenses (See Note 5) | | | 34,880 | | |
| Total Expenses | | | 384,402 | | |
| Custody earnings credit | | | (10 | ) | |
| Net Expenses | | | 384,392 | | |
| Net Investment Income | | | 248,372 | | |
Net Realized and Unrealized Gain (Loss) on
Investments and Foreign Currency: | |
| Net realized gain (loss) on: | |
| Investments | | | 8,773,662 | | |
| Foreign currency transactions | | | (7,203 | ) | |
| Net realized gain | | | 8,766,459 | | |
| Net change in unrealized depreciation on: | |
| Investments | | | (1,420,295 | ) | |
| Foreign currency translations | | | (1,096 | ) | |
| Net change in unrealized depreciation | | | (1,421,391 | ) | |
| Net Gain | | | 7,345,068 | | |
| Net Increase in Net Assets from Operations | | $ | 7,593,440 | | |
See accompanying notes to financial statements.
11
Wanger International Select 2007 Semiannual Report
Statement of Changes in Net Assets
| Increase (Decrease) in Net Assets: | | (Unaudited)
Six Months
Ended
June 30,
2007 | | Year Ended
December 31,
2006 | |
| Operations: | |
| Net investment income | | $ | 248,372 | | | $ | 259,835 | | |
| Net realized gain on investments and foreign currency transactions | | | 8,766,459 | | | | 9,092,683 | | |
Net change in unrealized appreciation (depreciation)
on investments and foreign currency translations | | | (1,421,391 | ) | | | 7,550,578 | | |
| Net Increase in Net Assets from Operations | | | 7,593,440 | | | | 16,903,096 | | |
| Distributions Declared to Shareholders: | |
| From net investment income | | | (491,093 | ) | | | (154,737 | ) | |
| From net realized gains | | | (7,887,030 | ) | | | — | | |
| Total Distributions Declared to Shareholders | | | (8,378,123 | ) | | | (154,737 | ) | |
| Share Transactions: | |
| Subscriptions | | | 6,447,338 | | | | 20,098,821 | | |
| Distributions reinvested | | | 8,378,122 | | | | 154,737 | | |
| Redemptions | | | (7,547,176 | ) | | | (18,433,819 | ) | |
| Net Increase from Share Transactions | | | 7,278,284 | | | | 1,819,739 | | |
| Total Increase in Net Assets | | | 6,493,601 | | | | 18,568,098 | | |
| Net Assets: | |
| Beginning of period | | | 62,594,373 | | | | 44,026,275 | | |
| End of period | | $ | 69,087,974 | | | $ | 62,594,373 | | |
| Undistributed (Overdistributed) net investment income at end of period | | $ | (186,369 | ) | | $ | 56,352 | | |
See accompanying notes to financial statements.
12
Wanger International Select 2007 Semiannual Report
Financial Highlights
| | | (Unaudited)
Six Months
Ended
June 30, | | Year Ended December 31, | |
| Selected data for a share outstanding throughout each period | | 2007 | | 2006 | | 2005 | | 2004 | | 2003 | | 2002 | |
| Net Asset Value, Beginning of Period | | $ | 26.62 | | | $ | 19.63 | | | $ | 17.19 | | | $ | 13.87 | | | $ | 9.86 | | | $ | 11.64 | | |
| Income from Investment Operations: | |
| Net investment income (a) | | | 0.10 | | | | 0.11 | | | | 0.13 | | | | 0.04 | | | | 0.04 | | | | 0.04 | | |
Net realized and unrealized gain (loss) on investments and
foreign currency transactions | | | 2.70 | | | | 6.94 | | | | 2.66 | | | | 3.33 | | | | 4.01 | | | | (1.82 | ) | |
| Total from Investment Operations | | | 2.80 | | | | 7.05 | | | | 2.79 | | | | 3.37 | | | | 4.05 | | | | (1.78 | ) | |
| Less Distributions Declared to Shareholders: | |
| From net investment income | | | (0.21 | ) | | | (0.06 | ) | | | (0.35 | ) | | | (0.05 | ) | | | (0.04 | ) | | | — | | |
| From net realized capital gains | | | (3.36 | ) | | | — | | | | — | | | | — | | | | — | | | | — | | |
| Total Distributions Declared to Shareholders | | | (3.57 | ) | | | (0.06 | ) | | | (0.35 | ) | | | (0.05 | ) | | | (0.04 | ) | | | — | | |
| Net Asset Value, End of Period | | $ | 25.85 | | | $ | 26.62 | | | $ | 19.63 | | | $ | 17.19 | | | $ | 13.87 | | | $ | 9.86 | | |
| Total Return (b) | | | 12.15 | %(c) | | | 36.00 | % | | | 16.43 | %(d) | | | 24.34 | % | | | 41.24 | %(d) | | | (15.29 | )%(d) | |
| Ratios to Average Net Assets: | |
| Net expenses(e) | | | 1.17 | %(f) | | | 1.19 | % | | | 1.32 | % | | | 1.43 | % | | | 1.45 | % | | | 1.45 | % | |
| Net investment income(e) | | | 0.76 | %(f) | | | 0.47 | % | | | 0.76 | % | | | 0.29 | % | | | 0.39 | % | | | 0.35 | % | |
| Waiver | | | — | | | | — | | | | 0.00 | %(g) | | | — | | | | 0.09 | % | | | 0.10 | % | |
| Portfolio turnover rate | | | 37 | %(c) | | | 61 | % | | | 48 | % | | | 71 | % | | | 59 | % | | | 113 | % | |
| Net assets, end of period (000's) | | $ | 69,088 | | | $ | 62,594 | | | $ | 44,026 | | | $ | 35,232 | | | $ | 26,928 | | | $ | 14,083 | | |
(a) Net investment income per share was based upon the average shares outstanding during the period.
(b) Total return at net asset value assuming all distributions reinvested.
(c) Not annualized.
(d) Had the Investment Adviser not waived a portion of expenses, total return would have been reduced.
(e) The benefits derived from custody fees paid indirectly had an impact of less than 0.01%.
(f) Annualized.
(g) Rounds to less than 0.01%.
See accompanying notes to financial statements.
13
Wanger International Select 2007 Semiannual Report
Notes to Financial Statements (Unaudited)
1. Nature of Operations
Wanger International Select (the "Fund") is a series of Wanger Advisors Trust (the "Trust"), an open-end management investment company organized as a Massachusetts business trust. The investment objective of the Fund is to seek long-term growth of capital. The Fund is available only for allocation to certain life insurance company separate accounts established for the purpose of funding qualified and non-qualified variable annuity contracts and variable life insurance policies and may also be offered directly to certain types of pension plans and retirement arrangements.
2. Significant Accounting Policies
Security valuation
Securities of the Fund are valued at market value or, if a market quotation for a security is not readily available or is deemed not to be reliable because of events or circumstances that have occurred between the market quotation and the time as of which the security is to be valued, the security is valued at a fair value determined in accordance with procedures established by the Board of Trustees. A security traded on a securities exchange or in an over-the-counter market in which transaction prices are reported is valued at the last sales price at the time of valuation. A security traded principally on Nasdaq is valued at the NASDAQ official closing price. A security for which there is no reported sale on the valuation date is valued at the latest bid quotation. A short-term debt obligation having a maturity of 60 days or less from the valuation date is valued at amortized cost, which approximates fair value. A security for which a market quotation is not readily available and any other assets are valued in accordance with procedures established by the Board of Trustees. The Trust has retained an independent statistical fair value pricing service to assist in the fair valuation process for securities principally traded in a foreign market in order to adjust for possible changes in value that may occur between the close of the foreign exchange and the time as of which the securities are to be valued. If a security is valued at a "fair value", that value may be different from the last quoted market price for the security.
In September 2006, Statement of Financial Accounting Standards No. 157, Fair Value Measurements ("SFAS 157"), was issued. SFAS 157 is effective for fiscal years beginning after November 15, 2007. SFAS 157 defines fair value, establishes a framework for measuring fair value and expands disclosures about fair value measurements. Management is evaluating the impact the application of SFAS 157 will have on the Fund's financial statement disclosures.
Repurchase agreements
The Fund may engage in repurchase agreement transactions. The Fund, through its custodians, receives delivery of underlying securities collateralizing each repurchase agreement. The Fund's investment advisor determines that the value of the underlying securities is at all times at least equal to the repurchase prices including interest. In the event of default or bankruptcy by the other party to the agreement, realization and/or retention of the collateral may be subject to legal proceedings.
Foreign currency translations
Values of investments denominated in foreign currencies are converted into U.S. dollars using the spot market rate of exchange at the time of valuation. Purchases and sales of investments and dividend and interest income are translated into U.S. dollars using the spot market rate of exchange prevailing on the respective dates of such transactions. The gain or loss resulting from changes in foreign exchange rates is included with net realized and unrealized gain or loss from investments, as appropriate.
Security transactions and investment income
Security transactions are accounted for on the trade date (date the order to buy or sell is executed) and dividend income is recorded on the ex-dividend date, except that certain dividends from foreign securities are recorded as soon as the information is available to the Fund. Interest income is recorded on an accrual basis and includes amortization of discounts and premiums on debt obligations when required for federal income tax purposes. Realized gains and losses from security transactions are recorded on an identified cost basis.
Awards, if any, from class action litigation related to securities owned may be recorded as a reduction of cost of those securities. If the applicable securities are no longer owned, the proceeds are recorded as realized gains.
Use of Estimates
The preparation of financial statements in conformity with accounting principles generally accepted in the United States of America ("GAAP") requires management to make estimates and assumptions that affect the amounts reported in the financial statements and accompanying notes. Actual results may differ from those estimated.
Fund share valuation
Fund shares are sold and redeemed on a continuing basis at net asset value. Net asset value per share is determined daily as of the close of trading on the New York Stock Exchange ("the Exchange") on each day the Exchange is open for trading by dividing the total value of the Fund's investments and other assets, less liabilities, by the number of Fund shares outstanding.
Custody fees/Credits
Custody fees are reduced based on the Fund's cash balances maintained with the custodian. The Fund could have invested a portion of the assets utilized in connection with the expense offset arrangement in an income-producing asset if it had not entered into such an agreement. The amount is disclosed as a reduction of total expenses in the Statement of Operations.
Federal income taxes
The Fund has complied with the provisions of the Internal Revenue Code available to regulated investment companies and, in the manner provided therein, distributes all its taxable income, as well as any net realized gain on sales of investments and foreign currency transactions reportable for federal income tax purposes. Accordingly, the Fund paid no federal income taxes and no federal income tax provision was required.
Foreign Capital Gains Taxes
Realized gains in certain countries may be subject to foreign taxes at the fund level, at rates ranging from 10%-15%. The Fund accrues for such foreign taxes on net realized and unrealized gains at the appropriate rate for each jurisdiction.
Distributions to shareholders
Distributions to shareholders are recorded on the ex-date.
Indemnification
In the normal course of business, the Fund enters into contracts that contain a variety of representations and warranties which provide general indemnities. The Fund's maximum exposure under these arrangements is unknown, as this would involve future claims against the Fund. Also, under the Trust's organizational documents, the Trustees and Officers of the Trust are indemnified against certain liabilities that may arise out of their duties to the Trust. However, based on experience, the Fund expects the risk of loss due to these warranties and indemnities to be minimal.
14
Wanger International Select 2007 Semiannual Report
Notes to Financial Statements, continued (Unaudited)
3. Federal Tax Information
The tax character of distributions paid during the year ended December 31, 2006 was as follows:
Distributions paid from:
| Ordinary Income * | | $ | 154,737 | | |
* For tax purposes short-term capital gains distributions, if any, are considered ordinary income distributions.
Expired capital loss carryforwards, if any, are recorded as reduction of paid-in capital. Capital loss carryforwards of $993,509 were utilized during the year ended December 31, 2006 for the Fund.
The Fund adopted Financial Accounting Standards Board ("FASB") Interpretation No. 48, Accounting for Uncertainty in Income Taxes–an Interpretation of FASB Statement No. 109 ("FIN 48") effective June 29, 2007. FIN 48 requires management to determine whether a tax position of a Fund is more likely than not to be sustained upon examination by the applicable taxing authority, including resolution of any related appeals or litigation processes, based in the technical merits of the position. The tax benefit to be recognized is measured as the largest amount of benefit that is greater than fifty percent likely of being realized upon ultimate settlement. FIN 48 must be applied to all existing tax positions upon initial adoption and the cumulative effect, if any, is to be reported as an adjustment to net assets. Management has evaluated the known implications of FIN 48 on its computation of net assets for the Fund. As a result of this evaluation, management believes that FIN 48 will not have any effect on the Fund's financial statements. However, management's conclusions regarding FIN 48 may be subject to review and adjustment at a latter date based on factors including, but not limited to, further implementation guidance expected from the FASB, new tax laws, regulations, and administrative interpretations (including relevant court decisions).
4. Transactions With Affiliates
Columbia Wanger Asset Management, L.P. ("Columbia WAM"), a wholly owned subsidiary of Columbia Management, Inc., which in turn is an indirect wholly owned subsidiary of Bank of America Corporation ("BOA"), furnishes continuing investment supervision to the Fund and is responsible for the overall management of the Fund's business affairs.
Effective August 1, 2007, under the Fund's investment advisory agreement, fees are accrued daily based on the Fund's average daily net assets and paid monthly to Columbia WAM at the annual rates shown in the table below:
| Average Daily Net Assets | | Annual Fee Rate | |
| Up to $500 million | | | 0.940 | % | |
| $500 million and over | | | 0.890 | % | |
For the period covered by this report as provided under the Fund's investment advisory agreement, fees were accrued daily based on the Fund's average daily net assets and paid monthly to Columbia WAM as the annual rate of 0.99%.
Through April 30, 2008, Columbia WAM will reimburse the Fund to the extent that ordinary operating expenses (computed based on net custodian fees) exceed an annual percentage of 1.45% of average daily net assets. There was no reimbursement for the six months ended June 30, 2007.
Columbia WAM provides administrative services and receives an administration fee from the Fund. For the period covered by this report, administrative services were covered under the Fund's investment advisory agreement in place between the Fund and Columbia WAM. Effective August 1, 2007, under the Fund's new administration agreement, which provides the same types of administrative services that were provided under the investment advisory agreement, fees are accrued daily and paid monthly to Columbia WAM at the annual rate of 0.05%. Accordingly, the investment advisory fees were decreased by 0.05% across all asset levels effective August 1, 2007 as well.
Certain officers and trustees of the Trust are also officers of Columbia WAM. The Trust makes no direct payments to its officers and trustees who are affiliated with Columbia WAM. For the six months ended June 30, 2007, the Fund paid $1,846 to trustees not affiliated with Columbia WAM. The Board of Trustees appointed a Chief Compliance Officer to the Fund in accordance with federal securities regulations. The Fund will pay its pro-rata share of the expenses associated with the Office of the Chief Compliance Officer. These expenses are disclosed separately as "Chief compliance officer expenses" in the Statement of Operations.
Columbia Management Distributors, Inc. (the "Distributor"), a wholly owned subsidiary of BOA, serves as the principal underwriter of the Trust and receives no compensation for its services.
Columbia Management Services, Inc. (the "Transfer Agent"), a wholly owned subsidiary of BOA, provides shareholder services to the Fund and has contracted with Boston Financial Data Services ("BFDS") to serve as subtransfer agent. For such services, the Transfer Agent receives a fee, paid monthly, at the annual rate of $21.00 per open account. The Transfer Agent also receives reimbursement for certain out-of-pocket expenses.
During the six months ended June 30, 2007, the Fund had no purchases or sales transactions with Funds that have a common investment adviser.
5. Borrowing Arrangements
The Trust participates in a $150,000,000 credit facility, which was entered into to facilitate portfolio liquidity. Interest is charged to each participating fund based on its borrowings at rate per annual equal to the Federal Funds rate plus 0.50%. In addition, a commitment fee of 0.08% per annum is accrued and apportioned among the participating funds based on their pro-rata portion of the unutilized line of credit. The commitment fee is included in "Other expenses" in the Statement of Operations. No amounts were borrowed by the Fund under this facility during the six months ended June 30, 2007.
6. Fund Share Transactions
Proceeds and payments on Fund shares as shown in the Statements of Changes in Net Assets are in respect of the following numbers of shares:
| | | Six months ended
June 30, 2007 | | Year ended
December 31, 2006 | |
| Shares sold | | | 251,294 | | | | 919,957 | | |
Shares issued in reinvestment
of dividend distributions | | | 363,319 | | | | 7,482 | | |
| Less shares redeemed | | | (294,130 | ) | | | (818,880 | ) | |
| Net increase in shares outstanding | | | 320,483 | | | | 108,559 | | |
7. Investment Transactions
The aggregate cost of purchases and proceeds from sales other than short-term obligations for the six months ended June 30, 2007 were $23,657,683 and $25,676,825, respectively.
15
Wanger International Select 2007 Semiannual Report
Notes to Financial Statements, continued (Unaudited)
8. Legal Proceedings
Columbia WAM, Columbia Acorn Trust, another mutual fund family advised by Columbia WAM, and the trustees of Colombia Acorn Trust (collectively, the "Columbia defendants") are named as defendants in class and derivative complaints which have been consolidated in a Multi-District Action in the federal district court for the District of Maryland (the "MDL Action"). These lawsuits contend that defendants permitted certain investors to market time their trades in certain Columbia Acorn Funds. The MDL Action is ongoing. However, all claims against Columbia Acorn Trust and the independent trustees of Columbia Acorn Trust have been dismissed.
The Columbia Acorn Trust and Columbia WAM are also defendants in a class action lawsuit that alleges, in summary, that the Columbia Acorn Trust and Columbia WAM exposed shareholders of Columbia Acorn International Fund to trading by market timers by allegedly (a) failing to properly evaluate daily whether a significant event affecting the value of that Fund's securities had occurred after foreign markets had closed but before the calculation of the funds' net asset value (NAV"); (b) failing to implement the fund's portfolio valuation and share pricing policies and procedures; and (c) failing to know and implement applicable rules and regulations concerning the calculation of NAV (the "Fair Valuation Lawsuit"). The Seventh Circuit ruled that the plaintiffs' state law claims were preempted under federal law resulting in the dismissal of plaintiffs' complaint. Plaintiffs appealed the Seventh Circuit's ruling to the United States Su preme Court. The Supreme Court reversed the Seventh Circuit's ruling on jurisdictional grounds, and the case ultimately was remanded to the state court.
On March 21, 2005, a class action complaint was filed against the Columbia Acorn Trust and Columbia WAM seeking to rescind the Contingent Deferred Sales Charges assessed upon redemption of Class B shares of Columbia Acorn Funds due to the alleged market timing of the Columbia Acorn Funds. In addition to the rescission of sales charges, plaintiffs seek recovery of actual damages, attorneys' fees and costs. The case has been transferred to the Multi-District Action in the federal district court of Maryland.
On April 4, 2006, the plaintiffs and the Columbia defendants named in the MDL Action executed an agreement in principle intended to fully resolve all of the lawsuits consolidated in the MDL Action as well as the Fair Valuation Lawsuit. The court entered a stay after the parties executed a settlement agreement. The settlement has not yet been finalized or approved by the court.
Columbia WAM, the Columbia Acorn Funds and the trustees of Columbia Acorn Trust are also defendants in a consolidated lawsuit filed in the federal district court of Massachusetts alleging that Columbia WAM used fund assets to make undisclosed payments to brokers as an incentive for the brokers to market the Columbia Acorn Funds over the other mutual funds to investors. The complaint alleges Columbia WAM and the Trustees of the Trust breached certain common laws duties and federal laws.
On November 30, 2005, the court dismissed all of the claims alleged against all of the parties in the consolidated complaint. The parties subsequently executed a formal settlement agreement resolving all claims in the litigation and the plaintiffs dismissed their appeal. The settlement requires court approval, which has not yet been obtained.
On or about January 11, 2005, a putative class action lawsuit was filed in federal district court in Massachusetts against the Columbia Acorn Trust and the trustees of Columbia Acorn Trust, along with the Columbia Advisers, the sub-administrator of the Wanger Advisors Funds and the Columbia Acorn Funds. The plaintiffs allege that the defendants failed to submit Proof of Claims in connection with settlements of securities class action lawsuits filed against companies in which the Columbia Acorn Funds held positions. The complaints seeks compensatory and punitive damages, and the disgorgement of all fees paid to the Columbia Advisers.
Plaintiffs have voluntarily dismissed the Columbia Acorn Trust and its independent trustees.
The Columbia Acorn Trust and Columbia WAM intend to defend these suits vigorously.
As a result of these matters or any adverse publicity or other developments resulting from them, there may be increased redemptions or reduced sales of Fund shares, which could increase transaction costs or operating expenses, or have other adverse consequences for the Funds.
However, based on currently available information, the Columbia Acorn Trust believes that the likelihood that these lawsuits will have a material adverse impact on any fund is remote, and Columbia WAM believes that the lawsuits are not likely to materially affect its ability to provide investment management services to the Funds.
16
Wanger International Select 2007 Semiannual Report
[Excerpt from:]
Wanger Advisors Trust
Management Fee Evaluation of the Senior Officer
Prepared Pursuant to the New York Attorney General's
Assurance of Discontinuance
June 2007
17
Wanger International Select 2007 Semiannual Report
Introduction
The New York Attorney General's Assurance of Discontinuance ("Order") entered into by Columbia Management Advisors, Inc. ("CMAI") and Columbia Management Distributors, Inc., ("CMDI" and collectively with "CMAI," "CMG") in February 2005, allows CMAI to manage or advise a mutual fund only if the trustees of the fund appoint a "Senior Officer" to perform specified duties and responsibilities. One of these responsibilities includes "managing the process by which proposed management fees (including but not limited to, advisory fees) to be charged the [Funds] are negotiated so that they are negotiated in a manner which is at arms' length and reasonable and consistent with this Assurance of Discontinuance."
This is the first year that the Columbia Acorn Trust and Wanger Advisors Trust (collectively, the "Trusts") and each series thereof (the "Acorn Funds," "WAT Funds" or collectively, the "Funds") have been overseen by the same Board of Trustees ("Board"). The Order provides that this Board must determine the reasonableness of proposed "management fees" by using either an annual competitive bidding process supervised by the Senior Officer or Independent Fee Consultant, or by obtaining "an annual independent written evaluation prepared by or under the direction of the Senior Officer or the Independent Fee Consultant."
"Management fees" are only part of the costs and expenses paid by mutual fund shareholders. The expenses can vary depending upon the class of shares held but usually include: (1) investment management or advisory fees to compensate analysts and portfolio managers for stock research and portfolio management, as well as the cost of operating a trading desk; (2) administrative expenses incurred to prepare registration statements and tax returns, calculate the Funds' net asset values, maintain effective compliance procedures and perform recordkeeping services; (3) transfer agency costs for establishing accounts, accepting and disbursing funds, as well as overseeing trading in Fund shares; (4) custodial expenses incurred to hold the securities purchased by the Funds; and (5) distribution expenses, including commissions paid to brokers that sell the Fund shares to investors.
Columbia Wanger Asset Management, L.P. ("CWAM"), the adviser to the Funds, has proposed that with respect to the Acorn Funds, the Columbia Acorn Trust continue the existing separate agreements governing the first two categories listed above: an advisory agreement governing portfolio management, and an administration agreement governing certain administration and clerical services. Together the fees paid under these two agreements are referred to as "management fees." CWAM proposes that the WAT Funds continue the existing single agreement governing both investment advisory and administrative services. A single management fee would cover both services. Other fund expenses are governed by separate agreements, in particular agreements with two CWAM affiliates: CMDI, the broker-dealer that underwrites and distributes the Funds' shares, and Columbia Management Services, Inc. ("CMSI"), the Funds' transfer agent. In conformity with the terms of the Order, this evaluation, therefore, addresses only the advisory and administrative contracts, and does not extend to the other agreements.
According to the Order, the Senior Officer's evaluation must consider at least the following:
(1) Management fees (including components thereof) charged to institutional and other clients of CWAM for like services;
(2) Management fees (including any components thereof) charged by other mutual fund companies for like services;
(3) Costs to CWAM and its affiliates of supplying services pursuant to the management fee agreements, excluding any intra-corporate profit;
(4) Profit margins of CWAM and its affiliates from supplying such services;
(5) Possible economies of scale as the Funds grow larger; and
(6) The nature and quality of CWAM's services, including the performance of each Fund.
In 2004, the Boards of the two Trusts, then separate groups, each appointed me Senior Officer under the Order. They also determined not to pursue a competitive bidding process and instead, charged me with the responsibility of evaluating the Funds' proposed advisory and administrative fee contracts with CWAM in conformity with the requirements of the Order. This Report is an annual evaluation required under the Order. In discharging their responsibilities, the independent Trustees have also consulted independent, outside counsel.
2006 Evaluation
This is the third annual evaluation prepared in connection with the Order. This evaluation follows the same structure as the earlier studies. Some areas are given more emphasis here, while others are given less. Still, the fundamental information gathered for this evaluation is largely the same as past years.
Process and Independence
The objectives of the Order are to insure the independent evaluation of the advisory fees paid by the Funds as well as to insure that all relevant factors are considered. In my view, this contract renewal process has been conducted at arms-length and with independence in gathering, considering and evaluating all relevant data. At the outset of the process, the Trustees sought and obtained from CWAM and CMG a comprehensive compilation of data regarding Fund performance and expenses, adviser profitability, and other information. The Board evaluated this information thoroughly and also explored CWAM's potential capacity restraints. Performance and expense data was obtained from both Morningstar and Lipper, the leading consultants in this area. The rankings prepared by Morningstar and Lipper were independent and not influenced by the adviser. CWAM itself identified what it considers competing funds, and the Trustees considered that data as well.
In the course of its work, the Contract Committee gave careful consideration to the conclusions and recommendations contained in last year's evaluation. The Contract Committee gave particular emphasis to the issue of whether economies of scale were appropriately reflected in the Funds' fee schedules. Last year, the
18
Wanger International Select 2007 Semiannual Report
Board sought and CWAM agreed to additional breakpoints for two Funds, Acorn USA and Acorn Select. These breakpoints are above current asset levels, but clearly operate to share economies of scale with Fund shareholders. This year, at the Board's request, CWAM has proposed additional breakpoints for the WAT Funds, and Acorn International Select. This proposal is under consideration by the Board.
My evaluation of the advisory contract was shaped, as it was last year, by my experience as Chief Compliance Officer of the Trusts ("CCO"). As CCO, I report solely to the Board and have no reporting obligation to or employment relationship with CMG or its affiliates, except for administrative purposes. I have commented on compliance matters in evaluating the quality of service provided by CWAM.
This Report, its supporting materials and the data contained in other materials submitted to the Contract Committee of the Board, in my view, provide a thorough factual basis upon which the Board, in consultation with independent counsel as it deems appropriate, may conduct management fee negotiations that are in the best interests of the Funds' shareholders.
The Fee Reductions Mandated under the Order
Under the terms of the Order, CMG agreed to secure certain management fee reductions for the mutual funds advised by its affiliate investment advisers. In some instances, breakpoints were also established. Although neither CWAM nor the Trusts was a party to the Order, CWAM offered and the Board accepted certain advisory fee reductions during 2005. By the terms of the Order, these fees may not be increased before November 30, 2009. I have used these advisory fee levels — as modified last year to add certain breakpoints for Acorn USA and Acorn Select — in this evaluation because they are the fees in the current agreements that CWAM proposes should be continued. Hence, these fee levels are the starting point of an evaluation.
Conclusions
My review of the data and other material above leads to the following conclusions with respect to the factors identified in the Order.
1. Performance. The domestic Funds generally have achieved outstanding performance. The Acorn Fund, Acorn USA, Acorn Select, Wanger Select and Wanger US Smaller Companies all rank very favorably against their peers over the past five years. Although Acorn USA and Wanger US Smaller Companies had a difficult year in 2006, these returns are not characteristic of these funds, both of which have shown improved performance during the first quarter of 2007. The international Funds have relatively weaker long term records than the domestic funds, but recently have improved significantly and their one year rankings are excellent. Overall then, performance of the Funds is excellent.
2. Management Fees relative to Peers. The management fee rankings for several of the Acorn Funds are generally more favorable to shareholders than those of their peer group funds. Management fees do, however, vary by Fund. Acorn Fund is the least expensive and the Acorn USA the most expensive. Acorn Fund is very competitive, while Acorn USA and Acorn Select were ranked by both Lipper and Morningstar at or below the median, and therefore impose higher fees than do the majority of their competitors. The WAT Funds also lag their competitors and impose higher fees than their peers.
3. Administrative Fees. The Acorn Funds' administrative fee, which is uniform across all Funds, is at a level comparable to or less expensive than the fees imposed by their peers, provides for appropriate services to Funds, and affords breakpoints that lower the fee as assets increase. The WAT Funds pay a single fee for advisory and administrative services and hence do not benefit from administrative fee breakpoints, nor is it possible to assess their administrative costs relative to competitors.
4. Management Fees relative to Institutional and Other Mutual Fund Accounts. CWAM's focus is on its mutual funds. It does not actively seek to manage separate or institutional accounts. The few institutional accounts it does manage vary in rate structures. Some pay advisory fees commensurate with or higher than the Acorn and WAT Funds. In a few instances, however, institutional accounts pay lower advisory fees than do the Acorn Funds. One particular institutional account is significant in size and has been under CWAM's management for over 25 years.
5. Costs to CWAM and its Affiliates. CWAM's direct costs do not appear excessive. Overhead and indirect costs allocated to CWAM by its parent organizations, however, are significant and increasing. CWAM's affiliates report operating losses and therefore do not appear to profit from CWAM's advisory agreement with the Funds.
6. Profit Margins. CWAM's firm-wide, pre-marketing expense profit margins are at the top of the industry, though these comparisons are hampered by limited industry data. High profit margins are not unexpected for firms that manage large, successful funds and have provided outstanding investment performance for investors.
7. Economies of Scale. Economies of scale do exist at CWAM and will expand as the assets of the Funds get larger. They are, however, only partially reflected in the management fee schedule for the Acorn Funds and not reflected at all in two of the four WAT Funds. Breakpoints above current asset levels have, however, been added to the more expensive funds, Acorn Select and Acorn USA. Nonetheless, if Fund assets continue to grow, under the Funds' current fee schedules, all Fund shareholders might not benefit in a manner generally commensurate with CWAM's increased profits. Management has proposed additional breakpoints for some of the Funds that, if implement, would result in greater sharing of economies of scale.
19
Wanger International Select 2007 Semiannual Report
8. Nature and Quality of Services. This category includes a variety of considerations that are difficult to quantify, yet can have a significant bearing on the performance of the Acorn Funds. Several areas merit comment.
a. Capacity. The Funds have continued to grow, posing ever greater challenges in deploying assets effectively. While trends here merit continued monitoring, CWAM appears to be managing assets effectively.
b. Compliance. CWAM has a reasonably designed compliance program that protects shareholders.
c. Administrative Services. The Funds benefit from a variety of administrative services that are performed by CWAM and CMAI.
9. Process. In my opinion, the process of negotiating an advisory contract for the Funds has been conducted thoroughly and at arms' length. Further, the Trustees have sufficient information to evaluate management's proposal, and negotiate contract terms that are in the best interests of fund shareholders.
Recommendations
I believe the Trustees should:
1. Continue to consider additional ways to restructure the advisory fee beyond the current breakpoint schedule to reflect more fully economies of scale.
2. Consider unbundling of the advisory and administrative fees paid by the WAT Funds.
3. Review the disparity in management fee levels between the Acorn International Fund and its related annuity-based fund, WAT International Small Cap Fund.
4. Continue to monitor CWAM's capacity limitations to insure that the Funds' expanding assets do not impair investment performance.
Robert P. Scales
Senior Vice President,
Chief Legal Officer
and General Counsel
June 18, 2007
20
Wanger International Select 2007 Semiannual Report
This page intentionally left blank.
21
Wanger International Select 2007 Semiannual Report
This page intentionally left blank.
22
Wanger International Select 2007 Semiannual Report

Wanger Advisors Trust
Trustees
Robert E. Nason
Chairman
Allan B. Muchin
Vice Chairman
Laura M. Born
Maureen M. Culhane
Margaret Eisen
Jerome Kahn, Jr.
Steven N. Kaplan
David C. Kleinman
Charles P. McQuaid
James A. Star
Ralph Wanger
Patricia H. Werhane
John A. Wing
Officers
Charles P. McQuaid
President
Ben Andrews
Vice President
Michael G. Clarke
Assistant Treasurer
Jeffrey R. Coleman
Assistant Treasurer
J. Kevin Connaughton
Assistant Treasurer
P. Zachary Egan
Vice President
Peter T. Fariel
Assistant Secretary
John M. Kunka
Assistant Treasurer
Joseph C. LaPalm
Vice President
Bruce H. Lauer
Vice President, Treasurer and Secretary
Louis J. Mendes III
Vice President
Robert A. Mohn
Vice President
Christopher J. Olson
Vice President
Linda K. Roth-Wiszowaty
Assistant Secretary
Robert P. Scales
Senior Vice President, Chief Compliance Officer and General Counsel
Transfer Agent,
Dividend Disbursing Agent
Columbia Management Services, Inc.
P.O. Box 8081
Boston, Massachusetts
02266-8081
Distributor
Columbia Management Distributors, Inc.
One Financial Center
Boston, Massachusetts
02111-2621
Investment Adviser
Columbia Wanger Asset Management, L.P.
227 West Monroe Street, Suite 3000
Chicago, Illinois 60606
1-888-4-WANGER
(1-888-492-6437)
Legal Counsel
Bell, Boyd & Lloyd LLP
Chicago, Illinois
This report, including the schedules of investments and financial statements, is submitted for the general information of the shareholders of the Wanger Advisors Trust.
A description of the Fund's proxy voting policies and procedures and a copy of the Fund's voting record for the most recent 12-month period ended June 30 are available (i) on Columbia Management's website at www.columbiafunds.com; (ii) on the Securities and Exchange Commission's website at www.sec.gov, and (iii) without charge, upon request, by calling 888-492-6437.
The Fund files a complete schedule of portfolio holdings with the SEC for the first and third quarters of each fiscal year on Form N-Q. The Fund's Form N-Q is available on the SEC's website at www.sec.gov and may be reviewed and copied at the SEC's Public Reference Room in Washington, D.C. Information on the operation of the Pubic Reference Room may be obtained by calling 800-SEC-0330.
23
Wanger Advisors Trust
SHC-44/133013-0607 08/07 07/42771
Wanger International Small Cap
2007 Semiannual Report


Wanger International Small Cap
2007 Semiannual Report
| | | Table of Contents | |
| | 1 | | | Understanding Your Expenses | |
|
| | 2 | | | Doomsayers vs. Doomslayers | |
|
| | 5 | | | Performance Review | |
|
| | 7 | | | Statement of Investments | |
|
| | 15 | | | Statement of Assets and Liabilities | |
|
| | 15 | | | Statement of Operations | |
|
| | 16 | | | Statement of Changes in Net Assets | |
|
| | 17 | | | Financial Highlights | |
|
| | 18 | | | Notes to Financial Statements | |
|
| | 21 | | | Management Fee Evaluation of the Senior Officer | |
|
Columbia Wanger Asset Management, L.P. ("Columbia WAM") is one of the leading global small- and mid-cap equity managers in the United States with more than 37 years of small- and mid-cap investment experience. As of June 30, 2007, Columbia WAM manages more than $38.2 billion in assets and is the investment adviser to Wanger U.S. Smaller Companies, Wanger International Small Cap, Wanger Select, Wanger International Select and the Columbia Acorn Family of Funds. Columbia Management Group, LLC ("Columbia Management") is the investment management division of Bank of America Corporation. Columbia Management entities furnish investment management services and products for institutional and individual investors. Columbia Funds are distributed by Columbia Management Distributors, Inc., member of FINRA, SIPC, part of Columbia Management and an affiliate of Bank of America Corporation. Columbia WAM is an SEC-registered investment adviser and indirect, wholly owned subsidiary of Bank of America Corporation.
Please consider the investment objectives, risks, charges and expenses for the Fund carefully before investing. Contact 1-888-4-WANGER for a prospectus, which contains this and other important information about the Fund. You should read it carefully before you invest.
The views expressed in "Doomsayers vs. Doomslayers" and in the Performance Review reflect the current views of the respective parties. These views are not guarantees of future performance and involve certain risks, uncertainties and assumptions that are difficult to predict so actual outcomes and results may differ significantly from the views expressed. These views are subject to change at any time based upon economic, market or other conditions and the respective parties disclaim any responsibility to update such views. These views may not be relied on as investment advice and, because investment decisions for a Columbia Fund are based on numerous factors, may not be relied on as an indication of trading intent on behalf of any particular Columbia Fund. References to specific company securities should not be construed as a recommendation or investment advice.
Wanger International Small Cap 2007 Semiannual Report
Understanding Your Expenses
As a Fund shareholder, you incur two types of costs. There are transaction costs, which generally include sales charges on purchases and may include redemption or exchange fees. There are also ongoing costs, which generally include investment advisory and other Fund expenses. The information on this page is intended to help you understand your ongoing costs of investing in the Fund and to compare these costs with the ongoing costs of investing in other mutual funds.
Analyzing your Fund's expenses
To illustrate these ongoing costs, we have provided an example and calculated the expenses paid by investors in the Fund during the reporting period. The information in the following table is based on an initial, hypothetical investment of $1,000.00, which is invested at the beginning of the reporting period and held for the entire period. Expense information is calculated two ways and each method provides you with different information. The amount listed in the "actual" column is calculated using actual operating expenses and total return for the Fund. The amount listed in the "hypothetical" column assumes that the return each year is 5% before expenses and then applies the Fund's actual expense ratio for the period to the hypothetical return. You should not use the hypothetical account values and expenses to estimate either your actual account balance at the end of the period or the expenses you paid during the reporting perio d. See the "Compare with other funds" information for details on using the hypothetical data.
Estimating your actual expenses
To estimate the expenses that you actually paid over the period, first you will need your account balance at the end of the period.
1. Divide your ending account balance by $1,000.00. For example, if an account balance was $8,600.00 at the end of the period, the result would be 8.6.
2. In the section of the table below titled "Expenses paid during the period," you will find a dollar amount in the column labeled "Actual." Multiply this amount by the result from step 1. Your answer is an estimate of the expenses you paid on your account during the period.
January 1, 2007 – June 30, 2007
| | | Account value at the
beginning of the period ($) | | Account value at the
end of the period ($) | | Expenses paid during
period ($) | | Fund's annualized
expense ratio (%)* | |
| | | Actual | | Hypothetical | | Actual | | Hypothetical | | Actual | | Hypothetical | | Actual | |
| Wanger International Small Cap | | | 1,000.00 | | | | 1,000.00 | | | | 1,143.61 | | | | 1,019.89 | | | | 5.26 | | | | 4.96 | | | | 0.99 | | |
*For the six months ended June 30, 2007.
Expenses paid during the period are equal to the Fund's annualized expense ratio, multiplied by the average account value over the period, then multiplied by the number of days in the Fund's most recent fiscal half-year and divided by 365.
It is important to note that the expense amounts shown in the table are meant to highlight only ongoing costs of investing in the Fund. As a shareholder of the Fund, you do not incur any transaction costs, such as sales charges, redemption or exchange fees. Expenses paid during the period do not include any insurance charges imposed by your insurance company's separate account. The hypothetical example provided is useful in comparing ongoing costs only and will not help you determine the relative total costs of owning different funds whose shareholders may incur transaction costs.
Compare with other funds
Since all mutual funds are required to include the same hypothetical calculations about expenses in shareholder reports, you can use this information to compare the ongoing cost of investing in the Fund with other funds. To do so, compare the 5% hypothetical example with the 5% hypothetical examples of other funds. As you compare hypothetical examples of other funds, it is important to note that hypothetical examples are meant to highlight the ongoing cost of investing in a fund and do not reflect any transaction costs, such as sales charges, redemption fees or exchange fees that may be incurred by shareholders of other funds. Expenses paid during the period do not include any insurance charges imposed by your insurance company's separate accounts.
1
Wanger International Small Cap 2007 Semiannual Report

Doomsayers vs. Doomslayers
Bad news seems to attract more attention than good news. Tabloid newspapers and the evening news thrive on sensational stories. "If it bleeds, it leads!" the media says, so disasters and doomsayers make headlines while good news is ignored.
Global warming is the current source of much concern and, therefore, much media and political focus. However, declarations of impending disaster for the planet and its inhabitants aren't new.
Doomsayers – Creating Concerns
In 1798, Thomas Malthus wrote An Essay on the Principal of Population.1 He noted that unchecked populations grow geometrically. For illustration, he modeled a population doubling every 25 years. In contrast, he postulated food supplies growing arithmetically. In 1998 therefore, the calculated population would be 256-times its 1798 level while food production would be nine times as large as in 1798. The poor would be "reduced to severe distress" and the actual population increase would revolve around the relatively slow increase in food production.
Moving forward 170 years, Paul Ehrlich's 1968 book, The Population Bomb,2 predicted imminent disaster and became the best-selling environmental tract of all time. He wrote, "The battle to feed all of humanity is over. In the 1970s and 1980s hundreds of millions of people will starve to death in spite of any crash programs embarked upon now." He stated that the world's population roughly doubled every thousand years from about 8000 BC to 1650, then doubled again in 200 years and again in 80 years, and appeared to be doubling over 35 years at the time of the book's publication.
Ehrlich's book also addressed pollution. "In Los Angeles and similar cities the human population has exceeded the carrying capacity of the environment—at least with respect to the ability of the atmosphere to remove waste." He stated, "It seems unlikely that much improvement can be expected...in air pollution until a major shift in the economy takes place." He recommended a shift away from gasoline-powered cars. To his credit, Ehrlich did mention that successful pollution control was possible.
Limits to Growth3 was first published in 1972, and became another best-selling doomsday book. It added resource depletion as a concern in addition to population growth and pollution. Using sophisticated computer models introduced by MIT professor Jay Forrester, the authors predicted long-term disaster: "If present growth trends...continue unchanged, the limits to growth on this planet will be reached sometime within the next one hundred years." (It's better to make a prediction that can be proven right but not wrong within your lifetime.) "The most probable result will be a rather sudden and uncontrollable decline in both population and industrial capacity." The authors recognized the need for more study, but "end(ed) on a note of urgency."
Adding another worry, the April 28, 1975 issue of Newsweek included an article titled, "The Cooling World."4 It quoted studies showing a temperature drop from 1945 to 1968 and then a sudden large increase in snow cover in the northern hemisphere. The article stated, "There are ominous signs that the earth's weather patterns have begun to change dramatically, and that these changes may portend a drastic decline in food production—with serious political implications for just about every nation on Earth."
The Newsweek story went on to report, "Meteorologists disagree about the cause and extent of the trend...but are almost unanimous in the view that the trend will reduce agricultural productivity for the rest of the century." The underlying prediction: "Resulting famines could be catastrophic."
In 2004, three of the original four Limits to Growth authors published Limits to Growth, The 30-Year Update.5 The authors offered a somewhat more positive tone but predicted that growth would not continue much past the year 2010.
The authors stated that the world population increase had slowed to a 1.2% growth rate, or a 60 year doubling period. That represents 75 million persons per year, or the equivalent of adding the population of "six Calcuttas." They did concede that air and water pollution has dropped in many developed countries, and agreed that the ozone hole over Antarctica will disappear by mid-century.
The authors also admitted that more hydrocarbon deposits were proven than used in the previous 30 years, and despite increased demand, the ratios of reserves to production increased. Consequently, while in 1970 world oil reserves were to be depleted by 2002, the update suggested depletion by 2037. Natural gas depletion was deferred from 2009 to 2065. Data on critical industrial metals were also updated. Assuming increases in consumption, depletion of copper and zinc reserves were postponed at least 20 years. The authors also noted that huge potential additional supplies were not yet in reserve statistics.
But the update also reiterated ominous food scarcity themes and said per-capita grain production peaked in the mid-80s. There is a widespread persistence of hunger, as "the number of hungry people has remained constant as the population has grown." The authors continued to believe that improved technology would not offset the effects of exponential growth.
As I mentioned, today's environmental doomsday headline grabber is global
2
Wanger International Small Cap 2007 Semiannual Report
warming. In 2006 an Oscar-winning documentary called, "An Inconvenient Truth" highlighted the potential consequences of higher temperatures, predicting rising ocean levels, animal species extinctions, and food and water shortages. Its creator suggested how people could cut carbon dioxide emissions in order to reduce the problem.
Doomslayers – Presenting the Facts
Are conditions bad and likely to get worse? Julian Simon, a University of Maryland business school professor, became obsessed with data about population growth and prosperity. He found Ehrlich's books and comments to be "a juggernaut of environmentalist hysteria."6 He noted that virtually all data series indicated that the human condition had improved. In 1980, he became the first self-proclaimed doomslayer, and published a fact-filled, footnoted article in Science magazine: "Resources, Population, Environment: An Oversupply of False Bad News."7 Simon went so far as to challenge Ehrlich's theory that overpopulation and depletion would cause prices of raw materials to rise. Ehrlich accepted a 10-year wager with Simon and the battle lines were drawn. Between 1980 and 1990, the world's population saw its largest 10-year increase ever, but materials prices fell. In October 1990, Simon accepted a check from Ehrlich!
Determined to report the facts, Simon went on to publish five books showing data that the doomsayers were wrong. He died in 1998 leaving behind manuscripts that resulted in a sixth book completed in 2000 by Stephen Moore: It's Getting Better all the Time, 100 Greatest Trends of the Last 100 Years.8 In his introduction, Moore wrote, "The central premise of this book is that there has been more improvement in the human condition in the past 100 years than in all of the previous centuries..." Here is a sampling of the book's facts that support its title:
• Since data collection began, life expectancies rose, infant mortality fell, some diseases were eradicated while mortality from others dropped. Job-related fatalities fell since data became available in the 1930s, long before OSHA's creation.
• Per-capita income and wealth rose despite shorter work weeks. Educational attainment jumped. Income disparities by gender and race receded. Most low income people acquired items previously considered "luxuries" and many achieved mid- or high-income status.
• Emissions per unit of GDP fell since the 1930s (prior to regulations) and absolute air quality improved since the data series started in the 1970s. The quality of surface water rose. Forests in the USA have increased in size and density since at least the 1950s. Energy prices relative to wages have plummeted since 1900.
In what could be considered an addendum to Simon's work, the Cato Institute earlier this year published The Improving State of the World.9 Its data also refutes most of what the doomsayers have said:
• Worldwide food supplies per capita increased 24% from 1961 to 2002. "Between 1969-71 and 2000-02, increases in food supplies reduced chronic undernourishment in developing countries from 956 million to 815 million (or from 37 to 17 percent) despite an 83% growth in their population."
• The environment in the developed world is notably cleaner than it was 40 years ago. Air and water pollution is down. Developing countries are increasingly addressing pollution and are making progress in many areas.
• Improved developing world health, wealth, food supplies, and the start of improved environments, are due to globalization. Trade increases wealth and disseminates technology.
• The long-term price trend of virtually every commodity that is used today has been downward over the past two centuries, in terms of both inflation-adjusted dollars and also in terms of minutes worked for purchase.
Investment Discipline – Embracing the Facts
Doomsayers sometimes sell a lot of books, magazines or movies, which in turn generate discussion and possibly action. Potential disasters such as stratospheric ozone depletion can be averted as a result. But often, doomsayers' predictions have turned out to be wrong and then largely forgotten. Mankind has a tremendous ability to solve problems, especially via democratic and capitalistic systems.
While doomsayers often are proven wrong, researching to find the elements of truth behind their claims can provide investment opportunities. When problems are real and are about to be addressed, there is usually money to be made, or lost.
Though the prices of basic materials have indeed fallen over the long run, our international portfolio managers detected an up cycle of accelerating demand and strong prices. We hired an analyst, Fritz Kaegi, to specialize in that group. He confirmed that companies had underinvested in several areas, and believed prices and profits could stay strong for a while. We've discussed some resulting investments in fund shareholder reports.
The world has not run out of oil; predictions of $100 oil proved to be wrong, or at least decades too early. Energy stocks have been
3
Wanger International Small Cap 2007 Semiannual Report
cyclical for a long time. Our funds now have significant investments in energy as we believe this up cycle will persist. Our energy analyst, Bill Doyle, is especially positive on oil service companies.
Doomsayers will come and go; some will raise valid concerns, which, if history repeats itself, will be successfully addressed. We expect to continue to sort through the rhetoric, determine the facts, and work to invest appropriately.


Charles P. McQuaid
President and Chief Investment Officer
Columbia Wanger Asset Management, L.P.
1 Source: Wired.com, "The Doomslayer" by Ed Regis, February 1997.
2 Ehrlich, Paul, The Population Bomb (Buccaneer Books, Inc, 1968, 1971)
3 Meadows, Donella H; Meadows, Dennis L; Randers, Jorgen; Behrens III, William W, The Limits to Growth (New York: Universe Books, 1972)
4 Reprinted in the The American Spectator, May/June 2002. Originally printed in Newsweek, "The Cooling World," reported by Peter Gwynne, April 28, 1975.
5 Meadows, Donella; Randers, Jorgen; Meadows, Dennis, Limits to Growth – The 30-Year Update, (Vermont: Chelsea Green Publishing Company, 2004)
6 Source: Wired.com, "The Doomslayer" by Ed Regis, February 1997.
7 Science, 27 June 1980, Vol. 208, no. 4451.
8 Moore, Stephen; Simon, Julian, It's Getting Better All the Time: 100 Greatest Trends of the Last 100 Years (Washington, DC: Cato Institute, 2000). Bullet pointed data applies to the United States.
9 Goklany, Indur M, The Improving State of the World: Why We're Living Longer, Healthier, More Comfortable Lives on a Cleaner Planet (Washington DC: Cato Institute, 2007)
Author's Note:
The author considers himself to be a disciple of Julian Simon. However, the author also has recycled and conserved energy for years. He has replaced numerous incandescent light bulbs with compact fluorescents. His wife happily drives a hybrid vehicle. And he has not emitted tons of carbon dioxide by flying in a private jet to Davos in order to tell other people to conserve.
4
Wanger International Small Cap 2007 Semiannual Report

Performance Review Wanger International Small Cap
 | |  | |
|
Louis J. Mendes III
Co-Portfolio Manager | | Christopher J. Olson
Co-Portfolio Manager | |
|
Performance data quoted represents past performance and current performance may be lower or higher. Past performance is no guarantee of future results. The investment return and principal value of an investment in the Fund will fluctuate so that shares, when redeemed, may be worth more or less than the original cost. For daily and month-end performance updates, please call 1-888-4-WANGER.
Wanger International Small Cap ended the period up 14.36%, just behind the 14.85% gain of the benchmark S&P/Citigroup EMI Global ex-US Index.
Returns varied considerably by region. Led by Korea and China, the Fund's Asia ex-Japan holdings posted a 32% return on the back of positive earnings surprises and liquidity inflows to the region. Liberalization measures in China allowing local investment companies to invest overseas—with Hong Kong as the most likely initial recipient of these funds—boosted sentiment regarding China–focused companies. China Shipping Development, one of China's largest transport companies, rose 54%, in part due to its large valuation gap when compared to its domestic-listed shares. The regional exchanges also continued to drive good returns, with Hong Kong Exchanges and Clearing and Singapore Exchange both benefiting as trading volumes increased in what is largely a fixed cost base business. The Fund's top two performers were two niche Korean industrial companies, Sung Kwang Bend and Taewoong. These recent additions to the Fund ros e 286% and 104%, respectively, driven by the strong growth in global infrastructure and construction projects, particularly in the Middle East where Korean companies have a long track record in infrastructure development. We applaud our analyst who covers this region, Jeannie Cheung, for ferreting out these ideas.
The Fund's holdings in Continental Europe and Canada also posted strong results, rising 23% and 46%, respectively. The Netherland's Fugro, a provider of oilfield services, was up 35% for the half year on strong demand for its services. Also in the Netherlands, Smit Internationale, a provider of harbor and offshore towing and marine services, gained 52%. Canada's ShawCor, a manufacturer of oil and gas pipeline products, increased 43%.
Japanese stocks fell during the period. Despite a reasonably strong domestic economy, flat wage growth has lead to lackluster domestic consumption as consumers save rather than spend. Moreover, Japanese savers, attracted by higher yields than they can receive at home, are increasingly investing in overseas investment products. This has contributed to yen weakness relative to world currencies, placing a further drag on performance.
The other regions of note were the poorly performing British and Irish markets. After posting strong returns in 2006, these markets have seen a strong pullback thus far in 2007 on concerns over higher interest rates, extended valuations and a deepening financial crisis. Since the beginning of 2007, we have significantly reduced our exposure to these markets, but still have been affected by the overall poor sentiment.
International investments involve greater potential risks, including less regulation, currency fluctuations, economic instability and political developments. Investments in small- and mid-cap companies may be subject to greater volatility and price fluctuations because they may be thinly traded and less liquid.
Fund's Positions in Mentioned Holdings
as of 6/30/07
| Fugro | | | 1.7 | % | |
| Hong Kong Exchanges and Clearing | | | 1.4 | % | |
| ShawCor | | | 1.1 | % | |
| China Shipping Development | | | 1.1 | % | |
| Smit Internationale | | | 1.0 | % | |
| Singapore Exchange | | | 0.9 | % | |
| Taewoong | | | 0.6 | % | |
| Sung Kwang Bend | | | 0.5 | % | |
Portfolio holdings are subject to change periodically and may not be representative of current characteristics and holdings.
5
Wanger International Small Cap 2007 Semiannual Report
Growth of a $10,000 Investment in
Wanger International Small Cap
Total return for each period,
May 3, 1995 (inception date) through June 30, 2007
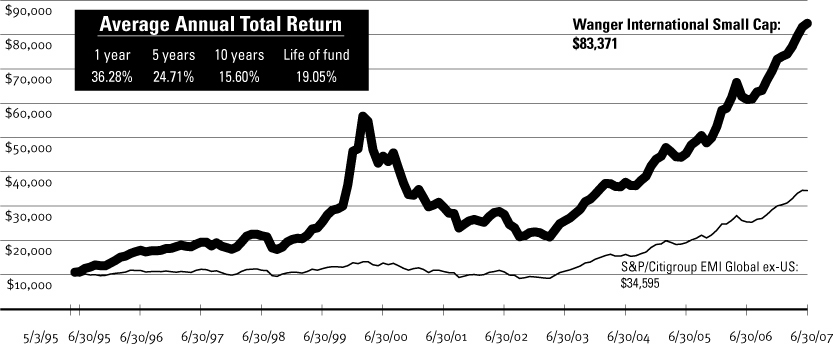
This graph compares the results of $10,000 invested in Wanger International Small Cap on May 3, 1995 (the date the Fund began operations) through June 30, 2007, to the S&P/Citigroup EMI Global ex-US Index, with dividends and capital gains reinvested. Performance shown here is past performance, which cannot guarantee future results. Current performance may be higher or lower. The investment return and principal value of an investment in the Fund will fluctuate so that Fund shares, when redeemed, may be worth more or less than their original cost. Performance changes over time. Current returns for the Fund may be different than that shown. For daily and month-end performance updates, please contact us at 1-888-4-WANGER.
Results to June 30, 2007
| | | 2nd quarter | | Year to date | | 1 year | |
Wanger International
Small Cap | | | 8.85 | % | | | 14.36 | % | | | 36.28 | % | |
S&P/Citigroup
EMI Global ex-US | | | 7.37 | | | | 14.85 | | | | 35.90 | | |
S&P/Citigroup Global
ex-US Cap Range $500mm-$5bn | | | 8.02 | | | | 15.47 | | | | 35.50 | | |
| MSCI EAFE Index | | | 6.40 | | | | 10.74 | | | | 27.00 | | |
NAV as of 6/30/07: $43.30
Performance numbers reflect all Fund expenses but do not include any insurance charge imposed by your insurance company's separate accounts. If performance included the effect of these additional charges, it would be lower.
Wanger International Small Cap annual operating expense ratio is 1.00%. Annual operating expense ratio is as stated in the Fund's prospectus that is current as of the date of this report. Differences in expense ratios disclosed elsewhere in this report may result from including fee waivers and reimbursements as well as different time periods used in calculating the ratios.
The graph and table do not reflect taxes that a shareholder would pay on Fund distributions or the sale of Fund shares.
The S&P/Citigroup EMI Global ex-U.S. is the bottom 20% of institutionally investable capital of developed and emerging countries, selected by the index sponsor, outside the United States. MSCI EAFE Index is Morgan Stanley's Europe, Australasia and Far East Index, a free float-adjusted market capitalization index that is designed to measure developed market equity performance, excluding the U.S. and Canada. All indexes are unmanaged and returns include reinvested dividends. It is not possible to invest directly in an index.
Portfolio characteristics and holdings are subject to change periodically and may not be representative of current characteristics and holdings.
Top 5 Countries
As a % of net assets, as of 6/30/07
| Japan | | 14.1 % | |
| Netherlands | | 9.3 | |
| France | | 9.0 | |
| United Kingdom | | 7.6 | |
| Germany | | 6.5 | |
Top 10 Holdings
As a % of net assets, as of 6/30/07
1. Fugro (Netherlands)
Oilfield Services | | 1.7%
| |
2. Hong Kong Exchanges and Clearing (Hong Kong)
Hong Kong Equity & Derivatives Market Operator | | 1.4
| |
3. Suzano (Brazil)
Brazilian Pulp & Paper Producer | | 1.4
| |
4. Atwood Oceanics (United States)
Offshore Drilling Contractor | | 1.4
| |
5. Hexagon (Sweden)
Measurement Equipment & Polymers | | 1.3
| |
6. SES Global (France)
Satellite Broadcasting Services | | 1.3
| |
7. Uranium One (South Africa)
Uranium Mines in South Africa, Kazakhstan, Australia & the U.S. | | 1.2
| |
8. ShawCor (Canada)
Oil & Gas Pipeline Products | | 1.1
| |
9. SWECO (Sweden)
Engineering Consultants | | 1.1
| |
10. China Shipping Development (China)
China's Dominant Shipper for Oil & Coal | | 1.0
| |
6
Wanger International Small Cap 2007 Semiannual Report
Wanger International Small Cap
Statement of Investments (Unaudited) June 30, 2007
Number of
Shares | | | | Value | |
| | | Common Stocks – 95.0% | |
| | | Europe – 52.6% | |
| | | Netherlands – 9.3% | |
| | 447,692 | | | Fugro
Oilfield Services | | $ | 28,412,085 |
| |
| | 261,000 | | | Stork
Industrial Services & Food Processing Equipment | | | 16,941,429 |
| |
| | 214,916 | | | Smit Internationale
Harbor & Offshore Towage & Marine Services | | | 16,816,840 |
| |
| | 608,450 | | | Aalberts Industries
Flow Control & Heat Treatment | | | 16,706,400 |
| |
| | 300,255 | | | USG People
Temporary Staffing Services | | | 14,105,604 |
| |
| | 350,000 | | | Koninklijke TenCate
Advanced Textiles & Industrial Fabrics | | | 13,397,322 |
| |
| | 152,000 | | | Imtech
Engineering & Technical Services | | | 13,185,748 |
| |
| | 410,000 | | | Unit 4 Agresso
Business & Security Software | | | 11,105,970 |
| |
| | 380,527 | | | Wavin
Largest European Plastic Pipe Systems Company | | | 9,153,813 |
| |
| | 228,000 | | | OPG Groep
Health Care Supplies & Pharmacies | | | 8,302,495 |
| |
| | 161,661 | | | Boskalis Westminster
Dredging & Maritime Contractor | | | 6,426,918 |
| |
| | 150,000
| | | SBM Offshore
Builds & Leases Offshore Vessels to
Process & Store Crude Oil | | | 5,717,739 |
| |
| | | | | | | | 160,272,363 | | |
| | | France – 9.0% | |
| | 1,000,000 | | | SES Global
Satellite Broadcasting Services | | | 21,555,102 |
| |
| | 200,000 | | | Carbone Lorraine
Advanced Industrial Materials | | | 15,520,770 |
| |
| | 130,000 | | | Iliad
Alternative Internet & Telecoms Provider | | | 13,134,623 |
| |
| | 85,000 | | | Pierre & Vacances
Vacation Apartment Lets | | | 12,968,485 |
| |
| | 182,818 | | | Trigano
Leisure Vehicles & Camping Equipment | | | 10,826,822 |
| |
| | 111,517 | | | Rubis
Tank Storage & LPG Supplier | | | 9,979,266 |
| |
| | 65,000 | | | Bacou Dalloz
Safety Equipment | | | 9,880,948 |
| |
Number of
Shares | | | | Value | |
| | 90,000 | | | Norbert Dentressangle
Transport | | $ | 8,712,848 |
| |
| | 230,000 | | | Legrand
Electrical Components | | | 8,276,972 |
| |
| | 81,000 | | | Imerys
Industrial Minerals Producer | | | 8,215,003 |
| |
| | 56,000 | | | Neopost
Postage Meter Machines | | | 8,189,773 | | |
| | 35,000 | | | Ciments Francais
Leading French & Emerging Markets Cement Producer | | | 8,026,405 |
| |
| | 92,000 | | | Eurofins Scientific (a)
Food Screening & Testing | | | 7,811,014 |
| |
| | 120,000 | | | April Group
Insurance Policy Construction | | | 6,321,276 |
| |
| | 120,000 | | | Meetic (a)
Dating Services | | | 5,097,103 |
| |
| | | | | | | | 154,516,410 | | |
| | | United Kingdom – 7.6% | |
| | 2,200,000 | | | Charles Taylor (b)
Insurance Services | | | 17,183,205 |
| |
| | 600,000 | | | Northgate
Light Commercial Vehicle Rental Specialist | | | 12,292,174 |
| |
| | 1,750,000 | | | RPS Group
Environmental Consulting & Planning | | | 12,258,262 |
| |
| | 618,214 | | | Expro International Group
Offshore Oilfield Services | | | 12,051,026 |
| |
| | 910,000 | | | Smith & Nephew
Medical Equipment & Supplies | | | 11,261,128 |
| |
| | 1,102,000 | | | Tullow Oil
Oil & Gas Producer | | | 10,738,294 |
| |
| | 1,973,700 | | | Taylor Nelson Sofres
Market Research | | | 9,334,326 |
| |
| | 2,000,000 | | | Begbies Traynor
Financial Restructuring & Corporate Recovery Services | | | 5,513,895 |
| |
| | 1,008,000 | | | BBA Group
Aviation Support Services | | | 5,466,360 |
| |
| | 215,000 | | | Randgold Resources
Gold Mining in Western Africa | | | 4,770,850 |
| |
| | 400,000 | | | Informa Group
Global Publisher & Event Organizer | | | 4,446,557 |
| |
See accompanying notes to financial statements.
7
Wanger International Small Cap 2007 Semiannual Report
Wanger International Small Cap
Statement of Investments (Unaudited) June 30, 2007
Number of
Shares | | | | Value | |
| | | United Kingdom – 7.6% (cont) | |
| | 205,000 | | | Keller Group
International Ground Engineering Specialist | | $ | 4,421,858 |
| |
| | 710,000 | | | Debt Free Direct
Consumer Debt Reduction & Management Solutions | | | 3,375,946 |
| |
| | 172,000 | | | Intertek Testing
Testing, Inspection, Certification Services | | | 3,372,242 |
| |
| | 423,306 | | | Detica
UK IT Services Company | | | 3,258,338 |
| |
| | 400,000 | | | Workspace Group
UK Real Estate | | | 3,206,746 |
| |
| | 478,300 | | | Mears Group
Social Housing Mainentance | | | 3,113,364 |
| |
| | 148,749 | | | Rotork
Valve Actuators for Oil & Water Pipelines | | | 2,714,196 |
| |
| | 123,250 | | | Paragon Group
UK Buy-to-let Finance Company | | | 1,206,217 |
| |
| | | | | | | | 129,984,984 | | |
| | | Germany – 6.5% | |
| | 260,000 | | | CTS Eventim
Event Ticket Sales | | | 12,805,711 |
| |
| | 131,000 | | | Wincor Nixdorf
Retail POS Systems & ATM Machines | | | 12,141,864 |
| |
| | 55,000 | | | Rational
Commercial Oven Manufacturer | | | 10,777,308 |
| |
| | 98,000 | | | MPC Muechmeyer Petersen Capital
Alternative Asset Manager | | | 10,018,903 |
| |
| | 82,000 | | | Vossloh
Rail Infrastructure & Diesel Locomotives | | | 9,625,390 |
| |
| | 150,000 | | | Rhoen-Klinikum
Health Care Services | | | 9,038,344 |
| |
| | 4,900 | | | Porsche
Specialty Automobile Manufacturer | | | 8,723,361 |
| |
| | 170,000 | | | GFK
Market Research Services | | | 8,395,699 |
| |
| | 205,000 | | | Deutsche Beteiligungs
Private Equity Investment Management | | | 8,318,160 |
| |
| | 135,000 | | | Hugo Boss Designs
Fashion Apparel | | | 8,082,723 |
| |
| | 88,000 | | | Elringklinger
Automobile Components | | | 8,028,371 |
| |
Number of
Shares | | | | Value | |
| | 300,000 | | | Takkt
Mail Order Retailer of Office & Warehouse Durables | | | $5,342,365
| | |
| | | | | | | | 111,298,199 | | |
| | | Switzerland – 5.8% | |
| | 190,000 | | | Kuehne & Nagel
Freight Forwarding/Logistics | | | 17,499,987
| | |
| | 8,000 | | | Sika
Chemicals for Construction & Industrial Applications | | | 16,327,515
| | |
| | 44,000 | | | Nobel Biocare Holding
Dental Implants & Ceramic Crowns | | | 14,367,030
| | |
| | 115,000 | | | Synthes
Products for Orthopedic Surgery | | | 13,802,162
| | |
| | 80,000 | | | Geberit
Plumbing Supplies | | | 13,649,748
| | |
| | 48,000 | | | Burckhardt Compression (a)
Gas Compression Pumps | | | 11,631,414
| | |
| | 8,000 | | | Givaudan
Fragrances & Flavors | | | 7,899,443
| | |
| | 130,000 | | | Logitech International (a)
Branded Peripheral Computer Devices | | | 3,444,755
| | |
| | | | | | | | 98,622,054 | | |
| | | Ireland – 3.6% | |
| | 2,550,000 | | | United Drug
Irish Pharmaceutical Wholesaler & Outsourcer | | | 13,924,686
| | |
| | 600,000 | | | IAWS Group
Baked Goods | | | 12,568,147
| | |
| | 360,000 | | | Kingspan Group
Building Insulation & Environmental Containers | | | 10,067,000
| | |
| | 430,000 | | | Depfa Bank
Investment Banker to Public Authorities | | | 7,613,488
| | |
| | 200,000 | | | Paddy Power
Irish Betting Services | | | 6,235,397
| | |
| | 260,000 | | | Bank of Ireland
Irish Commercial Bank | | | 5,268,610
| | |
| | 320,000 | | | Grafton Group
Builders Materials Wholesaling & Do-it-yourself Retailing | | | 4,565,348
| | |
| | 87,215 | | | C&C Group
Beverage Company | | | 1,169,851
| | |
| | | | | | | | 61,412,527 | | |
See accompanying notes to financial statements.
8
Wanger International Small Cap 2007 Semiannual Report
Wanger International Small Cap
Statement of Investments (Unaudited) June 30, 2007
Number of
Shares | | | | Value | |
| | | Sweden – 2.4% | |
| | 1,125,000 | | | Hexagon
Measurement Equipment & Polymers | | | $21,574,983
| | |
| | 1,974,000 | | | SWECO
Engineering Consultants | | | 18,916,459
| | |
| | | | | | | | 40,491,442 | | |
| | | Italy – 1.6% | |
| | 3,000,000 | | | CIR
Italian Holding Company | | | 11,537,607
| | |
| | 1,000,000 | | | Amplifon
Hearing Aid Retailer | | | 8,309,044
| | |
| | 573,000 | | | GranitiFiandre
Innovative Stoneware | | | 7,276,986
| | |
| | | | | | | | 27,123,637 | | |
| | | Spain – 1.2% | |
| | 195,000 | | | Red Electrica de Espana
Spanish Power Grid | | | 9,137,582
| | |
| | 300,000 | | | Prisa
Leading Spanish-speaking Publisher | | | 6,597,668
| | |
| | 130,000 | | | Sogecable (a)
Spain's Main Pay-TV | | | 5,441,864
| | |
| | | | | | | | 21,177,114 | | |
| | | Austria – 1.1% | |
| | 310,000 | | | Zumtobel (a)
Lighting Systems | | | 11,563,392
| | |
| | 100,000 | | | Wienerberger
Bricks & Clay Roofing Tiles | | | 7,374,324
| | |
| | | | | | | | 18,937,716 | | |
| | | Denmark – 1.0% | |
| | 87,000 | | | Novozymes
Industrial Enzymes | | | 10,085,144
| | |
| | 125,000 | | | Thrane & Thrane
Mobile Transceivers for Satellite Communications | | | 7,766,538
| | |
| | | | | | | | 17,851,682 | | |
| | | Poland – 0.8% | |
| | 396,800 | | | Central European Distribution (a)
Vodka Production & Alcohol Distribution | | | 13,737,216
| | |
Number of
Shares | | | | Value | |
| | | Greece – 0.8% | |
| | 420,000 | | | Intralot
Lottery & Gaming Systems and Services | | $ | 13,529,885 |
| |
| | | Finland – 0.6% | |
| | 488,000 | | | Poyry
Engineering Consultants | | | 10,819,783 |
| |
| | | Czech Republic – 0.6% | |
| | 56,000 | | | Komercni Banka
Leading Czech Universal Bank | | | 10,425,387 |
| |
| | | Norway – 0.4% | |
| | 776,485 | | | Kongsberg Automotive
Automotive Seating & Component Supplier | | | 6,508,535 |
| |
| | | Russia – 0.3% | |
| | 153,900 | | | RosBusinessConsulting (a)
Financial Information, Media & IT Services in Russia | | | 5,540,400 |
| |
| | | | | Total Europe | | | 902,249,334 | | |
| | | Asia – 26.0% | |
| | | Japan – 14.1% | |
| | 1,900,000 | | | Kansai Paint
Paint Producer in Japan, India, China & Southeast Asia | | | 16,596,877 |
| |
| | 240,000 | | | Ibiden
Electronic Parts & Ceramics | | | 15,453,798 |
| |
| | 17,500 | | | Jupiter Telecommunications (a)
Largest Cable Service Provider in Japan | | | 14,430,411 |
| |
| | 400,000 | | | Aeon Mall
Suburban Shopping Mall Developer, Owner & Operator | | | 12,270,236 |
| |
| | 350,000 | | | Hoya
Opto-electrical Components & Eyeglass Lenses | | | 11,583,925 |
| |
| | 3,920 | | | Risa Partners
NPL & Real Estate Related Investment | | | 10,651,647 |
| |
| | 400,000 | | | As One
Scientific Supplies Distributor | | | 10,303,226 |
| |
| | 410,000 | | | JSR
Films & Chemicals for LCD Screens & Electronics | | | 9,874,274 |
| |
| | 5,200 | | | Kenedix
Real Estate Investment Management | | | 9,672,044 |
| |
| | 145,000 | | | USS
Used Car Auctioneer | | | 9,229,250 |
| |
See accompanying notes to financial statements.
9
Wanger International Small Cap 2007 Semiannual Report
Wanger International Small Cap
Statement of Investments (Unaudited) June 30, 2007
Number of
Shares | | | | Value | |
| | | Japan – 14.1% (cont) | |
| | 430,000 | | | Yusen Air & Sea Service
Airfreight Logistics | | $ | 9,190,284 |
| |
| | 266,300 | | | Kintetsu World Express
Airfreight Logistics | | | 9,020,214 |
| |
| | 242,000 | | | Ito En
Bottled Tea & Other Beverages | | | 7,948,255 |
| |
| | 300,000 | | | Ushio
Industrial Light Sources | | | 6,647,246 |
| |
| | 320,000 | | | FCC
Auto/Motorcycle Clutches | | | 6,571,791 |
| |
| | 650,000 | | | Park24
Parking Lot Operator | | | 6,526,168 |
| |
| | 160,000 | | | Union Tool
Precision Drill Bit Manufacturer | | | 5,910,627 |
| |
| | 4,400 | | | FullCast
Employment Outsourcing | | | 5,783,826 |
| |
| | 120,000 | | | Daito Trust Construction
Apartment Builder | | | 5,709,556 |
| |
| | 45,000 | | | Nakanishi
Dental Tools & Machinery | | | 5,616,959 |
| |
| | 325,000 | | | T. Hasegawa
Industrial Flavors & Fragrances | | | 5,410,186 |
| |
| | 360,000 | | | Cosel
Industrial Standard Switching Power Supply System | | | 5,216,821 |
| |
| | 1,350,000 | | | Kansai Urban Banking
Regional Bank | | | 4,680,694 |
| |
| | 130,000 | | | Takata
Safety Related Auto Parts | | | 4,531,080 |
| |
| | 450,000 | | | Chiba Bank
Regional Bank | | | 3,993,929 |
| |
| | 440,000 | | | Kamigumi
Port Cargo Handling & Logistics | | | 3,813,979 |
| |
| | 520,000 | | | Bank of Fukuoka
Regional Bank | | | 3,430,278 |
| |
| | 222,000 | | | Ain Pharmaciez
Dispensing Pharmacy/Drugstore Operator | | | 3,387,963 |
| |
| | 200,000 | | | Topcon
Positioning & Medical Instrument | | | 3,328,598 |
| |
| | 720 | | | Osaka Securities Exchange
Osaka Securities Exchange | | | 3,321,372 |
| |
| | 24,000 | | | Hirose Electric
Electrical Connectors | | | 3,152,224 |
| |
Number of
Shares | | | | Value | |
| | 550 | | | Japan Pure Chemical
Precious Metal Plating Chemicals for Electronics | | $ | 2,161,883 |
| |
| | 1,030 | | | Message
Nursing Care Facility Operator | | | 1,670,796 |
| |
| | 35,100 | | | Unicharm PetCare
Pet Food & Pet Toiletries | | | 1,413,363 |
| |
| | 71,300 | | | Nagaileben
Medical/Health Care Related Clothes | | | 1,375,492 |
| |
| | 27,800 | | | Aeon Delight
Facility Maintenance & Management | | | 847,999 |
| |
| | 17,400 | | | Hogy Medical
Disposable Surgical Products | | | 776,726 |
| |
| | | | | | | | 241,503,997 | | |
| | | China – 4.0% | |
| | 7,788,000 | | | China Shipping Development
China's Dominant Shipper for Oil & Coal | | | 17,963,761 |
| |
| | 16,141,000 | | | Lenovo Group
Third Largest PC Vendor Globally | | | 9,507,727 |
| |
| | 8,122,000 | | | China Green
An Agricultural Grower & Processor in China | | | 7,479,899 |
| |
| | 2,062,000 | | | Fu Ji Food & Catering Services
Food Catering Service Provider in China | | | 7,068,441 |
| |
| | 5,636,000 | | | Jiangsu Expressway
Chinese Toll Road Operator | | | 5,732,422 |
| |
| | 170,000 | | | Sohu.com (a)
Chinese Internet Portal/Online Advertising | | | 5,438,300 |
| |
| | 6,330,000 | | | Travelsky Technology
Online Air Travel Bookings in China | | | 5,409,827 |
| |
| | 5,000,000 | | | Hopewell Highway Infrastructure
Guangdong Tollroad Leading to Hong Kong & Macau | | | 4,682,769 |
| |
| | 6,512,000 | | | TPV Technology
ODM for LCD Monitor & Flat TV | | | 4,501,358 |
| |
| | 1,858,000 | | | Xinyu Hengdeli
A High-end Watch Retailer in China | | | 911,404 |
| |
| | | | | | | | 68,695,908 | | |
| | | Hong Kong – 2.3% | |
| | 1,730,000 | | | Hong Kong Exchanges and Clearing
Hong Kong Equity & Derivatives Market Operator | | | 24,476,983 |
| |
| | 9,494,000 | | | EganaGoldpfeil
A Leather & Fashion Accessories Brand Manager | | | 8,316,966 |
| |
See accompanying notes to financial statements.
10
Wanger International Small Cap 2007 Semiannual Report
Wanger International Small Cap
Statement of Investments (Unaudited) June 30, 2007
Number of
Shares | | | | Value | |
| | | Hong Kong – 2.3% (cont) | |
| | 1,600,000 | | | Lifestyle International
Mid to High-end Department Store Operator in
Hong Kong & China | | | $6,201,058
| | |
| | | | | | | | 38,995,007 | | |
| | | Korea – 1.8% | |
| | 55,000 | | | MegaStudy
Online Education Service Provider | | | 10,684,199
| | |
| | 145,000 | | | Taewoong
A Player in the Niche Customized Forging Market | | | 10,170,990
| | |
| | 306,000 | | | Sung Kwang Bend
A Large Customized Industrial Pipe Fitting Manufacturer | | | 9,047,109
| | |
| | 87,000 | | | YBM Sisa.com
Online Language Educator & Tester | | | 1,670,469
| | |
| | | | | | | | 31,572,767 | | |
| | | Singapore – 1.2% | |
| | 2,300,000 | | | Singapore Exchange
Singapore Equity & Derivatives Market Operator | | | 14,689,352
| | |
| | 3,990,000 | | | ComfortDelGro
Taxi & Mass Transit Service | | | 5,686,290
| | |
| | | | | | | | 20,375,642 | | |
| | | Taiwan – 1.2% | |
| | 2,141,119 | | | Advantech
Embedded Computers | | | 6,837,801
| | |
| | 2,600,000 | | | Wah Lee Industrial
Distributor of Chemicals, Materials & Equipment | | | 5,884,935
| | |
| | 1,150,000 | | | Everlight Electronics
A Led Packager | | | 4,109,069
| | |
| | 272,695 | | | Formosa International Hotels
Hotel, Food & Beverage Operation &
Hospitality Management Services | | | 2,934,950 | | |
| | | | | | | | 19,766,755 | | |
| | | India – 1.1% | |
| | 300,000 | | | Housing Development Finance
Indian Mortgage Lender | | | 14,907,346
| | |
| | 230,000 | | | Asian Paints
India's Largest Paint Company | | | 4,682,192
| | |
| | | | | | | | 19,589,538 | | |
Number of
Shares | | | | Value | |
| | | Indonesia – 0.3% | |
| | 5,000,000 | | | Perusahaan Gas Negara
Gas Pipeline Operator | | | $5,222,718
| | |
| | | | | Total Asia | | | 445,722,332 | | |
| | | Other Countries – 11.5% | |
| | | Canada – 3.2% | |
| | 630,000 | | | ShawCor
Oil & Gas Pipeline Products | | | 19,345,036
| | |
| | 157,500 | | | Potash Corporation of Saskatchewan
World's Largest Producer of Potash | | | 12,280,275
| | |
| | 553,700 | | | RONA (a)
Leading Canadian Do-it-yourself Retailer | | | 11,565,196
| | |
| | 280,000 | | | Van Houtte
Coffee Services & Equipment | | | 6,539,686
| | |
| | 250,000 | | | Ivanhoe Mines (a)
Copper Mine Project in Mongolia | | | 3,543,769
| | |
| | 240,000 | | | Enerflex Systems
Natural Gas Compresser Rental & Fabrication | | | 2,374,654
| | |
| | | | | | | | 55,648,616 | | |
| | | South Africa – 2.8% | |
| | 1,575,000 | | | Uranium One (a)
Uranium Mines in South Africa, Kazakhstan,
Australia & the U.S. | | | 20,063,600
| | |
| | 484,000 | | | Impala Platinum Holdings
Platinum Group Metals Mining & Refining | | | 14,673,451
| | |
| | 518,000 | | | Naspers
Media & Education in Africa & Other Emerging Markets | | | 13,268,699
| | |
| | | | | | | | 48,005,750 | | |
| | | Australia – 2.6% | |
| | 900,000 | | | Billabong International
Action Sports Apparel Brand Manager | | | 13,627,678
| | |
| | 250,000 | | | Australian Stock Exchange
Australian Equity & Derivatives Market Operator | | | 10,283,644
| | |
| | 550,000 | | | Jubilee Mines
Nickel Mining in Australia | | | 7,427,481
| | |
| | 1,403,100 | | | Sino Gold (a)
Gold Mining in The People's Republic of China | | | 6,645,973
| | |
| | 100,000 | | | Perpetual Trustees
Mutual Fund Management | | | 6,623,872
| | |
| | | | | | | | 44,608,648 | | |
See accompanying notes to financial statements.
11
Wanger International Small Cap 2007 Semiannual Report
Wanger International Small Cap
Statement of Investments (Unaudited) June 30, 2007
Number of
Shares | | | | Value | |
| | | United States – 2.4% | |
| | 350,000 | | | Atwood Oceanics (a)
Offshore Drilling Contractor | | | $24,017,000
| | |
| | 165,000 | | | Dresser-Rand Group (a)
Largest Manufacturer of Compressors | | | 6,517,500
| | |
| | 62,900 | | | FMC Technologies (a)
Oil & Gas Well Head Manufacturer | | | 4,982,938
| | |
| | 157,000 | | | BioMarin (a)
Biotech Focused on Orphan Diseases | | | 2,816,580
| | |
| | 88,700 | | | Tesco (a)
Developing New Well Drilling Technologies | | | 2,798,485
| | |
| | | | | | | | 41,132,503 | | |
| | | New Zealand – 0.5% | |
| | 2,099,559 | | | Sky City Entertainment
Casino/Entertainment Complex | | | 8,208,043
| | |
| | | | | Total Other Countries | | | 197,603,560 | | |
| | | Latin America – 4.9% | |
| | | Brazil – 3.0% | |
| | 1,780,000 | | | Suzano
Brazilian Pulp & Paper Producer | | | 24,083,981
| | |
| | 900,000 | | | Natura Cosmeticos
Direct Retailer of Cosmetics | | | 13,063,764
| | |
| | 242,000 | | | Porto Seguro
Auto & Life Insurance | | | 9,283,567
| | |
| | 450,000 | | | Localiza Rent A Car
Car Rental | | | 5,073,872
| | |
| | | | | | | | 51,505,184 | | |
| | | Mexico – 1.9% | |
| | 2,700,000 | | | Urbi Desarrollos Urbanos (a)
Affordable Housing Builder | | | 12,433,471
| | |
| | 6,000,000 | | | Consorcio ARA
Affordable Housing Builder | | | 9,663,535
| | |
| | 180,000 | | | Grupo Aeroportuario del Surest
Cancun/Cozumel Airport Operator | | | 9,484,200
| | |
| | | | | | | | 31,581,206 | | |
| | | | | Total Latin America | | | 83,086,390 | | |
| Total Common Stocks (Cost: $995,084,374) – 95.0% | | | 1,628,661,616 | | |
Principal
Amount | | | | Value | |
| Short-Term Obligations – 4.3% | | | |
| $ | 8,600,000 | | | World Omni Vehicle Leasing (c)
5.30% due 7/05/07 | | $ | 8,594,935 | | |
| | 8,500,000 | | | Kaiserplatz Delaware (c)
5.30% due 7/02/07 | | | 8,498,748 | | |
| | 8,500,000 | | | American General Financial
5.28% due 7/03/07 | | | 8,497,507 | | |
| | 8,500,000 | | | Morrigan (c) 5.36% due 7/06/07 | | | 8,493,672 | | |
| | 8,500,000 | | | Natixis (c) 5.33% due 7/12/07 | | | 8,486,157 | | |
| | 8,400,000 | | | White Point Funding (c)
5.36% due 7/09/07 | | | 8,389,995 | | |
| | 8,400,000 | | | St. Germain Holdings (c)
5.36% due 7/10/07 | | | 8,388,744 | | |
| | 8,400,000 | | | Anglesea Funding (c) 5.35% due 7/11/07 | | | 8,387,517 | | |
| | 6,144,000 | | | Repurchase Agreement with
Fixed Income Clearing Corp.,
dated 6/29/07, due 7/02/07 at 5.05%,
collateralized by a U.S. Government
Agency Obligation, maturing 7/18/11,
market value $6,267,925 (repurchase
proceeds $6,146,586) | | | 6,144,000 | | |
| | | Total Short-Term Obligations (Cost: $73,881,275) | | | 73,881,275 | | |
| Total Investments (Cost: $1,068,965,649) – 99.3% (d)(e) | | | 1,702,542,891 | | |
| Cash and Other Assets Less Liabilities – 0.7% | | | 12,649,263 | | |
| Total Net Assets – 100% | | | 1,715,192,154 | | |
See accompanying notes to financial statements.
12
Wanger International Small Cap 2007 Semiannual Report
Wanger International Small Cap
Statement of Investments (Unaudited) June 30, 2007
Notes to Statement of Investments:
(a) Non-income producing security.
(b) An affiliate may include any company in which the Fund owns five percent or more of its outstanding voting shares. On June 30, 2007, the Fund held five percent or more of the outstanding voting securities of the following company:
Balance of
Affiliates | | Shares
Held
12/31/2006 | | Purchases/
Additions | | Balance of
Sales/
Reductions | | Shares
Held
06/30/2007 | | Value | | Dividend | |
Charles
Taylor | | | 1,700,000 | | | | 500,000 | | | | — | | | | 2,200,000 | | | $ | 17,183,205 | | | $ | 323,811 | | |
The aggregate cost and value of this company at June 30, 2007, was $11,890,537 and $17,183,205 respectively. Investments in affiliate companies represent 1.0% of total net assets at June 30, 2007.
(c) Security exempt from registration under Section 4(2) of the Securities Act of 1933. These securities may only be resold in exempt transactions to qualified buyers. Private resales of these securities to qualified institutional buyers are also exempt from registration pursuant to Rule 144A under the Securities Act of 1933. At June 30, 2007, these securities amounted to $59,239,768, which represents 3.5% of net assets.
(d) At June 30, 2007, for federal income tax purposes cost of investments was $1,068,965,649 and net unrealized appreciation was $633,577,242 consisting of gross unrealized appreciation of $657,060,974 and gross unrealized depreciation of $23,483,732.
(e) On June 30, 2007, the Fund's total investments were denominated in currencies as follows:
| Currency | | Value | | % of Net
Assets | |
| Euro Dollars | | $ | 579,087,635 | | | | 33.8 | | |
| Japanese Yen | | | 241,503,997 | | | | 14.1 | | |
| British Pounds | | | 125,214,133 | | | | 7.3 | | |
| Hong Kong Dollars | | | 102,252,615 | | | | 6.0 | | |
| Swiss Francs | | | 98,622,054 | | | | 5.7 | | |
| U.S. Dollars | | | 166,265,019 | | | | 9.7 | | |
Other currencies less than
5% of total net assets | | | 389,597,438 | | | | 22.7 | | |
| | | $ | 1,702,542,891 | | | | 99.3 | | |
See accompanying notes to financial statements.
13
Wanger International Small Cap 2007 Semiannual Report
Wanger International Small Cap
Portfolio Diversification June 30, 2007 (Unaudited)
At June 30, 2007, the Fund's portfolio investments as a percent of net assets was diversified as follows:
| | | Value | | Percent | |
| Industrial Goods & Services | |
| Specialty Chemicals | | $ | 139,972,144 | | | | 8.2 | % | |
| Other Industrial Services | | | 107,053,213 | | | | 6.2 | | |
| Machinery | | | 73,683,766 | | | | 4.3 | | |
| Conglomerates | | | 70,676,610 | | | | 4.1 | | |
| Construction | | | 49,248,891 | | | | 2.9 | | |
| Outsourcing & Training Services | | | 40,761,328 | | | | 2.4 | | |
| Electrical Compoments | | | 34,856,655 | | | | 2.0 | | |
| Industrial Distribution | | | 14,868,574 | | | | 0.9 | | |
| | | | 531,121,181 | | | | 31.0 | | |
| Consumer Goods & Services | |
| Consumer Services | | | 43,147,482 | | | | 2.5 | | |
| Food | | | 42,774,279 | | | | 2.5 | | |
| Retail | | | 36,443,843 | | | | 2.1 | | |
| Casinos | | | 27,973,325 | | | | 1.6 | | |
| Goods Distribution | | | 22,966,466 | | | | 1.4 | | |
| Non Durable Goods | | | 22,794,093 | | | | 1.3 | | |
| Apparels | | | 21,710,401 | | | | 1.3 | | |
| Durable Goods | | | 19,826,232 | | | | 1.2 | | |
| Entertainment | | | 15,740,661 | | | | 0.9 | | |
| Leisure Products | | | 10,826,822 | | | | 0.6 | | |
| Travel | | | 10,483,699 | | | | 0.6 | | |
| Consumer Electronics | | | 4,501,358 | | | | 0.3 | | |
| | | | 279,188,661 | | | | 16.3 | | |
| Information Technology | |
| Financial Processors | | | 39,166,335 | | | | 2.3 | | |
| Computer Hardware & Related Equipment | | | 31,932,147 | | | | 1.9 | | |
| Business Information & Marketing Services | | | 29,988,287 | | | | 1.7 | | |
| Satellite Broadcasting | | | 21,555,102 | | | | 1.3 | | |
| Cable Television | | | 19,872,275 | | | | 1.2 | | |
| Internet Related | | | 18,572,923 | | | | 1.1 | | |
| Semiconductors & Related Equipment | | | 15,692,994 | | | | 0.9 | | |
| Television Broadcasting | | | 13,268,699 | | | | 0.8 | | |
| Business Software | | | 11,105,970 | | | | 0.6 | | |
| Publishing | | | 11,044,225 | | | | 0.6 | | |
| Computer Services | | | 8,798,738 | | | | 0.5 | | |
| Telecommunication Equipment | | | 7,766,538 | | | | 0.5 | | |
| Electronics Distribution | | | 5,884,935 | | | | 0.3 | | |
| Instrumentation | | | 3,328,598 | | | | 0.2 | | |
| | | | 237,977,766 | | | | 13.9 | | |
| | | Value | | Percent | |
| Energy & Minerals | |
| Oil Services | | $ | 112,643,381 | | | | 6.6 | % | |
| Mining | | | 69,405,399 | | | | 4.0 | | |
| Agricultural Commodities (includes Forestry) | | | 24,083,981 | | | | 1.4 | | |
| Refining/Marketing/Distribution | | | 15,201,984 | | | | 0.9 | | |
| Oil/Gas Producers | | | 10,738,294 | | | | 0.6 | | |
| | | | 232,073,039 | | | | 13.5 | | |
| Other | |
| Transportation | | | 72,893,109 | | | | 4.2 | | |
| Real Estate | | | 45,627,443 | | | | 2.7 | | |
| Regulated Utilities | | | 20,675,189 | | | | 1.2 | | |
| | | | 139,195,741 | | | | 8.1 | | |
| Finance | |
| Banks | | | 35,412,386 | | | | 2.0 | | |
| Insurance | | | 32,788,048 | | | | 1.9 | | |
| Money Management | | | 25,225,676 | | | | 1.5 | | |
| Savings & Loans | | | 14,907,346 | | | | 0.9 | | |
| Finance Companies | | | 13,417,430 | | | | 0.8 | | |
| Closed End Funds | | | 10,018,903 | | | | 0.6 | | |
| | | | 131,769,789 | | | | 7.7 | | |
| Health Care | |
| Medical Equipment | | | 39,430,320 | | | | 2.3 | | |
| Services | | | 19,011,635 | | | | 1.1 | | |
| Pharmaceuticals | | | 13,924,686 | | | | 0.8 | | |
| Biotechnology/ Drug Delivery | | | 2,816,580 | | | | 0.2 | | |
| Hospital/ Laboratory Supplies | | | 2,152,218 | | | | 0.1 | | |
| | | | 77,335,439 | | | | 4.5 | | |
| Total Common Stocks | | | 1,628,661,616 | | | | 95.0 | | |
| Short-Term Obligations | | | 73,881,275 | | | | 4.3 | | |
| Total Investments | | | 1,702,542,891 | | | | 99.3 | | |
Cash & Other Assets
Less Liabilities | | | 12,649,263 | | | | 0.7 | | |
| Net Assets | | $ | 1,715,192,154 | | | | 100.0 | % | |
See accompanying notes to financial statements.
14
Wanger International Small Cap 2007 Semiannual Report
Statement of Assets and Liabilities
June 30, 2007 (Unaudited)
| Assets: | | | | | |
| Unaffiliated investments, at cost | | $ | 1,057,075,112 | | |
| Affiliated investments, at cost (See Note 4) | | | 11,890,537 | | |
| Unaffiliated investments, at value | | $ | 1,685,359,686 | | |
| Affiliated investments, at value (See Note 4) | | | 17,183,205 | | |
| Foreign currency (cost of $6,531,470) | | | 6,571,360 | | |
| Receivable for: | |
| Investments sold | | | 10,071,102 | | |
| Fund shares sold | | | 517,282 | | |
| Interest | | | 1,724 | | |
| Dividends | | | 1,758,812 | | |
| Foreign tax reclaims | | | 399,968 | | |
| Total Assets | | | 1,721,863,139 | | |
| Liabilities: | |
| Payable to custodian bank | | | 469,253 | | |
| Payable for: | |
| Investments purchased | | | 2,956,889 | | |
| Fund shares repurchased | | | 1,723,438 | | |
| Investment advisory fee | | | 1,238,688 | | |
| Transfer agent fee | | | 22 | | |
| Trustees' fees | | | 3,023 | | |
| Custody fee | | | 69,966 | | |
| Deferred Trustees' fees | | | 23,683 | | |
| Deferred foreign capital gains tax payable | | | 127,234 | | |
| Other liabilities | | | 58,789 | | |
| Total Liabilities | | | 6,670,985 | | |
| Net Assets | | $ | 1,715,192,154 | | |
| Composition of Net Assets: | |
| Paid-in capital | | $ | 992,104,814 | | |
| Undistributed net investment income | | | 4,995,470 | | |
| Accumulated net realized gain | | | 84,587,807 | | |
| Net unrealized appreciation (depreciation) on: | |
| Investments | | | 633,577,242 | | |
| Foreign currency translations | | | 54,055 | | |
| Foreign capital gains tax | | | (127,234 | ) | |
| Net Assets | | $ | 1,715,192,154 | | |
| Fund Shares outstanding | | | 39,613,657 | | |
Net asset value, offering price and redemption
price per share | | $ | 43.30 | | |
Statement of Operations
For the Six Months Ended June 30, 2007 (Unaudited)
| Investment Income: | |
Dividends (net of foreign taxes withheld
of $1,577,619) | | $ | 18,012,945 | | |
| Dividends from affiliates | | | 323,811 | | |
| Interest income | | | 1,544,042 | | |
| Total Investment Income | | | 19,880,798 | | |
| Expenses: | |
| Investment advisory fee | | | 7,063,570 | | |
| Transfer agent fee | | | 173 | | |
| Trustees' fees | | | 37,321 | | |
| Custody fee | | | 363,268 | | |
| Chief compliance officer expenses (See Note 4) | | | 22,040 | | |
| Other expenses (See Note 5) | | | 273,285 | | |
| Total Expenses | | | 7,759,657 | | |
| Custody earnings credit | | | (139 | ) | |
| Net Expenses | | | 7,759,518 | | |
| Net Investment Income | | | 12,121,280 | | |
Net Realized and Unrealized Gain (Loss) on
Portfolio Positions and Foreign Currency: | |
| Net realized gain (loss) on: | |
| Investments | | | 85,437,434 | | |
| Foreign currency transactions | | | (373,581 | ) | |
| Net realized gain | | | 85,063,853 | | |
Net change in unrealized appreciation
(depreciation) on: | |
| Unaffiliated Investments | | | 112,869,025 | | |
| Affiliated Investments | | | 4,151,664 | | |
| Foreign currency translations | | | 50,900 | | |
| Foreign capital gains tax | | | (127,234 | ) | |
| Net change in unrealized appreciation | | | 116,944,355 | | |
| Net Gain | | | 202,008,208 | | |
| Net Increase in Net Assets from Operations | | $ | 214,129,488 | | |
See accompanying notes to financial statements.
15
Wanger International Small Cap 2007 Semiannual Report
Statement of Changes in Net Assets
| Increase (Decrease) in Net Assets: | | (Unaudited)
Six Months
Ended
June 30,
2007 | | Year Ended
December 31,
2006 | |
| From Operations: | |
| Net investment income | | $ | 12,121,280 | | | $ | 9,968,290 | | |
| Net realized gain on investments and foreign currency transactions | | | 85,063,853 | | | | 133,033,796 | | |
Net change in unrealized appreciation on investments, foreign currency
translations and foreign capital gains tax | | | 116,944,355 | | | | 239,496,939 | | |
| Net Increase in Net Assets from Operations | | | 214,129,488 | | | | 382,499,025 | | |
| Distributions Declared to Shareholders: | |
| From net investment income | | | (13,868,748 | ) | | | (6,400,167 | ) | |
| From net realized gains | | | (124,882,759 | ) | | | — | | |
| Total Distributions Declared to Shareholders | | | (138,751,507 | ) | | | (6,400,167 | ) | |
| Share Transactions: | |
| Subscriptions | | | 76,751,022 | | | | 235,925,977 | | |
| Distributions reinvested | | | 138,751,507 | | | | 6,400,167 | | |
| Redemptions | | | (55,811,175 | ) | | | (111,559,587 | ) | |
| Net Increase from Share Transactions | | | 159,691,354 | | | | 130,766,557 | | |
| Total Increase in Net Assets | | | 235,069,335 | | | | 506,865,415 | | |
| Net Assets: | |
| Beginning of period | | | 1,480,122,819 | | | | 973,257,404 | | |
| End of period | | $ | 1,715,192,154 | | | $ | 1,480,122,819 | | |
| Undistributed net investment income at end of period | | $ | 4,995,470 | | | $ | 6,742,938 | | |
See accompanying notes to financial statements.
16
Wanger International Small Cap 2007 Semiannual Report
Financial Highlights
| | | (Unaudited)
Six Months Ended
June 30, | | Year Ended December 31, | |
| Selected data for a share outstanding throughout each period | | 2007 | | 2006 | | 2005 | | 2004 | | 2003 | | 2002 | |
| Net Asset Value, Beginning of Period | | $ | 41.77 | | | $ | 30.63 | | | $ | 25.46 | | | $ | 19.68 | | | $ | 13.27 | | | $ | 15.40 | | |
| Income from Investment Operations: | |
| Net investment income (a) | | | 0.32 | (b) | | | 0.29 | | | | 0.25 | | | | 0.13 | | | | 0.13 | | | | 0.07 | | |
Net realized and unrealized gain (loss) on investments
and foreign currency transactions | | | 5.11 | | | | 11.04 | | | | 5.20 | | | | 5.80 | | | | 6.33 | | | | (2.20 | ) | |
| Total from Investment Operations | | | 5.43 | | | | 11.33 | | | | 5.45 | | | | 5.93 | | | | 6.46 | | | | (2.13 | ) | |
| Less Distributions Declared to Shareholders: | |
| From net investment income | | | (0.39 | ) | | | (0.19 | ) | | | (0.28 | ) | | | (0.15 | ) | | | (0.05 | ) | | | — | | |
From net realized gain and unrealized
gain reportable for federal income taxes | | | (3.51 | ) | | | — | | | | — | | | | — | | | | — | | | | — | | |
| Total Distributions Declared to Shareholders | | | (3.90 | ) | | | (0.19 | ) | | | (0.28 | ) | | | (0.15 | ) | | | (0.05 | ) | | | — | | |
| Net Asset Value, End of Period | | $ | 43.30 | | | $ | 41.77 | | | $ | 30.63 | | | $ | 25.46 | | | $ | 19.68 | | | $ | 13.27 | | |
| Total Return (c) | | | 14.36 | %(d) | | | 37.16 | % | | | 21.53 | %(e) | | | 30.27 | % | | | 48.86 | % | | | (13.83 | )% | |
| Ratios to Average Net Assets/Supplemental Data: | |
| Net operating expenses (f) | | | 0.99 | %(g) | | | 1.01 | % | | | 1.13 | % | | | 1.36 | % | | | 1.41 | % | | | 1.47 | % | |
| Interest expense | | | — | | | | 0.00 | %(h) | | | — | | | | — | | | | — | | | | — | | |
| Total net expenses (f) | | | 0.99 | %(g) | | | 1.01 | % | | | 1.13 | % | | | 1.36 | % | | | 1.41 | % | | | 1.47 | % | |
| Net investment income(f) | | | 1.54 | %(g) | | | 0.81 | % | | | 0.92 | % | | | 0.59 | % | | | 0.85 | % | | | 0.46 | % | |
| Waiver | | | — | | | | — | | | | 0.02 | % | | | — | | | | — | | | | — | | |
| Portfolio turnover rate | | | 18 | %(d) | | | 41 | % | | | 24 | % | | | 47 | % | | | 45 | % | | | 54 | % | |
| Net assets, end of period (000's) | | $ | 1,715,192 | | | $ | 1,480,123 | | | $ | 973,257 | | | $ | 606,773 | | | $ | 380,726 | | | $ | 216,084 | | |
(a) Net investment income per share was based upon the average shares outstanding during the period.
(b) Net investment income per share reflects a special dividend. The effect of this dividend amounted to $0.03 per share.
(c) Total return at net asset value assuming all distributions are reinvested.
(d) Not annualized.
(e) Had the Investment Adviser not waived a portion of expenses, total return would have been reduced.
(f) The benefits derived from custody fees paid indirectly had an impact of less than 0.01%.
(g) Annualized.
(h) Rounds to less than 0.01%.
See accompanying notes to financial statements.
17
Wanger International Small Cap 2007 Semiannual Report
Notes to Financial Statements (Unaudited)
1. Nature of Operations
Wanger International Small Cap (the "Fund") is a series of Wanger Advisors Trust (the "Trust"), an open-end management investment company organized as a Massachusetts business trust. The investment objective of the Fund is to seek long-term growth of capital. The Fund is available only for allocation to certain life insurance company separate accounts established for the purpose of funding qualified and non-qualified variable annuity contracts and variable life insurance policies and may also be offered directly to certain types of pension plans and retirement arrangements.
2. Significant Accounting Policies
Security valuation
Securities of the Fund are valued at market value or, if a market quotation for a security is not readily available or is deemed not to be reliable because of events or circumstances that have occurred between the market quotation and the time as of which the security is to be valued, the security is valued at a fair value determined in accordance with procedures established by the Board of Trustees. A security traded on a securities exchange or in over-the-counter market in which transaction prices are reported is valued at the last sales price at the time of valuation. A security traded principally on Nasdaq is valued at the NASDAQ official closing price. A security for which there is no reported sale on the valuation date is valued at the latest bid quotation. A short-term debt obligation having a maturity of 60 days or less from the valuation date is valued in accordance with procedures established by the Board of Trustees. The Trust has retained an independent statistical fair value pricing service to assist in the fair valuation process for securities principally traded in a foreign market in order to adjust for possible changes in value that may occur between the close of the foreign exchanges and the time as of which the securities are to be valued. If a security is valued at a "fair value", that value may be different from the last quoted market price for the security.
In September 2006, Statement of Financial Accounting Standards No. 157, Fair Value Measurements ("SFAS 157"), was issued. SFAS 157 is effective for fiscal years beginning after November 15, 2007. SFAS 157 defines fair value, establishes a framework for measuring fair value and expands disclosures about fair value measurements. Management is evaluating the impact the application of SFAS 157 will have on the Fund's financial statement disclosures.
Repurchase agreements
The Fund may engage in repurchase agreement transactions. The Fund, through its custodians, receives delivery of underlying securities collateralizing each repurchase agreement. The Fund's investment advisor determines that the value of the underlying securities is at all times at least equal to the repurchase price including interest. In the event of default or bankruptcy by the other party to the agreement, realization and/or retention of the collateral may be subject to legal proceedings.
Foreign currency translations
Values of investments denominated in foreign currencies are converted into U.S. dollars using the spot market rate of exchange at the time of valuation. Purchases and sales of investments and dividend and interest income are translated into U.S. dollars using the spot market rate of exchange prevailing on the respective dates of such transactions. The gain or loss resulting from changes in foreign exchange rates is included with net realized and unrealized gain or loss from investments, as appropriate.
Security transactions and investment income
Security transactions are accounted for on the trade date (date the order to buy or sell is executed) and dividend income is recorded on the ex-dividend date, except that certain dividends from foreign securities are recorded as soon as the information is available to the Fund. Interest income is recorded on the accrual basis and includes amortization of discounts and premiums on debt obligations when required for federal income tax purposes. Realized gains and losses from security transactions are recorded on an identified cost basis.
Awards, if any, from class action litigation related to securities owned may be recorded as a reduction of cost of those securities. If the applicable securities are no longer owned, the proceeds are recorded as realized gains.
Restricted Securities
Restricted securities are securities that may only be resold upon registration under federal securities laws or in transactions exempt from registration. In some cases, the issuer of restricted securities has agreed to register such securities for resale at the issuer's expense either upon demand by the Fund or in connection with another registered offering of the securities. Many restricted securities may be resold in the secondary market in transactions exempt from registration. Such restricted securities may be determined to be liquid under criteria established by the Board of Trustees. The Fund will not incur any registration costs upon such resale.
Use of Estimates
The preparation of financial statements in conformity with accounting principles generally accepted in the United States of America ("GAAP") requires management to make estimates and assumptions that affect the amounts reported in the financial statements and accompanying notes. Actual results may differ from those estimated.
Fund share valuation
Fund shares are sold and redeemed on a continuing basis at net asset value. Net asset value per share is determined daily as of the close of trading on the New York Stock Exchange ("the Exchange") on each day the Exchange is open for trading by dividing the total value of the Fund's investments and other assets, less liabilities, by the number of Fund shares outstanding.
Custody fees/Credits
Custody fees are reduced based on the Fund's cash balances maintained with the custodian. The Fund could have invested a portion of the assets utilized in connection with the expense offset arrangement in an income-producing asset if it had not entered in to such an agreement. The amount is disclosed as a reduction of total expenses in the Statement of Operations.
Federal income taxes
The Fund has complied with the provisions of the Internal Revenue Code available to regulated investment companies and, in the manner provided therein, distribute all its taxable income, as well as any net realized gain on sales of investments and foreign currency transactions reportable for federal income tax purposes. Accordingly, the Fund paid no federal income taxes and no federal income tax provision was required.
Foreign Capital Gains Taxes
Realized gains in certain countries may be subject to foreign taxes at the fund level, at rates ranging from 10%-15%. The Fund accrues for such foreign taxes on net realized and unrealized gains at the appropriate rate for each jurisdiction.
Distributions to shareholders
Distributions to shareholders are recorded on the ex-date.
18
Wanger International Small Cap 2007 Semiannual Report
Notes to Financial Statements, continued (Unaudited)
Indemnification
In the normal course of business, the Fund enters into contracts that contain a variety of representations and warranties which provide general indemnities. The Fund's maximum exposure under these arrangements is unknown, as this would involve future claims against the Fund. Also, under the Trust's organizational documents, the Trustees and Officers of the Trust are indemnified against certain liabilities that may arise out of their duties to the Trust. However, based on experience, the Fund expects the risk of loss due to these warranties and indemnities to be minimal.
3. Federal Tax Information
The tax character of distributions paid during the year ended December 31, 2006 was as follows:
| Distributions paid from: | |
| Ordinary Income | | $ | 6,400,167 | | |
Expired capital loss carryforwards, if any, are recorded as reduction of paid-in capital. Capital loss carryforwards of $7,293,526 were utilized during the year ended December 31, 2006.
The Fund adopted Financial Accounting Standards Board ("FASB") Interpretation No. 48, Accounting for Uncertainty in Income Taxes — an Interpretation of FASB Statement No. 109 ("FIN 48") effective June 29, 2007. FIN 48 requires management to determine whether a tax position of a Fund is more likely than not to be sustained upon examination by the applicable taxing authority, including resolution of any related appeals or litigation processes, based in the technical merits of the position. The tax benefit to be recognized is measured as the largest amount of benefit that is greater than fifty percent likely of being realized upon ultimate settlement. FIN 48 must be applied to all existing tax positions upon initial adoption and the cumulative effect, if any, is to be reported a s an adjustment to net assets. Management has evaluated the known implications of FIN 48 on its computation of net assets for the Fund. As a result of this evaluation, management believes that FIN 48 will not have any effect on the Fund's financial statements. However, management's conclusions regarding FIN 48 may be subject to review and adjustment at a later date based on factors including, but not limited to, further implementation guidance expected from the FASB, new tax laws, regulations, and administrative interpretations (including relevant court decisions).
4. Transactions With Affiliates
Columbia Wanger Asset Management, L.P. ("Columbia WAM"), a wholly owned subsidiary of Columbia Management Group, Inc. ("CM"), which in turn is an indirect wholly owned subsidiary of Bank of America Corporation ("BOA"), furnishes continuing investment supervision to the Fund and is responsible for the overall management of the Fund's business affairs.
Effective August 1, 2007, under the Fund's investment advisory agreement, fees are accrued daily based on the Fund's average daily net assets and paid monthly to Columbia WAM at the annual rates shown in the table below:
| Average Daily Net Assets | | Annual Fee Rate | |
| Up to $100 million | | | 1.10 | % | |
| $100 million to $250 million | | | 0.95 | % | |
| $250 million to $500 million | | | 0.90 | % | |
| $500 million to $1 billion | | | 0.80 | % | |
| $1 billion and over | | | 0.72 | % | |
For the period covered by this report as provided under the Fund's investment advisory agreement, fees were accrued daily based on the Fund's average daily net assets and paid monthly to Columbia WAM at the annual rates shown in the table below:
| Average Daily Net Assets | | Annual Fee Rate | |
| Up to $100 million | | | 1.15 | % | |
| $100 million to $250 million | | | 1.00 | % | |
| $250 million to $500 million | | | 0.95 | % | |
| $500 million and over | | | 0.85 | % | |
For the six months ended June 30, 2007, the Fund's annualized effective investment advisory fee rate was 0.90%.
Columbia WAM provides administrative services and receives an administration fee from the Fund. For the period covered by this report, administrative services were covered under the Fund's investment advisory agreement in place between the Fund and Columbia WAM. Effective August 1, 2007, under the Fund's new administration agreement, which provides the same types of administrative services that were provided under the investment advisory agreement, fees are accrued daily and paid monthly to Columbia WAM at the annual rate of 0.05%. Accordingly, the investment advisory fees were decreased by 0.05% across all asset levels effective August 1, 2007 as well.
Certain officers and trustees of the Trust are also officers of Columbia WAM. The Trust makes no direct payments to its officers and trustees who are affiliated with Columbia WAM. For the six months ended June 30, 2007, the Fund paid $37,321 to trustees not affiliated with Columbia WAM. The Board of Trustees appointed a Chief Compliance Officer to the Fund in accordance with federal securities regulations. The Fund will pay its pro-rata share of the expenses associated with the Office of the Chief Compliance Officer. These expenses are disclosed separately as "Chief compliance officer expenses" in the Statement of Operations.
Columbia Management Distributors, Inc. (the "Distributor"), a wholly owned subsidiary of BOA, serves as the principal underwriter of the Trust and receives no compensation for its services.
Columbia Management Services, Inc. (the "Transfer Agent"), a wholly owned subsidiary of BOA, provides shareholder services to the Fund and has subcontracted with Boston Financial Data Services ("BFDS") to serve as subtransfer agent. For such services, the Transfer Agent receives a fee, paid monthly, at the annual rate of $21.00 per open account. The Transfer Agent also receives a reimbursement for certain out-of-pocket expenses.
An affiliate may include any company in which a fund owns five percent or more of its outstanding voting shares. On June 30, 2007, the Fund held five percent or more of the outstanding voting securities of one or more companies. Details of investments in those affiliated companies are presented on page 13.
During the six months ended June 30, 2007, the Fund engaged in purchases and sales transactions with funds that have a common investment advisor (or affiliated investment advisers), common Directors/Trustees, and/or common Officers. These purchase and sale transactions complied with the provisions of Rule 17a-7 under the Investment Company Act of 1940 and were $0 and $93,597, respectively.
5. Borrowing Arrangements
The Trust participates in a $150,000,000 credit facility, which was entered into to facilitate portfolio liquidity. Interest is charged to each participating fund based on its borrowings at a rate per annum equal to the Federal Funds rate plus 0.50%. In addition, a commitment fee of 0.08% per annum is accrued and
19
Wanger International Small Cap 2007 Semiannual Report
Notes to Financial Statements, continued (Unaudited)
apportioned among the participating funds based on their pro-rata portion of the unutilized line of credit. The commitment fee is included in "Other expenses" in the Statement of Operations. No amounts were borrowed by the Fund under this facility during the six months ended June 30, 2007.
6. Fund Share Transactions
Proceeds and payments on Fund shares as shown in the Statement of Changes in Net Assets are in respect of the following numbers of shares:
| | | Six months ended
June 30, 2007 | | Year ended
December 31, 2006 | |
| Shares sold | | | 1,844,349 | | | | 6,658,470 | | |
Shares issued in reinvestment
of dividend distributions | | | 3,669,704 | | | | 192,371 | | |
| Less shares redeemed | | | (1,336,304 | ) | | | (3,192,246 | ) | |
| Net increase in shares outstanding | | | 4,177,749 | | | | 3,658,595 | | |
7. Investment Transactions
The aggregate cost of purchases and proceeds from sales other than short-term obligations for the six months ended June 30, 2007 were $289,921,370 and $279,885,505, respectively.
8. Legal Proceedings
Columbia WAM, Columbia Acorn Trust, another mutual fund family advised by Columbia WAM, and the trustees of Colombia Acorn Trust (collectively, the "Columbia defendants") are named as defendants in class and derivative complaints which have been consolidated in a Multi-District Action in the federal district court for the District of Maryland (the "MDL Action"). These lawsuits contend that defendants permitted certain investors to market time their trades in certain Columbia Acorn Funds. The MDL Action is ongoing. However, all claims against Columbia Acorn Trust and the independent trustees of Columbia Acorn Trust have been dismissed.
The Columbia Acorn Trust and Columbia WAM are also defendants in a class action lawsuit that alleges, in summary, that the Columbia Acorn Trust and Columbia WAM exposed shareholders of Columbia Acorn International Fund to trading by market timers by allegedly (a) failing to properly evaluate daily whether a significant event affecting the value of that Fund's securities had occurred after foreign markets had closed but before the calculation of the funds' net asset value (NAV"); (b) failing to implement the fund's portfolio valuation and share pricing policies and procedures; and (c) failing to know and implement applicable rules and regulations concerning the calculation of NAV (the "Fair Valuation Lawsuit"). The Seventh Circuit ruled that the plaintiffs' state law claims were preempted under federal law resulting in the dismissal of plaintiffs' complaint. Plaintiffs appealed the Seventh Circuit's ruling to the United States Su preme Court. The Supreme Court reversed the Seventh Circuit's ruling on jurisdictional grounds, and the case ultimately was remanded to the state court.
On March 21, 2005, a class action complaint was filed against the Columbia Acorn Trust and Columbia WAM seeking to rescind the Contingent Deferred Sales Charges assessed upon redemption of Class B shares of Columbia Acorn Funds due to the alleged market timing of the Columbia Acorn Funds. In addition to the rescission of sales charges, plaintiffs seek recovery of actual damages, attorneys' fees and costs. The case has been transferred to the Multi-District Action in the federal district court of Maryland.
On April 4, 2006, the plaintiffs and the Columbia defendants named in the MDL Action executed an agreement in principle intended to fully resolve all of the lawsuits consolidated in the MDL Action as well as the Fair Valuation Lawsuit.
The court entered a stay after the parties executed a settlement agreement. The settlement has not yet been finalized or approved by the court.
Columbia WAM, the Columbia Acorn Funds and the trustees of Columbia Acorn Trust are also defendants in a consolidated lawsuit filed in the federal district court of Massachusetts alleging that Columbia WAM used fund assets to make undisclosed payments to brokers as an incentive for the brokers to market the Columbia Acorn Funds over the other mutual funds to investors. The complaint alleges Columbia WAM and the Trustees of the Trust breached certain common laws duties and federal laws.
On November 30, 2005, the court dismissed all of the claims alleged against all of the parties in the consolidated complaint. The parties subsequently executed a formal settlement agreement resolving all claims in the litigation and the plaintiffs dismissed their appeal. The settlement requires court approval, which has not yet been obtained.
On or about January 11, 2005, a putative class action lawsuit was filed in federal district court in Massachusetts against the Columbia Acorn Trust and the trustees of Columbia Acorn Trust, along with the Columbia Advisers, the sub-administrator of the Wanger Advisors Funds and the Columbia Acorn Funds. The plaintiffs allege that the defendants failed to submit Proof of Claims in connection with settlements of securities class action lawsuits filed against companies in which the Columbia Acorn Funds held positions. The complaints seeks compensatory and punitive damages, and the disgorgement of all fees paid to the Columbia Advisers.
Plaintiffs have voluntarily dismissed the Columbia Acorn Trust and its independent trustees.
The Columbia Acorn Trust and Columbia WAM intend to defend these suits vigorously.
As a result of these matters or any adverse publicity or other developments resulting from them, there may be increased redemptions or reduced sales of Fund shares, which could increase transaction costs or operating expenses, or have other adverse consequences for the Funds.
However, based on currently available information, the Columbia Acorn Trust believes that the likelihood that these lawsuits will have a material adverse impact on any fund is remote, and Columbia WAM believes that the lawsuits are not likely to materially affect its ability to provide investment management services to the Funds.
20
Wanger International Small Cap 2007 Semiannual Report
[Excerpt from:]
Wanger Advisors Trust
Management Fee Evaluation of the Senior Officer
Prepared Pursuant to the New York Attorney General's
Assurance of Discontinuance
June 2007
21
Wanger International Small Cap 2007 Semiannual Report
Introduction
The New York Attorney General's Assurance of Discontinuance ("Order") entered into by Columbia Management Advisors, Inc. ("CMAI") and Columbia Management Distributors, Inc., ("CMDI" and collectively with "CMAI," "CMG") in February 2005, allows CMAI to manage or advise a mutual fund only if the trustees of the fund appoint a "Senior Officer" to perform specified duties and responsibilities. One of these responsibilities includes "managing the process by which proposed management fees (including but not limited to, advisory fees) to be charged the [Funds] are negotiated so that they are negotiated in a manner which is at arms' length and reasonable and consistent with this Assurance of Discontinuance."
This is the first year that the Columbia Acorn Trust and Wanger Advisors Trust (collectively, the "Trusts") and each series thereof (the "Acorn Funds," "WAT Funds" or collectively, the "Funds") have been overseen by the same Board of Trustees ("Board"). The Order provides that this Board must determine the reasonableness of proposed "management fees" by using either an annual competitive bidding process supervised by the Senior Officer or Independent Fee Consultant, or by obtaining "an annual independent written evaluation prepared by or under the direction of the Senior Officer or the Independent Fee Consultant."
"Management fees" are only part of the costs and expenses paid by mutual fund shareholders. The expenses can vary depending upon the class of shares held but usually include: (1) investment management or advisory fees to compensate analysts and portfolio managers for stock research and portfolio management, as well as the cost of operating a trading desk; (2) administrative expenses incurred to prepare registration statements and tax returns, calculate the Funds' net asset values, maintain effective compliance procedures and perform recordkeeping services; (3) transfer agency costs for establishing accounts, accepting and disbursing funds, as well as overseeing trading in Fund shares; (4) custodial expenses incurred to hold the securities purchased by the Funds; and (5) distribution expenses, including commissions paid to brokers that sell the Fund shares to investors.
Columbia Wanger Asset Management, L.P. ("CWAM"), the adviser to the Funds, has proposed that with respect to the Acorn Funds, the Columbia Acorn Trust continue the existing separate agreements governing the first two categories listed above: an advisory agreement governing portfolio management, and an administration agreement governing certain administration and clerical services. Together the fees paid under these two agreements are referred to as "management fees." CWAM proposes that the WAT Funds continue the existing single agreement governing both investment advisory and administrative services. A single management fee would cover both services. Other fund expenses are governed by separate agreements, in particular agreements with two CWAM affiliates: CMDI, the broker-dealer that underwrites and distributes the Funds' shares, and Columbia Management Services, Inc. ("CMSI"), the Funds' transfer agent. In conformity with the terms of the Order, this evaluation, therefore, addresses only the advisory and administrative contracts, and does not extend to the other agreements.
According to the Order, the Senior Officer's evaluation must consider at least the following:
(1) Management fees (including components thereof) charged to institutional and other clients of CWAM for like services;
(2) Management fees (including any components thereof) charged by other mutual fund companies for like services;
(3) Costs to CWAM and its affiliates of supplying services pursuant to the management fee agreements, excluding any intra-corporate profit;
(4) Profit margins of CWAM and its affiliates from supplying such services;
(5) Possible economies of scale as the Funds grow larger; and
(6) The nature and quality of CWAM's services, including the performance of each Fund.
In 2004, the Boards of the two Trusts, then separate groups, each appointed me Senior Officer under the Order. They also determined not to pursue a competitive bidding process and instead, charged me with the responsibility of evaluating the Funds' proposed advisory and administrative fee contracts with CWAM in conformity with the requirements of the Order. This Report is an annual evaluation required under the Order. In discharging their responsibilities, the independent Trustees have also consulted independent, outside counsel.
2006 Evaluation
This is the third annual evaluation prepared in connection with the Order. This evaluation follows the same structure as the earlier studies. Some areas are given more emphasis here, while others are given less. Still, the fundamental information gathered for this evaluation is largely the same as past years.
Process and Independence
The objectives of the Order are to insure the independent evaluation of the advisory fees paid by the Funds as well as to insure that all relevant factors are considered. In my view, this contract renewal process has been conducted at arms-length and with independence in gathering, considering and evaluating all relevant data. At the outset of the process, the Trustees sought and obtained from CWAM and CMG a comprehensive compilation of data regarding Fund performance and expenses, adviser profitability, and other information. The Board evaluated this information thoroughly and also explored CWAM's potential capacity restraints. Performance and expense data was obtained from both Morningstar and Lipper, the leading consultants in this area. The rankings prepared by Morningstar and Lipper were independent and not influenced by the adviser. CWAM itself identified what it considers competing funds, and the Trustees considered that data as well.
22
Wanger International Small Cap 2007 Semiannual Report
In the course of its work, the Contract Committee gave careful consideration to the conclusions and recommendations contained in last year's evaluation. The Contract Committee gave particular emphasis to the issue of whether economies of scale were appropriately reflected in the Funds' fee schedules. Last year, the Board sought and CWAM agreed to additional breakpoints for two Funds, Acorn USA and Acorn Select. These breakpoints are above current asset levels, but clearly operate to share economies of scale with Fund shareholders. This year, at the Board's request, CWAM has proposed additional breakpoints for the WAT Funds, and Acorn International Select. This proposal is under consideration by the Board.
My evaluation of the advisory contract was shaped, as it was last year, by my experience as Chief Compliance Officer of the Trusts ("CCO"). As CCO, I report solely to the Board and have no reporting obligation to or employment relationship with CMG or its affiliates, except for administrative purposes. I have commented on compliance matters in evaluating the quality of service provided by CWAM.
This Report, its supporting materials and the data contained in other materials submitted to the Contract Committee of the Board, in my view, provide a thorough factual basis upon which the Board, in consultation with independent counsel as it deems appropriate, may conduct management fee negotiations that are in the best interests of the Funds' shareholders.
The Fee Reductions Mandated under the Order
Under the terms of the Order, CMG agreed to secure certain management fee reductions for the mutual funds advised by its affiliate investment advisers. In some instances, breakpoints were also established. Although neither CWAM nor the Trusts was a party to the Order, CWAM offered and the Board accepted certain advisory fee reductions during 2005. By the terms of the Order, these fees may not be increased before November 30, 2009. I have used these advisory fee levels—as modified last year to add certain breakpoints for Acorn USA and Acorn Select—in this evaluation because they are the fees in the current agreements that CWAM proposes should be continued. Hence, these fee levels are the starting point of an evaluation.
Conclusions
My review of the data and other material above leads to the following conclusions with respect to the factors identified in the Order.
1. Performance. The domestic Funds generally have achieved outstanding performance. The Acorn Fund, Acorn USA, Acorn Select, Wanger Select and Wanger US Smaller Companies all rank very favorably against their peers over the past five years. Although Acorn USA and Wanger US Smaller Companies had a difficult year in 2006, these returns are not characteristic of these funds, both of which have shown improved performance during the first quarter of 2007. The international Funds have relatively weaker long term records than the domestic funds, but recently have improved significantly and their one year rankings are excellent. Overall then, performance of the Funds is excellent.
2. Management Fees relative to Peers. The management fee rankings for several of the Acorn Funds are generally more favorable to shareholders than those of their peer group funds. Management fees do, however, vary by Fund. Acorn Fund is the least expensive and the Acorn USA the most expensive. Acorn Fund is very competitive, while Acorn USA and Acorn Select were ranked by both Lipper and Morningstar at or below the median, and therefore impose higher fees than do the majority of their competitors. The WAT Funds also lag their competitors and impose higher fees than their peers.
3. Administrative Fees. The Acorn Funds' administrative fee, which is uniform across all Funds, is at a level comparable to or less expensive than the fees imposed by their peers, provides for appropriate services to Funds, and affords breakpoints that lower the fee as assets increase. The WAT Funds pay a single fee for advisory and administrative services and hence do not benefit from administrative fee breakpoints, nor is it possible to assess their administrative costs relative to competitors.
4. Management Fees relative to Institutional and Other Mutual Fund Accounts. CWAM's focus is on its mutual funds. It does not actively seek to manage separate or institutional accounts. The few institutional accounts it does manage vary in rate structures. Some pay advisory fees commensurate with or higher than the Acorn and WAT Funds. In a few instances, however, institutional accounts pay lower advisory fees than do the Acorn Funds. One particular institutional account is significant in size and has been under CWAM's management for over 25 years.
5. Costs to CWAM and its Affiliates. CWAM's direct costs do not appear excessive. Overhead and indirect costs allocated to CWAM by its parent organizations, however, are significant and increasing. CWAM's affiliates report operating losses and therefore do not appear to profit from CWAM's advisory agreement with the Funds.
6. Profit Margins. CWAM's firm-wide, pre-marketing expense profit margins are at the top of the industry, though these comparisons are hampered by limited industry data. High profit margins are not unexpected for firms that manage large, successful funds and have provided outstanding investment performance for investors.
7. Economies of Scale. Economies of scale do exist at CWAM and will expand as the assets of the Funds get larger. They are, however, only partially reflected in the management fee schedule for the Acorn Funds and not reflected at all in two of the four WAT Funds. Breakpoints above current asset levels have, however, been added to the more expensive funds, Acorn Select and Acorn USA. Nonetheless, if Fund assets continue to grow, under the Funds' current fee schedules, all Fund shareholders might not benefit in a manner generally commensurate with CWAM's increased profits. Management has proposed additional breakpoints for some of the Funds that, if implement, would result in greater sharing of economies of scale.
23
Wanger International Small Cap 2007 Semiannual Report
8. Nature and Quality of Services. This category includes a variety of considerations that are difficult to quantify, yet can have a significant bearing on the performance of the Acorn Funds. Several areas merit comment.
a. Capacity. The Funds have continued to grow, posing ever greater challenges in deploying assets effectively. While trends here merit continued monitoring, CWAM appears to be managing assets effectively.
b. Compliance. CWAM has a reasonably designed compliance program that protects shareholders.
c. Administrative Services. The Funds benefit from a variety of administrative services that are performed by CWAM and CMAI.
9. Process. In my opinion, the process of negotiating an advisory contract for the Funds has been conducted thoroughly and at arms' length. Further, the Trustees have sufficient information to evaluate management's proposal, and negotiate contract terms that are in the best interests of fund shareholders.
Recommendations
I believe the Trustees should:
1. Continue to consider additional ways to restructure the advisory fee beyond the current breakpoint schedule to reflect more fully economies of scale.
2. Consider unbundling of the advisory and administrative fees paid by the WAT Funds.
3. Review the disparity in management fee levels between the Acorn International Fund and its related annuity-based fund, WAT International Small Cap Fund.
4. Continue to monitor CWAM's capacity limitations to insure that the Funds' expanding assets do not impair investment performance.
Robert P. Scales
Senior Vice President,
Chief Legal Officer
and General Counsel
June 18, 2007
24
Wanger International Small Cap 2007 Semiannual Report
This page intentionally left blank.
25
Wanger International Small Cap 2007 Semiannual Report
This page intentionally left blank.
26
Wanger International Small Cap 2007 Semiannual Report

Wanger Advisors Trust
Trustees
Robert E. Nason
Chairman
Allan B. Muchin
Vice Chairman
Laura M. Born
Maureen M. Culhane
Margaret Eisen
Jerome Kahn, Jr.
Steven N. Kaplan
David C. Kleinman
Charles P. McQuaid
James A. Star
Ralph Wanger
Patricia H. Werhane
John A. Wing
Officers
Charles P. McQuaid
President
Ben Andrews
Vice President
Michael G. Clarke
Assistant Treasurer
Jeffrey R. Coleman
Assistant Treasurer
J. Kevin Connaughton
Assistant Treasurer
P. Zachary Egan
Vice President
Peter T. Fariel
Assistant Secretary
John M. Kunka
Assistant Treasurer
Joseph C. LaPalm
Vice President
Bruce H. Lauer
Vice President, Treasurer and Secretary
Louis J. Mendes III
Vice President
Robert A. Mohn
Vice President
Christopher J. Olson
Vice President
Linda K. Roth-Wiszowaty
Assistant Secretary
Robert P. Scales
Senior Vice President, Chief Compliance Officer and General Counsel
Transfer Agent,
Dividend Disbursing Agent
Columbia Management Services, Inc.
P.O. Box 8081
Boston, Massachusetts
02266-8081
Distributor
Columbia Management Distributors, Inc.
One Financial Center
Boston, Massachusetts
02111-2621
Investment Adviser
Columbia Wanger Asset Management, L.P.
227 West Monroe Street, Suite 3000
Chicago, Illinois 60606
1-888-4-WANGER
(1-888-492-6437)
Legal Counsel
Bell, Boyd & Lloyd LLP
Chicago, Illinois
This report, including the schedules of investments and financial statements, is submitted for the general information of the shareholders of the Wanger Advisors Trust.
A description of the Fund's proxy voting policies and procedures and a copy of the Fund's voting record for the most recent 12-month period ended June 30 are available (i) on Columbia Management's website at www.columbiafunds.com; (ii) on the Securities and Exchange Commission's website at www.sec.gov, and (iii) without charge, upon request, by calling 888-492-6437.
The Fund files a complete schedule of portfolio holdings with the SEC for the first and third quarters of each fiscal year on Form N-Q. The Fund's Form N-Q is available on the SEC's website at www.sec.gov and may be reviewed and copied at the SEC's Public Reference Room in Washington, D.C. Information on the operation of the Pubic Reference Room may be obtained by calling 800-SEC-0330.
27
Wanger Advisors Trust
SHC-44/132916-0607 08/07 07/42685
Wanger Select
2007 Semiannual Report


Wanger Select
2007 Semiannual Report
Table of Contents
| | 1 | | | Understanding Your Expenses | |
|
| | 2 | | | Doomsayers vs. Doomslayers | |
|
| | 5 | | | Performance Review | |
|
| | 7 | | | Statement of Investments | |
|
| | 10 | | | Statement of Assets and Liabilities | |
|
| | 10 | | | Statement of Operations | |
|
| | 11 | | | Statement of Changes in Net Assets | |
|
| | 12 | | | Financial Highlights | |
|
| | 13 | | | Notes to Financial Statements | |
|
| | 16 | | | Management Fee Evaluation of the Senior Officer | |
|
Columbia Wanger Asset Management, L.P. ("Columbia WAM") is one of the leading global small- and mid-cap equity managers in the United States with more than 37 years of small- and mid-cap investment experience. As of June 30, 2007, Columbia WAM manages more than $38.2 billion in assets and is the investment adviser to Wanger U.S. Smaller Companies, Wanger International Small Cap, Wanger Select, Wanger International Select and the Columbia Acorn Family of Funds. Columbia Management Group, LLC ("Columbia Management") is the investment management division of Bank of America Corporation. Columbia Management entities furnish investment management services and products for institutional and individual investors. Columbia Funds are distributed by Columbia Management Distributors, Inc., member of FINRA, SIPC, part of Columbia Management and an affiliate of Bank of America Corporation. Columbia WAM is a SEC-registered investment adviser and indirect, wholly owned subsidiary of Bank of America Corporation.
Please consider the investment objectives, risks, charges and expenses for the Fund carefully before investing. Contact 1-888-4-WANGER for a prospectus, which contains this and other important information about the Fund. You should read it carefully before you invest.
The views expressed in "Doomsayers vs. Doomslayers" and in the Performance Review reflect the current views of the respective parties. These views are not guarantees of future performance and involve certain risks, uncertainties and assumptions that are difficult to predict so actual outcomes and results may differ significantly from the views expressed. These views are subject to change at any time based upon economic, market or other conditions and the respective parties disclaim any responsibility to update such views. These views may not be relied on as investment advice and, because investment decisions for a Columbia Fund are based on numerous factors, may not be relied on as an indication of trading intent on behalf of any particular Columbia Fund. References to specific company securities should not be construed as a recommendation or investment advice.
Wanger Select 2007 Semiannual Report
Understanding Your Expenses
As a Fund shareholder, you incur two types of costs. There are transaction costs, which generally include sales charges on purchases and may include redemption or exchange fees. There are also ongoing costs, which generally include investment advisory and other Fund expenses. The information on this page is intended to help you understand your ongoing costs of investing in the Fund and to compare these costs with the ongoing costs of investing in other mutual funds.
Analyzing your Fund's expenses
To illustrate these ongoing costs, we have provided an example and calculated the expenses paid by investors in the Fund during the reporting period. The information in the following table is based on an initial hypothetical investment of $1,000.00, which is invested at the beginning of the reporting period and held for the entire period. Expense information is calculated two ways and each method provides you with different information. The amount listed in the "actual" column is calculated using actual operating expenses and total return for the Fund. The amount listed in the "hypothetical" column assumes that the return each year is 5% before expenses and then applies the Fund's actual expense ratio for the period to the hypothetical return. You should not use the hypothetical account values and expenses to estimate either your actual account balance at the end of the period or the expenses you paid during the reporting period . See the "Compare with other funds" information for details on using the hypothetical data.
Estimating your actual expenses
To estimate the expenses that you actually paid over the period, first you will need your account balance at the end of the period.
1. Divide your ending account balance by $1,000.00. For example, if an account balance was $8,600.00 at the end of the period, the result would be 8.6.
2. In the section of the table below titled "Expenses paid during the period," you will find a dollar amount in the column labeled "Actual." Multiply this amount by the result from step 1. Your answer is an estimate of the expenses you paid on your account during the period.
January 1, 2007 – June 30, 2007
| | | Account value at the
beginning of the period ($) | | Account value at the
end of the period ($) | | Expenses paid during
period ($) | | Fund's annualized
expense ratio (%)* | |
| | | Actual | | Hypothetical | | Actual | | Hypothetical | | Actual | | Hypothetical | | Actual | |
| Wanger Select | | | 1,000.00 | | | | 1,000.00 | | | | 1,164.39 | | | | 1,020.33 | | | | 4.83 | | | | 4.51 | | | | 0.90 | | |
*For the six months ended June 30, 2007.
Expenses paid during the period are equal to the Fund's annualized expense ratio, multiplied by the average account value over the period, then multiplied by the number of days in the Fund's most recent fiscal half-year and divided by 365.
It is important to note that the expense amounts shown in the table are meant to highlight only ongoing costs of investing in the Fund. As a shareholder of the Fund, you do not incur any transaction costs, such as sales charges, redemption or exchange fees. Expenses paid during the period do not include any insurance charges imposed by your insurance company's separate account. The hypothetical example provided is useful in comparing ongoing costs only and will not help you determine the relative total costs of owning different funds whose shareholders may incur transaction costs.
Compare with other funds
Since all mutual funds are required to include the same hypothetical calculations about expenses in shareholder reports, you can use this information to compare the ongoing cost of investing in the Fund with other funds. To do so, compare the 5% hypothetical example with the 5% hypothetical examples of other funds. As you compare hypothetical examples of other funds, it is important to note that hypothetical examples are meant to highlight the ongoing cost of investing in a fund and do not reflect any transaction costs, such as sales charges, redemption fees or exchange fees that may be incurred by shareholders of other funds. Expenses paid during the period do not include any insurance charges imposed by your insurance company's separate accounts.
1
Wanger Select 2007 Semiannual Report

Doomsayers vs. Doomslayers
Bad news seems to attract more attention than good news. Tabloid newspapers and the evening news thrive on sensational stories. "If it bleeds, it leads!" the media says, so disasters and doomsayers make headlines while good news is ignored.
Global warming is the current source of much concern and, therefore, much media and political focus. However, declarations of impending disaster for the planet and its inhabitants aren't new.
Doomsayers – Creating Concerns
In 1798, Thomas Malthus wrote An Essay on the Principal of Population.1 He noted that unchecked populations grow geometrically. For illustration, he modeled a population doubling every 25 years. In contrast, he postulated food supplies growing arithmetically. In 1998 therefore, the calculated population would be 256-times its 1798 level while food production would be nine times as large as in 1798. The poor would be "reduced to severe distress" and the actual population increase would revolve around the relatively slow increase in food production.
Moving forward 170 years, Paul Ehrlich's 1968 book, The Population Bomb,2 predicted imminent disaster and became the best-selling environmental tract of all time. He wrote, "The battle to feed all of humanity is over. In the 1970s and 1980s hundreds of millions of people will starve to death in spite of any crash programs embarked upon now." He stated that the world's population roughly doubled every thousand years from about 8000 BC to 1650, then doubled again in 200 years and again in 80 years, and appeared to be doubling over 35 years at the time of the book's publication.
Ehrlich's book also addressed pollution. "In Los Angeles and similar cities the human population has exceeded the carrying capacity of the environment—at least with respect to the ability of the atmosphere to remove waste." He stated, "It seems unlikely that much improvement can be expected...in air pollution until a major shift in the economy takes place." He recommended a shift away from gasoline-powered cars. To his credit, Ehrlich did mention that successful pollution control was possible.
Limits to Growth3 was first published in 1972, and became another best-selling doomsday book. It added resource depletion as a concern in addition to population growth and pollution. Using sophisticated computer models introduced by MIT professor Jay Forrester, the authors predicted long-term disaster: "If present growth trends...continue unchanged, the limits to growth on this planet will be reached sometime within the next one hundred years." (It's better to make a prediction that can be proven right but not wrong within your lifetime.) "The most probable result will be a rather sudden and uncontrollable decline in both population and industrial capacity." The authors recognized the need for more study, but "end(ed) on a note of urgency."
Adding another worry, the April 28, 1975 issue of Newsweek included an article titled, "The Cooling World."4 It quoted studies showing a temperature drop from 1945 to 1968 and then a sudden large increase in snow cover in the northern hemisphere. The article stated, "There are ominous signs that the earth's weather patterns have begun to change dramatically, and that these changes may portend a drastic decline in food production—with serious political implications for just about every nation on Earth."
The Newsweek story went on to report, "Meteorologists disagree about the cause and extent of the trend...but are almost unanimous in the view that the trend will reduce agricultural productivity for the rest of the century." The underlying prediction: "Resulting famines could be catastrophic."
In 2004, three of the original four Limits to Growth authors published Limits to Growth, The 30-Year Update.5 The authors offered a somewhat more positive tone but predicted that growth would not continue much past the year 2010.
The authors stated that the world population increase had slowed to a 1.2% growth rate, or a 60 year doubling period. That represents 75 million persons per year, or the equivalent of adding the population of "six Calcuttas." They did concede that air and water pollution has dropped in many developed countries, and agreed that the ozone hole over Antarctica will disappear by mid-century.
The authors also admitted that more hydrocarbon deposits were proven than used in the previous 30 years, and despite increased demand, the ratios of reserves to production increased. Consequently, while in 1970 world oil reserves were to be depleted by 2002, the update suggested depletion by 2037. Natural gas depletion was deferred from 2009 to 2065. Data on critical industrial metals were also updated. Assuming increases in consumption, depletion of copper and zinc reserves were postponed at least 20 years. The authors also noted that huge potential additional supplies were not yet in reserve statistics.
But the update also reiterated ominous food scarcity themes and said per-capita grain production peaked in the mid-80s. There is a widespread persistence of hunger, as "the number of hungry people has remained constant as the population has grown." The authors continued to believe that improved technology would not offset the effects of exponential growth.
As I mentioned, today's environmental doomsday headline grabber is global
2
Wanger Select 2007 Semiannual Report
warming. In 2006 an Oscar-winning documentary called, "An Inconvenient Truth" highlighted the potential consequences of higher temperatures, predicting rising ocean levels, animal species extinctions, and food and water shortages. Its creator suggested how people could cut carbon dioxide emissions in order to reduce the problem.
Doomslayers – Presenting the Facts
Are conditions bad and likely to get worse? Julian Simon, a University of Maryland business school professor, became obsessed with data about population growth and prosperity. He found Ehrlich's books and comments to be "a juggernaut of environmentalist hysteria."6 He noted that virtually all data series indicated that the human condition had improved. In 1980, he became the first self-proclaimed doomslayer, and published a fact-filled, footnoted article in Science magazine: "Resources, Population, Environment: An Oversupply of False Bad News."7 Simon went so far as to challenge Ehrlich's theory that overpopulation and depletion would cause prices of raw materials to rise. Ehrlich accepted a 10-year wager with Simon and the battle lines were drawn. Between 1980 and 1990, the world's population saw its largest 10-year increase ever, but materials prices fell. In October 1990, Simon accepted a check from Ehrlich!
Determined to report the facts, Simon went on to publish five books showing data that the doomsayers were wrong. He died in 1998 leaving behind manuscripts that resulted in a sixth book completed in 2000 by Stephen Moore: It's Getting Better all the Time, 100 Greatest Trends of the Last 100 Years.8 In his introduction, Moore wrote, "The central premise of this book is that there has been more improvement in the human condition in the past 100 years than in all of the previous centuries..." Here is a sampling of the book's facts that support its title:
• Since data collection began, life expectancies rose, infant mortality fell, some diseases were eradicated while mortality from others dropped. Job-related fatalities fell since data became available in the 1930s, long before OSHA's creation.
• Per-capita income and wealth rose despite shorter work weeks. Educational attainment jumped. Income disparities by gender and race receded. Most low income people acquired items previously considered "luxuries" and many achieved mid- or high-income status.
• Emissions per unit of GDP fell since the 1930s (prior to regulations) and absolute air quality improved since the data series started in the 1970s. The quality of surface water rose. Forests in the USA have increased in size and density since at least the 1950s. Energy prices relative to wages have plummeted since 1900.
In what could be considered an addendum to Simon's work, the Cato Institute earlier this year published The Improving State of the World.9 Its data also refutes most of what the doomsayers have said:
• Worldwide food supplies per capita increased 24% from 1961 to 2002. "Between 1969-71 and 2000-02, increases in food supplies reduced chronic undernourishment in developing countries from 956 million to 815 million (or from 37 to 17 percent) despite an 83% growth in their population."
• The environment in the developed world is notably cleaner than it was 40 years ago. Air and water pollution is down. Developing countries are increasingly addressing pollution and are making progress in many areas.
• Improved developing world health, wealth, food supplies, and the start of improved environments, are due to globalization. Trade increases wealth and disseminates technology.
• The long-term price trend of virtually every commodity that is used today has been downward over the past two centuries, in terms of both inflation-adjusted dollars and also in terms of minutes worked for purchase.
Investment Discipline – Embracing the Facts
Doomsayers sometimes sell a lot of books, magazines or movies, which in turn generate discussion and possibly action. Potential disasters such as stratospheric ozone depletion can be averted as a result. But often, doomsayers' predictions have turned out to be wrong and then largely forgotten. Mankind has a tremendous ability to solve problems, especially via democratic and capitalistic systems.
While doomsayers often are proven wrong, researching to find the elements of truth behind their claims can provide investment opportunities. When problems are real and are about to be addressed, there is usually money to be made, or lost.
Though the prices of basic materials have indeed fallen over the long run, our international portfolio managers detected an up cycle of accelerating demand and strong prices. We hired an analyst, Fritz Kaegi, to specialize in that group. He confirmed that companies had underinvested in several areas, and believed prices and profits could stay strong for a while. We've discussed some resulting investments in fund shareholder reports.
The world has not run out of oil; predictions of $100 oil proved to be wrong, or at least decades too early. Energy stocks have been
3
Wanger Select 2007 Semiannual Report
cyclical for a long time. Our funds now have significant investments in energy as we believe this up cycle will persist. Our energy analyst, Bill Doyle, is especially positive on oil service companies.
Doomsayers will come and go; some will raise valid concerns, which, if history repeats itself, will be successfully addressed. We expect to continue to sort through the rhetoric, determine the facts, and work to invest appropriately.


Charles P. McQuaid
President and Chief Investment Officer
Columbia Wanger Asset Management, L.P.
1 Source: Wired.com, "The Doomslayer" by Ed Regis, February 1997.
2 Ehrlich, Paul, The Population Bomb (Buccaneer Books, Inc, 1968, 1971)
3 Meadows, Donella H; Meadows, Dennis L; Randers, Jorgen; Behrens III, William W, The Limits to Growth (New York: Universe Books, 1972)
4 Reprinted in the The American Spectator, May/June 2002. Originally printed in Newsweek, "The Cooling World," reported by Peter Gwynne, April 28, 1975.
5 Meadows, Donella; Randers, Jorgen; Meadows, Dennis, Limits to Growth – The 30-Year Update, (Vermont: Chelsea Green Publishing Company, 2004)
6 Source: Wired.com, "The Doomslayer" by Ed Regis, February 1997.
7 Science, 27 June 1980, Vol. 208, no. 4451.
8 Moore, Stephen; Simon, Julian, It's Getting Better All the Time: 100 Greatest Trends of the Last 100 Years (Washington, DC: Cato Institute, 2000). Bullet pointed data applies to the United States.
9 Goklany, Indur M, The Improving State of the World: Why We're Living Longer, Healthier, More Comfortable Lives on a Cleaner Planet (Washington DC: Cato Institute, 2007)
Author's Note:
The author considers himself to be a disciple of Julian Simon. However, the author also has recycled and conserved energy for years. He has replaced numerous incandescent light bulbs with compact fluorescents. His wife happily drives a hybrid vehicle. And he has not emitted tons of carbon dioxide by flying in a private jet to Davos in order to tell other people to conserve.
4
Wanger Select 2007 Semiannual Report

Performance Review Wanger Select

Ben Andrews
Portfolio Manager
Performance data quoted represents past performance and current performance may be lower or higher. Past performance is no guarantee of future results. The investment return and principal value of an investment in the Fund will fluctuate so that shares, when redeemed, may be worth more or less than the original cost. For daily and month-end performance updates, please call 1-888-4-WANGER.
Wanger Select gained 16.44% during the six-month period outperforming its benchmark, the S&P MidCap 400 Index, which returned 11.98%. The Fund also topped the S&P 500's return of 6.96% for the six months.
The top three drivers of Fund performance were ITT Educational Services, Potash Corporation of Saskatchewan and Liberty Global. All three companies displayed strong fundamentals and their combined return accounted for 6.5% of the Fund's 16.44% return year to date.
We made a few structural adjustments to Wanger Select during the period. We increased the number of stocks that we are allowed to hold in the Fund. Wanger Select can now invest in generally 30 to 60 companies (currently we hold 39), an increase from the previous 20 to 40. We still plan on running a select portfolio. Since starting the Fund in 1999, we have had over 40% of the Fund's assets in its top 10 names. We also slightly increased the percentage of the Fund that we can invest in foreign companies. Currently we have approximately 11% of the Fund's assets invested in international stocks, mostly in the raw materials sector.
We added four stocks to the portfolio during the period: Chico's FAS, American Commercial Lines, JB Hunt Transportation Services and Tetra Technologies. We sold out of Pride International, Nuveen Investments and Weight Watchers.
We sold Nuveen one month before it announced it was selling itself to a private equity firm. Our crystal ball was smudged and we did not see the take out coming, but should we have? We sold Nuveen because we were concerned with the direction it was taking with its asset management division. We believe Nuveen was purchased at a much higher price than we sold it at because money has been abundant and private equity can leverage cheap money and pay lofty multiples while infusing little equity. The Nuveen sale prompted me to go back and look at our other sales since I became portfolio manager of the Fund in early 2004. We exited 22 positions and had another three companies taken over for cash during the last three years. Looking back at the reasons we had for selling the positions, we were often right yet many of these stocks trade at higher prices. This exercise reminded us how easily mistakes are forgiven in bull markets; companie s can miss earnings estimates and growth can come in slower than Wall Street originally thought yet share prices can still go up. This is true for portfolio managers as well; most of us are putting up large returns during this period but will we keep these returns when the economy goes slack? When the market does cool, we believe owning the right stocks will be very important and having more structural flexibility should help the Fund preserve capital. Thank you for your continued support of Wanger Select.
Risks include stock market fluctuations due to economic and business developments. The Fund also has potentially greater price volatility due to the fund's concentration in a limited number of stocks of mid-size companies. The Fund is a non-diversified fund and may, therefore, have a greater risk of loss from a few issuers than a similar fund that invests more broadly. The Fund may not operate as a non-diversified fund at all times. International investments involve greater potential risks, including less regulation, currency fluctuations, economic instability and political developments.
Fund's Positions in Mentioned Holdings
as of 6/30/07
| ITT Educational Services | | | 4.8 | % | |
| Liberty Global | | | 4.5 | % | |
| Potash Corporation of Saskatchewan | | | 3.5 | % | |
| Tetra Technologies | | | 1.8 | % | |
| American Commercial Lines | | | 1.7 | % | |
| Chico's FAS | | | 1.5 | % | |
| JB Hunt Transportation Services | | | 0.9 | % | |
| Nuveen Investments | | | 0.0 | % | |
| Weight Watchers | | | 0.0 | % | |
| Pride International | | | 0.0 | % | |
Portfolio holdings are subject to change periodically and may not be representative of current characteristics and holdings.
5
Wanger Select 2007 Semiannual Report
Growth of a $10,000 Investment in
Wanger Select
Total return for each period,
February 1, 1999 (inception date) through June 30, 2007

This graph compares the results of $10,000 invested in Wanger Select on February 1, 1999 (the date the Fund began operations) through June 30, 2007, to the S&P MidCap 400 Index, with dividends and capital gains reinvested. Performance results reflect any waivers or reimbursements of Fund expenses by the Adviser or any of its affiliates. Absent these waivers or reimbursement arrangements, performance results would have been lower. Performance shown here is past performance, which cannot guarantee future results. Current performance may be higher or lower. The investment return and principal value of an investment in the Fund will fluctuate so that Fund shares, when redeemed, may be worth more or less than their original cost. Performance changes over time. Current returns for the Fund may be different than that shown. For daily and month-end performance updates, please contact us at 1-888-4-WANGER.
Results to June 30, 2007
| | | 2nd quarter | | Year to date | | 1 year | |
| Wanger Select | | | 9.05 | % | | | 16.44 | % | | | 32.10 | % | |
| S&P MidCap 400 | | | 5.84 | | | | 11.98 | | | | 18.51 | | |
| S&P 500 | | | 6.28 | | | | 6.96 | | | | 20.59 | | |
NAV as of 6/30/07: $29.89
Performance numbers reflect all Fund expenses but do not include any insurance charge imposed by your insurance company's separate accounts. If performance included the effect of these additional charges, it would be lower.
Wanger Select annual operating expense ratio is 0.94%. Annual operating expense ratio is as stated in the Fund's prospectus that is current as of the date of this report. Differences in expense ratios disclosed elsewhere in this report may result from including fee waivers and reimbursements as well as different time periods used in calculating the ratios.
The graph and table do not reflect taxes that a shareholder would pay on Fund distributions or the sale of Fund shares.
The S&P MidCap 400 is an unmanaged, market value-weighted index of 400 mid-cap U.S. companies. The S&P 500 is a broad, market-weighted average of 500 widely-held large capitalization U.S. stocks. All indexes are unmanaged and include reinvested dividends. It is not possible to invest directly in an index.
Portfolio characteristics and holdings are subject to change periodically and may not be representative of current characteristics and holdings.
Top 5 Industries
As a % of net assets, as of 6/30/07
| Consumer Goods & Services | | | 26.5 | % | |
| Information Group | | | 24.9 | | |
| Energy & Minerals | | | 14.3 | | |
| Finance | | | 12.1 | | |
| Industrial Goods & Services | | | 9.6 | | |
Top 10 Holdings
As a % of net assets, as of 6/30/07
1. Uranium One (South Africa) (Previously UrAsia Energy)
Uranium Mines in South Africa, Kazakhstan, Australia & the U.S. | | | 6.4 | % | |
2. ITT Educational Services
Post-secondary Degree Programs | | | 4.8 | | |
3. Tellabs
Telecommunications Equipment | | | 4.6 | | |
4. Liberty Global
Cable TV Franchises outside the USA | | | 4.5 | | |
5. Conseco
Life, Long-term Care & Medical Supplemental Insurance | | | 4.3 | | |
6. Safeway
Supermarkets | | | 3.8 | | |
7. Abercrombie & Fitch
Teen Apparel Retailer | | | 3.8 | | |
8. Janus Capital Group
Manages Mutual Funds | | | 3.6 | | |
9. Potash Corp. of Saskatchewan (Canada)
World's Largest Producer of Potash | | | 3.5 | | |
10. Expedia
Online Travel Services Company | | | 3.2 | | |
6
Wanger Select 2007 Semiannual Report
Wanger Select Fund
Statement of Investments (Unaudited) June 30, 2007
Number of
Shares | | | | Value | |
| | | | | Common Stocks – 89.4% | | | | | |
| | | Consumer Goods & Services – 26.5% | |
| | | Retail – 10.6% | |
| | 312,000 | | | Safeway
Supermarkets | | $ | 10,617,360 |
| |
| | 145,000 | | | Abercrombie & Fitch
Teen Apparel Retailer | | | 10,582,100 | | |
| | 74,000 | | | Costco Wholesale
Warehouse Superstores | | | 4,330,480 | | |
| | 175,000 | | | Chico's FAS (a)
Women's Specialty Retailer | | | 4,259,500 | | |
| | | | 29,789,440 | | |
| | | Other Consumer Services – 6.0% | |
| | 115,000 | | | ITT Educational Services (a)
Post-secondary Degree Programs | | | 13,498,700 | | |
| | 131,100 | | | Universal Technical Institute (a)
Vocational Training | | | 3,328,629 | | |
| | | | 16,827,329 | | |
| | | Travel – 4.9% | |
| | 311,000 | | | Expedia (a)
Online Travel Services Company | | | 9,109,190 | | |
| | 176,000 | | | Hertz (a)
Largest U.S. Rental Car Operator | | | 4,676,320 | | |
| | | | 13,785,510 | | |
| | | Leisure Products – 2.7% | |
| | 70,000 | | | Harley-Davidson
Motorcycles & Related Merchandise | | | 4,172,700 | | |
| | 65,000 | | | International Speedway
Largest Motorsports Racetrack Owner & Operator | | | 3,426,150 | | |
| | | | 7,598,850 | | |
| | | Apparel – 2.3% | |
| | 136,000 | | | Coach (a)
Designer & Retailer of Branded Leather Accessories | | | 6,445,040 | | |
| Total Consumer Goods & Services | | | 74,446,169 | | |
| | | Information Group – 24.9% | |
| | | CATV – 6.6% | |
| | 263,000 | | | Liberty Global Series C (a) | | | 10,335,900 | | |
| | 53,000 | | | Liberty Global Series A (a)
Cable TV Franchises outside the USA | | | 2,175,120 | | |
Number of
Shares | | | | Value | |
| | 263,000 | | | Discovery Holding (a)
CATV Programming | | $ | 6,046,370 | | |
| | | | 18,557,390 | | |
| | | Mobile Communications – 5.0% | |
| | 203,000 | | | American Tower (a)
Communications Towers in USA & Mexico | | | 8,526,000 | | |
| | 534,000 | | | Globalstar (a)
Satellite Mobile Voice & Data Carrier | | | 5,526,900 | | |
| | | | 14,052,900 | | |
| | | Telecommunications Equipment – 4.6% | |
| | 1,210,100 | | | Tellabs (a)
Telecommunications Equipment | | | 13,020,676 | | |
| | | Business Software – 4.2% | |
| | 209,000 | | | Avid Technology (a)
Digital Nonlinear Editing Software & Systems | | | 7,388,150 | | |
| | 569,000 | | | Novell (a)
Directory, Operating System & Identity
Management Software | | | 4,432,510 | | |
| | | | 11,820,660 | | |
| | | Internet Related – 2.0% | |
| | 600,000 | | | SkillSoft (a)
Web-based Learning Solutions (E-Learning) | | | 5,574,000 | | |
| | | Contract Manufacturing – 1.6% | |
| | 1,401,520 | | | Sanmina-SCI (a)
Electronic Manufacturing Services | | | 4,386,758 | | |
| | | Semiconductors & Related Equipment – 0.8% | |
| | 235,000 | | | Canadian Solar (a)
Solar Cell & Module Manufacturer | | | 2,209,000 | | |
| | | Computer Service – 0.1% | |
| | 86,500 | | | AnswerThink (a)
IT Integration & Best Practice Research | | | 313,130 | | |
| Total Information Group | | | 69,934,514 | | |
See accompanying notes to financial statements.
7
Wanger Select 2007 Semiannual Report
Wanger Select Fund
Statement of Investments (Unaudited) June 30, 2007
Number of
Shares | | | | Value | |
| | | Energy & Minerals – 14.3% | |
| | | Mining – 9.9% | |
| | 1,409,000 | | | Uranium One (South Africa) (a)
Uranium Mines in South Africa, Kazakhstan,
Australia & the U.S. | | $ | 17,948,960 | | |
| | 126,300 | | | Potash Corp. of Saskatchewan
(Canada)
World's Largest Producer of Potash | | | | | |
| | | | 27,796,571 | | |
| | | Oil Services – 4.4% | |
| | 183,000 | | | Tetra Technologies (a)
U.S.-based Services Company with
Life of Field Approach | | | 5,160,600 | | |
| | 54,000 | | | FMC Technologies (a)
Oil & Gas Well Head Manufacturer | | | 4,277,880 | | |
| | 43,000 | | | Atwood Oceanics (a)
Offshore Drilling Contractor | | | 2,950,660 | | |
| | | | 12,389,140 | | |
| Total Energy & Minerals | | | 40,185,711 | | |
| | | Finance – 12.1% | |
| | | Insurance – 7.2% | |
| | 578,000 | | | Conseco (a)
Life, Long Term Care & Medical Supplement Insurance | | | 12,074,420 | | |
| | 9,800 | | | Markel (a)
Specialty Insurance | | | 4,748,688 | | |
| | 178,000 | | | Montpelier Re
Commercial Lines Insurance/Reinsurance | | | 3,300,120 | | |
| | | | 20,123,228 | | |
| | | Brokerage & Money Management – 4.9% | |
| | 361,000 | | | Janus Capital Group
Manages Mutual Funds | | | 10,050,240 | | |
| | 132,000 | | | SEI Investments
Mutual Fund Administration & Investment Management | | | 3,833,280 | | |
| | | | | | | | 13,883,520 | | |
| Total Finance | | | 34,006,748 | | |
Number of
Shares | | | | Value | |
| | | Industrial Goods & Services – 9.6% | |
| | | Other Industrial Services – 3.6% | |
| | 125,000 | | | Expeditors International of Washington
International Freight Forwarder | | $ | 5,162,500 | | |
| | 184,500 | | | American Commercial Lines (a)
Operator of Inland Barges/Builder of Inland Barges | | | 4,806,225 | | |
| | | | 9,968,725 | | |
| | | Outsourcing Services – 2.6% | |
| | 235,000 | | | Quanta Services (a)
Electrical & Telecom Construction Services | | | 7,207,450 | | |
| | | Waste Management – 1.8% | |
| | 131,000 | | | Waste Management
U.S. Garbage Collection & Disposal | | | 5,115,550 | | |
| | | Steel – 1.6% | |
| | 206,000 | | | Worthington Industries
Steel Processing & Manufactured Metal Products | | | 4,459,900 | �� | |
| Total Industrial Goods & Services | | | 26,751,625 | | |
| | | Health Care – 1.1% | |
| | | Health Care Services – 1.1% | |
| | 79,000 | | | Lincare Holdings (a)
Home Health Care Services | | | 3,148,150 | | |
| Total Health Care | | | 3,148,150 | | |
| | | Other – 0.9% | |
| | | Transportation – 0.9% | |
| | 87,000 | | | JB Hunt Transport Services
Truck & Intermodal Carrier | | | 2,550,840 | | |
| Total Other | | | 2,550,840 | | |
| Total Common Stocks (Cost: $174,459,522) – 89.4% | | | 251,023,757 | | |
See accompanying notes to financial statements.
8
Wanger Select 2007 Semiannual Report
Wanger Select Fund
Statement of Investments (Unaudited) June 30, 2007
| Principal Amount | | | | Value | |
| Short-Term Obligation – 10.9% | |
| $ | 30,474,000 | | | Repurchase Agreement with Fixed
Income Clearing Corp., dated
06/29/07, due 7/02/07 at 5.05%,
collateralized by a U.S. Agency
Obligation, maturing to 07/18/11,
market value of $31,084,000
(repurchase proceeds $30,486,824) | | $ | 30,474,000 | | |
| Total Short-Term Obligation (Cost: 30,474,000) | | | 30,474,000 | | |
| Total Investments (Cost: $204,933,522) (b)(c) – 100.3% | | | 281,497,757 | | |
| Cash and Other Assets Less Liabilities – (0.3)% | | | (838,509 | ) | |
| Total Net Assets – 100% | | $ | 280,659,248 | | |
Notes to Statement of Investments:
(a) Non-income producing security.
(b) On June 30, 2007, the market value of foreign securities represents 9.9% of total net assets. The Fund's foreign portfolio was diversified as follows:
| Currency | | Value | | % of Net
Assets | |
| Canadian Dollar | | $ | 9,847,611 | | | | 3.50 | | |
| South African Rand | | | 17,948,960 | | | | 6.40 | | |
| | | $ | 27,796,571 | | | | 9.90 | | |
(c) At June 30, 2007, for federal income tax purposes cost of investments was $204,933,522 and net unrealized appreciation (depreciation) was $76,564,235 consisting of gross unrealized appreciation of $81,389,910 unrealized depreciation of $4,825,675.
At June 30, 2007, the Fund held investments in the following sectors:
| Sector | | % of
Net Assets | |
| Consumer Goods & Services | | | 26.5 | | |
| Information Group | | | 24.9 | | |
| Energy & Minerals | | | 14.3 | | |
| Finance | | | 12.1 | | |
| Industrial Goods & Services | | | 9.6 | | |
| Health Care | | | 1.1 | | |
| Other | | | 0.9 | | |
| Short-Term Obligation | | | 10.9 | | |
| Cash and Other Assets less Liabilities | | | (0.3 | ) | |
| | | | 100.0 | | |
See accompanying notes to financial statements.
9
Wanger Select 2007 Semiannual Report
Statement of Assets and Liabilities
June 30, 2007 (Unaudited)
| Assets: | |
| Investments, at cost | | $ | 204,933,522 | | |
| Investments, at value | | $ | 251,023,757 | | |
| Repurchase agreement | | | 30,474,000 | | |
| Cash | | | 59,879 | | |
| Receivable for: | |
| Fund shares sold | | | 526,372 | | |
| Interest | | | 8,550 | | |
| Dividends | | | 34,878 | | |
| Total Assets | | | 282,127,436 | | |
| Liabilities: | |
| Payable for: | |
| Investments purchased | | | 921,764 | | |
| Fund shares repurchased | | | 310,721 | | |
| Investment advisory fee | | | 190,886 | | |
| Transfer agent fee | | | 17 | | |
| Trustees' fees | | | 587 | | |
| Custody fee | | | 354 | | |
| Reports to shareholders | | | 29,665 | | |
| Deferred Trustees' fees | | | 2,261 | | |
| Other liabilities | | | 11,933 | | |
| Total Liabilities | | | 1,468,188 | | |
| Net Assets | | $ | 280,659,248 | | |
| Composition of Net Assets: | |
| Paid-in capital | | $ | 202,549,521 | | |
| Overdistributed net investment income | | | (718,120 | ) | |
| Accumulated net realized gain | | | 2,263,628 | | |
| Net unrealized appreciation (depreciation) on: | |
| Investments | | | 76,564,235 | | |
| Foreign currency translations | | | (16 | ) | |
| Net Assets | | $ | 280,659,248 | | |
| Fund Shares outstanding | | | 9,388,222 | | |
Net asset value, offering price and redemption
price per share | | $ | 29.89 | | |
Statement of Operations
For the Six Months Ended June 30, 2007 (Unaudited)
| Investment Income: | |
| Dividends (net of foreign taxes withheld of $1,769) | | $ | 373,954 | | |
| Interest | | | 575,877 | | |
| Total Investment Income | | | 949,831 | | |
| Expenses: | |
| Investment advisory fee | | | 967,691 | | |
| Transfer agent fee | | | 123 | | |
| Trustees' fees | | | 4,090 | | |
| Custody fee | | | 6,997 | | |
| Chief compliance officer expenses (See Note 4) | | | 6,200 | | |
| Other expenses (See Note 5) | | | 44,949 | | |
| Total Expenses | | | 1,030,050 | | |
| Custody earnings credit | | | (1,039 | ) | |
| Net Expenses | | | 1,029,011 | | |
| Net Investment Loss | | | (79,180 | ) | |
Net Realized and Unrealized Gain (Loss) on
Investments and Foreign Currency: | |
| Net realized gain (loss) on: | |
| Investments | | | 2,321,968 | | |
| Foreign currency transactions | | | (1,134 | ) | |
| Net realized gain | | | 2,320,834 | | |
| Net change in unrealized appreciation on: | |
| Investments | | | 31,533,047 | | |
| Foreign currency translations | | | 5,003 | | |
| Net change in unrealized appreciation | | | 31,538,050 | | |
| Net Gain | | | 33,858,884 | | |
| Net Increase in Net Assets from Operations | | $ | 33,779,704 | | |
See accompanying notes to financial statements.
10
Wanger Select 2007 Semiannual Report
Statement of Changes in Net Assets
| Increase (Decrease) in Net Assets: | | (Unaudited)
Six Months
Ended
June 30,
2007 | | Year Ended
December 31,
2006 | |
| Operations: | |
| Net investment loss | | $ | (79,180 | ) | | $ | (280,699 | ) | |
| Net realized gain on investments and foreign currency transactions | | | 2,320,834 | | | | 4,109,684 | | |
Net change in unrealized appreciation on investments and foreign
currency translations | | | 31,538,050 | | | | 21,452,932 | | |
| Net Increase in Net Assets from Operations | | | 33,779,704 | | | | 25,281,917 | | |
| Distributions Declared to Shareholders: | |
| From net investment income | | | — | | | | (466,512 | ) | |
| From net realized gains | | | (3,866,407 | ) | | | (3,873,384 | ) | |
| Total Distributions Declared to Shareholders | | | (3,866,407 | ) | | | (4,339,896 | ) | |
| Share Transactions: | |
| Subscriptions | | | 83,839,544 | | | | 67,137,702 | | |
| Distributions reinvested | | | 3,866,407 | | | | 4,339,896 | | |
| Redemptions | | | (12,306,393 | ) | | | (19,746,917 | ) | |
| Net Increase from Share Transactions | | | 75,399,558 | | | | 51,730,681 | | |
| Total Increase in Net Assets | | | 105,312,855 | | | | 72,672,702 | | |
| Net Assets: | |
| Beginning of period | | | 175,346,393 | | | | 102,673,691 | | |
| End of period | | $ | 280,659,248 | | | $ | 175,346,393 | | |
| Overdistributed net investment income at end of period | | $ | (718,120 | ) | | $ | (638,940 | ) | |
See accompanying notes to financial statements.
11
Wanger Select 2007 Semiannual Report
Financial Highlights
| | | (Unaudited)
Six Months Ended
June 30, | | Year Ened December 31, | |
| Selected data for a share outstanding throughout each period | | 2007 | | 2006 | | 2005 | | 2004 | | 2003 | | 2002 | |
| Net Asset Value, Beginning of Period | | $ | 26.15 | | | $ | 22.66 | | | $ | 22.11 | | | $ | 18.55 | | | $ | 14.19 | | | $ | 15.36 | | |
| Income from Investment Operations: | |
| Net investment loss (a) | | | (0.01 | ) | | | (0.05 | ) | | | (0.04 | ) | | | (0.10 | ) | | | (0.11 | ) | | | (0.09 | ) | |
Net realized and unrealized gain (loss) on investments
and foreign currency translations | | | 4.25 | | | | 4.38 | | | | 2.12 | | | | 3.68 | | | | 4.47 | | | | (1.08 | ) | |
| Total from Investment Operations | | | 4.24 | | | | 4.33 | | | | 2.08 | | | | 3.58 | | | | 4.36 | | | | (1.17 | ) | |
| Less Distributions Declared to Shareholders: | |
| From net investment income | | | — | | | | (0.09 | ) | | | — | | | | — | | | | — | | | | — | | |
| From net realized capital gains | | | (0.50 | ) | | | (0.75 | ) | | | (1.53 | ) | | | (0.02 | ) | | | — | | | | — | | |
| Total Distributions Declared to Shareholders | | | (0.50 | ) | | | (0.84 | ) | | | (1.53 | ) | | | (0.02 | ) | | | — | | | | — | | |
| Net Asset Value, End of Period | | $ | 29.89 | | | $ | 26.15 | | | $ | 22.66 | | | $ | 22.11 | | | $ | 18.55 | | | $ | 14.19 | | |
| Total Return (b) | | | 16.44 | %(c) | | | 19.70 | % | | | 10.49 | %(d) | | | 19.31 | % | | | 30.73 | % | | | (7.62 | )% | |
| Ratios to Average Net Assets: | |
| Net expenses (e) | | | 0.90 | %(f) | | | 0.94 | % | | | 0.96 | % | | | 1.10 | % | | | 1.15 | % | | | 1.18 | % | |
| Net investment loss (e) | | | (0.07 | )%(f) | | | (0.20 | )% | | | (0.20 | )% | | | (0.49 | )% | | | (0.65 | )% | | | (0.62 | )% | |
| Waiver | | | — | | | | — | | | | 0.02 | % | | | — | | | | — | | | | — | | |
| Portfolio turnover rate | | | 8 | %(c) | | | 21 | % | | | 26 | % | | | 36 | % | | | 21 | % | | | 45 | % | |
| Net assets, end of period (000's) | | $ | 280,659 | | | $ | 175,346 | | | $ | 102,674 | | | $ | 82,465 | | | $ | 52,112 | | | $ | 26,124 | | |
(a) Net investment loss per share was based upon the average shares outstanding during the period.
(b) Total return at net asset value assuming all distributions reinvested.
(c) Not annualized.
(d) Had the Investment Adviser not waived a portion of expenses, total return would have been reduced.
(e) The benefits derived from custody fees paid indirectly had an impact of less than 0.01%.
(f) Annualized.
See accompanying notes to financial statements.
12
Wanger Select 2007 Semiannual Report
Notes to Financial Statements (Unaudited)
1. Nature of Operations
Wanger Select (the "Fund") is a series of Wanger Advisors Trust (the "Trust"), an open-end management investment company organized as a Massachusetts business trust. The investment objective of the Fund is to seek long-term growth of capital. The Fund is available only for allocation to certain life insurance company separate accounts established for the purpose of funding qualified and non-qualified variable annuity contracts and variable life insurance policies and may also be offered directly to certain types of pension plans and retirement arrangements.
2. Significant Accounting Policies
Security valuation
Securities of the Fund are valued at market value or, if a market quotation for a security is not readily available or is deemed not to be reliable because of events or circumstances that have occurred between the market quotation and the time as of which the security is to be valued, the security is valued at a fair value determined in accordance with procedures established by the Board of Trustees. A security traded on a securities exchange or in an over-the-counter market in which transaction prices are reported is valued at the last sales price at the time of valuation. A security traded principally on NASDAQ is valued at the NASDAQ official closing price. A security for which there is no reported sale on the valuation date is valued at the latest bid quotation. A short-term debt obligation having a maturity of 60 days or less from the valuation date is valued at amortized cost, which approximates fair value. A security for which a market quotation is not readily available and any other assets are valued in accordance with procedures established by the Board of Trustees. The Trust has retained an independent statistical fair value pricing service to assist in the fair valuation process for securities principally traded in a foreign market in order to adjust for possible changes in value that may occur between the close of the foreign exchange and the time as of which the securities are to be valued. If a security is valued at a "fair value", that value may be different from the last quoted market price for the security.
In September 2006, Statement of Financial Accounting Standards No. 157, Fair Value Measurements ("SFAS 157"), was issued. SFAS 157 is effective for fiscal years beginning after November 15, 2007. SFAS 157 defines fair value, establishes a framework for measuring fair value and expands disclosures about fair value measurements. Management is evaluating the impact the application of SFAS 157 will have on the Fund's financial statement disclosures.
Repurchase agreements
The Fund may engage in repurchase agreement transactions. The Fund, through its custodians, receives delivery of underlying securities collateralizing each repurchase agreement. The Fund's investment advisor determines that the value of the underlying securities is at all times at least equal to the repurchase price including interest. In the event of default or bankruptcy by the other party to the agreement, realization and/or retention of the collateral may be subject to legal proceedings.
Foreign currency translations
Values of investments denominated in foreign currencies are converted into U.S. dollars using the spot market rate of exchange at the time of valuation. Purchases and sales of investments and dividend and interest income are translated into U.S. dollars using the spot market rate of exchange prevailing on the respective dates of such transactions. The gain or loss resulting from changes in foreign exchange rates is included with net realized and unrealized gain or loss from investments, as appropriate.
Security transactions and investment income
Security transactions are accounted for on the trade date (date the order to buy or sell is executed) and dividend income is recorded on the ex-dividend date, except that certain dividends from foreign securities are recorded as soon as the information is available to the Fund. Interest income is recorded on an accrual basis and includes amortization of discounts and premiums on debt obligations when required for federal income tax purposes. Realized gains and losses from security transactions are recorded on an identified cost basis.
Awards, if any, from class action litigation related to securities owned may be recorded as a reduction of cost of those securities. If the applicable securities are no longer owned, the proceeds are recorded as realized gains.
Use of Estimates
The preparation of financial statements in conformity with accounting principles generally accepted in the United States of America ("GAAP") requires management to make estimates and assumptions that affect the amounts reported in the financial statements and accompanying notes. Actual results may differ from those estimated.
Fund share valuation
Fund shares are sold and redeemed on a continuing basis at net asset value. Net asset value per share is determined daily as of the close of trading on the New York Stock Exchange ("the Exchange") on each day the Exchange is open for trading by dividing the total value of the Fund's investments and other assets, less liabilities, by the number of Fund shares outstanding.
Custody fees/Credits
Custody fees are reduced based on the Fund's cash balances maintained with the custodian. The Fund could have invested a portion of the assets utilized in connection with the expense offset arrangement in an income-producing asset if it had not entered into such agreement. The amount is disclosed as a reduction of total expenses in the Statement of Operations.
Federal income taxes
The Fund has complied with the provisions of the Internal Revenue Code available to regulated investment companies and, in the manner provided therein, distributes all their taxable income, as well as any net realized gain on sales of investments and foreign currency transactions reportable for federal income tax purposes. Accordingly, the Fund paid no federal income taxes and no federal income tax provision was required.
Distributions to shareholders
Distributions to shareholders are recorded on the ex-date.
Indemnification
In the normal course of business, the Fund enters into contracts that contain a variety of representations and warranties which provide general indemnities. The Fund's maximum exposure under these arrangements is unknown, as this would involve future claims against the Fund. Also, under the Trust's organizational documents, the Trustees and Officers of the Trust are indemnified against certain liabilities that may arise out of their duties to the Trust. However, based on experience, the Fund expects the risk of loss due to these warranties and indemnities to be minimal.
13
Wanger Select 2007 Semiannual Report
Notes to Financial Statements, continued (Unaudited)
3. Federal Tax Information
The tax character of distributions paid during the year ended December 31, 2006 was as follows:
| Distributions paid from: | |
| Ordinary Income * | | $ | 970,016 | | |
| Long-Term Capital Gains | | $ | 3,369,880 | | |
* For tax purposes short-term capital gains distributions, if any, are considered ordinary income distributions.
The Fund adopted Financial Accounting Standards Board ("FASB") Interpretation No. 48, Accounting for Uncertainty in Income Taxes—an Interpretation of FASB Statement No. 109 ("FIN 48") effective June 29, 2007. FIN 48 requires management to determine whether a tax position of a Fund is more likely than not to be sustained upon examination by the applicable taxing authority, including resolution of any related appeals or litigation processes, based in the technical merits of the position. The tax benefit to be recognized is measured as the largest amount of benefit that is greater than fifty percent likely of being realized upon ultimate settlement. FIN 48 must be applied to all existing tax positions upon initial adoption and the cumulative effect, if any, is to be reported as an adjustment to net assets. Management has evaluated the known implications of FIN 48 on its computation of net assets for the Fund. As a result of this evaluation, management believes that FIN 48 will not have any effect on the Fund's financial statements. However, management's conclusions regarding FIN 48 may be subject to review and adjustment at a later date based on factors including, but not limited to, further implementation guidance expected from the FASB, new tax laws, regulations, and administrative interpretations (including relevant court decisions).
4. Transactions With Affiliates
Columbia Wanger Asset Management, L.P., ("Columbia WAM") a wholly owned subsidiary of Columbia Management Group, Inc. ("CM"), which in turn is an indirect wholly owned subsidiary of Bank of America Corporation ("BOA"), furnishes continuing investment supervision to the Fund and is responsible for the overall management of the Fund's business affairs.
Effective August 1, 2007, under the Fund's investment advisory agreement, fees are accrued daily based on the Fund's average daily net assets and paid monthly to Columbia WAM at the annual rates shown in the table below:
| Average Daily Net Assets | | Annual Fee Rate | |
| | Up to $500 million | | | | 0.800 | % | |
| | $500 million and over | | | | 0.780 | % | |
For the period covered by this report as provided under the Fund's investment advisory agreement, fees were accrued daily based on the Fund's average daily net assets and paid monthly to Columbia WAM at the annual rate of 0.85%.
Through April 30, 2008, Columbia WAM will reimburse the Fund to the extent that ordinary operating expenses (computed based on net custodian fees) exceed an annual percentage of 1.35% of average daily net assets. There was no reimbursement for the six months ended June 30, 2007.
Columbia WAM provides administrative services and receives an administration fee from the Fund. For the period covered by this report, administrative services were covered under the Fund's investment advisory agreement in place between the Fund and Columbia WAM. Effective August 1, 2007, under the Fund's new administration agreement, which provides the same types of administrative services that were provided under the investment advisory agreement, fees are accrued daily and paid monthly to Columbia WAM at the annual rate of 0.05%. Accordingly, the investment advisory fees were decreased by 0.05% across all asset levels effective August 1, 2007 as well.
Certain officers and trustees of the Trust are also officers of Columbia WAM. The Trust makes no direct payments to its officers and trustees who are affiliated with Columbia WAM. For the six months ended June 30, 2007, the Fund paid $4,090 to trustees not affiliated with Columbia WAM. The Board of Trustees appointed a Chief Compliance Officer to the Fund in accordance with federal securities regulations. The Fund will pay its pro-rata share of the expenses associated with the Office of the Chief Compliance Officer. These expenses are disclosed separately as "Chief compliance officer expenses" in the Statement of Operations.
Columbia Management Distributors, Inc. (the "Distributor"), a wholly owned subsidiary of BOA, serves as the principal underwriter of the Trust and receives no compensation for its services.
Columbia Management Services, Inc. (the "Transfer Agent"), a wholly owned subsidiary of BOA, provides shareholder services to the Fund and has subcontracted with Boston Financial Data Services ("BFDS") to serve as subtransfer agent. For such services, the Transfer Agent receives a fee, paid monthly, at the annual rate of $21.00 per open account. The Transfer Agent also receives reimbursement for certain out-of-pocket expenses.
During the six months ended June 30, 2007, the Fund engaged is purchase and sales transactions with funds that have a common investment adviser (or affiliated investment advisers), common Directors/Trustees, and/or common Officers. These purchase and sale transactions complied with the provisions of Rule 17a-7 under the Investment Company Act of 1940 and were $93,600 and $2,089,504, respectively.
5. Borrowing Arrangements
The Trust participates in a $150,000,000 credit facility, which was entered into to facilitate portfolio liquidity. Interest is charged to each participating fund based on its borrowings at rate per annual equal to the Federal Funds rate plus 0.50%. In addition, a commitment fee of 0.08% per annum is accrued and apportioned among the participating funds based on their pro-rata portion of the unutilized line of credit. The commitment fee is included in "Other expenses" in the Statement of Operations. No amounts were borrowed by the Fund under this facility during the six months ended June 30, 2007.
6. Fund Share Transactions
Proceeds and payments on Fund shares as shown in the Statement of Changes in Net Assets are in respect of the following numbers of shares:
| | | Six months ended
June 30, 2007 | | Year ended
December 31, 2006 | |
| Shares sold | | | 2,978,516 | | | | 2,825,971 | | |
Shares issued in reinvestment
of dividend distributions | | | 145,354 | | | | 191,438 | | |
| Less shares redeemed | | | (441,446 | ) | | | (841,953 | ) | |
| Net increase in shares outstanding | | | 2,682,424 | | | | 2,175,456 | | |
7. Investment Transactions
The aggregate cost of purchases and proceeds from sales other than short-term obligations for the six months ended June 30, 2007 were $70,070,111 and $16,507,825, respectively.
14
Wanger Select 2007 Semiannual Report
Notes to Financial Statements, continued (Unaudited)
8. Legal Proceedings
Columbia WAM, Columbia Acorn Trust, another mutual fund family advised by Columbia WAM, and the trustees of Colombia Acorn Trust (collectively, the "Columbia defendants") are named as defendants in class and derivative complaints which have been consolidated in a Multi-District Action in the federal district court for the District of Maryland (the "MDL Action"). These lawsuits contend that defendants permitted certain investors to market time their trades in certain Columbia Acorn Funds. The MDL Action is ongoing. However, all claims against Columbia Acorn Trust and the independent trustees of Columbia Acorn Trust have been dismissed.
The Columbia Acorn Trust and Columbia WAM are also defendants in a class action lawsuit that alleges, in summary, that the Columbia Acorn Trust and Columbia WAM exposed shareholders of Columbia Acorn International Fund to trading by market timers by allegedly (a) failing to properly evaluate daily whether a significant event affecting the value of that Fund's securities had occurred after foreign markets had closed but before the calculation of the funds' net asset value (NAV"); (b) failing to implement the fund's portfolio valuation and share pricing policies and procedures; and (c) failing to know and implement applicable rules and regulations concerning the calculation of NAV (the "Fair Valuation Lawsuit"). The Seventh Circuit ruled that the plaintiffs' state law claims were preempted under federal law resulting in the dismissal of plaintiffs' complaint. Plaintiffs appealed the Seventh Circuit's ruling to the United States Su preme Court. The Supreme Court reversed the Seventh Circuit's ruling on jurisdictional grounds, and the case ultimately was remanded to the state court.
On March 21, 2005, a class action complaint was filed against the Columbia Acorn Trust and Columbia WAM seeking to rescind the Contingent Deferred Sales Charges assessed upon redemption of Class B shares of Columbia Acorn Funds due to the alleged market timing of the Columbia Acorn Funds. In addition to the rescission of sales charges, plaintiffs seek recovery of actual damages, attorneys' fees and costs. The case has been transferred to the Multi-District Action in the federal district court of Maryland.
On April 4, 2006, the plaintiffs and the Columbia defendants named in the MDL Action executed an agreement in principle intended to fully resolve all of the lawsuits consolidated in the MDL Action as well as the Fair Valuation Lawsuit. The court entered a stay after the parties executed a settlement agreement. The settlement has not yet been finalized or approved by the court.
Columbia WAM, the Columbia Acorn Funds and the trustees of Columbia Acorn Trust are also defendants in a consolidated lawsuit filed in the federal district court of Massachusetts alleging that Columbia WAM used fund assets to make undisclosed payments to brokers as an incentive for the brokers to market the Columbia Acorn Funds over the other mutual funds to investors. The complaint alleges Columbia WAM and the Trustees of the Trust breached certain common laws duties and federal laws.
On November 30, 2005, the court dismissed all of the claims alleged against all of the parties in the consolidated complaint. The parties subsequently executed a formal settlement agreement resolving all claims in the litigation and the plaintiffs dismissed their appeal. The settlement requires court approval, which has not yet been obtained.
On or about January 11, 2005, a putative class action lawsuit was filed in federal district court in Massachusetts against the Columbia Acorn Trust and the trustees of Columbia Acorn Trust, along with the Columbia Advisers, the sub-administrator of the Wanger Advisors Funds and the Columbia Acorn Funds. The plaintiffs allege that the defendants failed to submit Proof of Claims in connection with settlements of securities class action lawsuits filed against companies in which the Columbia Acorn Funds held positions. The complaints seeks compensatory and punitive damages, and the disgorgement of all fees paid to the Columbia Advisers.
Plaintiffs have voluntarily dismissed the Columbia Acorn Trust and its independent trustees.
The Columbia Acorn Trust and Columbia WAM intend to defend these suits vigorously.
As a result of these matters or any adverse publicity or other developments resulting from them, there may be increased redemptions or reduced sales of Fund shares, which could increase transaction costs or operating expenses, or have other adverse consequences for the Funds.
However, based on currently available information, the Columbia Acorn Trust believes that the likelihood that these lawsuits will have a material adverse impact on any fund is remote, and Columbia WAM believes that the lawsuits are not likely to materially affect its ability to provide investment management services to the Funds.
15
Wanger Select 2007 Semiannual Report
[Excerpt from:]
Wanger Advisors Trust
Management Fee Evaluation of the Senior Officer
Prepared Pursuant to the New York Attorney General's
Assurance of Discontinuance
June 2007
16
Wanger Select 2007 Semiannual Report
Introduction
The New York Attorney General's Assurance of Discontinuance ("Order") entered into by Columbia Management Advisors, Inc. ("CMAI") and Columbia Management Distributors, Inc., ("CMDI" and collectively with "CMAI," "CMG") in February 2005, allows CMAI to manage or advise a mutual fund only if the trustees of the fund appoint a "Senior Officer" to perform specified duties and responsibilities. One of these responsibilities includes "managing the process by which proposed management fees (including but not limited to, advisory fees) to be charged the [Funds] are negotiated so that they are negotiated in a manner which is at arms' length and reasonable and consistent with this Assurance of Discontinuance."
This is the first year that the Columbia Acorn Trust and Wanger Advisors Trust (collectively, the "Trusts") and each series thereof (the "Acorn Funds," "WAT Funds" or collectively, the "Funds") have been overseen by the same Board of Trustees ("Board"). The Order provides that this Board must determine the reasonableness of proposed "management fees" by using either an annual competitive bidding process supervised by the Senior Officer or Independent Fee Consultant, or by obtaining "an annual independent written evaluation prepared by or under the direction of the Senior Officer or the Independent Fee Consultant."
"Management fees" are only part of the costs and expenses paid by mutual fund shareholders. The expenses can vary depending upon the class of shares held but usually include: (1) investment management or advisory fees to compensate analysts and portfolio managers for stock research and portfolio management, as well as the cost of operating a trading desk; (2) administrative expenses incurred to prepare registration statements and tax returns, calculate the Funds' net asset values, maintain effective compliance procedures and perform recordkeeping services; (3) transfer agency costs for establishing accounts, accepting and disbursing funds, as well as overseeing trading in Fund shares; (4) custodial expenses incurred to hold the securities purchased by the Funds; and (5) distribution expenses, including commissions paid to brokers that sell the Fund shares to investors.
Columbia Wanger Asset Management, L.P. ("CWAM"), the adviser to the Funds, has proposed that with respect to the Acorn Funds, the Columbia Acorn Trust continue the existing separate agreements governing the first two categories listed above: an advisory agreement governing portfolio management, and an administration agreement governing certain administration and clerical services. Together the fees paid under these two agreements are referred to as "management fees." CWAM proposes that the WAT Funds continue the existing single agreement governing both investment advisory and administrative services. A single management fee would cover both services. Other fund expenses are governed by separate agreements, in particular agreements with two CWAM affiliates: CMDI, the broker-dealer that underwrites and distributes the Funds' shares, and Columbia Management Services, Inc. ("CMSI"), the Funds' transfer agent. In conformity with the terms of the Order, this evaluation, therefore, addresses only the advisory and administrative contracts, and does not extend to the other agreements.
According to the Order, the Senior Officer's evaluation must consider at least the following:
(1) Management fees (including components thereof) charged to institutional and other clients of CWAM for like services;
(2) Management fees (including any components thereof) charged by other mutual fund companies for like services;
(3) Costs to CWAM and its affiliates of supplying services pursuant to the management fee agreements, excluding any intra-corporate profit;
(4) Profit margins of CWAM and its affiliates from supplying such services;
(5) Possible economies of scale as the Funds grow larger; and
(6) The nature and quality of CWAM's services, including the performance of each Fund.
In 2004, the Boards of the two Trusts, then separate groups, each appointed me Senior Officer under the Order. They also determined not to pursue a competitive bidding process and instead, charged me with the responsibility of evaluating the Funds' proposed advisory and administrative fee contracts with CWAM in conformity with the requirements of the Order. This Report is an annual evaluation required under the Order. In discharging their responsibilities, the independent Trustees have also consulted independent, outside counsel.
2006 Evaluation
This is the third annual evaluation prepared in connection with the Order. This evaluation follows the same structure as the earlier studies. Some areas are given more emphasis here, while others are given less. Still, the fundamental information gathered for this evaluation is largely the same as past years.
Process and Independence
The objectives of the Order are to insure the independent evaluation of the advisory fees paid by the Funds as well as to insure that all relevant factors are considered. In my view, this contract renewal process has been conducted at arms-length and with independence in gathering, considering and evaluating all relevant data. At the outset of the process, the Trustees sought and obtained from CWAM and CMG a comprehensive compilation of data regarding Fund performance and expenses, adviser profitability, and other information. The Board evaluated this information thoroughly and also explored CWAM's potential capacity restraints. Performance and expense data was obtained from both Morningstar and Lipper, the leading consultants in this area. The rankings prepared by Morningstar and Lipper were independent and not influenced by the adviser. CWAM itself identified what it considers competing funds, and the Trustees considered that data as well.
In the course of its work, the Contract Committee gave careful consideration to the conclusions and recommendations contained in last year's evaluation. The Contract Committee gave particular emphasis to the issue of whether economies of scale were appropriately reflected in the Funds' fee schedules. Last year, the Board sought and CWAM agreed to additional breakpoints for two Funds, Acorn USA and Acorn Select. These breakpoints are above current asset levels, but
17
Wanger Select 2007 Semiannual Report
clearly operate to share economies of scale with Fund shareholders. This year, at the Board's request, CWAM has proposed additional breakpoints for the WAT Funds, and Acorn International Select. This proposal is under consideration by the Board.
My evaluation of the advisory contract was shaped, as it was last year, by my experience as Chief Compliance Officer of the Trusts ("CCO"). As CCO, I report solely to the Board and have no reporting obligation to or employment relationship with CMG or its affiliates, except for administrative purposes. I have commented on compliance matters in evaluating the quality of service provided by CWAM.
This Report, its supporting materials and the data contained in other materials submitted to the Contract Committee of the Board, in my view, provide a thorough factual basis upon which the Board, in consultation with independent counsel as it deems appropriate, may conduct management fee negotiations that are in the best interests of the Funds' shareholders.
The Fee Reductions Mandated under the Order
Under the terms of the Order, CMG agreed to secure certain management fee reductions for the mutual funds advised by its affiliate investment advisers. In some instances, breakpoints were also established. Although neither CWAM nor the Trusts was a party to the Order, CWAM offered and the Board accepted certain advisory fee reductions during 2005. By the terms of the Order, these fees may not be increased before November 30, 2009. I have used these advisory fee levels—as modified last year to add certain breakpoints for Acorn USA and Acorn Select—in this evaluation because they are the fees in the current agreements that CWAM proposes should be continued. Hence, these fee levels are the starting point of an evaluation.
Conclusions
My review of the data and other material above leads to the following conclusions with respect to the factors identified in the Order.
1. Performance. The domestic Funds generally have achieved outstanding performance. The Acorn Fund, Acorn USA, Acorn Select, Wanger Select and Wanger US Smaller Companies all rank very favorably against their peers over the past five years. Although Acorn USA and Wanger US Smaller Companies had a difficult year in 2006, these returns are not characteristic of these funds, both of which have shown improved performance during the first quarter of 2007. The international Funds have relatively weaker long term records than the domestic funds, but recently have improved significantly and their one year rankings are excellent. Overall then, performance of the Funds is excellent.
2. Management Fees relative to Peers. The management fee rankings for several of the Acorn Funds are generally more favorable to shareholders than those of their peer group funds. Management fees do, however, vary by Fund. Acorn Fund is the least expensive and the Acorn USA the most expensive. Acorn Fund is very competitive, while Acorn USA and Acorn Select were ranked by both Lipper and Morningstar at or below the median, and therefore impose higher fees than do the majority of their competitors. The WAT Funds also lag their competitors and impose higher fees than their peers.
3. Administrative Fees. The Acorn Funds' administrative fee, which is uniform across all Funds, is at a level comparable to or less expensive than the fees imposed by their peers, provides for appropriate services to Funds, and affords breakpoints that lower the fee as assets increase. The WAT Funds pay a single fee for advisory and administrative services and hence do not benefit from administrative fee breakpoints, nor is it possible to assess their administrative costs relative to competitors.
4. Management Fees relative to Institutional and Other Mutual Fund Accounts. CWAM's focus is on its mutual funds. It does not actively seek to manage separate or institutional accounts. The few institutional accounts it does manage vary in rate structures. Some pay advisory fees commensurate with or higher than the Acorn and WAT Funds. In a few instances, however, institutional accounts pay lower advisory fees than do the Acorn Funds. One particular institutional account is significant in size and has been under CWAM's management for over 25 years.
5. Costs to CWAM and its Affiliates. CWAM's direct costs do not appear excessive. Overhead and indirect costs allocated to CWAM by its parent organizations, however, are significant and increasing. CWAM's affiliates report operating losses and therefore do not appear to profit from CWAM's advisory agreement with the Funds.
6. Profit Margins. CWAM's firm-wide, pre-marketing expense profit margins are at the top of the industry, though these comparisons are hampered by limited industry data. High profit margins are not unexpected for firms that manage large, successful funds and have provided outstanding investment performance for investors.
7. Economies of Scale. Economies of scale do exist at CWAM and will expand as the assets of the Funds get larger. They are, however, only partially reflected in the management fee schedule for the Acorn Funds and not reflected at all in two of the four WAT Funds. Breakpoints above current asset levels have, however, been added to the more expensive funds, Acorn Select and Acorn USA. Nonetheless, if Fund assets continue to grow, under the Funds' current fee schedules, all Fund shareholders might not benefit in a manner generally commensurate with CWAM's increased profits. Management has proposed additional breakpoints for some of the Funds that, if implement, would result in greater sharing of economies of scale.
18
Wanger Select 2007 Semiannual Report
8. Nature and Quality of Services. This category includes a variety of considerations that are difficult to quantify, yet can have a significant bearing on the performance of the Acorn Funds. Several areas merit comment.
a. Capacity. The Funds have continued to grow, posing ever greater challenges in deploying assets effectively. While trends here merit continued monitoring, CWAM appears to be managing assets effectively.
b. Compliance. CWAM has a reasonably designed compliance program that protects shareholders.
c. Administrative Services. The Funds benefit from a variety of administrative services that are performed by CWAM and CMAI.
9. Process. In my opinion, the process of negotiating an advisory contract for the Funds has been conducted thoroughly and at arms' length. Further, the Trustees have sufficient information to evaluate management's proposal, and negotiate contract terms that are in the best interests of fund shareholders.
Recommendations
I believe the Trustees should:
1. Continue to consider additional ways to restructure the advisory fee beyond the current breakpoint schedule to reflect more fully economies of scale.
2 Consider unbundling of the advisory and administrative fees paid by the WAT Funds.
3. Review the disparity in management fee levels between the Acorn International Fund and its related annuity-based fund, WAT International Small Cap Fund.
4. Continue to monitor CWAM's capacity limitations to insure that the Funds' expanding assets do not impair investment performance.
Robert P. Scales
Senior Vice President,
Chief Legal Officer
and General Counsel
June 18, 2007
19
Wanger Select 2007 Semiannual Report

Wanger Advisors Trust
Trustees
Robert E. Nason
Chairman
Allan B. Muchin
Vice Chairman
Laura M. Born
Maureen M. Culhane
Margaret Eisen
Jerome Kahn, Jr.
Steven N. Kaplan
David C. Kleinman
Charles P. McQuaid
James A. Star
Ralph Wanger
Patricia H. Werhane
John A. Wing
Officers
Charles P. McQuaid
President
Ben Andrews
Vice President
Michael G. Clarke
Assistant Treasurer
Jeffrey R. Coleman
Assistant Treasurer
J. Kevin Connaughton
Assistant Treasurer
P. Zachary Egan
Vice President
Peter T. Fariel
Assistant Secretary
John M. Kunka
Assistant Treasurer
Joseph C. LaPalm
Vice President
Bruce H. Lauer
Vice President, Treasurer and Secretary
Louis J. Mendes III
Vice President
Robert A. Mohn
Vice President
Christopher J. Olson
Vice President
Linda K. Roth-Wiszowaty
Assistant Secretary
Robert P. Scales
Senior Vice President, Chief Compliance Officer and General Counsel
Transfer Agent,
Dividend Disbursing Agent
Columbia Management Services, Inc.
P.O. Box 8081
Boston, Massachusetts
02266-8081
Distributor
Columbia Management Distributors, Inc.
One Financial Center
Boston, Massachusetts
02111-2621
Investment Adviser
Columbia Wanger Asset Management, L.P.
227 West Monroe Street, Suite 3000
Chicago, Illinois 60606
1-888-4-WANGER
(1-888-492-6437)
Legal Counsel
Bell, Boyd & Lloyd LLP
Chicago, Illinois
This report, including the schedules of investments and financial statements, is submitted for the general information of the shareholders of the Wanger Advisors Trust.
A description of the Fund's proxy voting policies and procedures and a copy of the Fund's voting record for the most recent 12-month period ended June 30 are available (i) on Columbia Management's website at www.columbiafunds.com; (ii) on the Securities and Exchange Commission's website at www.sec.gov, and (iii) without charge, upon request, by calling 888-492-6437.
The Fund files a complete schedule of portfolio holdings with the SEC for the first and third quarters of each fiscal year on Form N-Q. The Fund's Form N-Q is available on the SEC's website at www.sec.gov and may be reviewed and copied at the SEC's Public Reference Room in Washington, D.C. Information on the operation of the Pubic Reference Room may be obtained by calling 800-SEC-0330.
20
Wanger Advisors Trust
SHC-44/133012-0607 08/07 07/42772
Wanger U.S. Smaller Companies
2007 Semiannual Report


Wanger U.S. Smaller Companies
2007 Semiannual Report
Table of Contents
| | 1 | | | Understanding Your Expenses | |
|
| | 2 | | | Doomsayers vs. Doomslayers | |
|
| | 5 | | | Performance Review | |
|
| | 7 | | | Statement of Investments | |
|
| | 15 | | | Statement of Assets and Liabilities | |
|
| | 15 | | | Statement of Operations | |
|
| | 16 | | | Statement of Changes in Net Assets | |
|
| | 17 | | | Financial Highlights | |
|
| | 18 | | | Notes to Financial Statements | |
|
| | 21 | | | Management Fee Evaluation of the Senior Officer | |
|
Columbia Wanger Asset Management, L.P. ("Columbia WAM") is one of the leading global small- and mid-cap equity managers in the United States with more than 37 years of small- and mid-cap investment experience. As of June 30, 2007, Columbia WAM manages more than $38.2 billion in assets and is the investment adviser to Wanger U.S. Smaller Companies, Wanger International Small Cap, Wanger Select, Wanger International Select and the Columbia Acorn Family of Funds. Columbia Management Group, LLC ("Columbia Management") is the investment management division of Bank of America Corporation. Columbia Management entities furnish investment management services and products for institutional and individual investors. Columbia Funds are distributed by Columbia Management Distributors, Inc., member of FINRA, SIPC, part of Columbia Management and an affiliate of Bank of America Corporation. Columbia WAM is an SEC-registered investment adviser and indirect, wholly owned subsidiary of Bank of America Corporation.
Please consider the investment objectives, risks, charges and expenses for the Fund carefully before investing. Contact 1-888-4-WANGER for a prospectus, which contains this and other important information about the Fund. You should read it carefully before you invest.
The views expressed in "Doomsayers vs. Doomslayers" and in the Performance Review reflect the current views of the respective parties. These views are not guarantees of future performance and involve certain risks, uncertainties and assumptions that are difficult to predict so actual outcomes and results may differ significantly from the views expressed. These views are subject to change at any time based upon economic, market or other conditions and the respective parties disclaim any responsibility to update such views. These views may not be relied on as investment advice and, because investment decisions for a Columbia Fund are based on numerous factors, may not be relied on as an indication of trading intent on behalf of any particular Columbia Fund. References to specific company securities should not be construed as a recommendation or investment advice.
Wanger U.S. Smaller Companies 2007 Semiannual Report
Understanding Your Expenses
As a Fund shareholder, you incur two types of costs. There are transaction costs, which generally include sales charges on purchases and may include redemption or exchange fees. There are also ongoing costs, which generally include investment advisory and other Fund expenses. The information on this page is intended to help you understand your ongoing costs of investing in the Fund and to compare these costs with the ongoing costs of investing in other mutual funds.
Analyzing your Fund's expenses
To illustrate these ongoing costs, we have provided an example and calculated the expenses paid by investors in the Fund during the reporting period. The information in the following table is based on an initial, hypothetical investment of $1,000.00, which is invested at the beginning of the reporting period and held for the entire period. Expense information is calculated two ways and each method provides you with different information. The amount listed in the "actual" column is calculated using actual operating expenses and total return for the Fund. The amount listed in the "hypothetical" column assumes that the return each year is 5% before expenses and then applies the Fund's actual expense ratio for the period to the hypothetical return. You should not use the hypothetical account values and expenses to estimate either your actual account balance at the end of the period or the expenses you paid during the reporting perio d. See the "Compare with other funds" information for details on using the hypothetical data.
Estimating your actual expenses
To estimate the expenses that you actually paid over the period, first you will need your account balance at the end of the period.
1. Divide your ending account balance by $1,000.00. For example, if an account balance was $8,600.00 at the end of the period, the result would be 8.6.
2. In the section of the table below titled "Expenses paid during the period," you will find a dollar amount in the column labeled "Actual." Multiply this amount by the result from step 1. Your answer is an estimate of the expenses you paid on your account during the period.
January 1, 2007 – June 30, 2007
| | | Account value at the
beginning of the period ($) | | Account value at the
end of the period ($) | | Expenses paid during
period ($) | | Fund's annualized
expense ratio (%)* | |
| | | Actual | | Hypothetical | | Actual | | Hypothetical | | Actual | | Hypothetical | | Actual | |
Wanger U.S. Smaller
Companies | | | 1,000.00 | | | | 1,000.00 | | | | 1,108.20 | | | | 1,020.08 | | | | 4.97 | | | | 4.76 | | | | 0.95 | | |
*For the six months ended June 30, 2007.
Expenses paid during the period are equal to the Fund's annualized expense ratio, multiplied by the average account value over the period, then multiplied by the number of days in the Fund's most recent fiscal half-year and divided by 365.
It is important to note that the expense amounts shown in the table are meant to highlight only ongoing costs of investing in the Fund. As a shareholder of the Fund, you do not incur any transaction costs, such as sales charges, redemption or exchange fees. Expenses paid during the period do not include any insurance charges imposed by your insurance company's separate account. The hypothetical example provided is useful in comparing ongoing costs only and will not help you determine the relative total costs of owning different funds whose shareholders may incur transaction costs.
Compare with other funds
Since all mutual funds are required to include the same hypothetical calculations about expenses in shareholder reports, you can use this information to compare the ongoing cost of investing in the Fund with other funds. To do so, compare the 5% hypothetical example with the 5% hypothetical examples of other funds. As you compare hypothetical examples of other funds, it is important to note that hypothetical examples are meant to highlight the ongoing cost of investing in a fund and do not reflect any transaction costs, such as sales charges, redemption fees or exchange fees that may be incurred by shareholders of other funds. Expenses paid during the period do not include any insurance charges imposed by your insurance company's separate accounts.
1
Wanger U.S. Smaller Companies 2007 Semiannual Report

Doomsayers vs. Doomslayers
Bad news seems to attract more attention than good news. Tabloid newspapers and the evening news thrive on sensational stories. "If it bleeds, it leads!" the media says, so disasters and doomsayers make headlines while good news is ignored.
Global warming is the current source of much concern and, therefore, much media and political focus. However, declarations of impending disaster for the planet and its inhabitants aren't new.
Doomsayers – Creating Concerns
In 1798, Thomas Malthus wrote An Essay on the Principal of Population.1 He noted that unchecked populations grow geometrically. For illustration, he modeled a population doubling every 25 years. In contrast, he postulated food supplies growing arithmetically. In 1998 therefore, the calculated population would be 256-times its 1798 level while food production would be nine times as large as in 1798. The poor would be "reduced to severe distress" and the actual population increase would revolve around the relatively slow increase in food production.
Moving forward 170 years, Paul Ehrlich's 1968 book, The Population Bomb,2 predicted imminent disaster and became the best-selling environmental tract of all time. He wrote, "The battle to feed all of humanity is over. In the 1970s and 1980s hundreds of millions of people will starve to death in spite of any crash programs embarked upon now." He stated that the world's population roughly doubled every thousand years from about 8000 BC to 1650, then doubled again in 200 years and again in 80 years, and appeared to be doubling over 35 years at the time of the book's publication.
Ehrlich's book also addressed pollution. "In Los Angeles and similar cities the human population has exceeded the carrying capacity of the environment—at least with respect to the ability of the atmosphere to remove waste." He stated, "It seems unlikely that much improvement can be expected...in air pollution until a major shift in the economy takes place." He recommended a shift away from gasoline-powered cars. To his credit, Ehrlich did mention that successful pollution control was possible.
Limits to Growth3 was first published in 1972, and became another best-selling doomsday book. It added resource depletion as a concern in addition to population growth and pollution. Using sophisticated computer models introduced by MIT professor Jay Forrester, the authors predicted long-term disaster: "If present growth trends...continue unchanged, the limits to growth on this planet will be reached sometime within the next one hundred years." (It's better to make a prediction that can be proven right but not wrong within your lifetime.) "The most probable result will be a rather sudden and uncontrollable decline in both population and industrial capacity." The authors recognized the need for more study, but "end(ed) on a note of urgency."
Adding another worry, the April 28, 1975 issue of Newsweek included an article titled, "The Cooling World."4 It quoted studies showing a temperature drop from 1945 to 1968 and then a sudden large increase in snow cover in the northern hemisphere. The article stated, "There are ominous signs that the earth's weather patterns have begun to change dramatically, and that these changes may portend a drastic decline in food production—with serious political implications for just about every nation on Earth."
The Newsweek story went on to report, "Meteorologists disagree about the cause and extent of the trend...but are almost unanimous in the view that the trend will reduce agricultural productivity for the rest of the century." The underlying prediction: "Resulting famines could be catastrophic."
In 2004, three of the original four Limits to Growth authors published Limits to Growth, The 30-Year Update.5 The authors offered a somewhat more positive tone but predicted that growth would not continue much past the year 2010.
The authors stated that the world population increase had slowed to a 1.2% growth rate, or a 60 year doubling period. That represents 75 million persons per year, or the equivalent of adding the population of "six Calcuttas." They did concede that air and water pollution has dropped in many developed countries, and agreed that the ozone hole over Antarctica will disappear by mid-century.
The authors also admitted that more hydrocarbon deposits were proven than used in the previous 30 years, and despite increased demand, the ratios of reserves to production increased. Consequently, while in 1970 world oil reserves were to be depleted by 2002, the update suggested depletion by 2037. Natural gas depletion was deferred from 2009 to 2065. Data on critical industrial metals were also updated. Assuming increases in consumption, depletion of copper and zinc reserves were postponed at least 20 years. The authors also noted that huge potential additional supplies were not yet in reserve statistics.
But the update also reiterated ominous food scarcity themes and said per-capita grain production peaked in the mid-80s. There is a widespread persistence of hunger, as "the number of hungry people has remained constant as the population has grown." The authors continued to believe that improved technology would not offset the effects of exponential growth.
As I mentioned, today's environmental doomsday headline grabber is global
2
Wanger U.S. Smaller Companies 2007 Semiannual Report
warming. In 2006 an Oscar-winning documentary called, "An Inconvenient Truth" highlighted the potential consequences of higher temperatures, predicting rising ocean levels, animal species extinctions, and food and water shortages. Its creator suggested how people could cut carbon dioxide emissions in order to reduce the problem.
Doomslayers – Presenting the Facts
Are conditions bad and likely to get worse? Julian Simon, a University of Maryland business school professor, became obsessed with data about population growth and prosperity. He found Ehrlich's books and comments to be "a juggernaut of environmentalist hysteria."6 He noted that virtually all data series indicated that the human condition had improved. In 1980, he became the first self-proclaimed doomslayer, and published a fact-filled, footnoted article in Science magazine: "Resources, Population, Environment: An Oversupply of False Bad News."7 Simon went so far as to challenge Ehrlich's theory that overpopulation and depletion would cause prices of raw materials to rise. Ehrlich accepted a 10-year wager with Simon and the battle lines were drawn. Between 1980 and 1990, the world's population saw its largest 10-year increase ever, but materials prices fell. In October 1990, Simon accepted a check from Ehrlich!
Determined to report the facts, Simon went on to publish five books showing data that the doomsayers were wrong. He died in 1998 leaving behind manuscripts that resulted in a sixth book completed in 2000 by Stephen Moore: It's Getting Better all the Time, 100 Greatest Trends of the Last 100 Years.8 In his introduction, Moore wrote, "The central premise of this book is that there has been more improvement in the human condition in the past 100 years than in all of the previous centuries..." Here is a sampling of the book's facts that support its title:
• Since data collection began, life expectancies rose, infant mortality fell, some diseases were eradicated while mortality from others dropped. Job-related fatalities fell since data became available in the 1930s, long before OSHA's creation.
• Per-capita income and wealth rose despite shorter work weeks. Educational attainment jumped. Income disparities by gender and race receded. Most low income people acquired items previously considered "luxuries" and many achieved mid- or high-income status.
• Emissions per unit of GDP fell since the 1930s (prior to regulations) and absolute air quality improved since the data series started in the 1970s. The quality of surface water rose. Forests in the USA have increased in size and density since at least the 1950s. Energy prices relative to wages have plummeted since 1900.
In what could be considered an addendum to Simon's work, the Cato Institute earlier this year published The Improving State of the World.9 Its data also refutes most of what the doomsayers have said:
• Worldwide food supplies per capita increased 24% from 1961 to 2002. "Between 1969-71 and 2000-02, increases in food supplies reduced chronic undernourishment in developing countries from 956 million to 815 million (or from 37 to 17 percent) despite an 83% growth in their population."
• The environment in the developed world is notably cleaner than it was 40 years ago. Air and water pollution is down. Developing countries are increasingly addressing pollution and are making progress in many areas.
• Improved developing world health, wealth, food supplies, and the start of improved environments, are due to globalization. Trade increases wealth and disseminates technology.
• The long-term price trend of virtually every commodity that is used today has been downward over the past two centuries, in terms of both inflation-adjusted dollars and also in terms of minutes worked for purchase.
Investment Discipline – Embracing the Facts
Doomsayers sometimes sell a lot of books, magazines or movies, which in turn generate discussion and possibly action. Potential disasters such as stratospheric ozone depletion can be averted as a result. But often, doomsayers' predictions have turned out to be wrong and then largely forgotten. Mankind has a tremendous ability to solve problems, especially via democratic and capitalistic systems.
While doomsayers often are proven wrong, researching to find the elements of truth behind their claims can provide investment opportunities. When problems are real and are about to be addressed, there is usually money to be made, or lost.
Though the prices of basic materials have indeed fallen over the long run, our international portfolio managers detected an up cycle of accelerating demand and strong prices. We hired an analyst, Fritz Kaegi, to specialize in that group. He confirmed that companies had underinvested in several areas, and believed prices and profits could stay strong for a while. We've discussed some resulting investments in fund shareholder reports.
The world has not run out of oil; predictions of $100 oil proved to be wrong, or at least decades too early. Energy stocks have been
3
Wanger U.S. Smaller Companies 2007 Semiannual Report
cyclical for a long time. Our funds now have significant investments in energy as we believe this up cycle will persist. Our energy analyst, Bill Doyle, is especially positive on oil service companies.
Doomsayers will come and go; some will raise valid concerns, which, if history repeats itself, will be successfully addressed. We expect to continue to sort through the rhetoric, determine the facts, and work to invest appropriately.


Charles P. McQuaid
President and Chief Investment Officer
Columbia Wanger Asset Management, L.P.
1 Source: Wired.com, "The Doomslayer" by Ed Regis, February 1997.
2 Ehrlich, Paul, The Population Bomb (Buccaneer Books, Inc, 1968, 1971)
3 Meadows, Donella H; Meadows, Dennis L; Randers, Jorgen; Behrens III, William W, The Limits to Growth (New York: Universe Books, 1972)
4 Reprinted in the The American Spectator, May/June 2002. Originally printed in Newsweek, "The Cooling World," reported by Peter Gwynne, April 28, 1975.
5 Meadows, Donella; Randers, Jorgen; Meadows, Dennis, Limits to Growth – The 30-Year Update, (Vermont: Chelsea Green Publishing Company, 2004)
6 Source: Wired.com, "The Doomslayer" by Ed Regis, February 1997.
7 Science, 27 June 1980, Vol. 208, no. 4451.
8 Moore, Stephen; Simon, Julian, It's Getting Better All the Time: 100 Greatest Trends of the Last 100 Years (Washington, DC: Cato Institute, 2000). Bullet pointed data applies to the United States.
9 Goklany, Indur M, The Improving State of the World: Why We're Living Longer, Healthier, More Comfortable Lives on a Cleaner Planet (Washington DC: Cato Institute, 2007)
Author's Note:
The author considers himself to be a disciple of Julian Simon. However, the author also has recycled and conserved energy for years. He has replaced numerous incandescent light bulbs with compact fluorescents. His wife happily drives a hybrid vehicle. And he has not emitted tons of carbon dioxide by flying in a private jet to Davos in order to tell other people to conserve.
4
Wanger U.S. Smaller Companies 2007 Semiannual Report

Performance Review Wanger U.S. Smaller Companies

Robert A. Mohn
Portfolio Manager
Performance data quoted represents past performance and current performance may be lower or higher. Past performance is no guarantee of future results. The investment return and principal value of an investment in the Fund will fluctuate so that shares, when redeemed, may be worth more or less than the original cost. For daily and month-end performance updates, please call 1-888-4-WANGER.
Wanger U.S. Smaller Companies gained 10.82% in the first half of 2007, outperforming the 6.45% return of the Russell 2000® Index. An underweight in financials contributed to the Fund's outperformance. A victim of deteriorating fundamentals and lingering concerns over credit losses, the financial sector was off 6% for the half year in the Russell 2000 Index. Wanger U.S. Smaller Companies had less than half of the index weighting in financials at the end of the period.
Strong performance of consumer stocks also bolstered the Fund's relative performance. ITT Educational Services, a provider of post-secondary degree programs, was the Fund's leader in the consumer sector and overall. The stock was up 77% on strong student enrollment growth. True Religion Apparel, a maker of premium denim clothing, gained 33% for the six months on aggressive retail store opening plans. Apparel retailer J. Crew Group gained 40% thanks to explosive earnings growth of 70% year-over-year.
Three Fund holdings received significant takeover offers during the period. Kronos, a labor management software developer, gained 50% on takeover news and Florida Rock, a provider of aggregates and concrete used in construction, soared 57%. Dobson Communications, a rural and small city cellular service provider, gained 28% on speculation that the company would be bought out. On June 29, after the market closed on the last day of the period, Dobson did indeed announce they were being acquired by AT&T.
Other winners included Flir Systems, a manufacturer of infrared cameras. The stock was up 45% for the half year on news of large contract wins with the U.S. Army. Atwood Oceanics and FMC Technologies increased due to healthy demand for offshore drilling contractors (Atwood Oceanics) and oil and gas well head manufacturers (FMC Technologies). Atwood gained 40% while FMC Technologies posted a 29% gain.
Laggards included ESCO Technologies, a maker of automatic electric meter readers. The stock fell 20% on news of possible changes in a large contract with a California utility. Global Payments fell 14% on slowing growth in credit card processing and price competition in its money transfer business. Two biotech names also landed in the loser column. The Medicines Company, a maker of cardiovascular drugs, fell 39% as an appeal to extend one of its major drug patents was denied. We sold the Fund's position in the stock. Nektar Therapeutics, a provider of drug delivery technologies, was off 38% for the six months as sales of the company's inhaleable insulin came in under expectations.
While certain sectors, such as housing, have been under a lot of pressure so far this year, we believe the overall economy remains remarkably healthy. We feel the market is continuing to offer plenty of investment opportunities for discriminating small-cap investors.
Risks include stock market fluctuations due to economic and business developments. Investments in small- and mid-cap companies may be subject to greater volatility and price fluctuations because they may be thinly traded and less liquid.
Fund's Positions in Mentioned Holdings
as of 6/30/07
| ITT Educational Services | | | 4.3 | % | |
| FMC Technologies | | | 2.3 | % | |
| Dobson Communications | | | 1.3 | % | |
| Global Payments | | | 1.2 | % | |
| Atwood Oceanics | | | 1.1 | % | |
| ESCO Technologies | | | 1.1 | % | |
| True Religion Apparel | | | 1.0 | % | |
| Florida Rock | | | 0.8 | % | |
| Flir Systems | | | 0.7 | % | |
| J. Crew Group | | | 0.6 | % | |
| Nektar Therapeutics | | | 0.3 | % | |
| The Medicines Company | | | 0.0 | % | |
| Kronos | | | 0.0 | % | |
Portfolio holdings are subject to change periodically and may not be representative of current characteristics and holdings.
5
Wanger U.S. Smaller Companies 2007 Semiannual Report
Growth of a $10,000 Investment in
Wanger U.S. Smaller Companies
Total return for each period,
May 3, 1995 (inception date) through June 30, 2007

This graph compares the results of $10,000 invested in Wanger U.S. Smaller Companies on May 3, 1995 (the date the Fund began operations) through June 30, 2007, with the Russell 2000 Index. Dividends and capital gains are reinvested. Performance shown here is past performance, which cannot guarantee future results. Current performance may be higher or lower. The investment return and principal value of an investment in the Fund will fluctuate so that Fund shares, when redeemed, may be worth more or less than their original cost. Performance changes over time. Current returns for the Fund may be different than that shown. For daily and month-end performance updates, please contact us at 1-888-4-WANGER.
Results as of June 30, 2007
| | | 2nd quarter | | Year to date | | 1 year | |
| Wanger U.S. Smaller Companies | | | 6.69 | % | | | 10.82 | % | | | 17.21 | % | |
| Russell 2000 Index | | | 4.42 | | | | 6.45 | | | | 16.43 | | |
| S&P MidCap 400 | | | 5.84 | | | | 11.98 | | | | 18.51 | | |
| S&P 500 | | | 6.28 | | | | 6.96 | | | | 20.59 | | |
NAV as of 6/30/07: $38.13
Performance numbers reflect all Fund expenses but do not include any insurance charge imposed by your insurance company's separate accounts. If performance included the effect of these additional charges, it would be lower.
Wanger U.S. Smaller Companies annual operating expense ratio is 0.95%. Annual operating expense ratio is as stated in the Fund's prospectus that is current as of the date of this report. Differences in expense ratios disclosed elsewhere in this report may result from including fee waivers and reimbursements as well as different time periods used in calculating the ratios.
The graph and table do not reflect taxes that a shareholder would pay on Fund distributions or the sale of Fund shares.
The Russell 2000 Index is a market-weighted index of 2,000 of the smallest U.S. companies taken from the 3,000 largest U.S. companies based on market capitalization. The S&P MidCap 400 is an unmanaged, market value-weighted index of 400 mid-cap U.S. companies. The S&P 500 is a broad, market-weighted average of 500 widely-held large capitalization U.S. stocks. All indexes are unmanaged and include reinvested dividends. It is not possible to invest directly in an index.
Portfolio characteristics and holdings are subject to change periodically and may not be representative of current characteristics and holdings.
Top 5 Industries
As a % of net assets, as of 6/30/07
| Information Group | | | 29.2 | % | |
| Consumer Goods & Services | | | 21.9 | | |
| Industrial Goods & Services | | | 14.2 | | |
| Health Care | | | 10.9 | | |
| Finance | | | 10.0 | | |
Top 10 Holdings
As a % of net assets, as of 6/30/07
1. ITT Educational Services
Post-secondary Degree Programs | | | 4.3 | % | |
2. FMC Technologies
Oil & Gas Well Head Manufacturer | | | 2.3 | | |
3. Genlyte Group
Commercial Lighting Fixtures | | | 2.3 | | |
4. Ametek
Aerospace/Industrial Instruments | | | 1.9 | | |
5. Abercrombie & Fitch
Teen Apparel Retailer | | | 1.9 | | |
6. Avid Technology
Digital Nonlinear Editing Software & Systems | | | 1.8 | | |
7. AmeriCredit
Auto Lending | | | 1.8 | | |
8. Time Warner Telecom
Fiber Optic Telephone/Data Services | | | 1.8 | | |
9. American Tower
Communications Towers in USA & Mexico | | | 1.6 | | |
10. Pentair
Pumps & Water Treatment | | | 1.6 | | |
6
Wanger U.S. Smaller Companies 2007 Semiannual Report
Wanger U.S. Smaller Companies
Statement of Investments (Unaudited) June 30, 2007
Number of
Shares | | | | Value | |
| | | | | Common Stocks – 97.9% | | | | | |
| | | Information Group – 29.2% | |
| | | Business Software – 5.4% | |
| | 874,900 | | | Avid Technology (a)
Digital Nonlinear Editing Software & Systems | | | $30,927,715
| | |
| | 395,000 | | | Micros Systems (a)
Information Systems for Restaurants & Hotels | | | 21,488,000 | | |
| | 2,280,000 | | | Novell (a)
Directory, Operating System & Identity
Management Software | | | 17,761,200 | | |
| | 327,200 | | | Parametric Technology (a)
Engineering Software & Services | | | 7,070,792 | | |
| | 304,000 | | | Concur Technologies (a)
Web Enabled Cost & Expense Management Software | | | 6,946,400 | | |
| | 195,400 | | | Blackbaud
Software & Services for Non-Profits | | | 4,314,432 | | |
| | 250,000 | | | Agile Software (a)
Product Design Software | | | 2,015,000 | | |
| | | | 90,523,539 | | |
| | | Mobile Communications – 4.1% | |
| | 640,000 | | | American Tower (a)
Communications Towers in USA & Mexico | | | 26,880,000 | | |
| | 2,033,000 | | | Dobson Communications (a)
Rural & Small City Cellular Telephone Services | | | 22,586,630 | | |
| | 495,000 | | | Crown Castle International (a)
Communications Towers | | | 17,953,650 | | |
| | 88,000 | | | Globalstar (a)
Satellite Mobile Voice & Data Carrier | | | 910,800 | | |
| | 75,000 | | | Openwave Systems
Internet Software for Mobile Devices | | | 469,500 | | |
| | | | 68,800,580 | | |
| | | Semiconductors & Related Equipment – 3.4% | |
| | 1,310,500 | | | Integrated Device Technology (a)
Communications Semiconductors | | | 20,011,335 | | |
| | 473,000 | | | Microsemi (a)
Analog/Mixed Signal Semiconductors | | | 11,328,350 | | |
| | 670,000 | | | Entegris (a)
Semiconductor Wafer Shipping & Handling Products | | | 7,959,600 | | |
| | 601,000 | | | AMIS Holdings (a)
Mixed-signal Semiconductors | | | 7,524,520 | | |
| | 189,300 | | | Supertex (a)
Mixed-signal Semiconductors | | | 5,932,662 | | |
Number of
Shares | | | | Value | |
| | 140,000 | | | Littelfuse (a)
Little Fuses | | | $4,727,800
| | |
| | | | 57,484,267 | | |
| | | Telecommunications Equipment – 2.7% | |
| | 2,430,000 | | | Tellabs (a)
Telecommunications Equipment | | | 26,146,800 | | |
| | 425,000 | | | Polycom (a)
Video Conferencing Equipment | | | 14,280,000 | | |
| | 85,000 | | | Ciena (a)
Optical Transport & Broadband Access Equipment | | | 3,071,050 | | |
| | 100,000 | | | Symmetricom (a)
Network Timing & Synchronization Devices | | | 840,000 | | |
| | | | 44,337,850 | | |
| | | Instrumentation – 2.2% | |
| | 145,000 | | | Mettler Toledo (a)
Laboratory Equipment | | | 13,848,950 | | |
| | 368,000 | | | Trimble Navigation (a)
GPS-based Instruments | | | 11,849,600 | | |
| | 250,000 | | | Flir Systems (a)
Infrared Cameras | | | 11,562,500 | | |
| | | | 37,261,050 | | |
| | | Internet Related – 2.1% | |
| | 530,000 | | | ValueClick (a)
Internet Advertising | | | 15,613,800 | | |
| | 1,420,000 | | | CNET Networks (a)
Internet Advertising on Niche Websites | | | 11,629,800 | | |
| | 488,400 | | | TheStreet.com
Financial Information Website Publisher | | | 5,313,792 | | |
| | 310,000 | | | SkillSoft (a)
Web-based Learning Solutions (E-Learning) | | | 2,879,900 | | |
| | | | 35,437,292 | | |
| | | Telephone Services – 1.8% | |
| | 1,491,000 | | | Time Warner Telecom (a)
Fiber Optic Telephone/Data Services | | | 29,969,100 | | |
See accompanying notes to financial statements.
7
Wanger U.S. Smaller Companies 2007 Semiannual Report
Wanger U.S. Smaller Companies
Statement of Investments (Unaudited) June 30, 2007
Number of
Shares | | | | Value | |
| | | Business Information & Marketing Services – 1.5% | |
| | 485,000 | | | Ceridian (a)
HR Services & Payment Processing | | | $16,975,000
| | |
| | 443,200 | | | Navigant Consulting (a)
Financial Consulting Firm | | | 8,225,792 | | |
| | | | 25,200,792 | | |
| | | Computer Hardware & Related Equipment – 1.4% | |
| | 245,600 | | | Amphenol
Electronic Connectors | | | 8,755,640 | | |
| | 158,100 | | | Nice Systems (Israel) (a)
Audio & Video Recording Solutions | | | 5,492,394 | | |
| | 90,000 | | | Netgear (a)
Networking Products for Small Business & Home | | | 3,262,500 | | |
| | 81,600 | | | Rogers (a)
PCB Laminates & High-performance Foams | | | 3,019,200 | | |
| | 30,000 | | | Belden CDT
Specialty Cable | | | 1,660,500 | | |
| | 50,000 | | | Avocent (a)
Computer Control Switches | | | 1,450,500 | | |
| | | | 23,640,734 | | |
| | | Financial Processors – 1.2% | |
| | 516,880 | | | Global Payments
Credit Card Processor | | | 20,494,292 | | |
| | | CATV – 1.0% | |
| | 740,000 | | | Discovery Holding (a)
CATV Programming | | | 17,012,600 | | |
| | | Radio – 0.7% | |
| | 561,900 | | | Salem Communications
Radio Stations for Religious Programming | | | 6,231,471 | | |
| | 260,000 | | | Cumulus Media (a)
Radio Stations in Small Cities | | | 2,431,000 | | |
| | 515,000 | | | Spanish Broadcasting System (a)
Spanish Language Radio Stations | | | 2,214,500 | | |
| | | | 10,876,971 | | |
| | | TV Broadcasting – 0.6% | |
| | 1,030,000 | | | Entravision Communications (a)
Spanish Language TV, Radio & Outdoor | | | 10,742,900 | | |
Number of
Shares | | | | Value | |
| | | Computer Services – 0.6% | |
| | 753,000 | | | RCM Technologies (Germany) (a)(b)
Technology & Engineering Services | | | $5,865,870
| | |
| | 705,500 | | | AnswerThink (a)
IT Integration & Best Practice Research | | | 2,553,910 | | |
| | 45,000 | | | SRA International (a)
Government IT Services | | | 1,136,700 | | |
| | | | 9,556,480 | | |
| | | Television Programming – 0.4% | |
| | 600,000 | | | Lions Gate Entertainment (a)
Film & TV Studio | | | 6,618,000 | | |
| | | Gaming Equipment & Services – 0.1% | |
| | 98,500 | | | Shuffle Master (a)
Card Shufflers & Casino Games | | | 1,635,100 | | |
| Total Information Group | | | 489,591,547 | | |
| | | Consumer Goods & Services – 21.9% | |
| | | Retail – 5.6% | |
| | 431,000 | | | Abercrombie & Fitch
Teen Apparel Retailer | | | 31,454,380 | | |
| | 515,000 | | | Chico's FAS (a)
Women's Specialty Retailer | | | 12,535,100 | | |
| | 490,000 | | | Urban Outfitters (a)
Apparel & Home Specialty Retailer | | | 11,774,700 | | |
| | 175,000 | | | J. Crew Group (a)
Multi-channel Branded Retailer | | | 9,465,750 | | |
| | 265,000 | | | AnnTaylor Stores (a)
Women's Apparel Retailer | | | 9,386,300 | | |
| | 163,000 | | | Genesco (a)
Multi-concept Branded Footwear Retailer | | | 8,526,530 | | |
| | 409,150 | | | Christopher & Banks
Women's Apparel Retailer | | | 7,016,923 | | |
| | 150,000 | | | Gaiam (a)
Healthy Living Catalogs & E-Commerce | | | 2,734,500 | | |
| | | | 92,894,183 | | |
| | | Other Consumer Services – 5.5% | |
| | 620,000 | | | ITT Educational Services (a)
Post-secondary Degree Programs | | | 72,775,600 | | |
| | 150,000 | | | Weight Watchers International
Weight Loss Programs | | | 7,626,000 | | |
See accompanying notes to financial statements.
8
Wanger U.S. Smaller Companies 2007 Semiannual Report
Wanger U.S. Smaller Companies
Statement of Investments (Unaudited) June 30, 2007
Number of
Shares | | | | Value | |
| | | Other Consumer Services – 5.5% (cont) | |
| | 99,000 | | | NutriSystem (a)
Weight Loss Programs | | | $6,914,160
| | |
| | 200,000 | | | Universal Technical Institute (a)
Vocational Training | | | 5,078,000 | | |
| | | | 92,393,760 | | |
| | | Apparel – 3.8% | |
| | 459,000 | | | Coach (a)
Designer & Retailer of Branded Leather Accessories | | | 21,752,010 | | |
| | 860,000 | | | True Religion Apparel (a)
Premium Denim | | | 17,483,800 | | |
| | 394,200 | | | Oxford Industries
Branded & Private Label Apparel | | | 17,478,828 | | |
| | 240,000 | | | Carter's (a)
Children's Branded Apparel | | | 6,225,600 | | |
| | 45,000 | | | Heelys (a)
Wheeled Footwear | | | 1,163,700 | | |
| | | | 64,103,938 | | |
| | | Leisure Products – 2.0% | |
| | 366,300 | | | International Speedway
Largest Motorsports Racetrack Owner & Operator | | | 19,307,673 | | |
| | 248,200 | | | Speedway Motorsports
Motorsport Racetrack Owner & Operator | | | 9,923,036 | | |
| | 50,000 | | | Polaris Industries
Leisure Vehicles & Related Products | | | 2,708,000 | | |
| | 40,000 | | | Thor Industries
RV & Bus Manufacturer | | | 1,805,600 | | |
| | | | 33,744,309 | | |
| | | Other Durable Goods – 1.5% | |
| | 1,478,300 | | | Champion Enterprises (a)
Manufactured Homes | | | 14,531,689 | | |
| | 288,400 | | | Cavco Industries (a)
Higher End Manufactured Homes | | | 10,820,768 | | |
| | | | 25,352,457 | | |
Number of
Shares | | | | Value | |
| | | Nondurables – 1.0% | |
| | 323,000 | | | Scotts Miracle-Gro
Consumer Lawn & Garden Products | | | $13,869,620
| | |
| | 72,000 | | | Jarden (a)
Branded Household Products | | | 3,096,720 | | |
| | | | 16,966,340 | | |
| | | Consumer Goods Distribution – 1.0% | |
| | 433,500 | | | Pool
Distributor of Swimming Pool Supplies & Equipment | | | 16,919,505 | | |
| | | | | Casinos & Gaming – 0.5% | | | | | |
| | 280,000 | | | Pinnacle Entertainment (a)
Regional Casino Operator | | | 7,882,000 | | |
| | | Restaurants – 0.5% | |
| | 337,500 | | | Sonic (a)
Quick Service Restaurant | | | 7,465,500 | | |
| | | Food & Beverage – 0.2% | |
| | 90,000 | | | Hansen Natural (a)
Alternative Beverages | | | 3,868,200 | | |
| | | Travel – 0.2% | |
| | 45,000 | | | Vail Resorts (a)
Ski Resort Operator & Developer | | | 2,739,150 | | |
| | | Furniture & Textiles – 0.1% | |
| | 56,200 | | | HNI
Office Furniture & Fireplaces | | | 2,304,200 | | |
| Total Consumer Goods & Services | | | 366,633,542 | | |
| | | Industrial Goods & Services – 14.2% | |
| | | Machinery – 7.6% | |
| | 795,000 | | | Ametek
Aerospace/Industrial Instruments | | | 31,545,600 | | |
| | 690,600 | | | Pentair
Pumps & Water Treatment | | | 26,636,442 | | |
| | 527,300 | | | ESCO Technologies
Automatic Electric Meter Readers | | | 19,119,898 | | |
| | 365,100 | | | Nordson
Dispensing Systems for Adhesives & Coatings | | | 18,313,416 | | |
See accompanying notes to financial statements.
9
Wanger U.S. Smaller Companies 2007 Semiannual Report
Wanger U.S. Smaller Companies
Statement of Investments (Unaudited) June 30, 2007
Number of
Shares | | | | Value | |
| | | Machinery – 7.6% (cont) | |
| | 191,300 | | | Mine Safety Appliances
Safety Equipment | | | $8,371,288
| | |
| | 196,000 | | | Clarcor
Mobile & Industrial Filters | | | 7,336,280 | | |
| | 177,300 | | | Donaldson
Industrial Air Filtration | | | 6,303,015 | | |
| | 71,800 | | | Toro
Turf Maintenance Equipment | | | 4,228,302 | | |
| | 132,000 | | | Goodman Global (a)
HVAC Equipment Manufacturer | | | 2,933,040 | | |
| | 50,000 | | | Kaydon
Specialized Friction & Motion Control Products | | | 2,606,000 | | |
| | | | 127,393,281 | | |
| | | Electrical Components – 2.3% | |
| | 493,000 | | | Genlyte Group (a)
Commercial Lighting Fixtures | | | 38,720,220 | | |
| | | Construction – 1.1% | |
| | 191,400 | | | Florida Rock
Aggregates & Concrete | | | 12,919,500 | | |
| | 35,000 | | | Martin Marietta Materials
Aggregates | | | 5,670,700 | | |
| | | | 18,590,200 | | |
| | | Outsourcing Services – 1.1% | |
| | 400,000 | | | Quanta Services (a)
Electrical & Telecom Construction Services | | | 12,268,000 | | |
| | 165,000 | | | Administaff
Professional Employer Organization | | | 5,525,850 | | |
| | | | 17,793,850 | | |
| | | Other Industrial Services – 1.0% | |
| | 340,000 | | | American Commercial Lines (a)
Operator of Inland Barges/Builder of Inland Barges | | | 8,857,000 | | |
| | 180,000 | | | Labor Ready (a)
Temporary Manual Labor | | | 4,159,800 | | |
| | 89,000 | | | G&K Services
Uniform Rental | | | 3,516,390 | | |
| | | | 16,533,190 | | |
Number of
Shares | | | | Value | |
| | | Industrial Distribution – 0.5% | |
| | 70,000 | | | Watsco
HVAC Distribution | | | $3,808,000
| | |
| | 50,000 | | | Airgas
Industrial Gas Distributor | | | 2,395,000 | | |
| | 75,000 | | | Interline Brands (a)
Industrial Distribution | | | 1,956,000 | | |
| | | | 8,159,000 | | |
| | | Waste Management – 0.3% | |
| | 184,200 | | | Waste Connections (a)
Solid Waste Management | | | 5,570,208 | | |
| | | Industrial Materials & Specialty Chemicals – 0.3% | |
| | 155,000 | | | Drew Industries (a)
RV & Manufactured Home Components | | | 5,136,700 | | |
| Total Industrial Goods & Services | | | 237,896,649 | | |
| | | Health Care – 10.9% | |
| | | Biotechnology & Drug Delivery – 4.5% | |
| | 955,000 | | | PDL BioPharma (a)
Proprietary Monoclonal Antibodies | | | 22,251,500 | | |
| | 692,400 | | | BioMarin (a)
Biotech Focused on Orphan Diseases | | | 12,421,656 | | |
| | 535,000 | | | Nektar Therapeutics (a)
Drug Delivery Technologies | | | 5,077,150 | | |
| | 3,690,300 | | | Medicure (a) | | | 4,981,905 | | |
| | 738,060 | | | Medicure - Warrants (a)(c)
Cardiovascular Biotech Company | | | 442,836 | | |
| | 125,000 | | | Myriad Genetics (a)
Drugs/Diagnostics Hybrid | | | 4,648,750 | | |
| | 1,215,000 | | | Decode Genetics (a)
Drugs for Heart Attack, Asthma & Vascular Disease | | | 4,538,025 | | |
| | 204,400 | | | Medarex (a)
Humanized Antibodies | | | 2,920,876 | | |
| | 650,000 | | | La Jolla Pharmaceutical (a)
Lupus Treatment | | | 2,912,000 | | |
| | 243,994 | | | Array Biopharma (a)
Drugs for Cancer & Inflammatory Diseases | | | 2,847,410 | | |
| | 248,600 | | | Arena Pharmaceuticals (a)
Novel Drug Targeting Technology | | | 2,732,114 | | |
| | 500,000 | | | IsoRay (a) | | | 2,520,000 | | |
See accompanying notes to financial statements.
10
Wanger U.S. Smaller Companies 2007 Semiannual Report
Wanger U.S. Smaller Companies
Statement of Investments (Unaudited) June 30, 2007
Number of
Shares | | | | Value | |
| | | Biotechnology & Drug Delivery – 4.5% (cont) | |
| | 100,000 | | | IsoRay - Warrants (a)(c)
Radiology Cancer Company | | | $114,000
| | |
| | 251,400 | | | Seattle Genetics (a)
Antibody-based Therapies for Cancer | | | 2,466,234 | | |
| | 271,688 | | | Neurogen (a)
Development-stage Biotech Focused on Neurology | | | 1,804,008 | | |
| | 450,000 | | | Genitope (a)
Cancer Vaccine | | | 1,737,000 | | |
| | 220,000 | | | Pharmacopeia (a)
Biotech Company with Broad Early-stage Pipeline | | | 1,221,000 | | |
| | 273,500 | | | Nuvelo (a)
Development-stage Biotech Focused on
Cardiovascular/Cancer | | | 743,920 | | |
| | 250,000 | | | Locus Discovery, Series D, Pfd. (a)(c) | | | 72,500 | | |
| | 128,859 | | | Locus Discovery, Series B, Pfd. (a)(c)
High Throughput Rational Drug Design | | | 37,369 | | |
| | | | 76,490,253 | | |
| | | Medical Equipment & Devices – 2.1% | |
| | 412,000 | | | Edwards Lifesciences (a)
Heart Valves | | | 20,328,080 | | |
| | 105,000 | | | Vital Signs
Anesthesia, Respiratory & Sleep Products | | | 5,832,750 | | |
| | 137,227 | | | Advanced Medical Optics (a)
Medical Devices for Eye Care | | | 4,786,478 | | |
| | 93,500 | | | Orthofix International (a)
Bone Fixation & Stimulation Devices | | | 4,204,695 | | |
| | | | 35,152,003 | | |
| | | Health Care Services – 1.6% | |
| | 400,000 | | | Lincare Holdings (a)
Home Health Care Services | | | 15,940,000 | | |
| | 180,000 | | | LCA-Vision
Lasik Surgery Centers | | | 8,506,800 | | |
| | 165,000 | | | PSS World Medical (a)
Medical Supplies | | | 3,006,300 | | |
| | | | 27,453,100 | | |
Number of
Shares | | | | Value | |
| | | Pharmaceuticals – 1.4% | |
| | 270,000 | | | MGI Pharma (a)
Specialty Pharmaceuticals for Oncology & Acute Care | | | $6,039,900
| | |
| | 790,000 | | | QLT (a)
Specialty Pharmaceuticals for Ophthalmology
& Dermatology | | | 5,846,000 | | |
| | 140,000 | | | Medicis Pharmaceutical
Specialty Pharmaceuticals for Dermatology | | | 4,275,600 | | |
| | 300,000 | | | Collagenex Pharmaceuticals (a)
Specialty Pharmaceuticals for Dermatology | | | 3,720,000 | | |
| | 505,000 | | | Barrier Therapeutics (a)
Specialty Pharmaceuticals for Dermatology | | | 3,282,500 | | |
| | | | 23,164,000 | | |
| | | Medical Supplies – 1.3% | |
| | 235,700 | | | ICU Medical (a)
Intravenous Therapy Products | | | 10,120,958 | | |
| | 190,000 | | | Arrow International
Disposable Catheters | | | 7,273,200 | | |
| | 70,700 | | | Techne (a)
Cytokines, Antibodies & Other Reagents for Life Science | | | 4,044,747 | | |
| | | | | | | | 21,438,905 | | |
| Total Health Care | | | 183,698,261 | | |
| | | Finance – 10.0% | |
| | | Insurance – 4.0% | |
| | 720,500 | | | HCC Insurance Holdings
Specialty Insurance | | | 24,071,905 | | |
| | 36,500 | | | Markel (a)
Specialty Insurance | | | 17,686,440 | | |
| | 276,000 | | | Leucadia National
Insurance Holding Company | | | 9,729,000 | | |
| | 105,000 | | | Philadelphia Consolidated Holding (a)
Specialty Insurance | | | 4,389,000 | | |
| | 87,000 | | | Delphi Financial Group
Group Employee Benefit Products & Services | | | 3,638,340 | | |
| | 75,000 | | | Endurance Specialty Holdings
Commercial Lines Insurance/Reinsurance | | | 3,003,000 | | |
| | 177,434 | | | Eastern Insurance Holdings (Germany)
Workers Comp & Specialty Insurance | | | 2,819,426 | | |
| | 77,000 | | | United America Indemnity (a)
Specialty Insurance | | | 1,914,990 | | |
| | | | 67,252,101 | | |
See accompanying notes to financial statements.
11
Wanger U.S. Smaller Companies 2007 Semiannual Report
Wanger U.S. Smaller Companies
Statement of Investments (Unaudited) June 30, 2007
Number of
Shares | | | | Value | |
| | | Finance Companies – 2.4% | |
| | 1,135,400 | | | AmeriCredit (a)
Auto Lending | | | $30,144,870
| | |
| | 144,800 | | | World Acceptance (a)
Personal Loans | | | 6,187,304 | | |
| | 130,000 | | | McGrath Rentcorp
Temporary Space & IT Rentals | | | 4,379,700 | | |
| | | | 40,711,874 | | |
| | | Banks – 2.2% | |
| | 284,500 | | | TCF Financial
Great Lakes Bank | | | 7,909,100 | | |
| | 146,975 | | | Chittenden
New England Bank | | | 5,136,776 | | |
| | 215,000 | | | First Busey
Illinois Bank | | | 4,297,850 | | |
| | 105,000 | | | MB Financial
Chicago Bank | | | 3,647,700 | | |
| | 187,000 | | | Pacific Continental
Niche Pacific N.W. Bank | | | 3,029,400 | | |
| | 95,000 | | | Greene County Bancshares
Tennessee Bank | | | 2,969,700 | | |
| | 125,000 | | | Lakeland Financial
Indiana Bank | | | 2,658,750 | | |
| | 114,816 | | | Glacier Bancorp
Mountain States Bank | | | 2,336,506 | | |
| | 75,000 | | | Old Second Bancorp
Illinois Bank | | | 2,187,000 | | |
| | 35,000 | | | Associated Banc-Corp
Midwest Bank | | | 1,144,500 | | |
| | 31,500 | | | West Bancorporation
Des Moines Commercial Bank | | | 503,055 | | |
| | | | 35,820,337 | | |
| | | Brokerage & Money Management – 1.1% | |
| | 642,000 | | | SEI Investments
Mutual Fund Administration & Investment Management | | | 18,643,680 | | |
Number of
Shares | | | | Value | |
| | | Savings & Loans – 0.3% | |
| | 168,000 | | | People's United
Connecticut Savings & Loan | | | $2,978,640
| | |
| | 85,200 | | | Anchor Bancorp Wisconsin
Wisconsin Thrift | | | 2,231,388 | | |
| | | | | | | | 5,210,028 | | |
| Total Finance | | | 167,638,020 | | |
| | | Energy & Minerals – 9.1% | |
| | | Oil Services – 4.9% | |
| | 490,700 | | | FMC Technologies (a)
Oil & Gas Well Head Manufacturer | | | 38,873,254 | | |
| | 275,800 | | | Atwood Oceanics (a)
Offshore Drilling Contractor | | | 18,925,396 | | |
| | 625,000 | | | Hanover Compressor (France) (a)
Natural Gas Compressor Rental & Fabrication | | | 14,906,250 | | |
| | 67,500 | | | CARBO Ceramics
Natural Gas Well Stimulants | | | 2,957,175 | | |
| | 89,900 | | | Tesco (a)
Developing New Well Drilling Technologies | | | 2,836,345 | | |
| | 71,500 | | | Tetra Technologies (a)
U.S.-based Services Company with Life of Field Approach | | | 2,016,300 | | |
| | 22,900 | | | Dresser-Rand Group (a)
Largest Manufacturer of Compressors | | | 904,550 | | |
| | 16,000 | | | Key Energy Services (a)
Well Workover Services | | | 296,480 | | |
| | | | 81,715,750 | | |
| | | Oil & Gas Producers – 4.1% | |
| | 400,000 | | | Ultra Petroleum (a)
Oil & Gas Producer | | | 22,096,000 | | |
| | 416,000 | | | Equitable Resources
Natural Gas Producer & Utility | | | 20,616,960 | | |
| | 195,000 | | | Quicksilver Resources (Germany) (a)
Natural Gas & Coal Seam Gas Producer | | | 8,693,100 | | |
| | 193,600 | | | Southwestern Energy (a)
Oil & Gas Producer | | | 8,615,200 | | |
| | 120,000 | | | Carrizo Oil & Gas (a)
Explores for Natural Gas & Crude Oil | | | 4,976,400 | | |
See accompanying notes to financial statements.
12
Wanger U.S. Smaller Companies 2007 Semiannual Report
Wanger U.S. Smaller Companies
Statement of Investments (Unaudited) June 30, 2007
Number of
Shares | | | | Value | |
| | | Oil & Gas Producers – 4.1% (cont) | |
| | 450,000 | | | Vaalco Energy (a)
Oil & Gas Producer | | | $2,173,500
| | |
| | 47,000 | | | St. Mary Land & Exploration
Oil & Gas Producer | | | 1,721,140 | | |
| | | | 68,892,300 | | |
| | | Oil Refining, Marketing & Distribution – 0.1% | |
| | 50,000 | | | Oneok
Natural Gas Distribution, Pipeline Processing & Trading | | | 2,520,500 | | |
| Total Energy & Minerals | | | 153,128,550 | | |
| | | Other – 2.6% | |
| | | Real Estate – 1.4% | |
| | 560,000 | | | DiamondRock Hospitality
Hotel Owner | | | 10,684,800 | | |
| | 77,500 | | | Gaylord Entertainment (a)
Convention Hotels | | | 4,157,100 | | |
| | 100,000 | | | Digital Realty Trust
Technology-focused Office Buildings | | | 3,768,000 | | |
| | 150,000 | | | Kite Realty Group
Community Shopping Centers | | | 2,853,000 | | |
| | 90,000 | | | American Campus Communities
Student Housing | | | 2,546,100 | | |
| | | | 24,009,000 | | |
| | | Regulated Utilities – 0.6% | |
| | 345,000 | | | Northeast Utilities
Regulated Electric Utility | | | 9,784,200 | | |
| | | Transportation – 0.6% | |
| | 580,800 | | | Heartland Express
Regional Trucker | | | 9,467,040 | | |
| Total Other | | | 43,260,240 | | |
| Total Common Stocks (Cost: $1,055,334,847) – 97.9% | | | 1,641,846,809 | | |
Principal
Amount | | | | Value | |
| Short-Term Obligations – 3.0% | | | |
| $ | 8,444,000 | | | Repurchase Agreement with Fixed
Income Clearing Corp., dated 6/29/07,
due 7/02/07 at 5.05%, collateralized by
a U.S. Government Agency Obligation,
maturing 7/18/11, market value $8,614,563
(repurchase proceeds $8,447,554) | | $ | 8,444,000 | | |
| | 8,400,000 | | | Cargill Asia Pacific Treasury Ltd. (d)
5.38% due 7/06/07 | | | 8,393,723 | | |
| | 8,300,000 | | | Abbey National
5.29% due 7/02/07 | | | 8,298,782 | | |
| | 8,300,000 | | | Times Square (d)
5.30% due 7/02/07 | | | 8,298,778 | | |
| | 8,300,000 | | | White Point Funding (d)
5.30% due 7/03/07 | | | 8,297,556 | | |
| | 8,300,000 | | | Anglesea Funding (d)
5.38% due 7/05/07 | | | 8,295,038 | | |
| Total Short-Term Obligations (Cost: $50,027,877) | | | 50,027,877 | | |
| Total Investments (Cost: $1,105,362,724) (e) – 100.9% | | | 1,691,874,686 | | |
| Cash and Other Assets Less Liabilities – (0.9)% | | | (14,790,298 | ) | |
| Total Net Assets – 100% | | | 1,677,084,388 | | |
See accompanying notes to financial statements.
13
Wanger U.S. Smaller Companies 2007 Semiannual Report
Wanger U.S. Smaller Companies
Statement of Investments (Unaudited) June 30, 2007
Notes to Statement of Investments:
(a) Non-income producing security.
(b) An affiliate may include any company in which the Fund owns five percent or more of its outstanding voting shares. On June 30, 2007, the Fund held five percent or more of the outstanding voting securities of the following company:
Affiliates | | Balance of
Shares
Held
12/31/2006 | |
Purchases/
Additions | |
Sales/
Reductions | | Balance of
Shares
Held
06/30/2007 | |
Value | |
Dividend | |
RCM
Technologies | | | 753,000 | | | | — | | | | — | | | | 753,000 | | | $ | 5,865,870 | | | | — | | |
The aggregate cost and value of this company at June 30, 2007, was $5,474,962 and $5,865,870 respectively. Investments in affiliate companies represent 0.3% of total net assets at June 30, 2007.
(c) Denotes a restricted security, which is subject to restrictions on resale under federal securities laws. These securities are valued in good faith by the Board of Trustees. At June 30, 2007, these securities amounted to $666,705 which represents 0.04% of total net assets.
Additional information on these securities is as follows:
Security | | Acquisition
Dates | |
Shares | |
Cost | |
Value | |
Locus Discovery,
Series D, Pfd. | | 9/5/01 | | | 250,000 | | | $ | 1,000,000 | | | $ | 72,500 | | |
Locus Discovery,
Series B, Pfd. | | 2/8/07 | | | 128,859 | | | | 37,369 | | | | 37,369 | | |
| IsoRay - Warrants | | 3/21/07 | | | 100,000 | | | | 0 | | | | 114,000 | | |
| Medicure - Warrants | | 12/22/06 | | | 738,060 | | | | 0 | | | | 442,836 | | |
| | | | | | | | | $ | 1,037,369 | | | $ | 666,705 | | |
(d) Security exempt from registration under Section 4(2) of the Securities Act of 1933. These securities may only be resold in exempt transactions to qualified buyers. Private resales of these securities to qualified institutional buyers are also exempt from registration pursuant to Rule 144A under the Securities Act of 1933. At June 30, 2007, these securities amounted to $33,285,095 which represents 2.0% of net assets.
(e) At June 30, 2007, for federal income tax purposes cost of investments was $1,105,362,724 and net unrealized appreciation was $586,511,962 consisting of gross unrealized appreciation of $630,998,482 and gross unrealized depreciation of $44,486,520.
At June 30, 2007, the Fund held investments in the following sectors:
| Sector | | % of
Net Assets | |
| Information Group | | | 29.2 | | |
| Consumer Goods & Services | | | 21.9 | | |
| Industrial Goods & Services | | | 14.2 | | |
| Health Care | | | 10.9 | | |
| Finance | | | 10.0 | | |
| Energy & Minerals | | | 9.1 | | |
| Other | | | 2.6 | | |
| Short-Term Obligations | | | 3.0 | | |
| Cash and Other Assets less Liabilities | | | (0.9 | ) | |
| | | | 100.0 | | |
See accompanying notes to financial statements.
14
Wanger U.S. Smaller Companies 2007 Semiannual Report
Statement of Assets and Liabilities
June 30, 2007 (Unaudited)
| Assets: | |
| Unaffiliated investments, at cost | | $ | 1,099,887,762 | | |
| Affiliated investments, at cost (See Note 4) | | | 5,474,962 | | |
| Unaffiliated investments, at value | | $ | 1,686,008,816 | | |
| Affiliated investments, at value (See Note 4) | | | 5,865,870 | | |
| Cash | | | 12,140 | | |
| Receivable for: | |
| Investments sold | | | 4,092,556 | | |
| Fund shares sold | | | 447,416 | | |
| Interest | | | 2,369 | | |
| Dividends | | | 365,856 | | |
| Total Assets | | | 1,696,795,023 | | |
| Liabilities: | |
| Payable for: | |
| Investments purchased | | | 10,397,255 | | |
| Fund shares repurchased | | | 7,941,512 | | |
| Investment advisory fee | | | 1,255,439 | | |
| Transfer agent fee | | | 36 | | |
| Trustees' fees | | | 17,952 | | |
| Custody fee | | | 1,161 | | |
| Deferred Trustees' fees | | | 21,873 | | |
| Other liabilities | | | 75,407 | | |
| Total Liabilities | | | 19,710,635 | | |
| Net Assets | | $ | 1,677,084,388 | | |
| Composition of Net Assets: | |
| Paid-in capital | | $ | 990,256,327 | | |
| Undistributed net investment income | | | 696,681 | | |
| Accumulated net realized gain | | | 99,619,418 | | |
| Net unrealized appreciation on investments | | | 586,511,962 | | |
| Net Assets | | $ | 1,677,084,388 | | |
| Fund Shares outstanding | | | 43,983,157 | | |
Net asset value, offering price and redemption
price per share | | $ | 38.13 | | |
Statement of Operations
For the Six Months Ended June 30, 2007 (Unaudited)
| Investment Income: | |
| Dividends (net of foreign taxes withheld of $191) | | $ | 7,203,606 | | |
| Interest income | | | 1,276,515 | | |
| Total Investment Income | | | 8,480,121 | | |
| Expenses: | |
| Investment advisory fee | | | 7,366,000 | | |
| Transfer agent fee | | | 277 | | |
| Trustees' fees | | | 51,142 | | |
| Custody fee | | | 24,668 | | |
| Chief compliance officer expenses (See Note 4) | | | 24,729 | | |
| Other expenses (See Note 5) | | | 311,479 | | |
| Total Expenses | | | 7,778,295 | | |
| Custody earnings credit | | | (4,268 | ) | |
| Net Expenses | | | 7,774,027 | | |
| Net Investment Income | | | 706,094 | | |
Net Realized and Unrealized Gain on
Portfolio Positions: | |
| Net realized gain on investments | | | 99,997,438 | | |
| Net change in unrealized appreciation on: | |
| Unaffiliated Investments | | | 66,528,894 | | |
| Affiliated Investments (See Note 4) | | | 1,355,400 | | |
| Net change in unrealized appreciation | | | 67,884,294 | | |
| Net Gain | | | 167,881,732 | | |
| Net Increase in Net Assets from Operations | | $ | 168,587,826 | | |
See accompanying notes to financial statements.
15
Wanger U.S. Smaller Companies 2007 Semiannual Report
Statement of Changes in Net Assets
| Increase (Decrease) in Net Assets: | | (Unaudited)
Six Months
Ended
June 30,
2007 | | Year Ended
December 31,
2006 | |
| From Operations: | |
| Net investment income (loss) | | $ | 706,094 | | | $ | (1,119,633 | ) | |
| Net realized gain on investments | | | 99,997,438 | | | | 86,495,092 | | |
| Net change in unrealized appreciation on investments | | | 67,884,294 | | | | 27,720,176 | | |
| Net Increase in Net Assets from Operations | | | 168,587,826 | | | | 113,095,635 | | |
| Distributions Declared to Shareholders: | |
| From net investment income | | | — | | | | (3,589,922 | ) | |
| From net realized gains | | | (85,256,052 | ) | | | (50,639,120 | ) | |
| Total Distributions Declared to Shareholders | | | (85,256,052 | ) | | | (54,229,042 | ) | |
| Share Transactions: | |
| Subscriptions | | | 27,432,136 | | | | 193,269,036 | | |
| Distributions reinvested | | | 85,256,052 | | | | 54,229,042 | | |
| Redemptions | | | (127,275,766 | ) | | | (191,719,601 | ) | |
| Net Increase (Decrease) from Share Transactions | | | (14,587,578 | ) | | | 55,778,477 | | |
| Total Increase in Net Assets | | | 68,744,196 | | | | 114,645,070 | | |
| Net Assets: | |
| Beginning of period | | | 1,608,340,192 | | | | 1,493,695,122 | | |
| End of period | | $ | 1,677,084,388 | | | $ | 1,608,340,192 | | |
| Undistributed (Overdistributed) net investment income at end of period | | $ | 696,681 | | | $ | (9,413 | ) | |
See accompanying notes to financial statements.
16
Wanger U.S. Smaller Companies 2007 Semiannual Report
Financial Highlights
| | | (Unaudited)
Six Months Ended
June 30, | | Year Ended December 31, | |
| Selected data for a share outstanding throughout each period | | 2007 | | 2006 | | 2005 | | 2004 | | 2003 | | 2002 | |
| Net Asset Value, Beginning of Period | | $ | 36.36 | | | $ | 34.90 | | | $ | 31.37 | | | $ | 26.51 | | | $ | 18.51 | | | $ | 22.25 | | |
| Income from Investment Operations: | |
| Net investment income (loss) (a) | | | 0.02 | (b) | | | (0.02 | ) | | | 0.09 | | | | (0.14 | ) | | | (0.11 | ) | | | (0.10 | ) | |
| Net realized and unrealized gain (loss) on investments | | | 3.71 | | | | 2.71 | | | | 3.44 | | | | 5.00 | | | | 8.11 | | | | (3.64 | ) | |
| Total from Investment Operations | | | 3.73 | | | | 2.69 | | | | 3.53 | | | | 4.86 | | | | 8.00 | | | | (3.74 | ) | |
| Less Distributions Declared to Shareholders: | |
| From net investment income | | | — | | | | (0.08 | ) | | | — | | | | — | | | | — | | | | — | | |
| From net realized capital gains | | | (1.96 | ) | | | (1.15 | ) | | | — | | | | — | | | | — | | | | — | | |
| Total Distributions Declared to Shareholders | | | (1.96 | ) | | | (1.23 | ) | | | — | | | | — | | | | — | | | | — | | |
| Net Asset Value, End of Period | | $ | 38.13 | | | $ | 36.36 | | | $ | 34.90 | | | $ | 31.37 | | | $ | 26.51 | | | $ | 18.51 | | |
| Total Return (c) | | | 10.82 | %(d) | | | 7.87 | % | | | 11.25 | %(e) | | | 18.33 | % | | | 43.22 | % | | | (16.81 | )% | |
| Ratios to Average Net Assets/Supplemental Data: | |
| Net operating expenses (f) | | | 0.95 | %(g) | | | 0.95 | % | | | 0.95 | % | | | 1.00 | % | | | 0.99 | % | | | 1.05 | % | |
| Interest expense | | | — | | | | 0.00 | %(h) | | | — | | | | — | | | | — | | | | — | | |
| Total net expenses (f) | | | 0.95 | %(g) | | | 0.95 | % | | | 0.95 | % | | | 1.00 | % | | | 0.99 | % | | | 1.05 | % | |
| Net investment income (loss) (f) | | | 0.09 | %(g) | | | (0.07 | )% | | | 0.29 | % | | | (0.49 | )% | | | (0.48 | )% | | | (0.47 | )% | |
| Waiver | | | — | | | | — | | | | 0.00 | %(h) | | | — | | | | — | | | | — | | |
| Portfolio turnover rate | | | 11 | %(d) | | | 19 | % | | | 11 | % | | | 15 | % | | | 10 | % | | | 16 | % | |
| Net assets, end of period (000's) | | $ | 1,677,084 | | | $ | 1,608,340 | | | $ | 1,493,695 | | | $ | 1,153,553 | | | $ | 822,658 | | | $ | 471,726 | | |
(a) Net investment income (loss) per share was based upon the average shares outstanding during the period.
(b) Net investment income per share reflects special dividends. The effect of these dividends amounted to $0.09 per share.
(c) Total return at net asset value assuming all distributions are reinvested.
(d) Not annualized.
(e) Had the Investment Adviser not waived a portion of expenses, total return would have been reduced.
(f) The benefits derived from custody fees paid indirectly had an impact of less than 0.01%.
(g) Annualized.
(h) Rounds to less than 0.01%.
See accompanying notes to financial statements.
17
Wanger U.S. Smaller Companies 2007 Semiannual Report
Notes to Financial Statements (Unaudited)
1. Nature of Operations
Wanger U.S. Smaller Companies (the "Fund") is a series of Wanger Advisors Trust (the "Trust"), an open-end management investment company organized as a Massachusetts business trust. The investment objective of the Fund is to seek long-term growth of capital. The Fund is available only for allocation to certain life insurance company separate accounts established for the purpose of funding qualified and non-qualified variable annuity contracts and variable life insurance policies and may also be offered directly to certain types of pension plans and retirement arrangements.
2. Significant Accounting Policies
Security valuation
Securities of the Fund are valued at market value or, if a market quotation for a security is not readily available or is deemed not to be reliable because of events or circumstances that have occurred between the market quotation and the time as of which the security is to be valued, the security is valued at a fair value determined in accordance with procedures established by the Board of Trustees. A security traded on a securities exchange or in an over-the-counter market in which transaction prices are reported is valued at the last sales price at the time of valuation. A security traded principally on NASDAQ is valued at the NASDAQ official closing price. A security for which there is no reported sale on the valuation date is valued at the latest bid quotation. A short-term debt obligation having a maturity of 60 days or less from the valuation date is valued on an amortized cost, which approximates fair value. A security f or which a market quotation is not readily available and any other assets are valued in accordance with procedures established by the Board of Trustees. The Trust has retained an independent statistical fair value pricing service to assist in the fair valuation process for securities principally traded in a foreign market in order to adjust for possible changes in value that may occur between the close of the foreign exchange and the time as of which the securities are to be valued. If a security is valued at a "fair value", that value may be different from the last quoted market price for the security.
In September 2006, Statement of Financial Accounting Standards No. 157, Fair Value Measurements ("SFAS 157"), was issued. SFAS 157 is effective for fiscal years beginning after November 15, 2007. SFAS 157 defines fair value, establishes a framework for measuring fair value and expands disclosures about fair value measurements. Management is evaluating the impact the application of SFAS 157 will have on the Fund's financial statement disclosures.
Repurchase agreements
The Fund may engage in repurchase agreement transactions. The Fund, through its custodians, receives delivery of underlying securities collateralizing each repurchase agreement. The Fund's investment advisor determines that the value of the underlying securities is at all times at least equal to the repurchase price including interest. In the event of default or bankruptcy by the other party to the agreement, realization and/or retention of the collateral may be subject to legal proceedings.
Security transactions and investment income
Security transactions are accounted for on the trade date (date the order to buy or sell is executed) and dividend income is recorded on the ex-dividend date, except that certain dividends from foreign securities are recorded as soon as the information is available to the Fund. Interest income is recorded on an accrual basis and includes amortization of discounts and premiums on debt obligations when required for federal income tax purposes. Realized gains and losses from security transactions are recorded on an identified cost basis.
Awards, if any, from class action litigation related to securities owned may be recorded as a reduction of cost of those securities. If the applicable securities are no longer owned, the proceeds are recorded as realized gains.
The Fund estimates components of distributions from Real Estate Investment Trusts ("REITS"). Distributions received in excess of income are recorded as a reduction of the cost of the related investments. Results of operations for the year reflect a change in estimate of these components using more current tax reporting received from REIT investments. The change in estimate has no impact on the Fund's net assets.
Restricted Securities
Restricted securities are securities that may only be resold upon registration under federal securities laws or in transactions exempt from registration. In some cases, the issuer of restricted securities has agreed to register such securities for resale at the issuer's expense either upon demand by the Fund or in connection with another registered offering of the securities. Many restricted securities may be resold in the secondary market in transactions exempt from registration. Such restricted securities may be determined to be liquid under criteria established by the Board of Trustees. The Fund will not incur any registration costs upon such resale.
Use of Estimates
The preparation of financial statements in conformity with accounting principles generally accepted in the United States of America ("GAAP") requires management to make estimates and assumptions that affect the amounts reported in the financial statements and accompanying notes. Actual results may differ from those estimated.
Fund share valuation
Fund shares are sold and redeemed on a continuing basis at net asset value. Net asset value per share is determined daily as of the close of trading on the New York Stock Exchange ("the Exchange") on each day the Exchange is open for trading by dividing the total value of the Fund's investments and other assets, less liabilities, by the number of Fund shares outstanding.
Custody fees/Credits
Custody fees are reduced based on the Fund's cash balances maintained with the custodian. The Fund could have invested a portion of the assets utilized in connection with the expense offset arrangement in an income-producing asset if it had not entered into such an agreement. The amount is disclosed as a reduction of total expenses in the Statement of Operations.
Federal income taxes
The Fund has complied with the provisions of the Internal Revenue Code available to regulated investment companies and, in the manner provided therein, distributes all its taxable income, as well as any net realized gain on sales of investments and foreign currency transactions reportable for federal income tax purposes. Accordingly, the Fund paid no federal income taxes and no federal income tax provision was required.
Distributions to shareholders
Distributions to shareholders are recorded on the ex-date.
Indemnification
In the normal course of business, the Fund enters into contracts that contain a variety of representations and warranties which provide general indemnities. The Fund's maximum exposure under these arrangements is unknown, as this would involve future claims against the Fund. Also, under the Trust's organizational documents, the Trustees and Officers of the Trust are indemnified against certain liabilities that may arise out of their duties to
18
Wanger U.S. Smaller Companies 2007 Semiannual Report
Notes to Financial Statements, continued (Unaudited)
the Trust. However, based on experience, the Fund expects the risk of loss due to these warranties and indemnities to be minimal.
3. Federal Tax Information
The tax character of distributions paid during the year ended December 31, 2006 was as follows:
| Distributions paid from: | |
| Ordinary Income* | | $ | 3,784,450 | | |
| Long-Term Capital Gains | | | 50,444,592 | | |
* For tax purposes, short-term capital gains distributions, if any, are considered ordinary income distributions.
The Fund adopted Financial Accounting Standards Board ("FASB") Interpretation No. 48, Accounting for Uncertainty in Income Taxes—an Interpretation of FASB Statement No. 109 ("Fin 48") effective June 29, 2007. FIN 48 requires management to determine whether a tax position of a Fund is more likely than not to be sustained upon examination by the applicable taxing authority, including resolution of any related appeals or litigation processes, based in the technical merits of the position. The tax benefit to be recognized is measured as the largest amount of benefit that is greater than fifty percent likely of being realized upon ultimate settlement. FIN 48 must be applied to all existing tax positions upon initial adoption and the cumulative effect, if any, is to be reported as an adjustment to net assets. Management has evaluated the known implications of FIN 48 on its computation of net assets for the Fund. As a result of this evaluation, management believes that FIN 48 will not have any effect on the Fund's financial statements. However, management's conclusions regarding FIN 48 may be subject to review and adjustment at a later date based on factors including, but not limited to, further implementation guidance expected from the FASB, new tax laws, regulations, and administrative interpretations (including relevant court decisions).
4. Transactions With Affiliates
Columbia Wanger Asset Management, L.P. ("Columbia WAM"), a wholly owned subsidiary of Columbia Management Group, Inc., which in turn is an indirect wholly-owned subsidiary of Bank of America Corporation ("BOA"), furnishes continuing investment supervision to the Fund and is responsible for the overall management of the Fund's business affairs.
Effective August 1, 2007, under the Fund's investment advisory agreement, fees are accrued daily based on the Fund's average daily net assets and paid monthly to Columbia WAM at the annual rates shown in the table below:
| Average Daily Net Assets | | Annual Fee Rate | |
| Up to $100 million | | | 0.94 | % | |
| $100 million to $250 million | | | 0.89 | % | |
| $250 million to $2 billion | | | 0.84 | % | |
| $2 billion and over | | | 0.80 | % | |
For the period covered by this report as provided under the Fund's investment advisory agreement, fees were accrued daily based on the Fund's average daily net assets and paid monthly to Columbia WAM at the annual rates shown in the table below:
| Average Daily Net Assets | | Annual Fee Rate | |
| Up to $100 million | | | 0.99 | % | |
| $100 million to $250 million | | | 0.94 | % | |
| $250 million and over | | | 0.89 | % | |
For the six months ended June 30, 2007, the Fund's annualized effective investment advisory fee rate was 0.90%.
Columbia WAM provides administrative services and receives an administration fee from the Fund. For the period covered by this report, administrative services were covered under the Fund's investment advisory agreement in place between the Fund and Columbia WAM. Effective August 1, 2007, under the Fund's new administration agreement, which provides the same types of administrative services that were provided under the Fund's investment advisory agreement, fees are accrued daily and paid monthly to Columbia WAM at the annual rate of 0.05%. Accordingly, the investment advisory fees were decreased by 0.05% across all asset levels effective August 1, 2007 as well.
Certain officers and trustees of the Trust are also officers of Columbia WAM. The Trust makes no direct payments to its officers and trustees who are affiliated with Columbia WAM. For the six months ended June 30, 2007, the Fund paid $51,142 to trustees not affiliated with Columbia WAM. The Board of Trustees appointed a Chief Compliance Officer to the Fund in accordance with federal securities regulations. The Fund will pay its pro-rata share of the expenses associated with the Office of the Chief Compliance Officer. These expenses are disclosed separately as "Chief compliance officer expenses" in the Statement of Operations.
Columbia Management Distributors, Inc. (the "Distributor"), a wholly-owned subsidiary of BOA, serves as the principal underwriter of the Trust and receives no compensation for its services.
Columbia Management Services, Inc. (the "Transfer Agent"), a wholly-owned subsidiary of BOA, provides shareholder services to the Fund and has subcontracted with Boston Financial Data Services ("BFDS") to serve as subtransfer agent. For such services, the Transfer Agent receives a fee, paid monthly, at the annual rate of $21.00 per open account. . The Transfer Agent also receives reimbursement for certain out-of-pocket expenses.
An affiliate may include any company in which a fund owns five percent or more of its outstanding voting shares. On June 30, 2007, the Fund held five percent or more of the outstanding voting securities of one or more companies. Details of investments in the affiliated company is presented on page 14.
During the six months ended June 30, 2007, the Fund engaged in purchase and sales transactions with funds that have a common investment adviser (or affiliated investment advisers), common Directors/Trustees, and/or common Officers. These purchase and sale transactions complied with provisions of Rule 17a-7 under the Investment Company Act of 1940 and were $114,800 and $0, respectively.
5. Borrowing Arrangements
The Trust participates in a $150,000,000 credit facility, which was entered into to facilitate portfolio liquidity. Interest is charged to each participating fund based on its borrowings at a rate per annum equal to the Federal Funds rate plus 0.50%. In addition, a commitment fee of 0.08% per annum is accrued and apportioned among the participating funds based on their pro-rata portion of the unutilized line of credit. The commitment fee is included in "Other expenses" in the Statement of Operations. No amounts were borrowed by the Fund under this facility during the six months ended June 30, 2007.
19
Wanger U.S. Smaller Companies 2007 Semiannual Report
Notes to Financial Statements, continued (Unaudited)
6. Fund Share Transactions
Proceeds and payments on Fund shares as shown in the Statement of Changes in Net Assets are in respect of the following numbers of shares:
| | | Six months ended
June 30, 2007 | | Year ended
December 31, 2006 | |
| Shares sold | | | 735,589 | | | | 5,444,074 | | |
Shares issued in reinvestment
of dividend distributions | | | 2,466,899 | | | | 1,565,956 | | |
| Less shares redeemed | | | (3,452,319 | ) | | | (5,577,186 | ) | |
| Net increase (decrease) in shares outstanding | | | (249,831 | ) | | | 1,432,844 | | |
7. Investment Transactions
The aggregate cost of purchases and proceeds from sales other than short-term obligations for the six months ended June 30, 2007 were $171,604,725 and $216,297,795, respectively.
8. Legal Proceedings
Columbia WAM, Columbia Acorn Trust, another mutual fund family advised by Columbia WAM, and the trustees of Colombia Acorn Trust (collectively, the "Columbia defendants") are named as defendants in class and derivative complaints which have been consolidated in a Multi-District Action in the federal district court for the District of Maryland (the "MDL Action"). These lawsuits contend that defendants permitted certain investors to market time their trades in certain Columbia Acorn Funds. The MDL Action is ongoing. However, all claims against Columbia Acorn Trust and the independent trustees of Columbia Acorn Trust have been dismissed.
The Columbia Acorn Trust and Columbia WAM are also defendants in a class action lawsuit that alleges, in summary, that the Columbia Acorn Trust and Columbia WAM exposed shareholders of Columbia Acorn International Fund to trading by market timers by allegedly (a) failing to properly evaluate daily whether a significant event affecting the value of that Fund's securities had occurred after foreign markets had closed but before the calculation of the funds' net asset value (NAV"); (b) failing to implement the fund's portfolio valuation and share pricing policies and procedures; and (c) failing to know and implement applicable rules and regulations concerning the calculation of NAV (the "Fair Valuation Lawsuit"). The Seventh Circuit ruled that the plaintiffs' state law claims were preempted under federal law resulting in the dismissal of plaintiffs' complaint. Plaintiffs appealed the Seventh Circuit's ruling to the United States Su preme Court. The Supreme Court reversed the Seventh Circuit's ruling on jurisdictional grounds, and the case ultimately was remanded to the state court.
On March 21, 2005, a class action complaint was filed against the Columbia Acorn Trust and Columbia WAM seeking to rescind the Contingent Deferred Sales Charges assessed upon redemption of Class B shares of Columbia Acorn Funds due to the alleged market timing of the Columbia Acorn Funds. In addition to the rescission of sales charges, plaintiffs seek recovery of actual damages, attorneys' fees and costs. The case has been transferred to the Multi-District Action in the federal district court of Maryland.
On April 4, 2006, the plaintiffs and the Columbia defendants named in the MDL Action executed an agreement in principle intended to fully resolve all of the lawsuits consolidated in the MDL Action as well as the Fair Valuation Lawsuit. The court entered a stay after the parties executed a settlement agreement. The settlement has not yet been finalized or approved by the court.
Columbia WAM, the Columbia Acorn Funds and the trustees of Columbia Acorn Trust are also defendants in a consolidated lawsuit filed in the federal district court of Massachusetts alleging that Columbia WAM used fund assets to make undisclosed payments to brokers as an incentive for the brokers to market the Columbia Acorn Funds over the other mutual funds to investors. The complaint alleges Columbia WAM and the Trustees of the Trust breached certain common laws duties and federal laws.
On November 30, 2005, the court dismissed all of the claims alleged against all of the parties in the consolidated complaint. The parties subsequently executed a formal settlement agreement resolving all claims in the litigation and the plaintiffs dismissed their appeal. The settlement requires court approval, which has not yet been obtained.
On or about January 11, 2005, a putative class action lawsuit was filed in federal district court in Massachusetts against the Columbia Acorn Trust and the trustees of Columbia Acorn Trust, along with the Columbia Advisers, the sub-administrator of the Wanger Advisors Funds and the Columbia Acorn Funds. The plaintiffs allege that the defendants failed to submit Proof of Claims in connection with settlements of securities class action lawsuits filed against companies in which the Columbia Acorn Funds held positions. The complaints seeks compensatory and punitive damages, and the disgorgement of all fees paid to the Columbia Advisers.
Plaintiffs have voluntarily dismissed the Columbia Acorn Trust and its independent trustees.
The Columbia Acorn Trust and Columbia WAM intend to defend these suits vigorously.
As a result of these matters or any adverse publicity or other developments resulting from them, there may be increased redemptions or reduced sales of Fund shares, which could increase transaction costs or operating expenses, or have other adverse consequences for the Funds.
However, based on currently available information, the Columbia Acorn Trust believes that the likelihood that these lawsuits will have a material adverse impact on any fund is remote, and Columbia WAM believes that the lawsuits are not likely to materially affect its ability to provide investment management services to the Funds.
20
Wanger U.S. Smaller Companies 2007 Semiannual Report
[Excerpt from:]
Wanger Advisors Trust
Management Fee Evaluation of the Senior Officer
Prepared Pursuant to the New York Attorney General's
Assurance of Discontinuance
June 2007
21
Wanger U.S. Smaller Companies 2007 Semiannual Report
Introduction
The New York Attorney General's Assurance of Discontinuance ("Order") entered into by Columbia Management Advisors, Inc. ("CMAI") and Columbia Management Distributors, Inc., ("CMDI" and collectively with "CMAI," "CMG") in February 2005, allows CMAI to manage or advise a mutual fund only if the trustees of the fund appoint a "Senior Officer" to perform specified duties and responsibilities. One of these responsibilities includes "managing the process by which proposed management fees (including but not limited to, advisory fees) to be charged the [Funds] are negotiated so that they are negotiated in a manner which is at arms' length and reasonable and consistent with this Assurance of Discontinuance."
This is the first year that the Columbia Acorn Trust and Wanger Advisors Trust (collectively, the "Trusts") and each series thereof (the "Acorn Funds," "WAT Funds" or collectively, the "Funds") have been overseen by the same Board of Trustees ("Board"). The Order provides that this Board must determine the reasonableness of proposed "management fees" by using either an annual competitive bidding process supervised by the Senior Officer or Independent Fee Consultant, or by obtaining "an annual independent written evaluation prepared by or under the direction of the Senior Officer or the Independent Fee Consultant."
"Management fees" are only part of the costs and expenses paid by mutual fund shareholders. The expenses can vary depending upon the class of shares held but usually include: (1) investment management or advisory fees to compensate analysts and portfolio managers for stock research and portfolio management, as well as the cost of operating a trading desk; (2) administrative expenses incurred to prepare registration statements and tax returns, calculate the Funds' net asset values, maintain effective compliance procedures and perform recordkeeping services; (3) transfer agency costs for establishing accounts, accepting and disbursing funds, as well as overseeing trading in Fund shares; (4) custodial expenses incurred to hold the securities purchased by the Funds; and (5) distribution expenses, including commissions paid to brokers that sell the Fund shares to investors.
Columbia Wanger Asset Management, L.P. ("CWAM"), the adviser to the Funds, has proposed that with respect to the Acorn Funds, the Columbia Acorn Trust continue the existing separate agreements governing the first two categories listed above: an advisory agreement governing portfolio management, and an administration agreement governing certain administration and clerical services. Together the fees paid under these two agreements are referred to as "management fees." CWAM proposes that the WAT Funds continue the existing single agreement governing both investment advisory and administrative services. A single management fee would cover both services. Other fund expenses are governed by separate agreements, in particular agreements with two CWAM affiliates: CMDI, the broker-dealer that underwrites and distributes the Funds' shares, and Columbia Management Services, Inc. ("CMSI"), the Funds' transfer agent. In conformity with the terms of the Order, this evaluation, therefore, addresses only the advisory and administrative contracts, and does not extend to the other agreements.
According to the Order, the Senior Officer's evaluation must consider at least the following:
(1) Management fees (including components thereof) charged to institutional and other clients of CWAM for like services;
(2) Management fees (including any components thereof) charged by other mutual fund companies for like services;
(3) Costs to CWAM and its affiliates of supplying services pursuant to the management fee agreements, excluding any intra-corporate profit;
(4) Profit margins of CWAM and its affiliates from supplying such services;
(5) Possible economies of scale as the Funds grow larger; and
(6) The nature and quality of CWAM's services, including the performance of each Fund.
In 2004, the Boards of the two Trusts, then separate groups, each appointed me Senior Officer under the Order. They also determined not to pursue a competitive bidding process and instead, charged me with the responsibility of evaluating the Funds' proposed advisory and administrative fee contracts with CWAM in conformity with the requirements of the Order. This Report is an annual evaluation required under the Order. In discharging their responsibilities, the independent Trustees have also consulted independent, outside counsel.
2006 Evaluation
This is the third annual evaluation prepared in connection with the Order. This evaluation follows the same structure as the earlier studies. Some areas are given more emphasis here, while others are given less. Still, the fundamental information gathered for this evaluation is largely the same as past years.
Process and Independence
The objectives of the Order are to insure the independent evaluation of the advisory fees paid by the Funds as well as to insure that all relevant factors are considered. In my view, this contract renewal process has been conducted at arms-length and with independence in gathering, considering and evaluating all relevant data. At the outset of the process, the Trustees sought and obtained from CWAM and CMG a comprehensive compilation of data regarding Fund performance and expenses, adviser profitability, and other information. The Board evaluated this information thoroughly and also explored CWAM's potential capacity restraints. Performance and expense data was obtained from both Morningstar and Lipper, the leading consultants in this area. The rankings prepared by Morningstar and Lipper were independent and not influenced by the adviser. CWAM itself identified what it considers competing funds, and the Trustees considered that data as well.
In the course of its work, the Contract Committee gave careful consideration to the conclusions and recommendations contained in last year's evaluation. The Contract Committee gave particular emphasis to the issue of whether economies of scale were appropriately reflected in the Funds' fee schedules. Last year, the
22
Wanger U.S. Smaller Companies 2007 Semiannual Report
Board sought and CWAM agreed to additional breakpoints for two Funds, Acorn USA and Acorn Select. These breakpoints are above current asset levels, but clearly operate to share economies of scale with Fund shareholders. This year, at the Board's request, CWAM has proposed additional breakpoints for the WAT Funds, and Acorn International Select. This proposal is under consideration by the Board.
My evaluation of the advisory contract was shaped, as it was last year, by my experience as Chief Compliance Officer of the Trusts ("CCO"). As CCO, I report solely to the Board and have no reporting obligation to or employment relationship with CMG or its affiliates, except for administrative purposes. I have commented on compliance matters in evaluating the quality of service provided by CWAM.
This Report, its supporting materials and the data contained in other materials submitted to the Contract Committee of the Board, in my view, provide a thorough factual basis upon which the Board, in consultation with independent counsel as it deems appropriate, may conduct management fee negotiations that are in the best interests of the Funds' shareholders.
The Fee Reductions Mandated under the Order
Under the terms of the Order, CMG agreed to secure certain management fee reductions for the mutual funds advised by its affiliate investment advisers. In some instances, breakpoints were also established. Although neither CWAM nor the Trusts was a party to the Order, CWAM offered and the Board accepted certain advisory fee reductions during 2005. By the terms of the Order, these fees may not be increased before November 30, 2009. I have used these advisory fee levels—as modified last year to add certain breakpoints for Acorn USA and Acorn Select—in this evaluation because they are the fees in the current agreements that CWAM proposes should be continued. Hence, these fee levels are the starting point of an evaluation.
Conclusions
My review of the data and other material above leads to the following conclusions with respect to the factors identified in the Order.
1. Performance. The domestic Funds generally have achieved outstanding performance. The Acorn Fund, Acorn USA, Acorn Select, Wanger Select and Wanger US Smaller Companies all rank very favorably against their peers over the past five years. Although Acorn USA and Wanger US Smaller Companies had a difficult year in 2006, these returns are not characteristic of these funds, both of which have shown improved performance during the first quarter of 2007. The international Funds have relatively weaker long term records than the domestic funds, but recently have improved significantly and their one year rankings are excellent. Overall then, performance of the Funds is excellent.
2. Management Fees relative to Peers. The management fee rankings for several of the Acorn Funds are generally more favorable to shareholders than those of their peer group funds. Management fees do, however, vary by Fund. Acorn Fund is the least expensive and the Acorn USA the most expensive. Acorn Fund is very competitive, while Acorn USA and Acorn Select were ranked by both Lipper and Morningstar at or below the median, and therefore impose higher fees than do the majority of their competitors. The WAT Funds also lag their competitors and impose higher fees than their peers.
3. Administrative Fees. The Acorn Funds' administrative fee, which is uniform across all Funds, is at a level comparable to or less expensive than the fees imposed by their peers, provides for appropriate services to Funds, and affords breakpoints that lower the fee as assets increase. The WAT Funds pay a single fee for advisory and administrative services and hence do not benefit from administrative fee breakpoints, nor is it possible to assess their administrative costs relative to competitors.
4. Management Fees relative to Institutional and Other Mutual Fund Accounts. CWAM's focus is on its mutual funds. It does not actively seek to manage separate or institutional accounts. The few institutional accounts it does manage vary in rate structures. Some pay advisory fees commensurate with or higher than the Acorn and WAT Funds. In a few instances, however, institutional accounts pay lower advisory fees than do the Acorn Funds. One particular institutional account is significant in size and has been under CWAM's management for over 25 years.
5. Costs to CWAM and its Affiliates. CWAM's direct costs do not appear excessive. Overhead and indirect costs allocated to CWAM by its parent organizations, however, are significant and increasing. CWAM's affiliates report operating losses and therefore do not appear to profit from CWAM's advisory agreement with the Funds.
6. Profit Margins. CWAM's firm-wide, pre-marketing expense profit margins are at the top of the industry, though these comparisons are hampered by limited industry data. High profit margins are not unexpected for firms that manage large, successful funds and have provided outstanding investment performance for investors.
7. Economies of Scale. Economies of scale do exist at CWAM and will expand as the assets of the Funds get larger. They are, however, only partially reflected in the management fee schedule for the Acorn Funds and not reflected at all in two of the four WAT Funds. Breakpoints above current asset levels have, however, been added to the more expensive funds, Acorn Select and Acorn USA. Nonetheless, if Fund assets continue to grow, under the Funds' current fee schedules, all Fund shareholders might not benefit in a manner generally commensurate with CWAM's increased profits. Management has proposed additional breakpoints for some of the Funds that, if implement, would result in greater sharing of economies of scale.
23
Wanger U.S. Smaller Companies 2007 Semiannual Report
8. Nature and Quality of Services. This category includes a variety of considerations that are difficult to quantify, yet can have a significant bearing on the performance of the Acorn Funds. Several areas merit comment.
a. Capacity. The Funds have continued to grow, posing ever greater challenges in deploying assets effectively. While trends here merit continued monitoring, CWAM appears to be managing assets effectively.
b. Compliance. CWAM has a reasonably designed compliance program that protects shareholders.
c. Administrative Services. The Funds benefit from a variety of administrative services that are performed by CWAM and CMAI.
9. Process. In my opinion, the process of negotiating an advisory contract for the Funds has been conducted thoroughly and at arms' length. Further, the Trustees have sufficient information to evaluate management's proposal, and negotiate contract terms that are in the best interests of fund shareholders.
Recommendations
I believe the Trustees should:
1. Continue to consider additional ways to restructure the advisory fee beyond the current breakpoint schedule to reflect more fully economies of scale.
2. Consider unbundling of the advisory and administrative fees paid by the WAT Funds.
3. Review the disparity in management fee levels between the Acorn International Fund and its related annuity-based fund, WAT International Small Cap Fund.
4. Continue to monitor CWAM's capacity limitations to insure that the Funds' expanding assets do not impair investment performance.
Robert P. Scales
Senior Vice President,
Chief Legal Officer
and General Counsel
June 18, 2007
24
Wanger U.S. Smaller Companies 2007 Semiannual Report
This page intentionally left blank.
25
Wanger U.S. Smaller Companies 2007 Semiannual Report
This page intentionally left blank.
26
Wanger U.S. Smaller Companies 2007 Semiannual Report

Wanger Advisors Trust
Trustees
Robert E. Nason
Chairman
Allan B. Muchin
Vice Chairman
Laura M. Born
Maureen M. Culhane
Margaret Eisen
Jerome Kahn, Jr.
Steven N. Kaplan
David C. Kleinman
Charles P. McQuaid
James A. Star
Ralph Wanger
Patricia H. Werhane
John A. Wing
Officers
Charles P. McQuaid
President
Ben Andrews
Vice President
Michael G. Clarke
Assistant Treasurer
Jeffrey R. Coleman
Assistant Treasurer
J. Kevin Connaughton
Assistant Treasurer
P. Zachary Egan
Vice President
Peter T. Fariel
Assistant Secretary
John M. Kunka
Assistant Treasurer
Joseph C. LaPalm
Vice President
Bruce H. Lauer
Vice President, Treasurer and Secretary
Louis J. Mendes III
Vice President
Robert A. Mohn
Vice President
Christopher J. Olson
Vice President
Linda K. Roth-Wiszowaty
Assistant Secretary
Robert P. Scales
Senior Vice President, Chief Compliance Officer and General Counsel
Transfer Agent,
Dividend Disbursing Agent
Columbia Management Services, Inc.
P.O. Box 8081
Boston, Massachusetts
02266-8081
Distributor
Columbia Management Distributors, Inc.
One Financial Center
Boston, Massachusetts
02111-2621
Investment Adviser
Columbia Wanger Asset Management, L.P.
227 West Monroe Street, Suite 3000
Chicago, Illinois 60606
1-888-4-WANGER
(1-888-492-6437)
Legal Counsel
Bell, Boyd & Lloyd LLP
Chicago, Illinois
This report, including the schedules of investments and financial statements, is submitted for the general information of the shareholders of the Wanger Advisors Trust.
A description of the Fund's proxy voting policies and procedures and a copy of the Fund's voting record for the most recent 12-month period ended June 30 are available (i) on Columbia Management's website at www.columbiafunds.com; (ii) on the Securities and Exchange Commission's website at www.sec.gov, and (iii) without charge, upon request, by calling 888-492-6437.
The Fund files a complete schedule of portfolio holdings with the SEC for the first and third quarters of each fiscal year on Form N-Q. The Fund's Form N-Q is available on the SEC's website at www.sec.gov and may be reviewed and copied at the SEC's Public Reference Room in Washington, D.C. Information on the operation of the Pubic Reference Room may be obtained by calling 800-SEC-0330.
27
Wanger Advisors Trust
SHC-44/132812-0607 08/07 07/42586
Item 2. Code of Ethics.
Not applicable for semi-annual reports.
Item 3. Audit Committee Financial Expert.
Not applicable for semi-annual reports.
Item 4. Principal Accountant Fees and Services.
Not applicable for semi-annual reports.
Item 5. Audit Committee of Listed Registrants.
Not applicable.
Item 6. Schedule of Investments
The registrant’s “Schedule I – Investments in securities of unaffiliated issuers” (as set forth in 17 CFR 210.12-12) is included in Item 1 of this Form N-CSR.
Item 7. Disclosure of Proxy Voting Policies and Procedures for Closed-End Management Investment Companies.
Not applicable.
Item 8. Portfolio Managers of Closed-End Management Investment Companies.
Not applicable.
Item 9. Purchases of Equity Securities by Closed-End Management Investment Company and Affiliated Purchasers.
Not applicable.
Item 10. Submission of Matters to a Vote of Security Holders.
There have not been any material changes to the procedures by which shareholders may recommend nominees to the registrant’s board of directors, since those procedures were last disclosed in response to requirements of Item 7(d)(2)(ii)(G) of Schedule 14A or this Item.
Item 11. Controls and Procedures.
(a) The registrant’s principal executive officer and principal financial officers, based on their evaluation of the registrant’s disclosure controls and procedures as of a date within 90 days of the filing of this report, have concluded that such controls and procedures are adequately designed to ensure that information required to be disclosed by the registrant in Form N-CSR is accumulated and communicated to the registrant’s management, including the principal executive officer and principal financial officer, or persons performing similar functions, as appropriate to allow timely decisions regarding required disclosure.
(b) There was no change in the registrant’s internal control over financial reporting that occurred during the registrant’s second fiscal quarter of the period covered by this report that has materially affected, or is reasonably likely to materially affect, the registrant’s internal control over financial reporting.
Item 12. Exhibits.
(a)(1) Code of ethics required to be disclosed under Item 2 of Form N-CSR: Not applicable at this time.
(a)(2) Certifications pursuant to Rule 30a-2(a) under the Investment Company Act of 1940 (17 CFR 270.30a-2(a)) attached hereto as Exhibit 99.CERT.
(a)(3) Not applicable.
(b) Certification pursuant to Rule 30a-2(b) under the Investment Company Act of 1940 (17 CFR 270.30a-2(b)) attached hereto as Exhibit 99.906CERT.
SIGNATURES
Pursuant to the requirements of the Securities Exchange Act of 1934 and the Investment Company Act of 1940, the registrant has duly caused this report to be signed on its behalf by the undersigned, thereunto duly authorized.
(registrant) | | Wanger Advisors Trust | |
| |
| |
By (Signature and Title) | | /s/ Charles P. McQuaid | |
| | Charles P. McQuaid, President | |
| |
Date | | August 24, 2007 | |
| | | | | |
Pursuant to the requirements of the Securities Exchange Act of 1934 and the Investment Company Act of 1940, this report has been signed below by the following persons on behalf of the registrant and in the capacities and on the dates indicated.
By (Signature and Title) | | /s/ Charles P. McQuaid | |
| | Charles P. McQuaid, President | |
| |
Date | | August 24, 2007 | |
| | | |
| | | |
By (Signature and Title) | | /s/ Bruce H. Lauer | |
| | Bruce H. Lauer, Treasurer | |
| |
Date | | August 24, 2007 | |
| | | | |