UNITED STATES
SECURITIES AND EXCHANGE COMMISSION
Washington, D.C. 20549
FORM N-CSR
CERTIFIED SHAREHOLDER REPORT OF REGISTERED
MANAGEMENT INVESTMENT COMPANIES
Investment Company Act file number | 811-08748 |
|
Wanger Advisors Trust |
(Exact name of registrant as specified in charter) |
|
One Financial Center, Boston, Massachusetts | | 02111 |
(Address of principal executive offices) | | (Zip code) |
|
Scott R. Plummer
5228 Ameriprise Financial Center
One Financial Center
Minneapolis, MN 55474 |
(Name and address of agent for service) |
|
Registrant’s telephone number, including area code: | 1-612-671-1947 | |
|
Date of fiscal year end: | December 31 | |
|
Date of reporting period: | June 30, 2010 | |
| | | | | | | | |
Form N-CSR is to be used by management investment companies to file reports with the Commission not later than 10 days after the transmission to stockholders of any report that is required to be transmitted to stockholders under Rule 30e-1 under the Investment Company Act of 1940 (17 CFR 270.30e-1). The Commission may use the information provided on Form N-CSR in its regulatory, disclosure review, inspection, and policymaking roles.
A registrant is required to disclose the information specified by Form N-CSR, and the Commission will make this information public. A registrant is not required to respond to the collection of information contained in Form N-CSR unless the Form displays a currently valid Office of Management and Budget (“OMB”) control number. Please direct comments concerning the accuracy of the information collection burden estimate and any suggestions for reducing the burden to Secretary, Securities and Exchange Commission, 450 Fifth Street, NW, Washington, DC 20549-0609. The OMB has reviewed this collection of information under the clearance requirements of 44 U.S.C. § 3507.
Item 1. Reports to Stockholders.
Wanger International
2010 Semiannual Report

Not FDIC insured • No bank guarantee • May lose value

Wanger International
2010 Semiannual Report
Table of Contents
| | 1 | | | Understanding Your Expenses | |
|
| | 2 | | | The School that Changed the World | |
|
| | 4 | | | Performance Review | |
|
| | 6 | | | Statement of Investments | |
|
| | 16 | | | Statement of Assets and Liabilities | |
|
| | 16 | | | Statement of Operations | |
|
| | 17 | | | Statement of Changes in Net Assets | |
|
| | 18 | | | Financial Highlights | |
|
| | 19 | | | Notes to Financial Statements | |
|
| | 24 | | | Management Fee Evaluation of the Senior Officer | |
|
| | 32 | | | Board Approval of the Proposed Advisory Agreement | |
|
| | 36 | | | Proxy Voting Results | |
|
Columbia Wanger Asset Management, LLC ("CWAM") is one of the leading global small- and mid-cap equity managers in the United States with 40 years of small- and mid-cap investment experience. As of June 30, 2010, CWAM managed $26.1 billion in assets, and is the investment advisor to Wanger USA, Wanger International, Wanger Select and Wanger International Select (together, the "Columbia Wanger Funds") and the Columbia Acorn Family of Funds.
Important Information Regarding the Acquisition of the Long-term Asset Management Business
of Columbia Management Group, LLC
On April 30, 2010, Ameriprise Financial, Inc., ("Ameriprise Financial"), the parent company of RiverSource Investments, LLC, acquired the long-term asset management business of Columbia Management Group, LLC, including certain of its affiliates, which were, prior to this acquisition, part of Bank of America Corporation. In connection with this acquisition, Ameriprise Financial acquired CWAM. CWAM will continue as the investment advisor for the Columbia Acorn and Wanger Funds, and no changes are anticipated in the existing investment management team. Also in connection with this acquisition, Columbia Management Investment Distributors, Inc., member FINRA, became the distributor and principal underwriter of the Funds and Columbia Management Investment Services Corp. became the transfer agent of the Funds.
Investors should consider the investment objectives, risks, charges and expenses of a mutual fund carefully before investing. For a free prospectus, which contains this and other important information about the Fund, contact your financial advisor or insurance company or contact 1-888-4-WANGER.
An important note: Columbia Wanger Funds are sold only to certain life insurance companies in connection with certain variable annuity contracts, variable life insurance policies and eligible qualified retirement plans.
The views expressed in "The School that Changed the World" and in the Performance Review reflect the current views of the respective authors. These views are not guarantees of future performance and involve certain risks, uncertainties and assumptions that are difficult to predict so actual outcomes and results may differ significantly from the views expressed. These views are subject to change at any time based upon economic, market or other conditions and the respective parties disclaim any responsibility to update such views. These views may not be relied on as investment advice and, because investment decisions for a Columbia Wanger Fund are based on numerous factors, may not be relied on as an indication of trading intent on behalf of any particular Columbia Wanger Fund. References to specific company securities should not be construed as a recommendation or investment advice.
Wanger International 2010 Semiannual Report
Understanding Your Expenses
As a Fund shareholder, you incur three types of costs. There are transaction costs, which generally include sales charges on purchases and may include redemption or exchange fees. There are also ongoing costs, which generally include investment advisory fees and other Fund expenses. Lastly, there may be additional fees or charges imposed by the insurance company that sponsors your variable annuity product. The information on this page is intended to help you understand your ongoing costs of investing in the Fund and to compare these costs with the ongoing costs of investing in other mutual funds.
Analyzing your Fund's expenses
To illustrate these ongoing costs, we have provided an example and calculated the expenses paid by investors in the Fund during the period. The information in the following table is based on an initial, hypothetical investment of $1,000, which is invested at the beginning of the period and held for the entire period. Expense information is calculated two ways and each method provides you with different results. The amount listed in the "Actual" column is calculated using actual operating expenses and total return for the Fund. The amount listed in the "Hypothetical" column assumes that the return each year is 5% before expenses and then applies the Fund's actual expense ratio for the period to the hypothetical return. You should not use the hypothetical account values and expenses to estimate either your actual account balance at the end of the period or the expenses you paid during the period. See "Compare with other funds" for details on using the hypothetical data.
Estimating your actual expenses
To estimate the expenses that you actually paid over the period, first you will need your account balance at the end of the period.
1. Divide your ending account balance by $1,000. For example, if an account balance was $8,600 at the end of the period, the result would be 8.6.
2. In the section of the table below titled "Expenses paid during the period," you will find a dollar amount in the column labeled "Actual." Multiply this amount by the result from step 1. Your answer is an estimate of the expenses you paid on your account during the period.
January 1, 2010 – June 30, 2010
| | | Account value at the
beginning of the period ($) | | Account value at the
end of the period ($) | | Expenses paid
during the period ($) | | Fund's annualized
expense ratio (%)* | |
| | | Actual | | Hypothetical | | Actual | | Hypothetical | | Actual | | Hypothetical | | Actual | |
| Wanger International | | | 1,000.00 | | | | 1,000.00 | | | | 970.10 | | | | 1,019.69 | | | | 5.03 | | | | 5.16 | | | | 1.03 | | |
*For the six months ended June 30, 2010.
Expenses paid during the period are equal to the Fund's annualized expense ratio, multiplied by the average account value over the period, then multiplied by the number of days in the Fund's most recent fiscal half-year and divided by 365.
Had the investment advisor not waived fees or reimbursed a portion of expenses, account value at the end of the period would have been reduced.
It is important to note that the expense amounts shown in the table are meant to highlight only ongoing costs of investing in the Fund. Expenses paid during the period do not include any insurance charges imposed by your insurance company's separate account. The hypothetical example provided is useful in comparing ongoing costs only and will not help you determine the relative total costs of owning different funds whose shareholders may incur transaction costs.
Compare with other funds
Since all mutual funds are required to include the same hypothetical calculations about expenses in shareholder reports, you can use this information to compare the ongoing cost of investing in the Fund with other funds. To do so, compare the 5% hypothetical example with the 5% hypothetical examples of other funds. As you compare hypothetical examples of other funds, it is important to note that hypothetical examples are meant to highlight the ongoing cost of investing in a fund and do not reflect any transaction costs, such as sales charges, redemption fees or exchange fees that may be incurred by shareholders of other funds. Expenses paid during the period do not include any insurance charges imposed by your insurance company's separate accounts.
1
Wanger International 2010 Semiannual Report

The School that Changed the World
Chicago is known for a lot of things. Yes, this city's ability to stuff ballot boxes and pizzas is legendary, but the number of Nobel Prize winners who have hailed from the University of Chicago is one of Chicago's greatest distinctions. The University's faculty, students and researchers have been awarded 85 Nobel Prizes across all fields, nearly as many as first-place Cambridge University, which has 87.
The University of Chicago holds nearly a 40% share of the Nobel Prizes awarded in economics to date. The great thinkers who received these awards, and those who influenced them, helped trigger a world-wide shift towards capitalism, resulting in enhanced prosperity and freedom around the globe. These are the men and women of the "Chicago School."
The Chicago School
Between the Great Depression and the 1970s, many in government and academia believed that increasingly centralized economic planning was inevitable. Much of the world was subjected to communism, socialism, or other sorts of command economies. Government in the United States grew rapidly during this period, as did regulation of businesses. During this time, William F. Buckley was not the only one who stood athwart history and yelled, "Stop!"
Starting in the 1950s, references to a "Chicago School" began to appear, referring to the economists, business researchers, lawyers and sociologists from the University of Chicago who disagreed with the "more government" thinking of the time. In the first written reference to the Chicago School, found in a handbook on the history of economic thought, members of the Chicago School were described as follows:
Libertarians all, they preferred rules to authorities and the impersonal forces of the market to their deliberate direction, and they viewed with alarm the increasing scope of governmental activities in the economic sphere.1
Frank Knight and Jacob Viner are considered founders of the Chicago School. Knight set a tone; he was intellectually rigorous, devoted to knowledge, skeptical of authority and cynical of planned economies. Knight believed capitalism was the only acceptable system by default, as other systems were worse. Viner was a terror to his students in the classroom but otherwise very helpful; he elevated neoclassical price theory2 into a core element for economics education at U. of C. Both men personally taught Nobel winners, but became ineligible for Nobel prizes upon their deaths soon after the economics award was first presented in 1969.
In his book titled, The Chicago School,3 Johan Van Overtveldt lists five characteristics that he believes underpin the success of this influential group. First, a strong work ethic. Locally, U. of C. is known as the university "where fun goes to die." But for some people, interesting work appears to be fun.
Next, economics is treated as a true science. Theories are tested and, unless backed by evidence, are disregarded.
Third, academic excellence is the sole criterion for advancement. Although the school is known for free-market advocacy, it attracts and cultivates fiercely independent thinkers with divergent views; some U. of C. professors, in contrast, have attacked elements of the capitalistic system.
Fourth, the Chicago School has a strong debating culture. Economic theories are critiqued by interdisciplinary workshops, often attended by professors of business, law and sociology to name a few. (Many of the University of Chicago's Nobel winners in economics have been associated with its business and law schools.) Work is subject to an intense, critical review process and heated debates are common.
Fifth, the University of Chicago is relatively isolated. Located on the shore of Lake Michigan and otherwise surrounded by tough neighborhoods, U. of C. tends to have many faculty members who live in its enclave, allowing academic discussions to extend well beyond classrooms.
Chicago School Economists and Their Work
Milton Friedman was a student of Knight and Viner and, in 1946, he accepted an offer to teach economics at the University of Chicago (a position opened by Viner's departure). Friedman taught at the University of Chicago for the next 30 years. His research centered on monetary theory and consumption analysis. He documented how a one-third cut in the money supply turned what could have been a normal recession into the Great Depression. Although Friedman was skeptical of government and endorsed steady growth in the money supply, his theories induced policymakers to ease credit during the dot.com bust and the more recent housing bubble. Though tremendous wealth was lost during both events, economic depressions were avoided, likely due to the monetary ease.
Friedman is perhaps best known for his influence on public policy. Like many other Chicago economists, he believed in free markets and minimal government interference in the economy. Unlike others, he popularized those notions.
Friedman believed that competition was morally superior to government control, as consumers and producers are free to choose in a capitalistic system, but are often coerced in other systems.4 He and other Chicago economists went so far as to advocate no regulations of some monopolies, stating that monopolies tend to be temporary and regulators often cause long-lasting inefficiencies and politically inspired anomalies.
Friedman was often criticized for his policy recommendations, and some of the criticisms, in hindsight, now appear laughable. One such article, published in the 1970s, attacked Friedman on the grounds that competition was imperfect and firms like General Motors and IBM had considerable
2
Wanger International 2010 Semiannual Report
market power and stifled competition. It's now safe to say that Friedman was right, as competition and technological change reduce market power over time. In 1976, Friedman won the Nobel Prize in Economics "for his achievements in the fields of consumption analysis, monetary history and theory, and for his demonstration of the complexity of stabilization policy."
Economist Theodore Schultz analyzed agricultural policies first at Iowa State, but his work was attacked by Iowa's powerful dairy lobby. He joined the University of Chicago faculty in 1944, continuing his work. He concluded that 30% to 40% of farm productivity gains in the United States were driven by increasing the skills of farmers and investing in "human capital." Chicago School economist D. Gale Johnson was greatly inspired by Schultz's work. He also joined the University of Chicago in 1944 and the two worked together for nearly 50 years. Johnson analyzed Soviet agriculture and correctly predicted that subsidies and price distortions would destabilize the entire Soviet economy. Schultz received a Nobel Prize in Economics in 1979 for his pioneering research in economic development and the problems of developing countries.
Gary Becker analyzed many curious phenomena, such as crime and punishment (deterrents matter), addiction, families and marriage, and perhaps most important, he pursued analysis of human capital. He concluded that investments in education, training and health care are crucial and can be analyzed like other investments. Becker and other Chicago School economists concluded that investment in human capital was the leading driver of economic growth. He won the Nobel Prize in Economics in 1992 "for having extended the domain of microeconomic analysis to a wide range of human behavior and interaction, including non-market behavior."
Many of the innovations in finance and financial markets have been driven by other Chicago School economists. Modern portfolio theory, efficient markets and behavioral finance have been noteworthy accomplishments. The Chicago School's option pricing models have spurred growth of trading of stock and currency options, which enable entities to reduce or assume risks.
Numerous public policies have been impacted by Chicago School research. Radio spectrum, water rights and energy leases are now often auctioned rather than awarded by regulators' opinions on "merit." Price controls, which caused America's energy shortages in the 1970s, have been repudiated. Many industries have been deregulated.
The Chicago School provided the intellectual underpinnings for Reagan's and Thatcher's economic policies,5 which reduced inflation, reinvigorated the free world and contributed to the collapse of communism. Chicago School economists provided advice that enabled third world and ex-communist countries to grow, lifting hundreds of millions of people out of poverty.
Chicago School analytical efforts have gone far beyond traditional economic topics. Economist Steven Levitt's best-selling book, Freakonomics,6 covers the economic side of lots of items, including street gangs selling crack cocaine. It turns out that from an economic standpoint, street gangs tend to be set up like large corporate franchise operations. Corner drug dealers tend to earn little money, but have room for advancement (should they not be in jail or get killed).7 Levit t covers other topics including cheating by schoolteachers and sumo wrestlers, as well as choices of names for babies.
The near-meltdown of the worldwide financial system has caused many to question deregulation and free market capitalism. It appears that public policy errors, ineffective regulation, and serious mistakes by both private sector and government entities all had a role in the crisis. Clearly there is plenty of room for improvement, and sound economic analysis is needed to facilitate new government policies and private sector practices.
The world clearly operates in an economic framework. Our investments for the Columbia Wanger Funds are driven by our evaluations of the underlying economics of the companies in which we invest. We pursue investments in businesses that we believe are strong, have competitive advantages and that are reasonably valued.


Charles P. McQuaid
President and Chief Investment Officer
Columbia Wanger Asset Management, LLC
Opinions expressed in this essay are those of the author and are not necessarily those of Columbia Wanger Asset Management, its parent organizations, or the Wanger Advisors Trust Board. These views are not guarantees of future performance and involve certain risks, uncertainties and assumptions that are difficult to predict so actual outcomes and results may differ significantly from the views expressed. These views are subject to change at any time based upon economic, market or other conditions and the respective parties disclaim any responsibility to update such views. These views may not be relied on as investment advice and, because investment decisions for a Columbia Wanger Fund are based on numerous factors, may not be relied on as an indication of trading intent on behalf of any particular Columbia Wanger Fund.
1 Overtveldt, Johan Van, The Chicago School (Chicago, Agate Publishing, 2007), pg. 6.
2 Neoclassical price theory uses mathematics to make conclusions about how the economy will behave if the price of goods, services, or behaviors increases.
3 Overtveldt, Johan Van, op. cit., pg. 11.
4 Friedman, Milton and Rose, Free to Choose (New York, Harcourt Brace Jovanovich, Inc., 1980).
5 Chicago School economists had differing opinions about elements of the policies. George Stigler, also a Nobel Prize winner affiliated with the Chicago School, labelled the supply-side program as something between a "gimmick and a slogan."
6 Levitt, Steven D., and Dubner, Stephen J., Freakonomics (New York, HarperCollins Publishers, Inc., 2005).
7 For additional information, see Sudhir Venkatesh's, Gang Leader for a Day, Penguin Press, 2008. Venkatesh was the University of Chicago sociology student whose data was utilized by Levitt.
3
Wanger International 2010 Semiannual Report

Performance Review Wanger International
 | |  | |
|
Louis J. Mendes III
Co-Portfolio Manager | | Christopher J. Olson
Co-Portfolio Manager | |
|
Performance data quoted represents past performance and current performance may be lower or higher. Past performance is no guarantee of future results. The investment return and principal value will fluctuate so that shares, when redeemed, may be worth more or less than the original cost. For daily and most recent month-end performance updates, please call 1-888-4-WANGER.
Wanger International declined 2.99% in the semiannual period ended June 30, 2010. This compares with a 4.96% drop of its primary benchmark, the S&P Global Ex-U.S. Between $500 Million and $5 Billion Index. On a year-to-date basis, international small-cap stocks continued to post better returns than their large cap counterparts. The large-cap focused MSCI EAFE Index was down 13.23% in the first half of 2010. This extends a trend of small-cap outperformance. On trailing three-year numbers, the S&P $500m to $5b cap range international stock universe, excluding emerging market securities, has led the MSCI EAFE Index (which does not contain emerging markets stocks) by an annualized 2.27%.
Continental Europe struggled in the second half of the semiannual period as investors pondered the prospects for default of one or more of the financially stressed eurozone member states such as Greece or Spain. We agree that the trends in public debt and deficits are worrying and that concern extends to creditor states like Germany, whose banks hold large quantities of public and private debt emanating from its weaker neighbors. However, we believe that the situation is more likely to result in a tighter monetary union, with more effective fiscal constraints on member states, than in the demise of the now 11-year-old euro currency. Consistent with these views, we maintained the Fund's overweight position in continental Europe, which has been the source of many of our best ideas and investment returns in recent years, and we did not categorically avoid the most vulnerable eurozone states.
Within the troubled eurozone states, we have strived to identify investments that should do well even if their capital costs increase with a perceived increase in risk. For example, at the end of the semiannual period, the Fund had 1.2% of its capital invested in electric transmission companies in Spain, Portugal and Italy. We believe capacity shortfalls and new requirements associated with renewable sources will result in large investments in these networks, and that the regulated returns on these investments will facilitate pricing structures that offset rising capital costs. It's worth noting that continental Europe was the Fund's top-performing region during the period due to good stock selection.
Japan, home to nearly 18% of the Fund's assets at the end of the period, was the second best performing region in the Fund. Japanese securities held by the Fund were up 4.7% while Japanese small caps in general were up 2.5%. The difference can be explained by a few big winners in the portfolio. Ain Pharmaciez, a pharmacy chain, was up 70% in the half after guiding investors to expect another strong fiscal year. The stock also gained greater visibility with a listing move to a more prominent segment of the Tokyo Exchange. Start Today, an online apparel retailer, was up 55% as continuing strong monthly sales figures reflect an industry shift to online purchasing. Aeon Delight, the biggest facility maintenance company in Japan, returned 40% during the semiannual period after announcing an acquisition expected to immediately contribute to earnings per share.
Laggards for the period included South Korea's MegaStudy, a provider of online education services. The stock fell 35% as the South Korean government's plans to offer free online education services created uncertainty about the future of MegaStudy's business. U.S. offshore drilling contractor Atwood Oceanics was down 28%, falling with the rest of the oil services sector due to the BP oil spill in the Gulf of Mexico. China's Wasion Group, a manufacturer of electronic power meters for Chinese utilities, declined 39% after winning a smaller than anticipated share of an important equipment tender.
International investing involves special risks, including foreign taxation, currency risks, risks associated with possible differences in financial standards and other risks associated with future political and economic developments. Stocks of small- and mid-cap companies pose special risks, including possible illiquidity and greater price volatility than stocks of larger, more established companies. Investing in emerging markets may involve greater risks than investing in more developed countries. In addition, concentration of investments in a single region may result in greater volatility.
Portfolio holdings are subject to change periodically and may not be representative of current holdings.
Fund's Positions in Mentioned Holdings
As a percentage of net assets, as of 6/30/10
| Aeon Delight | | | 0.8 | % | |
| Atwood Oceanics | | | 0.8 | | |
| Start Today | | | 0.8 | | |
| MegaStudy | | | 0.8 | | |
| Ain Pharmaciez | | | 0.7 | | |
| Wasion Group | | | 0.4 | | |
4
Wanger International 2010 Semiannual Report
Growth of a $10,000 Investment in Wanger International
May 3, 1995 (inception date) through June 30, 2010
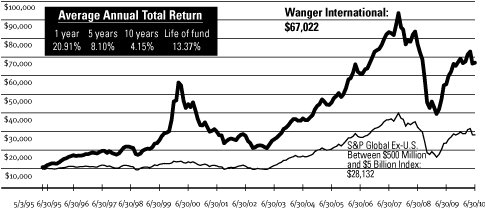
Performance data quoted represents past performance and current performance may be lower or higher. Past performance is no guarantee of future results. The investment return and principal value will fluctuate so that shares, when redeemed, may be worth more or less than the original cost. Performance results may reflect any fee waivers or reimbursements of Fund expenses by the investment advisor and/or any of its affiliates. Absent these fee waivers or expense reimbursement arrangements, performance results would have been lower. For daily and most recent month-end performance updates, please call 1-888-4-WANGER.
This graph compares the results of $10,000 invested in Wanger International on May 3, 1995 (the date the Fund began operations) through June 30, 2010, to the S&P Global Ex-U.S. Between $500 Million and $5 Billion Index with dividends and capital gains reinvested. Although the index is provided for use in assessing the Fund's performance, the Fund's holdings may differ significantly from those in the index.
Top 10 Holdings
As a percentage of net assets, as of 6/30/10
1. Naspers (South Africa)
Media in Africa & Other Emerging Markets | | | 1.5 | % | |
2. Olam International (Singapore)
Agriculture Supply Chain Manager | | | 1.5 | | |
3. Serco (United Kingdom)
Facilities Management | | | 1.4 | | |
4. Localiza Rent A Car (Brazil)
Car Rental | | | 1.3 | | |
5. Kansai Paint (Japan)
Paint Producer in Japan, India, China & Southeast Asia | | | 1.3 | | |
6. Imtech (Netherlands)
Electromechanical & ICT Installation & Maintenance | | | 1.2 | | |
7. Hexagon (Sweden)
Measurement Equipment | | | 1.1 | | |
8. Suzano (Brazil)
Brazilian Pulp & Paper Producer | | | 1.0 | | |
9. Asian Paints (India)
India's Largest Paint Company | | | 1.0 | | |
10. Lifestyle International (Hong Kong)
Mid to High-end Department Store Operator in Hong Kong & China | | | 1.0 | | |
Top 5 Countries
As a percentage of net assets, as of 6/30/10
| Japan | | | 17.7 | % | |
| United Kingdom | | | 9.1 | | |
| China | | | 6.4 | | |
| Netherlands | | | 5.9 | | |
| Canada | | | 5.4 | | |
Results as of June 30, 2010
| | | 2nd quarter | | Year to date | | 1 year | | 5 years | | 10 years | |
| Wanger International | | | -6.13 | % | | | -2.99 | % | | | 20.91 | % | | | 8.10 | % | | | 4.15 | % | |
S&P Global Ex-U.S.
Between
$500 Million and
$5 Billion Index* | | | -9.15 | | | | -4.96 | | | | 18.65 | | | | 6.51 | | | | 7.49 | | |
| MSCI EAFE Index | | | -13.97 | | | | -13.23 | | | | 5.92 | | | | 0.88 | | | | 0.16 | | |
S&P Global Ex-U.S.
SmallCap Index | | | -10.01 | | | | -6.09 | | | | 18.59 | | | | 5.21 | | | | 6.39 | | |
Lipper Variable
Underlying
International Core
Funds Index | | | -12.95 | | | | -11.54 | | | | 7.40 | | | | 0.97 | | | | -1.26 | | |
NAV as of 6/30/10: $28.46
* The Fund's primary benchmark.
Performance numbers reflect all Fund expenses but do not include any insurance charge imposed by your insurance company's separate accounts. If performance included the effect of these additional charges, it would be lower.
The Fund's annual operating expense ratio is 1.05%. The annual operating expense ratio is as stated in the Fund's prospectus that is current as of the date of this report. Differences in expense ratios disclosed elsewhere in this report may result from including fee waivers and reimbursements, if any, as well as different time periods used in calculating the ratios.
All results shown assume reinvestment of distributions and do not reflect taxes that a shareholder would pay on Fund distributions or the sale of Fund shares.
The S&P Global Ex-U.S. Between $500 Million and $5 Billion Index is a subset of the broad market selected by the index sponsor representing the mid- and small-cap developed and emerging markets, excluding the United States. The Morgan Stanley Capital International Europe, Australasia, Far East (MSCI EAFE) Index is a capitalization-weighted index that tracks the total return of common stocks in 21 developed-market countries within Europe, Australasia and the Far East. The S&P Global Ex-U.S. SmallCap Index is an unmanaged index consisting of the bottom 20% of institutionally investable capital of developed and emerging countries, outside the United States. The Lipper Variable Underlying International Core Funds Index is an equally weighted representation of the 30 largest variable insurance underlying funds in the Lipper Variable Underlying International Core Funds classification. Indexes are not managed and do not incur f ees or expenses. It is not possible to invest directly in an index.
Lipper Inc., a widely respected data provider in the industry, calculates an average total return (assuming reinvestment of distributions) for mutual funds with investment objectives similar to those of the Fund. Lipper makes no adjustment for the effect of sales loads.
Portfolio characteristics and holdings are subject to change periodically and may not be representative of current characteristics and holdings.
5
Wanger International 2010 Semiannual Report
Wanger International
Statement of Investments (Unaudited) June 30, 2010
Number of
Shares | | | | Value | |
| | | Equities – 97.4% | |
| | | Asia – 41.6% | |
| | | Japan – 17.7% | |
| | 1,131,989 | | | Kansai Paint
Paint Producer in Japan, India, China & Southeast Asia | | $ | 9,687,648 | | |
| | 320,742 | | | Aeon Delight
Facility Maintenance & Management | | | 6,226,663 | | |
| | 111,668 | | | Point
Apparel Specialty Retailer | | | 6,127,875 | | |
| | 2,200 | | | Start Today
Largest Online Japanese Apparel Retailer | | | 6,027,980 | | |
| | 4,528 | | | Advance Residence Investment (a)
Residential REIT | | | 5,844,691 | | |
| | 129,011 | | | Ain Pharmaciez
Dispensing Pharmacy/Drugstore Operator | | | 5,222,633 | | |
| | 3,359 | | | Wacom
Computer Graphic Illustration Devices | | | 4,942,174 | | |
| | 2,429 | | | Seven Bank
ATM Processing Services | | | 4,398,211 | | |
| | 551,151 | | | Kamigumi
Port Cargo Handling & Logistics | | | 4,235,782 | | |
| | 134,916 | | | Tsumura
Traditional Chinese/Japanese Herbal Rx Drugs (Kampo) | | | 4,134,988 | | |
| | 950 | | | Orix JREIT
Diversified REIT | | | 3,960,623 | | |
| | 46,099 | | | Nakanishi
Dental Tools & Machinery | | | 3,947,142 | | |
| | 164,618 | | | Glory
Currency Handling Systems & Related Equipment | | | 3,583,234 | | |
| | 665 | | | Nippon Accommodations Fund
Residential REIT | | | 3,494,570 | | |
| | 284,893 | | | Rohto Pharmaceutical
Health & Beauty Products | | | 3,474,981 | | |
| | 124,203 | | | Ibiden
Electronic Parts & Ceramics | | | 3,348,452 | | |
| | 129,041 | | | Kintetsu World Express
Airfreight Logistics | | | 3,249,135 | | |
| | 70,560 | | | Benesse
Education Service Provider | | | 3,213,452 | | |
| | 348,954 | | | Asics
Footwear & Apparel | | | 3,197,534 | | |
| | 181,977 | | | Hoshizaki Electric
Commercial Kitchen Equipment | | | 3,177,938 | | |
| | 111,286 | | | Hamamatsu Photonics
Optical Sensors for Medical & Industrial Applications | | | 3,095,492 | | |
Number of
Shares | | | | Value | |
| | 142,425 | | | Aeon Mall
Suburban Shopping Mall Developer, Owner & Operator | | $ | 2,826,055 | | |
| | 661 | | | Osaka Securities Exchange
Osaka Securities Exchange | | | 2,802,528 | | |
| | 130,847 | | | Daiseki
Waste Disposal & Recycling | | | 2,708,265 | | |
| | 298,639 | | | Suruga Bank
Regional Bank | | | 2,705,525 | | |
| | 99,286 | | | Makita
Power Tools | | | 2,648,612 | | |
| | 456 | | | Fukuoka
Diversified REIT in United Kingdom | | | 2,631,103 | | |
| | 165,960 | | | Ushio
Industrial Light Sources | | | 2,562,266 | | |
| | 166,801 | | | Tamron
Camera Lens Maker | | | 2,368,883 | | |
| | 103,258 | | | Miura
Industrial Boiler | | | 2,353,651 | | |
| | 208,723 | | | Zenrin
Map Content Publisher | | | 2,255,924 | | |
| | 2,343 | | | Jupiter Telecommunications
Largest Cable Service Provider in Japan | | | 2,232,944 | | |
| | 141,809 | | | Japan Airport Terminal
Airport Terminal Operator at Haneda | | | 2,102,276 | | |
| | 120,966 | | | Torishima Pump Manufacturing
Industrial Pump for Power Generation &
Water Supply Systems | | | 1,862,220 | | |
| | 76,586 | | | Icom
Two Way Radio Communication Equipment | | | 1,748,931 | | |
| | 407 | | | Kakaku.com
Online Price Comparison Services for Consumers | | | 1,682,448 | | |
| | 55,571 | | | Olympus
Medical Equipment (Endoscopes) & Cameras | | | 1,315,347 | | |
| | 28,114 | | | As One
Scientific Supplies Distributor | | | 482,395 | | |
| | | | 131,880,571 | | |
| | | China – 6.4% | |
| | 1,388,331 | | | Shandong Weigao
Vertically Integrated Hospital
Consumable Manufacturing | | | 6,048,380 | | |
| | 2,419,705 | | | Zhaojin Mining Industry
Gold Mining & Refining in China | | | 5,674,963 | | |
See accompanying notes to financial statements.
6
Wanger International 2010 Semiannual Report
Wanger International
Statement of Investments (Unaudited) June 30, 2010
Number of
Shares | | | | Value | |
| | | China – 6.4% (cont) | |
| | 1,752,817 | | | China Yurun Food
Meat Processor in China | | $ | 5,486,958 | | |
| | 56,000 | | | New Oriental Education &
Technology – ADR (a)(b)
China's Largest Private Education Service Provider | | | 5,218,640 | | |
| | 5,057,636 | | | China Green
Chinese Fruit & Vegetable Grower & Processor | | | 5,070,721 | | |
| | 5,546,696 | | | Jiangsu Expressway
Chinese Toll Road Operator | | | 5,056,790 | | |
| | 150,010 | | | Mindray – ADR (b)
Medical Device Manufacturer | | | 4,713,314 | | |
| | 41,684,524 | | | RexLot Holdings
Lottery Equipment Supplier in China | | | 3,803,725 | | |
| | 4,323,601 | | | Wasion Group
Electronic Power Meter Total Solution Provider | | | 2,714,828 | | |
| | 4,360,383 | | | China Communication Services
China's Telecom Infrastructure Service Provider | | | 2,124,153 | | |
| | 2,756,368 | | | Sino Ocean Land
Property Developer in China | | | 1,970,945 | | |
| | 4,580,000 | | | Fu Ji Food & Catering Services (a)(c)
Food Catering Service Provider in China | | | 47,053 | | |
| | | | 47,930,470 | | |
| | | Singapore – 4.7% | |
| | 6,200,078 | | | Olam International
Agriculture Supply Chain Manager | | | 11,352,962 | | |
| | 5,826,817 | | | CDL Hospitality Trust
Hotel Owner/Operator | | | 7,225,020 | | |
| | 11,700,000 | | | Mapletree Logistics Trust
Asian Logistics Landlord | | | 6,946,178 | | |
| | 838,842 | | | Singapore Exchange
Singapore Equity & Derivatives Market Operator | | | 4,389,314 | | |
| | 3,367,072 | | | Ascendas REIT
Singapore Industrial Property Landlord | | | 4,346,143 | | |
| | 627,300 | | | Goodpack
International Bulk Container Leasing | | | 746,516 | | |
| | | | 35,006,133 | | |
Number of
Shares | | | | Value | |
| | | India – 4.4% | |
| | 154,100 | | | Asian Paints
India's Largest Paint Company | | $ | 7,580,797 | | |
| | 322,200 | | | Jain Irrigation Systems
Agricultural Micro-irrigation Systems &
Food Processing | | | 7,378,881 | | |
| | 400,000 | | | Shriram Transport Finance
Truck Financing in India | | | 4,944,109 | | |
| | 270,000 | | | Mundra Port & Special Economic Zone
Indian West Coast Shipping Port | | | 4,248,569 | | |
| | 65,000 | | | Housing Development Finance
Indian Mortgage Lender | | | 4,097,619 | | |
| | 250,000 | | | Educomp Solutions
Multimedia Educational Content & Schools | | | 2,825,550 | | |
| | 200,000 | | | Patel Engineering
Civil Engineering & Construction | | | 1,825,768 | | |
| | | | 32,901,293 | | |
| | | South Korea – 2.9% | |
| | 45,600 | | | MegaStudy
Online Education Service Provider | | | 6,016,414 | | |
| | 40,000 | | | NHN (a)
South Korea's Largest Online Search Engine | | | 5,952,880 | | |
| | 150,000 | | | Woongjin Coway
South Korean Household Appliance Rental
Service Provider | | | 5,014,513 | | |
| | 65,000 | | | Mirae Asset Securities
South Korean Largest Diversified Financial Company | | | 2,847,866 | | |
| | 30,000 | | | Taewoong
Niche Custom Forging | | | 1,349,840 | | |
| | | | 21,181,513 | | |
| | | Hong Kong – 2.6% | |
| | 3,850,492 | | | Lifestyle International
Mid to High-end Department Store Operator in
Hong Kong & China | | | 7,468,260 | | |
| | 400,000 | | | Hong Kong Exchanges and Clearing
Hong Kong Equity & Derivatives Market Operator | | | 6,247,486 | | |
| | 900,000 | | | Melco Crown Entertainment (a)(b)
Macau Casino Operator | | | 3,366,000 | | |
| | 863,326 | | | L'Occitane International (a)
Skin Care & Cosmetics Producer | | | 1,882,556 | | |
| | | | 18,964,302 | | |
See accompanying notes to financial statements.
7
Wanger International 2010 Semiannual Report
Wanger International
Statement of Investments (Unaudited) June 30, 2010
Number of
Shares | | | | Value | |
| | | Taiwan – 2.3% | |
| | 1,000,000 | | | Simplo Technology
World's Largest Notebook Battery Pack Supplier | | $ | 5,414,291 | | |
| | 8,479,000 | | | Yuanta Financial Holdings
Financial Holding Company in Taiwan | | | 4,524,831 | | |
| | 1,550,000 | | | Everlight Electronics
LED Packager | | | 3,962,917 | | |
| | 240,000 | | | Formosa International Hotels (a)
Hotel, Food & Beverage Operation & Hospitality Management Services | | | 2,939,422 | | |
| | | | 16,841,461 | | |
| | | Indonesia – 0.6% | |
| | 11,000,000 | | | Perusahaan Gas Negara
Gas Distributor & Pipeline Operator | | | 4,651,189 | | |
| | | | | Total Asia | | | 309,356,932 | | |
| | | Europe – 35.2% | |
| | | United Kingdom – 9.1% | |
| | 1,175,000 | | | Serco
Facilities Management | | | 10,235,378 | | |
| | 2,250,000 | | | Charles Taylor (d)
Insurance Services | | | 7,416,778 | | |
| | 305,828 | | | Intertek Group
Testing, Inspection & Certification Services | | | 6,540,903 | | |
| | 825,000 | | | Micro Focus
United Kingdom Legacy Software Provider | | | 5,166,990 | | |
| | 1,618,214 | | | Cobham
Aerospace Components | | | 5,100,585 | | |
| | 440,779 | | | Capita Group
White Collar, Back Office Outsourcing | | | 4,836,040 | | |
| | 108,516 | | | Chemring
Defense Manufacturer of
Countermeasures & Energetics | | | 4,763,096 | | |
| | 6,648,224 | | | Archipelago Resources (a)
Gold Mining Projects in Indonesia,
Vietnam & the Philippines | | | 4,131,451 | | |
| | 213,236 | | | Schroders
United Kingdom Top Tier Asset Manager | | | 3,837,549 | | |
| | 907,298 | | | PureCircle (a)
Manufactures Natural Sweetener | | | 3,355,750 | | |
| | 133,047 | | | Abcam
Online Sales of Antibodies | | | 2,428,824 | | |
Number of
Shares | | | | Value | |
| | 162,804 | | | Tullow Oil
Oil & Gas Producer | | $ | 2,425,080 | | |
| | 200,158 | | | Smith & Nephew
Medical Equipment & Supplies | | | 1,884,513 | | |
| | 492,966 | | | N Brown Group
Home Shopping Women's Clothes Retailer | | | 1,833,501 | | |
| | 652,534 | | | RPS Group
Environmental Consulting & Planning | | | 1,814,083 | | |
| | 91,875 | | | Rotork
Valve Actuators for Oil & Water Pipelines | | | 1,736,387 | | |
| | | | 67,506,908 | | |
| | | Netherlands – 5.9% | |
| | 333,886 | | | Imtech
Electromechanical & ICT Installation & Maintenance | | | 8,565,025 | | |
| | 145,037 | | | Fugro
Sub-sea Oilfield Services | | | 6,631,610 | | |
| | 175,074 | | | Vopak
World's Largest Operator of Petroleum &
Chemical Storage Terminals | | | 6,425,012 | | |
| | 248,514 | | | Unit 4 Agresso
Business Software Development | | | 5,144,669 | | |
| | 221,101 | | | Koninklijke TenCate
Advanced Textiles & Industrial Fabrics | | | 4,816,904 | | |
| | 332,364 | | | Aalberts Industries
Flow Control & Heat Treatment | | | 4,284,625 | | |
| | 188,666 | | | Arcadis
Engineering Consultants | | | 3,379,293 | | |
| | 124,084 | | | QIAGEN (a)
Life Science Tools & Molecular Diagnostics | | | 2,403,696 | | |
| | 87,900 | | | USG People (a)
Temporary Staffing Services | | | 1,233,482 | | |
| | 8,017 | | | Core Laboratories
Oil & Gas Reservoir Consulting | | | 1,183,389 | | |
| | | | 44,067,705 | | |
| | | Germany – 4.2% | |
| | 298,241 | | | Rhoen-Klinikum
Health Care Services | | | 6,624,300 | | |
| | 105,736 | | | CTS Eventim
Event Ticket Sales | | | 5,082,188 | | |
See accompanying notes to financial statements.
8
Wanger International 2010 Semiannual Report
Wanger International
Statement of Investments (Unaudited) June 30, 2010
Number of
Shares | | | | Value | |
| | | Germany – 4.2% (cont) | |
| | 45,229 | | | Vossloh
Rail Infrastructure & Diesel Locomotives | | $ | 3,676,560 | | |
| | 61,837 | | | Wincor Nixdorf
Retail POS Systems & ATM Machines | | | 3,459,882 | | |
| | 22,209 | | | Rational
Commercial Oven Manufacturer | | | 3,429,974 | | |
| | 160,062 | | | Tognum
Diesel Engines for Drive & Power Generation Systems | | | 2,975,956 | | |
| | 110,600 | | | Elringklinger
Automobile Components | | | 2,366,644 | | |
| | 217,494 | | | Wirecard (b)
Online Payment Processing & Risk Management | | | 1,849,995 | | |
| | 62,890 | | | Deutsche Beteiligungs
Private Equity Investment Management | | | 1,432,368 | | |
| | | | 30,897,867 | | |
| | | Switzerland – 3.1% | |
| | 3,613 | | | Sika
Chemicals for Construction & Industrial Applications | | | 6,385,434 | | |
| | 56,616 | | | Kuehne & Nagel
Freight Forwarding/Logistics | | | 5,799,153 | | |
| | 32,086 | | | Geberit
Plumbing Supplies | | | 4,975,672 | | |
| | 112,031 | | | Bank Sarasin & Cie
Private Banking | | | 4,488,459 | | |
| | 13,030 | | | Partners Group
Private Markets Asset Management | | | 1,572,298 | | |
| | | | 23,221,016 | | |
| | | France – 3.0% | |
| | 57,526 | | | Neopost
Postage Meter Machines | | | 4,162,952 | | |
| | 98,988 | | | Mersen
Advanced Industrial Materials | | | 3,375,668 | | |
| | 85,175 | | | Eurofins Scientific (a)(b)
Food, Pharmaceuticals & Materials Screening & Testing | | | 3,022,273 | | |
| | 43,766 | | | Pierre & Vacances
Vacation Apartment Lets | | | 2,912,987 | | |
| | 73,568 | | | Saft (b)
Niche Battery Manufacturer | | | 2,230,770 | | |
| | 27,264 | | | Rubis
Tank Storage & Liquefied Petroleum Gas Distribution | | | 2,204,368 | | |
Number of
Shares | | | | Value | |
| | 28,044 | | | Norbert Dentressangle
Leading European Logistics & Transport Group | | $ | 1,841,676 | | |
| | 36,025 | | | Zodiac Aerospace
Aerospace Supplier | | | 1,735,156 | | |
| | 146,933 | | | Hi-Media (a)
Online Advertiser in Europe | | | 772,599 | | |
| | | | 22,258,449 | | |
| | | Italy – 1.9% | |
| | 615,959 | | | Credito Emiliano
Italian Regional Bank | | | 3,466,463 | | |
| | 905,816 | | | Terna
Italian Power Transmission | | | 3,262,213 | | |
| | 190,828 | | | Ansaldo STS
Railway Systems Integrator | | | 3,046,962 | | |
| | 1,424,488 | | | CIR (a)
Italian Holding Company | | | 2,400,564 | | |
| | 36,304 | | | Tod's
Leather Shoes & Bags | | | 2,288,753 | | |
| | | | 14,464,955 | | |
| | | Sweden – 1.9% | |
| | 623,465 | | | Hexagon
Measurement Equipment | | | 8,118,390 | | |
| | 674,010 | | | Sweco
Engineering Consultants | | | 4,296,653 | | |
| | 173,829 | | | East Capital Explorer (a)
Sweden-based RUS/CEE Investment Fund | | | 1,577,025 | | |
| | | | 13,992,068 | | |
| | | Ireland – 1.3% | |
| | 2,066,721 | | | United Drug
Irish Pharmaceutical Wholesaler & Outsourcer | | | 5,752,755 | | |
| | 76,507 | | | Paddy Power
Irish Betting Services | | | 2,375,549 | | |
| | 42,721 | | | Aryzta
Baked Goods | | | 1,611,961 | | |
| | | | 9,740,265 | | |
| | | Finland – 1.2% | |
| | 167,841 | | | Stockmann
Department Store & Fashion Retailer in
Scandinavia & Russia | | | 5,178,100 | | |
See accompanying notes to financial statements.
9
Wanger International 2010 Semiannual Report
Wanger International
Statement of Investments (Unaudited) June 30, 2010
Number of
Shares | | | | Value | |
| | | Finland – 1.2% (cont) | |
| | 305,022 | | | Poyry
Engineering Consultants | | $ | 3,755,574 | | |
| | | | 8,933,674 | | |
| | | Denmark – 0.8% | |
| | 53,050 | | | Novozymes
Industrial Enzymes | | | 5,630,591 | | |
| | | Iceland – 0.6% | |
| | 6,000,001 | | | Marel (a)
Largest Manufacturer of Poultry & Fish
Processing Equipment | | | 4,212,460 | | |
| | | Spain – 0.6% | |
| | 116,000 | | | Red Eléctrica de Espana
Spanish Power Transmission | | | 4,146,589 | | |
| | | Poland – 0.4% | |
| | 155,043 | | | Central European Distribution (a)
Largest Spirits Company in Central & Eastern Europe | | | 3,314,819 | | |
| | | Czech Republic – 0.4% | |
| | 19,791 | | | Komercni Banka
Leading Czech Republic Universal Bank | | | 3,197,935 | | |
| | | Greece – 0.4% | |
| | 1,000,000 | | | Intralot
Lottery & Gaming Systems & Services | | | 3,175,101 | | |
| | | Portugal – 0.4% | |
| | 520,068 | | | Redes Energéticas Nacionais
Portuguese Power Transmission & Gas Transportation | | | 1,676,406 | | |
| | 1,804,112 | | | Banco Comercial Português
Largest Portuguese Banking Franchise | | | 1,352,384 | | |
| | | | 3,028,790 | | |
| | | | | Total Europe | | | 261,789,192 | | |
| | | Other Countries – 14.4% | |
| | | Canada – 5.4% | |
| | 287,815 | | | ShawCor
Oil & Gas Pipeline Products | | | 7,259,248 | | |
| | 320,940 | | | Eldorado Gold
Gold Miner in Turkey, Greece, China & Brazil | | | 5,752,229 | | |
| | 198,849 | | | CCL Industries
Leading Global Label Manufacturer | | | 5,323,561 | | |
| | 155,000 | | | Baytex
Oil & Gas Producer in Canada | | | 4,630,125 | | |
| | 93,542 | | | AG Growth
Leading Manufacturer of Augers &
Grain Handling Equipment | | | 3,084,237 | | |
Number of
Shares | | | | Value | |
| | 436,000 | | | Guyana Goldfields (a)(e)
Gold Mining Projects in Guyana | | $ | 2,838,270 | | |
| | 309,100 | | | Tahoe Resources (a)(e)
Silver Project in Guatemala | | | 1,849,577 | | |
| | 111,315 | | | Black Diamond Group
Provides Accommodations/Equipment for
Oil Sands Exploitation | | | 1,835,121 | | |
| | 369,071 | | | Pan Orient (a)
Growth Oriented & Return Focused Asian Explorer | | | 1,785,464 | | |
| | 135,221 | | | Ivanhoe Mines (a) | | | 1,751,630 | | |
| | 129,042 | | | Ivanhoe Mines (a)(f)
Copper Mine Project in Mongolia | | | 1,682,708 | | |
| | 4,000,000 | | | Eacom Timber – Subscription
Receipts (a)(e)
Canadian Lumber Producer | | | 1,713,400 | | |
| | 510,777 | | | Horizon North Logistics (a)
Provides Diversified Oil Service Offering in
Northern Canada | | | 791,679 | | |
| | 10,000 | | | WestFire Energy (a)
Oil Producer in Alberta & Saskatchewan | | | 61,340 | | |
| | | | 40,358,589 | | |
| | | United States – 3.4% | |
| | 239,934 | | | Atwood Oceanics (a)
Offshore Drilling Contractor | | | 6,123,116 | | |
| | 97,523 | | | Alexion Pharmaceuticals (a)
Biotech Focused on Orphan Diseases | | | 4,992,202 | | |
| | 148,910 | | | World Fuel Services
Global Fuel Broker | | | 3,862,725 | | |
| | 61,961 | | | FMC Technologies (a)
Oil & Gas Wellhead Manufacturer | | | 3,262,866 | | |
| | 81,415 | | | Bristow (a)
Largest Provider of Helicopter Services to
Offshore Oil & Gas Producers | | | 2,393,601 | | |
| | 128,081 | | | Ritchie Brothers Auctioneers (b)
Heavy Equipment Auctioneer | | | 2,333,636 | | |
| | 31,077 | | | Oceaneering International (a)
Provider of Sub-sea Services & Manufactured Products | | | 1,395,357 | | |
| | 58,560 | | | Tesco (a)
Developing New Well Drilling Technologies | | | 719,117 | | |
| | 1,361 | | | Textainer Group Holdings
Top International Container Leasor | | | 32,855 | | |
| | | | 25,115,475 | | |
See accompanying notes to financial statements.
10
Wanger International 2010 Semiannual Report
Wanger International
Statement of Investments (Unaudited) June 30, 2010
Number of
Shares | | | | Value | |
| | | South Africa – 2.2% | |
| | 340,000 | | | Naspers
Media in Africa & Other Emerging Markets | | $ | 11,427,365 | | |
| | 798,985 | | | Mr. Price
South African Retailer of Apparel,
Household & Sporting Goods | | | 4,632,950 | | |
| | 19,300 | | | Northam Platinum
Platinum Mining in South Africa | | | 113,380 | | |
| | | | 16,173,695 | | |
| | | Australia – 2.1% | |
| | 415,425 | | | UGL
Engineering & Facilities Management | | | 4,691,310 | | |
| | 53,785 | | | Cochlear
Cochlear Implants for Hearing | | | 3,350,372 | | |
| | 293,547 | | | Billabong International
Action Sports Apparel Brand Manager | | | 2,137,759 | | |
| | 82,885 | | | Perpetual Trustees
Mutual Fund Management | | | 1,953,204 | | |
| | 1,399,296 | | | Hastie Group
Mechanical, Electrical & Hydraulic (MEH) Engineering | | | 1,610,547 | | |
| | 443,145 | | | SAI Global
Publishing, Certification & Compliance Services | | | 1,485,011 | | |
| | 131,503 | | | Seek
Online Job Listing & Education | | | 766,006 | | |
| | | | 15,994,209 | | |
| | | Israel – 0.7% | |
| | 502,004 | | | Israel Chemicals
Producer of Potash, Phosphates, Bromine &
Specialty Chemicals | | | 5,235,091 | | |
| | | Kazakhstan – 0.3% | |
| | 300,000 | | | Halyk Savings Bank of
Kazakhstan – GDR (a)
Largest Retail Bank & Insurer in Kazakhstan | | | 2,330,923 | | |
| | | Senegal – 0.3% | |
| | 7,408 | | | Sonatel
Leading Telecoms Operator in Western Africa | | | 1,864,372 | | |
| | | Egypt – 0.0% | |
| | 15,430 | | | Paints & Chemical Industries (Pachin)
Paints & Inks in Egypt | | | 131,347 | | |
| | | | | Total Other Countries | | | 107,203,701 | | |
Number of
Shares | | | | Value | |
| | | Latin America – 6.2% | |
| | | Brazil – 4.8% | |
| | 850,000 | | | Localiza Rent A Car
Car Rental | | $ | 9,865,651 | | |
| | 900,000 | | | Suzano
Brazilian Pulp & Paper Producer | | | 7,583,933 | | |
| | 320,000 | | | Natura
Direct Retailer of Cosmetics | | | 7,091,413 | | |
| | 579,400 | | | Mills Estruturas e Servicios
de Engenha (a)
Civil Engineering & Construction | | | 4,381,612 | | |
| | 430,000 | | | PDG Realty
Brazilian Low-income Property Developer | | | 3,630,582 | | |
| | 500,000 | | | MRV Engenharia
Brazilian Low-income Property Developer | | | 3,520,776 | | |
| | | | 36,073,967 | | |
| | | Mexico – 0.9% | |
| | 98,000 | | | Grupo Aeroportuario del Sureste – ADR
Mexican Airport Operator | | | 4,462,920 | | |
| | 1,264,510 | | | Urbi Desarrollos Urbanos (a)
Affordable Housing Builder | | | 2,346,565 | | |
| | | | 6,809,485 | | |
| | | Chile – 0.5% | |
| | 111,689 | | | Sociedad Quimica y Minera de
Chile – ADR
Producer of Specialty Fertilizers, Lithium & Iodine | | | 3,642,178 | | |
| | | | | Total Latin America | | | 46,525,630 | | |
| Total Equities (Cost: $521,894,550) – 97.4% | | | 724,875,455 | | |
| Securities Lending Collateral – 1.5% | | | |
| | 10,806,494 | | | Dreyfus Government Cash
Management Fund (g)
(7 day yield of 0.03%) | | | 10,806,494 | | |
Total Securities Lending Collateral
(Cost: $10,806,494) | | | 10,806,494 | | |
See accompanying notes to financial statements.
11
Wanger International 2010 Semiannual Report
Wanger International
Statement of Investments (Unaudited) June 30, 2010
| Principal Amount | | | | Value | |
| Short-Term Obligation – 2.3% | |
| | | Repurchase Agreement – 2.3% | |
| $ | 17,244,000 | | | Repurchase Agreement with Fixed
Income Clearing Corp., dated 6/30/10,
due 7/01/10 at 0.00%, collateralized by
a U.S. Government Agency obligation,
maturing 8/25/14, market value
$17,591,288 (repurchase proceeds
$17,244,000) | | $ | 17,244,000 | | |
Total Short-Term Obligation
(Amortized Cost: $17,244,000) | | | 17,244,000 | | |
Total Investments
(Cost: $549,945,044) – 101.2% (h)(i) | | | 752,925,949 | | |
Obligation to Return Collateral for Securities
Loaned – (1.5)% | | | (10,806,494 | ) | |
| Cash and Other Assets Less Liabilities – 0.3% | | | 2,288,857 | | |
| Total Net Assets – 100.0% | | $ | 744,408,312 | | |
Notes to Statement of Investments:
(a) Non-income producing security.
(b) All or a portion of this security was on loan at June 30, 2010. The total market value of Fund securities on loan at June 30, 2010 was $10,406,883.
(c) Illiquid security.
(d) An affiliated person of the Fund may include any company in which the Fund owns five percent or more of its outstanding voting shares. Holdings and transactions in this affiliated company during the six months ended June 30, 2010, are as follows:
Affiliate | | Balance
of Shares
Held at
12/31/2009 | | Purchases/
Additions | | Sales/
Reductions | | Balance of
Shares
Held at
6/30/10 | | Value | | Dividend | |
Charles
Taylor | | | 3,000,000 | | | | 150,000 | | | | 900,000 | | | | 2,250,000 | | | $ | 7,416,778 | | | $ | 439,403 | | |
The aggregate cost and value of this company at June 30, 2010, was $9,152,033 and $7,416,778, respectively. Investments in the affiliated company represented 1.0% of the total net assets at June 30, 2010.
(e) Denotes a restricted security, which is subject to restrictions on resale under federal securities laws. These securities are valued at a fair value determined in good faith under consistently applied procedures established by the Board of Trustees. At June 30, 2010, the market value of these securities amounted to $6,401,247 which represented 0.86% of total net assets.
Additional information on these securities is as follows:
Security | | Acquisition
Dates | | Shares | |
Cost | |
Value | |
| Guyana Goldfields | | 1/19/10 | | | 436,000 | | | $ | 2,939,088 | | | $ | 2,838,270 | | |
| Tahoe Resources | | 5/28/10 | | | 309,100 | | | | 1,765,109 | | | | 1,849,577 | | |
Eacom Timber –
Subscription Receipts | | 3/17/10 | | | 4,000,000 | | | | 1,980,198 | | | | 1,713,400 | | |
| | | | | | | | | $ | 6,684,395 | | | $ | 6,401,247 | | |
(f) Security is traded on a U.S. exchange.
(g) Investment made with cash collateral received from securities lending activity.
(h) At June 30, 2010, for federal income tax purposes, the cost of investments was $549,945,044, and net unrealized appreciation was $202,980,905, consisting of gross unrealized appreciation of $239,281,506 and gross unrealized depreciation of $36,300,601.
(i) On June 30, 2010, the Fund's total investments were denominated in currencies as follows:
| Currency | | Value | | Percentage of
Net Assets | |
| Euro | | $ | 135,514,348 | | | | 18.2 | | |
| Japanese Yen | | | 131,880,571 | | | | 17.7 | | |
| U.S. Dollar | | | 70,661,719 | | | | 9.5 | | |
| British Pound | | | 67,506,908 | | | | 9.1 | | |
| Hong Kong Dollar | | | 53,596,817 | | | | 7.2 | | |
| Canadian Dollar | | | 42,692,225 | | | | 5.7 | | |
Other currencies less than
5% of total net assets | | | 240,266,867 | | | | 32.3 | | |
Cash and other assets
less liabilities | | | 2,288,857 | | | | 0.3 | | |
| | | $ | 744,408,312 | | | | 100.0 | | |
ADR = American Depositary Receipts
GDR = Global Depositary Receipts
At June 30, 2010, the Fund had entered into the following forward foreign currency exchange contracts:
Foreign Exchange Rate Risk
Forward
Foreign
Currency
Exchange
Contracts
to Buy | | Forward
Foreign
Currency
Exchange
Contracts
to Sell | | Principal
Amount in
Foreign
Currency | | Principal
Amount in
U.S. Dollar | | Settlement
Date | | Unrealized
Appreciation | |
| USD | | AUD | | | 6,075,831 | | | $ | 5,200,000 | | | 7/15/10 | | $ | 93,287 | | |
| USD | | CAD | | | 4,649,850 | | | | 4,500,000 | | | 7/15/10 | | | 132,431 | | |
| USD | | EUR | | | 18,667,233 | | | | 25,500,000 | | | 7/15/10 | | | 2,671,371 | | |
| USD | | EUR | | | 8,662,749 | | | | 10,600,000 | | | 8/13/10 | | | 4,555 | | |
| USD | | EUR | | | 8,660,838 | | | | 10,600,000 | | | 9/15/10 | | | 4,839 | | |
| JPY | | USD | | | 790,338,500 | | | | 8,500,000 | | | 7/15/10 | | | 440,783 | | |
| JPY | | USD | | | 302,527,500 | | | | 3,300,000 | | | 8/13/10 | | | 123,959 | | |
| JPY | | USD | | | 302,603,400 | | | | 3,300,000 | | | 9/15/10 | | | 126,762 | | |
| | | | | | | | | $ | 71,500,000 | | | | | $ | 3,597,987 | | |
See accompanying notes to financial statements.
12
Wanger International 2010 Semiannual Report
Wanger International
Statement of Investments (Unaudited) June 30, 2010
Forward
Foreign
Currency
Exchange
Contracts
to Buy | | Forward
Foreign
Currency
Exchange
Contracts
to Sell | | Principal
Amount in
Foreign
Currency | | Principal
Amount in
U.S. Dollar | | Settlement
Date | | Unrealized
Depreciation | |
| AUD | | USD | | | 9,173,718 | | | $ | 8,500,000 | | | 7/15/10 | | $ | (789,525 | ) | |
| AUD | | USD | | | 3,868,925 | | | | 3,300,000 | | | 8/13/10 | | | (59,074 | ) | |
| AUD | | USD | | | 3,883,724 | | | | 3,300,000 | | | 9/15/10 | | | (59,301 | ) | |
| CAD | | USD | | | 8,467,955 | | | | 8,500,000 | | | 7/15/10 | | | (546,114 | ) | |
| CAD | | USD | | | 4,134,000 | | | | 4,000,000 | | | 8/13/10 | | | (117,641 | ) | |
| CAD | | USD | | | 4,135,080 | | | | 4,000,000 | | | 9/15/10 | | | (117,543 | ) | |
| EUR | | USD | | | 12,179,969 | | | | 14,900,000 | | | 7/15/10 | | | (4,809 | ) | |
| USD | | JPY | | | 476,580,000 | | | | 5,200,000 | | | 7/15/10 | | | (191,359 | ) | |
| | | | | | | | | $ | 51,700,000 | | | | | $ | (1,885,366 | ) | |
The counterparty for all forward foreign currency exchange contracts is State Street Bank and Trust company.
AUD = Australian Dollar
CAD = Canadian Dollar
EUR = Euro
JPY = Japanese Yen
USD = United States Dollar
The following table summarizes the inputs used, as of June 30, 2010, in valuing the Fund's assets:
Investment Type | | Quoted Prices
(Level 1) | | Other
Significant
Observable
Inputs
(Level 2) | | Significant
Unobservable
Inputs
(Level 3) | | Total | |
| Equities | |
| Asia | | $ | 13,297,954 | | | $ | 296,011,925 | | | $ | 47,053 | | | $ | 309,356,932 | | |
| Europe | | | 4,498,208 | | | | 257,290,984 | | | | — | | | | 261,789,192 | | |
| Other Countries | | | 61,911,087 | | | | 45,292,614 | | | | — | | | | 107,203,701 | | |
| Latin America | | | 46,525,630 | | | | — | | | | — | | | | 46,525,630 | | |
| Total Equities | | | 126,232,879 | | | | 598,595,523 | | | | 47,053 | | | | 724,875,455 | | |
Total Securities
Lending Collateral | | | 10,806,494 | | | | — | | | | — | | | | 10,806,494 | | |
Total Short-Term
Obligation | | | — | | | | 17,244,000 | | | | — | | | | 17,244,000 | | |
| Total Investments | | $ | 137,039,373 | | | $ | 615,839,523 | | | $ | 47,053 | | | $ | 752,925,949 | | |
Unrealized
Appreciation on
Forward Foreign
Currency Exchange
Contracts | | | — | | | | 3,597,987 | | | | — | | | | 3,597,987 | | |
Unrealized
Depreciation on
Forward Foreign
Currency Exchange
Contracts | | | — | | | | (1,885,366 | ) | | | — | | | | (1,885,366 | ) | |
| Total | | $ | 137,039,373 | | | $ | 617,552,144 | | | $ | 47,053 | | | $ | 754,638,570 | | |
The Fund's assets assigned to the Level 2 input category are generally valued using the market approach, in which a security's value is determined through its correlation to prices and information from market transactions for similar or identical assets. Foreign equities are generally valued at the last sales price on the foreign exchange or market on which they trade. The Fund may use a systematic fair valuation model provided by an independent third party to value securities principally traded in foreign markets in order to adjust for possible stale pricing that may occur between the close of the foreign exchanges and the time for valuation. These models take into account available market data including intraday index, ADR, and ETF movements. Forward foreign currency exchange contracts are valued at the prevailing forward exchange rate of the underlying cu rrencies. Securities acquired via private placement, that have a holding period or an extended settlement period, are valued at a discount to the same shares that are trading freely on the market. These discounts are determined by the advisors experience with similar securities or situations. Factors may include, but are not limited to, trade volume, shares outstanding and stock price.
Certain Short-Term Obligations may be valued using amortized cost, an income approach which converts future cash flows to a present value based upon the discount or premium at purchase.
The Fund's assets assigned to the Level 3 input category are valued at fair value as determined in good faith under consistently applied procedures established by and under the general supervision of the Board of Trustees. To determine fair value, management will utilize the valuation technique that they deem the most appropriate in the circumstances. Securities for which no market exists are valued based upon the market approach using inputs from the investment team but ultimately decided by the Board of Trustees. These may include, but are not limited to, projected earnings, available cash, line of business, multiples, and consideration of the prioritization of the equity in a company's capital structure.
See accompanying notes to financial statements.
13
Wanger International 2010 Semiannual Report
Wanger International
Statement of Investments (Unaudited) June 30, 2010
The following table reconciles asset balances for the six-month period ending June 30, 2010, in which significant unobservable inputs (Level 3) were used in determining value:
| Investments in Securities | | Balance as of
December 31,
2009 | | Realized
Gain/(Loss) | | Change in
Unrealized
Appreciation
(Depreciation) | | Purchase | | (Sales) | | Transfers
into Level 3 | | Transfers
(out of) Level 3 | | Balance
as of
June 30,
2010 | |
Equities
Asia | | $ | 47,257 | | | $ | — | | | $ | (204 | ) | | $ | — | | | $ | — | | | $ | — | | | $ | — | | | $ | 47,053 | | |
| | | $ | 47,257 | | | $ | — | | | $ | (204 | ) | | $ | — | | | $ | — | | | $ | — | | | $ | — | | | $ | 47,053 | | |
The information in the above reconciliation represents fiscal year to date activity for any securities identified as using Level 3 inputs at either the beginning or the end of the current fiscal period.
The change in unrealized depreciation attributed to securities owned at June 30, 2010, which were valued using significant unobservable inputs (Level 3) amounted to $204. This amount is included in net change in unrealized appreciation (depreciation) on the Statement of Changes in Net Assets.
The Fund adopted FASB Accounting Standards Update No. 2010-06 "Fair Value Measurements and Disclosures (Topic 820)" ("the Update"), effective March 31, 2010. The Update applies to the Fund's disclosures about transfers in and out of Level 1 and Level 2 of the fair value hierarchy and the reasons for the transfers as well as to disclosures about the valuation techniques and inputs used to measure fair value for investments that fall in either Level 2 or Level 3 fair value hierarchy.
The following table shows transfers between Level 1 and Level 2 of the fair value hierarchy:
| Transfers In | | Transfers Out | |
| Level 1 | | Level 2 | | Level 1 | | Level 2 | |
| $ | 50,404,067 | | | $ | — | | | $ | — | | | $ | 50,404,067 | | |
Financial assets were transferred from Level 2 to Level 1 as they resumed trading during the period.
For more information on valuation inputs, and their aggregation into the levels used in the tables above, please refer to the Security Valuation section in the accompanying Notes to Financial Statements.
See accompanying notes to financial statements.
14
Wanger International 2010 Semiannual Report
Wanger International
Portfolio Diversification (Unaudited) June 30, 2010
At June 30, 2010, the Fund's portfolio investments as a percentage of net assets was diversified as follows:
| | | Value | | Percentage of
Net Assets | |
| Industrial Goods & Services | |
| Other Industrial Services | | $ | 64,360,492 | | | | 8.6 | | |
Industrial Materials &
Specialty Chemicals | | | 48,852,302 | | | | 6.6 | | |
| Machinery | | | 48,347,730 | | | | 6.5 | | |
| Outsourcing Services | | | 16,304,900 | | | | 2.2 | | |
| Electrical Components | | | 14,656,717 | | | | 2.0 | | |
| Construction | | | 13,516,688 | | | | 1.8 | | |
| Conglomerates | | | 7,633,077 | | | | 1.0 | | |
| Medical Equipment & Devices | | | 3,947,142 | | | | 0.5 | | |
| Industrial Distribution | | | 1,228,911 | | | | 0.2 | | |
| | | | 218,847,959 | | | | 29.4 | | |
| Consumer Goods & Services | |
| Food & Beverage | | | 26,925,405 | | | | 3.6 | | |
| Retail | | | 26,670,994 | | | | 3.6 | | |
| Other Consumer Services | | | 21,712,639 | | | | 2.9 | | |
| Nondurables | | | 20,061,264 | | | | 2.7 | | |
| Travel | | | 12,778,638 | | | | 1.7 | | |
| Casinos & Gaming | | | 12,720,375 | | | | 1.7 | | |
| Apparel | | | 10,513,393 | | | | 1.4 | | |
| Other Entertainment | | | 8,021,610 | | | | 1.1 | | |
| Educational Services | | | 5,218,640 | | | | 0.7 | | |
| Consumer Goods Distribution | | | 3,314,819 | | | | 0.5 | | |
| Consumer Electronics | | | 2,368,883 | | | | 0.3 | | |
| | | | 150,306,660 | | | | 20.2 | | |
| Information | |
| Computer Hardware & Related Equipment | | | 13,816,347 | | | | 1.9 | | |
| Financial Processors | | | 12,486,795 | | | | 1.7 | | |
| TV Broadcasting | | | 11,427,365 | | | | 1.5 | | |
| Instrumentation | | | 11,213,882 | | | | 1.5 | | |
| Business Software | | | 10,311,659 | | | | 1.4 | | |
| Internet Related | | | 8,401,334 | | | | 1.1 | | |
| Publishing | | | 5,081,474 | | | | 0.7 | | |
| Semiconductors & Related Equipment | | | 3,962,917 | | | | 0.5 | | |
| CATV | | | 2,232,944 | | | | 0.3 | | |
| Telecommunications Equipment | | | 2,124,153 | | | | 0.3 | | |
| Telephone and Data Services | | | 1,864,372 | | | | 0.3 | | |
| Business Information & Marketing Services | | | 1,814,083 | | | | 0.2 | | |
| Mobile Communications | | | 1,748,931 | | | | 0.2 | | |
| Advertising | | | 772,599 | | | | 0.1 | | |
| | | | 87,258,855 | | | | 11.7 | | |
| Energy & Minerals | |
| Oil Services | | | 30,411,715 | | | | 4.1 | | |
| Mining | | | 24,977,597 | | | | 3.4 | | |
| Oil Refining, Marketing & Distribution | | | 13,280,569 | | | | 1.8 | | |
| Agricultural Commodities | | | 9,297,333 | | | | 1.2 | | |
| Oil & Gas Producers | | | 8,902,009 | | | | 1.2 | | |
| | | | 86,869,223 | | | | 11.7 | | |
| | | Value | | Percentage of
Net Assets | |
| Other Industries | |
| Real Estate | | $ | 45,917,196 | | | | 6.2 | | |
| Transportation | | | 21,562,169 | | | | 2.9 | | |
| Regulated Utilities | | | 9,085,208 | | | | 1.2 | | |
| Conglomerates | | | 2,400,564 | | | | 0.3 | | |
| | | | 78,965,137 | | | | 10.6 | | |
| Finance | |
| Brokerage & Money Management | | | 22,233,600 | | | | 3.0 | | |
| Banks | | | 17,451,441 | | | | 2.3 | | |
| Finance Companies | | | 7,779,492 | | | | 1.0 | | |
| Insurance | | | 7,416,778 | | | | 1.0 | | |
| Savings & Loans | | | 4,097,619 | | | | 0.6 | | |
| | | | 58,978,930 | | | | 7.9 | | |
| Health Care | |
| Medical Equipment & Devices | | | 22,304,128 | | | | 3.0 | | |
| Pharmaceuticals | | | 9,887,743 | | | | 1.3 | | |
| Health Care Services | | | 6,624,300 | | | | 0.9 | | |
| Medical Supplies | | | 4,832,520 | | | | 0.7 | | |
| | | | 43,648,691 | | | | 5.9 | | |
| Total Equities | | | 724,875,455 | | | | 97.4 | | |
| Securities Lending Collateral | | | 10,806,494 | | | | 1.5 | | |
| Short-Term Obligation | | | 17,244,000 | | | | 2.3 | | |
| Total Investments | | | 752,925,949 | | | | 101.2 | | |
Obligation to Return Collateral for
Securities Loaned | | | (10,806,494 | ) | | | (1.5 | ) | |
Cash and Other Assets
Less Liabilities | | | 2,288,857 | | | | 0.3 | | |
| Net Assets | | $ | 744,408,312 | | | | 100.0 | | |
See accompanying notes to financial statements.
15
Wanger International 2010 Semiannual Report
Statement of Assets and Liabilities
June 30, 2010 (Unaudited)
| Assets: | |
| Unaffiliated investments, at cost | | $ | 540,793,011 | | |
| Affiliated investments, at cost (See Note 4) | | | 9,152,033 | | |
Unaffiliated investments, at value (including
securities on loan of $10,406,883) | | $ | 745,509,171 | | |
| Affiliated investments, at value (See Note 4) | | | 7,416,778 | | |
| Cash | | | 896 | | |
| Foreign currency (cost of $3,528,265) | | | 3,533,026 | | |
Unrealized appreciation on forward foreign
currency exchange contracts | | | 3,597,987 | | |
| Receivable for: | |
| Investments sold | | | 1,799,723 | | |
| Fund shares sold | | | 26,326 | | |
| Securities lending income | | | 23,794 | | |
| Dividends | | | 1,075,297 | | |
| Foreign tax reclaims | | | 529,552 | | |
| Trustees' deferred compensation plan | | | 102,855 | | |
| Other assets | | | 338,300 | | |
| Total Assets | | | 763,953,705 | | |
| Liabilities: | |
| Collateral on securities loaned | | | 10,806,494 | | |
Unrealized depreciation on forward foreign
currency exchange contracts | | | 1,885,366 | | |
| Payable for: | |
| Investments purchased | | | 4,233,388 | | |
| Fund shares repurchased | | | 1,348,708 | | |
| Investment advisory fee | | | 554,302 | | |
| Administration fee | | | 33,444 | | |
| Transfer agent fee | | | 31 | | |
| Trustees' fees | | | 12,800 | | |
| Custody fee | | | 174,975 | | |
| Reports to shareholders | | | 301,769 | | |
| Trustees' deferred compensation plan | | | 102,855 | | |
| Other liabilities | | | 91,261 | | |
| Total Liabilities | | | 19,545,393 | | |
| Net Assets | | $ | 744,408,312 | | |
| Composition of Net Assets: | |
| Paid-in capital | | $ | 582,706,388 | | |
| Overdistributed net investment income | | | (4,387,387 | ) | |
| Accumulated net realized loss | | | (38,609,762 | ) | |
| Net unrealized appreciation on: | |
| Investments | | | 202,980,905 | | |
| Foreign currency translations | | | 1,718,168 | | |
| Net Assets | | $ | 744,408,312 | | |
| Fund Shares Outstanding | | | 26,152,339 | | |
Net asset value, offering price and redemption
price per share | | $ | 28.46 | | |
Statement of Operations
For the Six Months Ended June 30, 2010 (Unaudited)
| Investment Income: | |
| Dividends (net foreign taxes withheld of $1,370,473) | | $ | 16,381,292 | | |
| Dividends from affiliates | | | 439,403 | | |
| Securities lending income | | | 95,571 | | |
| Interest income | | | 31,882 | | |
| Total Investment Income | | | 16,948,148 | | |
| Expenses: | |
| Investment advisory fee | | | 5,442,446 | | |
| Administration fee | | | 324,753 | | |
| Transfer agent fee | | | 244 | | |
| Trustees' fees | | | 41,940 | | |
| Custody fee | | | 612,578 | | |
| Chief compliance officer expenses (See Note 4) | | | 19,568 | | |
| Other expenses (See Note 6) | | | 291,778 | | |
| Total Expenses | | | 6,733,307 | | |
| Advisory fee waiver | | | (63,024 | ) | |
| Custody earnings credit | | | (43 | ) | |
| Net Expenses | | | 6,670,240 | | |
| Net Investment Income | | | 10,277,908 | | |
Net Realized and Unrealized Gain (Loss) on
Investments and Foreign Currency and Forward
Foreign Currency Exchange Contracts: | |
| Net realized gain (loss) on: | |
| Unaffiliated investments | | | 121,950,910 | | |
| Affiliated investments | | | (3,212,313 | ) | |
Foreign currency transactions and forward
foreign currency exchange contracts | | | 8,540,641 | | |
| Net realized gain | | | 127,279,238 | | |
Net change in unrealized appreciation
(depreciation) on: | |
| Unaffiliated investments | | | (185,082,080 | ) | |
| Affiliated investments (See Note 4) | | | 2,887,056 | | |
Foreign currency translations and forward
foreign currency exchange contracts | | | 849,221 | | |
| Foreign capital gains tax | | | 1,943,744 | | |
Net change in unrealized
appreciation (depreciation) | | | (179,402,059 | ) | |
| Net Loss | | | (52,122,821 | ) | |
| Net Decrease in Net Assets from Operations | | $ | (41,844,913 | ) | |
See accompanying notes to financial statements.
16
Wanger International 2010 Semiannual Report
Statement of Changes in Net Assets
| Increase (Decrease) in Net Assets | | (Unaudited)
Six Months
Ended
June 30,
2010 | | Year Ended
December 31,
2009 | |
| Operations: | |
| Net investment income | | $ | 10,277,908 | | | $ | 14,183,367 | | |
| Net realized gain (loss) on: | |
| Unaffiliated investments | | | 121,950,910 | | | | (70,795,081 | ) | |
| Affiliated investments (See Note 4) | | | (3,212,313 | ) | | | — | | |
| Foreign currency transactions and forward foreign currency exchange contracts | | | 8,540,641 | | | | 797,283 | | |
| Foreign capital gains tax | | | — | | | | (298,151 | ) | |
| Net change in unrealized appreciation (depreciation) on: | |
| Unaffiliated investments | | | (185,082,080 | ) | | | 531,420,177 | | |
| Affiliated investments (See Note 4) | | | 2,887,056 | | | | (644,429 | ) | |
| Foreign currency translations and forward foreign currency exchange contracts | | | 849,221 | | | | 1,880,189 | | |
| Foreign capital gains tax | | | 1,943,744 | | | | (1,943,744 | ) | |
| Net Increase (Decrease) in Net Assets from Operations | | | (41,844,913 | ) | | | 474,599,611 | | |
| Distributions to Shareholders: | |
| From net investment income | | | (8,462,241 | ) | | | (43,225,419 | ) | |
| Share Transactions: | |
| Subscriptions | | | 23,889,243 | | | | 158,196,950 | | |
| Distributions reinvested | | | 8,462,241 | | | | 43,225,419 | | |
| Redemptions | | | (680,064,192 | ) | | | (163,728,038 | ) | |
| Net Increase (Decrease) from Fund Share Transactions | | | (647,712,708 | ) | | | 37,694,331 | | |
| Increase from regulatory settlements | | | — | | | | 500,054 | | |
| Total Increase (Decrease) in Net Assets | | | (698,019,862 | ) | | | 469,568,577 | | |
| Net Assets: | |
| Beginning of period | | | 1,442,428,174 | | | | 972,859,597 | | |
| End of period | | $ | 744,408,312 | | | $ | 1,442,428,174 | | |
| Overdistributed net investment income at end of period | | $ | (4,387,387 | ) | | $ | (6,203,054 | ) | |
See accompanying notes to financial statements.
17
Wanger International 2010 Semiannual Report
Financial Highlights
| | | (Unaudited)
Six Months Ended
June 30, | | Year Ended December 31, | |
| Selected data for a share outstanding throughout each period | | 2010 | | 2009 | | 2008 | | 2007 | | 2006 | | 2005 | |
| Net Asset Value, Beginning of Period | | $ | 29.68 | | | $ | 20.69 | | | $ | 44.04 | | | $ | 41.77 | | | $ | 30.63 | | | $ | 25.46 | | |
| Income from Investment Operations: | |
| Net investment income (a) | | | 0.24 | | | | 0.30 | | | | 0.52 | | | | 0.37 | | | | 0.29 | | | | 0.25 | | |
Net realized and unrealized gain (loss) on investments,
foreign currency and foreign capital gains tax | | | (1.14 | ) | | | 9.61 | | | | (18.37 | ) | | | 5.80 | | | | 11.04 | | | | 5.20 | | |
| Total from Investment Operations | | | (0.90 | ) | | | 9.91 | | | | (17.85 | ) | | | 6.17 | | | | 11.33 | | | | 5.45 | | |
| Less Distributions to Shareholders: | |
| From net investment income | | | (0.32 | ) | | | (0.93 | ) | | | (0.34 | ) | | | (0.39 | ) | | | (0.19 | ) | | | (0.28 | ) | |
| From net realized gains | | | — | | | | — | | | | (5.16 | ) | | | (3.51 | ) | | | — | | | | — | | |
| Total Distributions to Shareholders | | | (0.32 | ) | | | (0.93 | ) | | | (5.50 | ) | | | (3.90 | ) | | | (0.19 | ) | | | (0.28 | ) | |
| Increase from Regulatory Settlements | | | — | | | | 0.01 | | | | — | | | | — | | | | — | | | | — | | |
| Net Asset Value, End of Period | | $ | 28.46 | | | $ | 29.68 | | | $ | 20.69 | | | $ | 44.04 | | | $ | 41.77 | | | $ | 30.63 | | |
| Total Return (b) | | | (2.99 | )%(c)(d) | | | 49.78 | % | | | (45.60 | )% | | | 16.31 | % | | | 37.16 | % | | | 21.53 | %(d) | |
| Ratios to Average Net Assets/Supplemental Data: | |
| Net expenses before interest expense (e) | | | 1.03 | %(f) | | | 1.05 | % | | | 1.02 | % | | | 0.99 | % | | | 1.01 | % | | | 1.13 | % | |
| Interest expense | | | — | | | | — | | | | — | | | | — | | | | 0.00 | %(g) | | | — | | |
| Net expenses (e) | | | 1.03 | %(f) | | | 1.05 | % | | | 1.02 | % | | | 0.99 | % | | | 1.01 | % | | | 1.13 | % | |
| Net investment income (e) | | | 1.59 | %(f) | | | 1.23 | % | | | 1.67 | % | | | 0.87 | % | | | 0.81 | % | | | 0.92 | % | |
| Waiver/Reimbursement | | | 0.01 | %(f) | | | — | | | | — | | | | — | | | | — | | | | 0.02 | % | |
| Portfolio turnover rate | | | 15 | %(c) | | | 37 | % | | | 36 | % | | | 35 | % | | | 41 | % | | | 24 | % | |
| Net assets, end of period (000s) | | $ | 744,408 | | | $ | 1,442,428 | | | $ | 972,860 | | | $ | 1,693,374 | | | $ | 1,480,123 | | | $ | 973,257 | | |
(a) Net investment income per share was based upon the average shares outstanding during the period.
(b) Total return at net asset value assuming all distributions reinvested.
(c) Not annualized.
(d) Had the investment advisor not waived a portion of expenses, total return would have been reduced.
(e) The benefits derived from custody fees paid indirectly had an impact of less than 0.01%.
(f) Annualized
(g) Rounds to less than 0.01%.
See accompanying notes to financial statements.
18
Wanger International 2010 Semiannual Report
Notes to Financial Statements (Unaudited)
1. Nature of Operations
Wanger International (the "Fund"), is a series of Wanger Advisors Trust (the "Trust"), an open-end management investment company organized as a Massachusetts business trust. The investment objective of the Fund is to seek long-term capital appreciation. The Fund is available only for allocation to certain life insurance company separate accounts established for the purpose of funding qualified and non-qualified variable annuity contracts and variable life insurance policies and may also be offered directly to certain types of pension plans and retirement arrangements.
2. Significant Accounting Policies
The preparation of financial statements in accordance with accounting principles generally accepted in the United States of America ("GAAP") requires management to make certain estimates and assumptions that affect the reported amounts of assets and liabilities, the disclosure of contingent assets and liabilities at the date of the financial statements and the reported amounts of revenue and expenses during the reporting period. Actual results could differ from those estimates.
Security valuation
Securities of the Fund are valued at market value or, if a market quotation for a security is not readily available or is deemed not to be reliable because of events or circumstances that have occurred between the market quotation and the time as of which the security is to be valued, the security is valued at its fair value determined in good faith under consistently applied procedures established by the Board of Trustees. A security traded on a securities exchange or in an over-the-counter market in which transaction prices are reported is valued at the last sales price at the time of valuation. A security traded principally on NASDAQ is valued at the NASDAQ official closing price. Mutual Funds and Exchange Traded Funds are valued at their closing net asset value as reported to NASDAQ. A security for which there is no reported sale on the valuation date is valued at the latest bid quotation. Short-term investments maturing in 60 days or less are valued at amortized cost, which approximates market value. A security for which a market quotation is not readily available and any other assets are valued at its fair value determined in good faith under consistently applied procedures established by the Board of Trustees. The Trust has retained an independent statistical fair value pricing service that employs a systematic methodology to assist in the fair valuation process for securities principally traded in a foreign market in order to adjust for possible changes in value that may occur between the close of the foreign market and the time as of which the securities are to be valued. If a security is valued at a "fair value", that value may be different from the last quoted market price for the security.
Various inputs are used in determining the value of the Fund's investments, following the input prioritization hierarchy established by GAAP. These inputs are summarized in the three broad levels listed below:
• Level 1—quoted prices in active markets for identical securities
• Level 2—prices determined using other significant observable inputs (including quoted prices for similar securities, interest rates, prepayment speeds, credit risk and others)
• Level 3—prices determined using significant unobservable inputs where quoted prices or observable inputs are available or less reliable (including management's own assumptions about the factors market participants would use in pricing an investment)
The inputs or methodologies used for valuing securities are not necessarily an indication of the risk associated with investing in those securities.
Examples of the types of securities in which the Fund would typically invest and how they are classified within this hierarchy are as follows. Typical level 1 securities include exchange traded domestic equities, mutual funds whose NAVs are published each day and exchange traded foreign equities that are not statistically fair valued. Typical level 2 securities include exchange traded foreign equities that are statistically fair valued, forward foreign currency-exchange contracts and short-term investments valued at amortized cost. Additionally, securities fair valued by the Fund's Valuation Committee that rely on significant observable inputs are also included in level 2. Typical level 3 securities include any security fair valued by the Fund's Valuation Committee that relies on significant unobservable inputs.
On January 21, 2010, the Financial Accounting Standards Board issued an Accounting Standards Update, Fair Value Measurements and Disclosures (Topic 820): Improving Disclosures about Fair Value Measurements, (the "Update"), which provides guidance on how investment assets and liabilities are to be valued and disclosed. Specifically, the Update requires reporting entities to disclose the input and valuation techniques used to measure fair value for both recurring and nonrecurring fair value measurements for Level 2 and Level 3 positions. The Update also requires that transfers between all levels (including Level 1 and Level 2) be disclosed on a gross basis (i.e., transfers out must be disclosed separately from transfers in), and requires disclosure of the reason(s) for the transfer. Additionally, purchases, sales, issuances and settlements must be disclosed on a gross basis in the Level 3 rollforward. The effective date of the Update is for interim and annual periods beginning after December 15, 2009; except for the requirement to provide the Level 3 activity for purchases, sales, issuances and settlements on a gross basis, which will be effective for interim and annual periods beginning after December 15, 2010. The Fund adopted the Update effective March 31, 2010.
Repurchase agreements
The Fund may engage in repurchase agreement transactions. The Fund, through its custodian, receives delivery of underlying securities collateralizing each repurchase agreement. The counterparty is required to maintain collateral that is at all times at least equal to the repurchase price including interest. In the event of default or bankruptcy by the other party to the agreement, realization and/or retention of the collateral may be subject to legal proceedings.
Foreign currency translations
Values of investments denominated in foreign currencies are converted into U.S. dollars using the New York spot market rate of exchange at the time of valuation. Purchases and sales of investments and dividend and interest income are translated into U.S. dollars using the spot market rate of exchange prevailing on the respective dates of such transactions. The gain or loss resulting from changes in foreign exchange rates is included with net realized and unrealized gain or loss from investments, as appropriate.
Forward foreign currency exchange contracts
The Fund may enter into forward foreign currency exchange contracts in order to seek to minimize the risk from adverse changes in the relationship between the U.S. dollar and foreign currencies. A forward foreign currency exchange contract is a commitment to purchase or sell a foreign currency at a future date at a negotiated forward rate. Forward foreign currency exchange contracts are valued at the interpolated forward exchange rate of the underlying currencies and any market gain or loss, arising from the difference between the original value and the current value of such contract, is included as a component of unrealized gain/(loss) on the Statement of Operations. Open forward foreign currency exchange contracts, if any, are disclosed in the Notes to the Statement of Investments. As forward foreign currency exchange contracts are closed the resulting gain or loss, arising from the difference between the original value of the contract and the closing value of such contract, is included as a component of realized gain/(loss) on the Statement of Operations.
19
Wanger International 2010 Semiannual Report
Notes to Financial Statements, continued (Unaudited)
A forward foreign currency exchange contract would limit the risk of loss due to a decline in the value of a particular currency; however, it also would limit any potential gain that might result should the value of the currency increase instead of decrease. These contracts may involve market risk in excess of the unrealized gain or loss reflected on the Statement of Assets and Liabilities. In addition, a Fund could be exposed to risks if counterparties to the contracts are unable to meet the terms of their contracts. The counterparty risk exposure is, therefore, closely monitored and contracts are only executed with high credit quality financial institutions.
A Fund may use forward contracts to buy or sell a foreign currency when the Advisor believes it has exposure to a foreign currency which may suffer or enjoy a movement against another foreign currency to which the Fund has exposure. A Fund will not attempt to hedge all of its foreign portfolio positions.
For additional information on derivative instruments, please see Note 5.
Securities lending
The Fund may lend securities up to one-third of the value of its total assets to certain approved brokers, dealers and other financial institutions to earn additional income. The Fund retains the benefits of owning the securities, including receipt of dividends or interest generated by the security. The Fund also receives a fee for the loan. The Fund has the ability to recall the loans at any time and could do so in order to vote proxies or to sell the loaned securities. Each loan is collateralized by cash that exceeded the value of the securities on loan. The market value of the loaned securities is determined daily at the close of business of the Fund and any additional required collateral is delivered to each Fund on the next business day. The Fund has elected to invest the cash collateral in the Dreyfus Government Cash Management Fund and the income earned is paid to the Fund, net of any fees remitted to Goldman Sachs Agency Lending as the lending agent and borrower rebates. The Fund's advisor, Columbia Wanger Asset Management, LLC ("CWAM"), does not retain any fees earned by the lending program. Generally, in the event of borrower default, the Fund has the right to use the collateral to offset any losses incurred. In the event the Fund is delayed or prevented from exercising its right to dispose of the collateral, there may be a potential loss to the Fund. Some of these losses may be indemnified by the lending agent. The Fund bears the risk of loss with respect to the investment of collateral.
The net lending income earned in 2010 by the Fund is included in the Statement of Operations.
Security transactions and investment income
Security transactions are accounted for on the trade date (date the order to buy or sell is executed) and dividend income is recorded on the ex-dividend date, except that certain dividends from foreign securities are recorded as soon as the information is available to the Fund. Interest income is recorded on the accrual basis and includes amortization of discounts on debt obligations when required for federal income tax purposes. Realized gains and losses from security transactions are recorded on an identified cost basis.
Awards, if any, from class action litigation related to securities owned may be recorded as a reduction of cost of those securities. If the applicable securities are no longer owned, the proceeds are recorded as realized gains.
Restricted securities
Restricted securities are securities that may only be resold upon registration under federal securities laws or in transactions exempt from registration. In some cases, the issuer of restricted securities has agreed to register such securities for resale at the issuer's expense either upon demand by the Fund or in connection with another registered offering of the securities. Many restricted securities may be resold in the secondary market in transactions exempt from registration. Such restricted securities may be determined to be liquid under criteria established by the Board of Trustees.
Fund share valuation
Fund shares are sold and redeemed on a continuing basis at net asset value. Net asset value per share is determined daily as of the close of trading on the New York Stock Exchange ("the Exchange") on each day the Exchange is open for trading by dividing the total value of the Fund's investments and other assets, less liabilities, by the number of Fund shares outstanding.
Custody fees/Credits
Custody fees are reduced based on the Fund's cash balances maintained with the custodian. The amount is disclosed as a reduction of total expenses in the Statement of Operations.
Federal income taxes
The Fund has complied with the provisions of the Internal Revenue Code available to regulated investment companies and, in the manner provided therein, distributes all its taxable income, as well as any net realized gain on sales of investments and foreign currency transactions reportable for federal income tax purposes. Accordingly, the Fund paid no federal income taxes and no federal income tax provision was required.
Expenses
General expenses of the Trust are allocated to the Fund and the other series of the Trust based upon relative net assets or other expense allocation methodologies determined by the nature of the expense. Expenses directly attributable to the Fund are charged to the Fund.
Foreign capital gains taxes
Gains in certain countries may be subject to foreign taxes at the fund level, at rates ranging from 10%-15%. The Fund accrues for such foreign taxes on net realized and unrealized gains at the appropriate rate for each jurisdiction.
Distributions to shareholders
Distributions to shareholders are recorded on the ex-dividend date.
Indemnification
In the normal course of business, the Trust on behalf of the Fund enters into contracts that contain a variety of representations and warranties and that provide general indemnities. The Fund's maximum exposure under these arrangements is unknown, as this would involve future claims against the Fund. Also under the Trust's organizational documents, the trustees and officers of the Trust are indemnified against certain liabilities that may arise out of their duties to the Trust. However based on experience, the Fund expects the risk of loss due to these warranties and indemnities to be minimal.
3. Federal Tax Information
The tax character of distributions paid during the year ended December 31, 2009 was as follows:
| | | December 31, 2009 | |
| Ordinary Income* | | $ | 43,225,419 | | |
* For tax purposes short-term capital gains distributions, if any, are considered ordinary income distributions.
The following capital loss carryforwards, determined as of December 31, 2009, may be available to reduce taxable income arising from future net realized gains on investments, if any, to the extent permitted by the Internal Revenue Code:
Year of
Expiration | | Capital Loss
Carryforwards | |
| 2016 | | $ | 28,082,656 | | |
| 2017 | | | 134,084,079 | | |
| Total | | $ | 162,166,735 | | |
20
Wanger International 2010 Semiannual Report
Notes to Financial Statements, continued (Unaudited)
Management is required to determine whether a tax position of the Fund is more likely than not to be sustained upon examination by the applicable taxing authority, including resolution of any related appeals or litigation processes, based on the technical merits of the position. The tax benefit to be recognized by the Fund is measured as the largest amount of benefit that is greater than fifty percent likely of being realized upon ultimate settlement. Management is not aware of any tax positions for which it is reasonably possible that the total amounts of unrecognized tax benefits will significantly change in the next twelve months. However, management's conclusions may be subject to review and adjustment at a later date based on factors including, but not limited to, new tax laws, regulations, and administrative interpretations (including relevant court decisions). The Funds' federal tax returns for the prior three fiscal year s remain subject to examination by the Internal Revenue Service.
4. Transactions With Affiliates
CWAM is a wholly owned subsidiary of Columbia Management Investment Advisers, LLC ("Columbia Management"), which in turn is an indirect, wholly owned subsidiary of Ameriprise Financial, Inc. ("Ameriprise Financial"). CWAM furnishes continuing investment supervision to the Fund and is responsible for the overall management of the Fund's business affairs.
After the close of business on April 30, 2010, (the "Closing"), Ameriprise Financial acquired from Bank of America Corporation ("BOA"), a portion of the asset management business of Columbia Management Group, LLC, including 100% of CWAM. On May 27, 2010, the shareholders of the Fund approved a new investment advisory agreement with CWAM to provide advisory services to the Fund. There were no changes to the Fund's advisory fee rate under the new agreement.
CWAM receives a monthly advisory fee based on the Fund's average daily net assets at the following annual rates:
| Average Daily Net Assets | | Annual Fee Rate | |
| Up to $100 million | | | 1.10 | % | |
| $100 million to $250 million | | | 0.95 | % | |
| $250 million to $500 million | | | 0.90 | % | |
| $500 million to $1 billion | | | 0.80 | % | |
| $1 billion and over | | | 0.72 | % | |
For the six months ended June 30, 2010, the Fund's annualized effective investment advisory fee rate, net of fee waivers, was 0.83% of average daily net assets. CWAM has contractually agreed to reimburse the Fund to the extent that investment advisory fees exceed an annual percentage of 0.83% of average daily net assets on an annualized basis, through April 30, 2012. The reimbursement for the six months ended June 30, 2010, was $63,024.
CWAM provides administrative services and receives an administration fee from the Fund at the following annual rates.
Wanger Advisors Trust Aggregate
| Average Daily Net Assets of the Trust | | Annual Fee Rate | |
| Up to $4 million | | | 0.05 | % | |
| $4 billion to $6 billion | | | 0.04 | % | |
| $6 billion to $8 billion | | | 0.03 | % | |
| $8 billion and over | | | 0.02 | % | |
For the six months ended June 30, 2010, the Fund's annualized effective administration fee rate was 0.05% of average daily net assets. Prior to the Closing, CWAM had delegated to Columbia Management Advisors, LLC ("CMA") an indirect, wholly owned subsidiary of BOA, responsibility to provide certain sub-administrative services to the Fund. Following the Closing, Riversource Investments, LLC, a wholly owned subsidiary of Ameriprise Financial, acquired the assets of CMA and subsequently changed its name to Columbia Management, and thereafter began providing certain sub-administrative services to the Fund.
Prior to the Closing, Columbia Management Distributors, Inc., a wholly owned subsidiary of BOA, served as the Fund's distributor and principal underwriter. In connection with the Closing, RiverSource Fund Distributors, Inc., a wholly owned subsidiary of Ameriprise Financial, became the distributor of the Fund and subsequently changed its name to Columbia Management Investment Distributors, Inc. ("CMDI"). There were no changes to the underwriting discount structure of the Fund or the service or distribution fee rates paid by the Fund as a result of the Closing.
Prior to the Closing, Columbia Management Services, Inc., an indirect, wholly owned subsidiary of BOA, provided shareholder services to the Fund and contracted with Boston Financial Data Services ("BFDS") to serve as sub-transfer agent. In connection with the Closing, RiverSource Service Corporation, a wholly owned subsidiary of Ameriprise Financial, became the transfer agent of the Fund and subsequently changed its name to Columbia Management Investment Services Corp. ("CMIS"). The transfer agent fee rates paid by the Fund did not change as a result of the change in transfer agent. For its services, the Fund pays CMIS a monthly fee at the annual rate of $21.00 per open account. CMIS also receives reimbursement for certain out-of-pocket expenses and sub-transfer agency expenses. The arrangement with BFDS has been continued by CMIS.
Certain officers and trustees of the Trust are also officers of CWAM. The Trust makes no direct payments to its officers and trustees who are affiliated with CWAM.
The Board of Trustees has appointed a Chief Compliance Officer of the Trust in accordance with federal securities regulations. The Fund, along with other affiliated funds, pays its pro-rata share of the expenses associated with the Office of the Chief Compliance Officer. These expenses are disclosed separately as "Chief compliance officer expenses" in the Statement of Operations.
The Trust offers a deferred compensation plan for its independent trustees. Under that plan, a trustee may elect to defer all or a portion of his or her compensation. Amounts deferred are retained by the Trust and may represent an unfunded obligation of the Trust. The value of amounts deferred is determined by reference to the change in value of Class Z shares of one or more series of Columbia Acorn Trust or a money market fund as specified by the trustee. Benefits under the deferred compensation plan are payable when the trustee ceases to be a member of the Board of Trustees.
An affiliated person of the Fund may include any company in which the Fund owns five percent or more of its outstanding voting shares. On June 30, 2010, the Fund held five percent or more of the outstanding voting securities of one or more companies. Details of investments in those affiliated companies are presented in the Notes to the Statement of Investments on page 12.
During the six months ended June 30, 2010, the Fund engaged in purchase and sales transactions with funds that have a common investment advisor (or affiliated investment advisors), common directors/trustees, and/or common officers. Those purchase and sale transactions complied with provisions of Rule 17a-7 under the Investment Company Act of 1940 and were $0 and $476,630,680, respectively.
During May and June 2010, a significant number of shares of the Fund, representing the interests of owners of contracts issued by insurance companies affiliated with Ameriprise Financial, were redeemed. In an effort to minimize the impact on the remaining shareholders, Ameriprise Financial agreed to reimburse the Fund $335,670 in certain transaction costs that were incurred as a result of the redemption.
5. Objectives and Strategies for Investing in Derivative Instruments
The Fund uses derivatives instruments including forward forward currency exchange contracts in order to meet its investment objectives. The Fund employs strategies in differing combinations to permit it to increase, decrease or change the level of exposure to market risk factors. The achievement of any strategy involving derivatives depends on analysis of various risk factors, and
21
Wanger International 2010 Semiannual Report
Notes to Financial Statements, continued (Unaudited)
if the strategies for the use of derivatives do not work as intended, the Fund may not achieve its investment objectives.
In pursuit of its investment objectives, the Fund is exposed to the following market risks:
Foreign Exchange Rate Risk: Foreign exchange rate risk relates to the change in the U.S. dollar value of a security held that is denominated in a foreign currency. The U.S. dollar value of a foreign-currency-denominated security will decrease as the dollar appreciates against the currency, while the U.S. dollar value will increase as the dollar depreciates against the currency.
The following notes provide more detailed information about the derivative type held by the Fund:
Forward Foreign Currency Exchange Contracts
• The Fund entered into forward foreign currency exchange contracts to shift its investment exposure from one currency to another.
• The Fund used forward foreign currency exchange contracts to shift its U.S. dollar exposure in order to achieve a representative weighted mix of major currencies relative to its benchmark and/or to recover an underweight country exposure in its portfolio relative to its benchmark.
Forward foreign currency exchange contracts are agreements to exchange one currency for another at a future date at a specified price. These contracts are used to minimize the exposure to foreign exchange rate fluctuations during the period between the trade and settlement dates of the contract. The Fund may utilize forward foreign currency exchange contracts in connection with the settlement of purchases and sales of securities. The Fund may also enter into these contracts to reduce the exposure to adverse price movements in certain other foreign-currency-denominated assets. Contracts to buy are used to acquire exposure to foreign currencies, while contracts to sell are used to reduce the exposure to foreign exchange rate fluctuations. Forward foreign currency exchange contracts are valued daily at the current exchange rate of the underlying currency, resulting in unrealized gains (losses) which become realized at the time the forward foreign currency exchange contracts are closed or mature. Realized and unrealized gains (losses) arising from such transactions are included in net realized and unrealized gains (losses) on foreign currency transactions. The use of forward foreign currency exchange contracts does not eliminate fluctuations in the prices of the Fund's portfolio securities. While the maximum potential loss from such contracts is the aggregate face value in U.S. dollars at the time the contract was opened, exposure is typically limited to the change in value of the contract (in U.S. dollars) over the period it remains open. The Fund could also be exposed to risk that counterparties of the contracts may be unable to fulfill the terms of the contracts.
During the six months ended June 30, 2010, the Fund entered into 68 forward foreign currency exchange contracts.
The following table is a summary of the value of the Fund's derivative instruments as of June 30, 2010.
Fair Value of Derivative Instruments
| Asset | | Liability | |
Statement of Assets
and Liabilities | | Fair
Value | | Statement of Assets
and Liabilities | | Fair
Value | |
Unrealized appreciation
on forward foreign
currency exchange
contracts | | $ | 3,597,987 | | | Unrealized appreciation
on forward foreign
currency exchange
contracts | | $ | (1,885,366 | ) | |
The effect of derivative instruments on the Fund's Statement of Operations for the six months ended June 30, 2010 was as follows:
Amount of Realized Gain or (Loss) and Change in Unrealized Appreciation or
(Depreciation) on Derivatives Recognized in Income
| | | Risk
Exposure | | Realized
Gain (Loss) | | Change in
Unrealized
Appreciation
(Depreciation) | |
Forward Foreign Currency
Exchange Contracts | | Foreign
Exchange
Rate Risk | |
$10,021,712
| |
$(872,365)
| |
6. Borrowing Arrangements
The Trust participates in a $150 million credit facility, along with another Trust managed by CWAM, which was entered into to facilitate portfolio liquidity. Under the facility, interest is charged to each participating fund based on its borrowings at a rate per annum equal to the higher of Federal Funds Rate or Overnight LIBOR plus 1.25%. In addition, a commitment fee of 0.15% per annum of the unutilized line of credit is accrued and apportioned among the participating funds based on their relative net assets. The commitment fee is included in "Other expenses" in the Statement of Operations. No amounts were borrowed by the Fund under this facility during the six months ended June 30, 2010. The Trust enters into this line of credit for one year durations. The Trust has secured the line of credit for the entire year of 2010.
7. Fund Share Transactions
Proceeds and payments on Fund shares as shown in the Statement of Changes in Net Assets are in respect of the following numbers of shares:
| | | Six months ended
June 30, 2010 | | Year ended
December 31, 2009 | |
| Shares sold | | | 791,801 | | | | 6,481,672 | | |
Shares issued in reinvestment
of dividend distributions | | | 303,415 | | | | 2,019,809 | | |
| Less shares redeemed | | | (23,539,070 | ) | | | (6,922,363 | ) | |
| Net increase in shares outstanding | | | 22,443,854 | | | | 1,579,118 | | |
8. Investment Transactions
The aggregate cost of purchases and proceeds from sales other than short-term obligations for the six months ended June 30, 2010 were $178,403,134 and $791,609,099, respectively.
9. Information Regarding Pending and Settled Legal Proceedings
In June 2004, an action captioned John E. Gallus et al. v. American Express Financial Corp. and American Express Financial Advisors Inc. was filed in the United States District Court for the District of Arizona. The plaintiffs allege that they are investors in several American Express Company (now known as RiverSource) mutual funds and they purport to bring the action derivatively on behalf of those funds under the Investment Company Act of 1940. The plaintiffs allege that fees allegedly paid to the defendants by the funds for investment advisory and administrative services are excessive. The plaintiffs seek remedies including restitution and rescission of investment advisory and distribution agreements. The plaintiffs voluntarily agreed to transfer this case to the United States District Court for the District of Minnesota (the District Court). In response to defendants' motion to dismiss the complaint, the District Court dismissed one of plaintiffs' four claims and granted plaintiffs limited discovery. Defendants moved for summary judgment in April 2007. Summary judgment was granted in the defendants' favor on July 9, 2007. The plaintiffs filed a notice of appeal with the Eighth Circuit Court of Appeals (the Eighth Circuit) on August 8, 2007. On April 8, 2009, the Eighth Circuit reversed summary judgment and remanded to the District Court for further proceedings.
22
Wanger International 2010 Semiannual Report
Notes to Financial Statements, continued (Unaudited)
On August 6, 2009, defendants filed a writ of certiorari with the U.S. Supreme Court (the Supreme Court), asking the Supreme Court to stay the District Court proceedings while the Supreme Court considers and rules in a case captioned Jones v. Harris Associates, which involves issues of law similar to those presented in the Gallus case. On March 30, 2010, the Supreme Court issued its ruling in Jones v. Harris Associates, and on April 5, 2010, the Supreme Court vacated the Eighth Circuit's decision in the Gallus case and remanded the case to the Eighth Circuit for further consideration in light of the Supreme Court's decision in Jones v. Harris Associates. On June 4, 2010, the Eighth Circuit remanded the Gallus case to the District Court for further consideration in light of the Supreme Court's decision in Jones v. Harris Associates.
In December 2005, without admitting or denying the allegations, American Express Financial Corporation (AEFC, which is now known as Ameriprise Financial, Inc. (Ameriprise Financial)), entered into settlement agreements with the Securities and Exchange Commission (SEC) and Minnesota Department of Commerce (MDOC) related to market timing activities. As a result, AEFC was censured and ordered to cease and desist from committing or causing any violations of certain provisions of the Investment Advisers Act of 1940, the Investment Company Act of 1940, and various Minnesota laws. AEFC agreed to pay disgorgement of $10 million and civil money penalties of $7 million. AEFC also agreed to retain an independent distribution consultant to assist in developing a plan for distribution of all disgorgement and civil penalties ordered by the SEC in accordance with various undertakings detailed at http://www.sec.gov/litigation/admin/ia-2451.pdf. Ameriprise Financial and its affiliates have cooperated with the SEC and the MDOC in these legal proceedings, and have made regular reports to the Columbia Management Funds' Boards of Directors/Trustees.
Ameriprise Financial and certain of its affiliates have historically been involved in a number of legal, arbitration and regulatory proceedings, including routine litigation, class actions, and governmental actions, concerning matters arising in connection with the conduct of their business activities. Ameriprise Financial believes that the Funds are not currently the subject of, and that neither Ameriprise Financial nor any of its affiliates are the subject of, any pending legal, arbitration or regulatory proceedings that are likely to have a material adverse effect on the Funds or the ability of Ameriprise Financial or its affiliates to perform under their contracts with the Funds. Ameriprise Financial is required to make 10-Q, 10-K and, as necessary, 8-K filings with the Securities and Exchange Commission on legal and regulatory matters that relate to Ameriprise Financial and its affiliates. Copies of these filings may be obt ained by accessing the SEC website at www.sec.gov.
There can be no assurance that these matters, or the adverse publicity associated with them, will not result in increased fund redemptions, reduced sale of fund shares or other adverse consequences to the Funds. Further, although we believe proceedings are not likely to have a material adverse effect on the Funds or the ability of Ameriprise Financial or its affiliates to perform under their contracts with the Funds, these proceedings are subject to uncertainties and, as such, we are unable to estimate the possible loss or range of loss that may result. An adverse outcome in one or more of these proceedings could result in adverse judgments, settlements, fines, penalties or other relief that could have a material adverse effect on the consolidated financial condition or results of operations of Ameriprise Financial.
******
CWAM, Columbia Acorn Trust (another mutual fund family advised by CWAM), and the trustees of Columbia Acorn Trust (collectively, the "Columbia defendants") were named as defendants in class and derivative complaints that were consolidated in a Multi-District Action (the MDL Action) in the federal district court of Maryland. These lawsuits contend that defendants permitted certain investors to market time their trades in certain Columbia Acorn Funds. The MDL Action is ongoing. However, all claims against the Trust and the Independent Trustees of the Trust have been dismissed.
Columbia Acorn Trust and CWAM are also defendants in a state court class action lawsuit that alleges, in summary, that the Trust and CWAM exposed shareholders of Columbia Acorn International to trading by market timers by allegedly: (a) failing to properly evaluate daily whether a significant event affecting the value of the Fund's securities had occurred after foreign markets had closed but before the calculation of the Fund's net asset value (NAV); (b) failing to implement the Fund's portfolio valuation and share pricing policies and procedures; and (c) failing to know and implement applicable rules and regulations concerning the calculation of NAV (the Fair Valuation Lawsuit). The United States Court of Appeals for the Seventh Circuit ruled that the plaintiffs' state law claims were preempted under federal law, resulting in the dismissal of plaintiffs' complaint. Plaintiffs appealed the Seventh Circuit's ruling to the United States Supreme Court. The Supreme Court reversed the Seventh Circuit's ruling on jurisdictional grounds and the case was remanded to the state court.
On March 21, 2005, a class action complaint was filed against the Trust and CWAM seeking to rescind the CDSC assessed upon redemption of Class B shares of the Columbia Acorn Funds (the CDSC Lawsuit). In addition to the rescission of sales charges, plaintiffs seek recovery of actual damages, attorneys' fees and costs. The case was transferred to the MDL Action in the federal district court of Maryland.
On September 14, 2007, the plaintiffs and the Columbia defendants named in the MDL Action, including the Columbia family of funds, entered into a stipulation of settlement with respect to all Columbia-related claims in the MDL Action described above, including the CDSC and Fair Valuation Lawsuits.
On April 23, 2010, the parties of the MDL Action filed a motion seeking: (a) preliminary approval of the MDL settlements; (b) the conditional certification of the plaintiff class for purposes of settlement; (c) approval of the form and manner of giving notice to the plaintiff class of the proposed settlements; and (d) approval of the proposed schedule for various deadlines in connection with the final settlement hearing. The motion was presented to and approved by the court on May 7, 2010. The final hearing on the fairness of the settlements is scheduled for October 21, 2010.
CWAM believes that the lawsuits are not likely to materially affect its ability to provide investment management services to the Funds.
23
Wanger International 2010 Semiannual Report
[Excerpt from:]
Wanger Advisors Trust
Management Fee Evaluation of the Senior Officer
Prepared Pursuant to the New York Attorney General's
Assurance of Discontinuance
December 2009
24
Wanger International 2010 Semiannual Report
Introduction
The New York Attorney General's Assurance of Discontinuance ("Order") entered into by Columbia Management Advisors, LLC ("CMAI") and Columbia Management Distributors, Inc., ("CMDI") in February 2005, allows CMAI to manage or advise a mutual fund only if the trustees of the fund appoint a "Senior Officer" to perform specified duties and responsibilities. One of these responsibilities includes "managing the process by which proposed management fees (including but not limited to, advisory fees) to be charged the [funds] are negotiated so that they are negotiated in a manner which is at arms' length and reasonable and consistent with this Assurance of Discontinuance."
The Columbia Acorn Trust and Wanger Advisors Trust (collectively, the "Trusts") and each series thereof (the "Acorn Funds," "WAT Funds" or collectively, the "Funds") are overseen by the same Board of Trustees ("Board"). The Order provides that this Board must determine the reasonableness of proposed "management fees" by using either an annual competitive bidding process supervised by the Senior Officer or Independent Fee Consultant, or by obtaining "an annual independent written evaluation prepared by or under the direction of the Senior Officer or the Independent Fee Consultant."
"Management fees" are only part of the costs and expenses paid by mutual fund shareholders. Fund expenses can vary depending upon the class of shares held but usually include: (1) investment management or advisory fees to compensate analysts and portfolio managers for stock research and portfolio management, as well as the cost of operating a trading desk; (2) administrative expenses incurred to prepare registration statements and tax returns, calculate the funds' net asset values, maintain effective compliance procedures and perform recordkeeping services; (3) transfer agency costs for establishing accounts, accepting and disbursing funds, as well as overseeing trading in fund shares; (4) custodial expenses incurred to hold the securities purchased by the funds; and (5) distribution expenses, including commissions paid to brokers that sell the fund shares to investors.
Columbia Wanger Asset Management, L.P. ("CWAM"), is the adviser to the Funds, and at present is a part of Columbia Management Group ("Columbia"), an umbrella organization that also includes CMAI, Columbia Management Services, Inc. ("CMSI") and CMDI. Columbia is owned by Bank of America Corporation ("Bank of America").
The Proposed Change of Ownership
On September 29, 2009, Bank of America entered into a Purchase Agreement ("APA") with Ameriprise Financial, Inc. ("Ameriprise") providing for, among other things, the sale of CWAM to Ameriprise and the acquisition by Ameriprise of certain assets of Columbia. The Columbia assets to be acquired by Ameriprise include the functions currently performed by CMAI, CMSI and CMDI. Because some of Columbia's operations are supported by Bank of America staff and facilities outside of Columbia, Ameriprise and Bank of America entered into a Transition Services Agreement ("TSA") that, among other things, provides for the continuation of those services for a period of time. The parties contemplate a closing date of the APA in Spring 2010, and closing is conditioned upon the approval by the Board of a new advisory agreement between the Trusts and CWAM, as well as agreements with the entities that will succeed CMSI, CMDI and CMAI. These entities& #151;RiverSource Fund Services, Inc. ("RFS"), RiverSource Fund Distributors, Inc. ("RFD") and RiverSource Investments, LLC—are wholly owned subsidiaries of Ameriprise and currently support the RiverSource family of mutual funds. Therefore, if the sale is consummated as contemplated by the various agreements, CWAM's ownership will change from Bank of America to Ameriprise, as will the Funds' primary service providers.1
Columbia and Ameriprise have proposed that the Trusts continue, in substance, the existing advisory agreement governing portfolio management, and the administration services agreement governing certain administration and clerical services. They propose no material changes to these agreements, no change in services and no changes in fee levels, only those changes necessary to effect the change of ownership. The fees paid under these two agreements are referred to as "management fees." Other fund expenses will be governed by separate agreements, in particular agreements with two Ameriprise affiliates: RFD, the broker-dealer that will underwrite and distribute the Funds' shares, and RFS the Funds' proposed transfer agent.
While the proposed agreements themselves suggest no substantive changes in the services provided to the Funds, Ameriprise and Columbia have informed the Board that they intend to embark on a process of integrating the operations of the two organizations with respect to administration and other services. Among the objectives of that integration are the reduction of costs, and increased economies of scale. Further, CWAM will be subject to new management oversight by Ameriprise which, among other things, will establish the compensation structure for CWAM's portfolio managers and analysts.
Requirements of the Order
The Order applies to any successor to substantially all the assets of CMDI and CMAI. Under the Order, a fee evaluation must precede the execution of new advisory and administration services agreements; there is no express exception from this requirement for agreements that are intended solely to transfer ownership of the existing service providers. I have been advised by Columbia that it believes the Order requires the preparation of this fee evaluation.
In conformity with the terms of the Order and past evaluations, this evaluation addresses only the advisory and administration contracts, and does not extend to any proposed new underwriting and transfer agency agreements.
1 The Funds' custodian is State Street Bank and Trust Company. No change in custodian is required by the APA nor is such a change contemplated at this time.
25
Wanger International 2010 Semiannual Report
According to the Order, the Senior Officer's evaluation must consider at least the following:
(1) Management fees (including components thereof) charged to institutional and other clients of CWAM for like services;
(2) Management fees (including any components thereof) charged by other mutual fund companies for like services;
(3) Costs to CWAM and its affiliates of supplying services pursuant to the management fee agreements, excluding any intra-corporate profit;
(4) Profit margins of CWAM and its affiliates from supplying such services;
(5) Possible economies of scale as the Funds grow larger; and
(6) The nature and quality of CWAM's services, including the performance of each Fund.
In 2004, the Boards of the two Trusts, then separate groups, each appointed me Senior Officer under the Order. They also determined not to pursue a competitive bidding process and instead, charged me with the responsibility of evaluating the Funds' proposed advisory and administration fee contracts with CWAM in conformity with the requirements of the Order. In discharging their responsibilities, the independent Trustees have also consulted independent, outside counsel. The Board has asked that I prepare this evaluation.
2009 Evaluation
In May 2009, I submitted to the Board the fourth annual evaluation prepared under the Order. That evaluation, based on performance and fee data as of December 31, 2008, was considered by the Board in renewing the advisory and administration services agreements that were effective on July 31, 2009. That evaluation followed the same structure as the earlier studies. Some areas were given more emphasis, while others were given less. Still, the fundamental information gathered for that evaluation was largely the same as past years. That evaluation is referred to here as the "2009 Study."
Process and Independence
The objectives of the Order are to ensure the independent evaluation of the management fees paid by the Funds as well as to insure that all relevant factors are considered. In my view, this contract process has been conducted at arms-length and with independence in gathering, considering and evaluating all relevant data. At the outset of the process, the Trustees sought and obtained from Ameriprise and Columbia a comprehensive compilation of data regarding Fund performance and expenses, adviser profitability, and other information. The Trustees, acting through their Performance Committee and the Ad Hoc Committee, evaluated this information thoroughly, and met often to discuss it. Performance and expense data was obtained from both Morningstar and Lipper, the leading consultants in this area. The rankings prepared by Morningstar and Lipper were independent and prepared in conformity with the methodologies employed by those organi zations. Counsel for the Funds and the Independent Trustees considered, as did I, the terms and conditions of the existing contracts, and evaluated them in light of the proposed transaction.
In the course of its work, the Trustees also gave careful consideration to the conclusions and recommendations contained in the 2009 Study.
My evaluation of the advisory contracts was shaped, as it has been in the past, by my experience as Chief Compliance Officer of the Trusts ("CCO"). As CCO, I report solely to the Board and have no reporting obligation to, or employment relationship with, Columbia or its affiliates. I have commented on compliance matters in evaluating the quality of service provided by CWAM.
This Report, its supporting materials and the data contained in other materials submitted to the Ad Hoc and Performance Committees of the Board, in my view, provide a thorough factual basis upon which the Board, in consultation with independent counsel as it deems appropriate, may conduct management fee negotiations that are in the best interests of the Funds' shareholders.
The Fee Reductions Mandated under the Order
Under the terms of the Order, Columbia agreed to secure certain management fee reductions for the mutual funds advised by its affiliate investment advisers. In some instances, breakpoints were also established. Although neither CWAM nor the Trusts was a party to the Order, CWAM offered and the Board accepted certain advisory fee reductions during 2005. By the terms of the Order, these fees may not be increased before November 30, 2009, and under the Investment Company Act, may not be increased before March 2012 or later (other than for bona fide additional investment advisory services), if the closing date of the transaction is later than March 2010. I have used these advisory fee levels, as modified thereafter, in this evaluation because they are the fees in the current agreements that CWAM and Ameriprise propose should be continued. Hence, these fee levels are the starting point of an evaluation.
Conclusions
My review of the data and other material above leads to the following conclusions with respect to the factors identified in the Order.
A. Fund Performance
The Domestic Funds: The Acorn Fund has achieved good performance over the past five years, and achieved those results with less risk than its peers. Acorn Select and Wanger Select have enjoyed strong investment returns in the past year, resulting in improved rankings that place those funds near or in the top third of their peers over the trailing five year period. These results are achieved, however, with greater relative risk than the other domestic Funds. Acorn USA and its parallel, Wanger USA have not been as strong as the other Funds relative to their peers over this period, turning in a largely average performance, though both Funds have outperformed their benchmarks. Thermostat is unique and therefore difficult to assess, but now enjoys a
26
Wanger International 2010 Semiannual Report
Morningstar rank above its peer median. The overall trend for performance of the domestic Funds is positive, and further, all domestic Funds enjoy positive alpha, confirming that their portfolio managers add value to performance.
The International Funds: The international Funds experienced a challenging 12 month period relative to their peers, but their five year rankings remain at or above the median. These Funds have enjoyed periods of strong out-performance during that five year stretch. Further, they have outperformed their benchmarks during the past five years, and done so while exposing shareholders to less risk than competitors. Finally, all the international Funds enjoy positive alpha, again confirming the value of their portfolio managers.
B. Management Fees Relative to Peers
There is significant variance in management fee rankings across the Funds. Acorn International is the only fund that was ranked in the top quartile by both Morningstar and Lipper. The other Acorn funds tend to fall around the medians identified by one or the other service. The WAT funds are uniformly more expensive than their peers.
C. Management Fees Relative to Institutional Account and Other Mutual Fund Accounts
CWAM's focus is on its mutual funds. The few institutional accounts it does manage vary in rate structures. Some pay advisory fees commensurate with or higher than the Acorn and WAT funds. In a few instances, however, institutional accounts pay lower advisory fees than do the Acorn funds. One such institutional account is significant in size and has been under CWAM's management for over 31 years. Further, CWAM performs sub-advisory services for two mutual funds managed by RiverSource, a fund family operated by Ameriprise, at rates that are lower than those paid by the parallel Acorn funds, though sub-advisory services can differ from those necessary for the full support of a mutual fund.
D. Administrative Services
The Acorn and WAT funds' administrative fees are generally less competitive than are the fees charged by competitors, but these rankings suffer from a lack of uniformity in the scope of services encompassed by the fee. CWAM and CMAI provide excellent administrative support for all the Funds.
E. Costs and Benefits to CWAM and its Affiliates
CWAM's direct costs do not appear excessive. Overhead and indirect costs allocated to CWAM by its parent organizations, however, are significant and have varied considerably over the years. CWAM's affiliates report operating losses and therefore do not appear to enjoy excessive "fall out" benefits from CWAM's advisory agreement with the Funds. CWAM continues to enjoy substantial benefits from the use of "soft dollar" payments for research.
F. Profitability
CWAM's profit margins have declined in recent periods, as have the margins of many fund companies, but it still maintains margins that appear to be in the upper range of its competitors.
G. Economies of Scale
Economies of scale do exist at CWAM, and the Board has instituted breakpoints that reflect that reality. In the past two years, however, asset levels have generally declined, and sustained asset growth will be required to trigger additional fee reductions under the current schedule. Asset declines have not, however, resulted in significant fee increases.
H. Nature and Quality of Service
This category includes a variety of considerations that are difficult to quantify, yet can have a significant bearing on the performance of the Acorn and WAT funds. Several areas merit comment.
1. Capacity. CWAM has maintained its investment management capacity even in a difficult environment.
2. Compliance. CWAM has a reasonably designed compliance program that protects shareholders.
I. Process
In my opinion, the process of negotiating an advisory contract for the Funds has been conducted thoroughly and at arms' length. The Ad Hoc Committee has taken the steps necessary to assess the proposed change of ownership and recommended appropriate measures to protect Fund shareholders. It has also taken steps to encourage an agreement on an appropriate incentive plan for CWAM that will facilitate the continuity of management, motivate CWAM professionals and that will align their efforts with the interests of Fund shareholders. The Trustees have sufficient information to evaluate management's proposal, and negotiate contract terms that are in the best interests of fund shareholders.
****
27
Wanger International 2010 Semiannual Report
Recommendations
I believe the Trustees should:
1. Continue to monitor closely the performance of Acorn USA and Wanger USA, to assess the impact of the portfolio changes implemented by the portfolio manager.
2. Focus their review on the WAT funds' management fee levels in relation to their peers, in particular the fees paid by Wanger Select, which are, in the views of both Morningstar and Lipper, significantly higher than their peers.
3. Take appropriate steps to insure that any integration of the two organizations does not adversely impact Fund shareholders, and continue their efforts to facilitate an agreement on an appropriate incentive plan for CWAM personnel that will both motivate them and align their interests with Fund shareholders.
4. Consider the fees paid by (sub-advisory fees) and to (revenue sharing payments) the proposed new parent organization, Ameriprise or its mutual funds, to identify and address all conflicts of interest.
Robert P. Scales
December 2009
28
Wanger International 2010 Semiannual Report
[Excerpt from:]
Wanger Advisors Trust
Supplement to the Management Fee Evaluation of the Senior Officer
Prepared Pursuant to the New York Attorney General's
Assurance of Discontinuance
April 2010
29
Wanger International 2010 Semiannual Report
Introduction
In December 2009, I prepared a fee evaluation required under the New York Attorney General's Assurance of Discontinuance ("Order") entered into by Columbia Management Advisors, LLC ("CMAI") and Columbia Management Distributors, Inc., ("CMDI") in February 2005. That Order allows CMAI to manage or advise a mutual fund only if the trustees of the fund appoint a "Senior Officer" to perform specified duties and responsibilities. One of these responsibilities includes "managing the process by which proposed management fees (including but not limited to, advisory fees) to be charged the [funds] are negotiated so that they are negotiated in a manner which is at arms' length and reasonable and consistent with this Assurance of Discontinuance."
The Columbia Acorn Trust and Wanger Advisors Trust (collectively, the "Trusts") and each series thereof (the "Acorn Funds," "WAT Funds" or collectively, the "Funds") are overseen by the same Board of Trustees ("Board"). The Order provides that this Board must determine the reasonableness of proposed "management fees" by using either an annual competitive bidding process supervised by the Senior Officer or Independent Fee Consultant, or by obtaining "an annual independent written evaluation prepared by or under the direction of the Senior Officer or the Independent Fee Consultant."
Columbia Wanger Asset Management, L.P. ("CWAM"), is the adviser to the Funds, and at present is a part of Columbia Management Group ("Columbia"), an umbrella organization that also includes CMAI, Columbia Management Services, Inc. ("CMSI") and CMDI. Columbia is owned by Bank of America Corporation ("Bank of America").
On September 29, 2009, Bank of America entered into a Purchase Agreement ("APA") with Ameriprise Financial, Inc. ("Ameriprise") providing for, among other things, the sale of CWAM to Ameriprise and the acquisition by Ameriprise of certain assets of Columbia. The parties contemplate a closing date of the APA in Spring 2010, and closing is conditioned upon the approval by the Board of a new advisory agreement between the Trusts and CWAM, as well as agreements with the entities that will succeed CMSI, CMDI and CMAI. These entities—RiverSource Fund Services, Inc. ("RFS"), RiverSource Fund Distributors, Inc. ("RFD") and RiverSource Investments, LLC—are wholly owned subsidiaries of Ameriprise and currently support the RiverSource family of mutual funds. Therefore, if the sale is consummated as contemplated by the various agreements, CWAM's ownership will change from Bank of America to Ameriprise, as will the Funds' primary s ervice providers.
Ameriprise, through various separate accounts ("Accounts") established by certain of its insurance company affiliates, is currently an investor in the WAT Funds on behalf of contract holders in variable insurance policies and variable annuity contracts (together, the "Contracts") that Ameriprise or its affiliates have marketed to their clients. In the WAT structure, the insurance companies purchase shares in the WAT Funds on behalf of the Accounts, which fund the Contracts. The insurance company enters into a participation agreement with Wanger Advisors Trust to purchase shares on behalf of its Accounts. The Accounts are the actual investors in the Wanger Funds, not the individual contract holders. Through this structure, Ameriprise controlled Accounts hold approximately $2 billion or two-thirds of the WAT Funds' total assets; approximately nine other insurance companies also participate in the WAT Funds and hold the remaining a ssets in those Funds. Ameriprise also maintains a small account with CWAM that is a sub-account for a RiverSource mutual fund. This sub-account is not subject to oversight by the WAT or Acorn Board.
Columbia and Ameriprise have proposed that the Trusts continue, in substance, the existing advisory agreement governing portfolio management, and the administration services agreement governing certain administration and clerical services. They propose no change in services and no changes in fee levels, only those changes necessary to effect the change of ownership. The fees paid under these two agreements are referred to as "management fees."
Reasons for this Supplement
This Supplement is prompted by notice given by Ameriprise, after completion of the fee evaluation in December, that following the closing of the transaction, it anticipates a redemption of approximately $1 billion of its clients' investments in two of the WAT Funds (Wanger USA and Wanger International), and re-investment of most of the proceeds in one or more RiverSource mutual funds; CWAM will sub-advise these funds in two new sub-accounts at CWAM and effect investment strategies substantially identical to those pursued by the WAT Funds from which those funds were redeemed. One of the sub-accounts will parallel WAT International/Acorn International, and the other Wanger USA/Acorn USA. Ameriprise has advised the Board of the sub-advisory fees to be paid to CWAM and such sub-advisory fees will be lower than the advisory fee paid to CWAM by the parallel WAT Fund. Sub-advised accounts of this kind are generally considered instituti onal accounts and sub-advisory services are priced differently (and usually lower) than the advisory fees for mutual funds that are not sub-advised.
The Order and the Investment Company Act require fund trustees to consider, among other things, the proposed management fees (including components thereof) charged to institutional and other clients of the adviser for like services. As the Fee Evaluation notes, CWAM historically has maintained very few institutional accounts with relatively few assets under management. The new Ameriprise accounts are, therefore, a departure from past practice at CWAM.
Ameriprise's intentions pose the following issues with respect to assessing the reasonableness of the management fee proposed by Ameriprise for the WAT and Acorn Funds:
1. How do the Funds' fees compare to the fees paid by the parallel institutional accounts?
2. What impact might the redemption have on the fees paid by the shareholders who remain in the WAT Funds after the Ameriprise action?
3. Would expanded assets in the institutional accounts strain CWAM's limited capacity to manage the Acorn and WAT Funds?
This Supplement is intended solely to address these points as additional information for consideration by the Trustees in assessing the reasonableness of the management fees proposed by Ameriprise.
****
30
Wanger International 2010 Semiannual Report
Conclusions
The conclusions and recommendations in the December 2009 Fee Evaluation remain valid today. Consideration of the Ameriprise redemption proposal leads to the following additional conclusions and recommendations.
A. Reasonableness of the Advisory Fees and Related Considerations
CWAM will soon manage assets in a sub-advised account at fee levels that reflect a substantial discount to the parallel mutual fund. Ameriprise has set forth the differences in services that support its claim that this divergence in fees is justified. These justifications should be revisited by the Trustees. In addition, the redemption will result in higher fees for remaining participants in the WAT Funds, and will result in brokerage and other expenses for Fund participants. These costs should also be a part of the Trustees' calculus in assessing fees. Lastly, the prospect of increased assets for CWAM management raises potential future issues of investment capacity.
B. Process
In my opinion, the process of negotiating an advisory contract for the Funds has been conducted thoroughly and at arms' length. The Board's Contract Committee and its Ad Hoc Committee engaged in a careful assessment of the repercussions of the Ameriprise redemption proposal, assessed as best as possible its potential costs, and revisited the breakpoint schedules of the WAT and Acorn Funds to determine whether WAT Fund participants are treated equitably in relation to Acorn Fund shareholders. It also gave consideration to the fee differential between institutional and mutual fund accounts. The Trustees met on a number occasions with me and with counsel, and gave close attention to a variety of materials including data submitted by Ameriprise and the legal analysis of counsel. The Trustees have sufficient information to evaluate management's proposals, and negotiate contract terms that are in the best interests of fund shareholder s. Lastly, the Trustees considered the recommendations set forth below and the Contract Committee adopted them as appropriate measures to protect shareholders.
Recommendations
In light of the developments discussed in this Supplement, I recommend that the Trustees:
1. Consider imposing an expense cap on Wanger International and Wanger USA that will insulate those participants who remain after the Ameriprise redemption from the impact of increased advisory fees.
2. Consider including in the advisory or related contracts with Ameriprise a provision requiring Ameriprise to reimburse the direct costs of its redemption, insulating remaining Fund participants from the commission and other expenses that will be required to effect the redemption.
3. Consider seeking an agreement on the part of Ameriprise to seek Board approval of new institutional and sub-advised accounts that will result in increased assets under management at CWAM, thereby protecting existing investors from dilution of CWAM's limited investment management capacity.
Robert P. Scales
April 2010
31
Wanger International 2010 Semiannual Report
Board Approval of the Proposed Advisory Agreement
The Board of Trustees unanimously approved the proposed Investment Advisory Agreement with Columbia Wanger Asset Management, LLC ("Columbia WAM") (the "Proposed Advisory Agreement") for each Fund of the Trust at meetings held on February 24, 2010 and April 6, 2010.
The Ad Hoc Committee on the Sale of Columbia Management Group of the Board and the Contract Committee of the Board (together, the "Committees"), which are comprised solely of Trustees who have no direct or indirect interest in the Proposed Advisory Agreement and who are not "interested persons" (as defined in the Investment Company Act of 1940, as amended (the "1940 Act")), of the Trust (the "Independent Trustees"), and all Trustees received and reviewed a substantial amount of information provided by Columbia WAM and Ameriprise Financial, Inc. ("Ameriprise") in response to requests from the Independent Trustees and their independent legal counsel. Throughout the process, the Trustees had numerous opportunities to ask questions of and request additional materials from Columbia WAM and Ameriprise.
During each meeting at which the Committees or the Independent Trustees considered the Proposed Advisory Agreement, they met in executive session with their independent legal counsel. The Committees also met separately with representatives of Ameriprise, Columbia Management Group, LLC ("CMG") and Columbia WAM management on several different occasions. In all, one or other of the Committees convened formally on 22 separate occasions to consider the sale of a portion of the asset management business of CMG, including 100% of Columbia WAM, by Bank of America Corporation ("Bank of America") to Ameriprise (the "Transaction"), and convened informally on many other occasions. The Board and/or some or all of the Independent Trustees met on at least 6 other occasions to receive the Committees' status reports on the Transaction, receive presentations from Ameriprise and Columbia WAM representatives, and to discuss outstanding issues. In a ddition, the Independent Trustees' counsel and the Trust's Chief Compliance Officer conducted on-site due diligence sessions at Ameriprise. As they considered the Proposed Advisory Agreement, the Independent Trustees were advised by independent legal counsel.
The Trustees reviewed the Proposed Advisory Agreement, as well as certain information obtained through Ameriprise's responses to initial and supplemental questionnaires prepared at the request of the Trustees by counsel to the Funds and independent legal counsel to the Independent Trustees. In addition, the Trustees reviewed the Management Fee Evaluation dated December 2009 and the Supplement thereto dated April 2010 (the "Fee Evaluation") prepared by, the Trust's chief compliance officer, senior vice president and general counsel, who also serves as the Trust's "Senior Officer," as contemplated by the Assurance of Discontinuance dated February 9, 2005 among affiliates of Columbia WAM and the Office of the New York Attorney General. Finally, the Trustees considered certain additional contractual protections they had obtained from Ameriprise in the event of a material compliance violation or harm caused to shareholders during the conversion of certain operational services as a result of the Transaction.
The materials reviewed by the Committees and the Trustees included, among other items, (i) information on the investment performance of each Fund and of independently selected peer groups of funds and of the Fund's performance benchmarks over various time periods, (ii) information on each Fund's advisory fees and other expenses, including information comparing the Fund's fees and expenses to those of peer groups of funds and information about any applicable expense limitations and fee breakpoints, (iii) data on sales and redemptions of Fund shares, and (iv) information on the profitability to Columbia WAM and Ameriprise, as well as potential "fall-out" or ancillary benefits that Columbia WAM and its affiliates may receive as a result of their relationships with the Funds. The Trustees also considered other information such as (i) Columbia WAM's financial condition, (ii) each Fund's investment objective and strategy, (iii) the si ze, education and experience of Columbia WAM's investment staff and its use of technology, external research and trading cost measurement tools, (iv) information on Ameriprise's approach to retention and compensation of portfolio managers and the terms of the new incentive compensation plan for Columbia WAM investment personnel, (v) the allocation of the Funds' brokerage, and the use of "soft" commission dollars to pay for research products and services, (vi) the resources devoted to, and the record of compliance with, the Funds' investment policies and restrictions, policies on personal securities transactions and other compliance policies, and (vii) Ameriprise's management structure, financial condition and its intentions for managing the Funds and the respective service providers.
In considering whether to approve the Proposed Advisory Agreement, the Trustees reviewed and analyzed various factors that they determined were relevant, none of which by itself was considered dispositive. However, the material factors and conclusions that formed the basis for the Trustees' determination to approve the Proposed Advisory Agreement are discussed separately below.
Nature, quality and extent of services. The Trustees reviewed the expected nature, quality and extent of the services to be provided by Columbia WAM and its affiliates to the Funds under the Proposed Advisory Agreement, taking into account the investment objective and strategy of each Fund. In addition, the Trustees reviewed the available resources and key personnel of Columbia WAM and Ameriprise, especially those providing investment management services to the Funds. The Trustees also considered other services to be provided to the Funds by Columbia WAM, including: managing the execution of portfolio transactions and selecting broker-dealers for those transactions; monitoring adherence to the Funds' investment restrictions; producing shareholder reports; providing support services for the Board and committees of the Board; communicating with sharehol ders; serving as the Funds' administrator; and overseeing the activities of the Funds' other service providers, including monitoring for compliance with various policies and procedures as well as applicable securities laws and regulations. The Trustees reviewed each of these factors in light of the expected change of control of Columbia WAM and the likelihood of possible changes as a result of the Transaction.
In addition, in connection with the Transaction, the Board considered:
• the reputation, financial strength, regulatory histories and resources of Ameriprise and its affiliates;
• the terms of the Proposed Advisory Agreement, including the difference between the Current and Proposed Advisory Agreements, as set forth in this Proxy Statement, including that Columbia WAM had agreed to a higher standard of care for non-investment services in the Proposed Advisory Agreement;
• the terms and conditions of other agreements and arrangements relating to the future operations of the Funds, including the Underwriting Agreement and the Transition Services Agreement, both between Ameriprise and Bank of America; the Administration Services Agreement, between Columbia WAM and the Funds; the Shareholders' Servicing and Transfer Agent Agreement, between RiverSource Services Corporation and the Funds; the Underwriting Agreement between RiverSource Fund Distributors, Inc. and the Funds; and the Transition, Integration and Conversion Principles Agreement and the Compliance Agreement, both between Ameriprise and the Funds;
• that the Trustees recently had completed a full annual review of the Current Advisory Agreement for each Fund under the 1940 Act, and had determined that they were satisfied with the nature, extent and quality of services provided thereunder and that they had determined that the management fees were reasonable in relation to the services rendered; and
• that Ameriprise and Bank of America, and not the Funds, would bear all costs of obtaining approvals of the Proposed Advisory Agreement, including legal and Trustee fees and costs resulting from the Transaction.
32
Wanger International 2010 Semiannual Report
Board Approval of the Proposed Advisory Agreement
The Trustees concluded that the expected nature, quality and extent of the services to be provided by Columbia WAM to each Fund under the Proposed Advisory Agreement were appropriate for the Funds. They also concluded that Columbia WAM currently had sufficient personnel, with appropriate education and experience, to serve the Funds effectively, and that the firm had demonstrated its continuing ability to attract and retain well-qualified personnel. The Trustees also believed that Columbia WAM investment personnel would continue to be compensated pursuant to a plan that was designed to align their interests with those of Fund shareholders. The Trustees also considered that Columbia WAM had maintained its investment management capacity and resources throughout a difficult economic environment. In addition, they took note of the quality of Columbia WAM's compliance record. The Trustees also took into consideration that Ameriprise h ad offered its assurances that the services provided to the Funds following the Transaction would be consistent with or better than the manner and level at which such services were currently being performed for the Funds and that there would be no diminution of services to the Funds or their shareholders as a result of the Transaction. In this regard, the Trustees considered that certain current senior executives of CMG who are currently responsible for oversight of certain services provided to the Funds would continue to oversee those services after the closing of the Transaction. The Trustees also believed that the higher standard of care in the Proposed Advisory Agreement would benefit shareholders. The Trustees further recognized that the investment personnel of Columbia WAM would, effective upon a change of control of Columbia WAM to Ameriprise, be subject to employment agreements and other terms of employment created for the purpose of retaining skilled investment personnel. Assuming such personnel rem ain in place following the change in control, the Trustees concluded that the Transaction would not result in a diminution of investment services provided to the Funds.
Performance of the Funds. The Trustees received and considered detailed performance information at various meetings of the Board and of the Investment Performance Analysis Committee of the Board throughout the year in addition to performance information considered in connection with the Transaction. They reviewed information comparing each Fund's performance with that of its benchmark(s) and with the performance of comparable funds and peer groups as identified by Lipper Inc. ("Lipper") and Morningstar, Inc. ("Morningstar"). The Trustees evaluated the performance of the Funds over various time periods. However, they gave somewhat more consideration to the rolling three-year performance of each Fund.
More particularly, with respect to the domestic Funds, the Trustees noted that Wanger Select equaled its Morningstar peer group median while underperforming its Lipper peer group median and its benchmark for the three-year period ended September 30, 2009. Wanger USA underperformed its peer group medians but outperformed its benchmark over the three-year period. For the five-year period ended September 30, 2009, Wanger Select outperformed its peer group medians and primary benchmark and Wanger USA underperformed its peer group medians but outperformed its benchmark.
With respect to the international Funds, the Trustees considered that Wanger International and Wanger International Select both outperformed their peer group medians and benchmarks for the three year and five-year periods ended September 30, 2009.
The Trustees concluded that, although past performance is not necessarily indicative of future results, the strong overall longer-term performance record of the Funds was an important factor in the evaluation of the expected quality of services to be provided by Columbia WAM under the Proposed Advisory Agreement for each Fund and also supported approval.
Costs of Services and Profits Realized by Columbia WAM. The Trustees noted that Ameriprise and Columbia WAM were not proposing any changes in investment advisory or administration fees or total operating expenses in connection with the Transaction. At various Committee and Board meetings and other informal meetings, the Trustees examined detailed information on the fees and expenses of each Fund in comparison to information for comparable funds provided by Lipper and Morningstar. The Trustees reviewed the observations in the Fee Evaluation relating to the lack of uniformity in the Funds' rankings, and noted that the Funds are assessed by Morningstar and Lipper in relation to peers selected only from the variable annuity universe. As noted in the Fee Evaluation, the actual advisory fees paid by Wanger Select and Wanger International Select were higher than the median advisory fees of each Fund's respective Morningstar and Lipper peer groups and the actual advisory fee paid by the Wanger USA was higher than the median advisory fee of the Fund's Morningstar peer group, but not of its Lipper peer group. The actual advisory fee paid by Wanger International was higher than the median advisory fee of the Fund's Lipper peer group, but not of its Morningstar peer group. Total management fees for one of the four Funds, Wanger International, were lower than its Morningstar peer group median, but none of the Funds had total management fees equal to or lower than its respective Lipper peer group median. The Trustees also considered that the total expenses paid by investors compared to total expenses charged by other peer funds, which they also considered to be a meaningful comparison.
The Trustees reviewed the analysis of the historic profitability of Columbia WAM in serving as each Fund's investment adviser and of Columbia WAM and its affiliates in their relationships with each Fund, as well as an explanation of the methodology utilized in allocating various expenses among the Funds and other business units, each of which was included in the Fee Evaluation. The Trustees considered the current methodology used by Columbia WAM in determining compensation payable to portfolio managers and the competitive market for investment management talent. In addition, the Trustees considered the expected profitability of Columbia WAM related to the Funds following the Transaction; however, they determined that profitability projections at this time were speculative, at best. The Trustees noted that Columbia WAM's profit margins had declined recently, in line with industry trends, as a result of reduced assets under manage ment. Nevertheless, based on limited comparative data, its current margins appeared to be in the upper range of competitors. They discussed how profitability comparisons among fund managers are of limited probative value due to the small number of publicly-owned managers, and that the profitability of any investment manager is affected by numerous factors, including its particular organizational structure, the types of funds and other accounts managed, other lines of business, expense allocation methodology, capital structure and cost of capital.
The Trustees also reviewed the advisory fee rates charged by Columbia WAM for managing other investment companies (including the Columbia Acorn Funds), sub-advised funds and other institutional separate accounts, as detailed in the Fee Evaluation. The Trustees noted that the Columbia Wanger Funds' advisory fees were generally comparable to the Columbia Acorn Funds' advisory fees. Columbia WAM's institutional separate account fees for various investment strategies were also examined; in some cases those fees were higher than the advisory fees charged to the Funds, and in some instances the fees were lower. The Trustees noted that Columbia WAM performs significant additional services for the Funds that it does not provide to sub-advised funds or non-mutual fund clients, including administrative services, oversight of the Funds' other service providers, trustee support, regulatory compliance and numerous other services, and that, i n servicing the Funds, Columbia WAM assumes many legal risks that it does not assume in servicing its non-fund clients.
The Trustees concluded that the rates of advisory fees and other compensation to be payable by the Funds to Columbia WAM and its affiliates were reasonable in relation to the nature and quality of the services to be provided, taking into account the fees charged by other advisers for managing comparable mutual funds with similar strategies and the fees Columbia WAM charges to other clients. The Trustees also concluded that the Funds' estimated overall expense ratios were reasonable, considering the quality of
33
Wanger International 2010 Semiannual Report
Board Approval of the Proposed Advisory Agreement
services provided by Columbia WAM and its affiliates and the investment performance of the Funds.
Economies of Scale. At various Committee and Board meetings and other informal meetings, the Trustees considered information about the extent to which Columbia WAM realizes economies of scale in connection with an increase in Fund assets. The Trustees noted that the advisory fee schedule for each Fund includes breakpoints in the rate of fees at various asset levels. The Trustees concluded that the fee structure of each Fund was reasonable and reflective of a sharing between Columbia WAM and the Funds of economies of scale.
Other Benefits to Columbia WAM. The Trustees also reviewed benefits that could be expected to accrue to Columbia WAM and its affiliates from their relationships with the Funds, as outlined in the Fee Evaluation. They noted that, in connection with the Transaction, the Funds' transfer agency agreement would be assigned to RiverSource Service Corporation (now known as Columbia Management Investment Services Corp.), an affiliate of Ameriprise, which would receive compensation from the Funds for services provided. They considered that an affiliate of Ameriprise, RiverSource Funds Distributors, Inc. (now known as Columbia Management Investment Distributors, Inc.), would serve as the new distributor under an underwriting agreement containing substantially the same terms as the Funds' existing underwriting agreement with an affiliate of Columbia WAM. In addi tion, the sub-administration agreement between Columbia WAM and a current affiliate would be transferred to an Ameriprise affiliate. The Trustees also considered other ways that the Funds and Columbia WAM may potentially benefit from their relationship with each other. For example, the Trustees considered Columbia WAM's use of commissions paid by each Fund on its portfolio brokerage transactions to obtain research products and services benefiting the Fund and/or other clients of Columbia WAM and noted that no material changes were being contemplated by Columbia WAM regarding its policies and procedures in respect of soft dollars as a result of the change in ownership of Columbia WAM. They determined that Columbia WAM's use of the Funds' "soft" commission dollars to obtain research products and services was consistent with current regulatory requirements and guidance. They also concluded that Columbia WAM benefits from the receipt of proprietary research products and services acquired through commissions paid on portfolio transactions of the Funds, and that the Funds benefit from Columbia WAM's receipt of those products and services as well as research products and services acquired through commissions paid by other clients of Columbia WAM.
Section 15(f) of the 1940 Act. The Trustees also considered whether the arrangements between Columbia WAM and the Funds comply with the conditions of Section 15(f) of the 1940 Act. Section 15(f) provides a non-exclusive safe harbor under which an investment adviser to an investment company or any of its affiliated persons may receive any amount or benefit in connection with a change in control of the investment adviser provided two conditions are met. First, for a period of three years after closing of the transaction, at least 75% of the board members of the investment company may not be "interested persons" (as defined in the 1940 Act) of the investment adviser or predecessor adviser. Second, an "unfair burden" must not be imposed upon the investment company as a result of the transaction or any express or implied terms, conditions or understandings applicable thereto. The term "unfair burden" is defined in Section 15(f) to include any arrangement during the two-year period after the closing of the transaction whereby the investment adviser (or predecessor or successor adviser) or any interested person of any such investment adviser, receives or is entitled to receive any compensation, directly or indirectly, from the investment company or its shareholders (other than fees for bona fide additional investment advisory or other services) or from any person in connection with the purchase or sale of securities or other property to, from or on behalf of the investment company (other than bona fide ordinary compensation as principal underwriter for the investment company).
In connection with the first condition of Section 15(f), the Trustees concluded that upon closing of the Transaction at least 75% of the Trustees would not be "interested persons" (as defined in the 1940 Act) of the Adviser and would be in compliance with this provision of Section 15(f). With respect to the second condition of Section 15(f), Columbia WAM and Ameriprise represented in writing that no advisory or distribution fee increases were contemplated during the two years following the Transaction. The Trustees also noted that, to the extent future transactions are contemplated and recommended following the Transaction, Columbia WAM and Ameriprise represented that they would not seek any change that would impose an "unfair burden" on the Trust.
After full consideration of the above factors, as well as other factors that were instructive in evaluating the Proposed Advisory Agreement for each Fund, the Trustees, including the Independent Trustees, concluded on February 24, 2010 that the approval of the Proposed Advisory Agreement was in the best interest of each Fund, and they approved the Agreement and recommended that the shareholders of each Fund approve the Agreement for their Fund.
Following the Board's approval of the Proposed Advisory Agreement for each Fund on February 24, 2010, Ameriprise advised the Board that it anticipated that a significant amount of the existing assets of Wanger International and Wanger USA, representing the interests of owners of contracts issued by life insurance companies affiliated with Ameriprise, would be redeemed in spring 2010 (the "Proposed Redemption"). These assets would be reinvested in two RiverSource Funds (the "New Institutional Accounts") that have similar investment objectives and strategies to Wanger International and Wanger USA. The New Institutional Accounts would be sub-advised by Columbia WAM for investment sub-advisory fees that were proposed to be lower than the advisory fees of their Columbia Wanger Fund counterparts. The Board therefore determined that the proposed redemption and the existence of the New Institutional Accounts to be sub-advised by Columbi a WAM warranted another review of the Proposed Advisory Agreement for each Fund and the fees paid thereunder.
The Committees then met in the aggregate on four occasions in March 2010, including once with representatives of Ameriprise, to review and consider the Proposed Redemption and the New Institutional Accounts and the implications of these transactions with respect to their consideration of the Proposed Advisory Agreement for each Fund. In their deliberations, the Trustees received and reviewed a supplement dated April 2010 ("Supplement") to the Fee Evaluation prepared by the Senior Officer, which contained an analysis of both the Proposed Redemption and the potential impact on the remaining shareholders in the Funds. The Supplement also reviewed the fees related to the New Institutional Accounts. The Trustees were also advised by independent counsel at each of these meetings.
With respect to the Proposed Redemption, the Trustees considered that Ameriprise had agreed to a fee cap on the advisory fees of Wanger International and Wanger USA for a period of two years from the redemption date, such that the remaining shareholders in these Funds would not experience any increase in advisory fees as a result of the Proposed Redemption. The Trustees further considered that Ameriprise had also agreed with the Trust to minimize the potential for adverse effects to Wanger International and Wanger USA from any economic harm caused by the redemption proposal by reimbursing for transaction costs related to the Proposed Redemption including brokerage commissions and transfer fees (but not market impact costs).
With respect to the New Institutional Accounts, the Trustees considered information submitted by Ameriprise regarding the sub-advisory fees payable to Columbia WAM for investment advisory services rendered to the accounts. The Trustees also considered that the sub-advisory fees payable were substantially the same as an existing RiverSource Fund account sub-advised by Columbia WAM. The Trustees considered the explanations previously
34
Wanger International 2010 Semiannual Report
Board Approval of the Proposed Advisory Agreement
provided by Columbia WAM for the differences in advisory fees paid by the Funds and Columbia WAM's other similar institutional accounts. The Trustees also considered Ameriprise's and Columbia WAM's agreement that they would not agree to, or submit a proposal to, manage new institutional accounts without the express approval of the Board. The Board believed that this provision was necessary in order to protect Columbia WAM's investment capacity and the resulting quality of its investment services with respect to the Funds.
The Trustees also considered the performance of the Funds over various time periods ended December 31, 2009. Wanger USA outperformed its primary benchmark and Morningstar peer group median over the three-year period ended December 31, 2009, but underperformed its Lipper peer group median over that same period. Wanger Select outperformed its Morningstar peer group median over the three-year period, but underperformed its Lipper peer group median and primary benchmark over that same period. Both Wanger International and Wanger International Select outperformed their respective peer groups and primary benchmarks for the three-year period. For the five-year period ended December 31, 2009, each Fund outperformed its primary benchmark.
Taking all of the foregoing factors into account as well as the continued satisfactory performance of the Funds since the last Board meeting and other factors they deemed relevant, the Trustees, including all of the independent Trustees, concluded again on April 6, 2010 that the approval of the Proposed Advisory Agreement was in the best interest of each Fund, and they affirmed the approval of the Agreement and recommended that the shareholders of each Fund approve the Agreement for their Fund.
35
Wanger International 2010 Semiannual Report
Proxy Voting Results
On May 27, 2010, a special meeting of shareholders of Wanger Advisors Trust (the "Trust") was held to ask shareholders of each Fund of the Trust to: (1) consider and vote on a proposed Investment Advisory Agreement for the Fund with CWAM, which became a subsidiary of Ameriprise Financial; and (2) elect eleven trustees to the Trust's Board of Trustees (the "Board"). A proxy statement that described the proposals was mailed to shareholders of record as of April 8, 2010.
Proposal 1: A proposed Investment Advisory Agreement with CWAM was approved for the Fund, as follows:
| Fund | | Votes For | | Votes Against | | Abstentions | | Broker Non-Votes* | |
| Wanger International | | | 44,546,169 | | | | 1,257,735 | | | | 1,866,059 | | | | 1,000 | | |
* Shares held of record by a financial intermediary, such as a broker or nominee, typically held in "street name," as to which (i) written voting instructions on the matter have not been received from the beneficial owners or persons entitled to vote and (ii) the intermediary does not have discretionary voting power on the matter.
Proposal 2: Each of the trustee nominees was elected to the Board, as follows:
| Fund | | Votes For | | Votes Against | | Abstentions | |
| Laura M. Born | | | 93,621,627 | | | | 4,677,959 | | | | 0 | | |
| Michelle L. Collins | | | 93,862,814 | | | | 4,436,772 | | | | 0 | | |
| Maureen M. Culhane | | | 93,620,353 | | | | 4,679,233 | | | | 0 | | |
| Margaret M. Eisen | | | 93,949,255 | | | | 4,350,330 | | | | 0 | | |
| John C. Heaton | | | 93,852,982 | | | | 4,446,603 | | | | 0 | | |
| Steven N. Kaplan | | | 93,803,548 | | | | 4,496,038 | | | | 0 | | |
| David C. Kleinman | | | 93,545,604 | | | | 4,753,982 | | | | 0 | | |
| Charles P. McQuaid** | | | 93,886,104 | | | | 4,413,482 | | | | 0 | | |
| Allan B. Muchin | | | 93,539,358 | | | | 4,760,228 | | | | 0 | | |
| David B. Small | | | 93,966,760 | | | | 4,332,826 | | | | 0 | | |
| James A. Star | | | 93,923,838 | | | | 4,375,748 | | | | 0 | | |
** Mr. McQuaid is an "interested person" of the Trust and of CWAM because he is an officer of the Trust and of CWAM.
36
Wanger International 2010 Semiannual Report

Columbia Wanger Funds
Trustees
James A. Star
Chairman of the Board
Steven N. Kaplan
Vice Chairman of the Board
Laura M. Born
Michelle L. Collins
Maureen M. Culhane
Margaret M. Eisen
John C. Heaton
David C. Kleinman
Charles P. McQuaid
Allan B. Muchin
David B. Small
Ralph Wanger (Trustee Emeritus)
Officers
Charles P. McQuaid
President
Ben Andrews
Vice President
Michael G. Clarke
Assistant Treasurer
P. Zachary Egan
Vice President
John M. Kunka
Assistant Treasurer
Joseph C. LaPalm
Vice President
Bruce H. Lauer
Vice President, Secretary and Treasurer
Louis J. Mendes III
Vice President
Robert A. Mohn
Vice President
Christopher J. Olson
Vice President
Christopher O. Petersen
Assistant Secretary
Scott R. Plummer
Assistant Secretary
Linda K. Roth-Wiszowaty
Assistant Secretary
Robert P. Scales
Chief Compliance Officer, Chief Legal
Officer, Senior Vice President and
General Counsel
Transfer Agent,
Dividend Disbursing Agent*
Columbia Management Investment Services Corp.
P.O.Box 8081
Boston, Massachusetts
02266-8081
Distributor*
Columbia Management Investment Distributors, Inc.
One Financial Center
Boston, Massachusetts
02111-2621
Investment Advisor
Columbia Wanger Asset Management, LLC
227 West Monroe Street, Suite 3000
Chicago, Illinois 60606
1-888-4-WANGER
(1-888-492-6437)
Legal Counsel to the Funds
K&L Gates LLP
Washington, DC
Legal Counsel to the Independent Trustees
Drinker Biddle & Reath LLP
Philadelphia, Pennsylvania
Independent Registered Public
Accounting Firm
PricewaterhouseCoopers LLP
Chicago, Illinois
* As of May 1, 2010
This report, including the schedules of investments and financial statements, is submitted for the general information of the shareholders of the Wanger Advisors Trust.
A description of the Fund's proxy voting policies and procedures and a copy of the Fund's voting record for the most recent 12-month period ended June 30 are available (i) on the Securities and Exchange Commission's website at www.sec.gov, and (ii) without charge, upon request, by calling 888-492-6437.
The Fund files a complete schedule of portfolio holdings with the SEC for the first and third quarters of each fiscal year on Form N-Q. The Fund's Form N-Q is available on the SEC's website at www.sec.gov and may be reviewed and copied at the SEC's Public Reference Room in Washington, D.C. Information on the operation of the Pubic Reference Room may be obtained by calling 800-SEC-0330. The Fund's complete portfolio holdings are disclosed at www.columbiafunds.com approximately 30 days after each month-end.
37
Columbia Wanger Funds
© 2010 Columbia Management Investment Advisers, LLC. All rights reserved.
C-1460 A (8/10) 103611
Wanger International Select
2010 Semiannual Report

Not FDIC insured • No bank guarantee • May lose value

Wanger International Select
2010 Semiannual Report
Table of Contents
| | 1 | | | Understanding Your Expenses | |
|
| | 2 | | | The School that Changed the World | |
|
| | 4 | | | Performance Review | |
|
| | 6 | | | Statement of Investments | |
|
| | 10 | | | Statement of Assets and Liabilities | |
|
| | 10 | | | Statement of Operations | |
|
| | 11 | | | Statement of Changes in Net Assets | |
|
| | 12 | | | Financial Highlights | |
|
| | 13 | | | Notes to Financial Statements | |
|
| | 17 | | | Management Fee Evaluation of the Senior Officer | |
|
| | 25 | | | Board Approval of the Proposed Advisory Agreement | |
|
| | 29 | | | Proxy Voting Results | |
|
Columbia Wanger Asset Management, LLC ("CWAM") is one of the leading global small- and mid-cap equity managers in the United States with 40 years of small- and mid-cap investment experience. As of June 30, 2010, CWAM managed $26.1 billion in assets, and is the investment advisor to Wanger USA, Wanger International, Wanger Select and Wanger International Select (together, the "Columbia Wanger Funds") and the Columbia Acorn Family of Funds.
Important Information Regarding the Acquisition of the Long-term Asset Management Business
of Columbia Management Group, LLC
On April 30, 2010, Ameriprise Financial, Inc., ("Ameriprise Financial"), the parent company of RiverSource Investments, LLC, acquired the long-term asset management business of Columbia Management Group, LLC, including certain of its affiliates, which were, prior to this acquisition, part of Bank of America Corporation. In connection with this acquisition, Ameriprise Financial acquired CWAM. CWAM will continue as the investment advisor for the Columbia Acorn and Wanger Funds, and no changes are anticipated in the existing investment management team. Also in connection with this acquisition, Columbia Management Investment Distributors, Inc., member FINRA, became the distributor and principal underwriter of the Funds and Columbia Management Investment Services Corp. became the transfer agent of the Funds.
Investors should consider the investment objectives, risks, charges and expenses of a mutual fund carefully before investing. For a free prospectus, which contains this and other important information about the Fund, contact your financial advisor or insurance company or contact 1-888-4-WANGER.
An important note: Columbia Wanger Funds are sold only to certain life insurance companies in connection with certain variable annuity contracts, variable life insurance policies and eligible qualified retirement plans.
The views expressed in "The School that Changed the World" and in the Performance Review reflect the current views of the respective authors. These views are not guarantees of future performance and involve certain risks, uncertainties and assumptions that are difficult to predict so actual outcomes and results may differ significantly from the views expressed. These views are subject to change at any time based upon economic, market or other conditions and the respective parties disclaim any responsibility to update such views. These views may not be relied on as investment advice and, because investment decisions for a Columbia Wanger Fund are based on numerous factors, may not be relied on as an indication of trading intent on behalf of any particular Columbia Wanger Fund. References to specific company securities should not be construed as a recommendation or investment advice.
Wanger International Select 2010 Semiannual Report
Understanding Your Expenses
As a Fund shareholder, you incur three types of costs. There are transaction costs, which generally include sales charges on purchases and may include redemption or exchange fees. There are also ongoing costs, which generally include investment advisory fees and other Fund expenses. Lastly, there may be additional fees or charges imposed by the insurance company that sponsors your variable annuity product. The information on this page is intended to help you understand your ongoing costs of investing in the Fund and to compare these costs with the ongoing costs of investing in other mutual funds.
Analyzing your Fund's expenses
To illustrate these ongoing costs, we have provided an example and calculated the expenses paid by investors in the Fund during the period. The information in the following table is based on an initial, hypothetical investment of $1,000, which is invested at the beginning of the period and held for the entire period. Expense information is calculated two ways and each method provides you with different results. The amount listed in the "Actual" column is calculated using actual operating expenses and total return for the Fund. The amount listed in the "Hypothetical" column assumes that the return each year is 5% before expenses and then applies the Fund's actual expense ratio for the period to the hypothetical return. You should not use the hypothetical account values and expenses to estimate either your actual account balance at the end of the period or the expenses you paid during the period. See "Compare with other funds" for details on using the hypothetical data.
Estimating your actual expenses
To estimate the expenses that you actually paid over the period, first you will need your account balance at the end of the period.
1. Divide your ending account balance by $1,000. For example, if an account balance was $8,600 at the end of the period, the result would be 8.6.
2. In the section of the table below titled "Expenses paid during the period," you will find a dollar amount in the column labeled "Actual." Multiply this amount by the result from step 1. Your answer is an estimate of the expenses you paid on your account during the period.
January 1, 2010 – June 30, 2010
| | | Account value at the
beginning of the period ($) | | Account value at the
end of the period ($) | | Expenses paid
during the period ($) | | Fund's annualized
expense ratio (%)* | |
| | | Actual | | Hypothetical | | Actual | | Hypothetical | | Actual | | Hypothetical | | Actual | |
| Wanger International Select | | | 1,000.00 | | | | 1,000.00 | | | | 958.60 | | | | 1,017.75 | | | | 6.90 | | | | 7.10 | | | | 1.42 | | |
*For the six months ended June 30, 2010.
Expenses paid during the period are equal to the Fund's annualized expense ratio, multiplied by the average account value over the period, then multiplied by the number of days in the Fund's most recent fiscal half-year and divided by 365.
It is important to note that the expense amounts shown in the table are meant to highlight only ongoing costs of investing in the Fund. Expenses paid during the period do not include any insurance charges imposed by your insurance company's separate account. The hypothetical example provided is useful in comparing ongoing costs only and will not help you determine the relative total costs of owning different funds whose shareholders may incur transaction costs.
Compare with other funds
Since all mutual funds are required to include the same hypothetical calculations about expenses in shareholder reports, you can use this information to compare the ongoing cost of investing in the Fund with other funds. To do so, compare the 5% hypothetical example with the 5% hypothetical examples of other funds. As you compare hypothetical examples of other funds, it is important to note that hypothetical examples are meant to highlight the ongoing cost of investing in a fund and do not reflect any transaction costs, such as sales charges, redemption fees or exchange fees that may be incurred by shareholders of other funds. Expenses paid during the period do not include any insurance charges imposed by your insurance company's separate accounts.
1
Wanger International Select 2010 Semiannual Report

The School that Changed the World
Chicago is known for a lot of things. Yes, this city's ability to stuff ballot boxes and pizzas is legendary, but the number of Nobel Prize winners who have hailed from the University of Chicago is one of Chicago's greatest distinctions. The University's faculty, students and researchers have been awarded 85 Nobel Prizes across all fields, nearly as many as first-place Cambridge University, which has 87.
The University of Chicago holds nearly a 40% share of the Nobel Prizes awarded in economics to date. The great thinkers who received these awards, and those who influenced them, helped trigger a world-wide shift towards capitalism, resulting in enhanced prosperity and freedom around the globe. These are the men and women of the "Chicago School."
The Chicago School
Between the Great Depression and the 1970s, many in government and academia believed that increasingly centralized economic planning was inevitable. Much of the world was subjected to communism, socialism, or other sorts of command economies. Government in the United States grew rapidly during this period, as did regulation of businesses. During this time, William F. Buckley was not the only one who stood athwart history and yelled, "Stop!"
Starting in the 1950s, references to a "Chicago School" began to appear, referring to the economists, business researchers, lawyers and sociologists from the University of Chicago who disagreed with the "more government" thinking of the time. In the first written reference to the Chicago School, found in a handbook on the history of economic thought, members of the Chicago School were described as follows:
Libertarians all, they preferred rules to authorities and the impersonal forces of the market to their deliberate direction, and they viewed with alarm the increasing scope of governmental activities in the economic sphere.1
Frank Knight and Jacob Viner are considered founders of the Chicago School. Knight set a tone; he was intellectually rigorous, devoted to knowledge, skeptical of authority and cynical of planned economies. Knight believed capitalism was the only acceptable system by default, as other systems were worse. Viner was a terror to his students in the classroom but otherwise very helpful; he elevated neoclassical price theory2 into a core element for economics education at U. of C. Both men personally taught Nobel winners, but became ineligible for Nobel prizes upon their deaths soon after the economics award was first presented in 1969.
In his book titled, The Chicago School,3 Johan Van Overtveldt lists five characteristics that he believes underpin the success of this influential group. First, a strong work ethic. Locally, U. of C. is known as the university "where fun goes to die." But for some people, interesting work appears to be fun.
Next, economics is treated as a true science. Theories are tested and, unless backed by evidence, are disregarded.
Third, academic excellence is the sole criterion for advancement. Although the school is known for free-market advocacy, it attracts and cultivates fiercely independent thinkers with divergent views; some U. of C. professors, in contrast, have attacked elements of the capitalistic system.
Fourth, the Chicago School has a strong debating culture. Economic theories are critiqued by interdisciplinary workshops, often attended by professors of business, law and sociology to name a few. (Many of the University of Chicago's Nobel winners in economics have been associated with its business and law schools.) Work is subject to an intense, critical review process and heated debates are common.
Fifth, the University of Chicago is relatively isolated. Located on the shore of Lake Michigan and otherwise surrounded by tough neighborhoods, U. of C. tends to have many faculty members who live in its enclave, allowing academic discussions to extend well beyond classrooms.
Chicago School Economists and Their Work
Milton Friedman was a student of Knight and Viner and, in 1946, he accepted an offer to teach economics at the University of Chicago (a position opened by Viner's departure). Friedman taught at the University of Chicago for the next 30 years. His research centered on monetary theory and consumption analysis. He documented how a one-third cut in the money supply turned what could have been a normal recession into the Great Depression. Although Friedman was skeptical of government and endorsed steady growth in the money supply, his theories induced policymakers to ease credit during the dot.com bust and the more recent housing bubble. Though tremendous wealth was lost during both events, economic depressions were avoided, likely due to the monetary ease.
Friedman is perhaps best known for his influence on public policy. Like many other Chicago economists, he believed in free markets and minimal government interference in the economy. Unlike others, he popularized those notions.
Friedman believed that competition was morally superior to government control, as consumers and producers are free to choose in a capitalistic system, but are often coerced in other systems.4 He and other Chicago economists went so far as to advocate no regulations of some monopolies, stating that monopolies tend to be temporary and regulators often cause long-lasting inefficiencies and politically inspired anomalies.
Friedman was often criticized for his policy recommendations, and some of the criticisms, in hindsight, now appear laughable. One such article, published in the 1970s, attacked Friedman on the grounds that competition was imperfect and firms like General Motors and IBM had considerable market power and stifled competition. It's now safe to say that Friedman was right, as competition and technological change reduce market power over time. In 1976,
2
Wanger International Select 2010 Semiannual Report
Friedman won the Nobel Prize in Economics "for his achievements in the fields of consumption analysis, monetary history and theory, and for his demonstration of the complexity of stabilization policy."
Economist Theodore Schultz analyzed agricultural policies first at Iowa State, but his work was attacked by Iowa's powerful dairy lobby. He joined the University of Chicago faculty in 1944, continuing his work. He concluded that 30% to 40% of farm productivity gains in the United States were driven by increasing the skills of farmers and investing in "human capital." Chicago School economist D. Gale Johnson was greatly inspired by Schultz's work. He also joined the University of Chicago in 1944 and the two worked together for nearly 50 years. Johnson analyzed Soviet agriculture and correctly predicted that subsidies and price distortions would destabilize the entire Soviet economy. Schultz received a Nobel Prize in Economics in 1979 for his pioneering research in economic development and the problems of developing countries.
Gary Becker analyzed many curious phenomena, such as crime and punishment (deterrents matter), addiction, families and marriage, and perhaps most important, he pursued analysis of human capital. He concluded that investments in education, training and health care are crucial and can be analyzed like other investments. Becker and other Chicago School economists concluded that investment in human capital was the leading driver of economic growth. He won the Nobel Prize in Economics in 1992 "for having extended the domain of microeconomic analysis to a wide range of human behavior and interaction, including non-market behavior."
Many of the innovations in finance and financial markets have been driven by other Chicago School economists. Modern portfolio theory, efficient markets and behavioral finance have been noteworthy accomplishments. The Chicago School's option pricing models have spurred growth of trading of stock and currency options, which enable entities to reduce or assume risks.
Numerous public policies have been impacted by Chicago School research. Radio spectrum, water rights and energy leases are now often auctioned rather than awarded by regulators' opinions on "merit." Price controls, which caused America's energy shortages in the 1970s, have been repudiated. Many industries have been deregulated.
The Chicago School provided the intellectual underpinnings for Reagan's and Thatcher's economic policies,5 which reduced inflation, reinvigorated the free world and contributed to the collapse of communism. Chicago School economists provided advice that enabled third world and ex-communist countries to grow, lifting hundreds of millions of people out of poverty.
Chicago School analytical efforts have gone far beyond traditional economic topics. Economist Steven Levitt's best-selling book, Freakonomics,6 covers the economic side of lots of items, including street gangs selling crack cocaine. It turns out that from an economic standpoint, street gangs tend to be set up like large corporate franchise operations. Corner drug dealers tend to earn little money, but have room for advancement (should they not be in jail or get killed).7 Levit t covers other topics including cheating by schoolteachers and sumo wrestlers, as well as choices of names for babies.
The near-meltdown of the worldwide financial system has caused many to question deregulation and free market capitalism. It appears that public policy errors, ineffective regulation, and serious mistakes by both private sector and government entities all had a role in the crisis. Clearly there is plenty of room for improvement, and sound economic analysis is needed to facilitate new government policies and private sector practices.
The world clearly operates in an economic framework. Our investments for the Columbia Wanger Funds are driven by our evaluations of the underlying economics of the companies in which we invest. We pursue investments in businesses that we believe are strong, have competitive advantages and that are reasonably valued.


Charles P. McQuaid
President and Chief Investment Officer
Columbia Wanger Asset Management, LLC
Opinions expressed in this essay are those of the author and are not necessarily those of Columbia Wanger Asset Management, its parent organizations, or the Wanger Advisors Trust Board. These views are not guarantees of future performance and involve certain risks, uncertainties and assumptions that are difficult to predict so actual outcomes and results may differ significantly from the views expressed. These views are subject to change at any time based upon economic, market or other conditions and the respective parties disclaim any responsibility to update such views. These views may not be relied on as investment advice and, because investment decisions for a Columbia Wanger Fund are based on numerous factors, may not be relied on as an indication of trading intent on behalf of any particular Columbia Wanger Fund.
1 Overtveldt, Johan Van, The Chicago School (Chicago, Agate Publishing, 2007), pg. 6.
2 Neoclassical price theory uses mathematics to make conclusions about how the economy will behave if the price of goods, services, or behaviors increases.
3 Overtveldt, Johan Van, op. cit., pg. 11.
4 Friedman, Milton and Rose, Free to Choose (New York, Harcourt Brace Jovanovich, Inc., 1980).
5 Chicago School economists had differing opinions about elements of the policies. George Stigler, also a Nobel Prize winner affiliated with the Chicago School, labelled the supply-side program as something between a "gimmick and a slogan."
6 Levitt, Steven D., and Dubner, Stephen J., Freakonomics (New York, HarperCollins Publishers, Inc., 2005).
7 For additional information, see Sudhir Venkatesh's, Gang Leader for a Day, Penguin Press, 2008. Venkatesh was the University of Chicago sociology student whose data was utilized by Levitt.
3
Wanger International Select 2010 Semiannual Report

Performance Review Wanger International Select

Christopher J. Olson
Portfolio Manager
Performance data quoted represents past performance and current performance may be lower or higher. Past performance is no guarantee of future results. The investment return and principal value will fluctuate so that shares, when redeemed, may be worth more or less than the original cost. For daily and most recent month-end performance updates, please call 1-888-4-WANGER.
Wanger International Select was down 4.14%, holding up better than the 6.52% drop of its primary benchmark, the S&P Developed Ex-U.S. Between $2 Billion and $10 Billion Index, for the six months ended June 30, 2010. The Fund's relative performance was hurt in the first half of the period by the strong performance of more cyclical names as investors hoped for a return to solid global economic growth. In the second half of the period, however, the performance of these riskier names declined as indicators pointed to disappointing economic growth. The higher quality names in the Fund's portfolio fared better in this cooler market environment. We continue to favor companies with stronger franchises, better earnings visibility and more solid balance sheets, as we believe it is likely the global equity markets will remain volatile for some time.
Top performers for the first half of 2010 included two gold mining companies: Canada's Eldorado Gold, up 26%, and China's Zhaojin Mining Industry, up 21% year to date. Both stocks benefited from rising gold prices in addition to strong production and exploration profiles. Japan's Ain Pharmaciez gained 71% during the semiannual period as the pharmacy chain provided a strong earnings outlook and moved its stock listing to a more prominent segment of the Tokyo Exchange. Pacific Rubiales Energy, an oil production and exploration company with assets in Colombia, gained 52% year to date as it wisely reinvested cash flow into further successful oil exploration. Benefiting from the Chinese government's focus on medical care reform, Shandong Weigao, a manufacturer of hospital consumables, ended the half year up 43%. We opted to take our profits on the stock given its high valuation, and sold the Fund's position.
Naspers, a media company with assets in South Africa and other emerging markets, was the biggest detractor to Fund gains in the semiannual period, falling 17%. Naspers has been a top contributor to performance for several quarters, but concerns about a possible slowdown at its major investment Tencent, an Internet service provider in China, caused a setback. Germany's Wirecard, an online payment processor and risk manager, fell 34% during the half year when allegations of improper transfers of gaming proceeds arose. Red Eléctrica de Espana, a Spanish power transmission company, was off 34% for the half, as concerns grew about Spain's financial stability and the Spanish stock market sold off heavily. Cobham, a UK manufacturer of aerospace components, was down 20% due to concerns that the British and U.S. governments will cut defense budgets. Micro Focus, a UK legacy software provider, was a new addition to the Fund during the period, but got off to a rocky start, falling 26% on news the company's chief financial officer was resigning. Earnings data released in the second quarter, however, came in strong and met expectations. Dutch sub-sea oilfield services provider Fugro fell 18% year to date, tracking the oil services sector that was rocked due to the BP oil spill in the Gulf of Mexico.
International investing involves special risks, including foreign taxation, currency risks, risks associated with possible differences in financial standards and other risks associated with future political and economic developments. Stocks of small- and mid-cap companies pose special risks, including possible illiquidity and greater price volatility than stocks of larger, more established companies. Investing in emerging markets may involve greater risks than investing in more developed countries.
Portfolio holdings are subject to change periodically and may not be representative of current holdings.
Fund's Positions in Mentioned Holdings
As a percentage of net assets, as of 6/30/10
| Naspers | | | 5.8 | % | |
| Pacific Rubiales Energy | | | 4.2 | | |
| Zhaojin Mining Industry | | | 3.5 | | |
| Eldorado Gold | | | 3.3 | | |
| Cobham | | | 2.6 | | |
| Fugro | | | 2.4 | | |
| Micro Focus | | | 2.1 | | |
| Ain Pharmaciez | | | 1.8 | | |
| Red Eléctrica de Espana | | | 1.2 | | |
| Wirecard | | | 1.0 | | |
4
Wanger International Select 2010 Semiannual Report
Growth of a $10,000 Investment in Wanger International Select
February 1, 1999 (inception date) through June 30, 2010

Performance data quoted represents past performance and current performance may be lower or higher. Past performance is no guarantee of future results. The investment return and principal value will fluctuate so that shares, when redeemed, may be worth more or less than the original cost. Performance results may reflect any fee waivers or reimbursements of Fund expenses by the investment advisor and/or any of its affiliates. Absent these fee waivers or expense reimbursement arrangements, performance results would have been lower. For daily and most recent month-end performance updates, please call 1-888-4-WANGER.
This graph compares the results of $10,000 invested in Wanger International Select on February 1, 1999 (the date the Fund began operations) through June 30, 2010, to the S&P Developed Ex-U.S. Between $2 Billion and $10 Billion Index, with dividends and capital gains reinvested. Although the index is provided for use in assessing the Fund's performance, the Fund's holdings may differ significantly from those in the index.
Top 10 Holdings
As a percentage of net assets, as of 6/30/10
1. Naspers (South Africa)
Media in Africa & Other Emerging Markets | | | 5.7 | % | |
2. Serco (United Kingdom)
Facilities Management | | | 5.0 | | |
3. Kansai Paint (Japan)
Paint Producer in Japan, India, China & Southeast Asia | | | 4.2 | | |
4. Pacific Rubiales Energy (Colombia)
Oil Production & Exploration in Colombia | | | 4.2 | | |
5. Zhaojin Mining Industry (China)
Gold Mining & Refining in China | | | 3.5 | | |
6. Pan American Silver (Canada)
Silver Mining | | | 3.4 | | |
7. Eldorado Gold (Canada)
Gold Miner in Turkey, Greece, China & Brazil | | | 3.3 | | |
8. Olam International (Singapore)
Agriculture Supply Chain Manager | | | 3.2 | | |
9. Jiangsu Expressway (China)
Chinese Toll Road Operator | | | 3.1 | | |
10. NHN (South Korea)
South Korea's Largest Online Search Engine | | | 3.1 | | |
Top 5 Countries
As a percentage of net assets, as of 6/30/10
| Japan | | | 16.3 | % | |
| United Kingdom | | | 13.4 | | |
| Canada | | | 9.3 | | |
| China | | | 6.6 | | |
| Singapore | | | 6.1 | | |
Results as of June 30, 2010
| | | 2nd quarter | | Year to date | | 1 year | | 5 years | | 10 years | |
Wanger International
Select | | | -5.85 | % | | | -4.14 | % | | | 15.31 | % | | | 6.35 | % | | | 2.96 | % | |
S&P Developed
Ex-U.S. Between
$2 Billion and
$10 Billion Index* | | | -10.15 | | | | -6.52 | | | | 12.73 | | | | 3.42 | | | | 5.02 | | |
| MSCI EAFE Index (net) | | | -13.97 | | | | -13.23 | | | | 5.92 | | | | 0.88 | | | | 0.16 | | |
Lipper Variable
Underlying
International
Growth Funds Index | | | -11.36 | | | | -9.54 | | | | 10.97 | | | | 2.48 | | | | -1.79 | | |
NAV as of 6/30/10: $14.65
* The Fund's primary benchmark.
Performance numbers reflect all Fund expenses but do not include any insurance charge imposed by your insurance company's separate accounts. If performance included the effect of these additional charges, it would be lower.
The Fund's annual operating expense ratio, as stated in the current prospectus, reflects a contractual expense waiver or reimbursement that expires April 30, 2011. Expense ratios without and with the contractual waiver are 1.49% and 1.45%, respectively. Absent the waiver or reimbursement, performance results would have been lower.
All results shown assume reinvestment of distributions and do not reflect taxes that a shareholder would pay on Fund distributions or the sale of Fund shares.
The S&P Developed Ex-U.S. Between $2 Billion and $10 Billion Index is a subset of the broad market selected by the index sponsor representing the mid-cap developed market, excluding the United States. The Morgan Stanley Capital International Europe, Australasia, Far East (MSCI EAFE) Index (net) is a capitalization-weighted index that tracks the total return of common stocks in 22 developed market countries within Europe, Australasia and the Far East. The Lipper Variable Underlying International Growth Funds Index is an equally weighted representation of the 30 largest variable insurance underlying funds in the Lipper Variable Underlying International Growth Funds classification. Indexes are not managed and do not incur fees or expenses. It is not possible to invest directly in an index.
Lipper Inc., a widely respected data provider in the industry, calculates an average total return (assuming reinvestment of distributions) for mutual funds with investment objectives similar to those of the Fund. Lipper makes no adjustment for the effect of sales loads.
Portfolio characteristics and holdings are subject to change periodically and may not be representative of current characteristics and holdings.
5
Wanger International Select 2010 Semiannual Report
Wanger International Select
Statement of Investments (Unaudited) June 30, 2010
Number of
Shares | | | | Value | |
| | | | | Equities – 92.6% | | | | | |
| | | Asia – 35.4% | |
| | | Japan – 16.3% | |
| | 133,000 | | | Kansai Paint
Paint Producer in Japan, India, China & Southeast Asia | | $ | 1,138,224 | | |
| | 13,900 | | | Benesse
Education Service Provider | | | 633,035 | | |
| | 335 | | | Seven Bank
ATM Processing Services | | | 606,587 | | |
| | 47,900 | | | Rohto Pharmaceutical
Health & Beauty Products | | | 584,260 | | |
| | 12,000 | | | Ain Pharmaciez
Dispensing Pharmacy/Drugstore Operator | | | 485,785 | | |
| | 425 | | | Jupiter Telecommunications
Largest Cable Service Provider in Japan | | | 405,037 | | |
| | 66 | | | Orix JREIT
Diversified REIT | | | 275,159 | | |
| | 32,000 | | | Kamigumi
Port Cargo Handling & Logistics | | | 245,931 | | |
| | | | 4,374,018 | | |
| | | China – 6.6% | |
| | 396,800 | | | Zhaojin Mining Industry
Gold Mining & Refining in China | | | 930,620 | | |
| | 918,000 | | | Jiangsu Expressway
Chinese Toll Road Operator | | | 836,918 | | |
| | | | 1,767,538 | | |
| | | Singapore – 6.1% | |
| | 465,000 | | | Olam International
Agriculture Supply Chain Manager | | | 851,462 | | |
| | 613,300 | | | Ascendas REIT
Singapore Industrial Property Landlord | | | 791,634 | | |
| | | | 1,643,096 | | |
| | | South Korea – 4.5% | |
| | 5,500 | | | NHN (a)
South Korea's Largest Online Search Engine | | | 818,521 | | |
| | 11,500 | | | Woongjin Coway
South Korean Household Appliance Rental
Service Provider | | | 384,446 | | |
| | | | 1,202,967 | | |
| | | Hong Kong – 1.9% | |
| | 33,000 | | | Hong Kong Exchanges and Clearing
Hong Kong Equity & Derivatives Market Operator | | | 515,418 | | |
| | | | | Total Asia | | | 9,503,037 | | |
Number of
Shares | | | | Value | |
| | | Europe – 33.2% | |
| | | United Kingdom – 13.4% | |
| | 155,000 | | | Serco
Facilities Management | | $ | 1,350,199 | | |
| | 35,000 | | | Intertek Group
Testing, Inspection & Certification Services | | | 748,563 | | |
| | 220,000 | | | Cobham
Aerospace Components | | | 693,436 | | |
| | 90,000 | | | Micro Focus
United Kingdom Legacy Software Provider | | | 563,672 | | |
| | 13,800 | | | Schroders
United Kingdom Top Tier Asset Manager | | | 248,355 | | |
| | | | 3,604,225 | | |
| | | Netherlands – 5.9% | |
| | 14,041 | | | Fugro
Sub-sea Oilfield Services | | | 642,004 | | |
| | 19,623 | | | Imtech
Electromechanical & ICT Installation & Maintenance | | | 503,380 | | |
| | 3,000 | | | Core Laboratories
Oil & Gas Reservoir Consulting | | | 442,830 | | |
| | | | 1,588,214 | | |
| | | Switzerland – 3.0% | |
| | 10,400 | | | Bank Sarasin & Cie
Private Banking | | | 416,670 | | |
| | 3,800 | | | Kuehne & Nagel
Freight Forwarding/Logistics | | | 389,233 | | |
| | | | 805,903 | | |
| | | Sweden – 2.6% | |
| | 53,300 | | | Hexagon
Measurement Equipment | | | 694,041 | | |
| | | Germany – 2.4% | |
| | 18,000 | | | Rhoen-Klinikum
Health Care Services | | | 399,802 | | |
| | 30,000 | | | Wirecard
Online Payment Processing & Risk Management | | | 255,179 | | |
| | | | 654,981 | | |
| | | France – 1.9% | |
| | 7,000 | | | Neopost
Postage Meter Machines | | | 506,565 | | |
See accompanying notes to financial statements.
6
Wanger International Select 2010 Semiannual Report
Wanger International Select
Statement of Investments (Unaudited) June 30, 2010
Number of
Shares | | | | Value | |
| | | Ireland – 1.9% | |
| | 181,900 | | | United Drug
Irish Pharmaceutical Wholesaler & Outsourcer | | $ | 506,322 | | |
| | | Spain – 1.2% | |
| | 9,100 | | | Red Eléctrica de Espana
Spanish Power Transmission | | | 325,293 | | |
| | | Denmark – 0.9% | |
| | 2,200 | | | Novozymes
Industrial Enzymes | | | 233,502 | | |
| | | | | Total Europe | | | 8,919,046 | | |
| | | Other Countries – 19.8% | |
| | | Canada – 9.3% | |
| | 36,000 | | | Pan American Silver
Silver Mining | | | 910,080 | | |
| | 50,000 | | | Eldorado Gold
Gold Miner in Turkey, Greece, China & Brazil | | | 896,153 | | |
| | 13,100 | | | CCL Industries
Leading Global Label Manufacturer | | | 350,712 | | |
| | 10,000 | | | AG Growth
Leading Manufacturer of Augers & Grain
Handling Equipment | | | 329,717 | | |
| | | | 2,486,662 | | |
| | | South Africa – 5.7% | |
| | 46,000 | | | Naspers
Media in Africa & Other Emerging Markets | | | 1,546,055 | | |
| | | Australia – 2.6% | |
| | 62,000 | | | UGL
Engineering & Facilities Management | | | 700,153 | | |
| | | United States – 1.2% | |
| | 12,500 | | | Atwood Oceanics (a)
Offshore Drilling Contractor | | | 319,000 | | |
| | | Israel – 1.0% | |
| | 25,000 | | | Israel Chemicals
Producer of Potash, Phosphates, Bromine &
Specialty Chemicals | | | 260,710 | | |
| | | | | Total Other Countries | | | 5,312,580 | | |
Number of Shares
or Principal Amount | | | | Value | |
| | | Latin America – 4.2% | |
| | | Colombia – 4.2% | |
| | 50,000 | | | Pacific Rubiales Energy (a)
Oil Production & Exploration in Colombia | | $ | 1,120,662 | | |
| | | Total Latin America | | | 1,120,662 | | |
| Total Equities (Cost: $20,551,865) – 92.6% | | | 24,855,325 | | |
| Short-Term Obligation – 7.3% | |
| | | Repurchase Agreement – 7.3% | |
| $ | 1,957,000 | | | Repurchase Agreement with Fixed
Income Clearing Corp., dated 6/30/10,
due 7/01/10 at 0.00%, collateralized
by a U.S. Government Agency
obligation maturing 12/30/13, market
value $1,997,494 (repurchase
proceeds $1,957,000) | | | 1,957,000 | | |
| Total Short-Term Obligation (Cost: $1,957,000) | | | 1,957,000 | | |
| Total Investments (Cost: $22,508,865) – 99.9% (b)(c) | | | 26,812,325 | | |
| Cash and Other Assets Less Liabilities – 0.1% | | | 19,507 | | |
| Total Net Assets – 100.0% | | $ | 26,831,832 | | |
Notes to Statement of Investments:
(a) Non-income producing security.
(b) On June 30, 2010, the Fund's total investments were denominated in currencies as follows:
| Currency | | Value | | Percentage
of Net Assets | |
| Japanese Yen | | $ | 4,374,019 | | | | 16.3 | | |
| U.S. Dollar | | | 3,628,910 | | | | 13.5 | | |
| British Pound | | | 3,604,225 | | | | 13.4 | | |
| Euro | | | 3,138,545 | | | | 11.7 | | |
| Canadian Dollar | | | 2,697,243 | | | | 10.1 | | |
| Hong Kong Dollar | | | 2,282,956 | | | | 8.5 | | |
| Singapore Dollar | | | 1,643,096 | | | | 6.1 | | |
| South African Rand | | | 1,546,055 | | | | 5.8 | | |
Other currencies less than
5% of total net assets | | | 3,897,276 | | | | 14.5 | | |
Cash and other assets
less liabilities | | | 19,507 | | | | 0.1 | | |
| | | $ | 26,831,832 | | | | 100.0 | | |
(c) At June 30, 2010, for federal income tax purposes, the cost of investments was $22,508,865 and net unrealized appreciation was $4,303,460 consisting of gross unrealized appreciation of $5,534,017 and gross unrealized depreciation of $1,230,557.
See accompanying notes to financial statements.
7
Wanger International Select 2010 Semiannual Report
Wanger International Select
Statement of Investments (Unaudited) June 30, 2010
The following table summarizes the inputs used, as of June 30, 2010, in valuing the Fund's assets:
| Investment Type | | Quoted Prices
(Level 1) | | Other
Significant
Observable
Inputs
(Level 2) | | Significant
Unobservable
Inputs
(Level 3) | | Total | |
| Equities | |
| Asia | | $ | — | | | $ | 9,503,037 | | | $ | — | | | $ | 9,503,037 | | |
| Europe | | | 442,830 | | | | 8,476,216 | | | | — | | | | 8,919,046 | | |
| Other Countries | | | 2,805,662 | | | | 2,506,918 | | | | — | | | | 5,312,580 | | |
| Latin America | | | 1,120,662 | | | | — | | | | — | | | | 1,120,662 | | |
| Total Equities | | | 4,369,154 | | | | 20,486,171 | | | | — | | | | 24,855,325 | | |
| Total Short-Term Obligation | | | — | | | | 1,957,000 | | | | — | | | | 1,957,000 | | |
| Total Investments | | $ | 4,369,154 | | | $ | 22,443,171 | | | $ | — | | | $ | 26,812,325 | | |
The Fund's assets assigned to the Level 2 input category are generally valued using the market approach, in which a security's value is determined through its correlation to prices and information from market transactions for similar or identical assets. Foreign equities are generally valued at the last sales price on the foreign exchange or market on which they trade. The Fund may use a systematic fair valuation model provided by an independent third party to value securities principally traded in foreign markets in order to adjust for possible stale pricing that may occur between the close of the foreign exchanges and the time for valuation. These models take into account available market data including intraday index, ADR, and ETF movements.
Certain Short-Term Obligations may be valued using amortized cost, an income approach which converts future cash flows to a present value based upon the discount or premium at purchase.
For more information on valuation inputs, and their aggregation into the levels used in the table above, please refer to the Security Valuation section in the accompanying Notes to Financial Statements.
See accompanying notes to financial statements.
8
Wanger International Select 2010 Semiannual Report
Wanger International Select
Portfolio Diversification (Unaudited) June 30, 2010
At June 30, 2010, the Fund's portfolio investments as a percentage of net assets was diversified as follows:
| | | Value | | Percentage of
Net Assets | |
| Industrial Goods & Services | |
| Other Industrial Services | | $ | 2,341,329 | | | | 8.7 | | |
| Industrial Materials & Specialty Chemicals | | | 1,632,436 | | | | 6.1 | | |
| Outsourcing Services | | | 1,350,199 | | | | 5.0 | | |
| Machinery | | | 836,282 | | | | 3.1 | | |
| Electrical Components | | | 693,437 | | | | 2.6 | | |
| | | | 6,853,683 | | | | 25.5 | | |
| Energy & Minerals | |
| Mining | | | 3,179,683 | | | | 11.8 | | |
| Oil & Gas Producers | | | 1,120,661 | | | | 4.2 | | |
| Oil Services | | | 961,005 | | | | 3.6 | | |
| | | | 5,261,349 | | | | 19.6 | | |
| Information | |
| TV Broadcasting | | | 1,546,055 | | | | 5.8 | | |
| Internet Related | | | 818,521 | | | | 3.0 | | |
| Financial Processors | | | 770,596 | | | | 2.9 | | |
| Instrumentation | | | 694,041 | | | | 2.6 | | |
| Business Software | | | 563,672 | | | | 2.1 | | |
| CATV | | | 405,037 | | | | 1.5 | | |
| | | | 4,797,922 | | | | 17.9 | | |
| Consumer Goods & Services | |
| Nondurables | | | 934,972 | | | | 3.5 | | |
| Food & Beverage | | | 851,461 | | | | 3.2 | | |
| Educational Services | | | 633,036 | | | | 2.3 | | |
| Retail | | | 485,785 | | | | 1.8 | | |
| Other Consumer Services | | | 384,446 | | | | 1.4 | | |
| | | | 3,289,700 | | | | 12.2 | | |
| | | Value | | Percentage of
Net Assets | |
| Other Industries | |
| Transportation | | $ | 1,082,849 | | | | 4.0 | | |
| Real Estate | | | 1,066,793 | | | | 4.0 | | |
| Regulated Utilities | | | 325,293 | | | | 1.2 | | |
| | | | 2,474,935 | | | | 9.2 | | |
| Finance | |
| Brokerage & Money Management | | | 665,025 | | | | 2.5 | | |
| Banks | | | 606,587 | | | | 2.3 | | |
| | | | 1,271,612 | | | | 4.8 | | |
| Health Care | |
| Pharmaceuticals | | | 506,322 | | | | 1.9 | | |
| Health Care Services | | | 399,802 | | | | 1.5 | | |
| | | | 906,124 | | | | 3.4 | | |
| Total Equities | | | 24,855,325 | | | | 92.6 | | |
| Short-Term Obligation | | | 1,957,000 | | | | 7.3 | | |
| Total Investments | | | 26,812,325 | | | | 99.9 | | |
Cash and Other Assets
Less Liabilities | | | 19,507 | | | | 0.1 | | |
| Net Assets | | $ | 26,831,832 | | | | 100.0 | | |
See accompanying notes to financial statements.
9
Wanger International Select 2010 Semiannual Report
Statement of Assets and Liabilities
June 30, 2010 (Unaudited)
| Assets: | |
| Investments, at cost | | $ | 22,508,865 | | |
| Investments, at value | | $ | 26,812,325 | | |
| Cash | | | 708 | | |
| Foreign currency (cost of $29,869) | | | 29,933 | | |
| Receivable for: | |
| Investments sold | | | 224,896 | | |
| Fund shares sold | | | 2,902 | | |
| Dividends | | | 25,758 | | |
| Foreign tax reclaims | | | 5,819 | | |
| Other assets | | | 68 | | |
| Total Assets | | | 27,102,409 | | |
| Liabilities: | |
| Payable for: | |
| Investments purchased | | | 151,344 | | |
| Fund shares repurchased | | | 50,337 | | |
| Investment advisory fee | | | 21,435 | | |
| Administration fee | | | 1,140 | | |
| Transfer agent fee | | | 19 | | |
| Trustees' fees | | | 963 | | |
| Audit fee | | | 14,014 | | |
| Custody fee | | | 8,711 | | |
| Reports to shareholders | | | 7,958 | | |
| Chief compliance officer expenses | | | 53 | | |
| Trustees' deferred compensation plan | | | 7,017 | | |
| Other liabilities | | | 7,586 | | |
| Total Liabilities | | | 270,577 | | |
| Net Assets | | $ | 26,831,832 | | |
| Composition of Net Assets: | |
| Paid-in capital | | $ | 30,624,611 | | |
| Overdistributed net investment income | | | (179,554 | ) | |
| Accumulated net realized loss | | | (7,917,560 | ) | |
| Net unrealized appreciation on: | |
| Investments | | | 4,303,460 | | |
| Foreign currency translations | | | 875 | | |
| Net Assets | | $ | 26,831,832 | | |
| Fund Shares Outstanding | | | 1,832,093 | | |
Net asset value, offering price and redemption
price per share | | $ | 14.65 | | |
Statement of Operations
For the Six Months Ended June 30, 2010 (Unaudited)
| Investment Income: | |
| Dividends (net foreign taxes withheld of $24,662) | | $ | 344,959 | | |
| Interest income | | | 369 | | |
| Securities lending income | | | 168 | | |
| Total Investment Income | | | 345,496 | | |
| Expenses: | |
| Investment advisory fee | | | 138,178 | | |
| Administration fee | | | 7,350 | | |
| Transfer agent fee | | | 83 | | |
| Trustees' fees | | | 2,124 | | |
| Custody fee | | | 27,082 | | |
| Reports to shareholders | | | 12,262 | | |
| Audit fee | | | 11,515 | | |
| Chief compliance officer expenses (See Note 4) | | | 687 | | |
| Other expenses (See Note 5) | | | 8,611 | | |
| Total Expenses | | | 207,892 | | |
| Custody earnings credit | | | — | * | |
| Net Expenses | | | 207,892 | | |
| Net Investment Income | | | 137,604 | | |
Net Realized and Unrealized Gain (Loss) on
Investments and Foreign Currency: | |
| Net realized gain (loss) on: | |
| Investments | | | 1,058,315 | | |
| Foreign currency transactions | | | (5,312 | ) | |
| Net realized gain | | | 1,053,003 | | |
| Net change in unrealized appreciation (depreciation) on: | |
| Investments | | | (2,363,673 | ) | |
| Foreign currency translations | | | 1,597 | | |
Net change in unrealized
appreciation (depreciation) | | | (2,362,076 | ) | |
| Net Loss | | | (1,309,073 | ) | |
| Net Decrease in Net Assets from Operations | | $ | (1,171,469 | ) | |
* Rounds to less than $1.
See accompanying notes to financial statements.
10
Wanger International Select 2010 Semiannual Report
Statement of Changes in Net Assets
| Increase (Decrease) in Net Assets | | (Unaudited)
Six Months
Ended
June 30,
2010 | | Year Ended
December 31,
2009 | |
| Operations: | |
| Net investment income | | $ | 137,604 | | | $ | 211,983 | | |
| Net realized gain (loss) on investments and foreign currency transactions | | | 1,053,003 | | | | (3,445,751 | ) | |
Net change in unrealized appreciation (depreciation)
on investments and foreign currency translations | | | (2,362,076 | ) | | | 11,080,753 | | |
| Net Increase (Decrease) in Net Assets from Operations | | | (1,171,469 | ) | | | 7,846,985 | | |
| Distributions to Shareholders: | |
| From net investment income | | | (239,549 | ) | | | (867,446 | ) | |
| Share Transactions: | |
| Subscriptions | | | 711,936 | | | | 1,881,562 | | |
| Distributions reinvested | | | 239,549 | | | | 867,446 | | |
| Redemptions | | | (4,162,757 | ) | | | (7,878,859 | ) | |
| Net Decrease from Fund Share Transactions | | | (3,211,272 | ) | | | (5,129,851 | ) | |
| Total Increase (Decrease) in Net Assets | | | (4,622,290 | ) | | | 1,849,688 | | |
| Net Assets: | |
| Beginning of period | | | 31,454,122 | | | | 29,604,434 | | |
| End of period | | $ | 26,831,832 | | | $ | 31,454,122 | | |
| Overdistributed net investment income at end of period | | $ | (179,554 | ) | | $ | (77,609 | ) | |
See accompanying notes to financial statements.
11
Wanger International Select 2010 Semiannual Report
Financial Highlights
| | | (Unaudited)
Six Months Ended
June 30, | | Year Ended December 31, | |
| Selected data for a share outstanding throughout each period | | 2010 | | 2009 | | 2008 | | 2007 | | 2006 | | 2005 | |
| Net Asset Value, Beginning of Period | | $ | 15.42 | | | $ | 12.01 | | | $ | 28.07 | | | $ | 26.62 | | | $ | 19.63 | | | $ | 17.19 | | |
| Income from Investment Operations: | |
| Net investment income (a) | | | 0.07 | | | | 0.10 | | | | 0.21 | | | | 0.10 | | | | 0.11 | | | | 0.13 | | |
Net realized and unrealized gain (loss) on investments and
foreign currency | | | (0.71 | ) | | | 3.71 | | | | (10.31 | ) | | | 4.92 | | | | 6.94 | | | | 2.66 | | |
| Total from Investment Operations | | | (0.64 | ) | | | 3.81 | | | | (10.10 | ) | | | 5.02 | | | | 7.05 | | | | 2.79 | | |
| Less Distributions to Shareholders: | |
| From net investment income | | | (0.13 | ) | | | (0.40 | ) | | | (0.09 | ) | | | (0.21 | ) | | | (0.06 | ) | | | (0.35 | ) | |
| From net realized gains | | | — | | | | — | | | | (5.87 | ) | | | (3.36 | ) | | | — | | | | — | | |
| Total Distributions to Shareholders | | | (0.13 | ) | | | (0.40 | ) | | | (5.96 | ) | | | (3.57 | ) | | | (0.06 | ) | | | (0.35 | ) | |
| Net Asset Value, End of Period | | $ | 14.65 | | | $ | 15.42 | | | $ | 12.01 | | | $ | 28.07 | | | $ | 26.62 | | | $ | 19.63 | | |
| Total Return (b) | | | (4.14 | )%(c) | | | 32.92 | %(d) | | | (44.35 | )% | | | 21.78 | % | | | 36.00 | % | | | 16.43 | %(d) | |
| Ratios to Average Net Assets/Supplemental Data: | |
| Net expenses (e) | | | 1.42 | %(f) | | | 1.45 | % | | | 1.24 | % | | | 1.18 | % | | | 1.19 | % | | | 1.32 | % | |
| Net investment income (e) | | | 0.94 | %(f) | | | 0.75 | % | | | 1.10 | % | | | 0.37 | % | | | 0.47 | % | | | 0.76 | % | |
| Waiver/Reimbursement | | | — | | | | 0.04 | % | | | — | | | | — | | | | — | | | | 0.00 | %(g) | |
| Portfolio turnover rate | | | 15 | %(c) | | | 62 | % | | | 68 | % | | | 69 | % | | | 61 | % | | | 48 | % | |
| Net assets, end of period (000s) | | $ | 26,832 | | | $ | 31,454 | | | $ | 29,604 | | | $ | 73,485 | | | $ | 62,594 | | | $ | 44,026 | | |
(a) Net investment income per share was based upon the average shares outstanding during the period.
(b) Total return at net asset value assuming all distributions reinvested.
(c) Not annualized.
(d) Had the investment advisor not waived a portion of expenses, total return would have been reduced.
(e) The benefits derived from custody fees paid indirectly had an impact of less than 0.01%.
(f) Annualized.
(g) Rounds to less than 0.01%.
See accompanying notes to financial statements.
12
Wanger International Select 2010 Semiannual Report
Notes to Financial Statements (Unaudited)
1. Nature of Operations
Wanger International Select (the "Fund"), is a series of Wanger Advisors Trust (the "Trust"), an open-end management investment company organized as a Massachusetts business trust. The investment objective of the Fund is to seek long-term capital appreciation. The Fund is available only for allocation to certain life insurance company separate accounts established for the purpose of funding qualified and non-qualified variable annuity contracts and variable life insurance policies and may also be offered directly to certain types of pension plans and retirement arrangements.
2. Significant Accounting Policies
The preparation of financial statements in accordance with accounting principles generally accepted in the United States of America ("GAAP") requires management to make certain estimates and assumptions that affect the reported amounts of assets and liabilities, the disclosure of contingent assets and liabilities at the date of the financial statements and the reported amounts of revenue and expenses during the reporting period. Actual results could differ from those estimates.
Security valuation
Securities of the Fund are valued at market value or, if a market quotation for a security is not readily available or is deemed not to be reliable because of events or circumstances that have occurred between the market quotation and the time as of which the security is to be valued, the security is valued at its fair value determined in good faith under consistently applied procedures established by the Board of Trustees. A security traded on a securities exchange or in an over-the-counter market in which transaction prices are reported is valued at the last sales price at the time of valuation. A security traded principally on NASDAQ is valued at the NASDAQ official closing price. Mutual Funds and Exchange Traded Funds are valued at their closing net asset value as reported to NASDAQ. A security for which there is no reported sale on the valuation date is valued at the latest bid quotation. Short-term investments maturing in 60 days or less are valued at amortized cost, which approximates market value. A security for which a market quotation is not readily available and any other assets are valued at its fair value determined in good faith under consistently applied procedures established by the Board of Trustees. The Trust has retained an independent statistical fair value pricing service that employs a systematic methodology to assist in the fair valuation process for securities principally traded in a foreign market in order to adjust for possible changes in value that may occur between the close of the foreign market and the time as of which the securities are to be valued. If a security is valued at a "fair value", that value may be different from the last quoted market price for the security.
Various inputs are used in determining the value of the Fund's investments; following the input prioritization hierarchy established by GAAP. These inputs are summarized in the three broad levels listed below:
• Level 1—quoted prices in active markets for identical securities
• Level 2—prices determined using other significant observable inputs (including quoted prices for similar securities, interest rates, prepayment speeds, credit risk and others)
• Level 3—prices determined using significant unobservable inputs when quoted prices or observable inputs are unavailable or less reliable (including management's own assumptions about the factors market participants would use in pricing an investment)
The inputs or methodologies used for valuing securities are not necessarily an indication of the risk associated with investing in those securities.
Examples of the types of securities in which the Fund would typically invest and how they are classified within this hierarchy are as follows. Typical level 1 securities include exchange traded domestic equities, mutual funds whose NAVs are published each day and exchange traded foreign equities that are not statistically fair valued. Typical level 2 securities include exchange traded foreign equities that are statistically fair valued and short-term investments valued at amortized cost. Additionally, securities fair valued by the Fund's valuation committee that rely on significant observable inputs are also included in level 2. Typical level 3 securities include any security fair valued by the Fund's Valuation Committee that relies on significant unobservable inputs.
On January 21, 2010, the Financial Accounting Standards Board issued an Accounting Standards Update, Fair Value Measurements and Disclosures (Topic 820): Improving Disclosures about Fair Value Measurements, (the "Update"), which provides guidance on how investment assets and liabilities are to be valued and disclosed. Specifically, the Update requires reporting entities to disclose the input and valuation techniques used to measure fair value for both recurring and nonrecurring fair value measurements for Level 2 and Level 3 positions. The Update also requires that transfers between all levels (including Level 1 and Level 2) be disclosed on a gross basis (i.e., transfers out must be disclosed separately from transfers in), and requires disclosure of the reason(s) for the transfer. Additionally, purchases, sales, issuances and settlements must be disclosed on a gross basis in the Level 3 rollforward. The effective date of the Update is for interim and annual periods beginning after December 15, 2009; except for the requirement to provide the Level 3 activity for purchases, sales, issuances and settlements on a gross basis, which will be effective for interim and annual periods beginning after December 15, 2010. The Fund adopted the Update effective March 31, 2010.
Repurchase agreements
The Fund may engage in repurchase agreement transactions. The Fund, through its custodian, receives delivery of underlying securities collateralizing each repurchase agreement. The counterparty is required to maintain collateral that is at all times at least equal to the repurchase price including interest. In the event of default or bankruptcy by the other party to the agreement, realization and/or retention of the collateral may be subject to legal proceedings.
Foreign currency translations
Values of investments denominated in foreign currencies are converted into U.S. dollars using the New York spot market rate of exchange at the time of valuation. Purchases and sales of investments and dividend and interest income are translated into U.S. dollars using the spot market rate of exchange prevailing on the respective dates of such transactions. The gain or loss resulting from changes in foreign exchange rates is included with net realized and unrealized gain or loss from investments, as appropriate.
Security transactions and investment income
Security transactions are accounted for on the trade date (date the order to buy or sell is executed) and dividend income is recorded on the ex-dividend date, except that certain dividends from foreign securities are recorded as soon as the information is available to the Fund. Interest income is recorded on the accrual basis and includes amortization of discounts on debt obligations when required for federal income tax purposes. Realized gains and losses from security transactions are recorded on an identified cost basis.
Awards, if any, from class action litigation related to securities owned may be recorded as a reduction of cost of those securities. If the applicable securities are no longer owned, the proceeds are recorded as realized gains.
Restricted securities
Restricted securities are securities that may only be resold upon registration under federal securities laws or in transactions exempt from registration. In some cases, the issuer of restricted securities has agreed to register such securities for resale at the issuer's expense either upon demand by the Fund or
13
Wanger International Select 2010 Semiannual Report
Notes to Financial Statements, continued (Unaudited)
in connection with another registered offering of the securities. Many restricted securities may be resold in the secondary market in transactions exempt from registration. Such restricted securities may be determined to be liquid under criteria established by the Board of Trustees.
Securities lending
The Fund may lend securities up to one-third of the value of its total assets to certain approved brokers, dealers and other financial institutions to earn additional income. The Fund retains the benefits of owning the securities, including receipt of dividends or interest generated by the security. The Fund also receives a fee for the loan. The Fund has the ability to recall the loans at any time and could do so in order to vote proxies or to sell the loaned securities. Each loan is collateralized by cash that exceeded the value of the securities on loan. The market value of the loaned securities is determined daily at the close of business of the Fund and any additional required collateral is delivered to each Fund on the next business day. The Fund has elected to invest the cash collateral in the Dreyfus Government Cash Management Fund and the income earned is paid to the Fund, net of any fees remitted to Goldman Sachs Agency Lending as the lending agent and borrower rebates. The Fund's advisor, Columbia Wanger Asset Management, LLC ("CWAM"), does not retain any fees earned by the lending program. Generally, in the event of borrower default, the Fund has the right to use the collateral to offset any losses incurred. In the event the Fund is delayed or prevented from exercising its right to dispose of the collateral, there may be a potential loss to the Fund. Some of these losses may be indemnified by the lending agent. The Fund bears the risk of loss with respect to the investment of collateral.
The net lending income earned in 2010 by the Fund is included in the Statement of Operations. There were no loans outstanding on June 30, 2010.
Fund share valuation
Fund shares are sold and redeemed on a continuing basis at net asset value. Net asset value per share is determined daily as of the close of trading on the New York Stock Exchange ("the Exchange") on each day the Exchange is open for trading by dividing the total value of the Fund's investments and other assets, less liabilities, by the number of Fund shares outstanding.
Custody fees/Credits
Custody fees are reduced based on the Fund's cash balances maintained with the custodian. The amount is disclosed as a reduction of total expenses in the Statement of Operations.
Federal income taxes
The Fund has complied with the provisions of the Internal Revenue Code available to regulated investment companies and, in the manner provided therein, distributes all its taxable income, as well as any net realized gain on sales of investments and foreign currency transactions reportable for federal income tax purposes. Accordingly, the Fund paid no federal income taxes and no federal income tax provision was required.
Expenses
General expenses of the Trust are allocated to the Fund and the other series of the Trust based upon relative net assets or other expense allocation methodologies determined by the nature of the expense. Expenses directly attributable to the Fund are charged to the Fund.
Foreign capital gains taxes
Gains in certain countries may be subject to foreign taxes at the fund level, at rates ranging from 10%-15%. The Fund accrues for such foreign taxes on net realized and unrealized gains at the appropriate rate for each jurisdiction.
Distributions to shareholders
Distributions to shareholders are recorded on the ex-dividend date.
Indemnification
In the normal course of business, the Trust on behalf of the Fund enters into contracts that contain a variety of representations and warranties and that provide general indemnities. The Fund's maximum exposure under these arrangements is unknown, as this would involve future claims against the Fund. Also under the Trust's organizational documents, the trustees and officers of the Trust are indemnified against certain liabilities that may arise out of their duties to the Trust. However based on experience, the Fund expects the risk of loss due to these warranties and indemnities to be minimal.
3. Federal Tax Information
The tax character of distributions paid during the year ended December 31, 2009 was as follows:
| Ordinary Income* | | $ | 867,446 | | |
* For tax purposes short-term capital gain distributions, if any, are considered ordinary income distributions.
The following capital loss carryforwards, determined as of December 31, 2009, may be available to reduce taxable income arising from future net realized gains on investments, if any, to the extent permitted by the Internal Revenue Code:
Year of
Expiration | | Capital Loss
Carryforwards | |
| 2016 | | $ | 2,630,085 | | |
| 2017 | | | 5,996,635 | | |
| Total | | $ | 8,626,720 | | |
Under current tax rules, certain currency (and capital) losses realized after October 31 may be deferred and treated as occurring on the first day of the following fiscal year. As of December 31, 2009, post-October capital losses of $196,242 attributed to security transactions were deferred to January 1, 2010.
Management is required to determine whether a tax position of the Fund is more likely than not to be sustained upon examination by the applicable taxing authority, including resolution of any related appeals or litigation processes, based on the technical merits of the position. The tax benefit to be recognized by the Fund is measured as the largest amount of benefit that is greater than fifty percent likely of being realized upon ultimate settlement. Management is not aware of any tax positions for which it is reasonably possible that the total amounts of unrecognized tax benefits will significantly change in the next twelve months. However, management's conclusions may be subject to review and adjustment at a later date based on factors including, but not limited to, new tax laws, regulations, and administrative interpretations (including relevant court decisions). The Fund's federal tax returns for the prior three fiscal year s remain subject to examination by the Internal Revenue Service.
4. Transactions With Affiliates
CWAM is a wholly owned subsidiary of Columbia Management Investment Advisers, LLC ("Columbia Management"), which in turn is an indirect, wholly owned subsidiary of Ameriprise Financial, Inc. ("Ameriprise Financial"). CWAM furnishes continuing investment supervision to the Fund and is responsible for the overall management of the Fund's business affairs.
After the close of business on April 30, 2010, (the "Closing"), Ameriprise Financial acquired from Bank of America Corporation ("BOA"), a portion of the asset management business of Columbia Management Group, LLC, including 100% of CWAM. On May 27, 2010, the shareholders of the Fund approved a new investment advisory agreement with CWAM to provide advisory services
14
Wanger International Select 2010 Semiannual Report
Notes to Financial Statements, continued (Unaudited)
to the Fund. There were no changes to the Fund's advisory fee rate under the new agreement.
CWAM receives a monthly advisory fee based on the Fund's average daily net assets at the following annual rates:
| Average Daily Net Assets | | Annual Fee Rate | |
| Up to $500 million | | | 0.94 | % | |
| $500 million and over | | | 0.89 | % | |
For the six months ended June 30, 2010, the Fund's annualized effective investment advisory fee rate was 0.94% of average daily net assets.
Through April 30, 2011, CWAM has contractually agreed to reimburse the Fund to the extent that ordinary operating expenses (exclusive of brokerage commissions, interest, taxes and extraordinary expenses, but inclusive of custodian charges relating to overdrafts, if any), after giving effect to any balance credits from the Fund's custodian, exceed an annual percentage of 1.45% of average daily net assets on an annualized basis. For the six months ended June 30, 2010, the Fund was not reimbursed any expenses.
CWAM provides administrative services and receives an administration fee from the Fund at the following annual rates.
Wanger Advisors Trust Aggregate
Average Daily Net Assets of the Trust | | Annual Fee Rate | |
| Up to $4 million | | | 0.05 | % | |
| $4 billion to $6 billion | | | 0.04 | % | |
| $6 billion to $8 billion | | | 0.03 | % | |
| $8 billion and over | | | 0.02 | % | |
For the six months ended June 30, 2010, the Fund's annualized effective administration fee rate was 0.05% of average daily net assets. Prior to the Closing, CWAM had delegated to Columbia Management Advisors, LLC ("CMA") an indirect, wholly owned subsidiary of BOA, responsibility to provide certain sub-administrative services to the Fund. Following the Closing, Riversource Investments, LLC, a wholly owned subsidiary of Ameriprise Financial, acquired the assets of CMA and subsequently changed its name to Columbia Management, and thereafter began providing certain sub-administrative services to the Fund.
Prior to the Closing, Columbia Management Distributors, Inc., a wholly owned subsidiary of BOA, served as the Fund's distributor and principal underwriter. In connection with the Closing, RiverSource Fund Distributors, Inc., a wholly owned subsidiary of Ameriprise Financial, became the distributor of the Fund and subsequently changed its name to Columbia Management Investment Distributors, Inc. ("CMDI"). There were no changes to the underwriting discount structure of the Fund or the service or distribution fee rates paid by the Fund as a result of the Closing.
Prior to the Closing, Columbia Management Services, Inc., an indirect, wholly owned subsidiary of BOA, provided shareholder services to the Fund and contracted with Boston Financial Data Services ("BFDS") to serve as sub-transfer agent. In connection with the Closing, RiverSource Service Corporation, a wholly owned subsidiary of Ameriprise Financial, became the transfer agent of the Fund and subsequently changed its name to Columbia Management Investment Services Corp. (CMIS). The transfer agent fee rates paid by the Fund did not change as a result of the change in transfer agent. For its services, the Fund pays CMIS a monthly fee at the annual rate of $21.00 per open account. CMIS also receives reimbursement for certain out-of-pocket expenses and sub-transfer agency expenses. The arrangement with BFDS has been continued by CMIS.
Certain officers and trustees of the Trust are also officers of CWAM. The Trust makes no direct payments to its officers and trustees who are affiliated with CWAM.
The Board of Trustees has appointed a Chief Compliance Officer of the Trust in accordance with federal securities regulations. The Fund, along with other affiliated funds, pays its pro-rata share of the expenses associated with the Office of the Chief Compliance Officer. These expenses are disclosed separately as "Chief compliance officer expenses" in the Statement of Operations.
The Trust offers a deferred compensation plan for its independent trustees. Under that plan, a trustee may elect to defer all or a portion of his or her compensation. Amounts deferred are retained by the Trust and may represent an unfunded obligation of the Trust. The value of amounts deferred is determined by reference to the change in value of Class Z shares of one or more series of Columbia Acorn Trust or a money market fund as specified by the trustee. Benefits under the deferred compensation plan are payable when the trustee ceases to be a member of the Board of Trustees.
During the six months ended June 30, 2010, the Fund did not engage in purchase and sales transactions with funds that have a common investment advisor (or affiliated investment advisors), common directors/trustees, and/or common officers.
5. Borrowing Arrangements
The Trust participates in a $150 million credit facility, along with another Trust managed by CWAM, which was entered into to facilitate portfolio liquidity. Under the facility, interest is charged to each participating fund based on its borrowings at a rate per annum equal to the higher of Federal Funds Rate or Overnight LIBOR plus 1.25%. In addition, a commitment fee of 0.15% per annum of the unutilized line of credit is accrued and apportioned among the participating funds based on their relative net assets. The commitment fee is included in "Other expenses" in the Statement of Operations. No amounts were borrowed by the Fund under this facility during the six months ended June 30, 2010. The Trust enters into this line of credit for one year durations. The Trust has secured the line of credit for the entire year of 2010.
6. Fund Share Transactions
Proceeds and payments on Fund shares as shown in the Statement of Changes in Net Assets are in respect of the following numbers of shares:
| | | Six months ended
June 30, 2010 | | Year ended
December 31, 2009 | |
| Shares sold | | | 47,092 | | | | 143,216 | | |
Shares issued in reinvestment
of dividend distributions | | | 16,635 | | | | 77,552 | | |
| Less shares redeemed | | | (271,242 | ) | | | (645,637 | ) | |
| Net decrease in shares outstanding | | | (207,515 | ) | | | (424,869 | ) | |
7. Investment Transactions
The aggregate cost of purchases and proceeds from sales other than short-term obligations for the six months ended June 30, 2010 were $4,398,670 and $9,053,076, respectively.
8. Information Regarding Pending and Settled Legal Proceedings
In June 2004, an action captioned John E. Gallus et al. v. American Express Financial Corp. and American Express Financial Advisors Inc. was filed in the United States District Court for the District of Arizona. The plaintiffs allege that they are investors in several American Express Company (now known as RiverSource) mutual funds and they purport to bring the action derivatively on behalf of those funds under the Investment Company Act of 1940. The plaintiffs allege that fees allegedly paid to the defendants by the funds for investment advisory and administrative services are excessive. The plaintiffs seek remedies including restitution and rescission of investment advisory and
15
Wanger International Select 2010 Semiannual Report
Notes to Financial Statements, continued (Unaudited)
distribution agreements. The plaintiffs voluntarily agreed to transfer this case to the United States District Court for the District of Minnesota (the District Court). In response to defendants' motion to dismiss the complaint, the District Court dismissed one of plaintiffs' four claims and granted plaintiffs limited discovery. Defendants moved for summary judgment in April 2007. Summary judgment was granted in the defendants' favor on July 9, 2007. The plaintiffs filed a notice of appeal with the Eighth Circuit Court of Appeals (the Eighth Circuit) on August 8, 2007. On April 8, 2009, the Eighth Circuit reversed summary judgment and remanded to the District Court for further proceedings. On August 6, 2009, defendants filed a writ of certiorari with the U.S. Supreme Court (the Supreme Court), asking the Supreme Court to stay the District Court proceedings while the Supreme Court considers and rules in a case captioned Jones v. Harris Associates, which involves issues of law similar to those presented in the Gallus case. On March 30, 2010, the Supreme Court issued its ruling in Jones v. Harris Associates, and on April 5, 2010, the Supreme Court vacated the Eighth Circuit's decision in the Gallus case and remanded the case to the Eighth Circuit for further consideration in light of the Supreme Court's decision in Jones v. Harris Associates. On June 4, 2010, the Eighth Circuit remanded the Gallus case to the District Court for further consideration in light of the Supreme Court's decision in Jones v. Harris Associates.
In December 2005, without admitting or denying the allegations, American Express Financial Corporation (AEFC, which is now known as Ameriprise Financial, Inc. (Ameriprise Financial)), entered into settlement agreements with the Securities and Exchange Commission (SEC) and Minnesota Department of Commerce (MDOC) related to market timing activities. As a result, AEFC was censured and ordered to cease and desist from committing or causing any violations of certain provisions of the Investment Advisers Act of 1940, the Investment Company Act of 1940, and various Minnesota laws. AEFC agreed to pay disgorgement of $10 million and civil money penalties of $7 million. AEFC also agreed to retain an independent distribution consultant to assist in developing a plan for distribution of all disgorgement and civil penalties ordered by the SEC in accordance with various undertakings detailed at http://www.sec.gov/litigation/admin/ia-2451.pdf. Ameriprise Financial and its affiliates have cooperated with the SEC and the MDOC in these legal proceedings, and have made regular reports to the Columbia Management Funds' Boards of Directors/Trustees.
Ameriprise Financial and certain of its affiliates have historically been involved in a number of legal, arbitration and regulatory proceedings, including routine litigation, class actions, and governmental actions, concerning matters arising in connection with the conduct of their business activities. Ameriprise Financial believes that the Funds are not currently the subject of, and that neither Ameriprise Financial nor any of its affiliates are the subject of, any pending legal, arbitration or regulatory proceedings that are likely to have a material adverse effect on the Funds or the ability of Ameriprise Financial or its affiliates to perform under their contracts with the Funds. Ameriprise Financial is required to make 10-Q, 10-K and, as necessary, 8-K filings with the Securities and Exchange Commission on legal and regulatory matters that relate to Ameriprise Financial and its affiliates. Copies of these filings may be obt ained by accessing the SEC website at www.sec.gov.
There can be no assurance that these matters, or the adverse publicity associated with them, will not result in increased fund redemptions, reduced sale of fund shares or other adverse consequences to the Funds. Further, although we believe proceedings are not likely to have a material adverse effect on the Funds or the ability of Ameriprise Financial or its affiliates to perform under their contracts with the Funds, these proceedings are subject to uncertainties and, as such, we are unable to estimate the possible loss or range of loss that may result. An adverse outcome in one or more of these proceedings could result in adverse judgments, settlements, fines, penalties or other relief that could have a material adverse effect on the consolidated financial condition or results of operations of Ameriprise Financial.
*****
CWAM, Columbia Acorn Trust (another mutual Fund family advised by CWAM), and the trustees of Columbia Acorn Trust (collectively, the "Columbia defendants") were named as defendants in class and derivative complaints that were consolidated in a Multi-District Action (the MDL Action) in the federal district court of Maryland. These lawsuits contend that defendants permitted certain investors to market time their trades in certain Columbia Acorn Funds. The MDL Action is ongoing. However, all claims against the Trust and the Independent Trustees of the Trust have been dismissed.
Columbia Acorn Trust and CWAM are also defendants in a state court class action lawsuit that alleges, in summary, that the Trust and CWAM exposed shareholders of Columbia Acorn International to trading by market timers by allegedly: (a) failing to properly evaluate daily whether a significant event affecting the value of the Fund's securities had occurred after foreign markets had closed but before the calculation of the Fund's net asset value (NAV); (b) failing to implement the Fund's portfolio valuation and share pricing policies and procedures; and (c) failing to know and implement applicable rules and regulations concerning the calculation of NAV (the Fair Valuation Lawsuit). The United States Court of Appeals for the Seventh Circuit ruled that the plaintiffs' state law claims were preempted under federal law, resulting in the dismissal of plaintiffs' complaint. Plaintiffs appealed the Seventh Circuit's ruling to the United States Supreme Court. The Supreme Court reversed the Seventh Circuit's ruling on jurisdictional grounds and the case was remanded to the state court.
On March 21, 2005, a class action complaint was filed against the Trust and CWAM seeking to rescind the CDSC assessed upon redemption of Class B shares of the Columbia Acorn Funds (the CDSC Lawsuit). In addition to the rescission of sales charges, plaintiffs seek recovery of actual damages, attorneys' fees and costs. The case was transferred to the MDL Action in the federal district court of Maryland.
On September 14, 2007, the plaintiffs and the Columbia defendants named in the MDL Action, including the Columbia family of funds, entered into a stipulation of settlement with respect to all Columbia-related claims in the MDL Action described above, including the CDSC and Fair Valuation Lawsuits.
On April 23, 2010, the parties of the MDL Action filed a motion seeking: (a) preliminary approval of the MDL settlements; (b) the conditional certification of the plaintiff class for purposes of settlement; (c) approval of the form and manner of giving notice to the plaintiff class of the proposed settlements; and (d) approval of the proposed schedule for various deadlines in connection with the final settlement hearing. The motion was presented to and approved by the court on May 7, 2010. The final hearing on the fairness of the settlements is scheduled for October 21, 2010.
CWAM believes that the lawsuits are not likely to materially affect its ability to provide investment management services to the Funds.
16
Wanger International Select 2010 Semiannual Report
[Excerpt from:]
Wanger Advisors Trust
Management Fee Evaluation of the Senior Officer
Prepared Pursuant to the New York Attorney General's
Assurance of Discontinuance
December 2009
17
Wanger International Select 2010 Semiannual Report
Introduction
The New York Attorney General's Assurance of Discontinuance ("Order") entered into by Columbia Management Advisors, LLC ("CMAI") and Columbia Management Distributors, Inc., ("CMDI") in February 2005, allows CMAI to manage or advise a mutual fund only if the trustees of the fund appoint a "Senior Officer" to perform specified duties and responsibilities. One of these responsibilities includes "managing the process by which proposed management fees (including but not limited to, advisory fees) to be charged the [funds] are negotiated so that they are negotiated in a manner which is at arms' length and reasonable and consistent with this Assurance of Discontinuance."
The Columbia Acorn Trust and Wanger Advisors Trust (collectively, the "Trusts") and each series thereof (the "Acorn Funds," "WAT Funds" or collectively, the "Funds") are overseen by the same Board of Trustees ("Board"). The Order provides that this Board must determine the reasonableness of proposed "management fees" by using either an annual competitive bidding process supervised by the Senior Officer or Independent Fee Consultant, or by obtaining "an annual independent written evaluation prepared by or under the direction of the Senior Officer or the Independent Fee Consultant."
"Management fees" are only part of the costs and expenses paid by mutual fund shareholders. Fund expenses can vary depending upon the class of shares held but usually include: (1) investment management or advisory fees to compensate analysts and portfolio managers for stock research and portfolio management, as well as the cost of operating a trading desk; (2) administrative expenses incurred to prepare registration statements and tax returns, calculate the funds' net asset values, maintain effective compliance procedures and perform recordkeeping services; (3) transfer agency costs for establishing accounts, accepting and disbursing funds, as well as overseeing trading in fund shares; (4) custodial expenses incurred to hold the securities purchased by the funds; and (5) distribution expenses, including commissions paid to brokers that sell the fund shares to investors.
Columbia Wanger Asset Management, L.P. ("CWAM"), is the adviser to the Funds, and at present is a part of Columbia Management Group ("Columbia"), an umbrella organization that also includes CMAI, Columbia Management Services, Inc. ("CMSI") and CMDI. Columbia is owned by Bank of America Corporation ("Bank of America").
The Proposed Change of Ownership
On September 29, 2009, Bank of America entered into a Purchase Agreement ("APA") with Ameriprise Financial, Inc. ("Ameriprise") providing for, among other things, the sale of CWAM to Ameriprise and the acquisition by Ameriprise of certain assets of Columbia. The Columbia assets to be acquired by Ameriprise include the functions currently performed by CMAI, CMSI and CMDI. Because some of Columbia's operations are supported by Bank of America staff and facilities outside of Columbia, Ameriprise and Bank of America entered into a Transition Services Agreement ("TSA") that, among other things, provides for the continuation of those services for a period of time. The parties contemplate a closing date of the APA in Spring 2010, and closing is conditioned upon the approval by the Board of a new advisory agreement between the Trusts and CWAM, as well as agreements with the entities that will succeed CMSI, CMDI and CMAI. These entities& #151;RiverSource Fund Services, Inc. ("RFS"), RiverSource Fund Distributors, Inc. ("RFD") and RiverSource Investments, LLC—are wholly owned subsidiaries of Ameriprise and currently support the RiverSource family of mutual funds. Therefore, if the sale is consummated as contemplated by the various agreements, CWAM's ownership will change from Bank of America to Ameriprise, as will the Funds' primary service providers.1
Columbia and Ameriprise have proposed that the Trusts continue, in substance, the existing advisory agreement governing portfolio management, and the administration services agreement governing certain administration and clerical services. They propose no material changes to these agreements, no change in services and no changes in fee levels, only those changes necessary to effect the change of ownership. The fees paid under these two agreements are referred to as "management fees." Other fund expenses will be governed by separate agreements, in particular agreements with two Ameriprise affiliates: RFD, the broker-dealer that will underwrite and distribute the Funds' shares, and RFS the Funds' proposed transfer agent.
While the proposed agreements themselves suggest no substantive changes in the services provided to the Funds, Ameriprise and Columbia have informed the Board that they intend to embark on a process of integrating the operations of the two organizations with respect to administration and other services. Among the objectives of that integration are the reduction of costs, and increased economies of scale. Further, CWAM will be subject to new management oversight by Ameriprise which, among other things, will establish the compensation structure for CWAM's portfolio managers and analysts.
Requirements of the Order
The Order applies to any successor to substantially all the assets of CMDI and CMAI. Under the Order, a fee evaluation must precede the execution of new advisory and administration services agreements; there is no express exception from this requirement for agreements that are intended solely to transfer ownership of the existing service providers. I have been advised by Columbia that it believes the Order requires the preparation of this fee evaluation.
In conformity with the terms of the Order and past evaluations, this evaluation addresses only the advisory and administration contracts, and does not extend to any proposed new underwriting and transfer agency agreements.
1The Funds' custodian is State Street Bank and Trust Company. No change in custodian is required by the APA nor is such a change contemplated at this time.
18
Wanger International Select 2010 Semiannual Report
According to the Order, the Senior Officer's evaluation must consider at least the following:
(1) Management fees (including components thereof) charged to institutional and other clients of CWAM for like services;
(2) Management fees (including any components thereof) charged by other mutual fund companies for like services;
(3) Costs to CWAM and its affiliates of supplying services pursuant to the management fee agreements, excluding any intra-corporate profit;
(4) Profit margins of CWAM and its affiliates from supplying such services;
(5) Possible economies of scale as the Funds grow larger; and
(6) The nature and quality of CWAM's services, including the performance of each Fund.
In 2004, the Boards of the two Trusts, then separate groups, each appointed me Senior Officer under the Order. They also determined not to pursue a competitive bidding process and instead, charged me with the responsibility of evaluating the Funds' proposed advisory and administration fee contracts with CWAM in conformity with the requirements of the Order. In discharging their responsibilities, the independent Trustees have also consulted independent, outside counsel. The Board has asked that I prepare this evaluation.
2009 Evaluation
In May 2009, I submitted to the Board the fourth annual evaluation prepared under the Order. That evaluation, based on performance and fee data as of December 31, 2008, was considered by the Board in renewing the advisory and administration services agreements that were effective on July 31, 2009. That evaluation followed the same structure as the earlier studies. Some areas were given more emphasis, while others were given less. Still, the fundamental information gathered for that evaluation was largely the same as past years. That evaluation is referred to here as the "2009 Study."
Process and Independence
The objectives of the Order are to ensure the independent evaluation of the management fees paid by the Funds as well as to insure that all relevant factors are considered. In my view, this contract process has been conducted at arms-length and with independence in gathering, considering and evaluating all relevant data. At the outset of the process, the Trustees sought and obtained from Ameriprise and Columbia a comprehensive compilation of data regarding Fund performance and expenses, adviser profitability, and other information. The Trustees, acting through their Performance Committee and the Ad Hoc Committee, evaluated this information thoroughly, and met often to discuss it. Performance and expense data was obtained from both Morningstar and Lipper, the leading consultants in this area. The rankings prepared by Morningstar and Lipper were independent and prepared in conformity with the methodologies employed by those organi zations. Counsel for the Funds and the Independent Trustees considered, as did I, the terms and conditions of the existing contracts, and evaluated them in light of the proposed transaction.
In the course of its work, the Trustees also gave careful consideration to the conclusions and recommendations contained in the 2009 Study.
My evaluation of the advisory contracts was shaped, as it has been in the past, by my experience as Chief Compliance Officer of the Trusts ("CCO"). As CCO, I report solely to the Board and have no reporting obligation to, or employment relationship with, Columbia or its affiliates. I have commented on compliance matters in evaluating the quality of service provided by CWAM.
This Report, its supporting materials and the data contained in other materials submitted to the Ad Hoc and Performance Committees of the Board, in my view, provide a thorough factual basis upon which the Board, in consultation with independent counsel as it deems appropriate, may conduct management fee negotiations that are in the best interests of the Funds' shareholders.
The Fee Reductions Mandated under the Order
Under the terms of the Order, Columbia agreed to secure certain management fee reductions for the mutual funds advised by its affiliate investment advisers. In some instances, breakpoints were also established. Although neither CWAM nor the Trusts was a party to the Order, CWAM offered and the Board accepted certain advisory fee reductions during 2005. By the terms of the Order, these fees may not be increased before November 30, 2009, and under the Investment Company Act, may not be increased before March 2012 or later (other than for bona fide additional investment advisory services), if the closing date of the transaction is later than March 2010. I have used these advisory fee levels, as modified thereafter, in this evaluation because they are the fees in the current agreements that CWAM and Ameriprise propose should be continued. Hence, these fee levels are the starting point of an evaluation.
Conclusions
My review of the data and other material above leads to the following conclusions with respect to the factors identified in the Order.
A. Fund Performance
The Domestic Funds: The Acorn Fund has achieved good performance over the past five years, and achieved those results with less risk than its peers. Acorn Select and Wanger Select have enjoyed strong investment returns in the past year, resulting in improved rankings that place those funds near or in the top third of their peers over the trailing five year period. These results are achieved, however, with greater relative risk than the other domestic Funds. Acorn USA and its parallel,
19
Wanger International Select 2010 Semiannual Report
Wanger USA have not been as strong as the other Funds relative to their peers over this period, turning in a largely average performance, though both Funds have outperformed their benchmarks. Thermostat is unique and therefore difficult to assess, but now enjoys a Morningstar rank above its peer median. The overall trend for performance of the domestic Funds is positive, and further, all domestic Funds enjoy positive alpha, confirming that their portfolio managers add value to performance.
The International Funds: The international Funds experienced a challenging 12 month period relative to their peers, but their five year rankings remain at or above the median. These Funds have enjoyed periods of strong out-performance during that five year stretch. Further, they have outperformed their benchmarks during the past five years, and done so while exposing shareholders to less risk than competitors. Finally, all the international Funds enjoy positive alpha, again confirming the value of their portfolio managers.
B. Management Fees Relative to Peers
There is significant variance in management fee rankings across the Funds. Acorn International is the only fund that was ranked in the top quartile by both Morningstar and Lipper. The other Acorn funds tend to fall around the medians identified by one or the other service. The WAT funds are uniformly more expensive than their peers.
C. Management Fees Relative to Institutional Account and Other Mutual Fund Accounts
CWAM's focus is on its mutual funds. The few institutional accounts it does manage vary in rate structures. Some pay advisory fees commensurate with or higher than the Acorn and WAT funds. In a few instances, however, institutional accounts pay lower advisory fees than do the Acorn funds. One such institutional account is significant in size and has been under CWAM's management for over 31 years. Further, CWAM performs sub-advisory services for two mutual funds managed by RiverSource, a fund family operated by Ameriprise, at rates that are lower than those paid by the parallel Acorn funds, though sub-advisory services can differ from those necessary for the full support of a mutual fund.
D. Administrative Services
The Acorn and WAT funds' administrative fees are generally less competitive than are the fees charged by competitors, but these rankings suffer from a lack of uniformity in the scope of services encompassed by the fee. CWAM and CMAI provide excellent administrative support for all the Funds.
E. Costs and Benefits to CWAM and its Affiliates
CWAM's direct costs do not appear excessive. Overhead and indirect costs allocated to CWAM by its parent organizations, however, are significant and have varied considerably over the years. CWAM's affiliates report operating losses and therefore do not appear to enjoy excessive "fall out" benefits from CWAM's advisory agreement with the Funds. CWAM continues to enjoy substantial benefits from the use of "soft dollar" payments for research.
F. Profitability
CWAM's profit margins have declined in recent periods, as have the margins of many fund companies, but it still maintains margins that appear to be in the upper range of its competitors.
G. Economies of Scale
Economies of scale do exist at CWAM, and the Board has instituted breakpoints that reflect that reality. In the past two years, however, asset levels have generally declined, and sustained asset growth will be required to trigger additional fee reductions under the current schedule. Asset declines have not, however, resulted in significant fee increases.
H. Nature and Quality of Service
This category includes a variety of considerations that are difficult to quantify, yet can have a significant bearing on the performance of the Acorn and WAT funds. Several areas merit comment.
1. Capacity. CWAM has maintained its investment management capacity even in a difficult environment.
2. Compliance. CWAM has a reasonably designed compliance program that protects shareholders.
I. Process
In my opinion, the process of negotiating an advisory contract for the Funds has been conducted thoroughly and at arms' length. The Ad Hoc Committee has taken the steps necessary to assess the proposed change of ownership and recommended appropriate measures to protect Fund shareholders. It has also taken steps to encourage an agreement on an appropriate incentive plan for CWAM that will facilitate the continuity of management, motivate CWAM professionals and that will
20
Wanger International Select 2010 Semiannual Report
align their efforts with the interests of Fund shareholders. The Trustees have sufficient information to evaluate management's proposal, and negotiate contract terms that are in the best interests of fund shareholders.
****
Recommendations
I believe the Trustees should:
1. Continue to monitor closely the performance of Acorn USA and Wanger USA, to assess the impact of the portfolio changes implemented by the portfolio manager.
2. Focus their review on the WAT funds' management fee levels in relation to their peers, in particular the fees paid by Wanger Select, which are, in the views of both Morningstar and Lipper, significantly higher than their peers.
3. Take appropriate steps to insure that any integration of the two organizations does not adversely impact Fund shareholders, and continue their efforts to facilitate an agreement on an appropriate incentive plan for CWAM personnel that will both motivate them and align their interests with Fund shareholders.
4. Consider the fees paid by (sub-advisory fees) and to (revenue sharing payments) the proposed new parent organization, Ameriprise or its mutual funds, to identify and address all conflicts of interest.
Robert P. Scales
December 2009
21
Wanger International Select 2010 Semiannual Report
[Excerpt from:]
Wanger Advisors Trust
Supplement to the
Management Fee Evaluation of the Senior Officer
Prepared Pursuant to the New York Attorney General's
Assurance of Discontinuance
April 2010
22
Wanger International Select 2010 Semiannual Report
Introduction
In December 2009, I prepared a fee evaluation required under the New York Attorney General's Assurance of Discontinuance ("Order") entered into by Columbia Management Advisors, LLC ("CMAI") and Columbia Management Distributors, Inc., ("CMDI") in February 2005. That Order allows CMAI to manage or advise a mutual fund only if the trustees of the fund appoint a "Senior Officer" to perform specified duties and responsibilities. One of these responsibilities includes "managing the process by which proposed management fees (including but not limited to, advisory fees) to be charged the [funds] are negotiated so that they are negotiated in a manner which is at arms' length and reasonable and consistent with this Assurance of Discontinuance."
The Columbia Acorn Trust and Wanger Advisors Trust (collectively, the "Trusts") and each series thereof (the "Acorn Funds," "WAT Funds" or collectively, the "Funds") are overseen by the same Board of Trustees ("Board"). The Order provides that this Board must determine the reasonableness of proposed "management fees" by using either an annual competitive bidding process supervised by the Senior Officer or Independent Fee Consultant, or by obtaining "an annual independent written evaluation prepared by or under the direction of the Senior Officer or the Independent Fee Consultant."
Columbia Wanger Asset Management, L.P. ("CWAM"), is the adviser to the Funds, and at present is a part of Columbia Management Group ("Columbia"), an umbrella organization that also includes CMAI, Columbia Management Services, Inc. ("CMSI") and CMDI. Columbia is owned by Bank of America Corporation ("Bank of America").
On September 29, 2009, Bank of America entered into a Purchase Agreement ("APA") with Ameriprise Financial, Inc. ("Ameriprise") providing for, among other things, the sale of CWAM to Ameriprise and the acquisition by Ameriprise of certain assets of Columbia. The parties contemplate a closing date of the APA in Spring 2010, and closing is conditioned upon the approval by the Board of a new advisory agreement between the Trusts and CWAM, as well as agreements with the entities that will succeed CMSI, CMDI and CMAI. These entities—RiverSource Fund Services, Inc. ("RFS"), RiverSource Fund Distributors, Inc. ("RFD") and RiverSource Investments, LLC—are wholly owned subsidiaries of Ameriprise and currently support the RiverSource family of mutual funds. Therefore, if the sale is consummated as contemplated by the various agreements, CWAM's ownership will change from Bank of America to Ameriprise, as will the Funds' primary s ervice providers.
Ameriprise, through various separate accounts ("Accounts") established by certain of its insurance company affiliates, is currently an investor in the WAT Funds on behalf of contract holders in variable insurance policies and variable annuity contracts (together, the "Contracts") that Ameriprise or its affiliates have marketed to their clients. In the WAT structure, the insurance companies purchase shares in the WAT Funds on behalf of the Accounts, which fund the Contracts. The insurance company enters into a participation agreement with Wanger Advisors Trust to purchase shares on behalf of its Accounts. The Accounts are the actual investors in the Wanger Funds, not the individual contract holders. Through this structure, Ameriprise controlled Accounts hold approximately $2 billion or two-thirds of the WAT Funds' total assets; approximately nine other insurance companies also participate in the WAT Funds and hold the remaining a ssets in those Funds. Ameriprise also maintains a small account with CWAM that is a sub-account for a RiverSource mutual fund. This sub-account is not subject to oversight by the WAT or Acorn Board.
Columbia and Ameriprise have proposed that the Trusts continue, in substance, the existing advisory agreement governing portfolio management, and the administration services agreement governing certain administration and clerical services. They propose no change in services and no changes in fee levels, only those changes necessary to effect the change of ownership. The fees paid under these two agreements are referred to as "management fees."
Reasons for this Supplement
This Supplement is prompted by notice given by Ameriprise, after completion of the fee evaluation in December, that following the closing of the transaction, it anticipates a redemption of approximately $1 billion of its clients' investments in two of the WAT Funds (Wanger USA and Wanger International), and re-investment of most of the proceeds in one or more RiverSource mutual funds; CWAM will sub-advise these funds in two new sub-accounts at CWAM and effect investment strategies substantially identical to those pursued by the WAT Funds from which those funds were redeemed. One of the sub-accounts will parallel WAT International/Acorn International, and the other Wanger USA/Acorn USA. Ameriprise has advised the Board of the sub-advisory fees to be paid to CWAM and such sub-advisory fees will be lower than the advisory fee paid to CWAM by the parallel WAT Fund. Sub-advised accounts of this kind are generally considered instituti onal accounts and sub-advisory services are priced differently (and usually lower) than the advisory fees for mutual funds that are not sub-advised.
The Order and the Investment Company Act require fund trustees to consider, among other things, the proposed management fees (including components thereof) charged to institutional and other clients of the adviser for like services. As the Fee Evaluation notes, CWAM historically has maintained very few institutional accounts with relatively few assets under management. The new Ameriprise accounts are, therefore, a departure from past practice at CWAM.
Ameriprise's intentions pose the following issues with respect to assessing the reasonableness of the management fee proposed by Ameriprise for the WAT and Acorn Funds:
1. How do the Funds' fees compare to the fees paid by the parallel institutional accounts?
2. What impact might the redemption have on the fees paid by the shareholders who remain in the WAT Funds after the Ameriprise action?
3. Would expanded assets in the institutional accounts strain CWAM's limited capacity to manage the Acorn and WAT Funds?
23
Wanger International Select 2010 Semiannual Report
This Supplement is intended solely to address these points as additional information for consideration by the Trustees in assessing the reasonableness of the management fees proposed by Ameriprise.
****
Conclusions
The conclusions and recommendations in the December 2009 Fee Evaluation remain valid today. Consideration of the Ameriprise redemption proposal leads to the following additional conclusions and recommendations.
A. Reasonableness of the Advisory Fees and Related Considerations
CWAM will soon manage assets in a sub-advised account at fee levels that reflect a substantial discount to the parallel mutual fund. Ameriprise has set forth the differences in services that support its claim that this divergence in fees is justified. These justifications should be revisited by the Trustees. In addition, the redemption will result in higher fees for remaining participants in the WAT Funds, and will result in brokerage and other expenses for Fund participants. These costs should also be a part of the Trustees' calculus in assessing fees. Lastly, the prospect of increased assets for CWAM management raises potential future issues of investment capacity.
B. Process
In my opinion, the process of negotiating an advisory contract for the Funds has been conducted thoroughly and at arms' length. The Board's Contract Committee and its Ad Hoc Committee engaged in a careful assessment of the repercussions of the Ameriprise redemption proposal, assessed as best as possible its potential costs, and revisited the breakpoint schedules of the WAT and Acorn Funds to determine whether WAT Fund participants are treated equitably in relation to Acorn Fund shareholders. It also gave consideration to the fee differential between institutional and mutual fund accounts. The Trustees met on a number occasions with me and with counsel, and gave close attention to a variety of materials including data submitted by Ameriprise and the legal analysis of counsel. The Trustees have sufficient information to evaluate management's proposals, and negotiate contract terms that are in the best interests of fund shareholder s. Lastly, the Trustees considered the recommendations set forth below and the Contract Committee adopted them as appropriate measures to protect shareholders.
Recommendations
In light of the developments discussed in this Supplement, I recommend that the Trustees:
1. Consider imposing an expense cap on Wanger International and Wanger USA that will insulate those participants who remain after the Ameriprise redemption from the impact of increased advisory fees.
2. Consider including in the advisory or related contracts with Ameriprise a provision requiring Ameriprise to reimburse the direct costs of its redemption, insulating remaining Fund participants from the commission and other expenses that will be required to effect the redemption.
3. Consider seeking an agreement on the part of Ameriprise to seek Board approval of new institutional and sub-advised accounts that will result in increased assets under management at CWAM, thereby protecting existing investors from dilution of CWAM's limited investment management capacity.
Robert P. Scales
April 2010
24
Wanger International Select 2010 Semiannual Report
Board Approval of the Proposed Advisory Agreement
The Board of Trustees unanimously approved the proposed Investment Advisory Agreement with Columbia Wanger Asset Management, LLC ("Columbia WAM") (the "Proposed Advisory Agreement") for each Fund of the Trust at meetings held on February 24, 2010 and April 6, 2010.
The Ad Hoc Committee on the Sale of Columbia Management Group of the Board and the Contract Committee of the Board (together, the "Committees"), which are comprised solely of Trustees who have no direct or indirect interest in the Proposed Advisory Agreement and who are not "interested persons" (as defined in the Investment Company Act of 1940, as amended (the "1940 Act")), of the Trust (the "Independent Trustees"), and all Trustees received and reviewed a substantial amount of information provided by Columbia WAM and Ameriprise Financial, Inc. ("Ameriprise") in response to requests from the Independent Trustees and their independent legal counsel. Throughout the process, the Trustees had numerous opportunities to ask questions of and request additional materials from Columbia WAM and Ameriprise.
During each meeting at which the Committees or the Independent Trustees considered the Proposed Advisory Agreement, they met in executive session with their independent legal counsel. The Committees also met separately with representatives of Ameriprise, Columbia Management Group, LLC ("CMG") and Columbia WAM management on several different occasions. In all, one or other of the Committees convened formally on 22 separate occasions to consider the sale of a portion of the asset management business of CMG, including 100% of Columbia WAM, by Bank of America Corporation ("Bank of America") to Ameriprise (the "Transaction"), and convened informally on many other occasions. The Board and/or some or all of the Independent Trustees met on at least 6 other occasions to receive the Committees' status reports on the Transaction, receive presentations from Ameriprise and Columbia WAM representatives, and to discuss outstanding issues. In a ddition, the Independent Trustees' counsel and the Trust's Chief Compliance Officer conducted on-site due diligence sessions at Ameriprise. As they considered the Proposed Advisory Agreement, the Independent Trustees were advised by independent legal counsel.
The Trustees reviewed the Proposed Advisory Agreement, as well as certain information obtained through Ameriprise's responses to initial and supplemental questionnaires prepared at the request of the Trustees by counsel to the Funds and independent legal counsel to the Independent Trustees. In addition, the Trustees reviewed the Management Fee Evaluation dated December 2009 and the Supplement thereto dated April 2010 (the "Fee Evaluation") prepared by, the Trust's chief compliance officer, senior vice president and general counsel, who also serves as the Trust's "Senior Officer," as contemplated by the Assurance of Discontinuance dated February 9, 2005 among affiliates of Columbia WAM and the Office of the New York Attorney General. Finally, the Trustees considered certain additional contractual protections they had obtained from Ameriprise in the event of a material compliance violation or harm caused to shareholders during the conversion of certain operational services as a result of the Transaction.
The materials reviewed by the Committees and the Trustees included, among other items, (i) information on the investment performance of each Fund and of independently selected peer groups of funds and of the Fund's performance benchmarks over various time periods, (ii) information on each Fund's advisory fees and other expenses, including information comparing the Fund's fees and expenses to those of peer groups of funds and information about any applicable expense limitations and fee breakpoints, (iii) data on sales and redemptions of Fund shares, and (iv) information on the profitability to Columbia WAM and Ameriprise, as well as potential "fall-out" or ancillary benefits that Columbia WAM and its affiliates may receive as a result of their relationships with the Funds. The Trustees also considered other information such as (i) Columbia WAM's financial condition, (ii) each Fund's investment objective and strategy, (iii) the si ze, education and experience of Columbia WAM's investment staff and its use of technology, external research and trading cost measurement tools, (iv) information on Ameriprise's approach to retention and compensation of portfolio managers and the terms of the new incentive compensation plan for Columbia WAM investment personnel, (v) the allocation of the Funds' brokerage, and the use of "soft" commission dollars to pay for research products and services, (vi) the resources devoted to, and the record of compliance with, the Funds' investment policies and restrictions, policies on personal securities transactions and other compliance policies, and (vii) Ameriprise's management structure, financial condition and its intentions for managing the Funds and the respective service providers.
In considering whether to approve the Proposed Advisory Agreement, the Trustees reviewed and analyzed various factors that they determined were relevant, none of which by itself was considered dispositive. However, the material factors and conclusions that formed the basis for the Trustees' determination to approve the Proposed Advisory Agreement are discussed separately below.
Nature, quality and extent of services. The Trustees reviewed the expected nature, quality and extent of the services to be provided by Columbia WAM and its affiliates to the Funds under the Proposed Advisory Agreement, taking into account the investment objective and strategy of each Fund. In addition, the Trustees reviewed the available resources and key personnel of Columbia WAM and Ameriprise, especially those providing investment management services to the Funds. The Trustees also considered other services to be provided to the Funds by Columbia WAM, including: managing the execution of portfolio transactions and selecting broker-dealers for those transactions; monitoring adherence to the Funds' investment restrictions; producing shareholder reports; providing support services for the Board and committees of the Board; communicating with sharehol ders; serving as the Funds' administrator; and overseeing the activities of the Funds' other service providers, including monitoring for compliance with various policies and procedures as well as applicable securities laws and regulations. The Trustees reviewed each of these factors in light of the expected change of control of Columbia WAM and the likelihood of possible changes as a result of the Transaction.
In addition, in connection with the Transaction, the Board considered:
• the reputation, financial strength, regulatory histories and resources of Ameriprise and its affiliates;
• the terms of the Proposed Advisory Agreement, including the difference between the Current and Proposed Advisory Agreements, as set forth in this Proxy Statement, including that Columbia WAM had agreed to a higher standard of care for non-investment services in the Proposed Advisory Agreement;
• the terms and conditions of other agreements and arrangements relating to the future operations of the Funds, including the Underwriting Agreement and the Transition Services Agreement, both between Ameriprise and Bank of America; the Administration Services Agreement, between Columbia WAM and the Funds; the Shareholders' Servicing and Transfer Agent Agreement, between RiverSource Services Corporation and the Funds; the Underwriting Agreement between RiverSource Fund Distributors, Inc. and the Funds; and the Transition, Integration and Conversion Principles Agreement and the Compliance Agreement, both between Ameriprise and the Funds;
• that the Trustees recently had completed a full annual review of the Current Advisory Agreement for each Fund under the 1940 Act, and had determined that they were satisfied with the nature, extent and quality of services provided thereunder and that they had determined that the management fees were reasonable in relation to the services rendered; and
• that Ameriprise and Bank of America, and not the Funds, would bear all costs of obtaining approvals of the Proposed Advisory Agreement, including legal and Trustee fees and costs resulting from the Transaction.
25
Wanger International Select 2010 Semiannual Report
Board Approval of the Proposed Advisory Agreement
The Trustees concluded that the expected nature, quality and extent of the services to be provided by Columbia WAM to each Fund under the Proposed Advisory Agreement were appropriate for the Funds. They also concluded that Columbia WAM currently had sufficient personnel, with appropriate education and experience, to serve the Funds effectively, and that the firm had demonstrated its continuing ability to attract and retain well-qualified personnel. The Trustees also believed that Columbia WAM investment personnel would continue to be compensated pursuant to a plan that was designed to align their interests with those of Fund shareholders. The Trustees also considered that Columbia WAM had maintained its investment management capacity and resources throughout a difficult economic environment. In addition, they took note of the quality of Columbia WAM's compliance record. The Trustees also took into consideration that Ameriprise h ad offered its assurances that the services provided to the Funds following the Transaction would be consistent with or better than the manner and level at which such services were currently being performed for the Funds and that there would be no diminution of services to the Funds or their shareholders as a result of the Transaction. In this regard, the Trustees considered that certain current senior executives of CMG who are currently responsible for oversight of certain services provided to the Funds would continue to oversee those services after the closing of the Transaction. The Trustees also believed that the higher standard of care in the Proposed Advisory Agreement would benefit shareholders. The Trustees further recognized that the investment personnel of Columbia WAM would, effective upon a change of control of Columbia WAM to Ameriprise, be subject to employment agreements and other terms of employment created for the purpose of retaining skilled investment personnel. Assuming such personnel rem ain in place following the change in control, the Trustees concluded that the Transaction would not result in a diminution of investment services provided to the Funds.
Performance of the Funds. The Trustees received and considered detailed performance information at various meetings of the Board and of the Investment Performance Analysis Committee of the Board throughout the year in addition to performance information considered in connection with the Transaction. They reviewed information comparing each Fund's performance with that of its benchmark(s) and with the performance of comparable funds and peer groups as identified by Lipper Inc. ("Lipper") and Morningstar, Inc. ("Morningstar"). The Trustees evaluated the performance of the Funds over various time periods. However, they gave somewhat more consideration to the rolling three-year performance of each Fund.
More particularly, with respect to the domestic Funds, the Trustees noted that Wanger Select equaled its Morningstar peer group median while underperforming its Lipper peer group median and its benchmark for the three-year period ended September 30, 2009. Wanger USA underperformed its peer group medians but outperformed its benchmark over the three-year period. For the five-year period ended September 30, 2009, Wanger Select outperformed its peer group medians and primary benchmark and Wanger USA underperformed its peer group medians but outperformed its benchmark.
With respect to the international Funds, the Trustees considered that Wanger International and Wanger International Select both outperformed their peer group medians and benchmarks for the three year and five-year periods ended September 30, 2009.
The Trustees concluded that, although past performance is not necessarily indicative of future results, the strong overall longer-term performance record of the Funds was an important factor in the evaluation of the expected quality of services to be provided by Columbia WAM under the Proposed Advisory Agreement for each Fund and also supported approval.
Costs of Services and Profits Realized by Columbia WAM. The Trustees noted that Ameriprise and Columbia WAM were not proposing any changes in investment advisory or administration fees or total operating expenses in connection with the Transaction. At various Committee and Board meetings and other informal meetings, the Trustees examined detailed information on the fees and expenses of each Fund in comparison to information for comparable funds provided by Lipper and Morningstar. The Trustees reviewed the observations in the Fee Evaluation relating to the lack of uniformity in the Funds' rankings, and noted that the Funds are assessed by Morningstar and Lipper in relation to peers selected only from the variable annuity universe. As noted in the Fee Evaluation, the actual advisory fees paid by Wanger Select and Wanger International Select were higher than the median advisory fees of each Fund's respective Morningstar and Lipper peer groups and the actual advisory fee paid by the Wanger USA was higher than the median advisory fee of the Fund's Morningstar peer group, but not of its Lipper peer group. The actual advisory fee paid by Wanger International was higher than the median advisory fee of the Fund's Lipper peer group, but not of its Morningstar peer group. Total management fees for one of the four Funds, Wanger International, were lower than its Morningstar peer group median, but none of the Funds had total management fees equal to or lower than its respective Lipper peer group median. The Trustees also considered that the total expenses paid by investors compared to total expenses charged by other peer funds, which they also considered to be a meaningful comparison.
The Trustees reviewed the analysis of the historic profitability of Columbia WAM in serving as each Fund's investment adviser and of Columbia WAM and its affiliates in their relationships with each Fund, as well as an explanation of the methodology utilized in allocating various expenses among the Funds and other business units, each of which was included in the Fee Evaluation. The Trustees considered the current methodology used by Columbia WAM in determining compensation payable to portfolio managers and the competitive market for investment management talent. In addition, the Trustees considered the expected profitability of Columbia WAM related to the Funds following the Transaction; however, they determined that profitability projections at this time were speculative, at best. The Trustees noted that Columbia WAM's profit margins had declined recently, in line with industry trends, as a result of reduced assets under manage ment. Nevertheless, based on limited comparative data, its current margins appeared to be in the upper range of competitors. They discussed how profitability comparisons among fund managers are of limited probative value due to the small number of publicly-owned managers, and that the profitability of any investment manager is affected by numerous factors, including its particular organizational structure, the types of funds and other accounts managed, other lines of business, expense allocation methodology, capital structure and cost of capital.
The Trustees also reviewed the advisory fee rates charged by Columbia WAM for managing other investment companies (including the Columbia Acorn Funds), sub-advised funds and other institutional separate accounts, as detailed in the Fee Evaluation. The Trustees noted that the Columbia Wanger Funds' advisory fees were generally comparable to the Columbia Acorn Funds' advisory fees. Columbia WAM's institutional separate account fees for various investment strategies were also examined; in some cases those fees were higher than the advisory fees charged to the Funds, and in some instances the fees were lower. The Trustees noted that Columbia WAM performs significant additional services for the Funds that it does not provide to sub-advised funds or non-mutual fund clients, including administrative services, oversight of the Funds' other service providers, trustee support, regulatory compliance and numerous other services, and that, i n servicing the Funds, Columbia WAM assumes many legal risks that it does not assume in servicing its non-fund clients.
The Trustees concluded that the rates of advisory fees and other compensation to be payable by the Funds to Columbia WAM and its affiliates were reasonable in relation to the nature and quality of the services to be provided, taking into account the fees charged by other advisers for managing comparable mutual funds with similar strategies and the fees Columbia WAM charges to other clients. The Trustees also concluded that the Funds' estimated overall expense ratios were reasonable, considering the quality of
26
Wanger International Select 2010 Semiannual Report
Board Approval of the Proposed Advisory Agreement
services provided by Columbia WAM and its affiliates and the investment performance of the Funds.
Economies of Scale. At various Committee and Board meetings and other informal meetings, the Trustees considered information about the extent to which Columbia WAM realizes economies of scale in connection with an increase in Fund assets. The Trustees noted that the advisory fee schedule for each Fund includes breakpoints in the rate of fees at various asset levels. The Trustees concluded that the fee structure of each Fund was reasonable and reflective of a sharing between Columbia WAM and the Funds of economies of scale.
Other Benefits to Columbia WAM. The Trustees also reviewed benefits that could be expected to accrue to Columbia WAM and its affiliates from their relationships with the Funds, as outlined in the Fee Evaluation. They noted that, in connection with the Transaction, the Funds' transfer agency agreement would be assigned to RiverSource Service Corporation (now known as Columbia Management Investment Services Corp.), an affiliate of Ameriprise, which would receive compensation from the Funds for services provided. They considered that an affiliate of Ameriprise, RiverSource Funds Distributors, Inc. (now known as Columbia Management Investment Distributors, Inc.), would serve as the new distributor under an underwriting agreement containing substantially the same terms as the Funds' existing underwriting agreement with an affiliate of Columbia WAM. In addi tion, the sub-administration agreement between Columbia WAM and a current affiliate would be transferred to an Ameriprise affiliate. The Trustees also considered other ways that the Funds and Columbia WAM may potentially benefit from their relationship with each other. For example, the Trustees considered Columbia WAM's use of commissions paid by each Fund on its portfolio brokerage transactions to obtain research products and services benefiting the Fund and/or other clients of Columbia WAM and noted that no material changes were being contemplated by Columbia WAM regarding its policies and procedures in respect of soft dollars as a result of the change in ownership of Columbia WAM. They determined that Columbia WAM's use of the Funds' "soft" commission dollars to obtain research products and services was consistent with current regulatory requirements and guidance. They also concluded that Columbia WAM benefits from the receipt of proprietary research products and services acquired through commissions paid on portfolio transactions of the Funds, and that the Funds benefit from Columbia WAM's receipt of those products and services as well as research products and services acquired through commissions paid by other clients of Columbia WAM.
Section 15(f) of the 1940 Act. The Trustees also considered whether the arrangements between Columbia WAM and the Funds comply with the conditions of Section 15(f) of the 1940 Act. Section 15(f) provides a non-exclusive safe harbor under which an investment adviser to an investment company or any of its affiliated persons may receive any amount or benefit in connection with a change in control of the investment adviser provided two conditions are met. First, for a period of three years after closing of the transaction, at least 75% of the board members of the investment company may not be "interested persons" (as defined in the 1940 Act) of the investment adviser or predecessor adviser. Second, an "unfair burden" must not be imposed upon the investment company as a result of the transaction or any express or implied terms, conditions or understandings applicable thereto. The term "unfair burden" is defined in Section 15(f) to include any arrangement during the two-year period after the closing of the transaction whereby the investment adviser (or predecessor or successor adviser) or any interested person of any such investment adviser, receives or is entitled to receive any compensation, directly or indirectly, from the investment company or its shareholders (other than fees for bona fide additional investment advisory or other services) or from any person in connection with the purchase or sale of securities or other property to, from or on behalf of the investment company (other than bona fide ordinary compensation as principal underwriter for the investment company).
In connection with the first condition of Section 15(f), the Trustees concluded that upon closing of the Transaction at least 75% of the Trustees would not be "interested persons" (as defined in the 1940 Act) of the Adviser and would be in compliance with this provision of Section 15(f). With respect to the second condition of Section 15(f), Columbia WAM and Ameriprise represented in writing that no advisory or distribution fee increases were contemplated during the two years following the Transaction. The Trustees also noted that, to the extent future transactions are contemplated and recommended following the Transaction, Columbia WAM and Ameriprise represented that they would not seek any change that would impose an "unfair burden" on the Trust.
After full consideration of the above factors, as well as other factors that were instructive in evaluating the Proposed Advisory Agreement for each Fund, the Trustees, including the Independent Trustees, concluded on February 24, 2010 that the approval of the Proposed Advisory Agreement was in the best interest of each Fund, and they approved the Agreement and recommended that the shareholders of each Fund approve the Agreement for their Fund.
Following the Board's approval of the Proposed Advisory Agreement for each Fund on February 24, 2010, Ameriprise advised the Board that it anticipated that a significant amount of the existing assets of Wanger International and Wanger USA, representing the interests of owners of contracts issued by life insurance companies affiliated with Ameriprise, would be redeemed in spring 2010 (the "Proposed Redemption"). These assets would be reinvested in two RiverSource Funds (the "New Institutional Accounts") that have similar investment objectives and strategies to Wanger International and Wanger USA. The New Institutional Accounts would be sub-advised by Columbia WAM for investment sub-advisory fees that were proposed to be lower than the advisory fees of their Columbia Wanger Fund counterparts. The Board therefore determined that the proposed redemption and the existence of the New Institutional Accounts to be sub-advised by Columbi a WAM warranted another review of the Proposed Advisory Agreement for each Fund and the fees paid thereunder.
The Committees then met in the aggregate on four occasions in March 2010, including once with representatives of Ameriprise, to review and consider the Proposed Redemption and the New Institutional Accounts and the implications of these transactions with respect to their consideration of the Proposed Advisory Agreement for each Fund. In their deliberations, the Trustees received and reviewed a supplement dated April 2010 ("Supplement") to the Fee Evaluation prepared by the Senior Officer, which contained an analysis of both the Proposed Redemption and the potential impact on the remaining shareholders in the Funds. The Supplement also reviewed the fees related to the New Institutional Accounts. The Trustees were also advised by independent counsel at each of these meetings.
With respect to the Proposed Redemption, the Trustees considered that Ameriprise had agreed to a fee cap on the advisory fees of Wanger International and Wanger USA for a period of two years from the redemption date, such that the remaining shareholders in these Funds would not experience any increase in advisory fees as a result of the Proposed Redemption. The Trustees further considered that Ameriprise had also agreed with the Trust to minimize the potential for adverse effects to Wanger International and Wanger USA from any economic harm caused by the redemption proposal by reimbursing for transaction costs related to the Proposed Redemption including brokerage commissions and transfer fees (but not market impact costs).
With respect to the New Institutional Accounts, the Trustees considered information submitted by Ameriprise regarding the sub-advisory fees payable to Columbia WAM for investment advisory services rendered to the accounts. The Trustees also considered that the sub-advisory fees payable were
27
Wanger International Select 2010 Semiannual Report
Board Approval of the Proposed Advisory Agreement
substantially the same as an existing RiverSource Fund account sub-advised by Columbia WAM. The Trustees considered the explanations previously provided by Columbia WAM for the differences in advisory fees paid by the Funds and Columbia WAM's other similar institutional accounts. The Trustees also considered Ameriprise's and Columbia WAM's agreement that they would not agree to, or submit a proposal to, manage new institutional accounts without the express approval of the Board. The Board believed that this provision was necessary in order to protect Columbia WAM's investment capacity and the resulting quality of its investment services with respect to the Funds.
The Trustees also considered the performance of the Funds over various time periods ended December 31, 2009. Wanger USA outperformed its primary benchmark and Morningstar peer group median over the three-year period ended December 31, 2009, but underperformed its Lipper peer group median over that same period. Wanger Select outperformed its Morningstar peer group median over the three-year period, but underperformed its Lipper peer group median and primary benchmark over that same period. Both Wanger International and Wanger International Select outperformed their respective peer groups and primary benchmarks for the three-year period. For the five-year period ended December 31, 2009, each Fund outperformed its primary benchmark.
Taking all of the foregoing factors into account as well as the continued satisfactory performance of the Funds since the last Board meeting and other factors they deemed relevant, the Trustees, including all of the independent Trustees, concluded again on April 6, 2010 that the approval of the Proposed Advisory Agreement was in the best interest of each Fund, and they affirmed the approval of the Agreement and recommended that the shareholders of each Fund approve the Agreement for their Fund.
28
Wanger International Select 2010 Semiannual Report
Proxy Voting Results
On May 27, 2010, a special meeting of shareholders of Wanger Advisors Trust (the "Trust") was held to ask shareholders of each Fund of the Trust to: (1) consider and vote on a proposed Investment Advisory Agreement for the Fund with CWAM, which became a subsidiary of Ameriprise Financial; and (2) elect eleven trustees to the Trust's Board of Trustees (the "Board"). A proxy statement that described the proposals was mailed to shareholders of record as of April 8, 2010.
Proposal 1: A proposed Investment Advisory Agreement with CWAM was approved for the Fund, as follows:
| Fund | | Votes For | | Votes Against | | Abstentions | | Broker Non-Votes* | |
| Wanger International Select | | | 1,561,699 | | | | 30,983 | | | | 24,894 | | | | 0 | | |
* Shares held of record by a financial intermediary, such as a broker or nominee, typically held in "street name," as to which (i) written voting instructions on the matter have not been received from the beneficial owners or persons entitled to vote and (ii) the intermediary does not have discretionary voting power on the matter.
Proposal 2: Each of the trustee nominees was elected to the Board, as follows:
| Fund | | Votes For | | Votes Against | | Abstentions | |
| Laura M. Born | | | 93,621,627 | | | | 4,677,959 | | | | 0 | | |
| Michelle L. Collins | | | 93,862,814 | | | | 4,436,772 | | | | 0 | | |
| Maureen M. Culhane | | | 93,620,353 | | | | 4,679,233 | | | | 0 | | |
| Margaret M. Eisen | | | 93,949,255 | | | | 4,350,330 | | | | 0 | | |
| John C. Heaton | | | 93,852,982 | | | | 4,446,603 | | | | 0 | | |
| Steven N. Kaplan | | | 93,803,548 | | | | 4,496,038 | | | | 0 | | |
| David C. Kleinman | | | 93,545,604 | | | | 4,753,982 | | | | 0 | | |
| Charles P. McQuaid** | | | 93,886,104 | | | | 4,413,482 | | | | 0 | | |
| Allan B. Muchin | | | 93,539,358 | | | | 4,760,228 | | | | 0 | | |
| David B. Small | | | 93,966,760 | | | | 4,332,826 | | | | 0 | | |
| James A. Star | | | 93,923,838 | | | | 4,375,748 | | | | 0 | | |
** Mr. McQuaid is an "interested person" of the Trust and of CWAM because he is an officer of the Trust and of CWAM.
29
Wanger International Select 2010 Semiannual Report
This page intentionally left blank.
30
Wanger International Select 2010 Semiannual Report
This page intentionally left blank.
31
Wanger International Select 2010 Semiannual Report

Columbia Wanger Funds
Trustees
James A. Star
Chairman of the Board
Steven N. Kaplan
Vice Chairman of the Board
Laura M. Born
Michelle L. Collins
Maureen M. Culhane
Margaret M. Eisen
John C. Heaton
David C. Kleinman
Charles P. McQuaid
Allan B. Muchin
David B. Small
Ralph Wanger (Trustee Emeritus)
Officers
Charles P. McQuaid
President
Ben Andrews
Vice President
Michael G. Clarke
Assistant Treasurer
P. Zachary Egan
Vice President
John M. Kunka
Assistant Treasurer
Joseph C. LaPalm
Vice President
Bruce H. Lauer
Vice President, Secretary and Treasurer
Louis J. Mendes III
Vice President
Robert A. Mohn
Vice President
Christopher J. Olson
Vice President
Christopher O. Petersen
Assistant Secretary
Scott R. Plummer
Assistant Secretary
Linda K. Roth-Wiszowaty
Assistant Secretary
Robert P. Scales
Chief Compliance Officer, Chief Legal Officer, Senior Vice President and
General Counsel
Transfer Agent,
Dividend Disbursing Agent*
Columbia Management Investment Services Corp.
P.O.Box 8081
Boston, Massachusetts
02266-8081
Distributor*
Columbia Management Investment Distributors, Inc.
One Financial Center
Boston, Massachusetts
02111-2621
Investment Advisor
Columbia Wanger Asset Management, LLC
227 West Monroe Street, Suite 3000
Chicago, Illinois 60606
1-888-4-WANGER
(1-888-492-6437)
Legal Counsel to the Funds
K&L Gates LLP
Washington, DC
Legal Counsel to the Independent Trustees
Drinker Biddle & Reath LLP
Philadelphia, Pennsylvania
Independent Registered Public Accounting Firm
PricewaterhouseCoopers LLP
Chicago, Illinois
* As of May 1, 2010
This report, including the schedules of investments and financial statements, is submitted for the general information of the shareholders of the Wanger Advisors Trust.
A description of the Fund's proxy voting policies and procedures and a copy of the Fund's voting record for the most recent 12-month period ended June 30 are available (i) on the Securities and Exchange Commission's website at www.sec.gov, and (ii) without charge, upon request, by calling 888-492-6437.
The Fund files a complete schedule of portfolio holdings with the SEC for the first and third quarters of each fiscal year on Form N-Q. The Fund's Form N-Q is available on the SEC's website at www.sec.gov and may be reviewed and copied at the SEC's Public Reference Room in Washington, D.C. Information on the operation of the Pubic Reference Room may be obtained by calling 800-SEC-0330. The Fund's complete portfolio holdings are disclosed at www.columbiafunds.com approximately 30 days after each month end.
32
Columbia Wanger Funds
© 2010 Columbia Management Investment Advisers, LLC. All rights reserved.
C-1455 A (8/10) 103613
Wanger Select
2010 Semiannual Report

Not FDIC insured • No bank guarantee • May lose value

Wanger Select
2010 Semiannual Report
Table of Contents
| | 1 | | | Understanding Your Expenses | |
|
| | 2 | | | The School that Changed the World | |
|
| | 4 | | | Performance Review | |
|
| | 6 | | | Statement of Investments | |
|
| | 11 | | | Statement of Assets and Liabilities | |
|
| | 11 | | | Statement of Operations | |
|
| | 12 | | | Statement of Changes in Net Assets | |
|
| | 13 | | | Financial Highlights | |
|
| | 14 | | | Notes to Financial Statements | |
|
| | 18 | | | Management Fee Evaluation of the Senior Officer | |
|
| | 26 | | | Board Approval of the Proposed Advisory Agreement | |
|
| | 30 | | | Proxy Voting Results | |
|
Columbia Wanger Asset Management, LLC ("CWAM") is one of the leading global small- and mid-cap equity managers in the United States with 40 years of small- and mid-cap investment experience. As of June 30, 2010, CWAM managed $26.1 billion in assets, and is the investment advisor to Wanger USA, Wanger International, Wanger Select and Wanger International Select (together, the "Columbia Wanger Funds") and the Columbia Acorn Family of Funds.
Important Information Regarding the Acquisition of the Long-term Asset Management Business
of Columbia Management Group, LLC
On April 30, 2010, Ameriprise Financial, Inc., ("Ameriprise Financial"), the parent company of RiverSource Investments, LLC, acquired the long-term asset management business of Columbia Management Group, LLC, including certain of its affiliates, which were, prior to this acquisition, part of Bank of America Corporation. In connection with this acquisition, Ameriprise Financial acquired CWAM. CWAM will continue as the investment advisor for the Columbia Acorn and Wanger Funds, and no changes are anticipated in the existing investment management team. Also in connection with this acquisition, Columbia Management Investment Distributors, Inc., member FINRA, became the distributor and principal underwriter of the Funds and Columbia Management Investment Services Corp. became the transfer agent of the Funds.
Investors should consider the investment objectives, risks, charges and expenses of a mutual fund carefully before investing. For a free prospectus, which contains this and other important information about the Fund, contact your financial advisor or insurance company or contact 1-888-4-WANGER.
An important note: Columbia Wanger Funds are sold only to certain life insurance companies in connection with certain variable annuity contracts, variable life insurance policies and eligible qualified retirement plans.
The views expressed in "The School that Changed the World" and in the Performance Review reflect the current views of the respective authors. These views are not guarantees of future performance and involve certain risks, uncertainties and assumptions that are difficult to predict so actual outcomes and results may differ significantly from the views expressed. These views are subject to change at any time based upon economic, market or other conditions and the respective parties disclaim any responsibility to update such views. These views may not be relied on as investment advice and, because investment decisions for a Columbia Wanger Fund are based on numerous factors, may not be relied on as an indication of trading intent on behalf of any particular Columbia Wanger Fund. References to specific company securities should not be construed as a recommendation or investment advice.
Wanger Select 2010 Semiannual Report

Understanding Your Expenses
As a Fund shareholder, you incur three types of costs. There are transaction costs, which generally include sales charges on purchases and may include redemption or exchange fees. There are also ongoing costs, which generally include investment advisory fees and other Fund expenses. Lastly, there may be additional fees or charges imposed by the insurance company that sponsors your variable annuity product. The information on this page is intended to help you understand your ongoing costs of investing in the Fund and to compare these costs with the ongoing costs of investing in other mutual funds.
Analyzing your Fund's expenses
To illustrate these ongoing costs, we have provided an example and calculated the expenses paid by investors in the Fund during the period. The information in the following table is based on an initial hypothetical investment of $1,000, which is invested at the beginning of the period and held for the entire period. Expense information is calculated two ways and each method provides you with different results. The amount listed in the "Actual" column is calculated using actual operating expenses and total return for the Fund. The amount listed in the "Hypothetical" column assumes that the return each year is 5% before expenses and then applies the Fund's actual expense ratio for the period to the hypothetical return. You should not use the hypothetical account values and expenses to estimate either your actual account balance at the end of the period or the expenses you paid during the period. See "Compare with other funds" for details on using the hypothetical data.
Estimating your actual expenses
To estimate the expenses that you actually paid over the period, first you will need your account balance at the end of the period.
1. Divide your ending account balance by $1,000. For example, if an account balance was $8,600 at the end of the period, the result would be 8.6.
2. In the section of the table below titled "Expenses paid during the period," you will find a dollar amount in the column labeled "Actual." Multiply this amount by the result from step 1. Your answer is an estimate of the expenses you paid on your account during the period.
January 1, 2010 – June 30, 2010
| | | Account value at the
beginning of the period ($) | | Account value at the
end of the period ($) | | Expenses paid
during the period ($) | | Fund's annualized
expense ratio (%)* | |
| | | Actual | | Hypothetical | | Actual | | Hypothetical | | Actual | | Hypothetical | | Actual | |
| Wanger Select | | | 1,000.00 | | | | 1,000.00 | | | | 954.80 | | | | 1,020.23 | | | | 4.46 | | | | 4.61 | | | | 0.92 | | |
*For the six months ended June 30, 2010.
Expenses paid during the period are equal to the Fund's annualized expense ratio, multiplied by the average account value over the period, then multiplied by the number of days in the Fund's most recent fiscal half-year and divided by 365.
It is important to note that the expense amounts shown in the table are meant to highlight only ongoing costs of investing in the Fund. Expenses paid during the period do not include any insurance charges imposed by your insurance company's separate account. The hypothetical example provided is useful in comparing ongoing costs only and will not help you determine the relative total costs of owning different funds whose shareholders may incur transaction costs.
Compare with other funds
Since all mutual funds are required to include the same hypothetical calculations about expenses in shareholder reports, you can use this information to compare the ongoing cost of investing in the Fund with other funds. To do so, compare the 5% hypothetical example with the 5% hypothetical examples of other funds. As you compare hypothetical examples of other funds, it is important to note that hypothetical examples are meant to highlight the ongoing cost of investing in a fund and do not reflect any transaction costs, such as sales charges, redemption fees or exchange fees that may be incurred by shareholders of other funds. Expenses paid during the period do not include any insurance charges imposed by your insurance company's separate accounts.
1
Wanger Select 2010 Semiannual Report

The School that Changed the World
Chicago is known for a lot of things. Yes, this city's ability to stuff ballot boxes and pizzas is legendary, but the number of Nobel Prize winners who have hailed from the University of Chicago is one of Chicago's greatest distinctions. The University's faculty, students and researchers have been awarded 85 Nobel Prizes across all fields, nearly as many as first-place Cambridge University, which has 87.
The University of Chicago holds nearly a 40% share of the Nobel Prizes awarded in economics to date. The great thinkers who received these awards, and those who influenced them, helped trigger a world-wide shift towards capitalism, resulting in enhanced prosperity and freedom around the globe. These are the men and women of the "Chicago School."
The Chicago School
Between the Great Depression and the 1970s, many in government and academia believed that increasingly centralized economic planning was inevitable. Much of the world was subjected to communism, socialism, or other sorts of command economies. Government in the United States grew rapidly during this period, as did regulation of businesses. During this time, William F. Buckley was not the only one who stood athwart history and yelled, "Stop!"
Starting in the 1950s, references to a "Chicago School" began to appear, referring to the economists, business researchers, lawyers and sociologists from the University of Chicago who disagreed with the "more government" thinking of the time. In the first written reference to the Chicago School, found in a handbook on the history of economic thought, members of the Chicago School were described as follows:
Libertarians all, they preferred rules to authorities and the impersonal forces of the market to their deliberate direction, and they viewed with alarm the increasing scope of governmental activities in the economic sphere.1
Frank Knight and Jacob Viner are considered founders of the Chicago School. Knight set a tone; he was intellectually rigorous, devoted to knowledge, skeptical of authority and cynical of planned economies. Knight believed capitalism was the only acceptable system by default, as other systems were worse. Viner was a terror to his students in the classroom but otherwise very helpful; he elevated neoclassical price theory2 into a core element for economics education at U. of C. Both men personally taught Nobel winners, but became ineligible for Nobel prizes upon their deaths soon after the economics award was first presented in 1969.
In his book titled, The Chicago School,3 Johan Van Overtveldt lists five characteristics that he believes underpin the success of this influential group. First, a strong work ethic. Locally, U. of C. is known as the university "where fun goes to die." But for some people, interesting work appears to be fun.
Next, economics is treated as a true science. Theories are tested and, unless backed by evidence, are disregarded.
Third, academic excellence is the sole criterion for advancement. Although the school is known for free-market advocacy, it attracts and cultivates fiercely independent thinkers with divergent views; some U. of C. professors, in contrast, have attacked elements of the capitalistic system.
Fourth, the Chicago School has a strong debating culture. Economic theories are critiqued by interdisciplinary workshops, often attended by professors of business, law and sociology to name a few. (Many of the University of Chicago's Nobel winners in economics have been associated with its business and law schools.) Work is subject to an intense, critical review process and heated debates are common.
Fifth, the University of Chicago is relatively isolated. Located on the shore of Lake Michigan and otherwise surrounded by tough neighborhoods, U. of C. tends to have many faculty members who live in its enclave, allowing academic discussions to extend well beyond classrooms.
Chicago School Economists and Their Work
Milton Friedman was a student of Knight and Viner and, in 1946, he accepted an offer to teach economics at the University of Chicago (a position opened by Viner's departure). Friedman taught at the University of Chicago for the next 30 years. His research centered on monetary theory and consumption analysis. He documented how a one-third cut in the money supply turned what could have been a normal recession into the Great Depression. Although Friedman was skeptical of government and endorsed steady growth in the money supply, his theories induced policymakers to ease credit during the dot.com bust and the more recent housing bubble. Though tremendous wealth was lost during both events, economic depressions were avoided, likely due to the monetary ease.
Friedman is perhaps best known for his influence on public policy. Like many other Chicago economists, he believed in free markets and minimal government interference in the economy. Unlike others, he popularized those notions.
Friedman believed that competition was morally superior to government control, as consumers and producers are free to choose in a capitalistic system, but are often coerced in other systems.4 He and other Chicago economists went so far as to advocate no regulations of some monopolies, stating that monopolies tend to be temporary and regulators often cause long-lasting inefficiencies and politically inspired anomalies.
Friedman was often criticized for his policy recommendations, and some of the criticisms, in hindsight, now appear laughable. One such article, published in the 1970s, attacked Friedman on the grounds that competition was imperfect and firms like General Motors and IBM had considerable market power and stifled competition. It's now safe to say that Friedman was right, as competition and technological change reduce market power over time. In 1976,
2
Wanger Select 2010 Semiannual Report
Friedman won the Nobel Prize in Economics "for his achievements in the fields of consumption analysis, monetary history and theory, and for his demonstration of the complexity of stabilization policy."
Economist Theodore Schultz analyzed agricultural policies first at Iowa State, but his work was attacked by Iowa's powerful dairy lobby. He joined the University of Chicago faculty in 1944, continuing his work. He concluded that 30% to 40% of farm productivity gains in the United States were driven by increasing the skills of farmers and investing in "human capital." Chicago School economist D. Gale Johnson was greatly inspired by Schultz's work. He also joined the University of Chicago in 1944 and the two worked together for nearly 50 years. Johnson analyzed Soviet agriculture and correctly predicted that subsidies and price distortions would destabilize the entire Soviet economy. Schultz received a Nobel Prize in Economics in 1979 for his pioneering research in economic development and the problems of developing countries.
Gary Becker analyzed many curious phenomena, such as crime and punishment (deterrents matter), addiction, families and marriage, and perhaps most important, he pursued analysis of human capital. He concluded that investments in education, training and health care are crucial and can be analyzed like other investments. Becker and other Chicago School economists concluded that investment in human capital was the leading driver of economic growth. He won the Nobel Prize in Economics in 1992 "for having extended the domain of microeconomic analysis to a wide range of human behavior and interaction, including non-market behavior."
Many of the innovations in finance and financial markets have been driven by other Chicago School economists. Modern portfolio theory, efficient markets and behavioral finance have been noteworthy accomplishments. The Chicago School's option pricing models have spurred growth of trading of stock and currency options, which enable entities to reduce or assume risks.
Numerous public policies have been impacted by Chicago School research. Radio spectrum, water rights and energy leases are now often auctioned rather than awarded by regulators' opinions on "merit." Price controls, which caused America's energy shortages in the 1970s, have been repudiated. Many industries have been deregulated.
The Chicago School provided the intellectual underpinnings for Reagan's and Thatcher's economic policies,5 which reduced inflation, reinvigorated the free world and contributed to the collapse of communism. Chicago School economists provided advice that enabled third world and ex-communist countries to grow, lifting hundreds of millions of people out of poverty.
Chicago School analytical efforts have gone far beyond traditional economic topics. Economist Steven Levitt's best-selling book, Freakonomics,6 covers the economic side of lots of items, including street gangs selling crack cocaine. It turns out that from an economic standpoint, street gangs tend to be set up like large corporate franchise operations. Corner drug dealers tend to earn little money, but have room for advancement (should they not be in jail or get killed).7 Levit t covers other topics including cheating by schoolteachers and sumo wrestlers, as well as choices of names for babies.
The near-meltdown of the worldwide financial system has caused many to question deregulation and free market capitalism. It appears that public policy errors, ineffective regulation, and serious mistakes by both private sector and government entities all had a role in the crisis. Clearly there is plenty of room for improvement, and sound economic analysis is needed to facilitate new government policies and private sector practices.
The world clearly operates in an economic framework. Our investments for the Columbia Wanger Funds are driven by our evaluations of the underlying economics of the companies in which we invest. We pursue investments in businesses that we believe are strong, have competitive advantages and that are reasonably valued.


Charles P. McQuaid
President and Chief Investment Officer
Columbia Wanger Asset Management, LLC
Opinions expressed in this essay are those of the author and are not necessarily those of Columbia Wanger Asset Management, its parent organizations, or the Wanger Advisors Trust Board. These views are not guarantees of future performance and involve certain risks, uncertainties and assumptions that are difficult to predict so actual outcomes and results may differ significantly from the views expressed. These views are subject to change at any time based upon economic, market or other conditions and the respective parties disclaim any responsibility to update such views. These views may not be relied on as investment advice and, because investment decisions for a Columbia Wanger Fund are based on numerous factors, may not be relied on as an indication of trading intent on behalf of any particular Columbia Wanger Fund.
1 Overtveldt, Johan Van, The Chicago School (Chicago, Agate Publishing, 2007), pg. 6.
2 Neoclassical price theory uses mathematics to make conclusions about how the economy will behave if the price of goods, services, or behaviors increases.
3 Overtveldt, Johan Van, op. cit., pg. 11.
4 Friedman, Milton and Rose, Free to Choose (New York, Harcourt Brace Jovanovich, Inc., 1980).
5 Chicago School economists had differing opinions about elements of the policies. George Stigler, also a Nobel Prize winner affiliated with the Chicago School, labelled the supply-side program as something between a "gimmick and a slogan."
6 Levitt, Steven D., and Dubner, Stephen J., Freakonomics (New York, HarperCollins Publishers, Inc., 2005).
7 For additional information, see Sudhir Venkatesh's, Gang Leader for a Day, Penguin Press, 2008. Venkatesh was the University of Chicago sociology student whose data was utilized by Levitt.
3
Wanger Select 2010 Semiannual Report

Performance Review Wanger Select

Ben Andrews
Portfolio Manager
Performance data quoted represents past performance and current performance may be lower or higher. Past performance is no guarantee of future results. The investment return and principal value will fluctuate so that shares, when redeemed, may be worth more or less than the original cost. For daily and most recent month-end performance updates, please call 1-888-4-WANGER.
Wanger Select lost 4.52% in the first half of 2010, while its primary benchmark, the S&P MidCap 400 Index, dropped 1.36%. The large-cap S&P 500 Index had a 6.65% decline during the same period. The market sold off considerably in the second half of the period as fears that the U.S. economy is going back into recession grew.
Two energy names, Pacific Rubiales Energy and Canacol Energy, added 3.6% of return to our portfolio during the semiannual period. Both companies continue to have success finding oil in Colombia. SkillSoft, a provider of web-based learning tools, was acquired by a group of private investors during the period and contributed 0.3% to the portfolio. On the downside, the names were numerous, but Canadian Solar (CSIQ, a solar cell and module manufacturer) cost the Fund 2.0% of total portfolio performance year to date. CSIQ lost ground due to falling solar cell prices and fears that Germany's subsidy cut to the solar industry would hurt demand for new solar installation. Teen apparel retailer Abercrombie & Fitch and ITT Educational Services (ESI) cost the Fund 0.3% and 0.4%, respectively, of portfolio performance during the semiannual period. The latter fell hard on proposed government regulation that could impact providers of post - -secondary degree programs like ITT Educational Services. We trimmed ESI's position size in the portfolio in anticipation of the government attacking this industry, but we still own the company because we strongly believe that it educates a portion of American students that traditional not-for-profit colleges largely ignore.
We did use the market weakness to invest some of the Fund's cash into companies that we felt were oversold and that show growth potential in a sluggish economy. The Fund's cash level at the end of the period was 4.8%. During the semiannual period, we sold out of eight names and added 13 new companies to the portfolio.
According to a U.S. Treasury Department report that was recently released, the U.S. is estimated to run a $1.6 trillion dollar budget deficit this year alone. This will be greater than 10.5% of the country's gross domestic product (GDP) for the year, a mind boggling number. If GDP is down 3% in a year, that would cause a really rough recession, but if all the deficit spending was withdrawn in the next year, thus a minus 10% economy, well, heaven help us. As I see it, over the next several years the U.S. has to reduce this deficit spending while increasing employment to get the country heading toward a sound footing. If not, I believe we may run into a nasty currency crisis. Executing on this strategy will not be an easy task. If the deficit spending is withdrawn too fast, I believe the country could go into recession. But, allowing a budget deficit this big for too long is likely to cause pain to this generation and the next thr ough inflation and/or massive tax increases. Getting unemployment down when the country is already deficit spending like crazy is going to be tricky. I think it needs to start with less government legislation and regulation, which has been keeping our businesses from adding employees until they can understand what is happening in their industries. Uncertainty is a killer in any capital market.
I'm not looking for the next couple of years to be easy, but I never do. Our Fund's portfolio will remain focused on businesses that we feel can grow in a soft economy.
Risks include stock market fluctuations due to economic and business developments. The Fund also has potentially greater price volatility due to the Fund's concentration in a limited number of stocks of mid-size companies. The Fund is a non-diversified fund and may, therefore, have a greater risk of loss from a few issuers than a similar fund that invests more broadly. The Fund may not operate as a non-diversified fund at all times. International investments involve greater potential risks, including less regulation, currency fluctuations, economic instability and political developments.
Opinions expressed are those of the author and are not necessarily those of the Advisor, its parent organizations, or the trustees of Wanger Advisors Trust.
Portfolio holdings are subject to change periodically and may not be representative of current holdings.
Fund's Positions in Mentioned Holdings
As a percentage of net assets, as of 6/30/10
| Pacific Rubiales Energy | | | 7.0 | % | |
| Canacol Energy | | | 5.2 | | |
| ITT Educational Services | | | 3.9 | | |
| Abercrombie & Fitch | | | 2.7 | | |
| Canadian Solar | | | 1.6 | | |
4
Wanger Select 2010 Semiannual Report
Growth of a $10,000 Investment in Wanger Select
February 1, 1999 (inception date) through June 30, 2010
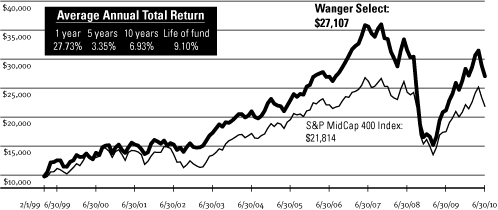
Performance data quoted represents past performance and current performance may be lower or higher. Past performance is no guarantee of future results. The investment return and principal value will fluctuate so that shares, when redeemed, may be worth more or less than the original cost. Performance results may reflect any fee waivers or reimbursements of Fund expenses by the investment advisor and/or any of its affiliates. Absent these fee waivers or expense reimbursement arrangements, performance results would have been lower. For daily and most recent month-end performance updates, please call 1-888-4-WANGER.
This graph compares the results of $10,000 invested in Wanger Select on February 1, 1999 (the date the Fund began operations) through June 30, 2010, to the S&P MidCap 400 Index, with dividends and capital gains reinvested. Although the index is provided for use in assessing the Fund's performance, the Fund's holdings may differ significantly from those in the index.
Top 10 Holdings
As a percentage of net assets, as of 6/30/10
1. Pacific Rubiales Energy (Colombia)
Oil Production & Exploration in Colombia | | | 7.0 | % | |
2. Canacol Energy (Colombia)
Oil Producer in South America | | | 5.2 | | |
3. Sanmina-SCI
Electronic Manufacturing Services | | | 4.6 | | |
4. Hertz
Largest U.S. Rental Car Operator | | | 4.3 | | |
5. Safeway
Supermarkets | | | 4.0 | | |
6. ITT Educational Services
Post-secondary Degree Services | | | 3.9 | | |
7. CNO Financial Group
Life, Long-term Care & Medical Supplement Insurance | | | 3.3 | | |
8. Crown Castle International
Communications Towers | | | 3.1 | | |
9. Abercrombie & Fitch
Teen Apparel Retailer | | | 2.7 | | |
10. WNS-ADR (India)
Offshore BPO (Business Process Outsourcing) Services | | | 2.6 | | |
Top 5 Industries
As a percentage of net assets, as of 6/30/10
| Consumer Goods & Services | | | 26.2 | % | |
| Energy & Minerals | | | 21.4 | | |
| Information | | | 20.9 | | |
| Finance | | | 11.0 | | |
| Industrial Goods & Services | | | 10.2 | | |
Results as of June 30, 2010
| | | 2nd quarter | | Year to date | | 1 year | | 5 years | | 10 years | |
| Wanger Select | | | -11.79 | % | | | -4.52 | % | | | 27.73 | % | | | 3.35 | % | | | 6.93 | % | |
S&P MidCap 400
Index* | | | -9.59 | | | | -1.36 | | | | 24.93 | | | | 2.21 | | | | 5.31 | | |
| S&P 500 Index | | | -11.43 | | | | -6.65 | | | | 14.43 | | | | -0.79 | | | | -1.59 | | |
Lipper Variable
Underlying
Mid-Cap Growth
Funds Index | | | -9.03 | | | | -2.34 | | | | 22.77 | | | | 2.26 | | | | -2.65 | | |
NAV as of 6/30/10: $21.87
* The Fund's primary benchmark.
Performance numbers reflect all Fund expenses but do not include any insurance charge imposed by your insurance company's separate accounts. If performance included the effect of these additional charges, it would be lower.
The Fund's annual operating expense ratio is 0.95%. The annual operating expense ratio is as stated in the Fund's prospectus that is current as of the date of this report. Differences in expense ratios disclosed elsewhere in this report may result from including fee waivers and reimbursements, if any, as well as different time periods used in calculating the ratios.
All results shown assume reinvestment of distributions and do not reflect taxes that a shareholder would pay on Fund distributions or the sale of Fund shares.
The S&P MidCap 400 Index is a market value-weighted index that tracks the performance of 400 mid-cap U.S. companies. The S&P 500 tracks the performance of 500 widely-held large capitalization U.S. stocks. Although the Fund typically invests in companies under $20 billion at the time of investment, the comparison to the S&P 500 Index is presented to show performance against a widely recognized market index. The Lipper Variable Underlying Mid-Cap Growth Funds Index is an equally weighted representation of the 30 largest variable insurance underlying funds in the Lipper Variable Underlying Mid-Cap Growth Funds classification. Indexes are not managed and do not incur fees or expenses. It is not possible to invest directly in an index.
Lipper Inc., a widely respected data provider in the industry, calculates an average total return (assuming reinvestment of distributions) for mutual funds with investment objectives similar to those of the Fund. Lipper makes no adjustment for the effect of sales loads.
Portfolio characteristics and holdings are subject to change periodically and may not be representative of current characteristics and holdings.
5
Wanger Select 2010 Semiannual Report
Wanger Select
Statement of Investments (Unaudited), June 30, 2010
Number of
Shares | | | | Value | |
| | | Equities – 95.3% | |
| | | Consumer Goods & Services – 26.2% | |
| | | Retail – 8.1% | |
| | 534,000 | | | Safeway
Supermarkets | | $ | 10,498,440 | | |
| | 232,000 | | | Abercrombie & Fitch
Teen Apparel Retailer | | | 7,120,080 | | |
| | 46,850 | | | lululemon athletica (a)
Premium Active Apparel Retailer | | | 1,743,757 | | |
| | 342,000 | | | Wet Seal (a)
Specialty Apparel Retailer | | | 1,248,300 | | |
| | 8,200 | | | Tractor Supply Company
Rural America Retailer | | | 499,954 | | |
| | | | 21,110,531 | | |
| | | Travel – 6.9% | |
| | 1,194,400 | | | Hertz (a)
Largest U.S. Rental Car Operator | | | 11,299,024 | | |
| | 351,000 | | | Expedia
Online Travel Services Company | | | 6,591,780 | | |
| | | | 17,890,804 | | |
| | | Educational Services – 5.9% | |
| | 121,000 | | | ITT Educational Services (a)
Post-secondary Degree Services | | | 10,045,420 | | |
| | 224,900 | | | Career Education (a)
Post-secondary Education | | | 5,177,198 | | |
| | | | 15,222,618 | | |
| | | Apparel – 2.2% | |
| | 160,000 | | | Coach
Designer & Retailer of Branded Leather Accessories | | | 5,848,000 | | |
| | | Casinos & Gaming – 1.6% | |
| | 45,600,000 | | | RexLot Holdings (China)
Lottery Equipment Supplier in China | | | 4,161,014 | | |
| | | Other Consumer Services – 0.6% | |
| | 299,950 | | | IFM Investments (Century 21 China RE) –
ADR (China) (a)
Provides Real Estate Services in China | | | 1,568,738 | | |
| | | Leisure Products – 0.5% | |
| | 56,200 | | | Thor Industries
RV & Bus Manufacturer | | | 1,334,750 | | |
Number of
Shares | | | | Value | |
| | | Food & Beverage – 0.4% | |
| | 120,900 | | | GLG Life Tech (Canada) (a)
Produce an All-natural Sweetener
Extracted from the Stevia Plant | | $ | 922,467 | | |
| | 2,279,000 | | | Fu Ji Food & Catering
Services (China) (a)(b)
Food Catering Service Provider in China | | | 23,414 | | |
| | | | 945,881 | | |
| | | | | Total Consumer Goods & Services | | | 68,082,336 | | |
| | | Energy & Minerals – 21.4% | |
| | | Oil & Gas Producers – 15.4% | |
| | 16,460,000 | | | Canacol Energy (Colombia) (a)(c)
Oil Producer in South America | | | 13,637,424 | | |
| | 430,500 | | | Pacific Rubiales Energy (Colombia) (a)(c) | | | 9,600,649 | | |
| | 381,166 | | | Pacific Rubiales Energy (Colombia) (a)
Oil Production & Exploration in Colombia | | | 8,543,160 | | |
| | 148,000 | | | Houston American Energy (d)
Oil & Gas Exploration/Production in Colombia | | | 1,459,280 | | |
| | 5,714,000 | | | Petrodorado (Colombia) (a)(c) | | | 1,367,646 | | |
| | 5,714,000 | | | Petrodorado – Warrants (Colombia) (a)(c)
Oil & Gas Exploration & Production in
Colombia, Peru & Paraguay | | | 536,753 | | |
| | 256,000 | | | Gran Tierra Energy (Colombia) (a)
Oil Exploration & Production in Colombia,
Peru & Argentina | | | 1,286,553 | | |
| | 3,450,000 | | | ShaMaran Petroleum (Iraq) (a)(c) | | | 1,270,396 | | |
| | 1,196,900 | | | ShaMaran Petroleum (Iraq) (a)
Oil Exploration in Kurdistan | | | 449,730 | | |
| | 2,218,500 | | | Petroamerica (Colombia) (a)
Oil Exploration & Production in Colombia | | | 666,873 | | |
| | 1,875,000 | | | Petromanas (Canada) (a)(c) | | | 486,121 | | |
| | 700,000 | | | Petromanas (Canada) (a) | | | 197,267 | | |
| | 937,500 | | | Petromanas – Warrants (Canada) (a)(c)
Exploring for Oil in Albania | | | 35,226 | | |
| | 1,207,000 | | | Alange Energy (Colombia) (a)
Oil & Gas Exploration/Production in Colombia | | | 396,834 | | |
| | | | 39,933,912 | | |
See accompanying notes to financial statements.
6
Wanger Select 2010 Semiannual Report
Wanger Select
Statement of Investments (Unaudited), June 30, 2010
Number of
Shares | | | | Value | |
| | | Oil Services – 3.1% | |
| | 547,100 | | | Tetra Technologies (a)
U.S.-based Services Company with Life of Field Approach | | $ | 4,967,668 | | |
| | 3,004,800 | | | Tuscany International Drilling
(Colombia) (a)(c) | | | 3,042,764 | | |
| | 500,000 | | | Tuscany International Drilling –
Warrants (Colombia) (a)(c)
South America-based Drilling Rig Contractor | | | 13,527 | | |
| | | | 8,023,959 | | |
| | | Alternative Energy – 2.1% | |
| | 435,600 | | | Canadian Solar (China) (a)
Solar Cell & Module Manufacturer | | | 4,260,168 | | |
| | 532,700 | | | Synthesis Energy Systems (China) (a)
Owner/Operator of Gasification Plants | | | 585,970 | | |
| | 179,900 | | | Real Goods Solar (a)
Residential Solar Energy Installer | | | 568,484 | | |
| | | | 5,414,622 | | |
| | | Agricultural Commodities – 0.8% | |
| | 5,000,000 | | | Eacom Timber – Subscription Receipts
(Canada) (a)(c) | | | 2,141,750 | | |
| | 162,000 | | | Eacom Timber (Canada) (a)
Canadian Lumber Producer | | | 86,741 | | |
| | | | 2,228,491 | | |
| | | | | Total Energy & Minerals | | | 55,600,984 | | |
| | | Information – 20.9% | |
| | | Mobile Communications – 7.3% | |
| | 218,000 | | | Crown Castle International (a)
Communications Towers | | | 8,122,680 | | |
| | 127,000 | | | American Tower (a)
Communications Towers in USA &
Latin America | | | 5,651,500 | | |
| | 1,884,100 | | | Globalstar (a)
Satellite Mobile Voice & Data Carrier | | | 2,901,514 | | |
| | 71,000 | | | SBA Communications (a)
Communications Towers | | | 2,414,710 | | |
| | | | 19,090,404 | | |
| | | Contract Manufacturing – 4.6% | |
| | 875,833 | | | Sanmina-SCI (a)
Electronic Manufacturing Services | | | 11,920,087 | | |
Number of
Shares | | | | Value | |
| | | Computer Services – 2.7% | |
| | 566,700 | | | WNS – ADR (India) (a)
Offshore BPO (Business Process Outsourcing) Services | | $ | 6,653,058 | | |
| | 131,500 | | | Hackett Group (a)
IT Integration & Best Practice Research | | | 369,515 | | |
| | | | 7,022,573 | | |
| | | Business Software – 2.2% | |
| | 984,000 | | | Novell (a)
Directory, Operating System & Identity
Management Software | | | 5,589,120 | | |
| | | Computer Hardware & Related Equipment – 1.6% | |
| | 105,500 | | | Amphenol
Electronic Connectors | | | 4,144,040 | | |
| | | Financial Processors – 1.5% | |
| | 295,000 | | | CardTronics (a)
Operates the World's Largest Network of ATMs | | | 3,823,200 | | |
| | | Instrumentation – 0.6% | |
| | 14,500 | | | Mettler Toledo (a)
Laboratory Equipment | | | 1,618,635 | | |
| | | Advertising – 0.4% | |
| | 337,500 | | | VisionChina Media – ADR (China) (a)(d)
Advertising on Digital Screens in China's
Mass Transit System | | | 1,012,500 | | |
| | | | | Total Information | | | 54,220,559 | | |
| | | Finance – 11.0% | |
| | | Brokerage & Money Management – 5.2% | |
| | 914,000 | | | MF Global (a)
Futures Broker | | | 5,218,940 | | |
| | 183,000 | | | Eaton Vance
Specialty Mutual Funds | | | 5,052,630 | | |
| | 155,000 | | | SEI Investments
Mutual Fund Administration & Investment Management | | | 3,155,800 | | |
| | | | 13,427,370 | | |
| | | Insurance – 3.3% | |
| | 1,751,000 | | | CNO Financial Group (a)
Life, Long-term Care & Medical Supplement
Insurance | | | 8,667,450 | | |
| | | Credit Cards – 2.5% | |
| | 467,200 | | | Discover Financial Services
Credit Card Company | | | 6,531,456 | | |
| | | | | Total Finance | | | 28,626,276 | | |
See accompanying notes to financial statements.
7
Wanger Select 2010 Semiannual Report
Wanger Select
Statement of Investments (Unaudited), June 30, 2010
Number of
Shares | | | | Value | |
| | | Industrial Goods & Services – 10.2% | |
| | | Waste Management – 2.5% | |
| | 211,000 | | | Waste Management
U.S. Garbage Collection & Disposal | | $ | 6,602,190 | | |
| | | Machinery – 2.4% | |
| | 155,000 | | | Ametek
Aerospace/Industrial Instruments | | | 6,223,250 | | |
| | | Outsourcing Services – 2.1% | |
| | 260,000 | | | Quanta Services (a)
Electrical & Telecom Construction Services | | | 5,369,000 | | |
| | | Industrial Materials & Specialty Chemicals – 1.6% | |
| | 141,000 | | | Nalco Holding Company
Provider of Water Treatment & Process
Chemicals & Services | | | 2,884,860 | | |
| | 184,600 | | | ChemSpec International – ADR (China)
Specialty Chemicals with Focus on
Fluorinated Chemical Manufacturing | | | 1,330,966 | | |
| | | | 4,215,826 | | |
| | | Other Industrial Services – 1.1% | |
| | 84,500 | | | Expeditors International of Washington
International Freight Forwarder | | | 2,916,095 | | |
| | | Industrial Distribution – 0.5% | |
| | 13,000 | | | WW Grainger
Industrial Distribution | | | 1,292,850 | | |
| | | | | Total Industrial Goods & Services | | | 26,619,211 | | |
| | | Other Industries – 5.2% | |
| | | Transportation – 3.7% | |
| | 183,000 | | | JB Hunt Transport Services
Truck & Intermodal Carrier | | | 5,978,610 | | |
| | 156,000 | | | American Commercial Lines (a)
Operator of Inland Barges/Builder of Barges & Vessels | | | 3,511,560 | | |
| | | | 9,490,170 | | |
| | | Real Estate – 1.0% | |
| | 168,500 | | | BioMed Realty Trust
Life Science-focused Office Buildings | | | 2,711,165 | | |
| | | Regulated Utilities – 0.5% | |
| | 27,500 | | | Wisconsin Energy
Wisconsin Utility | | | 1,395,350 | | |
| | | | | Total Other Industries | | | 13,596,685 | | |
Number of Shares
or Principal Amount | | | | Value | |
| | | Health Care – 0.4% | |
| | | Biotechnology & Drug Delivery – 0.4% | |
| | 174,100 | | | NPS Pharmaceuticals (a)
Orphan Drugs & Healthy Royalties | | $ | 1,121,204 | | |
| | | | | Total Health Care | | | 1,121,204 | | |
| Total Equities: (Cost: $219,181,863) – 95.3% | | | 247,867,255 | | |
| Securities Lending Collateral – 0.1% | | | |
| | 190,975 | | | Dreyfus Government Cash Management
Fund (e)
(7 day yield of 0.03%) | | | 190,975 | | |
| Total Securities Lending Collateral (Cost: $190,975) | | | 190,975 | | |
| Short-Term Obligations – 7.5% | | | |
| | | Repurchase Agreement – 7.0% | |
| $ | 18,193,000 | | | Repurchase Agreement with Fixed
Income Clearing Corp., dated 6/30/10,
due 7/01/10 at 0.00%, collateralized by
a U.S. Government Agency obligation,
maturing 8/25/14, market value
$18,561,806 (repurchase proceeds
$18,193,000) | | | 18,193,000 | | |
| | | Commercial Paper – 0.5% | |
| | 1,300,000 | | | Toyota Motor Credit
0.27% due 7/02/10 | | | 1,299,990 | | |
Total Short-Term Obligations
(Amortized Cost: $19,492,990) | | | 19,492,990 | | |
| Total Investments (Cost: $238,865,828) – 102.9% (f)(g) | | | 267,551,220 | | |
Obligation to Return Collateral for Securities
Loaned – (0.1)% | | | (190,975 | ) | |
| Cash and Other Assets Less Liabilities – (2.8)% | | | (7,358,179 | ) | |
| Total Net Assets – 100.0% | | $ | 260,002,066 | | |
Notes to Statement of Investments:
(a) Non-income producing security.
(b) Illiquid Security.
(c) Denotes a restricted security, which is subject to restrictions on resale under federal securities laws. These securities are valued at a fair value determined in good faith under consistently applied
See accompanying notes to financial statements.
8
Wanger Select 2010 Semiannual Report
Wanger Select
Statement of Investments (Unaudited), June 30, 2010
procedures established by the Board of Trustees. At June 30, 2010, the market value of these securities amounted to $32,132,256 which represented 12.36% of total net assets.
Additional information on these securities is as follows:
Security | | Acquisition
Dates | | Shares | | Cost | | Value | |
| Canacol Energy | | 9/23/09 | | | 16,460,000 | | | $ | 4,287,256 | | | $ | 13,637,424 | | |
| Pacific Rubiales Energy | | 7/12/07 | | | 430,500 | | | | 1,728,466 | | | | 9,600,649 | | |
Tuscany International
Drilling | | 2/12/10-
3/23/10 | | | 3,004,800 | | | | 3,442,850 | | | | 3,042,764 | | |
Tuscany International
Drilling – Warrants | | 2/12/10 | | | 500,000 | | | | 61,950 | | | | 13,527 | | |
Eacom Timber –
Subscription Receipts | | 3/17/10 | | | 5,000,000 | | | | 2,475,248 | | | | 2,141,750 | | |
| Petrodorado | | 11/20/09 | | | 5,714,000 | | | | 1,202,115 | | | | 1,367,646 | | |
| Petrodorado – Warrants | | 11/20/09 | | | 5,714,000 | | | | 706,004 | | | | 536,753 | | |
| ShaMaran Petroleum | | 9/15/09 | | | 3,450,000 | | | | 2,414,839 | | | | 1,270,396 | | |
| Petromanas | | 5/20/10 | | | 1,875,000 | | | | 651,600 | | | | 486,121 | | |
| Petromanas – Warrants | | 5/20/10 | | | 937,500 | | | | 54,282 | | | | 35,226 | | |
| | | | | | | | | $ | 17,024,610 | | | $ | 32,132,256 | | |
(d) All or a portion of this security was on loan at June 30, 2010. The total market value of Fund securities on loan at June 30, 2010 was $182,660.
(e) Investment made with cash collateral received from securities lending activity.
(f) On June 30, 2010, the market value of foreign securities represents 17.3% of total net assets. The Fund's foreign portfolio was diversified as follows:
| Currency | | Value | | Cost | | Percentage of
Net Assets | |
| Canadian Dollar | | $ | 40,703,123 | | | $ | 19,771,690 | | | | 15.7 | | |
| Hong Kong Dollar | | | 4,184,428 | | | | 5,131,271 | | | | 1.6 | | |
| | | $ | 44,887,551 | | | $ | 24,902,961 | | | | 17.3 | | |
(g) At June 30, 2010, for federal income tax purposes, the cost of investments was $238,865,828 and net unrealized appreciation was $28,685,392 consisting of gross unrealized appreciation of $71,061,831 and gross unrealized depreciation of $42,376,439.
An affiliated person of the Fund may include any company in which the Fund owns five percent or more of its outstanding voting shares. Transactions in this affiliated company during the six months ended June 30, 2010 are as follows:
Affiliate | | Balance of
Shares Held
12/31/09 | |
Purchases/
Additions | |
Sales/
Reductions | | Balance of
Shares Held
6/30/10 | | Value | | Dividend | |
| Canacol Energy* | | | 16,460,000 | | | | — | | | | — | | | | 16,460,000 | | | $ | 13,637,424 | | | $ | — | | |
* At June 30, 2010, the Fund owned less than five percent of the company's outstanding voting shares.
The aggregate cost and value of this company at June 30, 2010, was $4,287,256 and $13,637,424, respectively. Investments in this affiliated company represented 5.25% of total net assets at June 30, 2010.
ADR = American Depositary Receipts.
The following table summarizes the inputs used, as of June 30, 2010, in valuing the Fund's assets:
| Investment Type | | Quoted Prices
(Level 1) | | Other
Significant
Observable
Inputs
(Level 2) | | Significant
Unobservable
Inputs
(Level 3) | | Total | |
| Equities | |
Consumer Goods &
Services | | $ | 63,897,908 | | | $ | 4,161,014 | | | $ | 23,414 | | | $ | 68,082,336 | | |
| Energy & Minerals | | | 23,468,728 | | | | 32,132,256 | | | | — | | | | 55,600,984 | | |
| Information | | | 54,220,559 | | | | — | | | | — | | | | 54,220,559 | | |
| Finance | | | 28,626,276 | | | | — | | | | — | | | | 28,626,276 | | |
Industrial Goods &
Services | | | 26,619,211 | | | | — | | | | — | | | | 26,619,211 | | |
| Other Industries | | | 13,596,685 | | | | — | | | | — | | | | 13,596,685 | | |
| Health Care | | | 1,121,204 | | | | — | | | | — | | | | 1,121,204 | | |
| Total Equities | | | 211,550,571 | | | | 36,293,270 | | | | 23,414 | | | | 247,867,255 | | |
Total Securities
Lending Collateral | | | 190,975 | | | | — | | | | — | | | | 190,975 | | |
Total Short-Term
Obligations | | | — | | | | 19,492,990 | | | | — | | | | 19,492,990 | | |
| Total Investments | | $ | 211,741,546 | | | $ | 55,786,260 | | | $ | 23,414 | | | $ | 267,551,220 | | |
The Fund's assets assigned to the Level 2 input category are generally valued using the market approach, in which a security's value is determined through its correlation to prices and information from market transactions for similar or identical assets. Foreign equities are generally valued at the last sales price on the foreign exchange or market on which they trade. The Fund may use a systematic fair valuation model provided by an independent third party to value securities principally traded in foreign markets in order to adjust for possible stale pricing that may occur between the close of the foreign exchanges and the time for valuation. These models take into account available market data including intraday index, ADR, and ETF movements. Securities acquired via private placement, that have a holding period or an extended settlement period, are valued at a discount to the same shares that are trading freely on the market. These discounts are determined by the advisors experience with similar securities or situations. Factors may include, but are not limited to, trade volume, shares outstanding and stock price.
Certain Short-Term Obligations may be valued using amortized cost, an income approach which converts future cash flows to a present value based upon the discount or premium at purchase.
The Fund's assets assigned to the Level 3 input category are valued at fair value as determined in good faith under consistently applied procedures established by and under the general supervision of the Board of Trustees. To determine fair value, management will utilize the valuation technique that they deem the most appropriate in the circumstances. Securities acquired via private placement but are not yet trading are valued using the market approach for which management has determined that the original transaction price is the best representation of fair value. Securities for which no markets exist are valued based upon the market approach using inputs from the investment team but ultimately decided by the Board of Trustees. These may include, but are not limited to, projected earnings, available cash, line of business, multiples, and consideration of the prioritization of the equity in a company's capital structure.
See accompanying notes to financial statements.
9
Wanger Select 2010 Semiannual Report
Wanger Select
Statement of Investments (Unaudited), June 30, 2010
The following table reconciles asset balances for the six-month period ending June 30, 2010, in which significant unobservable inputs (Level 3) were used in determining value:
| Investments in Securities | | Balance as of
December 31, 2009 | | Realized
Gain/(Loss) | | Change in
Unrealized
Appreciation
(Depreciation) | |
Purchases | | (Sales) | | Transfers
into Level 3 | | Transfers
(out of) Level 3 | | Balance as of
June 30, 2010 | |
Equities
Consumer Goods & Services | | $ | 23,515 | | | $ | — | | | $ | (101 | ) | | $ | — | | | $ | — | | | $ | — | | | $ | — | | | $ | 23,414 | | |
| | | $ | 23,515 | | | $ | — | | | $ | (101 | ) | | $ | — | | | $ | — | | | $ | — | | | $ | — | | | $ | 23,414 | | |
The information in the above reconciliation represents fiscal year to date activity for any securities identified as using Level 3 inputs at either the beginning or the end of the current fiscal period.
The change in unrealized depreciation attributed to securities owned at June 30, 2010, which were valued using significant unobservable inputs (Level 3) amounted to $101.
For more information on valuation inputs, and their aggregation into the levels used in the tables above, please refer to the Security Valuation section in the accompanying Notes to Financial Statements.
At June 30, 2010, the Fund held investments in the following sectors:
| Sector | | Percentage
of
Net Assets | |
| Consumer Goods & Services | | | 26.2 | | |
| Energy & Minerals | | | 21.4 | | |
| Information | | | 20.9 | | |
| Finance | | | 11.0 | | |
| Industrial Goods & Services | | | 10.2 | | |
| Other Industries | | | 5.2 | | |
| Health Care | | | 0.4 | | |
| | | | 95.3 | | |
| Securities Lending Collateral | | | 0.1 | | |
| Short-Term Obligations | | | 7.5 | | |
| Obligation to Return Collateral for Securities Loaned | | | (0.1 | ) | |
| Cash and Other Assets less Liabilities | | | (2.8 | ) | |
| | | | 100.0 | | |
See accompanying notes to financial statements.
10
Wanger Select 2010 Semiannual Report
Statement of Assets and Liabilities
June 30, 2010 (Unaudited)
| Assets: | |
| Unaffiliated investments, at cost | | $ | 234,578,572 | | |
| Affiliated investments, at cost (See Note 4) | | | 4,287,256 | | |
Unaffiliated investments, at value (including
securities on loan of $182,660) | | $ | 253,913,796 | | |
| Affiliated investments, at value (See Note 4) | | | 13,637,424 | | |
| Cash | | | 569 | | |
| Receivable for: | |
| Investments sold | | | 486,086 | | |
| Fund shares sold | | | 75,572 | | |
| Securities lending income | | | 4 | | |
| Dividends | | | 137,728 | | |
| Other assets | | | 489 | | |
| Total Assets | | | 268,251,668 | | |
| Liabilities: | |
| Collateral on securities loaned | | | 190,975 | | |
| Payable for: | |
| Investments purchased | | | 7,411,290 | | |
| Fund shares repurchased | | | 381,837 | | |
| Investment advisory fee | | | 178,511 | | |
| Administration fee | | | 11,157 | | |
| Transfer agent fee | | | 25 | | |
| Trustees' fees | | | 2,032 | | |
| Custody fee | | | 2,070 | | |
| Trustees' deferred compensation plan | | | 18,786 | | |
| Other liabilities | | | 52,919 | | |
| Total Liabilities | | | 8,249,602 | | |
| Net Assets | | $ | 260,002,066 | | |
| Composition of Net Assets: | |
| Paid-in capital | | $ | 271,883,360 | | |
| Accumulated net investment loss | | | (3,027,283 | ) | |
| Accumulated net realized loss | | | (37,539,373 | ) | |
| Net unrealized appreciation (depreciation) on: | |
| Investments | | | 28,685,392 | | |
| Foreign currency translations | | | (30 | ) | |
| Net Assets | | $ | 260,002,066 | | |
| Fund Shares Outstanding | | | 11,887,679 | | |
Net asset value, offering price and redemption
price per share | | $ | 21.87 | | |
Statement of Operations
For the Six Months Ended June 30, 2010 (Unaudited)
| Investment Income: | |
| Dividends | | $ | 652,529 | | |
| Interest income | | | 10,984 | | |
| Securities lending income | | | 222 | | |
| Total Investment Income | | | 663,735 | | |
| Expenses: | |
| Investment advisory fee | | | 1,113,228 | | |
| Administration fee | | | 69,577 | | |
| Transfer agent fee | | | 147 | | |
| Trustees' fees | | | 9,426 | | |
| Custody fee | | | 29,214 | | |
| Chief compliance officer expenses (See Note 4) | | | 4,264 | | |
| Other expenses (See Note 5) | | | 57,098 | | |
| Total Expenses | | | 1,282,954 | | |
| Custody earnings credit | | | (36 | ) | |
| Net Expenses | | | 1,282,918 | | |
| Net Investment Loss | | | (619,183 | ) | |
Net Realized and Unrealized Gain (Loss) on
Investments and Foreign Currency: | |
| Net realized gain (loss) on: | |
| Investments | | | 1,588,474 | | |
| Foreign currency transactions | | | (27,680 | ) | |
| Net realized gain | | | 1,560,794 | | |
| Net change in unrealized appreciation (depreciation) on: | |
| Unaffiliated investments | | | (17,764,850 | ) | |
| Affiliated investments (See Note 4) | | | 4,021,265 | | |
| Foreign currency translations | | | (30 | ) | |
Net change in unrealized
appreciation (depreciation) | | | (13,743,615 | ) | |
| Net Loss | | | (12,182,821 | ) | |
| Net Decrease in Net Assets from Operations | | $ | (12,802,004 | ) | |
See accompanying notes to financial statements.
11
Wanger Select 2010 Semiannual Report
Statement of Changes in Net Assets
| Increase (Decrease) in Net Assets | | (Unaudited)
Six Months
Ended
June 30,
2010 | | Year Ended
December 31,
2009 | |
| Operations: | |
| Net investment loss | | $ | (619,163 | ) | | $ | (872,018 | ) | |
| Net realized gain (loss) on: | |
| Unaffiliated investments | | | 1,588,474 | | | | (14,804,246 | ) | |
| Affiliated investments (See Note 4) | | | — | | | | — | | |
| Foreign currency transactions | | | (27,680 | ) | | | (112,113 | ) | |
| Net change in unrealized appreciation (depreciation) on: | |
| Unaffiliated investments | | | (17,764,850 | ) | | | 114,979,225 | | |
| Affiliated investments (See Note 4) | | | 4,021,265 | | | | 5,328,903 | | |
| Foreign currency translations | | | (30 | ) | | | — | | |
| Net Increase (Decrease) in Net Assets from Operations | | | (12,802,004 | ) | | | 104,519,751 | | |
| Distributions to Shareholders: | |
| From net investment income | | | (1,632,499 | ) | | | — | | |
| Share Transactions: | |
| Subscriptions | | | 22,656,738 | | | | 34,296,345 | | |
| Distributions reinvested | | | 1,632,499 | | | | — | | |
| Redemptions | | | (20,221,050 | ) | | | (25,035,845 | ) | |
| Net Increase from Fund Share Transactions | | | 4,068,187 | | | | 9,260,500 | | |
| Total Increase (Decrease) in Net Assets | | | (10,366,316 | ) | | | 113,780,251 | | |
| Net Assets: | |
| Beginning of period | | | 270,368,382 | | | | 156,588,131 | | |
| End of period | | $ | 260,002,066 | | | $ | 270,368,382 | | |
| Accumulated net investment loss at end of period | | $ | (3,027,283 | ) | | $ | (775,601 | ) | |
See accompanying notes to financial statements.
12
Wanger Select 2010 Semiannual Report
Financial Highlights
| | | (Unaudited)
Six Months Ended
June 30, | | Year Ended December 31, | |
| Selected data for a share outstanding throughout each period | | 2010 | | 2009 | | 2008 | | 2007 | | 2006 | | 2005 | |
| Net Asset Value, Beginning of Period | | $ | 23.05 | | | $ | 13.87 | | | $ | 28.08 | | | $ | 26.15 | | | $ | 22.66 | | | $ | 22.11 | | |
| Income from Investment Operations: | |
| Net investment loss (a) | | | (0.05 | ) | | | (0.08 | ) | | | (0.10 | ) | | | (0.04 | ) | | | (0.05 | ) | | | (0.04 | ) | |
Net realized and unrealized gain (loss) on investments
and foreign currency | | | (0.99 | ) | | | 9.26 | | | | (13.38 | ) | | | 2.47 | | | | 4.38 | | | | 2.12 | | |
| Total from Investment Operations | | | (1.04 | ) | | | 9.18 | | | | (13.48 | ) | | | 2.43 | | | | 4.33 | | | | 2.08 | | |
| Less Distributions to Shareholders: | |
| From net investment income | | | (0.14 | ) | | | — | | | | — | | | | — | | | | (0.09 | ) | | | — | | |
| From net realized gains | | | — | | | | — | | | | (0.73 | ) | | | (0.50 | ) | | | (0.75 | ) | | | (1.53 | ) | |
| Total Distributions to Shareholders | | | (0.14 | ) | | | — | | | | (0.73 | ) | | | (0.50 | ) | | | (0.84 | ) | | | (1.53 | ) | |
| Net Asset Value, End of Period | | $ | 21.87 | | | $ | 23.05 | | | $ | 13.87 | | | $ | 28.08 | | | $ | 26.15 | | | $ | 22.66 | | |
| Total Return (b) | | | (4.52 | )%(c) | | | 66.19 | % | | | (49.06 | )% | | | 9.39 | % | | | 19.70 | % | | | 10.49 | %(d) | |
| Ratios to Average Net Assets/Supplemental Data: | |
| Net expenses (e) | | | 0.92 | %(f) | | | 0.95 | % | | | 0.91 | % | | | 0.90 | % | | | 0.94 | % | | | 0.96 | % | |
| Net investment loss (e) | | | (0.45 | )%(f) | | | (0.44 | )% | | | (0.45 | )% | | | (0.15 | )% | | | (0.20 | )% | | | (0.20 | )% | |
| Waiver/Reimbursement | | | — | | | | — | | | | — | | | | — | | | | — | | | | 0.02 | % | |
| Portfolio turnover rate | | | 13 | %(c) | | | 35 | % | | | 36 | % | | | 15 | % | | | 21 | % | | | 26 | % | |
| Net assets, end of period (000s) | | $ | 260,002 | | | $ | 270,368 | | | $ | 156,588 | | | $ | 316,380 | | | $ | 175,346 | | | $ | 102,674 | | |
(a) Net investment loss per share was based upon the average shares outstanding during the period.
(b) Total return at net asset value assuming all distributions reinvested.
(c) Not annualized.
(d) Had the investment advisor not waived a portion of expenses, total return would have been reduced.
(e) The benefits derived from custody fees paid indirectly had an impact of less than 0.01%.
(f) Annualized.
See accompanying notes to financial statements.
13
Wanger Select 2010 Semiannual Report
Notes to Financial Statements (Unaudited)
1. Nature of Operations
Wanger Select (the "Fund"), is a series of Wanger Advisors Trust (the "Trust"), an open-end management investment company organized as a Massachusetts business trust. The investment objective of the Fund is to seek long-term capital appreciation. The Fund is available only for allocation to certain life insurance company separate accounts established for the purpose of funding qualified and non-qualified variable annuity contracts and variable life insurance policies and may also be offered directly to certain types of pension plans and retirement arrangements.
2. Significant Accounting Policies
The preparation of financial statements in accordance with accounting principles generally accepted in the United States of America ("GAAP") requires management to make certain estimates and assumptions that affect the reported amounts of assets and liabilities, the disclosure of contingent assets and liabilities at the date of the financial statements and the reported amounts of revenue and expenses during the reporting period. Actual results could differ from those estimates.
Security valuation
Securities of the Fund are valued at market value or, if a market quotation for a security is not readily available or is deemed not to be reliable because of events or circumstances that have occurred between the market quotation and the time as of which the security is to be valued, the security is valued at its fair value determined in good faith under consistently applied procedures established by the Board of Trustees. A security traded on a securities exchange or in an over-the-counter market in which transaction prices are reported is valued at the last sales price at the time of valuation. A security traded principally on NASDAQ is valued at the NASDAQ official closing price. Mutual Funds and Exchange Traded Funds are valued at their closing net asset value as reported to NASDAQ. A security for which there is no reported sale on the valuation date is valued at the latest bid quotation. Short-term investments maturing in 60 days or less are valued at amortized cost, which approximates market value. A security for which a market quotation is not readily available and any other assets are valued at its fair value determined in good faith under consistently applied procedures established by the Board of Trustees. The Trust has retained an independent statistical fair value pricing service that employs a systematic methodology to assist in the fair valuation process for securities principally traded in a foreign market in order to adjust for possible changes in value that may occur between the close of the foreign market and the time as of which the securities are to be valued. If a security is valued at a "fair value", that value may be different from the last quoted market price for the security.
Various inputs are used in determining the value of the Fund's investments, following the input prioritization hierarchy established by GAAP. These inputs are summarized in the three broad levels listed below:
• Level 1—quoted prices in active markets for identical securities
• Level 2—prices determined using other significant observable inputs where quoted prices or observable inputs are unavailable or less reliable (including quoted prices for similar securities, interest rates, prepayment speeds, credit risk and others)
• Level 3—prices determined using significant unobservable inputs (including management's own assumptions about the factors market participants would use in pricing an investment)
The inputs or methodologies used for valuing securities are not necessarily an indication of the risk associated with investing in those securities.
Examples of the types of securities in which the Fund would typically invest and how they are classified within this hierarchy are as follows. Typical level 1 securities include exchange traded domestic equities, mutual funds whose NAVs are published each day and exchange traded foreign equities that are not statistically fair valued. Typical level 2 securities include exchange traded foreign equities that are statistically fair valued and short-term investments valued at amortized cost. Additionally, securities fair valued by the Fund's valuation committee that rely on significant observable inputs are also included in level 2. Typical level 3 securities include any security fair valued by the Fund's Valuation Committee that relies on significant unobservable inputs.
On January 21, 2010, the Financial Accounting Standards Board issued an Accounting Standards Update, Fair Value Measurements and Disclosures (Topic 820): Improving Disclosures about Fair Value Measurements, (the "Update"), which provides guidance on how investment assets and liabilities are to be valued and disclosed. Specifically, the Update requires reporting entities to disclose the input and valuation techniques used to measure fair value for both recurring and nonrecurring fair value measurements for Level 2 and Level 3 positions. The Update also requires that transfers between all levels (including Level 1 and Level 2) be disclosed on a gross basis (i.e., transfers out must be disclosed separately from transfers in), and requires disclosure of the reason(s) for the transfer. Additionally, purchases, sales, issuances and settlements must be disclosed on a gross basis in the Level 3 rollforward. The effective date of the Update is for interim and annual periods beginning after December 15, 2009; except for the requirement to provide the Level 3 activity for purchases, sales, issuances and settlements on a gross basis, which will be effective for interim and annual periods beginning after December 15, 2010. The Fund adopted the Update effective March 31, 2010.
Repurchase agreements
The Fund may engage in repurchase agreement transactions. The Fund, through its custodian, receives delivery of underlying securities collateralizing each repurchase agreement. The counterparty is required to maintain collateral that is at all times at least equal to the repurchase price including interest. In the event of default or bankruptcy by the other party to the agreement, realization and/or retention of the collateral may be subject to legal proceedings.
Foreign currency translations
Values of investments denominated in foreign currencies are converted into U.S. dollars using the New York spot market rate of exchange at the time of valuation. Purchases and sales of investments and dividend and interest income are translated into U.S. dollars using the spot market rate of exchange prevailing on the respective dates of such transactions. The gain or loss resulting from changes in foreign exchange rates is included with net realized and unrealized gain or loss from investments, as appropriate.
Securities lending
The Fund may lend securities up to one-third of the value of its total assets to certain approved brokers, dealers and other financial institutions to earn additional income. The Fund retains the benefits of owning the securities, including receipt of dividends or interest generated by the security. The Fund also receives a fee for the loan. The Fund has the ability to recall the loans at any time and could do so in order to vote proxies or to sell the loaned securities. Each loan is collateralized by cash that exceeded the value of the securities on loan. The market value of the loaned securities is determined daily at the close of business of the Fund and any additional required collateral is delivered to each Fund on the next business day. The Fund has elected to invest the cash collateral in the Dreyfus Government Cash Management Fund and the income earned is paid to the Fund, net of any fees remitted to Goldman Sachs Agency Lending as the lending agent and borrower rebates. The Fund's advisor, Columbia Wanger Asset Management, LLC ("CWAM"), does not retain any fees earned by the lending program. Generally, in the event of borrower default, the Fund has the right to use the collateral to offset any losses
14
Wanger Select 2010 Semiannual Report
Notes to Financial Statements, continued (Unaudited)
incurred. In the event the Fund is delayed or prevented from exercising its right to dispose of the collateral, there may be a potential loss to the Fund. Some of these losses may be indemnified by the lending agent. The Fund bears the risk of loss with respect to the investment of collateral.
The net lending income earned in 2010 by the Fund is included in the Statement of Operations.
Security transactions and investment income
Security transactions are accounted for on the trade date (date the order to buy or sell is executed) and dividend income is recorded on the ex-dividend date, except that certain dividends from foreign securities are recorded as soon as the information is available to the Fund. Interest income is recorded on the accrual basis and includes amortization of discounts on debt obligations when required for federal income tax purposes. Realized gains and losses from security transactions are recorded on an identified cost basis.
Awards, if any, from class action litigation related to securities owned may be recorded as a reduction of cost of those securities. If the applicable securities are no longer owned, the proceeds are recorded as realized gains.
Restricted securities
Restricted securities are securities that may only be resold upon registration under federal securities laws or in transactions exempt from registration. In some cases, the issuer of restricted securities has agreed to register such securities for resale at the issuer's expense either upon demand by the Fund or in connection with another registered offering of the securities. Many restricted securities may be resold in the secondary market in transactions exempt from registration. Such restricted securities may be determined to be liquid under criteria established by the Board of Trustees.
Fund share valuation
Fund shares are sold and redeemed on a continuing basis at net asset value. Net asset value per share is determined daily as of the close of trading on the New York Stock Exchange ("the Exchange") on each day the Exchange is open for trading by dividing the total value of the Fund's investments and other assets, less liabilities, by the number of Fund shares outstanding.
Custody fees/Credits
Custody fees are reduced based on the Fund's cash balances maintained with the custodian. The amount is disclosed as a reduction of total expenses in the Statement of Operations.
Federal income taxes
The Fund has complied with the provisions of the Internal Revenue Code available to regulated investment companies and, in the manner provided therein, distributes all its taxable income, as well as any net realized gain on sales of investments and foreign currency transactions reportable for federal income tax purposes. Accordingly, the Fund paid no federal income taxes and no federal income tax provision was required.
Expenses
General expenses of the Trust are allocated to the Fund and the other series of the Trust based upon relative net assets or other expense allocation methodologies determined by the nature of the expense. Expenses directly attributable to the Fund are charged to the Fund.
Foreign capital gains taxes
Gains in certain countries may be subject to foreign taxes at the fund level, at rates ranging from 10%-15%. The Fund accrues for such foreign taxes on net realized and unrealized gains at the appropriate rate for each jurisdiction.
Distributions to shareholders
Distributions to shareholders are recorded on the ex-dividend date.
Indemnification
In the normal course of business, the Trust on behalf of the Fund enters into contracts that contain a variety of representations and warranties and that provide general indemnities. The Fund's maximum exposure under these arrangements is unknown, as this would involve future claims against the Fund. Also under the Trust's organizational documents, the trustees and officers of the Trust are indemnified against certain liabilities that may arise out of their duties to the Trust. However based on experience, the Fund expects the risk of loss due to these warranties and indemnities to be minimal.
3. Federal Tax Information
The tax character of distributions paid during the year ended December 31, 2009 was as follows:
| | | December 31, 2009 | |
| Ordinary Income* | | $ | — | | |
| Long-Term Capital Gains | | | — | | |
* For tax purposes short-term capital gains distributions, if any, are considered ordinary income distributions.
The following capital loss carryforwards, determined as of December 31, 2009, may be available to reduce taxable income arising from future net realized gains on investments, if any, to the extent permitted by the Internal Revenue Code:
Year of
Expiration | | Capital Loss
Carryforwards | |
| 2016 | | $ | 6,605,628 | | |
| 2017 | | | 27,110,035 | | |
| Total | | $ | 33,715,663 | | |
Under current tax rules, certain currency (and capital) losses realized after October 31 may be deferred and treated as occurring on the first day of the following fiscal year. As of December 31, 2009, post-October capital losses of $173,029 attributed to security transactions were deferred to January 1, 2010.
Management is required to determine whether a tax position of the Fund is more likely than not to be sustained upon examination by the applicable taxing authority, including resolution of any related appeals or litigation processes, based on the technical merits of the position. The tax benefit to be recognized by the Fund is measured as the largest amount of benefit that is greater than fifty percent likely of being realized upon ultimate settlement. Management is not aware of any tax positions for which it is reasonably possible that the total amounts of unrecognized tax benefits will significantly change in the next twelve months. However, management's conclusions may be subject to review and adjustment at a later date based on factors including, but not limited to, new tax laws, regulations, and administrative interpretations (including relevant court decisions). The Funds' federal tax returns for the prior three fiscal year s remain subject to examination by the Internal Revenue Service.
4. Transactions With Affiliates
CWAM is a wholly owned subsidiary of Columbia Management Investment Advisers, LLC ("Columbia Management"), which in turn is an indirect, wholly owned subsidiary of Ameriprise Financial, Inc. ("Ameriprise Financial"). CWAM furnishes continuing investment supervision to the Fund and is responsible for the overall management of the Fund's business affairs.
After the close of business on April 30, 2010, (the "Closing"), Ameriprise Financial acquired from Bank of America Corporation ("BOA"), a portion of the
15
Wanger Select 2010 Semiannual Report
Notes to Financial Statements, continued (Unaudited)
asset management business of Columbia Management Group, LLC, including 100% of CWAM. On May 27, 2010, the shareholders of the Fund approved a new investment advisory agreement with CWAM to provide advisory services to the Fund. There were no changes to the Fund's advisory fee rate under the new agreement.
CWAM receives a monthly advisory fee based on the Fund's average daily net assets at the following annual rates:
| Average Daily Net Assets | | Annual Fee Rate | |
| Up to $500 million | | | 0.80 | % | |
| $500 million and over | | | 0.78 | % | |
For the six months ended June 30, 2010, the Fund's annualized effective investment advisory fee rate was 0.80% of average daily net assets.
Through April 30, 2011, CWAM has contractually agreed to reimburse the Fund to the extent that ordinary operating expenses (exclusive of brokerage commissions, interest, taxes and extraordinary expenses, but inclusive of custodian charges relating to overdrafts, if any), after giving effect to any balance credits from the Fund's custodian, exceed an annual percentage of 1.35% of average daily net assets on an annualized basis. There is no reimbursement for the six months ended June 30, 2010.
CWAM provides administrative services and receives an administration fee from the Fund at the following annual rates.
Wanger Advisors Trust Aggregate
Average Daily Net Assets of the Trust | | Annual Fee Rate | |
| Up to $4 million | | | 0.05 | % | |
| $4 billion to $6 billion | | | 0.04 | % | |
| $6 billion to $8 billion | | | 0.03 | % | |
| $8 billion and over | | | 0.02 | % | |
For the six months ended June 30, 2010, the Fund's annualized effective administration fee rate was 0.05% of average daily net assets. Prior to the Closing, CWAM had delegated to Columbia Management Advisors, LLC ("CMA") an indirect, wholly owned subsidiary of BOA, responsibility to provide certain sub-administrative services to the Fund. Following the Closing, Riversource Investments, LLC, a wholly owned subsidiary of Ameriprise Financial, acquired the assets of CMA and subsequently changed its name to Columbia Management, and thereafter began providing certain sub-administrative services to the Fund.
Prior to the Closing, Columbia Management Distributors, Inc., a wholly owned subsidiary of BOA, served as the Fund's distributor and principal underwriter. In connection with the Closing, RiverSource Fund Distributors, Inc., a wholly owned subsidiary of Ameriprise Financial, became the distributor of the Fund and subsequently changed its name to Columbia Management Investment Distributors, Inc. ("CMDI"). There were no changes to the underwriting discount structure of the Fund or the service or distribution fee rates paid by the Fund as a result of the Closing.
Prior to the Closing, Columbia Management Services, Inc., an indirect, wholly owned subsidiary of BOA, provided shareholder services to the Fund and contracted with Boston Financial Data Services ("BFDS") to serve as sub-transfer agent. In connection with the Closing, RiverSource Service Corporation, a wholly owned subsidiary of Ameriprise Financial, became the transfer agent of the Fund and subsequently changed its name to Columbia Management Investment Services Corp. ("CMIS"). The transfer agent fee rates paid by the Fund did not change as a result of the change in transfer agent. For its services, the Fund pays CMIS a monthly fee at the annual rate of $21.00 per open account. CMIS also receives reimbursement for certain out-of-pocket expenses and sub-transfer agency expenses. The arrangement with BFDS has been continued by CMIS.
Certain officers and trustees of the Trust are also officers of CWAM. The Trust makes no direct payments to its officers and trustees who are affiliated with CWAM.
The Board of Trustees has appointed a Chief Compliance Officer of the Trust in accordance with federal securities regulations. The Fund, along with other affiliated funds, pays its pro-rata share of the expenses associated with the Office of the Chief Compliance Officer. These expenses are disclosed separately as "Chief compliance officer expenses" in the Statement of Operations.
The Trust offers a deferred compensation plan for its independent trustees. Under that plan, a trustee may elect to defer all or a portion of his or her compensation. Amounts deferred are retained by the Trust and may represent an unfunded obligation of the Trust. The value of amounts deferred is determined by reference to the change in value of Class Z shares of one or more series of Columbia Acorn Trust or a money market fund as specified by the trustee. Benefits under the deferred compensation plan are payable when the trustee ceases to be a member of the Board of Trustees.
An affiliated person of the Fund may include any company in which the Fund owns five percent or more of its outstanding voting shares. On June 30, 2010, the Fund held five percent of more of the outstanding voting securities of one of more companies. Details of investments in those affiliated companies are presented in the Notes to the Statement of Investments on page 9.
During the six months ended June 30, 2010, the Fund engaged in purchase and sales transactions with funds that have a common investment advisor (or affiliated investment advisors), common directors/trustees, and/or common officers. Those purchase and sale transactions complied with provisions of Rule 17a-7 under the Investment Company Act of 1940 and were $134,583 and $309,584, respectively.
5. Borrowing Arrangements
The Trust participates in a $150 million credit facility, along with another Trust managed by CWAM, which was entered into to facilitate portfolio liquidity. Under the facility, interest is charged to each participating fund based on its borrowings at a rate per annum equal to the higher of Federal Funds Rate or Overnight LIBOR plus 1.25%. In addition, a commitment fee of 0.15% per annum of the unutilized line of credit is accrued and apportioned among the participating funds based on their relative net assets. The commitment fee is included in "Other expenses" in the Statement of Operations. No amounts were borrowed by the Fund under this facility during the six months ended June 30, 2010. The Trust enters into this line of credit for one year durations. The Trust has secured the line of credit for the entire year of 2010.
6. Fund Share Transactions
Proceeds and payments on Fund shares as shown in the Statement of Changes in Net Assets are in respect of the following numbers of shares:
| | | Six Months Ended
June 30, 2010 | | Year ended
December 31, 2009 | |
| Shares sold | | | 940,874 | | | | 1,920,232 | | |
Shares issued in reinvestment
of dividend distributions | | | 74,306 | | | | — | | |
| Less shares redeemed | | | (859,581 | ) | | | (1,481,433 | ) | |
| Net increase in shares outstanding | | | 155,599 | | | | 438,799 | | |
7. Investment Transactions
The aggregate cost of purchases and proceeds from sales other than short-term obligations for the six months ended June 30, 2010 were $57,372,117 and $34,084,235, respectively.
16
Wanger Select 2010 Semiannual Report
Notes to Financial Statements, continued (Unaudited)
8. Information Regarding Pending and Settled Legal Proceedings
In June 2004, an action captioned John E. Gallus et al. v. American Express Financial Corp. and American Express Financial Advisors Inc. was filed in the United States District Court for the District of Arizona. The plaintiffs allege that they are investors in several American Express Company (now known as RiverSource) mutual funds and they purport to bring the action derivatively on behalf of those funds under the Investment Company Act of 1940. The plaintiffs allege that fees allegedly paid to the defendants by the funds for investment advisory and administrative services are excessive. The plaintiffs seek remedies including restitution and rescission of investment advisory and distribution agreements. The plaintiffs voluntarily agreed to transfer this case to the United States District Court for the District of Minnesota (the District Court). In response to defendants' motion to dismiss the complaint, the District Court dismissed one of plaintiffs' four claims and granted plaintiffs limited discovery. Defendants moved for summary judgment in April 2007. Summary judgment was granted in the defendants' favor on July 9, 2007. The plaintiffs filed a notice of appeal with the Eighth Circuit Court of Appeals (the Eighth Circuit) on August 8, 2007. On April 8, 2009, the Eighth Circuit reversed summary judgment and remanded to the District Court for further proceedings. On August 6, 2009, defendants filed a writ of certiorari with the U.S. Supreme Court (the Supreme Court), asking the Supreme Court to stay the District Court proceedings while the Supreme Court considers and rules in a case captioned Jones v. Harris Associates, which involve s issues of law similar to those presented in the Gallus case. On March 30, 2010, the Supreme Court issued its ruling in Jones v. Harris Associates, and on April 5, 2010, the Supreme Court vacated the Eighth Circuit's decision in the Gallus case and remanded the case to the Eighth Circuit for further consideration in light of the Supreme Court's decision in Jones v. Harris Associates. On June 4, 2010, the Eighth Circuit remanded the Gallus case to the District Court for further consideration in light of the Supreme Court's decision in Jones v. Harris Associates.
In December 2005, without admitting or denying the allegations, American Express Financial Corporation (AEFC, which is now known as Ameriprise Financial, Inc. (Ameriprise Financial)), entered into settlement agreements with the Securities and Exchange Commission (SEC) and Minnesota Department of Commerce (MDOC) related to market timing activities. As a result, AEFC was censured and ordered to cease and desist from committing or causing any violations of certain provisions of the Investment Advisers Act of 1940, the Investment Company Act of 1940, and various Minnesota laws. AEFC agreed to pay disgorgement of $10 million and civil money penalties of $7 million. AEFC also agreed to retain an independent distribution consultant to assist in developing a plan for distribution of all disgorgement and civil penalties ordered by the SEC in accordance with various undertakings detailed at http://www.sec.gov/litigation/admin/ia-2451.pdf. Ameriprise Financial and its affiliates have cooperated with the SEC and the MDOC in these legal proceedings, and have made regular reports to the Columbia Management Funds' Boards of Directors/Trustees.
Ameriprise Financial and certain of its affiliates have historically been involved in a number of legal, arbitration and regulatory proceedings, including routine litigation, class actions, and governmental actions, concerning matters arising in connection with the conduct of their business activities. Ameriprise Financial believes that the Funds are not currently the subject of, and that neither Ameriprise Financial nor any of its affiliates are the subject of, any pending legal, arbitration or regulatory proceedings that are likely to have a material adverse effect on the Funds or the ability of Ameriprise Financial or its affiliates to perform under their contracts with the Funds. Ameriprise Financial is required to make 10-Q, 10-K and, as necessary, 8-K filings with the Securities and Exchange Commission on legal and regulatory matters that relate to Ameriprise Financial and its affiliates. Copies of these filings may be obt ained by accessing the SEC website at www.sec.gov.
There can be no assurance that these matters, or the adverse publicity associated with them, will not result in increased fund redemptions, reduced sale of fund shares or other adverse consequences to the Funds. Further, although we believe proceedings are not likely to have a material adverse effect on the Funds or the ability of Ameriprise Financial or its affiliates to perform under their contracts with the Funds, these proceedings are subject to uncertainties and, as such, we are unable to estimate the possible loss or range of loss that may result. An adverse outcome in one or more of these proceedings could result in adverse judgments, settlements, fines, penalties or other relief that could have a material adverse effect on the consolidated financial condition or results of operations of Ameriprise Financial.
*****
CWAM, Columbia Acorn Trust (another mutual fund family advised by CWAM), and the trustees of Columbia Acorn Trust (collectively, the "Columbia defendants") were named as defendants in class and derivative complaints that were consolidated in a Multi-District Action (the MDL Action) in the federal district court of Maryland. These lawsuits contend that defendants permitted certain investors to market time their trades in certain Columbia Acorn Funds. The MDL Action is ongoing. However, all claims against the Trust and the Independent Trustees of the Trust have been dismissed.
Columbia Acorn Trust and CWAM are also defendants in a state court class action lawsuit that alleges, in summary, that the Trust and CWAM exposed shareholders of Columbia Acorn International to trading by market timers by allegedly: (a) failing to properly evaluate daily whether a significant event affecting the value of the Fund's securities had occurred after foreign markets had closed but before the calculation of the Fund's net asset value (NAV); (b) failing to implement the Fund's portfolio valuation and share pricing policies and procedures; and (c) failing to know and implement applicable rules and regulations concerning the calculation of NAV (the Fair Valuation Lawsuit). The United States Court of Appeals for the Seventh Circuit ruled that the plaintiffs' state law claims were preempted under federal law, resulting in the dismissal of plaintiffs' complaint. Plaintiffs appealed the Seventh Circuit's ruling to the United States Supreme Court. The Supreme Court reversed the Seventh Circuit's ruling on jurisdictional grounds and the case was remanded to the state court.
On March 21, 2005, a class action complaint was filed against the Trust and CWAM seeking to rescind the CDSC assessed upon redemption of Class B shares of the Columbia Acorn Funds (the CDSC Lawsuit). In addition to the rescission of sales charges, plaintiffs seek recovery of actual damages, attorneys' fees and costs. The case was transferred to the MDL Action in the federal district court of Maryland.
On September 14, 2007, the plaintiffs and the Columbia defendants named in the MDL Action, including the Columbia family of funds, entered into a stipulation of settlement with respect to all Columbia-related claims in the MDL Action described above, including the CDSC and Fair Valuation Lawsuits.
On April 23, 2010, the parties of the MDL Action filed a motion seeking: (a) preliminary approval of the MDL settlements; (b) the conditional certification of the plaintiff class for purposes of settlement; (c) approval of the form and manner of giving notice to the plaintiff class of the proposed settlements; and (d) approval of the proposed schedule for various deadlines in connection with the final settlement hearing. The motion was presented to and approved by the court on May 7, 2010. The final hearing on the fairness of the settlements is scheduled for October 21, 2010.
CWAM believes that the lawsuits are not likely to materially affect its ability to provide investment management services to the Funds.
17
Wanger Select 2010 Semiannual Report
[Excerpt from:]
Wanger Advisors Trust
Management Fee Evaluation of the Senior Officer
Prepared Pursuant to the New York Attorney General's
Assurance of Discontinuance
December 2009
18
Wanger Select 2010 Semiannual Report
Introduction
The New York Attorney General's Assurance of Discontinuance ("Order") entered into by Columbia Management Advisors, LLC ("CMAI") and Columbia Management Distributors, Inc., ("CMDI") in February 2005, allows CMAI to manage or advise a mutual fund only if the trustees of the fund appoint a "Senior Officer" to perform specified duties and responsibilities. One of these responsibilities includes "managing the process by which proposed management fees (including but not limited to, advisory fees) to be charged the [funds] are negotiated so that they are negotiated in a manner which is at arms' length and reasonable and consistent with this Assurance of Discontinuance."
The Columbia Acorn Trust and Wanger Advisors Trust (collectively, the "Trusts") and each series thereof (the "Acorn Funds," "WAT Funds" or collectively, the "Funds") are overseen by the same Board of Trustees ("Board"). The Order provides that this Board must determine the reasonableness of proposed "management fees" by using either an annual competitive bidding process supervised by the Senior Officer or Independent Fee Consultant, or by obtaining "an annual independent written evaluation prepared by or under the direction of the Senior Officer or the Independent Fee Consultant."
"Management fees" are only part of the costs and expenses paid by mutual fund shareholders. Fund expenses can vary depending upon the class of shares held but usually include: (1) investment management or advisory fees to compensate analysts and portfolio managers for stock research and portfolio management, as well as the cost of operating a trading desk; (2) administrative expenses incurred to prepare registration statements and tax returns, calculate the funds' net asset values, maintain effective compliance procedures and perform recordkeeping services; (3) transfer agency costs for establishing accounts, accepting and disbursing funds, as well as overseeing trading in fund shares; (4) custodial expenses incurred to hold the securities purchased by the funds; and (5) distribution expenses, including commissions paid to brokers that sell the fund shares to investors.
Columbia Wanger Asset Management, L.P. ("CWAM"), is the adviser to the Funds, and at present is a part of Columbia Management Group ("Columbia"), an umbrella organization that also includes CMAI, Columbia Management Services, Inc. ("CMSI") and CMDI. Columbia is owned by Bank of America Corporation ("Bank of America").
The Proposed Change of Ownership
On September 29, 2009, Bank of America entered into a Purchase Agreement ("APA") with Ameriprise Financial, Inc. ("Ameriprise") providing for, among other things, the sale of CWAM to Ameriprise and the acquisition by Ameriprise of certain assets of Columbia. The Columbia assets to be acquired by Ameriprise include the functions currently performed by CMAI, CMSI and CMDI. Because some of Columbia's operations are supported by Bank of America staff and facilities outside of Columbia, Ameriprise and Bank of America entered into a Transition Services Agreement ("TSA") that, among other things, provides for the continuation of those services for a period of time. The parties contemplate a closing date of the APA in Spring 2010, and closing is conditioned upon the approval by the Board of a new advisory agreement between the Trusts and CWAM, as well as agreements with the entities that will succeed CMSI, CMDI and CMAI. These entities – RiverSource Fund Services, Inc. ("RFS"), RiverSource Fund Distributors, Inc. ("RFD") and RiverSource Investments, LLC — are wholly owned subsidiaries of Ameriprise and currently support the RiverSource family of mutual funds. Therefore, if the sale is consummated as contemplated by the various agreements, CWAM's ownership will change from Bank of America to Ameriprise, as will the Funds' primary service providers.1
Columbia and Ameriprise have proposed that the Trusts continue, in substance, the existing advisory agreement governing portfolio management, and the administration services agreement governing certain administration and clerical services. They propose no material changes to these agreements, no change in services and no changes in fee levels, only those changes necessary to effect the change of ownership. The fees paid under these two agreements are referred to as "management fees." Other fund expenses will be governed by separate agreements, in particular agreements with two Ameriprise affiliates: RFD, the broker-dealer that will underwrite and distribute the Funds' shares, and RFS the Funds' proposed transfer agent.
While the proposed agreements themselves suggest no substantive changes in the services provided to the Funds, Ameriprise and Columbia have informed the Board that they intend to embark on a process of integrating the operations of the two organizations with respect to administration and other services. Among the objectives of that integration are the reduction of costs, and increased economies of scale. Further, CWAM will be subject to new management oversight by Ameriprise which, among other things, will establish the compensation structure for CWAM's portfolio managers and analysts.
Requirements of the Order
The Order applies to any successor to substantially all the assets of CMDI and CMAI. Under the Order, a fee evaluation must precede the execution of new advisory and administration services agreements; there is no express exception from this requirement for agreements that are intended solely to transfer ownership of the existing service providers. I have been advised by Columbia that it believes the Order requires the preparation of this fee evaluation.
In conformity with the terms of the Order and past evaluations, this evaluation addresses only the advisory and administration contracts, and does not extend to any proposed new underwriting and transfer agency agreements.
1 The Funds' custodian is State Street Bank and Trust Company. No change in custodian is required by the APA nor is such a change contemplated at this time.
19
Wanger Select 2010 Semiannual Report
According to the Order, the Senior Officer's evaluation must consider at least the following:
(1) Management fees (including components thereof) charged to institutional and other clients of CWAM for like services;
(2) Management fees (including any components thereof) charged by other mutual fund companies for like services;
(3) Costs to CWAM and its affiliates of supplying services pursuant to the management fee agreements, excluding any intra-corporate profit;
(4) Profit margins of CWAM and its affiliates from supplying such services;
(5) Possible economies of scale as the Funds grow larger; and
(6) The nature and quality of CWAM's services, including the performance of each Fund.
In 2004, the Boards of the two Trusts, then separate groups, each appointed me Senior Officer under the Order. They also determined not to pursue a competitive bidding process and instead, charged me with the responsibility of evaluating the Funds' proposed advisory and administration fee contracts with CWAM in conformity with the requirements of the Order. In discharging their responsibilities, the independent Trustees have also consulted independent, outside counsel. The Board has asked that I prepare this evaluation.
2009 Evaluation
In May 2009, I submitted to the Board the fourth annual evaluation prepared under the Order. That evaluation, based on performance and fee data as of December 31, 2008, was considered by the Board in renewing the advisory and administration services agreements that were effective on July 31, 2009. That evaluation followed the same structure as the earlier studies. Some areas were given more emphasis, while others were given less. Still, the fundamental information gathered for that evaluation was largely the same as past years. That evaluation is referred to here as the "2009 Study."
Process and Independence
The objectives of the Order are to ensure the independent evaluation of the management fees paid by the Funds as well as to insure that all relevant factors are considered. In my view, this contract process has been conducted at arms-length and with independence in gathering, considering and evaluating all relevant data. At the outset of the process, the Trustees sought and obtained from Ameriprise and Columbia a comprehensive compilation of data regarding Fund performance and expenses, adviser profitability, and other information. The Trustees, acting through their Performance Committee and the Ad Hoc Committee, evaluated this information thoroughly, and met often to discuss it. Performance and expense data was obtained from both Morningstar and Lipper, the leading consultants in this area. The rankings prepared by Morningstar and Lipper were independent and prepared in conformity with the methodologies employed by those organi zations. Counsel for the Funds and the Independent Trustees considered, as did I, the terms and conditions of the existing contracts, and evaluated them in light of the proposed transaction.
In the course of its work, the Trustees also gave careful consideration to the conclusions and recommendations contained in the 2009 Study.
My evaluation of the advisory contracts was shaped, as it has been in the past, by my experience as Chief Compliance Officer of the Trusts ("CCO"). As CCO, I report solely to the Board and have no reporting obligation to, or employment relationship with, Columbia or its affiliates. I have commented on compliance matters in evaluating the quality of service provided by CWAM.
This Report, its supporting materials and the data contained in other materials submitted to the Ad Hoc and Performance Committees of the Board, in my view, provide a thorough factual basis upon which the Board, in consultation with independent counsel as it deems appropriate, may conduct management fee negotiations that are in the best interests of the Funds' shareholders.
The Fee Reductions Mandated under the Order
Under the terms of the Order, Columbia agreed to secure certain management fee reductions for the mutual funds advised by its affiliate investment advisers. In some instances, breakpoints were also established. Although neither CWAM nor the Trusts was a party to the Order, CWAM offered and the Board accepted certain advisory fee reductions during 2005. By the terms of the Order, these fees may not be increased before November 30, 2009, and under the Investment Company Act, may not be increased before March 2012 or later (other than for bona fide additional investment advisory services), if the closing date of the transaction is later than March 2010. I have used these advisory fee levels, as modified thereafter, in this evaluation because they are the fees in the current agreements that CWAM and Ameriprise propose should be continued. Hence, these fee levels are the starting point of an evaluation.
Conclusions
My review of the data and other material above leads to the following conclusions with respect to the factors identified in the Order.
A. Fund Performance
The Domestic Funds: The Acorn Fund has achieved good performance over the past five years, and achieved those results with less risk than its peers. Acorn Select and Wanger Select have enjoyed strong investment returns in the past year, resulting in improved rankings that place those funds near or in the top third of their peers over the trailing five year period. These results are achieved, however, with greater relative risk than the other domestic Funds. Acorn USA and its parallel, Wanger USA have not been as strong as the other Funds relative to their peers over this period, turning in a largely average performance, though both Funds have
20
Wanger Select 2010 Semiannual Report
outperformed their benchmarks. Thermostat is unique and therefore difficult to assess, but now enjoys a Morningstar rank above its peer median. The overall trend for performance of the domestic Funds is positive, and further, all domestic Funds enjoy positive alpha, confirming that their portfolio managers add value to performance.
The International Funds: The international Funds experienced a challenging 12 month period relative to their peers, but their five year rankings remain at or above the median. These Funds have enjoyed periods of strong out-performance during that five year stretch. Further, they have outperformed their benchmarks during the past five years, and done so while exposing shareholders to less risk than competitors. Finally, all the international Funds enjoy positive alpha, again confirming the value of their portfolio managers.
B. Management Fees Relative to Peers
There is significant variance in management fee rankings across the Funds. Acorn International is the only fund that was ranked in the top quartile by both Morningstar and Lipper. The other Acorn funds tend to fall around the medians identified by one or the other service. The WAT funds are uniformly more expensive than their peers.
C. Management Fees Relative to Institutional Account and Other Mutual Fund Accounts
CWAM's focus is on its mutual funds. The few institutional accounts it does manage vary in rate structures. Some pay advisory fees commensurate with or higher than the Acorn and WAT funds. In a few instances, however, institutional accounts pay lower advisory fees than do the Acorn funds. One such institutional account is significant in size and has been under CWAM's management for over 31 years. Further, CWAM performs sub-advisory services for two mutual funds managed by RiverSource, a fund family operated by Ameriprise, at rates that are lower than those paid by the parallel Acorn funds, though sub-advisory services can differ from those necessary for the full support of a mutual fund.
D. Administrative Services
The Acorn and WAT funds' administrative fees are generally less competitive than are the fees charged by competitors, but these rankings suffer from a lack of uniformity in the scope of services encompassed by the fee. CWAM and CMAI provide excellent administrative support for all the Funds.
E. Costs and Benefits to CWAM and its Affiliates
CWAM's direct costs do not appear excessive. Overhead and indirect costs allocated to CWAM by its parent organizations, however, are significant and have varied considerably over the years. CWAM's affiliates report operating losses and therefore do not appear to enjoy excessive "fall out" benefits from CWAM's advisory agreement with the Funds. CWAM continues to enjoy substantial benefits from the use of "soft dollar" payments for research.
F. Profitability
CWAM's profit margins have declined in recent periods, as have the margins of many fund companies, but it still maintains margins that appear to be in the upper range of its competitors.
G. Economies of Scale
Economies of scale do exist at CWAM, and the Board has instituted breakpoints that reflect that reality. In the past two years, however, asset levels have generally declined, and sustained asset growth will be required to trigger additional fee reductions under the current schedule. Asset declines have not, however, resulted in significant fee increases.
H. Nature and Quality of Service
This category includes a variety of considerations that are difficult to quantify, yet can have a significant bearing on the performance of the Acorn and WAT funds. Several areas merit comment.
1. Capacity. CWAM has maintained its investment management capacity even in a difficult environment.
2. Compliance. CWAM has a reasonably designed compliance program that protects shareholders.
I. Process
In my opinion, the process of negotiating an advisory contract for the Funds has been conducted thoroughly and at arms' length. The Ad Hoc Committee has taken the steps necessary to assess the proposed change of ownership and recommended appropriate measures to protect Fund shareholders. It has also taken steps to encourage an agreement on an appropriate incentive plan for CWAM that will facilitate the continuity of management, motivate CWAM professionals and that will align their efforts with the interests of Fund shareholders. The Trustees have sufficient information to evaluate management's proposal, and negotiate contract terms that are in the best interests of fund shareholders.
21
Wanger Select 2010 Semiannual Report
****
Recommendations
I believe the Trustees should:
1. Continue to monitor closely the performance of Acorn USA and Wanger USA, to assess the impact of the portfolio changes implemented by the portfolio manager.
2. Focus their review on the WAT funds' management fee levels in relation to their peers, in particular the fees paid by Wanger Select, which are, in the views of both Morningstar and Lipper, significantly higher than their peers.
3. Take appropriate steps to insure that any integration of the two organizations does not adversely impact Fund shareholders, and continue their efforts to facilitate an agreement on an appropriate incentive plan for CWAM personnel that will both motivate them and align their interests with Fund shareholders.
4. Consider the fees paid by (sub-advisory fees) and to (revenue sharing payments) the proposed new parent organization, Ameriprise or its mutual funds, to identify and address all conflicts of interest.
Robert P. Scales
December 2009
22
Wanger Select 2010 Semiannual Report
[Excerpt from:]
Wanger Advisors Trust
Supplement to the
Management Fee Evaluation of the Senior Officer
Prepared Pursuant to the New York Attorney General's
Assurance of Discontinuance
April 2010
23
Wanger Select 2010 Semiannual Report
Introduction
In December 2009, I prepared a fee evaluation required under the New York Attorney General's Assurance of Discontinuance ("Order") entered into by Columbia Management Advisors, LLC ("CMAI") and Columbia Management Distributors, Inc., ("CMDI") in February 2005. That Order allows CMAI to manage or advise a mutual fund only if the trustees of the fund appoint a "Senior Officer" to perform specified duties and responsibilities. One of these responsibilities includes "managing the process by which proposed management fees (including but not limited to, advisory fees) to be charged the [funds] are negotiated so that they are negotiated in a manner which is at arms' length and reasonable and consistent with this Assurance of Discontinuance."
The Columbia Acorn Trust and Wanger Advisors Trust (collectively, the "Trusts") and each series thereof (the "Acorn Funds," "WAT Funds" or collectively, the "Funds") are overseen by the same Board of Trustees ("Board"). The Order provides that this Board must determine the reasonableness of proposed "management fees" by using either an annual competitive bidding process supervised by the Senior Officer or Independent Fee Consultant, or by obtaining "an annual independent written evaluation prepared by or under the direction of the Senior Officer or the Independent Fee Consultant."
Columbia Wanger Asset Management, L.P. ("CWAM"), is the adviser to the Funds, and at present is a part of Columbia Management Group ("Columbia"), an umbrella organization that also includes CMAI, Columbia Management Services, Inc. ("CMSI") and CMDI. Columbia is owned by Bank of America Corporation ("Bank of America").
On September 29, 2009, Bank of America entered into a Purchase Agreement ("APA") with Ameriprise Financial, Inc. ("Ameriprise") providing for, among other things, the sale of CWAM to Ameriprise and the acquisition by Ameriprise of certain assets of Columbia. The parties contemplate a closing date of the APA in Spring 2010, and closing is conditioned upon the approval by the Board of a new advisory agreement between the Trusts and CWAM, as well as agreements with the entities that will succeed CMSI, CMDI and CMAI. These entities – RiverSource Fund Services, Inc. ("RFS"), RiverSource Fund Distributors, Inc. ("RFD") and RiverSource Investments, LLC — are wholly owned subsidiaries of Ameriprise and currently support the RiverSource family of mutual funds. Therefore, if the sale is consummated as contemplated by the various agreements, CWAM's ownership will change from Bank of America to Ameriprise, as will the Funds' prima ry service providers.
Ameriprise, through various separate accounts ("Accounts") established by certain of its insurance company affiliates, is currently an investor in the WAT Funds on behalf of contract holders in variable insurance policies and variable annuity contracts (together, the "Contracts") that Ameriprise or its affiliates have marketed to their clients. In the WAT structure, the insurance companies purchase shares in the WAT Funds on behalf of the Accounts, which fund the Contracts. The insurance company enters into a participation agreement with Wanger Advisors Trust to purchase shares on behalf of its Accounts. The Accounts are the actual investors in the Wanger Funds, not the individual contract holders. Through this structure, Ameriprise controlled Accounts hold approximately $2 billion or two-thirds of the WAT Funds' total assets; approximately nine other insurance companies also participate in the WAT Funds and hold the remaining a ssets in those Funds. Ameriprise also maintains a small account with CWAM that is a sub-account for a RiverSource mutual fund. This sub-account is not subject to oversight by the WAT or Acorn Board.
Columbia and Ameriprise have proposed that the Trusts continue, in substance, the existing advisory agreement governing portfolio management, and the administration services agreement governing certain administration and clerical services. They propose no change in services and no changes in fee levels, only those changes necessary to effect the change of ownership. The fees paid under these two agreements are referred to as "management fees."
Reasons for this Supplement
This Supplement is prompted by notice given by Ameriprise, after completion of the fee evaluation in December, that following the closing of the transaction, it anticipates a redemption of approximately $1 billion of its clients' investments in two of the WAT Funds (Wanger USA and Wanger International), and re-investment of most of the proceeds in one or more RiverSource mutual funds; CWAM will sub-advise these funds in two new sub-accounts at CWAM and effect investment strategies substantially identical to those pursued by the WAT Funds from which those funds were redeemed. One of the sub-accounts will parallel WAT International/Acorn International, and the other Wanger USA/Acorn USA. Ameriprise has advised the Board of the sub-advisory fees to be paid to CWAM and such sub-advisory fees will be lower than the advisory fee paid to CWAM by the parallel WAT Fund. Sub-advised accounts of this kind are generally considered instituti onal accounts and sub-advisory services are priced differently (and usually lower) than the advisory fees for mutual funds that are not sub-advised.
The Order and the Investment Company Act require fund trustees to consider, among other things, the proposed management fees (including components thereof) charged to institutional and other clients of the adviser for like services. As the Fee Evaluation notes, CWAM historically has maintained very few institutional accounts with relatively few assets under management. The new Ameriprise accounts are, therefore, a departure from past practice at CWAM.
Ameriprise's intentions pose the following issues with respect to assessing the reasonableness of the management fee proposed by Ameriprise for the WAT and Acorn Funds:
1. How do the Funds' fees compare to the fees paid by the parallel institutional accounts?
2. What impact might the redemption have on the fees paid by the shareholders who remain in the WAT Funds after the Ameriprise action?
3. Would expanded assets in the institutional accounts strain CWAM's limited capacity to manage the Acorn and WAT Funds?
24
Wanger Select 2010 Semiannual Report
This Supplement is intended solely to address these points as additional information for consideration by the Trustees in assessing the reasonableness of the management fees proposed by Ameriprise.
****
Conclusions
The conclusions and recommendations in the December 2009 Fee Evaluation remain valid today. Consideration of the Ameriprise redemption proposal leads to the following additional conclusions and recommendations.
A. Reasonableness of the Advisory Fees and Related Considerations
CWAM will soon manage assets in a sub-advised account at fee levels that reflect a substantial discount to the parallel mutual fund. Ameriprise has set forth the differences in services that support its claim that this divergence in fees is justified. These justifications should be revisited by the Trustees. In addition, the redemption will result in higher fees for remaining participants in the WAT Funds, and will result in brokerage and other expenses for Fund participants. These costs should also be a part of the Trustees' calculus in assessing fees. Lastly, the prospect of increased assets for CWAM management raises potential future issues of investment capacity.
B. Process
In my opinion, the process of negotiating an advisory contract for the Funds has been conducted thoroughly and at arms' length. The Board's Contract Committee and its Ad Hoc Committee engaged in a careful assessment of the repercussions of the Ameriprise redemption proposal, assessed as best as possible its potential costs, and revisited the breakpoint schedules of the WAT and Acorn Funds to determine whether WAT Fund participants are treated equitably in relation to Acorn Fund shareholders. It also gave consideration to the fee differential between institutional and mutual fund accounts. The Trustees met on a number occasions with me and with counsel, and gave close attention to a variety of materials including data submitted by Ameriprise and the legal analysis of counsel. The Trustees have sufficient information to evaluate management's proposals, and negotiate contract terms that are in the best interests of fund shareholder s. Lastly, the Trustees considered the recommendations set forth below and the Contract Committee adopted them as appropriate measures to protect shareholders.
Recommendations
In light of the developments discussed in this Supplement, I recommend that the Trustees:
1. Consider imposing an expense cap on Wanger International and Wanger USA that will insulate those participants who remain after the Ameriprise redemption from the impact of increased advisory fees.
2. Consider including in the advisory or related contracts with Ameriprise a provision requiring Ameriprise to reimburse the direct costs of its redemption, insulating remaining Fund participants from the commission and other expenses that will be required to effect the redemption.
3. Consider seeking an agreement on the part of Ameriprise to seek Board approval of new institutional and sub-advised accounts that will result in increased assets under management at CWAM, thereby protecting existing investors from dilution of CWAM's limited investment management capacity.
Robert P. Scales
April 2010
25
Wanger Select 2010 Semiannual Report
Board Approval of the Proposed Advisory Agreement
The Board of Trustees unanimously approved the proposed Investment Advisory Agreement with Columbia Wanger Asset Management, LLC ("Columbia WAM") (the "Proposed Advisory Agreement") for each Fund of the Trust at meetings held on February 24, 2010 and April 6, 2010.
The Ad Hoc Committee on the Sale of Columbia Management Group of the Board and the Contract Committee of the Board (together, the "Committees"), which are comprised solely of Trustees who have no direct or indirect interest in the Proposed Advisory Agreement and who are not "interested persons" (as defined in the Investment Company Act of 1940, as amended (the "1940 Act")), of the Trust (the "Independent Trustees"), and all Trustees received and reviewed a substantial amount of information provided by Columbia WAM and Ameriprise Financial, Inc. ("Ameriprise") in response to requests from the Independent Trustees and their independent legal counsel. Throughout the process, the Trustees had numerous opportunities to ask questions of and request additional materials from Columbia WAM and Ameriprise.
During each meeting at which the Committees or the Independent Trustees considered the Proposed Advisory Agreement, they met in executive session with their independent legal counsel. The Committees also met separately with representatives of Ameriprise, Columbia Management Group, LLC ("CMG") and Columbia WAM management on several different occasions. In all, one or other of the Committees convened formally on 22 separate occasions to consider the sale of a portion of the asset management business of CMG, including 100% of Columbia WAM, by Bank of America Corporation ("Bank of America") to Ameriprise (the "Transaction"), and convened informally on many other occasions. The Board and/or some or all of the Independent Trustees met on at least 6 other occasions to receive the Committees' status reports on the Transaction, receive presentations from Ameriprise and Columbia WAM representatives, and to discuss outstanding issues. In a ddition, the Independent Trustees' counsel and the Trust's Chief Compliance Officer conducted on-site due diligence sessions at Ameriprise. As they considered the Proposed Advisory Agreement, the Independent Trustees were advised by independent legal counsel.
The Trustees reviewed the Proposed Advisory Agreement, as well as certain information obtained through Ameriprise's responses to initial and supplemental questionnaires prepared at the request of the Trustees by counsel to the Funds and independent legal counsel to the Independent Trustees. In addition, the Trustees reviewed the Management Fee Evaluation dated December 2009 and the Supplement thereto dated April 2010 (the "Fee Evaluation") prepared by, the Trust's chief compliance officer, senior vice president and general counsel, who also serves as the Trust's "Senior Officer," as contemplated by the Assurance of Discontinuance dated February 9, 2005 among affiliates of Columbia WAM and the Office of the New York Attorney General. Finally, the Trustees considered certain additional contractual protections they had obtained from Ameriprise in the event of a material compliance violation or harm caused to shareholders during the conversion of certain operational services as a result of the Transaction.
The materials reviewed by the Committees and the Trustees included, among other items, (i) information on the investment performance of each Fund and of independently selected peer groups of funds and of the Fund's performance benchmarks over various time periods, (ii) information on each Fund's advisory fees and other expenses, including information comparing the Fund's fees and expenses to those of peer groups of funds and information about any applicable expense limitations and fee breakpoints, (iii) data on sales and redemptions of Fund shares, and (iv) information on the profitability to Columbia WAM and Ameriprise, as well as potential "fall-out" or ancillary benefits that Columbia WAM and its affiliates may receive as a result of their relationships with the Funds. The Trustees also considered other information such as (i) Columbia WAM's financial condition, (ii) each Fund's investment objective and strategy, (iii) the si ze, education and experience of Columbia WAM's investment staff and its use of technology, external research and trading cost measurement tools, (iv) information on Ameriprise's approach to retention and compensation of portfolio managers and the terms of the new incentive compensation plan for Columbia WAM investment personnel, (v) the allocation of the Funds' brokerage, and the use of "soft" commission dollars to pay for research products and services, (vi) the resources devoted to, and the record of compliance with, the Funds' investment policies and restrictions, policies on personal securities transactions and other compliance policies, and (vii) Ameriprise's management structure, financial condition and its intentions for managing the Funds and the respective service providers.
In considering whether to approve the Proposed Advisory Agreement, the Trustees reviewed and analyzed various factors that they determined were relevant, none of which by itself was considered dispositive. However, the material factors and conclusions that formed the basis for the Trustees' determination to approve the Proposed Advisory Agreement are discussed separately below.
Nature, quality and extent of services. The Trustees reviewed the expected nature, quality and extent of the services to be provided by Columbia WAM and its affiliates to the Funds under the Proposed Advisory Agreement, taking into account the investment objective and strategy of each Fund. In addition, the Trustees reviewed the available resources and key personnel of Columbia WAM and Ameriprise, especially those providing investment management services to the Funds. The Trustees also considered other services to be provided to the Funds by Columbia WAM, including: managing the execution of portfolio transactions and selecting broker-dealers for those transactions; monitoring adherence to the Funds' investment restrictions; producing shareholder reports; providing support services for the Board and committees of the Board; communicating with sharehol ders; serving as the Funds' administrator; and overseeing the activities of the Funds' other service providers, including monitoring for compliance with various policies and procedures as well as applicable securities laws and regulations. The Trustees reviewed each of these factors in light of the expected change of control of Columbia WAM and the likelihood of possible changes as a result of the Transaction.
In addition, in connection with the Transaction, the Board considered:
• the reputation, financial strength, regulatory histories and resources of Ameriprise and its affiliates;
• the terms of the Proposed Advisory Agreement, including the difference between the Current and Proposed Advisory Agreements, as set forth in this Proxy Statement, including that Columbia WAM had agreed to a higher standard of care for non-investment services in the Proposed Advisory Agreement;
• the terms and conditions of other agreements and arrangements relating to the future operations of the Funds, including the Underwriting Agreement and the Transition Services Agreement, both between Ameriprise and Bank of America; the Administration Services Agreement, between Columbia WAM and the Funds; the Shareholders' Servicing and Transfer Agent Agreement, between RiverSource Services Corporation and the Funds; the Underwriting Agreement between RiverSource Fund Distributors, Inc. and the Funds; and the Transition, Integration and Conversion Principles Agreement and the Compliance Agreement, both between Ameriprise and the Funds;
• that the Trustees recently had completed a full annual review of the Current Advisory Agreement for each Fund under the 1940 Act, and had determined that they were satisfied with the nature, extent and quality of services provided thereunder and that they had determined that the management fees were reasonable in relation to the services rendered; and
• that Ameriprise and Bank of America, and not the Funds, would bear all costs of obtaining approvals of the Proposed Advisory Agreement, including legal and Trustee fees and costs resulting from the Transaction.
26
Wanger Select 2010 Semiannual Report
Board Approval of the Proposed Advisory Agreement
The Trustees concluded that the expected nature, quality and extent of the services to be provided by Columbia WAM to each Fund under the Proposed Advisory Agreement were appropriate for the Funds. They also concluded that Columbia WAM currently had sufficient personnel, with appropriate education and experience, to serve the Funds effectively, and that the firm had demonstrated its continuing ability to attract and retain well-qualified personnel. The Trustees also believed that Columbia WAM investment personnel would continue to be compensated pursuant to a plan that was designed to align their interests with those of Fund shareholders. The Trustees also considered that Columbia WAM had maintained its investment management capacity and resources throughout a difficult economic environment. In addition, they took note of the quality of Columbia WAM's compliance record. The Trustees also took into consideration that Ameriprise h ad offered its assurances that the services provided to the Funds following the Transaction would be consistent with or better than the manner and level at which such services were currently being performed for the Funds and that there would be no diminution of services to the Funds or their shareholders as a result of the Transaction. In this regard, the Trustees considered that certain current senior executives of CMG who are currently responsible for oversight of certain services provided to the Funds would continue to oversee those services after the closing of the Transaction. The Trustees also believed that the higher standard of care in the Proposed Advisory Agreement would benefit shareholders. The Trustees further recognized that the investment personnel of Columbia WAM would, effective upon a change of control of Columbia WAM to Ameriprise, be subject to employment agreements and other terms of employment created for the purpose of retaining skilled investment personnel. Assuming such personnel rem ain in place following the change in control, the Trustees concluded that the Transaction would not result in a diminution of investment services provided to the Funds.
Performance of the Funds. The Trustees received and considered detailed performance information at various meetings of the Board and of the Investment Performance Analysis Committee of the Board throughout the year in addition to performance information considered in connection with the Transaction. They reviewed information comparing each Fund's performance with that of its benchmark(s) and with the performance of comparable funds and peer groups as identified by Lipper Inc. ("Lipper") and Morningstar, Inc. ("Morningstar"). The Trustees evaluated the performance of the Funds over various time periods. However, they gave somewhat more consideration to the rolling three-year performance of each Fund.
More particularly, with respect to the domestic Funds, the Trustees noted that Wanger Select equaled its Morningstar peer group median while underperforming its Lipper peer group median and its benchmark for the three-year period ended September 30, 2009. Wanger USA underperformed its peer group medians but outperformed its benchmark over the three-year period. For the five-year period ended September 30, 2009, Wanger Select outperformed its peer group medians and primary benchmark and Wanger USA underperformed its peer group medians but outperformed its benchmark.
With respect to the international Funds, the Trustees considered that Wanger International and Wanger International Select both outperformed their peer group medians and benchmarks for the three year and five-year periods ended September 30, 2009.
The Trustees concluded that, although past performance is not necessarily indicative of future results, the strong overall longer-term performance record of the Funds was an important factor in the evaluation of the expected quality of services to be provided by Columbia WAM under the Proposed Advisory Agreement for each Fund and also supported approval.
Costs of Services and Profits Realized by Columbia WAM. The Trustees noted that Ameriprise and Columbia WAM were not proposing any changes in investment advisory or administration fees or total operating expenses in connection with the Transaction. At various Committee and Board meetings and other informal meetings, the Trustees examined detailed information on the fees and expenses of each Fund in comparison to information for comparable funds provided by Lipper and Morningstar. The Trustees reviewed the observations in the Fee Evaluation relating to the lack of uniformity in the Funds' rankings, and noted that the Funds are assessed by Morningstar and Lipper in relation to peers selected only from the variable annuity universe. As noted in the Fee Evaluation, the actual advisory fees paid by Wanger Select and Wanger International Select were higher than the median advisory fees of each Fund's respective Morningstar and Lipper peer groups and the actual advisory fee paid by the Wanger USA was higher than the median advisory fee of the Fund's Morningstar peer group, but not of its Lipper peer group. The actual advisory fee paid by Wanger International was higher than the median advisory fee of the Fund's Lipper peer group, but not of its Morningstar peer group. Total management fees for one of the four Funds, Wanger International, were lower than its Morningstar peer group median, but none of the Funds had total management fees equal to or lower than its respective Lipper peer group median. The Trustees also considered that the total expenses paid by investors compared to total expenses charged by other peer funds, which they also considered to be a meaningful comparison.
The Trustees reviewed the analysis of the historic profitability of Columbia WAM in serving as each Fund's investment adviser and of Columbia WAM and its affiliates in their relationships with each Fund, as well as an explanation of the methodology utilized in allocating various expenses among the Funds and other business units, each of which was included in the Fee Evaluation. The Trustees considered the current methodology used by Columbia WAM in determining compensation payable to portfolio managers and the competitive market for investment management talent. In addition, the Trustees considered the expected profitability of Columbia WAM related to the Funds following the Transaction; however, they determined that profitability projections at this time were speculative, at best. The Trustees noted that Columbia WAM's profit margins had declined recently, in line with industry trends, as a result of reduced assets under manage ment. Nevertheless, based on limited comparative data, its current margins appeared to be in the upper range of competitors. They discussed how profitability comparisons among fund managers are of limited probative value due to the small number of publicly-owned managers, and that the profitability of any investment manager is affected by numerous factors, including its particular organizational structure, the types of funds and other accounts managed, other lines of business, expense allocation methodology, capital structure and cost of capital.
The Trustees also reviewed the advisory fee rates charged by Columbia WAM for managing other investment companies (including the Columbia Acorn Funds), sub-advised funds and other institutional separate accounts, as detailed in the Fee Evaluation. The Trustees noted that the Columbia Wanger Funds' advisory fees were generally comparable to the Columbia Acorn Funds' advisory fees. Columbia WAM's institutional separate account fees for various investment strategies were also examined; in some cases those fees were higher than the advisory fees charged to the Funds, and in some instances the fees were lower. The Trustees noted that Columbia WAM performs significant additional services for the Funds that it does not provide to sub-advised funds or non-mutual fund clients, including administrative services, oversight of the Funds' other service providers, trustee support, regulatory compliance and numerous other services, and that, i n servicing the Funds, Columbia WAM assumes many legal risks that it does not assume in servicing its non-fund clients.
The Trustees concluded that the rates of advisory fees and other compensation to be payable by the Funds to Columbia WAM and its affiliates were reasonable in relation to the nature and quality of the services to be provided, taking into account the fees charged by other advisers for managing comparable mutual funds with similar strategies and the fees Columbia WAM charges to other clients. The Trustees also concluded that the Funds' estimated overall expense ratios were reasonable, considering the quality of
27
Wanger Select 2010 Semiannual Report
Board Approval of the Proposed Advisory Agreement
services provided by Columbia WAM and its affiliates and the investment performance of the Funds.
Economies of Scale. At various Committee and Board meetings and other informal meetings, the Trustees considered information about the extent to which Columbia WAM realizes economies of scale in connection with an increase in Fund assets. The Trustees noted that the advisory fee schedule for each Fund includes breakpoints in the rate of fees at various asset levels. The Trustees concluded that the fee structure of each Fund was reasonable and reflective of a sharing between Columbia WAM and the Funds of economies of scale.
Other Benefits to Columbia WAM. The Trustees also reviewed benefits that could be expected to accrue to Columbia WAM and its affiliates from their relationships with the Funds, as outlined in the Fee Evaluation. They noted that, in connection with the Transaction, the Funds' transfer agency agreement would be assigned to RiverSource Service Corporation (now known as Columbia Management Investment Services Corp.), an affiliate of Ameriprise, which would receive compensation from the Funds for services provided. They considered that an affiliate of Ameriprise, RiverSource Funds Distributors, Inc. (now known as Columbia Management Investment Distributors, Inc.), would serve as the new distributor under an underwriting agreement containing substantially the same terms as the Funds' existing underwriting agreement with an affiliate of Columbia WAM. In addi tion, the sub-administration agreement between Columbia WAM and a current affiliate would be transferred to an Ameriprise affiliate. The Trustees also considered other ways that the Funds and Columbia WAM may potentially benefit from their relationship with each other. For example, the Trustees considered Columbia WAM's use of commissions paid by each Fund on its portfolio brokerage transactions to obtain research products and services benefiting the Fund and/or other clients of Columbia WAM and noted that no material changes were being contemplated by Columbia WAM regarding its policies and procedures in respect of soft dollars as a result of the change in ownership of Columbia WAM. They determined that Columbia WAM's use of the Funds' "soft" commission dollars to obtain research products and services was consistent with current regulatory requirements and guidance. They also concluded that Columbia WAM benefits from the receipt of proprietary research products and services acquired through commissions paid on portfolio transactions of the Funds, and that the Funds benefit from Columbia WAM's receipt of those products and services as well as research products and services acquired through commissions paid by other clients of Columbia WAM.
Section 15(f) of the 1940 Act. The Trustees also considered whether the arrangements between Columbia WAM and the Funds comply with the conditions of Section 15(f) of the 1940 Act. Section 15(f) provides a non-exclusive safe harbor under which an investment adviser to an investment company or any of its affiliated persons may receive any amount or benefit in connection with a change in control of the investment adviser provided two conditions are met. First, for a period of three years after closing of the transaction, at least 75% of the board members of the investment company may not be "interested persons" (as defined in the 1940 Act) of the investment adviser or predecessor adviser. Second, an "unfair burden" must not be imposed upon the investment company as a result of the transaction or any express or implied terms, conditions or understandings applicable thereto. The term "unfair burden" is defined in Section 15(f) to include any arrangement during the two-year period after the closing of the transaction whereby the investment adviser (or predecessor or successor adviser) or any interested person of any such investment adviser, receives or is entitled to receive any compensation, directly or indirectly, from the investment company or its shareholders (other than fees for bona fide additional investment advisory or other services) or from any person in connection with the purchase or sale of securities or other property to, from or on behalf of the investment company (other than bona fide ordinary compensation as principal underwriter for the investment company).
In connection with the first condition of Section 15(f), the Trustees concluded that upon closing of the Transaction at least 75% of the Trustees would not be "interested persons" (as defined in the 1940 Act) of the Adviser and would be in compliance with this provision of Section 15(f). With respect to the second condition of Section 15(f), Columbia WAM and Ameriprise represented in writing that no advisory or distribution fee increases were contemplated during the two years following the Transaction. The Trustees also noted that, to the extent future transactions are contemplated and recommended following the Transaction, Columbia WAM and Ameriprise represented that they would not seek any change that would impose an "unfair burden" on the Trust.
After full consideration of the above factors, as well as other factors that were instructive in evaluating the Proposed Advisory Agreement for each Fund, the Trustees, including the Independent Trustees, concluded on February 24, 2010 that the approval of the Proposed Advisory Agreement was in the best interest of each Fund, and they approved the Agreement and recommended that the shareholders of each Fund approve the Agreement for their Fund.
Following the Board's approval of the Proposed Advisory Agreement for each Fund on February 24, 2010, Ameriprise advised the Board that it anticipated that a significant amount of the existing assets of Wanger International and Wanger USA, representing the interests of owners of contracts issued by life insurance companies affiliated with Ameriprise, would be redeemed in spring 2010 (the "Proposed Redemption"). These assets would be reinvested in two RiverSource Funds (the "New Institutional Accounts") that have similar investment objectives and strategies to Wanger International and Wanger USA. The New Institutional Accounts would be sub-advised by Columbia WAM for investment sub-advisory fees that were proposed to be lower than the advisory fees of their Columbia Wanger Fund counterparts. The Board therefore determined that the proposed redemption and the existence of the New Institutional Accounts to be sub-advised by Columbi a WAM warranted another review of the Proposed Advisory Agreement for each Fund and the fees paid thereunder.
The Committees then met in the aggregate on four occasions in March 2010, including once with representatives of Ameriprise, to review and consider the Proposed Redemption and the New Institutional Accounts and the implications of these transactions with respect to their consideration of the Proposed Advisory Agreement for each Fund. In their deliberations, the Trustees received and reviewed a supplement dated April 2010 ("Supplement") to the Fee Evaluation prepared by the Senior Officer, which contained an analysis of both the Proposed Redemption and the potential impact on the remaining shareholders in the Funds. The Supplement also reviewed the fees related to the New Institutional Accounts. The Trustees were also advised by independent counsel at each of these meetings.
With respect to the Proposed Redemption, the Trustees considered that Ameriprise had agreed to a fee cap on the advisory fees of Wanger International and Wanger USA for a period of two years from the redemption date, such that the remaining shareholders in these Funds would not experience any increase in advisory fees as a result of the Proposed Redemption. The Trustees further considered that Ameriprise had also agreed with the Trust to minimize the potential for adverse effects to Wanger International and Wanger USA from any economic harm caused by the redemption proposal by reimbursing for transaction costs related to the Proposed Redemption including brokerage commissions and transfer fees (but not market impact costs).
With respect to the New Institutional Accounts, the Trustees considered information submitted by Ameriprise regarding the sub-advisory fees payable to Columbia WAM for investment advisory services rendered to the accounts. The Trustees also considered that the sub-advisory fees payable were
28
Wanger Select 2010 Semiannual Report
Board Approval of the Proposed Advisory Agreement
substantially the same as an existing RiverSource Fund account sub-advised by Columbia WAM. The Trustees considered the explanations previously provided by Columbia WAM for the differences in advisory fees paid by the Funds and Columbia WAM's other similar institutional accounts. The Trustees also considered Ameriprise's and Columbia WAM's agreement that they would not agree to, or submit a proposal to, manage new institutional accounts without the express approval of the Board. The Board believed that this provision was necessary in order to protect Columbia WAM's investment capacity and the resulting quality of its investment services with respect to the Funds.
The Trustees also considered the performance of the Funds over various time periods ended December 31, 2009. Wanger USA outperformed its primary benchmark and Morningstar peer group median over the three-year period ended December 31, 2009, but underperformed its Lipper peer group median over that same period. Wanger Select outperformed its Morningstar peer group median over the three-year period, but underperformed its Lipper peer group median and primary benchmark over that same period. Both Wanger International and Wanger International Select outperformed their respective peer groups and primary benchmarks for the three-year period. For the five-year period ended December 31, 2009, each Fund outperformed its primary benchmark.
Taking all of the foregoing factors into account as well as the continued satisfactory performance of the Funds since the last Board meeting and other factors they deemed relevant, the Trustees, including all of the independent Trustees, concluded again on April 6, 2010 that the approval of the Proposed Advisory Agreement was in the best interest of each Fund, and they affirmed the approval of the Agreement and recommended that the shareholders of each Fund approve the Agreement for their Fund.
29
Wanger Select 2010 Semiannual Report
Proxy Voting Results
On May 27, 2010, a special meeting of shareholders of Wanger Advisors Trust (the "Trust") was held to ask shareholders of each Fund of the Trust to: (1) consider and vote on a proposed Investment Advisory Agreement for the Fund with CWAM, which became a subsidiary of Ameriprise Financial; and (2) elect eleven trustees to the Trust's Board of Trustees (the "Board"). A proxy statement that described the proposals was mailed to shareholders of record as of April 8, 2010.
Proposal 1: A proposed Investment Advisory Agreement with CWAM was approved for the Fund, as follows:
| Fund | | Votes For | | Votes Against | | Abstentions | | Broker Non-Votes* | |
| Wanger Select | | | 5,251,589 | | | | 707,767 | | | | 217,774 | | | | 0 | | |
* Shares held of record by a financial intermediary, such as a broker or nominee, typically held in "street name," as to which (i) written voting instructions on the matter have not been received from the beneficial owners or persons entitled to vote and (ii) the intermediary does not have discretionary voting power on the matter.
Proposal 2: Each of the trustee nominees was elected to the Board, as follows:
| Fund | | Votes For | | Votes Against | | Abstentions | |
| Laura M. Born | | | 93,621,627 | | | | 4,677,959 | | | | 0 | | |
| Michelle L. Collins | | | 93,862,814 | | | | 4,436,772 | | | | 0 | | |
| Maureen M. Culhane | | | 93,620,353 | | | | 4,679,233 | | | | 0 | | |
| Margaret M. Eisen | | | 93,949,255 | | | | 4,350,330 | | | | 0 | | |
| John C. Heaton | | | 93,852,982 | | | | 4,446,603 | | | | 0 | | |
| Steven N. Kaplan | | | 93,803,548 | | | | 4,496,038 | | | | 0 | | |
| David C. Kleinman | | | 93,545,604 | | | | 4,753,982 | | | | 0 | | |
| Charles P. McQuaid** | | | 93,886,104 | | | | 4,413,482 | | | | 0 | | |
| Allan B. Muchin | | | 93,539,358 | | | | 4,760,228 | | | | 0 | | |
| David B. Small | | | 93,966,760 | | | | 4,332,826 | | | | 0 | | |
| James A. Star | | | 93,923,838 | | | | 4,375,748 | | | | 0 | | |
** Mr. McQuaid is an "interested person" of the Trust and of CWAM because he is an officer of the Trust and of CWAM.
30
Wanger Select 2010 Semiannual Report
This page intentionally left blank.
31
Wanger Select 2010 Semiannual Report

Columbia Wanger Funds
Trustees
James A. Star
Chairman of the Board
Steven N. Kaplan
Vice Chairman of the Board
Laura M. Born
Michelle L. Collins
Maureen M. Culhane
Margaret M. Eisen
John C. Heaton
David C. Kleinman
Charles P. McQuaid
Allan B. Muchin
David B. Small
Ralph Wanger (Trustee Emeritus)
Officers
Charles P. McQuaid
President
Ben Andrews
Vice President
Michael G. Clarke
Assistant Treasurer
P. Zachary Egan
Vice President
John M. Kunka
Assistant Treasurer
Joseph C. LaPalm
Vice President
Bruce H. Lauer
Vice President, Secretary and Treasurer
Louis J. Mendes III
Vice President
Robert A. Mohn
Vice President
Christopher J. Olson
Vice President
Christopher O. Petersen
Assistant Secretary
Scott R. Plummer
Assistant Secretary
Linda K. Roth-Wiszowaty
Assistant Secretary
Robert P. Scales
Chief Compliance Officer, Chief Legal Officer, Senior Vice President and
General Counsel
Transfer Agent,
Dividend Disbursing Agent*
Columbia Management Investment Services Corp.
P.O.Box 8081
Boston, Massachusetts
02266-8081
Distributor*
Columbia Management Investment Distributors, Inc.
One Financial Center
Boston, Massachusetts
02111-2621
Investment Advisor
Columbia Wanger Asset Management, LLC
227 West Monroe Street, Suite 3000
Chicago, Illinois 60606
1-888-4-WANGER
(1-888-492-6437)
Legal Counsel to the Funds
K&L Gates LLP
Washington, DC
Legal Counsel to the Independent Trustees
Drinker Biddle & Reath LLP
Philadelphia, Pennsylvania
Independent Registered Public Accounting Firm
PricewaterhouseCoopers LLP
Chicago, Illinois
* As of May 1, 2010
This report, including the schedules of investments and financial statements, is submitted for the general information of the shareholders of the Wanger Advisors Trust.
A description of the Fund's proxy voting policies and procedures and a copy of the Fund's voting record for the most recent 12-month period ended June 30 are available (i) on the Securities and Exchange Commission's website at www.sec.gov, and (ii) without charge, upon request, by calling 888-492-6437.
The Fund files a complete schedule of portfolio holdings with the SEC for the first and third quarters of each fiscal year on Form N-Q. The Fund's Form N-Q is available on the SEC's website at www.sec.gov and may be reviewed and copied at the SEC's Public Reference Room in Washington, D.C. Information on the operation of the Pubic Reference Room may be obtained by calling 800-SEC-0330. The Fund's complete portfolio holdings are disclosed at www.columbiafunds.com approximately 30 days after each month-end.
32
Columbia Wanger Funds
© 2010 Columbia Management Investment Advisers, LLC. All rights reserved.
C-1465 A (8/10) 103618
Wanger USA
2010 Semiannual Report

Not FDIC insured • No bank guarantee • May lose value

Wanger USA
2010 Semiannual Report
Table of Contents
| | 1 | | | Understanding Your Expenses | |
|
| | 2 | | | The School that Changed the World | |
|
| | 4 | | | Performance Review | |
|
| | 6 | | | Statement of Investments | |
|
| | 14 | | | Statement of Assets and Liabilities | |
|
| | 14 | | | Statement of Operations | |
|
| | 15 | | | Statement of Changes in Net Assets | |
|
| | 16 | | | Financial Highlights | |
|
| | 17 | | | Notes to Financial Statements | |
|
| | 21 | | | Management Fee Evaluation of the Senior Officer | |
|
| | 29 | | | Board Approval of the Proposed Advisory Agreement | |
|
| | 33 | | | Proxy Voting Results | |
|
Columbia Wanger Asset Management, LLC ("CWAM") is one of the leading global small- and mid-cap equity managers in the United States with 40 years of small- and mid-cap investment experience. As of June 30, 2010, CWAM managed $26.1 billion in assets, and is the investment advisor to Wanger USA, Wanger International, Wanger Select and Wanger International Select (together, the "Columbia Wanger Funds") and the Columbia Acorn Family of Funds.
Important Information Regarding the Acquisition of the Long-term Asset Management Business
of Columbia Management Group, LLC
On April 30, 2010, Ameriprise Financial, Inc., ("Ameriprise Financial"), the parent company of RiverSource Investments, LLC, acquired the long-term asset management business of Columbia Management Group, LLC, including certain of its affiliates, which were, prior to this acquisition, part of Bank of America Corporation. In connection with this acquisition, Ameriprise Financial acquired CWAM. CWAM will continue as the investment advisor for the Columbia Acorn and Wanger Funds, and no changes are anticipated in the existing investment management team. Also in connection with this acquisition, Columbia Management Investment Distributors, Inc., member FINRA, became the distributor and principal underwriter of the Funds and Columbia Management Investment Services Corp. became the transfer agent of the Funds.
Investors should consider the investment objectives, risks, charges and expenses of a mutual fund carefully before investing. For a free prospectus, which contains this and other important information about the Fund, contact your financial advisor or insurance company or contact 1-888-4-WANGER.
An important note: Columbia Wanger Funds are sold only to certain life insurance companies in connection with certain variable annuity contracts, variable life insurance policies and eligible qualified retirement plans.
The views expressed in "The School that Changed the World" and in the Performance Review reflect the current views of the respective authors. These views are not guarantees of future performance and involve certain risks, uncertainties and assumptions that are difficult to predict so actual outcomes and results may differ significantly from the views expressed. These views are subject to change at any time based upon economic, market or other conditions and the respective parties disclaim any responsibility to update such views. These views may not be relied on as investment advice and, because investment decisions for a Columbia Wanger Fund are based on numerous factors, may not be relied on as an indication of trading intent on behalf of any particular Columbia Wanger Fund. References to specific company securities should not be construed as a recommendation or investment advice.
Wanger USA 2010 Semiannual Report
Understanding Your Expenses
As a Fund shareholder, you incur three types of costs. There are transaction costs, which generally include sales charges on purchases and may include redemption or exchange fees. There are also ongoing costs, which generally include investment advisory fees and other Fund expenses. Lastly, there may be additional fees or charges imposed by the insurance company that sponsors your variable annuity product. The information on this page is intended to help you understand your ongoing costs of investing in the Fund and to compare these costs with the ongoing costs of investing in other mutual funds.
Analyzing your Fund's expenses
To illustrate these ongoing costs, we have provided an example and calculated the expenses paid by investors in the Fund during the period. The information in the following table is based on an initial, hypothetical investment of $1,000, which is invested at the beginning of the period and held for the entire period. Expense information is calculated two ways and each method provides you with different results. The amount listed in the "Actual" column is calculated using actual operating expenses and total return for the Fund. The amount listed in the "Hypothetical" column assumes that the return each year is 5% before expenses and then applies the Fund's actual expense ratio for the period to the hypothetical return. You should not use the hypothetical account values and expenses to estimate either your actual account balance at the end of the period or the expenses you paid during the period. See "Compare with other funds" for details on using the hypothetical data.
Estimating your actual expenses
To estimate the expenses that you actually paid over the period, first you will need your account balance at the end of the period.
1. Divide your ending account balance by $1,000. For example, if an account balance was $8,600 at the end of the period, the result would be 8.6.
2. In the section of the table below titled "Expenses paid during the period," you will find a dollar amount in the column labeled "Actual." Multiply this amount by the result from step 1. Your answer is an estimate of the expenses you paid on your account during the period.
January 1, 2010 – June 30, 2010
| | | Account value at the
beginning of the period ($) | | Account value at the
end of the period ($) | | Expenses paid
during the period ($) | | Fund's annualized
expense ratio (%)* | |
| | | Actual | | Hypothetical | | Actual | | Hypothetical | | Actual | | Hypothetical | | Actual | |
| Wanger USA | | | 1,000.00 | | | | 1,000.00 | | | | 938.10 | | | | 1,019.98 | | | | 4.66 | | | | 4.86 | | | | 0.97 | | |
*For the six months ended June 30, 2010.
Expenses paid during the period are equal to the Fund's annualized expense ratio, multiplied by the average account value over the period, then multiplied by the number of days in the Fund's most recent fiscal half-year and divided by 365.
Had the investment advisor not waived fees or reimbursed a portion of expenses, account value at the end of the period would have been reduced.
It is important to note that the expense amounts shown in the table are meant to highlight only ongoing costs of investing in the Fund. Expenses paid during the period do not include any insurance charges imposed by your insurance company's separate account. The hypothetical example provided is useful in comparing ongoing costs only and will not help you determine the relative total costs of owning different funds whose shareholders may incur transaction costs.
Compare with other funds
Since all mutual funds are required to include the same hypothetical calculations about expenses in shareholder reports, you can use this information to compare the ongoing cost of investing in the Fund with other funds. To do so, compare the 5% hypothetical example with the 5% hypothetical examples of other funds. As you compare hypothetical examples of other funds, it is important to note that hypothetical examples are meant to highlight the ongoing cost of investing in a fund and do not reflect any transaction costs, such as sales charges, redemption fees or exchange fees that may be incurred by shareholders of other funds. Expenses paid during the period do not include any insurance charges imposed by your insurance company's separate accounts.
1
Wanger USA 2010 Semiannual Report

The School that Changed the World
Chicago is known for a lot of things. Yes, this city's ability to stuff ballot boxes and pizzas is legendary, but the number of Nobel Prize winners who have hailed from the University of Chicago is one of Chicago's greatest distinctions. The University's faculty, students and researchers have been awarded 85 Nobel Prizes across all fields, nearly as many as first-place Cambridge University, which has 87.
The University of Chicago holds nearly a 40% share of the Nobel Prizes awarded in economics to date. The great thinkers who received these awards, and those who influenced them, helped trigger a world-wide shift towards capitalism, resulting in enhanced prosperity and freedom around the globe. These are the men and women of the "Chicago School."
The Chicago School
Between the Great Depression and the 1970s, many in government and academia believed that increasingly centralized economic planning was inevitable. Much of the world was subjected to communism, socialism, or other sorts of command economies. Government in the United States grew rapidly during this period, as did regulation of businesses. During this time, William F. Buckley was not the only one who stood athwart history and yelled, "Stop!"
Starting in the 1950s, references to a "Chicago School" began to appear, referring to the economists, business researchers, lawyers and sociologists from the University of Chicago who disagreed with the "more government" thinking of the time. In the first written reference to the Chicago School, found in a handbook on the history of economic thought, members of the Chicago School were described as follows:
Libertarians all, they preferred rules to authorities and the impersonal forces of the market to their deliberate direction, and they viewed with alarm the increasing scope of governmental activities in the economic sphere.1
Frank Knight and Jacob Viner are considered founders of the Chicago School. Knight set a tone; he was intellectually rigorous, devoted to knowledge, skeptical of authority and cynical of planned economies. Knight believed capitalism was the only acceptable system by default, as other systems were worse. Viner was a terror to his students in the classroom but otherwise very helpful; he elevated neoclassical price theory2 into a core element for economics education at U. of C. Both men personally taught Nobel winners, but became ineligible for Nobel prizes upon their deaths soon after the economics award was first presented in 1969.
In his book titled, The Chicago School,3 Johan Van Overtveldt lists five characteristics that he believes underpin the success of this influential group. First, a strong work ethic. Locally, U. of C. is known as the university "where fun goes to die." But for some people, interesting work appears to be fun.
Next, economics is treated as a true science. Theories are tested and, unless backed by evidence, are disregarded.
Third, academic excellence is the sole criterion for advancement. Although the school is known for free-market advocacy, it attracts and cultivates fiercely independent thinkers with divergent views; some U. of C. professors, in contrast, have attacked elements of the capitalistic system.
Fourth, the Chicago School has a strong debating culture. Economic theories are critiqued by interdisciplinary workshops, often attended by professors of business, law and sociology to name a few. (Many of the University of Chicago's Nobel winners in economics have been associated with its business and law schools.) Work is subject to an intense, critical review process and heated debates are common.
Fifth, the University of Chicago is relatively isolated. Located on the shore of Lake Michigan and otherwise surrounded by tough neighborhoods, U. of C. tends to have many faculty members who live in its enclave, allowing academic discussions to extend well beyond classrooms.
Chicago School Economists and Their Work
Milton Friedman was a student of Knight and Viner and, in 1946, he accepted an offer to teach economics at the University of Chicago (a position opened by Viner's departure). Friedman taught at the University of Chicago for the next 30 years. His research centered on monetary theory and consumption analysis. He documented how a one-third cut in the money supply turned what could have been a normal recession into the Great Depression. Although Friedman was skeptical of government and endorsed steady growth in the money supply, his theories induced policymakers to ease credit during the dot.com bust and the more recent housing bubble. Though tremendous wealth was lost during both events, economic depressions were avoided, likely due to the monetary ease.
Friedman is perhaps best known for his influence on public policy. Like many other Chicago economists, he believed in free markets and minimal government interference in the economy. Unlike others, he popularized those notions.
Friedman believed that competition was morally superior to government control, as consumers and producers are free to choose in a capitalistic system, but are often coerced in other systems.4 He and other Chicago economists went so far as to advocate no regulations of some monopolies, stating that monopolies tend to be temporary and regulators often cause long-lasting inefficiencies and politically inspired anomalies.
Friedman was often criticized for his policy recommendations, and some of the criticisms, in hindsight, now appear laughable. One such article, published in the 1970s, attacked Friedman on the grounds that competition was imperfect and firms like General Motors and IBM had considerable
2
Wanger USA 2010 Semiannual Report
market power and stifled competition. It's now safe to say that Friedman was right, as competition and technological change reduce market power over time. In 1976, Friedman won the Nobel Prize in Economics "for his achievements in the fields of consumption analysis, monetary history and theory, and for his demonstration of the complexity of stabilization policy."
Economist Theodore Schultz analyzed agricultural policies first at Iowa State, but his work was attacked by Iowa's powerful dairy lobby. He joined the University of Chicago faculty in 1944, continuing his work. He concluded that 30% to 40% of farm productivity gains in the United States were driven by increasing the skills of farmers and investing in "human capital." Chicago School economist D. Gale Johnson was greatly inspired by Schultz's work. He also joined the University of Chicago in 1944 and the two worked together for nearly 50 years. Johnson analyzed Soviet agriculture and correctly predicted that subsidies and price distortions would destabilize the entire Soviet economy. Schultz received a Nobel Prize in Economics in 1979 for his pioneering research in economic development and the problems of developing countries.
Gary Becker analyzed many curious phenomena, such as crime and punishment (deterrents matter), addiction, families and marriage, and perhaps most important, he pursued analysis of human capital. He concluded that investments in education, training and health care are crucial and can be analyzed like other investments. Becker and other Chicago School economists concluded that investment in human capital was the leading driver of economic growth. He won the Nobel Prize in Economics in 1992 "for having extended the domain of microeconomic analysis to a wide range of human behavior and interaction, including non-market behavior."
Many of the innovations in finance and financial markets have been driven by other Chicago School economists. Modern portfolio theory, efficient markets and behavioral finance have been noteworthy accomplishments. The Chicago School's option pricing models have spurred growth of trading of stock and currency options, which enable entities to reduce or assume risks.
Numerous public policies have been impacted by Chicago School research. Radio spectrum, water rights and energy leases are now often auctioned rather than awarded by regulators' opinions on "merit." Price controls, which caused America's energy shortages in the 1970s, have been repudiated. Many industries have been deregulated.
The Chicago School provided the intellectual underpinnings for Reagan's and Thatcher's economic policies,5 which reduced inflation, reinvigorated the free world and contributed to the collapse of communism. Chicago School economists provided advice that enabled third world and ex-communist countries to grow, lifting hundreds of millions of people out of poverty.
Chicago School analytical efforts have gone far beyond traditional economic topics. Economist Steven Levitt's best-selling book, Freakonomics,6 covers the economic side of lots of items, including street gangs selling crack cocaine. It turns out that from an economic standpoint, street gangs tend to be set up like large corporate franchise operations. Corner drug dealers tend to earn little money, but have room for advancement (should they not be in jail or get killed).7 Levitt covers other topics including cheating by schoolteachers and sumo wres tlers, as well as choices of names for babies.
The near-meltdown of the worldwide financial system has caused many to question deregulation and free market capitalism. It appears that public policy errors, ineffective regulation, and serious mistakes by both private sector and government entities all had a role in the crisis. Clearly there is plenty of room for improvement, and sound economic analysis is needed to facilitate new government policies and private sector practices.
The world clearly operates in an economic framework. Our investments for the Columbia Wanger Funds are driven by our evaluations of the underlying economics of the companies in which we invest. We pursue investments in businesses that we believe are strong, have competitive advantages and that are reasonably valued.


Charles P. McQuaid
President and Chief Investment Officer
Columbia Wanger Asset Management, LLC
Opinions expressed in this essay are those of the author and are not necessarily those of Columbia Wanger Asset Management, its parent organizations, or the Wanger Advisors Trust Board. These views are not guarantees of future performance and involve certain risks, uncertainties and assumptions that are difficult to predict so actual outcomes and results may differ significantly from the views expressed. These views are subject to change at any time based upon economic, market or other conditions and the respective parties disclaim any responsibility to update such views. These views may not be relied on as investment advice and, because investment decisions for a Columbia Wanger Fund are based on numerous factors, may not be relied on as an indication of trading intent on behalf of any particular Columbia Wanger Fund.
1 Overtveldt, Johan Van, The Chicago School (Chicago, Agate Publishing, 2007), pg. 6.
2 Neoclassical price theory uses mathematics to make conclusions about how the economy will behave if the price of goods, services, or behaviors increases.
3 Overtveldt, Johan Van, op. cit., pg. 11.
4 Friedman, Milton and Rose, Free to Choose (New York, Harcourt Brace Jovanovich, Inc., 1980).
5 Chicago School economists had differing opinions about elements of the policies. George Stigler, also a Nobel Prize winner affiliated with the Chicago School, labelled the supply-side program as something between a "gimmick and a slogan."
6 Levitt, Steven D., and Dubner, Stephen J., Freakonomics (New York, HarperCollins Publishers, Inc., 2005).
7 For additional information, see Sudhir Venkatesh's, Gang Leader for a Day, Penguin Press, 2008. Venkatesh was the University of Chicago sociology student whose data was utilized by Levitt.
3
Wanger USA 2010 Semiannual Report

Performance Review Wanger USA

Robert A. Mohn
Portfolio Manager
Performance data quoted represents past performance and current performance may be lower or higher. Past performance is no guarantee of future results. The investment return and principal value will fluctuate so that shares, when redeemed, may be worth more or less than the original cost. For daily and most recent month-end performance updates, please call 1-888-4-WANGER.
Wanger USA was down 6.19% while its primary benchmark, the Russell 2000 Index, fell 1.95% for the six months ended June 30, 2010. Talk of a double-dip recession and a continued sluggish economy changed the course of market performance in the second half of the period, more than erasing earlier gains.
Our energy investments for the Fund have largely focused on offshore oil service companies. The oil disaster in the Gulf of Mexico drove a sell-off in this sector, as the current moratorium on Gulf drilling decreased current demand for deepwater services and new regulations will likely drive up future drilling costs. Atwood Oceanics, an offshore drilling contractor, and FMC Technologies, an oil and gas wellhead manufacturer, were down 28% and 9%, respectively, in the semiannual period despite having very limited exposure to any Gulf drilling activity and no involvement in the BP crisis.
Other laggards for the half year included credit card processor Global Payments, which fell 32% on concerns of increased competition in the Canadian market. Carrizo Oil & Gas, an oil and gas producer, continued to struggle as U.S. natural gas prices fell. ESCO Technologies, a maker of automatic electric meter readers ended the six months down 28% on fears the company will not win a California natural gas meter contract. Blue Coat Systems, a provider of Internet network management services, suffered a steep drop in European sales. Its stock fell 28% in the semiannual period.
On the brighter side, Novell, a business software developer, gained 39% for the half year on news that Elliott Associates was taking the company private. We opted to sell the Fund's position in the stock and put the assets into other names that we believe have more upside potential. Gaylord Entertainment, an owner of convention hotels, gained 15% in the half on indications of increased hotel bookings. Knoll, a maker of office furniture, was up 29% for the six-month period as new orders improved. Tennessee bank Green Bankshares broke a string of three consecutive quarterly losses in the second quarter, sending its stock soaring 259% for the six months. lululemon athletica, a maker of premium active apparel for women, enjoyed a 24% year-to-date gain thanks to earnings that nearly tripled from the prior year.
The first half of 2010 has been frustrating, but recent market weakness is providing many investment opportunities in attractively priced small-cap companies that we believe have strong prospects for the future. Looking at the bigger picture, there is no denying the horde of problems facing the world: the stability of the euro, the housing crisis, unemployment, the over-indebted American consumer, the Gulf oil spill. It's certainly easy to despair over these issues and hide out in cash. More difficult, but potentially more profitable, is to realize that however daunting they may seem, economic problems have a habit of resolving over time.
Stocks of small- and mid-cap companies pose special risks, including possible illiquidity and greater price volatility than stocks of larger, more established companies.
Portfolio holdings are subject to change periodically and may not be representative of current holdings.
Fund Positions in Mentioned Holdings
As a percentage of net assets, as of 6/30/10
| FMC Technologies | | | 2.5 | % | |
| Atwood Oceanics | | | 1.8 | | |
| lululemon athletica | | | 1.4 | | |
| Knoll | | | 1.2 | | |
| Gaylord Entertainment | | | 1.2 | | |
| ESCO Technologies | | | 1.1 | | |
| Blue Coat Systems | | | 0.9 | | |
| Global Payments | | | 0.5 | | |
| Carrizo Oil & Gas | | | 0.3 | | |
| Green Bankshares | | | 0.2 | | |
4
Wanger USA 2010 Semiannual Report
Growth of a $10,000 Investment in Wanger USA
May 3, 1995 (inception date) through June 30, 2010

Performance data quoted represents past performance and current performance may be lower or higher. Past performance is no guarantee of future results. The investment return and principal value will fluctuate so that shares, when redeemed, may be worth more or less than the original cost. Performance results may reflect any fee waivers or reimbursements of Fund expenses by the investment advisor and/or any of its affiliates. Absent these fee waivers or expense reimbursement arrangements, performance results would have been lower. For daily and most recent month-end performance updates, please call 1-888-4-WANGER.
This graph compares the results of $10,000 invested in Wanger USA on May 3, 1995 (the date the Fund began operations) through June 30, 2010, to the Russell 2000 Index, with dividends and capital gains reinvested. Although the index is provided for use in assessing the Fund's performance, the Fund's holdings may differ significantly from those in the index.
Top 10 Holdings
As a percentage of net assets, as of 6/30/10
1. tw telecom
Fiber Optic Telephone/Data Services | | | 3.0 | % | |
2. FMC Technologies
Oil & Gas Wellhead Manufacturer | | | 2.5 | | |
3. Ametek
Aerospace/Industrial Instruments | | | 2.3 | | |
4. SL Green Realty
Manhattan Office Buildings | | | 2.0 | | |
5. Atwood Oceanics
Offshore Drilling Contractor | | | 1.8 | | |
6. AmeriCredit
Auto Lending | | | 1.8 | | |
7. Mettler Toledo
Laboratory Equipment | | | 1.8 | | |
8. Nordson
Dispensing Systems for Adhesives & Coatings | | | 1.8 | | |
9. Informatica
Enterprise Data Integration Software | | | 1.8 | | |
10. Micros Systems
Information Systems for Restaurants & Hotels | | | 1.8 | | |
Top 5 Industries
As a percentage of net assets, as of 6/30/10
| Information | | | 31.0 | % | |
| Consumer Goods & Services | | | 16.5 | | |
| Finance | | | 15.0 | | |
| Industrial Goods & Services | | | 12.0 | | |
| Health Care | | | 10.2 | | |
Results as of June 30, 2010
| | | 2nd quarter | | Year to date | | 1 year | | 5 years | | 10 years | |
| Wanger USA | | | -12.18 | % | | | -6.19 | % | | | 22.10 | % | | | -0.30 | % | | | 5.57 | % | |
| Russell 2000 Index* | | | -9.92 | | | | -1.95 | | | | 21.48 | | | | 0.37 | | | | 3.00 | | |
Lipper Variable
Underlying Small-Cap
Growth Funds Index | | | -8.76 | | | | -1.55 | | | | 21.86 | | | | 0.81 | | | | 0.17 | | |
NAV as of 6/30/10: $25.75
* The Fund's primary benchmark.
Performance numbers reflect all Fund expenses but do not include any insurance charge imposed by your insurance company's separate accounts. If performance included the effect of these additional charges, it would be lower.
The Fund's annual operating expense ratio is 0.98%. The annual operating expense ratio is as stated in the Fund's prospectus that is current as of the date of this report. Differences in expense ratios disclosed elsewhere in this report may result from including fee waivers and reimbursements, if any, as well as different time periods used in calculating the ratios.
All results shown assume reinvestment of distributions and do not reflect taxes that a shareholder would pay on Fund distributions or the sale of Fund shares.
The Russell 2000 Index measures the performance of the 2,000 smallest companies in the Russell 3000 Index, which represents approximately 8% of the total market capitalization of the Russell 3000 Index. The Lipper Variable Underlying Small-Cap Growth Funds Index is an equally weighted representation of the 30 largest variable insurance underlying funds in the Lipper Variable Underlying Small-Cap Growth Funds classification. Indexes are not managed and do not incur fees or expenses. It is not possible to invest directly in an index.
Lipper Inc., a widely respected data provider in the industry, calculates an average total return (assuming reinvestment of distributions) for mutual funds with investment objectives similar to those of the Fund. Lipper makes no adjustment for the effect of sales loads.
Portfolio characteristics and holdings are subject to change periodically and may not be representative of current characteristics and holdings.
5
Wanger USA 2010 Semiannual Report
Wanger USA
Statement of Investments (Unaudited) June 30, 2010
Number of
Shares | | | | Value | |
| | | Equities – 99.8% | |
| | | Information – 31.0% | |
| | | Business Software – 7.5% | |
| | 556,000 | | | Informatica (a)
Enterprise Data Integration Software | | $ | 13,277,280 | | |
| | 415,000 | | | Micros Systems (a)
Information Systems for Restaurants & Hotels | | | 13,226,050 | | |
| | 246,000 | | | ANSYS (a)
Simulation Software for Engineers & Designers | | | 9,980,220 | | |
| | 118,000 | | | Concur Technologies (a)
Web Enabled Cost & Expense Management Software | | | 5,036,240 | | |
| | 209,000 | | | Blackbaud
Software & Services for Non-profits | | | 4,549,930 | | |
| | 800,000 | | | Art Technology Group (a)
Software & Tools to Optimize Websites for E-Commerce | | | 2,736,000 | | |
| | 108,000 | | | Jack Henry & Associates
Systems Financial Institutions | | | 2,579,040 | | |
| | 39,000 | | | Quality Systems
IT Systems for Medical Groups & Ambulatory
Care Centers | | | 2,261,610 | | |
| | 59,000 | | | Blackboard (a)
Education Software | | | 2,202,470 | | |
| | 59,000 | | | Avid Technology (a)
Digital Nonlinear Editing Software & Systems | | | 751,070 | | |
| | | | 56,599,910 | | |
| | | Semiconductors & Related Equipment – 4.3% | |
| | 488,000 | | | Microsemi (a)
Analog/Mixed-signal Semiconductors | | | 7,139,440 | | |
| | 314,000 | | | Monolithic Power Systems (a)
High Performance Analog & Mixed-signal Integrated
Circuits (ICs) | | | 5,608,040 | | |
| | 776,750 | | | ON Semiconductor (a)
Mixed-signal & Power Management Semiconductors | | | 4,955,665 | | |
| | 856,000 | | | Atmel (a)
Microcontrollers, RF & Memory Semiconductors | | | 4,108,800 | | |
| | 157,300 | | | Supertex (a)
Analog/Mixed-signal Semiconductors | | | 3,879,018 | | |
| | 497,000 | | | Integrated Device Technology (a)
Communications Semiconductors | | | 2,460,150 | | |
| | 228,000 | | | Pericom Semiconductor (a)
Interface Integrated Circuits (ICs) & Frequency
Control Products | | | 2,188,800 | | |
| | 494,000 | | | Entegris (a)
Semiconductor Materials Management Products | | | 1,961,180 | | |
| | | | | | | | 32,301,093 | | |
Number of
Shares | | | | Value | |
| | | Telephone and Data Services – 4.1% | |
| | 1,369,000 | | | tw telecom (a)
Fiber Optic Telephone/Data Services | | $ | 22,834,920 | | |
| | 1,381,000 | | | PAETEC Holding (a)
Telephone/Data Services for Business | | | 4,709,210 | | |
| | 61,000 | | | AboveNet (a)
Metropolitan Fiber Communications Services | | | 2,877,980 | | |
| | | | 30,422,110 | | |
| | | Instrumentation – 2.6% | |
| | 122,000 | | | Mettler Toledo (a)
Laboratory Equipment | | | 13,618,860 | | |
| | 394,000 | | | IPG Photonics (a)
Fiber Lasers | | | 6,000,620 | | |
| | | | 19,619,480 | | |
| | | Telecommunications Equipment – 2.5% | |
| | 237,000 | | | Polycom (a)
Video Conferencing Equipment | | | 7,060,230 | | |
| | 321,000 | | | Blue Coat Systems (a)
WAN Acceleration & Network Security | | | 6,558,030 | | |
| | 196,000 | | | Finisar (a)(b)
Optical Sub-systems & Components | | | 2,920,400 | | |
| | 91,000 | | | CommScope (a)
Wireless Infrastructure Equipment & Telecom Cable | | | 2,163,070 | | |
| | | | 18,701,730 | | |
| | | Computer Hardware & Related
Equipment – 2.3% | |
| | 201,600 | | | Amphenol
Electronic Connectors | | | 7,918,848 | | |
| | 179,000 | | | II-VI (a)
Laser Optics & Specialty Materials | | | 5,303,770 | | |
| | 88,000 | | | Netgear (a)
Networking Products for Small Business & Home | | | 1,569,920 | | |
| | 56,000 | | | Zebra Technologies (a)
Bar Code Printers | | | 1,420,720 | | |
| | 53,000 | | | Nice Systems – ADR (Israel) (a)
Audio & Video Recording Solutions | | | 1,350,970 | | |
| | | | 17,564,228 | | |
See accompanying notes to financial statements.
6
Wanger USA 2010 Semiannual Report
Wanger USA
Statement of Investments (Unaudited) June 30, 2010
Number of
Shares | | | | Value | |
| | | Computer Services – 1.6% | |
| | 181,000 | | | SRA International (a)
Government IT Services | | $ | 3,560,270 | | |
| | 204,000 | | | ExlService Holdings (a)
BPO (Business Process Outsourcing) | | | 3,502,680 | | |
| | 495,000 | | | RCM Technologies (a)
Technology & Engineering Services | | | 2,212,650 | | |
| | 102,000 | | | Acxiom (a)
Database Marketing Services | | | 1,498,380 | | |
| | 416,500 | | | Hackett Group (a)
IT Integration & Best Practice Research | | | 1,170,365 | | |
| | | | 11,944,345 | | |
| | | Mobile Communications – 1.6% | |
| | 282,000 | | | SBA Communications (a)
Communications Towers | | | 9,590,820 | | |
| | 56,000 | | | Crown Castle International (a)
Communications Towers | | | 2,086,560 | | |
| | 57,000 | | | Globalstar (a)
Satellite Mobile Voice & Data Carrier | | | 87,780 | | |
| | | | 11,765,160 | | |
| | | Gaming Equipment & Services – 1.4% | |
| | 264,000 | | | Bally Technologies (a)
Slot Machines & Software | | | 8,550,960 | | |
| | 42,000 | | | WMS Industries (a)
Slot Machine Provider | | | 1,648,500 | | |
| | | | 10,199,460 | | |
| | | Internet Related – 0.9% | |
| | 63,802 | | | Equinix (a)
Network Neutral Data Centers | | | 5,181,999 | | |
| | 575,000 | | | TheStreet.com
Financial Information Websites | | | 1,656,000 | | |
| | | | 6,837,999 | | |
| | | Contract Manufacturing – 0.9% | |
| | 165,000 | | | Plexus (a)
Electronic Manufacturing Services | | | 4,412,100 | | |
| | 165,000 | | | Sanmina-SCI (a)
Electronic Manufacturing Services | | | 2,245,650 | | |
| | | | 6,657,750 | | |
Number of
Shares | | | | Value | |
| | | Financial Processors – 0.5% | |
| | 101,000 | | | Global Payments
Credit Card Processor | | $ | 3,690,540 | | |
| | | Business Information & Marketing Services – 0.4% | |
| | 291,200 | | | Navigant Consulting (a)
Financial Consulting Firm | | | 3,022,656 | �� | |
| | | Radio – 0.2% | |
| | 369,900 | | | Salem Communications (a)
Radio Stations for Religious Programming | | | 1,372,329 | | |
| | 339,000 | | | Spanish Broadcasting System (a)
Spanish Language Radio Stations | | | 386,460 | | |
| | | | 1,758,789 | | |
| | | TV Broadcasting – 0.2% | |
| | 579,000 | | | Entravision Communications (a)
Spanish Language TV & Radio Stations | | | 1,221,690 | | |
| | | | | Total Information | | | 232,306,940 | | |
| | | Consumer Goods & Services – 16.5% | |
| | | Retail 7.0% | |
| | 275,000 | | | lululemon athletica (a)(b)
Premium Active Apparel Retailer | | | 10,235,500 | | |
| | 237,000 | | | Urban Outfitters (a)
Apparel & Home Specialty Retailer | | | 8,150,430 | | |
| | 178,000 | | | Abercrombie & Fitch
Teen Apparel Retailer | | | 5,462,820 | | |
| | 147,000 | | | J Crew Group (a)
Multi-channel Branded Retailer | | | 5,411,070 | | |
| | 458,000 | | | Chico's FAS
Women's Specialty Retailer | | | 4,525,040 | | |
| | 526,000 | | | Saks (a)
Luxury Department Store Retailer | | | 3,992,340 | | |
| | 315,000 | | | Talbots (a)
Women's Specialty Retailer | | | 3,247,650 | | |
| | 143,000 | | | AnnTaylor Stores (a)
Women's Apparel Retailer | | | 2,326,610 | | |
| | 553,000 | | | Charming Shoppes (a)
Women's Specialty Plus Size Apparel Retailer | | | 2,073,750 | | |
| | 79,000 | | | Shutterfly (a)
Internet Photo-Centric Retailer | | | 1,892,840 | | |
| | 421,000 | | | Wet Seal (a)
Specialty Apparel Retailer | | | 1,536,650 | | |
| | 214,000 | | | Pier 1 Imports (a)
Home Furnishing Retailer | | | 1,371,740 | | |
See accompanying notes to financial statements.
7
Wanger USA 2010 Semiannual Report
Wanger USA
Statement of Investments (Unaudited) June 30, 2010
Number of
Shares | | | | Value | |
| | | Retail – 7.0% (cont) | |
| | 274,700 | | | Coldwater Creek (a)
Women's Apparel Retailer | | $ | 922,992 | | |
| | 28,400 | | | Rue21 (a)
Fashion Value Apparel Retailer | | | 861,656 | | |
| | 129,229 | | | Gaiam
Healthy Living Catalogs & E-Commerce | | | 784,420 | | |
| | | | 52,795,508 | | |
| | | Travel – 2.5% | |
| | 393,700 | | | Gaylord Entertainment (a)
Convention Hotels | | | 8,696,833 | | |
| | 523,900 | | | Avis Budget Group (a)
Second Largest Car Rental Company | | | 5,144,698 | | |
| | 494,000 | | | Hertz (a)
Largest U.S. Rental Car Operator | | | 4,673,240 | | |
| | | | 18,514,771 | | |
| | | Furniture & Textiles – 1.7% | |
| | 700,000 | | | Knoll
Office Furniture | | | 9,303,000 | | |
| | 204,000 | | | Herman Miller
Office Furniture | | | 3,849,480 | | |
| | | | 13,152,480 | | |
| | | Educational Services – 0.9% | |
| | 77,600 | | | ITT Educational Services (a)
Post-secondary Degree Services | | | 6,442,352 | | |
| | | Other Durable Goods – 0.9% | |
| | 111,000 | | | Cavco Industries (a)
Manufactured Homes | | | 3,904,980 | | |
| | 94,000 | | | Jarden
Branded Household Products | | | 2,525,780 | | |
| | | | 6,430,760 | | |
| | | Casinos & Gaming – 0.9% | |
| | 365,000 | | | Pinnacle Entertainment (a)
Regional Casino Operator | | | 3,452,900 | | |
| | 128,000 | | | Penn National Gaming (a)
Regional Casino Operator | | | 2,956,800 | | |
| | | | 6,409,700 | | |
| | | Consumer Goods Distribution – 0.8% | |
| | 285,500 | | | Pool
Distributor of Swimming Pool Supplies & Equipment | | | 6,258,160 | | |
Number of
Shares | | | | Value | |
| | | Food & Beverage – 0.5% | |
| | 97,000 | | | Diamond Foods
Culinary Ingredients & Snack Foods | | $ | 3,986,700 | | |
| | | Apparel – 0.5% | |
| | 176,745 | | | True Religion Apparel (a)
Premium Denim | | | 3,900,762 | | |
| | | Other Consumer Services – 0.5% | |
| | 118,000 | | | Lifetime Fitness (a)
Sport & Fitness Club Operator | | | 3,751,220 | | |
| | | Leisure Products – 0.3% | |
| | 92,000 | | | Thor Industries
RV & Bus Manufacturer | | | 2,185,000 | | |
| | | | | Total Consumer Goods & Services | | | 123,827,413 | | |
| | | Finance – 15.0% | |
| | | Banks – 6.2% | |
| | 645,837 | | | Valley National Bancorp
New Jersey/New York Bank | | | 8,796,300 | | |
| | 453,700 | | | TCF Financial
Great Lakes Bank | | | 7,535,957 | | |
| | 314,100 | | | MB Financial
Chicago Bank | | | 5,776,299 | | |
| | 281,779 | | | Lakeland Financial
Indiana Bank | | | 5,629,945 | | |
| | 107,000 | | | SVB Financial Group (a)
Bank to Venture Capitalists | | | 4,411,610 | | |
| | 260,000 | | | Wilmington Trust
Delaware Trust Bank | | | 2,883,400 | | |
| | 289,000 | | | Pacific Continental
Pacific Northwest Bank | | | 2,736,830 | | |
| | 170,600 | | | Associated Banc-Corp
Midwest Bank | | | 2,091,556 | | |
| | 446,200 | | | First Busey
Illinois Bank | | | 2,021,286 | | |
| | 119,582 | | | Green Bankshares (a)(b)
Tennessee Bank | | | 1,527,062 | | |
| | 97,700 | | | Sandy Spring Bancorp
Baltimore/D.C. Bank | | | 1,368,777 | | |
| | 131,000 | | | Whitney Holding
Gulf Coast Bank | | | 1,211,750 | | |
| | 560,451 | | | Guaranty Bancorp (a)
Colorado Bank | | | 594,078 | | |
| | | | 46,584,850 | | |
See accompanying notes to financial statements.
8
Wanger USA 2010 Semiannual Report
Wanger USA
Statement of Investments (Unaudited) June 30, 2010
Number of
Shares | | | | Value | |
| | | Finance Companies – 4.3% | |
| | 751,400 | | | AmeriCredit (a)
Auto Lending | | $ | 13,690,508 | | |
| | 152,900 | | | World Acceptance (a)
Personal Loans | | | 5,857,599 | | |
| | 237,000 | | | McGrath Rentcorp
Temporary Space & IT Rentals | | | 5,398,860 | | |
| | 355,900 | | | H&E Equipment Services (a)
Heavy Equipment Leasing | | | 2,665,691 | | |
| | 151,000 | | | CAI International (a)
International Container Leasing | | | 1,796,900 | | |
| | 61,500 | | | GATX
Rail Car Lessor | | | 1,640,820 | | |
| | 79,000 | | | Aaron's
Rent to Own | | | 1,348,530 | | |
| | | | 32,398,908 | | |
| | | Brokerage & Money Management – 2.2% | |
| | 343,000 | | | SEI Investments
Mutual Fund Administration & Investment Management | | | 6,983,480 | | |
| | 184,000 | | | Eaton Vance
Specialty Mutual Funds | | | 5,080,240 | | |
| | 444,000 | | | MF Global (a)
Futures Broker | | | 2,535,240 | | |
| | 101,000 | | | Investment Technology Group (a)
Electronic Trading | | | 1,622,060 | | |
| | | | 16,221,020 | | |
| | | Savings & Loans – 1.2% | |
| | 394,000 | | | ViewPoint Financial
Texas Thrift | | | 5,456,900 | | |
| | 157,079 | | | Berkshire Hills Bancorp
Northeast Thrift | | | 3,059,899 | | |
| | 27,455 | | | K-Fed Bancorp (b)
Los Angeles Savings & Loan | | | 249,291 | | |
| | 19,696 | | | Provident New York Bancorp
New York State Thrift | | | 174,310 | | |
| | | | 8,940,400 | | |
| | | Insurance – 1.1% | |
| | 247,000 | | | Leucadia National (a)
Insurance Holding Company | | | 4,818,970 | | |
Number of
Shares | | | | Value | |
| | 72,000 | | | Delphi Financial Group
Workers Compensation & Group Employee Benefit
Products & Services | | $ | 1,757,520 | | |
| | 79,000 | | | Tower Group
Commercial & Personal Lines Insurance | | | 1,700,870 | | |
| | | | 8,277,360 | | |
| | | | | Total Finance | | | 112,422,538 | | |
| | | Industrial Goods & Services – 12.0% | |
| | | Machinery – 9.1% | |
| | 421,000 | | | Ametek
Aerospace/Industrial Instruments | | | 16,903,150 | | |
| | 240,100 | | | Nordson
Dispensing Systems for Adhesives & Coatings | | | 13,464,808 | | |
| | 290,000 | | | Donaldson
Industrial Air Filtration | | | 12,368,500 | | |
| | 319,000 | | | Pentair
Pumps & Water Treatment | | | 10,271,800 | | |
| | 297,300 | | | ESCO Technologies
Automatic Electric Meter Readers | | | 7,655,475 | | |
| | 128,000 | | | MOOG (a)
Motion Control Products for Aerospace, Defense &
Industrial Markets | | | 4,125,440 | | |
| | 111,000 | | | Oshkosh (a)
Specialty Truck Manufacturer | | | 3,458,760 | | |
| | | | 68,247,933 | | |
| | | Industrial Materials & Specialty Chemicals – 1.2% | |
| | 168,000 | | | Drew Industries (a)
RV & Manufactured Home Components | | | 3,393,600 | | |
| | 79,000 | | | Albemarle
Refinery Catalysts & Other Specialty Chemicals | | | 3,137,090 | | |
| | 165,000 | | | Albany International
Paper Machine Clothing & Advanced Textiles | | | 2,671,350 | | |
| | | | 9,202,040 | | |
| | | Steel – 0.7% | |
| | 356,000 | | | GrafTech International (a)
Industrial Graphite Materials Producer | | | 5,204,720 | | |
| | | Electrical Components – 0.6% | |
| | 128,000 | | | Acuity Brands
Commercial Lighting Fixtures | | | 4,656,640 | | |
See accompanying notes to financial statements.
9
Wanger USA 2010 Semiannual Report
Wanger USA
Statement of Investments (Unaudited) June 30, 2010
Number of
Shares | | | | Value | |
| | | Construction – 0.2% | |
| | 158,000 | | | M/I Homes (a)
Columbus-based Home Builder | | $ | 1,523,120 | | |
| | | Water – 0.2% | |
| | 362,000 | | | Mueller Water Products
Fire Hydrants, Valves & Ductile Iron Pipes | | | 1,343,020 | | |
| | | | | Total Industrial Goods & Services | | | 90,177,473 | | |
| | | Health Care – 10.2% | |
| | | Biotechnology & Drug Delivery – 5.2% | |
| | 371,600 | | | Seattle Genetics (a)
Antibody-based Therapies for Cancer | | | 4,455,484 | | |
| | 131,000 | | | Acorda Therapeutics (a)
Biopharma Company Focused on Nervous
Disorder Drugs | | | 4,075,410 | | |
| | 288,000 | | | Nektar Therapeutics (a)
Drug Delivery Technologies | | | 3,484,800 | | |
| | 161,000 | | | BioMarin (a)
Biotech Focused on Orphan Diseases | | | 3,052,560 | | |
| | 472,600 | | | Allos Therapeutics (a)
Cancer Drug Development | | | 2,897,038 | | |
| | 84,000 | | | AMAG Pharmaceuticals (a)
Biotech Focused on Niche Diseases | | | 2,885,400 | | |
| | 371,800 | | | NPS Pharmaceuticals (a)
Orphan Drugs & Healthy Royalties | | | 2,394,392 | | |
| | 360,500 | | | Micromet (a)
Next-generation Antibody Technology | | | 2,249,520 | | |
| | 96,000 | | | Human Genome Sciences (a)
Biotech Focused on HCV, Inflammation & Cancer | | | 2,175,360 | | |
| | 206,700 | | | Isis Pharmaceuticals (a)
Biotech Pioneer in Anti-sense Drugs | | | 1,978,119 | | |
| | 38,000 | | | United Therapeutics (a)
Biotech Focused on Rare Diseases | | | 1,854,780 | | |
| | 185,000 | | | Xenoport (a)(b)
Biotech Company with Proprietary Drug
Development Platform | | | 1,814,850 | | |
| | 71,000 | | | Amylin Pharmaceuticals (a)
Biotech Company Focused on Diabetes & Obesity | | | 1,334,800 | | |
| | 418,000 | | | Array Biopharma (a)
Drugs for Cancer & Inflammatory Diseases | | | 1,274,900 | | |
| | 51,600 | | | Auxilium Pharmaceuticals (a)
Biotech Focused on Niche Disease Areas | | | 1,212,600 | | |
Number of
Shares | | | | Value | |
| | 217,800 | | | Idenix Pharmaceuticals (a)
Developer of Drugs for Infectious Diseases | | $ | 1,089,000 | | |
| | 118,000 | | | Anthera (a)
Biotech Focused on Cardiovascular,
Cancer & Immunology | | | 632,480 | | |
| | 23,180 | | | Onyx Pharmaceuticals (a)
Commercial-stage Biotech Focused on Cancer | | | 500,456 | | |
| | 738,060 | | | Medicure – Warrants (a)(c)
Cardiovascular Biotech Company | | | 5,093 | | |
| | 100,000 | | | IsoRay – Warrants (a)(c)
Radiology Cancer Company | | | 3,000 | | |
| | 25,000 | | | Locus Pharmaceuticals,
Series A-1, Pfd. (a)(c) | | | 750 | | |
| | 12,886 | | | Locus Pharmaceuticals,
Series B-1, Pfd. (a)(c)
High Throughput Rational Drug Design | | | 386 | | |
| | | | 39,371,178 | | |
| | | Medical Equipment & Devices – 2.9% | |
| | 154,000 | | | Alexion Pharmaceuticals (a)
Biotech Focused on Orphan Diseases | | | 7,883,260 | | |
| | 109,000 | | | Orthofix International (a)
Bone Fixation & Stimulation Devices | | | 3,493,450 | | |
| | 106,000 | | | American Medical Systems (a)
Medical Devices to Treat Urological Conditions | | | 2,344,720 | | |
| | 48,000 | | | Gen-Probe (a)
Molecular In-vitro Diagnostics | | | 2,180,160 | | |
| | 53,000 | | | Sirona Dental Systems (a)
Manufacturer of Dental Equipment | | | 1,846,520 | | |
| | 40,000 | | | Illumina (a)
Leading Tools & Service Provider for Genetic Analysis | | | 1,741,200 | | |
| | 102,740 | | | Vermillion (a)(c)
Ovarian Cancer Diagnostic Test | | | 1,202,305 | | |
| | 158,000 | | | Nanosphere (a)
Molecular Diagnostics Company with Best of
Breed Platform | | | 688,880 | | |
| | | | 21,380,495 | | |
See accompanying notes to financial statements.
10
Wanger USA 2010 Semiannual Report
Wanger USA
Statement of Investments (Unaudited) June 30, 2010
Number of
Shares | | | | Value | |
| | | Medical Supplies – 1.0% | |
| | 217,000 | | | Cepheid (a)
Molecular Diagnostics | | $ | 3,476,340 | | |
| | 34,000 | | | Idexx Laboratories (a)(b)
Diagnostic Equipment & Services for Veterinarians | | | 2,070,600 | | |
| | 93,200 | | | Immucor (a)
Automated Blood Typing Reagents | | | 1,775,460 | | |
| | | | 7,322,400 | | |
| | | Health Care Services – 0.9% | |
| | 238,465 | | | PSS World Medical (a)
Distributor of Medical Supplies | | | 5,043,535 | | |
| | 26,000 | | | Mednax (a)
Physician Management for Pediatric &
Anesthesia Practices | | | 1,445,860 | | |
| | | | 6,489,395 | | |
| | | Pharmaceuticals – 0.2% | |
| | 205,000 | | | The Medicines Company (a)
Specialty Pharmaceuticals – Cardiovascular | | | 1,560,050 | | |
| | | | | Total Health Care | | | 76,123,518 | | |
| | | Energy & Minerals – 8.2% | |
| | | Oil Services 5.4% | |
| | 354,600 | | | FMC Technologies (a)
Oil & Gas Wellhead Manufacturer | | | 18,673,236 | | |
| | 541,100 | | | Atwood Oceanics (a)
Offshore Drilling Contractor | | | 13,808,872 | | |
| | 134,125 | | | Exterran Holdings (a)
Natural Gas Compressor Rental & Fabrication | | | 3,461,766 | | |
| | 116,000 | | | Bristow (a)
Largest Provider of Helicopter Services to
Offshore Oil & Gas Producers | | | 3,410,400 | | |
| | 71,700 | | | Tesco (a)
Developing New Well Drilling Technologies | | | 880,476 | | |
| | | | 40,234,750 | | |
| | | Oil & Gas Producers – 2.2% | |
| | 108,000 | | | Ultra Petroleum (a)
Oil & Gas Producer | | | 4,779,000 | | |
| | 92,000 | | | St. Mary Land & Exploration
Oil & Gas Producer | | | 3,694,720 | | |
Number of
Shares | | | | Value | |
| | 162,000 | | | Carrizo Oil & Gas (a)
Oil & Gas Producer | | $ | 2,515,860 | | |
| | 174,000 | | | Quicksilver Resources (a)
Natural Gas & Coal Steam Gas Producer | | | 1,914,000 | | |
| | 145,000 | | | Northern Oil & Gas (a)
Small E&P Company in North Dakota Bakken | | | 1,861,800 | | |
| | 81,000 | | | Rosetta Resources (a)
Oil & Gas Producer Exploring in South
Texas & Montana | | | 1,604,610 | | |
| | 22,800 | | | Oasis Petroleum (a)
Oil Producer in North Dakota | | | 330,600 | | |
| | | | 16,700,590 | | |
| | | Mining – 0.6% | |
| | 33,000 | | | Core Laboratories (Netherlands)
Oil & Gas Reservoir Consulting | | | 4,871,130 | | |
| | | | | Total Energy & Minerals | | | 61,806,470 | | |
| | | Other Industries – 6.9% | |
| | | Real Estate – 6.1% | |
| | 267,000 | | | SL Green Realty
Manhattan Office Buildings | | | 14,695,680 | | |
| | 184,620 | | | Macerich
Regional Shopping Malls | | | 6,890,018 | | |
| | 377,600 | | | BioMed Realty Trust
Life Science-focused Office Buildings | | | 6,075,584 | | |
| | 349,000 | | | Extra Space Storage
Self Storage Facilities | | | 4,851,100 | | |
| | 955,000 | | | Kite Realty Group
Community Shopping Centers | | | 3,991,900 | | |
| | 100,000 | | | Corporate Office Properties
Office Buildings | | | 3,776,000 | | |
| | 92,200 | | | Dupont Fabros Technology
Technology-focused Office Buildings | | | 2,264,432 | | |
| | 264,000 | | | Education Realty Trust
Student Housing | | | 1,591,920 | | |
| | 341,000 | | | DCT Industrial Trust
Industrial Properties | | | 1,541,320 | | |
| | | | 45,677,954 | | |
See accompanying notes to financial statements.
11
Wanger USA 2010 Semiannual Report
Wanger USA
Statement of Investments (Unaudited) June 30, 2010
Number of Shares
or Principal Amount | | | | Value | |
| | | Transportation – 0.8% | |
| | 100,500 | | | World Fuel Services
Global Fuel Broker | | $ | 2,606,970 | | |
| | 154,000 | | | Heartland Express
Regional Trucker | | | 2,236,080 | | |
| | 118,000 | | | Rush Enterprises, Class A (a)
Truck Sales & Services | | | 1,576,480 | | |
| | | | 6,419,530 | | |
| | | | | Total Other Industries | | | 52,097,484 | | |
| Total Equities (Cost: $607,090,837) – 99.8% | | | 748,761,836 | | |
| Securities Lending Collateral – 0.7% | | | |
| | 5,484,871 | | | Dreyfus Government Cash
Management Fund (d)
(7 day yield of 0.03%) | | | 5,484,871 | | |
Total Securities Lending Collateral
(Cost: $5,484,871) | | | 5,484,871 | | |
| Short-Term Obligation – 0.4% | | | |
| | | Repurchase Agreement 0.4% | |
| $ | 2,667,000 | | | Repurchase Agreement with Fixed
Income Clearing Corp., dated 6/30/10,
due 7/01/10 at 0.00%, collateralized
by a U.S. Government Agency obligation
maturing 1/19/16, market value $2,722,538 (repurchase proceeds $2,667,000) | | | 2,667,000 | | |
Total Short-Term Obligation
(Cost: $2,667,000) | | | 2,667,000 | | |
| Total Investments (Cost: $615,242,708) – 100.9% (e) | | | 756,913,707 | | |
Obligation to Return Collateral for
Securities Loaned – (0.7)% | | | (5,484,871 | ) | |
| Cash and Other Assets Less Liabilities – (0.2)% | | | (1,233,284 | ) | |
| Total Net Assets – 100.0% | | $ | 750,195,552 | | |
Notes to Statement of Investments:
(a) Non-income producing security.
(b) All or a portion of this security was on loan at June 30, 2010. The total market value of Fund securities on loan at June 30, 2010 was $5,253,895.
(c) Denotes a restricted security, which is subject to restrictions on resale under federal securities laws. These securities are valued at a fair value determined in good faith under consistently applied procedures established by the Board of Trustees. At June 30, 2010, the market value of these securities amounted to $1,211,534 which represents 0.16% of total net assets.
Additional information on these securities is as follows:
Security | | Acquisition
Dates | |
Shares | |
Cost | |
Value | |
| IsoRay – Warrants | | 3/21/07 | | | 100,000 | | | $ | — | | | $ | 3,000 | | |
Locus Pharmaceuticals,
Series A-1, Pfd. | | 9/05/01 | | | 25,000 | | | | 1,000,000 | | | | 750 | | |
Locus Pharmaceuticals,
Series B-1, Pfd. | | 2/08/07 | | | 12,886 | | | | 37,369 | | | | 386 | | |
| Medicure – Warrants | | 12/22/06 | | | 738,060 | | | | — | | | | 5,093 | | |
| Vermillion | | 1/07/10 | | | 102,740 | | | | 1,899,991 | | | | 1,202,305 | | |
| | | | | | | | | $ | 2,937,360 | | | $ | 1,211,534 | | |
(d) Investment made with cash collateral received from securities lending activity.
(e) At June 30, 2010, for federal income tax purposes, the cost of investments was $615,242,708 and net unrealized appreciation was $141,670,999 consisting of gross unrealized appreciation of $221,100,320 and gross unrealized depreciation of $79,429,321.
An affiliated person of the Fund may include any company in which the Fund owns five percent or more of its outstanding voting shares. Holdings and transactions in these affiliated companies during the six months ended June 30, 2010, are as follows:
Affiliates | | Balance
of Shares
Held at
12/31/2009 | |
Purchases/
Additions | |
Sales/
Reductions | | Balance of
Shares
Held at
6/30/10 | |
Value | |
Dividend | |
Cavco
Industries* | | | 272,184 | | | | — | | | | 161,184 | | | | 111,000 | | | $ | 3,904,980 | | | $ | — | | |
RCM
Techno-
logies* | | | 753,000 | | | | — | | | | 258,000 | | | | 495,000 | | | | 2,212,650 | | | | — | | |
Total of
affiliated
trans-
actions | | | 1,025,184 | | | | — | | | | 419,184 | | | | 606,000 | | | $ | 6,117,630 | | | $ | — | | |
* At June 30, 2010, the Fund owned less than five percent of the company's outstanding voting shares.
The aggregate cost and value of these companies at June 30, 2010, were $5,166,914 and $6,117,630, respectively. Investments in affiliated companies represented 0.82% of total net assets at June 30, 2010.
ADR = American Depositary Receipts
See accompanying notes to financial statements.
12
Wanger USA 2010 Semiannual Report
Wanger USA
Statement of Investments (Unaudited) June 30, 2010
The following table summarizes the inputs used, as of June 30, 2010, in valuing the Fund's assets:
| Investment Type | | Quoted Prices
(Level 1) | | Other
Significant
Observable
Inputs
(Level 2) | | Significant
Unobservable
Inputs
(Level 3) | | Total | |
| Equities | |
| Information | | $ | 232,306,940 | | | $ | — | | | $ | — | | | $ | 232,306,940 | | |
Consumer
Goods & Services | | | 123,827,413 | | | | — | | | | — | | | | 123,827,413 | | |
| Finance | | | 112,422,538 | | | | — | | | | — | | | | 112,422,538 | | |
Industrial
Goods & Services | | | 90,177,473 | | | | — | | | | — | | | | 90,177,473 | | |
| Health Care | | | 74,911,984 | | | | 1,210,398 | | | | 1,136 | | | | 76,123,518 | | |
| Energy & Minerals | | | 61,806,470 | | | | — | | | | — | | | | 61,806,470 | | |
| Other Industries | | | 52,097,484 | | | | — | | | | — | | | | 52,097,484 | | |
| Total Equities | | | 747,550,302 | | | | 1,210,398 | | | | 1,136 | | | | 748,761,836 | | |
Total Securities
Lending Collateral | | | 5,484,871 | | | | — | | | | — | | | | 5,484,871 | | |
Total Short-Term
Obligation | | | — | | | | 2,667,000 | | | | — | | | | 2,667,000 | | |
| Total Investments | | $ | 753,035,173 | | | $ | 3,877,398 | | | $ | 1,136 | | | $ | 756,913,707 | | |
The Fund's assets assigned to the Level 2 input category are generally valued using the market approach, in which a security's value is determined through its correlation to prices and information from market transactions for similar or identical assets. Securities acquired via private placement, that have a holding period or an extended settlement period, are valued at a discount to the same shares that are trading freely on the market. These discounts are determined by the advisors experience with similar securities or situations. Factors may include, but are not limited to, trade volume, shares outstanding and stock price. Warrants which do not trade are valued as a percentage of the actively trading common stock using a model, based on Black Scholes.
Certain Short-Term Obligations may be valued using amortized cost, an income approach which converts future cash flows to a present value based upon the discount or premium at purchase.
The Fund's assets assigned to the Level 3 input category are valued at fair value as determined in good faith under consistently applied procedures established by and under the general supervision of the Board of Trustees. To determine fair value, management will utilize the valuation technique that they deem the most appropriate in the circumstances. Securities for which no market exists are valued based upon the market approach using inputs from the investment team but ultimately decided by the Board of Trustees. These may include, but are not limited to, projected earnings, available cash, line of business, multiples, and consideration of the prioritization of the equity in a company's capital structure.
The following table reconciles asset balances for the six-month period ending June 30, 2010, in which significant unobservable inputs (Level 3) were used in determining value:
| Investments in Securities | | Balance as of
December 31,
2009 | | Realized
Gain/
(Loss) | | Change in
Unrealized
Appreciation
(Depreciation) | | Purchase | | (Sales) | | Transfers
into Level 3 | | Transfers
(out of) Level 3 | | Balance as of
June 30,
2010 | |
Equities
Health Care | | $ | 1,894 | | | $ | — | | | $ | (758 | ) | | $ | — | | | $ | — | | | $ | — | | | $ | — | | | $ | 1,136 | | |
| | | $ | 1,894 | | | $ | — | | | $ | (758 | ) | | $ | — | | | $ | — | | | $ | — | | | $ | — | | | $ | 1,136 | | |
The information in the above reconciliation represents fiscal year to date activity for any securities identified as using Level 3 inputs at either the beginning or the end of the current fiscal period.
The change in unrealized depreciation attributed to securities owned at June 30, 2010, which were valued using significant unobservable inputs (Level 3) amounted to $758. This amount is included in net change in unrealized appreciation (depreciation) on the Statement of Changes in Net Assets.
For more information on valuation inputs, and their aggregation into the levels used in the tables above, please refer to the Security Valuation section in the accompanying Notes to Financial Statements.
At June 30, 2010, the Fund held investments in the following sectors:
| Sector | | Percentage of
Net Assets | |
| Information | | | 31.0 | | |
| Consumer Goods & Services | | | 16.5 | | |
| Finance | | | 15.0 | | |
| Industrial Goods & Services | | | 12.0 | | |
| Health Care | | | 10.2 | | |
| Energy & Minerals | | | 8.2 | | |
| Other Industries | | | 6.9 | | |
| | | | 99.8 | | |
| Securities Lending Collateral | | | 0.7 | | |
| Short-Term Obligation | | | 0.4 | | |
| Obligation to Return Collateral for Securities Loaned | | | (0.7 | ) | |
| Cash and Other Assets less Liabilities | | | (0.2 | ) | |
| | | | 100.0 | | |
See accompanying notes to financial statements.
13
Wanger USA 2010 Semiannual Report
Statement of Assets and Liabilities
June 30, 2010 (Unaudited)
| Assets: | |
| Unaffiliated investments, at cost | | $ | 610,075,794 | | |
| Affiliated investments, at cost (See Note 4) | | | 5,166,914 | | |
Unaffiliated investments, at value
(including securities on loan of $5,253,895) | | $ | 750,796,077 | | |
| Affiliated investments, at value (See Note 4) | | | 6,117,630 | | |
| Cash | | | 872 | | |
| Receivable for: | |
| Investments sold | | | 1,781,676 | | |
| Fund shares sold | | | 919,071 | | |
| Securities lending income | | | 2,959 | | |
| Dividends | | | 337,312 | | |
| Trustees' deferred compensation plan | | | 90,111 | | |
| Other assets | | | 18,825 | | |
| Total Assets | | | 760,064,533 | | |
| Liabilities: | |
| Collateral on securities loaned | | | 5,484,871 | | |
| Payable for: | |
| Investments purchased | | | 2,405,539 | | |
| Fund shares repurchased | | | 839,563 | | |
| Investment advisory fee | | | 586,151 | | |
| Administration fee | | | 34,476 | | |
| Transfer agent fee | | | 50 | | |
| Trustees' fees | | | 13,435 | | |
| Custody fee | | | 7,487 | | |
| Reports to shareholders | | | 313,467 | | |
| Interest fee | | | 8,531 | | |
| Trustees' deferred compensation plan | | | 90,111 | | |
| Other liabilities | | | 85,300 | | |
| Total Liabilities | | | 9,868,981 | | |
| Net Assets | | $ | 750,195,552 | | |
| Composition of Net Assets: | |
| Paid-in capital | | $ | 582,304,755 | | |
| Accumulated net investment loss | | | (2,708,861 | ) | |
| Accumulated net realized gain | | | 28,928,659 | | |
| Net unrealized appreciation on investments | | | 141,670,999 | | |
| Net Assets | | $ | 750,195,552 | | |
| Fund Shares Outstanding | | | 29,130,607 | | |
Net asset value, offering price and redemption
price per share | | $ | 25.75 | | |
Statement of Operations
For the Six Months Ended June 30, 2010 (Unaudited)
| Investment Income: | |
| Dividends (net foreign taxes withheld of $1,800) | | $ | 3,203,829 | | |
| Securities lending income | | | 24,544 | | |
| Interest income | | | 2,209 | | |
| Total Investment Income | | | 3,230,582 | | |
| Expenses: | |
| Investment advisory fee | | | 5,125,140 | | |
| Administration fee | | | 299,902 | | |
| Transfer agent fee | | | 358 | | |
| Trustees' fees | | | 37,205 | | |
| Custody fee | | | 27,422 | | |
| Chief compliance officer expenses (See Note 4) | | | 23,097 | | |
| Other expenses (See Note 5) | | | 293,529 | | |
| Expenses before interest expense | | | 5,806,653 | | |
| Interest expense | | | 34,624 | | |
| Total Expenses | | | 5,841,277 | | |
| Advisory fee waiver | | | (12,366 | ) | |
| Interest expense waiver (See Note 4) | | | (34,624 | ) | |
| Custody earnings credit | | | (12 | ) | |
| Net Expenses | | | 5,794,275 | | |
| Net Investment Loss | | | (2,563,693 | ) | |
| Net Realized and Unrealized Gain (Loss) on Investments: | |
| Net realized gain (loss) on: | |
| Unaffiliated investments | | | 101,410,568 | | |
| Affiliated investments (See Note 4) | | | (2,058,439 | ) | |
| Net realized gain | | | 99,352,129 | | |
| Net change in unrealized appreciation (depreciation) on: | |
| Unaffiliated investments | | | (136,340,892 | ) | |
| Affiliated investments (See Note 4) | | | 3,367,091 | | |
Net change in unrealized appreciation
(depreciation) | | | (132,973,801 | ) | |
| Net Loss | | | (33,621,672 | ) | |
| Net Decrease in Net Assets from Operations | | $ | (36,185,365 | ) | |
See accompanying notes to financial statements.
14
Wanger USA 2010 Semiannual Report
Statement of Changes in Net Assets
| Increase (Decrease) in Net Assets | | (Unaudited)
Six Months
Ended
June 30,
2010 | | Year Ended
December 31,
2009 | |
| Operations: | |
| Net investment loss | | $ | (2,563,693 | ) | | $ | (3,035,972 | ) | |
| Net realized gain (loss) on: | |
| Unaffiliated investments | | | 101,410,568 | | | | (2,149,140 | ) | |
| Affiliated investments (See Note 4) | | | (2,058,439 | ) | | | (484,084 | ) | |
| Net change in unrealized appreciation (depreciation) on: | |
| Unaffiliated investments | | | (136,340,892 | ) | | | 396,200,017 | | |
| Affiliated investments (See Note 4) | | | 3,367,091 | | | | 2,245,347 | | |
| Net Increase (Decrease) in Net Assets from Operations | | | (36,185,365 | ) | | | 392,776,168 | | |
| Share Transactions: | |
| Subscriptions | | | 23,257,432 | | | | 67,709,638 | | |
| Redemptions | | | (514,030,039 | ) | | | (135,581,347 | ) | |
| Net Decrease from Fund Share Transactions | | | (490,772,607 | ) | | | (67,871,709 | ) | |
| Total Increase (Decrease) in Net Assets | | | (526,957,972 | ) | | | 324,904,459 | | |
| Net Assets: | |
| Beginning of period | | | 1,277,153,524 | | | | 952,249,065 | | |
| End of period | | $ | 750,195,552 | | | $ | 1,277,153,524 | | |
| Accumulated net investment loss at end of period | | $ | (2,708,861 | ) | | $ | (145,168 | ) | |
See accompanying notes to financial statements.
15
Wanger USA 2010 Semiannual Report
Financial Highlights
| | | (Unaudited)
Six Months Ended
June 30, | | Year Ended December 31, | |
| Selected data for a share outstanding throughout each period | | 2010 | | 2009 | | 2008 | | 2007 | | 2006 | | 2005 | |
| Net Asset Value, Beginning of Period | | $ | 27.45 | | | $ | 19.30 | | | $ | 36.26 | | | $ | 36.36 | | | $ | 34.90 | | | $ | 31.37 | | |
| Income from Investment Operations: | |
| Net investment income (loss) (a) | | | (0.06 | ) | | | (0.06 | ) | | | (0.07 | ) | | | (0.05 | )(b) | | | (0.02 | ) | | | 0.09 | | |
| Net realized and unrealized gain (loss) on investments | | | (1.64 | ) | | | 8.21 | | | | (13.16 | ) | | | 1.91 | | | | 2.71 | | | | 3.44 | | |
| Total from Investment Operations | | | (1.70 | ) | | | 8.15 | | | | (13.23 | ) | | | 1.86 | | | | 2.69 | | | | 3.53 | | |
| Less Distributions to Shareholders: | |
| From net investment income | | | — | | | | — | | | | — | | | | — | | | | (0.08 | ) | | | — | | |
| From net realized gains | | | — | | | | — | | | | (3.73 | ) | | | (1.96 | ) | | | (1.15 | ) | | | — | | |
| Total Distributions to Shareholders | | | — | | | | — | | | | (3.73 | ) | | | (1.96 | ) | | | (1.23 | ) | | | — | | |
| Net Asset Value, End of Period | | $ | 25.75 | | | $ | 27.45 | | | $ | 19.30 | | | $ | 36.26 | | | $ | 36.36 | | | $ | 34.90 | | |
| Total Return (c) | | | (6.19 | )%(d)(e) | | | 42.23 | % | | | (39.68 | )% | | | 5.39 | % | | | 7.87 | % | | | 11.25 | %(e) | |
| Ratios to Average Net Assets/Supplemental Data: | |
| Net expenses before interest expense (f) | | | 0.97 | %(g) | | | 0.98 | % | | | 0.96 | % | | | 0.95 | % | | | 0.95 | % | | | 0.95 | % | |
| Interest expense | | | 0.01 | %(g) | | | — | | | | — | | | | — | | | | 0.00 | %(h) | | | — | | |
| Interest expense waiver | | | 0.01 | %(g) | | | — | | | | — | | | | — | | | | — | | | | — | | |
| Net expenses (f) | | | 0.97 | %(g) | | | 0.98 | % | | | 0.96 | % | | | 0.95 | % | | | 0.95 | % | | | 0.95 | % | |
| Net investment income (loss) (f) | | | (0.43 | )%(g) | | | (0.29 | )% | | | (0.26 | )% | | | (0.15 | )% | | | (0.07 | )% | | | 0.29 | % | |
| Waiver/Reimbursement | | | 0.00 | %(g)(h) | | | — | | | | — | | | | — | | | | — | | | | 0.00 | %(h) | |
| Portfolio turnover rate | | | 15 | %(d) | | | 30 | % | | | 22 | % | | | 27 | % | | | 19 | % | | | 11 | % | |
| Net assets, end of period (000s) | | $ | 750,196 | | | $ | 1,277,154 | | | $ | 952,249 | | | $ | 1,688,040 | | | $ | 1,608,340 | | | $ | 1,493,695 | | |
(a) Net investment income (loss) per share was based upon the average shares outstanding during the period.
(b) Net investment loss per share reflects special dividends. The effect of these dividends amounted to $0.08 per share.
(c) Total return at net asset value assuming all distributions reinvested.
(d) Not annualized.
(e) Had the investment advisor and/or any of its affiliates not waived a portion of expenses, total return would have been reduced.
(f) The benefits derived from custody fees paid indirectly had an impact of less than 0.01%.
(g) Annualized.
(h) Rounds to less than 0.01%.
See accompanying notes to financial statements.
16
Wanger USA 2010 Semiannual Report
Notes to Financial Statements (Unaudited)
1. Nature of Operations
Wanger USA (the "Fund"), is a series of Wanger Advisors Trust (the "Trust"), an open-end management investment company organized as a Massachusetts business trust. The investment objective of the Fund is to seek long-term capital appreciation. The Fund is available only for allocation to certain life insurance company separate accounts established for the purpose of funding qualified and non-qualified variable annuity contracts and variable life insurance policies and may also be offered directly to certain types of pension plans and retirement arrangements.
2. Significant Accounting Policies
The preparation of financial statements in accordance with accounting principles generally accepted in the United States of America ("GAAP") requires management to make certain estimates and assumptions that affect the reported amounts of assets and liabilities, the disclosure of contingent assets and liabilities at the date of the financial statements and the reported amounts of revenue and expenses during the reporting period. Actual results could differ from those estimates.
Security valuation
Securities of the Fund are valued at market value or, if a market quotation for a security is not readily available or is deemed not to be reliable because of events or circumstances that have occurred between the market quotation and the time as of which the security is to be valued, the security is valued at its fair value determined in good faith under consistently applied procedures established by the Board of Trustees. A security traded on a securities exchange or in an over-the-counter market in which transaction prices are reported is valued at the last sales price at the time of valuation. A security traded principally on NASDAQ is valued at the NASDAQ official closing price. Mutual Funds and Exchange Traded Funds are valued at their closing net asset value as reported to NASDAQ. A security for which there is no reported sale on the valuation date is valued at the latest bid quotation. Short-term investments maturing in 60 days or less are valued at amortized cost, which approximates market value. A security for which a market quotation is not readily available and any other assets are valued at its fair value determined in good faith under consistently applied procedures established by the Board of Trustees. The Trust has retained an independent statistical fair value pricing service that employs a systematic methodology to assist in the fair valuation process for securities principally traded in a foreign market in order to adjust for possible changes in value that may occur between the close of the foreign market and the time as of which the securities are to be valued. If a security is valued at a "fair value", that value may be different from the last quoted market price for the security.
Various inputs are used in determining the value of the Fund's investments, following the input prioritization hierarchy established by GAAP. These inputs are summarized in the three broad levels listed below:
• Level 1—quoted prices in active markets for identical securities
• Level 2—prices determined using other significant observable inputs where quoted prices or observable inputs are unavailable or less reliable (including quoted prices for similar securities, interest rates, prepayment speeds, credit risk and others)
• Level 3—prices determined using significant unobservable inputs (including management's own assumptions about the factors market participants would use in pricing an investment)
The inputs or methodologies used for valuing securities are not necessarily an indication of the risk associated with investing in those securities.
Examples of the types of securities in which the Fund would typically invest and how they are classified within this hierarchy are as follows. Typical level 1 securities include exchange traded domestic equities, mutual funds whose NAVs are published each day and exchange traded foreign equities that are not statistically fair valued. Typical level 2 securities include exchange traded foreign equities that are statistically fair valued and short-term investments valued at amortized cost. Additionally, securities fair valued by the Fund's valuation committee that rely on significant observable inputs are also included in level 2. Typical level 3 securities include any security fair valued by the Fund's Valuation Committee that relies on significant unobservable inputs.
On January 21, 2010, the Financial Accounting Standards Board issued an Accounting Standards Update, Fair Value Measurements and Disclosures (Topic 820): Improving Disclosures about Fair Value Measurements, (the "Update"), which provides guidance on how investment assets and liabilities are to be valued and disclosed. Specifically, the Update requires reporting entities to disclose the input and valuation techniques used to measure fair value for both recurring and nonrecurring fair value measurements for Level 2 and Level 3 positions. The Update also requires that transfers between all levels (including Level 1 and Level 2) be disclosed on a gross basis (i.e., transfers out must be disclosed separately from transfers in), and requires disclosure of the reason(s) for the transfer. Additionally, purchases, sales, issuances and settlements must be disclosed on a gross basis in the Level 3 rollforward. The effective date of the Update is for interim and annual periods beginning after December 15, 2009; except for the requirement to provide the Level 3 activity for purchases, sales, issuances and settlements on a gross basis, which will be effective for interim and annual periods beginning after December 15, 2010. The Fund adopted the Update effective March 31, 2010.
Repurchase agreements
The Fund may engage in repurchase agreement transactions. The Fund, through its custodian, receives delivery of underlying securities collateralizing each repurchase agreement. The counterparty is required to maintain collateral that is at all times at least equal to the repurchase price including interest. In the event of default or bankruptcy by the other party to the agreement, realization and/or retention of the collateral may be subject to legal proceedings.
Foreign currency translations
Values of investments denominated in foreign currencies are converted into U.S. dollars using the New York spot market rate of exchange at the time of valuation. Purchases and sales of investments and dividend and interest income are translated into U.S. dollars using the spot market rate of exchange prevailing on the respective dates of such transactions. The gain or loss resulting from changes in foreign exchange rates is included with net realized and unrealized gain or loss from investments, as appropriate.
Securities lending
The Fund may lend securities up to one-third of the value of its total assets to certain approved brokers, dealers and other financial institutions to earn additional income. The Fund retains the benefits of owning the securities, including receipt of dividends or interest generated by the security. The Fund also receives a fee for the loan. The Fund has the ability to recall the loans at any time and could do so in order to vote proxies or to sell the loaned securities. Each loan is collateralized by cash that exceeded the value of the securities on loan. The market value of the loaned securities is determined daily at the close of business of the Fund and any additional required collateral is delivered to each Fund on the next business day. The Fund has elected to invest the cash collateral in the Dreyfus Government Cash Management Fund and the income earned is paid to the Fund, net of any fees remitted to Goldman Sachs Agency Lending as the lending agent and borrower rebates. The Fund's advisor, Columbia Wanger Asset Management, LLC ("CWAM"), does not retain any fees earned by the lending program. Generally, in the event of borrower default, the Fund has the right to use the collateral to offset any losses incurred. In the event the Fund is delayed or prevented from exercising
17
Wanger USA 2010 Semiannual Report
Notes to Financial Statements, continued (Unaudited)
its right to dispose of the collateral, there may be a potential loss to the Fund. Some of these losses may be indemnified by the lending agent. The Fund bears the risk of loss with respect to the investment of collateral.
The net lending income earned in 2010 by the Fund is included in the Statement of Operations.
Security transactions and investment income
Security transactions are accounted for on the trade date (date the order to buy or sell is executed) and dividend income is recorded on the ex-dividend date, except that certain dividends from foreign securities are recorded as soon as the information is available to the Fund. Interest income is recorded on the accrual basis and includes amortization of discounts on debt obligations when required for federal income tax purposes. Realized gains and losses from security transactions are recorded on an identified cost basis.
Awards, if any, from class action litigation related to securities owned may be recorded as a reduction of cost of those securities. If the applicable securities are no longer owned, the proceeds are recorded as realized gains.
The Fund estimates the tax character of distributions from real estate investment trusts ("REITs"). Distributions received in excess of income are recorded as a reduction of the cost of the related investments. If the applicable securities are no longer owned, any distributions received in excess of income are recorded as realized gains.
Restricted securities
Restricted securities are securities that may only be resold upon registration under federal securities laws or in transactions exempt from registration. In some cases, the issuer of restricted securities has agreed to register such securities for resale at the issuer's expense either upon demand by the Fund or in connection with another registered offering of the securities. Many restricted securities may be resold in the secondary market in transactions exempt from registration. Such restricted securities may be determined to be liquid under criteria established by the Board of Trustees.
Fund share valuation
Fund shares are sold and redeemed on a continuing basis at net asset value. Net asset value per share is determined daily as of the close of trading on the New York Stock Exchange ("the Exchange") on each day the Exchange is open for trading by dividing the total value of the Fund's investments and other assets, less liabilities, by the number of Fund shares outstanding.
Custody fees/Credits
Custody fees are reduced based on the Fund's cash balances maintained with the custodian. The amount is disclosed as a reduction of total expenses in the Statement of Operations.
Federal income taxes
The Fund has complied with the provisions of the Internal Revenue Code available to regulated investment companies and, in the manner provided therein, distributes all its taxable income, as well as any net realized gain on sales of investments and foreign currency transactions reportable for federal income tax purposes. Accordingly, the Fund paid no federal income taxes and no federal income tax provision was required.
Expenses
General expenses of the Trust are allocated to the Fund and the other series of the Trust based upon relative net assets or other expense allocation methodologies determined by the nature of the expense. Expenses directly attributable to the Fund are charged to the Fund.
Distributions to shareholders
Distributions to shareholders are recorded on the ex-dividend date.
Indemnification
In the normal course of business, the Trust on behalf of the Fund enters into contracts that contain a variety of representations and warranties and that provide general indemnities. The Fund's maximum exposure under these arrangements is unknown, as this would involve future claims against the Fund. Also under the Trust's organizational documents, the trustees and officers of the Trust are indemnified against certain liabilities that may arise out of their duties to the Trust. However based on experience, the Fund expects the risk of loss due to these warranties and indemnities to be minimal.
3. Federal Tax Information
The tax character of distributions paid during the year ended December 31, 2009 was as follows:
| Ordinary Income* | | $ | — | | |
| Long-Term Capital Gains | | | — | | |
* For tax purposes short-term capital gain distributions, if any, are considered ordinary income distributions.
The following capital loss carryforwards, determined as of December 31, 2009, may be available to reduce taxable income arising from future net realized gains on investments, if any, to the extent permitted by the Internal Revenue Code:
Year of
Expiration | | Capital Loss
Carryforwards | |
| 2016 | | $ | 48,548,576 | | |
| 2017 | | | 15,575,489 | | |
| Total | | $ | 64,124,065 | | |
Under current tax rules, certain currency (and capital) losses realized after October 31 may be deferred and treated as occurring on the first day of the following fiscal year. As of December 31, 2009, post-October capital losses of $5,103,988 attributed to security transactions were deferred to January 1, 2010.
Management is required to determine whether a tax position of the Fund is more likely than not to be sustained upon examination by the applicable taxing authority, including resolution of any related appeals or litigation processes, based on the technical merits of the position. The tax benefit to be recognized by the Fund is measured as the largest amount of benefit that is greater than fifty percent likely of being realized upon ultimate settlement. Management is not aware of any tax positions for which it is reasonably possible that the total amounts of unrecognized tax benefits will significantly change in the next twelve months. However, management's conclusions may be subject to review and adjustment at a later date based on factors including, but not limited to, new tax laws, regulations, and administrative interpretations (including relevant court decisions). The Fund's federal tax returns for the prior three fiscal year s remain subject to examination by the Internal Revenue Service.
4. Transactions With Affiliates
CWAM is a wholly owned subsidiary of Columbia Management Investment Advisers, LLC ("Columbia Management"), which in turn is an indirect, wholly owned subsidiary of Ameriprise Financial, Inc. ("Ameriprise Financial"). CWAM furnishes continuing investment supervision to the Fund and is responsible for the overall management of the Fund's business affairs.
After the close of business on April 30, 2010, (the "Closing"), Ameriprise Financial acquired from Bank of America Corporation ("BOA"), a portion of the asset management business of Columbia Management Group, LLC, including 100% of CWAM. On May 27, 2010, the shareholders of the Fund approved a new investment advisory agreement with CWAM to provide advisory services to the Fund. There were no changes to the Fund's advisory fee rate under the new agreement.
18
Wanger USA 2010 Semiannual Report
Notes to Financial Statements, continued (Unaudited)
CWAM receives a monthly advisory fee based on the Fund's average daily net assets at the following annual rates:
| Average Daily Net Assets | | Annual Fee Rate | |
| Up to $100 million | | | 0.94 | % | |
| $100 million to $250 million | | | 0.89 | % | |
| $250 million to $2 billion | | | 0.84 | % | |
| $2 billion and over | | | 0.80 | % | |
For the six months ended June 30, 2010, the Fund's annualized effective investment advisory fee rate net of fee waivers, was 0.85% of average daily net assets. CWAM has contractually agreed to reimburse the Fund to the extent that investment advisory fees exceed an annual percentage of 0.85% of average daily net assets on an annualized basis, through April 30, 2012. The reimbursement for the six months ended June 30, 2010, was $12,366.
CWAM provides administrative services and receives an administration fee from the Fund at the following annual rates.
Wanger Advisors Trust Aggregate
Average Daily Net Assets of the Trust | | Annual Fee Rate | |
| Up to $4 million | | | 0.05 | % | |
| $4 billion to $6 billion | | | 0.04 | % | |
| $6 billion to $8 billion | | | 0.03 | % | |
| $8 billion and over | | | 0.02 | % | |
For the six months ended June 30, 2010, the Fund's annualized effective administration fee rate was 0.05% of average daily net assets. Prior to the Closing, CWAM had delegated to Columbia Management Advisors, LLC ("CMA") an indirect, wholly owned subsidiary of BOA, responsibility to provide certain sub-administrative services to the Fund. Following the Closing, Riversource Investments, LLC, a wholly owned subsidiary of Ameriprise Financial, acquired the assets of CMA and subsequently changed its name to Columbia Management, and thereafter began providing certain sub-administrative services to the Fund.
Prior to the Closing, Columbia Management Distributors, Inc., a wholly owned subsidiary of BOA, served as the Fund's distributor and principal underwriter. In connection with the Closing, RiverSource Fund Distributors, Inc., a wholly owned subsidiary of Ameriprise Financial, became the distributor of the Fund and subsequently changed its name to Columbia Management Investment Distributors, Inc. ("CMDI"). There were no changes to the underwriting discount structure of the Fund or the service or distribution fee rates paid by the Fund as a result of the Closing.
Prior to the Closing, Columbia Management Services, Inc., an indirect, wholly owned subsidiary of BOA, provided shareholder services to the Fund and contracted with Boston Financial Data Services ("BFDS") to serve as sub-transfer agent. In connection with the Closing, RiverSource Service Corporation, a wholly owned subsidiary of Ameriprise Financial, became the transfer agent of the Fund and subsequently changed its name to Columbia Management Investment Services Corp. ("CMIS"). The transfer agent fee rates paid by the Fund did not change as a result of the change in transfer agent. For its services, the Fund pays CMIS a monthly fee at the annual rate of $21.00 per open account. CMIS also receives reimbursement for certain out-of-pocket expenses and sub-transfer agency expenses. The arrangement with BFDS has been continued by CMIS.
Certain officers and trustees of the Trust are also officers of CWAM. The Trust makes no direct payments to its officers and trustees who are affiliated with CWAM.
The Board of Trustees has appointed a Chief Compliance Officer of the Trust in accordance with federal securities regulations. The Fund, along with other affiliated funds, pays its pro-rata share of the expenses associated with the Office of the Chief Compliance Officer. These expenses are disclosed separately as "Chief compliance officer expenses" in the Statement of Operations.
The Trust offers a deferred compensation plan for its independent trustees. Under that plan, a trustee may elect to defer all or a portion of his or her compensation. Amounts deferred are retained by the Trust and may represent an unfunded obligation of the Trust. The value of amounts deferred is determined by reference to the change in value of Class Z shares of one or more series of Columbia Acorn Trust or a money market fund as specified by the trustee. Benefits under the deferred compensation plan are payable when the trustee ceases to be a member of the Board of Trustees.
An affiliated person of the Fund may include any company in which the Fund owns five percent or more of its outstanding voting shares. On June 30, 2010, the Fund held five percent of more of the outstanding voting securities of one of more companies. Details of investments in those affiliated companies are presented in the Notes to the Statement of Investments on page 12.
During the six months ended June 30, 2010, the Fund engaged in purchase and sales transactions with funds that have a common investment advisor (or affiliated investment advisors), common directors/trustees, and/or common officers. Those purchase and sale transactions complied with provisions of Rule 17a-7 under the Investment Company Act of 1940 and were $422,400 and $428,510,161, respectively.
During May and June 2010, a significant number of shares of the Fund, representing the interests of owners of contracts issued by insurance companies affiliated with Ameriprise Financial, were redeemed. In an effort to minimize the impact on the remaining shareholders, Ameriprise Financial agreed to reimburse the Fund $34,624 in interest charges and $19,197 in certain transaction costs that were incurred as a result of the redemption.
5. Borrowing Arrangements
The Trust participates in a $150 million credit facility, along with another Trust managed by CWAM, which was entered into to facilitate portfolio liquidity. Under the facility, interest is charged to each participating fund based on its borrowings at a rate per annum equal to the higher of Federal Funds Rate or Overnight LIBOR plus 1.25%. In addition, a commitment fee of 0.15% per annum of the unutilized line of credit is accrued and apportioned among the participating funds based on their relative net assets. The commitment fee is included in "Other expenses" in the Statement of Operations. For the six months ended June 30, 2010, the average daily loan balance outstanding on days where borrowing existed was $100,537,500 at a weighted average interest rate of 1.55%. The Trust enters into this line of credit for one year durations. The Trust has secured the line of credit for the entire year of 2010.
6. Fund Share Transactions
Proceeds and payments on Fund shares as shown in the Statement of Changes in Net Assets are in respect of the following numbers of shares:
| | | Six Months Ended
June 30, 2010 | | Year ended
December 31, 2009 | |
| Shares sold | | | 812,160 | | | | 3,261,189 | | |
| Less shares redeemed | | | (18,203,440 | ) | | | (6,075,892 | ) | |
| Net decrease in shares outstanding | | | (17,391,280 | ) | | | (2,814,703 | ) | |
7. Investment Transactions
The aggregate cost of purchases and proceeds from sales other than short-term obligations for the six months ended June 30, 2010 were $173,890,725 and $660,638,233, respectively.
8. Information Regarding Pending and Settled Legal Proceedings
In June 2004, an action captioned John E. Gallus et al. v. American Express Financial Corp. and American Express Financial Advisors Inc. was filed in the United States District Court for the District of Arizona. The plaintiffs allege that they are investors in several American Express Company (now known as RiverSource) mutual funds and they purport to bring the action derivatively on
19
Wanger USA 2010 Semiannual Report
Notes to Financial Statements, continued (Unaudited)
behalf of those funds under the Investment Company Act of 1940. The plaintiffs allege that fees allegedly paid to the defendants by the funds for investment advisory and administrative services are excessive. The plaintiffs seek remedies including restitution and rescission of investment advisory and distribution agreements. The plaintiffs voluntarily agreed to transfer this case to the United States District Court for the District of Minnesota (the District Court). In response to defendants' motion to dismiss the complaint, the District Court dismissed one of plaintiffs' four claims and granted plaintiffs limited discovery. Defendants moved for summary judgment in April 2007. Summary judgment was granted in the defendants' favor on July 9, 2007. The plaintiffs filed a notice of appeal with the Eighth Circuit Court of Appeals (the Eighth Circuit) on August 8, 2007. On April 8, 2009, the Eighth Circuit reversed summary judgment a nd remanded to the District Court for further proceedings. On August 6, 2009, defendants filed a writ of certiorari with the U.S. Supreme Court (the Supreme Court), asking the Supreme Court to stay the District Court proceedings while the Supreme Court considers and rules in a case captioned Jones v. Harris Associates, which involves issues of law similar to those presented in the Gallus case. On March 30, 2010, the Supreme Court issued its ruling in Jones v. Harris Associates, and on April 5, 2010, the Supreme Court vacated the Eighth Circuit's decision in the Gallus case and remanded the case to the Eighth Circuit for further consideration in light of the Supreme Court's decision in Jones v. Harris Associates. On June 4, 2010, the Eighth Circuit remanded the Gallus case to the District Court for further consideration in light of the Supreme Court's decision in Jones v. Harris Associates.
In December 2005, without admitting or denying the allegations, American Express Financial Corporation (AEFC, which is now known as Ameriprise Financial, Inc. (Ameriprise Financial)), entered into settlement agreements with the Securities and Exchange Commission (SEC) and Minnesota Department of Commerce (MDOC) related to market timing activities. As a result, AEFC was censured and ordered to cease and desist from committing or causing any violations of certain provisions of the Investment Advisers Act of 1940, the Investment Company Act of 1940, and various Minnesota laws. AEFC agreed to pay disgorgement of $10 million and civil money penalties of $7 million. AEFC also agreed to retain an independent distribution consultant to assist in developing a plan for distribution of all disgorgement and civil penalties ordered by the SEC in accordance with various undertakings detailed at http://www.sec.gov/litigation/admin/ia-2451.pdf. Ameriprise Financial and its affiliates have cooperated with the SEC and the MDOC in these legal proceedings, and have made regular reports to the Columbia Management Funds' Boards of Directors/Trustees.
Ameriprise Financial and certain of its affiliates have historically been involved in a number of legal, arbitration and regulatory proceedings, including routine litigation, class actions, and governmental actions, concerning matters arising in connection with the conduct of their business activities. Ameriprise Financial believes that the Funds are not currently the subject of, and that neither Ameriprise Financial nor any of its affiliates are the subject of, any pending legal, arbitration or regulatory proceedings that are likely to have a material adverse effect on the Funds or the ability of Ameriprise Financial or its affiliates to perform under their contracts with the Funds. Ameriprise Financial is required to make 10-Q, 10-K and, as necessary, 8-K filings with the Securities and Exchange Commission on legal and regulatory matters that relate to Ameriprise Financial and its affiliates. Copies of these filings may be obt ained by accessing the SEC website at www.sec.gov.
There can be no assurance that these matters, or the adverse publicity associated with them, will not result in increased fund redemptions, reduced sale of fund shares or other adverse consequences to the Funds. Further, although we believe proceedings are not likely to have a material adverse effect on the Funds or the ability of Ameriprise Financial or its affiliates to perform under their contracts with the Funds, these proceedings are subject to uncertainties and, as such, we are unable to estimate the possible loss or range of loss that may result. An adverse outcome in one or more of these proceedings could result in adverse judgments, settlements, fines, penalties or other relief that could have a material adverse effect on the consolidated financial condition or results of operations of Ameriprise Financial.
*****
CWAM, Columbia Acorn Trust (another mutual fund family advised by CWAM), and the trustees of Columbia Acorn Trust (collectively, the "Columbia defendants") were named as defendants in class and derivative complaints that were consolidated in a Multi-District Action (the MDL Action) in the federal district court of Maryland. These lawsuits contend that defendants permitted certain investors to market time their trades in certain Columbia Acorn Funds. The MDL Action is ongoing. However, all claims against the Trust and the Independent Trustees of the Trust have been dismissed.
Columbia Acorn and CWAM are also defendants in a state court class action lawsuit that alleges, in summary, that the Trust and CWAM exposed shareholders of Columbia Acorn International to trading by market timers by allegedly: (a) failing to properly evaluate daily whether a significant event affecting the value of the Fund's securities had occurred after foreign markets had closed but before the calculation of the Fund's net asset value (NAV); (b) failing to implement the Fund's portfolio valuation and share pricing policies and procedures; and (c) failing to know and implement applicable rules and regulations concerning the calculation of NAV (the Fair Valuation Lawsuit). The United States Court of Appeals for the Seventh Circuit ruled that the plaintiffs' state law claims were preempted under federal law, resulting in the dismissal of plaintiffs' complaint. Plaintiffs appealed the Seventh Circuit's ruling to the United States Supreme Court. The Supreme Court reversed the Seventh Circuit's ruling on jurisdictional grounds and the case was remanded to the state court.
On March 21, 2005, a class action complaint was filed against the Trust and CWAM seeking to rescind the CDSC assessed upon redemption of Class B shares of the Columbia Acorn Funds (the CDSC Lawsuit). In addition to the rescission of sales charges, plaintiffs seek recovery of actual damages, attorneys' fees and costs. The case was transferred to the MDL Action in the federal district court of Maryland.
On September 14, 2007, the plaintiffs and the Columbia defendants named in the MDL Action, including the Columbia family of funds, entered into a stipulation of settlement with respect to all Columbia-related claims in the MDL Action described above, including the CDSC and Fair Valuation Lawsuits.
On April 23, 2010, the parties of the MDL Action filed a motion seeking: (a) preliminary approval of the MDL settlements; (b) the conditional certification of the plaintiff class for purposes of settlement; (c) approval of the form and manner of giving notice to the plaintiff class of the proposed settlements; and (d) approval of the proposed schedule for various deadlines in connection with the final settlement hearing. The motion was presented to and approved by the court on May 7, 2010. The final hearing on the fairness of the settlements is scheduled for October 21, 2010.
CWAM believes that the lawsuits are not likely to materially affect its ability to provide investment management services to the Funds.
20
Wanger USA 2010 Semiannual Report
[Excerpt from:]
Wanger Advisors Trust
Management Fee Evaluation of the Senior Officer
Prepared Pursuant to the New York Attorney General's
Assurance of Discontinuance
December 2009
21
Wanger USA 2010 Semiannual Report
Introduction
The New York Attorney General's Assurance of Discontinuance ("Order") entered into by Columbia Management Advisors, LLC ("CMAI") and Columbia Management Distributors, Inc., ("CMDI") in February 2005, allows CMAI to manage or advise a mutual fund only if the trustees of the fund appoint a "Senior Officer" to perform specified duties and responsibilities. One of these responsibilities includes "managing the process by which proposed management fees (including but not limited to, advisory fees) to be charged the [funds] are negotiated so that they are negotiated in a manner which is at arms' length and reasonable and consistent with this Assurance of Discontinuance."
The Columbia Acorn Trust and Wanger Advisors Trust (collectively, the "Trusts") and each series thereof (the "Acorn Funds," "WAT Funds" or collectively, the "Funds") are overseen by the same Board of Trustees ("Board"). The Order provides that this Board must determine the reasonableness of proposed "management fees" by using either an annual competitive bidding process supervised by the Senior Officer or Independent Fee Consultant, or by obtaining "an annual independent written evaluation prepared by or under the direction of the Senior Officer or the Independent Fee Consultant."
"Management fees" are only part of the costs and expenses paid by mutual fund shareholders. Fund expenses can vary depending upon the class of shares held but usually include: (1) investment management or advisory fees to compensate analysts and portfolio managers for stock research and portfolio management, as well as the cost of operating a trading desk; (2) administrative expenses incurred to prepare registration statements and tax returns, calculate the funds' net asset values, maintain effective compliance procedures and perform recordkeeping services; (3) transfer agency costs for establishing accounts, accepting and disbursing funds, as well as overseeing trading in fund shares; (4) custodial expenses incurred to hold the securities purchased by the funds; and (5) distribution expenses, including commissions paid to brokers that sell the fund shares to investors.
Columbia Wanger Asset Management, L.P. ("CWAM"), is the adviser to the Funds, and at present is a part of Columbia Management Group ("Columbia"), an umbrella organization that also includes CMAI, Columbia Management Services, Inc. ("CMSI") and CMDI. Columbia is owned by Bank of America Corporation ("Bank of America").
The Proposed Change of Ownership
On September 29, 2009, Bank of America entered into a Purchase Agreement ("APA") with Ameriprise Financial, Inc. ("Ameriprise") providing for, among other things, the sale of CWAM to Ameriprise and the acquisition by Ameriprise of certain assets of Columbia. The Columbia assets to be acquired by Ameriprise include the functions currently performed by CMAI, CMSI and CMDI. Because some of Columbia's operations are supported by Bank of America staff and facilities outside of Columbia, Ameriprise and Bank of America entered into a Transition Services Agreement ("TSA") that, among other things, provides for the continuation of those services for a period of time. The parties contemplate a closing date of the APA in Spring 2010, and closing is conditioned upon the approval by the Board of a new advisory agreement between the Trusts and CWAM, as well as agreements with the entities that will succeed CMSI, CMDI and CMAI. These entities& #151;RiverSource Fund Services, Inc. ("RFS"), RiverSource Fund Distributors, Inc. ("RFD") and RiverSource Investments, LLC—are wholly owned subsidiaries of Ameriprise and currently support the RiverSource family of mutual funds. Therefore, if the sale is consummated as contemplated by the various agreements, CWAM's ownership will change from Bank of America to Ameriprise, as will the Funds' primary service providers.1
Columbia and Ameriprise have proposed that the Trusts continue, in substance, the existing advisory agreement governing portfolio management, and the administration services agreement governing certain administration and clerical services. They propose no material changes to these agreements, no change in services and no changes in fee levels, only those changes necessary to effect the change of ownership. The fees paid under these two agreements are referred to as "management fees." Other fund expenses will be governed by separate agreements, in particular agreements with two Ameriprise affiliates: RFD, the broker-dealer that will underwrite and distribute the Funds' shares, and RFS the Funds' proposed transfer agent.
While the proposed agreements themselves suggest no substantive changes in the services provided to the Funds, Ameriprise and Columbia have informed the Board that they intend to embark on a process of integrating the operations of the two organizations with respect to administration and other services. Among the objectives of that integration are the reduction of costs, and increased economies of scale. Further, CWAM will be subject to new management oversight by Ameriprise which, among other things, will establish the compensation structure for CWAM's portfolio managers and analysts.
Requirements of the Order
The Order applies to any successor to substantially all the assets of CMDI and CMAI. Under the Order, a fee evaluation must precede the execution of new advisory and administration services agreements; there is no express exception from this requirement for agreements that are intended solely to transfer ownership of the existing service providers. I have been advised by Columbia that it believes the Order requires the preparation of this fee evaluation.
In conformity with the terms of the Order and past evaluations, this evaluation addresses only the advisory and administration contracts, and does not extend to any proposed new underwriting and transfer agency agreements.
1 The Funds' custodian is State Street Bank and Trust Company. No change in custodian is required by the APA nor is such a change contemplated at this time.
22
Wanger USA 2010 Semiannual Report
According to the Order, the Senior Officer's evaluation must consider at least the following:
(1) Management fees (including components thereof) charged to institutional and other clients of CWAM for like services;
(2) Management fees (including any components thereof) charged by other mutual fund companies for like services;
(3) Costs to CWAM and its affiliates of supplying services pursuant to the management fee agreements, excluding any intra-corporate profit;
(4) Profit margins of CWAM and its affiliates from supplying such services;
(5) Possible economies of scale as the Funds grow larger; and
(6) The nature and quality of CWAM's services, including the performance of each Fund.
In 2004, the Boards of the two Trusts, then separate groups, each appointed me Senior Officer under the Order. They also determined not to pursue a competitive bidding process and instead, charged me with the responsibility of evaluating the Funds' proposed advisory and administration fee contracts with CWAM in conformity with the requirements of the Order. In discharging their responsibilities, the independent Trustees have also consulted independent, outside counsel. The Board has asked that I prepare this evaluation.
2009 Evaluation
In May 2009, I submitted to the Board the fourth annual evaluation prepared under the Order. That evaluation, based on performance and fee data as of December 31, 2008, was considered by the Board in renewing the advisory and administration services agreements that were effective on July 31, 2009. That evaluation followed the same structure as the earlier studies. Some areas were given more emphasis, while others were given less. Still, the fundamental information gathered for that evaluation was largely the same as past years. That evaluation is referred to here as the "2009 Study."
Process and Independence
The objectives of the Order are to ensure the independent evaluation of the management fees paid by the Funds as well as to insure that all relevant factors are considered. In my view, this contract process has been conducted at arms-length and with independence in gathering, considering and evaluating all relevant data. At the outset of the process, the Trustees sought and obtained from Ameriprise and Columbia a comprehensive compilation of data regarding Fund performance and expenses, adviser profitability, and other information. The Trustees, acting through their Performance Committee and the Ad Hoc Committee, evaluated this information thoroughly, and met often to discuss it. Performance and expense data was obtained from both Morningstar and Lipper, the leading consultants in this area. The rankings prepared by Morningstar and Lipper were independent and prepared in conformity with the methodologies employed by those organi zations. Counsel for the Funds and the Independent Trustees considered, as did I, the terms and conditions of the existing contracts, and evaluated them in light of the proposed transaction.
In the course of its work, the Trustees also gave careful consideration to the conclusions and recommendations contained in the 2009 Study.
My evaluation of the advisory contracts was shaped, as it has been in the past, by my experience as Chief Compliance Officer of the Trusts ("CCO"). As CCO, I report solely to the Board and have no reporting obligation to, or employment relationship with, Columbia or its affiliates. I have commented on compliance matters in evaluating the quality of service provided by CWAM.
This Report, its supporting materials and the data contained in other materials submitted to the Ad Hoc and Performance Committees of the Board, in my view, provide a thorough factual basis upon which the Board, in consultation with independent counsel as it deems appropriate, may conduct management fee negotiations that are in the best interests of the Funds' shareholders.
The Fee Reductions Mandated under the Order
Under the terms of the Order, Columbia agreed to secure certain management fee reductions for the mutual funds advised by its affiliate investment advisers. In some instances, breakpoints were also established. Although neither CWAM nor the Trusts was a party to the Order, CWAM offered and the Board accepted certain advisory fee reductions during 2005. By the terms of the Order, these fees may not be increased before November 30, 2009, and under the Investment Company Act, may not be increased before March 2012 or later (other than for bona fide additional investment advisory services), if the closing date of the transaction is later than March 2010. I have used these advisory fee levels, as modified thereafter, in this evaluation because they are the fees in the current agreements that CWAM and Ameriprise propose should be continued. Hence, these fee levels are the starting point of an evaluation.
Conclusions
My review of the data and other material above leads to the following conclusions with respect to the factors identified in the Order.
A. Fund Performance
The Domestic Funds: The Acorn Fund has achieved good performance over the past five years, and achieved those results with less risk than its peers. Acorn Select and Wanger Select have enjoyed strong investment returns in the past year, resulting in improved rankings that place those funds near or in the top third of their peers over the trailing five year period. These results are achieved, however, with greater relative risk than the other domestic Funds. Acorn USA and its parallel, Wanger USA have not been as strong as the other Funds relative to their peers over this period, turning in a largely average
23
Wanger USA 2010 Semiannual Report
performance, though both Funds have outperformed their benchmarks. Thermostat is unique and therefore difficult to assess, but now enjoys a Morningstar rank above its peer median. The overall trend for performance of the domestic Funds is positive, and further, all domestic Funds enjoy positive alpha, confirming that their portfolio managers add value to performance.
The International Funds: The international Funds experienced a challenging 12 month period relative to their peers, but their five year rankings remain at or above the median. These Funds have enjoyed periods of strong out-performance during that five year stretch. Further, they have outperformed their benchmarks during the past five years, and done so while exposing shareholders to less risk than competitors. Finally, all the international Funds enjoy positive alpha, again confirming the value of their portfolio managers.
B. Management Fees Relative to Peers
There is significant variance in management fee rankings across the Funds. Acorn International is the only fund that was ranked in the top quartile by both Morningstar and Lipper. The other Acorn funds tend to fall around the medians identified by one or the other service. The WAT funds are uniformly more expensive than their peers.
C. Management Fees Relative to Institutional Account and Other Mutual Fund Accounts
CWAM's focus is on its mutual funds. The few institutional accounts it does manage vary in rate structures. Some pay advisory fees commensurate with or higher than the Acorn and WAT funds. In a few instances, however, institutional accounts pay lower advisory fees than do the Acorn funds. One such institutional account is significant in size and has been under CWAM's management for over 31 years. Further, CWAM performs sub-advisory services for two mutual funds managed by RiverSource, a fund family operated by Ameriprise, at rates that are lower than those paid by the parallel Acorn funds, though sub-advisory services can differ from those necessary for the full support of a mutual fund.
D. Administrative Services
The Acorn and WAT funds' administrative fees are generally less competitive than are the fees charged by competitors, but these rankings suffer from a lack of uniformity in the scope of services encompassed by the fee. CWAM and CMAI provide excellent administrative support for all the Funds.
E. Costs and Benefits to CWAM and its Affiliates
CWAM's direct costs do not appear excessive. Overhead and indirect costs allocated to CWAM by its parent organizations, however, are significant and have varied considerably over the years. CWAM's affiliates report operating losses and therefore do not appear to enjoy excessive "fall out" benefits from CWAM's advisory agreement with the Funds. CWAM continues to enjoy substantial benefits from the use of "soft dollar" payments for research.
F. Profitability
CWAM's profit margins have declined in recent periods, as have the margins of many fund companies, but it still maintains margins that appear to be in the upper range of its competitors.
G. Economies of Scale
Economies of scale do exist at CWAM, and the Board has instituted breakpoints that reflect that reality. In the past two years, however, asset levels have generally declined, and sustained asset growth will be required to trigger additional fee reductions under the current schedule. Asset declines have not, however, resulted in significant fee increases.
H. Nature and Quality of Service
This category includes a variety of considerations that are difficult to quantify, yet can have a significant bearing on the performance of the Acorn and WAT funds. Several areas merit comment.
1. Capacity. CWAM has maintained its investment management capacity even in a difficult environment.
2. Compliance. CWAM has a reasonably designed compliance program that protects shareholders.
I. Process
In my opinion, the process of negotiating an advisory contract for the Funds has been conducted thoroughly and at arms' length. The Ad Hoc Committee has taken the steps necessary to assess the proposed change of ownership and recommended appropriate measures to protect Fund shareholders. It has also taken steps to encourage an agreement on an appropriate incentive plan for CWAM that will facilitate the continuity of management, motivate CWAM professionals and that will align their efforts with the interests of Fund shareholders. The Trustees have sufficient information to evaluate management's proposal, and negotiate contract terms that are in the best interests of fund shareholders.
****
24
Wanger USA 2010 Semiannual Report
Recommendations
I believe the Trustees should:
1. Continue to monitor closely the performance of Acorn USA and Wanger USA, to assess the impact of the portfolio changes implemented by the portfolio manager.
2. Focus their review on the WAT funds' management fee levels in relation to their peers, in particular the fees paid by Wanger Select, which are, in the views of both Morningstar and Lipper, significantly higher than their peers.
3. Take appropriate steps to insure that any integration of the two organizations does not adversely impact Fund shareholders, and continue their efforts to facilitate an agreement on an appropriate incentive plan for CWAM personnel that will both motivate them and align their interests with Fund shareholders.
4. Consider the fees paid by (sub-advisory fees) and to (revenue sharing payments) the proposed new parent organization, Ameriprise or its mutual funds, to identify and address all conflicts of interest.
Robert P. Scales
December 2009
25
Wanger USA 2010 Semiannual Report
[Excerpt from:]
Wanger Advisors Trust
Supplement to the Management Fee Evaluation of the Senior Officer
Prepared Pursuant to the New York Attorney General's
Assurance of Discontinuance
April 2010
26
Wanger USA 2010 Semiannual Report
Introduction
In December 2009, I prepared a fee evaluation required under the New York Attorney General's Assurance of Discontinuance ("Order") entered into by Columbia Management Advisors, LLC ("CMAI") and Columbia Management Distributors, Inc., ("CMDI") in February 2005. That Order allows CMAI to manage or advise a mutual fund only if the trustees of the fund appoint a "Senior Officer" to perform specified duties and responsibilities. One of these responsibilities includes "managing the process by which proposed management fees (including but not limited to, advisory fees) to be charged the [funds] are negotiated so that they are negotiated in a manner which is at arms' length and reasonable and consistent with this Assurance of Discontinuance."
The Columbia Acorn Trust and Wanger Advisors Trust (collectively, the "Trusts") and each series thereof (the "Acorn Funds," "WAT Funds" or collectively, the "Funds") are overseen by the same Board of Trustees ("Board"). The Order provides that this Board must determine the reasonableness of proposed "management fees" by using either an annual competitive bidding process supervised by the Senior Officer or Independent Fee Consultant, or by obtaining "an annual independent written evaluation prepared by or under the direction of the Senior Officer or the Independent Fee Consultant."
Columbia Wanger Asset Management, L.P. ("CWAM"), is the adviser to the Funds, and at present is a part of Columbia Management Group ("Columbia"), an umbrella organization that also includes CMAI, Columbia Management Services, Inc. ("CMSI") and CMDI. Columbia is owned by Bank of America Corporation ("Bank of America").
On September 29, 2009, Bank of America entered into a Purchase Agreement ("APA") with Ameriprise Financial, Inc. ("Ameriprise") providing for, among other things, the sale of CWAM to Ameriprise and the acquisition by Ameriprise of certain assets of Columbia. The parties contemplate a closing date of the APA in Spring 2010, and closing is conditioned upon the approval by the Board of a new advisory agreement between the Trusts and CWAM, as well as agreements with the entities that will succeed CMSI, CMDI and CMAI. These entities—RiverSource Fund Services, Inc. ("RFS"), RiverSource Fund Distributors, Inc. ("RFD") and RiverSource Investments, LLC—are wholly owned subsidiaries of Ameriprise and currently support the RiverSource family of mutual funds. Therefore, if the sale is consummated as contemplated by the various agreements, CWAM's ownership will change from Bank of America to Ameriprise, as will the Funds' primary s ervice providers.
Ameriprise, through various separate accounts ("Accounts") established by certain of its insurance company affiliates, is currently an investor in the WAT Funds on behalf of contract holders in variable insurance policies and variable annuity contracts (together, the "Contracts") that Ameriprise or its affiliates have marketed to their clients. In the WAT structure, the insurance companies purchase shares in the WAT Funds on behalf of the Accounts, which fund the Contracts. The insurance company enters into a participation agreement with Wanger Advisors Trust to purchase shares on behalf of its Accounts. The Accounts are the actual investors in the Wanger Funds, not the individual contract holders. Through this structure, Ameriprise controlled Accounts hold approximately $2 billion or two-thirds of the WAT Funds' total assets; approximately nine other insurance companies also participate in the WAT Funds and hold the remaining a ssets in those Funds. Ameriprise also maintains a small account with CWAM that is a sub-account for a RiverSource mutual fund. This sub-account is not subject to oversight by the WAT or Acorn Board.
Columbia and Ameriprise have proposed that the Trusts continue, in substance, the existing advisory agreement governing portfolio management, and the administration services agreement governing certain administration and clerical services. They propose no change in services and no changes in fee levels, only those changes necessary to effect the change of ownership. The fees paid under these two agreements are referred to as "management fees."
Reasons for this Supplement
This Supplement is prompted by notice given by Ameriprise, after completion of the fee evaluation in December, that following the closing of the transaction, it anticipates a redemption of approximately $1 billion of its clients' investments in two of the WAT Funds (Wanger USA and Wanger International), and re-investment of most of the proceeds in one or more RiverSource mutual funds; CWAM will sub-advise these funds in two new sub-accounts at CWAM and effect investment strategies substantially identical to those pursued by the WAT Funds from which those funds were redeemed. One of the sub-accounts will parallel WAT International/Acorn International, and the other Wanger USA/Acorn USA. Ameriprise has advised the Board of the sub-advisory fees to be paid to CWAM and such sub-advisory fees will be lower than the advisory fee paid to CWAM by the parallel WAT Fund. Sub-advised accounts of this kind are generally considered instituti onal accounts and sub-advisory services are priced differently (and usually lower) than the advisory fees for mutual funds that are not sub-advised.
The Order and the Investment Company Act require fund trustees to consider, among other things, the proposed management fees (including components thereof) charged to institutional and other clients of the adviser for like services. As the Fee Evaluation notes, CWAM historically has maintained very few institutional accounts with relatively few assets under management. The new Ameriprise accounts are, therefore, a departure from past practice at CWAM.
Ameriprise's intentions pose the following issues with respect to assessing the reasonableness of the management fee proposed by Ameriprise for the WAT and Acorn Funds:
1. How do the Funds' fees compare to the fees paid by the parallel institutional accounts?
2. What impact might the redemption have on the fees paid by the shareholders who remain in the WAT Funds after the Ameriprise action?
3. Would expanded assets in the institutional accounts strain CWAM's limited capacity to manage the Acorn and WAT Funds?
This Supplement is intended solely to address these points as additional information for consideration by the Trustees in assessing the reasonableness of the management fees proposed by Ameriprise.
****
27
Wanger USA 2010 Semiannual Report
Conclusions
The conclusions and recommendations in the December 2009 Fee Evaluation remain valid today. Consideration of the Ameriprise redemption proposal leads to the following additional conclusions and recommendations.
A. Reasonableness of the Advisory Fees and Related Considerations
CWAM will soon manage assets in a sub-advised account at fee levels that reflect a substantial discount to the parallel mutual fund. Ameriprise has set forth the differences in services that support its claim that this divergence in fees is justified. These justifications should be revisited by the Trustees. In addition, the redemption will result in higher fees for remaining participants in the WAT Funds, and will result in brokerage and other expenses for Fund participants. These costs should also be a part of the Trustees' calculus in assessing fees. Lastly, the prospect of increased assets for CWAM management raises potential future issues of investment capacity.
B. Process
In my opinion, the process of negotiating an advisory contract for the Funds has been conducted thoroughly and at arms' length. The Board's Contract Committee and its Ad Hoc Committee engaged in a careful assessment of the repercussions of the Ameriprise redemption proposal, assessed as best as possible its potential costs, and revisited the breakpoint schedules of the WAT and Acorn Funds to determine whether WAT Fund participants are treated equitably in relation to Acorn Fund shareholders. It also gave consideration to the fee differential between institutional and mutual fund accounts. The Trustees met on a number occasions with me and with counsel, and gave close attention to a variety of materials including data submitted by Ameriprise and the legal analysis of counsel. The Trustees have sufficient information to evaluate management's proposals, and negotiate contract terms that are in the best interests of fund shareholder s. Lastly, the Trustees considered the recommendations set forth below and the Contract Committee adopted them as appropriate measures to protect shareholders.
Recommendations
In light of the developments discussed in this Supplement, I recommend that the Trustees:
1. Consider imposing an expense cap on Wanger International and Wanger USA that will insulate those participants who remain after the Ameriprise redemption from the impact of increased advisory fees.
2. Consider including in the advisory or related contracts with Ameriprise a provision requiring Ameriprise to reimburse the direct costs of its redemption, insulating remaining Fund participants from the commission and other expenses that will be required to effect the redemption.
3. Consider seeking an agreement on the part of Ameriprise to seek Board approval of new institutional and sub-advised accounts that will result in increased assets under management at CWAM, thereby protecting existing investors from dilution of CWAM's limited investment management capacity.
Robert P. Scales
April 2010
28
Wanger USA 2010 Semiannual Report
Board Approval of the Proposed Advisory Agreement
The Board of Trustees unanimously approved the proposed Investment Advisory Agreement with Columbia Wanger Asset Management, LLC ("Columbia WAM") (the "Proposed Advisory Agreement") for each Fund of the Trust at meetings held on February 24, 2010 and April 6, 2010.
The Ad Hoc Committee on the Sale of Columbia Management Group of the Board and the Contract Committee of the Board (together, the "Committees"), which are comprised solely of Trustees who have no direct or indirect interest in the Proposed Advisory Agreement and who are not "interested persons" (as defined in the Investment Company Act of 1940, as amended (the "1940 Act")), of the Trust (the "Independent Trustees"), and all Trustees received and reviewed a substantial amount of information provided by Columbia WAM and Ameriprise Financial, Inc. ("Ameriprise") in response to requests from the Independent Trustees and their independent legal counsel. Throughout the process, the Trustees had numerous opportunities to ask questions of and request additional materials from Columbia WAM and Ameriprise.
During each meeting at which the Committees or the Independent Trustees considered the Proposed Advisory Agreement, they met in executive session with their independent legal counsel. The Committees also met separately with representatives of Ameriprise, Columbia Management Group, LLC ("CMG") and Columbia WAM management on several different occasions. In all, one or other of the Committees convened formally on 22 separate occasions to consider the sale of a portion of the asset management business of CMG, including 100% of Columbia WAM, by Bank of America Corporation ("Bank of America") to Ameriprise (the "Transaction"), and convened informally on many other occasions. The Board and/or some or all of the Independent Trustees met on at least 6 other occasions to receive the Committees' status reports on the Transaction, receive presentations from Ameriprise and Columbia WAM representatives, and to discuss outstanding issues. In a ddition, the Independent Trustees' counsel and the Trust's Chief Compliance Officer conducted on-site due diligence sessions at Ameriprise. As they considered the Proposed Advisory Agreement, the Independent Trustees were advised by independent legal counsel.
The Trustees reviewed the Proposed Advisory Agreement, as well as certain information obtained through Ameriprise's responses to initial and supplemental questionnaires prepared at the request of the Trustees by counsel to the Funds and independent legal counsel to the Independent Trustees. In addition, the Trustees reviewed the Management Fee Evaluation dated December 2009 and the Supplement thereto dated April 2010 (the "Fee Evaluation") prepared by, the Trust's chief compliance officer, senior vice president and general counsel, who also serves as the Trust's "Senior Officer," as contemplated by the Assurance of Discontinuance dated February 9, 2005 among affiliates of Columbia WAM and the Office of the New York Attorney General. Finally, the Trustees considered certain additional contractual protections they had obtained from Ameriprise in the event of a material compliance violation or harm caused to shareholders during the conversion of certain operational services as a result of the Transaction.
The materials reviewed by the Committees and the Trustees included, among other items, (i) information on the investment performance of each Fund and of independently selected peer groups of funds and of the Fund's performance benchmarks over various time periods, (ii) information on each Fund's advisory fees and other expenses, including information comparing the Fund's fees and expenses to those of peer groups of funds and information about any applicable expense limitations and fee breakpoints, (iii) data on sales and redemptions of Fund shares, and (iv) information on the profitability to Columbia WAM and Ameriprise, as well as potential "fall-out" or ancillary benefits that Columbia WAM and its affiliates may receive as a result of their relationships with the Funds. The Trustees also considered other information such as (i) Columbia WAM's financial condition, (ii) each Fund's investment objective and strategy, (iii) the si ze, education and experience of Columbia WAM's investment staff and its use of technology, external research and trading cost measurement tools, (iv) information on Ameriprise's approach to retention and compensation of portfolio managers and the terms of the new incentive compensation plan for Columbia WAM investment personnel, (v) the allocation of the Funds' brokerage, and the use of "soft" commission dollars to pay for research products and services, (vi) the resources devoted to, and the record of compliance with, the Funds' investment policies and restrictions, policies on personal securities transactions and other compliance policies, and (vii) Ameriprise's management structure, financial condition and its intentions for managing the Funds and the respective service providers.
In considering whether to approve the Proposed Advisory Agreement, the Trustees reviewed and analyzed various factors that they determined were relevant, none of which by itself was considered dispositive. However, the material factors and conclusions that formed the basis for the Trustees' determination to approve the Proposed Advisory Agreement are discussed separately below.
Nature, quality and extent of services. The Trustees reviewed the expected nature, quality and extent of the services to be provided by Columbia WAM and its affiliates to the Funds under the Proposed Advisory Agreement, taking into account the investment objective and strategy of each Fund. In addition, the Trustees reviewed the available resources and key personnel of Columbia WAM and Ameriprise, especially those providing investment management services to the Funds. The Trustees also considered other services to be provided to the Funds by Columbia WAM, including: managing the execution of portfolio transactions and selecting broker-dealers for those transactions; monitoring adherence to the Funds' investment restrictions; producing shareholder reports; providing support services for the Board and committees of the Board; communicating with sharehol ders; serving as the Funds' administrator; and overseeing the activities of the Funds' other service providers, including monitoring for compliance with various policies and procedures as well as applicable securities laws and regulations. The Trustees reviewed each of these factors in light of the expected change of control of Columbia WAM and the likelihood of possible changes as a result of the Transaction.
In addition, in connection with the Transaction, the Board considered:
• the reputation, financial strength, regulatory histories and resources of Ameriprise and its affiliates;
• the terms of the Proposed Advisory Agreement, including the difference between the Current and Proposed Advisory Agreements, as set forth in this Proxy Statement, including that Columbia WAM had agreed to a higher standard of care for non-investment services in the Proposed Advisory Agreement;
• the terms and conditions of other agreements and arrangements relating to the future operations of the Funds, including the Underwriting Agreement and the Transition Services Agreement, both between Ameriprise and Bank of America; the Administration Services Agreement, between Columbia WAM and the Funds; the Shareholders' Servicing and Transfer Agent Agreement, between RiverSource Services Corporation and the Funds; the Underwriting Agreement between RiverSource Fund Distributors, Inc. and the Funds; and the Transition, Integration and Conversion Principles Agreement and the Compliance Agreement, both between Ameriprise and the Funds;
• that the Trustees recently had completed a full annual review of the Current Advisory Agreement for each Fund under the 1940 Act, and had determined that they were satisfied with the nature, extent and quality of services provided thereunder and that they had determined that the management fees were reasonable in relation to the services rendered; and
• that Ameriprise and Bank of America, and not the Funds, would bear all costs of obtaining approvals of the Proposed Advisory Agreement, including legal and Trustee fees and costs resulting from the Transaction.
29
Wanger USA 2010 Semiannual Report
Board Approval of the Proposed Advisory Agreement
The Trustees concluded that the expected nature, quality and extent of the services to be provided by Columbia WAM to each Fund under the Proposed Advisory Agreement were appropriate for the Funds. They also concluded that Columbia WAM currently had sufficient personnel, with appropriate education and experience, to serve the Funds effectively, and that the firm had demonstrated its continuing ability to attract and retain well-qualified personnel. The Trustees also believed that Columbia WAM investment personnel would continue to be compensated pursuant to a plan that was designed to align their interests with those of Fund shareholders. The Trustees also considered that Columbia WAM had maintained its investment management capacity and resources throughout a difficult economic environment. In addition, they took note of the quality of Columbia WAM's compliance record. The Trustees also took into consideration that Ameriprise h ad offered its assurances that the services provided to the Funds following the Transaction would be consistent with or better than the manner and level at which such services were currently being performed for the Funds and that there would be no diminution of services to the Funds or their shareholders as a result of the Transaction. In this regard, the Trustees considered that certain current senior executives of CMG who are currently responsible for oversight of certain services provided to the Funds would continue to oversee those services after the closing of the Transaction. The Trustees also believed that the higher standard of care in the Proposed Advisory Agreement would benefit shareholders. The Trustees further recognized that the investment personnel of Columbia WAM would, effective upon a change of control of Columbia WAM to Ameriprise, be subject to employment agreements and other terms of employment created for the purpose of retaining skilled investment personnel. Assuming such personnel rem ain in place following the change in control, the Trustees concluded that the Transaction would not result in a diminution of investment services provided to the Funds.
Performance of the Funds. The Trustees received and considered detailed performance information at various meetings of the Board and of the Investment Performance Analysis Committee of the Board throughout the year in addition to performance information considered in connection with the Transaction. They reviewed information comparing each Fund's performance with that of its benchmark(s) and with the performance of comparable funds and peer groups as identified by Lipper Inc. ("Lipper") and Morningstar, Inc. ("Morningstar"). The Trustees evaluated the performance of the Funds over various time periods. However, they gave somewhat more consideration to the rolling three-year performance of each Fund.
More particularly, with respect to the domestic Funds, the Trustees noted that Wanger Select equaled its Morningstar peer group median while underperforming its Lipper peer group median and its benchmark for the three-year period ended September 30, 2009. Wanger USA underperformed its peer group medians but outperformed its benchmark over the three-year period. For the five-year period ended September 30, 2009, Wanger Select outperformed its peer group medians and primary benchmark and Wanger USA underperformed its peer group medians but outperformed its benchmark.
With respect to the international Funds, the Trustees considered that Wanger International and Wanger International Select both outperformed their peer group medians and benchmarks for the three year and five-year periods ended September 30, 2009.
The Trustees concluded that, although past performance is not necessarily indicative of future results, the strong overall longer-term performance record of the Funds was an important factor in the evaluation of the expected quality of services to be provided by Columbia WAM under the Proposed Advisory Agreement for each Fund and also supported approval.
Costs of Services and Profits Realized by Columbia WAM. The Trustees noted that Ameriprise and Columbia WAM were not proposing any changes in investment advisory or administration fees or total operating expenses in connection with the Transaction. At various Committee and Board meetings and other informal meetings, the Trustees examined detailed information on the fees and expenses of each Fund in comparison to information for comparable funds provided by Lipper and Morningstar. The Trustees reviewed the observations in the Fee Evaluation relating to the lack of uniformity in the Funds' rankings, and noted that the Funds are assessed by Morningstar and Lipper in relation to peers selected only from the variable annuity universe. As noted in the Fee Evaluation, the actual advisory fees paid by Wanger Select and Wanger International Select were higher than the median advisory fees of each Fund's respective Morningstar and Lipper peer groups and the actual advisory fee paid by the Wanger USA was higher than the median advisory fee of the Fund's Morningstar peer group, but not of its Lipper peer group. The actual advisory fee paid by Wanger International was higher than the median advisory fee of the Fund's Lipper peer group, but not of its Morningstar peer group. Total management fees for one of the four Funds, Wanger International, were lower than its Morningstar peer group median, but none of the Funds had total management fees equal to or lower than its respective Lipper peer group median. The Trustees also considered that the total expenses paid by investors compared to total expenses charged by other peer funds, which they also considered to be a meaningful comparison.
The Trustees reviewed the analysis of the historic profitability of Columbia WAM in serving as each Fund's investment adviser and of Columbia WAM and its affiliates in their relationships with each Fund, as well as an explanation of the methodology utilized in allocating various expenses among the Funds and other business units, each of which was included in the Fee Evaluation. The Trustees considered the current methodology used by Columbia WAM in determining compensation payable to portfolio managers and the competitive market for investment management talent. In addition, the Trustees considered the expected profitability of Columbia WAM related to the Funds following the Transaction; however, they determined that profitability projections at this time were speculative, at best. The Trustees noted that Columbia WAM's profit margins had declined recently, in line with industry trends, as a result of reduced assets under manage ment. Nevertheless, based on limited comparative data, its current margins appeared to be in the upper range of competitors. They discussed how profitability comparisons among fund managers are of limited probative value due to the small number of publicly-owned managers, and that the profitability of any investment manager is affected by numerous factors, including its particular organizational structure, the types of funds and other accounts managed, other lines of business, expense allocation methodology, capital structure and cost of capital.
The Trustees also reviewed the advisory fee rates charged by Columbia WAM for managing other investment companies (including the Columbia Acorn Funds), sub-advised funds and other institutional separate accounts, as detailed in the Fee Evaluation. The Trustees noted that the Columbia Wanger Funds' advisory fees were generally comparable to the Columbia Acorn Funds' advisory fees. Columbia WAM's institutional separate account fees for various investment strategies were also examined; in some cases those fees were higher than the advisory fees charged to the Funds, and in some instances the fees were lower. The Trustees noted that Columbia WAM performs significant additional services for the Funds that it does not provide to sub-advised funds or non-mutual fund clients, including administrative services, oversight of the Funds' other service providers, trustee support, regulatory compliance and numerous other services, and that, i n servicing the Funds, Columbia WAM assumes many legal risks that it does not assume in servicing its non-fund clients.
The Trustees concluded that the rates of advisory fees and other compensation to be payable by the Funds to Columbia WAM and its affiliates were reasonable in relation to the nature and quality of the services to be provided, taking into account the fees charged by other advisers for managing comparable mutual funds with similar strategies and the fees Columbia WAM charges to other clients. The Trustees also concluded that the Funds' estimated overall expense ratios were reasonable, considering the quality of
30
Wanger USA 2010 Semiannual Report
Board Approval of the Proposed Advisory Agreement
services provided by Columbia WAM and its affiliates and the investment performance of the Funds.
Economies of Scale. At various Committee and Board meetings and other informal meetings, the Trustees considered information about the extent to which Columbia WAM realizes economies of scale in connection with an increase in Fund assets. The Trustees noted that the advisory fee schedule for each Fund includes breakpoints in the rate of fees at various asset levels. The Trustees concluded that the fee structure of each Fund was reasonable and reflective of a sharing between Columbia WAM and the Funds of economies of scale.
Other Benefits to Columbia WAM. The Trustees also reviewed benefits that could be expected to accrue to Columbia WAM and its affiliates from their relationships with the Funds, as outlined in the Fee Evaluation. They noted that, in connection with the Transaction, the Funds' transfer agency agreement would be assigned to RiverSource Service Corporation (now known as Columbia Management Investment Services Corp.), an affiliate of Ameriprise, which would receive compensation from the Funds for services provided. They considered that an affiliate of Ameriprise, RiverSource Funds Distributors, Inc. (now known as Columbia Management Investment Distributors, Inc.), would serve as the new distributor under an underwriting agreement containing substantially the same terms as the Funds' existing underwriting agreement with an affiliate of Columbia WAM. In addi tion, the sub-administration agreement between Columbia WAM and a current affiliate would be transferred to an Ameriprise affiliate. The Trustees also considered other ways that the Funds and Columbia WAM may potentially benefit from their relationship with each other. For example, the Trustees considered Columbia WAM's use of commissions paid by each Fund on its portfolio brokerage transactions to obtain research products and services benefiting the Fund and/or other clients of Columbia WAM and noted that no material changes were being contemplated by Columbia WAM regarding its policies and procedures in respect of soft dollars as a result of the change in ownership of Columbia WAM. They determined that Columbia WAM's use of the Funds' "soft" commission dollars to obtain research products and services was consistent with current regulatory requirements and guidance. They also concluded that Columbia WAM benefits from the receipt of proprietary research products and services acquired through commissions paid on portfolio transactions of the Funds, and that the Funds benefit from Columbia WAM's receipt of those products and services as well as research products and services acquired through commissions paid by other clients of Columbia WAM.
Section 15(f) of the 1940 Act. The Trustees also considered whether the arrangements between Columbia WAM and the Funds comply with the conditions of Section 15(f) of the 1940 Act. Section 15(f) provides a non-exclusive safe harbor under which an investment adviser to an investment company or any of its affiliated persons may receive any amount or benefit in connection with a change in control of the investment adviser provided two conditions are met. First, for a period of three years after closing of the transaction, at least 75% of the board members of the investment company may not be "interested persons" (as defined in the 1940 Act) of the investment adviser or predecessor adviser. Second, an "unfair burden" must not be imposed upon the investment company as a result of the transaction or any express or implied terms, conditions or understandings applicable thereto. The term "unfair burden" is defined in Section 15(f) to include any arrangement during the two-year period after the closing of the transaction whereby the investment adviser (or predecessor or successor adviser) or any interested person of any such investment adviser, receives or is entitled to receive any compensation, directly or indirectly, from the investment company or its shareholders (other than fees for bona fide additional investment advisory or other services) or from any person in connection with the purchase or sale of securities or other property to, from or on behalf of the investment company (other than bona fide ordinary compensation as principal underwriter for the investment company).
In connection with the first condition of Section 15(f), the Trustees concluded that upon closing of the Transaction at least 75% of the Trustees would not be "interested persons" (as defined in the 1940 Act) of the Adviser and would be in compliance with this provision of Section 15(f). With respect to the second condition of Section 15(f), Columbia WAM and Ameriprise represented in writing that no advisory or distribution fee increases were contemplated during the two years following the Transaction. The Trustees also noted that, to the extent future transactions are contemplated and recommended following the Transaction, Columbia WAM and Ameriprise represented that they would not seek any change that would impose an "unfair burden" on the Trust.
After full consideration of the above factors, as well as other factors that were instructive in evaluating the Proposed Advisory Agreement for each Fund, the Trustees, including the Independent Trustees, concluded on February 24, 2010 that the approval of the Proposed Advisory Agreement was in the best interest of each Fund, and they approved the Agreement and recommended that the shareholders of each Fund approve the Agreement for their Fund.
Following the Board's approval of the Proposed Advisory Agreement for each Fund on February 24, 2010, Ameriprise advised the Board that it anticipated that a significant amount of the existing assets of Wanger International and Wanger USA, representing the interests of owners of contracts issued by life insurance companies affiliated with Ameriprise, would be redeemed in spring 2010 (the "Proposed Redemption"). These assets would be reinvested in two RiverSource Funds (the "New Institutional Accounts") that have similar investment objectives and strategies to Wanger International and Wanger USA. The New Institutional Accounts would be sub-advised by Columbia WAM for investment sub-advisory fees that were proposed to be lower than the advisory fees of their Columbia Wanger Fund counterparts. The Board therefore determined that the proposed redemption and the existence of the New Institutional Accounts to be sub-advised by Columbi a WAM warranted another review of the Proposed Advisory Agreement for each Fund and the fees paid thereunder.
The Committees then met in the aggregate on four occasions in March 2010, including once with representatives of Ameriprise, to review and consider the Proposed Redemption and the New Institutional Accounts and the implications of these transactions with respect to their consideration of the Proposed Advisory Agreement for each Fund. In their deliberations, the Trustees received and reviewed a supplement dated April 2010 ("Supplement") to the Fee Evaluation prepared by the Senior Officer, which contained an analysis of both the Proposed Redemption and the potential impact on the remaining shareholders in the Funds. The Supplement also reviewed the fees related to the New Institutional Accounts. The Trustees were also advised by independent counsel at each of these meetings.
With respect to the Proposed Redemption, the Trustees considered that Ameriprise had agreed to a fee cap on the advisory fees of Wanger International and Wanger USA for a period of two years from the redemption date, such that the remaining shareholders in these Funds would not experience any increase in advisory fees as a result of the Proposed Redemption. The Trustees further considered that Ameriprise had also agreed with the Trust to minimize the potential for adverse effects to Wanger International and Wanger USA from any economic harm caused by the redemption proposal by reimbursing for transaction costs related to the Proposed Redemption including brokerage commissions and transfer fees (but not market impact costs).
With respect to the New Institutional Accounts, the Trustees considered information submitted by Ameriprise regarding the sub-advisory fees payable to Columbia WAM for investment advisory services rendered to the accounts. The Trustees also considered that the sub-advisory fees payable were
31
Wanger USA 2010 Semiannual Report
Board Approval of the Proposed Advisory Agreement
substantially the same as an existing RiverSource Fund account sub-advised by Columbia WAM. The Trustees considered the explanations previously provided by Columbia WAM for the differences in advisory fees paid by the Funds and Columbia WAM's other similar institutional accounts. The Trustees also considered Ameriprise's and Columbia WAM's agreement that they would not agree to, or submit a proposal to, manage new institutional accounts without the express approval of the Board. The Board believed that this provision was necessary in order to protect Columbia WAM's investment capacity and the resulting quality of its investment services with respect to the Funds.
The Trustees also considered the performance of the Funds over various time periods ended December 31, 2009. Wanger USA outperformed its primary benchmark and Morningstar peer group median over the three-year period ended December 31, 2009, but underperformed its Lipper peer group median over that same period. Wanger Select outperformed its Morningstar peer group median over the three-year period, but underperformed its Lipper peer group median and primary benchmark over that same period. Both Wanger International and Wanger International Select outperformed their respective peer groups and primary benchmarks for the three-year period. For the five-year period ended December 31, 2009, each Fund outperformed its primary benchmark.
Taking all of the foregoing factors into account as well as the continued satisfactory performance of the Funds since the last Board meeting and other factors they deemed relevant, the Trustees, including all of the independent Trustees, concluded again on April 6, 2010 that the approval of the Proposed Advisory Agreement was in the best interest of each Fund, and they affirmed the approval of the Agreement and recommended that the shareholders of each Fund approve the Agreement for their Fund.
32
Wanger USA 2010 Semiannual Report
Proxy Voting Results
On May 27, 2010, a special meeting of shareholders of Wanger Advisors Trust (the "Trust") was held to ask shareholders of each Fund of the Trust to: (1) consider and vote on a proposed Investment Advisory Agreement for the Fund with CWAM, which became a subsidiary of Ameriprise Financial; and (2) elect eleven trustees to the Trust's Board of Trustees (the "Board"). A proxy statement that described the proposals was mailed to shareholders of record as of April 8, 2010.
Proposal 1: A proposed Investment Advisory Agreement with CWAM was approved for the Fund, as follows:
| Fund | | Votes For | | Votes Against | | Abstentions | | Broker Non-Votes* | |
| Wanger USA | | | 40,329,841 | | | | 1,002,102 | | | | 1,501,974 | | | | 0 | | |
* Shares held of record by a financial intermediary, such as a broker or nominee, typically held in "street name," as to which (i) written voting instructions on the matter have not been received from the beneficial owners or persons entitled to vote and (ii) the intermediary does not have discretionary voting power on the matter.
Proposal 2: Each of the trustee nominees was elected to the Board, as follows:
| Fund | | Votes For | | Votes Against | | Abstentions | |
| Laura M. Born | | | 93,621,627 | | | | 4,677,959 | | | | 0 | | |
| Michelle L. Collins | | | 93,862,814 | | | | 4,436,772 | | | | 0 | | |
| Maureen M. Culhane | | | 93,620,353 | | | | 4,679,233 | | | | 0 | | |
| Margaret M. Eisen | | | 93,949,255 | | | | 4,350,330 | | | | 0 | | |
| John C. Heaton | | | 93,852,982 | | | | 4,446,603 | | | | 0 | | |
| Steven N. Kaplan | | | 93,803,548 | | | | 4,496,038 | | | | 0 | | |
| David C. Kleinman | | | 93,545,604 | | | | 4,753,982 | | | | 0 | | |
| Charles P. McQuaid** | | | 93,886,104 | | | | 4,413,482 | | | | 0 | | |
| Allan B. Muchin | | | 93,539,358 | | | | 4,760,228 | | | | 0 | | |
| David B. Small | | | 93,966,760 | | | | 4,332,826 | | | | 0 | | |
| James A. Star | | | 93,923,838 | | | | 4,375,748 | | | | 0 | | |
** Mr. McQuaid is an "interested person" of the Trust and of CWAM because he is an officer of the Trust and of CWAM.
33
Wanger USA 2010 Semiannual Report
This page intentionally left blank.
34
Wanger USA 2010 Semiannual Report
This page intentionally left blank.
35
Wanger USA 2010 Semiannual Report

Columbia Wanger Funds
Trustees
James A. Star
Chairman of the Board
Steven N. Kaplan
Vice Chairman of the Board
Laura M. Born
Michelle L. Collins
Maureen M. Culhane
Margaret M. Eisen
John C. Heaton
David C. Kleinman
Charles P. McQuaid
Allan B. Muchin
David B. Small
Ralph Wanger (Trustee Emeritus)
Officers
Charles P. McQuaid
President
Ben Andrews
Vice President
Michael G. Clarke
Assistant Treasurer
P. Zachary Egan
Vice President
John M. Kunka
Assistant Treasurer
Joseph C. LaPalm
Vice President
Bruce H. Lauer
Vice President, Secretary and Treasurer
Louis J. Mendes III
Vice President
Robert A. Mohn
Vice President
Christopher J. Olson
Vice President
Christopher O. Petersen
Assistant Secretary
Scott R. Plummer
Assistant Secretary
Linda K. Roth-Wiszowaty
Assistant Secretary
Robert P. Scales
Chief Compliance Officer, Chief Legal
Officer, Senior Vice President and
General Counsel
Transfer Agent,
Dividend Disbursing Agent*
Columbia Management Investment Services Corp.
P.O.Box 8081
Boston, Massachusetts
02266-8081
Distributor*
Columbia Management Investment Distributors, Inc.
One Financial Center
Boston, Massachusetts
02111-2621
Investment Advisor
Columbia Wanger Asset Management, LLC
227 West Monroe Street, Suite 3000
Chicago, Illinois 60606
1-888-4-WANGER
(1-888-492-6437)
Legal Counsel to the Funds
K&L Gates LLP
Washington, DC
Legal Counsel to the Independent Trustees
Drinker Biddle & Reath LLP
Philadelphia, Pennsylvania
Independent Registered Public Accounting Firm
PricewaterhouseCoopers LLP
Chicago, Illinois
* As of May 1, 2010
This report, including the schedules of investments and financial statements, is submitted for the general information of the shareholders of the Wanger Advisors Trust.
A description of the Fund's proxy voting policies and procedures and a copy of the Fund's voting record for the most recent 12-month period ended June 30 are available (i) on the Securities and Exchange Commission's website at www.sec.gov, and (ii) without charge, upon request, by calling 888-492-6437.
The Fund files a complete schedule of portfolio holdings with the SEC for the first and third quarters of each fiscal year on Form N-Q. The Fund's Form N-Q is available on the SEC's website at www.sec.gov and may be reviewed and copied at the SEC's Public Reference Room in Washington, D.C. Information on the operation of the Pubic Reference Room may be obtained by calling 800-SEC-0330. The Fund's complete portfolio holdings are disclosed at www.columbiafunds.com approximately 30 days after each month-end.
36
Columbia Wanger Funds
© 2010 Columbia Management Investments Advisers, LLC. All rights reserved.
C-1470 A (8/10) 103620
Item 2. Code of Ethics.
Not applicable for semiannual reports.
Item 3. Audit Committee Financial Expert.
Not applicable for semiannual reports.
Item 4. Principal Accountant Fees and Services.
Not applicable for semiannual reports.
Item 5. Audit Committee of Listed Registrants.
Not applicable.
Item 6. Investments
(a) The registrant’s “Schedule I — Investments in securities of unaffiliated issuers” (as set forth in 17 CFR 210.12-12) is included in Item 1 of this Form N-CSR.
(b) Not applicable.
Item 7. Disclosure of Proxy Voting Policies and Procedures for Closed-End Management Investment Companies.
Not applicable.
Item 8. Portfolio Managers of Closed-End Management Investment Companies.
Not applicable.
Item 9. Purchases of Equity Securities by Closed-End Management Investment Company and Affiliated Purchasers.
Not applicable.
Item 10. Submission of Matters to a Vote of Security Holders.
There were no material changes to the procedures by which shareholders may recommend nominees to the registrant’s board of directors.
Item 11. Controls and Procedures.
(a) The registrant’s principal executive officer and principal financial officers, based on their evaluation of the registrant’s disclosure controls and procedures as of a date within 90 days of the filing of this report, have concluded that such controls and procedures are adequately designed to ensure that material information required to be disclosed by the registrant in Form N-CSR is accumulated and communicated to the registrant’s management, including the principal executive officer and principal financial officer, or persons performing similar functions, as appropriate to allow timely decisions regarding required disclosure.
(b) There was no change in the registrant’s internal control over financial reporting that occurred during the registrant’s second fiscal quarter of the period covered by this report that has materially affected, or is reasonably likely to materially affect, the registrant’s internal control over financial reporting.
Item 12. Exhibits.
(a)(1) Code of ethics required to be disclosed under Item 2 of Form N-CSR: Not applicable for semiannual reports.
(a)(2) Certifications pursuant to Rule 30a-2(a) under the Investment Company Act of 1940 (17 CFR 270.30a-2(a)) attached hereto as Exhibit 99.CERT.
(a)(3) Not applicable.
(b) Certification pursuant to Rule 30a-2(b) under the Investment Company Act of 1940 (17 CFR 270.30a-2(b)) attached hereto as Exhibit 99.906CERT.
SIGNATURES
Pursuant to the requirements of the Securities Exchange Act of 1934 and the Investment Company Act of 1940, the registrant has duly caused this report to be signed on its behalf by the undersigned, thereunto duly authorized.
(registrant) | | Wanger Advisors Trust | |
| | |
| | |
By (Signature and Title) | /s/ Charles P. McQuaid | |
| Charles P. McQuaid, President | |
| | |
| | |
Date | | August 23, 2010 | |
|
|
Pursuant to the requirements of the Securities Exchange Act of 1934 and the Investment Company Act of 1940, this report has been signed below by the following persons on behalf of the registrant and in the capacities and on the dates indicated. |
|
|
By (Signature and Title) | /s/ Charles P. McQuaid | |
| Charles P. McQuaid, President | |
| | |
| | |
Date | | August 23, 2010 | |
| | |
| | |
By (Signature and Title) | /s/ Bruce H. Lauer | |
| Bruce H. Lauer, Treasurer | |
| | |
| | |
Date | | August 23, 2010 | |
| | | | | |