UNITED STATES
SECURITIES AND EXCHANGE COMMISSION
Washington, D.C. 20549
FORM N-CSR
CERTIFIED SHAREHOLDER REPORT OF REGISTERED
MANAGEMENT INVESTMENT COMPANIES
Investment Company Act file number | 811-08748 | |||||||
| ||||||||
Wanger Advisors Trust | ||||||||
(Exact name of registrant as specified in charter) | ||||||||
| ||||||||
225 Franklin Street, Boston, Massachusetts |
| 02110 | ||||||
(Address of principal executive offices) |
| (Zip code) | ||||||
| ||||||||
Scott R. Plummer 5228 Ameriprise Financial Center Minneapolis, MN 55474 | ||||||||
(Name and address of agent for service) | ||||||||
| ||||||||
Registrant’s telephone number, including area code: | 1-612-671-1947 |
| ||||||
| ||||||||
Date of fiscal year end: | December 31 |
| ||||||
| ||||||||
Date of reporting period: | June 30, 2012 |
| ||||||
Form N-CSR is to be used by management investment companies to file reports with the Commission not later than 10 days after the transmission to stockholders of any report that is required to be transmitted to stockholders under Rule 30e-1 under the Investment Company Act of 1940 (17 CFR 270.30e-1). The Commission may use the information provided on Form N-CSR in its regulatory, disclosure review, inspection, and policymaking roles.
A registrant is required to disclose the information specified by Form N-CSR, and the Commission will make this information public. A registrant is not required to respond to the collection of information contained in Form N-CSR unless the Form displays a currently valid Office of Management and Budget (“OMB”) control number. Please direct comments concerning the accuracy of the information collection burden estimate and any suggestions for reducing the burden to Secretary, Securities and Exchange Commission, 450 Fifth Street, NW, Washington, DC 20549-0609. The OMB has reviewed this collection of information under the clearance requirements of 44 U.S.C. § 3507.
Item 1. Reports to Stockholders.
Wanger International
2012 Semiannual Report

Not FDIC insured • No bank guarantee • May lose value

Wanger International
2012 Semiannual Report
Table of Contents
| 2 | Understanding Your Expenses | ||||||
| 3 | Genetic Science | ||||||
| 6 | Performance Review | ||||||
| 8 | Statement of Investments | ||||||
| 19 | Statement of Assets and Liabilities | ||||||
| 19 | Statement of Operations | ||||||
| 20 | Statement of Changes in Net Assets | ||||||
| 21 | Financial Highlights | ||||||
| 22 | Notes to Financial Statements | ||||||
| 26 | Board Approval of the Advisory Agreement | ||||||
Columbia Wanger Asset Management, LLC (CWAM) is one of the leading global small- and mid-cap equity managers in the United States with over 40 years of small- and mid-cap investment experience. As of June 30, 2012, CWAM managed $31.0 billion in assets. CWAM is the investment manager to Wanger USA, Wanger International, Wanger Select and Wanger International Select (together, the Columbia Wanger Funds) and the Columbia Acorn Family of Funds.
Investors should consider the investment objectives, risks, charges and expenses of a mutual fund carefully before investing. For a free prospectus, which contains this and other important information about the Fund, contact your financial adviser or insurance company or contact 1-888-4-WANGER. Read the prospectus carefully before investing.
An important note: Columbia Wanger Funds are available for purchase through variable annuity contracts and variable life insurance policies offered by the separate accounts of participating insurance companies and qualified pension or retirement plans.
The views expressed in "Genetic Science" and in the Performance Review reflect the current views of the respective authors. These views are not guarantees of future performance and involve certain risks, uncertainties and assumptions that are difficult to predict so actual outcomes and results may differ significantly from the views expressed. These views are subject to change at any time based upon economic, market or other conditions and the respective parties disclaim any responsibility to update such views. These views may not be relied on as investment advice and, because investment decisions for a Columbia Wanger Fund are based on numerous factors, may not be relied on as an indication of trading intent on behalf of any particular Columbia Wanger Fund. References to specific company securities should not be construed as a recommendation or investment advice.
1
Wanger International 2012 Semiannual Report
Understanding Your Expenses
As a shareholder, you incur three types of costs. There are transaction costs, which generally include sales charges on purchases and may include redemption fees. There are also ongoing costs, which generally include management fees and other Fund expenses. Lastly, there may be additional fees or charges imposed by the insurance company that sponsors your variable annuity and/or variable life insurance product. The following information is intended to help you understand your ongoing costs (in dollars) of investing in the Fund and to help you compare these costs with the ongoing costs of investing in other mutual funds.
Analyzing your Fund's expenses
To illustrate these ongoing costs, we have provided an example and calculated the expenses paid by investors in the Fund during the period. The actual and hypothetical information in the table below is based on an initial investment of $1,000 at the beginning of the period indicated and held for the entire period. Expense information is calculated two ways and each method provides you with different information. The amount listed in the "Actual" column is calculated using the Fund's actual operating expenses and total return for the period. You may use the Actual information, together with the amount invested, to estimate the expenses that you paid over the period. Simply divide your account value by $1,000 (for example, an $8,600 account value divided by $1,000 = 8.6), then multiply the results by the expenses paid during the period under the Actual column. The amount listed in the "Hypothetical" column assumes a 5% annual rate of return before expenses (which is not the Fund's actual return) and then applies the Fund's actual expense ratio for the period to the hypothetical return. You should not use the hypothetical account values and expenses to estimate either your actual account balance at the end of the period or the expenses you paid during the period. See "Compare with other funds" below for details on how to use the hypothetical data.
Compare with other funds
Since all mutual funds are required to include the same hypothetical calculations about expenses in shareholder reports, you can use this information to compare the ongoing cost of investing in the Fund with other funds. To do so, compare the hypothetical example with the 5% hypothetical examples that appear in the shareholder reports of other funds. As you compare hypothetical examples of other funds, it is important to note that hypothetical examples are meant to highlight the ongoing cost of investing in a fund only and do not reflect any transaction costs, such as sales charges, redemption or exchange fees. Therefore, the hypothetical calculations are useful in comparing ongoing costs only, and will not help you determine the relative total costs of owning different funds. If transaction costs were included in these calculations, your costs would be higher.
January 1, 2012 – June 30, 2012
| Account value at the beginning of the period ($) | Account value at the end of the period ($) | Expenses paid during period ($) | Fund's annualized expense ratio (%)* | ||||||||||||||||||||||||||||
| Actual | Hypothetical | Actual | Hypothetical | Actual | Hypothetical | ||||||||||||||||||||||||||
| Wanger International | 1,000.00 | 1,000.00 | 1,086.40 | 1,019.59 | 5.50 | 5.32 | 1.06 | ||||||||||||||||||||||||
*Expenses paid during the period are equal to the Fund's annualized expense ratio, multiplied by the average account value over the period, then multiplied by the number of days in the Fund's most recent fiscal half-year and divided by 366.
Had the investment manager not waived fees or reimbursed a portion of expenses, account value at the end of the period would have been reduced.
It is important to note that the expense amounts shown in the table are meant to highlight only ongoing costs of investing in the Fund. Expenses paid during the period do not include any insurance charges imposed by your insurance company's separate account. The hypothetical example provided is useful in comparing ongoing costs only and will not help you determine the relative total costs of owning different funds whose shareholders may incur transaction costs.
2
Wanger International 2012 Semiannual Report

Genetic Science
Genetic theory began with Gregor Mendel, a friar who in the middle 19th century meticulously bred different types of peas and tracked traits of offspring. He discovered recessive genes, which are carried by one generation but expressed in the next if both parents have that gene. Human genetic studies began a few decades later. In 1872, Huntington's disease was the first genetic disease identified by scientific research.1
Humans normally have 23 pairs of chromosomes, with half of each pair inherited from each parent. The chromosomes combined consist of over 20,000 genes. These genes ultimately consist of over 3 billion units of four different nitrogenous bases, labeled by their first letters: A, G, C and T.2
DNA, the double helix structure of bases assembled into genes, was discovered by James Watson and Francis Crick in 1953. Various genes were identified over the next several decades. The Human Genome Project, an effort to sequence and identify all genes and bases in human DNA, started in 1990. After $2.7 billion of expenditures over 13 years, a composite genome from three people was specified.3
Gene Sequencing
Kevin Davies' book, The $1,000 Genome, discusses the incredible progress made in gene sequencing technology. First generation sequencing used bacteria to purify and grow DNA fragments utilizing equipment made by Applied Biosystems, which dominated the market for 15 years.4 Hundreds of machines labored for years to complete the Human Genome Project sequencing, at a direct cost of tens of millions of dollars.5
A company called 454 Life Sciences, later acquired by Roche, developed a second generation sequencer. Utilizing a semiconductor chip with thousands of wells, DNA fragments were sequenced in parallel via real-time image processing. First shipped in 2005, the $500,000 machines then sold as fast as they could be built. James Watson's genome was sequenced in 2007 at a cost of $1 million.6
In 2006, Solexa shipped a sequencing machine that also sequenced in parallel, but had throughput and cost advantages. Illumina bought Solexa later that year. By 2007, the equipment could sequence a human's DNA at a cost of $100,000.7 Illumina subsequently created faster and more accurate machines. In early 2010, it pushed the cost of human genome sequencing down to $10,000.8 Service company Knome currently offers full genome sequencing via Illumina equipment, plus interpretation of results, for $4,998.9 Roche recently attempted to acquire Illumina.10
Third generation machines, often utilizing nanotechnology as well as parallel sequencing and faster data processing chips, should cut the cost of sequencing a human genome to well below $1,000, Davies notes.11 Pacific Biosciences of California claimed a potential 30,000-fold speed increase via sequencing in real time as DNA is replicated. Another company, Oxford Nanopore, was working on sequencing via measurement of electric current passing through bases.12 Ion Torrent Systems measures the pH of bases streaming through pores.13
Davies calculated that the cost of DNA sequencing fell 50% a year through 2005, and then by an amazing 90% a year due to a series of disruptive technologies.14 He does not predict when a hand-held "Star Trek Medical Tricorder," capable of reading the DNA of a patient and his disease and then prescribing personalized medicine, will be available, but the world seems headed in that direction.
Personal Genomic Services
It doesn't take a full genome sequence to determine genetic characteristics such as ancestry and possible risks of disease. In November 2007, deCODEme and 23andMe launched competing $1,000 services. Processing cheek swab or saliva DNA on equipment utilizing specialized chips, they sampled up to 600,000 bases, 0.02% of the total, and looked for differences in bases between people, called single nucleotide polymorphisms (SNPs).15 By correlating SNPs with known ancestry and disease databases, the companies provided statistical probabilities to clients based on their DNA samples.
Since 2007, deCODEme has had financial problems; it currently offers the service for $1,100, including updates.16 23andMe currently charges $207 for an initial sampling and a one-year subscription for updates. According to its website, 23andMe provides probabilities for 118 diseases, shows likely responses to 20 drugs, and determines whether clients' children could be at risk for any of 44 inherited diseases.17 Navigenics has also entered the market and provides genetic counseling as well as data.
The personal genomic services companies update disease probabilities as additional data is analyzed. Probabilities can and do change, sometimes drastically, as new correlations and additional SNPs are incorporated into a person's profile. It's somewhat disconcerting that, according to Davies, Navigenics and 23andMe disagree qualitatively on one-third of diseases.18
As more of the population gets increasingly more genes sequenced, more data becomes available and the relationships between genes, health and responses to drugs become better known. Full genome sequencing will likely show an average of three million SNPs per person,19 creating an enormous data management problem as well as new understandings of relationships between genes and diseases.
Limits to Predicting Diseases
Recent research published in Science Translational Medicine titled, "The Predictive Capacity of Personal Genome Sequencing,"20 ingeniously addressed the theoretical potential for genes to predict common diseases. The underlying question was, of course, what are the odds of someone with a specific genome getting
3
Wanger International 2012 Semiannual Report
a specific disease? According to the study, the answer can be determined by studying pairs of people with nearly identical genomes: identical twins. By comparing histories of 24 common diseases among identical twins versus fraternal twins, genetic determination of diseases were inferred.
The study concluded that for 19 of the 24 diseases a negative test score (below average risk) will hardly be reassuring because the odds of getting the disease will still be substantial, at 50% to 80% of the general population's odds. Over half of the ultimate victims of 12 diseases would have tested at below average risk, receiving a false sense of security. However, there was one disease category tested in the study, Alzheimer's disease, in which a negative test result might indicate as little as a 12% relative risk of disease compared to the general population.
Those testing positive for Alzheimer's, type 1 diabetes, male coronary heart disease and thyroid autoimmunity could account for over 75% of the patients developing the diseases. The study suggested that the utility of genetic tests will depend on the results of the individual tested, and cautions against complacency and unwise lifestyle choices for those testing negative.
I agree that some subscribers to personal genetics services could obtain valuable results. If, for example, someone learned that his probability of developing glaucoma was much higher than the 4% probability for the average person, the subscriber would more likely get regular glaucoma testing. This is of some value, assuming the stated odds are indeed properly calibrated, which may take years to confirm.
Inherited Diseases
Some inherited diseases, including cystic fibrosis, Tay-Sachs disease and sickle cell anemia, occur only when single defective genes are inherited from each parent. Other single gene diseases, such as Huntington's, are inherited with 50% odds of getting the gene and disease if just one parent is afflicted.
Dozens of rare genetic diseases affect newborns, many of which can be addressed by diet or vitamins.21 Quick diagnosis is often crucial as permanent damage can occur otherwise. As of March 2010, newborns were tested for 29 genetic diseases in most states.22
Sometimes only a tendency to contract a disease is inherited. One version of a specific gene mutation implies a 65% to 85% lifetime probability of a woman developing breast cancer, while another version implies a 45% to 85% probability.23 However, only 5% to 10% of breast cancer patients have those genes.24 Others get the disease with no apparent genetic correlation. Having those genes is a cause for concern, but not having them should not provide a lot of comfort.
Personalized Medicine
In 2003, Allen Roses, vice-president of genetics for GlaxoSmithKline, shocked consumers by stating that more than 90% of drugs work in just 30% to 50% of people.25 Roses was pushing the drug industry to pursue genetic testing rather than trial and error to determine which drugs work for a specific individual. Matt Ridley, in the 2006 version of his book, Genome, stated, "genetic diagnosis followed by conventional cure is probably the genome's greatest boon to medicine."26
Indeed, the lung cancer drug Iressa was approved in 2003 and creates a "miraculous response" in the 10% of patients with a specific genetic mutation of the disease. Herceptin was approved in 2006 to target the 25% of breast cancer patients who are afflicted with a specific genetic version of that disease. Likewise, targeted cancer drugs such as Avastin, Tarceva and Erbitux, are prescribed after genetic testing.27
On January 31, 2012, Kalydeco was approved to treat 1,200 cystic fibrosis patients, 4% of the total, who have a specific gene defect. It is the first drug to treat the defect rather than the symptoms of the disease, and has been termed "transformational" for those who can use it.28 The Cystic Fibrosis Foundation spurred development of the drug by helping to fund the development effort, and aided the process by creating a registry that includes the genetic characteristics of the disease for 90% of American patients.
Some drugs appear to work for most people, but have widely varying optimal dosages. Variations in genes largely determine how quickly people metabolize drugs.29 "Unanticipated drug responses are estimated to result in two million hospitalizations and 100,000 deaths in the United States each year," writes Nicholas Gillham in his book, Genes, Chromosomes, and Disease.30
In the case of blood thinner warfarin (brand name Coumadin), patients exhibit a tenfold range in ability to metabolize the drug.31 Too little of it can result in a stroke, but too much can cause bleeding and hemorrhaging.32 The FDA now provides dosage information on the drug's label based on variants of two genes.33 About 10% of labels for FDA-approved drugs now have pharmacogenomics information.34
Investment Implications
Genetic science is rapidly advancing and will likely revolutionize many aspects of medical care. It is starting to be helpful in predicting susceptibility to common diseases, but will likely be more valuable in identifying risks of inherited diseases and in determining appropriate drug usage and dosage. Given the complexity of the subject, there will likely be increasing demands for genetic counselors.
There exists uncertainty regarding how the FDA and others will regulate genetic tests, as well as the extent to which genetic discoveries will be patentable. On the investment front, we have looked for and invested in opportunities created by genetic science. We've focused on a number of biotechnology and drug companies addressing personalized medicine and niche orphan
4
Wanger International 2012 Semiannual Report
diseases and we will continue to look for additional opportunities.


Charles P. McQuaid
President and Chief Investment Officer
Columbia Wanger Asset Management, LLC
The information and data provided in this analysis are derived from sources that we deem to be reliable and accurate. These views are not guarantees of future performance and involve certain risks, uncertainties and assumptions that are difficult to predict so actual outcomes and results may differ significantly from the views expressed. The views/opinions expressed in this essay are those of the author and not of the Wanger Advisors Trust Board, are subject to change at any time based upon economic, market or other conditions, may differ from views expressed by other Columbia Management associates and the respective parties disclaim any responsibility to update such views. These views may not be relied on as investment advice and, because investment decisions for a Columbia Wanger Fund are based on numerous factors, may not be relied on as an indication of trading intent on behalf of any particular Columbia Wanger Fund.
1 Gillham, Nicholas Wright, Genes, Chromosomes, and Disease, (Upper Saddle River, New Jersey, FT Press Science 2011) p. 5.
2 Davies, Kevin, The $1,000 Genome, (New York, New York, Free Press 2010) p. 1, 23.
3 Ibid., p. 9-11.
4 Ibid., p. 79.
5 Ibid., p. 90.
6 Ibid., p. 94.
7 Ibid., p. 111.
8 Gillham, Nicholas Wright, op. cit., p. 244.
9 Davies, Kevin, op. cit., p. 209. www.knome.com.
10 Falconi, Marta, "Roche To Return Tendered Illumina Shares to Shareholders," Dow Jones News Service, April 23, 2012.
11 Davies, Kevin, op. cit., p. 231.
12 Davies, Kevin, op. cit., p. 239.
13 Ibid., p. 245-246.
14 Ibid., p. 133. Disruptive technologies refers to making much more than incremental advances by utilizing a whole new or additional approach. In this context, the parallel sequencing and use of other detection mechanisms such as pH or electric conductivity have caused the cost of sequencing to plunge far faster than a regular learning curve might suggest.
15 Ibid., p. 31-32.
16 Ibid., p. 55,63. www.decodeme.com.
17 www.23andme.com.
18 Davies, Kevin, op. cit., p. 149.
19 Ibid., p. 23.
20 Roberts, Nicholas J., and Vogelstein, Joshua T., et al, "The Predictive Capacity of Personal Genome Sequencing," Science Translational Medicine, Rapid Publication, April 2, 2012, stm.sciencemag.org.
21 Gillham, Nicholas Wright, op. cit., p. 204.
22 Ibid., p. 201.
23 Ibid., p. 184.
24 Ibid., p. 116.
25 Connor, Steve, "Glaxo Chief: Our Drugs Do Not Work On Most Patients," The Independent, December 8, 2003.
26 Ridley, Matt, Genome, (New York, New York, First Harper Perennial, 2006) p. 257.
27 Davies, Kevin, op. cit., p. 255-256.
28 Usdin, Steve, "Product Discovery & Development: Kalydescopic Vision," BioCentury, March 5, 2012, Volume 20, Number 10, p. A2.
29 Davies, Kevin, op. cit., p. 257.
30 Gillham, Nicholas Wright, op. cit., p. 237.
31 Davies, Kevin, op. cit., p. 257.
32 Gillham, Nicholas Wright, op. cit., p. 238.
33 Davies, Kevin, op. cit., p. 257.
34 Hamburg, M.D., Margaret A., and Collins, M.D., Ph.D., Francis S., "The Path to Personalized Medicine," New England Journal of Medicine, July 22, 2010, Volume 363, p. 301-304, www.nejm.org.
5
Wanger International 2012 Semiannual Report

Performance Review Wanger International
 |  | ||||||
| Louis J. Mendes III Co-Portfolio Manager | Christopher J. Olson Co-Portfolio Manager | ||||||
Performance data shown represents past performance and is not a guarantee of future results. The investment return and principal value will fluctuate so that shares, when redeemed, may be worth more or less than the original cost. Current performance may be lower or higher than the performance data shown. Please visit columbiamanagement.com for most recent month-end performance updates.
Wanger International returned 8.64% for the six months ended June 30, 2012, 3.82% better than its primary benchmark, the S&P Global Ex-U.S. between $500M and $5B Index.
A reversal of fortune occurred in the markets at the end of the first quarter of 2012 and continued throughout the second quarter. This shift was brought on by high anxiety regarding the financial stability of peripheral eurozone states, and the worsening outlook for Chinese growth. Markets do not like uncertainty, and the lack of a resolution to European budget crises continues to rattle the confidence of long-term investors in the region. As confidence falls, sovereign borrowing costs rise, which further deteriorates the long-term financial outlook. Aside from this unhelpful, self-reinforcing mechanism, signs of a slowing Chinese economy further fuel market volatility. Despite the ebb and flow of sentiment, however, many of the Fund's holdings have continued to post a pleasing growth in earnings.
Most notable about the Fund's results during the six-month period is the relatively strong performance of classic "Wanger-style" companies. By this we refer to companies that are taking advantage of structural changes within the market for their products or services—whether related to regulation, technology, energy efficiency, social change or otherwise. These can be contrasted with companies that primarily depend on macroeconomic factors to drive earnings. Top performers in the period included Nagacorp (+85%), a Cambodian-based casino operator catering to the growing needs of Indochina's emerging middle class for quality entertainment facilities. Two French companies, Eurofins Scientific (+71%) and Gemalto (+47%) performed well despite eurozone concerns. Eurofins Scientific provides laboratory analysis of food, pharmaceuticals and cosmetics products globally and, after a long period of consolidation, looms as a one-stop solution for multinational companies and others increasingly concerned with the safety and purity of traded goods. Gemalto is a leader in developing smart-chip technology for use in credit cards and mobile handsets. These mobile devices are finding increasingly valuable applications in secure payment systems.
Where macroeconomic worries did hurt the Fund was in commodity-related holdings. Fears of slower global growth drove down a number of energy and basic material stocks. Indonesian gold miner Archipelago Resources (-26%), Mongolian coal miner Mongolian Mining (-24%) and South African platinum miner Northam Platinum (-23%) all fell on weakened outlook for demand. Similarly, oil exploration-related companies Celtic Exploration (-41%) and FMC Technologies (-25%) declined on expectations that oil prices would soften.
We expect continued volatility in the second half of the year. The euro debt crisis does not lend itself to a tidy resolution in the short- or even mid-term. The most likely outcome in our view is piecemeal structural reform within uncompetitive states, incented by explicit and tacit German support and the fact that the alternatives entail a lower standard of living for these states on a long-term basis. We believe that this will be a political process fraught with complexity, and made more complicated by the way Europe is organized. This fall, the presidential election in the United States and the transition of leadership in China will also likely become a focus for continued sentiment shifts in the marketplace. As always, we will strive to work through the noise to identify companies where reasonable valuations are supported by good or improving fundamentals.
International investing involves special risks, including foreign taxation, currency risks, risks associated with possible differences in financial standards and other risks associated with future political and economic developments. Stocks of small- and mid-cap companies pose special risks, including possible illiquidity and greater price volatility than stocks of larger, more established companies. Investing in emerging markets may involve greater risks than investing in more developed countries. In addition, concentration of investments in a single region may result in greater volatility.
Portfolio holdings are subject to change periodically and may not be representative of current holdings.
Fund's Positions in Mentioned Holdings
As a percentage of net assets, as of 6/30/12
| Eurofins Scientific | 1.1 | % | |||||
| Archipelago Resources | 0.9 | ||||||
| Gemalto | 0.9 | ||||||
| Mongolian Mining | 0.6 | ||||||
| Nagacorp | 0.5 | ||||||
| Northam Platinum | 0.4 | ||||||
| FMC Technologies | 0.3 | ||||||
| Celtic Exploration | 0.1 | ||||||
6
Wanger International 2012 Semiannual Report
Growth of a $10,000 Investment in Wanger International
May 3, 1995 (inception date) through June 30, 2012
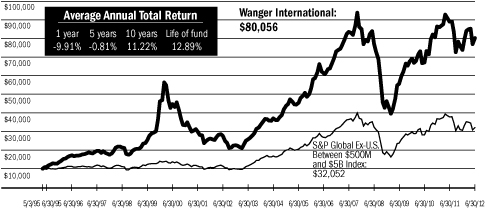
Performance data shown represents past performance and is not a guarantee of future results. The investment return and principal value will fluctuate so that shares, when redeemed, may be worth more or less than the original cost. Current performance may be lower or higher than the performance data shown. Performance results reflect any fee waivers or reimbursements of Fund expenses by the investment manager and/or any of its affiliates. Absent these fee waivers and/or expense reimbursement arrangements, performance results would have been lower. For daily and most recent month-end performance updates, please call 1-888-4-WANGER.
This graph compares the results of $10,000 invested in Wanger International on May 3, 1995 (the date the Fund began operations) through June 30, 2012, to the S&P Global Ex-U.S. Between $500M and $5B Index with dividends and capital gains reinvested. Although the index is provided for use in assessing the Fund's performance, the Fund's holdings may differ significantly from those in the index.
Top 10 Holdings
As a percentage of net assets, as of 6/30/12
| 1. Far EasTone Telecom (Taiwan) Taiwan's Third Largest Mobile Operator | 1.3 | % | |||||
| 2. Melco Crown Entertainment (Hong Kong) Macau Casino Operator | 1.3 | ||||||
| 3. Hexagon (Sweden) Design, Measurement & Visualization Software & Equipment | 1.2 | ||||||
| 4. Eurofins Scientific (France) Food, Pharmaceuticals & Materials Screening & Testing | 1.1 | ||||||
| 5. Naspers (South Africa) Media in Africa, China, Russia & Other Emerging Markets | 1.0 | ||||||
| 6. Kansai Paint (Japan) Paint Producer in Japan, India, China & Southeast Asia | 1.0 | ||||||
| 7. Partners Group (Switzerland) Private Markets Asset Management | 0.9 | ||||||
| 8. Localiza Rent A Car (Brazil) Car Rental | 0.9 | ||||||
| 9. Taiwan Mobile (Taiwan) Taiwan's Second-largest Mobile Operator | 0.9 | ||||||
| 10. Archipelago Resources (Indonesia) Gold Mining Projects in Indonesia, Vietnam & the Philippines | 0.9 | ||||||
Top 5 Countries
As a percentage of net assets, as of 6/30/12
| Japan | 17.7 | % | |||||
| Taiwan | 7.2 | ||||||
| United Kingdom | 6.8 | ||||||
| South Africa | 4.5 | ||||||
| Netherlands | 4.4 | ||||||
Results as of June 30, 2012
| 2nd quarter | Year to date | 1 year | 5 years | 10 years | |||||||||||||||||||
| Wanger International | -5.68 | % | 8.64 | % | -9.91 | % | -0.81 | % | 11.22 | % | |||||||||||||
| S&P Global Ex-U.S. Between $500M and $5B Index* | -8.03 | 4.82 | -15.17 | -2.48 | 10.95 | ||||||||||||||||||
| MSCI EAFE Index | -7.13 | 2.96 | -13.83 | -6.10 | 5.14 | ||||||||||||||||||
| Lipper Variable Underlying International Growth Funds Index | -6.65 | 5.33 | -11.89 | -4.52 | 5.26 | ||||||||||||||||||
* The Fund's primary benchmark.
NAV as of 6/30/12: $28.17
Performance numbers reflect all Fund expenses but do not include any fees and expenses imposed under your variable annuity or life insurance policy or qualified pension or retirement plan. If performance included the effect of these additional charges, it would be lower.
The Fund's annual operating expense ratio of 1.02% is stated as of the Fund's prospectus dated May 1, 2012, and differences in expense ratios disclosed elsewhere in this report may result from including fee waivers and expense reimbursements as well as different time periods used in calculating the ratios.
All results shown assume reinvestment of distributions and do not reflect taxes that a shareholder would pay on Fund distributions or the sale of Fund shares.
The S&P Global Ex-U.S. Between $500M and $5B Index is a subset of the broad market selected by the index sponsor representing the mid- and small-cap developed and emerging markets, excluding the United States. The MSCI Europe, Australasia, Far East (EAFE) Index (Net) is a capitalization-weighted index that tracks the total return of common stocks in 22 developed-market countries within Europe, Australasia and the Far East. The returns of the MSCI EAFE Index (Net) are presented net of the withholding tax rate applicable to foreign non-resident institutional investors in the foreign companies included in the index who do not benefit from double taxation treaties. The performance of the MSCI EAFE Index (Net) is provided to show how the Fund's performance compares to a widely recognized broad-based index of foreign market performance. The Lipper Variable Underlying International Growth Funds Index is an equally weighted representation of the 30 largest variable insurance underlying funds in the Lipper Variable Underlying International Growth Funds Classification, and shows how the Fund's performance compares with returns of an index of funds with similar investment objectives. Indexes are not managed and do not incur fees or expenses. It is not possible to invest directly in an index.
Lipper Inc., a widely respected data provider in the industry, calculates an average total return (assuming reinvestment of distributions) for mutual funds with investment objectives similar to those of the Fund. Lipper makes no adjustment for the effect of sales loads.
Portfolio characteristics and holdings are subject to change periodically and may not be representative of current characteristics and holdings.
7
Wanger International 2012 Semiannual Report
Wanger International
Statement of Investments (Unaudited) June 30, 2012
| Number of Shares | Value | ||||||||||
| Equities – 97.7% | |||||||||||
| Asia – 44.9% | |||||||||||
| Japan – 17.7% | |||||||||||
| 632,589 | Kansai Paint Paint Producer in Japan, India, China & Southeast Asia | $ | 6,778,710 | ||||||||
| 2,292,100 | Seven Bank ATM Processing Services | 5,886,081 | |||||||||
| 2,275 | Wacom Computer Graphic Illustration Devices | 5,095,286 | |||||||||
| 343,300 | Park24 Parking Lot Operator | 5,069,929 | |||||||||
| 180,000 | Hoshizaki Electric Commercial Kitchen Equipment | 4,555,943 | |||||||||
| 339,100 | Kuraray Special Resin, Fine Chemical, Fibers & Textures | 4,394,556 | |||||||||
| 291,631 | Start Today (a) Online Japanese Apparel Retailer | 4,075,395 | |||||||||
| 195,118 | Glory Currency Handling Systems & Related Equipment | 4,070,469 | |||||||||
| 896 | Orix JREIT Diversified REIT | 4,027,534 | |||||||||
| 160,342 | Aeon Delight Facility Maintenance & Management | 3,681,649 | |||||||||
| 98,000 | Sanrio (a) Character Goods & Licensing | 3,572,907 | |||||||||
| 33,599 | Nakanishi Dental Tools & Machinery | 3,414,985 | |||||||||
| 106,641 | Kintetsu World Express Airfreight Logistics | 3,413,179 | |||||||||
| 1,713 | Advance Residence Investment Residential REIT | 3,330,045 | |||||||||
| 78,100 | Miraca Holdings Outsourced Lab Testing, Diagnostic Equipment & Reagents | 3,242,586 | |||||||||
| 185,847 | Daiseki Waste Disposal & Recycling | 3,231,240 | |||||||||
| 289,200 | NGK Insulators Ceramic Products for Auto, Power & Electronics | 3,202,467 | |||||||||
| 54,400 | Disco Semiconductor Dicing & Grinding Equipment | 3,080,829 | |||||||||
| 2,992 | Jupiter Telecommunications Largest Cable Service Provider in Japan | 3,050,579 | |||||||||
| 243,109 | Japan Airport Terminal Airport Terminal Operator at Haneda | 2,965,191 | |||||||||
| Number of Shares | Value | ||||||||||
| 600 | Mori Hills REIT Investment Tokyo-centric Diversified REIT | $ | 2,592,953 | ||||||||
| 299,000 | Shimadzu Analytical Instrument, Medical & Industrial Equipment | 2,587,246 | |||||||||
| 91,300 | Doshisha Wholesaler | 2,529,208 | |||||||||
| 213,700 | Asahi Diamond Industrial Consumable Diamond Tools | 2,453,878 | |||||||||
| 38,400 | FP Corporation Disposable Food Trays & Containers | 2,381,944 | |||||||||
| 39,111 | Ain Pharmaciez Dispensing Pharmacy/Drugstore Operator | 2,359,305 | |||||||||
| 226,900 | Sintokogio Automated Casting Machines, Surface Treatment System & Consumables | 2,274,676 | |||||||||
| 680 | Kenedix Realty Investment Tokyo Mid-size Office REIT | 2,198,583 | |||||||||
| 99,825 | Aeon Mall Suburban Shopping Mall Developer, Owner & Operator | 2,127,118 | |||||||||
| 85,646 | Icom Two Way Radio Communication Equipment | 2,102,942 | |||||||||
| 88,900 | Misumi Group Industrial Components Distributor | 2,094,956 | |||||||||
| 1,720,700 | Shinsei Bank Commercial Bank | 2,093,406 | |||||||||
| 161,860 | Ushio Industrial Light Sources | 2,006,186 | |||||||||
| 98,703 | Ibiden Electronic Parts & Ceramics | 1,787,934 | |||||||||
| 48,100 | Horiba Measuring Instruments & Analyzers | 1,689,264 | |||||||||
| 227 | Fukuoka REIT Diversified REIT in Fukuoka | 1,563,029 | |||||||||
| 152,566 | Torishima Pump Manufacturing Industrial Pump for Power Generation & Water Supply Systems | 1,533,770 | |||||||||
| 95,200 | Nihon Parkerizing Metal Surface Treatment Agents & Processing | 1,474,536 | |||||||||
| 160 | Japan Real Estate Investment Office REIT in Tokyo | 1,467,001 | |||||||||
| 49,958 | Miura Industrial Boiler | 1,330,186 | |||||||||
| 120,787,681 | |||||||||||
See accompanying notes to financial statements.
8
Wanger International 2012 Semiannual Report
Wanger International
Statement of Investments (Unaudited) June 30, 2012
| Number of Shares | Value | ||||||||||
| Taiwan – 7.2% | |||||||||||
| 4,148,000 | Far EasTone Telecom Taiwan's Third Largest Mobile Operator | $ | 9,024,641 | ||||||||
| 1,859,000 | Taiwan Mobile Taiwan's Second Largest Mobile Operator | 6,147,660 | |||||||||
| 2,314,000 | CTCI Corp International Engineering Firm | 4,332,508 | |||||||||
| 572,940 | Simplo Technology Battery Packs for Notebook & Tablet PCs | 3,956,943 | |||||||||
| 1,384,830 | Tripod Technologies Printed Circuit Boards (PCB) | 3,936,386 | |||||||||
| 670,000 | Radiant Opto-Electronics (b) LCD Back Light Units & Modules | 3,405,103 | |||||||||
| 287,000 | St. Shine Optical World's Leading Disposable Contact Lens OEM | 3,211,963 | |||||||||
| 1,274,000 | Taiwan Hon Chuan Beverage Packaging (Bottles, Caps, Labels) Manufacturer | 2,869,825 | |||||||||
| 415,000 | MStar Semiconductor Integrated Circuits for TV, Digital Set-top-box & Handset | 2,799,333 | |||||||||
| 1,210,000 | Chroma Ate Automatic Test Systems, Testing & Measurement Instruments | 2,762,200 | |||||||||
| 748,000 | Advantech Industrial PC & Components | 2,487,532 | |||||||||
| 366,000 | President Chain Store Taiwan's Number One Convenience Chain Store Operator | 1,952,827 | |||||||||
| 299,000 | PC Home Taiwanese Internet Retail Company | 1,695,067 | |||||||||
| 280,000 | Lung Yen Funeral Services & Columbaria | 809,505 | |||||||||
| 49,391,493 | |||||||||||
| Hong Kong – 3.9% | |||||||||||
| 740,000 | Melco Crown Entertainment - ADR (b) Macau Casino Operator | 8,524,800 | |||||||||
| 2,484,600 | Lifestyle International Mid to High-end Department Store Operator in Hong Kong & China | 5,474,844 | |||||||||
| 1,777,500 | L'Occitane International Skin Care & Cosmetics Producer | 4,933,088 | |||||||||
| 976,000 | AAC Technologies Miniature Acoustic Components | 2,840,312 | |||||||||
| 3,400,000 | Sasa International Cosmetics Retailer | 2,154,147 | |||||||||
| Number of Shares | Value | ||||||||||
| 1,133,000 | MGM China Holdings Macau Casino Operator | $ | 1,737,291 | ||||||||
| 1,000,000 | Melco International Macau Casino Operator | 809,006 | |||||||||
| 467,200 | Vitasoy International Hong Kong Soy Food Brand | 392,617 | |||||||||
| 26,866,105 | |||||||||||
| Singapore – 3.8% | |||||||||||
| 2,833,000 | Olam International Agriculture Supply Chain Manager | 4,103,164 | |||||||||
| 2,275,000 | Ascendas REIT Industrial Property Landlord | 3,881,034 | |||||||||
| 2,303,000 | CDL Hospitality Trust Hotel Owner/Operator | 3,562,079 | |||||||||
| 4,030,000 | Mapletree Logistics Trust Industrial Property Landlord | 3,133,477 | |||||||||
| 3,981,000 | Mapletree Commercial Trust Retail & Office Property Landlord | 3,091,060 | |||||||||
| 3,173,000 | Mapletree Industrial Trust Industrial Property Landlord | 3,039,542 | |||||||||
| 1,728,000 | Goodpack Limited International Bulk Container Leasing | 2,366,909 | |||||||||
| 409,000 | Singapore Exchange Singapore Equity & Derivatives Market Operator | 2,054,753 | |||||||||
| 360,400 | Petra Foods Cocoa Processor & Chocolate Manufacturer | 711,269 | |||||||||
| 25,943,287 | |||||||||||
| China – 3.2% | |||||||||||
| 3,060,000 | Want Want Chinese Branded Consumer Food Company | 3,784,119 | |||||||||
| 2,040,000 | Digital China IT Distribution & Systems Integration Services | 3,594,952 | |||||||||
| 126,700 | New Oriental Education & Technology - ADR (b) Education Service Provider | 3,104,150 | |||||||||
| 2,213,000 | Zhaojin Mining Industry Gold Mining & Refining in China | 2,909,805 | |||||||||
| 44,300 | NetEase.com - ADR (b) Chinese Online Gaming Services | 2,607,055 | |||||||||
| 30,000,000 | RexLot Holdings Lottery Equipment Supplier in China | 2,149,024 | |||||||||
See accompanying notes to financial statements.
9
Wanger International 2012 Semiannual Report
Wanger International
Statement of Investments (Unaudited) June 30, 2012
| Number of Shares | Value | ||||||||||
| China – 3.2% (cont) | |||||||||||
| 38,300 | 51job - ADR (b) Integrated Human Resource Services | $ | 1,744,565 | ||||||||
| 3,600,000 | AMVIG Holdings Chinese Tobacco Packaging Material Supplier | 1,594,138 | |||||||||
| 21,487,808 | |||||||||||
| India – 2.5% | |||||||||||
| 38,900 | Asian Paints India's Largest Paint Company | 2,715,494 | |||||||||
| 256,300 | United Breweries India's Largest Brewer | 2,506,725 | |||||||||
| 1,520,000 | Redington India Supply Chain Solutions for IT & Mobile Handsets in Emerging Markets | 2,099,104 | |||||||||
| 941,500 | Adani Ports & Special Economic Zone Indian West Coast Shipping Port | 2,055,718 | |||||||||
| 1,328,300 | Jain Irrigation Systems | 1,993,114 | |||||||||
| 59,405 | Jain Irrigation Systems - DVR (b) Agricultural Micro-irrigation Systems & Food Processing | 42,049 | |||||||||
| 175,600 | Shriram Transport Finance Used Truck Finance | 1,675,073 | |||||||||
| 62,000 | Colgate-Palmolive India Consumer Products in Oral Care | 1,338,048 | |||||||||
| 1,250,800 | S. Kumars Nationwide Textiles, Clothing & Retail | 776,345 | |||||||||
| 4,020,100 | REI Agro Basmati Rice Processing | 673,197 | |||||||||
| 165,000 | Titan Industries Jewlery, Watches & Eyeglasses | 664,397 | |||||||||
| 199,131 | SKIL Ports and Logistics (b) Indian Container Port Project | 352,412 | |||||||||
| 16,891,676 | |||||||||||
| Korea – 1.9% | |||||||||||
| 131,000 | Grand Korea Leisure Largest 'Foreigner Only' Casino Group in Korea | 2,719,468 | |||||||||
| 11,800 | NHN Korean Online Search Services | 2,588,142 | |||||||||
| 71,700 | Woongjin Coway Korean Household Appliance Rental Service Provider | 2,238,788 | |||||||||
| Number of Shares | Value | ||||||||||
| 55,400 | Handsome Korea's Leading High-end Apparel Company | $ | 1,247,488 | ||||||||
| 66,800 | iMarketKorea Procurement, Distribution of MRO (Maintenance, Repair, Operations) Goods | 1,238,245 | |||||||||
| 28,360 | Kepco Plant Service & Engineering Power Plant & Grid Maintenance | 1,196,203 | |||||||||
| 20,600 | Hana Tour Service Korea's Largest Wholesale Tour Provider | 808,816 | |||||||||
| 6,500 | Hyundai Home Shopping TV Home Shopping Company | 636,110 | |||||||||
| 12,673,260 | |||||||||||
| Indonesia – 1.8% | |||||||||||
| 7,592,066 | Archipelago Resources (b) Gold Mining Projects in Indonesia, Vietnam & the Philippines | 6,064,064 | |||||||||
| 6,123,900 | Tower Bersama Infrastructure (b) Communications Towers | 2,145,356 | |||||||||
| 1,471,000 | Mitra Adiperkasa Operator of Department Store & Specialty Retail Stores | 1,129,354 | |||||||||
| 1,800,000 | Ace Indonesia Home Improvement Retailer | 975,294 | |||||||||
| 4,681,000 | MNC Skyvision (b) Largest Satellite Pay TV Operator in Indonesia | 783,802 | |||||||||
| 256,000 | Mayora Indah Consumer Branded Food Manufacturer | 694,767 | |||||||||
| 847,500 | Southern Arc Minerals (b) Gold & Copper Exploration in Indonesia | 233,081 | |||||||||
| 12,025,718 | |||||||||||
| Mongolia – 0.9% | |||||||||||
| 6,913,000 | Mongolian Mining (b) Coking Coal Mining in Mongolia | 3,922,826 | |||||||||
| 118,952 | Ivanhoe Mines (a) (b) | 1,173,046 | |||||||||
| 108,951 | Ivanhoe Mines (a) (b) (c) Copper Mine Project in Mongolia | 1,054,646 | |||||||||
| 6,150,518 | |||||||||||
See accompanying notes to financial statements.
10
Wanger International 2012 Semiannual Report
Wanger International
Statement of Investments (Unaudited) June 30, 2012
| Number of Shares | Value | ||||||||||
| Philippines – 0.8% | |||||||||||
| 8,297,525 | SM Prime Holdings Shopping Mall Operator | $ | 2,571,911 | ||||||||
| 942,890 | Int'l Container Terminal Container Handling Terminals & Port Management | 1,655,119 | |||||||||
| 2,064,100 | Manila Water Company Water Utility Company in the Philippines | 1,202,168 | |||||||||
| 5,429,198 | |||||||||||
| Thailand – 0.7% | |||||||||||
| 12,465,500 | Home Product Center Home Improvement Retailer | 4,978,291 | |||||||||
| Cambodia – 0.5% | |||||||||||
| 7,000,000 | Nagacorp Casino/Entertainment Complex in Cambodia | 3,130,246 | |||||||||
| Total Asia | 305,755,281 | ||||||||||
| Europe – 31.3% | |||||||||||
| United Kingdom – 6.8% | |||||||||||
| 2,250,000 | Charles Taylor (d) Insurance Services | 5,620,525 | |||||||||
| 115,500 | Intertek Group Testing, Inspection, Certification Services | 4,838,974 | |||||||||
| 1,021,000 | BBA Aviation Aviation Support Services | 3,268,641 | |||||||||
| 388,449 | Serco Facilities Management | 3,262,210 | |||||||||
| 296,872 | JLT Group International Business Insurance Broker | 3,261,906 | |||||||||
| 352,000 | Domino's Pizza UK & Ireland Pizza Delivery in the UK, Ireland & Germany | 2,838,295 | |||||||||
| 90,000 | Rightmove Internet Real Estate Listings | 2,248,892 | |||||||||
| 67,600 | Aggreko Temporary Power & Temperature Control Services | 2,198,399 | |||||||||
| 327,000 | Abcam Online Sales of Antibodies | 2,135,334 | |||||||||
| 264,837 | Greggs Bakery | 2,092,143 | |||||||||
| 199,590 | Smith and Nephew Medical Equipment & Supplies | 1,996,392 | |||||||||
| 58,588 | Rotork Valve Actuators for Oil & Water Pipelines | 1,812,033 | |||||||||
| Number of Shares | Value | ||||||||||
| 200,900 | Shaftesbury London Prime Retail REIT | $ | 1,621,847 | ||||||||
| 31,200 | Next Clothes & Home Retailer in the UK | 1,566,620 | |||||||||
| 180,000 | WH Smith British Retailer | 1,536,760 | |||||||||
| 229,742 | Premier Oil (b) Oil & Gas Producer in Europe, Pakistan & Asia | 1,220,625 | |||||||||
| 267,000 | Chemring Defense Manufacturer of Countermeasures & Energetics | 1,149,540 | |||||||||
| 494,998 | PureCircle (a) (b) Natural Sweeteners | 1,112,711 | |||||||||
| 45,604 | Tullow Oil Oil & Gas Producer | 1,054,026 | |||||||||
| 29,141 | Spirax Sarco Steam Systems for Manufacturing & Process Industries | 908,186 | |||||||||
| 331,900 | Sterling Resources (b) Oil & Gas Exploration - Europe | 332,519 | |||||||||
| 46,076,578 | |||||||||||
| Netherlands – 4.4% | |||||||||||
| 183,314 | UNIT4 Business Software Development | 4,672,049 | |||||||||
| 293,428 | Aalberts Industries Flow Control & Heat Treatment | 4,568,917 | |||||||||
| 190,423 | Imtech Electromechanical & Information & Communications Technology Installation & Maintenance | 4,546,961 | |||||||||
| 142,136 | Koninklijke TenCate Advanced Textiles & Industrial Fabrics | 3,794,338 | |||||||||
| 52,129 | Fugro Subsea Oilfield Services | 3,162,087 | |||||||||
| 144,166 | Arcadis Engineering Consultants | 3,153,041 | |||||||||
| 37,116 | Vopak World's Largest Operator of Petroleum & Chemical Storage Terminals | 2,380,683 | |||||||||
| 101,682 | TKH Group Dutch Industrial Conglomerate | 2,184,226 | |||||||||
| 16,249 | Core Laboratories Oil & Gas Reservoir Consulting | 1,883,259 | |||||||||
| 30,345,561 | |||||||||||
See accompanying notes to financial statements.
11
Wanger International 2012 Semiannual Report
Wanger International
Statement of Investments (Unaudited) June 30, 2012
| Number of Shares | Value | ||||||||||
| Switzerland – 3.8% | |||||||||||
| 35,650 | Partners Group Private Markets Asset Management | $ | 6,340,441 | ||||||||
| 28,886 | Geberit Plumbing Supplies | 5,698,574 | |||||||||
| 37,396 | Dufry Group (b) Operates Airport Duty Free & Duty Paid Shops | 4,532,720 | |||||||||
| 1,758 | Sika Chemicals for Construction & Industrial Applications | 3,394,734 | |||||||||
| 19,216 | Kuehne & Nagel Freight Forwarding/Logistics | 2,035,804 | |||||||||
| 32,747 | Zehnder Radiators & Ventilation Systems | 1,957,401 | |||||||||
| 67,830 | Bank Sarasin & Cie (b) Private Banking | 1,911,125 | |||||||||
| 25,870,799 | |||||||||||
| France – 3.6% | |||||||||||
| 62,700 | Eurofins Scientific Food, Pharmaceuticals & Materials Screening & Testing | 7,786,223 | |||||||||
| 84,000 | Gemalto Digital Security Solutions | 6,033,164 | |||||||||
| 77,724 | Neopost Postage Meter Machines | 4,147,878 | |||||||||
| 113,700 | Saft Niche Battery Manufacturer | 2,727,890 | |||||||||
| 27,200 | Norbert Dentressangle Leading European Logistics & Transport Group | 1,725,682 | |||||||||
| 15,550 | Compagnie Française de l'Afrique Occidentale African Wholesaler & Distributor | 736,097 | |||||||||
| 220,933 | Hi-Media (b) Online Advertiser in Europe | 563,140 | |||||||||
| 20,321 | Mersen Advanced Industrial Materials | 509,155 | |||||||||
| 24,229,229 | |||||||||||
| Germany – 3.3% | |||||||||||
| 287,894 | Wirecard Online Payment Processing & Risk Management | 5,582,380 | |||||||||
| 17,109 | Rational Commercial Ovens | 4,078,062 | |||||||||
| Number of Shares | Value | ||||||||||
| 56,872 | Dürr Automotive Plant Engineering & Associated Capital Equipment | $ | 3,509,109 | ||||||||
| 47,100 | Rheinmetall Defense & Automotive | 2,315,301 | |||||||||
| 70,772 | CTS Eventim Event Ticket Sales | 2,129,666 | |||||||||
| 79,400 | NORMA Group Clamps for Automotive & Industrial Applications | 1,744,636 | |||||||||
| 19,339 | Bertrandt Outsourced Engineering | 1,448,656 | |||||||||
| 39,500 | Elringklinger Automobile Components | 942,542 | |||||||||
| 39,590 | Deutsche Beteiligungs Private Equity Investment Management | 781,707 | |||||||||
| 22,532,059 | |||||||||||
| Sweden – 2.2% | |||||||||||
| 459,649 | Hexagon Design, Measurement & Visualization Software & Equipment | 7,889,836 | |||||||||
| 477,910 | Sweco Engineering Consultants | 5,036,099 | |||||||||
| 75,800 | Unibet European Online Gaming Operator | 1,921,763 | |||||||||
| 51,601 | East Capital Explorer Sweden-based Russia & Central Eastern Europe Investment Fund | 355,439 | |||||||||
| 15,203,137 | |||||||||||
| Denmark – 1.4% | |||||||||||
| 189,879 | Novozymes Industrial Enzymes | 4,923,828 | |||||||||
| 19,041 | SimCorp Software for Investment Managers | 3,282,524 | |||||||||
| 20,718 | Solar Technical Wholesaler of Electrical, Plumbing & HVAC Equipment | 1,123,391 | |||||||||
| 9,329,743 | |||||||||||
| Italy – 1.2% | |||||||||||
| 301,517 | Pirelli (a) Global Tire Supplier | 3,180,048 | |||||||||
See accompanying notes to financial statements.
12
Wanger International 2012 Semiannual Report
Wanger International
Statement of Investments (Unaudited) June 30, 2012
| Number of Shares | Value | ||||||||||
| Italy – 1.2% (cont) | |||||||||||
| 18,800 | Tod's (a) Leather Shoes & Bags | $ | 1,885,792 | ||||||||
| 850,000 | Geox (a) Apparel & Shoe Maker | 1,880,500 | |||||||||
| 1,118,273 | CIR (a) Italian Holding Company | 1,102,887 | |||||||||
| 8,049,227 | |||||||||||
| Russia – 0.8% | |||||||||||
| 118,500 | Yandex (b) Search Engine for Russian & Turkish Languages | 2,257,425 | |||||||||
| 246,800 | Petropavlovsk Gold & Iron Ore Mining in Russia | 1,768,128 | |||||||||
| 43,100 | Mail.ru - GDR (b) (e) Internet Social Networking & Games for Russian Speakers | 1,467,813 | |||||||||
| 5,493,366 | |||||||||||
| Iceland – 0.7% | |||||||||||
| 4,344,101 | Marel Largest Manufacturer of Poultry & Fish Processing Equipment | 4,579,364 | |||||||||
| Ireland – 0.5% | |||||||||||
| 29,800 | Paddy Power Irish Betting Services | 1,945,354 | |||||||||
| 488,000 | United Drug Irish Pharmaceutical Wholesaler & Outsourcer | 1,280,497 | |||||||||
| 3,225,851 | |||||||||||
| Spain – 0.4% | |||||||||||
| 70,063 | Red Eléctrica de España Spanish Power Transmission | 3,057,934 | |||||||||
| Portugal – 0.4% | |||||||||||
| 1,009,900 | Redes Energéticas Nacionais Portuguese Power Transmission & Gas Transportation | 2,673,318 | |||||||||
| Czech Republic – 0.4% | |||||||||||
| 15,049 | Komercni Banka Leading Czech Universal Bank | 2,625,317 | |||||||||
| Number of Shares | Value | ||||||||||
| Finland – 0.4% | |||||||||||
| 121,541 | Stockmann (a) Department Store & Fashion Retailer in Scandinavia & Russia | $ | 2,457,274 | ||||||||
| Belgium – 0.3% | |||||||||||
| 51,323 | EVS Broadcast Equipment Digital Live Mobile Production Software & Systems | 2,421,183 | |||||||||
| Norway – 0.3% | |||||||||||
| 272,396 | Atea Leading Nordic IT Hardware/Software Reseller & Installation Company | 2,398,545 | |||||||||
| Kazakhstan – 0.3% | |||||||||||
| 388,200 | Halyk Savings Bank of Kazakhstan - GDR (b) Largest Retail Bank & Insurer in Kazakhstan | 1,936,227 | |||||||||
| Greece – 0.1% | |||||||||||
| 529,085 | Intralot Lottery & Gaming Systems & Services | 597,281 | |||||||||
| Total Europe | 213,101,993 | ||||||||||
| Other Countries – 16.8% | |||||||||||
| South Africa – 4.5% | |||||||||||
| 132,600 | Naspers Media in Africa, China, Russia & Other Emerging Markets | 7,082,487 | |||||||||
| 359,785 | Mr. Price South African Retailer of Apparel, Household & Sporting Goods | 4,932,695 | |||||||||
| 2,199,200 | Rand Merchant Insurance Directly Sold Property & Casualty Insurance; Holdings in Other Insurers | 4,683,921 | |||||||||
| 1,333,156 | Coronation Fund Managers South African Fund Manager | 4,513,823 | |||||||||
| 567,800 | Adcock Ingram Holdings Manufacturer of Pharmaceuticals & Medical Supplies | 4,173,682 | |||||||||
| 999,500 | Northam Platinum Platinum Mining in South Africa | 2,858,858 | |||||||||
| 116,223 | Massmart Holdings General Merchandise, Food & Home Improvement Stores; Wal-Mart Subsidiary | 2,406,440 | |||||||||
| 30,651,906 | |||||||||||
See accompanying notes to financial statements.
13
Wanger International 2012 Semiannual Report
Wanger International
Statement of Investments (Unaudited) June 30, 2012
| Number of Shares | Value | ||||||||||
| Canada – 3.9% | |||||||||||
| 159,649 | CCL Industries Leading Global Label Manufacturer | $ | 5,856,881 | ||||||||
| 139,615 | ShawCor Oil & Gas Pipeline Products | 5,053,347 | |||||||||
| 74,000 | Onex Capital Private Equity | 2,873,215 | |||||||||
| 68,142 | AG Growth (a) Leading Manufacturer of Augers & Grain Handling Equipment | 2,455,682 | |||||||||
| 88,830 | Black Diamond Group Provides Accommodations/Equipment for Oil Sands Development | 1,990,190 | |||||||||
| 117,000 | Alliance Grain Traders Global Leader in Pulse Processing & Distribution | 1,569,806 | |||||||||
| 244,077 | Horizon North Logistics Provides Diversified Oil Service Offering in Northern Canada | 1,392,876 | |||||||||
| 30,351 | Baytex (a) Oil & Gas Producer in Canada | 1,278,612 | |||||||||
| 378,516 | DeeThree Exploration (b) (f) | 1,202,358 | |||||||||
| 86,526 | DeeThree Exploration (b) Canadian Oil & Gas Producer | 280,459 | |||||||||
| 57,000 | Celtic Exploration (b) Canadian Oil & Gas Producer | 770,936 | |||||||||
| 195,271 | Pan Orient (b) Asian Oil & Gas Explorer | 719,248 | |||||||||
| 53,000 | Athabasca Oil Sands (b) Oil Sands & Unconventional Oil Development | 583,047 | |||||||||
| 201,000 | Americas Petrogas (b) Oil & Gas Exploration in Argentina, Potash in Peru | 373,136 | |||||||||
| 42,800 | Crew Energy (b) Canadian Oil & Gas Producer | 241,725 | |||||||||
| 26,641,518 | |||||||||||
| Australia – 3.7% | |||||||||||
| 5,609,785 | Commonwealth Property Office Fund Australia Prime Office REIT | 5,847,620 | |||||||||
| 450,200 | UGL (a) Engineering & Facilities Management | 5,764,631 | |||||||||
| 1,379,700 | Challenger Financial Largest Annuity Provider | 4,633,953 | |||||||||
| Number of Shares | Value | ||||||||||
| 57,385 | Cochlear Cochlear Implants | $ | 3,897,182 | ||||||||
| 865,650 | IAG General Insurance Provider | 3,104,757 | |||||||||
| 181,300 | Domino's Pizza Enterprises Domino's Pizza Operator in Australia/New Zealand & France/Benelux | 1,874,094 | |||||||||
| 25,122,237 | |||||||||||
| United States – 3.5% | |||||||||||
| 139,366 | BioMarin Pharmaceutical (b) Biotech Focused on Orphan Diseases | 5,516,106 | |||||||||
| 120,500 | Atwood Oceanics (b) Offshore Drilling Contractor | 4,559,720 | |||||||||
| 111,165 | Textainer Group Holdings (a) Top International Container Leasor | 4,101,989 | |||||||||
| 88,370 | World Fuel Services Global Fuel Broker | 3,360,711 | |||||||||
| 62,949 | Hornbeck Offshore (b) Supply Vessel Operator in U.S. Gulf of Mexico | 2,441,162 | |||||||||
| 65,200 | Rowan (b) Contract Offshore Driller | 2,107,916 | |||||||||
| 46,146 | FMC Technologies (b) Oil & Gas Well Head Manufacturer | 1,810,308 | |||||||||
| 23,897,912 | |||||||||||
| Israel – 1.0% | |||||||||||
| 542,004 | Israel Chemicals Producer of Potash, Phosphates, Bromine & Specialty Chemicals | 5,996,923 | |||||||||
| 67,000 | Caesarstone (b) Quartz Countertops | 811,370 | |||||||||
| 6,808,293 | |||||||||||
| Senegal – 0.2% | |||||||||||
| 6,012 | Sonatel Leading Telecoms Operator in Western Africa | 1,322,241 | |||||||||
| Total Other Countries | 114,444,107 | ||||||||||
| Latin America – 4.7% | |||||||||||
| Brazil – 2.8% | |||||||||||
| 420,900 | Localiza Rent A Car Car Rental | 6,330,789 | |||||||||
See accompanying notes to financial statements.
14
Wanger International 2012 Semiannual Report
Wanger International
Statement of Investments (Unaudited) June 30, 2012
| Number of Shares | Value | ||||||||||
| Brazil – 2.8% (cont.) | |||||||||||
| 136,000 | Multiplus Loyalty Program Operator in Brazil | $ | 3,243,415 | ||||||||
| 219,900 | Mills Estruturas e Servicos de Engenharia Civil Engineering & Construction | 2,956,087 | |||||||||
| 518,200 | Odontoprev Dental Insurance | 2,613,575 | |||||||||
| 150,000 | Arcos Dorados (a) McDonald's Master Franchise for Latin America | 2,217,000 | |||||||||
| 418,000 | MRV Engenharia Brazilan Property Developer | 1,925,068 | |||||||||
| 19,285,934 | |||||||||||
| Mexico – 0.8% | |||||||||||
| 67,990 | Grupo Aeroportuario del Sureste - ADR Mexican Airport Operator | 5,307,979 | |||||||||
| Guatemala – 0.3% | |||||||||||
| 164,360 | Tahoe Resources (b) Silver Project in Guatemala | 2,271,432 | |||||||||
| Uruguay – 0.4% | |||||||||||
| 230,870 | Union Agriculture Group (b) (f) (g) Farmland Operator in Uruguay | 2,260,217 | |||||||||
| Chile – 0.2% | |||||||||||
| 677,000 | Viña Concha y Toro Global Branded Wine Manufacturer | 1,324,933 | |||||||||
| Colombia – 0.1% | |||||||||||
| 932,244 | Canacol (b) Oil Producer in South America | 416,630 | |||||||||
| 3,074,000 | Gulf United (b) Prospecting for Oil Alongside Large Producers in Colombia | 184,440 | |||||||||
| 601,070 | |||||||||||
| Argentina – 0.1% | |||||||||||
| 604,000 | Madalena Ventures (b) (f) | 199,336 | |||||||||
| 302,000 | Madalena Ventures (b) Oil & Gas Exploration in Argentina | 103,821 | |||||||||
| 303,157 | |||||||||||
| Total Latin America | 31,354,722 | ||||||||||
| Total Equities (Cost: $513,770,478) – 97.7% | 664,656,103 | ||||||||||
| Number of Shares | Value | ||||||||||
| Securities Lending Collateral – 2.8% | |||||||||||
| 19,057,146 | Dreyfus Government Cash Management Fund (7 day yield of 0.01%) (h) | $ | 19,057,146 | ||||||||
| Total Securities Lending Collateral (Cost: $19,057,146) | 19,057,146 | ||||||||||
| Total Investments (Cost: $532,827,624) – 100.5% (i) (j) | 683,713,249 | ||||||||||
| Obligation to Return Collateral for Securities Loaned – (2.8)% | (19,057,146 | ) | |||||||||
| Cash and Other Assets Less Liabilities – 2.3% | 15,972,888 | ||||||||||
| Total Net Assets – 100.0% | $ | 680,628,991 | |||||||||
ADR = American Depositary Receipts
DVR = Differential Voting Right Equity Shares
GDR = Global Depositary Receipts
REIT = Real Estate Investment Trust
Notes to Statement of Investments (dollar values in thousands)
(a) All or a portion of this security was on loan at June 30, 2012. The total market value of securities on loan at June 30, 2012 was $18,795,678.
(b) Non-income producing security.
(c) Security is traded on a U.S. exchange.
(d) An affiliated person of the Fund may include any company in which the Fund owns five percent or more of its outstanding voting shares. Holdings and transactions in these affiliated companies during the six months ended June 30, 2012, are as follows:
Security | Balance of Shares Held 12/31/11 | Purchases/ Additions | Sales/ Reductions | Balance of Shares Held 6/30/12 | Value | Dividend | |||||||||||||||||||||
| Charles Taylor | 2,250,000 | — | — | 2,250,000 | $ | 5,620,525 | $ | 237,836 | |||||||||||||||||||
The aggregate cost and value of this company at June 30, 2012, was $9,152,033 and $5,620,525, respectively. Investments in the affiliated company represented 0.83% of the Fund's total net assets at June 30, 2012.
(e) Security exempt from registration under Section 4(2) of the Securities Act of 1933. This security may only be resold in exempt transactions to qualified buyers. Private resales of this security to qualified institutional buyers are also exempt from registration pursuant to Rule 144A under the Securities Act of 1933. At June 30, 2012, this security had an aggregate value of $1,467,813, which represented 0.22% of total net assets.
See accompanying notes to financial statements.
15
Wanger International 2012 Semiannual Report
Wanger International
Statement of Investments (Unaudited) June 30, 2012
(f) Denotes a restricted security, which is subject to restrictions on resale under federal securities laws. These securities are valued at fair value determined in good faith under consistently applied procedures established by the Board of Trustees. At June 30, 2012, the market value of these securities amounted to $3,661,911, which represented 0.54% of total net assets.
Additional information on these securities is as follows:
Security | Acquisition Dates | Shares | Cost | Value | |||||||||||||||
| Union Agriculture Group | 12/8/10- 6/27/12 | 230,870 | $ | 2,649,999 | $ | 2,260,217 | |||||||||||||
| DeeThree Exploration | 9/7/10- 3/8/11 | 378,516 | 1,283,408 | 1,202,358 | |||||||||||||||
| Madalena Ventures | 10/21/10 | 604,000 | 382,726 | 199,336 | |||||||||||||||
| $4,316,133 | $3,661,911 | ||||||||||||||||||
(g) Illiquid security.
(h) Investment made with cash collateral received from securities lending activity.
(i) On June 30, 2012, the Fund's total investments were denominated in currencies as follows:
| Currency | Value | Percentage of Net Assets | |||||||||
| Japanese Yen | $ | 120,787,681 | 17.7 | ||||||||
| Euro | 97,705,658 | 14.4 | |||||||||
| United States Dollar | 59,258,859 | 8.7 | |||||||||
| British Pound | 53,928,663 | 7.9 | |||||||||
| Taiwan Dollar | 49,391,493 | 7.3 | |||||||||
| Hong Kong Dollar | 39,426,416 | 5.8 | |||||||||
| Other currencies less than 5% of total net assets | 244,157,333 | 35.9 | |||||||||
| $ | 664,656,103 | 97.7 | |||||||||
(j) At June 30, 2012, for federal income tax purposes, the cost of investments was $532,827,624 and net unrealized appreciation (depreciation) was $150,885,625 consisting of gross unrealized appreciation of $193,535,551 and gross unrealized depreciation of $42,649,926.
Fair Value Measurements
Various inputs are used in determining the value of the Fund's investments, following the input prioritization hierarchy established by GAAP. These inputs are summarized in the three broad levels listed below:
• Level 1 – quoted prices in active markets for identical securities
• Level 2 – prices determined using other significant observable inputs (including quoted prices for similar securities, interest rates, prepayment speeds, credit risk and others)
• Level 3 – prices determined using significant unobservable inputs where quoted prices or observable inputs are unavailable or less reliable (including management's own assumptions about the factors market participants would use in pricing an investment)
The inputs or methodology used for valuing securities are not necessarily an indication of the risk associated with investing in those securities.
Examples of the types of securities in which the Fund would typically invest and how they are classified within this hierarchy are as follows. Typical Level 1 securities include exchange traded domestic equities, mutual funds whose NAVs are published each day and exchange traded foreign equities that are not statistically fair valued. Typical Level 2 securities include exchange traded foreign equities that are statistically fair valued, forward foreign currency exchange contracts and short-term investments valued at amortized cost. Additionally, securities fair valued by the Valuation Committee (the Committee) of the Fund's Board of Trustees (the Board) that rely on significant observable inputs are also included in Level 2. Typical Level 3 securities include any security fair valued by the Committee that relies on significant unobservable inputs.
Under the direction of the Board, the Committee is responsible for carrying out the valuation procedures approved by the Board.
The Committee meets as necessary, and no less frequently than quarterly, to determine fair values for securities for which market quotations are not readily available or for which the investment manager believes that available market quotations are unreliable, and to review the continuing appropriateness of the current value of any security subject to the Trust's Portfolio Pricing Policy and the pricing procedures of the investment manager (the Policies). The Policies address, among other things: circumstances under which market quotations will be deemed readily available; selection of third party pricing vendors; appropriate pricing methodologies; events that require fair valuation and fair value techniques; and circumstances under which securities will be deemed to pose a potential for stale pricing, including when securities are illiquid, restricted, or in default. The Committee may also meet to discuss additional valuation matters, which may include review of back-testing results, review of time-sensitive information or approval of other valuation related actions, and to review the appropriateness of the Policies.
For investments categorized as Level 3, the significant unobservable inputs used in the fair value measurement of the Funds' securities may include: (i) data specific to the issuer or comparable issuers, (ii) general market or specific sector news and (iii) quoted prices and specific or similar security transactions. The Committee considers this data and any changes from prior periods in order to assess the reasonableness of observable and unobservable inputs, any assumptions or internal models used to value those securities and changes in fair value. Significant changes in any of these factors could result in lower or higher fair value measurements. Various factors impact the frequency of monitoring (which may occur as often as daily), however the Committee may determine that changes to inputs, assumptions and models are not required with the same frequency.
The following table summarizes the inputs used, as of June 30, 2012, in valuing the Fund's assets:
Investment Type | Quoted Prices (Level 1) | Other Significant Observable Inputs (Level 2) | Significant Unobservable Inputs (Level 3) | Total | |||||||||||||||
| Equities | |||||||||||||||||||
| Asia | $ | 18,441,343 | $ | 287,313,938 | $ | — | $ | 305,755,281 | |||||||||||
| Europe | 4,473,203 | 208,628,790 | — | 213,101,993 | |||||||||||||||
| Other Countries | 50,148,442 | 64,295,665 | — | 114,444,107 | |||||||||||||||
| Latin America | 28,895,170 | 199,335 | 2,260,217 | 31,354,722 | |||||||||||||||
| Total Equities | 101,958,158 | 560,437,728 | 2,260,217 | 664,656,103 | |||||||||||||||
| Total Securities Lending Collateral | 19,057,146 | — | — | 19,057,146 | |||||||||||||||
| Total Investments | $ | 121,015,304 | $ | 560,437,728 | $ | 2,260,217 | $ | 683,713,249 | |||||||||||
See accompanying notes to financial statements.
16
Wanger International 2012 Semiannual Report
Wanger International
Statement of Investments (Unaudited) June 30, 2012
The Fund's assets assigned to the Level 2 input category are generally valued using a market approach, in which a security's value is determined through its correlation to prices and information from observable market transactions for similar or identical assets. Foreign equities are generally valued at the last sale price on the foreign exchange or market on which they trade. The Fund may use a statistical fair valuation model, in accordance with the policy adopted by the Board, provided by an independent third party to value securities principally traded in foreign markets in order to adjust for possible stale pricing that may occur between the close of the foreign exchanges and the time for valuation. These models take into account available market data including intraday index, ADR, and ETF movements. Securities acquired via private placement that have a holding period or an extended settlement period are valued at a discount to the same shares that are trading freely on the market. These discounts are determined by the investment manager's experience with similar securities or situations. Factors may include, but are not limited to, trade volume, shares outstanding and stock price.
The following table shows transfers between Level 1 and Level 2 of the fair value hierarchy:
| Transfers In | Transfers Out | ||||||||||||||
| Level 1 | Level 2 | Level 1 | Level 2 | ||||||||||||
| $ | 1,451,902 | $ | — | $ | — | $ | 1,451,902 | ||||||||
Financial assets were transferred from Level 2 to Level 1 as resale restrictions no longer apply.
The following table reconciles asset balances for the period ending June 30, 2012, in which significant observable and/or unobservable inputs (Level 3) were used in determining value:
| Investments in Securities | Balance as of December 31, 2011 | Realized Gain/(Loss) | Change in Unrealized Appreciation (Depreciation) | Purchases | Sales | Transfers into Level 3 | Transfers out of Level 3 | Balance as of June 30, 2012 | |||||||||||||||||||||||||||
| Equities | |||||||||||||||||||||||||||||||||||
| Latin America | $ | 2,201,705 | $ | — | $ | 58,512 | $ | — | $ | — | $ | — | $ | — | $ | 2,260,217 | |||||||||||||||||||
| $ | 2,201,705 | $ | — | $ | 58,512 | $ | — | $ | — | $ | — | $ | — | $ | 2,260,217 | ||||||||||||||||||||
The information in the above reconciliation table represents fiscal year to date activity for any securities identified as using Level 3 inputs at either the beginning or the end of the current fiscal period.
The change in unrealized appreciation attributed to securities owned at June 30, 2012, which were valued using significant unobservable inputs (Level 3), amounted to $58,512.
The Fund does not hold any significant investments categorized as Level 3.
Certain common stock classified as Level 3 are valued at fair value, using a market approach, as determined in good faith under consistently applied procedures established by and under the general supervision of the Board. To determine fair value for these securities, for which no market exists, the Committee utilizes the valuation technique it deems most appropriate in the circumstances, using some unobservable inputs, which may include but are not limited to trades of similar securities, estimated earnings of the company, market multiples derived from a set of comparable companies, and the position of the security within the company's capital structure. Significant increases or decreases to any of these inputs could result in a significantly lower or higher fair value measurement. Generally, a change in estimated earnings of a company may result in a change to the comparable companies and market multiples utilized.
See accompanying notes to financial statements.
17
Wanger International 2012 Semiannual Report
Wanger International
Portfolio Diversification (Unaudited) June 30, 2012
At June 30, 2012 the funds investments as a percentage of net assets were diversified as follows:
| Value | Percentage of Net Assets | ||||||||||
| Industrial Goods & Services | |||||||||||
| Other Industrial Services | $ | 58,188,453 | 8.6 | ||||||||
| Machinery | 53,220,623 | 7.8 | |||||||||
| Industrial Materials & Specialty Chemicals | 32,102,105 | 4.7 | |||||||||
| Construction | 14,870,631 | 2.2 | |||||||||
| Industrial Distribution | 10,489,430 | 1.6 | |||||||||
| Electrical Components | 10,479,104 | 1.5 | |||||||||
| Conglomerates | 9,438,610 | 1.4 | |||||||||
| Outsourcing Services | 9,183,765 | 1.3 | |||||||||
| 197,972,721 | 29.1 | ||||||||||
| Consumer Goods & Services | |||||||||||
| Retail | 49,574,428 | 7.3 | |||||||||
| Food & Beverage | 38,806,616 | 5.7 | |||||||||
| Casinos & Gaming | 30,714,557 | 4.5 | |||||||||
| Other Consumer Services | 14,160,757 | 2.1 | |||||||||
| Apparel | 13,099,210 | 1.9 | |||||||||
| Travel | 5,672,200 | 0.8 | |||||||||
| Other Durable Goods | 4,700,868 | 0.7 | |||||||||
| Other Entertainment | 4,532,720 | 0.7 | |||||||||
| Educational Services | 3,681,650 | 0.5 | |||||||||
| Nondurables | 3,450,387 | 0.5 | |||||||||
| Restaurants | 3,282,333 | 0.5 | |||||||||
| Consumer Goods Distribution | 2,306,290 | 0.3 | |||||||||
| Furniture & Textiles | 1,883,259 | 0.3 | |||||||||
| 175,865,275 | 25.8 | ||||||||||
| Information | |||||||||||
| Computer Hardware & Related Equipment | 20,132,101 | 3.0 | |||||||||
| Internet Related | 16,490,773 | 2.4 | |||||||||
| Business Software | 7,399,638 | 1.1 | |||||||||
| Mobile Communications | 7,288,468 | 1.1 | |||||||||
| Instrumentation | 7,038,530 | 1.0 | |||||||||
| Electronics Distribution | 6,340,441 | 0.9 | |||||||||
| Telephone & Data Services | 5,996,923 | 0.9 | |||||||||
| Financial Processors | 5,612,062 | 0.8 | |||||||||
| Satellite Brodcasting & Services | 4,101,989 | 0.6 | |||||||||
| Semiconductors & Related Equipment | 3,957,874 | 0.6 | |||||||||
| Advertising | 2,315,301 | 0.3 | |||||||||
| Computer Services | 1,448,657 | 0.2 | |||||||||
| CATV | 1,220,625 | 0.2 | |||||||||
| 89,343,382 | 13.1 | ||||||||||
| Energy & Minerals | |||||||||||
| Oil & Gas Producers | 35,565,373 | 5.2 | |||||||||
| Mining | 23,500,027 | 3.5 | |||||||||
| Oil Services | 14,383,747 | 2.1 | |||||||||
| Agricultural Commodities | 6,450,051 | 1.0 | |||||||||
| Oil Refining, Marketing & Distribution | 809,505 | 0.1 | |||||||||
| 80,708,703 | 11.9 | ||||||||||
| Value | Percentage of Net Assets | ||||||||||
| Other Industries | |||||||||||
| Real Estate | $ | 29,349,314 | 4.4 | ||||||||
| Transportation | 13,736,863 | 2.0 | |||||||||
| Regulated Utilities | 13,075,286 | 1.9 | |||||||||
| 56,161,463 | 8.3 | ||||||||||
| Finance | |||||||||||
| Brokerage & Money Management | 16,790,991 | 2.5 | |||||||||
| Banks | 10,306,263 | 1.5 | |||||||||
| Insurance | 8,910,467 | 1.3 | |||||||||
| Finance Companies | 8,694,452 | 1.3 | |||||||||
| 44,702,173 | 6.6 | ||||||||||
| Health Care | |||||||||||
| Pharmaceuticals | 8,966,460 | 1.3 | |||||||||
| Medical Equipment & Devices | 3,445,211 | 0.5 | |||||||||
| Medical Supplies | 3,407,864 | 0.5 | |||||||||
| Health Care Services | 2,909,805 | 0.4 | |||||||||
| Biotechnology & Drug Delivery | 1,173,046 | 0.2 | |||||||||
| 19,902,386 | 2.9 | ||||||||||
| Total Equities | 664,656,103 | 97.7 | |||||||||
| Security Lending Collateral | 19,057,146 | 2.8 | |||||||||
| Total Investments | 683,713,249 | 100.5 | |||||||||
| Obligation to Return Collateral for Securities Loaned | (19,057,146 | ) | (2.8 | ) | |||||||
| Cash and Other Assets Less Liabilities | 15,972,888 | 2.3 | |||||||||
| Net Assets | $ | 680,628,991 | 100.0 | % | |||||||
See accompanying notes to financial statements.
18
Wanger International 2012 Semiannual Report
Statement of Assets and Liabilities
June 30, 2012 (Unaudited)
| Assets: | |||||||
| Unaffiliated investments, at cost | $ | 523,675,591 | |||||
| Affiliated investments, at cost (See Note 4) | 9,152,033 | ||||||
| Unaffiliated investments, at value (including securities on loan of $18,795,678) | $ | 678,092,724 | |||||
| Affiliated investments, at value (See Note 4) | 5,620,525 | ||||||
| Cash | 8,999,037 | ||||||
| Foreign currency (cost of $716,213) | 715,032 | ||||||
| Receivable for: | |||||||
| Investments sold | 11,030,045 | ||||||
| Fund shares sold | 164,423 | ||||||
| Securities lending income | 14,455 | ||||||
| Dividends | 700,670 | ||||||
| Foreign tax reclaims | 461,605 | ||||||
| Trustees' deferred compensation plan | 113,728 | ||||||
| Prepaid expenses | 3,760 | ||||||
| Total Assets | 705,916,004 | ||||||
| Liabilities: | |||||||
| Collateral on securities loaned | 19,057,146 | ||||||
| Payable for: | |||||||
| Investments purchased | 4,725,564 | ||||||
| Fund shares repurchased | 582,909 | ||||||
| Investment advisory fee | 16,536 | ||||||
| Administration fee | 901 | ||||||
| Transfer agent fee | 1 | ||||||
| Custody fee | 43,784 | ||||||
| Reports to shareholders | 222,847 | ||||||
| Chief compliance officer expenses | 929 | ||||||
| Deferred foreign capital gains tax payable | 505,788 | ||||||
| Trustees' deferred compensation plan | 113,728 | ||||||
| Other liabilities | 16,880 | ||||||
| Total Liabilities | 25,287,013 | ||||||
| Net Assets | $ | 680,628,991 | |||||
| Composition of Net Assets: | |||||||
| Paid-in capital | $ | 510,691,462 | |||||
| Overdistributed net investment income | (10,757,350 | ) | |||||
| Accumulated net realized gain | 30,306,872 | ||||||
| Net unrealized appreciation (depreciation) on: | |||||||
| Unaffiliated investments | 154,417,133 | ||||||
| Affiliated investments | (3,531,508 | ) | |||||
| Foreign currency translations | 8,170 | ||||||
| Foreign capital gains tax | (505,788 | ) | |||||
| Net Assets | $ | 680,628,991 | |||||
| Fund Shares Outstanding | 24,163,063 | ||||||
| Net asset value, offering price and redemption price per share | $ | 28.17 | |||||
Statement of Operations
For the Six Months Ended June 30, 2012 (Unaudited)
| Investment Income: | |||||||
| Dividends (net foreign taxes withheld of $1,062,708) | $ | 9,644,477 | |||||
| Dividends from affiliates | 237,836 | ||||||
| Interest income | 88 | ||||||
| Securities lending income, net | 88,210 | ||||||
| Total Investment Income | 9,970,611 | ||||||
| Expenses: | |||||||
| Investment advisory fee | 3,211,386 | ||||||
| Administration fee | 178,094 | ||||||
| Transfer agent fee | 244 | ||||||
| Trustees' fees | 21,532 | ||||||
| Custody fee | 142,829 | ||||||
| Reports to shareholders | 215,188 | ||||||
| Audit fee | 29,802 | ||||||
| Legal fees | 36,661 | ||||||
| Chief compliance officer expenses (See Note 4) | 10,857 | ||||||
| Commitment fee for line of credit (See Note 5) | 2,544 | ||||||
| Other expenses | 16,527 | ||||||
| Total Expenses | 3,865,664 | ||||||
| Advisory fee waiver (See Note 4) | (184,826 | ) | |||||
| Net Expenses | 3,680,838 | ||||||
| Net Investment Income | 6,289,773 | ||||||
| Net Realized and Unrealized Gain (Loss) on Investments: | |||||||
| Net realized gain (loss) on: | |||||||
| Unaffiliated investments | 35,221,093 | ||||||
| Foreign currency translations | (139,347 | ) | |||||
| Forward foreign currency exchange contracts | 536,208 | ||||||
| Net realized gain | 35,617,954 | ||||||
| Net change in unrealized appreciation (depreciation) on: | |||||||
| Unaffiliated investments | 17,306,885 | ||||||
| Affiliated investments (See Note 4) | 1,178,460 | ||||||
| Foreign currency translations | 29,064 | ||||||
| Forward foreign currency exchange contracts | (447,630 | ) | |||||
| Foreign capital gains tax | (206,355 | ) | |||||
| Net change in unrealized appreciation | 17,860,424 | ||||||
| Net Gain | 53,478,378 | ||||||
| Net Increase in Net Assets from Operations | $ | 59,768,151 | |||||
See accompanying notes to financial statements.
19
Wanger International 2012 Semiannual Report
Statements of Changes in Net Assets
| Increase (Decrease) in Net Assets: | (Unaudited) Six Months Ended June 30, 2012 | Year Ended December 31, 2011 | |||||||||
| Operations: | |||||||||||
| Net investment income (loss) | $ | 6,289,773 | $ | 10,429,793 | |||||||
| Net realized gain (loss) on: | |||||||||||
| Unaffiliated investments | 35,221,093 | 72,735,230 | |||||||||
| Foreign currency translations | (139,347 | ) | (826,730 | ) | |||||||
| Forward foreign currency exchange contracts | 536,208 | 895,678 | |||||||||
| Reimbursement from affiliate (See Note 4) | — | 23,741 | |||||||||
| Net change in unrealized appreciation (depreciation) on: | |||||||||||
| Unaffiliated investments | 17,306,885 | (201,356,235 | ) | ||||||||
| Affiliated investments | 1,178,460 | (1,398,710 | ) | ||||||||
| Foreign currency translations | 29,064 | (240,164 | ) | ||||||||
| Forward foreign currency exchange contracts | (447,630 | ) | (1,163,361 | ) | |||||||
| Foreign capital gains tax | (206,355 | ) | (248,488 | ) | |||||||
| Net Increase (Decrease) in Net Assets from Operations | 59,768,151 | (121,149,246 | ) | ||||||||
| Distributions to Shareholders: | |||||||||||
| From net investment income | (1,058,027 | ) | (39,660,297 | ) | |||||||
| From net realized gains | (64,994,967 | ) | (20,366,967 | ) | |||||||
| Total Distributions to Shareholders | (66,052,994 | ) | (60,027,264 | ) | |||||||
| Share Transactions: | |||||||||||
| Subscriptions | 9,266,212 | 42,767,097 | |||||||||
| Distributions reinvested | 66,052,994 | 60,027,264 | |||||||||
| Redemptions | (70,622,622 | ) | (165,161,101 | ) | |||||||
| Net Increase (Decrease) from Share Transactions | 4,696,584 | (62,366,740 | ) | ||||||||
| Total Decrease in Net Assets | (1,588,259 | ) | (243,543,250 | ) | |||||||
| Net Assets: | |||||||||||
| Beginning of period | 682,217,250 | 925,760,500 | |||||||||
| End of period | $ | 680,628,991 | $ | 682,217,250 | |||||||
| Overdistributed Net Investment Income | $ | (10,757,350 | ) | $ | (15,989,096 | ) | |||||
See accompanying notes to financial statements.
20
Wanger International 2012 Semiannual Report
Financial Highlights
| (Unaudited) Six Months Ended June 30, | Year Ended December 31, | ||||||||||||||||||||||||||
| Selected data for a share outstanding throughout each period | 2012 | 2011 | 2010 | 2009 | 2008 | 2007 | |||||||||||||||||||||
| Net Asset Value, Beginning of Period | $ | 28.79 | $ | 36.16 | $ | 29.68 | $ | 20.69 | $ | 44.04 | $ | 41.77 | |||||||||||||||
| Income from Investment Operations: | |||||||||||||||||||||||||||
| Net investment income (a) | 0.27 | 0.42 | 0.35 | 0.30 | 0.52 | 0.37 | |||||||||||||||||||||
| Net realized and unrealized gain (loss) on investments and foreign currency and foreign capital gains tax | 2.11 | (5.31 | ) | 6.93 | 9.61 | (18.37 | ) | 5.80 | |||||||||||||||||||
| Reimbursement from affiliate | — | 0.00 | (b) | — | — | — | — | ||||||||||||||||||||
| Total from Investment Operations | 2.38 | (4.89 | ) | 7.28 | 9.91 | (17.85 | ) | 6.17 | |||||||||||||||||||
| Less Distributions to Shareholders: | |||||||||||||||||||||||||||
| From net investment income | (0.05 | ) | (1.64 | ) | (0.80 | ) | (0.93 | ) | (0.34 | ) | (0.39 | ) | |||||||||||||||
| From net realized gains | (2.95 | ) | (0.84 | ) | — | — | (5.16 | ) | (3.51 | ) | |||||||||||||||||
| Total Distributions to Shareholders | (3.00 | ) | (2.48 | ) | (0.80 | ) | (0.93 | ) | (5.50 | ) | (3.90 | ) | |||||||||||||||
| Increase from Regulatory Settlements | — | — | — | 0.01 | — | — | |||||||||||||||||||||
| Net Asset Value, End of Period | $ | 28.17 | $ | 28.79 | $ | 36.16 | $ | 29.68 | $ | 20.69 | $ | 44.04 | |||||||||||||||
| Total Return (c) | 8.64 | %(d)(e) | (14.62 | )%(d) | 24.92 | %(d) | 49.78 | % | (45.60 | )% | 16.31 | % | |||||||||||||||
| Ratios to Average Net Assets/Supplemental Data: | |||||||||||||||||||||||||||
| Net expenses | 1.06 | %(f) | 1.00 | %(g) | 1.04 | %(g) | 1.05 | %(g) | 1.02 | %(g) | 0.99 | %(g) | |||||||||||||||
| Net investment income | 1.77 | %(f) | 1.25 | %(g) | 1.12 | %(g) | 1.23 | %(g) | 1.67 | %(g) | 0.87 | %(g) | |||||||||||||||
| Waiver/Reimbursement | 0.03 | %(e) | 0.06 | % | 0.03 | % | — | — | — | ||||||||||||||||||
| Portfolio turnover rate | 18 | %(e) | 36 | % | 32 | % | 37 | % | 36 | % | 35 | % | |||||||||||||||
| Net assets, end of period (000s) | $ | 680,629 | $ | 682,217 | $ | 925,761 | $ | 1,442,428 | $ | 972,860 | $ | 1,693,374 | |||||||||||||||
(a) Net investment income per share was based upon the average shares outstanding during the period.
(b) Rounds to less than $0.01 per share.
(c) Total return at net asset value assuming all distributions reinvested.
(d) Had the investment manager and/or its affiliates not waived a portion of expenses, total return would have been reduced.
(e) Not annualized.
(f) Annualized excluding the advisory fee waiver, which was terminated April 30, 2012 (See Note 4).
(g) The benefits derived from custody fees paid indirectly had an impact of less than 0.01%.
See accompanying notes to financial statements.
21
Wanger International 2012 Semiannual Report
Notes to Financial Statements (Unaudited)
1. Nature of Operations
Wanger International (the Fund), a series of Wanger Advisors Trust (the Trust), is registered under the Investment Company Act of 1940, as amended (the 1940 Act), as an open-end management investment company organized as a Massachusetts business trust. The investment objective of the Fund is to seek long-term capital appreciation. The Fund is available only for allocation to certain life insurance company separate accounts established for the purpose of funding participating variable annuity contracts and variable life insurance policies and may also be offered directly to certain qualified pension and retirement plans.
2. Significant Accounting Policies
The preparation of financial statements in accordance with accounting principles generally accepted in the United States of America (GAAP) requires management to make certain estimates and assumptions that affect the reported amounts of assets and liabilities, the disclosure of contingent assets and liabilities at the date of the financial statements and the reported amounts of revenue and expenses during the reporting period. Actual results could differ from those estimates.
Security valuation
Securities of the Fund are valued at market value or, if a market quotation for a security is not readily available or is deemed not to be reliable because of events or circumstances that have occurred between the market quotation and the time as of which the security is to be valued, the security is valued at its fair value determined in good faith under consistently applied procedures established by the Board of Trustees. A security traded on a securities exchange or in an over-the-counter market in which transaction prices are reported is valued at the last sales price at the time of valuation. A security traded principally on NASDAQ is valued at the NASDAQ official closing price. Mutual Funds and Exchange Traded Funds are valued at their closing net asset value as reported to NASDAQ. A security for which there is no reported sale on the valuation date is valued at the mean of the latest bid and ask quotations.
Short-term investments maturing in 60 days or less are valued at amortized cost, which approximates market value.
Forward foreign currency exchange contracts are marked-to-market based upon foreign currency exchange rates provided by a pricing service.
A security for which a market quotation is not readily available and any other assets are valued at their fair value determined in good faith under consistently applied procedures established by the Board of Trustees. The Trust has retained an independent statistical fair value pricing service that employs a systematic methodology to assist in the fair valuation process for securities principally traded in a foreign market in order to adjust for possible changes in value that may occur between the close of the foreign market and the time as of which the securities are to be valued. If a security is valued at a fair value, that value may be different from the last quoted market price for the security.
Foreign currency translations
Values of investments denominated in foreign currencies are converted into U.S. dollars using the New York spot market rate of exchange at the time of valuation. Purchases and sales of investments and dividend and interest income are translated into U.S. dollars using the spot market rate of exchange prevailing on the respective dates of such transactions. The gain or loss resulting from changes in foreign exchange rates is included with net realized and unrealized gain or loss from investments, as appropriate.
Repurchase agreements
The Fund may engage in repurchase agreement transactions. The Fund, through its custodian, receives delivery of underlying securities collateralizing each repurchase agreement. The counterparty is required to maintain collateral that is at all times at least equal to the repurchase price including interest. In the event of default or bankruptcy by the other party to the agreement, realization and/or retention of the collateral may be subject to legal proceedings.
Restricted securities
Restricted securities are securities that may only be resold upon registration under federal securities laws or in transactions exempt from registration. In some cases, the issuer of restricted securities has agreed to register such securities for resale at the issuer's expense either upon demand by the Fund or in connection with another registered offering of the securities. Many restricted securities may be resold in the secondary market in transactions exempt from registration. Such restricted securities may be determined to be liquid under criteria established by the Board of Trustees.
Derivative Instruments
The Fund invests in certain derivative instruments as detailed below to meet its investment objectives. Derivatives are instruments whose values depend on, or are derived from, in whole or in part, the value of one or more other assets, such as securities, currencies, commodities or indices. Derivative instruments may be used to maintain cash reserves while maintaining exposure to certain other assets, to offset anticipated declines in values of investments, to facilitate trading, to reduce transaction costs and to pursue higher investment returns. The Fund may also use derivative instruments to mitigate certain investment risks, such as foreign currency exchange rate risk, interest rate risk and credit risk. Derivatives may involve various risks, including the potential inability of the counterparty to fulfill its obligation under the terms of the contract, the potential for an illiquid secondary market and the potential for market movements, which may expose the Fund to gains or losses in excess of the amount shown in the Statement of Assets and Liabilities.
Forward Foreign Currency Exchange Contracts
Forward foreign currency exchange contracts are agreements between two parties to buy and sell a currency at a set price on a future date. The contracts are intended to be used to minimize the exposure to foreign exchange rate fluctuations during the period between the trade and settlement dates of the contract. The Fund utilized forward foreign currency exchange contracts to hedge the currency exposure associated with some or all of the Fund's securities or to hedge out of a currency that is off benchmark.
The values of forward foreign currency exchange contracts fluctuate with changes in foreign currency exchange rates. The Fund will record a realized gain or loss when the forward foreign currency exchange contract is closed.
The use of forward foreign currency exchange contracts does not eliminate fluctuations in the prices of the Fund's portfolio securities. The risks of forward foreign currency exchange contracts include movement in the values of the foreign currencies relative to the U.S. dollar (or other foreign currencies) and the possibility that counterparties will not complete their contractual obligations, which may be in excess of the amount reflected, if any, in the Statement of Assets and Liabilities.
Effects of Derivative Transactions in the Financial Statements
The following tables are intended to provide additional information about the effect of derivatives on the financial statements of the Fund, including: the fair value of derivatives by risk category and the location of those fair values in the Statement of Assets and Liabilities; the impact of derivative transactions on the Fund's operations over the period including realized gains or losses and unrealized gains or losses. The derivative schedules following the Portfolio of Investments present additional information regarding derivative instruments outstanding at the end of the period, if any.
At June 30, 2012, the fund had no outstanding derivatives.
The effect of derivative instruments in the Statement of Operations for the six months ended June 30, 2012:
Amount of Realized Gain (Loss) on Derivatives Recognized in Income
| Risk Exposure Category | Forward Foreign Currency Exchange Contracts ($) | ||||||
| Foreign exchange contracts | 536,208 | ||||||
22
Wanger International 2012 Semiannual Report
Notes to Financial Statements, continued (Unaudited)
Change in Unrealized Appreciation (Depreciation) on Derivatives Recognized in Income
| Risk Exposure Category | Forward Foreign Currency Exchange Contracts ($) | ||||||
| Foreign exchange contracts | (447,630 | ) | |||||
The following table is a summary of the volume of derivative instruments for the six months ended June 30, 2012:
| Derivative Instrument | Contracts Opened | ||||||
| Forward Foreign Currency Exchange Contracts | 3 | ||||||
Security transactions and investment income
Security transactions are accounted for on the trade date (date the order to buy or sell is executed) and dividend income is recorded on the ex-dividend date, except that certain dividends from foreign securities are recorded as soon as the information is available to the Fund. Interest income is recorded on the accrual basis and includes amortization of discounts on debt obligations when required for federal income tax purposes. Realized gains and losses from security transactions are recorded on an identified cost basis.
Awards, if any, from class action litigation related to securities owned may be recorded as a reduction of cost of those securities. If the applicable securities are no longer owned, the proceeds are recorded as realized gains.
Expenses
General expenses of the Trust are allocated to the Fund and the other series of the Trust based upon relative net assets or other expense allocation methodologies determined by the nature of the expense. Expenses directly attributable to the Fund are charged to the Fund.
Fund share valuation
Fund shares are sold and redeemed on a continuing basis at net asset value. Net asset value per share is determined daily as of the close of trading on the New York Stock Exchange (the Exchange) on each day the Exchange is open for trading by dividing the total value of the Fund's investments and other assets, less liabilities, by the number of Fund shares outstanding.
Securities lending
The Fund may lend securities up to one-third of the value of its total assets to certain approved brokers, dealers and other financial institutions to earn additional income. The Fund retains the benefits of owning the securities, including receipt of dividends or interest generated by the security. The Fund also receives a fee for the loan. The Fund has the ability to recall the loans at any time and could do so in order to vote proxies or to sell the loaned securities. Each loan is collateralized by cash that exceeded the value of the securities on loan. The market value of the loaned securities is determined daily at the close of business of the Fund and any additional required collateral is delivered to each Fund on the next business day. The Fund has elected to invest the cash collateral in the Dreyfus Government Cash Management Fund and the income earned is paid to the Fund, net of any fees remitted to Goldman Sachs Agency Lending, the Fund's lending agent and borrower rebates. The Fund's investment manager, Columbia Wanger Asset Management, LLC (CWAM), does not retain any fees earned by the lending program. Generally, in the event of borrower default, the Fund has the right to use the collateral to offset any losses incurred. In the event the Fund is delayed or prevented from exercising its right to dispose of the collateral, there may be a potential loss to the Fund. Some of these losses may be indemnified by the lending agent. The Fund bears the risk of loss with respect to the investment of collateral.
The net lending income earned by the Fund as of June 30, 2012, is included in the Statement of Operations.
Federal income taxes
The Fund has complied with the provisions of the Internal Revenue Code available to regulated investment companies and, in the manner provided therein, distributes substantially all its taxable income, as well as any net realized gain on sales of investments and foreign currency transactions reportable for federal income tax purposes. Accordingly, the Fund paid no federal income taxes and no federal income tax provision was required.
Foreign capital gains taxes
Gains in certain countries may be subject to foreign taxes at the fund level. The Fund accrues for such foreign taxes on net realized and unrealized gains at the appropriate rate for each jurisdiction. The amount, if any, is disclosed as a liability on the Statement of Assets and Liabilities.
Distributions to shareholders
Distributions to shareholders are recorded on the ex-dividend date.
Indemnification
In the normal course of business, the Trust on behalf of the Fund enters into contracts that contain a variety of representations and warranties and that provide general indemnities. The Fund's maximum exposure under these arrangements is unknown, as this would involve future claims against the Fund. Also under the Trust's organizational documents, the trustees and officers of the Trust are indemnified against certain liabilities that may arise out of their duties to the Trust. However based on experience, the Fund expects the risk of loss due to these warranties and indemnities to be remote.
Recent Accounting Pronouncement
Disclosures about Offsetting Assets and Liabilities
In December 2011, the Financial Accounting Standards Board (FASB) issued ASU No. 2011-11, Disclosures about Offsetting Assets and Liabilities. The objective of the FASB is to enhance current disclosure requirements on offsetting of certain assets and liabilities and to enable financial statement users to compare financial statements prepared under GAAP and International Financial Reporting Standards.
Specifically, ASU No. 2011-11 requires an entity to disclose both gross and net information for derivatives and other financial instruments that are subject to a master netting arrangement or similar agreement. The standard requires disclosure of collateral received in connection with the master netting agreements or similar agreements. The effective date of ASU No. 2011-11 is for interim and annual periods beginning on or after January 1, 2013. At this time, management is evaluating the implications of this guidance and the impact it will have on the financial statement amounts and footnote disclosures, if any.
3. Federal Tax Information
The timing and character of income and capital gain distributions are determined in accordance with income tax regulations, which may differ from GAAP. Reclassifications are made to the Fund's capital accounts for permanent tax differences to reflect income and gains available for distribution (or available capital loss carryforwards) under income tax regulations.
Under current tax rules, regulated investment companies can elect to treat certain late-year ordinary losses incurred and post-October capital losses (capital losses realized after October 31) as arising on the first day of the following taxable year. The Fund has elected to treat late year ordinary losses of $269,200 at December 31, 2011 as arising on January 1, 2012.
Management is required to determine whether a tax position of the Fund is more likely than not to be sustained upon examination by the applicable taxing authority, including resolution of any related appeals or litigation processes, based on the technical merits of the position. The tax benefit to be recognized by the Fund is measured as the largest amount of benefit that is greater than fifty percent likely of being realized upon ultimate settlement. Management is not aware of any tax positions for which it is reasonably possible that the total amounts of unrecognized
23
Wanger International 2012 Semiannual Report
Notes to Financial Statements, continued (Unaudited)
tax benefits will significantly change in the next twelve months. However, management's conclusions may be subject to review and adjustment at a later date based on factors including, but not limited to, new tax laws, regulations, and administrative interpretations (including relevant court decisions). The Fund's federal tax returns for the prior three fiscal years remain subject to examination by the Internal Revenue Service.
4. Transactions With Affiliates
CWAM is a wholly owned subsidiary of Columbia Management Investment Advisers, LLC (Columbia Management), which in turn is a wholly owned subsidiary of Ameriprise Financial, Inc. (Ameriprise Financial). CWAM furnishes continuing investment supervision to the Fund and is responsible for the overall management of the Fund's business affairs.
CWAM receives a monthly advisory fee based on the Fund's average daily net assets at the following annual rates:
| Average Daily Net Assets | Annual Fee Rate | ||||||
| Up to $100 million | 1.10 | % | |||||
| $100 million to $250 million | 0.95 | % | |||||
| $250 million to $500 million | 0.90 | % | |||||
| $500 million to $1billion | 0.80 | % | |||||
| $1 billion and over | 0.72 | % | |||||
For the six months ended June 30, 2012, the annualized effective investment advisory fee rate, net of fee waivers, in effect during a portion of the period, was 0.88% of the Fund's average daily net assets.
Prior to May 1, 2012, CWAM had contractually agreed to reimburse the Fund to the extent that investment advisory fees exceeded an annual percentage of 0.83% of average daily net assets on an annualized basis. The reimbursement to the Fund for the six months ended June 30, 2012 was $184,826.
CWAM provides administrative services and receives an administration fee from the Fund at the following annual rates:
Wanger Advisors Trust Aggregate
| Average Daily Net Assets of the Trust | Annual Fee Rate | ||||||
| Up to $4 billion | 0.05 | % | |||||
| $4 billion to $6 billion | 0.04 | % | |||||
| $6 billion to $8 billion | 0.03 | % | |||||
| $8 billion and over | 0.02 | % | |||||
For the six months ended June 30, 2012, the annualized effective administration fee rate was 0.05% of the Fund's average daily net assets. Columbia Management provides certain sub-administrative services to the Fund.
Columbia Management Investment Distributors, Inc. (CMID), a wholly owned subsidiary of Ameriprise Financial, serves as the Fund's distributor and principal underwriter.
Columbia Management Investment Services Corp. (CMIS), a wholly owned subsidiary of Ameriprise Financial, is the transfer agent to the Fund. For its services, the Fund pays CMIS a monthly fee at the annual rate of $21.00 per open account. CMIS also receives reimbursement from the Fund for certain out-of-pocket expenses.
Certain officers and trustees of the Trust are also officers of CWAM. The Trust makes no direct payments to its officers and trustees who are affiliated with CWAM.
The Board of Trustees has appointed a Chief Compliance Officer of the Trust in accordance with federal securities regulations. The Fund, along with other affiliated funds, pays its pro-rata share of the expenses associated with the Office of the Chief Compliance Officer. These expenses are disclosed separately as "Chief compliance officer expenses" in the Statement of Operations.
The Trust offers a deferred compensation plan for its independent trustees. Under that plan, a trustee may elect to defer all or a portion of his or her compensation. Amounts deferred are retained by the Trust and may represent an unfunded obligation of the Trust. The value of amounts deferred is determined by reference to the change in value of Class Z shares of one or more series of Columbia Acorn Trust or a money market fund as specified by the trustee. Benefits under the deferred compensation plan are payable in accordance with the plan.
An affiliated person of the Fund may include any company in which the Fund owns five percent or more of its outstanding voting shares. On June 30, 2012, the Fund held five percent or more of the outstanding voting securities of one company. Details of investments in those affiliated companies are presented in the Notes to the Statement of Investments on Page 15.
For the six months ended June 30, 2012, the Fund engaged in purchase and sales transactions with funds that have a common investment adviser (or affiliated investment advisers), common directors/trustees, and/or common officers. Those purchase and sale transactions complied with provisions of Rule 17a-7 under the Investment Company Act of 1940 and were $124,168 and $574,238, respectively. During the year ended December 31, 2011, Columbia Management reimbursed the Fund $23,741 for a loss on a trading error.
5. Borrowing Arrangements
The Trust participates in a $150 million credit facility with JPMorgan Chase Bank, N.A., along with another Trust managed by CWAM, which was entered into to facilitate portfolio liquidity. Under the facility, as in effect for the six months ended June 30, 2012, interest is charged to each participating fund based on its borrowings at a rate per annum equal to the higher of Federal Funds Rate or Overnight LIBOR plus 1.25%. In addition, a commitment fee of 0.10% per annum of the unutilized line of credit is accrued and apportioned among the participating funds based on their relative net assets. The commitment fee is disclosed separately as "Commitment fee for line of credit" in the Statement of Operations. The Trust expects to renew this line of credit for one year durations annually in July at then current market rates and terms.
The Fund had no borrowings during the six months ended June 30, 2012.
6. Fund Share Transactions
Proceeds and payments on Fund shares as shown in the Statement of Changes in Net Assets are in respect of the following numbers of shares:
| (Unaudited) Six months ended June 30, 2012 | Year ended December 31, 2011 | ||||||||||
| Shares sold | 302,929 | 1,268,598 | |||||||||
| Shares issued in reinvestment of dividend distributions | 2,427,526 | 1,741,626 | |||||||||
| Less shares redeemed | (2,263,366 | ) | (4,915,244 | ) | |||||||
| Net increase (decrease) in shares outstanding | 467,089 | (1,905,020 | ) | ||||||||
7. Investment Transactions
The aggregate cost of purchases and proceeds from sales other than short-term obligations for the six months ended June 30, 2012, were $122,996,506 and $174,521,574, respectively.
8. Shareholder Concentration
At June 30, 2012, one unaffiliated shareholder account owned 20.5% of the outstanding shares of the Fund. The Fund has no knowledge about whether any portion of those shares was owned beneficially by such account. Affiliated shareholder accounts owned 58.3% of the outstanding shares of the Fund. Subscription and redemption activity by concentrated accounts may have a significant effect on the operations of the Fund.
9. Subsequent Events
Management has evaluated the events and transactions that have occurred through the date the financial statements were issued and noted no items requiring adjustment of the financial statements or additional disclosure.
24
Wanger International 2012 Semiannual Report
Notes to Financial Statements, continued (Unaudited)
10. Information Regarding Pending and Settled Legal Proceedings
Ameriprise Financial and certain of its affiliates have historically been involved in a number of legal, arbitration and regulatory proceedings, including routine litigation, class actions, and governmental actions, concerning matters arising in connection with the conduct of their business activities. Ameriprise Financial believes that the Funds are not currently the subject of, and that neither Ameriprise Financial nor any of its affiliates are the subject of, any pending legal, arbitration or regulatory proceedings that are likely to have a material adverse effect on the Funds or the ability of Ameriprise Financial or its affiliates to perform under their contracts with the Funds. Ameriprise Financial is required to make 10-Q, 10-K and, as necessary, 8-K filings with the Securities and Exchange Commission on legal and regulatory matters that relate to Ameriprise Financial and its affiliates. Copies of these filings may be obtained by accessing the SEC website at www.sec.gov.
There can be no assurance that these matters, or the adverse publicity associated with them, will not result in increased fund redemptions, reduced sale of fund shares or other adverse consequences to the Funds. Further, although we believe proceedings are not likely to have a material adverse effect on the Funds or the ability of Ameriprise Financial or its affiliates to perform under their contracts with the Funds, these proceedings are subject to uncertainties and, as such, we are unable to estimate the possible loss or range of loss that may result. An adverse outcome in one or more of these proceedings could result in adverse judgments, settlements, fines, penalties or other relief that could have a material adverse effect on the consolidated financial condition or results of operations of Ameriprise Financial.
25
Wanger International 2012 Semiannual Report
Board Approval of the Advisory Agreement
Wanger Advisors Trust (the "Trust") has an investment advisory agreement (the "Advisory Agreement") with Columbia Wanger Asset Management, LLC ("Columbia WAM") under which Columbia WAM manages the Wanger Funds (each, a "Fund", and together, the "Funds"). More than 75% of the trustees of the Trust (the "Trustees") are persons who have no direct or indirect interest in the Advisory Agreement and are not "interested persons" (as defined in the Investment Company Act of 1940, as amended (the "1940 Act")) of the Trust (the "Independent Trustees"). The Trustees oversee the management of each Fund and, as required by law, determine at least annually whether to continue the Advisory Agreement for each Fund.
The Contract Committee (the "Committee") of the Board of Trustees (the "Board"), which is comprised solely of Independent Trustees, makes recommendations to the Board regarding any proposed continuation of the Advisory Agreement. After the Committee has made its recommendations, the full Board determines whether to approve continuation of the Advisory Agreement. The Board also considers matters bearing on the Advisory Agreement at its various meetings throughout the year, meets at least quarterly with Columbia WAM's portfolio managers and receives monthly reports from Columbia WAM on the performance of the Funds.
In connection with their most recent consideration of the Advisory Agreement for each Fund, the Committee and all Trustees received and reviewed a substantial amount of information provided by Columbia WAM, Columbia Management Investment Advisers, LLC ("Columbia Management") and Ameriprise Financial, Inc. ("Ameriprise"), in response to written requests from the Independent Trustees and their independent legal counsel. Throughout the process, the Trustees had numerous opportunities to ask questions of and request additional materials from Columbia WAM, Columbia Management and Ameriprise.
During each meeting at which the Committee or the Independent Trustees considered the Advisory Agreement, they met in executive session with their independent legal counsel. The Committee also met with representatives of Columbia WAM, Columbia Management and Ameriprise on several occasions. In all, the Committee convened formally on six separate occasions to consider the continuation of the Advisory Agreement. The Board and/or some or all of the Independent Trustees met on other occasions to receive the Committee's status reports, receive presentations from Columbia WAM, Columbia Management and Ameriprise representatives, and to discuss outstanding issues. In addition, the Investment Performance Analysis Committee of the Board, also comprised exclusively of Independent Trustees, reviewed the performance of the Funds and presented its findings to the Board and the Committee throughout the year. The Compliance Committee of the Board also provided information to the Committee with respect to relevant matters.
The Trustees reviewed the Advisory Agreement, as well as certain information obtained through Columbia WAM's, Columbia Management's and Ameriprise's responses to independent legal counsel's questionnaires. In addition, the Trustees reviewed the Management Fee Evaluation dated June 2012 (the "Fee Evaluation") prepared by the Trust's chief compliance officer, senior vice president and general counsel at the request of the Board.
The materials reviewed by the Committee and the Trustees included, among other items, (i) information on the investment performance of each Fund and of independently selected peer groups of funds and of the Funds' performance benchmarks over various time periods, (ii) information on each Fund's advisory fees and other expenses, including information comparing the Fund's fees and expenses to those of peer groups of funds and information about any applicable expense limitations and fee breakpoints, (iii) data on sales and redemptions of Fund shares, and (iv) information on the profitability to Columbia WAM and Ameriprise, as well as potential "fall-out" or ancillary benefits that Columbia WAM and its affiliates may receive as a result of their relationships with the Funds. The Trustees also considered other information such as (i) Columbia WAM's financial condition, (ii) each Fund's investment objective and strategy, (iii) the size, education and experience of Columbia WAM's investment staff and its use of technology, external research and trading cost measurement tools, (iv) the portfolio manager compensation framework, (v) the allocation of the Funds' brokerage, and the use of "soft" commission dollars to pay for research products and services, (vi) Columbia WAM's risk management program, and (vii) the resources devoted to, and the record of compliance with, the Funds' investment policies and restrictions, policies on personal securities transactions and other compliance policies.
At a meeting held on June 6, 2012, upon recommendations of the Committee, the Board of Trustees unanimously approved the continuation of the Advisory Agreement.
In considering the continuation of the Advisory Agreement, the Trustees reviewed and analyzed various factors that they determined were relevant, none of which by itself was considered dispositive. The material factors and conclusions that formed the basis for the Trustees' determination to approve the continuation of the Advisory Agreement are discussed below.
Nature, quality and extent of services. The Trustees reviewed the nature, quality and extent of the services provided by Columbia WAM and its affiliates to Wanger International under the Advisory Agreement, taking into account the investment objective and strategy of the Fund and knowledge gained from meetings with management, which were held on at least a quarterly basis. In addition, the Trustees reviewed the available resources and key personnel of Columbia WAM and its affiliates, especially those providing investment management services to the Funds. The Trustees also considered other services provided to the Fund by Columbia WAM and its affiliates, including: managing the execution of portfolio transactions and selecting broker-dealers for those transactions; monitoring adherence to the Fund's investment restrictions; producing shareholder reports; providing support services for the Board and committees of the Board; managing the Fund's securities lending program; communicating with shareholders; serving as the Fund's administrator; and overseeing the activities of the Fund's other service providers, including monitoring for compliance with various policies and procedures as well as applicable securities laws and regulations.
The Trustees concluded that the nature, quality and extent of the services provided by Columbia WAM and its affiliates to the Fund under the Advisory Agreement were appropriate for the Fund and that the Fund was likely to benefit from the continued provision of those services by Columbia WAM. They also concluded that Columbia WAM currently had sufficient personnel, with appropriate education and experience, to serve the Fund effectively, and that the firm had demonstrated its continuing ability to attract and retain well-qualified personnel. In addition, they took note of the quality of Columbia WAM's compliance record.
Performance of the Fund. The Trustees received and considered detailed performance information at various meetings of the Board, the Committee and the Investment Performance Analysis Committee of the Board throughout the year. They reviewed information comparing each Fund's performance with that of its benchmark(s) and with the performance of comparable funds and peer groups as identified by Lipper Inc. ("Lipper") and Morningstar, Inc. ("Morningstar"). The Trustees evaluated the performance of Wanger International over various time periods, including over the one-, three- and five-year periods ending December 31, 2011. The Trustees also considered peer performance rankings for similar timeframes, although they focused more on the five-year period.
The Trustees noted that Wanger International had delivered excellent results over the past five years according to both Morningstar and Lipper and did so while investors to less risk than competing funds, according to Morningstar. The Trustees concluded that Fund performance was satisfactory.
The Trustees concluded that, although past performance is not necessarily indicative of future results, the strong overall performance of Wanger International was an important factor in their evaluation of the quality of services provided by Columbia WAM under the Advisory Agreement for the Fund.
Costs of Services and Profits Realized by Columbia WAM. At various Committee and Board meetings, the Trustees examined detailed information on the fees and expenses of each Fund in comparison to information for comparable funds provided by Lipper and Morningstar. The Trustees reviewed data from Lipper and Morningstar and noted that Wanger International had lower total net operating expenses than its Lipper and Morningstar peer group medians. As noted in the Fee Evaluation, the actual advisory fees paid by Wanger International were higher than the median
26
Wanger International 2012 Semiannual Report
Board Approval of the Advisory Agreement
advisory fee of the Fund's Lipper peer group but lower than the Morningstar peer group. The Trustees reviewed the observations in the Fee Evaluation and noted that the Fund was assessed by Morningstar and Lipper in relation to peers selected only from the variable annuity universe.
The Trustees also reviewed the advisory fee rates charged by Columbia WAM for managing other investment companies (including the Columbia Acorn Funds), sub-advised funds and other institutional separate accounts, as detailed in materials provided to the Committee by Columbia WAM and in the Fee Evaluation. The Trustees noted that the Fund's advisory fees were generally comparable to Columbia Acorn International Fund's advisory fees at the same asset level. The Trustees also examined Columbia WAM's institutional separate account fees for various investment strategies; in some cases those fees were higher than the advisory fees charged to the Fund, and in a few instances the fees were lower. The Trustees noted that Columbia WAM performs significant additional services for the Fund that it does not provide to sub-advised funds or non-mutual fund clients, including administrative services, oversight of the Fund's other service providers, Trustee support, regulatory compliance and numerous other services, and that, in servicing the Fund, Columbia WAM assumes many legal and business risks that it does not assume in servicing many of its non-fund clients.
The Trustees concluded that the rate of advisory fees payable to Columbia WAM was reasonable in relation to the nature and quality of the services to be provided. The Trustees also concluded that the Fund's overall expense ratio was reasonable, considering the quality of the services provided by Columbia WAM and its affiliates and the investment performance of the Fund.
The Trustees reviewed the analysis of the historic profitability of Columbia WAM in serving as the Fund's investment adviser and of Columbia WAM and its affiliates in their relationships with each Fund. The Committee and Trustees met with representatives from Ameriprise to discuss its methodologies for calculating profitability and allocating costs. They considered that Ameriprise calculated profitability and allocated costs on a contract-by-contract and fund-by-fund basis. The Trustees also considered the methodology used by Columbia WAM and Ameriprise in determining compensation payable to portfolio managers and the competitive market for investment management talent. The Trustees were also provided with profitability information from Lipper, which compared Columbia WAM's profitability to other similar investment advisers in the mutual fund industry. The Trustees concluded that Columbia WAM's and its affiliates' profits were within a reasonable range of those of competitors with similar business models. The Trustees discussed, however, that profitability comparisons among fund managers may not always be meaningful due to the lack of consistency in data, small number of publicly-owned managers, and the fact that profitability of any investment manager is affected by numerous factors, including its particular organizational structure, the types of funds and other accounts managed, other lines of business, expense allocation methodology, capital structure and cost of capital.
Economies of Scale. At various Committee and Board meetings and other informal meetings, the Trustees considered information about the extent to which Columbia WAM realizes economies of scale in connection with an increase in Fund assets. The Trustees also discussed the potential for Fund sales growth. The Trustees noted that the advisory fee schedule for each Fund includes breakpoints in the rate of fees at various asset levels. The Trustees concluded that the fee structure of the Fund was reflective of a sharing between Columbia WAM and the Fund of economies of scale.
Other Benefits to Columbia WAM. The Trustees also reviewed benefits that accrue to Columbia WAM and its affiliates from their relationships with the Fund, based upon information provided to them by Ameriprise and as outlined in the Fee Evaluation. They noted that the Fund's transfer agency services are performed by Columbia Management Investment Services Corp., an affiliate of Ameriprise, which receives compensation from the Funds for its services provided. They considered that an affiliate of Ameriprise, Columbia Management Investment Distributors, Inc. ("CMID"), serves as the Fund's distributor under a distribution agreement and receives no fees for its services. In addition, Columbia Management provides sub-administration services to the Fund. The Committee received information regarding the profitability of each Fund agreement with Columbia WAM affiliates. The Committee and the Board also reviewed information about and discussed the capabilities of each affiliated entity in performing its duties.
The Trustees considered other ways that the Fund and Columbia WAM may potentially benefit from their relationship with each other. For example, the Trustees considered Columbia WAM's use of commissions paid by the Fund on its portfolio brokerage transactions to obtain research products and services benefiting the Funds and/or other clients of Columbia WAM. The Committee reviewed Columbia WAM's annual "soft dollar" report and met with representatives from Columbia WAM to review Columbia WAM's soft dollar spending. The Committee also considered that the Compliance Committee of the Board regularly reviewed third-party prepared reports that evaluated the quality of Columbia WAM's execution of the Fund's portfolio transactions. The Trustees noted that these reports showed that Columbia WAM's execution capabilities were generally better than industry peers. The Trustees determined that Columbia WAM's use of the Fund's "soft" commission dollars to obtain research products and services was consistent with current regulatory requirements and guidance. They also concluded that Columbia WAM benefits from the receipt of proprietary research products and services acquired through commissions paid on portfolio transactions of the Fund, and that the Fund benefits from Columbia WAM's receipt of those products and services as well as research products and services acquired through commissions paid by other clients of Columbia WAM.
After full consideration of the above factors, as well as other factors that were instructive in evaluating the Advisory Agreement, the Trustees, including the Independent Trustees, concluded that the continuation of the Advisory Agreement was in the best interest of the Fund. On June 6, 2012, the Trustees approved continuation of the Advisory Agreement through July 31, 2013.
27
Wanger International 2012 Semiannual Report

Columbia Wanger Funds
Trustees
Laura M. Born
Chair of the Board
Steven N. Kaplan
Vice Chair of the Board
Michelle L. Collins
Maureen M. Culhane
Margaret M. Eisen
John C. Heaton
Charles P. McQuaid
David J. Rudis
David B. Small
Ralph Wanger (Trustee Emeritus)
Officers
Charles P. McQuaid
President
Ben Andrews
Vice President
Robert A. Chalupnik
Vice President
Michael G. Clarke
Assistant Treasurer
Joseph F. DiMaria
Assistant Treasurer
P. Zachary Egan
Vice President
Fritz Kaegi
Vice President
John M. Kunka
Assistant Treasurer
Stephen Kusmierczak
Vice President
Joseph C. LaPalm
Vice President
Bruce H. Lauer
Vice President, Secretary and Treasurer
Louis J. Mendes III
Vice President
Robert A. Mohn
Vice President
Christopher J. Olson
Vice President
Christopher O. Petersen
Assistant Secretary
Scott R. Plummer
Assistant Secretary
Linda K. Roth-Wiszowaty
Assistant Secretary
Robert P. Scales
Chief Compliance Officer, Chief Legal Officer, Senior Vice President and
General Counsel
Andreas Waldburg-Wolfegg
Vice President
Investment Manager
Columbia Wanger Asset Management, LLC
227 West Monroe Street, Suite 3000
Chicago, Illinois 60606
1-888-4-WANGER
(1-888-492-6437)
Transfer Agent,
Dividend Disbursing Agent
Columbia Management Investment Services Corp.
P.O. Box 8081
Boston, Massachusetts
02266-8081
Distributor
Columbia Management Investment Distributors, Inc.
225 Franklin Street
Boston, Massachusetts
02110
Legal Counsel to the Funds
Perkins Coie LLP
Washington, DC
Legal Counsel to the Independent Trustees
Drinker Biddle & Reath LLP
Philadelphia, Pennsylvania
Independent Registered Public Accounting Firm
PricewaterhouseCoopers LLP
Chicago, Illinois
This document contains Global Industry Classification Standard data. The Global Industry Classification Standard ("GICS") was developed by and is the exclusive property and a service mark of MSCI Inc. ("MSCI") and Standard & Poor's Financial Services LLC ("S&P") and is licensed for use by Columbia Wanger Asset Management, LLC ("CWAM"). Neither MSCI, S&P, nor any other party involved in making or compiling the GICS or any GICS classifications makes any express or implied warranties or representations with respect to such standard or classification (or the results to be obtained by the use thereof), and all such parties hereby expressly disclaim all warranties of originality, accuracy, completeness, merchantability and fitness for a particular purpose with respect to any of such standard or classification. Without limiting any of the foregoing, in no event shall MSCI, S&P, any of their affiliates or any third party involved in making or compiling the GICS or any GICS classifications have any liability for any direct, indirect, special, punitive, consequential or any other damages (including lost profits) even if notified of the possibility of such damages.
This report, including the schedules of investments and financial statements, is submitted for the general information of the shareholders of the Wanger Advisors Trust.
A description of the Fund's proxy voting policies and procedures and a copy of the Fund's voting record for the most recent 12-month period ended June 30 are available (i) on the Securities and Exchange Commission's website at www.sec.gov, and (ii) without charge, upon request, by calling 888-492-6437.
The Fund files a complete schedule of portfolio holdings with the SEC for the first and third quarters of each fiscal year on Form N-Q. The Fund's Form N-Q is available on the SEC's website at www.sec.gov and may be reviewed and copied at the SEC's Public Reference Room in Washington, D.C. Information on the operation of the Pubic Reference Room may be obtained by calling 800-SEC-0330. The Fund's complete portfolio holdings are disclosed at www.columbiamanagement.com approximately 30 to 40 days after each month-end.
28
Columbia Wanger Funds
© 2012 Columbia Management Investment Advisers, LLC. All rights reserved.
C-1460 C (8/12) 142480
Wanger International Select
2012 Semiannual Report
Not FDIC insured • No bank guarantee • May lose value

Wanger International Select
2012 Semiannual Report
Table of Contents
| 2 | Understanding Your Expenses | ||||||
| 3 | Genetic Science | ||||||
| 6 | Performance Review | ||||||
| 8 | Statement of Investments | ||||||
| 13 | Statement of Assets and Liabilities | ||||||
| 13 | Statement of Operations | ||||||
| 14 | Statement of Changes in Net Assets | ||||||
| 15 | Financial Highlights | ||||||
| 16 | Notes to Financial Statements | ||||||
| 20 | Board Approval of the Advisory Agreement | ||||||
Columbia Wanger Asset Management, LLC (CWAM) is one of the leading global small- and mid-cap equity managers in the United States with over 40 years of small- and mid-cap investment experience. As of June 30, 2012, CWAM managed $31.0 billion in assets. CWAM is the investment manager to Wanger USA, Wanger International, Wanger Select and Wanger International Select (together, the Columbia Wanger Funds) and the Columbia Acorn Family of Funds.
Investors should consider the investment objectives, risks, charges and expenses of a mutual fund carefully before investing. For a free prospectus, which contains this and other important information about the Fund, contact your financial adviser or insurance company or contact 1-888-4-WANGER. Read the prospectus carefully before investing.
An important note: Columbia Wanger Funds are available for purchase through variable annuity contracts and variable life insurance policies offered by the separate accounts of participating insurance companies and qualified pension or retirement plans.
The views expressed in "Genetic Science" and in the Performance Review reflect the current views of the respective authors. These views are not guarantees of future performance and involve certain risks, uncertainties and assumptions that are difficult to predict so actual outcomes and results may differ significantly from the views expressed. These views are subject to change at any time based upon economic, market or other conditions and the respective parties disclaim any responsibility to update such views. These views may not be relied on as investment advice and, because investment decisions for a Columbia Wanger Fund are based on numerous factors, may not be relied on as an indication of trading intent on behalf of any particular Columbia Wanger Fund. References to specific company securities should not be construed as a recommendation or investment advice.
1
Wanger International Select 2012 Semiannual Report
Understanding Your Expenses
As a shareholder, you incur three types of costs. There are transaction costs, which generally include sales charges on purchases and may include redemption fees. There are also ongoing costs, which generally include management fees and other Fund expenses. Lastly, there may be additional fees or charges imposed by the insurance company that sponsors your variable annuity and/or variable life insurance product. The following information is intended to help you understand your ongoing costs (in dollars) of investing in the Fund and to help you compare these costs with the ongoing costs of investing in other mutual funds.
Analyzing your Fund's expenses
To illustrate these ongoing costs, we have provided an example and calculated the expenses paid by investors in the Fund during the period. The actual and hypothetical information in the table below is based on an initial investment of $1,000 at the beginning of the period indicated and held for the entire period. Expense information is calculated two ways and each method provides you with different information. The amount listed in the "Actual" column is calculated using the Fund's actual operating expenses and total return for the period. You may use the Actual information, together with the amount invested, to estimate the expenses that you paid over the period. Simply divide your account value by $1,000 (for example, an $8,600 account value divided by $1,000 = 8.6), then multiply the results by the expenses paid during the period under the Actual column. The amount listed in the "Hypothetical" column assumes a 5% annual rate of return before expenses (which is not the Fund's actual return) and then applies the Fund's actual expense ratio for the period to the hypothetical return. You should not use the hypothetical account values and expenses to estimate either your actual account balance at the end of the period or the expenses you paid during the period. See "Compare with other funds" below for details on how to use the hypothetical data.
Compare with other funds
Since all mutual funds are required to include the same hypothetical calculations about expenses in shareholder reports, you can use this information to compare the ongoing cost of investing in the Fund with other funds. To do so, compare the hypothetical example with the 5% hypothetical examples that appear in the shareholder reports of other funds. As you compare hypothetical examples of other funds, it is important to note that hypothetical examples are meant to highlight the ongoing cost of investing in a fund only and do not reflect any transaction costs, such as sales charges, redemption or exchange fees. Therefore, the hypothetical calculations are useful in comparing ongoing costs only, and will not help you determine the relative total costs of owning different funds. If transaction costs were included in these calculations, your costs would be higher.
January 1, 2012 – June 30, 2012
| Account value at the beginning of the period ($) | Account value at the end of the period ($) | Expenses paid during period ($) | Fund's annualized expense ratio (%)* | ||||||||||||||||||||||||||||
| Actual | Hypothetical | Actual | Hypothetical | Actual | Hypothetical | ||||||||||||||||||||||||||
| Wanger International Select | 1,000.00 | 1,000.00 | 1,099.10 | 1,018.05 | 7.15 | 6.87 | 1.37 | ||||||||||||||||||||||||
*Expenses paid during the period are equal to the Fund's annualized expense ratio, multiplied by the average account value over the period, then multiplied by the number of days in the Fund's most recent fiscal half-year and divided by 366.
Had the investment manager not waived fees or reimbursed a portion of expenses, account value at the end of the period would have been reduced.
It is important to note that the expense amounts shown in the table are meant to highlight only ongoing costs of investing in the Fund. Expenses paid during the period do not include any insurance charges imposed by your insurance company's separate account. The hypothetical example provided is useful in comparing ongoing costs only and will not help you determine the relative total costs of owning different funds whose shareholders may incur transaction costs.
2
Wanger International Select 2012 Semiannual Report

Genetic Science
Genetic theory began with Gregor Mendel, a friar who in the middle 19th century meticulously bred different types of peas and tracked traits of offspring. He discovered recessive genes, which are carried by one generation but expressed in the next if both parents have that gene. Human genetic studies began a few decades later. In 1872, Huntington's disease was the first genetic disease identified by scientific research.1
Humans normally have 23 pairs of chromosomes, with half of each pair inherited from each parent. The chromosomes combined consist of over 20,000 genes. These genes ultimately consist of over 3 billion units of four different nitrogenous bases, labeled by their first letters: A, G, C and T.2
DNA, the double helix structure of bases assembled into genes, was discovered by James Watson and Francis Crick in 1953. Various genes were identified over the next several decades. The Human Genome Project, an effort to sequence and identify all genes and bases in human DNA, started in 1990. After $2.7 billion of expenditures over 13 years, a composite genome from three people was specified.3
Gene Sequencing
Kevin Davies' book, The $1,000 Genome, discusses the incredible progress made in gene sequencing technology. First generation sequencing used bacteria to purify and grow DNA fragments utilizing equipment made by Applied Biosystems, which dominated the market for 15 years.4 Hundreds of machines labored for years to complete the Human Genome Project sequencing, at a direct cost of tens of millions of dollars.5
A company called 454 Life Sciences, later acquired by Roche, developed a second generation sequencer. Utilizing a semiconductor chip with thousands of wells, DNA fragments were sequenced in parallel via real-time image processing. First shipped in 2005, the $500,000 machines then sold as fast as they could be built. James Watson's genome was sequenced in 2007 at a cost of $1 million.6
In 2006, Solexa shipped a sequencing machine that also sequenced in parallel, but had throughput and cost advantages. Illumina bought Solexa later that year. By 2007, the equipment could sequence a human's DNA at a cost of $100,000.7 Illumina subsequently created faster and more accurate machines. In early 2010, it pushed the cost of human genome sequencing down to $10,000.8 Service company Knome currently offers full genome sequencing via Illumina equipment, plus interpretation of results, for $4,998.9 Roche recently attempted to acquire Illumina.10
Third generation machines, often utilizing nanotechnology as well as parallel sequencing and faster data processing chips, should cut the cost of sequencing a human genome to well below $1,000, Davies notes.11 Pacific Biosciences of California claimed a potential 30,000-fold speed increase via sequencing in real time as DNA is replicated. Another company, Oxford Nanopore, was working on sequencing via measurement of electric current passing through bases.12 Ion Torrent Systems measures the pH of bases streaming through pores.13
Davies calculated that the cost of DNA sequencing fell 50% a year through 2005, and then by an amazing 90% a year due to a series of disruptive technologies.14 He does not predict when a hand-held "Star Trek Medical Tricorder," capable of reading the DNA of a patient and his disease and then prescribing personalized medicine, will be available, but the world seems headed in that direction.
Personal Genomic Services
It doesn't take a full genome sequence to determine genetic characteristics such as ancestry and possible risks of disease. In November 2007, deCODEme and 23andMe launched competing $1,000 services. Processing cheek swab or saliva DNA on equipment utilizing specialized chips, they sampled up to 600,000 bases, 0.02% of the total, and looked for differences in bases between people, called single nucleotide polymorphisms (SNPs).15 By correlating SNPs with known ancestry and disease databases, the companies provided statistical probabilities to clients based on their DNA samples.
Since 2007, deCODEme has had financial problems; it currently offers the service for $1,100, including updates.16 23andMe currently charges $207 for an initial sampling and a one-year subscription for updates. According to its website, 23andMe provides probabilities for 118 diseases, shows likely responses to 20 drugs, and determines whether clients' children could be at risk for any of 44 inherited diseases.17 Navigenics has also entered the market and provides genetic counseling as well as data.
The personal genomic services companies update disease probabilities as additional data is analyzed. Probabilities can and do change, sometimes drastically, as new correlations and additional SNPs are incorporated into a person's profile. It's somewhat disconcerting that, according to Davies, Navigenics and 23andMe disagree qualitatively on one-third of diseases.18
As more of the population gets increasingly more genes sequenced, more data becomes available and the relationships between genes, health and responses to drugs become better known. Full genome sequencing will likely show an average of three million SNPs per person,19 creating an enormous data management problem as well as new understandings of relationships between genes and diseases.
Limits to Predicting Diseases
Recent research published in Science Translational Medicine titled, "The Predictive Capacity of Personal Genome Sequencing,"20 ingeniously addressed the theoretical potential for genes to predict common diseases. The underlying question was, of course, what are the odds of someone with a specific genome getting
3
Wanger International Select 2012 Semiannual Report
a specific disease? According to the study, the answer can be determined by studying pairs of people with nearly identical genomes: identical twins. By comparing histories of 24 common diseases among identical twins versus fraternal twins, genetic determination of diseases were inferred.
The study concluded that for 19 of the 24 diseases a negative test score (below average risk) will hardly be reassuring because the odds of getting the disease will still be substantial, at 50% to 80% of the general population's odds. Over half of the ultimate victims of 12 diseases would have tested at below average risk, receiving a false sense of security. However, there was one disease category tested in the study, Alzheimer's disease, in which a negative test result might indicate as little as a 12% relative risk of disease compared to the general population.
Those testing positive for Alzheimer's, type 1 diabetes, male coronary heart disease and thyroid autoimmunity could account for over 75% of the patients developing the diseases. The study suggested that the utility of genetic tests will depend on the results of the individual tested, and cautions against complacency and unwise lifestyle choices for those testing negative.
I agree that some subscribers to personal genetics services could obtain valuable results. If, for example, someone learned that his probability of developing glaucoma was much higher than the 4% probability for the average person, the subscriber would more likely get regular glaucoma testing. This is of some value, assuming the stated odds are indeed properly calibrated, which may take years to confirm.
Inherited Diseases
Some inherited diseases, including cystic fibrosis, Tay-Sachs disease and sickle cell anemia, occur only when single defective genes are inherited from each parent. Other single gene diseases, such as Huntington's, are inherited with 50% odds of getting the gene and disease if just one parent is afflicted.
Dozens of rare genetic diseases affect newborns, many of which can be addressed by diet or vitamins.21 Quick diagnosis is often crucial as permanent damage can occur otherwise. As of March 2010, newborns were tested for 29 genetic diseases in most states.22
Sometimes only a tendency to contract a disease is inherited. One version of a specific gene mutation implies a 65% to 85% lifetime probability of a woman developing breast cancer, while another version implies a 45% to 85% probability.23 However, only 5% to 10% of breast cancer patients have those genes.24 Others get the disease with no apparent genetic correlation. Having those genes is a cause for concern, but not having them should not provide a lot of comfort.
Personalized Medicine
In 2003, Allen Roses, vice-president of genetics for GlaxoSmithKline, shocked consumers by stating that more than 90% of drugs work in just 30% to 50% of people.25 Roses was pushing the drug industry to pursue genetic testing rather than trial and error to determine which drugs work for a specific individual. Matt Ridley, in the 2006 version of his book, Genome, stated, "genetic diagnosis followed by conventional cure is probably the genome's greatest boon to medicine."26
Indeed, the lung cancer drug Iressa was approved in 2003 and creates a "miraculous response" in the 10% of patients with a specific genetic mutation of the disease. Herceptin was approved in 2006 to target the 25% of breast cancer patients who are afflicted with a specific genetic version of that disease. Likewise, targeted cancer drugs such as Avastin, Tarceva and Erbitux, are prescribed after genetic testing.27
On January 31, 2012, Kalydeco was approved to treat 1,200 cystic fibrosis patients, 4% of the total, who have a specific gene defect. It is the first drug to treat the defect rather than the symptoms of the disease, and has been termed "transformational" for those who can use it.28 The Cystic Fibrosis Foundation spurred development of the drug by helping to fund the development effort, and aided the process by creating a registry that includes the genetic characteristics of the disease for 90% of American patients.
Some drugs appear to work for most people, but have widely varying optimal dosages. Variations in genes largely determine how quickly people metabolize drugs.29 "Unanticipated drug responses are estimated to result in two million hospitalizations and 100,000 deaths in the United States each year," writes Nicholas Gillham in his book, Genes, Chromosomes, and Disease.30
In the case of blood thinner warfarin (brand name Coumadin), patients exhibit a tenfold range in ability to metabolize the drug.31 Too little of it can result in a stroke, but too much can cause bleeding and hemorrhaging.32 The FDA now provides dosage information on the drug's label based on variants of two genes.33 About 10% of labels for FDA-approved drugs now have pharmacogenomics information.34
Investment Implications
Genetic science is rapidly advancing and will likely revolutionize many aspects of medical care. It is starting to be helpful in predicting susceptibility to common diseases, but will likely be more valuable in identifying risks of inherited diseases and in determining appropriate drug usage and dosage. Given the complexity of the subject, there will likely be increasing demands for genetic counselors.
There exists uncertainty regarding how the FDA and others will regulate genetic tests, as well as the extent to which genetic discoveries will be patentable. On the investment front, we have looked for and invested in opportunities created by genetic science. We've focused on a number of biotechnology and drug companies addressing personalized medicine and niche
4
Wanger International Select 2012 Semiannual Report
orphan diseases and we will continue to look for additional opportunities.


Charles P. McQuaid
President and Chief Investment Officer
Columbia Wanger Asset Management, LLC
The information and data provided in this analysis are derived from sources that we deem to be reliable and accurate. These views are not guarantees of future performance and involve certain risks, uncertainties and assumptions that are difficult to predict so actual outcomes and results may differ significantly from the views expressed. The views/opinions expressed in this essay are those of the author and not of the Wanger Advisors Trust Board, are subject to change at any time based upon economic, market or other conditions, may differ from views expressed by other Columbia Management associates and the respective parties disclaim any responsibility to update such views. These views may not be relied on as investment advice and, because investment decisions for a Columbia Wanger Fund are based on numerous factors, may not be relied on as an indication of trading intent on behalf of any particular Columbia Wanger Fund.
1 Gillham, Nicholas Wright, Genes, Chromosomes, and Disease, (Upper Saddle River, New Jersey, FT Press Science 2011) p. 5.
2 Davies, Kevin, The $1,000 Genome, (New York, New York, Free Press 2010) p. 1, 23.
3 Ibid., p. 9-11.
4 Ibid., p. 79.
5 Ibid., p. 90.
6 Ibid., p. 94.
7 Ibid., p. 111.
8 Gillham, Nicholas Wright, op. cit., p. 244.
9 Davies, Kevin, op. cit., p. 209. www.knome.com.
10 Falconi, Marta, "Roche To Return Tendered Illumina Shares to Shareholders," Dow Jones News Service, April 23, 2012.
11 Davies, Kevin, op. cit., p. 231.
12 Davies, Kevin, op. cit., p. 239.
13 Ibid., p. 245-246.
14 Ibid., p. 133. Disruptive technologies refers to making much more than incremental advances by utilizing a whole new or additional approach. In this context, the parallel sequencing and use of other detection mechanisms such as pH or electric conductivity have caused the cost of sequencing to plunge far faster than a regular learning curve might suggest.
15 Ibid., p. 31-32.
16 Ibid., p. 55,63. www.decodeme.com.
17 www.23andme.com.
18 Davies, Kevin, op. cit., p. 149.
19 Ibid., p. 23.
20 Roberts, Nicholas J., and Vogelstein, Joshua T., et al, "The Predictive Capacity of Personal Genome Sequencing," Science Translational Medicine, Rapid Publication, April 2, 2012, stm.sciencemag.org.
21 Gillham, Nicholas Wright, op. cit., p. 204.
22 Ibid., p. 201.
23 Ibid., p. 184.
24 Ibid., p. 116.
25 Connor, Steve, "Glaxo Chief: Our Drugs Do Not Work On Most Patients," The Independent, December 8, 2003.
26 Ridley, Matt, Genome, (New York, New York, First Harper Perennial, 2006) p. 257.
27 Davies, Kevin, op. cit., p. 255-256.
28 Usdin, Steve, "Product Discovery & Development: Kalydescopic Vision," BioCentury, March 5, 2012, Volume 20, Number 10, p. A2.
29 Davies, Kevin, op. cit., p. 257.
30 Gillham, Nicholas Wright, op. cit., p. 237.
31 Davies, Kevin, op. cit., p. 257.
32 Gillham, Nicholas Wright, op. cit., p. 238.
33 Davies, Kevin, op. cit., p. 257.
34 Hamburg, M.D., Margaret A., and Collins, M.D., Ph.D., Francis S., "The Path to Personalized Medicine," New England Journal of Medicine, July 22, 2010, Volume 363, p. 301-304, www.nejm.org.
5
Wanger International Select 2012 Semiannual Report

Performance Review Wanger International Select

Christopher J. Olson
Portfolio Manager
Performance data shown represents past performance and is not a guarantee of future results. The investment return and principal value will fluctuate so that shares, when redeemed, may be worth more or less than the original cost. Current performance may be lower or higher than the performance data shown. Please visit columbiamanagement.com for most recent month-end performance updates.
Wanger International Select ended the semiannual period through June 30, 2012, up 9.91%, strongly outperforming the 3.47% gain of its primary benchmark, the S&P Developed Ex-U.S. Between $2B and $10B Index.
Financial stocks provided the biggest boost to Fund gains relative to the benchmark for the half year. Singapore's Ascendas REIT, Mapletree Industrial Trust and Mapletree Logistics Trust each had gains of 20% or more for the period. These industrial property landlords continue to benefit from a resilient Singaporean economic outlook and investor interest in their strong dividend yields. Japan's Seven Bank, a provider of ATM processing services, was up 34% for the half year as its ATM expansion within Japan benefited the company's stock. Rand Merchant Insurance, a South African insurance company, was up 31% for the half year.
Fund holdings in the telecom services sector also performed strongly. Far EasTone Telecom, Taiwan's third largest mobile operator, ended the half year up 16%. The company benefited from accelerated smartphone sales that are driving increased data usage. The second largest mobile operator in Taiwan, Taiwan Mobile, saw its stock fall in the first quarter of 2012, despite the company's improved earnings outlook, but investors returned in the second quarter after their brief flight to more cyclical names, giving the stock a 6% gain year to date.
Mining companies did not fare well in the first half of 2012 as fears of slower global growth decreased demand. The laggards included Indonesian gold miner Archipelago Resources, which was down 26% for the half year. In China, Zhaojin Mining Industry ended the half year off 15%. Northam Platinum, a South African platinum miner, was off 22% year to date. We opted to sell the Fund's position in Northam Platinum and invested the proceeds elsewhere.
While fears of a global recession eased in the first half of this six-month period, the second half saw renewed uncertainty regarding the financial stability of Europe and signs of slowing economic growth in China. We are also concerned and have maintained a focus on defensive, secular growth companies with good dividend yields and strong balance sheets. The Fund is underweight in areas such as Europe, the United Kingdom and Japan, where the concerns about global debt are greatest, and is overweight in Asia ex-Japan and emerging markets.
International investing involves special risks, including foreign taxation, currency risks, risks associated with possible differences in financial standards and other risks associated with future political and economic developments. Stocks of small- and mid-cap companies pose special risks, including possible illiquidity and greater price volatility than stocks of larger, more established companies. Investing in emerging markets may involve greater risks than investing in more developed countries.
Portfolio holdings are subject to change periodically and may not be representative of current holdings.
Fund's Positions in Mentioned Holdings
As a percentage of net assets, as of 6/30/12
| Far EasTone Telecom | 7.2 | % | |||||
| Ascendas REIT | 6.2 | % | |||||
| Mapletree Industrial Trust | 5.6 | % | |||||
| Seven Bank | 4.5 | % | |||||
| Rand Merchant Insurance | 4.2 | % | |||||
| Taiwan Mobile | 3.1 | % | |||||
| Mapletree Logistics Trust | 2.7 | % | |||||
| Archipelago Resources | 2.2 | % | |||||
| Zhaojin Mining Industry | 1.6 | % | |||||
6
Wanger International Select 2012 Semiannual Report
Growth of a $10,000 Investment in Wanger International Select
February 1, 1999 (inception date) through June 30, 2012
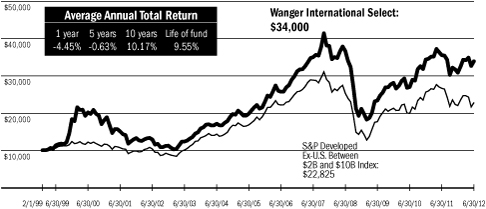
Performance data shown represents past performance and is not a guarantee of future results. The investment return and principal value will fluctuate so that shares, when redeemed, may be worth more or less than the original cost. Current performance may be lower or higher than the performance data shown. Performance results reflect any fee waivers or reimbursements of Fund expenses by the investment manager and/or any of its affiliates. Absent these fee waivers and/or expense reimbursement arrangements, performance results would have been lower. For daily and most recent month-end performance updates, please call 1-888-4-WANGER.
This graph compares the results of $10,000 invested in Wanger International Select on February 1, 1999 (the date the Fund began operations) through June 30, 2012, to the S&P Developed Ex-U.S. Between $2B and $10B Index, with dividends and capital gains reinvested. Although the index is provided for use in assessing the Fund's performance, the Fund's holdings may differ significantly from those in the index.
Top 10 Holdings
As a percentage of net assets, as of 6/30/12
| 1. Far EasTone Telecom (Taiwan) Taiwan's Third Largest Mobile Operator | 7.2 | % | |||||
| 2. Ascendas REIT (Singapore) Industrial Property Landlord | 6.2 | ||||||
| 3. Mapletree Industrial Trust (Singapore) Industrial Property Landlord | 5.6 | ||||||
| 4. Seven Bank (Japan) ATM Processing Services | 4.5 | ||||||
| 5. Rand Merchant Insurance (South Africa) Directly Sold Property & Casualty Insurance; Holdings in Other Insurers | 4.2 | ||||||
| 6. Fresnillo (Mexico) Silver & Metal Byproduct Mining in Mexico | 4.1 | ||||||
| 7. UGL (Australia) Engineering & Facilities Management | 3.9 | ||||||
| 8. Goldcorp (Canada) Gold Mining | 3.9 | ||||||
| 9. Wirecard (Germany) Online Payment Processing & Risk Management | 3.6 | ||||||
| 10. Commonwealth Property Office Fund (Australia) Australia Prime Office REIT | 3.3 | ||||||
Top 5 Countries
As a percentage of net assets, as of 6/30/12
| Singapore | 14.5 | % | |||||
| Taiwan | 12.2 | ||||||
| Australia | 11.8 | ||||||
| Japan | 10.3 | ||||||
| South Africa | 8.9 | ||||||
Results as of June 30, 2012
| 2nd quarter | Year to date | 1 year | 5 years | 10 years | |||||||||||||||||||
| Wanger International Select | -0.88 | % | 9.91 | % | -4.45 | % | -0.63 | % | 10.17 | % | |||||||||||||
| S&P Developed Ex-U.S. Between $2B and $10B Index* | -7.60 | 3.47 | -14.48 | -4.59 | 8.19 | ||||||||||||||||||
| MSCI EAFE Index | -7.13 | 2.96 | -13.83 | -6.10 | 5.14 | ||||||||||||||||||
| Lipper Variable Underlying International Growth Funds Index | -6.65 | 5.33 | -11.89 | -4.52 | 5.26 | ||||||||||||||||||
* The Fund's primary benchmark.
NAV as of 6/30/12: $18.07
Performance numbers reflect all Fund expenses but do not include any fees and expenses imposed under your variable annuity or life insurance policy or qualified pension or retirement plan. If performance included the effect of these additional charges, it would be lower.
The Fund's annual operating expense ratio of 1.40% is stated as of the Fund's prospectus dated May 1, 2012, and differences in expense ratios disclosed elsewhere in this report may result from including fee waivers and expense reimbursements as well as different time periods used in calculating the ratios.
All results shown assume reinvestment of distributions and do not reflect taxes that a shareholder would pay on Fund distributions or the sale of Fund shares.
The S&P Developed Ex-U.S. Between $2B and $10B Index is a subset of the broad market selected by the index sponsor representing the mid-cap developed market, excluding the United States. The MSCI Europe, Australasia, Far East (EAFE) Index (Net) is a capitalization-weighted index that tracks the total return of common stocks in 22 developed-market countries within Europe, Australasia and the Far East. The returns of the MSCI EAFE Index (Net) are presented net of the withholding tax rate applicable to foreign non-resident institutional investors in the foreign companies included in the index who do not benefit from double taxation treaties. The performance of the MSCI EAFE Index (Net) is provided to show how the Fund's performance compares to a widely recognized broad-based index of foreign market performance. The Lipper Variable Underlying International Growth Funds Index is an equally weighted representation of the 30 largest variable insurance underlying funds in the Lipper Variable Underlying International Growth Funds Classification, and shows how the Fund's performance compares with returns of an index of funds with similar investment objectives. Indexes are not managed and do not incur fees or expenses. It is not possible to invest directly in an index.
Lipper Inc., a widely respected data provider in the industry, calculates an average total return (assuming reinvestment of distributions) for mutual funds with investment objectives similar to those of the Fund. Lipper makes no adjustment for the effect of sales loads.
Portfolio characteristics and holdings are subject to change periodically and may not be representative of current characteristics and holdings.
7
Wanger International Select 2012 Semiannual Report
Wanger International Select
Statement of Investments (Unaudited) June 30, 2012
| Number of Shares | Value | ||||||||||
| Equities – 95.3% | |||||||||||
| Asia – 44.4% | |||||||||||
| Singapore – 14.5% | |||||||||||
| 885,000 | Ascendas REIT Industrial Property Landlord | $ | 1,509,765 | ||||||||
| 1,443,000 | Mapletree Industrial Trust Industrial Property Landlord | 1,382,307 | |||||||||
| 835,000 | Mapletree Logistics Trust Industrial Property Landlord | 649,244 | |||||||||
| 3,541,316 | |||||||||||
| Taiwan – 12.2% | |||||||||||
| 805,000 | Far EasTone Telecom Taiwan's Third Largest Mobile Operator | 1,751,407 | |||||||||
| 229,400 | Taiwan Mobile Taiwan's Second Largest Mobile Operator | 758,619 | |||||||||
| 256,000 | CTCI Corp International Engineering Firm | 479,310 | |||||||||
| 2,989,336 | |||||||||||
| Japan – 10.3% | |||||||||||
| 424,425 | Seven Bank ATM Processing Services | 1,089,917 | |||||||||
| 670 | Jupiter Telecommunications Largest Cable Service Provider in Japan | 683,118 | |||||||||
| 36,000 | Start Today Online Japanese Apparel Retailer | 503,082 | |||||||||
| 23,000 | Kansai Paint Paint Producer in Japan, India, China & Southeast Asia | 246,464 | |||||||||
| 100 | Asahi Diamond Industrial Consumable Diamond Tools | 1,148 | |||||||||
| 2,523,729 | |||||||||||
| China – 2.8% | |||||||||||
| 304,000 | Zhaojin Mining Industry Gold Mining & Refining in China | 399,720 | |||||||||
| 225,000 | Want Want Chinese Branded Consumer Food Company | 278,244 | |||||||||
| 100 | NetEase.com – ADR (a) Chinese Online Gaming Services | 5,885 | |||||||||
| 683,849 | |||||||||||
| Korea – 2.4% | |||||||||||
| 2,720 | NHN Korean Online Search Services | 596,589 | |||||||||
| Number of Shares | Value | ||||||||||
| Indonesia – 2.2% | |||||||||||
| 687,000 | Archipelago Resources (a) Gold Mining Projects in Indonesia, Vietnam & the Philippines | $ | 548,732 | ||||||||
| Total Asia | 10,883,551 | ||||||||||
| Other Countries – 29.0% | |||||||||||
| Australia – 11.8% | |||||||||||
| 74,000 | UGL Engineering & Facilities Management | 947,540 | |||||||||
| 764,043 | Commonwealth Property Office Fund Australia Prime Office REIT | 796,436 | |||||||||
| 207,900 | Challenger Financial Largest Annuity Provider | 698,267 | |||||||||
| 121,420 | IAG General Insurance Provider | 435,487 | |||||||||
| 2,877,730 | |||||||||||
| South Africa – 8.9% | |||||||||||
| 479,700 | Rand Merchant Insurance Directly Sold Property & Casualty Insurance; Holdings in Other Insurers | 1,021,679 | |||||||||
| 97,000 | Adcock Ingram Holdings Manufacturer of Pharmaceuticals & Medical Supplies | 713,010 | |||||||||
| 8,300 | Naspers Media in Africa, China, Russia & Other Emerging Markets | 443,323 | |||||||||
| 2,178,012 | |||||||||||
| Canada – 5.0% | |||||||||||
| 25,200 | Goldcorp Gold Mining | 947,016 | |||||||||
| 7,800 | CCL Industries Leading Global Label Manufacturer | 286,151 | |||||||||
| 1,233,167 | |||||||||||
| United States – 1.8% | |||||||||||
| 7,125 | Atwood Oceanics (a) Offshore Drilling Contractor | 269,610 | |||||||||
| 3,600 | SM Energy Oil & Gas Producer | 176,796 | |||||||||
| 446,406 | |||||||||||
See accompanying notes to financial statements.
8
Wanger International Select 2012 Semiannual Report
Wanger International Select
Statement of Investments (Unaudited) June 30, 2012
| Number of Shares | Value | ||||||||||
| Israel – 1.5% | |||||||||||
| 32,000 | Israel Chemicals Producer of Potash, Phosphates, Bromine & Specialty Chemicals | $ | 354,059 | ||||||||
| Total Other Countries | 7,089,374 | ||||||||||
| Europe – 16.3% | |||||||||||
| Germany – 3.6% | |||||||||||
| 44,900 | Wirecard Online Payment Processing & Risk Management | 870,629 | |||||||||
| United Kingdom – 3.4% | |||||||||||
| 42,000 | Serco Facilities Management | 352,718 | |||||||||
| 6,000 | Intertek Group Testing, Inspection, Certification Services | 251,375 | |||||||||
| 21,600 | JLT Group International Business Insurance Broker | 237,332 | |||||||||
| 841,425 | |||||||||||
| Sweden – 3.1% | |||||||||||
| 43,733 | Hexagon Design, Measurement & Visualization Software & Equipment | 750,673 | |||||||||
| Iceland – 1.6% | |||||||||||
| 330,000 | Marel Largest Manufacturer of Poultry & Fish Processing Equipment | 401,344 | |||||||||
| Netherlands – 1.4% | |||||||||||
| 14,119 | Imtech Electromechanical & Information & Communications Technology Installation & Maintenance | 337,136 | |||||||||
| Switzerland – 1.3% | |||||||||||
| 1,770 | Partners Group Private Markets Asset Management | 314,799 | |||||||||
| Belgium – 1.0% | |||||||||||
| 5,000 | EVS Broadcast Equipment Digital Live Mobile Production Software & Systems | 235,877 | |||||||||
| Denmark – 0.9% | |||||||||||
| 9,000 | Novozymes Industrial Enzymes | 233,383 | |||||||||
| Total Europe | 3,985,266 | ||||||||||
| Number of Shares | Value | ||||||||||
| Latin America – 5.6% | |||||||||||
| Mexico – 4.1% | |||||||||||
| 44,100 | Fresnillo Silver & Metal Byproduct Mining in Mexico | $ | 1,010,152 | ||||||||
| Guatemala – 0.8% | |||||||||||
| 14,100 | Tahoe Resources (a) Silver Project in Guatemala | 194,860 | |||||||||
| Uruguay – 0.5% | |||||||||||
| 13,068 | Union Agriculture Group (a) (b) (c) Farmland Operator in Uruguay | 127,936 | |||||||||
| Colombia – 0.2% | |||||||||||
| 120,000 | Santa Maria Petroleum (a) (c) Explores for Oil & Gas in Latin America | 36,209 | |||||||||
| Total Latin America | 1,369,157 | ||||||||||
| Total Equities (Cost: $19,887,584) – 95.3% | 23,327,348 | ||||||||||
| Total Investments (Cost: $19,887,584) – 95.3% (d) (e) | 23,327,348 | ||||||||||
| Cash and Other Assets Less Liabilities – 4.7% | 1,151,801 | ||||||||||
| Total Net Assets – 100.0% | $ | 24,479,149 | |||||||||
ADR = American Depositary Receipts
REIT = Real Estate Investment Trust
Notes to Statement of Investments
(a) Non-income producing security.
(b) Illiquid security.
(c) Denotes a restricted security, which is subject to restrictions on resale under federal securities laws. These securities are valued at fair value determined in good faith under consistently applied procedures established by the Board of Trustees. At June 30, 2012, the market value of these securities amounted to $164,145, which represented 0.67% of total net assets.
Additional information on these securities is as follows:
Security | Acquisition Dates | Shares | Cost | Value | |||||||||||||||
| Union Agriculture Group | 12/8/10- 6/27/12 | 13,068 | $ | 150,000 | $ | 127,936 | |||||||||||||
| Santa Maria Petroleum | 1/14/11 | 120,000 | 151,653 | 36,209 | |||||||||||||||
| $ | 301,653 | $ | 164,145 | ||||||||||||||||
(d) At June 30, 2012 for federal income tax purposes, the cost of investments was $19,887,584 and net unrealized appreciation was $3,439,764 consisting of gross unrealized appreciation of $4,103,374 and gross unrealized depreciation of $663,610.
See accompanying notes to financial statements.
9
Wanger International Select 2012 Semiannual Report
Wanger International Select
Statement of Investments (Unaudited) June 30, 2012
(e) On June 30, 2012, the Fund's total investments were denominated in currencies as follows:
| Currency | Value | Percentage of Net Assets | |||||||||
| Singapore Dollar | $ | 3,541,316 | 14.5 | ||||||||
| Taiwan Dollar | 2,989,336 | 12.2 | |||||||||
| Australia Dollar | 2,877,730 | 11.8 | |||||||||
| Japanese Yen | 2,523,729 | 10.3 | |||||||||
| British Pound | 2,400,309 | 9.8 | |||||||||
| South African Rand | 2,178,012 | 8.9 | |||||||||
| United States Dollar | 1,527,243 | 6.2 | |||||||||
| Euro | 1,443,643 | 5.9 | |||||||||
| Other currencies less than 5% of total net assets | 3,846,030 | 15.7 | |||||||||
| Total Foreign Portfolio | $ | 23,327,348 | 95.3 | ||||||||
At June 30, 2012, the Fund had entered into the following forward foreign currency exchange contracts:
| Forward Foreign Currency Exchange Contracts to Buy | Forward Foreign Currency Exchange Contracts to Sell | Principal Amount in Foreign Currency | Principal Amount in U.S. Dollar | Settlement Date | Unrealized Appreciation/ (Depreciation) | ||||||||||||||||||
| USD | ZAR | 16,920,600 | $ | 2,000,000 | 7/13/2012 | $ | (66,608 | ) | |||||||||||||||
The counterparty for all forward foreign currency exchange contracts is State Street Bank and Trust Company.
USD = United States Dollar
ZAR = South African Rand
Fair Value Measurements
Various inputs are used in determining the value of the Fund's investments, following the input prioritization hierarchy established by GAAP. These inputs are summarized in the three broad levels listed below:
• Level 1 – quoted prices in active markets for identical securities
• Level 2 – prices determined using other significant observable inputs (including quoted prices for similar securities, interest rates, prepayment speeds, credit risk and others)
• Level 3 – prices determined using significant unobservable inputs where quoted prices or observable inputs are unavailable or less reliable (including management's own assumptions about the factors market participants would use in pricing an investment)
The inputs or methodology used for valuing securities are not necessarily an indication of the risk associated with investing in those securities.
Examples of the types of securities in which the Fund would typically invest and how they are classified within this hierarchy are as follows. Typical Level 1 securities include exchange traded domestic equities, mutual funds whose NAVs are published each day and exchange traded foreign equities that are not statistically fair valued. Typical Level 2 securities include exchange traded foreign equities that are statistically fair valued, forward foreign currency exchange contracts and short-term investments valued at amortized cost. Additionally, securities fair valued by the Valuation Committee (the Committee) of the Fund's Board of Trustees (the Board) that rely on significant observable inputs are also included in Level 2. Typical Level 3 securities include any security fair valued by the Committee that relies on significant unobservable inputs.
Under the direction of the Board, the Committee is responsible for carrying out the valuation procedures approved by the Board.
The Committee meets as necessary, and no less frequently than quarterly, to determine fair values for securities for which market quotations are not readily available or for which the investment manager believes that available market quotations are unreliable, and to review the continuing appropriateness of the current value of any security subject to the Trust's Portfolio Pricing Policy and the pricing procedures of the investment manager (the Policies). The Policies address, among other things: circumstances under which market quotations will be deemed readily available; selection of third party pricing vendors; appropriate pricing methodologies; events that require fair valuation and fair value techniques; and circumstances under which securities will be deemed to pose a potential for stale pricing, including when securities are illiquid, restricted, or in default. The Committee may also meet to discuss additional valuation matters, which may include review of back-testing results, review of time-sensitive information or approval of other valuation related actions, and to review the appropriateness of the Policies.
For investments categorized as Level 3, the significant unobservable inputs used in the fair value measurement of the Funds' securities may include: (i) data specific to the issuer or comparable issuers, (ii) general market or specific sector news and (iii) quoted prices and specific or similar security transactions. The Committee considers this data and any changes from prior periods in order to assess the reasonableness of observable and unobservable inputs, any assumptions or internal models used to value those securities and changes in fair value. Significant changes in any of these factors could result in lower or higher fair value measurements. Various factors impact the frequency of monitoring (which may occur as often as daily), however the Committee may determine that changes to inputs, assumptions and models are not required with the same frequency.
The following table summarizes the inputs used, as of June 30, 2012, in valuing the Fund's assets:
Investment Type | Quoted Prices (Level 1) | Other Significant Observable Inputs (Level 2) | Significant Unobservable Inputs (Level 3) | Total | |||||||||||||||
| Equities | |||||||||||||||||||
| Asia | $ | 5,885 | $ | 10,877,666 | $ | — | $ | 10,883,551 | |||||||||||
| Other Countries | 1,679,573 | 5,409,801 | — | 7,089,374 | |||||||||||||||
| Europe | — | 3,985,266 | — | 3,985,266 | |||||||||||||||
| Latin America | 194,860 | 1,046,361 | 127,936 | 1,369,157 | |||||||||||||||
| Total Equities | 1,880,318 | 21,319,094 | 127,936 | 23,327,348 | |||||||||||||||
| Total Investments | $ | 1,880,318 | $ | 21,319,094 | $ | 127,936 | $ | 23,327,348 | |||||||||||
| Unrealized Depreciation on Forward Foreign Currency Exchange Contracts | — | (66,608 | ) | — | (66,608 | ) | |||||||||||||
| Total Investments | $ | 1,880,318 | $ | 21,252,486 | $ | 127,936 | $ | 23,260,740 | |||||||||||
The Fund's assets assigned to the Level 2 input category are generally valued using a market approach, in which a security's value is determined through its correlation to prices and information from observable market transactions for similar or identical assets. Foreign equities are generally valued at the last sale price on the foreign exchange or market on which they trade. The Fund may use a statistical fair valuation model, in accordance with the policy adopted by the Board, provided by an independent third party to value securities principally traded in foreign markets in order to adjust for possible stale pricing that may occur between the close of the foreign exchanges and the time for
See accompanying notes to financial statements.
10
Wanger International Select 2012 Semiannual Report
Wanger International Select
Statement of Investments (Unaudited) June 30, 2012
valuation. These models take into account available market data including intraday index, ADR, and ETF movements. Forward foreign currency exchange contracts are valued at the prevailing forward exchange rate of the underlying currencies. Securities acquired via private placement that have a holding period or an extended settlement period are valued at a discount to the same shares that are trading freely on the market. These discounts are determined by the investment manager's experience with similar securities or situations. Factors may include, but are not limited to, trade volume, shares outstanding and stock price.
There were no transfers of financial assets between levels 1 and 2 during the period.
The following table reconciles asset balances for the period ending June 30, 2012, in which significant observable and/or unobservable inputs (Level 3) were used in determining value:
| Investments in Securities | Balance as of December 31, 2011 | Realized Gain/(Loss) | Change in Unrealized Appreciation (Depreciation) | Purchases | Sales | Transfers into Level 3 | Transfers out of Level 3 | Balance as of June 30, 2012 | |||||||||||||||||||||||||||
| Equities | |||||||||||||||||||||||||||||||||||
| Latin America | $ | 124,625 | $ | — | $ | 3,311 | $ | — | $ | — | $ | — | $ | — | $ | 127,936 | |||||||||||||||||||
The information in the above reconciliation table represents fiscal year to date activity for any securities identified as using Level 3 inputs at either the beginning or the end of the current fiscal period.
The change in unrealized appreciation attributed to securities owned at June 30, 2012, which were valued using significant unobservable inputs (Level 3), amounted to $3,311.
The Fund does not hold any significant investments categorized as Level 3.
Certain common stock classified as Level 3 are valued at fair value, using a market approach, as determined in good faith under consistently applied procedures established by and under the general supervision of the Board. To determine fair value for these securities, for which no market exists, the Committee utilizes the valuation technique it deems most appropriate in the circumstances, using some unobservable inputs, which may include but are not limited to trades of similar securities, estimated earnings of the company, market multiples derived from a set of comparable companies, and the position of the security within the company's capital structure. Significant increases or decreases to any of these inputs could result in a significantly lower or higher fair value measurement. Generally, a change in estimated earnings of a company may result in a change to the comparable companies and market multiples utilized.
See accompanying notes to financial statements.
11
Wanger International Select 2012 Semiannual Report
Wanger International Select
Portfolio Diversification (Unaudited) June 30, 2012
At June 30, 2012, the Fund's portfolio investments as a percentage of net assets were diversified as follows:
| Value | Percentage of Net Assets | ||||||||||
| Information | |||||||||||
| Mobile Communications | $ | 2,510,026 | 10.2 | ||||||||
| Internet Related | 1,045,797 | 4.3 | |||||||||
| Financial Processors | 870,629 | 3.5 | |||||||||
| Business Software | 750,673 | 3.1 | |||||||||
| CATV | 683,118 | 2.8 | |||||||||
| Computer Hardware & Related Equipment | 235,877 | 1.0 | |||||||||
| 6,096,120 | 24.9 | ||||||||||
| Other Industries | |||||||||||
| Real Estate | 4,337,752 | 17.7 | |||||||||
| 4,337,752 | 17.7 | ||||||||||
| Finance | |||||||||||
| Insurance | 2,392,765 | 9.8 | |||||||||
| Banks | 1,089,917 | 4.4 | |||||||||
| Brokerage & Money Management | 314,799 | 1.3 | |||||||||
| 3,797,481 | 15.5 | ||||||||||
| Energy & Minerals | |||||||||||
| Mining | 3,100,480 | 12.7 | |||||||||
| Oil Services | 269,610 | 1.1 | |||||||||
| Oil & Gas Producers | 213,005 | 0.9 | |||||||||
| Agricultural Commodities | 127,936 | 0.5 | |||||||||
| 3,711,031 | 15.2 | ||||||||||
| Value | Percentage of Net Assets | ||||||||||
| Industrial Goods & Services | |||||||||||
| Other Industrial Services | $ | 1,536,051 | 6.3 | ||||||||
| Industrial Materials & Specialty Chemicals | 833,906 | 3.4 | |||||||||
| Construction | 479,309 | 2.0 | |||||||||
| Machinery | 402,493 | 1.6 | |||||||||
| Outsourcing Services | 352,718 | 1.4 | |||||||||
| 3,604,477 | 14.7 | ||||||||||
| Consumer Goods & Services | |||||||||||
| Retail | 503,082 | 2.1 | |||||||||
| Nondurables | 286,151 | 1.2 | |||||||||
| Food & Beverage | 278,244 | 1.1 | |||||||||
| 1,067,477 | 4.4 | ||||||||||
| Health Care | |||||||||||
| Pharmaceuticals | 713,010 | 2.9 | |||||||||
| 713,010 | 2.9 | ||||||||||
| Total Equities | 23,327,348 | 95.3 | |||||||||
| Total Investments | 23,327,348 | 95.3 | |||||||||
| Cash and Other Assets Less Liabilities | 1,151,801 | 4.7 | |||||||||
| Net Assets | $ | 24,479,149 | 100.0 | % | |||||||
See accompanying notes to financial statements.
12
Wanger International Select 2012 Semiannual Report
Statement of Assets and Liabilities
June 30, 2012 (Unaudited)
| Assets: | |||||||
| Investments, at cost | $ | 19,887,584 | |||||
| Investments, at value | $ | 23,327,348 | |||||
| Cash | 1,198,697 | ||||||
| Foreign currency (cost of $13,751) | 13,751 | ||||||
| Receivable for: | |||||||
| Investments sold | 370,374 | ||||||
| Fund shares sold | 3,401 | ||||||
| Securities lending income | 2 | ||||||
| Dividends | 28,738 | ||||||
| Foreign tax reclaims | 14,835 | ||||||
| Prepaid expenses | 129 | ||||||
| Total Assets | 24,957,275 | ||||||
| Liabilities: | |||||||
| Unrealized depreciation on forward foreign currency exchange contracts | 66,608 | ||||||
| Payable for: | |||||||
| Investments purchased | 353,691 | ||||||
| Fund shares repurchased | 21,957 | ||||||
| Investment advisory fee | 611 | ||||||
| Administration fee | 33 | ||||||
| Trustees' fees | 8,369 | ||||||
| Custody fee | 4,355 | ||||||
| Reports to shareholders | 10,868 | ||||||
| Chief compliance officer expenses | 53 | ||||||
| Other liabilities | 11,581 | ||||||
| Total Liabilities | 478,126 | ||||||
| Net Assets | $ | 24,479,149 | |||||
| Composition of Net Assets: | |||||||
| Paid-in capital | $ | 22,244,972 | |||||
| Accumulated net investment loss | (172,690 | ) | |||||
| Accumulated net realized loss | (966,289 | ) | |||||
| Net unrealized appreciation (depreciation) on: | |||||||
| Unaffiliated investments | 3,439,764 | ||||||
| Forward foreign currency exchange contracts | (66,608 | ) | |||||
| Net Assets | $ | 24,479,149 | |||||
| Fund Shares Outstanding | 1,355,010 | ||||||
| Net asset value, offering price and redemption price per share | $ | 18.07 | |||||
Statement of Operations
For the Six Months Ended June 30, 2012 (Unaudited)
| Investment Income: | |||||||
| Dividends (net foreign taxes withheld of $33,835) | $ | 347,663 | |||||
| Interest income | 257 | ||||||
| Securities lending income, net | 638 | ||||||
| Total Investment Income | 348,558 | ||||||
| Expenses: | |||||||
| Investment advisory fee | 116,571 | ||||||
| Administration fee | 6,200 | ||||||
| Transfer agent fee | 84 | ||||||
| Trustees' fees | 1,191 | ||||||
| Custody fee | 9,560 | ||||||
| Reports to shareholders | 13,785 | ||||||
| Audit fee | 17,658 | ||||||
| Legal fees | 1,128 | ||||||
| Chief compliance officer expenses (See Note 4) | 397 | ||||||
| Commitment fee for line of credit (See Note 5) | 87 | ||||||
| Other expenses | 3,042 | ||||||
| Total Expenses | 169,703 | ||||||
| Net Expenses | 169,703 | ||||||
| Net Investment Income | 178,855 | ||||||
| Net Realized and Unrealized Gain (Loss) on Investments: | |||||||
| Net realized gain (loss) on: | |||||||
| Investments | 975,398 | ||||||
| Foreign currency translations | (8,587 | ) | |||||
| Foreign currency exchange contracts | 21,489 | ||||||
| Net realized gain | 988,300 | ||||||
| Net change in unrealized appreciation (depreciation) on: | |||||||
| Investments | 1,166,291 | ||||||
| Foreign currency translations | 831 | ||||||
| Foreign currency exchange contracts | (246 | ) | |||||
| Net change in unrealized appreciation | 1,166,876 | ||||||
| Net Gain | 2,155,176 | ||||||
| Net Increase in Net Assets from Operations | $ | 2,334,031 | |||||
See accompanying notes to financial statements.
13
Wanger International Select 2012 Semiannual Report
Statements of Changes in Net Assets
| Increase (Decrease) in Net Assets: | (Unaudited) Six Months Ended June 30, 2012 | Year Ended December 31, 2011 | |||||||||
| Operations: | |||||||||||
| Net investment income | $ | 178,855 | $ | 220,652 | |||||||
| Net realized gain (loss) on: | |||||||||||
| Investments | 975,398 | 3,494,930 | |||||||||
| Foreign currency translations | (8,587 | ) | (69,494 | ) | |||||||
| Forward foreign currency exchange contracts | 21,489 | 94,951 | |||||||||
| Net change in unrealized appreciation (depreciation) on: | |||||||||||
| Investments | 1,166,291 | (6,475,520 | ) | ||||||||
| Foreign currency translations | 831 | (1,738 | ) | ||||||||
| Forward foreign currency exchange contracts | (246 | ) | (66,362 | ) | |||||||
| Net Increase (Decrease) in Net Assets from Operations | 2,334,031 | (2,802,581 | ) | ||||||||
| Distributions to Shareholders: | |||||||||||
| From net investment income | — | (419,969 | ) | ||||||||
| Share Transactions: | |||||||||||
| Subscriptions | 916,289 | 1,422,889 | |||||||||
| Distributions reinvested | — | 419,969 | |||||||||
| Redemptions | (2,789,680 | ) | (6,270,862 | ) | |||||||
| Net Decrease from Share Transactions | (1,873,391 | ) | (4,428,004 | ) | |||||||
| Total Increase (Decrease) in Net Assets | 460,640 | (7,650,554 | ) | ||||||||
| Net Assets: | |||||||||||
| Beginning of period | 24,018,509 | 31,669,063 | |||||||||
| End of period | $ | 24,479,149 | $ | 24,018,509 | |||||||
| Accumulated Net Investment Loss | $ | (172,690 | ) | $ | (351,545 | ) | |||||
See accompanying notes to financial statements.
14
Wanger International Select 2012 Semiannual Report
Financial Highlights
| (Unaudited) Six Months Ended June 30, | Year Ended December 31, | ||||||||||||||||||||||||||
| Selected data for a share outstanding throughout each period | 2012 | 2011 | 2010 | 2009 | 2008 | 2007 | |||||||||||||||||||||
| Net Asset Value, Beginning of Period | $ | 16.44 | $ | 18.57 | $ | 15.42 | $ | 12.01 | $ | 28.07 | $ | 26.62 | |||||||||||||||
| Income from Investment Operations: | |||||||||||||||||||||||||||
| Net investment income (a) | 0.13 | 0.14 | 0.09 | 0.10 | 0.21 | 0.10 | |||||||||||||||||||||
| Net realized and unrealized gain (loss) on investments and foreign currency and foreign capital gains tax | 1.50 | (1.99 | ) | 3.28 | 3.71 | (10.31 | ) | 4.92 | |||||||||||||||||||
| Total from Investment Operations | 1.63 | (1.85 | ) | 3.37 | 3.81 | (10.10 | ) | 5.02 | |||||||||||||||||||
| Less Distributions to Shareholders: | |||||||||||||||||||||||||||
| From net investment income | — | (0.28 | ) | (0.22 | ) | (0.40 | ) | (0.09 | ) | (0.21 | ) | ||||||||||||||||
| From net realized gains | — | — | — | — | (5.87 | ) | (3.36 | ) | |||||||||||||||||||
| Total Distributions to Shareholders | — | (0.28 | ) | (0.22 | ) | (0.40 | ) | (5.96 | ) | (3.57 | ) | ||||||||||||||||
| Net Asset Value, End of Period | $ | 18.07 | $ | 16.44 | $ | 18.57 | $ | 15.42 | $ | 12.01 | $ | 28.07 | |||||||||||||||
| Total Return (b) | 9.91 | %(c) | (10.11 | )%(d) | 22.09 | % | 32.92 | %(d) | (44.35 | )% | 21.78 | % | |||||||||||||||
| Ratios to Average Net Assets/Supplemental Data: | |||||||||||||||||||||||||||
| Net expenses | 1.37 | %(e) | 1.40 | %(f) | 1.38 | %(f) | 1.45 | %(f) | 1.24 | %(f) | 1.18 | %(f) | |||||||||||||||
| Net investment income | 1.44 | %(e) | 0.77 | %(f) | 0.57 | %(f) | 0.75 | %(f) | 1.10 | %(f) | 0.37 | %(f) | |||||||||||||||
| Waiver/Reimbursement | — | 0.05 | % | — | 0.04 | % | — | — | |||||||||||||||||||
| Portfolio turnover rate | 31 | %(c) | 44 | % | 37 | % | 62 | % | 68 | % | 69 | % | |||||||||||||||
| Net assets, end of period (000s) | $ | 24,479 | $ | 24,019 | $ | 31,669 | $ | 31,454 | $ | 29,604 | $ | 73,485 | |||||||||||||||
(a) Net investment income per share was based upon the average shares outstanding during the period.
(b) Total return at net asset value assuming all distributions reinvested.
(c) Not annualized.
(d) Had the investment manager and/or its affiliates not waived a portion of expenses, total return would have been reduced.
(e) Annualized.
(f) The benefits derived from custody fees paid indirectly had an impact of less than 0.01%.
See accompanying notes to financial statements.
15
Wanger International Select 2012 Semiannual Report
Notes to Financial Statements (Unaudited)
1. Nature of Operations
Wanger International Select (the Fund), is a series of Wanger Advisors Trust (the Trust), is registered under the Investment Company Act of 1940, as amended (the 1940 Act), as an open-end management investment company organized as a Massachusetts business trust. The investment objective of the Fund is to seek long-term capital appreciation. The Fund is available only for allocation to certain life insurance company separate accounts established for the purpose of funding participating variable annuity contracts and variable life insurance policies and may also be offered directly to certain qualified pension and retirement plans.
2. Significant Accounting Policies
The preparation of financial statements in accordance with accounting principles generally accepted in the United States of America (GAAP) requires management to make certain estimates and assumptions that affect the reported amounts of assets and liabilities, the disclosure of contingent assets and liabilities at the date of the financial statements and the reported amounts of revenue and expenses during the reporting period. Actual results could differ from those estimates.
Security valuation
Securities of the Fund are valued at market value or, if a market quotation for a security is not readily available or is deemed not to be reliable because of events or circumstances that have occurred between the market quotation and the time as of which the security is to be valued, the security is valued at its fair value determined in good faith under consistently applied procedures established by the Board of Trustees. A security traded on a securities exchange or in an over-the-counter market in which transaction prices are reported is valued at the last sales price at the time of valuation. A security traded principally on NASDAQ is valued at the NASDAQ official closing price. Mutual Funds and Exchange Traded Funds are valued at their closing net asset value as reported to NASDAQ. A security for which there is no reported sale on the valuation date is valued at the mean of the latest bid and ask quotations.
Short-term investments maturing in 60 days or less are valued at amortized cost, which approximates market value.
Forward foreign currency exchange contracts are marked-to-market based upon foreign currency exchange rates provided by a pricing service.
A security for which a market quotation is not readily available and any other assets are valued at their fair value determined in good faith under consistently applied procedures established by the Board of Trustees. The Trust has retained an independent statistical fair value pricing service that employs a systematic methodology to assist in the fair valuation process for securities principally traded in a foreign market in order to adjust for possible changes in value that may occur between the close of the foreign market and the time as of which the securities are to be valued. If a security is valued at a fair value, that value may be different from the last quoted market price for the security.
Foreign currency translations
Values of investments denominated in foreign currencies are converted into U.S. dollars using the New York spot market rate of exchange at the time of valuation. Purchases and sales of investments and dividend and interest income are translated into U.S. dollars using the spot market rate of exchange prevailing on the respective dates of such transactions. The gain or loss resulting from changes in foreign exchange rates is included with net realized and unrealized gain or loss from investments, as appropriate.
Repurchase agreements
The Fund may engage in repurchase agreement transactions. The Fund, through its custodian, receives delivery of underlying securities collateralizing each repurchase agreement. The counterparty is required to maintain collateral that is at all times at least equal to the repurchase price including interest. In the event of default or bankruptcy by the other party to the agreement, realization and/or retention of the collateral may be subject to legal proceedings.
Restricted securities
Restricted securities are securities that may only be resold upon registration under federal securities laws or in transactions exempt from registration. In some cases, the issuer of restricted securities has agreed to register such securities for resale at the issuer's expense either upon demand by the Fund or in connection with another registered offering of the securities. Many restricted securities may be resold in the secondary market in transactions exempt from registration. Such restricted securities may be determined to be liquid under criteria established by the Board of Trustees.
Derivative instruments
The Fund invests in certain derivative instruments as detailed below to meet its investment objectives. Derivatives are instruments whose values depend on, or are derived from, in whole or in part, the value of one or more other assets, such as securities, currencies, commodities or indices. Derivative instruments may be used to maintain cash reserves while maintaining exposure to certain other assets, to offset anticipated declines in values of investments, to facilitate trading, to reduce transaction costs and to pursue higher investment returns. The Fund may also use derivative instruments to mitigate certain investment risks, such as foreign currency exchange rate risk, interest rate risk and credit risk. Derivatives may involve various risks, including the potential inability of the counterparty to fulfill its obligation under the terms of the contract, the potential for an illiquid secondary market and the potential for market movements, which may expose the Fund to gains or losses in excess of the amount shown in the Statement of Assets and Liabilities.
Forward foreign currency exchange contracts
Forward foreign currency exchange contracts are agreements between two parties to buy and sell a currency at a set price on a future date. These contracts are intended to be used to minimize the exposure to foreign exchange rate fluctuations during the period between the trade and settlement dates of the contract. The Fund utilized forward foreign currency exchange contracts to hedge the currency exposure associated with some or all of the Fund's securities or to hedge out of a currency that is off benchmark.
The values of forward foreign currency exchange contracts fluctuate with changes in foreign currency exchange rates. The Fund will record a realized gain or loss when the forward foreign currency exchange contract is closed.
The use of forward foreign currency exchange contracts does not eliminate fluctuations in the prices of the Fund's portfolio securities. The risks of forward foreign currency exchange contracts include movement in the values of the foreign currencies relative to the U.S. dollar (or other foreign currencies) and the possibility that counterparties will not complete their contractual obligations, which may be in excess of the amount reflected, if any, in the Statement of Assets and Liabilities.
Effects of derivative transactions in the financial statements
The following tables are intended to provide additional information about the effect of derivatives on the financial statements of the Fund including: the fair value of derivatives by risk category and the location of those fair values in the Statement of Assets and Liabilities; the impact of derivative transactions on the Fund's operations over the period including realized gains or losses and unrealized gains or losses. The derivative schedules following the Portfolio of Investments present additional information regarding derivative instruments outstanding at the end of the period, if any.
The following table is a summary of the fair value of derivative instruments at June 30, 2012:
| Liability Derivatives | |||||||||||
| Risk Exposure Category | Statement of Assets and Liabilities Location | Fair Value ($) | |||||||||
| Foreign exchange contracts | Unrealized depreciation on forward foreign currency exchange contracts | $ | 66,608 | ||||||||
16
Wanger International Select 2012 Semiannual Report
Notes to Financial Statements, continued (Unaudited)
The effect of derivative instruments in the Statement of Operations for the six months ended June 30, 2012:
Amount of Realized Gain (Loss) on Derivatives Recognized in Income
| Risk Exposure Category | Forward Foreign Currency Exchange Contracts ($) | ||||||
| Foreign exchange contracts | 21,489 | ||||||
Change in Unrealized Appreciation (Depreciation) on Derivatives
Recognized in Income
| Risk Exposure Category | Forward Foreign Currency Exchange Contracts ($) | ||||||
| Foreign exchange contracts | (246 | ) | |||||
The following table is a summary of the volume of derivative instruments for the six months ended June 30, 2012:
| Derivative Instrument | Contracts Opened | ||||||
| Forward Foreign Currency Exchange Contracts | 6 | ||||||
Security transactions and investment income
Security transactions are accounted for on the trade date (date the order to buy or sell is executed) and dividend income is recorded on the ex-dividend date, except that certain dividends from foreign securities are recorded as soon as the information is available to the Fund. Interest income is recorded on the accrual basis and includes amortization of discounts on debt obligations when required for federal income tax purposes. Realized gains and losses from security transactions are recorded on an identified cost basis.
Awards, if any, from class action litigation related to securities owned may be recorded as a reduction of cost of those securities. If the applicable securities are no longer owned, the proceeds are recorded as realized gains.
Expenses
General expenses of the Trust are allocated to the Fund and the other series of the Trust based upon relative net assets or other expense allocation methodologies determined by the nature of the expense. Expenses directly attributable to the Fund are charged to the Fund.
Fund share valuation
Fund shares are sold and redeemed on a continuing basis at net asset value. Net asset value per share is determined daily as of the close of trading on the New York Stock Exchange (the Exchange) on each day the Exchange is open for trading by dividing the total value of the Fund's investments and other assets, less liabilities, by the number of Fund shares outstanding.
Securities lending
The Fund may lend securities up to one-third of the value of its total assets to certain approved brokers, dealers and other financial institutions to earn additional income. The Fund retains the benefits of owning the securities, including receipt of dividends or interest generated by the security. The Fund also receives a fee for the loan. The Fund has the ability to recall the loans at any time and could do so in order to vote proxies or to sell the loaned securities. Each loan is collateralized by cash that exceeded the value of the securities on loan. The market value of the loaned securities is determined daily at the close of business of the Fund and any additional required collateral is delivered to each Fund on the next business day. The Fund has elected to invest the cash collateral in the Dreyfus Government Cash Management Fund and the income earned is paid to the Fund, net of any fees remitted to Goldman Sachs Agency Lending, the Fund's lending agent and borrower rebates. The Fund's investment manager, Columbia Wanger Asset Management, LLC (CWAM), does not retain any fees earned by the lending program. Generally, in the event of borrower default, the Fund has the right to use the collateral to offset any losses incurred. In the event the Fund is delayed or prevented from exercising its right to dispose of the collateral, there may be a potential loss to the Fund. Some of these losses may be indemnified by the lending agent. The Fund bears the risk of loss with respect to the investment of collateral.
The net lending income earned by the Fund as of June 30, 2012, is included in the Statement of Operations. There were no securities on loan on June 30, 2012.
Federal income taxes
The Fund has complied with the provisions of the Internal Revenue Code available to regulated investment companies and, in the manner provided therein, distributes substantially all its taxable income, as well as any net realized gain on sales of investments and foreign currency transactions reportable for federal income tax purposes. Accordingly, the Fund paid no federal income taxes and no federal income tax provision was required.
Foreign capital gains taxes
Gains in certain countries may be subject to foreign taxes at the fund level. The Fund accrues for such foreign taxes on net realized and unrealized gains at the appropriate rate for each jurisdiction. The amount, if any, is disclosed as a liability on the Statement of Assets and Liabilities.
Distributions to shareholders
Distributions to shareholders are recorded on the ex-dividend date.
Indemnification
In the normal course of business, the Trust on behalf of the Fund enters into contracts that contain a variety of representations and warranties and that provide general indemnities. The Fund's maximum exposure under these arrangements is unknown, as this would involve future claims against the Fund. Also under the Trust's organizational documents, the trustees and officers of the Trust are indemnified against certain liabilities that may arise out of their duties to the Trust. However based on experience, the Fund expects the risk of loss due to these warranties and indemnities to be remote.
Recent Accounting Pronouncement
Disclosures about Offsetting Assets and Liabilities
In December 2011, the Financial Accounting Standards Board (FASB) issued ASU No. 2011-11, Disclosures about Offsetting Assets and Liabilities. The objective of the FASB is to enhance current disclosure requirements on offsetting of certain assets and liabilities and to enable financial statement users to compare financial statements prepared under GAAP and International Financial Reporting Standards.
Specifically, ASU No. 2011-11 requires an entity to disclose both gross and net information for derivatives and other financial instruments that are subject to a master netting arrangement or similar agreement. The standard requires disclosure of collateral received in connection with the master netting agreements or similar agreements. The effective date of ASU No. 2011-11 is for interim and annual periods beginning on or after January 1, 2013. At this time, management is evaluating the implications of this guidance and the impact it will have on the financial statement amounts and footnote disclosures, if any.
3. Federal Tax Information
The timing and character of income and capital gain distributions are determined in accordance with income tax regulations, which may differ from GAAP. Reclassifications are made to the Fund's capital accounts for permanent tax differences to reflect income and gains available for distribution (or available capital loss carryforwards) under income tax regulations.
17
Wanger International Select 2012 Semiannual Report
Notes to Financial Statements, continued (Unaudited)
The following capital loss carryforward, determined as of December 31, 2011 may be available to reduce taxable income arising from future net realized gains on investments, if any, to the extent permitted by the Internal Revenue Code:
| Year of Expiration | Amount | ||||||
| 2017 | $ | 1,870,723 | |||||
Under current tax rules, regulated investment companies can elect to treat certain late-year ordinary losses incurred and post-October capital losses (capital losses realized after October 31) as arising on the first day of the following taxable year. The Fund has elected to treat late year ordinary losses of $134,279 at December 31, 2011 as arising on January 1, 2012.
Management is required to determine whether a tax position of the Fund is more likely than not to be sustained upon examination by the applicable taxing authority, including resolution of any related appeals or litigation processes, based on the technical merits of the position. The tax benefit to be recognized by the Fund is measured as the largest amount of benefit that is greater than fifty percent likely of being realized upon ultimate settlement. Management is not aware of any tax positions for which it is reasonably possible that the total amounts of unrecognized tax benefits will significantly change in the next twelve months. However, management's conclusions may be subject to review and adjustment at a later date based on factors including, but not limited to, new tax laws, regulations, and administrative interpretations (including relevant court decisions). The Fund's federal tax returns for the prior three fiscal years remain subject to examination by the Internal Revenue Service.
4. Transactions With Affiliates
CWAM is a wholly owned subsidiary of Columbia Management Investment Advisers, LLC (Columbia Management), which in turn is a wholly owned subsidiary of Ameriprise Financial, Inc. (Ameriprise Financial). CWAM furnishes continuing investment supervision to the Fund and is responsible for the overall management of the Fund's business affairs.
CWAM receives a monthly advisory fee based on the Fund's average daily net assets at the following annual rates:
| Average Daily Net Assets | Annual Fee Rate | ||||||
| Up to $500 million | 0.94 | % | |||||
| $500 million and over | 0.89 | % | |||||
For the six months ended June 30, 2012, the annualized effective investment advisory fee rate was 0.94% of the Fund's average daily net assets.
Through April 30, 2013, CWAM has contractually agreed to reimburse the Fund to the extent that ordinary operating expenses (exclusive of brokerage commissions, interest, taxes and extraordinary expenses, but inclusive of custodian charges relating to overdrafts, if any), after giving effect to any balance credits from the Fund's custodian, exceed an annual percentage of 1.45% of average daily net assets on an annualized basis. For the six months ended June 30, 2012 the Fund was not reimbursed any expenses.
CWAM provides administrative services and receives an administration fee from the Fund at the following annual rates:
| Wanger Advisors Trust Aggregate Average Daily Net Assets of the Trust | Annual Fee Rate | ||||||
| Up to $4 billion | 0.05 | % | |||||
| $4 billion to $6 billion | 0.04 | % | |||||
| $6 billion to $8 billion | 0.03 | % | |||||
| $8 billion and over | 0.02 | % | |||||
For the six months ended June 30, 2012, the annualized effective administration fee rate was 0.05% of the Fund's average daily net assets. Columbia Management provides certain sub-administrative services to the Fund.
Columbia Management Investment Distributors, Inc. (CMID), a wholly owned subsidiary of Ameriprise Financial, serves as the Fund's distributor and principal underwriter.
Columbia Management Investment Services Corp. (CMIS), a wholly owned subsidiary of Ameriprise Financial, is the transfer agent to the Fund. For its services, the Fund pays CMIS a monthly fee at the annual rate of $21.00 per open account. CMIS also receives reimbursement from the Fund for certain out-of-pocket expenses.
Certain officers and trustees of the Trust are also officers of CWAM. The Trust makes no direct payments to its officers and trustees who are affiliated with CWAM.
The Board of Trustees has appointed a Chief Compliance Officer of the Trust in accordance with federal securities regulations. The Fund, along with other affiliated funds, pays its pro-rata share of the expenses associated with the Office of the Chief Compliance Officer. These expenses are disclosed separately as "Chief compliance officer expenses" in the Statement of Operations.
The Trust offers a deferred compensation plan for its independent trustees. Under that plan, a trustee may elect to defer all or a portion of his or her compensation. Amounts deferred are retained by the Trust and may represent an unfunded obligation of the Trust. The value of amounts deferred is determined by reference to the change in value of Class Z shares of one or more series of Columbia Acorn Trust or a money market fund as specified by the trustee. Benefits under the deferred compensation plan are payable in accordance with the plan.
5. Borrowing Arrangements
The Trust participates in a $150 million credit facility with JPMorgan Chase Bank, N.A., along with another Trust managed by CWAM, which was entered into to facilitate portfolio liquidity. Under the facility, as in effect for the six months ended June 30, 2012, interest is charged to each participating fund based on its borrowings at a rate per annum equal to the higher of Federal Funds Rate or Overnight LIBOR plus 1.25%. In addition, a commitment fee of 0.10% per annum of the unutilized line of credit is accrued and apportioned among the participating funds based on their relative net assets. The commitment fee is disclosed separately as "Commitment fee for line of credit" in the Statement of Operations. The Trust expects to renew this line of credit for one year durations annually in July at then current market rates and terms.
The Fund had no borrowings during the six months ended June 30, 2012.
6. Fund Share Transactions
Proceeds and payments on Fund shares as shown in the Statement of Changes in Net Assets are in respect of the following numbers of shares:
| (Unaudited) Six months ended June 30, 2012 | Year ended December 31, 2011 | ||||||||||
| Shares sold | 51,307 | 76,620 | |||||||||
| Shares issued in reinvestment of dividend distributions | — | 23,263 | |||||||||
| Less shares redeemed | (157,514 | ) | (344,326 | ) | |||||||
| Net increase (decrease) in shares outstanding | (106,207 | ) | (244,443 | ) | |||||||
7. Investment Transactions
The aggregate cost of purchases and proceeds from sales other than short-term obligations for the six months ended June 30, 2012, were $7,211,372 and $7,745,381, respectively.
8. Shareholder Concentration
At June 30, 2012, two unaffiliated shareholder accounts owned an aggregate of 93.0% of the outstanding shares of the Fund. The Fund has no knowledge about whether any portion of those shares was owned beneficially by such accounts. Subscription and redemption activity by concentrated accounts may have a significant effect on the operations of the Fund.
18
Wanger International Select 2012 Semiannual Report
Notes to Financial Statements, continued (Unaudited)
9. Subsequent Events
Management has evaluated the events and transactions that have occurred through the date the financial statements were issued and noted no items requiring adjustment of the financial statements or additional disclosure.
10. Information Regarding Pending and Settled Legal Proceedings
Ameriprise Financial and certain of its affiliates have historically been involved in a number of legal, arbitration and regulatory proceedings, including routine litigation, class actions, and governmental actions, concerning matters arising in connection with the conduct of their business activities. Ameriprise Financial believes that the Funds are not currently the subject of, and that neither Ameriprise Financial nor any of its affiliates are the subject of, any pending legal, arbitration or regulatory proceedings that are likely to have a material adverse effect on the Funds or the ability of Ameriprise Financial or its affiliates to perform under their contracts with the Funds. Ameriprise Financial is required to make 10-Q, 10-K and, as necessary, 8-K filings with the Securities and Exchange Commission on legal and regulatory matters that relate to Ameriprise Financial and its affiliates. Copies of these filings may be obtained by accessing the SEC website at www.sec.gov.
There can be no assurance that these matters, or the adverse publicity associated with them, will not result in increased fund redemptions, reduced sale of fund shares or other adverse consequences to the Funds. Further, although we believe proceedings are not likely to have a material adverse effect on the Funds or the ability of Ameriprise Financial or its affiliates to perform under their contracts with the Funds, these proceedings are subject to uncertainties and, as such, we are unable to estimate the possible loss or range of loss that may result. An adverse outcome in one or more of these proceedings could result in adverse judgments, settlements, fines, penalties or other relief that could have a material adverse effect on the consolidated financial condition or results of operations of Ameriprise Financial.
19
Wanger International Select 2012 Semiannual Report
Board Approval of the Advisory Agreement
Wanger Advisors Trust (the "Trust") has an investment advisory agreement (the "Advisory Agreement") with Columbia Wanger Asset Management, LLC ("Columbia WAM") under which Columbia WAM manages the Wanger Funds (each, a "Fund" and together, the "Funds"). More than 75% of the trustees of the Trust (the "Trustees") are persons who have no direct or indirect interest in the Advisory Agreement and are not "interested persons" (as defined in the Investment Company Act of 1940, as amended (the "1940 Act")) of the Trust (the "Independent Trustees"). The Trustees oversee the management of each Fund and, as required by law, determine at least annually whether to continue the Advisory Agreement for each Fund.
The Contract Committee (the "Committee") of the Board of Trustees (the "Board"), which is comprised solely of Independent Trustees, makes recommendations to the Board regarding any proposed continuation of the Advisory Agreement. After the Committee has made its recommendations, the full Board determines whether to approve continuation of the Advisory Agreement. The Board also considers matters bearing on the Advisory Agreement at its various meetings throughout the year, meets at least quarterly with Columbia WAM's portfolio managers and receives monthly reports from Columbia WAM on the performance of the Funds.
In connection with their most recent consideration of the Advisory Agreement for each Fund, the Committee and all Trustees received and reviewed a substantial amount of information provided by Columbia WAM, Columbia Management Investment Advisers, LLC ("Columbia Management") and Ameriprise Financial, Inc. ("Ameriprise"), in response to written requests from the Independent Trustees and their independent legal counsel. Throughout the process, the Trustees had numerous opportunities to ask questions of and request additional materials from Columbia WAM, Columbia Management and Ameriprise.
During each meeting at which the Committee or the Independent Trustees considered the Advisory Agreement, they met in executive session with their independent legal counsel. The Committee also met with representatives of Columbia WAM, Columbia Management and Ameriprise on several occasions. In all, the Committee convened formally on six separate occasions to consider the continuation of the Advisory Agreement. The Board and/or some or all of the Independent Trustees met on other occasions to receive the Committee's status reports, receive presentations from Columbia WAM, Columbia Management and Ameriprise representatives, and to discuss outstanding issues. In addition, the Investment Performance Analysis Committee of the Board, also comprised exclusively of Independent Trustees, reviewed the performance of the Funds and presented its findings to the Board and the Committee throughout the year. The Compliance Committee of the Board also provided information to the Committee with respect to relevant matters.
The Trustees reviewed the Advisory Agreement, as well as certain information obtained through Columbia WAM's, Columbia Management's and Ameriprise's responses to independent legal counsel's questionnaires. In addition, the Trustees reviewed the Management Fee Evaluation dated June 2012 (the "Fee Evaluation") prepared by the Trust's chief compliance officer, senior vice president and general counsel at the request of the Board.
The materials reviewed by the Committee and the Trustees included, among other items, (i) information on the investment performance of each Fund and of independently selected peer groups of funds and of the Funds' performance benchmarks over various time periods, (ii) information on each Fund's advisory fees and other expenses, including information comparing the Fund's fees and expenses to those of peer groups of funds and information about any applicable expense limitations and fee breakpoints, (iii) data on sales and redemptions of Fund shares, and (iv) information on the profitability to Columbia WAM and Ameriprise, as well as potential "fall-out" or ancillary benefits that Columbia WAM and its affiliates may receive as a result of their relationships with the Funds. The Trustees also considered other information such as (i) Columbia WAM's financial condition, (ii) each Fund's investment objective and strategy, (iii) the size, education and experience of Columbia WAM's investment staff and its use of technology, external research and trading cost measurement tools, (iv) the portfolio manager compensation framework, (v) the allocation of the Funds' brokerage, and the use of "soft" commission dollars to pay for research products and services, (vi) Columbia WAM's risk management program, and (vii) the resources devoted to, and the record of compliance with, the Funds' investment policies and restrictions, policies on personal securities transactions and other compliance policies.
At a meeting held on June 6, 2012, upon recommendations of the Committee, the Board of Trustees unanimously approved the continuation of the Advisory Agreement.
In considering the continuation of the Advisory Agreement, the Trustees reviewed and analyzed various factors that they determined were relevant, none of which by itself was considered dispositive. The material factors and conclusions that formed the basis for the Trustees' determination to approve the continuation of the Advisory Agreement are discussed below.
Nature, quality and extent of services. The Trustees reviewed the nature, quality and extent of the services provided by Columbia WAM and its affiliates to Wanger International Select under the Advisory Agreement, taking into account the investment objective and strategy of the Fund and knowledge gained from meetings with management, which were held on at least a quarterly basis. In addition, the Trustees reviewed the available resources and key personnel of Columbia WAM and its affiliates, especially those providing investment management services to the Fund. The Trustees also considered other services provided to the Fund by Columbia WAM and its affiliates, including: managing the execution of portfolio transactions and selecting broker-dealers for those transactions; monitoring adherence to the Fund's investment restrictions; producing shareholder reports; providing support services for the Board and committees of the Board; managing the Fund's securities lending program; communicating with shareholders; serving as the Fund's administrator; and overseeing the activities of the Fund's other service providers, including monitoring for compliance with various policies and procedures as well as applicable securities laws and regulations.
The Trustees concluded that the nature, quality and extent of the services provided by Columbia WAM and its affiliates to the Fund under the Advisory Agreement were appropriate for the Fund and that the Fund was likely to benefit from the continued provision of those services by Columbia WAM. They also concluded that Columbia WAM currently had sufficient personnel, with appropriate education and experience, to serve the Fund effectively, and that the firm had demonstrated its continuing ability to attract and retain well-qualified personnel. In addition, they took note of the quality of Columbia WAM's compliance record.
Performance of the Fund. The Trustees received and considered detailed performance information at various meetings of the Board, the Committee and the Investment Performance Analysis Committee of the Board throughout the year. They reviewed information comparing each Fund's performance with that of its benchmark(s) and with the performance of comparable funds and peer groups as identified by Lipper Inc. ("Lipper") and Morningstar, Inc. ("Morningstar"). The Trustees evaluated the performance of Wanger International Select over various time periods, including over the one-, three- and five-year periods ending December 31, 2011. The Trustees also considered peer performance rankings for similar timeframes, although they focused more on the five-year period.
The Trustees noted that Wanger International Select had delivered excellent results over the past five years, according to both Morninstar and Lipper, and did so while investors to less risk than competing funds, according to Morningstar. The Trustees concluded that Fund performance was satisfactory.
The Trustees concluded that, although past performance is not necessarily indicative of future results, the strong overall performance of Wanger International Select was an important factor in their evaluation of the quality of services provided by Columbia WAM under the Advisory Agreement for Wanger International Select.
Costs of Services and Profits Realized by Columbia WAM. At various Committee and Board meetings, the Trustees examined detailed information on the fees and expenses of each Fund in comparison to information for comparable funds provided by Lipper and Morningstar. The Trustees reviewed data from Lipper and Morningstar and noted that Wanger International Select had lower total net operating expenses than its Lipper peer group median but higher total net operating expenses than its Morningstar peer group median. As noted in the Fee Evaluation, the actual advisory fees paid by
20
Wanger International Select 2012 Semiannual Report
Board Approval of the Advisory Agreement
Wanger International Select were higher than the median advisory fee of the Fund's Morningstar and Lipper peer groups. The Trustees reviewed the observations in the Fee Evaluation and noted that the Fund was assessed by Morningstar and Lipper in relation to peers selected only from the variable annuity universe.
The Trustees also reviewed the advisory fee rates charged by Columbia WAM for managing other investment companies (including the Columbia Acorn Funds), sub-advised funds and other institutional separate accounts, as detailed in materials provided to the Committee by Columbia WAM and in the Fee Evaluation. The Trustees noted that the Fund's advisory fees were generally comparable to Columbia Acorn International Select's advisory fees at the same asset level. The Trustees also examined Columbia WAM's institutional separate account fees for various investment strategies; in some cases those fees were higher than the advisory fees charged to the Fund, and in a few instances the fees were lower. The Trustees noted that Columbia WAM performs significant additional services for the Fund that it does not provide to sub-advised funds or non-mutual fund clients, including administrative services, oversight of the Fund's other service providers, Trustee support, regulatory compliance and numerous other services, and that, in servicing the Fund, Columbia WAM assumes many legal and business risks that it does not assume in servicing many of its non-fund clients.
The Trustees concluded that the rate of advisory fees payable to Columbia WAM was reasonable in relation to the nature and quality of the services to be provided. The Trustees also concluded that the Fund's overall expense ratio was reasonable, considering the quality of the services provided by Columbia WAM and its affiliates and the investment performance of the Fund.
The Trustees reviewed the analysis of the historic profitability of Columbia WAM in serving as the Fund's investment adviser and of Columbia WAM and its affiliates in their relationships with each Fund. The Committee and Trustees met with representatives from Ameriprise to discuss its methodologies for calculating profitability and allocating costs. They considered that Ameriprise calculated profitability and allocated costs on a contract-by-contract and fund-by-fund basis. The Trustees also considered the methodology used by Columbia WAM and Ameriprise in determining compensation payable to portfolio managers and the competitive market for investment management talent. The Trustees were also provided with profitability information from Lipper, which compared Columbia WAM's profitability to other similar investment advisers in the mutual fund industry. The Trustees concluded that Columbia WAM's and its affiliates' profits were within a reasonable range of those of competitors with similar business models. The Trustees discussed, however, that profitability comparisons among fund managers may not always be meaningful due to the lack of consistency in data, small number of publicly-owned managers, and the fact that profitability of any investment manager is affected by numerous factors, including its particular organizational structure, the types of funds and other accounts managed, other lines of business, expense allocation methodology, capital structure and cost of capital.
Economies of Scale. At various Committee and Board meetings and other informal meetings, the Trustees considered information about the extent to which Columbia WAM realizes economies of scale in connection with an increase in Fund assets. The Trustees also discussed the potential for Fund sales growth. The Trustees noted that the advisory fee schedule for each Fund includes breakpoints in the rate of fees at various asset levels. The Trustees concluded that the fee structure of the Fund was reflective of a sharing between Columbia WAM and the Fund of economies of scale.
Other Benefits to Columbia WAM. The Trustees also reviewed benefits that accrue to Columbia WAM and its affiliates from their relationships with the Fund, based upon information provided to them by Ameriprise and as outlined in the Fee Evaluation. They noted that the Fund's transfer agency services are performed by Columbia Management Investment Services Corp., an affiliate of Ameriprise, which receives compensation from the Funds for its services provided. They considered that an affiliate of Ameriprise, Columbia Management Investment Distributors, Inc. ("CMID"), serves as the Fund's distributor under a distribution agreement and receives no fees for its services. In addition, Columbia Management provides sub-administration services to the Fund. The Committee received information regarding the profitability of each Fund agreement with Columbia WAM affiliates. The Committee and the Board also reviewed information about and discussed the capabilities of each affiliated entity in performing its duties.
The Trustees considered other ways that the Fund and Columbia WAM may potentially benefit from their relationship with each other. For example, the Trustees considered Columbia WAM's use of commissions paid by the Fund on its portfolio brokerage transactions to obtain research products and services benefiting the Funds and/or other clients of Columbia WAM. The Committee reviewed Columbia WAM's annual "soft dollar" report and met with representatives from Columbia WAM to review Columbia WAM's soft dollar spending. The Committee also considered that the Compliance Committee of the Board regularly reviewed third-party prepared reports that evaluated the quality of Columbia WAM's execution of the Fund's portfolio transactions. The Trustees noted that these reports showed that Columbia WAM's execution capabilities were generally better than industry peers. The Trustees determined that Columbia WAM's use of the Fund's "soft" commission dollars to obtain research products and services was consistent with current regulatory requirements and guidance. They also concluded that Columbia WAM benefits from the receipt of proprietary research products and services acquired through commissions paid on portfolio transactions of the Fund, and that the Fund benefits from Columbia WAM's receipt of those products and services as well as research products and services acquired through commissions paid by other clients of Columbia WAM.
After full consideration of the above factors, as well as other factors that were instructive in evaluating the Advisory Agreement, the Trustees, including the Independent Trustees, concluded that the continuation of the Advisory Agreement was in the best interest of the Fund. On June 6, 2012, the Trustees approved continuation of the Advisory Agreement through July 31, 2013.
21
Wanger International Select 2012 Semiannual Report

Columbia Wanger Funds
© 2011 Columbia Management Investment Advisers, LLC. All rights reserved.
Trustees
Laura M. Born
Chair of the Board
Steven N. Kaplan
Vice Chair of the Board
Michelle L. Collins
Maureen M. Culhane
Margaret M. Eisen
John C. Heaton
Charles P. McQuaid
David J. Rudis
David B. Small
Ralph Wanger (Trustee Emeritus)
Officers
Charles P. McQuaid
President
Ben Andrews
Vice President
Robert A. Chalupnik
Vice President
Michael G. Clarke
Assistant Treasurer
Joseph F. DiMaria
Assistant Treasurer
P. Zachary Egan
Vice President
Fritz Kaegi
Vice President
John M. Kunka
Assistant Treasurer
Stephen Kusmierczak
Vice President
Joseph C. LaPalm
Vice President
Bruce H. Lauer
Vice President, Secretary and Treasurer
Louis J. Mendes III
Vice President
Robert A. Mohn
Vice President
Christopher J. Olson
Vice President
Christopher O. Petersen
Assistant Secretary
Scott R. Plummer
Assistant Secretary
Linda K. Roth-Wiszowaty
Assistant Secretary
Robert P. Scales
Chief Compliance Officer, Chief Legal Officer, Senior Vice President and
General Counsel
Andreas Waldburg-Wolfegg
Vice President
Investment Manager
Columbia Wanger Asset Management, LLC
227 West Monroe Street, Suite 3000
Chicago, Illinois 60606
1-888-4-WANGER
(1-888-492-6437)
Transfer Agent,
Dividend Disbursing Agent
Columbia Management Investment Services Corp.
P.O.Box 8081
Boston, Massachusetts
02266-8081
Distributor
Columbia Management Investment Distributors, Inc.
225 Franklin Street
Boston, Massachusetts
02110
Legal Counsel to the Funds
Perkins Coie LLP
Washington, DC
Legal Counsel to the Independent Trustees
Drinker Biddle & Reath LLP
Philadelphia, Pennsylvania
Independent Registered Public Accounting Firm
PricewaterhouseCoopers LLP
Chicago, Illinois
This document contains Global Industry Classification Standard data. The Global Industry Classification Standard ("GICS") was developed by and is the exclusive property and a service mark of MSCI Inc. ("MSCI") and Standard & Poor's Financial Services LLC ("S&P") and is licensed for use by Columbia Wanger Asset Management, LLC ("CWAM"). Neither MSCI, S&P, nor any other party involved in making or compiling the GICS or any GICS classifications makes any express or implied warranties or representations with respect to such standard or classification (or the results to be obtained by the use thereof), and all such parties hereby expressly disclaim all warranties of originality, accuracy, completeness, merchantability and fitness for a particular purpose with respect to any of such standard or classification. Without limiting any of the foregoing, in no event shall MSCI, S&P, any of their affiliates or any third party involved in making or compiling the GICS or any GICS classifications have any liability for any direct, indirect, special, punitive, consequential or any other damages (including lost profits) even if notified of the possibility of such damages.
This report, including the schedules of investments and financial statements, is submitted for the general information of the shareholders of the Wanger Advisors Trust.
A description of the Fund's proxy voting policies and procedures and a copy of the Fund's voting record for the most recent 12-month period ended June 30 are available (i) on the Securities and Exchange Commission's website at www.sec.gov, and (ii) without charge, upon request, by calling 888-492-6437.
The Fund files a complete schedule of portfolio holdings with the SEC for the first and third quarters of each fiscal year on Form N-Q. The Fund's Form N-Q is available on the SEC's website at www.sec.gov and may be reviewed and copied at the SEC's Public Reference Room in Washington, D.C. Information on the operation of the Pubic Reference Room may be obtained by calling 800-SEC-0330. The Fund's complete portfolio holdings are disclosed at www.columbiamanagement.com approximately 30 to 40 days after each month-end.
C-1455 C (8/12) 142482
Wanger Select
2012 Semiannual Report

Not FDIC insured • No bank guarantee • May lose value

Wanger Select
2012 Semiannual Report
Table of Contents
| 2 | Understanding Your Expenses | ||||||
| 3 | Genetic Science | ||||||
| 6 | Performance Review | ||||||
| 8 | Statement of Investments | ||||||
| 13 | Statement of Assets and Liabilities | ||||||
| 13 | Statement of Operations | ||||||
| 14 | Statement of Changes in Net Assets | ||||||
| 15 | Financial Highlights | ||||||
| 16 | Notes to Financial Statements | ||||||
| 19 | Board Approval of the Advisory Agreement | ||||||
Columbia Wanger Asset Management, LLC (CWAM) is one of the leading global small- and mid-cap equity managers in the United States with over 40 years of small- and mid-cap investment experience. As of June 30, 2012, CWAM managed $31.0 billion in assets. CWAM is the investment manager to Wanger USA, Wanger International, Wanger Select and Wanger International Select (together, the Columbia Wanger Funds) and the Columbia Acorn Family of Funds.
Investors should consider the investment objectives, risks, charges and expenses of a mutual fund carefully before investing. For a free prospectus, which contains this and other important information about the Fund, contact your financial adviser or insurance company or contact 1-888-4-WANGER. Read the prospectus carefully before investing.
An important note: Columbia Wanger Funds are available for purchase through variable annuity contracts and variable life insurance policies offered by the separate accounts of participating insurance companies and qualified pension or retirement plans.
The views expressed in "Genetic Science" and in the Performance Review reflect the current views of the respective authors. These views are not guarantees of future performance and involve certain risks, uncertainties and assumptions that are difficult to predict so actual outcomes and results may differ significantly from the views expressed. These views are subject to change at any time based upon economic, market or other conditions and the respective parties disclaim any responsibility to update such views. These views may not be relied on as investment advice and, because investment decisions for a Columbia Wanger Fund are based on numerous factors, may not be relied on as an indication of trading intent on behalf of any particular Columbia Wanger Fund. References to specific company securities should not be construed as a recommendation or investment advice.
1
Wanger Select 2012 Semiannual Report
Understanding Your Expenses
As a shareholder, you incur three types of costs. There are transaction costs, which generally include sales charges on purchases and may include redemption fees. There are also ongoing costs, which generally include management fees and other Fund expenses. Lastly, there may be additional fees or charges imposed by the insurance company that sponsors your variable annuity and/or variable life insurance product. The following information is intended to help you understand your ongoing costs (in dollars) of investing in the Fund and to help you compare these costs with the ongoing costs of investing in other mutual funds.
Analyzing your Fund's expenses
To illustrate these ongoing costs, we have provided an example and calculated the expenses paid by investors in the Fund during the period. The actual and hypothetical information in the table below is based on an initial investment of $1,000 at the beginning of the period indicated and held for the entire period. Expense information is calculated two ways and each method provides you with different information. The amount listed in the "Actual" column is calculated using the Fund's actual operating expenses and total return for the period. You may use the Actual information, together with the amount invested, to estimate the expenses that you paid over the period. Simply divide your account value by $1,000 (for example, an $8,600 account value divided by $1,000 = 8.6), then multiply the results by the expenses paid during the period under the Actual column. The amount listed in the "Hypothetical" column assumes a 5% annual rate of return before expenses (which is not the Fund's actual return) and then applies the Fund's actual expense ratio for the period to the hypothetical return. You should not use the hypothetical account values and expenses to estimate either your actual account balance at the end of the period or the expenses you paid during the period. See "Compare with other funds" below for details on how to use the hypothetical data.
Compare with other funds
Since all mutual funds are required to include the same hypothetical calculations about expenses in shareholder reports, you can use this information to compare the ongoing cost of investing in the Fund with other funds. To do so, compare the hypothetical example with the 5% hypothetical examples that appear in the shareholder reports of other funds. As you compare hypothetical examples of other funds, it is important to note that hypothetical examples are meant to highlight the ongoing cost of investing in a fund only and do not reflect any transaction costs, such as sales charges, redemption or exchange fees. Therefore, the hypothetical calculations are useful in comparing ongoing costs only, and will not help you determine the relative total costs of owning different funds. If transaction costs were included in these calculations, your costs would be higher.
January 1, 2012 – June 30, 2012
| Account value at the beginning of the period ($) | Account value at the end of the period ($) | Expenses paid during period ($) | Fund's annualized expense ratio (%)* | ||||||||||||||||||||||||||||
| Actual | Hypothetical | Actual | Hypothetical | Actual | Hypothetical | ||||||||||||||||||||||||||
| Wanger Select | 1,000.00 | 1,000.00 | 1,086.10 | 1,020.24 | 4.82 | 4.67 | 0.93 | ||||||||||||||||||||||||
* Expenses paid during the period are equal to the Fund's annualized expense ratio, multiplied by the average account value over the period, then multiplied by the number of days in the Fund's most recent fiscal half-year and divided by 366.
It is important to note that the expense amounts shown in the table are meant to highlight only ongoing costs of investing in the Fund. Expenses paid during the period do not include any insurance charges imposed by your insurance company's separate account. The hypothetical example provided is useful in comparing ongoing costs only and will not help you determine the relative total costs of owning different funds whose shareholders may incur transaction costs.
2
Wanger Select 2012 Semiannual Report

Genetic Science
Genetic theory began with Gregor Mendel, a friar who in the middle 19th century meticulously bred different types of peas and tracked traits of offspring. He discovered recessive genes, which are carried by one generation but expressed in the next if both parents have that gene. Human genetic studies began a few decades later. In 1872, Huntington's disease was the first genetic disease identified by scientific research.1
Humans normally have 23 pairs of chromosomes, with half of each pair inherited from each parent. The chromosomes combined consist of over 20,000 genes. These genes ultimately consist of over 3 billion units of four different nitrogenous bases, labeled by their first letters: A, G, C and T.2
DNA, the double helix structure of bases assembled into genes, was discovered by James Watson and Francis Crick in 1953. Various genes were identified over the next several decades. The Human Genome Project, an effort to sequence and identify all genes and bases in human DNA, started in 1990. After $2.7 billion of expenditures over 13 years, a composite genome from three people was specified.3
Gene Sequencing
Kevin Davies' book, The $1,000 Genome, discusses the incredible progress made in gene sequencing technology. First generation sequencing used bacteria to purify and grow DNA fragments utilizing equipment made by Applied Biosystems, which dominated the market for 15 years.4 Hundreds of machines labored for years to complete the Human Genome Project sequencing, at a direct cost of tens of millions of dollars.5
A company called 454 Life Sciences, later acquired by Roche, developed a second generation sequencer. Utilizing a semiconductor chip with thousands of wells, DNA fragments were sequenced in parallel via real-time image processing. First shipped in 2005, the $500,000 machines then sold as fast as they could be built. James Watson's genome was sequenced in 2007 at a cost of $1 million.6
In 2006, Solexa shipped a sequencing machine that also sequenced in parallel, but had throughput and cost advantages. Illumina bought Solexa later that year. By 2007, the equipment could sequence a human's DNA at a cost of $100,000.7 Illumina subsequently created faster and more accurate machines. In early 2010, it pushed the cost of human genome sequencing down to $10,000.8 Service company Knome currently offers full genome sequencing via Illumina equipment, plus interpretation of results, for $4,998.9 Roche recently attempted to acquire Illumina.10
Third generation machines, often utilizing nanotechnology as well as parallel sequencing and faster data processing chips, should cut the cost of sequencing a human genome to well below $1,000, Davies notes.11 Pacific Biosciences of California claimed a potential 30,000-fold speed increase via sequencing in real time as DNA is replicated. Another company, Oxford Nanopore, was working on sequencing via measurement of electric current passing through bases.12 Ion Torrent Systems measures the pH of bases streaming through pores.13
Davies calculated that the cost of DNA sequencing fell 50% a year through 2005, and then by an amazing 90% a year due to a series of disruptive technologies.14 He does not predict when a hand-held "Star Trek Medical Tricorder," capable of reading the DNA of a patient and his disease and then prescribing personalized medicine, will be available, but the world seems headed in that direction.
Personal Genomic Services
It doesn't take a full genome sequence to determine genetic characteristics such as ancestry and possible risks of disease. In November 2007, deCODEme and 23andMe launched competing $1,000 services. Processing cheek swab or saliva DNA on equipment utilizing specialized chips, they sampled up to 600,000 bases, 0.02% of the total, and looked for differences in bases between people, called single nucleotide polymorphisms (SNPs).15 By correlating SNPs with known ancestry and disease databases, the companies provided statistical probabilities to clients based on their DNA samples.
Since 2007, deCODEme has had financial problems; it currently offers the service for $1,100, including updates.16 23andMe currently charges $207 for an initial sampling and a one-year subscription for updates. According to its website, 23andMe provides probabilities for 118 diseases, shows likely responses to 20 drugs, and determines whether clients' children could be at risk for any of 44 inherited diseases.17 Navigenics has also entered the market and provides genetic counseling as well as data.
The personal genomic services companies update disease probabilities as additional data is analyzed. Probabilities can and do change, sometimes drastically, as new correlations and additional SNPs are incorporated into a person's profile. It's somewhat disconcerting that, according to Davies, Navigenics and 23andMe disagree qualitatively on one-third of diseases.18
As more of the population gets increasingly more genes sequenced, more data becomes available and the relationships between genes, health and responses to drugs become better known. Full genome sequencing will likely show an average of three million SNPs per person,19 creating an enormous data management problem as well as new understandings of relationships between genes and diseases.
Limits to Predicting Diseases
Recent research published in Science Translational Medicine titled, "The Predictive Capacity of Personal Genome Sequencing,"20 ingeniously addressed the theoretical potential for genes to predict common diseases. The underlying question was, of course, what are the odds of someone with a specific genome getting
3
Wanger Select 2012 Semiannual Report
a specific disease? According to the study, the answer can be determined by studying pairs of people with nearly identical genomes: identical twins. By comparing histories of 24 common diseases among identical twins versus fraternal twins, genetic determination of diseases were inferred.
The study concluded that for 19 of the 24 diseases a negative test score (below average risk) will hardly be reassuring because the odds of getting the disease will still be substantial, at 50% to 80% of the general population's odds. Over half of the ultimate victims of 12 diseases would have tested at below average risk, receiving a false sense of security. However, there was one disease category tested in the study, Alzheimer's disease, in which a negative test result might indicate as little as a 12% relative risk of disease compared to the general population.
Those testing positive for Alzheimer's, type 1 diabetes, male coronary heart disease and thyroid autoimmunity could account for over 75% of the patients developing the diseases. The study suggested that the utility of genetic tests will depend on the results of the individual tested, and cautions against complacency and unwise lifestyle choices for those testing negative.
I agree that some subscribers to personal genetics services could obtain valuable results. If, for example, someone learned that his probability of developing glaucoma was much higher than the 4% probability for the average person, the subscriber would more likely get regular glaucoma testing. This is of some value, assuming the stated odds are indeed properly calibrated, which may take years to confirm.
Inherited Diseases
Some inherited diseases, including cystic fibrosis, Tay-Sachs disease and sickle cell anemia, occur only when single defective genes are inherited from each parent. Other single gene diseases, such as Huntington's, are inherited with 50% odds of getting the gene and disease if just one parent is afflicted.
Dozens of rare genetic diseases affect newborns, many of which can be addressed by diet or vitamins.21 Quick diagnosis is often crucial as permanent damage can occur otherwise. As of March 2010, newborns were tested for 29 genetic diseases in most states.22
Sometimes only a tendency to contract a disease is inherited. One version of a specific gene mutation implies a 65% to 85% lifetime probability of a woman developing breast cancer, while another version implies a 45% to 85% probability.23 However, only 5% to 10% of breast cancer patients have those genes.24 Others get the disease with no apparent genetic correlation. Having those genes is a cause for concern, but not having them should not provide a lot of comfort.
Personalized Medicine
In 2003, Allen Roses, vice-president of genetics for GlaxoSmithKline, shocked consumers by stating that more than 90% of drugs work in just 30% to 50% of people.25 Roses was pushing the drug industry to pursue genetic testing rather than trial and error to determine which drugs work for a specific individual. Matt Ridley, in the 2006 version of his book, Genome, stated, "genetic diagnosis followed by conventional cure is probably the genome's greatest boon to medicine."26
Indeed, the lung cancer drug Iressa was approved in 2003 and creates a "miraculous response" in the 10% of patients with a specific genetic mutation of the disease. Herceptin was approved in 2006 to target the 25% of breast cancer patients who are afflicted with a specific genetic version of that disease. Likewise, targeted cancer drugs such as Avastin, Tarceva and Erbitux, are prescribed after genetic testing.27
On January 31, 2012, Kalydeco was approved to treat 1,200 cystic fibrosis patients, 4% of the total, who have a specific gene defect. It is the first drug to treat the defect rather than the symptoms of the disease, and has been termed "transformational" for those who can use it.28 The Cystic Fibrosis Foundation spurred development of the drug by helping to fund the development effort, and aided the process by creating a registry that includes the genetic characteristics of the disease for 90% of American patients.
Some drugs appear to work for most people, but have widely varying optimal dosages. Variations in genes largely determine how quickly people metabolize drugs.29 "Unanticipated drug responses are estimated to result in two million hospitalizations and 100,000 deaths in the United States each year," writes Nicholas Gillham in his book, Genes, Chromosomes, and Disease.30
In the case of blood thinner warfarin (brand name Coumadin), patients exhibit a tenfold range in ability to metabolize the drug.31 Too little of it can result in a stroke, but too much can cause bleeding and hemorrhaging.32 The FDA now provides dosage information on the drug's label based on variants of two genes.33 About 10% of labels for FDA-approved drugs now have pharmacogenomics information.34
Investment Implications
Genetic science is rapidly advancing and will likely revolutionize many aspects of medical care. It is starting to be helpful in predicting susceptibility to common diseases, but will likely be more valuable in identifying risks of inherited diseases and in determining appropriate drug usage and dosage. Given the complexity of the subject, there will likely be increasing demands for genetic counselors.
There exists uncertainty regarding how the FDA and others will regulate genetic tests, as well as the extent to which genetic discoveries will be patentable. On the investment front, we have looked for and invested in opportunities created by genetic science. We've focused on a number of biotechnology and drug companies addressing
4
Wanger Select 2012 Semiannual Report
personalized medicine and niche orphan diseases and we will continue to look for additional opportunities.


Charles P. McQuaid
President and Chief Investment Officer
Columbia Wanger Asset Management, LLC
The information and data provided in this analysis are derived from sources that we deem to be reliable and accurate. These views are not guarantees of future performance and involve certain risks, uncertainties and assumptions that are difficult to predict so actual outcomes and results may differ significantly from the views expressed. The views/opinions expressed in this essay are those of the author and not of the Wanger Advisors Trust Board, are subject to change at any time based upon economic, market or other conditions, may differ from views expressed by other Columbia Management associates and the respective parties disclaim any responsibility to update such views. These views may not be relied on as investment advice and, because investment decisions for a Columbia Wanger Fund are based on numerous factors, may not be relied on as an indication of trading intent on behalf of any particular Columbia Wanger Fund.
1 Gillham, Nicholas Wright, Genes, Chromosomes, and Disease, (Upper Saddle River, New Jersey, FT Press Science 2011) p. 5.
2 Davies, Kevin, The $1,000 Genome, (New York, New York, Free Press 2010) p. 1, 23.
3 Ibid., p. 9-11.
4 Ibid., p. 79.
5 Ibid., p. 90.
6 Ibid., p. 94.
7 Ibid., p. 111.
8 Gillham, Nicholas Wright, op. cit., p. 244.
9 Davies, Kevin, op. cit., p. 209. www.knome.com.
10 Falconi, Marta, "Roche To Return Tendered Illumina Shares to Shareholders," Dow Jones News Service, April 23, 2012.
11 Davies, Kevin, op. cit., p. 231.
12 Davies, Kevin, op. cit., p. 239.
13 Ibid., p. 245-246.
14 Ibid., p. 133. Disruptive technologies refers to making much more than incremental advances by utilizing a whole new or additional approach. In this context, the parallel sequencing and use of other detection mechanisms such as pH or electric conductivity have caused the cost of sequencing to plunge far faster than a regular learning curve might suggest.
15 Ibid., p. 31-32.
16 Ibid., p. 55,63. www.decodeme.com.
17 www.23andme.com.
18 Davies, Kevin, op. cit., p. 149.
19 Ibid., p. 23.
20 Roberts, Nicholas J., and Vogelstein, Joshua T., et al, "The Predictive Capacity of Personal Genome Sequencing," Science Translational Medicine, Rapid Publication, April 2, 2012, stm.sciencemag.org.
21 Gillham, Nicholas Wright, op. cit., p. 204.
22 Ibid., p. 201.
23 Ibid., p. 184.
24 Ibid., p. 116.
25 Connor, Steve, "Glaxo Chief: Our Drugs Do Not Work On Most Patients," The Independent, December 8, 2003.
26 Ridley, Matt, Genome, (New York, New York, First Harper Perennial, 2006) p. 257.
27 Davies, Kevin, op. cit., p. 255-256.
28 Usdin, Steve, "Product Discovery & Development: Kalydescopic Vision," BioCentury, March 5, 2012, Volume 20, Number 10, p. A2.
29 Davies, Kevin, op. cit., p. 257.
30 Gillham, Nicholas Wright, op. cit., p. 237.
31 Davies, Kevin, op. cit., p. 257.
32 Gillham, Nicholas Wright, op. cit., p. 238.
33 Davies, Kevin, op. cit., p. 257.
34 Hamburg, M.D., Margaret A., and Collins, M.D., Ph.D., Francis S., "The Path to Personalized Medicine," New England Journal of Medicine, July 22, 2010, Volume 363, p. 301-304, www.nejm.org.
5
Wanger Select 2012 Semiannual Report

Performance Review Wanger Select
 |  | ||||||
| Ben Andrews Lead Portfolio Manager | Robert A. Chalupnik Co-Portfolio Manager | ||||||
Performance data shown represents past performance and is not a guarantee of future results. The investment return and principal value will fluctuate so that shares, when redeemed, may be worth more or less than the original cost. Current performance may be lower or higher than the performance data shown. Please visit columbiamanagement.com for most recent month-end performance updates.
Wanger Select ended the six months through June 30, 2012, up 8.61%, outperforming the 7.90% gain of its primary benchmark, the S&P MidCap 400 Index. The S&P 500 Index, a general barometer of U.S. market large-cap performance, was up 9.49% for the same period.
During the first quarter of 2012, we saw some strengthening in U.S. economic indicators and hoped that improvements might continue for a little while. Unfortunately, they didn't. U.S., European and Asian economic indicators turned down in the second quarter. Many of the stocks that added to the Fund's outperformance in the first quarter took it away in the second quarter.
Looking at contributors and detractors to performance, credit card company Discover Financial Services added two percent to the portfolio's performance, while insurance company CNO Financial and communications tower owner SBA Communications each added roughly one percent to portfolio gains. The larger detractors to the Fund's six-month performance were oil and gas producers Houston American Energy and Canacol, and teen apparel retailer Abercrombie & Fitch. Each cost the portfolio between 62 and 73 basis points.
During the period, we added seven new companies to the portfolio, while exiting from five companies. Our new positions include midwest bank Associated Banc-Corp, real estate company Dupont Fabros Technology, niche specialty chemicals provider FMC Corporation, healthcare product distributor Henry Schein, dispensing systems manufacturer Nordson, cancer therapies manufacturer Seattle Genetics and Vail Resorts, a ski resort operator. WW Grainger, Continental Resources, Oshkosh, Waste Management and Safeway were sold based on what we believe will be slower future earnings growth at these companies.
When an economy is over leveraged, we believe a country has a choice to either grow, collapse, or inflate its way out of the problem. In our opinion, the western world has been doing a pretty good job of inflating but political leadership has done a poor job of providing a path to growth. The United States' path has been fraught with consistently changing regulation, controversial interpretations of legislation and court rulings, and concerns that new anti-business legislation will be passed. Each has helped cause businesses to sit back and wait. The western economies have been driven by huge government deficit spending and have bumped along with growth rates in the low single digits, prompting continuous investor concerns of possible recession.
We have struggled to outperform the Fund's primary benchmark. To address this, we have been slowly changing the mix of the Fund's core growth holdings and the Fund's opportunistic holdings within the portfolio. In an environment in which the economy is struggling to deliver consecutive quarters of increasing growth, we believe core growth stocks should perform better than companies trying to turn around their operations in a weak economic environment (which is the case with many of the Fund's opportunistic holdings). Though the Fund's performance weakened in the second quarter, we feel strongly that we are on the right path as we near the end of this transition within the Fund's portfolio.
Risks include stock market fluctuations due to economic and business developments. The Fund also has potentially greater price volatility due to the Fund's concentration in a limited number of stocks of mid-size companies. The Fund is a non-diversified fund and may, therefore, have a greater risk of loss from a few issuers than a similar fund that invests more broadly. The Fund may not operate as a non-diversified fund at all times. International investments involve greater potential risks, including less regulation, currency fluctuations, economic instability and political developments.
Portfolio holdings are subject to change periodically and may not be representative of current holdings.
Fund's Positions in Mentioned Holdings
As a percentage of net assets, as of 6/30/12
| Discover Financial Services | 6.0 | % | |||||
| CNO Financial | 5.3 | ||||||
| SBA Communications | 4.1 | ||||||
| FMC Corporation | 1.4 | ||||||
| Abercrombie & Fitch | 1.4 | ||||||
| Canacol | 1.2 | ||||||
| Henry Schein | 1.2 | ||||||
| Associated Banc-Corp | 1.1 | ||||||
| Dupont Fabros Technology | 1.1 | ||||||
| Vail Resorts | 1.1 | ||||||
| Nordson | 1.0 | ||||||
| Seattle Genetics | 0.8 | ||||||
| Houston American Energy | 0.1 | ||||||
6
Wanger Select 2012 Semiannual Report
Growth of a $10,000 Investment in Wanger Select
February 1, 1999 (inception date) through June 30, 2012
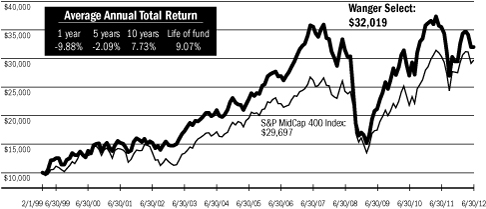
Performance data shown represents past performance and is not a guarantee of future results. The investment return and principal value will fluctuate so that shares, when redeemed, may be worth more or less than the original cost. Current performance may be lower or higher than the performance data shown. Performance results reflect any fee waivers or reimbursements of Fund expenses by the investment manager and/or any of its affiliates. Absent these fee waivers and/or expense reimbursement arrangements, performance results would have been lower. For daily and most recent month-end performance updates, please call 1-888-4-WANGER.
This graph compares the results of $10,000 invested in Wanger Select on February 1, 1999 (the date the Fund began operations) through June 30, 2012, to the S&P MidCap 400 Index, with dividends and capital gains reinvested. Although the index is provided for use in assessing the Fund's performance, the Fund's holdings may differ significantly from those in the index.
Top 10 Holdings
As a percentage of net assets, as of 6/30/12
| 1. Ametek Aerospace/Industrial Instruments | 6.1 | % | |||||
| 2. Discover Financial Services Credit Card Company | 6.0 | ||||||
| 3. Hertz Largest U.S. Rental Car Operator | 5.4 | ||||||
| 4. CNO Financial Group Life, Long-term Care & Medical Supplement Insurance | 5.3 | ||||||
| 5. SBA Communications Communications Towers | 4.1 | ||||||
| 6. Crown Castle International Communications Towers | 3.7 | ||||||
| 7. Donaldson Industrial Air Filtration | 3.4 | ||||||
| 8. Gaylord Entertainment Convention Hotels | 3.3 | ||||||
| 9. Pall Filtration & Fluids Clarification | 3.1 | ||||||
| 10. Coach Designer & Retailer of Branded Leather Accessories | 3.0 | ||||||
Top 5 Industries
As a percentage of net assets, as of 6/30/12
| Industrial Goods & Services | 21.3 | % | |||||
| Information | 20.3 | ||||||
| Consumer Goods & Services | 19.5 | ||||||
| Finance | 16.1 | ||||||
| Energy & Minerals | 8.4 | ||||||
Results as of June 30, 2012
| 2nd quarter | Year to date | 1 year | 5 years | 10 years | |||||||||||||||||||
| Wanger Select | -7.95 | % | 8.61 | % | -9.88 | % | -2.09 | % | 7.73 | % | |||||||||||||
| S&P MidCap 400 Index* | -4.93 | 7.90 | -2.33 | 2.55 | 8.21 | ||||||||||||||||||
| S&P 500 Index | -2.75 | 9.49 | 5.45 | 0.22 | 5.33 | ||||||||||||||||||
| Lipper Variable Underlying Mid-Cap Growth Funds Index | -5.97 | 8.38 | -4.69 | 2.12 | 7.56 | ||||||||||||||||||
* The Fund's primary benchmark.
NAV as of 6/30/12: $25.36
Performance numbers reflect all Fund expenses but do not include any fees and expenses imposed under your variable annuity or life insurance policy or qualified pension or retirement plan. If performance included the effect of these additional charges, it would be lower.
The Fund's annual operating expense ratio of 0.92% is stated as of the Fund's prospectus dated May 1, 2012, and differences in expense ratios disclosed elsewhere in this report may result from including fee waivers and expense reimbursements as well as different time periods used in calculating the ratios.
All results shown assume reinvestment of distributions and do not reflect taxes that a shareholder would pay on Fund distributions or the sale of Fund shares.
The S&P MidCap 400 Index is a market value-weighted index that tracks the performance of 400 mid-cap U.S. companies. The S&P 500 Index tracks the performance of 500 widely-held large capitalization U.S. stocks. Although the Fund typically invests in companies with market caps under $20 billion at the time of investment, the comparison to the S&P 500 Index is presented to show performance against a widely recognized market index. The Lipper Variable Underlying Mid-Cap Growth Funds Index is an equally weighted representation of the 30 largest variable insurance underlying funds in the Lipper Variable Underlying Mid-Cap Growth Funds Classification, and shows how the Fund's performance compares with returns of an index of funds with similar investment objectives. Indexes are not managed and do not incur fees or expenses. It is not possible to invest directly in an index.
Lipper Inc., a widely respected data provider in the industry, calculates an average total return (assuming reinvestment of distributions) for mutual funds with investment objectives similar to those of the Fund. Lipper makes no adjustment for the effect of sales loads.
Portfolio characteristics and holdings are subject to change periodically and may not be representative of current characteristics and holdings.
7
Wanger Select 2012 Semiannual Report
Wanger Select
Statement of Investments (Unaudited), June 30, 2012
| Number of Shares | Value | ||||||||||
| Equities – 97.7% | |||||||||||
| Industrial Goods & Services – 21.3% | |||||||||||
| Machinery – 16.1% | |||||||||||
| 300,500 | Ametek Aerospace/Industrial Instruments | $ | 14,997,955 | ||||||||
| 251,500 | Donaldson Industrial Air Filtration | 8,392,555 | |||||||||
| 138,000 | Pall Filtration & Fluids Clarification | 7,563,780 | |||||||||
| 180,000 | Kennametal Consumable Cutting Tools | 5,967,000 | |||||||||
| 50,000 | Nordson Dispensing Systems for Adhesives & Coatings | 2,564,500 | |||||||||
| 39,485,790 | |||||||||||
| Outsourcing Services – 2.2% | |||||||||||
| 225,000 | Quanta Services (a) Electrical & Telecom Construction Services | 5,415,750 | |||||||||
| Other Industrial Services – 1.6% | |||||||||||
| 103,500 | Expeditors International of Washington International Freight Forwarder | 4,010,625 | |||||||||
| Industrial Materials & Specialty Chemicals – 1.4% | |||||||||||
| 64,000 | FMC Corporation Niche Specialty Chemicals | 3,422,720 | |||||||||
| Total Industrial Goods & Services | 52,334,885 | ||||||||||
| Information – 20.3% | |||||||||||
| Mobile Communications – 8.1% | |||||||||||
| 177,000 | SBA Communications (a) Communications Towers | 10,097,850 | |||||||||
| 156,000 | Crown Castle International (a) Communications Towers | 9,150,960 | |||||||||
| 2,415,900 | Globalstar (a) (b) Satellite Mobile Voice & Data Carrier | 773,088 | |||||||||
| 20,021,898 | |||||||||||
| Computer Services – 2.9% | |||||||||||
| 743,400 | WNS - ADR (India) (a) Offshore BPO (Business Process Outsourcing) Services | 7,233,282 | |||||||||
| Contract Manufacturing – 2.8% | |||||||||||
| 839,733 | Sanmina-SCI (a) Electronic Manufacturing Services | 6,877,413 | |||||||||
| Computer Hardware & Related Equipment – 2.8% | |||||||||||
| 124,000 | Amphenol Electronic Connectors | 6,810,080 | |||||||||
| Number of Shares | Value | ||||||||||
| Instrumentation – 1.8% | |||||||||||
| 28,000 | Mettler Toledo International (a) Laboratory Equipment | $ | 4,363,800 | ||||||||
| Business Software – 0.8% | |||||||||||
| 27,500 | Concur Technologies (a) Web Enabled Cost & Expense Management Software | 1,872,750 | |||||||||
| Semiconductors & Related Equipment – 0.7% | |||||||||||
| 250,000 | Atmel (a) Microcontrollers, Radio Frequency & Memory Semiconductors | 1,675,000 | |||||||||
| Advertising – 0.4% | |||||||||||
| 1,017,100 | VisionChina Media - ADR (China) (a) Advertising on Digital Screens in China's Mass Transit System | 945,903 | |||||||||
| Total Information | 49,800,126 | ||||||||||
| Consumer Goods & Services – 19.5% | |||||||||||
| Travel – 9.8% | |||||||||||
| 1,040,000 | Hertz (a) Largest U.S. Rental Car Operator | 13,312,000 | |||||||||
| 210,000 | Gaylord Entertainment (a) Convention Hotels | 8,097,600 | |||||||||
| 52,000 | Vail Resorts Ski Resort Operator & Developer | 2,604,160 | |||||||||
| 24,013,760 | |||||||||||
| Retail – 3.9% | |||||||||||
| 74,600 | lululemon athletica (a) Premium Active Apparel Retailer | 4,448,398 | |||||||||
| 99,000 | Abercrombie & Fitch Teen Apparel Retailer | 3,379,860 | |||||||||
| 35,000 | Tiffany & Co. Luxury Good Retailer | 1,853,250 | |||||||||
| 9,681,508 | |||||||||||
| Apparel – 3.0% | |||||||||||
| 127,500 | Coach Designer & Retailer of Branded Leather Accessories | 7,456,200 | |||||||||
| Casinos & Gaming – 1.3% | |||||||||||
| 45,663,000 | RexLot Holdings (China) Lottery Equipment Supplier in China | 3,271,029 | |||||||||
| Educational Services – 1.3% | |||||||||||
| 52,625 | ITT Educational Services (a) (b) Postsecondary Degree Services | 3,196,969 | |||||||||
See accompanying notes to financial statements.
8
Wanger Select 2012 Semiannual Report
Wanger Select
Statement of Investments (Unaudited), June 30, 2012
| Number of Shares | Value | ||||||||||
| Other Consumer Services – 0.1% | |||||||||||
| 161,000 | IFM Investments (Century 21 China RE) - ADR (China) (a) Provide Real Estate Services in China | $ | 175,490 | ||||||||
| Food & Beverage – 0.1% | |||||||||||
| 307,000 | GLG Life Tech (Canada) (a) (b) (c) All-natural Sweetener Extracted from the Stevia Plant | 127,098 | |||||||||
| Total Consumer Goods & Services | 47,922,054 | ||||||||||
| Finance – 16.1% | |||||||||||
| Credit Cards – 5.9% | |||||||||||
| 423,200 | Discover Financial Services Credit Card Company | 14,634,256 | |||||||||
| Insurance – 5.3% | |||||||||||
| 1,673,000 | CNO Financial Group Life, Long-term Care & Medical Supplement Insurance | 13,049,400 | |||||||||
| Banks – 3.5% | |||||||||||
| 119,000 | City National Bank & Asset Manager | 5,781,020 | |||||||||
| 210,000 | Associated Banc-Corp Midwest Bank | 2,769,900 | |||||||||
| 8,550,920 | |||||||||||
| Brokerage & Money Management – 1.4% | |||||||||||
| 171,000 | SEI Investments Mutual Fund Administration & Investment Management | 3,401,190 | |||||||||
| Total Finance | 39,635,766 | ||||||||||
| Energy & Minerals – 8.4% | |||||||||||
| Oil & Gas Producers – 5.3% | |||||||||||
| 282,000 | Pacific Rubiales Energy (Colombia) Oil Production & Exploration in Colombia | 5,971,830 | |||||||||
| 6,520,700 | Canacol (Colombia) (a) Oil Producer in South America | 2,914,172 | |||||||||
| 8,714,000 | Petrodorado (Colombia) (a) | 1,369,453 | |||||||||
| 5,714,000 | Petrodorado - Warrants (Colombia) (a) (d) Oil & Gas Exploration & Production in Colombia, Peru & Paraguay | 80,819 | |||||||||
| 7,187,900 | Shamaran Petroleum (Iraq) (a) Oil Exploration in Kurdistan | 1,200,219 | |||||||||
| Number of Shares | Value | ||||||||||
| 3,600,000 | Canadian Overseas Petroleum (United Kingdom) (a) (d) | $ | 627,993 | ||||||||
| 1,800,000 | Canadian Overseas Petroleum - Warrants (United Kingdom) (a) (c) (d) | 34,830 | |||||||||
| 184,000 | Canadian Overseas Petroleum (United Kingdom) (a) Oil & Gas Exploration/Production in the North Sea | 33,435 | |||||||||
| 2,575,000 | Petromanas (Canada) (a) Exploring for Oil in Albania | 543,782 | |||||||||
| 305,000 | Houston American Energy (a) (b) Oil & Gas Exploration/Production in Colombia | 341,600 | |||||||||
| 13,118,133 | |||||||||||
| Agricultural Commodities – 1.1% | |||||||||||
| 261,363 | Union Agriculture Group (Uruguay) (a) (c) (d) Farmland Operator in Uruguay | 2,558,744 | |||||||||
| 1,941,600 | Eacom Timber (Canada) (a) Canadian Lumber Producer | 190,708 | |||||||||
| 2,749,452 | |||||||||||
| Alternative Energy – 1.0% | |||||||||||
| 422,600 | Canadian Solar (China) (a) (b) Solar Cell & Module Manufacturer | 1,521,360 | |||||||||
| 582,600 | Synthesis Energy Systems (China) (a) Owner/Operator of Gasification Plants | 710,772 | |||||||||
| 252,000 | Real Goods Solar (a) Residential Solar Energy Installer | 284,760 | |||||||||
| 2,516,892 | |||||||||||
| Mining – 0.7% | |||||||||||
| 152,000 | Kirkland Lake Gold (Canada) (a) Gold Mining | 1,636,303 | |||||||||
| Oil Services – 0.3% | |||||||||||
| 1,708,700 | Tuscany International Drilling (Colombia) (a) South America-based Drilling Rig Contractor | 662,937 | |||||||||
| Total Energy & Minerals | 20,683,717 | ||||||||||
See accompanying notes to financial statements.
9
Wanger Select 2012 Semiannual Report
Wanger Select
Statement of Investments (Unaudited), June 30, 2012
| Number of Shares | Value | ||||||||||
| Other Industries – 6.6% | |||||||||||
| Real Estate – 3.5% | |||||||||||
| 314,500 | Biomed Realty Trust Life Science-focused Office Buildings | $ | 5,874,860 | ||||||||
| 93,000 | DuPont Fabros Technology Technology-focused Office Buildings | 2,656,080 | |||||||||
| 8,530,940 | |||||||||||
| Transportation – 1.8% | |||||||||||
| 75,000 | JB Hunt Transport Services Truck & Intermodal Carrier | 4,470,000 | |||||||||
| Regulated Utilities – 1.3% | |||||||||||
| 79,000 | Wisconsin Energy Wisconsin Utility | 3,126,030 | |||||||||
| Total Other Industries | 16,126,970 | ||||||||||
| Health Care – 5.5% | |||||||||||
| Biotechnology & Drug Delivery – 2.4% | |||||||||||
| 440,000 | NPS Pharmaceuticals (a) Orphan Drugs & Healthy Royalties | 3,788,400 | |||||||||
| 77,000 | Seattle Genetics (a) (b) Antibody-based Therapies for Cancer | 1,955,030 | |||||||||
| 5,743,430 | |||||||||||
| Pharmaceuticals – 1.9% | |||||||||||
| 300,000 | Akorn (a) Develops, Manufactures & Sells Specialty Generic Drugs | 4,731,000 | |||||||||
| Medical Supplies – 1.2% | |||||||||||
| 37,000 | Henry Schein (a) Largest Distributor of Healthcare Products | 2,904,130 | |||||||||
| Total Health Care | 13,378,560 | ||||||||||
| Total Equities (Cost: $199,236,708) – 97.7% | 239,882,078 | ||||||||||
| Number of Shares | Value | ||||||||||
| Securities Lending Collateral – 2.4% | |||||||||||
| 5,981,175 | Dreyfus Government Cash Management Fund (7 day yield of 0.01%) (e) | $ | 5,981,175 | ||||||||
| Total Securities Lending Collateral (Cost: $5,981,175) | 5,981,175 | ||||||||||
| Total Investments (Cost: $205,217,883) – 100.1% (f) (g) | 245,863,253 | ||||||||||
| Obligation to Return Collateral for Securities Loaned – (2.4)% | (5,981,175 | ) | |||||||||
| Cash and Other Assets Less Liabilities – 2.3% | 5,653,184 | ||||||||||
| Total Net Assets – 100.0% | $ | 245,535,262 | |||||||||
ADR = American Depositary Receipts
Notes to Statement of Investments (dollar values in thousands)
(a) Non-income producing security.
(b) All or a portion of this security was on loan at June 30, 2012. The total market value of securities on loan at June 30, 2012 was $5,746,973.
(c) Illiquid security.
(d) Denotes a restricted security, which is subject to restrictions on resale under federal securities laws. These securities are valued at fair value determined in good faith under consistently applied procedures established by the Board of Trustees. At June 30, 2012, the market value of these securities amounted to $3,302,386 which represented 1.34% of total net assets.
Additional information on these securities is as follows:
Security | Acquisition Dates | Shares | Cost | Value | |||||||||||||||
| Union Agriculture Group | 12/8/10 - 6/27/12 | 261,363 | $ | 2,999,999 | $ | 2,558,744 | |||||||||||||
| Canadian Overseas Petroleum | 11/24/10 | 3,600,000 | 1,539,065 | 627,993 | |||||||||||||||
| Petrodorado - Warrants | 11/20/09 | 5,714,000 | 706,004 | 80,819 | |||||||||||||||
| Canadian Overseas Petroleum - Warrants | 11/24/10 | 1,800,000 | 225,295 | 34,830 | |||||||||||||||
| $ | 5,470,363 | $ | 3,302,386 | ||||||||||||||||
(e) Investment made with cash collateral received from securities lending activity.
(f) At June 30, 2012, for federal income tax purposes, the cost of investments was $205,217,883 and net unrealized appreciation was $40,645,370 consisting of gross unrealized appreciation of $73,898,544 and gross unrealized depreciation of $33,253,174.
See accompanying notes to financial statements.
10
Wanger Select 2012 Semiannual Report
Wanger Select
Statement of Investments (Unaudited), June 30, 2012
(g) On June 30, 2012, the Fund's total investments were denominated in currencies as follows:
| Currency | Value | Percentage of Net Assets | |||||||||
| United States Dollar | $ | 221,344,568 | 90.1 | ||||||||
| Canadian Dollar | 15,266,481 | 6.2 | |||||||||
| Other currencies less than 5% of total net assets | 3,271,029 | 1.4 | |||||||||
| Total Foreign Portfolio | $ | 239,882,078 | 97.7 | ||||||||
Fair Value Measurements
Various inputs are used in determining the value of the Fund's investments, following the input prioritization hierarchy established by GAAP. These inputs are summarized in the three broad levels listed below:
• Level 1 – quoted prices in active markets for identical securities
• Level 2 – prices determined using other significant observable inputs (including quoted prices for similar securities, interest rates, prepayment speeds, credit risk and others)
• Level 3 – prices determined using significant unobservable inputs where quoted prices or observable inputs are unavailable or less reliable (including management's own assumptions about the factors market participants would use in pricing an investment)
The inputs or methodology used for valuing securities are not necessarily an indication of the risk associated with investing in those securities.
Examples of the types of securities in which the Fund would typically invest and how they are classified within this hierarchy are as follows. Typical Level 1 securities include exchange traded domestic equities, mutual funds whose NAVs are published each day and exchange traded foreign equities that are not statistically fair valued. Typical Level 2 securities include exchange traded foreign equities that are statistically fair valued and short-term investments valued at amortized cost. Additionally, securities fair valued by the Valuation Committee (the Committee) of the Fund's Board of Trustees (the Board) that rely on significant observable inputs are also included in Level 2. Typical Level 3 securities include any security fair valued by the Committee that relies on significant unobservable inputs.
Under the direction of the Board, the Committee is responsible for carrying out the valuation procedures approved by the Board.
The Committee meets as necessary, and no less frequently than quarterly, to determine fair values for securities for which market quotations are not readily available or for which the investment manager believes that available market quotations are unreliable, and to review the continuing appropriateness of the current value of any security subject to the Trust's Portfolio Pricing Policy and the pricing procedures of the investment manager (the Policies). The Policies address, among other things: circumstances under which market quotations will be deemed readily available; selection of third party pricing vendors; appropriate pricing methodologies; events that require fair valuation and fair value techniques; and circumstances under which securities will be deemed to pose a potential for stale pricing, including when securities are illiquid, restricted, or in default. The Committee may also meet to discuss additional valuation matters, which may include review of back-testing results, review of time-sensitive information or approval of other valuation related actions, and to review the appropriateness of the Policies.
For investments categorized as Level 3, the significant unobservable inputs used in the fair value measurement of the Funds' securities may include: (i) data specific to the issuer or comparable issuers, (ii) general market or specific sector news and (iii) quoted prices and specific or similar security transactions. The Committee considers this data and any changes from prior periods in order to assess the reasonableness of observable and unobservable inputs, any assumptions or internal models used to value those securities and changes in fair value. Significant changes in any of these factors could result in lower or higher fair value measurements. Various factors impact the frequency of monitoring (which may occur as often as daily), however the Committee may determine that changes to inputs, assumptions and models are not required with the same frequency.
The following table summarizes the inputs used, as of June 30, 2012, in valuing the Fund's assets:
Investment Type | Quoted Prices (Level 1) | Other Significant Observable Inputs (Level 2) | Significant Unobservable Inputs (Level 3) | Total | |||||||||||||||
| Equities | |||||||||||||||||||
| Industrial Goods & Services | $ | 52,334,885 | $ | — | $ | — | $ | 52,334,885 | |||||||||||
| Information | 49,800,126 | — | — | 49,800,126 | |||||||||||||||
| Consumer Goods & Services | 44,523,927 | 3,398,127 | — | 47,922,054 | |||||||||||||||
| Finance | 39,635,766 | — | — | 39,635,766 | |||||||||||||||
| Energy & Minerals | 17,381,331 | 743,642 | 2,558,744 | 20,683,717 | |||||||||||||||
| Other Industries | 16,126,970 | — | — | 16,126,970 | |||||||||||||||
| Health Care | 13,378,560 | — | — | 13,378,560 | |||||||||||||||
| Total Equities | 233,181,565 | 4,141,769 | 2,558,744 | 239,882,078 | |||||||||||||||
| Total Securities Lending Collateral | 5,981,175 | — | — | 5,981,175 | |||||||||||||||
| Total Investments | $ | 239,162,740 | $ | 4,141,769 | $ | 2,558,744 | $ | 245,863,253 | |||||||||||
The Fund's assets assigned to the Level 2 input category are generally valued using a market approach, in which a security's value is determined through its correlation to prices and information from observable market transactions for similar or identical assets. Foreign equities are generally valued at the last sale price on the foreign exchange or market on which they trade. The Fund may use a statistical fair valuation model, in accordance with the policy adopted by the Board, provided by an independent third party to value securities principally traded in foreign markets in order to adjust for possible stale pricing that may occur between the close of the foreign exchanges and the time for valuation. These models take into account available market data including intraday index, ADR, and ETF movements. Securities acquired via private placement that have a holding period or an extended settlement period are valued at a discount to the same shares that are trading freely on the market. These discounts are determined by the investment manager's experience with similar securities or situations. Factors may include, but are not limited to, trade volume, shares outstanding and stock price. Warrants which do not trade are valued as a percentage of the actively trading common stock using a model, based on Black Scholes. Securities which have halted or temporarily stopped trading are valued at the last sale and adjusted by a premium or a discount to account for the anticipated re-opening price. These adjustments are determined by the investment manager's experience with similar securities or situations.
See accompanying notes to financial statements.
11
Wanger Select 2012 Semiannual Report
Wanger Select
Statement of Investments (Unaudited), June 30, 2012
The following table shows transfers between Level 1 and Level 2 of the fair value hierarchy:
| Transfers In | Transfers Out | ||||||||||||||
| Level 1 | Level 2 | Level 1 | Level 2 | ||||||||||||
| $ | — | $ | 276,300 | $ | 276,300 | $ | — | ||||||||
Financial assets were transferred from Level 1 to Level 2 as trading halted during the period.
The following table reconciles asset balances for the period ending June 30, 2012, in which significant observable and/or unobservable inputs (Level 3) were used in determining value:
| Investments in Securities | Balance as of December 31, 2011 | Realized Gain/(Loss) | Change in Unrealized Appreciation (Depreciation) | Purchases | Sales | Transfers into Level 3 | Transfers out of Level 3 | Balance as of June 30, 2012 | |||||||||||||||||||||||||||
| Equities | |||||||||||||||||||||||||||||||||||
| Energy & Materials | $ | 2,492,500 | $ | — | $ | 66,244 | $ | — | $ | — | $ | — | $ | — | $ | 2,558,744 | |||||||||||||||||||
| $ | 2,492,500 | $ | — | $ | 66,244 | $ | — | $ | — | $ | — | $ | — | $ | 2,558,744 | ||||||||||||||||||||
The information in the above reconciliation table represents fiscal year to date activity for any securities identified as using Level 3 inputs at either the beginning or the end of the current fiscal period.
The change in unrealized appreciation attributed to securities owned at June 30, 2012, which were valued using significant unobservable inputs (Level 3), amounted to $66,244.
| Fair Value at 06/30/12 | Valuation Technique(s) | Unobservable Input(s) | Range (Weighted Average) | ||||||||||||||||
| Equities | $ | 2,558,744 | Market comparable companies | Discount for lack of marketability | -2% to -28% (-12%) | ||||||||||||||
Certain common stock classified as Level 3 are valued at fair value, using a market approach, as determined in good faith under consistently applied procedures established by and under the general supervision of the Board. To determine fair value for these securities, for which no market exists, the Committee utilizes the valuation technique it deems most appropriate in the circumstances, using some unobservable inputs, which may include but are not limited to trades of similar securities, estimated earnings of the company, market multiples derived from a set of comparable companies, and the position of the security within the company's capital structure. Significant increases or decreases to any of these inputs could result in a significantly lower or higher fair value measurement. Generally, a change in estimated earnings of a company may result in a change to the comparable companies and market multiples utilized.
See accompanying notes to financial statements.
12
Wanger Select 2012 Semiannual Report
Statement of Assets and Liabilities
June 30, 2012 (Unaudited)
| Assets: | |||||||
| Investments, at cost | $ | 205,217,883 | |||||
| Investments, at value (including securities on loan of $5,746,973) | $ | 245,863,253 | |||||
| Cash | 5,211,857 | ||||||
| Receivable for: | |||||||
| Investments sold | 394,363 | ||||||
| Fund shares sold | 58,261 | ||||||
| Securities lending income | 75,048 | ||||||
| Dividends | 145,597 | ||||||
| Prepaid expenses | 1,345 | ||||||
| Total Assets | 251,749,724 | ||||||
| Liabilities: | |||||||
| Collateral on securities loaned | 5,981,175 | ||||||
| Payable for: | |||||||
| Fund shares repurchased | 125,219 | ||||||
| Investment advisory fee | 5,213 | ||||||
| Administration fee | 326 | ||||||
| Transfer agent fee | 1 | ||||||
| Trustees' fees | 25,839 | ||||||
| Custody fee | 1,843 | ||||||
| Reports to shareholders | 56,273 | ||||||
| Chief compliance officer expenses | 487 | ||||||
| Other liabilities | 18,086 | ||||||
| Total Liabilities | 6,214,462 | ||||||
| Net Assets | $ | 245,535,262 | |||||
| Composition of Net Assets: | |||||||
| Paid-in capital | $ | 209,792,900 | |||||
| Accumulated net investment loss | (73,916 | ) | |||||
| Accumulated net realized loss | (4,829,678 | ) | |||||
| Net unrealized appreciation (depreciation) on: | |||||||
| Unaffiliated investments | 40,645,370 | ||||||
| Foreign currency translations | 586 | ||||||
| Net Assets | $ | 245,535,262 | |||||
| Fund Shares Outstanding | 9,683,290 | ||||||
| Net asset value, offering price and redemption price per share | $ | 25.36 | |||||
Statement of Operations
For the Six Months Ended June 30, 2012 (Unaudited)
| Investment Income: | |||||||
| Dividends (net foreign taxes withheld of $10,242) | $ | 896,198 | |||||
| Securities lending income, net | 281,941 | ||||||
| Total Investment Income | 1,178,139 | ||||||
| Expenses: | |||||||
| Investment advisory fee | 1,046,450 | ||||||
| Administration fee | 65,403 | ||||||
| Transfer agent fee | 115 | ||||||
| Trustees' fees | 8,687 | ||||||
| Custody fee | 197 | ||||||
| Reports to shareholders | 36,911 | ||||||
| Audit fee | 13,654 | ||||||
| Legal fees | 13,563 | ||||||
| Chief compliance officer expenses (See Note 4) | 4,323 | ||||||
| Commitment fee for line of credit (See Note 5) | 937 | ||||||
| Other expenses | 28,284 | ||||||
| Total Expenses | 1,218,524 | ||||||
| Net Expenses | 1,218,524 | ||||||
| Net Investment Loss | (40,385 | ) | |||||
| Net Realized and Unrealized Gain (Loss) on Investments: | |||||||
| Net realized gain (loss) on: | |||||||
| Investments | 5,883,793 | ||||||
| Foreign currency transactions | (1,033 | ) | |||||
| Net realized gain | 5,882,760 | ||||||
| Net change in unrealized appreciation (depreciation) on: | |||||||
| Investments | 15,502,328 | ||||||
| Foreign currency translations | 586 | ||||||
| Net change in unrealized appreciation | 15,502,914 | ||||||
| Net Gain | 21,385,674 | ||||||
| Net Increase in Net Assets from Operations | $ | 21,345,289 | |||||
See accompanying notes to financial statements.
13
Wanger Select 2012 Semiannual Report
Statement of Changes in Net Assets
| Increase (Decrease) in Net Assets: | (Unaudited) Six Months Ended June 30, 2012 | Year Ended December 31, 2011 | |||||||||
| Operations: | |||||||||||
| Net investment loss | $ | (40,385 | ) | $ | (713,411 | ) | |||||
| Net realized gain (loss) on: | |||||||||||
| Investments | 5,883,793 | 21,899,595 | |||||||||
| Foreign currency transactions | (1,033 | ) | (12,775 | ) | |||||||
| Net change in unrealized appreciation (depreciation) on: | |||||||||||
| Investments | 15,502,328 | (77,026,053 | ) | ||||||||
| Foreign currency translations | 586 | (254 | ) | ||||||||
| Net Increase (Decrease) in Net Assets from Operations | 21,345,289 | (55,852,898 | ) | ||||||||
| Distributions to Shareholders: | |||||||||||
| From net investment income | — | (6,570,049 | ) | ||||||||
| Share Transactions: | |||||||||||
| Subscriptions | 5,483,179 | 16,603,789 | |||||||||
| Distributions reinvested | — | 6,570,049 | |||||||||
| Redemptions | (23,836,613 | ) | (64,167,013 | ) | |||||||
| Net Decrease from Share Transactions | (18,353,434 | ) | (40,993,175 | ) | |||||||
| Total Increase (Decrease) in Net Assets | 2,991,855 | (103,416,122 | ) | ||||||||
| Net Assets: | |||||||||||
| Beginning of period | 242,543,407 | 345,959,529 | |||||||||
| End of period | $ | 245,535,262 | $ | 242,543,407 | |||||||
| Accumulated Net Investment Loss at End of Period | $ | (73,916 | ) | $ | (33,531 | ) | |||||
See accompanying notes to financial statements.
14
Wanger Select 2012 Semiannual Report
Financial Highlights
| (Unaudited) Six Months Ended June 30, | Year Ended December 31, | ||||||||||||||||||||||||||
| Selected data for a share outstanding throughout each period | 2012 | 2011 | 2010 | 2009 | 2008 | 2007 | |||||||||||||||||||||
| Net Asset Value, Beginning of Period | $ | 23.35 | $ | 28.99 | $ | 23.05 | $ | 13.87 | $ | 28.08 | $ | 26.15 | |||||||||||||||
| Income from Investment Operations: | |||||||||||||||||||||||||||
| Net investment loss (a) | (0.00 | )(b) | (0.06 | ) | (0.09 | ) | (0.08 | ) | (0.10 | ) | (0.04 | ) | |||||||||||||||
| Net realized and unrealized gain (loss) on investments and foreign currency and foreign capital gains tax | 2.01 | (4.99 | ) | 6.17 | 9.26 | (13.38 | ) | 2.47 | |||||||||||||||||||
| Total from Investment Operations | 2.01 | (5.05 | ) | 6.08 | 9.18 | (13.48 | ) | 2.43 | |||||||||||||||||||
| Less Distributions to Shareholders: | |||||||||||||||||||||||||||
| From net investment income | — | (0.59 | ) | (0.14 | ) | — | — | — | |||||||||||||||||||
| From net realized gains | — | — | — | — | (0.73 | ) | (0.50 | ) | |||||||||||||||||||
| Total Distributions to Shareholders | — | (0.59 | ) | (0.14 | ) | — | (0.73 | ) | (0.50 | ) | |||||||||||||||||
| Net Asset Value, End of Period | $ | 25.36 | $ | 23.35 | $ | 28.99 | $ | 23.05 | $ | 13.87 | $ | 28.08 | |||||||||||||||
| Total Return (c) | 8.61 | %(d) | (17.68 | )% | 26.57 | % | 66.19 | % | (49.06 | )% | 9.39 | % | |||||||||||||||
| Ratios to Average Net Assets/Supplemental Data: | |||||||||||||||||||||||||||
| Net expenses | 0.93 | %(e) | 0.93 | %(f) | 0.93 | %(f) | 0.95 | %(f) | 0.91 | %(f) | 0.90 | %(f) | |||||||||||||||
| Net investment loss | (0.03 | )%(e) | (0.24 | )%(f) | (0.38 | )%(f) | (0.44 | )%(f) | (0.45 | )%(f) | (0.15 | )%(f) | |||||||||||||||
| Portfolio turnover rate | 11 | %(d) | 23 | % | 30 | % | 35 | % | 36 | % | 15 | % | |||||||||||||||
| Net assets, end of period (000s) | $ | 245,535 | $ | 242,543 | $ | 345,960 | $ | 270,368 | $ | 156,588 | $ | 316,380 | |||||||||||||||
(a) Net investment loss per share was based upon the average shares outstanding during the period.
(b) Rounds to less than $0.01 per share.
(c) Total return at net asset value assuming all distributions reinvested.
(d) Not annualized.
(e) Annualized.
(f) The benefits derived from custody fees paid indirectly had an impact of less than 0.01%.
See accompanying notes to financial statements.
15
Wanger Select 2012 Semiannual Report
Notes to Financial Statements (Unaudited)
1. Nature of Operations
Wanger Select (the Fund), a series of Wanger Advisors Trust (the Trust), is registered under the Investment Company Act of 1940, as amended (the 1940 Act), as an open-end management investment company organized as a Massachusetts business trust. The investment objective of the Fund is to seek long-term capital appreciation. The Fund is available only for allocation to certain life insurance company separate accounts established for the purpose of funding participating variable annuity contracts and variable life insurance policies and may also be offered directly to certain qualified pension and retirement plans.
2. Significant Accounting Policies
The preparation of financial statements in accordance with accounting principles generally accepted in the United States of America (GAAP) requires management to make certain estimates and assumptions that affect the reported amounts of assets and liabilities, the disclosure of contingent assets and liabilities at the date of the financial statements and the reported amounts of revenue and expenses during the reporting period. Actual results could differ from those estimates.
Security valuation
Securities of the Fund are valued at market value or, if a market quotation for a security is not readily available or is deemed not to be reliable because of events or circumstances that have occurred between the market quotation and the time as of which the security is to be valued, the security is valued at its fair value determined in good faith under consistently applied procedures established by the Board of Trustees. A security traded on a securities exchange or in an over-the-counter market in which transaction prices are reported is valued at the last sales price at the time of valuation. A security traded principally on NASDAQ is valued at the NASDAQ official closing price. Mutual Funds and Exchange Traded Funds are valued at their closing net asset value as reported to NASDAQ. A security for which there is no reported sale on the valuation date is valued at the mean of the latest bid and ask quotations.
Short-term investments maturing in 60 days or less are valued at amortized cost, which approximates market value.
A security for which a market quotation is not readily available and any other assets are valued at their fair value determined in good faith under consistently applied procedures established by the Board of Trustees. The Trust has retained an independent statistical fair value pricing service that employs a systematic methodology to assist in the fair valuation process for securities principally traded in a foreign market in order to adjust for possible changes in value that may occur between the close of the foreign market and the time as of which the securities are to be valued. If a security is valued at a fair value, that value may be different from the last quoted market price for the security.
Foreign currency translations
Values of investments denominated in foreign currencies are converted into U.S. dollars using the New York spot market rate of exchange at the time of valuation. Purchases and sales of investments and dividend and interest income are translated into U.S. dollars using the spot market rate of exchange prevailing on the respective dates of such transactions. The gain or loss resulting from changes in foreign exchange rates is included with net realized and unrealized gain or loss from investments, as appropriate.
Restricted securities
Restricted securities are securities that may only be resold upon registration under federal securities laws or in transactions exempt from registration. In some cases, the issuer of restricted securities has agreed to register such securities for resale at the issuer's expense either upon demand by the Fund or in connection with another registered offering of the securities. Many restricted securities may be resold in the secondary market in transactions exempt from registration. Such restricted securities may be determined to be liquid under criteria established by the Board of Trustees.
Security transactions and investment income
Security transactions are accounted for on the trade date (date the order to buy or sell is executed) and dividend income is recorded on the ex-dividend date, except that certain dividends from foreign securities are recorded as soon as the information is available to the Fund. Interest income is recorded on the accrual basis and includes amortization of discounts on debt obligations when required for federal income tax purposes. Realized gains and losses from security transactions are recorded on an identified cost basis.
Awards, if any, from class action litigation related to securities owned may be recorded as a reduction of cost of those securities. If the applicable securities are no longer owned, the proceeds are recorded as realized gains.
The Fund estimates the tax character of distributions from real estate investment trusts (REITs). Distributions received in excess of income are recorded as a reduction of the cost of the related investments. If the applicable securities are no longer owned, any distributions received in excess of income are recorded as realized gains.
Expenses
General expenses of the Trust are allocated to the Fund and the other series of the Trust based upon relative net assets or other expense allocation methodologies determined by the nature of the expense. Expenses directly attributable to the Fund are charged to the Fund.
Fund share valuation
Fund shares are sold and redeemed on a continuing basis at net asset value. Net asset value per share is determined daily as of the close of trading on the New York Stock Exchange (the Exchange) on each day the Exchange is open for trading by dividing the total value of the Fund's investments and other assets, less liabilities, by the number of Fund shares outstanding.
Securities lending
The Fund may lend securities up to one-third of the value of its total assets to certain approved brokers, dealers and other financial institutions to earn additional income. The Fund retains the benefits of owning the securities, including receipt of dividends or interest generated by the security. The Fund also receives a fee for the loan. The Fund has the ability to recall the loans at any time and could do so in order to vote proxies or to sell the loaned securities. Each loan is collateralized by cash that exceeded the value of the securities on loan. The market value of the loaned securities is determined daily at the close of business of the Fund and any additional required collateral is delivered to each Fund on the next business day. The Fund has elected to invest the cash collateral in the Dreyfus Government Cash Management Fund and the income earned is paid to the Fund, net of any fees remitted to Goldman Sachs Agency Lending, the Fund's lending agent and borrower rebates. The Fund's investment manager, Columbia Wanger Asset Management, LLC (CWAM), does not retain any fees earned by the lending program. Generally, in the event of borrower default, the Fund has the right to use the collateral to offset any losses incurred. In the event the Fund is delayed or prevented from exercising its right to dispose of the collateral, there may be a potential loss to the Fund. Some of these losses may be indemnified by the lending agent. The Fund bears the risk of loss with respect to the investment of collateral.
The net lending income earned by the Fund as of June 30, 2012, is included in the Statement of Operations.
Federal income taxes
The Fund has complied with the provisions of the Internal Revenue Code available to regulated investment companies and, in the manner provided therein, distributes substantially all its taxable income, as well as any net realized gain on sales of investments and foreign currency transactions reportable for federal income tax purposes. Accordingly, the Fund paid no federal income taxes and no federal income tax provision was required.
16
Wanger Select 2012 Semiannual Report
Notes to Financial Statements, continued (Unaudited)
Foreign capital gains taxes
Gains in certain countries may be subject to foreign taxes at the fund level. The Fund accrues for such foreign taxes on net realized and unrealized gains at the appropriate rate for each jurisdiction. The amount, if any, is disclosed as a liability on the Statement of Assets and Liabilities.
Distributions to shareholders
Distributions to shareholders are recorded on the ex-dividend date.
Indemnification
In the normal course of business, the Trust on behalf of the Fund enters into contracts that contain a variety of representations and warranties and that provide general indemnities. The Fund's maximum exposure under these arrangements is unknown, as this would involve future claims against the Fund. Also under the Trust's organizational documents, the trustees and officers of the Trust are indemnified against certain liabilities that may arise out of their duties to the Trust. However based on experience, the Fund expects the risk of loss due to these warranties and indemnities to be remote.
Recent Accounting Pronouncement
Disclosures about Offsetting Assets and Liabilities
In December 2011, the Financial Accounting Standards Board (FASB) issued ASU No. 2011-11, Disclosures about Offsetting Assets and Liabilities. The objective of the FASB is to enhance current disclosure requirements on offsetting of certain assets and liabilities and to enable financial statement users to compare financial statements prepared under GAAP and International Financial Reporting Standards.
Specifically, ASU No. 2011-11 requires an entity to disclose both gross and net information for derivatives and other financial instruments that are subject to a master netting arrangement or similar agreement. The standard requires disclosure of collateral received in connection with the master netting agreements or similar agreements. The effective date of ASU No. 2011-11 is for interim and annual periods beginning on or after January 1, 2013. At this time, management is evaluating the implications of this guidance and the impact it will have on the financial statement amounts and footnote disclosures, if any.
3. Federal Tax Information
The timing and character of income and capital gain distributions are determined in accordance with income tax regulations, which may differ from GAAP. Reclassifications are made to the Fund's capital accounts for permanent tax differences to reflect income and gains available for distribution (or available capital loss carryforwards) under income tax regulations.
The following capital loss carryforward, determined as of December 31, 2011 may be available to reduce taxable income arising from future net realized gains on investments, if any, to the extent permitted by the Internal Revenue Code:
| Year of Expiration | Amount | ||||||
| 2017 | $ | 3,446,870 | |||||
Under current tax rules, regulated investment companies can elect to treat certain late-year ordinary losses incurred and post-October capital losses (capital losses realized after October 31) as arising on the first day of the following taxable year. As of December 31, 2011, the Fund will elect to treat late-year ordinary losses of $11,470 as arising on January 1, 2012.
Management is required to determine whether a tax position of the Fund is more likely than not to be sustained upon examination by the applicable taxing authority, including resolution of any related appeals or litigation processes, based on the technical merits of the position. The tax benefit to be recognized by the Fund is measured as the largest amount of benefit that is greater than fifty percent likely of being realized upon ultimate settlement. Management is not aware of any tax positions for which it is reasonably possible that the total amounts of unrecognized tax benefits will significantly change in the next twelve months. However, management's conclusions may be subject to review and adjustment at a later date based on factors including, but not limited to, new tax laws, regulations, and administrative interpretations (including relevant court decisions). The Fund's federal tax returns for the prior three fiscal years remain subject to examination by the Internal Revenue Service.
4. Transactions With Affiliates
CWAM is a wholly owned subsidiary of Columbia Management Investment Advisers, LLC (Columbia Management), which in turn is a wholly owned subsidiary of Ameriprise Financial, Inc. (Ameriprise Financial). CWAM furnishes continuing investment supervision to the Fund and is responsible for the overall management of the Fund's business affairs.
CWAM receives a monthly advisory fee based on the Fund's average daily net assets at the following annual rates:
| Average Daily Net Assets | Annual Fee Rate | ||||||
| Up to $500 million | 0.80 | % | |||||
| $500 million and over | 0.78 | % | |||||
For the six months ended June 30, 2012, the annualized effective investment advisory fee rate was 0.80% of the Fund's average daily net assets.
Through April 30, 2013, CWAM has contractually agreed to reimburse the Fund to the extent that ordinary operating expenses (exclusive of brokerage commissions, interest, taxes and extraordinary expenses, but inclusive of custodian charges relating to overdrafts, if any), after giving effect to any balance credits from the Fund's custodian, exceed an annual percentage of 1.35% of average daily net assets on an annualized basis. For the six months ended June 30, 2012 the Fund was not reimbursed any expenses.
CWAM provides administrative services and receives an administration fee from the Fund at the following annual rates:
Wanger Advisors Trust Aggregate
| Average Daily Net Assets of the Trust | Annual Fee Rate | ||||||
| Up to $4 billion | 0.05 | % | |||||
| $4 billion to $6 billion | 0.04 | % | |||||
| $6 billion to $8 billion | 0.03 | % | |||||
| $8 billion and over | 0.02 | % | |||||
For the six months ended June 30, 2012, the annualized effective administration fee rate was 0.05% of the Fund's average daily net assets. Columbia Management provides certain sub-administrative services to the Fund.
Columbia Management Investment Distributors, Inc. (CMID), a wholly owned subsidiary of Ameriprise Financial, serves as the Fund's distributor and principal underwriter.
Columbia Management Investment Services Corp. (CMIS), a wholly owned subsidiary of Ameriprise Financial, is the transfer agent to the Fund. For its services, the Fund pays CMIS a monthly fee at the annual rate of $21.00 per open account. CMIS also receives reimbursement from the Fund for certain out-of-pocket expenses.
Certain officers and trustees of the Trust are also officers of CWAM. The Trust makes no direct payments to its officers and trustees who are affiliated with CWAM.
The Board of Trustees has appointed a Chief Compliance Officer of the Trust in accordance with federal securities regulations. The Fund, along with other affiliated funds, pays its pro-rata share of the expenses associated with the Office of the Chief Compliance Officer. These expenses are disclosed separately as "Chief compliance officer expenses" in the Statement of Operations.
The Trust offers a deferred compensation plan for its independent trustees. Under that plan, a trustee may elect to defer all or a portion of his or her compensation. Amounts deferred are retained by the Trust and may represent an unfunded obligation of the Trust. The value of amounts deferred is determined by reference to the change in value of Class Z shares of one or more series of Columbia Acorn Trust or a money
17
Wanger Select 2012 Semiannual Report
Notes to Financial Statements, continued (Unaudited)
market fund as specified by the trustee. Benefits under the deferred compensation plan are payable in accordance with the plan.
For the six months ended June 30, 2012, the Fund engaged in purchase and sales transactions with funds that have a common investment adviser (or affiliated investment advisers), common directors/trustees, and/or common officers. Those purchase and sale transactions complied with provisions of Rule 17a-7 under the Investment Company Act of 1940 and were $- and $800,000, respectively.
5. Borrowing Arrangements
The Trust participates in a $150 million credit facility with JPMorgan Chase Bank, N.A., along with another Trust managed by CWAM, which was entered into to facilitate portfolio liquidity. Under the facility, as in effect for the six months ended June 30, 2012, interest is charged to each participating fund based on its borrowings at a rate per annum equal to the higher of Federal Funds Rate or Overnight LIBOR plus 1.25%. In addition, a commitment fee of 0.10% per annum of the unutilized line of credit is accrued and apportioned among the participating funds based on their relative net assets. The commitment fee is disclosed separately as "Commitment fee for line of credit" in the Statement of Operations. The Trust expects to renew this line of credit for one year durations annually in July at then current market rates and terms.
The Fund had no borrowings during the six months ended June 30, 2012.
6. Fund Share Transactions
Proceeds and payments on Fund shares as shown in the Statement of Changes in Net Assets are in respect of the following numbers of shares:
| (Unaudited) Six months ended June 30, 2012 | Year ended December 31, 2011 | ||||||||||
| Shares sold | 205,288 | 609,932 | |||||||||
| Shares issued in reinvestment of dividend distributions | — | 245,977 | |||||||||
| Less shares redeemed | (907,283 | ) | (2,405,373 | ) | |||||||
| Net (decrease) in shares outstanding | (701,995 | ) | (1,549,464 | ) | |||||||
7. Investment Transactions
The aggregate cost of purchases and proceeds from sales other than short-term obligations for the six months ended June 30, 2012, were $28,580,746 and $48,619,144, respectively.
8. Shareholder Concentration
At June 30, 2012, two unaffiliated shareholder accounts owned 90.3% of the outstanding shares of the Fund. The Fund has no knowledge about whether any portion of those shares was owned beneficially by such account. Subscription and redemption activity by concentrated accounts may have a significant effect on the operations of the Fund.
9. Subsequent Events
Management has evaluated the events and transactions that have occurred through the date the financial statements were issued and noted no items requiring adjustment of the financial statements or additional disclosure.
10. Information Regarding Pending and Settled Legal Proceedings
Ameriprise Financial and certain of its affiliates have historically been involved in a number of legal, arbitration and regulatory proceedings, including routine litigation, class actions, and governmental actions, concerning matters arising in connection with the conduct of their business activities. Ameriprise Financial believes that the Funds are not currently the subject of, and that neither Ameriprise Financial nor any of its affiliates are the subject of, any pending legal, arbitration or regulatory proceedings that are likely to have a material adverse effect on the Funds or the ability of Ameriprise Financial or its affiliates to perform under their contracts with the Funds. Ameriprise Financial is required to make 10-Q, 10-K and, as necessary, 8-K filings with the Securities and Exchange Commission on legal and regulatory matters that relate to Ameriprise Financial and its affiliates. Copies of these filings may be obtained by accessing the SEC website at www.sec.gov.
There can be no assurance that these matters, or the adverse publicity associated with them, will not result in increased fund redemptions, reduced sale of fund shares or other adverse consequences to the Funds. Further, although we believe proceedings are not likely to have a material adverse effect on the Funds or the ability of Ameriprise Financial or its affiliates to perform under their contracts with the Funds, these proceedings are subject to uncertainties and, as such, we are unable to estimate the possible loss or range of loss that may result. An adverse outcome in one or more of these proceedings could result in adverse judgments, settlements, fines, penalties or other relief that could have a material adverse effect on the consolidated financial condition or results of operations of Ameriprise Financial.
18
Wanger Select 2012 Semiannual Report
Board Approval of the Advisory Agreement
Wanger Advisors Trust (the "Trust") has an investment advisory agreement (the "Advisory Agreement") with Columbia Wanger Asset Management, LLC ("Columbia WAM") under which Columbia WAM manages the Wanger Funds (each, a "Fund", and together, the "Funds"). More than 75% of the trustees of the Trust (the "Trustees") are persons who have no direct or indirect interest in the Advisory Agreement and are not "interested persons" (as defined in the Investment Company Act of 1940, as amended (the "1940 Act")) of the Trust (the "Independent Trustees"). The Trustees oversee the management of each Fund and, as required by law, determine at least annually whether to continue the Advisory Agreement for each Fund.
The Contract Committee (the Committee" of the Board of Trustees (the "Board"), which is comprised solely of Independent Trustees, makes recommendations to the Board regarding any proposed continuation of the Advisory Agreement. After the Committee has made its recommendations, the full Board determines whether to approve continuation of the Advisory Agreement. The Board also considers matters bearing on the Advisory Agreement at its various meetings throughout the year, meets at least quarterly with Columbia WAM's portfolio managers and receives monthly reports from Columbia WAM on the performance of the Funds.
In connection with their most recent consideration of the Advisory Agreement for each Fund, the Committee and all Trustees received and reviewed a substantial amount of information provided by Columbia WAM, Columbia Management Investment Advisers, LLC ("Columbia Management") and Ameriprise Financial, Inc. ("Ameriprise"), in response to written requests from the Independent Trustees and their independent legal counsel. Throughout the process, the Trustees had numerous opportunities to ask questions of and request additional materials from Columbia WAM, Columbia Management and Ameriprise.
During each meeting at which the Committee or the Independent Trustees considered the Advisory Agreement, they met in executive session with their independent legal counsel. The Committee also met with representatives of Columbia WAM, Columbia Management and Ameriprise on several occasions. In all, the Committee convened formally on six separate occasions to consider the continuation of the Advisory Agreement. The Board and/or some or all of the Independent Trustees met on other occasions to receive the Committee's status reports, receive presentations from Columbia WAM, Columbia Management and Ameriprise representatives, and to discuss outstanding issues. In addition, the Investment Performance Analysis Committee of the Board, also comprised exclusively of Independent Trustees, reviewed the performance of the Funds and presented its findings to the Board and the Committee throughout the year. The Compliance Committee of the Board also provided information to the Committee with respect to relevant matters.
The Trustees reviewed the Advisory Agreement, as well as certain information obtained through Columbia WAM's, Columbia Management's and Ameriprise's responses to independent legal counsel's questionnaires. In addition, the Trustees reviewed the Management Fee Evaluation dated June 2012 (the "Fee Evaluation") prepared by the Trust's chief compliance officer, senior vice president and general counsel at the request of the Board.
The materials reviewed by the Committee and the Trustees included, among other items, (i) information on the investment performance of each Fund and of independently selected peer groups of funds and of the Funds' performance benchmarks over various time periods, (ii) information on each Fund's advisory fees and other expenses, including information comparing the Fund's fees and expenses to those of peer groups of funds and information about any applicable expense limitations and fee breakpoints, (iii) data on sales and redemptions of Fund shares, and (iv) information on the profitability to Columbia WAM and Ameriprise, as well as potential "fall-out" or ancillary benefits that Columbia WAM and its affiliates may receive as a result of their relationships with the Funds. The Trustees also considered other information such as (i) Columbia WAM's financial condition, (ii) each Fund's investment objective and strategy, (iii) the size, education and experience of Columbia WAM's investment staff and its use of technology, external research and trading cost measurement tools, (iv) the portfolio manager compensation framework, (v) the allocation of the Funds' brokerage, and the use of "soft" commission dollars to pay for research products and services, (vi) Columbia WAM's risk management program, and (vii) the resources devoted to, and the record of compliance with, the Funds' investment policies and restrictions, policies on personal securities transactions and other compliance policies.
At a meeting held on June 6, 2012, upon recommendations of the Committee, the Board of Trustees unanimously approved the continuation of the Advisory Agreement.
In considering the continuation of the Advisory Agreement, the Trustees reviewed and analyzed various factors that they determined were relevant, none of which by itself was considered dispositive. The material factors and conclusions that formed the basis for the Trustees' determination to approve the continuation of the Advisory Agreement are discussed below.
Nature, quality and extent of services. The Trustees reviewed the nature, quality and extent of the services provided by Columbia WAM and its affiliates to Wanger Select under the Advisory Agreement, taking into account the investment objective and strategy of the Fund and knowledge gained from meetings with management, which were held on at least a quarterly basis. In addition, the Trustees reviewed the available resources and key personnel of Columbia WAM and its affiliates, especially those providing investment management services to the Fund. The Trustees also considered other services provided to the Fund by Columbia WAM and its affiliates, including: managing the execution of portfolio transactions and selecting broker-dealers for those transactions; monitoring adherence to the Fund's investment restrictions; producing shareholder reports; providing support services for the Board and committees of the Board; managing the Fund's securities lending program; communicating with shareholders; serving as the Fund's administrator; and overseeing the activities of the Fund's other service providers, including monitoring for compliance with various policies and procedures as well as applicable securities laws and regulations.
The Trustees concluded that the nature, quality and extent of the services provided by Columbia WAM and its affiliates to the Fund under the Advisory Agreement were appropriate for the Fund and that the Fund was likely to benefit from the continued provision of those services by Columbia WAM. They also concluded that Columbia WAM currently had sufficient personnel, with appropriate education and experience, to serve the Fund effectively, and that the firm had demonstrated its continuing ability to attract and retain well-qualified personnel. In addition, they took note of the quality of Columbia WAM's compliance record.
Performance of the Fund. The Trustees received and considered detailed performance information at various meetings of the Board, the Committee and the Investment Performance Analysis Committee of the Board throughout the year. They reviewed information comparing each Fund's performance with that of its benchmark(s) and with the performance of comparable funds and peer groups as identified by Lipper Inc. ("Lipper") and Morningstar, Inc. ("Morningstar"). The Trustees evaluated the performance of Wanger Select over various time periods, including over the one-, three- and five-year periods ending December 31, 2011. The Trustees also considered peer performance rankings for similar timeframes, although they focused more on the five-year period.
The Trustees noted that Wanger Select had underperformed its peers according to both Morningstar and Lipper, and benchmark over the five-year period ending December 31, 2011 and exposed investors to more risk versus its peers. The Trustees also considered that Wanger Select's performance for the three-year period was above and at median versus its Morningstar and Lipper groups, respectively, but they observed that one-year performance was at the bottom of the peer groups. The Trustees determined that performance with respect to Wanger Select needed to be improved, although performance of the Fund had been ahead of its benchmark at the time of the June 6th Board meeting. The Trustees concluded, however, that Columbia WAM had taken and continued to take a number of corrective steps with respect to the Fund's underperformance, that Columbia WAM had reported that these steps were being successfully implemented, and that the Investment Performance Analysis Committee of the Board was monitoring the Fund's performance closely.
The Trustees concluded that, although past performance is not necessarily indicative of future results, the steps taken by Columbia WAM to improve the Fund's
19
Wanger Select 2012 Semiannual Report
Board Approval of the Advisory Agreement
performance were an important factor in their evaluation of the quality of services provided by Columbia WAM under the Advisory Agreement for Wanger Select.
Costs of Services and Profits Realized by Columbia WAM. At various Committee and Board meetings, the Trustees examined detailed information on the fees and expenses of the Fund in comparison to information for comparable funds provided by Lipper and Morningstar. The Trustees reviewed data from Lipper and Morningstar and noted that Wanger Select had lower total net operating expenses than its Lipper peer group median but higher expenses than its Morningstar peer group median. As noted in the Fee Evaluation, the actual advisory fees paid by Wanger Select was higher than the median advisory fee of the Fund's Morningstar peer and Lipper groups. The Trustees reviewed the observations in the Fee Evaluation and noted that the Fund was assessed by Morningstar and Lipper in relation to peers selected only from the variable annuity universe.
The Trustees also reviewed the advisory fee rates charged by Columbia WAM for managing other investment companies (including the Columbia Acorn Funds), sub-advised funds and other institutional separate accounts, as detailed in materials provided to the Committee by Columbia WAM and in the Fee Evaluation. The Trustees noted that the Fund's advisory fees were generally comparable to the Columbia Acorn Select's advisory fees at the same asset level. The Trustees also examined Columbia WAM's institutional separate account fees for various investment strategies; in some cases those fees were higher than the advisory fees charged to the Fund, and in a few instances the fees were lower. The Trustees noted that Columbia WAM performs significant additional services for the Fund that it does not provide to sub-advised funds or non-mutual fund clients, including administrative services, oversight of the Fund's other service providers, Trustee support, regulatory compliance and numerous other services, and that, in servicing the Fund, Columbia WAM assumes many legal and business risks that it does not assume in servicing many of its non-fund clients.
The Trustees concluded that the rate of advisory fees payable to Columbia WAM was reasonable in relation to the nature and quality of the services to be provided. The Trustees also concluded that the Fund's overall expense ratio was reasonable, considering the quality of the services provided by Columbia WAM and its affiliates and the investment performance of the Fund, taking into account Columbia WAM's continuing steps to improve performance of the Fund.
The Trustees reviewed the analysis of the historic profitability of Columbia WAM in serving as the Fund's investment adviser and of Columbia WAM and its affiliates in their relationships with each Fund. The Committee and Trustees met with representatives from Ameriprise to discuss its methodologies for calculating profitability and allocating costs. They considered that Ameriprise calculated profitability and allocated costs on a contract-by-contract and fund-by-fund basis. The Trustees also considered the methodology used by Columbia WAM and Ameriprise in determining compensation payable to portfolio managers and the competitive market for investment management talent. The Trustees were also provided with profitability information from Lipper, which compared Columbia WAM's profitability to other similar investment advisers in the mutual fund industry. The Trustees concluded that Columbia WAM's and its affiliates' profits were within a reasonable range of those of competitors with similar business models. The Trustees discussed, however, that profitability comparisons among fund managers may not always be meaningful due to the lack of consistency in data, small number of publicly-owned managers, and the fact that profitability of any investment manager is affected by numerous factors, including its particular organizational structure, the types of funds and other accounts managed, other lines of business, expense allocation methodology, capital structure and cost of capital.
Economies of Scale. At various Committee and Board meetings and other informal meetings, the Trustees considered information about the extent to which Columbia WAM realizes economies of scale in connection with an increase in Fund assets. The Trustees also discussed the potential for Fund sales growth. The Trustees noted that the advisory fee schedule for each Fund includes breakpoints in the rate of fees at various asset levels. The Trustees concluded that the fee structure of the Fund was reflective of a sharing between Columbia WAM and the Fund of economies of scale.
Other Benefits to Columbia WAM. The Trustees also reviewed benefits that accrue to Columbia WAM and its affiliates from their relationships with the Fund, based upon information provided to them by Ameriprise and as outlined in the Fee Evaluation. They noted that the Fund's transfer agency services are performed by Columbia Management Investment Services Corp., an affiliate of Ameriprise, which receives compensation from the Funds for its services provided. They considered that an affiliate of Ameriprise, Columbia Management Investment Distributors, Inc. ("CMID"), serves as the Fund's distributor under a distribution agreement and receives no fees for its services. In addition, Columbia Management provides sub-administration services to the Fund. The Committee received information regarding the profitability of each Fund agreement with Columbia WAM affiliates. The Committee and the Board also reviewed information about and discussed the capabilities of each affiliated entity in performing its duties.
The Trustees considered other ways that the Fund and Columbia WAM may potentially benefit from their relationship with each other. For example, the Trustees considered Columbia WAM's use of commissions paid by the Fund on its portfolio brokerage transactions to obtain research products and services benefiting the Funds and/or other clients of Columbia WAM. The Committee reviewed Columbia WAM's annual "soft dollar" report and met with representatives from Columbia WAM to review Columbia WAM's soft dollar spending. The Committee also considered that the Compliance Committee of the Board regularly reviewed third-party prepared reports that evaluated the quality of Columbia WAM's execution of the Fund's portfolio transactions. The Trustees noted that these reports showed that Columbia WAM's execution capabilities were generally better than industry peers. The Trustees determined that Columbia WAM's use of the Fund's "soft" commission dollars to obtain research products and services was consistent with current regulatory requirements and guidance. They also concluded that Columbia WAM benefits from the receipt of proprietary research products and services acquired through commissions paid on portfolio transactions of the Fund, and that the Fund benefits from Columbia WAM's receipt of those products and services as well as research products and services acquired through commissions paid by other clients of Columbia WAM.
After full consideration of the above factors, as well as other factors that were instructive in evaluating the Advisory Agreement, the Trustees, including the Independent Trustees, concluded that the continuation of the Advisory Agreement was in the best interest of the Fund. On June 6, 2012, the Trustees approved continuation of the Advisory Agreement through July 31, 2013.
20
Wanger Select 2012 Semiannual Report

Columbia Wanger Funds
Trustees
Laura M. Born
Chair of the Board
Steven N. Kaplan
Vice Chair of the Board
Michelle L. Collins
Maureen M. Culhane
Margaret M. Eisen
John C. Heaton
Charles P. McQuaid
David J. Rudis
David B. Small
Ralph Wanger (Trustee Emeritus)
Officers
Charles P. McQuaid
President
Ben Andrews
Vice President
Robert A. Chalupnik
Vice President
Michael G. Clarke
Assistant Treasurer
Joseph F. DiMaria
Assistant Treasurer
P. Zachary Egan
Vice President
Fritz Kaegi
Vice President
John M. Kunka
Assistant Treasurer
Stephen Kusmierczak
Vice President
Joseph C. LaPalm
Vice President
Bruce H. Lauer
Vice President, Secretary and Treasurer
Louis J. Mendes III
Vice President
Robert A. Mohn
Vice President
Christopher J. Olson
Vice President
Christopher O. Petersen
Assistant Secretary
Scott R. Plummer
Assistant Secretary
Linda K. Roth-Wiszowaty
Assistant Secretary
Robert P. Scales
Chief Compliance Officer, Chief Legal Officer, Senior Vice President and
General Counsel
Andreas Waldburg-Wolfegg
Vice President
Investment Manager
Columbia Wanger Asset Management, LLC
227 West Monroe Street, Suite 3000
Chicago, Illinois 60606
1-888-4-WANGER
(1-888-492-6437)
Transfer Agent,
Dividend Disbursing Agent
Columbia Management Investment Services Corp.
P.O. Box 8081
Boston, Massachusetts
02266-8081
Distributor
Columbia Management Investment Distributors, Inc.
225 Franklin Street
Boston, Massachusetts
02110
Legal Counsel to the Funds
Perkins Coie LLP
Washington, DC
Legal Counsel to the Independent Trustees
Drinker Biddle & Reath LLP
Philadelphia, Pennsylvania
Independent Registered Public Accounting Firm
PricewaterhouseCoopers LLP
Chicago, Illinois
This document contains Global Industry Classification Standard data. The Global Industry Classification Standard ("GICS") was developed by and is the exclusive property and a service mark of MSCI Inc. ("MSCI") and Standard & Poor's Financial Services LLC ("S&P") and is licensed for use by Columbia Wanger Asset Management, LLC ("CWAM"). Neither MSCI, S&P, nor any other party involved in making or compiling the GICS or any GICS classifications makes any express or implied warranties or representations with respect to such standard or classification (or the results to be obtained by the use thereof), and all such parties hereby expressly disclaim all warranties of originality, accuracy, completeness, merchantability and fitness for a particular purpose with respect to any of such standard or classification. Without limiting any of the foregoing, in no event shall MSCI, S&P, any of their affiliates or any third party involved in making or compiling the GICS or any GICS classifications have any liability for any direct, indirect, special, punitive, consequential or any other damages (including lost profits) even if notified of the possibility of such damages.
This report, including the schedules of investments and financial statements, is submitted for the general information of the shareholders of the Wanger Advisors Trust.
A description of the Fund's proxy voting policies and procedures and a copy of the Fund's voting record for the most recent 12-month period ended June 30 are available (i) on the Securities and Exchange Commission's website at www.sec.gov, and (ii) without charge, upon request, by calling 888-492-6437.
The Fund files a complete schedule of portfolio holdings with the SEC for the first and third quarters of each fiscal year on Form N-Q. The Fund's Form N-Q is available on the SEC's website at www.sec.gov and may be reviewed and copied at the SEC's Public Reference Room in Washington, D.C. Information on the operation of the Pubic Reference Room may be obtained by calling 800-SEC-0330. The Fund's complete portfolio holdings are disclosed at www.columbiamanagement.com approximately 30 to 40 days after each month-end.
21
Columbia Wanger Funds
© 2011 Columbia Management Investment Advisers, LLC. All rights reserved.
C-1465 C (8/12) 142485
Wanger USA
2012 Semiannual Report

Not FDIC insured • No bank guarantee • May lose value

Wanger USA
2012 Semiannual Report
Table of Contents
| 2 | Understanding Your Expenses | ||||||
| 3 | Genetic Science | ||||||
| 6 | Performance Review | ||||||
| 8 | Statement of Investments | ||||||
| 15 | Statement of Assets and Liabilities | ||||||
| 15 | Statement of Operations | ||||||
| 16 | Statement of Changes in Net Assets | ||||||
| 17 | Financial Highlights | ||||||
| 18 | Notes to Financial Statements | ||||||
| 21 | Board Approval of the Advisory Agreement | ||||||
Columbia Wanger Asset Management, LLC (CWAM) is one of the leading global small- and mid-cap equity managers in the United States with over 40 years of small- and mid-cap investment experience. As of June 30, 2012, CWAM managed $31.0 billion in assets. CWAM is the investment manager to Wanger USA, Wanger International, Wanger Select and Wanger International Select (together, the Columbia Wanger Funds) and the Columbia Acorn Family of Funds.
Investors should consider the investment objectives, risks, charges and expenses of a mutual fund carefully before investing. For a free prospectus, which contains this and other important information about the Fund, contact your financial adviser or insurance company or contact 1-888-4-WANGER. Read the prospectus carefully before investing.
An important note: Columbia Wanger Funds are available for purchase through variable annuity contracts and variable life insurance policies offered by the separate accounts of participating insurance companies and qualified pension or retirement plans.
The views expressed in "Genetic Science" and in the Performance Review reflect the current views of the respective authors. These views are not guarantees of future performance and involve certain risks, uncertainties and assumptions that are difficult to predict so actual outcomes and results may differ significantly from the views expressed. These views are subject to change at any time based upon economic, market or other conditions and the respective parties disclaim any responsibility to update such views. These views may not be relied on as investment advice and, because investment decisions for a Columbia Wanger Fund are based on numerous factors, may not be relied on as an indication of trading intent on behalf of any particular Columbia Wanger Fund. References to specific company securities should not be construed as a recommendation or investment advice.
1
Wanger USA 2012 Semiannual Report
Understanding Your Expenses
As a shareholder, you incur three types of costs. There are transaction costs, which generally include sales charges on purchases and may include redemption fees. There are also ongoing costs, which generally include management fees and other Fund expenses. Lastly, there may be additional fees or charges imposed by the insurance company that sponsors your variable annuity and/or variable life insurance product. The following information is intended to help you understand your ongoing costs (in dollars) of investing in the Fund and to help you compare these costs with the ongoing costs of investing in other mutual funds.
Analyzing your Fund's expenses
To illustrate these ongoing costs, we have provided an example and calculated the expenses paid by investors in the Fund during the period. The actual and hypothetical information in the table below is based on an initial investment of $1,000 at the beginning of the period indicated and held for the entire period. Expense information is calculated two ways and each method provides you with different information. The amount listed in the "Actual" column is calculated using the Fund's actual operating expenses and total return for the period. You may use the Actual information, together with the amount invested, to estimate the expenses that you paid over the period. Simply divide your account value by $1,000 (for example, an $8,600 account value divided by $1,000 = 8.6), then multiply the results by the expenses paid during the period under the Actual column. The amount listed in the "Hypothetical" column assumes a 5% annual rate of return before expenses (which is not the Fund's actual return) and then applies the Fund's actual expense ratio for the period to the hypothetical return. You should not use the hypothetical account values and expenses to estimate either your actual account balance at the end of the period or the expenses you paid during the period. See "Compare with other funds" below for details on how to use the hypothetical data.
Compare with other funds
Since all mutual funds are required to include the same hypothetical calculations about expenses in shareholder reports, you can use this information to compare the ongoing cost of investing in the Fund with other funds. To do so, compare the hypothetical example with the 5% hypothetical examples that appear in the shareholder reports of other funds. As you compare hypothetical examples of other funds, it is important to note that hypothetical examples are meant to highlight the ongoing cost of investing in a fund only and do not reflect any transaction costs, such as sales charges, redemption or exchange fees. Therefore, the hypothetical calculations are useful in comparing ongoing costs only, and will not help you determine the relative total costs of owning different funds. If transaction costs were included in these calculations, your costs would be higher.
January 1, 2012 – June 30, 2012
| Account value at the beginning of the period ($) | Account value at the end of the period ($) | Expenses paid during period ($) | Fund's annualized expense ratio (%)* | ||||||||||||||||||||||||||||
| Actual | Hypothetical | Actual | Hypothetical | Actual | Hypothetical | ||||||||||||||||||||||||||
| Wanger USA | 1,000.00 | 1,000.00 | 1,103.70 | 1,020.04 | 5.07 | 4.87 | 0.97 | ||||||||||||||||||||||||
*Expenses paid during the period are equal to the Fund's annualized expense ratio, multiplied by the average account value over the period, then multiplied by the number of days in the Fund's most recent fiscal half-year and divided by 366.
Had the investment manager not waived fees or reimbursed a portion of expenses, account value at the end of the period would have been reduced.
It is important to note that the expense amounts shown in the table are meant to highlight only ongoing costs of investing in the Fund. Expenses paid during the period do not include any insurance charges imposed by your insurance company's separate account. The hypothetical example provided is useful in comparing ongoing costs only and will not help you determine the relative total costs of owning different funds whose shareholders may incur transaction costs.
2
Wanger USA 2012 Semiannual Report

Genetic Science
Genetic theory began with Gregor Mendel, a friar who in the middle 19th century meticulously bred different types of peas and tracked traits of offspring. He discovered recessive genes, which are carried by one generation but expressed in the next if both parents have that gene. Human genetic studies began a few decades later. In 1872, Huntington's disease was the first genetic disease identified by scientific research.1
Humans normally have 23 pairs of chromosomes, with half of each pair inherited from each parent. The chromosomes combined consist of over 20,000 genes. These genes ultimately consist of over 3 billion units of four different nitrogenous bases, labeled by their first letters: A, G, C and T.2
DNA, the double helix structure of bases assembled into genes, was discovered by James Watson and Francis Crick in 1953. Various genes were identified over the next several decades. The Human Genome Project, an effort to sequence and identify all genes and bases in human DNA, started in 1990. After $2.7 billion of expenditures over 13 years, a composite genome from three people was specified.3
Gene Sequencing
Kevin Davies' book, The $1,000 Genome, discusses the incredible progress made in gene sequencing technology. First generation sequencing used bacteria to purify and grow DNA fragments utilizing equipment made by Applied Biosystems, which dominated the market for 15 years.4 Hundreds of machines labored for years to complete the Human Genome Project sequencing, at a direct cost of tens of millions of dollars.5
A company called 454 Life Sciences, later acquired by Roche, developed a second generation sequencer. Utilizing a semiconductor chip with thousands of wells, DNA fragments were sequenced in parallel via real-time image processing. First shipped in 2005, the $500,000 machines then sold as fast as they could be built. James Watson's genome was sequenced in 2007 at a cost of $1 million.6
In 2006, Solexa shipped a sequencing machine that also sequenced in parallel, but had throughput and cost advantages. Illumina bought Solexa later that year. By 2007, the equipment could sequence a human's DNA at a cost of $100,000.7 Illumina subsequently created faster and more accurate machines. In early 2010, it pushed the cost of human genome sequencing down to $10,000.8 Service company Knome currently offers full genome sequencing via Illumina equipment, plus interpretation of results, for $4,998.9 Roche recently attempted to acquire Illumina.10
Third generation machines, often utilizing nanotechnology as well as parallel sequencing and faster data processing chips, should cut the cost of sequencing a human genome to well below $1,000, Davies notes.11 Pacific Biosciences of California claimed a potential 30,000-fold speed increase via sequencing in real time as DNA is replicated. Another company, Oxford Nanopore, was working on sequencing via measurement of electric current passing through bases.12 Ion Torrent Systems measures the pH of bases streaming through pores.13
Davies calculated that the cost of DNA sequencing fell 50% a year through 2005, and then by an amazing 90% a year due to a series of disruptive technologies.14 He does not predict when a hand-held "Star Trek Medical Tricorder," capable of reading the DNA of a patient and his disease and then prescribing personalized medicine, will be available, but the world seems headed in that direction.
Personal Genomic Services
It doesn't take a full genome sequence to determine genetic characteristics such as ancestry and possible risks of disease. In November 2007, deCODEme and 23andMe launched competing $1,000 services. Processing cheek swab or saliva DNA on equipment utilizing specialized chips, they sampled up to 600,000 bases, 0.02% of the total, and looked for differences in bases between people, called single nucleotide polymorphisms (SNPs).15 By correlating SNPs with known ancestry and disease databases, the companies provided statistical probabilities to clients based on their DNA samples.
Since 2007, deCODEme has had financial problems; it currently offers the service for $1,100, including updates.16 23andMe currently charges $207 for an initial sampling and a one-year subscription for updates. According to its website, 23andMe provides probabilities for 118 diseases, shows likely responses to 20 drugs, and determines whether clients' children could be at risk for any of 44 inherited diseases.17 Navigenics has also entered the market and provides genetic counseling as well as data.
The personal genomic services companies update disease probabilities as additional data is analyzed. Probabilities can and do change, sometimes drastically, as new correlations and additional SNPs are incorporated into a person's profile. It's somewhat disconcerting that, according to Davies, Navigenics and 23andMe disagree qualitatively on one-third of diseases.18
As more of the population gets increasingly more genes sequenced, more data becomes available and the relationships between genes, health and responses to drugs become better known. Full genome sequencing will likely show an average of three million SNPs per person,19 creating an enormous data management problem as well as new understandings of relationships between genes and diseases.
Limits to Predicting Diseases
Recent research published in Science Translational Medicine titled, "The Predictive Capacity of Personal Genome Sequencing,"20 ingeniously addressed the theoretical potential for genes to predict common diseases. The underlying question was, of course, what are the odds of someone with a specific genome getting
3
Wanger USA 2012 Semiannual Report
a specific disease? According to the study, the answer can be determined by studying pairs of people with nearly identical genomes: identical twins. By comparing histories of 24 common diseases among identical twins versus fraternal twins, genetic determination of diseases were inferred.
The study concluded that for 19 of the 24 diseases a negative test score (below average risk) will hardly be reassuring because the odds of getting the disease will still be substantial, at 50% to 80% of the general population's odds. Over half of the ultimate victims of 12 diseases would have tested at below average risk, receiving a false sense of security. However, there was one disease category tested in the study, Alzheimer's disease, in which a negative test result might indicate as little as a 12% relative risk of disease compared to the general population.
Those testing positive for Alzheimer's, type 1 diabetes, male coronary heart disease and thyroid autoimmunity could account for over 75% of the patients developing the diseases. The study suggested that the utility of genetic tests will depend on the results of the individual tested, and cautions against complacency and unwise lifestyle choices for those testing negative.
I agree that some subscribers to personal genetics services could obtain valuable results. If, for example, someone learned that his probability of developing glaucoma was much higher than the 4% probability for the average person, the subscriber would more likely get regular glaucoma testing. This is of some value, assuming the stated odds are indeed properly calibrated, which may take years to confirm.
Inherited Diseases
Some inherited diseases, including cystic fibrosis, Tay-Sachs disease and sickle cell anemia, occur only when single defective genes are inherited from each parent. Other single gene diseases, such as Huntington's, are inherited with 50% odds of getting the gene and disease if just one parent is afflicted.
Dozens of rare genetic diseases affect newborns, many of which can be addressed by diet or vitamins.21 Quick diagnosis is often crucial as permanent damage can occur otherwise. As of March 2010, newborns were tested for 29 genetic diseases in most states.22
Sometimes only a tendency to contract a disease is inherited. One version of a specific gene mutation implies a 65% to 85% lifetime probability of a woman developing breast cancer, while another version implies a 45% to 85% probability.23 However, only 5% to 10% of breast cancer patients have those genes.24 Others get the disease with no apparent genetic correlation. Having those genes is a cause for concern, but not having them should not provide a lot of comfort.
Personalized Medicine
In 2003, Allen Roses, vice-president of genetics for GlaxoSmithKline, shocked consumers by stating that more than 90% of drugs work in just 30% to 50% of people.25 Roses was pushing the drug industry to pursue genetic testing rather than trial and error to determine which drugs work for a specific individual. Matt Ridley, in the 2006 version of his book, Genome, stated, "genetic diagnosis followed by conventional cure is probably the genome's greatest boon to medicine."26
Indeed, the lung cancer drug Iressa was approved in 2003 and creates a "miraculous response" in the 10% of patients with a specific genetic mutation of the disease. Herceptin was approved in 2006 to target the 25% of breast cancer patients who are afflicted with a specific genetic version of that disease. Likewise, targeted cancer drugs such as Avastin, Tarceva and Erbitux, are prescribed after genetic testing.27
On January 31, 2012, Kalydeco was approved to treat 1,200 cystic fibrosis patients, 4% of the total, who have a specific gene defect. It is the first drug to treat the defect rather than the symptoms of the disease, and has been termed "transformational" for those who can use it.28 The Cystic Fibrosis Foundation spurred development of the drug by helping to fund the development effort, and aided the process by creating a registry that includes the genetic characteristics of the disease for 90% of American patients.
Some drugs appear to work for most people, but have widely varying optimal dosages. Variations in genes largely determine how quickly people metabolize drugs.29 "Unanticipated drug responses are estimated to result in two million hospitalizations and 100,000 deaths in the United States each year," writes Nicholas Gillham in his book, Genes, Chromosomes, and Disease.30
In the case of blood thinner warfarin (brand name Coumadin), patients exhibit a tenfold range in ability to metabolize the drug.31 Too little of it can result in a stroke, but too much can cause bleeding and hemorrhaging.32 The FDA now provides dosage information on the drug's label based on variants of two genes.33 About 10% of labels for FDA-approved drugs now have pharmacogenomics information.34
Investment Implications
Genetic science is rapidly advancing and will likely revolutionize many aspects of medical care. It is starting to be helpful in predicting susceptibility to common diseases, but will likely be more valuable in identifying risks of inherited diseases and in determining appropriate drug usage and dosage. Given the complexity of the subject, there will likely be increasing demands for genetic counselors.
There exists uncertainty regarding how the FDA and others will regulate genetic tests, as well as the extent to which genetic discoveries will be patentable. On the investment front, we have looked for and invested in opportunities created by genetic science. We've focused on a number of biotechnology and drug companies addressing
4
Wanger USA 2012 Semiannual Report
personalized medicine and niche orphan diseases and we will continue to look for additional opportunities.


Charles P. McQuaid
President and Chief Investment Officer
Columbia Wanger Asset Management, LLC
The information and data provided in this analysis are derived from sources that we deem to be reliable and accurate. These views are not guarantees of future performance and involve certain risks, uncertainties and assumptions that are difficult to predict so actual outcomes and results may differ significantly from the views expressed. The views/opinions expressed in this essay are those of the author and not of the Wanger Advisors Trust Board, are subject to change at any time based upon economic, market or other conditions, may differ from views expressed by other Columbia Management associates and the respective parties disclaim any responsibility to update such views. These views may not be relied on as investment advice and, because investment decisions for a Columbia Wanger Fund are based on numerous factors, may not be relied on as an indication of trading intent on behalf of any particular Columbia Wanger Fund.
1 Gillham, Nicholas Wright, Genes, Chromosomes, and Disease, (Upper Saddle River, New Jersey, FT Press Science 2011) p. 5.
2 Davies, Kevin, The $1,000 Genome, (New York, New York, Free Press 2010) p. 1, 23.
3 Ibid., p. 9-11.
4 Ibid., p. 79.
5 Ibid., p. 90.
6 Ibid., p. 94.
7 Ibid., p. 111.
8 Gillham, Nicholas Wright, op. cit., p. 244.
9 Davies, Kevin, op. cit., p. 209. www.knome.com.
10 Falconi, Marta, "Roche To Return Tendered Illumina Shares to Shareholders," Dow Jones News Service, April 23, 2012.
11 Davies, Kevin, op. cit., p. 231.
12 Davies, Kevin, op. cit., p. 239.
13 Ibid., p. 245-246.
14 Ibid., p. 133. Disruptive technologies refers to making much more than incremental advances by utilizing a whole new or additional approach. In this context, the parallel sequencing and use of other detection mechanisms such as pH or electric conductivity have caused the cost of sequencing to plunge far faster than a regular learning curve might suggest.
15�� Ibid., p. 31-32.
16 Ibid., p. 55,63. www.decodeme.com.
17 www.23andme.com.
18 Davies, Kevin, op. cit., p. 149.
19 Ibid., p. 23.
20 Roberts, Nicholas J., and Vogelstein, Joshua T., et al, "The Predictive Capacity of Personal Genome Sequencing," Science Translational Medicine, Rapid Publication, April 2, 2012, stm.sciencemag.org.
21 Gillham, Nicholas Wright, op. cit., p. 204.
22 Ibid., p. 201.
23 Ibid., p. 184.
24 Ibid., p. 116.
25 Connor, Steve, "Glaxo Chief: Our Drugs Do Not Work On Most Patients," The Independent, December 8, 2003.
26 Ridley, Matt, Genome, (New York, New York, First Harper Perennial, 2006) p. 257.
27 Davies, Kevin, op. cit., p. 255-256.
28 Usdin, Steve, "Product Discovery & Development: Kalydescopic Vision," BioCentury, March 5, 2012, Volume 20, Number 10, p. A2.
29 Davies, Kevin, op. cit., p. 257.
30 Gillham, Nicholas Wright, op. cit., p. 237.
31 Davies, Kevin, op. cit., p. 257.
32 Gillham, Nicholas Wright, op. cit., p. 238.
33 Davies, Kevin, op. cit., p. 257.
34 Hamburg, M.D., Margaret A., and Collins, M.D., Ph.D., Francis S., "The Path to Personalized Medicine," New England Journal of Medicine, July 22, 2010, Volume 363, p. 301-304, www.nejm.org.
5
Wanger USA 2012 Semiannual Report

Performance Review Wanger USA

Robert A. Mohn
Portfolio Manager
Performance data shown represents past performance and is not a guarantee of future results. The investment return and principal value will fluctuate so that shares, when redeemed, may be worth more or less than the original cost. Current performance may be lower or higher than the performance data shown. Please visit columbiamanagement.com for most recent month-end performance updates.
Wanger USA ended the six month period through June 30, 2012, up 10.37%, outperforming the 8.53% gain of its primary benchmark, the Russell 2000 Index. We were pleased with the Fund's relative return, but disappointed that lagging performance in several Fund retail and technology stocks late in the period took away from earlier gains.
On the upside, two "deal" announcements positively impacted results. Cost management software company Ariba is to be taken over by SAP. Its stock rose 59% on the announcement. Convention hotel operator Gaylord Entertainment decided to convert to a real estate investment trust, news that sent its stock up 60% for the half year.
In the telecom sector, tw telecom, a provider of fiber optic telephone and data services, benefited from a surge in data usage and reported solid growth in cash flow year-over-year. Its stocks responded favorably with a 32% gain for the six months.
Several Fund biopharmaceutical stocks were strong in the period. Auxilium Pharmaceuticals gained 35% on news of a successful phase three drug trial. Onyx Pharmaceuticals rose 52% upon receiving approval from an FDA advisory panel for one of its medications. Generic drug manufacturer Akorn increased 42% as sales of its generic injectable drugs tripled versus the prior year.
Other top contributors for the period included premium active apparel retailer lululemon athletica. The company announced a fantastic first quarter, with same-store sales up 25% over the prior year, but company guidance of slower growth in the second quarter caused the stock to pull back. Despite the negative turn, lululemon athletica was still up 27% for the period. Nordson, a manufacturer of dispensing systems for adhesives and coatings, ended the half year up 25% benefitting, in part, from better-than-expected earnings news early in the period.
Laggards for the period included semiconductor manufacturer Atmel, down 17%. The company's revenues dropped 22% versus the prior year due to the loss of an anticipated touchscreen microcontroller contract. Teen apparel retailer Abercrombie & Fitch experienced a sales shortfall on woeful sales in woebegone Europe. Its stock was down 30% for the half year.
Fund energy investments were also weak. Oil and gas producer SM Energy fell over 33% as prices of natural gas liquids fell more than crude oil. Houston American Energy was down 91% on disappointing drilling results in Colombia.
These days the financial press seems to enjoy obsessing over existential economic issues. Certainly, talk of euro woes and fiscal cliffs can be as riveting and entertaining as a good horror flick. "Experts" claim that investing is all about getting the macro right, given the current uncertain economic environment (truthfully, when has the economic outlook ever been certain?). But when the investment community is so overly focused on the big picture, we believe it pays to go small. We'll leave the macro anguish to others who can't see the trees for the forest, and instead dig for what we believe are well-run companies able to grow faster than their peers and that thrive in our current much-maligned, but still growing, economy.
Stocks of small- and mid-cap companies pose special risks, including possible illiquidity and greater price volatility than stocks of larger, more established companies.
Portfolio holdings are subject to change periodically and may not be representative of current holdings.
Fund's Positions in Mentioned Holdings
As a percentage of net assets, as of 6/30/12
| Nordson | 3.2 | % | |||||
| lululemon athletica | 3.0 | ||||||
| tw telecom | 2.7 | ||||||
| Gaylord Entertainment | 2.2 | ||||||
| Abercrombie & Fitch | 1.1 | ||||||
| Atmel | 1.0 | ||||||
| Akorn | 0.8 | ||||||
| Auxilium Pharmaceuticals | 0.7 | ||||||
| SM Energy | 0.6 | ||||||
| Onyx Pharmaceuticals | 0.4 | ||||||
| Houston American Energy | 0.0 | * | |||||
* Rounds to less than 0.1%.
6
Wanger USA 2012 Semiannual Report
Growth of a $10,000 Investment in Wanger USA
May 3, 1995 (inception date) through June 30, 2012
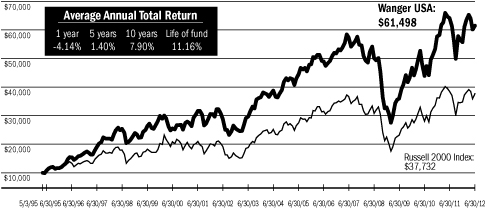
Performance data shown represents past performance and is not a guarantee of future results. The investment return and principal value will fluctuate so that shares, when redeemed, may be worth more or less than the original cost. Current performance may be lower or higher than the performance data shown. Performance results reflect any fee waivers or reimbursements of Fund expenses by the investment manager and/or any of its affiliates. Absent these fee waivers and/or expense reimbursement arrangements, performance results would have been lower. For daily and most recent month-end performance updates, please call 1-888-4-WANGER.
This graph compares the results of $10,000 invested in Wanger USA on May 3, 1995 (the date the Fund began operations) through June 30, 2012, to the Russell 2000 Index, with dividends and capital gains reinvested. Although the index is provided for use in assessing the Fund's performance, the Fund's holdings may differ significantly from those in the index.
Top 10 Holdings
As a percentage of net assets, as of 6/30/12
| 1. Ametek Aerospace/Industrial Instruments | 3.6 | % | |||||
| 2. Nordson Dispensing Systems for Adhesives & Coatings | 3.2 | ||||||
| 3. lululemon athletica Premium Active Apparel Retailer | 3.0 | ||||||
| 4. tw telecom Fiber Optic Telephone/Data Services | 2.7 | ||||||
| 5. Micros Systems Information Systems for Restaurants & Hotels | 2.7 | ||||||
| 6. Informatica Enterprise Data Integration Software | 2.7 | ||||||
| 7. Donaldson Industrial Air Filtration | 2.5 | ||||||
| 8. Gaylord Entertainment Convention Hotels | 2.2 | ||||||
| 9. Mettler-Toledo International Laboratory Equipment | 2.2 | ||||||
| 10. Atwood Oceanics Offshore Drilling Contractor | 2.1 | ||||||
Top 5 Industries
As a percentage of net assets, as of 6/30/12
| Information | 29.5 | % | |||||
| Industrial Goods & Services | 17.3 | ||||||
| Consumer Goods & Services | 17.0 | ||||||
| Finance | 14.0 | ||||||
| Health Care | 10.5 | ||||||
Results as of June 30, 2012
| 2nd quarter | Year to date | 1 year | 5 years | 10 years | |||||||||||||||||||
| Wanger USA | -5.86 | % | 10.37 | % | -4.14 | % | 1.40 | % | 7.90 | % | |||||||||||||
| Russell 2000 Index* | -3.47 | 8.53 | -2.08 | 0.54 | 7.00 | ||||||||||||||||||
| Lipper Variable Underlying Small-Cap Growth Funds Index | -5.65 | 8.56 | -4.87 | 1.31 | 7.17 | ||||||||||||||||||
* The Fund's primary benchmark.
NAV as of 6/30/12: $31.22
Performance numbers reflect all Fund expenses but do not include any fees and expenses imposed under your variable annuity or life insurance policy or qualified pension or retirement plan. If performance included the effect of these additional charges, it would be lower.
The Fund's annual operating expense ratio of 0.94% is stated as of the Fund's prospectus dated May 1, 2012, and differences in expense ratios disclosed elsewhere in this report may result from including fee waivers and expense reimbursements as well as different time periods used in calculating the ratios.
All results shown assume reinvestment of distributions and do not reflect taxes that a shareholder would pay on Fund distributions or the sale of Fund shares.
The Russell 2000 Index measures the performance of the 2,000 smallest companies in the Russell 3000 Index, which represents approximately 10% of the total market capitalization of the Russell 3000 Index. The Lipper Variable Underlying Small-Cap Growth Funds Index is an equally weighted representation of the 30 largest variable insurance underlying funds in the Lipper Variable Underlying Small-Cap Growth Funds Classification, and shows how the Fund's performance compares with returns of an index of funds with similar investment objectives. Indexes are not managed and do not incur fees or expenses. It is not possible to invest directly in an index.
Lipper Inc., a widely respected data provider in the industry, calculates an average total return (assuming reinvestment of distributions) for mutual funds with investment objectives similar to those of the Fund. Lipper makes no adjustment for the effect of sales loads.
Portfolio characteristics and holdings are subject to change periodically and may not be representative of current characteristics and holdings.
7
Wanger USA 2012 Semiannual Report
Wanger USA
Statement of Investments (Unaudited) June 30, 2012
| Number of Shares | Value | ||||||||||
| Equities – 99.7% | |||||||||||
| Information – 29.5% | |||||||||||
| Business Software – 10.2% | |||||||||||
| 413,000 | Micros Systems (a) Information Systems for Hotels, Restaurants & Retailers | $ | 21,145,600 | ||||||||
| 498,000 | Informatica (a) Enterprise Data Integration Software | 21,095,280 | |||||||||
| 221,000 | Ansys (a) Simulation Software for Engineers & Designers | 13,947,310 | |||||||||
| 106,000 | Concur Technologies (a) Web Enabled Cost & Expense Management Software | 7,218,600 | |||||||||
| 107,000 | NetSuite (a) End-to-end IT Systems Solution Delivered Over the Web | 5,860,390 | |||||||||
| 163,000 | SPS Commerce (a) Supply Chain Management Software Delivered via the Web | 4,951,940 | |||||||||
| 58,000 | Advent Software (a) Asset Management & Trading Systems | 1,572,380 | |||||||||
| 160,000 | SABA (a) Learning Management Systems | 1,484,800 | |||||||||
| 195,000 | Velti (a) (b) Mobile Marketing Software Platform | 1,267,500 | |||||||||
| 38,800 | Blackbaud Software & Services for Non-profits | 995,996 | |||||||||
| 79,539,796 | |||||||||||
| Semiconductors & Related Equipment – 4.3% | |||||||||||
| 438,000 | Microsemi (a) Analog/Mixed Signal Semiconductors | 8,098,620 | |||||||||
| 1,111,000 | Atmel (a) Microcontrollers, Radio Frequency & Memory Semiconductors | 7,443,700 | |||||||||
| 281,000 | Monolithic Power Systems (a) High Performance Analog & Mixed Signal Integrated Circuits | 5,583,470 | |||||||||
| 520,000 | ON Semiconductor (a) Mixed Signal & Power Management Semiconductors | 3,692,000 | |||||||||
| 86,000 | Ultratech (a) Semiconductor Equipment | 2,709,000 | |||||||||
| 243,000 | Entegris (a) Semiconductor Materials Management Products | 2,075,220 | |||||||||
| 205,000 | Pericom Semiconductor (a) Interface Integrated Circuits & Frequency Control Products | 1,845,000 | |||||||||
| 25,000 | Hittite Microwave (a) Radio Frequency, Microwave & Millimeterwave Semiconductors | 1,278,000 | |||||||||
| 203,000 | TriQuint Semiconductor (a) Radio Frequency Semiconductors | 1,116,500 | |||||||||
| 33,841,510 | |||||||||||
| Number of Shares | Value | ||||||||||
| Instrumentation – 4.0% | |||||||||||
| 109,750 | Mettler-Toledo International (a) Laboratory Equipment | $ | 17,104,537 | ||||||||
| 318,000 | IPG Photonics (a) Fiber Lasers | 13,861,620 | |||||||||
| 30,966,157 | |||||||||||
| Telephone & Data Services – 3.0% | |||||||||||
| 830,000 | tw telecom (a) Fiber Optic Telephone/Data Services | 21,297,800 | |||||||||
| 197,000 | Boingo Wireless (a) (b) Wholesale & Retail WiFi Networks | 2,289,140 | |||||||||
| 23,586,940 | |||||||||||
| Computer Services – 2.0% | |||||||||||
| 333,000 | ExlService Holdings (a) Business Process Outsourcing | 8,205,120 | |||||||||
| 405,000 | RCM Technologies (a) Technology & Engineering Services | 2,243,700 | |||||||||
| 33,000 | Syntel Offshore IT Services | 2,003,100 | |||||||||
| 175,000 | WNS - ADR (India) (a) Offshore BPO (Business Process Outsourcing) Services | 1,702,750 | |||||||||
| 297,522 | Hackett Group (a) IT Integration & Best Practice Research | 1,657,198 | |||||||||
| 15,811,868 | |||||||||||
| Computer Hardware & Related Equipment – 1.7% | |||||||||||
| 397,000 | II-VI (a) Laser Optics & Specialty Materials | 6,617,990 | |||||||||
| 90,000 | Zebra Technologies (a) Bar Code Printers | 3,092,400 | |||||||||
| 66,000 | Netgear (a) Networking Products for Small Business & Home | 2,277,660 | |||||||||
| 38,000 | Nice Systems - ADR (Israel) (a) Audio & Video Recording Solutions | 1,390,800 | |||||||||
| 13,378,850 | |||||||||||
| Gaming Equipment & Services – 1.7% | |||||||||||
| 264,000 | Bally Technologies (a) Slot Machines & Software | 12,318,240 | |||||||||
| 42,000 | WMS Industries (a) Slot Machine Provider | 837,900 | |||||||||
| 13,156,140 | |||||||||||
See accompanying notes to financial statements.
8
Wanger USA 2012 Semiannual Report
Wanger USA
Statement of Investments (Unaudited) June 30, 2012
| Number of Shares | Value | ||||||||||
| Telecommunications Equipment – 0.9% | |||||||||||
| 275,800 | Finisar (a) Optical Subsystems & Components | $ | 4,125,968 | ||||||||
| 133,000 | Ixia (a) Telecom Network Test Equipment | 1,598,660 | |||||||||
| 135,000 | Infinera (a) Optical Networking Equipment | 923,400 | |||||||||
| 6,648,028 | |||||||||||
| Contract Manufacturing – 0.6% | |||||||||||
| 122,000 | Plexus (a) Electronic Manufacturing Services | 3,440,400 | |||||||||
| 165,000 | Sanmina-SCI (a) Electronic Manufacturing Services | 1,351,350 | |||||||||
| 4,791,750 | |||||||||||
| Financial Processors – 0.5% | |||||||||||
| 91,000 | Global Payments Credit Card Processor | 3,933,930 | |||||||||
| Business Information & Marketing Services – 0.5% | |||||||||||
| 291,200 | Navigant Consulting (a) Financial Consulting Firm | 3,680,768 | |||||||||
| TV Broadcasting – 0.1% | |||||||||||
| 472,000 | Entravision Communications Spanish Language TV & Radio Stations | 571,120 | |||||||||
| Total Information | 229,906,857 | ||||||||||
| Industrial Goods & Services – 17.3% | |||||||||||
| Machinery – 14.3% | |||||||||||
| 568,200 | Ametek Aerospace/Industrial Instruments | 28,358,862 | |||||||||
| 480,200 | Nordson Dispensing Systems for Adhesives & Coatings | 24,629,458 | |||||||||
| 580,000 | Donaldson Industrial Air Filtration | 19,354,600 | |||||||||
| 297,300 | ESCO Technologies Automatic Electric Meter Readers | 10,833,612 | |||||||||
| 187,000 | Moog (a) Motion Control Products for Aerospace, Defense & Industrial Markets | 7,732,450 | |||||||||
| 128,000 | Pentair Pumps & Water Treatment | 4,899,840 | |||||||||
| 98,000 | Polypore International (a) (b) Battery Separators & Filtration Media | 3,958,220 | |||||||||
| Number of Shares | Value | ||||||||||
| 44,368 | Toro Turf Maintenance Equipment | $ | 3,251,731 | ||||||||
| 82,000 | Kennametal Consumable Cutting Tools | 2,718,300 | |||||||||
| 71,000 | Heico FAA Approved Aircraft Replacement Parts | 2,290,460 | |||||||||
| 100,000 | Oshkosh Corporation (a) Specialty Truck Manufacturer | 2,095,000 | |||||||||
| 13,000 | Middleby Corp (a) Manufacturer of Cooking Equipment | 1,294,930 | |||||||||
| 111,417,463 | |||||||||||
| Industrial Materials & Specialty Chemicals – 1.4% | |||||||||||
| 187,000 | Drew Industries (a) RV & Manufactured Home Components | 5,207,950 | |||||||||
| 176,000 | Albany International Paper Machine Clothing & Composites for Aerospace | 3,292,960 | |||||||||
| 33,000 | Albemarle Refinery Catalysts & Other Specialty Chemicals | 1,968,120 | |||||||||
| 10,469,030 | |||||||||||
| Electrical Components – 0.7% | |||||||||||
| 104,000 | Acuity Brands Commercial Lighting Fixtures | 5,294,640 | |||||||||
| Steel – 0.4% | |||||||||||
| 320,400 | GrafTech International (a) Industrial Graphite Materials Producer | 3,091,860 | |||||||||
| Construction – 0.3% | |||||||||||
| 100,000 | Fortune Brands Home & Security (a) Home Building Supplies & Small Locks | 2,227,000 | |||||||||
| Waste Management – 0.2% | |||||||||||
| 33,000 | Clean Harbors (a) Hazardous Waste Services & Disposal | 1,861,860 | |||||||||
| Total Industrial Goods & Services | 134,361,853 | ||||||||||
| Consumer Goods & Services – 17.0% | |||||||||||
| Retail – 6.5% | |||||||||||
| 388,000 | lululemon athletica (a) (b) Premium Active Apparel Retailer | 23,136,440 | |||||||||
| 256,000 | Abercrombie & Fitch Teen Apparel Retailer | 8,739,840 | |||||||||
| 382,000 | Pier 1 Imports Home Furnishing Retailer | 6,276,260 | |||||||||
See accompanying notes to financial statements.
9
Wanger USA 2012 Semiannual Report
Wanger USA
Statement of Investments (Unaudited) June 30, 2012
| Number of Shares | Value | ||||||||||
| Retail – 6.5% (cont) | |||||||||||
| 180,500 | Shutterfly (a) (b) Internet Photo-centric Retailer | $ | 5,539,545 | ||||||||
| 476,000 | Saks (a) (b) Luxury Department Store Retailer | 5,069,400 | |||||||||
| 69,500 | Teavana (a) (b) Specialty Tea Retailer | 940,335 | |||||||||
| 116,229 | Gaiam (a) Healthy Living Catalogs & E-Commerce | 453,293 | |||||||||
| 6,000 | The Fresh Market (a) Specialty Food Retailer | 321,780 | |||||||||
| 50,476,893 | |||||||||||
| Travel – 4.4% | |||||||||||
| 449,700 | Gaylord Entertainment (a) Convention Hotels | 17,340,432 | |||||||||
| 659,500 | Avis Budget Group (a) Second Largest Car Rental Company | 10,024,400 | |||||||||
| 400,000 | Hertz (a) Largest U.S. Rental Car Operator | 5,120,000 | |||||||||
| 72,000 | HomeAway (a) (b) Vacation Rental Online Marketplace | 1,565,280 | |||||||||
| 34,050,112 | |||||||||||
| Furniture & Textiles – 1.6% | |||||||||||
| 590,000 | Knoll Office Furniture | 7,917,800 | |||||||||
| 125,000 | Herman Miller Office Furniture | 2,315,000 | |||||||||
| 100,000 | Caesarstone (Israel) (a) Quartz Countertops | 1,211,000 | |||||||||
| 67,800 | Interface Modular & Broadloom Carpet | 924,114 | |||||||||
| 12,367,914 | |||||||||||
| Consumer Goods Distribution – 1.2% | |||||||||||
| 232,000 | Pool Distributor of Swimming Pool Supplies & Equipment | 9,386,720 | |||||||||
| Other Consumer Services – 1.0% | |||||||||||
| 163,000 | Lifetime Fitness (a) Sport & Fitness Club Operator | 7,581,130 | |||||||||
| Number of Shares | Value | ||||||||||
| Apparel – 0.8% | |||||||||||
| 108,500 | Warnaco Group (a) Global Branded Apparel Manufacturer | $ | 4,619,930 | ||||||||
| 65,000 | True Religion Apparel Premium Denim | 1,883,700 | |||||||||
| 6,503,630 | |||||||||||
| Casinos & Gaming – 0.5% | |||||||||||
| 392,000 | Pinnacle Entertainment (a) Regional Casino Operator | 3,771,040 | |||||||||
| Other Durable Goods – 0.4% | |||||||||||
| 85,000 | Jarden Branded Household Products | 3,571,700 | |||||||||
| Nondurables – 0.4% | |||||||||||
| 96,000 | Helen of Troy (a) Personal Care, Housewares, Healthcare & Home Environment Products | 3,253,440 | |||||||||
| Leisure Products – 0.2% | |||||||||||
| 110,000 | Skullcandy (a) (b) Lifestyle Branded Headphones | 1,556,500 | |||||||||
| Food & Beverage – % | |||||||||||
| 2,800 | Annie's (a) (b) Developer & Marketer of Natural & Organic Food | 117,208 | |||||||||
| Total Consumer Goods & Services | 132,636,287 | ||||||||||
| Finance – 13.9% | |||||||||||
| Banks – 7.7% | |||||||||||
| 373,000 | MB Financial Chicago Bank | 8,034,420 | |||||||||
| 253,000 | Lakeland Financial Indiana Bank | 6,787,990 | |||||||||
| 485,000 | Associated Banc-Corp Midwest Bank | 6,397,150 | |||||||||
| 107,000 | SVB Financial Group (a) Bank to Venture Capitalists | 6,283,040 | |||||||||
| 504,000 | Valley National Bancorp New Jersey/New York Bank | 5,342,400 | |||||||||
| 103,000 | City National Bank & Asset Manager | 5,003,740 | |||||||||
| 161,194 | Hancock Holding Gulf Coast Bank | 4,906,745 | |||||||||
| 368,000 | TCF Financial Great Lakes Bank | 4,224,640 | |||||||||
See accompanying notes to financial statements.
10
Wanger USA 2012 Semiannual Report
Wanger USA
Statement of Investments (Unaudited) June 30, 2012
| Number of Shares | Value | ||||||||||
| Banks – 7.7% (cont) | |||||||||||
| 666,200 | First Busey Illinois Bank | $ | 3,217,746 | ||||||||
| 400,000 | First Commonwealth Western Pennsylvania Bank | 2,692,000 | |||||||||
| 286,414 | Pacific Continental Bank Pacific Northwest Bank | 2,540,492 | |||||||||
| 216,000 | Virginia Commerce (a) Northern Virginia Bank | 1,820,880 | |||||||||
| 97,700 | Sandy Spring Bancorp Baltimore, D.C. Bank | 1,758,600 | |||||||||
| 504,451 | Guaranty Bancorp (a) Colorado Bank | 1,064,392 | |||||||||
| 16,282 | Green Bankshares (a) Tennessee Bank | 27,028 | |||||||||
| 60,101,263 | |||||||||||
| Finance Companies – 3.2% | |||||||||||
| 138,000 | World Acceptance (a) Personal Loans | 9,080,400 | |||||||||
| 174,900 | McGrath Rentcorp Temporary Space & IT Rentals | 4,634,850 | |||||||||
| 224,000 | CAI International (a) International Container Leasing | 4,453,120 | |||||||||
| 258,600 | H & E Equipment Services (a) Heavy Equipment Leasing | 3,886,758 | |||||||||
| 60,000 | Textainer Group Holdings (b) Top International Container Leasor | 2,214,000 | |||||||||
| 26,000 | Regional Management (a) Consumer Loans | 427,700 | |||||||||
| 24,696,828 | |||||||||||
| Savings & Loans – 1.3% | |||||||||||
| 408,600 | ViewPoint Financial Texas Thrift | 6,390,504 | |||||||||
| 142,000 | Berkshire Hills Bancorp Northeast Thrift | 3,124,000 | |||||||||
| 52,011 | Kaiser Federal Los Angeles Savings & Loan | 768,723 | |||||||||
| 10,283,227 | |||||||||||
| Number of Shares | Value | ||||||||||
| Brokerage & Money Management – 0.8% | |||||||||||
| 206,000 | SEI Investments Mutual Fund Administration & Investment Management | $ | 4,097,340 | ||||||||
| 85,000 | Eaton Vance (b) Specialty Mutual Funds | 2,290,750 | |||||||||
| 6,388,090 | |||||||||||
| Insurance – 0.5% | |||||||||||
| 27,000 | Allied World Holdings Commerical Lines Insurance/Reinsurance | 2,145,690 | |||||||||
| 19,000 | Enstar Group (a) Insurance/Reinsurance & Related Services | 1,879,860 | |||||||||
| 4,025,550 | |||||||||||
| Diversified Financial Companies – 0.4% | |||||||||||
| 146,500 | Leucadia National Holding Company | 3,116,055 | |||||||||
| Total Finance | 108,611,013 | ||||||||||
| Health Care – 10.5% | |||||||||||
| Biotechnology & Drug Delivery – 6.8% | |||||||||||
| 254,000 | BioMarin Pharmaceutical (a) Biotech Focused on Orphan Diseases | 10,053,320 | |||||||||
| 368,000 | Seattle Genetics (a) (b) Antibody-based Therapies for Cancer | 9,343,520 | |||||||||
| 55,000 | Alexion Pharmaceuticals (a) Biotech Focused on Orphan Diseases | 5,461,500 | |||||||||
| 202,000 | Auxilium Pharmaceuticals (a) Biotech Focused on Niche Disease Areas | 5,431,780 | |||||||||
| 411,000 | Isis Pharmaceuticals (a) Biotech Pioneer in Antisense Drugs | 4,932,000 | |||||||||
| 549,200 | NPS Pharmaceuticals (a) Orphan Drugs & Healthy Royalties | 4,728,612 | |||||||||
| 50,000 | Onyx Pharmaceuticals (a) Commercial-stage Biotech Focused on Cancer | 3,322,500 | |||||||||
| 185,200 | ARIAD Pharmaceuticals (a) Biotech Focused on Cancer | 3,187,292 | |||||||||
| 63,200 | Synageva Biopharma (a) (b) Biotech Focused on Orphan Diseases | 2,563,392 | |||||||||
| 201,000 | InterMune (a) Drugs for Pulmonary Fibrosis & Hepatitis C | 2,401,950 | |||||||||
| 155,400 | Raptor Pharmaceutical (a) (b) Orphan Drug Company | 868,686 | |||||||||
See accompanying notes to financial statements.
11
Wanger USA 2012 Semiannual Report
Wanger USA
Statement of Investments (Unaudited) June 30, 2012
| Number of Shares | Value | ||||||||||
| Biotechnology & Drug Delivery – 6.8% (cont) | |||||||||||
| 506,000 | Chelsea Therapeutics International (a) (b) Biotech Focused on Rare Diseases | $ | 748,880 | ||||||||
| 256,000 | Anthera Pharmaceuticals (a) Biotech Focused on Cardiovascular, Cancer & Immunology | 173,133 | |||||||||
| 53,216,565 | |||||||||||
| Medical Supplies – 1.5% | |||||||||||
| 224,600 | Cepheid (a) Molecular Diagnostics | 10,050,850 | |||||||||
| 26,000 | Techne Cytokines, Antibodies & Other Reagents for Life Science | 1,929,200 | |||||||||
| 11,980,050 | |||||||||||
| Medical Equipment & Devices – 1.2% | |||||||||||
| 143,000 | Sirona Dental Systems (a) Manufacturer of Dental Equipment | 6,436,430 | |||||||||
| 83,000 | Hill-Rom Holdings Hospital Beds/Patient Handling | 2,560,550 | |||||||||
| 8,996,980 | |||||||||||
| Pharmaceuticals – 0.9% | |||||||||||
| 385,000 | Akorn (a) Develops, Manufactures & Sells Specialty Generic Drugs | 6,071,450 | |||||||||
| 116,100 | Alimera Sciences (a) (b) Ophthalmology-focused Pharmaceutical Company | 347,139 | |||||||||
| 45,000 | Horizon Pharma (a) (b) Specialty Pharma Company | 320,850 | |||||||||
| 6,739,439 | |||||||||||
| Health Care Services – 0.1% | |||||||||||
| 100,000 | Health Management Associates (a) Non-urban Hospitals | 785,000 | |||||||||
| Total Health Care | 81,718,034 | ||||||||||
| Other Industries – 6.4% | |||||||||||
| Real Estate – 5.5% | |||||||||||
| 503,000 | Extra Space Storage Self Storage Facilities | 15,391,800 | |||||||||
| 371,600 | Biomed Realty Trust Life Science-focused Office Buildings | 6,941,488 | |||||||||
| 227,200 | DuPont Fabros Technology Technology-focused Office Buildings | 6,488,832 | |||||||||
| Number of Shares | Value | ||||||||||
| 935,000 | Kite Realty Group Community Shopping Centers | $ | 4,665,650 | ||||||||
| 264,000 | Education Realty Trust Student Housing | 2,925,120 | |||||||||
| 50,000 | Kilroy Realty West Coast Office & Industrial Properties | 2,420,500 | |||||||||
| 341,000 | DCT Industrial Trust Industrial Properties | 2,148,300 | |||||||||
| 119,000 | Associated Estates Realty Multi-family Properties | 1,779,050 | |||||||||
| 42,760,740 | |||||||||||
| Transportation – 0.9% | |||||||||||
| 100,500 | World Fuel Services Global Fuel Broker | 3,822,015 | |||||||||
| 184,487 | Rush Enterprises, Class A (a) Truck Sales & Service | 3,016,362 | |||||||||
| 6,838,377 | |||||||||||
| Total Other Industries | 49,599,117 | ||||||||||
| Energy & Minerals – 5.1% | |||||||||||
| Oil Services – 2.7% | |||||||||||
| 436,100 | Atwood Oceanics (a) Offshore Drilling Contractor | 16,502,024 | |||||||||
| 117,000 | Hornbeck Offshore (a) Supply Vessel Operator in U.S. Gulf of Mexico | 4,537,260 | |||||||||
| 21,039,284 | |||||||||||
| Oil & Gas Producers – 1.5% | |||||||||||
| 92,000 | SM Energy Oil & Gas Producer | 4,518,120 | |||||||||
| 81,000 | Rosetta Resources (a) Oil & Gas Producer Exploring in South Texas & Montana | 2,967,840 | |||||||||
| 83,000 | Swift Energy (a) Oil & Gas Exploration & Production | 1,544,630 | |||||||||
| 58,000 | Petroleum Development Corporation (a) Oil & Gas Producer in U.S. | 1,422,160 | |||||||||
| 47,000 | Approach Resource (a) Oil & Gas Producer in West Texas Permian | 1,200,380 | |||||||||
| 86,400 | Houston American Energy (a) Oil & Gas Exploration/Production in Colombia | 96,768 | |||||||||
| 11,749,898 | |||||||||||
See accompanying notes to financial statements.
12
Wanger USA 2012 Semiannual Report
Wanger USA
Statement of Investments (Unaudited) June 30, 2012
| Number of Shares | Value | ||||||||||
| Mining – 0.9% | |||||||||||
| 56,000 | Core Laboratories (Netherlands) Oil & Gas Reservoir Consulting | $ | 6,490,400 | ||||||||
| 100,000 | Augusta Resource (a) US Copper/Moly Mine | 166,000 | |||||||||
| 6,656,400 | |||||||||||
| Total Energy & Minerals | 39,445,582 | ||||||||||
| Total Equities (Cost: $489,392,930) – 99.7% | 776,278,743 | ||||||||||
| Securities Lending Collateral – 4.3% | |||||||||||
| 33,193,775 | Dreyfus Government Cash Management Fund (7 day yield of 0.01%) (c) | 33,193,775 | |||||||||
| Total Securities Lending Collateral (Cost: $33,193,775) | 33,193,775 | ||||||||||
| Total Investments (Cost: $522,586,705) – 104.0% (d) (e) | 809,472,518 | ||||||||||
| Obligation to Return Collateral for Securities Loaned – (4.3)% | (33,193,775 | ) | |||||||||
| Cash and Other Assets Less Liabilities – 0.3% | 2,285,837 | ||||||||||
| Total Net Assets – 100.0% | $ | 778,564,580 | |||||||||
ADR = American Depositary Receipts
Notes to Statement of Investments
(a) Non-income producing security.
(b) All or a portion of this security was on loan at June 30, 2012. The total market value of securities on loan at June 30, 2012 was $33,052,856.
(c) Investment made with cash collateral received from securities lending activity.
(d) At June 30, 2012, for federal income tax purposes, the cost of investments was $522,586,705 and net unrealized appreciation was $286,885,813 consisting of gross unrealized appreciation of $328,383,122 and gross unrealized depreciation of $41,497,309.
(e) On June 30, 2012, the market value of foreign securities represented 1.39% of total net assets. The Fund's foreign portfolio was diversified as follows:
| Country | Value | Percentage of Net Assets | |||||||||
| India | $ | 1,702,750 | 0.22 | ||||||||
| Israel | 2,601,800 | 0.34 | |||||||||
| Netherlands | 6,490,400 | 0.83 | |||||||||
| Total Foreign Portfolio | $ | 10,794,950 | 1.39 | ||||||||
Fair Value Measurements
Various inputs are used in determining the value of the Fund's investments, following the input prioritization hierarchy established by GAAP. These inputs are summarized in the three broad levels listed below:
• Level 1 – quoted prices in active markets for identical securities
• Level 2 – prices determined using other significant observable inputs (including quoted prices for similar securities, interest rates, prepayment speeds, credit risk and others)
• Level 3 – prices determined using significant unobservable inputs where quoted prices or observable inputs are unavailable or less reliable (including management's own assumptions about the factors market participants would use in pricing an investment)
The inputs or methodology used for valuing securities are not necessarily an indication of the risk associated with investing in those securities.
Examples of the types of securities in which the Fund would typically invest and how they are classified within this hierarchy are as follows. Typical Level 1 securities include exchange traded domestic equities, mutual funds whose NAVs are published each day and exchange traded foreign equities that are not statistically fair valued. Typical Level 2 securities include exchange traded foreign equities that are statistically fair valued and short-term investments valued at amortized cost. Additionally, securities fair valued by the Valuation Committee (the Committee) of the Fund's Board of Trustees (the Board) that rely on significant observable inputs are also included in Level 2. Typical Level 3 securities include any security fair valued by the Committee that relies on significant unobservable inputs.
Under the direction of the Board, the Committee is responsible for carrying out the valuation procedures approved by the Board.
The Committee meets as necessary, and no less frequently than quarterly, to determine fair values for securities for which market quotations are not readily available or for which the investment manager believes that available market quotations are unreliable, and to review the continuing appropriateness of the current value of any security subject to the Trust's Portfolio Pricing Policy and the pricing procedures of the investment manager (the Policies). The Policies address, among other things: circumstances under which market quotations will be deemed readily available; selection of third party pricing vendors; appropriate pricing methodologies; events that require fair valuation and fair value techniques; and circumstances under which securities will be deemed to
See accompanying notes to financial statements.
13
Wanger USA 2012 Semiannual Report
Wanger USA
Statement of Investments (Unaudited) June 30, 2012
pose a potential for stale pricing, including when securities are illiquid, restricted, or in default. The Committee may also meet to discuss additional valuation matters, which may include review of back-testing results, review of time-sensitive information or approval of other valuation related actions, and to review the appropriateness of the Policies.
For investments categorized as Level 3, the significant unobservable inputs used in the fair value measurement of the Funds' securities may include: (i) data specific to the issuer or comparable issuers, (ii) general market or specific sector news and (iii) quoted prices and specific or similar security transactions. The Committee considers this data and any changes from prior periods in order to assess the reasonableness of observable and unobservable inputs, any assumptions or internal models used to value those securities and changes in fair value. Significant changes in any of these factors could result in lower or higher fair value measurements. Various factors impact the frequency of monitoring (which may occur as often as daily), however the Committee may determine that changes to inputs, assumptions and models are not required with the same frequency.
The following table summarizes the inputs used, as of June 30, 2012, in valuing the Fund's assets:
| Investment Type | Quoted Prices (Level 1) | Other Significant Observable Inputs (Level 2) | Significant Unobservable Inputs (Level 3) | Total | |||||||||||||||
| Equities | |||||||||||||||||||
| Information | $ | 229,906,857 | $ | — | $ | — | $ | 229,906,857 | |||||||||||
| Industrial Goods & Services | 134,361,853 | — | — | 134,361,853 | |||||||||||||||
| Consumer Goods & Services | 132,636,287 | — | — | 132,636,287 | |||||||||||||||
| Finance | 108,611,013 | — | — | 108,611,013 | |||||||||||||||
| Health Care | 81,718,034 | — | — | 81,718,034 | |||||||||||||||
| Other Industries | 49,599,117 | — | — | 49,599,117 | |||||||||||||||
| Energy & Minerals | 39,445,582 | — | — | 39,445,582 | |||||||||||||||
| Total Equities | 776,278,743 | — | — | 776,278,743 | |||||||||||||||
| Total Securities Lending Collateral | 33,193,775 | — | — | 33,193,775 | |||||||||||||||
| Total Investments | $ | 809,472,518 | $ | — | $ | — | $ | 809,472,518 | |||||||||||
There were no transfers of financial assets between levels 1 and 2 during the period.
See accompanying notes to financial statements.
14
Wanger USA 2012 Semiannual Report
Statement of Assets and Liabilities
June 30, 2012 (Unaudited)
| Assets: | |||||||
| Investments, at cost | $ | 522,586,705 | |||||
| Investments, at value (including securities on loan of $33,052,856) | $ | 809,472,518 | |||||
| Cash | 1,921,482 | ||||||
| Receivable for: | |||||||
| Investments sold | 1,691,131 | ||||||
| Fund shares sold | 158,142 | ||||||
| Securities lending income | 39,069 | ||||||
| Dividends | 219,033 | ||||||
| Trustees' deferred compensation plan | 97,098 | ||||||
| Prepaid expenses | 3,953 | ||||||
| Total Assets | 813,602,426 | ||||||
| Liabilities: | |||||||
| Collateral on securities loaned | 33,193,775 | ||||||
| Payable for: | |||||||
| Investments purchased | 439,015 | ||||||
| Fund shares repurchased | 1,107,248 | ||||||
| Investment advisory fee | 17,828 | ||||||
| Administration fee | 1,033 | ||||||
| Transfer agent fee | 2 | ||||||
| Custody fee | 2,297 | ||||||
| Reports to shareholders | 152,481 | ||||||
| Chief compliance officer expenses | 1,731 | ||||||
| Trustees' deferred compensation plan | 97,098 | ||||||
| Other liabilities | 25,338 | ||||||
| Total Liabilities | 35,037,846 | ||||||
| Net Assets | $ | 778,564,580 | |||||
| Composition of Net Assets: | |||||||
| Paid-in capital | $ | 441,029,567 | |||||
| Accumulated net investment loss | (1,244,789 | ) | |||||
| Accumulated net realized gain | 51,893,989 | ||||||
| Net unrealized appreciation (depreciation) on: | |||||||
| Investments | 286,885,813 | ||||||
| Net Assets | $ | 778,564,580 | |||||
| Fund Shares Outstanding | 24,935,994 | ||||||
| Net asset value, offering price and redemption price per share | $ | 31.22 | |||||
Statement of Operations
For the Six Months Ended June 30, 2012 (Unaudited)
| Investment Income: | |||||||
| Dividends (net foreign taxes withheld of $4,704) | $ | 2,553,712 | |||||
| Securities lending income, net | 185,185 | ||||||
| Total Investment Income | 2,738,897 | ||||||
| Expenses: | |||||||
| Investment advisory fee | 3,463,837 | ||||||
| Administration fee | 202,154 | ||||||
| Transfer agent fee | 348 | ||||||
| Trustees' fees | 22,622 | ||||||
| Custody fee | 3,207 | ||||||
| Reports to shareholders | 141,531 | ||||||
| Audit fee | 19,733 | ||||||
| Legal fees | 41,140 | ||||||
| Chief compliance officer expenses (See Note 4) | 13,320 | ||||||
| Commitment fee for line of credit (See Note 5) | 2,753 | ||||||
| Other expenses | 15,845 | ||||||
| Total Expenses | 3,926,490 | ||||||
| Advisory fee waiver (See Note 4) | (30,627 | ) | |||||
| Net Expenses | 3,895,863 | ||||||
| Net Investment Loss | (1,156,966 | ) | |||||
| Net Realized and Unrealized Gain (Loss) on Investments: | |||||||
| Net realized gain (loss) on: | |||||||
| Investments | 55,214,832 | ||||||
| Net realized gain | 55,214,832 | ||||||
| Net change in unrealized appreciation (depreciation) on: | |||||||
| Investments | 25,059,880 | ||||||
| Net change in unrealized appreciation | 25,059,880 | ||||||
| Net Gain | 80,274,712 | ||||||
| Net Increase in Net Assets from Operations | $ | 79,117,746 | |||||
See accompanying notes to financial statements.
15
Wanger USA 2012 Semiannual Report
Statements of Changes in Net Assets
| Increase (Decrease) in Net Assets: | (Unaudited) Six Months Ended June 30, 2012 | Year Ended December 31, 2011 | |||||||||
| Operations: | |||||||||||
| Net investment loss | $ | (1,156,966 | ) | $ | (3,406,627 | ) | |||||
| Net realized gain (loss) on: | |||||||||||
| Investments | 55,214,832 | 40,209,704 | |||||||||
| Net change in unrealized appreciation (depreciation) on: | |||||||||||
| Investments | 25,059,880 | (61,499,216 | ) | ||||||||
| Net Increase (Decrease) in Net Assets from Operations | 79,117,746 | (24,696,139 | ) | ||||||||
| Distributions to Shareholders: | |||||||||||
| From net realized gains | (39,051,960 | ) | (78,451,985 | ) | |||||||
| Total Distributions to Shareholders | (39,051,960 | ) | (78,451,985 | ) | |||||||
| Share Transactions: | |||||||||||
| Subscriptions | 19,475,988 | 40,742,221 | |||||||||
| Distributions reinvested | 39,051,960 | 78,451,985 | |||||||||
| Redemptions | (77,590,781 | ) | (169,908,230 | ) | |||||||
| Net Decrease from Share Transactions | (19,062,833 | ) | (50,714,024 | ) | |||||||
| Total Increase (Decrease) in Net Assets | 21,002,953 | (153,862,148 | ) | ||||||||
| Net Assets: | |||||||||||
| Beginning of period | 757,561,627 | 911,423,775 | |||||||||
| End of period | $ | 778,564,580 | $ | 757,561,627 | |||||||
| Accumulated Net Investment Loss at End of Period | $ | (1,244,789 | ) | $ | (87,823 | ) | |||||
See accompanying notes to financial statements.
16
Wanger USA 2012 Semiannual Report
Financial Highlights
| (Unaudited) Six Months Ended June 30, | Year Ended December 31, | ||||||||||||||||||||||||||
| Selected data for a share outstanding throughout each period | 2012 | 2011 | 2010 | 2009 | 2008 | 2007 | |||||||||||||||||||||
| Net Asset Value, Beginning of Period | $ | 29.80 | $ | 33.86 | $ | 27.45 | $ | 19.30 | $ | 36.26 | $ | 36.36 | |||||||||||||||
| Income from Investment Operations: | |||||||||||||||||||||||||||
| Net investment loss (a) | (0.05 | ) | (0.13 | ) | (0.10 | ) | (0.06 | ) | (0.07 | ) | (0.05 | )(b) | |||||||||||||||
| Net realized and unrealized gain (loss) on investments and foreign currency and foreign capital gains tax | 3.10 | (0.82 | ) | 6.51 | 8.21 | (13.16 | ) | 1.91 | |||||||||||||||||||
| Total from Investment Operations | 3.05 | (0.95 | ) | 6.41 | 8.15 | (13.23 | ) | 1.86 | |||||||||||||||||||
| Less Distributions to Shareholders: | |||||||||||||||||||||||||||
| From net realized gains | (1.63 | ) | (3.11 | ) | — | — | (3.73 | ) | (1.96 | ) | |||||||||||||||||
| Total Distributions to Shareholders | (1.63 | ) | (3.11 | ) | — | — | (3.73 | ) | (1.96 | ) | |||||||||||||||||
| Net Asset Value, End of Period | $ | 31.22 | $ | 29.80 | $ | 33.86 | $ | 27.45 | $ | 19.30 | $ | 36.26 | |||||||||||||||
| Total Return (c) | 10.37 | %(d)(e) | (3.49 | )%(d) | 23.35 | %(d) | 42.23 | % | (39.68 | )% | 5.39 | % | |||||||||||||||
| Ratios to Average Net Assets/Supplemental Data: | |||||||||||||||||||||||||||
| Net expenses before interest expense | 0.97 | %(f) | 0.93 | %(g) | 0.97 | %(g) | 0.98 | %(g) | 0.96 | %(g) | 0.95 | %(g) | |||||||||||||||
| Interest expense | — | — | 0.00 | %(h) | — | — | — | ||||||||||||||||||||
| Interest expense waiver | — | — | 0.00 | %(h) | — | — | — | ||||||||||||||||||||
| Net expenses | 0.97 | %(f) | 0.93 | %(g) | 0.97 | %(g) | 0.98 | %(g) | 0.96 | %(g) | 0.95 | %(g) | |||||||||||||||
| Net investment loss | (0.29 | )%(f) | (0.40 | )%(g) | (0.35 | )%(g) | (0.29 | )%(g) | (0.26 | )%(g) | (0.15 | )%(g) | |||||||||||||||
| Waiver/Reimbursement | 0.00 | %(e)(h) | 0.01 | % | 0.01 | % | — | — | — | ||||||||||||||||||
| Portfolio turnover rate | 6 | %(e) | 10 | % | 27 | % | 30 | % | 22 | % | 27 | % | |||||||||||||||
| Net assets, end of period (000s) | $ | 778,565 | $ | 757,562 | $ | 911,424 | $ | 1,277,154 | $ | 952,249 | $ | 1,688,040 | |||||||||||||||
(a) Net investment loss per share was based upon the average shares outstanding during the period.
(b) Net investment loss per share reflects special dividends. The effect of these dividends amounted to $0.08 per share.
(c) Total return at net asset value assuming all distributions reinvested.
(d) Had the investment manager and/or its affiliates not waived a portion of expenses, total return would have been reduced.
(e) Not annualized.
(f) Annualized excluding the advisory fee waiver, which was terminated on April 30, 2012 (See Note 4).
(g) The benefits derived from custody fees paid indirectly had an impact of less than 0.01%.
(h) Rounds to less than 0.01%.
See accompanying notes to financial statements.
17
Wanger USA 2012 Semiannual Report
Notes to Financial Statements (Unaudited)
1. Nature of Operations
Wanger USA (the Fund), a series of Wanger Advisors Trust (the Trust), is registered under the Investment Company Act of 1940, as amended (the 1940 Act), as an open-end management investment company organized as a Massachusetts business trust. The investment objective of the Fund is to seek long-term capital appreciation. The Fund is available only for allocation to certain life insurance company separate accounts established for the purpose of funding participating variable annuity contracts and variable life insurance policies and may also be offered directly to certain qualified pension and retirement plans.
2. Significant Accounting Policies
The preparation of financial statements in accordance with accounting principles generally accepted in the United States of America (GAAP) requires management to make certain estimates and assumptions that affect the reported amounts of assets and liabilities, the disclosure of contingent assets and liabilities at the date of the financial statements and the reported amounts of revenue and expenses during the reporting period. Actual results could differ from those estimates.
Security valuation
Securities of the Fund are valued at market value or, if a market quotation for a security is not readily available or is deemed not to be reliable because of events or circumstances that have occurred between the market quotation and the time as of which the security is to be valued, the security is valued at its fair value determined in good faith under consistently applied procedures established by the Board of Trustees. A security traded on a securities exchange or in an over-the-counter market in which transaction prices are reported is valued at the last sales price at the time of valuation. A security traded principally on NASDAQ is valued at the NASDAQ official closing price. Mutual Funds and Exchange Traded Funds are valued at their closing net asset value as reported to NASDAQ. A security for which there is no reported sale on the valuation date is valued at the mean of the latest bid and ask quotations.
Short-term investments maturing in 60 days or less are valued at amortized cost, which approximates market value.
A security for which a market quotation is not readily available and any other assets are valued at their fair value determined in good faith under consistently applied procedures established by the Board of Trustees. The Trust has retained an independent statistical fair value pricing service that employs a systematic methodology to assist in the fair valuation process for securities principally traded in a foreign market in order to adjust for possible changes in value that may occur between the close of the foreign market and the time as of which the securities are to be valued. If a security is valued at a fair value, that value may be different from the last quoted market price for the security.
Repurchase agreements
The Fund may engage in repurchase agreement transactions. The Fund, through its custodian, receives delivery of underlying securities collateralizing each repurchase agreement. The counterparty is required to maintain collateral that is at all times at least equal to the repurchase price including interest. In the event of default or bankruptcy by the other party to the agreement, realization and/or retention of the collateral may be subject to legal proceedings.
Restricted securities
Restricted securities are securities that may only be resold upon registration under federal securities laws or in transactions exempt from registration. In some cases, the issuer of restricted securities has agreed to register such securities for resale at the issuer's expense either upon demand by the Fund or in connection with another registered offering of the securities. Many restricted securities may be resold in the secondary market in transactions exempt from registration. Such restricted securities may be determined to be liquid under criteria established by the Board of Trustees.
Security transactions and investment income
Security transactions are accounted for on the trade date (date the order to buy or sell is executed) and dividend income is recorded on the ex-dividend date, except that certain dividends from foreign securities are recorded as soon as the information is available to the Fund. Interest income is recorded on the accrual basis and includes amortization of discounts on debt obligations when required for federal income tax purposes. Realized gains and losses from security transactions are recorded on an identified cost basis.
Awards, if any, from class action litigation related to securities owned may be recorded as a reduction of cost of those securities. If the applicable securities are no longer owned, the proceeds are recorded as realized gains.
The Fund estimates the tax character of distributions from real estate investment trusts (REITs). Distributions received in excess of income are recorded as a reduction of the cost of the related investments. If the applicable securities are no longer owned, any distributions received in excess of income are recorded as realized gains.
Expenses
General expenses of the Trust are allocated to the Fund and the other series of the Trust based upon relative net assets or other expense allocation methodologies determined by the nature of the expense. Expenses directly attributable to the Fund are charged to the Fund.
Fund share valuation
Fund shares are sold and redeemed on a continuing basis at net asset value. Net asset value per share is determined daily as of the close of trading on the New York Stock Exchange (the Exchange) on each day the Exchange is open for trading by dividing the total value of the Fund's investments and other assets, less liabilities, by the number of Fund shares outstanding.
Securities lending
The Fund may lend securities up to one-third of the value of its total assets to certain approved brokers, dealers and other financial institutions to earn additional income. The Fund retains the benefits of owning the securities, including receipt of dividends or interest generated by the security. The Fund also receives a fee for the loan. The Fund has the ability to recall the loans at any time and could do so in order to vote proxies or to sell the loaned securities. Each loan is collateralized by cash that exceeded the value of the securities on loan. The market value of the loaned securities is determined daily at the close of business of the Fund and any additional required collateral is delivered to each Fund on the next business day. The Fund has elected to invest the cash collateral in the Dreyfus Government Cash Management Fund and the income earned is paid to the Fund, net of any fees remitted to Goldman Sachs Agency Lending, the Fund's lending agent and borrower rebates. The Fund's investment manager, Columbia Wanger Asset Management, LLC (CWAM), does not retain any fees earned by the lending program. Generally, in the event of borrower default, the Fund has the right to use the collateral to offset any losses incurred. In the event the Fund is delayed or prevented from exercising its right to dispose of the collateral, there may be a potential loss to the Fund. Some of these losses may be indemnified by the lending agent. The Fund bears the risk of loss with respect to the investment of collateral. The net lending income earned by the Fund as of June 30, 2012, is included in the Statement of Operations.
Federal income taxes
The Fund has complied with the provisions of the Internal Revenue Code available to regulated investment companies and, in the manner provided therein, distributes substantially all its taxable income, as well as any net realized gain on sales of investments and foreign currency transactions reportable for federal income tax purposes. Accordingly, the Fund paid no federal income taxes and no federal income tax provision was required.
Distributions to shareholders
Distributions to shareholders are recorded on the ex-dividend date.
Indemnification
In the normal course of business, the Trust on behalf of the Fund enters into contracts that contain a variety of representations and warranties and that provide general
18
Wanger USA 2012 Semiannual Report
Notes to Financial Statements, continued (Unaudited)
indemnities. The Fund's maximum exposure under these arrangements is unknown, as this would involve future claims against the Fund. Also under the Trust's organizational documents, the trustees and officers of the Trust are indemnified against certain liabilities that may arise out of their duties to the Trust. However based on experience, the Fund expects the risk of loss due to these warranties and indemnities to be remote.
Recent Accounting Pronouncement
Disclosures about Offsetting Assets and Liabilities
In December 2011, the Financial Accounting Standards Board (FASB) issued ASU No. 2011-11, Disclosures about Offsetting Assets and Liabilities. The objective of the FASB is to enhance current disclosure requirements on offsetting of certain assets and liabilities and to enable financial statement users to compare financial statements prepared under GAAP and International Financial Reporting Standards.
Specifically, ASU No. 2011-11 requires an entity to disclose both gross and net information for derivatives and other financial instruments that are subject to a master netting arrangement or similar agreement. The standard requires disclosure of collateral received in connection with the master netting agreements or similar agreements. The effective date of ASU No. 2011-11 is for interim and annual periods beginning on or after January 1, 2013. At this time, management is evaluating the implications of this guidance and the impact it will have on the financial statement amounts and footnote disclosures, if any.
3. Federal Tax Information
The timing and character of income and capital gain distributions are determined in accordance with income tax regulations, which may differ from GAAP. Reclassifications are made to the Fund's capital accounts for permanent tax differences to reflect income and gains available for distribution (or available capital loss carryforwards) under income tax regulations.
Management is required to determine whether a tax position of the Fund is more likely than not to be sustained upon examination by the applicable taxing authority, including resolution of any related appeals or litigation processes, based on the technical merits of the position. The tax benefit to be recognized by the Fund is measured as the largest amount of benefit that is greater than fifty percent likely of being realized upon ultimate settlement. Management is not aware of any tax positions for which it is reasonably possible that the total amounts of unrecognized tax benefits will significantly change in the next twelve months. However, management's conclusions may be subject to review and adjustment at a later date based on factors including, but not limited to, new tax laws, regulations, and administrative interpretations (including relevant court decisions). The Fund's federal tax returns for the prior three fiscal years remain subject to examination by the Internal Revenue Service.
4. Transactions With Affiliates
CWAM is a wholly owned subsidiary of Columbia Management Investment Advisers, LLC (Columbia Management), which in turn is a wholly owned subsidiary of Ameriprise Financial, Inc. (Ameriprise Financial). CWAM furnishes continuing investment supervision to the Fund and is responsible for the overall management of the Fund's business affairs.
CWAM receives a monthly advisory fee based on the Fund's average daily net assets at the following annual rates:
| Average Daily Net Assets | Annual Fee Rate | ||||||
| Up to $100 million | 0.94 | % | |||||
| $100 million to $250 million | 0.89 | % | |||||
| $250 million to $2 billion | 0.84 | % | |||||
| $2 billion and over | 0.80 | % | |||||
For the six months ended June 30, 2012, the annualized effective investment advisory fee rate, net of fee waivers, in effect during a portion of the period, was 0.86% of the Fund's average daily net assets.
Prior to May 1, 2012, CWAM had contractually agreed to reimburse the Fund to the extent that investment advisory fees exceeded an annual percentage of 0.85% of average daily net assets on an annualized basis. The reimbursement to the Fund for the six months ended June 30, 2012 was $30,627.
CWAM provides administrative services and receives an administration fee from the Fund at the following annual rates:
| Wanger Advisors Trust Aggregate Average Daily Net Assets of the Trust | Annual Fee Rate | ||||||
| Up $4 billion to | 0.05 | % | |||||
| $4 billion to $6 billion | 0.04 | % | |||||
| $6 billion to $8 billion | 0.03 | % | |||||
| $8 billion and over | 0.02 | % | |||||
For the six months ended June 30, 2012, the annualized effective administration fee rate was 0.05% of the Fund's average daily net assets. Columbia Management provides certain sub-administrative services to the Fund.
Columbia Management Investment Distributors, Inc. (CMID), a wholly owned subsidiary of Ameriprise Financial, serves as the Fund's distributor and principal underwriter.
Columbia Management Investment Services Corp. (CMIS), a wholly owned subsidiary of Ameriprise Financial, is the transfer agent to the Fund. For its services, the Fund pays CMIS a monthly fee at the annual rate of $21.00 per open account. CMIS also receives reimbursement from the Fund for certain out-of-pocket expenses.
Certain officers and trustees of the Trust are also officers of CWAM. The Trust makes no direct payments to its officers and trustees who are affiliated with CWAM.
The Board of Trustees has appointed a Chief Compliance Officer of the Trust in accordance with federal securities regulations. The Fund, along with other affiliated funds, pays its pro-rata share of the expenses associated with the Office of the Chief Compliance Officer. These expenses are disclosed separately as "Chief compliance officer expenses" in the Statement of Operations.
The Trust offers a deferred compensation plan for its independent trustees. Under that plan, a trustee may elect to defer all or a portion of his or her compensation. Amounts deferred are retained by the Trust and may represent an unfunded obligation of the Trust. The value of amounts deferred is determined by reference to the change in value of Class Z shares of one or more series of Columbia Acorn Trust or a money market fund as specified by the trustee. Benefits under the deferred compensation plan are payable in accordance with the plan.
5. Borrowing Arrangements
The Trust participates in a $150 million credit facility with JPMorgan Chase Bank, N.A., along with another Trust managed by CWAM, which was entered into to facilitate portfolio liquidity. Under the facility, as in effect for the six months ended June 30, 2012, interest is charged to each participating fund based on its borrowings at a rate per annum equal to the higher of Federal Funds Rate or Overnight LIBOR plus 1.25%. In addition, a commitment fee of 0.10% per annum of the unutilized line of credit is accrued and apportioned among the participating funds based on their relative net assets. The commitment fee is disclosed separately as "Commitment fee for line of credit" in the Statement of Operations. The Trust expects to renew this line of credit for one year durations annually in July at then current market rates and terms.
The Fund had no borrowings during the six months ended June 30, 2012.
19
Wanger USA 2012 Semiannual Report
Notes to Financial Statements, continued (Unaudited)
6. Fund Share Transactions
Proceeds and payments on Fund shares as shown in the Statement of Changes in Net Assets are in respect of the following numbers of shares:
| (Unaudited) Six months ended June 30, 2012 | Year ended December 31, 2011 | ||||||||||
| Shares sold | 584,065 | 1,244,190 | |||||||||
| Shares issued in reinvestment of dividend distributions | 1,279,553 | 2,434,129 | |||||||||
| Less shares redeemed | (2,348,973 | ) | (5,174,081 | ) | |||||||
| Net decrease in shares outstanding | (485,355 | ) | (1,495,762 | ) | |||||||
7. Investment Transactions
The aggregate cost of purchases and proceeds from sales other than short-term obligations for the six months ended June 30, 2012, were $52,236,960 and $109,900,901, respectively.
8. Shareholder Concentration
At June 30, 2012, two unaffiliated shareholder accounts owned 31.3% of the outstanding shares of the Fund. The Fund has no knowledge about whether any portion of those shares was owned beneficially by such accounts. Affiliated shareholder accounts owned 55.9% of the outstanding shares of the Fund. Subscription and redemption activity by concentrated accounts may have a significant effect on the operations of the Fund.
9. Subsequent Events
Management has evaluated the events and transactions that have occurred through the date the financial statements were issued and noted no items requiring adjustment of the financial statements or additional disclosure.
10. Information Regarding Pending and Settled Legal Proceedings
Ameriprise Financial and certain of its affiliates have historically been involved in a number of legal, arbitration and regulatory proceedings, including routine litigation, class actions, and governmental actions, concerning matters arising in connection with the conduct of their business activities. Ameriprise Financial believes that the Funds are not currently the subject of, and that neither Ameriprise Financial nor any of its affiliates are the subject of, any pending legal, arbitration or regulatory proceedings that are likely to have a material adverse effect on the Funds or the ability of Ameriprise Financial or its affiliates to perform under their contracts with the Funds. Ameriprise Financial is required to make 10-Q, 10-K and, as necessary, 8-K filings with the Securities and Exchange Commission on legal and regulatory matters that relate to Ameriprise Financial and its affiliates. Copies of these filings may be obtained by accessing the SEC website at www.sec.gov.
There can be no assurance that these matters, or the adverse publicity associated with them, will not result in increased fund redemptions, reduced sale of fund shares or other adverse consequences to the Funds. Further, although we believe proceedings are not likely to have a material adverse effect on the Funds or the ability of Ameriprise Financial or its affiliates to perform under their contracts with the Funds, these proceedings are subject to uncertainties and, as such, we are unable to estimate the possible loss or range of loss that may result. An adverse outcome in one or more of these proceedings could result in adverse judgments, settlements, fines, penalties or other relief that could have a material adverse effect on the consolidated financial condition or results of operations of Ameriprise Financial.
20
Wanger USA 2012 Semiannual Report
Board Approval of the Advisory Agreement
Wanger Advisors Trust (the "Trust") has an investment advisory agreement (the "Advisory Agreement") with Columbia Wanger Asset Management, LLC ("Columbia WAM") under which Columbia WAM manages the Wanger Funds (each, a "Fund", and together, the "Funds"). More than 75% of the trustees of the Trust (the "Trustees") are persons who have no direct or indirect interest in the Advisory Agreement and are not "interested persons" (as defined in the Investment Company Act of 1940, as amended (the "1940 Act")) of the Trust (the "Independent Trustees"). The Trustees oversee the management of each Fund and, as required by law, determine at least annually whether to continue the Advisory Agreement for each Fund.
The Contract Committee (the "Committee") of the Board of Trustees (the "Board"), which is comprised solely of Independent Trustees, makes recommendations to the Board regarding any proposed continuation of the Advisory Agreement. After the Committee has made its recommendations, the full Board determines whether to approve continuation of the Advisory Agreement. The Board also considers matters bearing on the Advisory Agreement at its various meetings throughout the year, meets at least quarterly with Columbia WAM's portfolio managers and receives monthly reports from Columbia WAM on the performance of the Funds.
In connection with their most recent consideration of the Advisory Agreement for each Fund, the Committee and all Trustees received and reviewed a substantial amount of information provided by Columbia WAM, Columbia Management Investment Advisers, LLC ("Columbia Management") and Ameriprise Financial, Inc. ("Ameriprise"), in response to written requests from the Independent Trustees and their independent legal counsel. Throughout the process, the Trustees had numerous opportunities to ask questions of and request additional materials from Columbia WAM, Columbia Management and Ameriprise.
During each meeting at which the Committee or the Independent Trustees considered the Advisory Agreement, they met in executive session with their independent legal counsel. The Committee also met with representatives of Columbia WAM, Columbia Management and Ameriprise on several occasions. In all, the Committee convened formally on six separate occasions to consider the continuation of the Advisory Agreement. The Board and/or some or all of the Independent Trustees met on other occasions to receive the Committee's status reports, receive presentations from Columbia WAM, Columbia Management and Ameriprise representatives, and to discuss outstanding issues. In addition, the Investment Performance Analysis Committee of the Board, also comprised exclusively of Independent Trustees, reviewed the performance of the Funds and presented its findings to the Board and the Committee throughout the year. The Compliance Committee of the Board also provided information to the Committee with respect to relevant matters.
The Trustees reviewed the Advisory Agreement, as well as certain information obtained through Columbia WAM's, Columbia Management's and Ameriprise's responses to independent legal counsel's questionnaires. In addition, the Trustees reviewed the Management Fee Evaluation dated June 2012 (the "Fee Evaluation") prepared by the Trust's chief compliance officer, senior vice president and general counsel at the request of the Board.
The materials reviewed by the Committee and the Trustees included, among other items, (i) information on the investment performance of each Fund and of independently selected peer groups of funds and of the Funds' performance benchmarks over various time periods, (ii) information on each Fund's advisory fees and other expenses, including information comparing the Fund's fees and expenses to those of peer groups of funds and information about any applicable expense limitations and fee breakpoints, (iii) data on sales and redemptions of Fund shares, and (iv) information on the profitability to Columbia WAM and Ameriprise, as well as potential "fall-out" or ancillary benefits that Columbia WAM and its affiliates may receive as a result of their relationships with the Funds. The Trustees also considered other information such as (i) Columbia WAM's financial condition, (ii) each Fund's investment objective and strategy, (iii) the size, education and experience of Columbia WAM's investment staff and its use of technology, external research and trading cost measurement tools, (iv) the portfolio manager compensation framework, (v) the allocation of the Funds' brokerage, and the use of "soft" commission dollars to pay for research products and services, (vi) Columbia WAM's risk management program, and (vii) the resources devoted to, and the record of compliance with, the Funds' investment policies and restrictions, policies on personal securities transactions and other compliance policies.
At a meeting held on June 6, 2012, upon recommendations of the Committee, the Board of Trustees unanimously approved the continuation of the Advisory Agreement.
In considering the continuation of the Advisory Agreement, the Trustees reviewed and analyzed various factors that they determined were relevant, none of which by itself was considered dispositive. The material factors and conclusions that formed the basis for the Trustees' determination to approve the continuation of the Advisory Agreement are discussed below.
Nature, quality and extent of services. The Trustees reviewed the nature, quality and extent of the services provided by Columbia WAM and its affiliates to Wanger USA under the Advisory Agreement, taking into account the investment objective and strategy of the Fund and knowledge gained from meetings with management, which were held on at least a quarterly basis. In addition, the Trustees reviewed the available resources and key personnel of Columbia WAM and its affiliates, especially those providing investment management services to the Fund. The Trustees also considered other services provided to the Fund by Columbia WAM and its affiliates, including: managing the execution of portfolio transactions and selecting broker-dealers for those transactions; monitoring adherence to the Fund's investment restrictions; producing shareholder reports; providing support services for the Board and committees of the Board; managing the Fund's securities lending program; communicating with shareholders; serving as the Fund's administrator; and overseeing the activities of the Fund's other service providers, including monitoring for compliance with various policies and procedures as well as applicable securities laws and regulations.
The Trustees concluded that the nature, quality and extent of the services provided by Columbia WAM and its affiliates to the Fund under the Advisory Agreement were appropriate for the Fund and that the Fund was likely to benefit from the continued provision of those services by Columbia WAM. They also concluded that Columbia WAM currently had sufficient personnel, with appropriate education and experience, to serve the Fund effectively, and that the firm had demonstrated its continuing ability to attract and retain well-qualified personnel. In addition, they took note of the quality of Columbia WAM's compliance record.
Performance of the Fund. The Trustees received and considered detailed performance information at various meetings of the Board, the Committee and the Investment Performance Analysis Committee of the Board throughout the year. They reviewed information comparing each Fund's performance with that of its benchmark(s) and with the performance of comparable funds and peer groups as identified by Lipper Inc. ("Lipper") and Morningstar, Inc. ("Morningstar"). The Trustees evaluated the performance of the Fund over various time periods, including over the one-, three- and five-year periods ending December 31, 2011. The Trustees also considered peer performance rankings for similar timeframes, although they focused more on the five-year period.
The Trustees noted that Wanger USA had underperformed its peer group median over the five-year period but it outperformed its benchmark for the same period. The Trustees also considered that while the Fund underperformed its Morningstar and Lipper peer groups for the one- and three- year periods, it had also outperformed its benchmark for the same time periods. In addition, the Trustees considered that Morningstar believed that Wanger USA exposed shareholders to more risk than peer funds. The Trustees determined that performance with respect to Wanger USA needed to be improved, although performance of the Fund had been ahead of its benchmark at the time of the June 6th Board meeting. The trustees concluded, however, that Columbia WAM had taken and continued to take a number of corrective steps to improve performance of the Fund, that Columbia WAM had reported that these steps were being successfully implemented, and that the Investment Performance Analysis Committee of the Board was monitoring the Fund's performance closely.
The Trustees concluded that, although past performance is not necessarily indicative of future results, the steps taken by Columbia WAM to improve Fund
21
Wanger USA 2012 Semiannual Report
Board Approval of the Advisory Agreement
performance were an important factor in their evaluation of the quality of services provided by Columbia WAM under the Advisory Agreement for Wanger USA.
Costs of Services and Profits Realized by Columbia WAM. At various Committee and Board meetings, the Trustees examined detailed information on the fees and expenses of the Fund in comparison to information for comparable funds provided by Lipper and Morningstar. The Trustees reviewed data from Lipper and Morningstar and noted that Wanger USA had lower total net operating expenses than its Lipper peer group median but higher total net operating expenses than its Morningstar peer group median. As noted in the Fee Evaluation, the actual advisory fees paid by Wanger USA were higher than the median advisory fee of the Fund's Morningstar and Lipper peer groups. The Trustees reviewed the observations in the Fee Evaluation and noted that the Fund was assessed by Morningstar and Lipper in relation to peers selected only from the variable annuity universe.
The Trustees also reviewed the advisory fee rates charged by Columbia WAM for managing other investment companies (including the Columbia Acorn Funds), sub-advised funds and other institutional separate accounts, as detailed in materials provided to the Committee by Columbia WAM and in the Fee Evaluation. The Trustees noted that the Fund's advisory fees were generally comparable to Columbia Acorn USA's advisory fees at the same asset level. The Trustees also examined Columbia WAM's institutional separate account fees for various investment strategies; in some cases those fees were higher than the advisory fees charged to the Fund, and in a few instances the fees were lower. The Trustees noted that Columbia WAM performs significant additional services for the Fund that it does not provide to sub-advised funds or non-mutual fund clients, including administrative services, oversight of the Fund's other service providers, Trustee support, regulatory compliance and numerous other services, and that, in servicing the Fund, Columbia WAM assumes many legal and business risks that it does not assume in servicing many of its non-fund clients.
The Trustees concluded that the rate of advisory fees payable to Columbia WAM was reasonable in relation to the nature and quality of the services to be provided. The Trustees also concluded that the Fund's overall expense ratio was reasonable, considering the quality of the services provided by Columbia WAM and its affiliates and the investment performance of the Fund, taking into account Columbia WAM's continuing steps to improve performance of the Fund.
The Trustees reviewed the analysis of the historic profitability of Columbia WAM in serving as the Fund's investment adviser and of Columbia WAM and its affiliates in their relationships with each Fund. The Committee and Trustees met with representatives from Ameriprise to discuss its methodologies for calculating profitability and allocating costs. They considered that Ameriprise calculated profitability and allocated costs on a contract-by-contract and fund-by-fund basis. The Trustees also considered the methodology used by Columbia WAM and Ameriprise in determining compensation payable to portfolio managers and the competitive market for investment management talent. The Trustees were also provided with profitability information from Lipper, which compared Columbia WAM's profitability to other similar investment advisers in the mutual fund industry. The Trustees concluded that Columbia WAM's and its affiliates' profits were within a reasonable range of those of competitors with similar business models. The Trustees discussed, however, that profitability comparisons among fund managers may not always be meaningful due to the lack of consistency in data, small number of publicly-owned managers, and the fact that profitability of any investment manager is affected by numerous factors, including its particular organizational structure, the types of funds and other accounts managed, other lines of business, expense allocation methodology, capital structure and cost of capital.
Economies of Scale. At various Committee and Board meetings and other informal meetings, the Trustees considered information about the extent to which Columbia WAM realizes economies of scale in connection with an increase in Fund assets. The Trustees also discussed the potential for Fund sales growth. The Trustees noted that the advisory fee schedule for each Fund includes breakpoints in the rate of fees at various asset levels. The Trustees concluded that the fee structure of the Fund was reflective of a sharing between Columbia WAM and the Fund of economies of scale.
Other Benefits to Columbia WAM. The Trustees also reviewed benefits that accrue to Columbia WAM and its affiliates from their relationships with the Fund, based upon information provided to them by Ameriprise and as outlined in the Fee Evaluation. They noted that the Fund's transfer agency services are performed by Columbia Management Investment Services Corp., an affiliate of Ameriprise, which receives compensation from the Funds for its services provided. They considered that an affiliate of Ameriprise, Columbia Management Investment Distributors, Inc. ("CMID"), serves as the Fund's distributor under a distribution agreement and receives no fees for its services. In addition, Columbia Management provides sub-administration services to the Fund. The Committee received information regarding the profitability of each Fund agreement with Columbia WAM affiliates. The Committee and the Board also reviewed information about and discussed the capabilities of each affiliated entity in performing its duties.
The Trustees considered other ways that the Fund and Columbia WAM may potentially benefit from their relationship with each other. For example, the Trustees considered Columbia WAM's use of commissions paid by the Fund on its portfolio brokerage transactions to obtain research products and services benefiting the Funds and/or other clients of Columbia WAM. The Committee reviewed Columbia WAM's annual "soft dollar" report and met with representatives from Columbia WAM to review Columbia WAM's soft dollar spending. The Committee also considered that the Compliance Committee of the Board regularly reviewed third-party prepared reports that evaluated the quality of Columbia WAM's execution of the Fund's portfolio transactions. The Trustees noted that these reports showed that Columbia WAM's execution capabilities were generally better than industry peers. The Trustees determined that Columbia WAM's use of the Fund's "soft" commission dollars to obtain research products and services was consistent with current regulatory requirements and guidance. They also concluded that Columbia WAM benefits from the receipt of proprietary research products and services acquired through commissions paid on portfolio transactions of the Fund, and that the Fund benefits from Columbia WAM's receipt of those products and services as well as research products and services acquired through commissions paid by other clients of Columbia WAM.
After full consideration of the above factors, as well as other factors that were instructive in evaluating the Advisory Agreement, the Trustees, including the Independent Trustees, concluded that the continuation of the Advisory Agreement was in the best interest of the Fund. On June 6, 2012, the Trustees approved continuation of the Advisory Agreement through July 31, 2013.
22
Wanger USA 2012 Semiannual Report
This page intentionally left blank.
23
Wanger USA 2012 Semiannual Report

Columbia Wanger Funds
Trustees
Laura M. Born
Chair of the Board
Steven N. Kaplan
Vice Chair of the Board
Michelle L. Collins
Maureen M. Culhane
Margaret M. Eisen
John C. Heaton
Charles P. McQuaid
David J. Rudis
David B. Small
Ralph Wanger (Trustee Emeritus)
Officers
Charles P. McQuaid
President
Ben Andrews
Vice President
Robert A. Chalupnik
Vice President
Michael G. Clarke
Assistant Treasurer
Joseph F. DiMaria
Assistant Treasurer
P. Zachary Egan
Vice President
Fritz Kaegi
Vice President
John M. Kunka
Assistant Treasurer
Stephen Kusmierczak
Vice President
Joseph C. LaPalm
Vice President
Bruce H. Lauer
Vice President, Secretary and Treasurer
Louis J. Mendes III
Vice President
Robert A. Mohn
Vice President
Christopher J. Olson
Vice President
Christopher O. Petersen
Assistant Secretary
Scott R. Plummer
Assistant Secretary
Linda K. Roth-Wiszowaty
Assistant Secretary
Robert P. Scales
Chief Compliance Officer, Chief Legal Officer,
Senior Vice President and
General Counsel
Andreas Waldburg-Wolfegg
Vice President
Investment Manager
Columbia Wanger Asset Management,LLC
227 West Monroe Street, Suite 3000
Chicago, Illinois 60606
1-888-4-WANGER
(1-888-492-6437)
Transfer Agent,
Dividend Disbursing Agent
Columbia Management Investment Services Corp.
P.O.Box 8081
Boston, Massachusetts
02266-8081
Distributor
Columbia Management Investment Distributors, Inc.
225 Franklin Street
Boston, Massachusetts
02110
Legal Counsel to the Funds
Perkins Coie LLP
Washington, DC
Legal Counsel to the Independent Trustees
Drinker Biddle & Reath LLP
Philadelphia, Pennsylvania
Independent Registered Public Accounting Firm
PricewaterhouseCoopers LLP
Chicago, Illinois
This document contains Global Industry Classification Standard data. The Global Industry Classification Standard ("GICS") was developed by and is the exclusive property and a service mark of MSCI Inc. ("MSCI") and Standard & Poor's Financial Services LLC ("S&P") and is licensed for use by Columbia Wanger Asset Management, LLC ("CWAM"). Neither MSCI, S&P, nor any other party involved in making or compiling the GICS or any GICS classifications makes any express or implied warranties or representations with respect to such standard or classification (or the results to be obtained by the use thereof), and all such parties hereby expressly disclaim all warranties of originality, accuracy, completeness, merchantability and fitness for a particular purpose with respect to any of such standard or classification. Without limiting any of the foregoing, in no event shall MSCI, S&P, any of their affiliates or any third party involved in making or compiling the GICS or any GICS classifications have any liability for any direct, indirect, special, punitive, consequential or any other damages (including lost profits) even if notified of the possibility of such damages.
This report, including the schedules of investments and financial statements, is submitted for the general information of the shareholders of the Wanger Advisors Trust.
A description of the Fund's proxy voting policies and procedures and a copy of the Fund's voting record for the most recent 12-month period ended June 30 are available (i) on the Securities and Exchange Commission's website at www.sec.gov, and (ii) without charge, upon request, by calling 888-492-6437.
The Fund files a complete schedule of portfolio holdings with the SEC for the first and third quarters of each fiscal year on Form N-Q. The Fund's Form N-Q is available on the SEC's website at www.sec.gov and may be reviewed and copied at the SEC's Public Reference Room in Washington, D.C. Information on the operation of the Pubic Reference Room may be obtained by calling 800-SEC-0330. The Fund's complete portfolio holdings are disclosed at www.columbiamanagement.com approximately 30 to 40 days after each month end.
24
Columbia Wanger Funds
© 2012 Columbia Management Investments Advisers, LLC. All rights reserved.
C-1470 C (8/12) 142486
Item 2. Code of Ethics.
Not applicable for semiannual reports.
Item 3. Audit Committee Financial Expert.
Not applicable for semiannual reports.
Item 4. Principal Accountant Fees and Services.
Not applicable for semiannual reports.
Item 5. Audit Committee of Listed Registrants.
Not applicable.
Item 6. Investments
(a) The registrant’s “Schedule I — Investments in securities of unaffiliated issuers” (as set forth in 17 CFR 210.12-12) is included in Item 1 of this Form N-CSR.
(b) Not applicable.
Item 7. Disclosure of Proxy Voting Policies and Procedures for Closed-End Management Investment Companies.
Not applicable.
Item 8. Portfolio Managers of Closed-End Management Investment Companies.
Not applicable.
Item 9. Purchases of Equity Securities by Closed-End Management Investment Company and Affiliated Purchasers.
Not applicable.
Item 10. Submission of Matters to a Vote of Security Holders.
There were no material changes to the procedures by which shareholders may recommend nominees to the registrant’s board of directors.
Item 11. Controls and Procedures.
(a) The registrant’s principal executive officer and principal financial officers, based on their evaluation of the registrant’s disclosure controls and procedures as of a date within 90 days of the filing of this report, have concluded that such controls and procedures are adequately designed to ensure that material information required to be disclosed by the registrant in Form N-CSR is accumulated and communicated to the registrant’s management, including the principal executive officer and principal financial officer, or persons performing similar functions, as appropriate to allow timely decisions regarding required disclosure.
(b) There was no change in the registrant’s internal control over financial reporting that occurred during the registrant’s second fiscal quarter of the period covered by this report that has materially affected, or is reasonably likely to materially affect, the registrant’s internal control over financial reporting.
Item 12. Exhibits.
(a)(1) Code of ethics required to be disclosed under Item 2 of Form N-CSR: Not applicable for semiannual reports.
(a)(2) Certifications pursuant to Rule 30a-2(a) under the Investment Company Act of 1940 (17 CFR 270.30a-2(a)) attached hereto as Exhibit 99.CERT.
(a)(3) Not applicable.
(b) Certification pursuant to Rule 30a-2(b) under the Investment Company Act of 1940 (17 CFR 270.30a-2(b)) attached hereto as Exhibit 99.906CERT.
SIGNATURES
Pursuant to the requirements of the Securities Exchange Act of 1934 and the Investment Company Act of 1940, the registrant has duly caused this report to be signed on its behalf by the undersigned, thereunto duly authorized.
(registrant) |
| Wanger Advisors Trust |
| ||
|
|
| |||
|
|
| |||
By (Signature and Title) |
| /s/ Charles P. McQuaid |
| ||
| Charles P. McQuaid, President |
| |||
|
|
| |||
|
|
| |||
Date |
| August 21, 2012 |
| ||
Pursuant to the requirements of the Securities Exchange Act of 1934 and the Investment Company Act of 1940, this report has been signed below by the following persons on behalf of the registrant and in the capacities and on the dates indicated.
By (Signature and Title) |
| /s/ Charles P. McQuaid |
| |
| Charles P. McQuaid, President |
| ||
|
|
| ||
|
|
| ||
Date |
| August 21, 2012 |
| |
|
|
| ||
|
|
| ||
By (Signature and Title) |
| /s/ Bruce H. Lauer |
| |
| Bruce H. Lauer, Treasurer |
| ||
|
|
| ||
|
|
| ||
Date |
| August 21, 2012 |
| |