UNITED STATES
SECURITIES AND EXCHANGE COMMISSION
Washington, D.C. 20549
FORM N-CSR
CERTIFIED SHAREHOLDER REPORT OF REGISTERED
MANAGEMENT INVESTMENT COMPANIES
Investment Company Act file number | 811-08748 | |||||||
| ||||||||
Wanger Advisors Trust | ||||||||
(Exact name of registrant as specified in charter) | ||||||||
| ||||||||
One Financial Center, Boston, Massachusetts |
| 02111 | ||||||
(Address of principal executive offices) |
| (Zip code) | ||||||
| ||||||||
James R. Bordewick, Jr., Esq. Columbia Management Advisors, LLC One Financial Center Boston, MA 02111 | ||||||||
(Name and address of agent for service) | ||||||||
| ||||||||
Registrant’s telephone number, including area code: | 1-617-426-3750 |
| ||||||
| ||||||||
Date of fiscal year end: | December 31 |
| ||||||
| ||||||||
Date of reporting period: | June 30, 2009 |
| ||||||
Form N-CSR is to be used by management investment companies to file reports with the Commission not later than 10 days after the transmission to stockholders of any report that is required to be transmitted to stockholders under Rule 30e-1 under the Investment Company Act of 1940 (17 CFR 270.30e-1). The Commission may use the information provided on Form N-CSR in its regulatory, disclosure review, inspection, and policymaking roles.
A registrant is required to disclose the information specified by Form N-CSR, and the Commission will make this information public. A registrant is not required to respond to the collection of information contained in Form N-CSR unless the Form displays a currently valid Office of Management and Budget (“OMB”) control number. Please direct comments concerning the accuracy of the information collection burden estimate and any suggestions for reducing the burden to Secretary, Securities and Exchange Commission, 450 Fifth Street, NW, Washington, DC 20549-0609. The OMB has reviewed this collection of information under the clearance requirements of 44 U.S.C. § 3507.
Item 1. Reports to Stockholders.
Wanger International Select
2009 Semiannual Report

| NOT FDIC INSURED | May Lose Value | ||||||
| NOT BANK ISSUED | No Bank Guarantee | ||||||
Wanger International Select 2009 Semiannual Report
Robert E. Nason Remembered

Robert E. Nason
On June 27, 2009, Wanger Advisors Trust Board of Trustees chairman Robert E. Nason passed away. Bob was a man of great personal integrity who maintained the independence of the Board and worked to promote the interests of shareholders. He served as chairman of the Wanger Advisors Trust Board from September 2006 until his death.
Bob brought impressive credentials to the Board. He served as CEO of the accounting firm Grant Thornton where he worked for 40 years.
Bob's tenure as chairman occurred during a period of change in the investment environment. Throughout, he served our shareholders well. As regulators pushed mutual fund boards toward more independence from fund advisors, Bob successfully maintained the Wanger Advisors Trust Board's history of independence. The Trust's advisor, Columbia Wanger Asset Management (CWAM), was also faced with ownership changes and the retirement of founder Ralph Wanger. Following these events, Bob and the Board saw to it that CWAM stayed the course, maintaining its time-tested investment process, developing and keeping talented investment professionals, and sustaining its autonomous and creative environment. Under Bob's leadership, the Board implemented fee breakpoints, allowing shareholders to benefit from growth and economies of scale. After intensive analysis, Bob and the Board also successfully initiated securities lending.
Bob is survived by his wife Carol, son Steven (Abbie Baynes), daughter Jill and grandchildren Sara and Ben. We are fortunate to have known Bob and we will miss him. He was a man of great vision and we will strive to build on the momentum that he created and to maintain the legacies of the Wanger Advisors Trust.

Allan Muchin
Vice Chairman of the Board of Trustees
Wanger Advisors Trust

Charles McQuaid
President and Chief Investment Officer
Columbia Wanger Asset Management, L.P.

Wanger International Select
2009 Semiannual Report
Table of Contents
| 2 | Understanding Your Expenses | ||||||
| 3 | Agriculture's Amazing Progress | ||||||
| 6 | Performance Review | ||||||
| 8 | Statement of Investments | ||||||
| 12 | Statement of Assets and Liabilities | ||||||
| 12 | Statement of Operations | ||||||
| 13 | Statement of Changes in Net Assets | ||||||
| 14 | Financial Highlights | ||||||
| 15 | Notes to Financial Statements | ||||||
| 18 | Management Fee Evaluation of the Senior Officer | ||||||
| 22 | Wanger Advisors Trust Board Approval of the Advisory Agreement 2009 | ||||||
Columbia Wanger Asset Management, L.P. ("CWAM") is one of the leading global small- and mid-cap equity managers in the United States with nearly 40 years of small- and mid-cap investment experience. As of June 30, 2009, CWAM manages $21.3 billion in assets and is the investment advisor to Wanger USA, Wanger International, Wanger Select, Wanger International Select (together, the "Columbia Wanger Funds") and the Columbia Acorn Family of Funds. Columbia Management Group, LLC ("Columbia Management") is the investment management division of Bank of America Corporation. Columbia Management entities furnish investment management services and products for institutional and individual investors. The Columbia Wanger Funds and the Columbia Acorn Family of Funds (together with other funds ad vised by Columbia Management affiliates, the "Columbia Funds") are distributed by Columbia Management Distributors, Inc., member of FINRA, SIPC, part of Columbia Management and an affiliate of Bank of America Corporation. CWAM is a registered investment advisor and an indirect, wholly owned subsidiary of Bank of America Corporation. CWAM is part of Columbia Management.
Please consider the investment objectives, risks, charges and expenses for the Fund carefully before investing. Contact 1-888-4-WANGER for a prospectus, which contains this and other important information about the Fund. You should read it carefully before you invest.
An important note: Columbia Wanger Funds are sold only to certain life insurance companies in connection with certain variable annuity contracts, variable life insurance policies and eligible qualified retirement plans.
The views expressed in "Agriculture's Amazing Progress" and in the Performance Review reflect the current views of the respective authors. These views are not guarantees of future performance and involve certain risks, uncertainties and assumptions that are difficult to predict so actual outcomes and results may differ significantly from the views expressed. These views are subject to change at any time based upon economic, market or other conditions and the respective authors disclaim any responsibility to update such views. These views may not be relied on as investment advice and, because investment decisions for a Columbia Fund are based on numerous factors, may not be relied on as an indication of trading intent on behalf of any particular Columbia Fund. References to specific company securities should not be construed as a recommendation or investment advice.
1
Wanger International Select 2009 Semiannual Report
Understanding Your Expenses
As a Fund shareholder, you incur two types of costs. There are transaction costs, which generally include sales charges on purchases and may include redemption or exchange fees. There are also ongoing costs, which generally include investment advisory fees and other Fund expenses. The information on this page is intended to help you understand your ongoing costs of investing in the Fund and to compare these costs with the ongoing costs of investing in other mutual funds.
Analyzing your Fund's expenses
To illustrate these ongoing costs, we have provided an example and calculated the expenses paid by investors in the Fund during the period. The information in the following table is based on an initial, hypothetical investment of $1,000, which is invested at the beginning of the period and held for the entire period. Expense information is calculated two ways and each method provides you with different information. The amount listed in the "Actual" column is calculated using actual operating expenses and total return for the Fund. The amount listed in the "Hypothetical" column assumes that the return each year is 5% before expenses and then applies the Fund's actual expense ratio for the period to the hypothetical return. You should not use the hypothetical account values and expenses to estimate either your actual account balance at the end of the period or the expenses you paid during the period. See the "Compare with other fu nds" information for details on using the hypothetical data.
Estimating your actual expenses
To estimate the expenses that you actually paid over the period, first you will need your account balance at the end of the period.
1. Divide your ending account balance by $1,000. For example, if an account balance was $8,600 at the end of the period, the result would be 8.6.
2. In the section of the table below titled "Expenses paid during the period," you will find a dollar amount in the column labeled "Actual." Multiply this amount by the result from step 1. Your answer is an estimate of the expenses you paid on your account during the period.
January 1, 2009 – June 30, 2009
| Account value at the beginning of the period ($) | Account value at the end of the period ($) | Expenses paid during the period ($) | Fund's annualized expense ratio (%)* | ||||||||||||||||||||||||||||
| Actual | Hypothetical | Actual | Hypothetical | Actual | Hypothetical | Actual | |||||||||||||||||||||||||
| Wanger International Select | 1,000.00 | 1,000.00 | 1,104.98 | 1,017.60 | 7.57 | 7.25 | 1.45 | ||||||||||||||||||||||||
*For the six months ended June 30, 2009.
Expenses paid during the period are equal to the Fund's annualized expense ratio, multiplied by the average account value over the period, then multiplied by the number of days in the Fund's most recent fiscal half-year and divided by 365.
Had the investment advisor and/or any of its affiliates not waived fees or reimbursed a portion of expenses, account value at the end of the period would have been reduced.
It is important to note that the expense amounts shown in the table are meant to highlight only ongoing costs of investing in the Fund. Expenses paid during the period do not include any insurance charges imposed by your insurance company's separate account. The hypothetical example provided is useful in comparing ongoing costs only and will not help you determine the relative total costs of owning different funds whose shareholders may incur transaction costs.
Compare with other funds
Since all mutual funds are required to include the same hypothetical calculations about expenses in shareholder reports, you can use this information to compare the ongoing cost of investing in the Fund with other funds. To do so, compare the 5% hypothetical example with the 5% hypothetical examples of other funds. As you compare hypothetical examples of other funds, it is important to note that hypothetical examples are meant to highlight the ongoing cost of investing in a fund and do not reflect any transaction costs, such as sales charges, redemption fees or exchange fees that may be incurred by shareholders of other funds. Expenses paid during the period do not include any insurance charges imposed by your insurance company's separate accounts.
2
Wanger International Select 2009 Semiannual Report

Agriculture's Amazing Progress
Following a conversation with two of our analysts regarding the prospects for several fertilizer companies, I decided to learn more about the history and current state of agriculture. According to Marcel Mazoyer and Laurence Roudart's, A History of World Agriculture,1 farming began about 10,000 years ago. One would think that mankind is far down the learning curve in agriculture, and that productivity gains are ending. Surprisingly, quite the opposite is true. Most of the improvements in agriculture have occurred in the last 80 years.
Mazoyer and Roudart's history explains six dominant agricultural processes. The first two of these were employed during the first 8,000 years of agricultural history, obviously a time of very slow progress. Agriculture began with slash and burn techniques, whereby forest segments were successively burned and farmed for a few years until nutrients were depleted. Then, beginning in about 2500 B.C., farmers began using animal drawn scratch-plows and annually rotating land from planted to fallow in an attempt to maintain soil fertility. Other than in exceptionally fertile areas such as the lands replenished by the Nile River, these techniques barely enabled one farmer to feed one family.
Medieval farmers utilized better tools and techniques. They kept more animals and, with the help of wheeled carts and plows, used more animal-based fertilizers. Beginning in the sixteenth century, farmers began planting legumes to enhance nitrogen in the soil, further improving fertility by organic means and eliminating the need for fallowing. Productivity per farmer doubled with each of these developments, enabling the best farmers by the eighteenth century to feed an average of 20 people.
Farms became more mechanized after 1800, using metal plows, sowers, reapers and threshing machines. Transportation also improved allowing better fertilizers, that contained minerals like phosphate and potassium, to reach farmers. These minerals along with nitrogen helped to sustain crop yields. While mechanization doubled the acreage a farmer could cultivate, United States Department of Agriculture (USDA) data indicates that yields per acre of corn and wheat in the United States were flat from 1866, the date of data inception, well into the 1930s.
In the first half of the twentieth century, North American farmers started using motorized equipment, synthetic fertilizers and hybrid seeds. According to Giovanni Federico's, Feeding the World,2 by 1950 farms in the United States and Canada had one tractor for every two farmers. Utilization of fertilizer grew six fold from 1900 to 1950. Hybrid wheat was grown on 87% of the planted acres in the United States in 1921, up from 14% in 1914. Hybrid corn crops jumped from 2% to 90% of acres planted from 1936 to 1945.3
After World War II these innovations spread. Worldwide chemical fertilizer usage grew nearly tenfold from 1950 to 2000. In most continents, over half of wheat, rice and corn acres were sown with high yield varieties by the year 2000. From 1950 to 2000, world agriculture production tripled, far outpacing population growth.4 USDA data indicates that from 1998 to 2008, wheat yields per acre averaged 41 bushels, triple the rate of 100 years ago, and corn yields quintupled to an average of 144 bushels. The best equipped farmers can now produce over four million pounds of grain and feed thousands!5
Launching a "Green Revolution" in Developing Countries
Rich countries had the means to adopt modern agricultural processes while poor regions struggled to advance. Leon Hesser's book, The Man Who Fed the World,6 describes how Dr. Norman Borlaug helped create the Green Revolution7 in many developing countries by improving plant varieties and increasing crop yields. For his efforts, Borlaug won a Nobel Peace Prize, the only one awarded in the twentieth century for work in agriculture.
Mexico redistributed land to poor peasants after its political revolution ended in 1918. However, its peasants remained poor and hungry for decades. In 1940, U.S. vice president elect, Henry Wallace, who had founded Hi-Bred Corn Company (now Pioneer Hi-Bred, a DuPont subsidiary), toured Mexico and was appalled by conditions there. He convinced the Rockefeller Foundation to sponsor efforts to adapt hybrid wheat and corn for Mexico and in 1943, the Mexican Government-Rockefeller Foundation Cooperative Agricultural Program was established.
The program hired Borlaug as its plant pathologist. Borlaug learned that a plant disease called wheat stem rust had halved Mexico's wheat production from 1939 to 1942. He set out to create high yielding hybrid wheat that was resistant to the disease. His program introduced three innovations. First, he planted successive hybrid crops in two locations each year, which both doubled the pace of progress and resulted in crops tolerant to varying conditions. Next, Borlaug crossed thousands of varieties of wheat, working to find the most resistant hybrids. He eventually developed 40 rust resistant varieties.
Third, Borlaug changed the architecture of wheat. He knew that many wheat varieties responded well to fertilizer but when yields exceeded roughly two tons per acre, plants became top-heavy and collapsed. Borlaug crossed over 20,000 varieties of wheat from around the world in his efforts to create high yielding wheat with shorter, stronger stems. He finally succeeded in 1953 by crossing rust-resistant Mexican seeds with Japanese dwarf wheat. Under ideal
3
Wanger International Select 2009 Semiannual Report
conditions, four tons of wheat per acre could be achieved. Mexico became self sufficient in wheat in 1956.
Having achieved success in Mexico, the Rockefeller Foundation pursued progress elsewhere, in partnership with the Ford Foundation, the United Nations and local governments. Pakistan and India were major beneficiaries. By 1970, 55% of Pakistan's wheat acreage and 35% of India's wheat acreage were sown with Mexican varieties. The Rockefeller and Ford Foundations also created the International Rice Research Institute, which began in 1960. By 1966 it developed a sturdy short-stemmed rice plant that, when fertilized sufficiently, yielded two- to three-times the rice it replaced. This rice was quickly adopted in India.
Borlaug was personally involved with the implementation of these programs. He understood that in addition to better seeds, farmers need fertilizer, credit and fair prices for their crops. Governments largely complied. As a result of the Green Revolution, many developing countries were substantial contributors to world agricultural growth.
Recent Conditions and Future Prospects
After reading so much about the amazing progress that has been made in agriculture, it was somewhat surprising to find an article in the June 2009 National Geographic titled, "The End of Plenty, The Global Food Crisis." It noted that global grain consumption exceeded production for seven of the last nine years and grain stockpiles plunged to a 20-year low of 61-days supply in 2007 prior to recovering to a meager 70-days supply in 2008. The price of wheat and corn tripled from 2005 to 2008, and the price of rice quintupled.
Demand recently grew more quickly than supply for several reasons. First, people in developing countries are becoming more prosperous and are eating more meat, causing grain consumption by livestock to rise rapidly. Second, use of ethanol as a gasoline additive or substitute has jumped. Some 30% of the 2008 U.S. corn crop was converted to ethanol instead of being available as food. Third, while world grain production hit records in 2008, growth in grain production has slowed somewhat since the year 2000 compared to prior decades.
Still, agriculture continues to find ways to meet the rising demand. Advancements in hybrid crops continue, and biotechnology is now creating crops with whole new characteristics. While conventional plant breeding is limited to crossing closely related species, biotech methods utilize genes from distant species. To date, two types of biotech crops have been commercialized, those resistant to herbicides and those resistant to insects.
Biotech crops were first made available in 1996 and by 2008 were planted in over 300 million acres, some 8% of global cropland in 25 countries, including 15 developing countries. That year, 85% of the corn crop in the United States came from biotech seeds. Farmers seem satisfied with biotech crops; nearly 100% keep planting biotech once they begin.8 Use of biotech versions of soybean, cotton, corn, canola and other crops increased farm income an estimated $10 billion in 2007 and biotech corn and soybean yields appear to be roughly 10% higher than conventional crops.9 The National Geographic story quotes a scientist with agricultural company Monsanto who predicts that biotechnology will double corn, soybean and cotton yields by 2030.
National Geographic also pointed out the downside of the Green Revolution. Yields in India have flattened since the mid-90s, and hybrid plant needs for water, fertilizer and pesticides have resulted in aquifer depletion, salinized soils and contamination of drinking water. However, new versions of biotech plants are in development, including versions likely to provide still higher yields, drought tolerance and salinized soil tolerance.
Not everyone agrees with the use of biotech crops. Critics have expressed doubts about productivity gains and have concerns about the possibility of a "Frankenfood" becoming toxic or creating an ecological disaster should some new plant become invasive. But numerous safeguards are in place, including rigorous approval processes. Countries that had prohibited biotech crops are now slowly introducing them. Increased adoption of biotech plants has had positive ecological effects, as higher yields reduce needs for additional crop acres and related deforestation, insect resistance reduces needs for pesticides, and herbicide resistance reduces fuel consumption and soil erosion by requiring less tillage.
Mankind's progress in agriculture has been truly amazing. We cannot revert back to previous agricultural processes, which are insufficient to feed a worldwide population of 6.7 billion. Instead, substantial investments in agriculture, and judicious use of new technologies, are needed to maintain impressive production gains in the future.
Columbia Wanger Funds News
Resumption of Securities Lending
The Columbia Wanger Funds restarted securities lending during the second quarter. The domestic Funds briefly participated in securities lending in the third quarter of last year but suspended lending activities due to the turmoil in the financial markets at that time. As market conditions have stabilized somewhat, the Wanger Advisors Trust Board and CWAM made the decision to begin securities lending again in June.
Securities lending has come under media scrutiny recently so we want to clearly
4
Wanger International Select 2009 Semiannual Report
state how CWAM administers the lending program. Fund shareholders receive all of the income generated by our lending program, net of modest fees charged by the lending agent to operate the program. The securities lending income benefits Fund shareholders by offsetting a portion of the Fund's operating expenses, which increases the Fund's total returns. The advisor charges no additional fees for administering this program.
Securities lending is the temporary lending of the Fund's portfolio securities to broker/dealers and other institutional investors. The Fund retains the benefits of owning the securities, including receipt of dividends or interest generated by the security. The Fund also receives a fee for the loan. The Fund may recall the loans at any time and may do so in order to vote proxies or to sell the loaned securities. Furthermore, borrowers provide the Fund with cash collateral that exceeds the value of the securities on loan. The Fund could lose money if it incurred a loss on the reinvestment of the cash collateral. To minimize this risk, cash collateral for the program is invested in the Dreyfus Government Cash Management Fund, a money market mutual fund. The securities lending agent is Goldman Sachs Agency Lending. Thus far, shareholders have received modest benefits and incurred no losses from the program.


Charles P. McQuaid
President and Chief Investment Officer
Columbia Wanger Asset Management, L.P.
The information and data provided in this analysis are derived from sources that we deem to be reliable and accurate. These views are not guarantees of future performance and involve certain risks, uncertainties and assumptions that are difficult to predict so actual outcomes and results may differ significantly from the views expressed. The views/opinions expressed in "Agriculture's Amazing Progress" are those of the author and not of the Wanger Advisors Trust Board, are subject to change at any time based upon economic, market or other conditions, may differ from views expressed by other Columbia Management associates or other divisions of Bank of America and the respective parties disclaim any responsibility to update such views. These views may not be relied on as investment advice and, because investment decisions for a Columbia Wanger Fund are based on numerous factors, may not be relied on as an indication of trading i ntent on behalf of any particular Columbia Wanger Fund.
1 Mazoyer, Marcel and Roudart, Laurence, A History of World Agriculture, (New York, NY, Monthly Review Press, 2006).
2 Federico, Giovanni, Feeding The World, (Princeton and Oxford, Princeton University Press, 2005).
3 Ibid, pg. 97.
4 Ibid, pgs. 55, 19.
5 Mazoyer, Marcel and Roudart, Laurence, op. cit., pg 11.
6 Hesser, Leon, The Man Who Fed The World, (Dallas, TX, Durban House, 2006).
7 The Green Revolution is defined by Mazoyer and Roudart as, "a variant of the contemporary agricultural revolution but without the large-scale motorization and mechanization, developed widely in the developing countries."
8 ISAAA Brief 39-2008: Executive Summary, "Global Status of Commercialized Biotech/GM Crops: 2008, The First Thirteen Years, 1996 to 2008," available at www.isaaa.org.
9 "GM crops: global, socio-economic and environmental impacts 1996-2007," a research paper written by Graham Brookes and Peter Barfoot of PG Economics Ltd, Dorchester, U.K., May 2009.
5
Wanger International Select 2009 Semiannual Report

Performance Review Wanger International Select

Christopher J. Olson
Portfolio Manager
Performance data quoted represents past performance and current performance may be lower or higher. Past performance is no guarantee of future results. The investment return and principal value will fluctuate so that shares, when redeemed, may be worth more or less than the original cost. For daily and most recent month-end performance updates, please call 1-888-4-WANGER.
Wanger International Select ended the semiannual period up 10.50%, underperforming its primary benchmark, the S&P Developed Ex-U.S. Between $2 Billion and $10 Billion Index, which gained 14.93%. The Fund's less cyclical portfolio, which helped performance during the recent market crash, held the Fund back as investors rushed into riskier assets during the period.
Health care holdings were among the Fund's worst performers as investors moved away from these more defensive businesses. U.S. pharmaceutical company Cephalon, Swiss orthopedic surgery materials manufacturer Synthes and U.S. biotech company BioMarin fell between 20% and 31% in the half year. We opted to sell the Fund's positions in Synthes and BioMarin during the period. Outside of health care, Japan's Nintendo, a maker of gaming software and hardware, fell 27% year to date as growth in its Wii product slowed. Japanese cable service provider Jupiter Telecommunications rebounded in the second quarter but it was not enough to offset first quarter declines. The stock was down 29% at the end of the half year as investors sold last year's strong performers to fund purchases of more cyclical stocks.
Pacific Rubiales Energy, an oil production and exploration company operating in Colombia, was a top contributor to Fund performance, up 363% for the half year. The stock benefited from the rebound in oil prices and on expectations that its production will continue to rise rapidly. Swedish measurement equipment manufacturer Hexagon was up 81% for the half on expectations that we have seen the worst of the economic crisis. Intertek Group, a U.K. provider of testing, inspection and certification services, was up 54% year to date as increasing government regulations continued to drive growth in its consumer products testing business. Finally, Naspers, a media company with assets in South Africa and other emerging markets, returned 43% year to date. Naspers announced strong results through the end of March and also benefited from its 35% holding in the rapidly growing Chinese internet company Tencent.
Volatility has been, and is likely to continue to be, a defining feature of the global equity markets. High debt levels, loose monetary policies, large fiscal stimulus plans, changing government regulations, rapidly evolving business environments and other factors will keep investors guessing. We will continue to focus our efforts on finding those companies that we believe can manage through such turbulence and adequately reward shareholders over the long term.
International investing involves special risks, including foreign taxation, currency risks, risks associated with possible differences in financial standards and other risks associated with future political and economic developments. Stocks of small- and mid-cap companies pose special risks, including possible illiquidity and greater price volatility than stocks of larger, more established companies. Investing in emerging markets may involve greater risks than investing in more developed countries.
Portfolio holdings are subject to change periodically and may not be representative of current holdings.
Fund's Positions in Mentioned Holdings
As a percentage of net assets, as of 6/30/09
| Naspers | 5.1 | % | |||||
| Pacific Rubiales Energy | 3.8 | ||||||
| Intertek Group | 3.5 | ||||||
| Nintendo | 2.7 | ||||||
| Jupiter Telecommunications | 2.2 | ||||||
| Hexagon | 1.9 | ||||||
| Cephalon | 1.4 | ||||||
6
Wanger International Select 2009 Semiannual Report
Growth of a $10,000 Investment in Wanger International Select
February 1, 1999 (inception date) through June 30, 2009
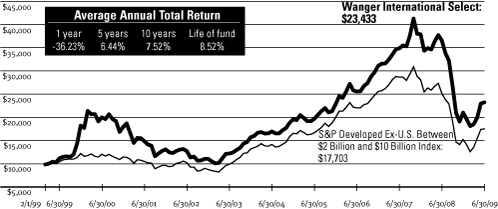
Performance data quoted represents past performance and current performance may be lower or higher. Past performance is no guarantee of future results. The investment return and principal value will fluctuate so that shares, when redeemed, may be worth more or less than the original cost. Performance results may reflect any fee waivers or reimbursements of fund expenses by the investment advisor and/or any of its affiliates. Absent these fee waivers or expense reimbursement arrangements, performance results would have been lower. For daily and most recent month-end performance updates, please call 1-888-4-WANGER.
This graph compares the results of $10,000 invested in Wanger International Select on February 1, 1999 (the date the Fund began operations) through June 30, 2009, to the S&P Developed Ex-U.S. Between $2 Billion and $10 Billion Index, with dividends and capital gains reinvested. Although the index is provided for use in assessing the Fund's performance, the Fund's holdings may differ significantly from those in the index.
Top 10 Holdings
As a percentage of net assets, as of 6/30/09
| 1. Naspers (South Africa) Media in Africa & Other Emerging Markets | 5.1 | % | |||||
| 2. Serco (United Kingdom) Facilities Management | 4.9 | ||||||
| 3. Pacific Rubiales Energy (Canada) Oil Production & Exploration in Colombia | 3.8 | ||||||
| 4. Capita Group (United Kingdom) White Collar, Back Office Outsourcing | 3.8 | ||||||
| 5. Israel Chemicals (Israel) Producer of Potash, Phosphates, Bromine & Specialty Chemicals | 3.6 | ||||||
| 6. Intertek Group (United Kingdom) Testing, Inspection & Certification Services | 3.5 | ||||||
| 7. Potash Corp. of Saskatchewan (Canada) World's Largest Producer of Potash | 3.2 | ||||||
| 8. NHN (South Korea) South Korea's Largest Online Search Engine | 3.0 | ||||||
| 9. Kansai Paint (Japan) Paint Producer in Japan, India, China & Southeast Asia | 2.9 | ||||||
| 10. Alexion Pharmaceuticals (United States) Biotech Focused on Orphan Diseases | 2.8 | ||||||
Top 5 Countries
As a percentage of net assets, as of 6/30/09
| Japan | 20.8 | % | |||||
| United Kingdom | 14.9 | ||||||
| Canada | 7.9 | ||||||
| United States | 7.0 | ||||||
| South Korea | 6.3 | ||||||
Results as of June 30, 2009
| 2nd quarter | Year to date | 1 year | 5 year | 10 year | |||||||||||||||||||
| Wanger International Select | 25.12 | % | 10.50 | % | -36.23 | % | 6.44 | % | 7.52 | % | |||||||||||||
| S&P Developed Ex-U.S. Between $2 Billion and $10 Billion Index | 28.70 | 14.93 | -30.16 | 4.30 | 5.24 | ||||||||||||||||||
| MSCI EAFE Index | 25.43 | 7.95 | -31.35 | 2.31 | 1.18 | ||||||||||||||||||
| Lipper Variable Underlying International Growth Funds Index | 23.55 | 10.66 | -32.51 | 2.91 | 1.06 | ||||||||||||||||||
NAV as of 6/30/09: $12.95
Performance numbers reflect all Fund expenses but do not include any insurance charge imposed by your insurance company's separate accounts. If performance results included the effect of these additional charges, it would be lower.
The Fund's annual operating expense ratio is 1.24%. The annual operating expense ratio is as stated in the Fund's prospectus that is current as of the date of this report. Differences in expense ratios disclosed elsewhere in this report may result from including fee waivers and expense reimbursements, if any, as well as different time periods used in calculating the ratios.
All results shown assume reinvestment of distributions and do not reflect taxes that a shareholder would pay on Fund distributions or the sale of Fund shares.
The S&P Developed Ex-U.S. Between $2 Billion and $10 Billion Index, the Fund's primary benchmark, is a subset of the broad market selected by the index sponsor representing the mid-cap developed market, excluding the United States. The Morgan Stanley Capital International Europe, Australasia, Far East (MSCI EAFE) Index is a capitalization-weighted index that tracks the total return of common stocks in 21 developed market countries within Europe, Australasia and the Far East. The Lipper Variable Underlying International Growth Funds Index is an equally weighted representation of the 30 largest variable insurance underlying funds in the Lipper Variable Underlying International Growth Funds Classification. Indexes are not managed and do not incur fees or expenses. It is not possible to invest directly in an index.
Portfolio characteristics and holdings are subject to change periodically and may not be representative of current characteristics and holdings.
Lipper Inc., a widely respected data provider in the industry, calculates an average total return (assuming reinvestment of distributions) for mutual funds with investment objectives similar to those of the fund. Lipper makes no adjustment for the effect of sales loads.
7
Wanger International Select 2009 Semiannual Report
Wanger International Select
Statement of Investments (Unaudited) June 30, 2009
| Number of Shares | Value | ||||||||||
| Common Stocks – 95.8% | |||||||||||
| Asia – 35.5% | |||||||||||
| Japan – 20.8% | |||||||||||
| 112,000 | Kansai Paint Paint Producer in Japan, India, China & Southeast Asia | $ | 801,877 | ||||||||
| 2,700 | Nintendo Entertainment Software & Hardware | 743,051 | |||||||||
| 800 | Jupiter Telecommunications Largest Cable Service Provider in Japan | 606,524 | |||||||||
| 230 | Seven Bank ATM Processing Services | 601,397 | |||||||||
| 14,900 | Benesse Education Service Provider | 595,504 | |||||||||
| 51,900 | Rohto Pharmaceutical Health & Beauty Products | 585,552 | |||||||||
| 28,000 | Aeon Mall Suburban Shopping Mall Developer, Owner & Operator | 529,819 | |||||||||
| 80 | Orix JREIT Diversified REIT | 366,212 | |||||||||
| 37,000 | Kamigumi Port Cargo Handling & Logistics | 311,464 | |||||||||
| 27,000 | Suruga Bank Regional Bank | 257,350 | |||||||||
| 30 | Nippon Building Fund Office REIT | 256,749 | |||||||||
| 5,000 | Ain Pharmaciez Dispensing Pharmacy/Drugstore Operator | 103,669 | |||||||||
| 5,759,168 | |||||||||||
| South Korea – 6.3% | |||||||||||
| 6,000 | NHN (a) South Korea's Largest Online Search Engine | 829,048 | |||||||||
| 3,600 | MegaStudy Online Education Service Provider | 648,013 | |||||||||
| 10,500 | Woongjin Coway South Korean Household Appliance Rental Service Provider | 254,788 | |||||||||
| 1,731,849 | |||||||||||
| Singapore – 4.6% | |||||||||||
| 460,000 | OLAM International Agriculture Supply Chain Manager | 769,136 | |||||||||
| Number of Shares | Value | ||||||||||
| 62,000 | Singapore Exchange Singapore Equity & Derivatives Market Operator | $ | 302,902 | ||||||||
| 196,300 | Ascendas REIT Singapore Industrial Property Landlord | 214,884 | |||||||||
| 1,286,922 | |||||||||||
| Hong Kong – 3.0% | |||||||||||
| 39,000 | Hong Kong Exchanges and Clearing Hong Kong Equity & Derivatives Market Operator | 605,564 | |||||||||
| 1,207,914 | NagaCorp Casino/Entertainment Complex in Cambodia | 159,450 | |||||||||
| 40,400 | Lifestyle International Mid to High-end Department Store Operator in Hong Kong & China | 52,538 | |||||||||
| 817,552 | |||||||||||
| China – 0.8% | |||||||||||
| 84,200 | Shandong Weigao Vertically Integrated Hospital Consumable Manufacturer | 215,756 | |||||||||
| Total Asia | 9,811,247 | ||||||||||
| Europe – 33.0% | |||||||||||
| United Kingdom – 14.9% | |||||||||||
| 195,000 | Serco Facilities Management | 1,354,778 | |||||||||
| 88,000 | Capita Group White Collar, Back Office Outsourcing | 1,037,453 | |||||||||
| 56,600 | Intertek Group Testing, Inspection & Certification Services | 975,903 | |||||||||
| 166,000 | Cobham Aerospace Components | 473,476 | |||||||||
| 87,000 | RPS Group Environmental Consulting & Planning | 286,876 | |||||||||
| 4,128,486 | |||||||||||
| France – 4.4% | |||||||||||
| 7,000 | Neopost Postage Meter Machines | 629,469 | |||||||||
| 18,000 | SES Satellite Broadcasting Services | 343,660 | |||||||||
See accompanying notes to financial statements.
8
Wanger International Select 2009 Semiannual Report
Wanger International Select
Statement of Investments (Unaudited) June 30, 2009
| Number of Shares | Value | ||||||||||
| France – 4.4% (cont) | |||||||||||
| 8,900 | Eutelsat Co-leader in European Fixed Satellite Services | $ | 229,919 | ||||||||
| 1,203,048 | |||||||||||
| Germany – 3.3% | |||||||||||
| 9,675 | Wincor Nixdorf Retail POS Systems & ATM Machines | 542,559 | |||||||||
| 16,900 | Rhoen-Klinikum Health Care Services | 373,694 | |||||||||
| 916,253 | |||||||||||
| Netherlands – 2.6% | |||||||||||
| 10,540 | Fugro Sub-sea Oilfield Services | 437,667 | |||||||||
| 14,000 | Imtech Engineering & Technical Services | 272,490 | |||||||||
| 710,157 | |||||||||||
| Spain – 2.5% | |||||||||||
| 15,400 | Red Electrica de Espana Spanish Power Grid | 696,757 | |||||||||
| Sweden – 1.9% | |||||||||||
| 59,000 | Hexagon Measurement Equipment | 533,776 | |||||||||
| Ireland – 1.8% | |||||||||||
| 180,000 | United Drug Irish Pharmaceutical Wholesaler & Outsourcer | 500,028 | |||||||||
| Switzerland – 0.8% | |||||||||||
| 2,900 | Kuehne & Nagel Freight Forwarding/Logistics | 227,651 | |||||||||
| Denmark – 0.8% | |||||||||||
| 2,700 | Novozymes Industrial Enzymes | 219,451 | |||||||||
| Total Europe | 9,135,607 | ||||||||||
| Other Countries – 25.2% | |||||||||||
| Canada – 7.9% | |||||||||||
| 110,000 | Pacific Rubiales Energy (a) | 906,934 | |||||||||
| 46,025 | Pacific Rubiales Energy-Warrants (a)(b) Oil Production & Exploration in Colombia | 145,852 | |||||||||
| Number of Shares | Value | ||||||||||
| 9,600 | Potash Corp. of Saskatchewan World's Largest Producer of Potash | $ | 893,280 | ||||||||
| 11,900 | CCL Industries Leading Global Label Manufacturer | 235,002 | |||||||||
| 2,181,068 | |||||||||||
| United States – 7.0% | |||||||||||
| 19,000 | Alexion Pharmaceuticals (a) Biotech Focused on Orphan Diseases | 781,280 | |||||||||
| 7,000 | Cephalon (a) Specialty Pharmaceuticals for Pain, Central Nervous System & Oncology | 396,550 | |||||||||
| 4,000 | Diamond Offshore Offshore Drilling Contractor | 332,200 | |||||||||
| 6,000 | Oceaneering International (a) Provider of Sub-sea Services & Manufactured Products | 271,200 | |||||||||
| 6,500 | Atwood Oceanics (a) Offshore Drilling Contractor | 161,915 | |||||||||
| 1,943,145 | |||||||||||
| South Africa – 5.0% | |||||||||||
| 53,000 | Naspers Media in Africa & Other Emerging Markets | 1,396,847 | |||||||||
| Israel – 3.6% | |||||||||||
| 101,000 | Israel Chemicals Producer of Potash, Phosphates, Bromine & Specialty Chemicals | 994,199 | |||||||||
| Australia – 1.7% | |||||||||||
| 111,000 | Sino Gold (a) Gold Mining in The People's Republic of China | 460,549 | |||||||||
| Total Other Countries | 6,975,808 | ||||||||||
| Latin America – 2.1% | |||||||||||
| Chile – 2.1% | |||||||||||
| 16,000 | Sociedad Quimica y Minera de Chile – ADR | 579,040 | |||||||||
| Producer of Specialty Fertilizers, Lithium & Iodine | |||||||||||
| Total Latin America | 579,040 | ||||||||||
| Total Common Stocks (Cost: $25,018,279) – 95.8% | 26,501,702 | ||||||||||
See accompanying notes to financial statements.
9
Wanger International Select 2009 Semiannual Report
Wanger International Select
Statement of Investments (Unaudited) June 30, 2009
| Number of Shares or Principal Amount | Value | ||||||||||
| Exchange Traded Fund – 0.6% | |||||||||||
| 16,500 | iShares MSCI Taiwan Index Fund Taiwan Exchange Traded Fund | $ | 166,485 | ||||||||
| Total Exchange Traded Fund (Cost: $162,310) | 166,485 | ||||||||||
| Short-Term Obligation – 3.9% | |||||||||||
| Repurchase Agreement – 3.9% | |||||||||||
| $ | 1,080,000 | Repurchase Agreement with Fixed Income Clearing Corp., dated 6/30/09, due 7/01/09 at 0.0001%, collateralized by a U.S. Government Agency obligation maturing 4/23/14, market value $1,102,456 (repurchase proceeds $1,080,000) | 1,080,000 | ||||||||
| Total Short-Term Obligation (Cost: $1,080,000) | 1,080,000 | ||||||||||
| Total Investments (Cost: $26,260,589) – 100.3% (c)(d) | 27,748,187 | ||||||||||
| Cash and Other Assets Less Liabilities – (0.3)% | (90,245 | ) | |||||||||
| Total Net Assets – 100.0% | $ | 27,657,942 | |||||||||
Notes to Statement of Investments:
(a) Non-income producing security.
(b) Denotes a restricted security, which is subject to restrictions on resale under federal securities laws. This security is valued at its fair value determined in good faith under consistently applied procedures established by the board of trustees. At June 30, 2009, this security amounted to $145,852, which represents 0.52% of total net assets.
Additional information on this security is as follows:
| Acquisition Security | Dates | Shares | Cost | Value | |||||||||||||||
| Pacific Rubiales Energy – Warrants | 7/12/07 | 46,025 | $ | 78,779 | $ | 145,852 | |||||||||||||
(c) On June 30, 2009, the Fund's total investments were denominated in currencies as follows:
| Currency | Percentage of Value | Net Assets | |||||||||
| Japanese Yen | $ | 5,759,168 | 20.8 | ||||||||
| British Pound | 4,128,487 | 14.9 | |||||||||
| Euro | 4,026,242 | 14.6 | |||||||||
| U.S. Dollar | 3,914,522 | 14.2 | |||||||||
| Canadian Dollar | 2,035,216 | 7.4 | |||||||||
| Korean Won | 1,731,849 | 6.3 | |||||||||
| South African Rand | 1,396,847 | 5.0 | |||||||||
| Other currencies less than 5% of total net assets | 4,755,856 | 17.1 | |||||||||
| Cash and other assets less liabilities | (90,245 | ) | (0.3 | ) | |||||||
| $ | 27,657,942 | 100.0 | |||||||||
(d) At June 30, 2009, for federal income tax purposes cost of investments was $26,260,589 and net unrealized appreciation was $1,487,598 consisting of gross unrealized appreciation of $3,666,375 and gross unrealized depreciation of $2,178,777.
The following table summarizes the inputs used, as of June 30, 2009, in valuing the Fund's assets:
| Investment Type | Other Quoted Prices (Level 1) | Significant Observable Inputs (Level 2) | Significant Unobservable Inputs (Level 3) | Total | |||||||||||||||
| Common Stocks | |||||||||||||||||||
| Total Asia | $ | — | $ | 9,811,247 | $ | — | $ | 9,811,247 | |||||||||||
| Total Europe | — | 9,135,607 | — | 9,135,607 | |||||||||||||||
| Total Other Countries | 3,978,361 | 2,997,447 | — | 6,975,808 | |||||||||||||||
| Total Latin America | 579,040 | — | — | 579,040 | |||||||||||||||
| Total Common Stocks | 4,557,401 | 21,944,301 | — | 26,501,702 | |||||||||||||||
| Exchange Traded Fund | 166,485 | — | — | 166,485 | |||||||||||||||
| Short-Term Obligation | — | 1,080,000 | — | 1,080,000 | |||||||||||||||
| Total Investments | 4,723,886 | 23,024,301 | — | 27,748,187 | |||||||||||||||
| Total | $ | 4,723,886 | $ | 23,024,301 | $ | — | $ | 27,748,187 | |||||||||||
The Fund's assets assigned to the Level 2 input category include certain foreign securities for which a third party statistical pricing service may be employed for purposes of fair market valuation.
For more information on valuation inputs, and their aggregation into the levels used in the tables above, please refer to the Security Valuation section in the accompanying Notes to Financial Statements.
ADR = American Depositary Receipts.
See accompanying notes to financial statements.
10
Wanger International Select 2009 Semiannual Report
Wanger International Select
Portfolio Diversification (Unaudited) June 30, 2009
At June 30, 2009, the Fund's portfolio investments as a percentage of net assets was diversified as follows:
| Value | Percentage of Net Assets | ||||||||||
| Industrial Goods & Services | |||||||||||
| Outsourcing Services | $ | 3,161,367 | 11.4 | ||||||||
| Industrial Materials & Specialty Chemicals | 2,594,567 | 9.4 | |||||||||
| Other Industrial Services | 1,476,044 | 5.3 | |||||||||
| Machinery | 629,469 | 2.3 | |||||||||
| Electrical Components | 473,476 | 1.7 | |||||||||
| 8,334,923 | 30.1 | ||||||||||
| Information | |||||||||||
| TV Broadcasting | 1,396,847 | 5.1 | |||||||||
| Financial Processors | 908,466 | 3.3 | |||||||||
| Internet Related | 829,048 | 3.0 | |||||||||
| Consumer Software | 743,051 | 2.7 | |||||||||
| CATV | 606,524 | 2.2 | |||||||||
| Satellite Broadcasting & Services | 573,579 | 2.1 | |||||||||
| Computer Hardware & Related Equipment | 542,559 | 2.0 | |||||||||
| Instrumentation | 533,776 | 1.9 | |||||||||
| Business Information & Marketing Services | 286,876 | 1.0 | |||||||||
| 6,420,726 | 23.3 | ||||||||||
| Energy & Minerals | |||||||||||
| Mining | 1,353,829 | 4.9 | |||||||||
| Oil Services | 1,202,982 | 4.3 | |||||||||
| Oil & Gas Producers | 1,052,786 | 3.8 | |||||||||
| 3,609,597 | 13.0 | ||||||||||
| Consumer Goods & Services | |||||||||||
| Other Consumer Services | 1,550,843 | 5.6 | |||||||||
| Nondurables | 820,554 | 3.0 | |||||||||
| Retail | 633,488 | 2.3 | |||||||||
| Casinos & Gaming | 159,450 | 0.6 | |||||||||
| 3,164,335 | 11.5 | ||||||||||
| Value | Percentage of Net Assets | ||||||||||
| Health Care | |||||||||||
| Medical Equipment & Devices | $ | 997,036 | 3.6 | ||||||||
| Pharmaceuticals | 896,578 | 3.2 | |||||||||
| Health Care Services | 373,694 | 1.4 | |||||||||
| 2,267,308 | 8.2 | ||||||||||
| Other Industries | |||||||||||
| Real Estate | 837,845 | 3.0 | |||||||||
| Regulated Utilities | 696,757 | 2.5 | |||||||||
| Transportation | 311,464 | 1.1 | |||||||||
| 1,846,066 | 6.6 | ||||||||||
| Finance | |||||||||||
| Banks | 858,747 | 3.1 | |||||||||
| 858,747 | 3.1 | ||||||||||
| Total Common Stocks | 26,501,702 | 95.8 | |||||||||
| Exchange Traded Fund | 166,485 | 0.6 | |||||||||
| Short-Term Obligation | 1,080,000 | 3.9 | |||||||||
| Total Investments | 27,748,187 | 100.3 | |||||||||
| Cash and Other Assets Less Liabilities | (90,245 | ) | (0.3 | ) | |||||||
| Net Assets | $ | 27,657,942 | 100.0 | ||||||||
See accompanying notes to financial statements.
11
Wanger International Select 2009 Semiannual Report
Statement of Assets and Liabilities
June 30, 2009 (Unaudited)
| Assets: | |||||||
| Investments, at cost | $ | 26,260,589 | |||||
| Investments, at value | $ | 27,748,187 | |||||
| Cash | 272 | ||||||
| Foreign currency (cost of $34,383) | 34,090 | ||||||
| Receivable for: | |||||||
| Investments sold | 129,424 | ||||||
| Dividends receivable | 28,012 | ||||||
| Foreign tax reclaims | 22,928 | ||||||
| Expense reimbursement due from investment advisor | 1,297 | ||||||
| Other assets | 102 | ||||||
| Total Assets | 27,964,312 | ||||||
| Liabilities: | |||||||
| Payable for: | |||||||
| Investments purchased | 9,694 | ||||||
| Fund shares repurchased | 229,604 | ||||||
| Investment advisory fee | 21,446 | ||||||
| Administration fee | 1,141 | ||||||
| Transfer agent fee | 10 | ||||||
| Trustees' fees | 1,340 | ||||||
| Custody fee | 10,710 | ||||||
| Reports to shareholders | 13,591 | ||||||
| Trustees' deferred compensation plan | 7,835 | ||||||
| Other liabilities | 10,999 | ||||||
| Total Liabilities | 306,370 | ||||||
| Net Assets | $ | 27,657,942 | |||||
| Composition of Net Assets: | |||||||
| Paid-in capital | $ | 35,216,890 | |||||
| Undistributed net investment income | 169,324 | ||||||
| Accumulated net realized loss | (9,216,033 | ) | |||||
| Net unrealized appreciation on: | |||||||
| Investments | 1,487,598 | ||||||
| Foreign currency translations | 163 | ||||||
| Net Assets | $ | 27,657,942 | |||||
| Fund Shares Outstanding | 2,135,237 | ||||||
| Net asset value, offering price and redemption price per share | $ | 12.95 | |||||
Statement of Operations
For the Six Months Ended June 30, 2009 (Unaudited)
| Investment Income: | |||||||
| Dividends (net foreign taxes withheld of $35,478) | $ | 368,337 | |||||
| Interest | 329 | ||||||
| Total Investment Income | 368,666 | ||||||
| Expenses: | |||||||
| Investment advisory fee | 122,399 | ||||||
| Administration fee | 6,510 | ||||||
| Custody fee | 25,371 | ||||||
| Reports to shareholders | 17,864 | ||||||
| Audit fee | 12,372 | ||||||
| Trustees' fees | 3,510 | ||||||
| Chief compliance officer expenses (See Note 4) | 761 | ||||||
| Transfer agent fee | 80 | ||||||
| Other expenses (See Note 5) | 7,603 | ||||||
| Total Expenses | 196,470 | ||||||
| Fees waived or expenses reimbursed by investment advisor | (7,627 | ) | |||||
| Net Expenses | 188,843 | ||||||
| Net Investment Income | 179,823 | ||||||
| Net Realized and Unrealized Gain (Loss) on Investments and Foreign Currency: | |||||||
| Net realized gain (loss) on: | |||||||
| Investments | (3,749,008 | ) | |||||
| Foreign currency transactions | 24,670 | ||||||
| Net realized loss | (3,724,338 | ) | |||||
| Net change in unrealized appreciation (depreciation) on: | |||||||
| Investments | 5,903,822 | ||||||
| Foreign currency translations | (1,719 | ) | |||||
| Net change in unrealized appreciation (depreciation) | 5,902,103 | ||||||
| Net Gain | 2,177,765 | ||||||
| Net Increase in Net Assets from Operations | $ | 2,357,588 | |||||
See accompanying notes to financial statements.
12
Wanger International Select 2009 Semiannual Report
Statement of Changes in Net Assets
| Increase (Decrease) in Net Assets | (Unaudited) Six Months Ended June 30, 2009 | Year Ended December 31, 2008 | |||||||||
| Operations: | |||||||||||
| Net investment income | $ | 179,823 | $ | 566,145 | |||||||
| Net realized loss on investments and foreign currency transactions | (3,724,338 | ) | (5,479,558 | ) | |||||||
| Net change in unrealized appreciation (depreciation) on investments and foreign currency translations | 5,902,103 | (22,161,534 | ) | ||||||||
| Net Increase (Decrease) in Net Assets from Operations | 2,357,588 | (27,074,947 | ) | ||||||||
| Distributions to Shareholders: | |||||||||||
| From net investment income | (555,236 | ) | (215,563 | ) | |||||||
| From net realized gains | — | (14,461,904 | ) | ||||||||
| Total Distributions to Shareholders | (555,236 | ) | (14,677,467 | ) | |||||||
| Share Transactions: | |||||||||||
| Subscriptions | 687,738 | 4,503,145 | |||||||||
| Distributions reinvested | 555,236 | 14,677,467 | |||||||||
| Redemptions | (4,991,818 | ) | (21,308,289 | ) | |||||||
| Net Decrease from Fund Share Transactions | (3,748,844 | ) | (2,127,677 | ) | |||||||
| Total Decrease in Net Assets | (1,946,492 | ) | (43,880,091 | ) | |||||||
| Net Assets: | |||||||||||
| Beginning of period | 29,604,434 | 73,484,525 | |||||||||
| End of period | $ | 27,657,942 | $ | 29,604,434 | |||||||
| Undistributed net investment income at end of period | $ | 169,324 | $ | 544,737 | |||||||
See accompanying notes to financial statements.
13
Wanger International Select 2009 Semiannual Report
Financial Highlights
| (Unaudited) Six Months Ended June 30, | Year Ended December 31, | ||||||||||||||||||||||||||
| Selected data for a share outstanding throughout each period | 2009 | 2008 | 2007 | 2006 | 2005 | 2004 | |||||||||||||||||||||
| Net Asset Value, Beginning of Period | $ | 12.01 | $ | 28.07 | $ | 26.62 | $ | 19.63 | $ | 17.19 | $ | 13.87 | |||||||||||||||
| Income from Investment Operations: | |||||||||||||||||||||||||||
| Net investment income (a) | 0.08 | 0.21 | 0.10 | 0.11 | 0.13 | 0.04 | |||||||||||||||||||||
| Net realized and unrealized gain (loss) on investments and foreign currency | 1.10 | (10.31 | ) | 4.92 | 6.94 | 2.66 | 3.33 | ||||||||||||||||||||
| Total from Investment Operations | 1.18 | (10.10 | ) | 5.02 | 7.05 | 2.79 | 3.37 | ||||||||||||||||||||
| Less Distributions to Shareholders: | |||||||||||||||||||||||||||
| From net investment income | (0.24 | ) | (0.09 | ) | (0.21 | ) | (0.06 | ) | (0.35 | ) | (0.05 | ) | |||||||||||||||
| From net realized gains | — | (5.87 | ) | (3.36 | ) | — | — | — | |||||||||||||||||||
| Total Distributions to Shareholders | (0.24 | ) | (5.96 | ) | (3.57 | ) | (0.06 | ) | (0.35 | ) | (0.05 | ) | |||||||||||||||
| Net Asset Value, End of Period | $ | 12.95 | $ | 12.01 | $ | 28.07 | $ | 26.62 | $ | 19.63 | $ | 17.19 | |||||||||||||||
| Total Return (b) | 10.50 | %(c)(d) | (44.35 | )% | 21.78 | % | 36.00 | % | 16.43 | %(d) | 24.34 | % | |||||||||||||||
| Ratios to Average Net Assets/Supplemental Data: | |||||||||||||||||||||||||||
| Net expenses | 1.45 | %(e) | 1.24 | %(f) | 1.18 | %(f) | 1.19 | %(f) | 1.32 | %(f) | 1.43 | %(f) | |||||||||||||||
| Net investment income | 1.38 | %(e) | 1.10 | %(f) | 0.37 | %(f) | 0.47 | %(f) | 0.76 | %(f) | 0.29 | %(f) | |||||||||||||||
| Waiver/Reimbursement | 0.06 | %(e) | — | — | — | 0.00 | %(g) | — | |||||||||||||||||||
| Portfolio turnover rate | 40 | %(c) | 68 | % | 69 | % | 61 | % | 48 | % | 71 | % | |||||||||||||||
| Net assets, end of period (000s) | $ | 27,658 | $ | 29,604 | $ | 73,485 | $ | 62,594 | $ | 44,026 | $ | 35,232 | |||||||||||||||
(a) Net investment income per share was based upon the average shares outstanding during the period.
(b) Total return at net asset value assuming all distributions reinvested.
(c) Not annualized.
(d) Had the investment advisor not waived a portion of expenses, total return would have been reduced.
(e) Annualized.
(f) The benefits derived from custody fees paid indirectly had an impact of less than 0.01%.
(g) Rounds to less than 0.01%.
See accompanying notes to financial statements.
14
Wanger International Select 2009 Semiannual Report
Notes to Financial Statements (Unaudited)
1. Nature of Operations
Wanger International Select (the "Fund") is a series of Wanger Advisors Trust (the "Trust"), an open-end management investment company organized as a Massachusetts business trust. The investment objective of the Fund is to seek long-term capital appreciation. The Fund is available only for allocation to certain life insurance company separate accounts established for the purpose of funding qualified and non-qualified variable annuity contracts and variable life insurance policies and may also be offered directly to certain types of pension plans and retirement arrangements.
2. Significant Accounting Policies
The preparation of financial statements in accordance with accounting principles generally accepted in the United States of America ("GAAP") requires management to make certain estimates and assumptions that affect the reported amounts of assets and liabilities, the disclosure of contingent assets and liabilities at the date of the financial statements and the reported amounts of revenue and expenses during the reporting period. Actual results could differ from those estimates. Management has evaluated the events and transactions that have occurred through August 20, 2009, the date the financial statements were issued, and noted no items requiring adjustment of the financial statements or additional disclosures. The following is a summary of significant accounting policies consistently followed by the Fund in the preparation of its financial statements.
Security valuation
Securities of the Fund are valued at market value or, if a market quotation for a security is not readily available or is deemed not to be reliable because of events or circumstances that have occurred between the market quotation and the time as of which the security is to be valued, the security is valued at its fair value determined in good faith under consistently applied procedures established by the Board of Trustees. A security traded on a securities exchange or in an over-the-counter market in which transaction prices are reported is valued at the last sales price at the time of valuation. A security traded principally on NASDAQ is valued at the NASDAQ official closing price. A security for which there is no reported sale on the valuation date is valued at the latest bid quotation. Short-term investments maturing in 60 days or less are valued at amortized cost, which approximates market value. A security for which a mark et quotation is not readily available and any other assets are valued at its fair value determined in good faith under consistently applied procedures established by the Board of Trustees. The Trust has retained an independent statistical fair value pricing service that employs a systemic methodology to assist in the fair valuation process for securities principally traded in a foreign market in order to adjust for possible changes in value that may occur between the close of the foreign market and the time as of which the securities are to be valued. If a security is valued at a "fair value", that value may be different from the last quoted market price for the security.
The Fund adopted Statement of Financial Accounting Standards No. 157, Fair Value Measurements ("SFAS 157"). Under SFAS 157, various inputs are used in determining the value of the Fund's investments. These inputs are summarized in the three broad levels listed below:
• Level 1—quoted prices in active markets for identical securities
• Level 2—other significant observable inputs (including quoted prices for similar securities, interest rates, prepayment speeds, credit risk and others)
• Level 3—significant unobservable inputs (including management's own assumptions in determining the value of investments)
The inputs or methodologies used for valuing securities are not necessarily an indication of the risk associated with investing in those securities.
Examples of the types of securities in which the Fund would typically invest and how they are classified within this SFAS 157 hierarchy are as follows. Typical level 1 securities include exchange traded domestic equities, mutual funds whose NAVs are published each day and exchange traded foreign equities that are not statistically fair valued. Typical level 2 securities include exchange traded foreign equities that are statistically fair valued and short-term investments valued at amortized cost. Typical level 3 securities include any security fair valued by the Fund's Valuation Committee that relies on significant unobservable inputs.
In April 2009, the Financial Accounting Standards Board ("FASB") issued FASB Staff Position 157-4, Determining Fair Value When the Value and Level of Activity for the Asset or Liability Have Significantly Decreased and Identifying Transactions That Are Not Orderly ("FSP FAS 157-4"), which amends SFAS 157 and is effective for interim and annual periods ending after June 15, 2009. FSP FAS 157-4 provides additional guidance for estimating fair value in accordance with SFAS 157 when the volume and level of activity for the asset or liability measured at fair value has significantly decreased. Additionally, FSP FAS 157-4 expands disclosure requirements for reporting entities with respect to categories of assets and liabilities carried at fair value. Management does not expect the adopt ion of FSP FAS 157-4 to have a material impact on the Fund's financial statement disclosure.
Repurchase agreements
The Fund may engage in repurchase agreement transactions. The Fund, through its custodian, receives delivery of underlying securities collateralizing each repurchase agreement. The counterparty is required to maintain collateral that is at all times at least equal to the repurchase price including interest. In the event of default or bankruptcy by the other party to the agreement, realization and/or retention of the collateral may be subject to legal proceedings.
Foreign currency translations
Values of investments denominated in foreign currencies are converted into U.S. dollars using the New York spot market rate of exchange at the time of valuation. Purchases and sales of investments and dividend and interest income are translated into U.S. dollars using the spot market rate of exchange prevailing on the respective dates of such transactions. The gain or loss resulting from changes in foreign exchange rates is included with net realized and unrealized gain or loss from investments, as appropriate.
Security transactions and investment income
Security transactions are accounted for on the trade date (date the order to buy or sell is executed) and dividend income is recorded on the ex-dividend date, except that certain dividends from foreign securities are recorded as soon as the information is available to the Fund. Interest income is recorded on the accrual basis and includes amortization of discounts on debt obligations when required for federal income tax purposes. Realized gains and losses from security transactions are recorded on an identified cost basis.
Awards, if any, from class action litigation related to securities owned may be recorded as a reduction of cost of those securities. If the applicable securities are no longer owned, the proceeds are recorded as realized gains.
Restricted securities
Restricted securities are securities that may only be resold upon registration under federal securities laws or in transactions exempt from registration. In some cases, the issuer of restricted securities has agreed to register such securities for resale at the issuer's expense either upon demand by the Fund or in connection with another registered offering of the securities. Many restricted securities may be resold in the secondary market in transactions exempt from registration. Such restricted securities may be determined to be liquid under criteria established by the Board of Trustees.
15
Wanger International Select 2009 Semiannual Report
Notes to Financial Statements, continued (Unaudited)
Use of estimates
The preparation of financial statements in conformity with GAAP requires management to make estimates and assumptions that affect the amounts reported in the financial statements and accompanying notes. Actual results may differ from those estimates.
Fund share valuation
Fund shares are sold and redeemed on a continuing basis at net asset value. Net asset value per share is determined daily as of the close of trading on the New York Stock Exchange ("the Exchange") on each day the Exchange is open for trading by dividing the total value of the Fund's investments and other assets, less liabilities, by the number of Fund shares outstanding.
Custody fees/Credits
Custody fees are reduced based on the Fund's cash balances maintained with the custodian. The amount is disclosed as a reduction of total expenses in the Statement of Operations.
Federal income taxes
The Fund has complied with the provisions of the Internal Revenue Code available to regulated investment companies and, in the manner provided therein, distributes all its taxable income, as well as any net realized gain on sales of investments and foreign currency transactions reportable for federal income tax purposes. Accordingly, the Fund paid no federal income taxes and no federal income tax provision was required.
Expenses
General expenses of the Trust are allocated to the Fund and the other series of the Trust based upon relative net assets or other expense allocation methodologies determined by the nature of the expense. Expenses directly attributable to the Fund are charged to the Fund.
Foreign capital gains taxes
Gains in certain countries may be subject to foreign taxes at the fund level, at rates ranging from 10%-15%. The Fund accrues for such foreign taxes on net realized and unrealized gains at the appropriate rate for each jurisdiction.
Distributions to shareholders
Distributions to shareholders are recorded on the ex-dividend date.
Indemnification
In the normal course of business, the Trust on behalf of the Fund enters into contracts that contain a variety of representations and warranties and that provide general indemnities. The Fund's maximum exposure under these arrangements is unknown, as this would involve future claims against the Fund. Also under the Trust's organizational documents, the trustees and officers of the Trust are indemnified against certain liabilities that may arise out of their duties to the Trust. However based on experience, the Fund expects the risk of loss due to these warranties and indemnities to be minimal.
3. Federal Tax Information
The tax character of distributions paid during the year ended December 31, 2008 was as follows:
| Distributions paid from: | |||||||
| Ordinary Income* | $ | 3,006,152 | |||||
| Long-Term Capital Gains | 11,671,315 | ||||||
* For tax purposes short-term capital gain distributions, if any, are considered ordinary income distributions.
The following capital loss carryforwards, determined as of December 31, 2008, may be available to reduce taxable income arising from future net realized gains on investments, if any, to the extent permitted by the Internal Revenue Code:
| Year of Expiration | Capital Loss Carryforward | ||||||
| 2016 | $ | 2,630,085 | |||||
FASB Interpretation No. 48, Accounting for Uncertainty in Income Taxes—an Interpretation of FASB Statement No. 109 ("FIN 48") management determines whether a tax position of the Fund is more likely than not to be sustained upon examination by the applicable taxing authority, including resolution of any related appeals or litigation processes, based on the technical merits of the position. The tax benefit to be recognized is measured as the largest amount of benefit that is greater than fifty percent likely of being realized upon ultimate settlement. Management has evaluated the known implications of FIN 48 on its computation of net assets for the Fund. As a result of this evaluation, management believes that FIN 48 does not have any effect on the Fund's financial statements. However, management's conclusions regarding FIN 48 may be subject to review and adjustment at a later date based on factors including, but not limited to, further implementation guidance from the FASB, new tax laws, regulations, and administrative interpretations (including relevant court decisions). The Fund's federal tax returns for the prior three fiscal years remain subject to examination by the Internal Revenue Service. The Fund is not aware of any tax positions for which it is reasonably possible that the total amounts of unrecognized tax benefits will significantly change in the next twelve months.
4. Transactions With Affiliates
Columbia Wanger Asset Management, L.P., ("CWAM") is a wholly owned subsidiary of Columbia Management Group, LLC, ("Columbia Management") which in turn is an indirect wholly owned subsidiary of Bank of America Corporation ("BOA"). CWAM furnishes continuing investment supervision to the Fund and is responsible for the overall management of the Fund's business affairs.
Under the Fund's investment advisory agreement, management fees are accrued daily based on the Fund's average daily net assets and paid monthly to CWAM at the annual rates shown in the table below:
| Average Daily Net Assets | Annual Fee Rate | ||||||
| Up to $500 million | 0.94 | % | |||||
| $500 million and over | 0.89 | % | |||||
For the six months ended June 30, 2009, the Fund's annualized effective investment advisory fee rate was 0.94% of average daily net assets.
Through April 30, 2010, CWAM will reimburse the Fund to the extent that ordinary operating expenses (exclusive of brokerage commissions, interest, taxes and extraordinary expenses, but inclusive of custodian charges relating to overdrafts, if any), after giving effect to any balance credits from the Fund's custodian, exceed an annual percentage of 1.45% of average daily net assets. For the six months ended June 30, 2009, the Fund was reimbursed $7,627.
CWAM provides administrative services and receives an administration fee from the Fund at the following annual rates:
| Wanger Advisors Trust Aggregate Average Daily Net Assets of the Trust | Annual Fee Rate | ||||||
| Up to $4 billion | 0.05 | % | |||||
| $4 billion to $6 billion | 0.04 | % | |||||
| $6 billion to $8 billion | 0.03 | % | |||||
| $8 billion and over | 0.02 | % | |||||
16
Wanger International Select 2009 Semiannual Report
Notes to Financial Statements, continued (Unaudited)
For the six months ended June 30, 2009, the Fund's annualized effective administration fee rate was 0.05% of average daily net assets. CWAM has delegated to Columbia Management Advisors, LLC ("Columbia"), an indirect, wholly owned subsidiary of BOA, the responsibility for certain administrative services.
Certain officers and trustees of the Trust are also officers of CWAM. The Trust makes no direct payments to its officers and trustees who are affiliated with CWAM.
The Board of Trustees has appointed a Chief Compliance Officer to the Trust in accordance with federal securities regulations. The Fund, along with other affiliated funds, pays its pro-rata share of the expenses associated with the Office of the Chief Compliance Officer. These expenses are disclosed separately as "Chief compliance officer expenses" in the Statement of Operations.
The Trust offers a deferred compensation plan for its independent trustees. Under that plan, a trustee may elect to defer all or a portion of his or her compensation. Amounts deferred are retained by the Trust and represent an unfunded obligation of the Trust. The value of amounts deferred is determined by reference to the change in value of Class Z shares of one or more series of Columbia Acorn Trust or a money market fund as specified by the trustee. Benefits under the deferred compensation plan are payable when the trustee ceases to be a member of the Board of Trustees.
Columbia Management Distributors, Inc. (the "Distributor"), an affiliate of Columbia and an indirect, wholly owned subsidiary of BOA, serves as the principal underwriter of the Trust and receives no compensation from the Fund for its services.
Columbia Management Services, Inc. (the "Transfer Agent"), an affiliate of Columbia and an indirect, wholly owned subsidiary of BOA, provides shareholder services to the Fund and has subcontracted with Boston Financial Data Services ("BFDS") to serve as subtransfer agent. For such services, the Transfer Agent receives a fee, paid monthly, at the annual rate of $21.00 per open account. The Transfer Agent also receives reimbursement for certain out-of-pocket expenses.
During the six months ended June 30, 2009, the Fund did not engage in purchase and sales transactions with funds that have a common investment advisor (or affiliated investment advisors), common directors/trustees, and/or common officers.
5. Borrowing Arrangements
The Trust participates in a $150 million credit facility, which was entered into to facilitate portfolio liquidity. Under the facility, interest is charged to each participating fund based on its borrowings at a rate per annum equal to the higher of Federal Funds Rate or Overnight LIBOR plus 0.750%. In addition, a commitment fee of 0.12% per annum of the unutilized line of credit is accrued and apportioned among the participating funds based on their relative net assets. The commitment fee is included in "Other expenses" in the Statement of Operations. No amounts were borrowed by the Fund under this facility during the six months ended June 30, 2009. The Trust enters into this line of credit for one year durations. The Trust has secured the line of credit for the entire year of 2009.
6. Fund Share Transactions
Proceeds and payments on Fund shares as shown in the Statement of Changes in Net Assets are in respect of the following numbers of shares:
| Six Months Ended June 30, 2009 | Year Ended December 31, 2008 | ||||||||||
| Shares sold | 61,303 | 246,505 | |||||||||
| Shares issued in reinvestment of dividend distributions | 56,773 | 740,912 | |||||||||
| Less shares redeemed | (447,316 | ) | (1,140,778 | ) | |||||||
| Net decrease in shares outstanding | (329,240 | ) | (153,361 | ) | |||||||
7. Investment Transactions
The aggregate cost of purchases and proceeds from sales other than short-term obligations for the six months ended June 30, 2009 were $10,359,117 and $14,524,923, respectively.
8. Legal Proceedings
CWAM, Columbia Acorn Trust, (another mutual fund family advised by CWAM), and the trustees of Columbia Acorn Trust (collectively, the "Columbia defendants") are named as defendants in class and derivative complaints that have been consolidated in a Multi-District Action (the "MDL Action") in the federal district court of Maryland. These lawsuits contend that defendants permitted certain investors to market time their trades in certain Columbia Acorn Funds. The MDL Action is ongoing. However, all claims against the Trust and the independent trustees of Columbia Acorn Trust have been dismissed.
Columbia Acorn Trust and CWAM are also defendants in a class action lawsuit that alleges, in summary, that Columbia Acorn Trust and CWAM exposed shareholders of Columbia Acorn International Fund to trading by market timers by allegedly: (a) failing to properly evaluate daily whether a significant event affecting the value of that fund's securities had occurred after foreign markets had closed but before the calculation of the funds' net asset value ("NAV"); (b) failing to implement the fund's portfolio valuation and share pricing policies and procedures; and (c) failing to know and implement applicable rules and regulations concerning the calculation of NAV (the "Fair Valuation Lawsuit"). The Seventh Circuit ruled that the plaintiffs' state law claims were preempted under federal law resulting in the dismissal of plaintiffs' complaint. Plaintiffs appealed the Seventh Circuit's ruling to the United States Supreme Court. The Supre me Court reversed the Seventh Circuit's ruling on jurisdictional grounds and the case was ultimately remanded to the state court.
On March 21, 2005, a class action complaint was filed against the Trust and CWAM seeking to rescind the CDSC assessed upon redemption of Class B shares of the Columbia Acorn Funds due to the alleged market timing of the Columbia Acorn Funds (the "CDSC Lawsuit"). In addition to the rescission of sales charges, plaintiffs seek recovery of actual damages, attorneys' fees and costs. The case has been transferred to the MDL Action in the federal district court of Maryland.
On September 14, 2007, the plaintiffs and the Columbia defendants named in the MDL Action, including the Columbia Funds, entered into a stipulation of settlement with respect to all Columbia-related claims in the MDL Action described above, including the CDSC and Fair Valuation Lawsuits. The settlement is subject to court approval.
Columbia Acorn Funds and CWAM intend to defend these suits vigorously. CWAM believes that the lawsuits are not likely to materially affect its ability to provide investment management services to the Fund.
17
Wanger International Select 2009 Semiannual Report
[Excerpt from:]
Wanger Advisors Trust
Management Fee Evaluation of the Senior Officer
Prepared Pursuant to the New York Attorney General's
Assurance of Discontinuance
May 2009
18
Wanger International Select 2009 Semiannual Report
Introduction
The New York Attorney General's Assurance of Discontinuance ("Order") entered into by Columbia Management Advisors, Inc. ("CMAI") and Columbia Management Distributors, Inc., ("CMDI" and collectively with "CMAI," "CMG") in February 2005, allows CMAI to manage or advise a mutual fund only if the trustees of the fund appoint a "Senior Officer" to perform specified duties and responsibilities. One of these responsibilities includes "managing the process by which proposed management fees (including but not limited to, advisory fees) to be charged the [Funds] are negotiated in a manner which is at arms' length and reasonable and consistent with this Assurance of Discontinuance."
This is the third year that the Columbia Acorn Trust and Wanger Advisors Trust (collectively, the "Trusts") and each series thereof (the "Acorn funds," "WAT funds" or collectively, the "Funds") have been overseen by the same Board of Trustees ("Board"). The Order provides that this Board must determine the reasonableness of proposed "management fees" by using either an annual competitive bidding process supervised by the Senior Officer or Independent Fee Consultant, or by obtaining "an annual independent written evaluation prepared by or under the direction of the Senior Officer or the Independent Fee Consultant."
"Management fees" are only part of the costs and expenses paid by mutual fund shareholders. Fund expenses can vary depending upon the class of shares held but usually include: (1) investment management or advisory fees to compensate analysts and portfolio managers for stock research and portfolio management, as well as the cost of operating a trading desk; (2) administrative expenses incurred to prepare registration statements and tax returns, calculate the Funds' net asset values, maintain effective compliance procedures and perform recordkeeping services; (3) transfer agency costs for establishing accounts, accepting and disbursing funds, as well as overseeing trading in Fund shares; (4) custodial expenses incurred to hold the securities purchased by the Funds; and (5) distribution expenses, including commissions paid to brokers that sell the Fund shares to investors.
Columbia Wanger Asset Management, L.P. ("CWAM"), the adviser to the Funds, has proposed that the Trusts continue the existing separate agreements governing the first two categories listed above: an advisory agreement governing portfolio management, and an administration agreement governing certain administration and clerical services. Together the fees paid under these two agreements are referred to as "management fees." Other fund expenses are governed by separate agreements, in particular agreements with two CWAM affiliates: CMDI, the broker-dealer that underwrites and distributes the Funds' shares, and Columbia Management Services, Inc. ("CMSI"), the Funds' transfer agent. In conformity with the terms of the Order, this evaluation, therefore, addresses only the advisory and administrative contracts, and does not extend to the other agreements.
According to the Order, the Senior Officer's evaluation must consider at least the following:
(1) Management fees (including components thereof) charged to institutional and other clients of CWAM for like services;
(2) Management fees (including any components thereof) charged by other mutual fund companies for like services;
(3) Costs to CWAM and its affiliates of supplying services pursuant to the management fee agreements, excluding any intra-corporate profit;
(4) Profit margins of CWAM and its affiliates from supplying such services;
(5) Possible economies of scale as the Funds grow larger; and
(6) The nature and quality of CWAM's services, including the performance of each Fund.
In 2004, the Boards of the two Trusts, then separate groups, each appointed me Senior Officer under the Order. They also determined not to pursue a competitive bidding process and instead, charged me with the responsibility of evaluating the Funds' proposed advisory and administrative fee contracts with CWAM in conformity with the requirements of the Order. This Report is an annual evaluation required under the Order. In discharging their responsibilities, the independent Trustees have also consulted independent, outside counsel.
2008 Evaluation
This is the fourth annual evaluation prepared in connection with the Order. This evaluation follows the same structure as the earlier studies. Some areas are given more emphasis here, while others are given less. Still, the fundamental information gathered for this evaluation is largely the same as past years. Last year's evaluation is referred to here as the "2008 Study."
Process and Independence
The objectives of the Order are to ensure the independent evaluation of the management fees paid by the Funds as well as to insure that all relevant factors are considered. In my view, this contract renewal process has been conducted at arms-length and with independence in gathering, considering and evaluating all relevant data. At the outset of the process, the Trustees sought and obtained from CWAM and CMG a comprehensive compilation of data regarding Fund performance and expenses, adviser profitability, and other information. The Contract Committee evaluated this information thoroughly. Performance and expense data was obtained from both Morningstar and Lipper, the leading consultants in this area. The rankings prepared by Morningstar and Lipper were independent and not influenced by the adviser.
In the course of its work, the Contract Committee gave careful consideration to the conclusions and recommendations contained in the 2008 Study. The Committee recommended, and the Board accepted and implemented several of the recommendations in this area contained in the 2008 Study.
19
Wanger International Select 2009 Semiannual Report
My evaluation of the advisory contracts was shaped, as it was last year, by my experience as Chief Compliance Officer of the Trusts ("CCO"). As CCO, I report solely to the Board and have no reporting obligation to, or employment relationship with, CMG or its affiliates, except for administrative purposes. I have commented on compliance matters in evaluating the quality of service provided by CWAM.
This Report, its supporting materials and the data contained in other materials submitted to the Contract Committee of the Board, in my view, provide a thorough factual basis upon which the Board, in consultation with independent counsel as it deems appropriate, may conduct management fee negotiations that are in the best interests of the Funds' shareholders.
The Fee Reductions Mandated under the Order
Under the terms of the Order, CMG agreed to secure certain management fee reductions for the mutual funds advised by its affiliate investment advisers. In some instances, breakpoints were also established. Although neither CWAM nor the Trusts was a party to the Order, CWAM offered and the Board accepted certain advisory fee reductions during 2005. By the terms of the Order, these fees may not be increased before November 30, 2009. I have used these advisory fee levels, as modified thereafter, in this evaluation because they are the fees in the current agreements that CWAM proposes should be continued. Hence, these fee levels are the starting point of an evaluation.
Conclusions
My review of the data and other material above leads to the following conclusions with respect to the factors identified in the Order.
1. Performance. Wanger Select and Wanger USA have suffered significant declines in ranking relative to their peers for the past five years. In contrast, the international Funds have improved their relative performance and enjoy solid rankings.
2. Management Fees relative to Peers. Management fees vary by WAT fund but, in general, the WAT funds impose higher fees than competing funds. Wanger Select and Wanger USA in particular were ranked by both Lipper and Morningstar at or below the median, and therefore impose higher fees than do the majority of their competitors.
3. Administrative Fees. The WAT funds' administrative fees are generally less competitive than are the fees charged by competitors, but these rankings suffer from a lack of uniformity in the scope of services encompassed by the fee. CWAM provides excellent administrative support for all the WAT funds. There are clear advantages to retaining the adviser and its affiliates to perform these services.
4. Management Fees relative to Institutional and Other Mutual Fund Accounts. CWAM's focus is on its mutual funds. It does not actively seek to manage separate or institutional accounts. The few institutional accounts it does manage vary in rate structures. Some pay advisory fees commensurate with or higher than the WAT funds. In addition, CWAM is now considering a new institutional account for a WAT shareholder that may enjoy a management fee significantly lower than the parallel mutual fund, and could adversely impact existing WAT shareholders.
5. Costs to CWAM and its Affiliates. CWAM's direct costs do not appear excessive. Overhead and indirect costs allocated to CWAM by its parent organizations, however, are significant and have varied considerably over the years. CWAM's affiliates report operating losses and therefore do not appear to enjoy excessive "fall out" benefits from CWAM's advisory agreement with the Funds.
6. Profit Margins. CWAM's pre-marketing expense profit margins are at the top of the industry, even in a difficult year such as 2008, though these comparisons are hampered by limited industry data. High profit margins are not unexpected for firms that manage large, successful funds and have provided outstanding investment performance for investors.
7. Economies of Scale. Economies of scale do exist at CWAM and will continue if asset levels return to those of past years. The Board has recently imposed additional breakpoints for some of the WAT funds that will result in greater sharing of economies of scale.
8. Nature and Quality of Services. This category includes a variety of considerations that are difficult to quantify, yet can have a significant bearing on the performance of the Funds. Several areas merit comment.
a. Capacity. CWAM has maintained its investment management capacity even in a difficult environment.
b. Compliance. CWAM has a reasonably designed compliance program that protects shareholders.
9. Process. In my opinion, the process of negotiating an advisory contract for the Funds has been conducted thoroughly and at arms' length. Further, the Trustees have sufficient information to evaluate management's proposal, and negotiate contract terms that are in the best interests of Fund shareholders.
20
Wanger International Select 2009 Semiannual Report
Recommendations
I believe the Trustees should:
1. Monitor closely the performance of Wanger Select and Wanger USA to ensure that appropriate steps are being taken by CWAM to improve their relative performance.
2. Consider imposing limitations on the use of soft dollars. While CWAM's use of soft dollars is consistent with the applicable regulatory requirements, the Board should have a clear understanding with CWAM regarding the cost to shareholders of the research purchased with Fund commission dollars.
3. Focus their review on the WAT funds' management fee levels in relation to their peers, in particular the fees paid by Wanger USA and Wanger Select. These Funds pay fees that are, in the views of both Morningstar and Lipper, significantly higher than their peers.
4. Seek assurances that CWAM and its affiliates will continue to provide adequate support to the WAT funds despite the recent downturn in market values and the difficulties faced by CWAM's ultimate parent organization, Bank of America. Similar assurances should be sought from any prospective purchaser of CWAM or its parent organization.
Robert P. Scales
May 26, 2009
21
Wanger International Select 2009 Semiannual Report
Wanger Advisors Trust Board Approval of the Advisory Agreement 2009
Wanger Advisors Trust (the "Trust") has an investment advisory agreement (the "Advisory Agreement") with Columbia Wanger Asset Management, L.P. ("CWAM") under which CWAM manages the Columbia Wanger Family of Funds (the "Funds"). The trustees of the Trust, more than seventy five percent of whom have never been affiliated with CWAM (the "Independent Trustees"), oversee the management of each Fund and, as required by law, determine at least annually whether to continue the Advisory Agreement for each Fund.
The Contract Committee of the board of trustees (the "Committee"), which is comprised of six Independent Trustees, makes recommendations to the board regarding any proposed continuation of the Advisory Agreement. After the Committee has made its recommendations, the full board of trustees determines whether to approve continuation of the Advisory Agreement. The board also considers matters bearing on the Advisory Agreement at its various meetings throughout the year, and meets at least quarterly with CWAM's portfolio managers.
In connection with their most recent consideration of the Advisory Agreement for each Fund, the Committee and all trustees received and reviewed a substantial amount of information provided by CWAM in response to requests from the Independent Trustees and their independent legal counsel. In addition, the Contract Committee met with the Investment Performance Committee, also comprised exclusively of Independent Trustees, to review performance related issues. As they considered the Advisory Agreement, the Independent Trustees were advised by independent legal counsel. At each meeting where the Committee or the Independent Trustees considered the Advisory Agreement, they met with management and also met in separate executive session with their independent legal counsel.
The materials reviewed by the Committee and the trustees included, among other items, (i) information on the investment performance of each Fund and its peer groups and performance benchmarks, (ii) information on each Fund's advisory fees and other expenses, including information comparing the Fund's fees and expenses to those of peer groups of funds and information about any applicable expense limitations and fee "breakpoints," (iii) data on sales and redemptions of Fund shares and (iv) information on the profitability to CWAM, as well as potential "fall-out" or ancillary benefits that CWAM and its affiliates may receive as a result of their relationships with the Funds. The trustees also considered other information such as (i) CWAM's financial condition, (ii) each Fund's investment objective and strategies, (iii) the size, education and experience of CWAM's investment staff and its use of technology, external research and tra ding cost measurement tools, (iv) the allocation of the Funds' brokerage, if any, including allocations to brokers affiliated with CWAM, and the use of "soft" commission dollars to pay for research products and services, (v) the resources devoted to, and the record of compliance with, the Funds' investment policies and restrictions, policies on personal securities transactions and other compliance policies and (vi) the economic and market outlook generally and for the mutual fund industry in particular, including the market-related events in 2008. In addition, the trustees conferred with, and reviewed the Management Fee Evaluation (the "Fee Evaluation") prepared by the Trust's chief compliance officer, who also serves as the Trust's "Senior Officer," as contemplated by the Assurance of Discontinuance dated February 9, 2005 among affiliates of CWAM and the Office of the New York Attorney General. A summary of the Fee Evaluation is included in this report. Throughout the annual contract renewal process, the tr ustees had the opportunity to ask questions of and request additional materials from CWAM.
The Committee held meetings in May 2009 and reported its recommendations to the full board of trustees. On June 10, 2009, the board of trustees unanimously approved continuation through July 31, 2010 of (i) the Advisory Agreement and (ii) the Trust's administrative services agreement with CWAM (the "Administration Agreement").
In considering the continuation of the Advisory Agreement and the continuation of the amended Administration Agreement, the trustees reviewed and analyzed various factors that they determined were relevant, including the factors described below, none of which by itself was considered dispositive. However, the material factors and conclusions that formed the basis for the trustees' determination to approve the continuation of the Advisory Agreement and the amended Administration Agreement are discussed separately below.
Nature, quality and extent of services. The trustees reviewed the nature, quality and extent of the services of CWAM and its affiliates to the Funds, taking into account the investment objective and strategy of each Fund and knowledge gained from meetings with management, which were held on at least a quarterly basis. In addition, the trustees reviewed the available resources and key personnel of CWAM and its affiliates, especially those providing investment management services to the Funds. The trustees also considered other services provided to the Funds by CWAM and its affiliates, including: managing the execution of portfolio transactions and selecting broker-dealers for those transactions; monitoring adherence to the Funds' investment restrictions; producing shareholder reports; providing support services. for the board of trustees and committees of the board; communicating with shareholders; serving as the Funds' administrator; and overseeing the activities of the Funds' other service providers, including monitoring for compliance with various policies and procedures as well as applicable securities laws and regulations.
The trustees concluded that the nature, quality and extent of the services provided by CWAM and its affiliates to each Fund were appropriate and consistent with the terms of the Advisory Agreement and the Administration Agreement, and that the quality of those services had been consistent with or superior to quality norms in the industry. The trustees further concluded that the Funds were likely to benefit from the continued provision of those services by CWAM to the Funds. They also concluded that CWAM currently had sufficient personnel, with appropriate education and experience, to serve the Funds effectively, and had demonstrated its continuing ability to attract and retain well qualified personnel.
Performance of the Funds. At various meetings of the board of trustees, the Committee and the Investment Performance Committee of the board, the trustees considered the short-term and longer-term performance of each Fund. They reviewed information comparing each Fund's performance with that of its benchmark(s) and with the performance of comparable funds and peer groups as identified by Lipper Inc. ("Lipper") and Morningstar, Inc. ("Morningstar"). On the domestic side, the trustees discussed that each of Wanger USA and Wanger Select had a particularly difficult performance year during 2008, which the trustees acknowledged. In that regard, Wanger USA and Wanger Select both underperformed their respective benchmarks and peer group averages for the five-year period. In evaluating the underperformance of these two Funds, the trustees considered that CWAM was taking steps to remediate the underperformance, which the trustees would monitor. The trustees also reviewed the performance of the international Funds, discussing how both Wanger International and Wanger International Select continued to outperform their benchmarks and the majority of their peer groups established by Lipper and Morningstar over the five-year period. During the annual contract renewal process, the trustees concluded that, although past performance is not necessarily indicative of future results, the international Funds' strong overall longer-term performance record was an important factor in the their evaluation of the quality of services provided by CWAM under the Advisory Agreement.
Costs of Services and Profits Realized by CWAM. At various Committee and board of trustees meetings and other informal meetings, the trustees examined detailed information on the fees and expenses of each Fund in comparison to information for other comparable funds provided by Lipper and Morningstar. As noted in the Fee Evaluation, the contractual rates of investment advisory fees and the actual advisory fees paid by Wanger Select and Wanger USA were higher than the median advisory fee rates of their
22
Wanger International Select 2009 Semiannual Report
Wanger Advisors Trust Board Approval of the Advisory Agreement 2009
respective peer groups. The trustees also considered the advisory fees of the Funds relative to those of the series of Columbia Acorn Trust ("Acorn"), a group of funds with similar investment strategies also overseen by the trustees and managed by CWAM. The trustees noted that the Funds' advisory fees were comparable to those of the Acorn funds.
The trustees reviewed the analysis of the profitability of CWAM in serving as each Fund's investment adviser and of CWAM and its affiliates in their relationships with each Fund, as well as an explanation of the methodology utilized in allocating various expenses among the Funds and other business units, each of which was included in the Fee Evaluation. The trustees considered the methodology used by CWAM in determining compensation payable to portfolio managers and the competitive market for investment management talent. They discussed how profitability comparisons among fund managers are not very meaningful due to the small number of publicly-owned managers, and how the profitability of any investment manager is affected by numerous factors, including its particular organizational structure, the types of funds and other accounts managed, other lines of business, expense allocation methodology, capital structure and cost of cap ital.
The trustees also reviewed the advisory fees charged by CWAM for managing other investment companies, sub-advised funds and other institutional separate accounts, as detailed in the Fee Evaluation. CWAM's institutional separate account fees for various investment strategies were examined and in some cases those fees were higher than the advisory fees charged to the Funds, and in some instances the Funds' fees were higher. The trustees noted that CWAM performs significant additional services for the Funds that it does not provide to sub-advised funds or non-mutual fund clients, including administrative services, oversight of the Funds' other service providers, trustee support, regulatory compliance and numerous other services, and that, in servicing the Funds, CWAM assumes many legal risks that it does not assume in servicing many of its other clients. Finally, as part of the annual contract renewal process, the trustees consider ed CWAM's financial condition as a result of market-related declines in assets in 2008 and 2009, and the possible impending sale of Bank of America's controlling interest in CWAM.
The trustees concluded that the rates of advisory fees and other compensation payable by the Funds to CWAM and its affiliate's were reasonable in relation to the nature and quality of the services to be provided, taking into account the fees charged by other advisers for managing comparable mutual funds with similar strategies and the fees CWAM charges to other clients. The trustees also concluded that the Funds' estimated overall expense ratios were reasonable, considering the quality of services provided by CWAM and its affiliates and the investment performance of the Funds.
Economies of Scale. At various meetings throughout the annual contract renewal process, the trustees considered information about the extent to which CWAM realizes economies of scale in connection with the increase of Fund assets. The trustees noted that the advisory fee schedule for each Fund includes breakpoints in the rate of fees at various asset levels. They noted that the Funds also share directly in economies of scale through lower charges by third party service providers based on the combined scale of all of the Funds. The trustees concluded that the current fee structure of each Fund was reasonable and reflective of a sharing between CWAM and the Funds of economies of scale.
Other Benefits to CWAM. The trustees also reviewed benefits that accrue to CWAM and its affiliates from their relationships with the Funds, as outlined in the Fee Evaluation. They noted that the Funds' transfer agent and distributor were each affiliates of CWAM and that the transfer agent received compensation from the Funds for services provided. The trustees considered ways, other than the services provided by CWAM and its affiliates pursuant to various agreements and the fees to be paid by each Fund therefor, that the Funds and CWAM may potentially benefit from their relationship with each other. At various Committee meetings, the trustees also considered CWAM's use of commissions paid by each Fund on its portfolio brokerage transactions to obtain research products and services benefiting the Fund and/or other clients of CWAM. They determined that CWAM's use of the Funds' "soft" commission dollars to obtain research products and services was consistent with regulatory requirements and guidance then in effect. They also concluded that CWAM benefits from the receipt of proprietary research products and services acquired through commissions paid on portfolio transactions of the Funds, and that the Funds benefit from CWAM's receipt of those products and services as well as research products and services acquired through commissions paid by other clients of CWAM. The trustees further determined that the success of any Fund could attract other business to CWAM or the Funds and that the success of CWAM could enhance its ability to serve the Funds.
After full consideration of the above factors, as well as other factors that were instructive in evaluating the Advisory Agreement, the trustees, including the Independent Trustees, concluded that the continuation of the Advisory Agreement and continuation of the Administration Agreement was in the best interest of each Fund. On June 10, 2009, the trustees approved continuation of the Advisory Agreement and the Administration Agreement , as so amended, through July 31, 2010.
23
Wanger International Select 2009 Semiannual Report

Columbia Wanger Funds
Trustees
Robert E. Nason*
Chairman of the Board
Allan B. Muchin
Vice Chairman of the Board
Laura M. Born
Michelle L. Collins
Maureen M. Culhane
Margaret M. Eisen
Jerome Kahn, Jr.
Steven N. Kaplan
David C. Kleinman
Charles P. McQuaid
James A. Star
Ralph Wanger
John A. Wing
Officers
Charles P. McQuaid
President
Ben Andrews
Vice President
Michael G. Clarke
Assistant Treasurer
Jeffrey R. Coleman
Assistant Treasurer
P. Zachary Egan
Vice President
Peter T. Fariel
Assistant Secretary
John M. Kunka
Assistant Treasurer
Joseph C. LaPalm
Vice President
Bruce H. Lauer
Vice President, Secretary and Treasurer
Louis J. Mendes III
Vice President
Robert A. Mohn
Vice President
Christopher J. Olson
Vice President
Robert P. Scales
Chief Compliance Officer, Chief Legal Officer, Senior Vice President and General Counsel
Linda K. Roth-Wiszowaty
Assistant Secretary
*Deceased, June 27, 2009.
Transfer Agent,
Dividend Disbursing Agent
Columbia Management Services, Inc.
P.O.Box 8081
Boston, Massachusetts
02266-8081
Distributor
Columbia Management Distributors, Inc.
One Financial Center
Boston, Massachusetts
02111-2621
Investment Advisor
Columbia Wanger Asset Management, L.P.
227 West Monroe Street, Suite 3000
Chicago, Illinois 60606
1-888-4-WANGER
(1-888-492-6437)
Legal Counsel to the Fund
K&L Gates LLP
Washington, DC
Legal Counsel to the Independent Trustees
Drinker Biddle & Reath LLP
Philadelphia, Pennsylvania
Independent Registered Public Accounting Firm
PricewaterhouseCoopers LLP
Chicago, Illinois
This report, including the schedules of investments and financial statements, is submitted for the general information of the shareholders of the Wanger Advisors Trust.
A description of the Fund's proxy voting policies and procedures and a copy of the Fund's voting record for the most recent 12-month period ended June 30 are available (i) on the Securities and Exchange Commission's website at www.sec.gov, and (ii) without charge, upon request, by calling 888-492-6437.
The Fund files a complete schedule of portfolio holdings with the SEC for the first and third quarters of each fiscal year on Form N-Q. The Fund's Form N-Q is available on the SEC's website at www.sec.gov and may be reviewed and copied at the SEC's Public Reference Room in Washington, D.C. Information on the operation of the Pubic Reference Room may be obtained by calling 800-SEC-0330.
24
Columbia Wanger Funds
0L2568S
SHC-44/20101-0609 09/87168
Wanger International
2009 Semiannual Report
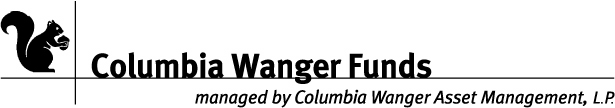
| NOT FDIC INSURED | May Lose Value | ||||||
| NOT BANK ISSUED | No Bank Guarantee | ||||||
Wanger International 2009 Semiannual Report
Robert E. Nason Remembered

Robert E. Nason
On June 27, 2009, Wanger Advisors Trust Board of Trustees chairman Robert E. Nason passed away. Bob was a man of great personal integrity who maintained the independence of the Board and worked to promote the interests of shareholders. He served as chairman of the Wanger Advisors Trust Board from September 2006 until his death.
Bob brought impressive credentials to the Board. He served as CEO of the accounting firm Grant Thornton where he worked for 40 years.
Bob's tenure as chairman occurred during a period of change in the investment environment. Throughout, he served our shareholders well. As regulators pushed mutual fund boards toward more independence from fund advisors, Bob successfully maintained the Wanger Advisors Trust Board's history of independence. The Trust's advisor, Columbia Wanger Asset Management (CWAM), was also faced with ownership changes and the retirement of founder Ralph Wanger. Following these events, Bob and the Board saw to it that CWAM stayed the course, maintaining its time-tested investment process, developing and keeping talented investment professionals, and sustaining its autonomous and creative environment. Under Bob's leadership, the Board implemented fee breakpoints, allowing shareholders to benefit from growth and economies of scale. After intensive analysis, Bob and the Board also successfully initiated securities lending.
Bob is survived by his wife Carol, son Steven (Abbie Baynes), daughter Jill and grandchildren Sara and Ben. We are fortunate to have known Bob and we will miss him. He was a man of great vision and we will strive to build on the momentum that he created and to maintain the legacies of the Wanger Advisors Trust.

Allan Muchin
Vice Chairman of the Board of Trustees
Wanger Advisors Trust

Charles McQuaid
President and Chief Investment Officer
Columbia Wanger Asset Management, L.P.

Wanger International
2009 Semiannual Report
Table of Contents
| 2 | Understanding Your Expenses | ||||||
| 3 | Agriculture's Amazing Progress | ||||||
| 6 | Performance Review | ||||||
| 8 | Statement of Investments | ||||||
| 16 | Statement of Assets and Liabilities | ||||||
| 16 | Statement of Operations | ||||||
| 17 | Statement of Changes in Net Assets | ||||||
| 18 | Financial Highlights | ||||||
| 19 | Notes to Financial Statements | ||||||
| 23 | Management Fee Evaluation of the Senior Officer | ||||||
| 27 | Wanger Advisors Trust Board Approval of the Advisory Agreement 2009 | ||||||
Columbia Wanger Asset Management, L.P. ("CWAM") is one of the leading global small- and mid-cap equity managers in the United States with nearly 40 years of small- and mid-cap investment experience. As of June 30, 2009, CWAM manages $21.3 billion in assets and is the investment advisor to Wanger USA, Wanger International, Wanger Select, Wanger International Select (together, the "Columbia Wanger Funds") and the Columbia Acorn Family of Funds. Columbia Management Group, LLC ("Columbia Management") is the investment management division of Bank of America Corporation. Columbia Management entities furnish investment management services and products for institutional and individual investors. The Columbia Wanger Funds and the Columbia Acorn Family of Funds (together with other funds ad vised by Columbia Management affiliates, the "Columbia Funds") are distributed by Columbia Management Distributors, Inc., member of FINRA, SIPC, part of Columbia Management and an affiliate of Bank of America Corporation. CWAM is a registered investment advisor and an indirect, wholly owned subsidiary of Bank of America Corporation. CWAM is part of Columbia Management.
Please consider the investment objectives, risks, charges and expenses for the Fund carefully before investing. Contact 1-888-4-WANGER for a prospectus, which contains this and other important information about the Fund. You should read it carefully before you invest.
An important note: Columbia Wanger Funds are sold only to certain life insurance companies in connection with certain variable annuity contracts, variable life insurance policies and eligible qualified retirement plans.
The views expressed in "Agriculture's Amazing Progress" and in the Performance Review reflect the current views of the respective authors. These views are not guarantees of future performance and involve certain risks, uncertainties and assumptions that are difficult to predict so actual outcomes and results may differ significantly from the views expressed. These views are subject to change at any time based upon economic, market or other conditions and the respective authors disclaim any responsibility to update such views. These views may not be relied on as investment advice and, because investment decisions for a Columbia Fund are based on numerous factors, may not be relied on as an indication of trading intent on behalf of any particular Columbia Fund. References to specific company securities should not be construed as a recommendation or investment advice.
1
Wanger International 2009 Semiannual Report
Understanding Your Expenses
As a Fund shareholder, you incur two types of costs. There are transaction costs, which generally include sales charges on purchases and may include redemption or exchange fees. There are also ongoing costs, which generally include investment advisory fees and other Fund expenses. The information on this page is intended to help you understand your ongoing costs of investing in the Fund and to compare these costs with the ongoing costs of investing in other mutual funds.
Analyzing your Fund's expenses
To illustrate these ongoing costs, we have provided an example and calculated the expenses paid by investors in the Fund during the period. The information in the following table is based on an initial, hypothetical investment of $1,000, which is invested at the beginning of the period and held for the entire period. Expense information is calculated two ways and each method provides you with different information. The amount listed in the "Actual" column is calculated using actual operating expenses and total return for the Fund. The amount listed in the "Hypothetical" column assumes that the return each year is 5% before expenses and then applies the Fund's actual expense ratio for the period to the hypothetical return. You should not use the hypothetical account values and expenses to estimate either your actual account balance at the end of the period or the expenses you paid during the period. See the "Compare with other fu nds" information for details on using the hypothetical data.
Estimating your actual expenses
To estimate the expenses that you actually paid over the period, first you will need your account balance at the end of the period.
1. Divide your ending account balance by $1,000. For example, if an account balance was $8,600 at the end of the period, the result would be 8.6.
2. In the section of the table below titled "Expenses paid during the period," you will find a dollar amount in the column labeled "Actual." Multiply this amount by the result from step 1. Your answer is an estimate of the expenses you paid on your account during the period.
January 1, 2009 – June 30, 2009
| Account value at the beginning of the period ($) | Account value at the end of the period ($) | Expenses paid during the period ($) | Fund's annualized expense ratio (%)* | ||||||||||||||||||||||||||||
| Actual | Hypothetical | Actual | Hypothetical | Actual | Hypothetical | Actual | |||||||||||||||||||||||||
| Wanger International | 1,000.00 | 1,000.00 | 1,201.68 | 1,019.34 | 6.00 | 5.51 | 1.10 | ||||||||||||||||||||||||
*For the six months ended June 30, 2009.
Expenses paid during the period are equal to the Fund's annualized expense ratio, multiplied by the average account value over the period, then multiplied by the number of days in the Fund's most recent fiscal half-year and divided by 365.
It is important to note that the expense amounts shown in the table are meant to highlight only ongoing costs of investing in the Fund. Expenses paid during the period do not include any insurance charges imposed by your insurance company's separate account. The hypothetical example provided is useful in comparing ongoing costs only and will not help you determine the relative total costs of owning different funds whose shareholders may incur transaction costs.
Compare with other funds
Since all mutual funds are required to include the same hypothetical calculations about expenses in shareholder reports, you can use this information to compare the ongoing cost of investing in the Fund with other funds. To do so, compare the 5% hypothetical example with the 5% hypothetical examples of other funds. As you compare hypothetical examples of other funds, it is important to note that hypothetical examples are meant to highlight the ongoing cost of investing in a fund and do not reflect any transaction costs, such as sales charges, redemption fees or exchange fees that may be incurred by shareholders of other funds. Expenses paid during the period do not include any insurance charges imposed by your insurance company's separate accounts.
2
Wanger International 2009 Semiannual Report

Agriculture's Amazing Progress
Following a conversation with two of our analysts regarding the prospects for several fertilizer companies, I decided to learn more about the history and current state of agriculture. According to Marcel Mazoyer and Laurence Roudart's, A History of World Agriculture,1 farming began about 10,000 years ago. One would think that mankind is far down the learning curve in agriculture, and that productivity gains are ending. Surprisingly, quite the opposite is true. Most of the improvements in agriculture have occurred in the last 80 years.
Mazoyer and Roudart's history explains six dominant agricultural processes. The first two of these were employed during the first 8,000 years of agricultural history, obviously a time of very slow progress. Agriculture began with slash and burn techniques, whereby forest segments were successively burned and farmed for a few years until nutrients were depleted. Then, beginning in about 2500 B.C., farmers began using animal drawn scratch-plows and annually rotating land from planted to fallow in an attempt to maintain soil fertility. Other than in exceptionally fertile areas such as the lands replenished by the Nile River, these techniques barely enabled one farmer to feed one family.
Medieval farmers utilized better tools and techniques. They kept more animals and, with the help of wheeled carts and plows, used more animal-based fertilizers. Beginning in the sixteenth century, farmers began planting legumes to enhance nitrogen in the soil, further improving fertility by organic means and eliminating the need for fallowing. Productivity per farmer doubled with each of these developments, enabling the best farmers by the eighteenth century to feed an average of 20 people.
Farms became more mechanized after 1800, using metal plows, sowers, reapers and threshing machines. Transportation also improved allowing better fertilizers, that contained minerals like phosphate and potassium, to reach farmers. These minerals along with nitrogen helped to sustain crop yields. While mechanization doubled the acreage a farmer could cultivate, United States Department of Agriculture (USDA) data indicates that yields per acre of corn and wheat in the United States were flat from 1866, the date of data inception, well into the 1930s.
In the first half of the twentieth century, North American farmers started using motorized equipment, synthetic fertilizers and hybrid seeds. According to Giovanni Federico's, Feeding the World,2 by 1950 farms in the United States and Canada had one tractor for every two farmers. Utilization of fertilizer grew six fold from 1900 to 1950. Hybrid wheat was grown on 87% of the planted acres in the United States in 1921, up from 14% in 1914. Hybrid corn crops jumped from 2% to 90% of acres planted from 1936 to 1945.3
After World War II these innovations spread. Worldwide chemical fertilizer usage grew nearly tenfold from 1950 to 2000. In most continents, over half of wheat, rice and corn acres were sown with high yield varieties by the year 2000. From 1950 to 2000, world agriculture production tripled, far outpacing population growth.4 USDA data indicates that from 1998 to 2008, wheat yields per acre averaged 41 bushels, triple the rate of 100 years ago, and corn yields quintupled to an average of 144 bushels. The best equipped farmers can now produce over four million pounds of grain and feed thousands!5
Launching a "Green Revolution" in Developing Countries
Rich countries had the means to adopt modern agricultural processes while poor regions struggled to advance. Leon Hesser's book, The Man Who Fed the World,6 describes how Dr. Norman Borlaug helped create the Green Revolution7 in many developing countries by improving plant varieties and increasing crop yields. For his efforts, Borlaug won a Nobel Peace Prize, the only one awarded in the twentieth century for work in agriculture.
Mexico redistributed land to poor peasants after its political revolution ended in 1918. However, its peasants remained poor and hungry for decades. In 1940, U.S. vice president elect, Henry Wallace, who had founded Hi-Bred Corn Company (now Pioneer Hi-Bred, a DuPont subsidiary), toured Mexico and was appalled by conditions there. He convinced the Rockefeller Foundation to sponsor efforts to adapt hybrid wheat and corn for Mexico and in 1943, the Mexican Government-Rockefeller Foundation Cooperative Agricultural Program was established.
The program hired Borlaug as its plant pathologist. Borlaug learned that a plant disease called wheat stem rust had halved Mexico's wheat production from 1939 to 1942. He set out to create high yielding hybrid wheat that was resistant to the disease. His program introduced three innovations. First, he planted successive hybrid crops in two locations each year, which both doubled the pace of progress and resulted in crops tolerant to varying conditions. Next, Borlaug crossed thousands of varieties of wheat, working to find the most resistant hybrids. He eventually developed 40 rust resistant varieties.
Third, Borlaug changed the architecture of wheat. He knew that many wheat varieties responded well to fertilizer but when yields exceeded roughly two tons per acre, plants became top-heavy and collapsed. Borlaug crossed over 20,000 varieties of wheat from around the world in his efforts to create high yielding wheat with shorter, stronger stems. He finally succeeded in 1953 by crossing rust-resistant Mexican seeds with Japanese dwarf wheat. Under ideal
3
Wanger International 2009 Semiannual Report
conditions, four tons of wheat per acre could be achieved. Mexico became self sufficient in wheat in 1956.
Having achieved success in Mexico, the Rockefeller Foundation pursued progress elsewhere, in partnership with the Ford Foundation, the United Nations and local governments. Pakistan and India were major beneficiaries. By 1970, 55% of Pakistan's wheat acreage and 35% of India's wheat acreage were sown with Mexican varieties. The Rockefeller and Ford Foundations also created the International Rice Research Institute, which began in 1960. By 1966 it developed a sturdy short-stemmed rice plant that, when fertilized sufficiently, yielded two- to three-times the rice it replaced. This rice was quickly adopted in India.
Borlaug was personally involved with the implementation of these programs. He understood that in addition to better seeds, farmers need fertilizer, credit and fair prices for their crops. Governments largely complied. As a result of the Green Revolution, many developing countries were substantial contributors to world agricultural growth.
Recent Conditions and Future Prospects
After reading so much about the amazing progress that has been made in agriculture, it was somewhat surprising to find an article in the June 2009 National Geographic titled, "The End of Plenty, The Global Food Crisis." It noted that global grain consumption exceeded production for seven of the last nine years and grain stockpiles plunged to a 20-year low of 61-days supply in 2007 prior to recovering to a meager 70-days supply in 2008. The price of wheat and corn tripled from 2005 to 2008, and the price of rice quintupled.
Demand recently grew more quickly than supply for several reasons. First, people in developing countries are becoming more prosperous and are eating more meat, causing grain consumption by livestock to rise rapidly. Second, use of ethanol as a gasoline additive or substitute has jumped. Some 30% of the 2008 U.S. corn crop was converted to ethanol instead of being available as food. Third, while world grain production hit records in 2008, growth in grain production has slowed somewhat since the year 2000 compared to prior decades.
Still, agriculture continues to find ways to meet the rising demand. Advancements in hybrid crops continue, and biotechnology is now creating crops with whole new characteristics. While conventional plant breeding is limited to crossing closely related species, biotech methods utilize genes from distant species. To date, two types of biotech crops have been commercialized, those resistant to herbicides and those resistant to insects.
Biotech crops were first made available in 1996 and by 2008 were planted in over 300 million acres, some 8% of global cropland in 25 countries, including 15 developing countries. That year, 85% of the corn crop in the United States came from biotech seeds. Farmers seem satisfied with biotech crops; nearly 100% keep planting biotech once they begin.8 Use of biotech versions of soybean, cotton, corn, canola and other crops increased farm income an estimated $10 billion in 2007 and biotech corn and soybean yields appear to be roughly 10% higher than conventional crops.9 The National Geographic story quotes a scientist with agricultural company Monsanto who predicts that biotechnology will double corn, soybean and cotton yields by 2030.
National Geographic also pointed out the downside of the Green Revolution. Yields in India have flattened since the mid-90s, and hybrid plant needs for water, fertilizer and pesticides have resulted in aquifer depletion, salinized soils and contamination of drinking water. However, new versions of biotech plants are in development, including versions likely to provide still higher yields, drought tolerance and salinized soil tolerance.
Not everyone agrees with the use of biotech crops. Critics have expressed doubts about productivity gains and have concerns about the possibility of a "Frankenfood" becoming toxic or creating an ecological disaster should some new plant become invasive. But numerous safeguards are in place, including rigorous approval processes. Countries that had prohibited biotech crops are now slowly introducing them. Increased adoption of biotech plants has had positive ecological effects, as higher yields reduce needs for additional crop acres and related deforestation, insect resistance reduces needs for pesticides, and herbicide resistance reduces fuel consumption and soil erosion by requiring less tillage.
Mankind's progress in agriculture has been truly amazing. We cannot revert back to previous agricultural processes, which are insufficient to feed a worldwide population of 6.7 billion. Instead, substantial investments in agriculture, and judicious use of new technologies, are needed to maintain impressive production gains in the future.
Columbia Wanger Funds News
Resumption of Securities Lending
The Columbia Wanger Funds restarted securities lending during the second quarter. The domestic Funds briefly participated in securities lending in the third quarter of last year but suspended lending activities due to the turmoil in the financial markets at that time. As market conditions have stabilized somewhat, the Wanger Advisors Trust Board and CWAM made the decision to begin securities lending again in June.
Securities lending has come under media scrutiny recently so we want to clearly state how CWAM administers the lending program. Fund shareholders receive all of the
4
Wanger International 2009 Semiannual Report
income generated by our lending program, net of modest fees charged by the lending agent to operate the program. The securities lending income benefits Fund shareholders by offsetting a portion of the Fund's operating expenses, which increases the Fund's total returns. The advisor charges no additional fees for administering this program.
Securities lending is the temporary lending of the Fund's portfolio securities to broker/dealers and other institutional investors. The Fund retains the benefits of owning the securities, including receipt of dividends or interest generated by the security. The Fund also receives a fee for the loan. The Fund may recall the loans at any time and may do so in order to vote proxies or to sell the loaned securities. Furthermore, borrowers provide the Fund with cash collateral that exceeds the value of the securities on loan. The Fund could lose money if it incurred a loss on the reinvestment of the cash collateral. To minimize this risk, cash collateral for the program is invested in the Dreyfus Government Cash Management Fund, a money market mutual fund. The securities lending agent is Goldman Sachs Agency Lending. Thus far, shareholders have received modest benefits and incurred no losses from the program.


Charles P. McQuaid
President and Chief Investment Officer
Columbia Wanger Asset Management, L.P.
The information and data provided in this analysis are derived from sources that we deem to be reliable and accurate. These views are not guarantees of future performance and involve certain risks, uncertainties and assumptions that are difficult to predict so actual outcomes and results may differ significantly from the views expressed. The views/opinions expressed in "Agriculture's Amazing Progress" are those of the author and not of the Wanger Advisors Trust Board, are subject to change at any time based upon economic, market or other conditions, may differ from views expressed by other Columbia Management associates or other divisions of Bank of America and the respective parties disclaim any responsibility to update such views. These views may not be relied on as investment advice and, because investment decisions for a Columbia Wanger Fund are based on numerous factors, may not be relied on as an indication of trading i ntent on behalf of any particular Columbia Wanger Fund.
1 Mazoyer, Marcel and Roudart, Laurence, A History of World Agriculture, (New York, NY, Monthly Review Press, 2006).
2 Federico, Giovanni, Feeding The World, (Princeton and Oxford, Princeton University Press, 2005).
3 Ibid, pg. 97.
4 Ibid, pgs. 55, 19.
5 Mazoyer, Marcel and Roudart, Laurence, op. cit., pg 11.
6 Hesser, Leon, The Man Who Fed The World, (Dallas, TX, Durban House, 2006).
7 The Green Revolution is defined by Mazoyer and Roudart as, "a variant of the contemporary agricultural revolution but without the large-scale motorization and mechanization, developed widely in the developing countries."
8 ISAAA Brief 39-2008: Executive Summary, "Global Status of Commercialized Biotech/GM Crops: 2008, The First Thirteen Years, 1996 to 2008," available at www.isaaa.org.
9 "GM crops: global, socio-economic and environmental impacts 1996-2007," a research paper written by Graham Brookes and Peter Barfoot of PG Economics Ltd, Dorchester, U.K., May 2009.
5
Wanger International 2009 Semiannual Report

Performance Review Wanger International
 |  | ||||||
| Louis J. Mendes III Co-Portfolio Manager | Christopher J. Olson Co-Portfolio Manager | ||||||
Performance data quoted represents past performance and current performance may be lower or higher. Past performance is no guarantee of future results. The investment return and principal value will fluctuate so that shares, when redeemed, may be worth more or less than the original cost. For daily and most recent month-end performance updates, please call 1-888-4-WANGER.
Wanger International ended the semiannual period up 20.17%, 4.37% behind its primary benchmark, the S&P Global Ex-U.S. Between $500 Million and $5 Billion Index. Small-cap international stocks outperformed larger-cap stocks. The large-cap focused MSCI EAFE Index was up just 7.95% year to date.
While coming on the heels of a severe sell-off in 2008, an absolute return north of 20% is certainly pleasing. A remarkable reversal in market sentiment came in the second half of the period and appears to reflect decreasing anxiety about our economic future as credit markets show signs of life, in a context of attractive valuations. While the stock market has historically done a good job of anticipating changes in economic fundamentals by several quarters, it is worth noting that the majority of the companies we follow have reported few sightings of "green shoots" presaging a return to global growth. Indeed, the International Monetary Fund expects global economic activity to contract by 1.4% in 2009 before expanding 2.5% in 2010. The major exeption to this has been the emerging markets of non-Japan Asia and Latin America. In these economies the sentiment is now distinctly upbeat. The rapid implementation of a sizeable governmen t stimulus package in China, and an election outcome in India perceived to endorse further economic liberalization, drove this enthusiasm.
While still making a positive contribution to absolute return, the Fund's health care stocks failed to keep up with a buoyant market. These companies' fortunes tend to be less correlated with actual or perceived changes in economic activity. Japanese holdings were a drag on absolute return in the half year, but keep in mind that Japan fell substantially less than most regions in 2008 and, therefore, had less ground to make up.
The Fund's holdings in the United Kingdom and Ireland fell short in the half year. The Fund held large positions in Serco and Capita Group, service providers with highly predictable revenues and considerable exposure to government contracts. Their comparatively low risk profiles proved to be a liability in an environment in which the riskiest stocks rallied the most.
Investments in emerging markets, which constitute about one quarter of the Fund's assets, posted the strongest returns, with the Fund's holdings in Asia ex-Japan up 42% year to date. The Fund's Indian stocks were up more than 60% in the first half. Educomp Solutions provides multimedia educational content to Indian classrooms and was a recent addition to the portfolio. Its stock provided a 97% gain. Housing Development Finance, an Indian mortgage lender, was also strong in the half, gaining 56%. Consumer stocks in developing markets, a long-time theme in the Fund, were also notable standouts. RexLot Holdings, which provides systems and services to the Chinese lottery market, tripled after several punishing quarters on evidence of tangible progress in its core business. Its stock was up 224% year to date.
On earnings adjusted for cyclicality and on other valuations measures, we believe that international small-cap stocks now trade at a modest discount to their 10-year average.
International investing involves special risks, including foreign taxation, currency risks, risks associated with possible differences in financial standards and other risks associated with future political and economic developments. Stocks of small- and mid-cap companies pose special risks, including possible illiquidity and greater price volatility than stocks of larger, more established companies. Investing in emerging markets may involve greater risks than investing in more developed countries. In addition, concentration of investments in a single region may result in greater volatility.
Portfolio holdings are subject to change periodically and may not be representative of current holdings.
Fund's Positions in Mentioned Holdings
As a percentage of net assets, as of 6/30/09
| Serco | 1.3 | % | |||||
| Capita Group | 1.2 | ||||||
| Educomp Solutions | 1.0 | ||||||
| Housing Development Finance | 0.7 | ||||||
| RexLot Holdings | 0.6 | ||||||
6
Wanger International 2009 Semiannual Report
Growth of a $10,000 Investment in Wanger International
May 3, 1995 (inception date) through June 30, 2009
Performance data quoted represents past performance and current performance may be lower or higher. Past performance is no guarantee of future results. The investment return and principal value will fluctuate so that shares, when redeemed, may be worth more or less than the original cost. Performance results may reflect any fee waivers or reimbursements of fund expenses by the investment advisor and/or any of its affiliates. Absent these fee waivers or expense reimbursement arrangements, performance results would have been lower. For daily and most recent month-end performance updates, please call 1-888-4-WANGER.
This graph compares the results of $10,000 invested in Wanger International on May 3, 1995 (the date the Fund began operations) through June 30, 2009, to the S&P Global Ex-U.S. Between $500 Million and $5 Billion Index with dividends and capital gains reinvested. Although the index is provided for use in assessing the Fund's performance, the Fund's holdings may differ significantly from those in the index.
Top 10 Holdings
As a percentage of net assets, as of 6/30/09
| 1. Naspers Media in Africa & Other Emerging Markets – South Africa | 1.7 | % | |||||
| Agriculture Supply Chain Manager – Singapore | 1.6 | ||||||
| 3. Kansai Paint Paint Producer in Japan, India, China & Southeast Asia – Japan | 1.4 | ||||||
| 4. Hong Kong Exchanges and Clearing Hong Kong Equity & Derivatives Market Operator – Hong Kong | 1.3 | ||||||
| 5. Serco Facilities Management – United Kingdom | 1.3 | ||||||
| 6. Capita Group White Collar, Back Office Outsourcing – United Kingdom | 1.2 | ||||||
| 7. Intertek Group Testing, Inspection & Certification Services – United Kingdom | 1.1 | ||||||
| 8. Localiza Rent A Car Car Rental – Brazil | 1.1 | ||||||
| 9. Imtech Engineering & Technical Services – Netherlands | 1.1 | ||||||
| 10. Hexagon Measurement Equipment – Sweden | 1.1 | ||||||
Top 5 Countries
As a percentage of net assets, as of 6/30/09
| Japan | 18.0 | % | |||||
| United Kingdom | 8.3 | ||||||
| Netherlands | 6.0 | ||||||
| China | 5.7 | ||||||
| Germany | 5.0 | ||||||
Results as of June 30, 2009
| 2nd quarter | Year to date | 1 year | 5 year | 10 year | |||||||||||||||||||
| Wanger International | 32.13 | % | 20.17 | % | -27.89 | % | 8.42 | % | 8.11 | % | |||||||||||||
| S&P Global Ex-U.S. Between $500 Million and $5 Billion Index | 34.15 | 24.54 | -26.45 | 7.13 | 6.80 | ||||||||||||||||||
| S&P Global Ex-U.S. SmallCap Index | 35.88 | 24.20 | -29.89 | 5.69 | 5.95 | ||||||||||||||||||
| MSCI EAFE Index | 25.43 | 7.95 | -31.35 | 2.31 | 1.18 | ||||||||||||||||||
| Lipper Variable Underlying International Core Funds Index | 22.81 | 5.73 | -33.10 | 2.00 | -0.10 | ||||||||||||||||||
NAV as of 6/30/09: $24.18
Performance numbers reflect all Fund expenses but do not include any insurance charge imposed by your insurance company's separate accounts. If performance results included the effect of these additional charges, it would be lower.
The Fund's annual operating expense ratio is 1.02%. The annual operating expense ratio is as stated in the Fund's prospectus that is current as of the date of this report. Differences in expense ratios disclosed elsewhere in this report may result from including fee waivers and expense reimbursements, if any, as well as different time periods used in calculating the ratios.
All results shown assume reinvestment of distributions and do not reflect taxes that a shareholder would pay on Fund distributions or the sale of Fund shares.
The S&P Global Ex-U.S. Between $500 Million and $5 Billion Index, the Fund's primary benchmark, is a subset of the broad market selected by the index sponsor representing the mid- and small-cap developed and emerging markets, excluding the United States. The S&P Global Ex-U.S. SmallCap Index is an unmanaged index consisting of the bottom 20% of institutionally investable capital of developed and emerging countries, outside the United States. The Morgan Stanley Capital International Europe, Australasia, Far East (MSCI EAFE) Index is a capitalization-weighted index that tracks the total return of common stocks in 21 developed-market countries within Europe, Australasia and the Far East. The Lipper Variable Underlying International Core Funds Index is an equally weighted representation of the 30 largest variable insurance underlying funds in the Lipper Variable Underlying International Core Funds Classification. Indexes are not managed and do not incur fees or expenses. It is not possible to invest directly in an index.
Portfolio characteristics and holdings are subject to change periodically and may not be representative of current characteristics and holdings.
Lipper Inc., a widely respected data provider in the industry, calculates an average total return (assuming reinvestment of distributions) for mutual funds with investment objectives similar to those of the fund. Lipper makes no adjustment for the effect of sales loads.
7
Wanger International 2009 Semiannual Report
Wanger International
Statement of Investments (Unaudited) June 30, 2009
| Number of Shares | Value | ||||||||||
| Common Stocks – 96.5% | |||||||||||
| Asia – 42.2% | |||||||||||
| Japan – 18.0% | |||||||||||
| 2,233,000 | Kansai Paint Paint Producer in Japan, India, China & Southeast Asia | $ | 15,987,418 | ||||||||
| 176,000 | Point Apparel Specialty Retailer | 9,449,078 | |||||||||
| 3,792 | Nippon Residential Investment Residential REIT | 9,324,990 | |||||||||
| 3,430 | Seven Bank ATM Processing Services | 8,968,665 | |||||||||
| 453,000 | Aeon Mall Suburban Shopping Mall Developer, Owner & Operator | 8,571,711 | |||||||||
| 991,000 | Kamigumi Port Cargo Handling & Logistics | 8,342,199 | |||||||||
| 10,500 | Jupiter Telecommunications Largest Cable Service Provider in Japan | 7,960,625 | |||||||||
| 1,500 | Osaka Securities Exchange Osaka Securities Exchange | 7,147,666 | |||||||||
| 413,900 | Aeon Delight Facility Maintenance & Management | 6,686,631 | |||||||||
| 728,400 | Asics Footwear & Apparel | 6,613,439 | |||||||||
| 585,400 | Rohto Pharmaceutical Health & Beauty Products | 6,604,661 | |||||||||
| 1,430 | Orix JREIT Diversified REIT | 6,546,045 | |||||||||
| 217,000 | Ibiden Electronic Parts & Ceramics | 6,061,725 | |||||||||
| 270,100 | Daiseki Waste Disposal & Recycling | 5,930,358 | |||||||||
| 294,900 | Glory Currency Handling Systems & Related Equipment | 5,833,811 | |||||||||
| 600,000 | Suruga Bank Regional Bank | 5,718,894 | |||||||||
| 238,500 | Kintetsu World Express Airfreight Logistics | 5,664,537 | |||||||||
| 187,700 | Unicharm PetCare Pet Food & Pet Toiletries | 5,603,257 | |||||||||
| 640 | Nippon Building Fund Office REIT | 5,477,305 | |||||||||
| 136,400 | Benesse Education Service Provider | 5,451,457 | |||||||||
| 2,550 | Wacom Computer Graphic Illustration Devices | 5,145,963 | |||||||||
| Number of Shares | Value | ||||||||||
| 322,000 | Ushio Industrial Light Sources | $ | 5,134,976 | ||||||||
| 222,000 | Ain Pharmaciez Dispensing Pharmacy/Drugstore Operator | 4,602,898 | |||||||||
| 1,000 | Fukuoka Diversified REIT in Fukuoka | 4,482,538 | |||||||||
| 196,000 | Miura Industrial Boiler | 4,366,301 | |||||||||
| 56,000 | Nakanishi Dental Tools & Machinery | 4,116,471 | |||||||||
| 1,000,000 | Chuo Mitsui Trust Holdings Trust Bank | 3,794,998 | |||||||||
| 256,500 | Zenrin Map Content Publisher | 3,790,671 | |||||||||
| 185,000 | Hamamatsu Photonics Optical Sensors for Medical & Industrial Applications | 3,526,597 | |||||||||
| 142,000 | Makita Power Tools | 3,419,947 | |||||||||
| 210,000 | Tamron Camera Lens Maker | 2,863,566 | |||||||||
| 133,400 | As One Scientific Supplies Distributor | 2,388,213 | |||||||||
| 507 | Nippon Accommodations Fund Residential REIT | 2,275,358 | |||||||||
| 34,100 | Toyo Tanso Carbon & Graphite Products for Industrial Use | 1,299,836 | |||||||||
| 34,000 | Tsumura Traditional Chinese/Japanese Herbal Rx Drugs (Kampo) | 1,059,450 | |||||||||
| 200,212,255 | |||||||||||
| China – 5.7% | |||||||||||
| 9,388,400 | China Green Chinese Fruit & Vegetable Grower & Processor | 9,851,503 | |||||||||
| Technology – ADR (a) | 142,000 China's Largest Private Education Service Provider | ||||||||||
| 283,500 | Mindray – ADR Medical Device Manufacturer | 7,915,320 | |||||||||
| 4,884,000 | China Yurun Food Meat Processor in China | 7,353,606 | |||||||||
| 80,000,000 | RexLot Holdings (a) Lottery Equipment Supplier in China | 6,291,397 | |||||||||
See accompanying notes to financial statements.
8
Wanger International 2009 Semiannual Report
Wanger International
Statement of Investments (Unaudited) June 30, 2009
| Number of Shares | Value | ||||||||||
| China – 5.7% (cont) | |||||||||||
| 4,474,000 | China Shipping Development China's Dominant Shipper for Oil & Coal | $ | 5,707,993 | ||||||||
| 6,984,000 | Jiangsu Expressway Chinese Toll Road Operator | 5,116,807 | |||||||||
| 4,580,000 | Fu Ji Food & Catering Services Food Catering Service Provider in China | 3,849,027 | |||||||||
| 1,500,000 | Shandong Weigao Vertically Integrated Hospital Consumable Manufacturer | 3,843,634 | |||||||||
| 335,000 | VisionChina Media – ADR (a) Advertising on Digital Screens in China's Mass Transit System | 2,046,850 | |||||||||
| 94,000 | ZhongDe Waste Technology Solid Municipal Waste & Medical Waste Incinerator Manufacturer | 1,706,874 | |||||||||
| 63,248,131 | |||||||||||
| Singapore – 4.3% | |||||||||||
| 10,500,000 | OLAM International Agriculture Supply Chain Manager | 17,556,357 | |||||||||
| 2,300,000 | Singapore Exchange Singapore Equity & Derivatives Market Operator | 11,236,683 | |||||||||
| 25,494,500 | Mapletree Logistics Asian Logistics Landlord | 9,727,972 | |||||||||
| 10,000,000 | CDL Hospitality Trust Hotel Owner/Operator | 5,703,990 | |||||||||
| 3,273,600 | Ascendas REIT Singapore Industrial Property Landlord | 3,583,523 | |||||||||
| 47,808,525 | |||||||||||
| South Korea – 4.0% | |||||||||||
| 83,000 | NHN (a) South Korea's Largest Online Search Engine | 11,468,502 | |||||||||
| 54,800 | MegaStudy Online Education Service Provider | 9,864,194 | |||||||||
| 100,000 | Taewoong Niche Customized Forging | 7,031,783 | |||||||||
| 127,000 | Mirae Asset Securities South Korean Largest Diversified Financial Company | 6,879,543 | |||||||||
| 262,000 | Woongjin Coway South Korean Household Appliance Rental Service Provider | 6,357,570 | |||||||||
| Number of Shares | Value | ||||||||||
| 206,000 | Sung Kwang Bend Custom Industrial Pipes | $ | 3,086,450 | ||||||||
| 44,688,042 | |||||||||||
| India – 3.9% | |||||||||||
| 132,000 | Educomp Solutions (a) Multimedia Educational Content | 10,361,664 | |||||||||
| 334,385 | Asian Paints India's Largest Paint Company | 8,179,659 | |||||||||
| 570,000 | Jain Irrigation Systems Agricultural Micro-irrigation Systems & Food Processing | 7,514,833 | |||||||||
| 150,000 | Housing Development Finance (a) Indian Mortgage Lender | 7,358,425 | |||||||||
| 460,000 | Mundra Port & Special Economic Zone Indian West Coast Shipping Port | 5,853,781 | |||||||||
| 731,017 | Shriram Transport Finance Truck Financing in India | 4,632,219 | |||||||||
| 43,900,581 | |||||||||||
| Taiwan – 3.2% | |||||||||||
| 15,296,000 | Yuanta Financial Financial Holding Company in Taiwan | 10,233,769 | |||||||||
| 3,381,000 | President Chain Store Taiwan's Number One Convenience Chain Store Operator | 8,653,931 | |||||||||
| 448,000 | Formosa International Hotels Hotel, Food & Beverage Operation & Hospitality Management Services | 6,260,875 | |||||||||
| 1,971,834 | Everlight Electronics LED Packager | 5,012,917 | |||||||||
| 1,230,000 | Simplo Technology World's Largest Notebook Battery Pack Supplier | 4,932,978 | |||||||||
| 35,094,470 | |||||||||||
| Hong Kong – 2.4% | |||||||||||
| 900,000 | Hong Kong Exchanges and Clearing Hong Kong Equity & Derivatives Market Operator | 13,974,568 | |||||||||
| 6,963,100 | Lifestyle International Mid to High-end Department Store Operator in Hong Kong & China | 9,055,086 | |||||||||
| 25,139,112 | NagaCorp Casino/Entertainment Complex in Cambodia | 3,318,477 | |||||||||
| 26,348,131 | |||||||||||
See accompanying notes to financial statements.
9
Wanger International 2009 Semiannual Report
Wanger International
Statement of Investments (Unaudited) June 30, 2009
| Number of Shares | Value | ||||||||||
| Indonesia – 0.7% | |||||||||||
| 25,000,000 | Perusahaan Gas Negara Gas Distributor & Pipeline Operator | $ | 7,683,778 | ||||||||
| Total Asia | 468,983,913 | ||||||||||
| Europe – 36.7% | |||||||||||
| United Kingdom – 8.3% | |||||||||||
| 2,000,000 | Serco Facilities Management | 13,895,161 | |||||||||
| 1,100,000 | Capita Group White Collar, Back Office Outsourcing | 12,968,162 | |||||||||
| 739,200 | Intertek Group Testing, Inspection & Certification Services | 12,745,364 | |||||||||
| 2,514,300 | Charles Taylor (b) Insurance Services | 7,701,610 | |||||||||
| 850,000 | Smith & Nephew Medical Equipment & Supplies | 6,301,698 | |||||||||
| 350,000 | Rotork Valve Actuators for Oil & Water Pipelines | 4,773,671 | |||||||||
| 130,000 | Chemring Defense Manufacturer of Countermeasures & Energetics | 4,647,049 | |||||||||
| 1,600,000 | Cobham Aerospace Components | 4,563,626 | |||||||||
| 71,000 | Randgold Resources – ADR Gold Mining in Western Africa | 4,556,070 | |||||||||
| 1,300,000 | RPS Group Environmental Consulting & Planning | 4,286,651 | |||||||||
| 2,126,600 | Begbies Traynor Financial Restructuring & Corporate Recovery Services | 3,621,723 | |||||||||
| 230,000 | Tullow Oil Oil & Gas Producer | 3,558,384 | |||||||||
| 931,000 | N Brown Group Home Shopping Women's Clothes Retailer | 3,295,649 | |||||||||
| 352,000 | Keller Group Ground Engineering | 3,208,619 | |||||||||
| 300,000 | Intermediate Capital European Provider of Mezzanine Capital | 2,399,013 | |||||||||
| 92,522,450 | |||||||||||
| Netherlands – 6.0% | |||||||||||
| 628,550 | Imtech Engineering & Technical Services | 12,233,810 | |||||||||
| Number of Shares | Value | ||||||||||
| 383,584 | Koninklijke TenCate Advanced Textiles & Industrial Fabrics | $ | 9,290,408 | ||||||||
| 221,351 | Fugro Sub-sea Oilfield Services | 9,191,462 | |||||||||
| 542,000 | Unit 4 Agresso (a) Business Development Software | 8,865,300 | |||||||||
| 131,432 | Vopak (a) World's Largest Operator of Petroleum & Chemical Storage Terminals | 6,574,188 | |||||||||
| 367,000 | Arcadis Engineering Consultants | 6,113,123 | |||||||||
| 687,590 | Aalberts Industries Flow Control & Heat Treatment | 5,410,045 | |||||||||
| 82,982 | Smit Internationale Harbor & Offshore Towage & Marine Services | 4,918,396 | |||||||||
| 225,000 | QIAGEN (a) Life Science Tools & Molecular Diagnostics | 4,176,228 | |||||||||
| 66,772,960 | |||||||||||
| Germany – 5.0% | |||||||||||
| 186,000 | Wincor Nixdorf Retail POS Systems & ATM Machines | 10,430,590 | |||||||||
| 251,000 | CTS Eventim Event Ticket Sales | 10,167,140 | |||||||||
| 72,300 | Vossloh Rail Infrastructure & Diesel Locomotives | 8,696,335 | |||||||||
| 335,600 | Rhoen-Klinikum Health Care Services | 7,420,818 | |||||||||
| 55,200 | Rational Commercial Oven Manufacturer | 6,367,738 | |||||||||
| 205,000 | Deutsche Beteiligungs Private Equity Investment Management | 3,508,578 | |||||||||
| 256,200 | Tognum Diesel Engines for Drive & Power Generation Systems | 3,375,296 | |||||||||
| 197,800 | Elringklinger Automobile Components | 3,299,277 | |||||||||
| 217,901 | Takkt Mail Order Retailer of Office & Warehouse Durables | 2,322,991 | |||||||||
| 55,588,763 | |||||||||||
| France – 4.3% | |||||||||||
| 99,000 | Neopost Postage Meter Machines | 8,902,489 | |||||||||
See accompanying notes to financial statements.
10
Wanger International 2009 Semiannual Report
Wanger International
Statement of Investments (Unaudited) June 30, 2009
| Number of Shares | Value | ||||||||||
| France – 4.3% (cont) | |||||||||||
| 72,000 | Iliad Alternative Internet & Telecoms Provider | $ | 6,993,608 | ||||||||
| 317,000 | SES Satellite Broadcasting Services | 6,052,231 | |||||||||
| 145,500 | SAFT Niche Battery Manufacturer | 5,780,112 | |||||||||
| 73,714 | Pierre & Vacances Vacation Apartment Lets | 5,128,297 | |||||||||
| 52,900 | Rubis Tank Storage & Liquefied Petroleum Gas Distribution | 3,939,434 | |||||||||
| 132,600 | Carbone Lorraine Advanced Industrial Materials | 3,644,791 | |||||||||
| 60,000 | Eurofins Scientific Food Screening & Testing | 3,527,070 | |||||||||
| 54,400 | Norbert Dentressangle Transport | 2,711,309 | |||||||||
| 207,000 | Hi-Media (a) Online Advertiser in Europe | 1,036,059 | |||||||||
| 47,715,400 | |||||||||||
| Sweden – 2.7% | |||||||||||
| 1,326,000 | Hexagon Measurement Equipment | 11,996,387 | |||||||||
| 1,974,000 | SWECO Engineering Consultants | 9,980,872 | |||||||||
| 1,500,200 | Nobia (a) Kitchen Cabinet Manufacturing & Sales | 5,354,849 | |||||||||
| 250,000 | East Capital Explorer (a) Sweden-based RUS/CEE Investment Fund | 2,004,611 | |||||||||
| 29,336,719 | |||||||||||
| Switzerland – 2.4% | |||||||||||
| 7,300 | Sika Chemicals for Construction & Industrial Applications | 8,103,288 | |||||||||
| 97,300 | Kuehne & Nagel Freight Forwarding/Logistics | 7,638,082 | |||||||||
| 59,000 | Geberit Plumbing Supplies | 7,271,526 | |||||||||
| 30,000 | Burckhardt Compression Gas Compression Pumps | 3,887,068 | |||||||||
| 26,899,964 | |||||||||||
| Number of Shares | Value | ||||||||||
| Finland – 2.0% | |||||||||||
| 427,000 | Stockmann Department Store & Fashion Retailer in Scandinavia & Russia | $ | 9,070,753 | ||||||||
| 630,000 | Poyry Engineering Consultants | 8,937,204 | |||||||||
| 745,000 | Ramirent (a) Largest Equipment Rental Company in Scandinavia & Central Eastern Europe | 4,585,723 | |||||||||
| 22,593,680 | |||||||||||
| Ireland – 1.5% | |||||||||||
| 2,750,000 | United Drug Irish Pharmaceutical Wholesaler & Outsourcer | 7,639,312 | |||||||||
| 200,000 | Aryzta (a) Baked Goods | 6,403,159 | |||||||||
| 100,000 | Paddy Power Irish Betting Services | 2,333,518 | |||||||||
| 16,375,989 | |||||||||||
| Italy – 1.2% | |||||||||||
| 5,366,005 | CIR (a) Italian Holding Company | 8,876,531 | |||||||||
| 500,000 | Credito Emiliano (a) Italian Regional Bank | 2,399,731 | |||||||||
| 393,309 | GranitiFiandre Innovative Stoneware | 1,416,359 | |||||||||
| 12,692,621 | |||||||||||
| Poland – 0.8% | |||||||||||
| 328,300 | Central European Distribution (a) Vodka Production & Spirits Distribution | 8,722,931 | |||||||||
| Spain – 0.7% | |||||||||||
| 180,000 | Red Electrica de Espana Spanish Power Grid | 8,143,907 | |||||||||
| Denmark – 0.7% | |||||||||||
| 99,000 | Novozymes Industrial Enzymes | 8,046,548 | |||||||||
| Greece – 0.6% | |||||||||||
| 1,148,000 | Intralot Lottery & Gaming Systems & Services | 6,920,963 | |||||||||
See accompanying notes to financial statements.
11
Wanger International 2009 Semiannual Report
Wanger International
Statement of Investments (Unaudited) June 30, 2009
| Number of Shares | Value | ||||||||||
| Czech Republic – 0.5% | |||||||||||
| 37,000 | Komercni Banka Leading Czech Republic Universal Bank | $ | 5,133,591 | ||||||||
| Total Europe | 407,466,486 | ||||||||||
| Other Countries – 11.9% | |||||||||||
| United States – 3.5% | |||||||||||
| 458,000 | Atwood Oceanics (a) Offshore Drilling Contractor | 11,408,780 | |||||||||
| 161,000 | Alexion Pharmaceuticals (a) Biotech Focused on Orphan Diseases | 6,620,320 | |||||||||
| 95,000 | Oceaneering International (a) Provider of Sub-sea Services & Manufactured Products | 4,294,000 | |||||||||
| 60,000 | Cephalon (a) Specialty Pharmaceuticals for Pain, Central Nervous System & Oncology | 3,399,000 | |||||||||
| 84,000 | FMC Technologies (a) Oil & Gas Wellhead Manufacturer | 3,156,720 | |||||||||
| 70,000 | World Fuel Services Global Fuel Broker | 2,886,100 | |||||||||
| 165,000 | BioMarin (a) Biotech Focused on Orphan Diseases | 2,575,650 | |||||||||
| 55,000 | Illumina (a) Leading Tools & Service Provider for Genetic Analysis | 2,141,700 | |||||||||
| 50,000 | Ritchie Brothers Auctioneers Heavy Equipment Auctioneer | 1,172,500 | |||||||||
| 35,000 | Bristow (a) Largest Provider of Helicopter Services to Offshore Oil & Gas Producers | 1,037,050 | |||||||||
| 100,000 | Tesco (a) Developing New Well Drilling Technologies | 794,000 | |||||||||
| 39,485,820 | |||||||||||
| South Africa – 2.5% | |||||||||||
| 700,000 | Naspers Media in Africa & Other Emerging Markets | 18,448,924 | |||||||||
| 1,530,000 | Mr. Price South African Retailer of Apparel, Household & Sporting Goods | 5,574,880 | |||||||||
| 1,575,000 | Uranium One (a) Uranium Mines in Kazakhstan, the U.S. & Australia | 3,615,398 | |||||||||
| 27,639,202 | |||||||||||
| Number of Shares | Value | ||||||||||
| Canada – 2.4% | |||||||||||
| 580,000 | ShawCor Oil & Gas Pipeline Products | $ | 10,037,742 | ||||||||
| 378,000 | CCL Industries Leading Global Label Manufacturer | 7,464,781 | |||||||||
| 644,000 | TriStar Oil & Gas (a) Canadian Oil & Gas Producer | 6,084,821 | |||||||||
| 286,000 | Ivanhoe Mines (a) | 1,601,600 | |||||||||
| 250,000 | Ivanhoe Mines (a) Copper Mine Project in Mongolia | 1,386,322 | |||||||||
| 725,700 | Horizon North Logistics (a) Provides Diversified Oil Service Offering in Northern Canada | 655,105 | |||||||||
| 27,230,371 | |||||||||||
| Australia – 2.3% | |||||||||||
| 2,438,333 | Sino Gold (a) Gold Mining in The People's Republic of China | 10,116,853 | |||||||||
| 170,000 | Australian Stock Exchange Australian Equity & Derivatives Market Operator | 5,050,714 | |||||||||
| 700,000 | Billabong International Action Sports Apparel Brand Manager | 4,919,182 | |||||||||
| 210,577 | Perpetual Trustees Mutual Fund Management | 4,821,881 | |||||||||
| 24,000 | Cochlear Cochlear Implants for Hearing | 1,114,824 | |||||||||
| 26,023,454 | |||||||||||
| Israel – 0.9% | |||||||||||
| 970,000 | Israel Chemicals Producer of Potash, Phosphates, Bromine & Specialty Chemicals | 9,548,246 | |||||||||
| Kazakhstan – 0.2% | |||||||||||
| 490,000 | Halyk Savings Bank of Kazakhstan – GDR (a) Largest Retail Bank & Insurer in Kazakhstan | 2,040,056 | |||||||||
| New Zealand – 0.1% | |||||||||||
| 398,177 | Sky City Entertainment Casino/Entertainment Complex | 687,226 | |||||||||
| Total Other Countries | 132,654,375 | ||||||||||
See accompanying notes to financial statements.
12
Wanger International 2009 Semiannual Report
Wanger International
Statement of Investments (Unaudited) June 30, 2009
| Number of Shares or Principal Amount | Value | ||||||||||
| Latin America – 5.7% | |||||||||||
| Brazil – 3.0% | |||||||||||
| 2,000,000 | Localiza Rent A Car Car Rental | $12,350,089 | |||||||||
| 1,445,000 | Suzano (a) Brazilian Pulp & Paper Producer | 11,179,485 | |||||||||
| 730,000 | Natura Direct Retailer of Cosmetics | 9,633,988 | |||||||||
| 33,163,562 | |||||||||||
| Mexico – 1.7% | |||||||||||
| 6,394,000 | Urbi Desarrollos Urbanos (a) Affordable Housing Builder | 9,711,237 | |||||||||
| 246,475 | Grupo Aeroportuario del Sureste – ADR Mexican Airport Operator | 9,612,525 | |||||||||
| 19,323,762 | |||||||||||
| Chile – 1.0% | |||||||||||
| 291,000 | Sociedad Quimica y Minera de Chile – ADR Producer of Specialty Fertilizers, Lithium & Iodine | 10,531,290 | |||||||||
| Total Latin America | 63,018,614 | ||||||||||
| Total Common Stocks (Cost: $962,782,705) – 96.5% | 1,072,123,388 | ||||||||||
| Short-Term Obligations – 4.2% | |||||||||||
| Repurchase Agreement – 3.7% | |||||||||||
| $ | 40,612,000 | Repurchase Agreement with Fixed Income Clearing Corp., dated 6/30/09, due 7/01/09 at 0.0001%, collateralized by a U.S. Government Agency obligation, maturing 4/23/14, market value $41,428,625 (repurchase proceeds $40,612,000) | 40,612,000 | ||||||||
| Commercial Paper – 0.5% | |||||||||||
| 0.26% due 7/6/09 5,600,000 | Toyota Motor Credit | 5,599,798 | |||||||||
| Total Short-Term Obligations (Cost: $46,211,798) | 46,211,798 | ||||||||||
| Total Investments (Cost: $1,008,994,503) – 100.7% (c)(d) | 1,118,335,186 | ||||||||||
| Cash and Other Assets Less Liabilities – (0.7)% | (7,681,746 | ) | |||||||||
| Total Net Assets – 100.0% | $ | 1,110,653,440 | |||||||||
Notes to Statement of Investments:
(a) Non-income producing security.
(b) An affiliated person of the Fund may include any company in which the Fund owns five percent or more of its outstanding voting shares. Transactions in this affiliated company during the six months ended June 30, 2009 are as follows:
Affiliates | Balance of Shares Held at 12/31/08 | Purchases/ Additions | Sales/ Reductions | Balance of Shares Held at 6/30/09 | Value | Dividend | |||||||||||||||||||||
| Charles Taylor | 2,490,000 | 24,300 | — | 2,514,300 | $ | 7,701,610 | $ | 339,680 | |||||||||||||||||||
The aggregate cost and value of this company at June 30, 2009, was $13,135,777 and $7,701,610, respectively. Investments in the affiliated company represented 0.69% of total net assets at June 30, 2009.
(c) At June 30, 2009, for federal income tax purposes cost of investments was $1,008,994,503 and net unrealized appreciation was $109,340,683 consisting of gross unrealized appreciation of $246,728,297 and gross unrealized depreciation of $137,387,614.
(d) On June 30, 2009, the Fund's total investments were denominated in currencies as follows:
| Currency | Value | Percentage of Net Assets | |||||||||
| Euro | $ | 238,511,157 | 21.5 | ||||||||
| Japanese Yen | 200,212,255 | 18.0 | |||||||||
| U.S. Dollar | 142,289,379 | 12.8 | |||||||||
| British Pound | 87,966,380 | 7.9 | |||||||||
| Hong Kong Dollar | 68,362,098 | 6.2 | |||||||||
| Other currencies less than 5% of total net assets | 380,993,917 | 34.3 | |||||||||
| Cash and other assets less liabilities | (7,681,746 | ) | (0.7 | ) | |||||||
| $ | 1,110,653,440 | 100.0 | |||||||||
At June 30, 2009, the Fund had entered into the following forward foreign currency exchange contracts:
| Forward Foreign Currency Contracts to Buy | Forward Foreign Currency Contracts to Sell | Principal Amount in Foreign Currency | Principal Amount in U.S. Dollar | Settlement Date | Unrealized Appreciation | ||||||||||||||||||
| AUD | USD | 4,150,239 | $ | 3,000,000 | 7/15/2009 | $ | 341,102 | ||||||||||||||||
| AUD | USD | 2,657,595 | 2,000,000 | 8/14/2009 | 134,773 | ||||||||||||||||||
| CAD | USD | 8,481,550 | 7,000,000 | 7/15/2009 | 292,324 | ||||||||||||||||||
| CAD | USD | 5,862,950 | 5,000,000 | 8/14/2009 | 41,763 | ||||||||||||||||||
| JPY | USD | 889,992,000 | 9,000,000 | 7/15/2009 | 239,858 | ||||||||||||||||||
| JPY | USD | 882,774,000 | 9,000,000 | 9/15/2009 | 171,346 | ||||||||||||||||||
| $ | 35,000,000 | $ | 1,221,166 | ||||||||||||||||||||
See accompanying notes to financial statements.
13
Wanger International 2009 Semiannual Report
Wanger International
Statement of Investments (Unaudited) June 30, 2009
| Forward Foreign Currency Contracts to Buy | Forward Foreign Currency Contracts to Sell | Principal Amount in Foreign Currency | Principal Amount in U.S. Dollar | Settlement Date | Unrealized (Depreciation) | ||||||||||||||||||
| AUD | USD | 6,193,638 | $ | 5,000,000 | 9/15/2009 | $ | (36,539 | ) | |||||||||||||||
| CAD | USD | 11,187,000 | 10,000,000 | 9/15/2009 | (377,963 | ) | |||||||||||||||||
| JPY | USD | 667,611,000 | 7,000,000 | 8/14/2009 | (66,559 | ) | |||||||||||||||||
| USD | EUR | 14,330,430 | 19,000,000 | 7/15/2009 | (1,103,664 | ) | |||||||||||||||||
| USD | EUR | 10,279,681 | 14,000,000 | 8/14/2009 | (420,801 | ) | |||||||||||||||||
| USD | EUR | 17,121,700 | 24,000,000 | 9/15/2009 | (16,309 | ) | |||||||||||||||||
| $ | 79,000,000 | $ | (2,021,835 | ) | |||||||||||||||||||
The counterparty for all forward foreign currency exchange contracts is State Street Bank and Trust Company.
ADR = American Depositary Receipts.
AUD = Australian Dollar
CAD = Canadian Dollar
EUR = Euro
GDR = Global Depositary Receipts.
JPY = Japanese Yen
USD = United States Dollar
The following table summarizes the inputs used, as of June 30, 2009, in valuing the Fund's assets:
Investment Type | Quoted Prices (Level 1) | Other Significant Observable Inputs (Level 2) | Significant Unobservable Inputs (Level 3) | Total | |||||||||||||||
| Common Stocks | |||||||||||||||||||
| Total Asia | $ | 19,527,290 | $ | 449,456,623 | $ | — | $ | 468,983,913 | |||||||||||
| Total Europe | 13,279,001 | 394,187,485 | — | 407,466,486 | |||||||||||||||
| Total Other Countries | 70,331,589 | 62,322,786 | — | 132,654,375 | |||||||||||||||
| Total Latin America | 63,018,614 | — | — | 63,018,614 | |||||||||||||||
| Total Common Stocks | 166,156,494 | 905,966,894 | — | 1,072,123,388 | |||||||||||||||
| Short-Term Obligations | — | 46,211,798 | — | 46,211,798 | |||||||||||||||
| Total Investments | 166,156,494 | 952,178,692 | — | 1,118,335,186 | |||||||||||||||
| Net Forward Foreign Currency Exchange Contracts | $ | — | $ | (800,669 | ) | $ | — | $ | (800,669 | ) | |||||||||
| Total | $ | 166,156,494 | $ | 951,378,023 | $ | — | $ | 1,117,534,517 | |||||||||||
The Fund's assets assigned to the Level 2 input category include certain foreign securities for which a third party statistical pricing service may be employed for purposes of fair market valuation.
The information in the below reconciliation represents fiscal year to date activity for any securities identified as using Level 3 inputs at either the beginning or the end of the current fiscal period.
Investments in Securities | Balance as of December 31, 2008 | Accrued Discounts/ Premiums | Realized Gain/(Loss) | Change in Unrealized Appreciation (Depreciation) | Net Purchases | Net Sales | Net transfers into Level 3 | Net transfers out of Level 3 | Balance as of June 30, 2009 | Change in Unrealized Appreciation (Depreciation) from Investments held at June 30, 2009 | |||||||||||||||||||||||||||||||||
| Common Stocks Asia Hong Kong | $ | 109,775 | $ | — | $ | — | $ | — | $ | — | $ | — | $ | — | $ | (109,775 | ) | $ | — | $ | — | ||||||||||||||||||||||
| Total | $ | 109,775 | $ | — | $ | — | $ | — | $ | — | $ | — | $ | — | $ | (109,775 | ) | $ | — | $ | — | ||||||||||||||||||||||
For more information on valuation inputs, and their aggregation into the levels used in the tables above, please refer to the Security Valuation section in the accompanying Notes to Financial Statements.
See accompanying notes to financial statements.
14
Wanger International 2009 Semiannual Report
Wanger International
Portfolio Diversification (Unaudited) June 30, 2009
At June 30, 2009, the Fund's portfolio investments as a percentage of net assets was diversified as follows:
| Value | Percentage of Net Assets | ||||||||||
| Industrial Goods & Services | |||||||||||
| Other Industrial Services | $ | 89,896,555 | 8.1 | ||||||||
| Industrial Materials & Specialty Chemicals | 80,370,275 | 7.2 | |||||||||
| Machinery | 67,255,722 | 6.1 | |||||||||
| Outsourcing Services | 44,419,680 | 4.0 | |||||||||
| Electrical Components | 21,425,599 | 1.9 | |||||||||
| Construction | 11,652,645 | 1.0 | |||||||||
| Conglomerates | 11,471,770 | 1.0 | |||||||||
| Medical Equipment & Devices | 4,116,471 | 0.4 | |||||||||
| Industrial Distribution | 2,388,213 | 0.2 | |||||||||
| Waste Management | 1,706,874 | 0.2 | |||||||||
| 334,703,804 | 30.1 | ||||||||||
| Consumer Goods & Services | |||||||||||
| Retail | 40,148,147 | 3.5 | |||||||||
| Other Consumer Services | 30,728,307 | 2.7 | |||||||||
| Nondurables | 29,306,687 | 2.6 | |||||||||
| Food & Beverage | 27,457,295 | 2.5 | |||||||||
| Apparel | 20,603,374 | 1.9 | |||||||||
| Casinos & Gaming | 19,551,581 | 1.8 | |||||||||
| Travel | 17,478,386 | 1.6 | |||||||||
| Other Entertainment | 16,428,015 | 1.5 | |||||||||
| Educational Services | 9,565,120 | 0.9 | |||||||||
| Consumer Goods Distribution | 8,722,931 | 0.8 | |||||||||
| Furniture & Textiles | 5,354,849 | 0.5 | |||||||||
| Consumer Electronics | 2,863,566 | 0.3 | |||||||||
| 228,208,258 | 20.6 | ||||||||||
| Information | |||||||||||
| Financial Processors | 25,211,251 | 2.2 | |||||||||
| Computer Hardware & Related Equipment | 20,509,531 | 1.8 | |||||||||
| Internet Related | 18,462,110 | 1.7 | |||||||||
| TV Broadcasting | 18,448,924 | 1.7 | |||||||||
| Instrumentation | 15,522,984 | 1.4 | |||||||||
| Publishing | 14,152,335 | 1.3 | |||||||||
| Business Software | 8,865,300 | 0.8 | |||||||||
| CATV | 7,960,625 | 0.7 | |||||||||
| Satellite Broadcasting & Services | 6,052,231 | 0.5 | |||||||||
| Semiconductors & Related Equipment | 5,012,917 | 0.5 | |||||||||
| Business Information & Marketing Services | 4,286,651 | 0.4 | |||||||||
| Advertising | 3,082,909 | 0.3 | |||||||||
| 147,567,768 | 13.3 | ||||||||||
| Value | Percentage of Net Assets | ||||||||||
| Other Industries | |||||||||||
| Real Estate | $ | 56,832,958 | 5.1 | ||||||||
| Transportation | 39,295,329 | 3.5 | |||||||||
| Conglomerates | 8,876,531 | 0.8 | |||||||||
| Regulated Utilities | 8,143,907 | 0.7 | |||||||||
| 113,148,725 | 10.1 | ||||||||||
| Energy & Minerals | |||||||||||
| Oil Services | 40,574,859 | 3.7 | |||||||||
| Mining | 21,276,243 | 1.9 | |||||||||
| Oil Refining, Marketing & Distribution | 18,197,400 | 1.6 | |||||||||
| Agricultural Commodities | 11,179,485 | 1.0 | |||||||||
| Oil & Gas Producers | 9,643,205 | 0.9 | |||||||||
| 100,871,192 | 9.1 | ||||||||||
| Finance | |||||||||||
| Brokerage & Money Management | 32,499,096 | 2.9 | |||||||||
| Banks | 28,055,935 | 2.5 | |||||||||
| Finance Companies | 17,800,621 | 1.6 | |||||||||
| Insurance | 7,701,610 | 0.7 | |||||||||
| Savings & Loans | 7,358,425 | 0.7 | |||||||||
| 93,415,687 | 8.4 | ||||||||||
| Health Care | |||||||||||
| Medical Equipment & Devices | 27,937,496 | 2.5 | |||||||||
| Pharmaceuticals | 12,097,762 | 1.1 | |||||||||
| Health Care Services | 7,420,818 | 0.7 | |||||||||
| Medical Supplies | 4,176,228 | 0.4 | |||||||||
| Biotechnology & Drug Delivery | 2,575,650 | 0.2 | |||||||||
| 54,207,954 | 4.9 | ||||||||||
| Total Common Stocks | 1,072,123,388 | 96.5 | |||||||||
| Short-Term Obligations | 46,211,798 | 4.2 | |||||||||
| Total Investments | 1,118,335,186 | 100.7 | |||||||||
| Cash and Other Assets Less Liabilities | (7,681,746 | ) | (0.7 | ) | |||||||
| Net Assets | $ | 1,110,653,440 | 100.0 | ||||||||
See accompanying notes to financial statements.
15
Wanger International 2009 Semiannual Report
Statement of Assets and Liabilities
June 30, 2009 (Unaudited)
| Assets: | |||||||
| Unaffiliated investments, at cost | $ | 995,858,726 | |||||
| Affiliated investments, at cost (See Note 4) | 13,135,777 | ||||||
| Unaffiliated investments, at value | $ | 1,110,633,576 | |||||
| Affiliated investments, at value (See Note 4) | 7,701,610 | ||||||
| Cash | 691 | ||||||
| Foreign currency (cost of $7,013,125) | 7,018,959 | ||||||
| Unrealized appreciation on forward foreign currency exchange contracts | 1,221,166 | ||||||
| Receivable for: | |||||||
| Investments sold | 2,357,177 | ||||||
| Fund shares sold | 14,394 | ||||||
| Securities lending income | 2,458 | ||||||
| Dividends | 1,619,660 | ||||||
| Foreign tax reclaims | 521,717 | ||||||
| Trustees' deferred compensation plan | 87,144 | ||||||
| Other assets | 2,456 | ||||||
| Total Assets | 1,131,181,008 | ||||||
| Liabilities: | |||||||
| Unrealized depreciation on forward foreign currency exchange contracts | 2,021,835 | ||||||
| Payable for: | |||||||
| Investments purchased | 13,970,478 | ||||||
| Fund shares repurchased | 1,800,948 | ||||||
| Investment advisory fee | 784,749 | ||||||
| Administration fee | 45,069 | ||||||
| Transfer agent fee | 32 | ||||||
| Trustees' fees | 1,245 | ||||||
| Custody fee | 213,594 | ||||||
| Reports to shareholders | 341,938 | ||||||
| Trustees' deferred compensation plan | 87,144 | ||||||
| Deferred foreign capital gains tax payable | 1,241,948 | ||||||
| Other liabilities | 18,588 | ||||||
| Total Liabilities | 20,527,568 | ||||||
| Net Assets | $ | 1,110,653,440 | |||||
| Composition of Net Assets: | |||||||
| Paid-in capital | $ | 1,169,162,248 | |||||
| Undistributed net investment income | 10,789,766 | ||||||
| Accumulated net realized loss | (176,604,557 | ) | |||||
| Net unrealized appreciation (depreciation) on: | |||||||
| Investments | 109,340,683 | ||||||
| Foreign currency translations | (792,752 | ) | |||||
| Foreign capital gains tax | (1,241,948 | ) | |||||
| Net Assets | $ | 1,110,653,440 | |||||
| Fund Shares Outstanding | 45,929,240 | ||||||
| Net asset value, offering price and redemption price per share | $ | 24.18 | |||||
Statement of Operations
For the Six Months Ended June 30, 2009 (Unaudited)
| Investment Income: | |||||||
| Dividends (net foreign taxes withheld of $1,434,216) | $ | 15,845,264 | |||||
| Dividends from affiliates | 339,680 | ||||||
| Interest | 30,044 | ||||||
| Securities lending income | 2,458 | ||||||
| Total Investment Income | 16,217,446 | ||||||
| Expenses: | |||||||
| Investment advisory fee | 4,140,640 | ||||||
| Administration fee | 235,059 | ||||||
| Transfer agent fee | 224 | ||||||
| Trustees' fees | 46,517 | ||||||
| Custody fee | 418,506 | ||||||
| Chief compliance officer expenses (See Note 4) | 25,286 | ||||||
| Other expenses (See Note 6) | 296,833 | ||||||
| Total Expenses | 5,163,065 | ||||||
| Custody earnings credit | (1 | ) | |||||
| Net Expenses | 5,163,064 | ||||||
| Net Investment Income | 11,054,382 | ||||||
| Net Realized and Unrealized Gain (Loss) on Investments, Foreign Currency and Forward Foreign Currency Exchange Contracts | |||||||
| Net realized loss on: | |||||||
| Investments | (80,596,594 | ) | |||||
| Foreign currency transactions and forward foreign currency exchange contracts | (1,350,004 | ) | |||||
| Net realized loss | (81,946,598 | ) | |||||
| Net change in unrealized appreciation (depreciation) on: | |||||||
| Unaffiliated investments | 256,396,787 | ||||||
| Affiliated Investments (See Note 4) | (1,456,285 | ) | |||||
| Foreign currency translations and forward foreign currency exchange contracts | 218,490 | ||||||
| Foreign capital gains tax | (1,241,948 | ) | |||||
| Net change in unrealized appreciation (depreciation) | 253,917,044 | ||||||
| Net Gain | 171,970,446 | ||||||
| Net Increase in Net Assets from Operations | $ | 183,024,828 | |||||
See accompanying notes to financial statements.
16
Wanger International 2009 Semiannual Report
Statement of Changes in Net Assets
| Increase (Decrease) in Net Assets | (Unaudited) Six Months Ended June 30, 2009 | Year Ended December 31, 2008 | |||||||||
| Operations: | |||||||||||
| Net investment income | $ | 11,054,382 | $ | 22,638,362 | |||||||
| Net realized loss on investments, foreign currency transactions and forward foreign currency exchange contracts | (81,946,598 | ) | (94,903,681 | ) | |||||||
| Net change in unrealized appreciation (depreciation) on investments, foreign currency translations, forward foreign currency exchange contracts and foreign capital gains tax | 253,917,044 | (691,757,262 | ) | ||||||||
| Net Increase (Decrease) in Net Assets from Operations | �� | 183,024,828 | (764,022,581 | ) | |||||||
| Distributions to Shareholders: | |||||||||||
| From net investment income | (21,668,468 | ) | (12,975,444 | ) | |||||||
| From net realized gains | — | (196,263,094 | ) | ||||||||
| Total Distributions to Shareholders | (21,668,468 | ) | (209,238,538 | ) | |||||||
| Share Transactions: | |||||||||||
| Subscriptions | 20,842,971 | 220,199,859 | |||||||||
| Distributions reinvested | 21,668,468 | 209,238,538 | |||||||||
| Redemptions | (66,073,956 | ) | (176,692,026 | ) | |||||||
| Net Increase (Decrease) from Share Transactions | (23,562,517 | ) | 252,746,371 | ||||||||
| Total Increase (Decrease) in Net Assets | 137,793,843 | (720,514,748 | ) | ||||||||
| Net Assets: | |||||||||||
| Beginning of period | 972,859,597 | 1,693,374,345 | |||||||||
| End of period | $ | 1,110,653,440 | $ | 972,859,597 | |||||||
| Undistributed net investment income at end of period | $ | 10,789,766 | $ | 21,403,852 | |||||||
See accompanying notes to financial statements.
17
Wanger International 2009 Semiannual Report
Financial Highlights
| (Unaudited) Six Months Ended June 30, | Year Ended December 31, | ||||||||||||||||||||||||||
| Selected data for a share outstanding throughout each period | 2009 | 2008 | 2007 | 2006 | 2005 | 2004 | |||||||||||||||||||||
| Net Asset Value, Beginning of Period | $ | 20.69 | $ | 44.04 | $ | 41.77 | $ | 30.63 | $ | 25.46 | $ | 19.68 | |||||||||||||||
| Income from Investment Operations: | |||||||||||||||||||||||||||
| Net investment income (a) | 0.24 | 0.52 | 0.37 | 0.29 | 0.25 | 0.13 | |||||||||||||||||||||
| Net realized and unrealized gain (loss) on investments, foreign currency and foreign capital gains tax | 3.73 | (18.37 | ) | 5.80 | 11.04 | 5.20 | 5.80 | ||||||||||||||||||||
| Total from Investment Operations | 3.97 | (17.85 | ) | 6.17 | 11.33 | 5.45 | 5.93 | ||||||||||||||||||||
| Less Distributions to Shareholders: | |||||||||||||||||||||||||||
| From net investment income | (0.48 | ) | (0.34 | ) | (0.39 | ) | (0.19 | ) | (0.28 | ) | (0.15 | ) | |||||||||||||||
| From net realized gains | — | (5.16 | ) | (3.51 | ) | — | — | — | |||||||||||||||||||
| Total Distributions to Shareholders | (0.48 | ) | (5.50 | ) | (3.90 | ) | (0.19 | ) | (0.28 | ) | (0.15 | ) | |||||||||||||||
| Net Asset Value, End of Period | $ | 24.18 | $ | 20.69 | $ | 44.04 | $ | 41.77 | $ | 30.63 | $ | 25.46 | |||||||||||||||
| Total Return (b) | 20.17 | %(c) | (45.60 | )% | 16.31 | % | 37.16 | % | 21.53 | %(d) | 30.27 | % | |||||||||||||||
| Ratios to Average Net Assets/Supplemental Data: | |||||||||||||||||||||||||||
| Net expenses before interest expense (e) | 1.10 | %(f) | 1.02 | % | 0.99 | % | 1.01 | % | 1.13 | % | 1.36 | % | |||||||||||||||
| Interest expense | — | — | — | 0.00 | %(g) | — | — | ||||||||||||||||||||
| Net expenses (e) | 1.10 | %(f) | 1.02 | % | 0.99 | % | 1.01 | % | 1.13 | % | 1.36 | % | |||||||||||||||
| Net investment income (e) | 2.35 | %(f) | 1.67 | % | 0.87 | % | 0.81 | % | 0.92 | % | 0.59 | % | |||||||||||||||
| Waiver/Reimbursement | — | — | — | — | 0.02 | % | — | ||||||||||||||||||||
| Portfolio turnover rate | 23 | %(c) | 36 | % | 35 | % | 41 | % | 24 | % | 47 | % | |||||||||||||||
| Net Assets, end of period (000s) | $ | 1,110,653 | $ | 972,860 | $ | 1,693,374 | $ | 1,480,123 | $ | 973,257 | $ | 606,773 | |||||||||||||||
(a) Net investment income per share was based upon the average shares outstanding during the period.
(b) Total return at net asset value assuming all distributions are reinvested.
(c) Not annualized.
(d) Had the investment advisor not waived a portion of expenses, total return would have been reduced.
(e) The benefits derived from custody fees paid indirectly had an impact of less than 0.01%.
(f) Annualized.
(g) Rounds to less than 0.01%.
See accompanying notes to financial statements.
18
Wanger International 2009 Semiannual Report
Notes to Financial Statements (Unaudited)
1. Nature of Operations
Wanger International (the "Fund") is a series of Wanger Advisors Trust (the "Trust"), an open-end management investment company organized as a Massachusetts business trust. The investment objective of the Fund is to seek long-term capital appreciation. The Fund is available only for allocation to certain life insurance company separate accounts established for the purpose of funding qualified and non-qualified variable annuity contracts and variable life insurance policies and may also be offered directly to certain types of pension plans and retirement arrangements.
2. Significant Accounting Policies
The preparation of financial statements in accordance with accounting principles generally accepted in the United States of America ("GAAP") requires management to make certain estimates and assumptions that affect the reported amounts of assets and liabilities, the disclosure of contingent assets and liabilities at the date of the financial statements and the reported amounts of revenue and expenses during the reporting period. Actual results could differ from those estimates. Management has evaluated the events and transactions that have occurred through August 20, 2009, the date the financial statements were issued, and noted no items requiring adjustment of the financial statements or additional disclosures. The following is a summary of significant accounting policies consistently followed by the Fund in the preparation of its financial statements.
Security valuation
Securities of the Fund are valued at market value or, if a market quotation for a security is not readily available or is deemed not to be reliable because of events or circumstances that have occurred between the market quotation and the time as of which the security is to be valued, the security is valued at its fair value determined in good faith under consistently applied procedures established by the Board of Trustees. A security traded on a securities exchange or in an over-the-counter market in which transaction prices are reported is valued at the last sales price at the time of valuation. A security traded principally on NASDAQ is valued at the NASDAQ official closing price. A security for which there is no reported sale on the valuation date is valued at the latest bid quotation. Short-term investments maturing in 60 days or less are valued at amortized cost, which approximates market value. A security for which a mark et quotation is not readily available and any other assets are valued at its fair value determined in good faith under consistently applied procedures established by the Board of Trustees. The Trust has retained an independent statistical fair value pricing service that employs a systematic methodology to assist in the fair valuation process for securities principally traded in a foreign market in order to adjust for possible changes in value that may occur between the close of the foreign market and the time as of which the securities are to be valued. If a security is valued at a "fair value", that value may be different from the last quoted market price for the security.
The Fund adopted Statement of Financial Accounting Standards No. 157, Fair Value Measurements ("SFAS 157"). Under SFAS 157, various inputs are used in determining the value of the Fund's investments. These inputs are summarized in the three broad levels listed below:
• Level 1—quoted prices in active markets for identical securities
• Level 2—other significant observable inputs (including quoted prices for similar securities, interest rates, prepayment speeds, credit risk and others)
• Level 3—significant unobservable inputs (including management's own assumptions in determining the value of investments)
The inputs or methodologies used for valuing securities are not necessarily an indication of the risk associated with investing in those securities.
Examples of the types of securities in which the Fund would typically invest and how they are classified within this SFAS 157 hierarchy are as follows. Typical level 1 securities include exchange traded domestic equities, mutual funds whose NAVs are published each day and exchange traded foreign equities that are not statistically fair valued. Typical level 2 securities include exchange traded foreign equities that are statistically fair valued and short-term investments valued at amortized cost. Typical level 3 securities include any security fair valued by the Fund's Valuation Committee that relies on significant unobservable inputs.
In April 2009, the Financial Accounting Standards Board ("FASB") issued FASB Staff Position 157-4, Determining Fair Value When the Value and Level of Activity for the Asset or Liability Have Significantly Decreased and Identifying Transactions That Are Not Orderly ("FSP FAS 157-4"), which amends SFAS 157 and is effective for interim and annual periods ending after June 15, 2009. FSP FAS 157-4 provides additional guidance for estimating fair value in accordance with SFAS 157 when the volume and level of activity for the asset or liability measured at fair value has significantly decreased. Additionally, FSP FAS 157-4 expands disclosure requirements for reporting entities with respect to categories of assets and liabilities carried at fair value. Management does not expect the adopt ion of FSP FAS 157-4 to have a material impact on the Fund's financial statement disclosure.
Repurchase agreements
The Fund may engage in repurchase agreement transactions. The Fund, through its custodian, receives delivery of underlying securities collateralizing each repurchase agreement. The counterparty is required to maintain collateral that is at all times at least equal to the repurchase price including interest. In the event of default or bankruptcy by the other party to the agreement, realization and/or retention of the collateral may be subject to legal proceedings.
Foreign currency translations
Values of investments denominated in foreign currencies are converted into U.S. dollars using the New York spot market rate of exchange at the time of valuation. Purchases and sales of investments and dividend and interest income are translated into U.S. dollars using the spot market rate of exchange prevailing on the respective dates of such transactions. The gain or loss resulting from changes in foreign exchange rates is included with net realized and unrealized gain or loss from investments, as appropriate.
Forward foreign currency exchange contracts
The Fund may enter into forward foreign currency exchange contracts as an attempt to minimize the risk from adverse changes in the relationship between the U.S. dollar and foreign currencies. A forward foreign currency exchange contract is a commitment to purchase or sell a foreign currency at a future date at a negotiated forward rate. Forward foreign currency exchange contracts are valued at the interpolated forward exchange rate of the underlying currencies and any market gain or loss, arising from the difference between the original value and the current value of such contract, is included as a component of unrealized gain/(loss) on the Statement of Operations. Open forward foreign currency contracts, if any, are disclosed in the Notes to the Statement of Investments. As forward foreign currency contracts are closed the resulting gain or loss, arising from the difference between the original value of the contract and the clo sing value of such contract, is included as a component of realized gain/(loss) on the Statement of Operations.
A forward foreign currency exchange contract would limit the risk of loss due to a decline in the value of a particular currency; however, it also would limit any potential gain that might result should the value of the currency increase instead of decrease. These contracts may involve market risk in excess of the unrealized gain or loss reflected on the Statement of Assets and Liabilities. In addition, a Fund could be exposed to risks if counterparties to the contracts are unable to meet the terms of their contracts. The counterparty
19
Wanger International 2009 Semiannual Report
Notes to Financial Statements, continued (Unaudited)
risk exposure is, therefore, closely monitored and contracts are only executed with high credit quality financial institutions.
A Fund may use forward contracts to buy or sell a foreign currency when the Advisor believes it has exposure to a foreign currency which may suffer or enjoy a movement against another foreign currency to which the Fund has exposure. A Fund will not attempt to hedge all of its foreign portfolio positions.
On January 1, 2009, the Fund adopted Statement of Financial Accounting Standards No. 161, Disclosures about Derivative Instruments and Hedging Activities—an amendment of FASB Statement No. 133 ("SFAS 161"). SFAS 161 requires additional discussion about the reporting entity's derivative instruments and hedging activities, by providing for qualitative disclosures about the objectives and strategies for using derivatives, quantitative data about the fair value of and gains and losses on derivative contracts, and details of credit-risk-related contingent features in their derivative contracts. For additional information on derivative instruments, please see Note 5.
Securities lending
The Fund may lend securities up to one-third of the value of its total assets to certain approved brokers, dealers and other financial institutions to earn additional income. The Fund retains the benefits of owning the securities, including receipt of dividends or interest generated by the security. The Fund also receives a fee for the loan. The Fund has the ability to recall the loans at any time and could do so in order to vote proxies or to sell the loaned securities. Each loan is collateralized by cash that exceeds the value of the securities on loan. The market value of the loaned securities is determined daily at the close of business of the Fund and any additional required collateral is delivered to each Fund on the next business day. The Fund has elected to invest the cash collateral in the Dreyfus Government Cash Management Fund and the income earned is paid to the Fund, net of any fees remitted to Goldman Sachs Agency Lending as the lending agent and borrower rebates. The Fund's advisor, Columbia Wanger Asset Management L.P. ("CWAM"), does not retain any fees earned by the lending program nor does it charge the Fund for administering the program. Generally, in the event of borrower default, the Fund has the right to use the collateral to offset any losses incurred. In the event the Fund is delayed or prevented from exercising its right to dispose of the collateral, there may be a potential loss to the Fund. Some of these losses may be indemnified by the lending agent. The Fund bears the risk of loss with respect to the investment of collateral.
After suspending securities lending in the third quarter of 2008, the Fund resumed lending securities in the second quarter of 2009. The net lending income earned in 2009 by the Fund is included in the Statement of Operations.
Security transactions and investment income
Security transactions are accounted for on the trade date (date the order to buy or sell is executed) and dividend income is recorded on the ex-dividend date, except that certain dividends from foreign securities are recorded as soon as the information is available to the Fund. Interest income is recorded on the accrual basis and includes amortization of discounts on debt obligations when required for federal income tax purposes. Realized gains and losses from security transactions are recorded on an identified cost basis.
Awards, if any, from class action litigation related to securities owned may be recorded as a reduction of cost of those securities. If the applicable securities are no longer owned, the proceeds are recorded as realized gains.
Restricted securities
Restricted securities are securities that may only be resold upon registration under federal securities laws or in transactions exempt from registration. In some cases, the issuer of restricted securities has agreed to register such securities for resale at the issuer's expense either upon demand by the Fund or in connection with another registered offering of the securities. Many restricted securities may be resold in the secondary market in transactions exempt from registration. Such restricted securities may be determined to be liquid under criteria established by the Board of Trustees.
Use of estimates
The preparation of financial statements in conformity with GAAP requires management to make estimates and assumptions that affect the amounts reported in the financial statements and accompanying notes. Actual results may differ from those estimates.
Fund share valuation
Fund shares are sold and redeemed on a continuing basis at net asset value. Net asset value per share is determined daily as of the close of trading on the New York Stock Exchange ("the Exchange") on each day the Exchange is open for trading by dividing the total value of the Fund's investments and other assets, less liabilities, by the number of Fund shares outstanding.
Custody fees/Credits
Custody fees are reduced based on the Fund's cash balances maintained with the custodian. The amount is disclosed as a reduction of total expenses in the Statement of Operations.
Federal income taxes
The Fund has complied with the provisions of the Internal Revenue Code available to regulated investment companies and, in the manner provided therein, distributes all its taxable income, as well as any net realized gain on sales of investments and foreign currency transactions reportable for federal income tax purposes. Accordingly, the Fund paid no federal income taxes and no federal income tax provision was required.
Expenses
General expenses of the Trust are allocated to the Fund and the other series of the Trust based upon relative net assets or other expense allocation methodologies determined by the nature of the expense. Expenses directly attributable to the Fund are charged to the Fund.
Foreign capital gains taxes
Gains in certain countries may be subject to foreign taxes at the fund level, at rates ranging from 10%-15%. The Fund accrues for such foreign taxes on net realized and unrealized gains at the appropriate rate for each jurisdiction.
Distributions to shareholders
Distributions to shareholders are recorded on the ex-dividend date.
Indemnification
In the normal course of business, the Trust on behalf of the Fund enters into contracts that contain a variety of representations and warranties and that provide general indemnities. The Fund's maximum exposure under these arrangements is unknown, as this would involve future claims against the Fund. Also under the Trust's organizational documents, the trustees and officers of the Trust are indemnified against certain liabilities that may arise out of their duties to the Trust. However based on experience, the Fund expects the risk of loss due to these warranties and indemnities to be minimal.
3. Federal Tax Information
The tax character of distributions paid during the year ended December 31, 2008 was as follows:
| Distributions paid from: | |||||||
| Ordinary Income* | $ | 35,894,096 | |||||
| Long-Term Capital Gains | 173,344,442 | ||||||
* For tax purposes short-term capital gain distributions, if any, are considered ordinary income distributions.
20
Wanger International 2009 Semiannual Report
Notes to Financial Statements, continued (Unaudited)
The following capital loss carryforwards, determined as of December 31, 2008, may be available to reduce taxable income arising from future net realized gains on investments, if any, to the extent permitted by the Internal Revenue Code:
| Year of Expiration | Capital Loss Carryforward | ||||||
| 2016 | $ | 28,082,656 | |||||
FASB Interpretation No. 48, Accounting for Uncertainty in Income Taxes— an Interpretation of FASB Statement No. 109 ("FIN 48") management determines whether a tax position of the Fund is more likely than not to be sustained upon examination by the applicable taxing authority, including resolution of any related appeals or litigation processes, based on the technical merits of the position. The tax benefit to be recognized is measured as the largest amount of benefit that is greater than fifty percent likely of being realized upon ultimate settlement. Management has evaluated the known implications of FIN 48 on its computation of net assets for the Fund. As a result of this evaluation, management believes that FIN 48 does not have any effect on the Fund's financial statements. However, management's conclusions regarding FIN 48 may be subject to review and adjustment at a later date based on factors including, but not limited to, further implementation guidance from the FASB, new tax laws, regulations, and administrative interpretations (including relevant court decisions). The Fund's federal tax returns for the prior three fiscal years remain subject to examination by the Internal Revenue Service. The Fund is not aware of any tax positions for which it is reasonably possible that the total amounts of unrecognized tax benefits will significantly change in the next twelve months.
4. Transactions With Affiliates
CWAM is a wholly owned subsidiary of Columbia Management Group, LLC, ("Columbia Management") which in turn is an indirect wholly owned subsidiary of Bank of America Corporation ("BOA"). CWAM furnishes continuing investment supervision to the Fund and is responsible for the overall management of the Fund's business affairs.
Under the Fund's investment advisory agreement, management fees are accrued daily based on the Fund's average daily net assets and paid monthly to CWAM at the annual rates shown in the table below:
| Average Daily Net Assets | Annual Fee Rate | ||||||
| Up to $100 million | 1.10 | % | |||||
| $100 million to $250 million | 0.95 | % | |||||
| $250 million to $500 million | 0.90 | % | |||||
| $500 million to $1 billion | 0.80 | % | |||||
| $1 billion and over | 0.72 | % | |||||
For the six months ended June 30, 2009, the Fund's annualized effective investment advisory fee rate was 0.88% of average daily net assets.
CWAM provides administrative services and receives an administration fee from the Fund at the following annual rates:
| Wanger Advisors Trust Aggregate Average Daily Net Assets of the Trust | Annual Fee Rate | ||||||
| Up to $4 billion | 0.05 | % | |||||
| $4 billion to $6 billion | 0.04 | % | |||||
| $6 billion to $8 billion | 0.03 | % | |||||
| $8 billion and over | 0.02 | % | |||||
For the six months ended June 30, 2009, the Fund's annualized effective administration fee rate was 0.05% of average daily net assets. CWAM has delegated to Columbia Management Advisors, LLC ("Columbia"), an indirect, wholly owned subsidiary of BOA, the responsibility for certain administrative services.
Certain officers and trustees of the Trust are also officers of CWAM. The Trust makes no direct payments to its officers and trustees who are affiliated with CWAM.
The Board of Trustees has appointed a Chief Compliance Officer to the Trust in accordance with federal securities regulations. The Fund, along with other affiliated funds, pays its pro-rata share of the expenses associated with the Office of the Chief Compliance Officer. These expenses are disclosed separately as "Chief compliance officer expenses" in the Statement of Operations.
The Trust offers a deferred compensation plan for its independent trustees. Under that plan, a trustee may elect to defer all or a portion of his or her compensation. Amounts deferred are retained by the Trust and represent an unfunded obligation of the Trust. The value of amounts deferred is determined by reference to the change in value of Class Z shares of one or more series of Columbia Acorn Trust or a money market fund as specified by the trustee. Benefits under the deferred compensation plan are payable when the trustee ceases to be a member of the Board of Trustees.
Columbia Management Distributors, Inc. (the "Distributor"), an affiliate of Columbia and an indirect, wholly owned subsidiary of BOA, serves as the principal underwriter of the Trust and receives no compensation from the Fund for its services.
Columbia Management Services, Inc. (the "Transfer Agent"), an affiliate of Columbia and an indirect, wholly owned subsidiary of BOA, provides shareholder services to the Fund and has subcontracted with Boston Financial Data Services ("BFDS") to serve as subtransfer agent. For such services, the Transfer Agent receives a fee, paid monthly, at the annual rate of $21.00 per open account. The Transfer Agent also receives reimbursement for certain out-of-pocket expenses.
An affiliated person of the Fund may include any company in which the Fund owns five percent or more of its outstanding voting shares. On June 30, 2009, the Fund held five percent or more of the outstanding voting securities of one or more companies. Details of investments in those affiliated companies are presented in the Notes to the Statement of Investments on page 12.
During the six months ended June 30, 2009, the Fund did not engage in purchase and sales transactions with funds that have a common investment advisor (or affiliated investment advisors), common directors/trustees, and/or common officers.
21
Wanger International 2009 Semiannual Report
Notes to Financial Statements, continued (Unaudited)
5. Derivative Instruments
Derivatives not accounted for as hedging instruments under Statement 133
Forward foreign currency exchange contracts
Fair Value of Derivative Instruments as of June 30, 2009
| Asset | Liability | ||||||||||||||
| Statement of Assets and Liabilities | Fair Value | Statement of Assets and Liabilities | Fair Value | ||||||||||||
| Unrealized appreciation on forward foreign | Unrealized depreciation on forward foreign | ||||||||||||||
| currency exchange | currency exchange | ||||||||||||||
| contracts | $ | 1,221,166 | contracts | $ | 2,021,835 | ||||||||||
| Total | $ | 1,221,166 | $ | 2,021,835 | |||||||||||
Amount of Realized Gain or (Loss) on Derivatives Recognized in Income on the Statement of Operations for the Six Months Ended June 30, 2009
| Forward Foreign Currency Exchange Contracts | Total | ||||||||||
| Net realized gain (loss) on foreign currency transactions and forward foreign currency exchange contracts | $ | (1,541,927 | ) | $ | (1,541,927 | ) | |||||
| Total | $ | (1,541,927 | ) | $ | (1,541,927 | ) | |||||
Change in Unrealized Appreciation or (Depreciation) on Derivatives Recognized in Income on the Statement of Operations for the Six Months Ended June 30, 2009
| Forward Foreign Currency Exchange Contracts | Total | ||||||||||
| Net change in unrealized appreciation (depreciation) on foreign currency translations and forward foreign currency exchange contracts | $ | 200,009 | $ | 200,009 | |||||||
6. Borrowing Arrangements
The Trust participates in a $150 million credit facility, which was entered into to facilitate portfolio liquidity. Under the facility, interest is charged to each participating fund based on its borrowings at a rate per annum equal to the higher of Federal Funds Rate or Overnight LIBOR plus 0.750%. In addition, a commitment fee of 0.12% per annum of the unutilized line of credit is accrued and apportioned among the participating funds based on their relative net assets. The commitment fee is included in "Other expenses" in the Statement of Operations. No amounts were borrowed by the Fund under this facility during the six months ended June 30, 2009. The Trust enters into this line of credit for one year durations. The Trust has secured the line of credit for the entire year of 2009.
7. Fund Share Transactions
Proceeds and payments on Fund shares as shown in the Statement of Changes in Net Assets are in respect of the following numbers of shares:
| Six Months Ended June 30, 2009 | Year Ended December 31, 2008 | ||||||||||
| Shares sold | 989,331 | 8,261,042 | |||||||||
| Shares issued in reinvestment of dividend distributions | 1,279,886 | 6,005,699 | |||||||||
| Less shares redeemed | (3,357,052 | ) | (5,704,494 | ) | |||||||
| Net increase (decrease) in shares outstanding | (1,087,835 | ) | 8,562,247 | ||||||||
8. Investment Transactions
The aggregate cost of purchases and proceeds from sales other than short-term obligations for the six months ended June 30, 2009 were $211,593,497 and $219,653,274, respectively.
9. Legal Proceedings
CWAM, Columbia Acorn Trust, (another mutual fund family advised by CWAM), and the trustees of Columbia Acorn Trust (collectively, the "Columbia defendants") are named as defendants in class and derivative complaints that have been consolidated in a Multi-District Action (the "MDL Action") in the federal district court of Maryland. These lawsuits contend that defendants permitted certain investors to market time their trades in certain Columbia Acorn Funds. The MDL Action is ongoing. However, all claims against the Trust and the independent trustees of Columbia Acorn Trust have been dismissed.
Columbia Acorn Trust and CWAM are also defendants in a class action lawsuit that alleges, in summary, that Columbia Acorn Trust and CWAM exposed shareholders of Columbia Acorn International Fund to trading by market timers by allegedly: (a) failing to properly evaluate daily whether a significant event affecting the value of that fund's securities had occurred after foreign markets had closed but before the calculation of the funds' net asset value ("NAV"); (b) failing to implement the fund's portfolio valuation and share pricing policies and procedures; and (c) failing to know and implement applicable rules and regulations concerning the calculation of NAV (the "Fair Valuation Lawsuit"). The Seventh Circuit ruled that the plaintiffs' state law claims were preempted under federal law resulting in the dismissal of plaintiffs' complaint. Plaintiffs appealed the Seventh Circuit's ruling to the United States Supreme Court. The Supre me Court reversed the Seventh Circuit's ruling on jurisdictional grounds and the case was ultimately remanded to the state court.
On March 21, 2005, a class action complaint was filed against the Trust and CWAM seeking to rescind the CDSC assessed upon redemption of Class B shares of the Columbia Acorn Funds due to the alleged market timing of the Columbia Acorn Funds (the "CDSC Lawsuit"). In addition to the rescission of sales charges, plaintiffs seek recovery of actual damages, attorneys' fees and costs. The case has been transferred to the MDL Action in the federal district court of Maryland.
On September 14, 2007, the plaintiffs and the Columbia defendants named in the MDL Action, including the Columbia Funds, entered into a stipulation of settlement with respect to all Columbia-related claims in the MDL Action described above, including the CDSC and Fair Valuation Lawsuits. The settlement is subject to court approval.
Columbia Acorn Funds and CWAM intend to defend these suits vigorously. CWAM believes that the lawsuits are not likely to materially affect its ability to provide investment management services to the Fund.
22
Wanger International 2009 Semiannual Report
[Excerpt from:]
Wanger Advisors Trust
Management Fee Evaluation of the Senior Officer
Prepared Pursuant to the New York Attorney General's
Assurance of Discontinuance
May 2009
23
Wanger International 2009 Semiannual Report
Introduction
The New York Attorney General's Assurance of Discontinuance ("Order") entered into by Columbia Management Advisors, Inc. ("CMAI") and Columbia Management Distributors, Inc., ("CMDI" and collectively with "CMAI," "CMG") in February 2005, allows CMAI to manage or advise a mutual fund only if the trustees of the fund appoint a "Senior Officer" to perform specified duties and responsibilities. One of these responsibilities includes "managing the process by which proposed management fees (including but not limited to, advisory fees) to be charged the [Funds] are negotiated in a manner which is at arms' length and reasonable and consistent with this Assurance of Discontinuance."
This is the third year that the Columbia Acorn Trust and Wanger Advisors Trust (collectively, the "Trusts") and each series thereof (the "Acorn funds," "WAT funds" or collectively, the "Funds") have been overseen by the same Board of Trustees ("Board"). The Order provides that this Board must determine the reasonableness of proposed "management fees" by using either an annual competitive bidding process supervised by the Senior Officer or Independent Fee Consultant, or by obtaining "an annual independent written evaluation prepared by or under the direction of the Senior Officer or the Independent Fee Consultant."
"Management fees" are only part of the costs and expenses paid by mutual fund shareholders. Fund expenses can vary depending upon the class of shares held but usually include: (1) investment management or advisory fees to compensate analysts and portfolio managers for stock research and portfolio management, as well as the cost of operating a trading desk; (2) administrative expenses incurred to prepare registration statements and tax returns, calculate the Funds' net asset values, maintain effective compliance procedures and perform recordkeeping services; (3) transfer agency costs for establishing accounts, accepting and disbursing funds, as well as overseeing trading in Fund shares; (4) custodial expenses incurred to hold the securities purchased by the Funds; and (5) distribution expenses, including commissions paid to brokers that sell the Fund shares to investors.
Columbia Wanger Asset Management, L.P. ("CWAM"), the adviser to the Funds, has proposed that the Trusts continue the existing separate agreements governing the first two categories listed above: an advisory agreement governing portfolio management, and an administration agreement governing certain administration and clerical services. Together the fees paid under these two agreements are referred to as "management fees." Other fund expenses are governed by separate agreements, in particular agreements with two CWAM affiliates: CMDI, the broker-dealer that underwrites and distributes the Funds' shares, and Columbia Management Services, Inc. ("CMSI"), the Funds' transfer agent. In conformity with the terms of the Order, this evaluation, therefore, addresses only the advisory and administrative contracts, and does not extend to the other agreements.
According to the Order, the Senior Officer's evaluation must consider at least the following:
(1) Management fees (including components thereof) charged to institutional and other clients of CWAM for like services;
(2) Management fees (including any components thereof) charged by other mutual fund companies for like services;
(3) Costs to CWAM and its affiliates of supplying services pursuant to the management fee agreements, excluding any intra-corporate profit;
(4) Profit margins of CWAM and its affiliates from supplying such services;
(5) Possible economies of scale as the Funds grow larger; and
(6) The nature and quality of CWAM's services, including the performance of each Fund.
In 2004, the Boards of the two Trusts, then separate groups, each appointed me Senior Officer under the Order. They also determined not to pursue a competitive bidding process and instead, charged me with the responsibility of evaluating the Funds' proposed advisory and administrative fee contracts with CWAM in conformity with the requirements of the Order. This Report is an annual evaluation required under the Order. In discharging their responsibilities, the independent Trustees have also consulted independent, outside counsel.
2008 Evaluation
This is the fourth annual evaluation prepared in connection with the Order. This evaluation follows the same structure as the earlier studies. Some areas are given more emphasis here, while others are given less. Still, the fundamental information gathered for this evaluation is largely the same as past years. Last year's evaluation is referred to here as the "2008 Study."
Process and Independence
The objectives of the Order are to ensure the independent evaluation of the management fees paid by the Funds as well as to insure that all relevant factors are considered. In my view, this contract renewal process has been conducted at arms-length and with independence in gathering, considering and evaluating all relevant data. At the outset of the process, the Trustees sought and obtained from CWAM and CMG a comprehensive compilation of data regarding Fund performance and expenses, adviser profitability, and other information. The Contract Committee evaluated this information thoroughly. Performance and expense data was obtained from both Morningstar and Lipper, the leading consultants in this area. The rankings prepared by Morningstar and Lipper were independent and not influenced by the adviser.
In the course of its work, the Contract Committee gave careful consideration to the conclusions and recommendations contained in the 2008 Study. The Committee recommended, and the Board accepted and implemented several of the recommendations in this area contained in the 2008 Study.
24
Wanger International 2009 Semiannual Report
My evaluation of the advisory contracts was shaped, as it was last year, by my experience as Chief Compliance Officer of the Trusts ("CCO"). As CCO, I report solely to the Board and have no reporting obligation to, or employment relationship with, CMG or its affiliates, except for administrative purposes. I have commented on compliance matters in evaluating the quality of service provided by CWAM.
This Report, its supporting materials and the data contained in other materials submitted to the Contract Committee of the Board, in my view, provide a thorough factual basis upon which the Board, in consultation with independent counsel as it deems appropriate, may conduct management fee negotiations that are in the best interests of the Funds' shareholders.
The Fee Reductions Mandated under the Order
Under the terms of the Order, CMG agreed to secure certain management fee reductions for the mutual funds advised by its affiliate investment advisers. In some instances, breakpoints were also established. Although neither CWAM nor the Trusts was a party to the Order, CWAM offered and the Board accepted certain advisory fee reductions during 2005. By the terms of the Order, these fees may not be increased before November 30, 2009. I have used these advisory fee levels, as modified thereafter, in this evaluation because they are the fees in the current agreements that CWAM proposes should be continued. Hence, these fee levels are the starting point of an evaluation.
Conclusions
My review of the data and other material above leads to the following conclusions with respect to the factors identified in the Order.
1. Performance. Wanger Select and Wanger USA have suffered significant declines in ranking relative to their peers for the past five years. In contrast, the international Funds have improved their relative performance and enjoy solid rankings.
2. Management Fees relative to Peers. Management fees vary by WAT fund but, in general, the WAT funds impose higher fees than competing funds. Wanger Select and Wanger USA in particular were ranked by both Lipper and Morningstar at or below the median, and therefore impose higher fees than do the majority of their competitors.
3. Administrative Fees. The WAT funds' administrative fees are generally less competitive than are the fees charged by competitors, but these rankings suffer from a lack of uniformity in the scope of services encompassed by the fee. CWAM provides excellent administrative support for all the WAT funds. There are clear advantages to retaining the adviser and its affiliates to perform these services.
4. Management Fees relative to Institutional and Other Mutual Fund Accounts. CWAM's focus is on its mutual funds. It does not actively seek to manage separate or institutional accounts. The few institutional accounts it does manage vary in rate structures. Some pay advisory fees commensurate with or higher than the WAT funds. In addition, CWAM is now considering a new institutional account for a WAT shareholder that may enjoy a management fee significantly lower than the parallel mutual fund, and could adversely impact existing WAT shareholders.
5. Costs to CWAM and its Affiliates. CWAM's direct costs do not appear excessive. Overhead and indirect costs allocated to CWAM by its parent organizations, however, are significant and have varied considerably over the years. CWAM's affiliates report operating losses and therefore do not appear to enjoy excessive "fall out" benefits from CWAM's advisory agreement with the Funds.
6. Profit Margins. CWAM's pre-marketing expense profit margins are at the top of the industry, even in a difficult year such as 2008, though these comparisons are hampered by limited industry data. High profit margins are not unexpected for firms that manage large, successful funds and have provided outstanding investment performance for investors.
7. Economies of Scale. Economies of scale do exist at CWAM and will continue if asset levels return to those of past years. The Board has recently imposed additional breakpoints for some of the WAT funds that will result in greater sharing of economies of scale.
8. Nature and Quality of Services. This category includes a variety of considerations that are difficult to quantify, yet can have a significant bearing on the performance of the Funds. Several areas merit comment.
a. Capacity. CWAM has maintained its investment management capacity even in a difficult environment.
b. Compliance. CWAM has a reasonably designed compliance program that protects shareholders.
9. Process. In my opinion, the process of negotiating an advisory contract for the Funds has been conducted thoroughly and at arms' length. Further, the Trustees have sufficient information to evaluate management's proposal, and negotiate contract terms that are in the best interests of Fund shareholders.
25
Wanger International 2009 Semiannual Report
Recommendations
I believe the Trustees should:
1. Monitor closely the performance of Wanger Select and Wanger USA to ensure that appropriate steps are being taken by CWAM to improve their relative performance.
2. Consider imposing limitations on the use of soft dollars. While CWAM's use of soft dollars is consistent with the applicable regulatory requirements, the Board should have a clear understanding with CWAM regarding the cost to shareholders of the research purchased with Fund commission dollars.
3. Focus their review on the WAT funds' management fee levels in relation to their peers, in particular the fees paid by Wanger USA and Wanger Select. These Funds pay fees that are, in the views of both Morningstar and Lipper, significantly higher than their peers.
4. Seek assurances that CWAM and its affiliates will continue to provide adequate support to the WAT funds despite the recent downturn in market values and the difficulties faced by CWAM's ultimate parent organization, Bank of America. Similar assurances should be sought from any prospective purchaser of CWAM or its parent organization.
Robert P. Scales
May 26, 2009
26
Wanger International 2009 Semiannual Report
Wanger Advisors Trust Board Approval of the Advisory Agreement 2009
Wanger Advisors Trust (the "Trust") has an investment advisory agreement (the "Advisory Agreement") with Columbia Wanger Asset Management, L.P. ("CWAM") under which CWAM manages the Columbia Wanger Family of Funds (the "Funds"). The trustees of the Trust, more than seventy five percent of whom have never been affiliated with CWAM (the "Independent Trustees"), oversee the management of each Fund and, as required by law, determine at least annually whether to continue the Advisory Agreement for each Fund.
The Contract Committee of the board of trustees (the "Committee"), which is comprised of six Independent Trustees, makes recommendations to the board regarding any proposed continuation of the Advisory Agreement. After the Committee has made its recommendations, the full board of trustees determines whether to approve continuation of the Advisory Agreement. The board also considers matters bearing on the Advisory Agreement at its various meetings throughout the year, and meets at least quarterly with CWAM's portfolio managers.
In connection with their most recent consideration of the Advisory Agreement for each Fund, the Committee and all trustees received and reviewed a substantial amount of information provided by CWAM in response to requests from the Independent Trustees and their independent legal counsel. In addition, the Contract Committee met with the Investment Performance Committee, also comprised exclusively of Independent Trustees, to review performance related issues. As they considered the Advisory Agreement, the Independent Trustees were advised by independent legal counsel. At each meeting where the Committee or the Independent Trustees considered the Advisory Agreement, they met with management and also met in separate executive session with their independent legal counsel.
The materials reviewed by the Committee and the trustees included, among other items, (i) information on the investment performance of each Fund and its peer groups and performance benchmarks, (ii) information on each Fund's advisory fees and other expenses, including information comparing the Fund's fees and expenses to those of peer groups of funds and information about any applicable expense limitations and fee "breakpoints," (iii) data on sales and redemptions of Fund shares and (iv) information on the profitability to CWAM, as well as potential "fall-out" or ancillary benefits that CWAM and its affiliates may receive as a result of their relationships with the Funds. The trustees also considered other information such as (i) CWAM's financial condition, (ii) each Fund's investment objective and strategies, (iii) the size, education and experience of CWAM's investment staff and its use of technology, external research and tra ding cost measurement tools, (iv) the allocation of the Funds' brokerage, if any, including allocations to brokers affiliated with CWAM, and the use of "soft" commission dollars to pay for research products and services, (v) the resources devoted to, and the record of compliance with, the Funds' investment policies and restrictions, policies on personal securities transactions and other compliance policies and (vi) the economic and market outlook generally and for the mutual fund industry in particular, including the market-related events in 2008. In addition, the trustees conferred with, and reviewed the Management Fee Evaluation (the "Fee Evaluation") prepared by the Trust's chief compliance officer, who also serves as the Trust's "Senior Officer," as contemplated by the Assurance of Discontinuance dated February 9, 2005 among affiliates of CWAM and the Office of the New York Attorney General. A summary of the Fee Evaluation is included in this report. Throughout the annual contract renewal process, the tr ustees had the opportunity to ask questions of and request additional materials from CWAM.
The Committee held meetings in May 2009 and reported its recommendations to the full board of trustees. On June 10, 2009, the board of trustees unanimously approved continuation through July 31, 2010 of (i) the Advisory Agreement and (ii) the Trust's administrative services agreement with CWAM (the "Administration Agreement").
In considering the continuation of the Advisory Agreement and the continuation of the amended Administration Agreement, the trustees reviewed and analyzed various factors that they determined were relevant, including the factors described below, none of which by itself was considered dispositive. However, the material factors and conclusions that formed the basis for the trustees' determination to approve the continuation of the Advisory Agreement and the amended Administration Agreement are discussed separately below.
Nature, quality and extent of services. The trustees reviewed the nature, quality and extent of the services of CWAM and its affiliates to the Funds, taking into account the investment objective and strategy of each Fund and knowledge gained from meetings with management, which were held on at least a quarterly basis. In addition, the trustees reviewed the available resources and key personnel of CWAM and its affiliates, especially those providing investment management services to the Funds. The trustees also considered other services provided to the Funds by CWAM and its affiliates, including: managing the execution of portfolio transactions and selecting broker-dealers for those transactions; monitoring adherence to the Funds' investment restrictions; producing shareholder reports; providing support services. for the board of trustees and committees of the board; communicating with shareholders; serving as the Funds' administrator; and overseeing the activities of the Funds' other service providers, including monitoring for compliance with various policies and procedures as well as applicable securities laws and regulations.
The trustees concluded that the nature, quality and extent of the services provided by CWAM and its affiliates to each Fund were appropriate and consistent with the terms of the Advisory Agreement and the Administration Agreement, and that the quality of those services had been consistent with or superior to quality norms in the industry. The trustees further concluded that the Funds were likely to benefit from the continued provision of those services by CWAM to the Funds. They also concluded that CWAM currently had sufficient personnel, with appropriate education and experience, to serve the Funds effectively, and had demonstrated its continuing ability to attract and retain well qualified personnel.
Performance of the Funds. At various meetings of the board of trustees, the Committee and the Investment Performance Committee of the board, the trustees considered the short-term and longer-term performance of each Fund. They reviewed information comparing each Fund's performance with that of its benchmark(s) and with the performance of comparable funds and peer groups as identified by Lipper Inc. ("Lipper") and Morningstar, Inc. ("Morningstar"). On the domestic side, the trustees discussed that each of Wanger USA and Wanger Select had a particularly difficult performance year during 2008, which the trustees acknowledged. In that regard, Wanger USA and Wanger Select both underperformed their respective benchmarks and peer group averages for the five-year period. In evaluating the underperformance of these two Funds, the trustees considered that CWAM was taking steps to remediate the underperformance, which the trustees would monitor. The trustees also reviewed the performance of the international Funds, discussing how both Wanger International and Wanger International Select continued to outperform their benchmarks and the majority of their peer groups established by Lipper and Morningstar over the five-year period. During the annual contract renewal process, the trustees concluded that, although past performance is not necessarily indicative of future results, the international Funds' strong overall longer-term performance record was an important factor in the their evaluation of the quality of services provided by CWAM under the Advisory Agreement.
Costs of Services and Profits Realized by CWAM. At various Committee and board of trustees meetings and other informal meetings, the trustees examined detailed information on the fees and expenses of each Fund in comparison to information for other comparable funds provided by Lipper and Morningstar. As noted in the Fee Evaluation, the contractual rates of investment advisory fees and the actual advisory fees paid by Wanger Select and Wanger USA were higher than the median advisory fee rates of their
27
Wanger International 2009 Semiannual Report
Wanger Advisors Trust Board Approval of the Advisory Agreement 2009
respective peer groups. The trustees also considered the advisory fees of the Funds relative to those of the series of Columbia Acorn Trust ("Acorn"), a group of funds with similar investment strategies also overseen by the trustees and managed by CWAM. The trustees noted that the Funds' advisory fees were comparable to those of the Acorn funds.
The trustees reviewed the analysis of the profitability of CWAM in serving as each Fund's investment adviser and of CWAM and its affiliates in their relationships with each Fund, as well as an explanation of the methodology utilized in allocating various expenses among the Funds and other business units, each of which was included in the Fee Evaluation. The trustees considered the methodology used by CWAM in determining compensation payable to portfolio managers and the competitive market for investment management talent. They discussed how profitability comparisons among fund managers are not very meaningful due to the small number of publicly-owned managers, and how the profitability of any investment manager is affected by numerous factors, including its particular organizational structure, the types of funds and other accounts managed, other lines of business, expense allocation methodology, capital structure and cost of cap ital.
The trustees also reviewed the advisory fees charged by CWAM for managing other investment companies, sub-advised funds and other institutional separate accounts, as detailed in the Fee Evaluation. CWAM's institutional separate account fees for various investment strategies were examined and in some cases those fees were higher than the advisory fees charged to the Funds, and in some instances the Funds' fees were higher. The trustees noted that CWAM performs significant additional services for the Funds that it does not provide to sub-advised funds or non-mutual fund clients, including administrative services, oversight of the Funds' other service providers, trustee support, regulatory compliance and numerous other services, and that, in servicing the Funds, CWAM assumes many legal risks that it does not assume in servicing many of its other clients. Finally, as part of the annual contract renewal process, the trustees consider ed CWAM's financial condition as a result of market-related declines in assets in 2008 and 2009, and the possible impending sale of Bank of America's controlling interest in CWAM.
The trustees concluded that the rates of advisory fees and other compensation payable by the Funds to CWAM and its affiliate's were reasonable in relation to the nature and quality of the services to be provided, taking into account the fees charged by other advisers for managing comparable mutual funds with similar strategies and the fees CWAM charges to other clients. The trustees also concluded that the Funds' estimated overall expense ratios were reasonable, considering the quality of services provided by CWAM and its affiliates and the investment performance of the Funds.
Economies of Scale. At various meetings throughout the annual contract renewal process, the trustees considered information about the extent to which CWAM realizes economies of scale in connection with the increase of Fund assets. The trustees noted that the advisory fee schedule for each Fund includes breakpoints in the rate of fees at various asset levels. They noted that the Funds also share directly in economies of scale through lower charges by third party service providers based on the combined scale of all of the Funds. The trustees concluded that the current fee structure of each Fund was reasonable and reflective of a sharing between CWAM and the Funds of economies of scale.
Other Benefits to CWAM. The trustees also reviewed benefits that accrue to CWAM and its affiliates from their relationships with the Funds, as outlined in the Fee Evaluation. They noted that the Funds' transfer agent and distributor were each affiliates of CWAM and that the transfer agent received compensation from the Funds for services provided. The trustees considered ways, other than the services provided by CWAM and its affiliates pursuant to various agreements and the fees to be paid by each Fund therefor, that the Funds and CWAM may potentially benefit from their relationship with each other. At various Committee meetings, the trustees also considered CWAM's use of commissions paid by each Fund on its portfolio brokerage transactions to obtain research products and services benefiting the Fund and/or other clients of CWAM. They determined that CWAM's use of the Funds' "soft" commission dollars to obtain research products and services was consistent with regulatory requirements and guidance then in effect. They also concluded that CWAM benefits from the receipt of proprietary research products and services acquired through commissions paid on portfolio transactions of the Funds, and that the Funds benefit from CWAM's receipt of those products and services as well as research products and services acquired through commissions paid by other clients of CWAM. The trustees further determined that the success of any Fund could attract other business to CWAM or the Funds and that the success of CWAM could enhance its ability to serve the Funds.
After full consideration of the above factors, as well as other factors that were instructive in evaluating the Advisory Agreement, the trustees, including the Independent Trustees, concluded that the continuation of the Advisory Agreement and continuation of the Administration Agreement was in the best interest of each Fund. On June 10, 2009, the trustees approved continuation of the Advisory Agreement and the Administration Agreement , as so amended, through July 31, 2010.
28
Wanger International 2009 Semiannual Report

Columbia Wanger Funds
Trustees
Robert E. Nason*
Chairman of the Board
Allan B. Muchin
Vice Chairman of the Board
Laura M. Born
Michelle L. Collins
Maureen M. Culhane
Margaret M. Eisen
Jerome Kahn, Jr.
Steven N. Kaplan
David C. Kleinman
Charles P. McQuaid
James A. Star
Ralph Wanger
John A. Wing
Officers
Charles P. McQuaid
President
Ben Andrews
Vice President
Michael G. Clarke
Assistant Treasurer
Jeffrey R. Coleman
Assistant Treasurer
P. Zachary Egan
Vice President
Peter T. Fariel
Assistant Secretary
John M. Kunka
Assistant Treasurer
Joseph C. LaPalm
Vice President
Bruce H. Lauer
Vice President, Secretary and Treasurer
Louis J. Mendes III
Vice President
Robert A. Mohn
Vice President
Christopher J. Olson
Vice President
Robert P. Scales
Chief Compliance Officer, Chief Legal Officer, Senior Vice President and General Counsel
Linda K. Roth-Wiszowaty
Assistant Secretary
*Deceased, June 27, 2009.
Transfer Agent,
Dividend Disbursing Agent
Columbia Management Services, Inc.
P.O.Box 8081
Boston, Massachusetts
02266-8081
Distributor
Columbia Management Distributors, Inc.
One Financial Center
Boston, Massachusetts
02111-2621
Investment Advisor
Columbia Wanger Asset Management, L.P.
227 West Monroe Street, Suite 3000
Chicago, Illinois 60606
1-888-4-WANGER
(1-888-492-6437)
Legal Counsel to the Fund
K&L Gates LLP
Washington, DC
Legal Counsel to the Independent Trustees
Drinker Biddle & Reath LLP
Philadelphia, Pennsylvania
Independent Registered Public Accounting Firm
PricewaterhouseCoopers LLP
Chicago, Illinois
This report, including the schedules of investments and financial statements, is submitted for the general information of the shareholders of the Wanger Advisors Trust.
A description of the Fund's proxy voting policies and procedures and a copy of the Fund's voting record for the most recent 12-month period ended June 30 are available (i) on the Securities and Exchange Commission's website at www.sec.gov, and (ii) without charge, upon request, by calling 888-492-6437.
The Fund files a complete schedule of portfolio holdings with the SEC for the first and third quarters of each fiscal year on Form N-Q. The Fund's Form N-Q is available on the SEC's website at www.sec.gov and may be reviewed and copied at the SEC's Public Reference Room in Washington, D.C. Information on the operation of the Pubic Reference Room may be obtained by calling 800-SEC-0330.
29
Columbia Wanger Funds
0L2568S
SHC-44/20003-0609 09/87166
Wanger Select
2009 Semiannual Report

| NOT FDIC INSURED | May Lose Value | ||||||
| NOT BANK ISSUED | No Bank Guarantee | ||||||
Wanger Select 2009 Semiannual Report
Robert E. Nason Remembered

Robert E. Nason
On June 27, 2009, Wanger Advisors Trust Board of Trustees chairman Robert E. Nason passed away. Bob was a man of great personal integrity who maintained the independence of the Board and worked to promote the interests of shareholders. He served as chairman of the Wanger Advisors Trust Board from September 2006 until his death.
Bob brought impressive credentials to the Board. He served as CEO of the accounting firm Grant Thornton where he worked for 40 years.
Bob's tenure as chairman occurred during a period of change in the investment environment. Throughout, he served our shareholders well. As regulators pushed mutual fund boards toward more independence from fund advisors, Bob successfully maintained the Wanger Advisors Trust Board's history of independence. The Trust's advisor, Columbia Wanger Asset Management (CWAM), was also faced with ownership changes and the retirement of founder Ralph Wanger. Following these events, Bob and the Board saw to it that CWAM stayed the course, maintaining its time-tested investment process, developing and keeping talented investment professionals, and sustaining its autonomous and creative environment. Under Bob's leadership, the Board implemented fee breakpoints, allowing shareholders to benefit from growth and economies of scale. After intensive analysis, Bob and the Board also successfully initiated securities lending.
Bob is survived by his wife Carol, son Steven (Abbie Baynes), daughter Jill and grandchildren Sara and Ben. We are fortunate to have known Bob and we will miss him. He was a man of great vision and we will strive to build on the momentum that he created and to maintain the legacies of the Wanger Advisors Trust.

Allan Muchin
Vice Chairman of the Board of Trustees
Wanger Advisors Trust

Charles McQuaid
President and Chief Investment Officer
Columbia Wanger Asset Management, L.P.

Wanger Select
2009 Semiannual Report
Table of Contents
| 2 | Understanding Your Expenses | ||||||
| 3 | Agriculture's Amazing Progress | ||||||
| 6 | Performance Review | ||||||
| 8 | Statement of Investments | ||||||
| 12 | Statement of Assets and Liabilities | ||||||
| 12 | Statement of Operations | ||||||
| 13 | Statement of Changes in Net Assets | ||||||
| 14 | Financial Highlights | ||||||
| 15 | Notes to Financial Statements | ||||||
| 18 | Management Fee Evaluation of the Senior Officer | ||||||
| 22 | Wanger Advisors Trust Board Approval of the Advisory Agreement 2009 | ||||||
Columbia Wanger Asset Management, L.P. ("CWAM") is one of the leading global small- and mid-cap equity managers in the United States with nearly 40 years of small- and mid-cap investment experience. As of June 30, 2009, CWAM manages $21.3 billion in assets and is the investment advisor to Wanger USA, Wanger International, Wanger Select, Wanger International Select (together, the "Columbia Wanger Funds") and the Columbia Acorn Family of Funds. Columbia Management Group, LLC ("Columbia Management") is the investment management division of Bank of America Corporation. Columbia Management entities furnish investment management services and products for institutional and individual investors. The Columbia Wanger Funds and the Columbia Acorn Family of Funds (together with other funds ad vised by Columbia Management affiliates, the "Columbia Funds") are distributed by Columbia Management Distributors, Inc., member of FINRA, SIPC, part of Columbia Management and an affiliate of Bank of America Corporation. CWAM is a registered investment advisor and an indirect, wholly owned subsidiary of Bank of America Corporation. CWAM is part of Columbia Management.
Please consider the investment objectives, risks, charges and expenses for the Fund carefully before investing. Contact 1-888-4-WANGER for a prospectus, which contains this and other important information about the Fund. You should read it carefully before you invest.
An important note: Columbia Wanger Funds are sold only to certain life insurance companies in connection with certain variable annuity contracts, variable life insurance policies and eligible qualified retirement plans.
The views expressed in "Agriculture's Amazing Progress" and in the Performance Review reflect the current views of the respective authors. These views are not guarantees of future performance and involve certain risks, uncertainties and assumptions that are difficult to predict so actual outcomes and results may differ significantly from the views expressed. These views are subject to change at any time based upon economic, market or other conditions and the respective authors disclaim any responsibility to update such views. These views may not be relied on as investment advice and, because investment decisions for a Columbia Fund are based on numerous factors, may not be relied on as an indication of trading intent on behalf of any particular Columbia Fund. References to specific company securities should not be construed as a recommendation or investment advice.
1
Wanger Select 2009 Semiannual Report
Understanding Your Expenses
As a Fund shareholder, you incur two types of costs. There are transaction costs, which generally include sales charges on purchases and may include redemption or exchange fees. There are also ongoing costs, which generally include investment advisory fees and other Fund expenses. The information on this page is intended to help you understand your ongoing costs of investing in the Fund and to compare these costs with the ongoing costs of investing in other mutual funds.
Analyzing your Fund's expenses
To illustrate these ongoing costs, we have provided an example and calculated the expenses paid by investors in the Fund during the period. The information in the following table is based on an initial hypothetical investment of $1,000, which is invested at the beginning of the period and held for the entire period. Expense information is calculated two ways and each method provides you with different information. The amount listed in the "Actual" column is calculated using actual operating expenses and total return for the Fund. The amount listed in the "Hypothetical" column assumes that the return each year is 5% before expenses and then applies the Fund's actual expense ratio for the period to the hypothetical return. You should not use the hypothetical account values and expenses to estimate either your actual account balance at the end of the period or the expenses you paid during the period. See the "Compare with other fun ds" information for details on using the hypothetical data.
Estimating your actual expenses
To estimate the expenses that you actually paid over the period, first you will need your account balance at the end of the period.
1. Divide your ending account balance by $1,000. For example, if an account balance was $8,600 at the end of the period, the result would be 8.6.
2. In the section of the table below titled "Expenses paid during the period," you will find a dollar amount in the column labeled "Actual." Multiply this amount by the result from step 1. Your answer is an estimate of the expenses you paid on your account during the period.
January 1, 2009 – June 30, 2009
| Account value at the beginning of the period ($) | Account value at the end of the period ($) | Expenses paid during the period ($) | Fund's annualized expense ratio (%)* | ||||||||||||||||||||||||||||
| Actual | Hypothetical | Actual | Hypothetical | Actual | Hypothetical | Actual | |||||||||||||||||||||||||
| Wanger Select | 1,000.00 | 1,000.00 | 1,242.19 | 1,020.03 | 5.34 | 4.81 | 0.96 | ||||||||||||||||||||||||
*For the six months ended June 30, 2009.
Expenses paid during the period are equal to the Fund's annualized expense ratio, multiplied by the average account value over the period, then multiplied by the number of days in the Fund's most recent fiscal half-year and divided by 365.
It is important to note that the expense amounts shown in the table are meant to highlight only ongoing costs of investing in the Fund. Expenses paid during the period do not include any insurance charges imposed by your insurance company's separate account. The hypothetical example provided is useful in comparing ongoing costs only and will not help you determine the relative total costs of owning different funds whose shareholders may incur transaction costs.
Compare with other funds
Since all mutual funds are required to include the same hypothetical calculations about expenses in shareholder reports, you can use this information to compare the ongoing cost of investing in the Fund with other funds. To do so, compare the 5% hypothetical example with the 5% hypothetical examples of other funds. As you compare hypothetical examples of other funds, it is important to note that hypothetical examples are meant to highlight the ongoing cost of investing in a fund and do not reflect any transaction costs, such as sales charges, redemption fees or exchange fees that may be incurred by shareholders of other funds. Expenses paid during the period do not include any insurance charges imposed by your insurance company's separate accounts.
2
Wanger Select 2009 Semiannual Report

Agriculture's Amazing Progress
Following a conversation with two of our analysts regarding the prospects for several fertilizer companies, I decided to learn more about the history and current state of agriculture. According to Marcel Mazoyer and Laurence Roudart's, A History of World Agriculture,1 farming began about 10,000 years ago. One would think that mankind is far down the learning curve in agriculture, and that productivity gains are ending. Surprisingly, quite the opposite is true. Most of the improvements in agriculture have occurred in the last 80 years.
Mazoyer and Roudart's history explains six dominant agricultural processes. The first two of these were employed during the first 8,000 years of agricultural history, obviously a time of very slow progress. Agriculture began with slash and burn techniques, whereby forest segments were successively burned and farmed for a few years until nutrients were depleted. Then, beginning in about 2500 B.C., farmers began using animal drawn scratch-plows and annually rotating land from planted to fallow in an attempt to maintain soil fertility. Other than in exceptionally fertile areas such as the lands replenished by the Nile River, these techniques barely enabled one farmer to feed one family.
Medieval farmers utilized better tools and techniques. They kept more animals and, with the help of wheeled carts and plows, used more animal-based fertilizers. Beginning in the sixteenth century, farmers began planting legumes to enhance nitrogen in the soil, further improving fertility by organic means and eliminating the need for fallowing. Productivity per farmer doubled with each of these developments, enabling the best farmers by the eighteenth century to feed an average of 20 people.
Farms became more mechanized after 1800, using metal plows, sowers, reapers and threshing machines. Transportation also improved allowing better fertilizers, that contained minerals like phosphate and potassium, to reach farmers. These minerals along with nitrogen helped to sustain crop yields. While mechanization doubled the acreage a farmer could cultivate, United States Department of Agriculture (USDA) data indicates that yields per acre of corn and wheat in the United States were flat from 1866, the date of data inception, well into the 1930s.
In the first half of the twentieth century, North American farmers started using motorized equipment, synthetic fertilizers and hybrid seeds. According to Giovanni Federico's, Feeding the World,2 by 1950 farms in the United States and Canada had one tractor for every two farmers. Utilization of fertilizer grew six fold from 1900 to 1950. Hybrid wheat was grown on 87% of the planted acres in the United States in 1921, up from 14% in 1914. Hybrid corn crops jumped from 2% to 90% of acres planted from 1936 to 1945.3
After World War II these innovations spread. Worldwide chemical fertilizer usage grew nearly tenfold from 1950 to 2000. In most continents, over half of wheat, rice and corn acres were sown with high yield varieties by the year 2000. From 1950 to 2000, world agriculture production tripled, far outpacing population growth.4 USDA data indicates that from 1998 to 2008, wheat yields per acre averaged 41 bushels, triple the rate of 100 years ago, and corn yields quintupled to an average of 144 bushels. The best equipped farmers can now produce over four million pounds of grain and feed thousands!5
Launching a "Green Revolution" in Developing Countries
Rich countries had the means to adopt modern agricultural processes while poor regions struggled to advance. Leon Hesser's book, The Man Who Fed the World,6 describes how Dr. Norman Borlaug helped create the Green Revolution7 in many developing countries by improving plant varieties and increasing crop yields. For his efforts, Borlaug won a Nobel Peace Prize, the only one awarded in the twentieth century for work in agriculture.
Mexico redistributed land to poor peasants after its political revolution ended in 1918. However, its peasants remained poor and hungry for decades. In 1940, U.S. vice president elect, Henry Wallace, who had founded Hi-Bred Corn Company (now Pioneer Hi-Bred, a DuPont subsidiary), toured Mexico and was appalled by conditions there. He convinced the Rockefeller Foundation to sponsor efforts to adapt hybrid wheat and corn for Mexico and in 1943, the Mexican Government-Rockefeller Foundation Cooperative Agricultural Program was established.
The program hired Borlaug as its plant pathologist. Borlaug learned that a plant disease called wheat stem rust had halved Mexico's wheat production from 1939 to 1942. He set out to create high yielding hybrid wheat that was resistant to the disease. His program introduced three innovations. First, he planted successive hybrid crops in two locations each year, which both doubled the pace of progress and resulted in crops tolerant to varying conditions. Next, Borlaug crossed thousands of varieties of wheat, working to find the most resistant hybrids. He eventually developed 40 rust resistant varieties.
Third, Borlaug changed the architecture of wheat. He knew that many wheat varieties responded well to fertilizer but when yields exceeded roughly two tons per acre, plants became top-heavy and collapsed. Borlaug crossed over 20,000 varieties of wheat from around the world in his efforts to create high yielding wheat with shorter, stronger stems. He finally succeeded in 1953 by crossing rust-resistant Mexican seeds with Japanese dwarf wheat. Under ideal
3
Wanger Select 2009 Semiannual Report
conditions, four tons of wheat per acre could be achieved. Mexico became self sufficient in wheat in 1956.
Having achieved success in Mexico, the Rockefeller Foundation pursued progress elsewhere, in partnership with the Ford Foundation, the United Nations and local governments. Pakistan and India were major beneficiaries. By 1970, 55% of Pakistan's wheat acreage and 35% of India's wheat acreage were sown with Mexican varieties. The Rockefeller and Ford Foundations also created the International Rice Research Institute, which began in 1960. By 1966 it developed a sturdy short-stemmed rice plant that, when fertilized sufficiently, yielded two- to three-times the rice it replaced. This rice was quickly adopted in India.
Borlaug was personally involved with the implementation of these programs. He understood that in addition to better seeds, farmers need fertilizer, credit and fair prices for their crops. Governments largely complied. As a result of the Green Revolution, many developing countries were substantial contributors to world agricultural growth.
Recent Conditions and Future Prospects
After reading so much about the amazing progress that has been made in agriculture, it was somewhat surprising to find an article in the June 2009 National Geographic titled, "The End of Plenty, The Global Food Crisis." It noted that global grain consumption exceeded production for seven of the last nine years and grain stockpiles plunged to a 20-year low of 61-days supply in 2007 prior to recovering to a meager 70-days supply in 2008. The price of wheat and corn tripled from 2005 to 2008, and the price of rice quintupled.
Demand recently grew more quickly than supply for several reasons. First, people in developing countries are becoming more prosperous and are eating more meat, causing grain consumption by livestock to rise rapidly. Second, use of ethanol as a gasoline additive or substitute has jumped. Some 30% of the 2008 U.S. corn crop was converted to ethanol instead of being available as food. Third, while world grain production hit records in 2008, growth in grain production has slowed somewhat since the year 2000 compared to prior decades.
Still, agriculture continues to find ways to meet the rising demand. Advancements in hybrid crops continue, and biotechnology is now creating crops with whole new characteristics. While conventional plant breeding is limited to crossing closely related species, biotech methods utilize genes from distant species. To date, two types of biotech crops have been commercialized, those resistant to herbicides and those resistant to insects.
Biotech crops were first made available in 1996 and by 2008 were planted in over 300 million acres, some 8% of global cropland in 25 countries, including 15 developing countries. That year, 85% of the corn crop in the United States came from biotech seeds. Farmers seem satisfied with biotech crops; nearly 100% keep planting biotech once they begin.8 Use of biotech versions of soybean, cotton, corn, canola and other crops increased farm income an estimated $10 billion in 2007 and biotech corn and soybean yields appear to be roughly 10% higher than conventional crops.9 The National Geographic story quotes a scientist with agricultural company Monsanto who predicts that biotechnology will double corn, soybean and cotton yields by 2030.
National Geographic also pointed out the downside of the Green Revolution. Yields in India have flattened since the mid-90s, and hybrid plant needs for water, fertilizer and pesticides have resulted in aquifer depletion, salinized soils and contamination of drinking water. However, new versions of biotech plants are in development, including versions likely to provide still higher yields, drought tolerance and salinized soil tolerance.
Not everyone agrees with the use of biotech crops. Critics have expressed doubts about productivity gains and have concerns about the possibility of a "Frankenfood" becoming toxic or creating an ecological disaster should some new plant become invasive. But numerous safeguards are in place, including rigorous approval processes. Countries that had prohibited biotech crops are now slowly introducing them. Increased adoption of biotech plants has had positive ecological effects, as higher yields reduce needs for additional crop acres and related deforestation, insect resistance reduces needs for pesticides, and herbicide resistance reduces fuel consumption and soil erosion by requiring less tillage.
Mankind's progress in agriculture has been truly amazing. We cannot revert back to previous agricultural processes, which are insufficient to feed a worldwide population of 6.7 billion. Instead, substantial investments in agriculture, and judicious use of new technologies, are needed to maintain impressive production gains in the future.
Columbia Wanger Funds News
Resumption of Securities Lending
The Columbia Wanger Funds restarted securities lending during the second quarter. The domestic Funds briefly participated in securities lending in the third quarter of last year but suspended lending activities due to the turmoil in the financial markets at that time. As market conditions have stabilized somewhat, the Wanger Advisors Trust Board and CWAM made the decision to begin securities lending again in June.
Securities lending has come under media scrutiny recently so we want to clearly
4
Wanger Select 2009 Semiannual Report
state how CWAM administers the lending program. Fund shareholders receive all of the income generated by our lending program, net of modest fees charged by the lending agent to operate the program. The securities lending income benefits Fund shareholders by offsetting a portion of the Fund's operating expenses, which increases the Fund's total returns. The advisor charges no additional fees for administering this program.
Securities lending is the temporary lending of the Fund's portfolio securities to broker/dealers and other institutional investors. The Fund retains the benefits of owning the securities, including receipt of dividends or interest generated by the security. The Fund also receives a fee for the loan. The Fund may recall the loans at any time and may do so in order to vote proxies or to sell the loaned securities. Furthermore, borrowers provide the Fund with cash collateral that exceeds the value of the securities on loan. The Fund could lose money if it incurred a loss on the reinvestment of the cash collateral. To minimize this risk, cash collateral for the program is invested in the Dreyfus Government Cash Management Fund, a money market mutual fund. The securities lending agent is Goldman Sachs Agency Lending. Thus far, shareholders have received modest benefits and incurred no losses from the program.


Charles P. McQuaid
President and Chief Investment Officer
Columbia Wanger Asset Management, L.P.
The information and data provided in this analysis are derived from sources that we deem to be reliable and accurate. These views are not guarantees of future performance and involve certain risks, uncertainties and assumptions that are difficult to predict so actual outcomes and results may differ significantly from the views expressed. The views/opinions expressed in "Agriculture's Amazing Progress" are those of the author and not of the Wanger Advisors Trust Board, are subject to change at any time based upon economic, market or other conditions, may differ from views expressed by other Columbia Management associates or other divisions of Bank of America and the respective parties disclaim any responsibility to update such views. These views may not be relied on as investment advice and, because investment decisions for a Columbia Wanger Fund are based on numerous factors, may not be relied on as an indication of trading i ntent on behalf of any particular Columbia Wanger Fund.
1 Mazoyer, Marcel and Roudart, Laurence, A History of World Agriculture, (New York, NY, Monthly Review Press, 2006).
2 Federico, Giovanni, Feeding The World, (Princeton and Oxford, Princeton University Press, 2005).
3 Ibid, pg. 97.
4 Ibid, pgs. 55, 19.
5 Mazoyer, Marcel and Roudart, Laurence, op. cit., pg 11.
6 Hesser, Leon, The Man Who Fed The World, (Dallas, TX, Durban House, 2006).
7 The Green Revolution is defined by Mazoyer and Roudart as, "a variant of the contemporary agricultural revolution but without the large-scale motorization and mechanization, developed widely in the developing countries."
8 ISAAA Brief 39-2008: Executive Summary, "Global Status of Commercialized Biotech/GM Crops: 2008, The First Thirteen Years, 1996 to 2008," available at www.isaaa.org.
9 "GM crops: global, socio-economic and environmental impacts 1996-2007," a research paper written by Graham Brookes and Peter Barfoot of PG Economics Ltd, Dorchester, U.K., May 2009.
5
Wanger Select 2009 Semiannual Report

Performance Review Wanger Select

Ben Andrews
Portfolio Manager
Performance data quoted represents past performance and current performance may be lower or higher. Past performance is no guarantee of future results. The investment return and principal value will fluctuate so that shares, when redeemed, may be worth more or less than the original cost. For daily and most recent month-end performance updates, please call 1-888-4-WANGER.
Wanger Select ended the semiannual period up 24.22%. This gain was well ahead of the 8.47% return of its primary benchmark, the S&P MidCap 400 Index. Mid-cap stocks outperformed large caps. The S&P 500 Index was up just 3.16%.
In the Fund's 2008 annual report, we mentioned positioning the portfolio in a barbell fashion. We saw many companies trading at low valuations due to a perceived bankruptcy risk, a fear driven by the tight credit markets. These undervalued, completely battered companies in the Fund's portfolio made up one side of the barbell. At the other end we had companies that were solid franchises with little to no credit risk. If the economy kept losing ground, we believed these solid franchises would hold up better than most and the already battered companies wouldn't go down much more unless they went bankrupt (they were a much smaller dollar amount in the portfolio than the solid franchises). However, if the economy stabilized or improved, we would see the lending market re-open and bankruptcy risk lessen, causing the battered companies to explosively rise. The latter scenario describes what happened during the second half of the period .
Looking at some of the Fund's top gainers for the half year, we had several stocks that each added roughly 2% or more return to our portfolio and these stocks were at the undervalued end of our barbell. They included Pacific Rubiales Energy, Tetra Technologies, Expedia and MF Global. On the downside Safeway, Cephalon and Waste Management were among the Fund's biggest detractors to year-to-date performance. These stocks were part of the Fund's more solid franchises with little credit risk. While they held up well last year, they pulled back during the period as money flowed into the riskier stocks. During the second quarter, we sold the Fund's position in Cephalon.
The credit markets continue to gradually re-open, which is positive, but many companies can still only issue credit based on federal programs and guarantees. Hopefully in the coming quarters these programs will be unnecessary for companies to access the credit markets. Though we have rebuilt some of our capital from last year's collapse, we are still cautious; the Fund's cash levels are currently at nearly 7% and could possibly trend higher over the coming months. Furthermore, in order to reduce risk, we've cut top position sizes to between 3% and 6% of the Fund, down from the prior 6% to 9% range. I see the fixed-income market facing challenges too that include an explosion in Treasury debt issuance. I also worry about a possible return of energy price inflation in the next couple of years.
I believe the market should grind higher in the coming months, but our economy is still weak and more excessive volatility probably lies ahead. We will continue to review and fine-tune our approach to try and get the most out of the markets as we struggle through the rough patches.
Risks include stock market fluctuations due to economic and business developments. The Fund also has potentially greater price volatility due to the Fund's concentration in a limited number of stocks of mid-size companies. The Fund is a non-diversified fund and may, therefore, have a greater risk of loss from a few issuers than a similar fund that invests more broadly. The Fund may not operate as a non-diversified fund at all times. International investments involve greater potential risks, including less regulation, currency fluctuations, economic instability and political developments.
Portfolio holdings are subject to change periodically and may not be representative of current holdings.
Fund's Positions in Mentioned Holdings
As a percentage of net assets, as of 6/30/09
| Pacific Rubiales Energy | 5.3 | % | |||||
| Safeway | 4.6 | ||||||
| Tetra Technologies | 3.6 | ||||||
| Expedia | 3.0 | ||||||
| Waste Management | 2.8 | ||||||
| MF Global | 2.4 | ||||||
6
Wanger Select 2009 Semiannual Report
Growth of a $10,000 Investment in Wanger Select
February 1, 1999 (inception date) through June 30, 2009
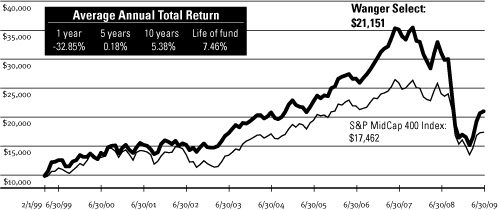
Performance data quoted represents past performance and current performance may be lower or higher. Past performance is no guarantee of future results. The investment return and principal value will fluctuate so that shares, when redeemed, may be worth more or less than the original cost. Performance results may reflect any fee waivers or reimbursements of fund expenses by the investment advisor and/or any of its affiliates. Absent these fee waivers or expense reimbursement arrangements, performance results would have been lower. For daily and most recent month-end performance updates, please call 1-888-4-WANGER.
This graph compares the results of $10,000 invested in Wanger Select on February 1, 1999 (the date the Fund began operations) through June 30, 2009, to the S&P MidCap 400 Index, with dividends and capital gains reinvested. Although the index is provided for use in assessing the Fund's performance, the Fund's holdings differ significantly from those in the index.
Top 10 Holdings
As a percentage of net assets, as of 6/30/09
| 1. ITT Educational Services Post-secondary Degree Services | 5.6 | % | |||||
| 2. Pacific Rubiales Energy (Canada) Oil Production & Exploration in Colombia | 5.3 | ||||||
| 3. Safeway Supermarkets | 4.6 | ||||||
| 4. Hertz Largest U.S. Rental Car Operator | 4.1 | ||||||
| 5. SkillSoft Web-based Learning Solutions (E-Learning) | 3.9 | ||||||
| 6. Quanta Services Electrical & Telecom Construction Services | 3.9 | ||||||
| 7. Tetra Technologies U.S.-based Service Company with Life of Field Approach | 3.6 | ||||||
| 8. Expedia Online Travel Services Company | 3.0 | ||||||
| 9. Coach Designer & Retailer of Branded Leather Accessories | 2.9 | ||||||
| 10. Career Education Post-secondary Education | 2.8 | ||||||
Top 5 Industries
As a percentage of net assets, as of 6/30/09
| Consumer Goods & Services | 32.7 | % | |||||
| Information | 19.2 | ||||||
| Energy & Minerals | 14.8 | ||||||
| Industrial Goods & Services | 12.8 | ||||||
| Finance | 10.4 | ||||||
Results as of June 30, 2009
| 2nd quarter | Year to date | 1 year | 5 year | 10 year | |||||||||||||||||||
| Wanger Select | 27.72 | % | 24.22 | % | -32.85 | % | 0.18 | % | 5.38 | % | |||||||||||||
| S&P MidCap 400 Index | 18.75 | 8.47 | -28.02 | 0.36 | 4.62 | ||||||||||||||||||
| S&P 500 Index | 15.93 | 3.16 | -26.21 | -2.24 | -2.22 | ||||||||||||||||||
| Lipper Variable Underlying Mid-Cap Growth Funds Index | 19.79 | 16.11 | -29.66 | -0.29 | 0.16 | ||||||||||||||||||
NAV as of 6/30/09: $17.23
Performance numbers reflect all Fund expenses but do not include any insurance charge imposed by your insurance company's separate accounts. If performance results included the effect of these additional charges, it would be lower.
The Fund's annual operating expense ratio is 0.91%. The annual operating expense ratio is as stated in the Fund's prospectus that is current as of the date of this report. Differences in expense ratios disclosed elsewhere in this report may result from including fee waivers and expense reimbursements, if any, as well as different time periods used in calculating the ratios.
All results shown assume reinvestment of distributions and do not reflect taxes that a shareholder would pay on Fund distributions or the sale of Fund shares.
The S&P MidCap 400 Index, the Fund's primary benchmark, is a market value-weighted index that tracks the performance of 400 mid-cap U.S. companies. The S&P 500 tracks the performance of 500 widely-held large capitalization U.S. stocks. The Lipper Variable Underlying Mid-Cap Growth Funds Index is an equally weighted representation of the 30 largest variable insurance underlying funds in the Lipper Variable Underlying Mid-Cap Growth Funds Classification. Indexes are not managed and do not incur fees or expenses. It is not possible to invest directly in an index.
Portfolio characteristics and holdings are subject to change periodically and may not be representative of current characteristics and holdings.
Lipper Inc., a widely respected data provider in the industry, calculates an average total return (assuming reinvestment of distributions) for mutual funds with investment objectives similar to those of the fund. Lipper makes no adjustment for the effect of sales loads.
7
Wanger Select 2009 Semiannual Report
Wanger Select
Statement of Investments (Unaudited) June 30, 2009
| Number of Shares | Value | ||||||||||
| Common Stocks – 93.7% | |||||||||||
| Consumer Goods & Services – 32.7% | |||||||||||
| Educational Services – 12.6% | |||||||||||
| 107,600 | ITT Educational Services (a) Post-secondary Degree Services | $ | 10,831,016 | ||||||||
| 984,900 | SkillSoft – ADR (a) Web-based Learning Solutions (E-Learning) | 7,682,220 | |||||||||
| 221,000 | Career Education (a) Post-secondary Education | 5,500,690 | |||||||||
| 109,000 | Princeton Review (a) College Preparation Courses | 589,690 | |||||||||
| 24,603,616 | |||||||||||
| Travel – 7.1% | |||||||||||
| 989,400 | Hertz (a) Largest U.S. Rental Car Operator | 7,905,306 | |||||||||
| 391,000 | Expedia (a) Online Travel Services Company | 5,908,010 | |||||||||
| 13,813,316 | |||||||||||
| Retail – 6.0% | |||||||||||
| 436,000 | Safeway Supermarkets | 8,881,320 | |||||||||
| 109,000 | Abercrombie & Fitch Teen Apparel Retailer | 2,767,510 | |||||||||
| 11,648,830 | |||||||||||
| Apparel – 2.9% | |||||||||||
| 208,000 | Coach Designer & Retailer of Branded Leather Accessories | 5,591,040 | |||||||||
| Casinos & Gaming – 2.3% | |||||||||||
| 42,326,000 | RexLot Holdings (China) (a) Lottery Equipment Supplier in China | 3,328,621 | |||||||||
| 9,380,250 | NagaCorp (Hong Kong) Casino/Entertainment Complex in Cambodia | 1,238,236 | |||||||||
| 4,566,857 | |||||||||||
| Food & Beverage – 1.0% | |||||||||||
| 2,279,000 | Fu Ji Food & Catering Services (China) Food Catering Service Provider in China | 1,915,269 | |||||||||
| Number of Shares | Value | ||||||||||
| Furniture & Textiles – 0.8% | |||||||||||
| 269,000 | Steelcase Office Furniture | $ | 1,565,580 | ||||||||
| Total Consumer Goods & Services | 63,704,508 | ||||||||||
| Information – 19.2% | |||||||||||
| Mobile Communications – 6.2% | |||||||||||
| 202,000 | Crown Castle International (a) Communications Towers | 4,852,040 | |||||||||
| 137,000 | American Tower (a) Communications Towers in USA & Latin America | 4,319,610 | |||||||||
| 70,000 | SBA Communications (a) Communications Towers | 1,717,800 | |||||||||
| 1,164,000 | Globalstar (a)(b) Satellite Mobile Voice & Data Carrier | 1,222,200 | |||||||||
| 12,111,650 | |||||||||||
| Advertising – 2.7% | |||||||||||
| 521,000 | VisionChina Media – ADR (China) (a) Advertising on Digital Screens in China's Mass Transit System | 3,183,310 | |||||||||
| 387,127 | China Mass Media – ADR (China) (a) Media Planning Agency in China | 2,005,318 | |||||||||
| 5,188,628 | |||||||||||
| Business Software – 2.6% | |||||||||||
| 1,107,000 | Novell (a) Directory, Operating System & Identity Management Software | 5,014,710 | |||||||||
| Computer Services – 2.4% | |||||||||||
| 512,600 | WNS – ADR (India) (a) Offshore BPO (Business Process Outsourcing) Services | 4,551,888 | |||||||||
| 86,500 | Hackett Group (a) IT Integration & Best Practice Research | 201,545 | |||||||||
| 4,753,433 | |||||||||||
| Computer Hardware & Related Equipment – 1.6% | |||||||||||
| 97,500 | Amphenol Electronic Connectors | 3,084,900 | |||||||||
| CATV – 1.6% | |||||||||||
| 147,000 | Discovery Communications, Series C (a) CATV Programming | 3,017,910 | |||||||||
See accompanying notes to financial statements.
8
Wanger Select 2009 Semiannual Report
Wanger Select
Statement of Investments (Unaudited) June 30, 2009
| Number of Shares | Value | ||||||||||
| Contract Manufacturing – 1.2% | |||||||||||
| 5,255,000 | Sanmina-SCI (a) Electronic Manufacturing Services | $ | 2,312,200 | ||||||||
| Financial Processors – 0.9% | |||||||||||
| 482,000 | CardTronics (a) Operates the World's Largest Network of ATMs | 1,836,420 | |||||||||
| Total Information | 37,319,851 | ||||||||||
| Energy & Minerals – 14.8% | |||||||||||
| Oil & Gas Producers – 5.7% | |||||||||||
| 792,500 | Pacific Rubiales Energy (Canada) (a)(c) | 6,501,341 | |||||||||
| 327,166 | Pacific Rubiales Energy (Canada) (a) | 2,697,435 | |||||||||
| 322,159 | Pacific Rubiales Energy-Warrants (Canada) (a)(c) Oil Production & Exploration in Colombia | 1,020,916 | |||||||||
| 255,000 | Gran Tierra Energy (Canada) (a) Oil Exploration & Production in Colombia, Peru & Argentina | 887,891 | |||||||||
| 11,107,583 | |||||||||||
| Oil Services – 5.6% | |||||||||||
| 873,000 | Tetra Technologies (a) U.S.-based Service Company with Life of Field Approach | 6,949,080 | |||||||||
| 104,000 | FMC Technologies (a) Oil & Gas Wellhead Manufacturer | 3,908,320 | |||||||||
| 10,857,400 | |||||||||||
| Alternative Energy – 2.0% | |||||||||||
| 247,100 | Canadian Solar (China) (a)(b) Solar Cell & Module Manufacturer | 2,994,852 | |||||||||
| 188,900 | Real Goods Solar (a) Residential Solar Energy Installer | 489,251 | |||||||||
| 326,000 | Synthesis Energy Systems (China) (a) Owner/Operator of Gasification Plants | 374,900 | |||||||||
| 3,859,003 | |||||||||||
| Mining – 1.5% | |||||||||||
| 1,283,000 | Uranium One (South Africa) (a) Uranium Mines in Kazakhstan, the U.S. & Australia | 2,945,114 | |||||||||
| Total Energy & Minerals | 28,769,100 | ||||||||||
| Number of Shares | Value | ||||||||||
| Industrial Goods & Services – 12.8% | |||||||||||
| Outsourcing Services – 3.9% | |||||||||||
| 326,000 | Quanta Services (a) Electrical & Telecom Construction Services | $ | 7,540,380 | ||||||||
| Other Industrial Services – 3.2% | |||||||||||
| 124,000 | Expeditors International of Washington International Freight Forwarder | 4,134,160 | |||||||||
| 137,000 | Mobile Mini (a) Portable Storage Units Leasing | 2,009,790 | |||||||||
| 6,143,950 | |||||||||||
| Waste Management – 2.8% | |||||||||||
| 195,000 | Waste Management U.S. Garbage Collection & Disposal | 5,491,200 | |||||||||
| Machinery – 1.8% | |||||||||||
| 68,000 | Ametek Aerospace/Industrial Instruments | 2,351,440 | |||||||||
| 31,500 | Donaldson Industrial Air Filtration | 1,091,160 | |||||||||
| 3,442,600 | |||||||||||
| Industrial Materials & Specialty Chemicals – 1.1% | |||||||||||
| 130,000 | Nalco Holding Company Provider of Water Treatment & Process Chemicals & Services | 2,189,200 | |||||||||
| Total Industrial Goods & Services | 24,807,330 | ||||||||||
| Finance 10.4% | |||||||||||
| Brokerage & Money Management – 6.6% | |||||||||||
| 783,300 | MF Global (a) Futures Broker | 4,644,969 | |||||||||
| 169,000 | Eaton Vance Specialty Mutual Funds | 4,520,750 | |||||||||
| 202,000 | SEI Investments Mutual Fund Administration & Investment Management | 3,644,080 | |||||||||
| 12,809,799 | |||||||||||
See accompanying notes to financial statements.
9
Wanger Select 2009 Semiannual Report
Wanger Select
Statement of Investments (Unaudited) June 30, 2009
| Number of Shares or Principal Amount | Value | ||||||||||
| Insurance – 2.0% | |||||||||||
| 1,651,000 | Conseco (a) Life, Long-term Care & Medical Supplement Insurance | $ | 3,912,870 | ||||||||
| Credit Cards – 0.9% | |||||||||||
| 173,300 | Discover Financial Services Credit Card Company | 1,779,791 | |||||||||
| Finance Companies – 0.9% | |||||||||||
| 781,000 | CIT Group Middle Market Lender, Equipment Leasing & Vendor Finance/Factoring | 1,679,150 | |||||||||
| Total Finance | 20,181,610 | ||||||||||
| Other Industries – 3.8% | |||||||||||
| Transportation – 3.8% | |||||||||||
| 169,000 | JB Hunt Transport Services Truck & Intermodal Carrier | 5,159,570 | |||||||||
| 147,000 | American Commercial Lines (a) Operator of Inland Barges/Builder of Barges & Vessels | 2,275,560 | |||||||||
| Total Other Industries | 7,435,130 | ||||||||||
| Total Common Stocks (Cost: $206,205,874) – 93.7% | 182,217,529 | ||||||||||
| Securities Lending Collateral – 1.2% | |||||||||||
| 2,396,825 | Dreyfus Government Cash Management Fund (d) (7 day yield of 0.150%) | 2,396,825 | |||||||||
| Total Securities Lending Collateral – (Cost: $2,396,825) | 2,396,825 | ||||||||||
| Short-Term Obligations – 8.7% | |||||||||||
| Repurchase Agreement – 8.2% | |||||||||||
| $ | 15,978,000 | Repurchase Agreement with Fixed Income Clearing Corp., dated 6/30/09, due 7/01/09 at 0.0001%, collateralized by a U.S. Treasury obligation, maturing 4/23/14, market value $16,299,544 (repurchase proceeds $15,978,000) | 15,978,000 | ||||||||
| Number of Shares or Principal Amount | Value | ||||||||||
| Commercial Paper – 0.5% | |||||||||||
| $ | 1,000,000 | Toyota Motor Credit 0.26% due 7/06/09 | $ | 999,964 | |||||||
| Total Short-Term Obligations (Cost: $16,977,964) | 16,977,964 | ||||||||||
| Total Investments (Cost: $225,580,663) – 103.6% (e)(f) | 201,592,318 | ||||||||||
| Obligation to Return Collateral for Securities Loaned – (1.2)% | (2,396,825 | ) | |||||||||
| Cash and Other Assets Less Liabilities – (2.4)% | (4,695,356 | ) | |||||||||
| Total Net Assets – 100.0% | $ | 194,500,137 | |||||||||
Notes to Statement of Investments:
(a) Non-income producing security.
(b) All or a portion of this security was on loan at June 30, 2009. The total market value of securities on loan at June 30, 2009 is $2,324,254.
(c) Denotes a restricted security, which is subject to restrictions on resale under federal securities laws. These securities are valued at their fair value determined in good faith under consistently applied procedures established by the board of trustees. At June 30, 2009, these securities amounted to $7,522,257, which represents 3.87% of total net assets.
Additional information on these securities is as follows:
Security | Acquisition Dates | Shares | Cost | Value | |||||||||||||||
| Pacific Rubiales Energy | 7/12/07 - 8/22/07 | 792,500 | $ | 3,375,397 | $ | 6,501,341 | |||||||||||||
| Pacific Rubiales Energy – Warrants | 7/12/07 | 322,159 | 551,426 | 1,020,916 | |||||||||||||||
| $ | 3,926,823 | $ | 7,522,257 | ||||||||||||||||
(d) Investment made with cash collateral received from securities lending activity.
(e) On June 30, 2009, the market value of foreign securities represents 6.23% of total net assets. The Fund's foreign portfolio was diversified as follows:
| Currency | Value | Cost | Percentage of Net Assets | ||||||||||||
| Canadian Dollar | $ | 5,642,550 | $ | 5,954,914 | 2.90 | ||||||||||
| Hong Kong Dollar | 6,482,126 | 6,626,164 | 3.33 | ||||||||||||
| $ | 12,124,676 | $ | 12,581,078 | 6.23 | |||||||||||
See accompanying notes to financial statements.
10
Wanger Select 2009 Semiannual Report
Wanger Select
Statement of Investments (Unaudited) June 30, 2009
(f) At June 30, 2009, for federal income tax purposes cost of investments was $225,580,663 and net unrealized depreciation was $23,988,345 consisting of gross unrealized appreciation of $40,573,917 and gross unrealized depreciation of $64,562,262.
The following table summarizes the inputs used, as of June 30, 2009, in valuing the Fund's assets:
| Security Type | Other Quoted Prices (Level 1) | Significant Observable Inputs (Level 2) | Significant Unobservable Inputs (Level 3) | Total | |||||||||||||||
| Common Stocks | |||||||||||||||||||
| Total Consumer Goods & Services | $ | 57,222,382 | $ | 6,482,126 | $ | — | $ | 63,704,508 | |||||||||||
| Total Information | 37,319,851 | — | — | 37,319,851 | |||||||||||||||
| Total Energy & Minerals | 21,246,843 | 7,522,257 | — | 28,769,100 | |||||||||||||||
| Total Industrial Goods & Services | 24,807,330 | — | — | 24,807,330 | |||||||||||||||
| Total Finance | 20,181,610 | — | — | 20,181,610 | |||||||||||||||
| Total Other Industries | 7,435,130 | — | — | 7,435,130 | |||||||||||||||
| Total Common Stocks | 168,213,146 | 14,004,383 | — | 182,217,529 | |||||||||||||||
| Securities Lending Collateral | 2,396,825 | — | — | 2,396,825 | |||||||||||||||
| Short-Term Obligations | — | 16,977,964 | — | 16,977,964 | |||||||||||||||
| Total Investments | 170,609,971 | 30,982,347 | — | 201,592,318 | |||||||||||||||
| Total | $ | 170,609,971 | $ | 30,982,347 | $ | — | $ | 201,592,318 | |||||||||||
The Fund's assets assigned to the Level 2 input category include certain foreign securities for which a third party statistical pricing service may be employed for purposes of fair market valuation.
For more information on valuation inputs, and their aggregation into the levels used in the tables above, please refer to the Security Valuation section in the accompanying Notes to Financial Statements.
At June 30, 2009, the Fund held investments in the following sectors:
| Sector | Percentage of Net Assets | ||||||
| Consumer Goods & Services | 32.7 | ||||||
| Information | 19.2 | ||||||
| Energy & Minerals | 14.8 | ||||||
| Industrial Goods & Services | 12.8 | ||||||
| Finance | 10.4 | ||||||
| Other Industries | 3.8 | ||||||
| 93.7 | |||||||
| Securities Lending Collateral | 1.2 | ||||||
| Short-Term Obligations | 8.7 | ||||||
| Obligation to Return Collateral for Securities Loaned | (1.2 | ) | |||||
| Cash and Other Assets less Liabilities | (2.4 | ) | |||||
| 100.0 | |||||||
ADR = American Depositary Receipts
See accompanying notes to financial statements.
11
Wanger Select 2009 Semiannual Report
Statement of Assets and Liabilities
June 30, 2009 (Unaudited)
| Assets: | |||||||
| Investments, at cost | $ | 225,580,663 | |||||
| Investments, at value (including securities on loan of $2,324,254) | $ | 201,592,318 | |||||
| Cash | 37 | ||||||
| Receivable for: | |||||||
| Investments sold | 103,454 | ||||||
| Securities lending income | 22,673 | ||||||
| Dividends | 67,257 | ||||||
| Other assets | 495 | ||||||
| Total Assets | 201,786,234 | ||||||
| Liabilities: | |||||||
| Collateral on securities loaned | 2,396,825 | ||||||
| Payable for: | |||||||
| Investments purchased | 4,131,900 | ||||||
| Fund shares repurchased | 569,994 | ||||||
| Investment advisory fee | 128,133 | ||||||
| Administration fee | 7,922 | ||||||
| Transfer agent fee | 22 | ||||||
| Trustees' fees | 405 | ||||||
| Custody fee | 3,299 | ||||||
| Reports to shareholders | 20,486 | ||||||
| Trustees' deferred compensation plan | 14,316 | ||||||
| Other liabilities | 12,795 | ||||||
| Total Liabilities | 7,286,097 | ||||||
| Net Assets | $ | 194,500,137 | |||||
| Composition of Net Assets: | |||||||
| Paid-in capital | $ | 258,961,955 | |||||
| Accumulated net investment loss | (318,278 | ) | |||||
| Accumulated net realized loss | (40,155,195 | ) | |||||
| Net unrealized depreciation on investments | (23,988,345 | ) | |||||
| Net Assets | $ | 194,500,137 | |||||
| Fund Shares Outstanding | 11,286,318 | ||||||
| Net asset value, offering price and redemption price per share | $ | 17.23 | |||||
Statement of Operations
For the Six Months Ended June 30, 2009 (Unaudited)
| Investment Income: | |||||||
| Dividends | $ | 441,738 | |||||
| Interest income | 6,354 | ||||||
| Securities lending income | 22,673 | ||||||
| Total Investment Income | 470,765 | ||||||
| Expenses: | |||||||
| Investment advisory fee | 654,176 | ||||||
| Administration fee | 40,800 | ||||||
| Transfer agent fee | 136 | ||||||
| Custody fee | 18,015 | ||||||
| Trustees' fees | 9,138 | ||||||
| Chief compliance officer expenses (See Note 4) | 4,432 | ||||||
| Other expenses (See Note 5) | 56,557 | ||||||
| Total Expenses | 783,254 | ||||||
| Net Investment Loss | (312,489 | ) | |||||
| Net Realized and Unrealized Gain (Loss) on Investments and Foreign Currency: | |||||||
| Net Realized Gain (Loss) on: | |||||||
| Investments | (16,112,197 | ) | |||||
| Foreign currency transactions | 38,604 | ||||||
| Net realized loss | (16,073,593 | ) | |||||
| Net change in unrealized appreciation (depreciation) on investments | 53,890,806 | ||||||
| Net Gain | 37,817,213 | ||||||
| Net Increase in Net Assets from Operations | $ | 37,504,724 | |||||
See accompanying notes to financial statements.
12
Wanger Select 2009 Semiannual Report
Statement of Changes in Net Assets
| Increase (Decrease) in Net Assets | (Unaudited) Six Months Ended June 30, 2009 | Year Ended December 31, 2008 | |||||||||
| Operations: | |||||||||||
| Net investment loss | $ | (312,489 | ) | $ | (1,135,073 | ) | |||||
| Net realized loss on investments and foreign currency transactions | (16,073,593 | ) | (23,401,237 | ) | |||||||
| Net change in unrealized appreciation (depreciation) on investments and foreign currency translations | 53,890,806 | (129,460,361 | ) | ||||||||
| Net Increase (Decrease) in Net Assets from Operations | 37,504,724 | (153,996,671 | ) | ||||||||
| Distributions to Shareholders: | |||||||||||
| From net realized gains | — | (8,211,851 | ) | ||||||||
| Share Transactions: | |||||||||||
| Subscriptions | 12,873,523 | 32,833,563 | |||||||||
| Distributions reinvested | — | 8,211,851 | |||||||||
| Redemptions | (12,466,241 | ) | (38,628,359 | ) | |||||||
| Net Increase from Share Transactions | 407,282 | 2,417,055 | |||||||||
| Total Increase (Decrease) in Net Assets | 37,912,006 | (159,791,467 | ) | ||||||||
| Net Assets: | |||||||||||
| Beginning of period | 156,588,131 | 316,379,598 | |||||||||
| End of period | $ | 194,500,137 | $ | 156,588,131 | |||||||
| Accumulated net investment loss at end of period | $ | (318,278 | ) | $ | (5,789 | ) | |||||
See accompanying notes to financial statements.
13
Wanger Select 2009 Semiannual Report
Financial Highlights
| (Unaudited) Six Months Ended June 30, | Year Ended December 31, | ||||||||||||||||||||||||||
| Selected data for a share outstanding throughout each period | 2009 | 2008 | 2007 | 2006 | 2005 | 2004 | |||||||||||||||||||||
| Net Asset Value, Beginning of Period | $ | 13.87 | $ | 28.08 | $ | 26.15 | $ | 22.66 | $ | 22.11 | $ | 18.55 | |||||||||||||||
| Income from Investment Operations: | |||||||||||||||||||||||||||
| Net investment loss (a) | (0.03 | ) | (0.10 | ) | (0.04 | ) | (0.05 | ) | (0.04 | ) | (0.10 | ) | |||||||||||||||
| Net realized and unrealized gain (loss) on investments and foreign currency | 3.39 | (13.38 | ) | 2.47 | 4.38 | 2.12 | 3.68 | ||||||||||||||||||||
| Total from Investment Operations | 3.36 | (13.48 | ) | 2.43 | 4.33 | 2.08 | 3.58 | ||||||||||||||||||||
| Less Distributions to Shareholders: | |||||||||||||||||||||||||||
| From net investment income | — | — | — | (0.09 | ) | — | — | ||||||||||||||||||||
| From net realized gains | — | (0.73 | ) | (0.50 | ) | (0.75 | ) | (1.53 | ) | (0.02 | ) | ||||||||||||||||
| Total Distributions to Shareholders | — | (0.73 | ) | (0.50 | ) | (0.84 | ) | (1.53 | ) | (0.02 | ) | ||||||||||||||||
| Net Asset Value, End of Period | $ | 17.23 | $ | 13.87 | $ | 28.08 | $ | 26.15 | $ | 22.66 | $ | 22.11 | |||||||||||||||
| Total Return (b) | 24.22 | %(c) | (49.06 | )% | 9.39 | % | 19.70 | % | 10.49 | %(d) | 19.31 | % | |||||||||||||||
| Ratios to Average Net Assets/Supplemental Data: | |||||||||||||||||||||||||||
| Net expenses | 0.96 | %(e) | 0.91 | %(f) | 0.90 | %(f) | 0.94 | %(f) | 0.96 | %(f) | 1.10 | %(f) | |||||||||||||||
| Net investment loss | (0.38 | )%(e) | (0.45 | )%(f) | (0.15 | )%(f) | (0.20 | )%(f) | (0.20 | )%(f) | (0.49 | )%(f) | |||||||||||||||
| Waiver/Reimbursement | — | — | — | — | 0.02 | % | — | ||||||||||||||||||||
| Portfolio turnover rate | 19 | %(c) | 36 | % | 15 | % | 21 | % | 26 | % | 36 | % | |||||||||||||||
| Net assets, end of period (000s) | $ | 194,500 | $ | 156,588 | $ | 316,380 | $ | 175,346 | $ | 102,674 | $ | 82,465 | |||||||||||||||
(a) Net investment loss per share was based upon the average shares outstanding during the period.
(b) Total return at net asset value assuming all distributions reinvested.
(c) Not annualized.
(d) Had the investment advisor not waived a portion of expenses, total return would have been reduced.
(e) Annualized.
(f) The benefits derived from custody fees paid indirectly had an impact of less than 0.01%.
See accompanying notes to financial statements.
14
Wanger Select 2009 Semiannual Report
Notes to Financial Statements (Unaudited)
1. Nature of Operations
Wanger Select (the "Fund") is a series of Wanger Advisors Trust (the "Trust"), an open-end management investment company organized as a Massachusetts business trust. The investment objective of the Fund is to seek long-term capital appreciation. The Fund is available only for allocation to certain life insurance company separate accounts established for the purpose of funding qualified and non-qualified variable annuity contracts and variable life insurance policies and may also be offered directly to certain types of pension plans and retirement arrangements.
2. Significant Accounting Policies
The preparation of financial statements in accordance with accounting principles generally accepted in the United States of America ("GAAP") requires management to make certain estimates and assumptions that affect the reported amounts of assets and liabilities, the disclosure of contingent assets and liabilities at the date of the financial statements and the reported amounts of revenue and expenses during the reporting period. Actual results could differ from those estimates. Management has evaluated the events and transactions that have occurred through August 20, 2009, the date the financial statements were issued, and noted no items requiring adjustment of the financial statements or additional disclosures. The following is a summary of significant accounting policies consistently followed by the Fund in the preparation of its financial statements.
Security valuation
Securities of the Fund are valued at market value or, if a market quotation for a security is not readily available or is deemed not to be reliable because of events or circumstances that have occurred between the market quotation and the time as of which the security is to be valued, the security is valued at its fair value determined in good faith under consistently applied procedures established by the Board of Trustees. A security traded on a securities exchange or in an over-the-counter market in which transaction prices are reported is valued at the last sales price at the time of valuation. A security traded principally on NASDAQ is valued at the NASDAQ official closing price. A security for which there is no reported sale on the valuation date is valued at the latest bid quotation. Short-term investments maturing in 60 days or less are valued at amortized cost, which approximates market value. A security for which a mark et quotation is not readily available and any other assets are valued at its fair value determined in good faith under consistently applied procedures established by the Board of Trustees. The Trust has retained an independent statistical fair value pricing service that employs a systematic methodology to assist in the fair valuation process for securities principally traded in a foreign market in order to adjust for possible changes in value that may occur between the close of the foreign market and the time as of which the securities are to be valued. If a security is valued at a "fair value", that value may be different from the last quoted market price for the security.
The Fund adopted Statement of Financial Accounting Standards No. 157, Fair Value Measurements ("SFAS 157"). Under SFAS 157, various inputs are used in determining the value of the Fund's investments. These inputs are summarized in the three broad levels listed below:
• Level 1—quoted prices in active markets for identical securities
• Level 2—other significant observable inputs (including quoted prices for similar securities, interest rates, prepayment speeds, credit risk and others)
• Level 3—significant unobservable inputs (including management's own assumptions in determining the value of investments)
The inputs or methodologies used for valuing securities are not necessarily an indication of the risk associated with investing in those securities.
Examples of the types of securities in which the Fund would typically invest and how they are classified within this SFAS 157 hierarchy are as follows. Typical level 1 securities include exchange traded domestic equities, mutual funds whose NAVs are published each day and exchange traded foreign equities that are not statistically fair valued. Typical level 2 securities include exchange traded foreign equities that are statistically fair valued and short-term investments valued at amortized cost. Typical level 3 securities include any security fair valued by the Fund's Valuation Committee that relies on significant unobservable inputs.
In April 2009, the Financial Accounting Standards Board ("FASB") issued FASB Staff Position 157-4, Determining Fair Value When the Value and Level of Activity for the Asset or Liability Have Significantly Decreased and Identifying Transactions That Are Not Orderly ("FSP FAS 157-4"), which amends SFAS 157 and is effective for interim and annual periods ending after June 15, 2009. FSP FAS 157-4 provides additional guidance for estimating fair value in accordance with SFAS 157 when the volume and level of activity for the asset or liability measured at fair value has significantly decreased. Additionally, FSP FAS 157-4 expands disclosure requirements for reporting entities with respect to categories of assets and liabilities carried at fair value. Management does not expect the adopt ion of FSP FAS 157-4 to have a material impact on the Fund's financial statement disclosure.
Repurchase agreements
The Fund may engage in repurchase agreement transactions. The Fund, through its custodian, receives delivery of underlying securities collateralizing each repurchase agreement. The counterparty is required to maintain collateral that is at all times at least equal to the repurchase price including interest. In the event of default or bankruptcy by the other party to the agreement, realization and/or retention of the collateral may be subject to legal proceedings.
Foreign currency translations
Values of investments denominated in foreign currencies are converted into U.S. dollars using the New York spot market rate of exchange at the time of valuation. Purchases and sales of investments and dividend and interest income are translated into U.S. dollars using the spot market rate of exchange prevailing on the respective dates of such transactions. The gain or loss resulting from changes in foreign exchange rates is included with net realized and unrealized gain or loss from investments, as appropriate.
Securities lending
The Fund may lend securities up to one-third of the value of its total assets to certain approved brokers, dealers and other financial institutions to earn additional income. The Fund retains the benefits of owning the securities, including receipt of dividends or interest generated by the security. The Fund also receives a fee for the loan. The Fund has the ability to recall the loans at any time and could do so in order to vote proxies or to sell the loaned securities. Each loan is collateralized by cash that exceeds the value of the securities on loan. The market value of the loaned securities is determined daily at the close of business of the Fund and any additional required collateral is delivered to each Fund on the next business day. The Fund has elected to invest the cash collateral in the Dreyfus Government Cash Management Fund and the income earned is paid to the Fund, net of any fees remitted to Goldman Sachs Agency Lending as the lending agent and borrower rebates. The Fund's advisor, Columbia Wanger Asset Management, L.P. ("CWAM"), does not retain any fees earned by the lending program nor does it charge the Fund for administering the program. Generally, in the event of borrower default, the Fund has the right to use the collateral to offset any losses incurred. In the event the Fund is delayed or prevented from exercising its right to dispose of the collateral, there may be a potential loss to the Fund. Some of these losses may be indemnified by the lending agent. The Fund bears the risk of loss with respect to the investment of collateral.
After suspending securities lending in the third quarter of 2008, the Fund resumed lending securities in the second quarter of 2009. The net lending income earned in 2009 by the Fund is included in the Statement of Operations.
15
Wanger Select 2009 Semiannual Report
Notes to Financial Statements, continued (Unaudited)
Security transactions and investment income
Security transactions are accounted for on the trade date (date the order to buy or sell is executed) and dividend income is recorded on the ex-dividend date, except that certain dividends from foreign securities are recorded as soon as the information is available to the Fund. Interest income is recorded on the accrual basis and includes amortization of discounts on debt obligations when required for federal income tax purposes. Realized gains and losses from security transactions are recorded on an identified cost basis.
Awards, if any, from class action litigation related to securities owned may be recorded as a reduction of cost of those securities. If the applicable securities are no longer owned, the proceeds are recorded as realized gains.
Restricted securities
Restricted securities are securities that may only be resold upon registration under federal securities laws or in transactions exempt from registration. In some cases, the issuer of restricted securities has agreed to register such securities for resale at the issuer's expense either upon demand by the Fund or in connection with another registered offering of the securities. Many restricted securities may be resold in the secondary market in transactions exempt from registration. Such restricted securities may be determined to be liquid under criteria established by the Board of Trustees.
Use of estimates
The preparation of financial statements in conformity with GAAP requires management to make estimates and assumptions that affect the amounts reported in the financial statements and accompanying notes. Actual results may differ from those estimates.
Fund share valuation
Fund shares are sold and redeemed on a continuing basis at net asset value. Net asset value per share is determined daily as of the close of trading on the New York Stock Exchange ("the Exchange") on each day the Exchange is open for trading by dividing the total value of the Fund's investments and other assets, less liabilities, by the number of Fund shares outstanding.
Custody fees/Credits
Custody fees are reduced based on the Fund's cash balances maintained with the custodian. The amount is disclosed as a reduction of total expenses in the Statement of Operations.
Federal income taxes
The Fund has complied with the provisions of the Internal Revenue Code available to regulated investment companies and, in the manner provided therein, distributes all its taxable income, as well as any net realized gain on sales of investments and foreign currency transactions reportable for federal income tax purposes. Accordingly, the Fund paid no federal income taxes and no federal income tax provision was required.
Expenses
General expenses of the Trust are allocated to the Fund and the other series of the Trust based upon relative net assets or other expense allocation methodologies determined by the nature of the expense. Expenses directly attributable to the Fund are charged to the Fund.
Foreign capital gains taxes
Gains in certain countries may be subject to foreign taxes at the fund level, at rates ranging from 10%-15%. The Fund accrues for such foreign taxes on net realized and unrealized gains at the appropriate rate for each jurisdiction.
Distributions to shareholders
Distributions to shareholders are recorded on the ex-dividend date.
Indemnification
In the normal course of business, the Trust on behalf of the Fund enters into contracts that contain a variety of representations and warranties and that provide general indemnities. The Fund's maximum exposure under these arrangements is unknown, as this would involve future claims against the Fund. Also under the Trust's organizational documents, the trustees and officers of the Trust are indemnified against certain liabilities that may arise out of their duties to the Trust. However based on experience, the Fund expects the risk of loss due to these warranties and indemnities to be minimal.
3. Federal Tax Information
The tax character of distributions paid during the year ended December 31, 2008 was as follows:
| Distributions paid from: | |||||||
| Ordinary Income* | $ | 1,686,639 | |||||
| Long-Term Capital Gains | 6,525,212 | ||||||
* For tax purposes short-term capital gain distributions, if any, are considered ordinary income distributions.
The following capital loss carryforwards, determined as of December 31, 2008, may be available to reduce taxable income arising from future net realized gains on investments, if any, to the extent permitted by the Internal Revenue Code:
| Year of Expiration | Capital Loss Carryforward | ||||||
| 2016 | $ | 6,605,628 | |||||
FASB Interpretation No. 48, Accounting for Uncertainty in Income Taxes—an Interpretation of FASB Statement No. 109 ("FIN 48") management determines whether a tax position of the Fund is more likely than not to be sustained upon examination by the applicable taxing authority, including resolution of any related appeals or litigation processes, based on the technical merits of the position. The tax benefit to be recognized is measured as the largest amount of benefit that is greater than fifty percent likely of being realized upon ultimate settlement. Management has evaluated the known implications of FIN 48 on its computation of net assets for the Fund. As a result of this evaluation, management believes that FIN 48 does not have any effect on the Fund's financial statements. However, management's conclusions regarding FIN 48 may be subject to review and adjustment at a later date based on factors including, but not limited to, further implementation guidance from the FASB, new tax laws, regulations, and administrative interpretations (including relevant court decisions). The Fund's federal tax returns for the prior three fiscal years remain subject to examination by the Internal Revenue Service. The Fund is not aware of any tax positions for which it is reasonably possible that the total amounts of unrecognized tax benefits will significantly change in the next twelve months.
4. Transactions With Affiliates
CWAM is a wholly owned subsidiary of Columbia Management Group, LLC, ("Columbia Management") which in turn is an indirect wholly owned subsidiary of Bank of America Corporation ("BOA"). CWAM furnishes continuing investment supervision to the Fund and is responsible for the overall management of the Fund's business affairs.
Under the Fund's investment advisory agreement, management fees are accrued daily based on the Fund's average daily net assets and paid monthly to CWAM at the annual rates shown in the table below:
| Average Daily Net Assets | Annual Fee Rate | ||||||
| Up to $500 million | 0.80 | % | |||||
| $500 million and over | 0.78 | % | |||||
16
Wanger Select 2009 Semiannual Report
Notes to Financial Statements, continued (Unaudited)
For the six months ended June 30, 2009, the Fund's annualized effective investment advisory fee rate was 0.80% of average daily net assets.
Through April 30, 2010, CWAM will reimburse the Fund to the extent that ordinary operating expenses (exclusive of brokerage commissions, interest, taxes and extraordinary expenses, but inclusive of custodian charges relating to overdrafts, if any), after giving effect to any balance credits from the Fund's custodian, exceed an annual percentage of 1.35% of average daily net assets. There was no reimbursement for the six months ended June 30, 2009.
CWAM provides administrative services and receives an administration fee from the Fund at the following annual rates:
| Wanger Advisors Trust Aggregate Average Daily Net Assets of the Trust | Annual Fee Rate | ||||||
| Up to $4 billion | 0.05 | % | |||||
| $4 billion to $6 billion | 0.04 | % | |||||
| $6 billion to $8 billion | 0.03 | % | |||||
| $8 billion and over | 0.02 | % | |||||
For the six months ended June 30, 2009, the Fund's annualized effective administration fee rate was 0.05% of average daily net assets. CWAM has delegated to Columbia Management Advisors, LLC ("Columbia"), an indirect, wholly owned subsidiary of BOA, the responsibility for certain administrative services.
Certain officers and trustees of the Trust are also officers of CWAM. The Trust makes no direct payments to its officers and trustees who are affiliated with CWAM.
The Board of Trustees has appointed a Chief Compliance Officer to the Trust in accordance with federal securities regulations. The Fund, along with other affiliated funds, pays its pro-rata share of the expenses associated with the Office of the Chief Compliance Officer. These expenses are disclosed separately as "Chief compliance officer expenses" in the Statement of Operations.
The Trust offers a deferred compensation plan for its independent trustees. Under that plan, a trustee may elect to defer all or a portion of his or her compensation. Amounts deferred are retained by the Trust and represent an unfunded obligation of the Trust. The value of amounts deferred is determined by reference to the change in value of Class Z shares of one or more series of Columbia Acorn Trust or a money market fund as specified by the trustee. Benefits under the deferred compensation plan are payable when the trustee ceases to be a member of the Board of Trustees.
Columbia Management Distributors, Inc. (the "Distributor"), an affiliate of Columbia and an indirect, wholly owned subsidiary of BOA, serves as the principal underwriter of the Trust and receives no compensation from the Fund for its services.
Columbia Management Services, Inc. (the "Transfer Agent"), an affiliate of Columbia and an indirect, wholly owned subsidiary of BOA, provides shareholder services to the Fund and has subcontracted with Boston Financial Data Services ("BFDS") to serve as subtransfer agent. For such services, the Transfer Agent receives a fee, paid monthly, at the annual rate of $21.00 per open account. The Transfer Agent also receives reimbursement for certain out-of-pocket expenses.
During the six months ended June 30, 2009, the Fund did not engage in purchase and sales transactions with funds that have a common investment advisor (or affiliated investment advisors), common directors/trustees, and/or common officers.
5. Borrowing Arrangements
The Trust participates in a $150 million credit facility, which was entered into to facilitate portfolio liquidity. Under the facility, interest is charged to each participating fund based on its borrowings at a rate per annum equal to the higher of Federal Funds Rate or Overnight LIBOR plus 0.750%. In addition, a commitment fee of 0.12% per annum of the unutilized line of credit is accrued and apportioned among the participating funds based on their relative net assets. The commitment fee is included in "Other expenses" in the Statement of Operations. No amounts were borrowed by the Fund under this facility during the six months ended June 30, 2009. The Trust enters into this line of credit for one year durations. The Trust has secured the line of credit for the entire year of 2009.
6. Fund Share Transactions
Proceeds and payments on Fund shares as shown in the Statement of Changes in Net Assets are in respect of the following numbers of shares:
| Six Months Ended June 30, 2009 | Year Ended December 31, 2008 | ||||||||||
| Shares sold | 857,238 | 1,464,413 | |||||||||
| Shares issued in reinvestment of dividend distributions | — | 349,441 | |||||||||
| Less shares redeemed | (864,201 | ) | (1,788,324 | ) | |||||||
| Net increase (decrease) in shares outstanding | (6,963 | ) | 25,530 | ||||||||
7. Investment Transactions
The aggregate cost of purchases and proceeds from sales other than short-term obligations for the six months ended June 30, 2009 were $29,846,799 and $33,169,033, respectively.
8. Legal Proceedings
CWAM, Columbia Acorn Trust, (another mutual fund family advised by CWAM), and the trustees of Columbia Acorn Trust (collectively, the "Columbia defendants") are named as defendants in class and derivative complaints that have been consolidated in a Multi-District Action (the "MDL Action") in the federal district court of Maryland. These lawsuits contend that defendants permitted certain investors to market time their trades in certain Columbia Acorn Funds. The MDL Action is ongoing. However, all claims against the Trust and the independent trustees of Columbia Acorn Trust have been dismissed.
Columbia Acorn Trust and CWAM are also defendants in a class action lawsuit that alleges, in summary, that Columbia Acorn Trust and CWAM exposed shareholders of Columbia Acorn International Fund to trading by market timers by allegedly: (a) failing to properly evaluate daily whether a significant event affecting the value of that fund's securities had occurred after foreign markets had closed but before the calculation of the funds' net asset value ("NAV"); (b) failing to implement the fund's portfolio valuation and share pricing policies and procedures; and (c) failing to know and implement applicable rules and regulations concerning the calculation of NAV (the "Fair Valuation Lawsuit"). The Seventh Circuit ruled that the plaintiffs' state law claims were preempted under federal law resulting in the dismissal of plaintiffs' complaint. Plaintiffs appealed the Seventh Circuit's ruling to the United States Supreme Court. The Supre me Court reversed the Seventh Circuit's ruling on jurisdictional grounds and the case was ultimately remanded to the state court.
On March 21, 2005, a class action complaint was filed against the Trust and CWAM seeking to rescind the CDSC assessed upon redemption of Class B shares of the Columbia Acorn Funds due to the alleged market timing of the Columbia Acorn Funds (the "CDSC Lawsuit"). In addition to the rescission of sales charges, plaintiffs seek recovery of actual damages, attorneys' fees and costs. The case has been transferred to the MDL Action in the federal district court of Maryland.
On September 14, 2007, the plaintiffs and the Columbia defendants named in the MDL Action, including the Columbia Funds, entered into a stipulation of settlement with respect to all Columbia-related claims in the MDL Action described above, including the CDSC and Fair Valuation Lawsuits. The settlement is subject to court approval.
Columbia Acorn Funds and CWAM intend to defend these suits vigorously. CWAM believes that the lawsuits are not likely to materially affect its ability to provide investment management services to the Fund.
17
Wanger Select 2009 Semiannual Report
[Excerpt from:]
Wanger Advisors Trust
Management Fee Evaluation of the Senior Officer
Prepared Pursuant to the New York Attorney General's
Assurance of Discontinuance
May 2009
18
Wanger Select 2009 Semiannual Report
Introduction
The New York Attorney General's Assurance of Discontinuance ("Order") entered into by Columbia Management Advisors, Inc. ("CMAI") and Columbia Management Distributors, Inc., ("CMDI" and collectively with "CMAI," "CMG") in February 2005, allows CMAI to manage or advise a mutual fund only if the trustees of the fund appoint a "Senior Officer" to perform specified duties and responsibilities. One of these responsibilities includes "managing the process by which proposed management fees (including but not limited to, advisory fees) to be charged the [Funds] are negotiated in a manner which is at arms' length and reasonable and consistent with this Assurance of Discontinuance."
This is the third year that the Columbia Acorn Trust and Wanger Advisors Trust (collectively, the "Trusts") and each series thereof (the "Acorn funds," "WAT funds" or collectively, the "Funds") have been overseen by the same Board of Trustees ("Board"). The Order provides that this Board must determine the reasonableness of proposed "management fees" by using either an annual competitive bidding process supervised by the Senior Officer or Independent Fee Consultant, or by obtaining "an annual independent written evaluation prepared by or under the direction of the Senior Officer or the Independent Fee Consultant."
"Management fees" are only part of the costs and expenses paid by mutual fund shareholders. Fund expenses can vary depending upon the class of shares held but usually include: (1) investment management or advisory fees to compensate analysts and portfolio managers for stock research and portfolio management, as well as the cost of operating a trading desk; (2) administrative expenses incurred to prepare registration statements and tax returns, calculate the Funds' net asset values, maintain effective compliance procedures and perform recordkeeping services; (3) transfer agency costs for establishing accounts, accepting and disbursing funds, as well as overseeing trading in Fund shares; (4) custodial expenses incurred to hold the securities purchased by the Funds; and (5) distribution expenses, including commissions paid to brokers that sell the Fund shares to investors.
Columbia Wanger Asset Management, L.P. ("CWAM"), the adviser to the Funds, has proposed that the Trusts continue the existing separate agreements governing the first two categories listed above: an advisory agreement governing portfolio management, and an administration agreement governing certain administration and clerical services. Together the fees paid under these two agreements are referred to as "management fees." Other fund expenses are governed by separate agreements, in particular agreements with two CWAM affiliates: CMDI, the broker-dealer that underwrites and distributes the Funds' shares, and Columbia Management Services, Inc. ("CMSI"), the Funds' transfer agent. In conformity with the terms of the Order, this evaluation, therefore, addresses only the advisory and administrative contracts, and does not extend to the other agreements.
According to the Order, the Senior Officer's evaluation must consider at least the following:
(1) Management fees (including components thereof) charged to institutional and other clients of CWAM for like services;
(2) Management fees (including any components thereof) charged by other mutual fund companies for like services;
(3) Costs to CWAM and its affiliates of supplying services pursuant to the management fee agreements, excluding any intra-corporate profit;
(4) Profit margins of CWAM and its affiliates from supplying such services;
(5) Possible economies of scale as the Funds grow larger; and
(6) The nature and quality of CWAM's services, including the performance of each Fund.
In 2004, the Boards of the two Trusts, then separate groups, each appointed me Senior Officer under the Order. They also determined not to pursue a competitive bidding process and instead, charged me with the responsibility of evaluating the Funds' proposed advisory and administrative fee contracts with CWAM in conformity with the requirements of the Order. This Report is an annual evaluation required under the Order. In discharging their responsibilities, the independent Trustees have also consulted independent, outside counsel.
2008 Evaluation
This is the fourth annual evaluation prepared in connection with the Order. This evaluation follows the same structure as the earlier studies. Some areas are given more emphasis here, while others are given less. Still, the fundamental information gathered for this evaluation is largely the same as past years. Last year's evaluation is referred to here as the "2008 Study."
Process and Independence
The objectives of the Order are to ensure the independent evaluation of the management fees paid by the Funds as well as to insure that all relevant factors are considered. In my view, this contract renewal process has been conducted at arms-length and with independence in gathering, considering and evaluating all relevant data. At the outset of the process, the Trustees sought and obtained from CWAM and CMG a comprehensive compilation of data regarding Fund performance and expenses, adviser profitability, and other information. The Contract Committee evaluated this information thoroughly. Performance and expense data was obtained from both Morningstar and Lipper, the leading consultants in this area. The rankings prepared by Morningstar and Lipper were independent and not influenced by the adviser.
In the course of its work, the Contract Committee gave careful consideration to the conclusions and recommendations contained in the 2008 Study. The Committee recommended, and the Board accepted and implemented several of the recommendations in this area contained in the 2008 Study.
19
Wanger Select 2009 Semiannual Report
My evaluation of the advisory contracts was shaped, as it was last year, by my experience as Chief Compliance Officer of the Trusts ("CCO"). As CCO, I report solely to the Board and have no reporting obligation to, or employment relationship with, CMG or its affiliates, except for administrative purposes. I have commented on compliance matters in evaluating the quality of service provided by CWAM.
This Report, its supporting materials and the data contained in other materials submitted to the Contract Committee of the Board, in my view, provide a thorough factual basis upon which the Board, in consultation with independent counsel as it deems appropriate, may conduct management fee negotiations that are in the best interests of the Funds' shareholders.
The Fee Reductions Mandated under the Order
Under the terms of the Order, CMG agreed to secure certain management fee reductions for the mutual funds advised by its affiliate investment advisers. In some instances, breakpoints were also established. Although neither CWAM nor the Trusts was a party to the Order, CWAM offered and the Board accepted certain advisory fee reductions during 2005. By the terms of the Order, these fees may not be increased before November 30, 2009. I have used these advisory fee levels, as modified thereafter, in this evaluation because they are the fees in the current agreements that CWAM proposes should be continued. Hence, these fee levels are the starting point of an evaluation.
Conclusions
My review of the data and other material above leads to the following conclusions with respect to the factors identified in the Order.
1. Performance. Wanger Select and Wanger USA have suffered significant declines in ranking relative to their peers for the past five years. In contrast, the international Funds have improved their relative performance and enjoy solid rankings.
2. Management Fees relative to Peers. Management fees vary by WAT fund but, in general, the WAT funds impose higher fees than competing funds. Wanger Select and Wanger USA in particular were ranked by both Lipper and Morningstar at or below the median, and therefore impose higher fees than do the majority of their competitors.
3. Administrative Fees. The WAT funds' administrative fees are generally less competitive than are the fees charged by competitors, but these rankings suffer from a lack of uniformity in the scope of services encompassed by the fee. CWAM provides excellent administrative support for all the WAT funds. There are clear advantages to retaining the adviser and its affiliates to perform these services.
4. Management Fees relative to Institutional and Other Mutual Fund Accounts. CWAM's focus is on its mutual funds. It does not actively seek to manage separate or institutional accounts. The few institutional accounts it does manage vary in rate structures. Some pay advisory fees commensurate with or higher than the WAT funds. In addition, CWAM is now considering a new institutional account for a WAT shareholder that may enjoy a management fee significantly lower than the parallel mutual fund, and could adversely impact existing WAT shareholders.
5. Costs to CWAM and its Affiliates. CWAM's direct costs do not appear excessive. Overhead and indirect costs allocated to CWAM by its parent organizations, however, are significant and have varied considerably over the years. CWAM's affiliates report operating losses and therefore do not appear to enjoy excessive "fall out" benefits from CWAM's advisory agreement with the Funds.
6. Profit Margins. CWAM's pre-marketing expense profit margins are at the top of the industry, even in a difficult year such as 2008, though these comparisons are hampered by limited industry data. High profit margins are not unexpected for firms that manage large, successful funds and have provided outstanding investment performance for investors.
7. Economies of Scale. Economies of scale do exist at CWAM and will continue if asset levels return to those of past years. The Board has recently imposed additional breakpoints for some of the WAT funds that will result in greater sharing of economies of scale.
8. Nature and Quality of Services. This category includes a variety of considerations that are difficult to quantify, yet can have a significant bearing on the performance of the Funds. Several areas merit comment.
a. Capacity. CWAM has maintained its investment management capacity even in a difficult environment.
b. Compliance. CWAM has a reasonably designed compliance program that protects shareholders.
9. Process. In my opinion, the process of negotiating an advisory contract for the Funds has been conducted thoroughly and at arms' length. Further, the Trustees have sufficient information to evaluate management's proposal, and negotiate contract terms that are in the best interests of Fund shareholders.
Recommendations
I believe the Trustees should:
20
Wanger Select 2009 Semiannual Report
1. Monitor closely the performance of Wanger Select and Wanger USA to ensure that appropriate steps are being taken by CWAM to improve their relative performance.
2. Consider imposing limitations on the use of soft dollars. While CWAM's use of soft dollars is consistent with the applicable regulatory requirements, the Board should have a clear understanding with CWAM regarding the cost to shareholders of the research purchased with Fund commission dollars.
3. Focus their review on the WAT funds' management fee levels in relation to their peers, in particular the fees paid by Wanger USA and Wanger Select. These Funds pay fees that are, in the views of both Morningstar and Lipper, significantly higher than their peers.
4. Seek assurances that CWAM and its affiliates will continue to provide adequate support to the WAT funds despite the recent downturn in market values and the difficulties faced by CWAM's ultimate parent organization, Bank of America. Similar assurances should be sought from any prospective purchaser of CWAM or its parent organization.
Robert P. Scales
May 26, 2009
21
Wanger Select 2009 Semiannual Report
Wanger Advisors Trust Board Approval of the Advisory Agreement 2009
Wanger Advisors Trust (the "Trust") has an investment advisory agreement (the "Advisory Agreement") with Columbia Wanger Asset Management, L.P. ("CWAM") under which CWAM manages the Columbia Wanger Family of Funds (the "Funds"). The trustees of the Trust, more than seventy five percent of whom have never been affiliated with CWAM (the "Independent Trustees"), oversee the management of each Fund and, as required by law, determine at least annually whether to continue the Advisory Agreement for each Fund.
The Contract Committee of the board of trustees (the "Committee"), which is comprised of six Independent Trustees, makes recommendations to the board regarding any proposed continuation of the Advisory Agreement. After the Committee has made its recommendations, the full board of trustees determines whether to approve continuation of the Advisory Agreement. The board also considers matters bearing on the Advisory Agreement at its various meetings throughout the year, and meets at least quarterly with CWAM's portfolio managers.
In connection with their most recent consideration of the Advisory Agreement for each Fund, the Committee and all trustees received and reviewed a substantial amount of information provided by CWAM in response to requests from the Independent Trustees and their independent legal counsel. In addition, the Contract Committee met with the Investment Performance Committee, also comprised exclusively of Independent Trustees, to review performance related issues. As they considered the Advisory Agreement, the Independent Trustees were advised by independent legal counsel. At each meeting where the Committee or the Independent Trustees considered the Advisory Agreement, they met with management and also met in separate executive session with their independent legal counsel.
The materials reviewed by the Committee and the trustees included, among other items, (i) information on the investment performance of each Fund and its peer groups and performance benchmarks, (ii) information on each Fund's advisory fees and other expenses, including information comparing the Fund's fees and expenses to those of peer groups of funds and information about any applicable expense limitations and fee "breakpoints," (iii) data on sales and redemptions of Fund shares and (iv) information on the profitability to CWAM, as well as potential "fall-out" or ancillary benefits that CWAM and its affiliates may receive as a result of their relationships with the Funds. The trustees also considered other information such as (i) CWAM's financial condition, (ii) each Fund's investment objective and strategies, (iii) the size, education and experience of CWAM's investment staff and its use of technology, external research and tra ding cost measurement tools, (iv) the allocation of the Funds' brokerage, if any, including allocations to brokers affiliated with CWAM, and the use of "soft" commission dollars to pay for research products and services, (v) the resources devoted to, and the record of compliance with, the Funds' investment policies and restrictions, policies on personal securities transactions and other compliance policies and (vi) the economic and market outlook generally and for the mutual fund industry in particular, including the market-related events in 2008. In addition, the trustees conferred with, and reviewed the Management Fee Evaluation (the "Fee Evaluation") prepared by the Trust's chief compliance officer, who also serves as the Trust's "Senior Officer," as contemplated by the Assurance of Discontinuance dated February 9, 2005 among affiliates of CWAM and the Office of the New York Attorney General. A summary of the Fee Evaluation is included in this report. Throughout the annual contract renewal process, the tr ustees had the opportunity to ask questions of and request additional materials from CWAM.
The Committee held meetings in May 2009 and reported its recommendations to the full board of trustees. On June 10, 2009, the board of trustees unanimously approved continuation through July 31, 2010 of (i) the Advisory Agreement and (ii) the Trust's administrative services agreement with CWAM (the "Administration Agreement").
In considering the continuation of the Advisory Agreement and the continuation of the amended Administration Agreement, the trustees reviewed and analyzed various factors that they determined were relevant, including the factors described below, none of which by itself was considered dispositive. However, the material factors and conclusions that formed the basis for the trustees' determination to approve the continuation of the Advisory Agreement and the amended Administration Agreement are discussed separately below.
Nature, quality and extent of services. The trustees reviewed the nature, quality and extent of the services of CWAM and its affiliates to the Funds, taking into account the investment objective and strategy of each Fund and knowledge gained from meetings with management, which were held on at least a quarterly basis. In addition, the trustees reviewed the available resources and key personnel of CWAM and its affiliates, especially those providing investment management services to the Funds. The trustees also considered other services provided to the Funds by CWAM and its affiliates, including: managing the execution of portfolio transactions and selecting broker-dealers for those transactions; monitoring adherence to the Funds' investment restrictions; producing shareholder reports; providing support services. for the board of trustees and committees of the board; communicating with shareholders; serving as the Funds' administrator; and overseeing the activities of the Funds' other service providers, including monitoring for compliance with various policies and procedures as well as applicable securities laws and regulations.
The trustees concluded that the nature, quality and extent of the services provided by CWAM and its affiliates to each Fund were appropriate and consistent with the terms of the Advisory Agreement and the Administration Agreement, and that the quality of those services had been consistent with or superior to quality norms in the industry. The trustees further concluded that the Funds were likely to benefit from the continued provision of those services by CWAM to the Funds. They also concluded that CWAM currently had sufficient personnel, with appropriate education and experience, to serve the Funds effectively, and had demonstrated its continuing ability to attract and retain well qualified personnel.
Performance of the Funds. At various meetings of the board of trustees, the Committee and the Investment Performance Committee of the board, the trustees considered the short-term and longer-term performance of each Fund. They reviewed information comparing each Fund's performance with that of its benchmark(s) and with the performance of comparable funds and peer groups as identified by Lipper Inc. ("Lipper") and Morningstar, Inc. ("Morningstar"). On the domestic side, the trustees discussed that each of Wanger USA and Wanger Select had a particularly difficult performance year during 2008, which the trustees acknowledged. In that regard, Wanger USA and Wanger Select both underperformed their respective benchmarks and peer group averages for the five-year period. In evaluating the underperformance of these two Funds, the trustees considered that CWAM was taking steps to remediate the underperformance, which the trustees would monitor. The trustees also reviewed the performance of the international Funds, discussing how both Wanger International and Wanger International Select continued to outperform their benchmarks and the majority of their peer groups established by Lipper and Morningstar over the five-year period. During the annual contract renewal process, the trustees concluded that, although past performance is not necessarily indicative of future results, the international Funds' strong overall longer-term performance record was an important factor in the their evaluation of the quality of services provided by CWAM under the Advisory Agreement.
Costs of Services and Profits Realized by CWAM. At various Committee and board of trustees meetings and other informal meetings, the trustees examined detailed information on the fees and expenses of each Fund in comparison to information for other comparable funds provided by Lipper and Morningstar. As noted in the Fee Evaluation, the contractual rates of investment advisory fees and the actual advisory fees paid by Wanger Select and Wanger USA were higher than the median advisory fee rates of their
22
Wanger Select 2009 Semiannual Report
Wanger Advisors Trust Board Approval of the Advisory Agreement 2009
respective peer groups. The trustees also considered the advisory fees of the Funds relative to those of the series of Columbia Acorn Trust ("Acorn"), a group of funds with similar investment strategies also overseen by the trustees and managed by CWAM. The trustees noted that the Funds' advisory fees were comparable to those of the Acorn funds.
The trustees reviewed the analysis of the profitability of CWAM in serving as each Fund's investment adviser and of CWAM and its affiliates in their relationships with each Fund, as well as an explanation of the methodology utilized in allocating various expenses among the Funds and other business units, each of which was included in the Fee Evaluation. The trustees considered the methodology used by CWAM in determining compensation payable to portfolio managers and the competitive market for investment management talent. They discussed how profitability comparisons among fund managers are not very meaningful due to the small number of publicly-owned managers, and how the profitability of any investment manager is affected by numerous factors, including its particular organizational structure, the types of funds and other accounts managed, other lines of business, expense allocation methodology, capital structure and cost of cap ital.
The trustees also reviewed the advisory fees charged by CWAM for managing other investment companies, sub-advised funds and other institutional separate accounts, as detailed in the Fee Evaluation. CWAM's institutional separate account fees for various investment strategies were examined and in some cases those fees were higher than the advisory fees charged to the Funds, and in some instances the Funds' fees were higher. The trustees noted that CWAM performs significant additional services for the Funds that it does not provide to sub-advised funds or non-mutual fund clients, including administrative services, oversight of the Funds' other service providers, trustee support, regulatory compliance and numerous other services, and that, in servicing the Funds, CWAM assumes many legal risks that it does not assume in servicing many of its other clients. Finally, as part of the annual contract renewal process, the trustees consider ed CWAM's financial condition as a result of market-related declines in assets in 2008 and 2009, and the possible impending sale of Bank of America's controlling interest in CWAM.
The trustees concluded that the rates of advisory fees and other compensation payable by the Funds to CWAM and its affiliate's were reasonable in relation to the nature and quality of the services to be provided, taking into account the fees charged by other advisers for managing comparable mutual funds with similar strategies and the fees CWAM charges to other clients. The trustees also concluded that the Funds' estimated overall expense ratios were reasonable, considering the quality of services provided by CWAM and its affiliates and the investment performance of the Funds.
Economies of Scale. At various meetings throughout the annual contract renewal process, the trustees considered information about the extent to which CWAM realizes economies of scale in connection with the increase of Fund assets. The trustees noted that the advisory fee schedule for each Fund includes breakpoints in the rate of fees at various asset levels. They noted that the Funds also share directly in economies of scale through lower charges by third party service providers based on the combined scale of all of the Funds. The trustees concluded that the current fee structure of each Fund was reasonable and reflective of a sharing between CWAM and the Funds of economies of scale.
Other Benefits to CWAM. The trustees also reviewed benefits that accrue to CWAM and its affiliates from their relationships with the Funds, as outlined in the Fee Evaluation. They noted that the Funds' transfer agent and distributor were each affiliates of CWAM and that the transfer agent received compensation from the Funds for services provided. The trustees considered ways, other than the services provided by CWAM and its affiliates pursuant to various agreements and the fees to be paid by each Fund therefor, that the Funds and CWAM may potentially benefit from their relationship with each other. At various Committee meetings, the trustees also considered CWAM's use of commissions paid by each Fund on its portfolio brokerage transactions to obtain research products and services benefiting the Fund and/or other clients of CWAM. They determined that CWAM's use of the Funds' "soft" commission dollars to obtain research products and services was consistent with regulatory requirements and guidance then in effect. They also concluded that CWAM benefits from the receipt of proprietary research products and services acquired through commissions paid on portfolio transactions of the Funds, and that the Funds benefit from CWAM's receipt of those products and services as well as research products and services acquired through commissions paid by other clients of CWAM. The trustees further determined that the success of any Fund could attract other business to CWAM or the Funds and that the success of CWAM could enhance its ability to serve the Funds.
After full consideration of the above factors, as well as other factors that were instructive in evaluating the Advisory Agreement, the trustees, including the Independent Trustees, concluded that the continuation of the Advisory Agreement and continuation of the Administration Agreement was in the best interest of each Fund. On June 10, 2009, the trustees approved continuation of the Advisory Agreement and the Administration Agreement , as so amended, through July 31, 2010.
23
Wanger Select 2009 Semiannual Report

Columbia Wanger Funds
Trustees
Robert E. Nason*
Chairman of the Board
Allan B. Muchin
Vice Chairman of the Board
Laura M. Born
Michelle L. Collins
Maureen M. Culhane
Margaret M. Eisen
Jerome Kahn, Jr.
Steven N. Kaplan
David C. Kleinman
Charles P. McQuaid
James A. Star
Ralph Wanger
John A. Wing
Officers
Charles P. McQuaid
President
Ben Andrews
Vice President
Michael G. Clarke
Assistant Treasurer
Jeffrey R. Coleman
Assistant Treasurer
P. Zachary Egan
Vice President
Peter T. Fariel
Assistant Secretary
John M. Kunka
Assistant Treasurer
Joseph C. LaPalm
Vice President
Bruce H. Lauer
Vice President, Secretary and Treasurer
Louis J. Mendes III
Vice President
Robert A. Mohn
Vice President
Christopher J. Olson
Vice President
Robert P. Scales
Chief Compliance Officer, Chief Legal Officer, Senior Vice President and General Counsel
Linda K. Roth-Wiszowaty
Assistant Secretary
*Deceased, June 27, 2009.
Transfer Agent,
Dividend Disbursing Agent
Columbia Management Services, Inc.
P.O.Box 8081
Boston, Massachusetts
02266-8081
Distributor
Columbia Management Distributors, Inc.
One Financial Center
Boston, Massachusetts
02111-2621
Investment Advisor
Columbia Wanger Asset Management, L.P.
227 West Monroe Street, Suite 3000
Chicago, Illinois 60606
1-888-4-WANGER
(1-888-492-6437)
Legal Counsel to the Fund
K&L Gates LLP
Washington, DC
Legal Counsel to the Independent Trustees
Drinker Biddle & Reath LLP
Philadelphia, Pennsylvania
Independent Registered Public Accounting Firm
PricewaterhouseCoopers LLP
Chicago, Illinois
This report, including the schedules of investments and financial statements, is submitted for the general information of the shareholders of the Wanger Advisors Trust.
A description of the Fund's proxy voting policies and procedures and a copy of the Fund's voting record for the most recent 12-month period ended June 30 are available (i) on the Securities and Exchange Commission's website at www.sec.gov, and (ii) without charge, upon request, by calling 888-492-6437.
The Fund files a complete schedule of portfolio holdings with the SEC for the first and third quarters of each fiscal year on Form N-Q. The Fund's Form N-Q is available on the SEC's website at www.sec.gov and may be reviewed and copied at the SEC's Public Reference Room in Washington, D.C. Information on the operation of the Pubic Reference Room may be obtained by calling 800-SEC-0330.
24
Columbia Wanger Funds
OL2568S
SHC-44/19906-0609 09/87164
Wanger USA
2009 Semiannual Report

| NOT FDIC INSURED | May Lose Value | ||||||
| NOT BANK ISSUED | No Bank Guarantee | ||||||
Wanger USA 2009 Semiannual Report
Robert E. Nason Remembered

Robert E. Nason
On June 27, 2009, Wanger Advisors Trust Board of Trustees chairman Robert E. Nason passed away. Bob was a man of great personal integrity who maintained the independence of the Board and worked to promote the interests of shareholders. He served as chairman of the Wanger Advisors Trust Board from September 2006 until his death.
Bob brought impressive credentials to the Board. He served as CEO of the accounting firm Grant Thornton where he worked for 40 years.
Bob's tenure as chairman occurred during a period of change in the investment environment. Throughout, he served our shareholders well. As regulators pushed mutual fund boards toward more independence from fund advisors, Bob successfully maintained the Wanger Advisors Trust Board's history of independence. The Trust's advisor, Columbia Wanger Asset Management (CWAM), was also faced with ownership changes and the retirement of founder Ralph Wanger. Following these events, Bob and the Board saw to it that CWAM stayed the course, maintaining its time-tested investment process, developing and keeping talented investment professionals, and sustaining its autonomous and creative environment. Under Bob's leadership, the Board implemented fee breakpoints, allowing shareholders to benefit from growth and economies of scale. After intensive analysis, Bob and the Board also successfully initiated securities lending.
Bob is survived by his wife Carol, son Steven (Abbie Baynes), daughter Jill and grandchildren Sara and Ben. We are fortunate to have known Bob and we will miss him. He was a man of great vision and we will strive to build on the momentum that he created and to maintain the legacies of the Wanger Advisors Trust.

Allan Muchin
Vice Chairman of the Board of Trustees
Wanger Advisors Trust

Charles McQuaid
President and Chief Investment Officer
Columbia Wanger Asset Management, L.P.

Wanger USA
2009 Semiannual Report
Table of Contents
| 2 | Understanding Your Expenses | ||||||
| 3 | Agriculture's Amazing Progress | ||||||
| 6 | Performance Review | ||||||
| 8 | Statement of Investments | ||||||
| 17 | Statement of Assets and Liabilities | ||||||
| 17 | Statement of Operations | ||||||
| 18 | Statement of Changes in Net Assets | ||||||
| 19 | Financial Highlights | ||||||
| 20 | Notes to Financial Statements | ||||||
| 24 | Management Fee Evaluation of the Senior Officer | ||||||
| 28 | Wanger Advisors Trust Board Approval of the Advisory Agreement 2009 | ||||||
Columbia Wanger Asset Management, L.P. ("CWAM") is one of the leading global small-and mid-cap equity managers in the United States with nearly 40 years of small- and mid-cap investment experience. As of June 30, 2009, CWAM manages $21.3 billion in assets and is the investment advisor to Wanger USA, Wanger International, Wanger Select, Wanger International Select (together, the "Columbia Wanger Funds") and the Columbia Acorn Family of Funds. Columbia Management Group, LLC ("Columbia Management") is the investment management division of Bank of America Corporation. Columbia Management entities furnish investment management services and products for institutional and individual investors.The Columbia Wanger Funds and the Columbia Acorn Family of Funds (together with other funds advi sed by Columbia Management affiliates, the"Columbia Funds") are distributed by Columbia Management Distributors, Inc., member of FINRA, SIPC, part of Columbia Management and an affiliate of Bank of America Corporation. CWAM is a registered investment advisor and an indirect, wholly owned subsidiary of Bank of America Corporation. CWAM is part of Columbia Management.
Please consider the investment objectives, risks, charges and expenses for the Fund carefully before investing. Contact 1-888-4-WANGER for a prospectus, which contains this and other important information about the Fund. You should read it carefully before you invest.
An important note: Columbia Wanger Funds are sold only to certain life insurance companies in connection with certain variable annuity contracts, variable life insurance policies and eligible qualified retirement plans.
The views expressed in "Agriculture's Amazing Progress" and in the Performance Review reflect the current views of the respective authors. These views are not guarantees of future performance and involve certain risks, uncertainties and assumptions that are difficult to predict so actual outcomes and results may differ significantly from the views expressed. These views are subject to change at any time based upon economic, market or other conditions and the respective authors disclaim any responsibility to update such views. These views may not be relied on as investment advice and, because investment decisions for a Columbia Fund are based on numerous factors, may not be relied on as an indication of trading intent on behalf of any particular Columbia Fund. References to specific company securities should not be construed as a recommendation or investment advice.
1
Wanger USA 2009 Semiannual Report
Understanding Your Expenses
As a Fund shareholder, you incur two types of costs. There are transaction costs, which generally include sales charges on purchases and may include redemption or exchange fees. There are also ongoing costs, which generally include investment advisory fees and other Fund expenses. The information on this page is intended to help you understand your ongoing costs of investing in the Fund and to compare these costs with the ongoing costs of investing in other mutual funds.
Analyzing your Fund's expenses
To illustrate these ongoing costs, we have provided an example and calculated the expenses paid by investors in the Fund during the period. The information in the following table is based on an initial, hypothetical investment of $1,000, which is invested at the beginning of the period and held for the entire period. Expense information is calculated two ways and each method provides you with different information. The amount listed in the "Actual" column is calculated using actual operating expenses and total return for the Fund. The amount listed in the "Hypothetical" column assumes that the return each year is 5% before expenses and then applies the Fund's actual expense ratio for the period to the hypothetical return. You should not use the hypothetical account values and expenses to estimate either your actual account balance at the end of the period or the expenses you paid during the period. See the "Compare with other fu nds" information for details on using the hypothetical data.
Estimating your actual expenses
To estimate the expenses that you actually paid over the period, first you will need your account balance at the end of the period.
1. Divide your ending account balance by $1,000. For example, if an account balance was $8,600 at the end of the period, the result would be 8.6.
2. In the section of the table below titled "Expenses paid during the period," you will find a dollar amount in the column labeled "Actual." Multiply this amount by the result from step 1. Your answer is an estimate of the expenses you paid on your account during the period.
January 1, 2009 – June 30, 2009
| Account value at the beginning of the period ($) | Account value at the end of the period ($) | Expenses paid during the period ($) | Fund's annualized expense ratio (%)* | ||||||||||||||||||||||||||||
| Actual | Hypothetical | �� | Actual | Hypothetical | Actual | Hypothetical | Actual | ||||||||||||||||||||||||
| Wanger USA | 1,000.00 | 1,000.00 | 1,092.68 | 1,019.84 | 5.19 | 5.01 | 1.00 | ||||||||||||||||||||||||
*For the six months ended June 30, 2009.
Expenses paid during the period are equal to the Fund's annualized expense ratio, multiplied by the average account value over the period, then multiplied by the number of days in the Fund's most recent fiscal half-year and divided by 365.
It is important to note that the expense amounts shown in the table are meant to highlight only ongoing costs of investing in the Fund. Expenses paid during the period do not include any insurance charges imposed by your insurance company's separate account. The hypothetical example provided is useful in comparing ongoing costs only and will not help you determine the relative total costs of owning different funds whose shareholders may incur transaction costs.
Compare with other funds
Since all mutual funds are required to include the same hypothetical calculations about expenses in shareholder reports, you can use this information to compare the ongoing cost of investing in the Fund with other funds. To do so, compare the 5% hypothetical example with the 5% hypothetical examples of other funds. As you compare hypothetical examples of other funds, it is important to note that hypothetical examples are meant to highlight the ongoing cost of investing in a fund and do not reflect any transaction costs, such as sales charges, redemption fees or exchange fees that may be incurred by shareholders of other funds. Expenses paid during the period do not include any insurance charges imposed by your insurance company's separate accounts.
2
Wanger USA 2009 Semiannual Report

Agriculture's Amazing Progress
Following a conversation with two of our analysts regarding the prospects for several fertilizer companies, I decided to learn more about the history and current state of agriculture. According to Marcel Mazoyer and Laurence Roudart's, A History of World Agriculture,1 farming began about 10,000 years ago. One would think that mankind is far down the learning curve in agriculture, and that productivity gains are ending. Surprisingly, quite the opposite is true. Most of the improvements in agriculture have occurred in the last 80 years.
Mazoyer and Roudart's history explains six dominant agricultural processes. The first two of these were employed during the first 8,000 years of agricultural history, obviously a time of very slow progress. Agriculture began with slash and burn techniques, whereby forest segments were successively burned and farmed for a few years until nutrients were depleted. Then, beginning in about 2500 B.C., farmers began using animal drawn scratch-plows and annually rotating land from planted to fallow in an attempt to maintain soil fertility. Other than in exceptionally fertile areas such as the lands replenished by the Nile River, these techniques barely enabled one farmer to feed one family.
Medieval farmers utilized better tools and techniques. They kept more animals and, with the help of wheeled carts and plows, used more animal-based fertilizers. Beginning in the sixteenth century, farmers began planting legumes to enhance nitrogen in the soil, further improving fertility by organic means and eliminating the need for fallowing. Productivity per farmer doubled with each of these developments, enabling the best farmers by the eighteenth century to feed an average of 20 people.
Farms became more mechanized after 1800, using metal plows, sowers, reapers and threshing machines. Transportation also improved allowing better fertilizers, that contained minerals like phosphate and potassium, to reach farmers. These minerals along with nitrogen helped to sustain crop yields. While mechanization doubled the acreage a farmer could cultivate, United States Department of Agriculture (USDA) data indicates that yields per acre of corn and wheat in the United States were flat from 1866, the date of data inception, well into the 1930s.
In the first half of the twentieth century, North American farmers started using motorized equipment, synthetic fertilizers and hybrid seeds. According to Giovanni Federico's, Feeding the World,2 by 1950 farms in the United States and Canada had one tractor for every two farmers. Utilization of fertilizer grew six fold from 1900 to 1950. Hybrid wheat was grown on 87% of the planted acres in the United States in 1921, up from 14% in 1914. Hybrid corn crops jumped from 2% to 90% of acres planted from 1936 to 1945.3
After World War II these innovations spread. Worldwide chemical fertilizer usage grew nearly tenfold from 1950 to 2000. In most continents, over half of wheat, rice and corn acres were sown with high yield varieties by the year 2000. From 1950 to 2000, world agriculture production tripled, far outpacing population growth.4 USDA data indicates that from 1998 to 2008, wheat yields per acre averaged 41 bushels, triple the rate of 100 years ago, and corn yields quintupled to an average of 144 bushels. The best equipped farmers can now produce over four million pounds of grain and feed thousands!5
Launching a "Green Revolution" in Developing Countries
Rich countries had the means to adopt modern agricultural processes while poor regions struggled to advance. Leon Hesser's book, The Man Who Fed the World,6 describes how Dr. Norman Borlaug helped create the Green Revolution7 in many developing countries by improving plant varieties and increasing crop yields. For his efforts, Borlaug won a Nobel Peace Prize, the only one awarded in the twentieth century for work in agriculture.
Mexico redistributed land to poor peasants after its political revolution ended in 1918. However, its peasants remained poor and hungry for decades. In 1940, U.S. vice president elect, Henry Wallace, who had founded Hi-Bred Corn Company (now Pioneer Hi-Bred, a DuPont subsidiary), toured Mexico and was appalled by conditions there. He convinced the Rockefeller Foundation to sponsor efforts to adapt hybrid wheat and corn for Mexico and in 1943, the Mexican Government-Rockefeller Foundation Cooperative Agricultural Program was established.
The program hired Borlaug as its plant pathologist. Borlaug learned that a plant disease called wheat stem rust had halved Mexico's wheat production from 1939 to 1942. He set out to create high yielding hybrid wheat that was resistant to the disease. His program introduced three innovations. First, he planted successive hybrid crops in two locations each year, which both doubled the pace of progress and resulted in crops tolerant to varying conditions. Next, Borlaug crossed thousands of varieties of wheat, working to find the most resistant hybrids. He eventually developed 40 rust resistant varieties.
Third, Borlaug changed the architecture of wheat. He knew that many wheat varieties responded well to fertilizer but when yields exceeded roughly two tons per acre, plants became top-heavy and collapsed. Borlaug crossed over 20,000 varieties of wheat from around the world in his efforts to create high yielding wheat with shorter, stronger stems. He finally succeeded in 1953 by crossing rust-resistant Mexican seeds with Japanese dwarf wheat. Under ideal
3
Wanger USA 2009 Semiannual Report
conditions, four tons of wheat per acre could be achieved. Mexico became self sufficient in wheat in 1956.
Having achieved success in Mexico, the Rockefeller Foundation pursued progress elsewhere, in partnership with the Ford Foundation, the United Nations and local governments. Pakistan and India were major beneficiaries. By 1970, 55% of Pakistan's wheat acreage and 35% of India's wheat acreage were sown with Mexican varieties. The Rockefeller and Ford Foundations also created the International Rice Research Institute, which began in 1960. By 1966 it developed a sturdy short-stemmed rice plant that, when fertilized sufficiently, yielded two- to three-times the rice it replaced. This rice was quickly adopted in India.
Borlaug was personally involved with the implementation of these programs. He understood that in addition to better seeds, farmers need fertilizer, credit and fair prices for their crops. Governments largely complied. As a result of the Green Revolution, many developing countries were substantial contributors to world agricultural growth.
Recent Conditions and Future Prospects
After reading so much about the amazing progress that has been made in agriculture, it was somewhat surprising to find an article in the June 2009 National Geographic titled, "The End of Plenty, The Global Food Crisis." It noted that global grain consumption exceeded production for seven of the last nine years and grain stockpiles plunged to a 20-year low of 61-days supply in 2007 prior to recovering to a meager 70-days supply in 2008. The price of wheat and corn tripled from 2005 to 2008, and the price of rice quintupled.
Demand recently grew more quickly than supply for several reasons. First, people in developing countries are becoming more prosperous and are eating more meat, causing grain consumption by livestock to rise rapidly. Second, use of ethanol as a gasoline additive or substitute has jumped. Some 30% of the 2008 U.S. corn crop was converted to ethanol instead of being available as food. Third, while world grain production hit records in 2008, growth in grain production has slowed somewhat since the year 2000 compared to prior decades.
Still, agriculture continues to find ways to meet the rising demand. Advancements in hybrid crops continue, and biotechnology is now creating crops with whole new characteristics. While conventional plant breeding is limited to crossing closely related species, biotech methods utilize genes from distant species. To date, two types of biotech crops have been commercialized, those resistant to herbicides and those resistant to insects.
Biotech crops were first made available in 1996 and by 2008 were planted in over 300 million acres, some 8% of global cropland in 25 countries, including 15 developing countries. That year, 85% of the corn crop in the United States came from biotech seeds. Farmers seem satisfied with biotech crops; nearly 100% keep planting biotech once they begin.8 Use of biotech versions of soybean, cotton, corn, canola and other crops increased farm income an estimated $10 billion in 2007 and biotech corn and soybean yields appear to be roughly 10% higher than conventional crops.9 The National Geographic story quotes a scientist with agricultural company Monsanto who predicts that biotechnology will double corn, soybean and cotton yields by 2030.
National Geographic also pointed out the downside of the Green Revolution. Yields in India have flattened since the mid-90s, and hybrid plant needs for water, fertilizer and pesticides have resulted in aquifer depletion, salinized soils and contamination of drinking water. However, new versions of biotech plants are in development, including versions likely to provide still higher yields, drought tolerance and salinized soil tolerance.
Not everyone agrees with the use of biotech crops. Critics have expressed doubts about productivity gains and have concerns about the possibility of a "Frankenfood" becoming toxic or creating an ecological disaster should some new plant become invasive. But numerous safeguards are in place, including rigorous approval processes. Countries that had prohibited biotech crops are now slowly introducing them. Increased adoption of biotech plants has had positive ecological effects, as higher yields reduce needs for additional crop acres and related deforestation, insect resistance reduces needs for pesticides, and herbicide resistance reduces fuel consumption and soil erosion by requiring less tillage.
Mankind's progress in agriculture has been truly amazing. We cannot revert back to previous agricultural processes, which are insufficient to feed a worldwide population of 6.7 billion. Instead, substantial investments in agriculture, and judicious use of new technologies, are needed to maintain impressive production gains in the future.
Columbia Wanger Funds News
Resumption of Securities Lending
The Columbia Wanger Funds restarted securities lending during the second quarter. The domestic Funds briefly participated in securities lending in the third quarter of last year but suspended lending activities due to the turmoil in the financial markets at that time. As market conditions have stabilized somewhat, the Wanger Advisors Trust Board and CWAM made the decision to begin securities lending again in June.
Securities lending has come under media scrutiny recently so we want to clearly
4
Wanger USA 2009 Semiannual Report
state how CWAM administers the lending program. Fund shareholders receive all of the income generated by our lending program, net of modest fees charged by the lending agent to operate the program. The securities lending income benefits Fund shareholders by offsetting a portion of the Fund's operating expenses, which increases the Fund's total returns. The advisor charges no additional fees for administering this program.
Securities lending is the temporary lending of the Fund's portfolio securities to broker/dealers and other institutional investors. The Fund retains the benefits of owning the securities, including receipt of dividends or interest generated by the security. The Fund also receives a fee for the loan. The Fund may recall the loans at any time and may do so in order to vote proxies or to sell the loaned securities. Furthermore, borrowers provide the Fund with cash collateral that exceeds the value of the securities on loan. The Fund could lose money if it incurred a loss on the reinvestment of the cash collateral. To minimize this risk, cash collateral for the program is invested in the Dreyfus Government Cash Management Fund, a money market mutual fund. The securities lending agent is Goldman Sachs Agency Lending. Thus far, shareholders have received modest benefits and incurred no losses from the program.


Charles P. McQuaid
President and Chief Investment Officer
Columbia Wanger Asset Management, L.P.
The information and data provided in this analysis are derived from sources that we deem to be reliable and accurate. These views are not guarantees of future performance and involve certain risks, uncertainties and assumptions that are difficult to predict so actual outcomes and results may differ significantly from the views expressed. The views/opinions expressed in "Agriculture's Amazing Progress" are those of the author and not of the Wanger Advisors Trust Board, are subject to change at any time based upon economic, market or other conditions, may differ from views expressed by other Columbia Management associates or other divisions of Bank of America and the respective parties disclaim any responsibility to update such views. These views may not be relied on as investment advice and, because investment decisions for a Columbia Wanger Fund are based on numerous factors, may not be relied on as an indication of trading i ntent on behalf of any particular Columbia Wanger Fund.
1 Mazoyer, Marcel and Roudart, Laurence, A History of World Agriculture, (New York, NY, Monthly Review Press, 2006).
2 Federico, Giovanni, Feeding The World, (Princeton and Oxford, Princeton University Press, 2005).
3 Ibid, pg. 97.
4 Ibid, pgs. 55, 19.
5 Mazoyer, Marcel and Roudart, Laurence, op. cit., pg 11.
6 Hesser, Leon, The Man Who Fed The World, (Dallas, TX, Durban House, 2006).
7 The Green Revolution is defined by Mazoyer and Roudart as, "a variant of the contemporary agricultural revolution but without the large-scale motorization and mechanization, developed widely in the developing countries."
8 ISAAA Brief 39-2008: Executive Summary, "Global Status of Commercialized Biotech/GM Crops: 2008, The First Thirteen Years, 1996 to 2008," available at www.isaaa.org.
9 "GM crops: global, socio-economic and environmental impacts 1996-2007," a research paper written by Graham Brookes and Peter Barfoot of PG Economics Ltd, Dorchester, U.K., May 2009.
5
Wanger USA 2009 Semiannual Report

Performance Review Wanger USA

Robert A. Mohn
Portfolio Manager
Performance data quoted represents past performance and current performance may be lower or higher. Past performance is no guarantee of future results. The investment return and principal value will fluctuate so that shares, when redeemed, may be worth more or less than the original cost. For daily and most recent month-end performance updates, please call 1-888-4-WANGER.
Wanger USA ended the semiannual period up 9.27%, well ahead of its primary benchmark, the Russell 2000 Index, which gained 2.64%.
Winners for the half year came from a variety of sectors. Auto lender AmeriCredit returned from the near-dead as the market reacted favorably to its positive earnings announcement and to news that the company was able to renegotiate its bank credit lines. The stock was up 77% year to date. Atwood Oceanics, an offshore drilling contractor, was helped by the rebound in oil prices, which fueled a 67% return for the half year. FMC Technologies, an oil and gas wellhead manufacturer, also benefited from the oil price bounce, gaining 57% for the half year. Cost controls helped Micros Systems, a provider of information systems for restaurants and hotels. Micros's earnings were down just a penny from the prior year and this ability to nearly maintain earnings, while operating in an extremely strained sector, got a positive nod from the market. Its stock gained 55% for the half year. Crown Castle International, an owner of cellular commun ications towers, gained 37% in the half year on news the company successfully completed a debt refinancing. True Religion Apparel, a maker of premium jeans, announced 19% year-to-year sales growth in its growing franchise. The stock was up 79% for the half.
Fund bank holdings came up short during the period. Community banks MB Financial, Valley National Bancorp, Berkshire Hills Bancorp, Lakeland Financial and Associated Banc-Corp all made the Fund's loser list as high default rates took down the whole group. Losses in these stocks ranged from 19% to 63%.
Fund health care stocks were also weak in the period. Pharmaceutical company Cephalon fell on fears that pending legislation and regulatory actions could have a negative impact on pharmaceutical companies. Immucor, a maker of blood typing and screening products, saw its stock collapse when news broke that it was under investigation for potential anti-trust violations. BioMarin, a biotech company focused on orphan diseases, declined after providing financial guidance that fell well below street expectations.
The second half of the period brought springtime to the United States and to the stock and bond markets. Debt markets loosened up quite a bit during the second quarter, with some corporate bond spreads dropping back below levels of one year ago. Credit markets led the stock market down last year; they may be leading us the other way in 2009.
Stocks of small- and mid-cap companies pose special risks, including possible illiquidity and greater price volatility than stocks of larger, more established companies.
Portfolio holdings are subject to change periodically and may not be representative of current holdings.
Fund's Positions in Mentioned Holdings
As a percentage of net assets, as of 6/30/09
| Crown Castle International | 2.5 | % | |||||
| FMC Technologies | 2.3 | ||||||
| Micros Systems | 1.8 | ||||||
| Atwood Oceanics | 1.8 | ||||||
| AmeriCredit | 1.5 | ||||||
| Valley National Bancorp | 1.1 | ||||||
| True Religion Apparel | 1.0 | ||||||
| Lakeland Financial | 0.8 | ||||||
| Cephalon | 0.6 | ||||||
| Berkshire Hills Bancorp | 0.5 | ||||||
| MB Financial | 0.5 | ||||||
| BioMarin | 0.4 | ||||||
| Immucor | 0.3 | ||||||
| Associated Banc-Corp | 0.2 | ||||||
6
Wanger USA 2009 Semiannual Report
Growth of a $10,000 Investment in Wanger USA
May 3, 1995 (inception date) through June 30, 2009
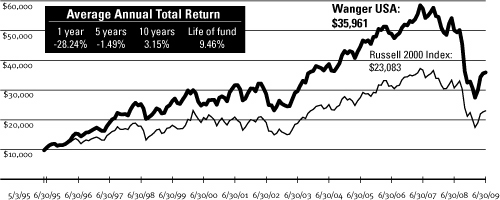
Performance data quoted represents past performance and current performance may be lower or higher. Past performance is no guarantee of future results. The investment return and principal value will fluctuate so that shares, when redeemed, may be worth more or less than the original cost. Performance results may reflect any fee waivers or reimbursements of fund expenses by the investment advisor and/or any of its affiliates. Absent these fee waivers or expense reimbursement arrangements, performance results would have been lower. For daily and most recent month-end performance updates, please call 1-888-4-WANGER.
This graph compares the results of $10,000 invested in Wanger USA on May 3, 1995 (the date the Fund began operations) through June 30, 2009, to the Russell 2000 Index, with dividends and capital gains reinvested. Although the index is provided for use in assessing the Fund's performance, the Fund's holdings may differ significantly from those in the index.
Top 10 Holdings
As a percentage of net assets, as of 6/30/09
| 1. Crown Castle International Communications Towers | 2.5 | % | |||||
| 2. Ametek Aerospace/Industrial Instruments | 2.4 | ||||||
| 3. FMC Technologies Oil & Gas Wellhead Manufacturer | 2.3 | ||||||
| 4. tw telecom Fiber Optic Telephone/Data Services | 2.1 | ||||||
| 5. ESCO Technologies Automatic Electric Meter Readers | 2.0 | ||||||
| 6. Global Payments Credit Card Processor | 1.9 | ||||||
| 7. Micros Systems Information Systems for Restaurants & Hotels | 1.8 | ||||||
| 8. ITT Educational Services Post-secondary Degree Services | 1.8 | ||||||
| 9. Atwood Oceanics Offshore Drilling Contractor | 1.8 | ||||||
| 10. Informatica Enterprise Data Integration Software | 1.6 | ||||||
Top 5 Industries
As a percentage of net assets, as of 6/30/09
| Information | 31.1 | % | |||||
| Finance | 16.0 | ||||||
| Consumer Goods & Services | 15.3 | ||||||
| Industrial Goods & Services | 14.4 | ||||||
| Health Care | 9.5 | ||||||
Results as of June 30, 2009
| 2nd quarter | Year to date | 1 year | 5 year | 10 year | |||||||||||||||||||
| Wanger USA | 19.97 | % | 9.27 | % | -28.24 | % | -1.49 | % | 3.15 | % | |||||||||||||
| Russell 2000 Index | 20.69 | 2.64 | -25.01 | -1.71 | 2.38 | ||||||||||||||||||
| Lipper Variable Underlying Small-Cap Growth Funds Index | 21.86 | 12.07 | -25.82 | -1.19 | 1.41 | ||||||||||||||||||
NAV as of 6/30/09: $21.09
Performance numbers reflect all Fund expenses but do not include any insurance charge imposed by your insurance company's separate accounts. If performance results included the effect of these additional charges, it would be lower.
The Fund's annual operating expense ratio is 0.96%. The annual operating expense ratio is as stated in the Fund's prospectus that is current as of the date of this report. Differences in expense ratios disclosed elsewhere in this report may result from including fee waivers and expense reimbursements, if any, as well as different time periods used in calculating the ratios.
All results shown assume reinvestment of distributions and do not reflect taxes that a shareholder would pay on Fund distributions or the sale of Fund shares.
The Russell 2000 Index, the Fund's primary benchmark, measures the performance of the 2,000 smallest companies in the Russell 3000 Index, which represents approximately 7% of the total market capitalization of the Russell 3000 Index. The Lipper Variable Underlying Small-Cap Growth Funds Index is an equally weighted representation of the 30 largest variable insurance underlying funds in the Lipper Variable Underlying Small-Cap Growth Funds Classification. Indexes are not managed and do not incur fees or expenses. It is not possible to invest directly in an index.
Portfolio characteristics and holdings are subject to change periodically and may not be representative of current characteristics and holdings.
Lipper Inc., a widely respected data provider in the industry, calculates an average total return (assuming reinvestment of distributions) for mutual funds with investment objectives similar to those of the fund. Lipper makes no adjustment for the effect of sales loads.
7
Wanger USA 2009 Semiannual Report
Wanger USA
Statement of Investments (Unaudited), June 30, 2009
| Number of Shares | Value | ||||||||||
| Common Stocks – 99.8% | |||||||||||
| Information – 31.1% | |||||||||||
| Business Software – 8.2% | |||||||||||
| 740,000 | Micros Systems (a) Information Systems for Restaurants & Hotels | $18,736,800 | |||||||||
| 939,000 | Informatica (a) Enterprise Data Integration Software | 16,141,410 | |||||||||
| 2,280,000 | Novell (a) Directory, Operating System & Identity Management Software | 10,328,400 | |||||||||
| 312,000 | Concur Technologies (a) Web Enabled Cost & Expense Management Software | 9,696,960 | |||||||||
| 305,000 | ANSYS (a) Simulation Software for Engineers & Designers | 9,503,800 | |||||||||
| 575,000 | Blackbaud Software & Services for Non-profits | 8,941,250 | |||||||||
| 100,000 | Quality Systems (b) IT Systems for Medical Groups & Ambulatory Care Centers | 5,696,000 | |||||||||
| 150,000 | NetSuite (a)(b) End to End IT Systems Solution Delivered Over the Web | 1,771,500 | |||||||||
| 90,000 | Avid Technology (a) Digital Nonlinear Editing Software & Systems | 1,206,900 | |||||||||
| 180,000 | Art Technology Group (a) Software & Tools to Optimize Websites for E-Commerce | 684,000 | |||||||||
| 82,707,020 | |||||||||||
| Semiconductors & Related Equipment – 3.9% | |||||||||||
| 743,000 | Microsemi (a) Analog/Mixed-signal Semiconductors | 10,253,400 | |||||||||
| 1,179,750 | ON Semiconductor (a) Mixed-signal & Power Management Semiconductors | 8,093,085 | |||||||||
| 1,180,000 | Integrated Device Technology (a) Communications Semiconductors | 7,127,200 | |||||||||
| 189,300 | Supertex (a) Analog/Mixed-signal Semiconductors | 4,753,323 | |||||||||
| 210,000 | Monolithic Power Systems (a) High Performance Analog & Mixed Signal Integrated Circuits (ICs) | 4,706,100 | |||||||||
| 345,000 | Pericom Semiconductor (a) Interface Integrated Circuits (ICs) & Frequency Control Products | 2,904,900 | |||||||||
| 750,000 | Entegris (a) Semiconductor Materials Management Products | 2,040,000 | |||||||||
| 39,878,008 | |||||||||||
| Number of Shares | Value | ||||||||||
| Instrumentation – 3.2% | |||||||||||
| 185,000 | Mettler Toledo (a) Laboratory Equipment | $14,272,750 | |||||||||
| 765,000 | IPG Photonics (a) Fiber Lasers | 8,392,050 | |||||||||
| 281,300 | FLIR Systems (a) Infrared Cameras | 6,346,128 | |||||||||
| 168,000 | Trimble Navigation (a) GPS-based Instruments | 3,297,840 | |||||||||
| 32,308,768 | |||||||||||
| Telephone and Data Services – 2.8% | |||||||||||
| 2,081,000 | tw telecom (a) Fiber Optic Telephone/Data Services | 21,371,870 | |||||||||
| 590,000 | Cogent Communications (a) Internet Data Pipelines | 4,808,500 | |||||||||
| 800,000 | PAETEC Holding (a) Telephone/Data Services for Business | 2,160,000 | |||||||||
| 28,340,370 | |||||||||||
| Mobile Communications – 2.5% | |||||||||||
| 1,040,000 | Crown Castle International (a) Communications Towers | 24,980,800 | |||||||||
| 88,000 | Globalstar (a) Satellite Mobile Voice & Data Carrier | 92,400 | |||||||||
| 25,073,200 | |||||||||||
| Computer Hardware & Related Equipment – 2.2% | |||||||||||
| 375,600 | Amphenol Electronic Connectors | 11,883,984 | |||||||||
| 230,000 | II-VI (a) Laser Optics & Specialty Materials | 5,099,100 | |||||||||
| 85,000 | Zebra Technologies (a) Bar Code Printers | 2,011,100 | |||||||||
| 135,000 | Netgear (a) Networking Products for Small Business & Home | 1,945,350 | |||||||||
| 80,000 | Nice Systems – ADR (Israel) (a) Audio & Video Recording Solutions | 1,845,600 | |||||||||
| 22,785,134 | |||||||||||
See accompanying notes to financial statements.
8
Wanger USA 2009 Semiannual Report
Wanger USA
Statement of Investments (Unaudited), June 30, 2009
| Number of Shares | Value | ||||||||||
| Telecommunications Equipment – 1.9% | |||||||||||
| 475,000 | Polycom (a) Video Conferencing Equipment | $9,628,250 | |||||||||
| 335,000 | CommScope (a) Wireless Infrastructure Equipment & Telecom Cable | 8,797,100 | |||||||||
| 77,400 | Blue Coat Systems (a) WAN Acceleration & Network Security | 1,280,196 | |||||||||
| 19,705,546 | |||||||||||
| Financial Processors – 1.9% | |||||||||||
| 511,000 | Global Payments Credit Card Processor | 19,142,060 | |||||||||
| Internet Related – 1.6% | |||||||||||
| 947,000 | Switch & Data Facilities (a) Network Neutral Data Centers | 11,108,310 | |||||||||
| 40,000 | Equinix (a) Network Neutral Data Centers | 2,909,600 | |||||||||
| 875,000 | TheStreet.com Advertising on Financial Information Websites | 1,828,750 | |||||||||
| 15,846,660 | |||||||||||
| Gaming Equipment & Services – 1.2% | |||||||||||
| 400,000 | Bally Technologies (a) Slot Machines & Software | 11,968,000 | |||||||||
| Computer Services – 0.6% | |||||||||||
| 155,000 | SRA International (a) Government IT Services | 2,721,800 | |||||||||
| 753,000 | RCM Technologies (a)(c) Technology & Engineering Services | 1,671,660 | |||||||||
| 705,500 | Hackett Group (a) IT Integration & Best Practice Research | 1,643,815 | |||||||||
| 6,037,275 | |||||||||||
| Business Information & Marketing Services – 0.6% | |||||||||||
| 443,200 | Navigant Consulting (a) Financial Consulting Firm | 5,726,144 | |||||||||
| Contract Manufacturing – 0.3% | |||||||||||
| 115,000 | Plexus (a) Electronic Manufacturing Services | 2,352,900 | |||||||||
| 1,500,000 | Sanmina-SCI (a) Electronic Manufacturing Services | 660,000 | |||||||||
| 3,012,900 | |||||||||||
| Number of Shares | Value | ||||||||||
| CATV – 0.1% | |||||||||||
| 305,800 | Mediacom Communications (a) CATV Franchises | $1,562,638 | |||||||||
| Radio – 0.1% | |||||||||||
| 561,900 | Salem Communications (a) Radio Stations for Religious Programming | 539,424 | |||||||||
| 515,000 | Spanish Broadcasting System (a) Spanish Language Radio Stations | 92,700 | |||||||||
| 632,124 | |||||||||||
| TV Broadcasting – —% | |||||||||||
| 880,000 | Entravision Communications (a) Spanish Language TV & Radio Stations | 422,400 | |||||||||
| Total Information | 315,148,247 | ||||||||||
| Finance – 16.0% | |||||||||||
| Finance Companies – 4.8% | |||||||||||
| 1,142,400 | AmeriCredit (a)(b) Auto Lending | 15,479,520 | |||||||||
| 365,000 | GATX Rail Car Lessor | 9,387,800 | |||||||||
| 359,000 | McGrath Rentcorp Temporary Space & IT Rentals | 6,842,540 | |||||||||
| 200,000 | Aaron's Rent to Own | 5,964,000 | |||||||||
| 625,000 | H&E Equipment Services (a) Heavy Equipment Leasing | 5,843,750 | |||||||||
| 144,800 | World Acceptance (a) Personal Loans | 2,882,968 | |||||||||
| 700,000 | CIT Group Middle Market Lender, Equipment Leasing & Vendor Finance/Factoring | 1,505,000 | |||||||||
| 230,000 | CAI International (a) International Container Leasing | 1,173,000 | |||||||||
| 49,078,578 | |||||||||||
| Banks – 4.8% | |||||||||||
| 935,083 | Valley National Bancorp New Jersey/New York Bank | 10,940,471 | |||||||||
| 689,700 | TCF Financial Great Lakes Bank | 9,221,289 | |||||||||
| 413,979 | Lakeland Financial Indiana Bank | 7,865,601 | |||||||||
See accompanying notes to financial statements.
9
Wanger USA 2009 Semiannual Report
Wanger USA
Statement of Investments (Unaudited), June 30, 2009
| Number of Shares | Value | ||||||||||
| Banks – 4.8% (cont) | |||||||||||
| 437,000 | Pacific Continental Pacific N.W. Bank | $ | 5,300,810 | ||||||||
| 455,100 | MB Financial Chicago Bank | 4,637,469 | |||||||||
| 103,000 | SVB Financial Group (a) Bank to Venture Capitalists | 2,803,660 | |||||||||
| 155,600 | Associated Banc-Corp Midwest Bank | 1,945,000 | |||||||||
| 140,000 | Wilmington Trust Delaware Trust Bank | 1,912,400 | |||||||||
| 47,000 | BOK Financial Tulsa-based Southwest Bank | 1,770,490 | |||||||||
| 851,451 | Guaranty Bancorp (a) Colorado Bank | 1,626,272 | |||||||||
| 100,925 | Green Bankshares Tennessee Bank | 452,144 | |||||||||
| 48,475,606 | |||||||||||
| Brokerage & Money Management – 2.6% | |||||||||||
| 642,000 | SEI Investments Mutual Fund Administration & Investment Management | 11,581,680 | |||||||||
| 280,000 | Eaton Vance Specialty Mutual Funds | 7,490,000 | |||||||||
| 750,000 | MF Global (a) Futures Broker | 4,447,500 | |||||||||
| 155,000 | Investment Technology Group (a) Electronic Trading | 3,160,450 | |||||||||
| 26,679,630 | |||||||||||
| Insurance – 2.1% | |||||||||||
| 276,000 | Leucadia National (a) Insurance Holding Company | 5,820,840 | |||||||||
| 18,000 | Markel (a) Specialty Insurance | 5,070,600 | |||||||||
| 120,000 | Tower Group Commercial & Personal Lines Insurance | 2,973,600 | |||||||||
| 64,000 | Navigators Group (a) Specialty Insurance | 2,843,520 | |||||||||
| Number of Shares | Value | ||||||||||
| 75,000 | Endurance Specialty Holdings Commercial Lines Insurance/Reinsurance | $ | 2,197,500 | ||||||||
| 110,000 | Delphi Financial Group Workers Compensation & Group Employee Benefit Products & Services | 2,137,300 | |||||||||
| 21,043,360 | |||||||||||
| Savings & Loans – 1.7% | |||||||||||
| 600,000 | ViewPoint Financial Texas Thrift | 9,138,000 | |||||||||
| 238,079 | Berkshire Hills Bancorp Northeast Thrift | 4,947,281 | |||||||||
| 112,650 | People's United Connecticut Savings & Loan | 1,694,256 | |||||||||
| 60,272 | Provident New York Bancorp New York State Thrift | 489,409 | |||||||||
| 42,455 | K-Fed Bancorp Los Angeles Savings & Loan | 389,737 | |||||||||
| 16,658,683 | |||||||||||
| Total Finance | 161,935,857 | ||||||||||
| Consumer Goods & Services – 15.3% | |||||||||||
| Retail – 4.8% | |||||||||||
| 380,000 | Urban Outfitters (a) Apparel & Home Specialty Retailer | 7,930,600 | |||||||||
| 606,000 | Chico's FAS (a) Women's Specialty Retailer | 5,896,380 | |||||||||
| 216,000 | Abercrombie & Fitch Teen Apparel Retailer | 5,484,240 | |||||||||
| 188,000 | J Crew Group (a) Multi-channel Branded Retailer | 5,079,760 | |||||||||
| 419,796 | Hot Topic (a) Music Inspired Retailer of Apparel, Accessories & Gifts | 3,068,709 | |||||||||
| 112,000 | Children's Place Retail Stores (a) Specialty Children's Retailer | 2,960,160 | |||||||||
| 223,920 | Charlotte Russe (a) Value Fashion Retailer | 2,884,089 | |||||||||
| 200,000 | Lululemon Athletica (a) Premium Active Apparel Retailer | 2,606,000 | |||||||||
| 479,000 | Talbots Women's Specialty Retailer | 2,586,600 | |||||||||
See accompanying notes to financial statements.
10
Wanger USA 2009 Semiannual Report
Wanger USA
Statement of Investments (Unaudited), June 30, 2009
| Number of Shares | Value | ||||||||||
| Retail – 4.8% (cont) | |||||||||||
| 570,900 | Charming Shoppes (a) Women's Specialty Plus Size Apparel Retailer | $ | 2,123,748 | ||||||||
| 429,000 | Saks (a) Luxury Department Store Retailer | 1,900,470 | |||||||||
| 248,000 | Bebe Stores Women's Contemporary Specialty Apparel Retailer | 1,706,240 | |||||||||
| 93,000 | Hibbett Sports (a) Sporting Goods Retailer | 1,674,000 | |||||||||
| 313,200 | American Apparel (a) Vertically Integrated Apparel Retailer | 1,140,048 | |||||||||
| 311,900 | New York & Co. (a) Women's Specialty Retailer | 963,771 | |||||||||
| 150,000 | Gaiam (a) Healthy Living Catalogs & E-Commerce | 820,500 | |||||||||
| 48,825,315 | |||||||||||
| Apparel – 2.2% | |||||||||||
| 459,000 | Coach Designer & Retailer of Branded Leather Accessories | 12,337,920 | |||||||||
| 433,745 | True Religion Apparel (a) Premium Denim | 9,672,514 | |||||||||
| 22,010,434 | |||||||||||
| Educational Services – 2.1% | |||||||||||
| 186,000 | ITT Educational Services (a) Post-secondary Degree Services | 18,722,760 | |||||||||
| 310,000 | SkillSoft - ADR (a) Web-based Learning Solutions (E-Learning) | 2,418,000 | |||||||||
| 21,140,760 | |||||||||||
| Travel – 1.8% | |||||||||||
| 529,131 | Gaylord Entertainment (a) Convention Hotels | 6,725,255 | |||||||||
| 750,000 | Hertz (a) Largest U.S. Rental Car Operator | 5,992,500 | |||||||||
| 907,900 | Avis Budget Group (a) Second Largest Car Rental Company | 5,129,635 | |||||||||
| 17,847,390 | |||||||||||
| Furniture & Textiles – 1.1% | |||||||||||
| 865,000 | Knoll Office Furniture | 6,556,700 | |||||||||
| Number of Shares | Value | ||||||||||
| 310,000 | Herman Miller Office Furniture | $ | 4,755,400 | ||||||||
| 11,312,100 | |||||||||||
| Other Durable Goods – 0.9% | |||||||||||
| 338,400 | Cavco Industries (a)(c) High End Manufactured Homes | 8,571,672 | |||||||||
| 1,478,300 | Champion Enterprises (a) Manufactured Homes | 473,056 | |||||||||
| 9,044,728 | |||||||||||
| Consumer Goods Distribution – 0.7% | |||||||||||
| 433,500 | Pool Distributor of Swimming Pool Supplies & Equipment | 7,178,760 | |||||||||
| Nondurables – 0.6% | |||||||||||
| 312,000 | Jarden (a) Branded Household Products | 5,850,000 | |||||||||
| 12,000 | Chattem (a) Personal Care Products | 817,200 | |||||||||
| 6,667,200 | |||||||||||
| Casinos & Gaming – 0.5% | |||||||||||
| 555,000 | Pinnacle Entertainment (a) Regional Casino Operator | 5,155,950 | |||||||||
| Leisure Products – 0.4% | |||||||||||
| 140,000 | Thor Industries RV & Bus Manufacturer | 2,571,800 | |||||||||
| 150,000 | Winnebago Premier Motor Home Maker | 1,114,500 | |||||||||
| 3,686,300 | |||||||||||
| Other Consumer Services – 0.2% | |||||||||||
| 110,000 | Lifetime Fitness (a) Sport & Fitness Club Operator | 2,201,100 | |||||||||
| Total Consumer Goods & Services | 155,070,037 | ||||||||||
| Industrial Goods & Services – 14.4% | |||||||||||
| Machinery – 10.7% | |||||||||||
| 715,000 | Ametek Aerospace/Industrial Instruments | 24,724,700 | |||||||||
| 452,300 | ESCO Technologies (a) Automatic Electric Meter Readers | 20,263,040 | |||||||||
See accompanying notes to financial statements.
11
Wanger USA 2009 Semiannual Report
Wanger USA
Statement of Investments (Unaudited), June 30, 2009
| Number of Shares | Value | ||||||||||
| Machinery – 10.7% (cont) | |||||||||||
| 442,000 | Donaldson Industrial Air Filtration | $ | 15,310,880 | ||||||||
| 365,100 | Nordson Dispensing Systems for Adhesives & Coatings | 14,114,766 | |||||||||
| 400,000 | Pentair Pumps & Water Treatment | 10,248,000 | |||||||||
| 256,000 | Clarcor Mobile & Industrial Filters | 7,472,640 | |||||||||
| 262,200 | Mine Safety Appliances Safety Equipment | 6,319,020 | |||||||||
| 195,000 | MOOG (a) Motion Control Products for Aerospace, Defense & Industrial Markets | 5,032,950 | |||||||||
| 200,000 | Oshkosh Specialty Truck Manufacturer | 2,908,000 | |||||||||
| 50,000 | Kaydon Specialized Friction & Motion Control Products | 1,628,000 | |||||||||
| 108,021,996 | |||||||||||
| Outsourcing Services – 1.4% | |||||||||||
| 400,000 | Quanta Services (a) Electrical & Telecom Construction Services | 9,252,000 | |||||||||
| 215,000 | Administaff Professional Employer Organization | 5,003,050 | |||||||||
| 14,255,050 | |||||||||||
| Industrial Materials & Specialty Chemicals – 1.3% | |||||||||||
| 255,000 | Drew Industries (a) RV & Manufactured Home Components | 3,103,350 | |||||||||
| 164,000 | Nalco Holding Company Provider of Water Treatment & Process Chemicals & Services | 2,761,760 | |||||||||
| 50,000 | Greif Industrial Packaging | 2,211,000 | |||||||||
| 65,000 | Koppers Holdings Integrated Provider of Carbon Compounds | 1,714,050 | |||||||||
| 150,000 | Albany International Paper Machine Clothing & Advanced Textiles | 1,707,000 | |||||||||
| 60,000 | Albemarle Refinery Catalysts & Other Specialty Chemicals | 1,534,200 | |||||||||
| 13,031,360 | |||||||||||
| Number of Shares | Value | ||||||||||
| Electrical Components – 0.4% | |||||||||||
| 145,000 | Acuity Brands Commercial Lighting Fixtures | $ | 4,067,250 | ||||||||
| Construction – 0.2% | |||||||||||
| 240,000 | M/I Homes (a) Columbus-based Home Builder | 2,349,600 | |||||||||
| Steel – 0.2% | |||||||||||
| 200,000 | GrafTech International (a) Industrial Graphite Materials Producer | 2,262,000 | |||||||||
| Industrial Distribution – 0.2% | |||||||||||
| 150,000 | Interline Brands (a) Industrial Distribution | 2,052,000 | |||||||||
| Total Industrial Goods & Services | 146,039,256 | ||||||||||
| Health Care – 9.5% | |||||||||||
| Biotechnology & Drug Delivery – 3.6% | |||||||||||
| 180,000 | Myriad Genetics (a) Genetic Diagnostics | 6,417,000 | |||||||||
| 475,284 | Seattle Genetics (a) Antibody-based Therapies for Cancer | 4,619,760 | |||||||||
| 270,000 | BioMarin (a) Biotech Focused on Orphan Diseases | 4,214,700 | |||||||||
| 125,000 | Auxilium Pharmaceuticals (a) Biotech Focused on Niche Disease Areas | 3,922,500 | |||||||||
| 280,000 | Savient Pharmaceuticals (a) Biotech Company Focused on Niche Disease Areas | 3,880,800 | |||||||||
| 43,000 | United Therapeutics (a) Biotech Focused on Rare Diseases | 3,583,190 | |||||||||
| 420,000 | Medarex (a) Humanized Antibodies | 3,507,000 | |||||||||
| 500,200 | Nektar Therapeutics (a) Drug Delivery Technologies | 3,241,296 | |||||||||
| 155,900 | InterMune (a) Drugs for Pulmonary Fibrosis & Hepatitis C | 2,369,680 | |||||||||
| 145,600 | NPS Pharmaceuticals (a) Orphan Drugs & Healthy Royalties | 678,496 | |||||||||
| 500,000 | IsoRay (a) | 125,000 | |||||||||
| 100,000 | IsoRay - Warrants (a)(d) Radiology Cancer Company | 5,000 | |||||||||
| 18,100 | Poniard (a) Cancer Biotech | 108,057 | |||||||||
| 738,060 | Medicure - Warrants (a)(d) Cardiovascular Biotech Company | 6,643 | |||||||||
See accompanying notes to financial statements.
12
Wanger USA 2009 Semiannual Report
Wanger USA
Statement of Investments (Unaudited), June 30, 2009
| Number of Shares | Value | ||||||||||
| Biotechnology & Drug Delivery – 3.6% (cont) | |||||||||||
| 25,000 | Locus Pharmaceuticals, Series A-1, Pfd. (a)(d) | $ | 2,000 | ||||||||
| 12,886 | Locus Pharmaceuticals, Series B-1, Pfd. (a)(d) High Throughput Rational Drug Design | 1,031 | |||||||||
| 36,682,153 | |||||||||||
| Medical Supplies – 2.0% | |||||||||||
| 350,000 | Luminex (a) Life Science Tools & Molecular Diagnostics | 6,489,000 | |||||||||
| 70,700 | Techne Cytokines, Antibodies & Other Reagents for Life Science | 4,511,367 | |||||||||
| 450,000 | Cepheid (a) Molecular Diagnostics | 4,239,000 | |||||||||
| 180,000 | Immucor (a) Automated Blood Typing Reagents | 2,476,800 | |||||||||
| 53,000 | Idexx Laboratories (a) Diagnostic Equipment & Services for Veterinarians | 2,448,600 | |||||||||
| 20,164,767 | |||||||||||
| Medical Equipment & Devices – 1.9% | |||||||||||
| 235,000 | Alexion Pharmaceuticals (a) Biotech Focused on Orphan Diseases | 9,663,200 | |||||||||
| 169,000 | Illumina (a) Leading Tools & Service Provider for Genetic Analysis | 6,580,860 | |||||||||
| 100,000 | American Medical Systems (a) Medical Devices to Treat Urological Conditions | 1,580,000 | |||||||||
| 50,000 | Kinetic Concepts (a) Wound Healing & Tissue Repair | 1,362,500 | |||||||||
| 19,186,560 | |||||||||||
| Health Care Services – 1.4% | |||||||||||
| 362,465 | PSS World Medical (a) Distributors of Medical Supplies | 6,709,227 | |||||||||
| 242,000 | Psychiatric Solutions (a) Behavioral Health Services | 5,503,080 | |||||||||
| 285,000 | eResearch Technology (a) Clinical Research Services | 1,769,850 | |||||||||
| 13,982,157 | |||||||||||
| Number of Shares | Value | ||||||||||
| Pharmaceuticals – 0.6% | |||||||||||
| 115,000 | Cephalon (a) Specialty Pharmaceuticals for Pain, Central Nervous System & Oncology | $ | 6,514,750 | ||||||||
| 13,600 | Myriad Pharmaceuticals (a) Genetic Diagnostics | 63,240 | |||||||||
| 6,577,990 | |||||||||||
| Total Health Care | 96,593,627 | ||||||||||
| Energy & Minerals – 9.1% | |||||||||||
| Oil Services – 5.5% | |||||||||||
| 626,400 | FMC Technologies (a) Oil & Gas Wellhead Manufacturer | 23,540,112 | |||||||||
| 749,000 | Atwood Oceanics (a) Offshore Drilling Contractor | 18,657,590 | |||||||||
| 130,100 | Oceaneering International (a) Provider of Sub-sea Services & Manufactured Products | 5,880,520 | |||||||||
| 203,125 | Exterran Holdings (a) Natural Gas Compressor Rental & Fabrication | 3,258,125 | |||||||||
| 107,000 | Bristow (a) Largest Provider of Helicopter Services to Offshore Oil & Gas Producers | 3,170,410 | |||||||||
| 108,700 | Tesco (a) Developing New Well Drilling Technologies | 863,078 | |||||||||
| 55,369,835 | |||||||||||
| Oil & Gas Producers – 3.6% | |||||||||||
| 307,200 | Southwestern Energy (a) Oil & Gas Producer | 11,934,720 | |||||||||
| 570,000 | Carrizo Oil & Gas (a) Oil & Gas Producer | 9,775,500 | |||||||||
| 230,000 | Ultra Petroleum (a) Oil & Gas Producer | 8,970,000 | |||||||||
| 88,000 | Equitable Resources Natural Gas Producer & Utility | 3,072,080 | |||||||||
| 265,000 | Quicksilver Resources (a) Natural Gas & Coal Seam Gas Producer | 2,461,850 | |||||||||
| 36,214,150 | |||||||||||
| Total Energy & Minerals | 91,583,985 | ||||||||||
See accompanying notes to financial statements.
13
Wanger USA 2009 Semiannual Report
Wanger USA
Statement of Investments (Unaudited), June 30, 2009
| Number of Shares | Value | ||||||||||
| Other Industries – 4.4% | |||||||||||
| Real Estate – 2.9% | |||||||||||
| 405,000 | SL Green Realty Manhattan Office Buildings | $ | 9,290,700 | ||||||||
| 266,953 | Macerich Company (b) Regional Shopping Malls | 4,701,042 | |||||||||
| 1,450,000 | Kite Realty Group Community Shopping Centers | 4,234,000 | |||||||||
| 100,000 | Digital Realty Trust Technology-focused Office Buildings | 3,585,000 | |||||||||
| 85,000 | Corporate Office Properties Office Buildings | 2,493,050 | |||||||||
| 90,000 | American Campus Communities Student Housing | 1,996,200 | |||||||||
| 196,000 | Extra Space Storage Self Storage Facilities | 1,636,600 | |||||||||
| 120,000 | BioMed Realty Trust Life Science-focused Office Buildings | 1,227,600 | |||||||||
| 29,164,192 | |||||||||||
| Transportation – 1.5% | |||||||||||
| 580,800 | Heartland Express Regional Trucker | 8,549,376 | |||||||||
| 160,000 | JB Hunt Transport Services Truck & Intermodal Carrier | 4,884,800 | |||||||||
| 180,000 | Rush Enterprises, Class A (a) Truck Sales & Service | 2,097,000 | |||||||||
| 15,531,176 | |||||||||||
| Total Other Industries | 44,695,368 | ||||||||||
| Total Common Stocks (Cost: $1,032,172,840) – 99.8% | 1,011,066,377 | ||||||||||
| Securities Lending Collateral – 0.9% | |||||||||||
| 9,450,950 | Dreyfus Government Cash Management Fund (7 day yield of 0.150%) (e) | 9,450,950 | |||||||||
| Total Securities Lending Collateral (Cost: $9,450,950) | 9,450,950 | ||||||||||
| Principal Amount | Value | ||||||||||
| Short-Term Obligation – 0.6% | |||||||||||
| Repurchase Agreement – 0.6% | |||||||||||
| $ | 6,112,000 | Repurchase Agreement with Fixed Income Clearing Corp., dated 6/30/09, due 7/01/09 at 0.0001%, collateralized by a U.S. Government Agency obligation maturing 4/23/14, market value $6,239,013 (repurchase proceeds $6,112,000) | $ | 6,112,000 | |||||||
| Total Short-Term Obligation (Cost: $6,112,000) | 6,112,000 | ||||||||||
| Total Investments (Cost: $1,047,735,790) – 101.3% (f) | 1,026,629,327 | ||||||||||
| Obligation to Return Collateral for Securities Loaned – (0.9)% | (9,450,950 | ) | |||||||||
| Cash and Other Assets Less Liabilities – (0.4)% | (3,567,933 | ) | |||||||||
| Total Net Assets 100.0% | $ | 1,013,610,444 | |||||||||
Notes to Statement of Investments:
(a) Non-income producing security.
(b) All or a portion of this security was on loan at June 30, 2009. The total market value of securities on loan at June 30, 2009 is $9,172,837.
(c) An affiliated person of the Fund may include any company in which the Fund owns five percent or more of its outstanding voting shares. Transactions in these affiliated companies during the six months ended June 30, 2009 are as follows:
Affiliates | Balance of Shares Held 12/31/2008 | Purchases/ Additions | Sales/ Reductions | Balance of Shares Held 6/30/09 | Value | Dividend | |||||||||||||||||||||
| RCM Technologies | 753,000 | — | — | 753,000 | $ | 1,671,660 | $ | — | |||||||||||||||||||
| Cavco Industries | 288,400 | 50,000 | — | 338,400 | 8,571,672 | — | |||||||||||||||||||||
| Total of affiliated transactions | 1,041,400 | 50,000 | — | 1,091,400 | $ | 10,243,332 | $ | — | |||||||||||||||||||
The aggregate cost and value of these companies at June 30, 2009, were $16,840,309 and $10,243,332, respectively. Investments in these affiliated companies represented 1.01% of total net assets at June 30, 2009.
See accompanying notes to financial statements.
14
Wanger USA 2009 Semiannual Report
Wanger USA
Statement of Investments (Unaudited), June 30, 2009
(d) Denotes a restricted security, which is subject to restrictions on resale under federal securities laws. These securities are valued at their fair value determined in good faith under consistently applied procedures established by the board of trustees. At June 30, 2009, these securities amounted to $14,674, which represents less than 0.01% of total net assets.
Additional information on these securities is as follows:
Security | Acquisition Dates | Shares | Cost | Value | |||||||||||||||
| Locus Pharmaceuticals, Series A-1, Pfd. | 9/05/01 | 25,000 | $ | 1,000,000 | $ | 2,000 | |||||||||||||
| Locus Pharmaceuticals, Series B-1, Pfd. | 2/08/07 | 12,886 | 37,369 | 1,031 | |||||||||||||||
| IsoRay – Warrants | 3/21/07 | 100,000 | — | 5,000 | |||||||||||||||
| Medicure – Warrants | 12/22/06 | 738,060 | — | 6,643 | |||||||||||||||
| $ | 1,037,369 | $ | 14,674 | ||||||||||||||||
(e) Investment made with cash collateral received from securities lending activity.
(f) At June 30, 2009, for federal income tax purposes cost of investments was $1,047,735,790 and net unrealized depreciation was $21,106,463 consisting of gross unrealized appreciation of $252,498,143 and gross unrealized depreciation of $273,604,606.
The following table summarizes the inputs used, as of June 30, 2009, in valuing the Fund's assets:
Security Type | Quoted Prices (Level 1) | Other Significant Observable Inputs (Level 2) | Significant Unobservable Inputs (Level 3) | Total | |||||||||||||||
| Common Stocks | |||||||||||||||||||
| Total Information | $ | 315,148,247 | $ | — | $ | — | $ | 315,148,247 | |||||||||||
| Total Finance | 161,935,857 | — | — | 161,935,857 | |||||||||||||||
| Total Consumer Goods & Services | 155,070,037 | — | — | 155,070,037 | |||||||||||||||
| Total Industrial Goods & Services | 146,039,256 | — | — | 146,039,256 | |||||||||||||||
| Total Health Care | 96,578,953 | 11,643 | 3,031 | 96,593,627 | |||||||||||||||
| Total Energy & Minerals | 91,583,985 | — | — | 91,583,985 | |||||||||||||||
| Total Other Industries | 44,695,368 | — | — | 44,695,368 | |||||||||||||||
| Total Common Stocks | 1,011,051,703 | 11,643 | 3,031 | 1,011,066,377 | |||||||||||||||
| Securities Lending Collateral | 9,450,950 | — | — | 9,450,950 | |||||||||||||||
| Short-Term Obligation | — | 6,112,000 | — | 6,112,000 | |||||||||||||||
| Total Investments | 1,020,502,653 | 6,123,643 | 3,031 | 1,026,629,327 | |||||||||||||||
| Total | $ | 1,020,502,653 | $ | 6,123,643 | $ | 3,031 | $ | 1,026,629,327 | |||||||||||
See accompanying notes to financial statements.
15
Wanger USA 2009 Semiannual Report
Wanger USA
Statement of Investments (Unaudited), June 30, 2009
The information in the below reconciliation represents fiscal year to date activity for any securities identified as using Level 3 inputs at either the beginning or the end of the current fiscal period.
Investments in Securities | Balance as of December 31, 2008 | Accrued Discounts/ Premiums | Realized Gain/(Loss) | Change in Unrealized Appreciation (Depreciation) | Net Purchases | Net Sales | Net transfers into Level 3 | Net transfers out of Level 3 | Balance as of June 30, 2009 | Change in Unrealized Appreciation (Depreciation) from Investments held at June 30, 2009 | |||||||||||||||||||||||||||||||||
| Common Stocks Health Care | |||||||||||||||||||||||||||||||||||||||||||
| Biotechnology & Drug Delivery | $ | 5,683 | $ | — | $ | — | $ | (2,652 | ) | $ | — | $ | — | $ | — | $ | — | $ | 3,031 | $ | (2,652 | ) | |||||||||||||||||||||
| Total | $ | 5,683 | $ | — | $ | — | $ | (2,652 | ) | $ | — | $ | — | $ | — | $ | — | $ | 3,031 | $ | (2,652 | ) | |||||||||||||||||||||
The change in unrealized depreciation attributable to securities owned at June 30, 2009 which were valued using significant unobservable inputs (Level 3) amounted to $2,652. This amount is included in net change in unrealized depreciation on the Statement of Changes in Net Assets.
For more information on valuation inputs, and their aggregation into the levels used in the tables above, please refer to the Security Valuation section in the accompanying Notes to Financial Statements.
At June 30, 2009, the Fund held investments in the following sectors:
| Sector | Percentage of Net Assets | ||||||
| Information | 31.1 | ||||||
| Finance | 16.0 | ||||||
| Consumer Goods & Services | 15.3 | ||||||
| Industrial Goods & Services | 14.4 | ||||||
| Health Care | 9.5 | ||||||
| Energy & Minerals | 9.1 | ||||||
| Other Industries | 4.4 | ||||||
| 99.8 | |||||||
| Securities Lending Collateral | 0.9 | ||||||
| Short-Term Obligation | 0.6 | ||||||
| Obligation to Return Collateral for Securities Loaned | (0.9 | ) | |||||
| Cash and Other Assets less Liabilities | (0.4 | ) | |||||
| 100.0 | |||||||
ADR = American Depositary Receipts.
See accompanying notes to financial statements.
16
Wanger USA 2009 Semiannual Report
Statement of Assets and Liabilities
June 30, 2009 (Unaudited)
| Assets: | |||||||
| Unaffiliated investments, at cost | $ | 1,030,895,481 | |||||
| Affiliated investments, at cost (See Note 4) | 16,840,309 | ||||||
| Unaffiliated investments, at value (including securities on loan of $9,172,837) | $ | 1,016,385,995 | |||||
| Affiliated investments, at value (See Note 4) | 10,243,332 | ||||||
| Receivable for: | |||||||
| Investments sold | 3,220,252 | ||||||
| Fund shares sold | 2,187 | ||||||
| Securities lending income | 17,896 | ||||||
| Dividends | 404,188 | ||||||
| Trustees' deferred compensation plan | 75,335 | ||||||
| Other assets | 2,447 | ||||||
| Total Assets | 1,030,351,632 | ||||||
| Liabilities: | |||||||
| Payable to custodian bank | 24,201 | ||||||
| Collateral on securities loaned | 9,450,950 | ||||||
| Payable for: | |||||||
| Investments purchased | 4,400,776 | ||||||
| Fund shares repurchased | 1,620,995 | ||||||
| Investment advisory fee | 721,885 | ||||||
| Administration fee | 41,768 | ||||||
| Transfer agent fee | 49 | ||||||
| Trustees' fees | 1,044 | ||||||
| Custody fee | 9,247 | ||||||
| Reports to shareholders | 377,608 | ||||||
| Trustees' deferred compensation plan | 75,335 | ||||||
| Other liabilities | 17,330 | ||||||
| Total Liabilities | 16,741,188 | ||||||
| Net Assets | $ | 1,013,610,444 | |||||
| Composition of Net Assets: | |||||||
| Paid-in capital | $ | 1,121,586,569 | |||||
| Accumulated net investment loss | (507,988 | ) | |||||
| Accumulated net realized loss | (86,361,674 | ) | |||||
| Net unrealized depreciation on investments | (21,106,463 | ) | |||||
| Net Assets | $ | 1,013,610,444 | |||||
| Fund Shares Outstanding | 48,054,823 | ||||||
| Net asset value, offering price and redemption price per share | $ | 21.09 | |||||
Statement of Operations
For the Six Months Ended June 30, 2009 (Unaudited)
| Investment Income: | |||||||
| Dividends | $ | 4,072,113 | |||||
| Interest | 12,662 | ||||||
| Securities lending income | 17,896 | ||||||
| Total Investment Income | 4,102,671 | ||||||
| Expenses: | |||||||
| Investment advisory fee | 3,930,258 | ||||||
| Administration fee | 228,433 | ||||||
| Transfer agent fee | 338 | ||||||
| Trustees' fees | 43,300 | ||||||
| Custody fee | 22,265 | ||||||
| Reports to shareholders | 246,675 | ||||||
| Chief compliance officer expenses (See Note 4) | 25,774 | ||||||
| Other expenses (See Note 5) | 60,805 | ||||||
| Total Expenses | 4,557,848 | ||||||
| Custody earnings credit | (2 | ) | |||||
| Net Expenses | 4,557,846 | ||||||
| Net Investment Loss | (455,175 | ) | |||||
| Net Realized and Unrealized Gain (Loss) on Investments: | |||||||
| Net realized loss on investments | (18,571,429 | ) | |||||
| Net realized loss | (18,571,429 | ) | |||||
| Net change in unrealized appreciation (depreciation) on: | |||||||
| Unaffiliated investments | 104,629,356 | ||||||
| Affiliated investments (See Note 4) | (1,935,255 | ) | |||||
| Net change in unrealized appreciation (depreciation) on investments | 102,694,101 | ||||||
| Net Gain | 84,122,672 | ||||||
| Net Increase in Net Assets from Operations | $ | 83,667,497 | |||||
See accompanying notes to financial statements.
17
Wanger USA 2009 Semiannual Report
Statement of Changes in Net Assets
| Increase (Decrease) in Net Assets | (Unaudited) Six Months Ended June 30, 2009 | Year Ended December 31, 2008 | |||||||||
| Operations: | |||||||||||
| Net investment loss | $ | (455,175 | ) | $ | (3,581,826 | ) | |||||
| Net realized loss on investments | (18,571,429 | ) | (67,478,097 | ) | |||||||
| Net change in unrealized appreciation (depreciation) on investments | 102,694,101 | (552,600,614 | ) | ||||||||
| Net Increase (Decrease) in Net Assets from Operations | 83,667,497 | (623,660,537 | ) | ||||||||
| Distributions to Shareholders: | |||||||||||
| From net realized gains | — | (170,275,092 | ) | ||||||||
| Share Transactions: | |||||||||||
| Subscriptions | 24,530,668 | 90,782,720 | |||||||||
| Distributions reinvested | — | 170,275,092 | |||||||||
| Redemptions | (46,836,786 | ) | (202,913,271 | ) | |||||||
| Net Increase (Decrease) from Share Transactions | (22,306,118 | ) | 58,144,541 | ||||||||
| Total Increase (Decrease) in Net Assets | 61,361,379 | (735,791,088 | ) | ||||||||
| Net Assets: | |||||||||||
| Beginning of period | 952,249,065 | 1,688,040,153 | |||||||||
| End of period | $ | 1,013,610,444 | $ | 952,249,065 | |||||||
| Accumulated net investment loss at end of period | $ | (507,988 | ) | $ | (52,813 | ) | |||||
See accompanying notes to financial statements.
18
Wanger USA 2009 Semiannual Report
Financial Highlights
| (Unaudited) Six Months Ended June 30, | Year Ended December 31, | ||||||||||||||||||||||||||
| Selected data for a share outstanding throughout each period | 2009 | 2008 | 2007 | 2006 | 2005 | 2004 | |||||||||||||||||||||
| Net Asset Value, Beginning of Period | $ | 19.30 | $ | 36.26 | $ | 36.36 | $ | 34.90 | $ | 31.37 | $ | 26.51 | |||||||||||||||
| Income from Investment Operations: | |||||||||||||||||||||||||||
| Net investment income (loss) (a) | (0.01 | ) | (0.07 | ) | (0.05 | )(b) | (0.02 | ) | 0.09 | (0.14 | ) | ||||||||||||||||
| Net realized and unrealized gain (loss) on investments | 1.80 | (13.16 | ) | 1.91 | 2.71 | 3.44 | 5.00 | ||||||||||||||||||||
| Total from Investment Operations | 1.79 | (13.23 | ) | 1.86 | 2.69 | 3.53 | 4.86 | ||||||||||||||||||||
| Less Distributions to Shareholders: | |||||||||||||||||||||||||||
| From net investment income | — | — | — | (0.08 | ) | — | — | ||||||||||||||||||||
| From net realized gains | — | (3.73 | ) | (1.96 | ) | (1.15 | ) | — | — | ||||||||||||||||||
| Total Distributions to Shareholders | — | (3.73 | ) | (1.96 | ) | (1.23 | ) | — | — | ||||||||||||||||||
| Net Asset Value, End of Period | $ | 21.09 | $ | 19.30 | $ | 36.26 | $ | 36.36 | $ | 34.90 | $ | 31.37 | |||||||||||||||
| Total Return (c) | 9.27 | %(d) | (39.68 | )% | 5.39 | % | 7.87 | % | 11.25 | %(e) | 18.33 | % | |||||||||||||||
| Ratios to Average Net Assets/Supplemental Data: | |||||||||||||||||||||||||||
| Net expenses before interest expense (f) | 1.00 | %(g) | 0.96 | % | 0.95 | % | 0.95 | % | 0.95 | % | 1.00 | % | |||||||||||||||
| Interest expense | — | — | — | 0.00 | %(h) | — | — | ||||||||||||||||||||
| Net expenses (f) | 1.00 | %(g) | 0.96 | % | 0.95 | % | 0.95 | % | 0.95 | % | 1.00 | % | |||||||||||||||
| Net investment income (loss) (f) | (0.10 | )%(g) | (0.26 | )% | (0.15 | )% | (0.07 | )% | 0.29 | % | (0.49 | )% | |||||||||||||||
| Waiver/Reimbursement | — | — | — | — | 0.00 | %(h) | — | ||||||||||||||||||||
| Portfolio turnover rate | 19 | %(d) | 22 | % | 27 | % | 19 | % | 11 | % | 15 | % | |||||||||||||||
| Net assets, end of period (000s) | $ | 1,013,610 | $ | 952,249 | $ | 1,688,040 | $ | 1,608,340 | $ | 1,493,695 | $ | 1,153,553 | |||||||||||||||
(a) Net investment income (loss) per share was based upon the average shares outstanding during the period.
(b) Net investment income per share reflects special dividends. The effect of these dividends amounted to $0.08 per share.
(c) Total return at net asset value assuming all distributions are reinvested.
(d) Not annualized.
(e) Had the investment advisor not waived a portion of expenses, total return would have been reduced.
(f) The benefits derived from custody fees paid indirectly had an impact of less than 0.01%.
(g) Annualized.
(h) Rounds to less than 0.01%.
See accompanying notes to financial statements.
19
Wanger USA 2009 Semiannual Report
Notes to Financial Statements (Unaudited)
1. Nature of Operations
Wanger USA (the "Fund") is a series of Wanger Advisors Trust (the "Trust"), an open-end management investment company organized as a Massachusetts business trust. The investment objective of the Fund is to seek long-term capital appreciation. The Fund is available only for allocation to certain life insurance company separate accounts established for the purpose of funding qualified and non-qualified variable annuity contracts and variable life insurance policies and may also be offered directly to certain types of pension plans and retirement arrangements.
2. Significant Accounting Policies
The preparation of financial statements in accordance with accounting principles generally accepted in the United States of America ("GAAP") requires management to make certain estimates and assumptions that affect the reported amounts of assets and liabilities, the disclosure of contingent assets and liabilities at the date of the financial statements and the reported amounts of revenue and expenses during the reporting period. Actual results could differ from those estimates. Management has evaluated the events and transactions that have occurred through August 20, 2009, the date the financial statements were issued, and noted no items requiring adjustment of the financial statements or additional disclosures. The following is a summary of significant accounting policies consistently followed by the Fund in the preparation of its financial statements.
Security valuation
Securities of the Fund are valued at market value or, if a market quotation for a security is not readily available or is deemed not to be reliable because of events or circumstances that have occurred between the market quotation and the time as of which the security is to be valued, the security is valued at its fair value determined in good faith under consistently applied procedures established by the Board of Trustees. A security traded on a securities exchange or in an over-the-counter market in which transaction prices are reported is valued at the last sales price at the time of valuation. A security traded principally on NASDAQ is valued at the NASDAQ official closing price. A security for which there is no reported sale on the valuation date is valued at the latest bid quotation. Short-term investments maturing in 60 days or less are valued at amortized cost, which approximates market value. A security for which a mark et quotation is not readily available and any other assets are valued at its fair value determined in good faith under consistently applied procedures established by the Board of Trustees. The Trust has retained an independent statistical fair value pricing service that employs a systematic methodology to assist in the fair valuation process for securities principally traded in a foreign market in order to adjust for possible changes in value that may occur between the close of the foreign market and the time as of which the securities are to be valued. If a security is valued at a "fair value", that value may be different from the last quoted market price for the security.
The Fund adopted Statement of Financial Accounting Standards No. 157, Fair Value Measurements ("SFAS 157"). Under SFAS 157, various inputs are used in determining the value of the Fund's investments. These inputs are summarized in the three broad levels listed below:
• Level 1—quoted prices in active markets for identical securities
• Level 2—other significant observable inputs (including quoted prices for similar securities, interest rates, prepayment speeds, credit risk and others)
• Level 3—significant unobservable inputs (including management's own assumptions in determining the value of investments)
The inputs or methodologies used for valuing securities are not necessarily an indication of the risk associated with investing in those securities.
Examples of the types of securities in which the Fund would typically invest and how they are classified within this SFAS 157 hierarchy are as follows. Typical level 1 securities include exchange traded domestic equities, mutual funds whose NAVs are published each day and exchange traded foreign equities that are not statistically fair valued. Typical level 2 securities include exchange traded foreign equities that are statistically fair valued and short-term investments valued at amortized cost. Typical level 3 securities include any security fair valued by the Fund's Valuation Committee that relies on significant unobservable inputs.
In April 2009, the Financial Accounting Standards Board ("FASB") issued FASB Staff Position 157-4, Determining Fair Value When the Value and Level of Activity for the Asset or Liability Have Significantly Decreased and Identifying Transactions That Are Not Orderly ("FSP FAS 157-4"), which amends SFAS 157 and is effective for interim and annual periods ending after June 15, 2009. FSP FAS 157-4 provides additional guidance for estimating fair value in accordance with SFAS 157 when the volume and level of activity for the asset or liability measured at fair value has significantly decreased. Additionally, FSP FAS 157-4 expands disclosure requirements for reporting entities with respect to categories of assets and liabilities carried at fair value. Management does not expect the adopt ion of FSP FAS 157-4 to have a material impact on the Fund's financial statement disclosure.
Repurchase agreements
The Fund may engage in repurchase agreement transactions. The Fund, through its custodian, receives delivery of underlying securities collateralizing each repurchase agreement. The counterparty is required to maintain collateral that is at all times at least equal to the repurchase price including interest. In the event of default or bankruptcy by the other party to the agreement, realization and/or retention of the collateral may be subject to legal proceedings.
Foreign currency translations
Values of investments denominated in foreign currencies are converted into U.S. dollars using the New York spot market rate of exchange at the time of valuation. Purchases and sales of investments and dividend and interest income are translated into U.S. dollars using the spot market rate of exchange prevailing on the respective dates of such transactions. The gain or loss resulting from changes in foreign exchange rates is included with net realized and unrealized gain or loss from investments, as appropriate.
Securities lending
The Fund may lend securities up to one-third of the value of its total assets to certain approved brokers, dealers and other financial institutions to earn additional income. The Fund retains the benefits of owning the securities, including receipt of dividends or interest generated by the security. The Fund also receives a fee for the loan. The Fund has the ability to recall the loans at any time and could do so in order to vote proxies or to sell the loaned securities. Each loan is collateralized by cash that exceeds the value of the securities on loan. The market value of the loaned securities is determined daily at the close of business of the Fund and any additional required collateral is delivered to each Fund on the next business day. The Fund has elected to invest the cash collateral in the Dreyfus Government Cash Management Fund and the income earned is paid to the Fund, net of any fees remitted to Goldman Sachs Agency Lending as the lending agent and borrower rebates. The Fund's advisor, Columbia Wanger Asset Management, L.P. ("CWAM"), does not retain any fees earned by the lending program nor does it charge the Fund for administering the program. Generally, in the event of borrower default, the Fund has the right to use the collateral to offset any losses incurred. In the event the Fund is delayed or prevented from exercising its right to dispose of the collateral, there may be a potential loss to the Fund. Some of these losses may be indemnified by the lending agent. The Fund bears the risk of loss with respect to the investment of collateral.
20
Wanger USA 2009 Semiannual Report
Notes to Financial Statements, continued (Unaudited)
After suspending securities lending in the third quarter of 2008, the Fund resumed lending securities in the second quarter of 2009. The net lending income earned in 2009 by the Fund is included in the Statement of Operations.
Security transactions and investment income
Security transactions are accounted for on the trade date (date the order to buy or sell is executed) and dividend income is recorded on the ex-dividend date, except that certain dividends from foreign securities are recorded as soon as the information is available to the Fund. Interest income is recorded on the accrual basis and includes amortization of discounts on debt obligations when required for federal income tax purposes. Realized gains and losses from security transactions are recorded on an identified cost basis.
Awards, if any, from class action litigation related to securities owned may be recorded as a reduction of cost of those securities. If the applicable securities are no longer owned, the proceeds are recorded as realized gains.
Restricted securities
Restricted securities are securities that may only be resold upon registration under federal securities laws or in transactions exempt from registration. In some cases, the issuer of restricted securities has agreed to register such securities for resale at the issuer's expense either upon demand by the Fund or in connection with another registered offering of the securities. Many restricted securities may be resold in the secondary market in transactions exempt from registration. Such restricted securities may be determined to be liquid under criteria established by the Board of Trustees.
Use of estimates
The preparation of financial statements in conformity with GAAP requires management to make estimates and assumptions that affect the amounts reported in the financial statements and accompanying notes. Actual results may differ from those estimates.
Fund share valuation
Fund shares are sold and redeemed on a continuing basis at net asset value. Net asset value per share is determined daily as of the close of trading on the New York Stock Exchange ("the Exchange") on each day the Exchange is open for trading by dividing the total value of the Fund's investments and other assets, less liabilities, by the number of Fund shares outstanding.
Custody fees/Credits
Custody fees are reduced based on the Fund's cash balances maintained with the custodian. The amount is disclosed as a reduction of total expenses in the Statement of Operations.
Federal income taxes
The Fund has complied with the provisions of the Internal Revenue Code available to regulated investment companies and, in the manner provided therein, distributes all its taxable income, as well as any net realized gain on sales of investments and foreign currency transactions reportable for federal income tax purposes. Accordingly, the Fund paid no federal income taxes and no federal income tax provision was required.
Expenses
General expenses of the Trust are allocated to the Fund and the other series of the Trust based upon relative net assets or other expense allocation methodologies determined by the nature of the expense. Expenses directly attributable to the Fund are charged to the Fund.
Foreign capital gains taxes
Gains in certain countries may be subject to foreign taxes at the fund level, at rates ranging from 10%-15%. The Fund accrues for such foreign taxes on net realized and unrealized gains at the appropriate rate for each jurisdiction.
Distributions to shareholders
Distributions to shareholders are recorded on the ex-dividend date.
Indemnification
In the normal course of business, the Trust on behalf of the Fund enters into contracts that contain a variety of representations and warranties and that provide general indemnities. The Fund's maximum exposure under these arrangements is unknown, as this would involve future claims against the Fund. Also under the Trust's organizational documents, the trustees and officers of the Trust are indemnified against certain liabilities that may arise out of their duties to the Trust. However based on experience, the Fund expects the risk of loss due to these warranties and indemnities to be minimal.
3. Federal Tax Information
The tax character of distributions paid during the year ended December 31, 2008 was as follows:
| Distributions paid from: | |||||||
| Ordinary Income* | $ | — | |||||
| Long-Term Capital Gains | 170,275,092 | ||||||
* For tax purposes short-term capital gain distributions, if any, are considered ordinary income distributions.
The following capital loss carryforwards, determined as of December 31, 2008, may be available to reduce taxable income arising from future net realized gains on investments, if any, to the extent permitted by the Internal Revenue Code:
| Year of Expiration | Capital Loss Carryforward | ||||||
| 2016 | $ | 48,548,576 | |||||
FASB Interpretation No. 48, Accounting for Uncertainty in Income Taxes- an Interpretation of FASB Statement No. 109 ("FIN 48") management determines whether a tax position of the Fund is more likely than not to be sustained upon examination by the applicable taxing authority, including resolution of any related appeals or litigation processes, based on the technical merits of the position. The tax benefit to be recognized is measured as the largest amount of benefit that is greater than fifty percent likely of being realized upon ultimate settlement. Management has evaluated the known implications of FIN 48 on its computation of net assets for the Fund. As a result of this evaluation, management believes that FIN 48 does not have any effect on the Fund's financial statements. Howe ver, management's conclusions regarding FIN 48 may be subject to review and adjustment at a later date based on factors including, but not limited to, further implementation guidance from the FASB, new tax laws, regulations, and administrative interpretations (including relevant court decisions). The Fund's federal tax returns for the prior three fiscal years remain subject to examination by the Internal Revenue Service. The Fund is not aware of any tax positions for which it is reasonably possible that the total amounts of unrecognized tax benefits will significantly change in the next twelve months.
4. Transactions With Affiliates
CWAM is a wholly owned subsidiary of Columbia Management Group, LLC, ("Columbia Management") which in turn is an indirect wholly owned subsidiary of Bank of America Corporation ("BOA"). CWAM furnishes
21
Wanger USA 2009 Semiannual Report
Notes to Financial Statements, continued (Unaudited)
continuing investment supervision to the Fund and is responsible for the overall management of the Fund's business affairs.
Under the Fund's investment advisory agreement, management fees are accrued daily based on the Fund's average daily net assets and paid monthly to CWAM at the annual rates shown in the table below:
| Average Daily Net Assets | Annual Fee Rate | ||||||
| Up to $100 million | 0.94 | % | |||||
| $100 million to $250 million | 0.89 | % | |||||
| $250 million to $2 billion | 0.84 | % | |||||
| $2 billion and over | 0.80 | % | |||||
For the six months ended June 30, 2009, the Fund's annualized effective investment advisory fee rate was 0.86% of average daily net assets.
CWAM provides administrative services and receives an administration fee from the Fund at the following annual rates:
| Wanger Advisors Trust Aggregate Average Daily Net Assets of the Trust | Annual Fee Rate | ||||||
| Up to $4 billion | 0.05 | % | |||||
| $4 billion to $6 billion | 0.04 | % | |||||
| $6 billion to $8 billion | 0.03 | % | |||||
| $8 billion and over | 0.02 | % | |||||
For the six months ended June 30, 2009, the Fund's annualized effective administration fee rate was 0.05% of average daily net assets. CWAM has delegated to Columbia Management Advisors, LLC ("Columbia"), an indirect, wholly owned subsidiary of BOA, the responsibility for certain administrative services.
Certain officers and trustees of the Trust are also officers of CWAM. The Trust makes no direct payments to its officers and trustees who are affiliated with CWAM.
The Board of Trustees has appointed a Chief Compliance Officer to the Trust in accordance with federal securities regulations. The Fund, along with other affiliated funds, pays its pro-rata share of the expenses associated with the Office of the Chief Compliance Officer. These expenses are disclosed separately as "Chief compliance officer expenses" in the Statement of Operations.
The Trust offers a deferred compensation plan for its independent trustees. Under that plan, a trustee may elect to defer all or a portion of his or her compensation. Amounts deferred are retained by the Trust and represent an unfunded obligation of the Trust. The value of amounts deferred is determined by reference to the change in value of Class Z shares of one or more series of Columbia Acorn Trust or a money market fund as specified by the trustee. Benefits under the deferred compensation plan are payable when the trustee ceases to be a member of the Board of Trustees.
Columbia Management Distributors, Inc. (the "Distributor"), an affiliate of Columbia and an indirect, wholly owned subsidiary of BOA, serves as the principal underwriter of the Trust and receives no compensation from the Fund for its services.
Columbia Management Services, Inc. (the "Transfer Agent"), an affiliate of Columbia and an indirect, wholly owned subsidiary of BOA, provides shareholder services to the Fund and has subcontracted with Boston Financial Data Services ("BFDS") to serve as subtransfer agent. For such services, the Transfer Agent receives a fee, paid monthly, at the annual rate of $21.00 per open account. The Transfer Agent also receives reimbursement for certain out-of-pocket expenses.
An affiliated person of the Fund may include any company in which the Fund owns five percent or more of its outstanding voting shares. On June 30, 2009, the Fund held five percent or more of the outstanding voting securities of one or more companies. Details of investments in those affiliated companies are presented in the Notes to the Statement of Investments on page 13.
During the six months ended June 30, 2009, the Fund did not engage in purchase and sales transactions with funds that have a common investment advisor (or affiliated investment advisors), common directors/trustees, and/or common officers.
5. Borrowing Arrangements
The Trust participates in a $150 million credit facility, which was entered into to facilitate portfolio liquidity. Under the facility, interest is charged to each participating fund based on its borrowings at a rate per annum equal to the higher of Federal Funds Rate or Overnight LIBOR plus 0.750%. In addition, a commitment fee of 0.12% per annum of the unutilized line of credit is accrued and apportioned among the participating funds based on their relative net assets. The commitment fee is included in "Other expenses" in the Statement of Operations. No amounts were borrowed by the Fund under this facility during the six months ended June 30, 2009. The Trust enters into this line of credit for one year durations. The Trust has secured the line of credit for the entire year of 2009.
6. Fund Share Transactions
Proceeds and payments on Fund shares as shown in the Statement of Changes in Net Assets are in respect of the following numbers of shares:
| Six Months Ended June 30, 2009 | Year Ended December 31, 2008 | ||||||||||
| Shares sold | 1,316,891 | 3,920,844 | |||||||||
| Shares issued in reinvestment of dividend distributions | — | 6,081,253 | |||||||||
| Less shares redeemed | (2,598,658 | ) | (7,219,133 | ) | |||||||
| Net increase (decrease) in shares outstanding | (1,281,767 | ) | 2,782,964 | ||||||||
7. Investment Transactions
The aggregate cost of purchases and proceeds from sales other than short-term obligations for the six months ended June 30, 2009 were $175,924,295 and $170,724,943, respectively.
8. Legal Proceedings
CWAM, Columbia Acorn Trust, (another mutual fund family advised by CWAM), and the trustees of Columbia Acorn Trust (collectively, the "Columbia defendants") are named as defendants in class and derivative complaints that have been consolidated in a Multi-District Action (the "MDL Action") in the federal district court of Maryland. These lawsuits contend that defendants permitted certain investors to market time their trades in certain Columbia Acorn Funds. The MDL Action is ongoing. However, all claims against the Trust and the independent trustees of Columbia Acorn Trust have been dismissed.
Columbia Acorn Trust and CWAM are also defendants in a class action lawsuit that alleges, in summary, that Columbia Acorn Trust and CWAM exposed shareholders of Columbia Acorn International Fund to trading by market timers by allegedly: (a) failing to properly evaluate daily whether a significant event affecting the value of that fund's securities had occurred after foreign markets had closed but before the calculation of the funds' net asset value ("NAV"); (b) failing to implement the fund's portfolio valuation and share pricing policies and procedures; and (c) failing to know and implement applicable rules and regulations concerning the calculation of NAV (the "Fair Valuation Lawsuit"). The Seventh Circuit ruled that the plaintiffs' state law claims were preempted under federal law resulting in the dismissal of plaintiffs' complaint. Plaintiffs appealed the Seventh Circuit's ruling to the United States Supreme Court. The Supre me Court reversed the Seventh Circuit's ruling on jurisdictional grounds and the case was ultimately remanded to the state court.
On March 21, 2005, a class action complaint was filed against the Trust and CWAM seeking to rescind the CDSC assessed upon redemption of Class B shares of the Columbia Acorn Funds due to the alleged market timing of the
22
Wanger USA 2009 Semiannual Report
Notes to Financial Statements, continued (Unaudited)
Columbia Acorn Funds (the "CDSC Lawsuit"). In addition to the rescission of sales charges, plaintiffs seek recovery of actual damages, attorneys' fees and costs. The case has been transferred to the MDL Action in the federal district court of Maryland.
On September 14, 2007, the plaintiffs and the Columbia defendants named in the MDL Action, including the Columbia Funds, entered into a stipulation of settlement with respect to all Columbia-related claims in the MDL Action described above, including the CDSC and Fair Valuation Lawsuits. The settlement is subject to court approval.
Columbia Acorn Funds and CWAM intend to defend these suits vigorously. CWAM believes that the lawsuits are not likely to materially affect its ability to provide investment management services to the Fund.
23
Wanger USA 2009 Semiannual Report
[Excerpt from:]
Wanger Advisors Trust
Management Fee Evaluation of the Senior Officer
Prepared Pursuant to the New York Attorney General's
Assurance of Discontinuance
May 2009
24
Wanger USA 2009 Semiannual Report
Introduction
The New York Attorney General's Assurance of Discontinuance ("Order") entered into by Columbia Management Advisors, Inc. ("CMAI") and Columbia Management Distributors, Inc., ("CMDI" and collectively with "CMAI," "CMG") in February 2005, allows CMAI to manage or advise a mutual fund only if the trustees of the fund appoint a "Senior Officer" to perform specified duties and responsibilities. One of these responsibilities includes "managing the process by which proposed management fees (including but not limited to, advisory fees) to be charged the [Funds] are negotiated in a manner which is at arms' length and reasonable and consistent with this Assurance of Discontinuance."
This is the third year that the Columbia Acorn Trust and Wanger Advisors Trust (collectively, the "Trusts") and each series thereof (the "Acorn funds," "WAT funds" or collectively, the "Funds") have been overseen by the same Board of Trustees ("Board"). The Order provides that this Board must determine the reasonableness of proposed "management fees" by using either an annual competitive bidding process supervised by the Senior Officer or Independent Fee Consultant, or by obtaining "an annual independent written evaluation prepared by or under the direction of the Senior Officer or the Independent Fee Consultant."
"Management fees" are only part of the costs and expenses paid by mutual fund shareholders. Fund expenses can vary depending upon the class of shares held but usually include: (1) investment management or advisory fees to compensate analysts and portfolio managers for stock research and portfolio management, as well as the cost of operating a trading desk; (2) administrative expenses incurred to prepare registration statements and tax returns, calculate the Funds' net asset values, maintain effective compliance procedures and perform recordkeeping services; (3) transfer agency costs for establishing accounts, accepting and disbursing funds, as well as overseeing trading in Fund shares; (4) custodial expenses incurred to hold the securities purchased by the Funds; and (5) distribution expenses, including commissions paid to brokers that sell the Fund shares to investors.
Columbia Wanger Asset Management, L.P. ("CWAM"), the adviser to the Funds, has proposed that the Trusts continue the existing separate agreements governing the first two categories listed above: an advisory agreement governing portfolio management, and an administration agreement governing certain administration and clerical services. Together the fees paid under these two agreements are referred to as "management fees." Other fund expenses are governed by separate agreements, in particular agreements with two CWAM affiliates: CMDI, the broker-dealer that underwrites and distributes the Funds' shares, and Columbia Management Services, Inc. ("CMSI"), the Funds' transfer agent. In conformity with the terms of the Order, this evaluation, therefore, addresses only the advisory and administrative contracts, and does not extend to the other agreements.
According to the Order, the Senior Officer's evaluation must consider at least the following:
(1) Management fees (including components thereof) charged to institutional and other clients of CWAM for like services;
(2) Management fees (including any components thereof) charged by other mutual fund companies for like services;
(3) Costs to CWAM and its affiliates of supplying services pursuant to the management fee agreements, excluding any intra-corporate profit;
(4) Profit margins of CWAM and its affiliates from supplying such services;
(5) Possible economies of scale as the Funds grow larger; and
(6) The nature and quality of CWAM's services, including the performance of each Fund.
In 2004, the Boards of the two Trusts, then separate groups, each appointed me Senior Officer under the Order. They also determined not to pursue a competitive bidding process and instead, charged me with the responsibility of evaluating the Funds' proposed advisory and administrative fee contracts with CWAM in conformity with the requirements of the Order. This Report is an annual evaluation required under the Order. In discharging their responsibilities, the independent Trustees have also consulted independent, outside counsel.
2008 Evaluation
This is the fourth annual evaluation prepared in connection with the Order. This evaluation follows the same structure as the earlier studies. Some areas are given more emphasis here, while others are given less. Still, the fundamental information gathered for this evaluation is largely the same as past years. Last year's evaluation is referred to here as the "2008 Study."
Process and Independence
The objectives of the Order are to ensure the independent evaluation of the management fees paid by the Funds as well as to insure that all relevant factors are considered. In my view, this contract renewal process has been conducted at arms-length and with independence in gathering, considering and evaluating all relevant data. At the outset of the process, the Trustees sought and obtained from CWAM and CMG a comprehensive compilation of data regarding Fund performance and expenses, adviser profitability, and other information. The Contract Committee evaluated this information thoroughly. Performance and expense data was obtained from both Morningstar and Lipper, the leading consultants in this area. The rankings prepared by Morningstar and Lipper were independent and not influenced by the adviser.
In the course of its work, the Contract Committee gave careful consideration to the conclusions and recommendations contained in the 2008 Study. The Committee recommended, and the Board accepted and implemented several of the recommendations in this area contained in the 2008 Study.
25
Wanger USA 2009 Semiannual Report
My evaluation of the advisory contracts was shaped, as it was last year, by my experience as Chief Compliance Officer of the Trusts ("CCO"). As CCO, I report solely to the Board and have no reporting obligation to, or employment relationship with, CMG or its affiliates, except for administrative purposes. I have commented on compliance matters in evaluating the quality of service provided by CWAM.
This Report, its supporting materials and the data contained in other materials submitted to the Contract Committee of the Board, in my view, provide a thorough factual basis upon which the Board, in consultation with independent counsel as it deems appropriate, may conduct management fee negotiations that are in the best interests of the Funds' shareholders.
The Fee Reductions Mandated under the Order
Under the terms of the Order, CMG agreed to secure certain management fee reductions for the mutual funds advised by its affiliate investment advisers. In some instances, breakpoints were also established. Although neither CWAM nor the Trusts was a party to the Order, CWAM offered and the Board accepted certain advisory fee reductions during 2005. By the terms of the Order, these fees may not be increased before November 30, 2009. I have used these advisory fee levels, as modified thereafter, in this evaluation because they are the fees in the current agreements that CWAM proposes should be continued. Hence, these fee levels are the starting point of an evaluation.
Conclusions
My review of the data and other material above leads to the following conclusions with respect to the factors identified in the Order.
1. Performance. Wanger Select and Wanger USA have suffered significant declines in ranking relative to their peers for the past five years. In contrast, the international Funds have improved their relative performance and enjoy solid rankings.
2. Management Fees relative to Peers. Management fees vary by WAT fund but, in general, the WAT funds impose higher fees than competing funds. Wanger Select and Wanger USA in particular were ranked by both Lipper and Morningstar at or below the median, and therefore impose higher fees than do the majority of their competitors.
3. Administrative Fees. The WAT funds' administrative fees are generally less competitive than are the fees charged by competitors, but these rankings suffer from a lack of uniformity in the scope of services encompassed by the fee. CWAM provides excellent administrative support for all the WAT funds. There are clear advantages to retaining the adviser and its affiliates to perform these services.
4. Management Fees relative to Institutional and Other Mutual Fund Accounts. CWAM's focus is on its mutual funds. It does not actively seek to manage separate or institutional accounts. The few institutional accounts it does manage vary in rate structures. Some pay advisory fees commensurate with or higher than the WAT funds. In addition, CWAM is now considering a new institutional account for a WAT shareholder that may enjoy a management fee significantly lower than the parallel mutual fund, and could adversely impact existing WAT shareholders.
5. Costs to CWAM and its Affiliates. CWAM's direct costs do not appear excessive. Overhead and indirect costs allocated to CWAM by its parent organizations, however, are significant and have varied considerably over the years. CWAM's affiliates report operating losses and therefore do not appear to enjoy excessive "fall out" benefits from CWAM's advisory agreement with the Funds.
6. Profit Margins. CWAM's pre-marketing expense profit margins are at the top of the industry, even in a difficult year such as 2008, though these comparisons are hampered by limited industry data. High profit margins are not unexpected for firms that manage large, successful funds and have provided outstanding investment performance for investors.
7. Economies of Scale. Economies of scale do exist at CWAM and will continue if asset levels return to those of past years. The Board has recently imposed additional breakpoints for some of the WAT funds that will result in greater sharing of economies of scale.
8. Nature and Quality of Services. This category includes a variety of considerations that are difficult to quantify, yet can have a significant bearing on the performance of the Funds. Several areas merit comment.
a. Capacity. CWAM has maintained its investment management capacity even in a difficult environment.
b. Compliance. CWAM has a reasonably designed compliance program that protects shareholders.
9. Process. In my opinion, the process of negotiating an advisory contract for the Funds has been conducted thoroughly and at arms' length. Further, the Trustees have sufficient information to evaluate management's proposal, and negotiate contract terms that are in the best interests of Fund shareholders.
Recommendations
I believe the Trustees should:
26
Wanger USA 2009 Semiannual Report
1. Monitor closely the performance of Wanger Select and Wanger USA to ensure that appropriate steps are being taken by CWAM to improve their relative performance.
2. Consider imposing limitations on the use of soft dollars. While CWAM's use of soft dollars is consistent with the applicable regulatory requirements, the Board should have a clear understanding with CWAM regarding the cost to shareholders of the research purchased with Fund commission dollars.
3. Focus their review on the WAT funds' management fee levels in relation to their peers, in particular the fees paid by Wanger USA and Wanger Select. These Funds pay fees that are, in the views of both Morningstar and Lipper, significantly higher than their peers.
4. Seek assurances that CWAM and its affiliates will continue to provide adequate support to the WAT funds despite the recent downturn in market values and the difficulties faced by CWAM's ultimate parent organization, Bank of America. Similar assurances should be sought from any prospective purchaser of CWAM or its parent organization.
Robert P. Scales
May 26, 2009
27
Wanger USA 2009 Semiannual Report
Wanger Advisors Trust Board Approval of the Advisory Agreement 2009
Wanger Advisors Trust (the "Trust") has an investment advisory agreement (the "Advisory Agreement") with Columbia Wanger Asset Management, L.P. ("CWAM") under which CWAM manages the Columbia Wanger Family of Funds (the "Funds"). The trustees of the Trust, more than seventy five percent of whom have never been affiliated with CWAM (the "Independent Trustees"), oversee the management of each Fund and, as required by law, determine at least annually whether to continue the Advisory Agreement for each Fund.
The Contract Committee of the board of trustees (the "Committee"), which is comprised of six Independent Trustees, makes recommendations to the board regarding any proposed continuation of the Advisory Agreement. After the Committee has made its recommendations, the full board of trustees determines whether to approve continuation of the Advisory Agreement. The board also considers matters bearing on the Advisory Agreement at its various meetings throughout the year, and meets at least quarterly with CWAM's portfolio managers.
In connection with their most recent consideration of the Advisory Agreement for each Fund, the Committee and all trustees received and reviewed a substantial amount of information provided by CWAM in response to requests from the Independent Trustees and their independent legal counsel. In addition, the Contract Committee met with the Investment Performance Committee, also comprised exclusively of Independent Trustees, to review performance related issues. As they considered the Advisory Agreement, the Independent Trustees were advised by independent legal counsel. At each meeting where the Committee or the Independent Trustees considered the Advisory Agreement, they met with management and also met in separate executive session with their independent legal counsel.
The materials reviewed by the Committee and the trustees included, among other items, (i) information on the investment performance of each Fund and its peer groups and performance benchmarks, (ii) information on each Fund's advisory fees and other expenses, including information comparing the Fund's fees and expenses to those of peer groups of funds and information about any applicable expense limitations and fee "breakpoints," (iii) data on sales and redemptions of Fund shares and (iv) information on the profitability to CWAM, as well as potential "fall-out" or ancillary benefits that CWAM and its affiliates may receive as a result of their relationships with the Funds. The trustees also considered other information such as (i) CWAM's financial condition, (ii) each Fund's investment objective and strategies, (iii) the size, education and experience of CWAM's investment staff and its use of technology, external research and tra ding cost measurement tools, (iv) the allocation of the Funds' brokerage, if any, including allocations to brokers affiliated with CWAM, and the use of "soft" commission dollars to pay for research products and services, (v) the resources devoted to, and the record of compliance with, the Funds' investment policies and restrictions, policies on personal securities transactions and other compliance policies and (vi) the economic and market outlook generally and for the mutual fund industry in particular, including the market-related events in 2008. In addition, the trustees conferred with, and reviewed the Management Fee Evaluation (the "Fee Evaluation") prepared by the Trust's chief compliance officer, who also serves as the Trust's "Senior Officer," as contemplated by the Assurance of Discontinuance dated February 9, 2005 among affiliates of CWAM and the Office of the New York Attorney General. A summary of the Fee Evaluation is included in this report. Throughout the annual contract renewal process, the tr ustees had the opportunity to ask questions of and request additional materials from CWAM.
The Committee held meetings in May 2009 and reported its recommendations to the full board of trustees. On June 10, 2009, the board of trustees unanimously approved continuation through July 31, 2010 of (i) the Advisory Agreement and (ii) the Trust's administrative services agreement with CWAM (the "Administration Agreement").
In considering the continuation of the Advisory Agreement and the continuation of the amended Administration Agreement, the trustees reviewed and analyzed various factors that they determined were relevant, including the factors described below, none of which by itself was considered dispositive. However, the material factors and conclusions that formed the basis for the trustees' determination to approve the continuation of the Advisory Agreement and the amended Administration Agreement are discussed separately below.
Nature, quality and extent of services. The trustees reviewed the nature, quality and extent of the services of CWAM and its affiliates to the Funds, taking into account the investment objective and strategy of each Fund and knowledge gained from meetings with management, which were held on at least a quarterly basis. In addition, the trustees reviewed the available resources and key personnel of CWAM and its affiliates, especially those providing investment management services to the Funds. The trustees also considered other services provided to the Funds by CWAM and its affiliates, including: managing the execution of portfolio transactions and selecting broker-dealers for those transactions; monitoring adherence to the Funds' investment restrictions; producing shareholder reports; providing support services. for the board of trustees and committees of the board; communicating with shareholders; serving as the Funds' administrator; and overseeing the activities of the Funds' other service providers, including monitoring for compliance with various policies and procedures as well as applicable securities laws and regulations.
The trustees concluded that the nature, quality and extent of the services provided by CWAM and its affiliates to each Fund were appropriate and consistent with the terms of the Advisory Agreement and the Administration Agreement, and that the quality of those services had been consistent with or superior to quality norms in the industry. The trustees further concluded that the Funds were likely to benefit from the continued provision of those services by CWAM to the Funds. They also concluded that CWAM currently had sufficient personnel, with appropriate education and experience, to serve the Funds effectively, and had demonstrated its continuing ability to attract and retain well qualified personnel.
Performance of the Funds. At various meetings of the board of trustees, the Committee and the Investment Performance Committee of the board, the trustees considered the short-term and longer-term performance of each Fund. They reviewed information comparing each Fund's performance with that of its benchmark(s) and with the performance of comparable funds and peer groups as identified by Lipper Inc. ("Lipper") and Morningstar, Inc. ("Morningstar"). On the domestic side, the trustees discussed that each of Wanger USA and Wanger Select had a particularly difficult performance year during 2008, which the trustees acknowledged. In that regard, Wanger USA and Wanger Select both underperformed their respective benchmarks and peer group averages for the five-year period. In evaluating the underperformance of these two Funds, the trustees considered that CWAM was taking steps to remediate the underperformance, which the trustees would monitor. The trustees also reviewed the performance of the international Funds, discussing how both Wanger International and Wanger International Select continued to outperform their benchmarks and the majority of their peer groups established by Lipper and Morningstar over the five-year period. During the annual contract renewal process, the trustees concluded that, although past performance is not necessarily indicative of future results, the international Funds' strong overall longer-term performance record was an important factor in the their evaluation of the quality of services provided by CWAM under the Advisory Agreement.
Costs of Services and Profits Realized by CWAM. At various Committee and board of trustees meetings and other informal meetings, the trustees examined detailed information on the fees and expenses of each Fund in comparison to information for other comparable funds provided by Lipper and Morningstar. As noted in the Fee Evaluation, the contractual rates of investment advisory fees and the actual advisory fees paid by Wanger Select and Wanger USA were higher than the median advisory fee rates of their
28
Wanger USA 2009 Semiannual Report
Wanger Advisors Trust Board Approval of the Advisory Agreement 2009
respective peer groups. The trustees also considered the advisory fees of the Funds relative to those of the series of Columbia Acorn Trust ("Acorn"), a group of funds with similar investment strategies also overseen by the trustees and managed by CWAM. The trustees noted that the Funds' advisory fees were comparable to those of the Acorn funds.
The trustees reviewed the analysis of the profitability of CWAM in serving as each Fund's investment adviser and of CWAM and its affiliates in their relationships with each Fund, as well as an explanation of the methodology utilized in allocating various expenses among the Funds and other business units, each of which was included in the Fee Evaluation. The trustees considered the methodology used by CWAM in determining compensation payable to portfolio managers and the competitive market for investment management talent. They discussed how profitability comparisons among fund managers are not very meaningful due to the small number of publicly-owned managers, and how the profitability of any investment manager is affected by numerous factors, including its particular organizational structure, the types of funds and other accounts managed, other lines of business, expense allocation methodology, capital structure and cost of cap ital.
The trustees also reviewed the advisory fees charged by CWAM for managing other investment companies, sub-advised funds and other institutional separate accounts, as detailed in the Fee Evaluation. CWAM's institutional separate account fees for various investment strategies were examined and in some cases those fees were higher than the advisory fees charged to the Funds, and in some instances the Funds' fees were higher. The trustees noted that CWAM performs significant additional services for the Funds that it does not provide to sub-advised funds or non-mutual fund clients, including administrative services, oversight of the Funds' other service providers, trustee support, regulatory compliance and numerous other services, and that, in servicing the Funds, CWAM assumes many legal risks that it does not assume in servicing many of its other clients. Finally, as part of the annual contract renewal process, the trustees consider ed CWAM's financial condition as a result of market-related declines in assets in 2008 and 2009, and the possible impending sale of Bank of America's controlling interest in CWAM.
The trustees concluded that the rates of advisory fees and other compensation payable by the Funds to CWAM and its affiliate's were reasonable in relation to the nature and quality of the services to be provided, taking into account the fees charged by other advisers for managing comparable mutual funds with similar strategies and the fees CWAM charges to other clients. The trustees also concluded that the Funds' estimated overall expense ratios were reasonable, considering the quality of services provided by CWAM and its affiliates and the investment performance of the Funds.
Economies of Scale. At various meetings throughout the annual contract renewal process, the trustees considered information about the extent to which CWAM realizes economies of scale in connection with the increase of Fund assets. The trustees noted that the advisory fee schedule for each Fund includes breakpoints in the rate of fees at various asset levels. They noted that the Funds also share directly in economies of scale through lower charges by third party service providers based on the combined scale of all of the Funds. The trustees concluded that the current fee structure of each Fund was reasonable and reflective of a sharing between CWAM and the Funds of economies of scale.
Other Benefits to CWAM. The trustees also reviewed benefits that accrue to CWAM and its affiliates from their relationships with the Funds, as outlined in the Fee Evaluation. They noted that the Funds' transfer agent and distributor were each affiliates of CWAM and that the transfer agent received compensation from the Funds for services provided. The trustees considered ways, other than the services provided by CWAM and its affiliates pursuant to various agreements and the fees to be paid by each Fund therefor, that the Funds and CWAM may potentially benefit from their relationship with each other. At various Committee meetings, the trustees also considered CWAM's use of commissions paid by each Fund on its portfolio brokerage transactions to obtain research products and services benefiting the Fund and/or other clients of CWAM. They determined that CWAM's use of the Funds' "soft" commission dollars to obtain research products and services was consistent with regulatory requirements and guidance then in effect. They also concluded that CWAM benefits from the receipt of proprietary research products and services acquired through commissions paid on portfolio transactions of the Funds, and that the Funds benefit from CWAM's receipt of those products and services as well as research products and services acquired through commissions paid by other clients of CWAM. The trustees further determined that the success of any Fund could attract other business to CWAM or the Funds and that the success of CWAM could enhance its ability to serve the Funds.
After full consideration of the above factors, as well as other factors that were instructive in evaluating the Advisory Agreement, the trustees, including the Independent Trustees, concluded that the continuation of the Advisory Agreement and continuation of the Administration Agreement was in the best interest of each Fund. On June 10, 2009, the trustees approved continuation of the Advisory Agreement and the Administration Agreement , as so amended, through July 31, 2010.
29
Wanger USA 2009 Semiannual Report
This page intentionally left blank.
30
Wanger USA 2009 Semiannual Report
This page intentionally left blank.
31
Wanger USA 2009 Semiannual Report

Columbia Wanger Funds
Trustees
Robert E. Nason*
Chairman of the Board
Allan B. Muchin
Vice Chairman of the Board
Laura M. Born
Michelle L. Collins
Maureen M. Culhane
Margaret M. Eisen
Jerome Kahn, Jr.
Steven N. Kaplan
David C. Kleinman
Charles P. McQuaid
James A. Star
Ralph Wanger
John A. Wing
Officers
Charles P. McQuaid
President
Ben Andrews
Vice President
Michael G. Clarke
Assistant Treasurer
Jeffrey R. Coleman
Assistant Treasurer
P. Zachary Egan
Vice President
Peter T. Fariel
Assistant Secretary
John M. Kunka
Assistant Treasurer
Joseph C. LaPalm
Vice President
Bruce H. Lauer
Vice President, Secretary and Treasurer
Louis J. Mendes III
Vice President
Robert A. Mohn
Vice President
Christopher J. Olson
Vice President
Robert P. Scales
Chief Compliance Officer, Chief Legal Officer, Senior Vice President and General Counsel
Linda K. Roth-Wiszowaty
Assistant Secretary
* Deceased, June 27, 2009.
Transfer Agent,
Dividend Disbursing Agent
Columbia Management Services, Inc.
P.O.Box 8081
Boston, Massachusetts
02266-8081
Distributor
Columbia Management Distributors, Inc.
One Financial Center
Boston, Massachusetts
02111-2621
Investment Advisor
Columbia Wanger Asset Management, L.P.
227 West Monroe Street, Suite 3000
Chicago, Illinois 60606
1-888-4-WANGER
(1-888-492-6437)
Legal Counsel to the Fund
K&L Gates LLP
Washington, DC
Legal Counsel to the Independent Trustees
Drinker Biddle & Reath LLP
Philadelphia, Pennsylvania
Independent Registered Public Accounting Firm
PricewaterhouseCoopers LLP
Chicago, Illinois
This report, including the schedules of investments and financial statements, is submitted for the general information of the shareholders of the Wanger Advisors Trust.
A description of the Fund's proxy voting policies and procedures and a copy of the Fund's voting record for the most recent 12-month period ended June 30 are available (i) on the Securities and Exchange Commission's website at www.sec.gov, and (ii) without charge, upon request, by calling 888-492-6437.
The Fund files a complete schedule of portfolio holdings with the SEC for the first and third quarters of each fiscal year on Form N-Q. The Fund's Form N-Q is available on the SEC's website at www.sec.gov and may be reviewed and copied at the SEC's Public Reference Room in Washington, D.C. Information on the operation of the Pubic Reference Room may be obtained by calling 800-SEC-0330.
32
Columbia Wanger Funds
0L2568S
SHC-44/19905-0609 09/87161
Item 2. Code of Ethics.
Not applicable for semi-annual reports.
Item 3. Audit Committee Financial Expert.
Not applicable for semi-annual reports.
Item 4. Principal Accountant Fees and Services.
Not applicable for semi-annual reports.
Item 5. Audit Committee of Listed Registrants.
Not applicable.
Item 6. Investments
(a) | The registrant’s “Schedule I — Investments in securities of unaffiliated issuers” (as set forth in 17 CFR 210.12-12) is included in Item 1 of this Form N-CSR. |
|
|
(b) | Not applicable. |
Item 7. Disclosure of Proxy Voting Policies and Procedures for Closed-End Management Investment Companies.
Not applicable.
Item 8. Portfolio Managers of Closed-End Management Investment Companies.
Not applicable.
Item 9. Purchases of Equity Securities by Closed-End Management Investment Company and Affiliated Purchasers.
Not applicable.
Item 10. Submission of Matters to a Vote of Security Holders.
There have not been any material changes to the procedures by which shareholders may recommend nominees to the registrant’s board of directors, since those procedures were last disclosed in response to requirements of Item 407(c)(2)(iv) of Regulation S-K (as required by Item 22(b)(15) of Schedule 14A) or this Item.
Item 11. Controls and Procedures.
(a) | The registrant’s principal executive officer and principal financial officers, based on their evaluation of the registrant’s disclosure controls and procedures as of a date within 90 days of the filing of this report, have concluded that such controls and procedures are adequately designed to ensure that information required to be disclosed by the registrant in Form N-CSR is accumulated and communicated to the registrant’s management, including the principal executive officer and principal financial officer, or persons performing similar functions, as appropriate to allow timely decisions regarding required disclosure. |
|
|
(b) | There was no change in the registrant’s internal control over financial reporting that occurred during the registrant’s second fiscal quarter of the period covered by this report that has materially affected, or is reasonably likely to materially affect, the registrant’s internal control over financial reporting. |
Item 12. Exhibits.
(a)(1) Code of ethics required to be disclosed under Item 2 of Form N-CSR: Not applicable at this time.
(a)(2) Certifications pursuant to Rule 30a-2(a) under the Investment Company Act of 1940 (17 CFR 270.30a-2(a)) attached hereto as Exhibit 99.CERT.
(a)(3) Not applicable.
(b) Certification pursuant to Rule 30a-2(b) under the Investment Company Act of 1940 (17 CFR 270.30a-2(b)) attached hereto as Exhibit 99.906CERT.
SIGNATURES
Pursuant to the requirements of the Securities Exchange Act of 1934 and the Investment Company Act of 1940, the registrant has duly caused this report to be signed on its behalf by the undersigned, thereunto duly authorized.
(registrant) | Wanger Advisors Trust |
|
|
|
|
|
|
|
By (Signature and Title) | /s/ Charles P. McQuaid |
|
| Charles P. McQuaid, President |
|
|
|
|
|
|
|
Date | August 21, 2009 |
|
Pursuant to the requirements of the Securities Exchange Act of 1934 and the Investment Company Act of 1940, this report has been signed below by the following persons on behalf of the registrant and in the capacities and on the dates indicated.
By (Signature and Title) | /s/ Charles P. McQuaid |
|
| Charles P. McQuaid, President |
|
|
|
|
|
|
|
Date | August 21, 2009 |
|
|
|
|
|
|
|
By (Signature and Title) | /s/ Bruce H. Lauer |
|
| Bruce H. Lauer, Treasurer |
|
|
|
|
|
|
|
Date | August 21, 2009 |
|