UNITED STATES
SECURITIES AND EXCHANGE COMMISSION
Washington, D.C. 20549
FORM N-CSR
CERTIFIED SHAREHOLDER REPORT OF REGISTERED
MANAGEMENT INVESTMENT COMPANIES
Investment Company Act file number | 811-8748 |
|
Wanger Advisors Trust |
(Exact name of registrant as specified in charter) |
|
One Financial Center, Boston, Massachusetts | | 02111 |
(Address of principal executive offices) | | (Zip code) |
|
James R. Bordewick, Jr., Esq.
Columbia Management Advisors, LLC
One Financial Center
Boston, MA 02111 |
(Name and address of agent for service) |
|
Registrant’s telephone number, including area code: | 1-617-426-3750 | |
|
Date of fiscal year end: | December 31, 2008 | |
|
Date of reporting period: | June 30, 2008 | |
| | | | | | | | |
Form N-CSR is to be used by management investment companies to file reports with the Commission not later than 10 days after the transmission to stockholders of any report that is required to be transmitted to stockholders under Rule 30e-1 under the Investment Company Act of 1940 (17 CFR 270.30e-1). The Commission may use the information provided on Form N-CSR in its regulatory, disclosure review, inspection, and policymaking roles.
A registrant is required to disclose the information specified by Form N-CSR, and the Commission will make this information public. A registrant is not required to respond to the collection of information contained in Form N-CSR unless the Form displays a currently valid Office of Management and Budget ("OMB") control number. Please direct comments concerning the accuracy of the information collection burden estimate and any suggestions for reducing the burden to Secretary, Securities and Exchange Commission, 450 Fifth Street, NW, Washington, DC 20549-0609. The OMB has reviewed this collection of information under the clearance requirements of 44 U.S.C. § 3507.
Item 1. Reports to Stockholders.
Wanger International Select
2008 Semiannual Report

| NOT FDIC INSURED | | May Lose Value | |
|
| NOT BANK ISSUED | | No Bank Guarantee | |
|

Wanger International Select
2008 Semiannual Report
Table of Contents
| | 1 | | | Understanding Your Expenses | |
|
| | 2 | | | Perceptions of Risk | |
|
| | 4 | | | Performance Review | |
|
| | 6 | | | Statement of Investments | |
|
| | 10 | | | Statement of Assets and Liabilities | |
|
| | 10 | | | Statement of Operations | |
|
| | 11 | | | Statement of Changes in Net Assets | |
|
| | 12 | | | Financial Highlights | |
|
| | 13 | | | Notes to Financial Statements | |
|
| | 16 | | | Management Fee Evaluation of the Senior Officer | |
|
Columbia Wanger Asset Management, L.P. ("CWAM") is one of the leading global small- and mid-cap equity managers in the United States with more than 37 years of small- and mid-cap investment experience. As of June 30, 2008, CWAM manages $32.2 billion in assets and is the investment advisor to Wanger USA, Wanger International, Wanger Select, Wanger International Select (together, the "Wanger Advisors Trust Funds") and the Columbia Acorn Family of Funds. Columbia Management Group, LLC ("Columbia Management") is the investment management division of Bank of America Corporation. Columbia Management entities furnish investment management services and products for institutional and individual investors. The Wanger Advisors Trust Funds and the Columbia Acorn Family of Funds (together with other funds advised by Columbia Management affiliates, the "Columbia Funds") are distributed by Columbia Management Distributors, Inc., member of FINRA, SIPC, part of Columbia Management and an affiliate of Bank of America Corporation. CWAM is an SEC-registered investment advisor and indirect, wholly owned subsidiary of Bank of America Corporation. CWAM is part of Columbia Management.
Please consider the investment objectives, risks, charges and expenses for the Fund carefully before investing. Contact 1-888-4-WANGER for a prospectus, which contains this and other important information about the Fund. You should read it carefully before you invest.
The views expressed in "Perceptions of Risk" and in the Performance Review reflect the current views of the respective parties. These views are not guarantees of future performance and involve certain risks, uncertainties and assumptions that are difficult to predict so actual outcomes and results may differ significantly from the views expressed. These views are subject to change at any time based upon economic, market or other conditions and the respective parties disclaim any responsibility to update such views. These views may not be relied on as investment advice and, because investment decisions for a Columbia Fund are based on numerous factors, may not be relied on as an indication of trading intent on behalf of any particular Columbia Fund. References to specific company securities should not be construed as a recommendation or investment advice.
Wanger International Select 2008 Semiannual Report
Understanding Your Expenses
As a Fund shareholder, you incur two types of costs. There are transaction costs, which generally include sales charges on purchases and may include redemption or exchange fees. There are also ongoing costs, which generally include investment advisory fees and other Fund expenses. The information on this page is intended to help you understand your ongoing costs of investing in the Fund and to compare these costs with the ongoing costs of investing in other mutual funds.
Analyzing your Fund's expenses
To illustrate these ongoing costs, we have provided an example and calculated the expenses paid by investors in the Fund during the period. The information in the following table is based on an initial, hypothetical investment of $1,000, which is invested at the beginning of the period and held for the entire period. Expense information is calculated two ways and each method provides you with different information. The amount listed in the "Actual" column is calculated using actual operating expenses and total return for the Fund. The amount listed in the "Hypothetical" column assumes that the return each year is 5% before expenses and then applies the Fund's actual expense ratio for the period to the hypothetical return. You should not use the hypothetical account values and expenses to estimate either your actual account balance at the end of the period or the expenses you paid during the period. See the "Compare with other fu nds" information for details on using the hypothetical data.
Estimating your actual expenses
To estimate the expenses that you actually paid over the period, first you will need your account balance at the end of the period.
1. Divide your ending account balance by $1,000. For example, if an account balance was $8,600 at the end of the period, the result would be 8.6.
2. In the section of the table below titled "Expenses paid during the period," you will find a dollar amount in the column labeled "Actual." Multiply this amount by the result from step 1. Your answer is an estimate of the expenses you paid on your account during the period.
January 1, 2008 – June 30, 2008
| | | Account value at the
beginning of the period ($) | | Account value at the
end of the period ($) | | Expenses paid during
period ($) | | Fund's annualized
expense ratio (%)* | |
| | | Actual | | Hypothetical | | Actual | | Hypothetical | | Actual | | Hypothetical | | Actual | |
| Wanger International Select | | | 1,000.00 | | | | 1,000.00 | | | | 964.30 | | | | 1,018.95 | | | | 5.81 | | | | 5.97 | | | | 1.19 | | |
*For the six months ended June 30, 2008.
Expenses paid during the period are equal to the Fund's annualized expense ratio, multiplied by the average account value over the period, then multiplied by the number of days in the Fund's most recent fiscal half-year and divided by 366.
It is important to note that the expense amounts shown in the table are meant to highlight only ongoing costs of investing in the Fund. Expenses paid during the period do not include any insurance charges imposed by your insurance company's separate account. The hypothetical example provided is useful in comparing ongoing costs only and will not help you determine the relative total costs of owning different funds whose shareholders may incur transaction costs.
Compare with other funds
Since all mutual funds are required to include the same hypothetical calculations about expenses in shareholder reports, you can use this information to compare the ongoing cost of investing in the Fund with other funds. To do so, compare the 5% hypothetical example with the 5% hypothetical examples of other funds. As you compare hypothetical examples of other funds, it is important to note that hypothetical examples are meant to highlight the ongoing cost of investing in a fund and do not reflect any transaction costs, such as sales charges, redemption fees or exchange fees that may be incurred by shareholders of other funds. Expenses paid during the period do not include any insurance charges imposed by your insurance company's separate accounts.
1
Wanger International Select 2008 Semiannual Report

Perceptions of Risk
Most people tend to calibrate risk poorly. We overestimate the likelihood of being harmed by the things that make the evening news and underestimate those that don't. In a survey, people estimated that the chance of death by accident matched the chance of death by disease. In fact, disease causes 17-times more deaths than accidents.1
Dan Gardner's, Risk, The Science and Politics of Fear,2 explains why our views and actions are often so distorted. It seems our perceptions are most influenced by preconceived notions, reinforced by recent information. Accidents are newsworthy, as are catastrophes. If fatalities occur in large numbers in a single event—instead of in small numbers dispersed over time—our perception of risk rises.3
Besides catastrophes, it won't shock too many parents to learn that we tend to worry a lot about our children. Other things that we can't control, like airplane flights, can be worrisome, while things that we can control, such as automobiles, evoke less fear despite higher risks. Things that we don't understand such as trace chemicals,4 and other man-made risks like nuclear power, are also feared. Many people worry about radiation from cell phones, while ignoring the real hazard of driving while using cell phones. Many non-headline risks caused by nature, such as radon gas, which kills an estimated 41,000 people a year in the U.S. and Europe,5 tend to be downplayed.
Gardner notes that we are living longer in the safest era ever known to mankind. Horrible diseases like smallpox have been eliminated while others have been drastically curtailed. Childhood mortality has especially plunged and accident rates are also down.
Fear Mongering Profiteers
So who is putting the scary thoughts into our heads? The media is an obvious culprit because sensational stories sell newspapers and increase viewership. Companies trying to sell certain health care products or security services and devices also find fear mongering to be profitable. The number of companies lobbying homeland security officials rose from 15 in 2001 to 861 in 2004 as fears of terrorist attacks swelled.6 Trial lawyers reaping the rewards of questionable lawsuits, politicians pandering for votes and special interest groups seeking funding also try to keep people scared.
Fear can end up increasing risks. People need to remember the classic definition of risk: probability times consequences. Avoiding immunizations or weight loss treatments due to possible side effects can be ill advised. Diabetes, a disease linked to obesity, has been diagnosed in 24 million Americans. That's eight percent of the total population.7
The American Council on Science and Health is dedicated to separating real health risks from unfounded health scares, tracking health scares reported by the press and debunking them. Among the top scares in 2007 were allegations that lipstick, fluoridated water, roses and water bottles are hazardous. Among the top scares of all time were cranberries (1959), DDT (1962), cyclamates (1969), Alar (1989), cellular phone radiation (1993) and trace PCBs in farmed salmon (2003).8 Fumes from new shower curtains may make the list this year!
Rational Understanding of Risk
Peter L. Bernstein's, Against The Gods, The Remarkable Story of Risk,9 is a fascinating review of mankind's history of approaching risk, and how to understand, measure and deal with it. He reviews the advances in probability theory, which enabled the creation of insurance and, in turn, facilitated trade and investment. He states that managing risks depends on the use of three assumptions originated by Jacob Bernoulli around the year 1700: full information, independent trials and relevance of quantitative valuation.
Bernstein explores additional progress in risk management, particularly in investing. Diversification may reduce risk. However, some quantitative techniques for investing have failed. "Portfolio insurance," a quantitative approach to reduce equity holdings in market declines via the purchase of put options, intensified the market collapse of 1987. Subsequent to the book's publication, numerous quant managers have claimed that "six sigma" events (one in a million chance of occurring) caused huge losses in their funds. These failures occurred because the investment models violated Bernoulli's "independent trials" assumption stated above. Stock price movements may look independent, until numerous people attempt the same strategies or until human emotions result in lots of investors reacting in similar manners.
Stock Market Risks
Sentiment in the stock market seems to gyrate between greed and fear, creating bull and bear markets. Because the S&P 500 Index has fallen more than 20% from its peak, a bear market has been proclaimed. This suggests that the market is currently focusing on fear.
I recall a long-ago brokerage firm ad listing people's fears each year for decades. The list likely included events like the Cuban Missile Crisis and Three Mile Island. It noted that there seemed to be a reason to avoid investing in stocks each year. But starting with $1,000 50 years ago, an investment in the S&P 500 would have resulted in $140,364 as of June 30, 2008, vs. $13,619 if invested in super safe treasury bills. Meanwhile, inflation would require $7,535 to buy in 2008 what $1,000 bought in 1958.10 This example suggests that staying out of stocks would have been a very bad decision.
Market strategist Steve Leuthold provides lots of data and perspectives. Based on his estimate of "operating" (recurring) earnings, the S&P 500 at its July 11, 2008, close of 1,239 was selling at about 14.5-times earnings.
2
Wanger International Select 2008 Semiannual Report
That multiple matched the depths of the 2002-2003 bear market and was below the market's average price-earnings (PE) ratio11 of 16.5-times, calculated since 1926. Leuthold notes that market price-earnings ratios vary a lot, and that inflation is a major driver of PE ratios. When inflation has varied between zero and 5%, PE ratios averaged 18- to 19-times. When inflation has been between 5% and 7%, PE ratios averaged 13.8-times, and when inflation was 7% or more, PE ratios averaged 11.4-times.12
Inflation has been boosted by fuel and food prices, and the Consumer Price Index recently spiked up to a 5% year-over-year gain. Some are concerned that we may be returning to a period of big government and stagflation. Future inflation is indeed unpredictable, but continued surges in fuel and food prices from current lofty levels seem unlikely. Low unit labor cost increases, continued globalization and the continued success of capitalism all suggest that inflation may slow. If inflation does slow, Leuthold's data suggests that PE ratios and stock prices can rise a lot.
We are stock pickers rather than economists, and we are now seeing what we believe to be many more excellent investment opportunities than we've seen for several years. Consequently, focusing on fear seems like a mistake and taking a longer term perspective seems to be more rational.


Charles P. McQuaid
President and Chief Investment Officer
Columbia Wanger Asset Management, L.P.
The information and data provided in this analysis are derived from sources that we deem to be reliable and accurate. These views are not guarantees of future performance and involve certain risks, uncertainties and assumptions that are difficult to predict so actual outcomes and results may differ significantly from the views expressed. The views/opinions expressed in this essay are those of the author and not of the Columbia Wanger Advisors Trust Board, are subject to change at any time based upon economic, market or other conditions, may differ from views expressed by other Columbia Management associates or other divisions of Bank of America and the respective parties disclaim any responsibility to update such views. These views may not be relied on as investment advice and, because investment decisions for a Columbia Wanger Fund are based on numerous factors, may not be relied on as an indication of trading intent on beha lf of any particular Columbia Wanger Fund.
1 Gardner, Dan, Risk, the Science and Politics of Fear, (Virgin Book Ltd, 2008), pg. 13.
2 In addition to Gardner's book on the subject of risk, I also recommend Panicology written by statisticians Simon Briscoe and Hugh Aldersey-Williams (Viking/Penguin Books, 2008).
3 Gardner, Dan, op. cit., pgs. 62-76.
4 Gardner notes that our ability to find trace chemicals has never been better. Today we have the technology to dissect the components of drinking water, for example, to the level of one part per billion—equivalent to a single grain of sugar in an Olympic-size swimming pool. While it's true that the elements in trace chemicals can cause cancer, science and testing almost never look at such trace amounts.
5 Gardner, Dan, op. cit., pg. 81.
6 Ibid, pg. 281.
7 Source: American Council on Science and Health, "ACSH Morning Dispatch," June 25, 2008.
8 The study titled, "Fact Versus Fears (Fourth Edition)" is available on the American Council on Science and Health website at www.acsh.org.
9 Bernstein, Peter L., Against the Gods, The Remarkable Story of Risk, (John Wiley & Sons, Inc., 1996).
10 Figures include the reinvestment of dividends and are pretax.
11 The price-earnings (PE) ratio reflects the price of a stock divided by earnings per share. This ratio gives investors an idea of how much they are paying for a company's earning power. In general, the higher the PE, the more investors are paying, and therefore the more earnings growth they are expecting.
12 Leuthold Weeden Institutional Research, "Perception For The Professional," August 2008, Vol. 28 No. 8.
3
Wanger International Select 2008 Semiannual Report

Performance Review Wanger International Select

Christopher J. Olson
Portfolio Manager
Performance data quoted represents past performance and current performance may be lower or higher. Past performance is no guarantee of future results. The investment return and principal value of an investment in the Fund will fluctuate so that shares, when redeemed, may be worth more or less than the original cost. Performance may reflect any voluntary waivers or reimbursements of fund expenses by the advisor or its affiliates. Absent these waivers, or reimbursement arrangements, performance results may be lower. For daily and month-end performance updates, please call 1-888-4-WANGER.
Wanger International Select ended the first half of 2008 down 3.57%. The Fund strongly outperformed its benchmark, the S&P/Citigroup World ex-US Cap Range $2-10B Index, which fell 10.42%.
Fund performance benefited from the strong gains in fertilizer stocks. Fertilizer prices have soared on the back of higher crop prices, which have risen due to improving diets in the developing world and a global push toward biofuels. This growing demand and limited fertilizer supply have kept prices high. Potash Corp. of Saskatchewan, Sociedad Quimica y Minera de Chile and Israel Chemicals were the Fund's top three contributors for the half year. All produce potash or other natural chemical components used in fertilizer. Gains for these holdings ranged from 47% to 137%.
Energy stocks were also strong in the Fund as oil prices and demand continued to soar. Oil production and exploration company Pacific Rubiales Energy gained 49% in the half and Dutch oilfield services provider Fugro rose over 13%. Also based in the Netherlands, SBM Offshore, a company that builds and leases offshore vessels to process and store crude oil, was up 19% year to date. A third winner from the Netherlands, Vopak, is the world's largest operator of petroleum and chemical storage terminals. The stock posted a 53% gain for the half year.
On the downside, Ibiden, a Japanese manufacturer of electronic parts and ceramics, fell 47% for the half year. The company had some production problems and is also suffering from weaker demand in its semiconductor packaging business. Austria's Zumtobel, a maker of lighting systems, fell 38% in the first half of the year as construction slowed in its European markets. Hong Kong Exchanges and Clearing and Singapore Exchange were both down more than 40% for the half as the economic downturn has raised fears that trading volumes will slow or decline.
Markets remain extremely volatile and we believe it will be some time before any sort of normality returns. In the meantime, we will continue to focus on companies that we believe have strong competitive positions, competent management and healthy balance sheets.
International investments involve greater potential risks, including less or different regulation, currency fluctuations, economic instability and political developments. Investments in small- and mid-cap companies may be subject to greater volatility and price fluctuations because they may be thinly traded and less liquid. Investing in emerging markets may involve greater risks than investing in more developed countries.
Fund's Positions in Mentioned Holdings
As a percentage of net assets, as of 6/30/08
| Fugro | | | 5.8 | % | |
| Potash Corp. of Saskatchewan | | | 4.7 | | |
| Israel Chemicals | | | 4.6 | | |
| Sociedad Quimica y Minera de Chile | | | 3.1 | | |
| Pacific Rubiales Energy | | | 2.5 | | |
| Ibiden | | | 1.9 | | |
| Vopak | | | 1.6 | | |
| SBM Offshore | | | 1.2 | | |
| Zumtobel | | | 0.8 | | |
| Hong Kong Exchanges and Clearing | | | 0.7 | | |
| Singapore Exchange | | | 0.5 | | |
Portfolio holdings are subject to change periodically and may not be representative of current holdings.
4
Wanger International Select 2008 Semiannual Report
Growth of a $10,000 Investment in Wanger International Select
Total return for each period,
February 1, 1999 (inception date) through June 30, 2008

This graph compares the results of $10,000 invested in Wanger International Select on February 1, 1999 (the date the Fund began operations) through June 30, 2008, to the S&P/Citigroup World ex-US Cap Range $2-10B Index, with dividends and capital gains reinvested. Performance results reflect any fee waivers or reimbursements of Fund expenses by CWAM or any of its affiliates. Absent these fee waivers or expense reimbursement arrangements, performance results would have been lower. Performance shown here is past performance, which cannot guarantee future results. Current performance may be higher or lower. The investment return and principal value of an investment in the Fund will fluctuate so that Fund shares, when redeemed, may be worth more or less than their original cost. Performance changes over time. Current returns for the Fund may be different than that shown. For daily and most recent month-end performance updates , please contact us at 1-888-4-WANGER.
Results to June 30, 2008
| | | 2nd quarter | | Year to date | | 1 year | |
| Wanger International Select | | | 5.47 | % | | | -3.57 | % | | | 4.71 | % | |
S&P/Citigroup World ex-US
Cap Range $2-10B Index | | | -2.73 | | | | -10.42 | | | | -12.18 | | |
| MSCI EAFE Index | | | -2.25 | | | | -10.96 | | | | -10.61 | | |
NAV as of 6/30/08: $20.81
Performance numbers reflect all Fund expenses but do not include any insurance charge imposed by your insurance company's separate accounts. If performance included the effect of these additional charges, it would be lower.
The Fund's annual operating expense ratio is 1.18%. The annual operating expense ratio is as stated in the Fund's prospectus that is current as of the date of this report. Differences in expense ratios disclosed elsewhere in this report may result from including fee waivers and expense reimbursements as well as different time periods used in calculating the ratios.
All results shown assume reinvestment of distributions and do not reflect taxes that a shareholder would pay on Fund distributions or the sale of Fund shares.
The S&P/Citigroup World ex-US Cap Range $2-10B Index is a subset of the broad market selected by the index sponsor representing the mid-cap developed market, excluding the United States. The Morgan Stanley Capital International Europe, Australia, Far East (MSCI EAFE) Index is a capitalization-weighted index that tracks the total return of common stocks in 21 developed market countries within Europe, Australia and the Far East. Indexes are not managed and do not incur fees or expenses. It is not possible to invest directly in an index.
Portfolio characteristics and holdings are subject to change periodically and may not be representative of current characteristics and holdings.
Top 5 Countries
As a percentage of net assets, as of 6/30/08
| United Kingdom | | | 12.7 | % | |
| Japan | | | 12.2 | | |
| Netherlands | | | 10.6 | | |
| Canada | | | 7.3 | | |
| China | | | 5.8 | | |
Top 10 Holdings
As a percentage of net assets, as of 6/30/08
1. Fugro (Netherlands)
Oilfield Services | | | 5.8 | % | |
2. Potash Corp. of Saskatchewan (Canada)
World's Largest Producer of Postash | | | 4.7 | | |
3. Israel Chemicals (Israel)
Producer of Potash, Phosphates, Bromine & Specialty Chemicals | | | 4.6 | | |
4. SES Global (France)
Satellite Broadcasting Services | | | 3.7 | | |
5. Impala Platinum Holdings (South Africa)
Platinum Group Metals Mining & Refining | | | 3.5 | | |
6. Intertek Testing (United Kingdom)
Testing, Inspection & Certification Services | | | 3.4 | | |
7. Informa Group (United Kingdom)
Global Publisher & Event Organizer | | | 3.4 | | |
8. Diamond Offshore (United States)
Contract Driller | | | 3.2 | | |
9. Jupiter Telecommunications (Japan)
Largest Cable Service Provider in Japan | | | 3.1 | | |
10. Sociedad Quimica y Minera de Chile (Chile)
Producer of Specialty Fertilizers, Lithium & Iodine | | | 3.1 | | |
5
Wanger International Select 2008 Semiannual Report
Wanger International Select
Statement of Investments (Unaudited) June 30, 2008
Number of
Shares | | | | Value | |
| | | Common Stocks – 96.9% | |
| | | Europe – 49.1% | |
| | | United Kingdom – 12.7% | |
| | 105,000 | | | Intertek Testing
Testing, Inspection & Certification Services | | $ | 2,066,345 | | |
| | 250,000 | | | Informa Group
Global Publisher & Event Organizer | | | 2,056,584 | | |
| | 150,000 | | | Smith & Nephew
Medical Equipment & Supplies | | | 1,655,227 | | |
| | 120,000 | | | Capita Group
White Collar, Back Office Outsourcing | | | 1,643,276 | | |
| | 9,100 | | | Intermediate Capital
European Provider of Mezzanine Capital | | | 245,967 | | |
| | | | 7,667,399 | | |
| | | Netherlands – 10.6% | |
| | 40,909 | | | Fugro
Oilfield Services | | | 3,494,200 | | |
| | 14,500 | | | Vopak
World's Largest Operator of Petroleum &
Chemical Storage Terminals | | | 982,812 | | |
| | 19,463 | | | SBM Offshore
Builds & Leases Offshore Vessels to
Process & Store Crude Oil | | | 718,285 | | |
| | 33,767 | | | Aalberts Industries
Flow Control & Heat Treatment | | | 637,974 | | |
| | 28,000 | | | QIAGEN (a)
Life Science Company; DNA/RNA Purification | | | 566,928 | | |
| | | | 6,400,199 | | |
| | | Switzerland – 5.3% | |
| | 14,100 | | | Kuehne & Nagel
Freight Forwarding/Logistics | | | 1,339,538 | | |
| | 7,350 | | | Synthes
Products for Orthopedic Surgery | | | 1,013,049 | | |
| | 3,310 | | | Swatch Group
Watch & Electronics Manufacturer | | | 827,054 | | |
| | | | 3,179,641 | | |
| | | Ireland – 4.1% | |
| | 245,600 | | | United Drug
Irish Pharmaceutical Wholesaler & Outsourcer | | | 1,364,998 | | |
| | 45,000 | | | IAWS Group
Baked Goods | | | 1,126,520 | | |
| | | | 2,491,518 | | |
Number of
Shares | | | | Value | |
| | | Germany – 3.8% | |
| | 55,000 | | | Rhoen-Klinikum
Health Care Services | | $ | 1,746,617 | | |
| | 8,250 | | | Wincor Nixdorf
Retail POS Systems & ATM Machines | | | 574,384 | | |
| | | | 2,321,001 | | |
| | | France – 3.7% | |
| | 88,900 | | | SES Global
Satellite Broadcasting Services | | | 2,253,496 | | |
| | | Sweden – 3.2% | |
| | 90,000 | | | Hexagon
Measurement Equipment & Polymers | | | 1,643,849 | | |
| | 139,000 | | | Niscayah
Commercial Security Installation & Service | | | 302,352 | | |
| | | | 1,946,201 | | |
| | | Greece – 2.5% | |
| | 87,000 | | | Intralot
Lottery & Gaming Systems & Services | | | 1,493,052 | | |
| | | Spain – 1.3% | |
| | 12,000 | | | Red Electrica de Espana
Spanish Power Grid | | | 781,243 | | |
| | | Denmark – 1.1% | |
| | 7,000 | | | Novozymes
Industrial Enzymes | | | 632,521 | | |
| | | Austria – 0.8% | |
| | 20,900 | | | Zumtobel
Lighting Systems | | | 477,137 | | |
| | | | | Total Europe | | | 29,643,408 | | |
| | | Other Countries – 23.9% | |
| | | Canada – 7.3% | |
| | 12,500 | | | Potash Corp. of Saskatchewan
World's Largest Producer of Potash | | | 2,857,125 | | |
| | 92,050 | | | Pacific Rubiales Energy (a)(b) | | | 1,200,225 | | |
| | 46,025 | | | Pacific Rubiales Energy – Warrants (a)(b) | | | 315,025 | | |
| | 450 | | | Pacific Rubiales Energy (a)
Oil Production & Exploration in Columbia | | | 5,927 | | |
| | | | 4,378,302 | | |
See accompanying notes to financial statements.
6
Wanger International Select 2008 Semiannual Report
Wanger International Select
Statement of Investments (Unaudited) June 30, 2008
Number of
Shares | | | | Value | |
| | | South Africa – 5.5% | |
| | 54,000 | | | Impala Platinum Holdings
Platinum Group Metals Mining & Refining | | $ | 2,131,035 | | |
| | 55,000 | | | Naspers
Media & Education in Africa & other
Emerging Markets | | | 1,201,149 | | |
| | | | 3,332,184 | | |
| | | United States – 5.0% | |
| | 14,000 | | | Diamond Offshore
Contract Driller | | | 1,947,960 | | |
| | 11,500 | | | Cephalon (a)
Specialty Pharmaceuticals for Pain,
Central Nervous System & Oncology | | | 766,935 | | |
| | 34,000 | | | Synthesis Energy Systems (a)
Owner/Operator of Gasification Plants | | | 306,000 | | |
| | | | 3,020,895 | | |
| | | Israel – 4.6% | |
| | 120,000 | | | Israel Chemicals
Producer of Potash, Phosphates, Bromine, &
Specialty Chemicals | | | 2,796,117 | | |
| | | Australia – 1.5% | |
| | 158,667 | | | Sino Gold (a)
Gold Mining in The People's Republic of China | | | 886,778 | | |
| | | | | Total Other Countries | | | 14,414,276 | | |
| | | Asia – 20.8% | |
| | | Japan – 12.2% | |
| | 2,450 | | | Jupiter Telecommunications
Largest Cable Service Provider in Japan | | | 1,898,903 | | |
| | 173,000 | | | Kansai Paint
Paint Producer in Japan, India,
China & Southeast Asia | | | 1,197,485 | | |
| | 2,000 | | | Nintendo
Entertainment Software & Hardware | | | 1,128,220 | | |
| | 31,000 | | | Ibiden
Electronic Parts & Ceramics | | | 1,126,901 | | |
| | 38,000 | | | Hoya
Opto-electrical Components & Eyeglass Lenses | | | 878,561 | | |
| | 54,000 | | | Asics
Footwear & Apparel | | | 588,897 | | |
| | 20,000 | | | Hitachi Construction Machinery
Construction Machinery | | | 560,343 | | |
| | | | 7,379,310 | | |
Number of
Shares | | | | Value | |
| | | China – 5.8% | |
| | 2,550,000 | | | Lenovo Group
Third Largest PC Vendor Globally | | $ | 1,726,763 | | |
| | 507,000 | | | China Shipping Development
China's Dominant Shipper for Oil & Coal | | | 1,521,536 | | |
| | 2,479,700 | | | RexCapital Finance (a)
Chinese Lottery | | | 248,058 | | |
| | | | 3,496,357 | | |
| | | Hong Kong – 1.2% | |
| | 27,000 | | | Hong Kong Exchanges and Clearing
Hong Kong Equity & Derivatives Market Operator | | | 394,754 | | |
| | 1,200,000 | | | Nagacorp
Monopoly Casino in Central Cambodia | | | 323,191 | | |
| | | | 717,945 | | |
| | | Korea – 1.0% | |
| | 20,000 | | | Woongjin Coway
South Korean Household Appliance Rental
Service Provider | | | 586,970 | | |
| | | Singapore – 0.6% | |
| | 65,000 | | | Singapore Exchange
Singapore Equity & Derivatives Market Operator | | | 330,124 | | |
| | 27,500 | | | OLAM
Agriculture Supply Chain Manager | | | 49,116 | | |
| | | | 379,240 | | |
| | | | | Total Asia | | | 12,559,822 | | |
| | | Latin America – 3.1% | |
| | | Chile – 3.1% | |
| | 40,000 | | | Sociedad Quimica y Minera
de Chile – ADR
Producer of Specialty Fertilizers, Lithium & Iodine | | | 1,864,000 | | |
| | | | | Total Latin America | | | 1,864,000 | | |
| Total Common Stocks (Cost: $44,503,029) – 96.9% | | | 58,481,506 | | |
See accompanying notes to financial statements.
7
Wanger International Select 2008 Semiannual Report
Wanger International Select
Statement of Investments (Unaudited) June 30, 2008
| Principal Amount | | | | Value | |
| Short Term-Obligation – 1.3% | |
| $ | 788,000 | | | Repurchase Agreement with
Fixed Income Clearing Corp.,
dated 06/30/08, due 07/01/08
at 1.80%, collateralized by
a U.S. Treasury Obligation
maturing 05/15/09, market
value $806,588 (repurchase
proceeds $788,039) | | $ | 788,000 | | |
| Total Short-Term Obligation (Cost: $788,000) | | | 788,000 | | |
| Total Investments (Cost: $45,291,029) – 98.2% (c)(d) | | | 59,269,506 | | |
| Cash and Other Assets Less Liabilities – 1.8% | | | 1,074,617 | | |
| Total Net Assets – 100.0% | | | 60,344,123 | | |
Notes to Statement of Investments:
(a) Non-income producing security.
(b) Denotes a restricted security, which is subject to restrictions on resale under federal securities laws. These securities are valued in good faith by the Board of Trustees. At June 30, 2008, these securities amounted to $1,515,250 which represents 2.51% of total net assets. Additional information on these securities is as follows:
Acquisition
Security | | Shares
Dates | | Par | | Cost | | Value | |
| Pacific Rubiales Energy | | 7/12/2007 | | | 92,050 | | | $ | 369,594 | | | $ | 1,200,225 | | |
Pacific Rubiales Energy –
Warrants | | 7/12/2007 | | | 46,025 | | | | 78,779 | | | | 315,025 | | |
| | | | | | | $ | 448,373 | | | $ | 1,515,250 | | |
(c) At June 30, 2008, for federal income tax purposes cost of investments was $45,291,029 and net unrealized appreciation was $13,978,477 consisting of gross unrealized appreciation of $16,388,281 and gross unrealized depreciation of $2,409,804.
(d) On June 30, 2008, the Fund's total investments were denominated in currencies as follows:
| Currency | | Value | | % of Net
Assets | |
| Euro | | $ | 16,217,646 | | | | 26.9 | | |
| U.S. Dollar | | | 8,530,020 | | | | 14.1 | | |
| British Pound | | | 7,667,399 | | | | 12.7 | | |
| Japanese Yen | | | 7,379,310 | | | | 12.2 | | |
| Hong Kong Dollar | | | 4,214,302 | | | | 7.0 | | |
| South African Rand | | | 3,332,184 | | | | 5.5 | | |
| Swiss Franc | | | 3,179,641 | | | | 5.3 | | |
Other currencies less than
5% of total net assets | | | 8,749,004 | | | | 14.5 | | |
Cash and other assets less
liabilities | | | 1,074,617 | | | | 1.8 | | |
| | | $ | 60,344,123 | | | | 100.0 | | |
ADR = American Depositary Receipts
See accompanying notes to financial statements.
8
Wanger International Select 2008 Semiannual Report
Wanger International Select
Portfolio Diversification (Unaudited) June 30, 2008
At June 30, 2008, the Fund's portfolio investments as a percent of net assets was diversified as follows:
| | | Value | | Percent | |
| Industrial Goods & Services | |
| Industrial Materials & Specialty Chemicals | | $ | 6,490,123 | | | | 10.8 | % | |
| Conglomerates | | | 3,408,724 | | | | 5.7 | | |
| Other Industrial Services | | | 3,405,883 | | | | 5.6 | | |
| Outsourcing Services | | | 1,994,744 | | | | 3.3 | | |
| Machinery | | | 560,343 | | | | 0.9 | | |
| Electrical Components | | | 477,137 | | | | 0.8 | | |
| | | | 16,336,954 | | | | 27.1 | | |
| Energy & Minerals | |
| Oil Services | | | 6,160,444 | | | | 10.2 | | |
| Mining | | | 5,874,938 | | | | 9.8 | | |
| Oil & Gas Producers | | | 1,521,177 | | | | 2.5 | | |
| Oil Refining, Marketing & Distribution | | | 982,812 | | | | 1.6 | | |
| Alternative Energy | | | 306,000 | | | | 0.5 | | |
| | | | 14,845,371 | | | | 24.6 | | |
| Information | |
| Computer Hardware & Related Equipment | | | 2,301,146 | | | | 3.8 | | |
| Satellite Broadcasting & Services | | | 2,253,496 | | | | 3.7 | | |
| Publishing | | | 2,056,585 | | | | 3.4 | | |
| CATV | | | 1,898,903 | | | | 3.2 | | |
| TV Broadcasting | | | 1,201,149 | | | | 2.0 | | |
| Consumer Software | | | 1,128,220 | | | | 1.9 | | |
| Semiconductors & Related Equipment | | | 878,561 | | | | 1.4 | | |
| Financial Processors | | | 724,878 | | | | 1.2 | | |
| | | | 12,442,938 | | | | 20.6 | | |
| | | Value | | Percent | |
| Health Care | |
| Medical Equipment & Devices | | $ | 2,668,276 | | | | 4.4 | % | |
| Pharmaceuticals | | | 2,131,934 | | | | 3.5 | | |
| Health Care Services | | | 1,746,617 | | | | 2.9 | | |
| Medical Supplies | | | 566,928 | | | | 1.0 | | |
| | | | 7,113,755 | | | | 11.8 | | |
| Consumer Goods & Services | |
| Casinos & Gaming | | | 2,064,300 | | | | 3.4 | | |
| Food & Beverage | | | 1,126,520 | | | | 1.8 | | |
| Other Durable Goods | | | 827,054 | | | | 1.4 | | |
| Leisure Products | | | 588,897 | | | | 1.0 | | |
| Other Consumer Services | | | 586,970 | | | | 1.0 | | |
| | | | 5,193,741 | | | | 8.6 | | |
| Other Industries | |
| Transportation | | | 1,521,536 | | | | 2.5 | | |
| Regulated Utilities | | | 781,243 | | | | 1.3 | | |
| | | | 2,302,779 | | | | 3.8 | | |
| Finance | |
| Finance Companies | | | 245,968 | | | | 0.4 | | |
| | | | 245,968 | | | | 0.4 | | |
| Total Common Stocks | | | 58,481,506 | | | | 96.9 | | |
| Short-Term Obligation | | | 788,000 | | | | 1.3 | | |
| Total Investments | | | 59,269,506 | | | | 98.2 | | |
Cash and Other Assets
Less Liabilities | | | 1,074,617 | | | | 1.8 | | |
| Net Assets | | $ | 60,344,123 | | | | 100.0 | % | |
See accompanying notes to financial statements.
9
Wanger International Select 2008 Semiannual Report
Statement of Assets and Liabilities
June 30, 2008 (Unaudited)
| Assets: | |
| Investments, at cost | | $ | 45,291,029 | | |
| Investments, at value | | $ | 59,269,506 | | |
| Cash | | | 508 | | |
| Foreign currency (cost of $1,729,917) | | | 1,721,956 | | |
| Receivable for: | |
| Investments sold | | | 70,572 | | |
| Interest | | | 40 | | |
| Dividends | | | 20,254 | | |
| Foreign tax reclaims | | | 18,389 | | |
| Other assets | | | 3,088 | | |
| Total Assets | | | 61,104,313 | | |
| Liabilities: | |
| Payable for: | |
| Investments purchased | | | 183,105 | | |
| Fund shares repurchased | | | 479,853 | | |
| Investment advisory fee | | | 48,307 | | |
| Administration fee | | | 2,569 | | |
| Transfer agent fee | | | 11 | | |
| Trustees' fees | | | 421 | | |
| Audit fee | | | 15,622 | | |
| Custody fee | | | 7,700 | | |
| Reports to shareholders | | | 15,343 | | |
| Trustees' deferred compensation plan | | | 7,259 | | |
| Total Liabilities | | | 760,190 | | |
| Net Assets | | $ | 60,344,123 | | |
| Composition of Net Assets: | |
| Paid-in capital | | $ | 45,674,109 | | |
| Undistributed net investment income | | | 459,203 | | |
| Accumulated net realized gain | | | 238,724 | | |
| Net unrealized appreciation (depreciation) on: | |
| Investments | | | 13,978,477 | | |
| Foreign currency translations | | | (6,390 | ) | |
| Net Assets | | $ | 60,344,123 | | |
| Fund Shares Outstanding | | | 2,900,166 | | |
Net asset value, offering price and redemption
price per share | | $ | 20.81 | | |
Statement of Operations
For the Six Months Ended June 30, 2008 (Unaudited)
| Investment Income: | |
| Dividends (net of foreign taxes withheld of $57,518) | | $ | 809,427 | | |
| Interest | | | 28,269 | | |
| Total Investment Income | | | 837,696 | | |
| Expenses: | |
| Investment advisory fee | | | 297,387 | | |
| Administration fee | | | 15,818 | | |
| Transfer agent fee | | | 73 | | |
| Reports to shareholders | | | 14,172 | | |
| Trustees' fees | | | 4,333 | | |
| Custody fee | | | 24,959 | | |
| Chief compliance officer expenses (See Note 4) | | | 810 | | |
| Other expenses (See Note 5) | | | 19,965 | | |
| Total Expenses | | | 377,517 | | |
| Custody earnings credit | | | (74 | ) | |
| Net Expenses | | | 377,443 | | |
| Net Investment Income | | | 460,253 | | |
Net Realized and Unrealized Gain (Loss) on
Investments and Foreign Currency: | |
| Net realized gain (loss) on: | |
| Investments | | | 319,720 | | |
| Foreign currency transactions | | | (48,501 | ) | |
| Net realized gain | | | 271,219 | | |
| Net change in unrealized depreciation on: | |
| Investments | | | (3,767,431 | ) | |
| Foreign currency translations | | | (7,674 | ) | |
| Net change in unrealized depreciation | | | (3,775,105 | ) | |
| Net Loss | | | (3,503,886 | ) | |
| Net Decrease in Net Assets from Operations | | $ | (3,043,633 | ) | |
See accompanying notes to financial statements.
10
Wanger International Select 2008 Semiannual Report
Statement of Changes in Net Assets
| Increase (Decrease) in Net Assets | | (Unaudited)
Six Months
Ended
June 30,
2008 | | Year Ended
December 31,
2007 | |
| Operations: | |
| Net investment income | | $ | 460,253 | | | $ | 256,588 | | |
| Net realized gain on investments and foreign currency transactions | | | 271,219 | | | | 14,866,303 | | |
Net change in unrealized depreciation
on investments and foreign currency translations | | | (3,775,105 | ) | | | (1,765,746 | ) | |
| Net Increase (Decrease) in Net Assets from Operations | | | (3,043,633 | ) | | | 13,357,145 | | |
| Distributions to Shareholders: | |
| From net investment income | | | (215,563 | ) | | | (491,093 | ) | |
| From net realized gains | | | (14,461,904 | ) | | | (7,887,030 | ) | |
| Total Distributions to Shareholders | | | (14,677,467 | ) | | | (8,378,123 | ) | |
| Share Transactions: | |
| Subscriptions | | | 2,531,213 | | | | 13,254,652 | | |
| Distributions reinvested | | | 14,677,467 | | | | 8,378,123 | | |
| Redemptions | | | (12,627,982 | ) | | | (15,721,645 | ) | |
| Net Increase from Share Transactions | | | 4,580,698 | | | | 5,911,130 | | |
| Total Increase (Decrease) in Net Assets | | | (13,140,402 | ) | | | 10,890,152 | | |
| Net Assets: | |
| Beginning of period | | | 73,484,525 | | | | 62,594,373 | | |
| End of period | | $ | 60,344,123 | | | $ | 73,484,525 | | |
| Undistributed net investment income at end of period | | $ | 459,203 | | | $ | 214,513 | | |
See accompanying notes to financial statements.
11
Wanger International Select 2008 Semiannual Report
Financial Highlights
| | | (Unaudited)
Six Months Ended
June 30, | | Year Ended December 31, | |
| Selected data for a share outstanding throughout each period | | 2008 | | 2007 | | 2006 | | 2005 | | 2004 | | 2003 | |
| Net Asset Value, Beginning of Period | | $ | 28.07 | | | $ | 26.62 | | | $ | 19.63 | | | $ | 17.19 | | | $ | 13.87 | | | $ | 9.86 | | |
| Income from Investment Operations: | |
| Net investment income (a) | | | 0.16 | | | | 0.10 | | | | 0.11 | | | | 0.13 | | | | 0.04 | | | | 0.04 | | |
Net realized and unrealized gain (loss) on investments
and foreign currency transactions | | | (1.46 | ) | | | 4.92 | | | | 6.94 | | | | 2.66 | | | | 3.33 | | | | 4.01 | | |
| Total from Investment Operations | | | (1.30 | ) | | | 5.02 | | | | 7.05 | | | | 2.79 | | | | 3.37 | | | | 4.05 | | |
| Less Distributions to Shareholders: | |
| From net investment income | | | (0.09 | ) | | | (0.21 | ) | | | (0.06 | ) | | | (0.35 | ) | | | (0.05 | ) | | | (0.04 | ) | |
| From net realized gains | | | (5.87 | ) | | | (3.36 | ) | | | — | | | | — | | | | — | | | | — | | |
| Total Distributions to Shareholders | | | (5.96 | ) | | | (3.57 | ) | | | (0.06 | ) | | | (0.35 | ) | | | (0.05 | ) | | | (0.04 | ) | |
| Net Asset Value, End of Period | | $ | 20.81 | | | $ | 28.07 | | | $ | 26.62 | | | $ | 19.63 | | | $ | 17.19 | | | $ | 13.87 | | |
| Total Return (b) | | | (3.57 | )%(c) | | | 21.78 | % | | | 36.00 | % | | | 16.43 | %(d) | | | 24.34 | % | | | 41.24 | %(d) | |
| Ratios to Average Net Assets/Supplemental Data: | |
| Net expenses (e) | | | 1.19 | %(f) | | | 1.18 | % | | | 1.19 | % | | | 1.32 | % | | | 1.43 | % | | | 1.45 | % | |
| Net investment income (e) | | | 1.46 | %(f) | | | 0.37 | % | | | 0.47 | % | | | 0.76 | % | | | 0.29 | % | | | 0.39 | % | |
| Waiver | | | — | | | | — | | | | — | | | | 0.00 | %(g) | | | — | | | | 0.09 | % | |
| Portfolio turnover rate | | | 25 | %(c) | | | 69 | % | | | 61 | % | | | 48 | % | | | 71 | % | | | 59 | % | |
| Net assets, end of period (000's) | | $ | 60,344 | | | $ | 73,485 | | | $ | 62,594 | | | $ | 44,026 | | | $ | 35,232 | | | $ | 26,928 | | |
(a) Net investment income per share was based upon the average shares outstanding during the period.
(b) Total return at net asset value assuming all distributions reinvested.
(c) Not annualized.
(d) Had the investment advisor not waived a portion of expenses, total return would have been reduced.
(e) The benefits derived from custody fees paid indirectly had an impact of less than 0.01%.
(f) Annualized.
(g) Rounds to less than 0.01%.
See accompanying notes to financial statements.
12
Wanger International Select 2008 Semiannual Report
Notes to Financial Statements (Unaudited)
1. Nature of Operations
Wanger International Select (the "Fund"), is a series of Wanger Advisors Trust (the "Trust"), an open-end management investment company organized as a Massachusetts business trust. The investment objective of the Fund is to seek long-term capital appreciation. The Fund is available only for allocation to certain life insurance company separate accounts established for the purpose of funding qualified and non-qualified variable annuity contracts and variable life insurance policies and may also be offered directly to certain types of pension plans and retirement arrangements.
2. Significant Accounting Policies
Security valuation
Securities of the Fund are valued at market value or, if a market quotation for a security is not readily available or is deemed not to be reliable because of events or circumstances that have occurred between the market quotation and the time as of which the security is to be valued, the security is valued at a fair value determined in accordance with procedures established by the Board of Trustees. A security traded on a securities exchange or in an over-the-counter market in which transaction prices are reported is valued at the last sales price at the time of valuation. A security traded principally on NASDAQ is valued at the NASDAQ official closing price. A security for which there is no reported sale on the valuation date is valued at the latest bid quotation. A short-term debt obligation having a maturity of 60 days or less from the valuation date is valued at amortized cost, which approximates fair value. A security for which a market quotation is not readily available and any other assets are valued in accordance with procedures established by the Board of Trustees. The Trust has retained an independent statistical fair value pricing service to assist in the fair valuation process for securities principally traded in a foreign market in order to adjust for possible changes in value that may occur between the close of the foreign market and the time as of which the securities are to be valued. If a security is valued at fair value, that value may be different from the last quoted market price for the security.
On January 1, 2008, the Fund adopted Statement of Financial Accounting Standard No. 157, Fair Value Measurements ("SFAS 157"). Under SFAS 157, various inputs are used in determining the value of the Fund's investments. These inputs are summarized in the three broad levels listed below:
• Level 1—quoted prices in active markets for identical securities
• Level 2—other significant observable inputs (including quoted prices for similar securities, interest rates, prepayment speeds, credit risk, and others)
• Level 3—significant unobservable inputs (including the Fund's own assumptions in determining the value of investments)
The inputs or methodology used for valuing securities are not necessarily an indication of the risk associated with investing in those securities.
The following table summarizes the inputs used, as of June 30, 2008, in valuing the Fund's assets:
| Valuation Inputs | | Investments in
Securities | | Other Financial
Instruments | |
| Level 1—Quoted Prices | | $ | 7,747,947 | | | $ | — | | |
| Level 2—Other Significant Observable Inputs | | $ | 51,521,559 | | | | — | | |
| Level 3—Significant Unobservable Inputs | | | — | | | | — | | |
| Total | | $ | 59,269,506 | | | $ | — | | |
The Fund's assets assigned to the Level 2 input category include certain foreign securities for which a third party pricing service may be employed for purposes of fair market valuation.
Repurchase agreements
The Fund may engage in repurchase agreement transactions. The Fund, through its custodians, receives delivery of underlying securities collateralizing each repurchase agreement. The Fund's custodian determines that the value of the underlying securities is at all times at least equal to the resale price. In the event of default or bankruptcy by the other party to the agreement, realization and/or retention of the collateral may be subject to legal proceedings.
Foreign currency translations
Values of investments denominated in foreign currencies are converted into U.S. dollars using the spot market rate of exchange at the time of valuation. Purchases and sales of investments and dividend and interest income are translated into U.S. dollars using the spot market rate of exchange prevailing on the respective dates of such transactions. The gain or loss resulting from changes in foreign exchange rates is included with net realized and unrealized gain or loss from investments, as appropriate.
Security transactions and investment income
Security transactions are accounted for on the trade date (date the order to buy or sell is executed) and dividend income is recorded on the ex-dividend date, except that certain dividends from foreign securities are recorded as soon as the information is available to the Fund. Interest income is recorded on the accrual basis and includes amortization of discounts on debt obligations when required for federal income tax purposes. Realized gains and losses from security transactions are recorded on an identified cost basis.
Awards, if any, from class action litigation related to securities owned may be recorded as a reduction of cost of those securities. If the applicable securities are no longer owned, the proceeds are recorded as realized gains.
In March 2008, Statement of Financial Accounting Standards No. 161 ("SFAS 161"), Disclosures about Derivative Instruments and Hedging Activities—an amendment of FASB Statement No. 133, was issued. SFAS 161 is effective for fiscal years beginning after November 15, 2008. SFAS 161 requires additional discussion about the reporting entity's derivative instruments and hedging activities, by providing for qualitative disclosures about the objectives and strategies for using derivatives, quantitative data about the fair value of and gains and losses on derivative contracts, and details of credit-risk-related contingent features in their hedged positions. Management is evaluating the impact the application of SFAS 161 will have on the Fund's financial statement disclosures.
Restricted securities
Restricted securities are securities that may only be resold upon registration under federal securities laws or in transactions exempt from registration. In some cases, the issuer of restricted securities has agreed to register such securities for resale at the issuer's expense either upon demand by the Fund or in connection with another registered offering of the securities. Many restricted securities may be resold in the secondary market in transactions exempt from registration. Such restricted securities may be determined to be liquid under criteria established by the Board of Trustees. The Fund will not incur any registration costs upon such resale.
Use of estimates
The preparation of financial statements in conformity with accounting principles generally accepted in the United States of America ("GAAP") requires management to make estimates and assumptions that affect the amounts reported in the financial statements and accompanying notes. Actual results may differ from those estimates.
Fund share valuation
Fund shares are sold and redeemed on a continuing basis at net asset value. Net asset value per share is determined daily as of the close of trading on the
13
Wanger International Select 2008 Semiannual Report
Notes to Financial Statements, continued (Unaudited)
New York Stock Exchange ("the Exchange") on each day the Exchange is open for trading by dividing the total value of the Fund's investments and other assets, less liabilities, by the number of Fund shares outstanding.
Custody fees/Credits
Custody fees are reduced based on the Fund's cash balances maintained with the custodian. The amount is disclosed as a reduction of total expenses in the Statement of Operations.
Federal income taxes
The Fund has complied with the provisions of the Internal Revenue Code available to regulated investment companies and, in the manner provided therein, distributes all its taxable income, as well as any net realized gain on sales of investments and foreign currency transactions reportable for federal income tax purposes. Accordingly, the Fund paid no federal income taxes and no federal income tax provision was required.
Foreign capital gains taxes
Gains realized in certain countries may be subject to foreign taxes at the fund level, at rates ranging from 10%-15%. The Fund accrues for such foreign taxes on net realized and unrealized gains at the appropriate rate for each jurisdiction.
Expenses
General expenses of the Trust are allocated to the Fund and the other series of the Trust based upon relative net assets or other expense allocation methodologies determined by the nature of the expense. Expenses directly attributable to the Fund are charged to the Fund.
Distributions to shareholders
Distributions to shareholders are recorded on the ex-date.
Indemnification
In the normal course of business, the Fund enters into contracts that contain a variety of representations and warranties which provide general indemnities. The Fund's maximum exposure under these arrangements is unknown, as this would involve future claims against the Fund. Also under the Trust's organizational documents, the Trustees and Officers of the Trust are indemnified against certain liabilities that may arise out of their duties to the Trust. However based on experience, the Fund expects the risk of loss due to these warranties and indemnities to be minimal.
3. Federal Tax Information
The tax character of distributions paid during the year ended December 31, 2007 was as follows:
| Distributions paid from: | |
| Ordinary Income* | | $ | 1,250,481 | | |
| Long-Term Capital Gains | | | 7,127,642 | | |
* For tax purposes short-term capital gains distributions, if any, are considered ordinary income distributions.
Under Financial Accounting Standards Board ("FASB") Interpretation No. 48, Accounting for Uncertainty in Income Taxes—an Interpretation of FASB Statement No. 109 ("FIN 48") management determines whether a tax position of the Fund is more likely than not to be sustained upon examination by the applicable taxing authority, including resolution of any related appeals or litigation processes, based on the technical merits of the position. The tax benefit to be recognized is measured as the largest amount of benefit that is greater than fifty percent likely of being realized upon ultimate settlement. Management has evaluated the known implications of FIN 48 on its computation of net assets for the Fund. As a result of this evaluation, management believes that FIN 48 does not have any effect on the Fund's financial statements. However, management's conclusions regarding FIN 48 may be subject to review and adjustment at a later date based on factors including, but not limited to, further implementation guidance from the FASB, new tax laws, regulations, and administrative interpretations (including relevant court decisions). The Fund's federal tax returns for the prior three fiscal years remain subject to examination by the Internal Revenue Service. The Fund is not aware of any tax positions for which it is reasonably possible that the total amounts of unrecognized tax benefits will significantly change in the next twelve months.
4. Transactions With Affiliates
Columbia Wanger Asset Management, L.P., ("CWAM") is a wholly owned subsidiary of Columbia Management Group, LLC ("Columbia Management"), which in turn is an indirect wholly owned subsidiary of Bank of America Corporation ("BOA"). CWAM furnishes continuing investment supervision to the Fund and is responsible for the overall management of the Fund's business affairs.
Under the Fund's investment advisory agreement, management fees are accrued daily based on the Fund's average daily net assets and paid monthly to CWAM at the annual rates shown in the table below:
| Average Daily Net Assets | | Annual Fee Rate | |
| Up to $500 million | | | 0.94 | % | |
| $500 million and over | | | 0.89 | % | |
For the six months ended June 30, 2008, the Fund's annualized effective investment advisory fee rate was 0.94% of average daily net assets.
Through April 30, 2009, CWAM will reimburse the Fund to the extent that ordinary operating expenses (including custodial charges relating to overdrafts, if any), after giving effect to any balance credits from the Fund's custodian, exceed an annual percentage of 1.45% of average daily net assets. There was no reimbursement for the six months ended June 30, 2008.
CWAM provides administrative services and receives an administration fee from the Fund. Effective August 1, 2008, CWAM will provide administrative services and receive an administration fee from the Fund at the following annual rates:
Wanger Advisors Trust
Aggregate Average Daily
Net Assets of the Trust: | | Annual Fee Rate | |
| Up to $4 billion | | | 0.050 | % | |
| $4 billion to $6 billion | | | 0.040 | % | |
| $6 billion to $8 billion | | | 0.030 | % | |
| $8 billion and over | | | 0.020 | % | |
Prior to August 1, 2008, fees were accrued daily and paid monthly to CWAM at the annual rate of 0.05%. For the six months ended June 30, 2008, the Fund's annualized effective administration fee rate was 0.05% of average daily net assets.
CWAM has delegated to Columbia Management the responsibility for certain administrative services.
Certain officers and trustees of the Trust are also officers of CWAM. The Trust makes no direct payments to its officers and trustees who are affiliated with CWAM.
The Board of Trustees appointed a Chief Compliance Officer to the Fund in accordance with federal securities regulations. The Fund, along with other affiliated funds, pays its pro-rata share of the expenses associated with the Office of the Chief Compliance Officer. These expenses are disclosed separately as "Chief compliance officer expenses" in the Statement of Operations.
14
Wanger International Select 2008 Semiannual Report
Notes to Financial Statements, continued (Unaudited)
The Trust offers a deferred compensation plan for its independent trustees. Under that plan, a trustee may elect to defer all or a portion of his or her compensation. Amounts deferred are retained by the Trust and represent an unfunded obligation of the Trust. The value of amounts deferred is determined by reference to the change in value of Class Z shares of one or more series of the Columbia Acorn Trust or a money market fund as specified by the trustee. Benefits under the deferred compensation plan are payable when the trustee ceases to be a member of the Board of Trustees.
Columbia Management Distributors, Inc. (the "Distributor"), a wholly owned subsidiary of BOA, serves as the principal underwriter of the Trust and receives no compensation from the Fund for its services.
Columbia Management Services, Inc. (the "Transfer Agent"), a wholly owned subsidiary of BOA, provides shareholder services to the Fund and has subcontracted with Boston Financial Data Services ("BFDS") to serve as subtransfer agent. For such services, the Transfer Agent receives a fee, paid monthly, at the annual rate of $21.00 per open account. . The Transfer Agent also receives reimbursement for certain out-of-pocket expenses.
During the six months ended June 30, 2008, the Fund had no purchases or sales transactions with funds or other accounts that have a common investment advisor.
5. Borrowing Arrangements
The Trust participates in a $150 million credit facility, which was entered into to facilitate portfolio liquidity. Interest is charged to each participating fund based on its borrowings at a rate per annum equal to the Federal Funds rate plus 0.50%. In addition, a commitment fee of 0.08% per annum of the unutilized line of credit is accrued and apportioned among the participating funds based on their relative net assets. The commitment fee is included in "Other expenses" in the Statement of Operations. No amounts were borrowed by the Fund under this facility during the six months ended June 30, 2008.
6. Fund Share Transactions
Proceeds and payments on Fund shares as shown in the Statement of Changes in Net Assets are in respect of the following numbers of shares:
| | | Six months ended
June 30, 2008 | | Year ended
December 31, 2007 | |
| Shares sold | | | 112,020 | | | | 497,815 | | |
Shares issued in reinvestment
of dividend distributions | | | 740,912 | | | | 363,318 | | |
| Less shares redeemed | | | (570,604 | ) | | | (595,024 | ) | |
| Net increase in shares outstanding | | | 282,328 | | | | 266,109 | | |
7. Investment Transactions
The aggregate cost of purchases and proceeds from sales other than short-term obligations for the six months ended June 30, 2008 were $15,452,534 and $23,101,152, respectively.
8. Legal Proceedings
CWAM, Columbia Acorn Trust, (another mutual fund family advised by CWAM), and the trustees of Colombia Acorn Trust (collectively, the "Columbia defendants") are named as defendants in class and derivative complaints that have been consolidated in a Multi-District Action (the "MDL Action") in the federal district court of Maryland. These lawsuits contend that defendants permitted certain investors to market time their trades in certain Columbia Acorn Funds. The MDL Action is ongoing. However, all claims against Columbia Acorn Trust and the independent trustees of Columbia Acorn Trust have been dismissed.
Columbia Acorn Trust and CWAM are also defendants in a class action lawsuit that alleges, in summary, that Columbia Acorn Trust and CWAM exposed shareholders of Columbia Acorn International Fund to trading by market timers by allegedly: (a) failing to properly evaluate daily whether a significant event affecting the value of the fund's securities had occurred after foreign markets had closed but before the calculation of the funds' net asset value (NAV"); (b) failing to implement the fund's portfolio valuation and share pricing policies and procedures; and (c) failing to know and implement applicable rules and regulations concerning the calculation of NAV (the "Fair Valuation Lawsuit"). The Seventh Circuit ruled that the plaintiffs' state law claims were preempted under federal law resulting in the dismissal of plaintiffs' complaint. Plaintiffs appealed the Seventh Circuit's ruling to the United States Supreme Court. The Supreme Court reversed the Seventh Circuit's ruling on jurisdictional grounds and the case was ultimately remanded to the state court.
On March 21, 2005, a class action complaint was filed against the Columbia Acorn Trust and CWAM seeking to rescind the CDSC assessed upon redemption of Class B shares of Columbia Acorn Funds due to the alleged market timing of the Columbia Acorn Funds (the "CDSC Lawsuit"). In addition to the rescission of sales charges, plaintiffs seek recovery of actual damages, attorneys' fees and costs. The case has been transferred to the MDL Action in the federal district court of Maryland.
On September 14, 2007, the plaintiffs and the Columbia defendants named in the MDL Action, including the Columbia Funds, entered into a stipulation of settlement with respect to all Columbia-related claims in the MDL Action described above, including the CDSC and Fair Valuation Lawsuits. The settlement is subject to court approval.
CWAM, the Columbia Acorn Funds and the Trustees of the Trust are also defendants in a consolidated lawsuit filed in the federal district court of Massachusetts alleging that CWAM used Fund assets to make undisclosed payments to brokers as an incentive for the brokers to market the Funds over other mutual funds to investors. The complaint alleges CWAM and the Trustees of the Columbia Acorn Trust, along with certain affiliated entities and individuals, breached certain common law duties and federal laws.
On November 30, 2005, the judge dismissed all claims by plaintiffs and entered final judgment in favor of the defendants. The plaintiffs appealed to the United States Court of Appeals for the First Circuit on December 30, 2005. A stipulation and settlement agreement dated January 19, 2007 was filed in the First Circuit on February 14, 2007, with a joint stipulation of dismissal and motion for remand to obtain district court approval of the settlement. That joint motion was granted and the appeal was dismissed. On March 6, 2007, the case was remanded to the federal district court. The settlement, approved by the federal district court on September 18, 2007, became effective October 19, 2007. Pursuant to the settlement, the funds' advisor and/or its affiliates made certain payments, including plaintiffs' attorneys' fees and costs of notice to class members.
The Trust and CWAM intend to defend these suits vigorously.
As a result of these matters, or any adverse publicity or other developments resulting from them, there may be increased redemptions or reduced sales of Columbia Acorn fund shares, which could increase transaction costs or operating expenses, or have other adverse consequences for the Columbia Acorn funds. However, based on currently available information, the Columbia Acorn Trust believes that the likelihood that these lawsuits will have a material adverse impact on any fund is remote, and CWAM believes that the lawsuits are not likely to materially affect its ability to provide investment management services to the funds.
15
Wanger International Select 2008 Semiannual Report
Excerpt from:
Wanger Advisors Trust
Management Fee Evaluation of the Senior Officer
Prepared Pursuant to the New York Attorney General's
Assurance of Discontinuance
May 2008
16
Wanger International Select 2008 Semiannual Report
Introduction
The New York Attorney General's Assurance of Discontinuance ("Order") entered into by Columbia Management Advisors, Inc. ("CMAI") and Columbia Management Distributors, Inc., ("CMDI" and collectively with "CMAI," "CMG") in February 2005, allows CMAI to manage or advise a mutual fund only if the trustees of the fund appoint a "Senior Officer" to perform specified duties and responsibilities. One of these responsibilities includes "managing the process by which proposed management fees (including but not limited to, advisory fees) to be charged the [Funds] are negotiated so that they are negotiated in a manner which is at arms' length and reasonable and consistent with this Assurance of Discontinuance."
This is the second year that the Columbia Acorn Trust and Wanger Advisors Trust (collectively, the "Trusts") and each series thereof (the "Acorn funds," "WAT funds" or collectively, the "Funds") have been overseen by the same Board of Trustees ("Board"). The Order provides that this Board must determine the reasonableness of proposed "management fees" by using either an annual competitive bidding process supervised by the Senior Officer or Independent Fee Consultant, or by obtaining "an annual independent written evaluation prepared by or under the direction of the Senior Officer or the Independent Fee Consultant."
"Management fees" are only part of the costs and expenses paid by mutual fund shareholders. Fund expenses can vary depending upon the class of shares held but usually include: (1) investment management or advisory fees to compensate analysts and portfolio managers for stock research and portfolio management, as well as the cost of operating a trading desk; (2) administrative expenses incurred to prepare registration statements and tax returns, calculate the Funds' net asset values, maintain effective compliance procedures and perform recordkeeping services; (3) transfer agency costs for establishing accounts, accepting and disbursing funds, as well as overseeing trading in Fund shares; (4) custodial expenses incurred to hold the securities purchased by the Funds; and (5) distribution expenses, including commissions paid to brokers that sell the Fund shares to investors.
Columbia Wanger Asset Management, L.P. ("CWAM"), the advisor to the Funds, has proposed that the Trusts continue the existing separate agreements governing the first two categories listed above: an advisory agreement governing portfolio management, and an administration agreement governing certain administration and clerical services. Together the fees paid under these two agreements are referred to as "management fees." Other fund expenses are governed by separate agreements, in particular agreements with two CWAM affiliates: CMDI, the broker-dealer that underwrites and distributes the Funds' shares, and Columbia Management Services, Inc. ("CMSI"), the Funds' transfer agent. In conformity with the terms of the Order, this evaluation, therefore, addresses only the advisory and administrative contracts, and does not extend to the other agreements.
According to the Order, the Senior Officer's evaluation must consider at least the following:
(1) Management fees (including components thereof) charged to institutional and other clients of CWAM for like services;
(2) Management fees (including any components thereof) charged by other mutual fund companies for like services;
(3) Costs to CWAM and its affiliates of supplying services pursuant to the management fee agreements, excluding any intra-corporate profit;
(4) Profit margins of CWAM and its affiliates from supplying such services;
(5) Possible economies of scale as the Funds grow larger; and
(6) The nature and quality of CWAM's services, including the performance of each Fund.
In 2004, the Boards of the two Trusts, then separate groups, each appointed me Senior Officer under the Order. They also determined not to pursue a competitive bidding process and instead, charged me with the responsibility of evaluating the Funds' proposed advisory and administrative fee contracts with CWAM in conformity with the requirements of the Order. This Report is an annual evaluation required under the Order. In discharging their responsibilities, the independent Trustees have also consulted independent, outside counsel.
2007 Evaluation
This is the third annual evaluation prepared in connection with the Order. This evaluation follows the same structure as the earlier studies. Some areas are given more emphasis here, while others are given less. Still, the fundamental information gathered for this evaluation is largely the same as past years. Last year's evaluation is referred to here as the "2007 Study."
Process and Independence
The objectives of the Order are to insure the independent evaluation of the management fees paid by the Funds as well as to insure that all relevant factors are considered. In my view, this contract renewal process has been conducted at arms-length and with independence in gathering, considering and evaluating all relevant data. At the outset of the process, the Trustees sought and obtained from CWAM and CMG a comprehensive compilation of data regarding Fund performance and expenses, advisor profitability, and other information. The Board evaluated this information thoroughly. Performance and expense data was obtained from both Morningstar and Lipper, the leading consultants in this area. The rankings prepared by Morningstar and Lipper were independent and not influenced by the advisor.
In the course of its work, the Contract Committee gave careful consideration to the conclusions and recommendations contained in the 2007 Study. The Contract Committee gave particular emphasis to the issue of whether economies of scale were appropriately reflected in the Funds' fee schedules. The Board accepted and implemented several of the recommendations in this area contained in the 2007 Study.
17
Wanger International Select 2008 Semiannual Report
My evaluation of the advisory contract was shaped, as it was last year, by my experience as Chief Compliance Officer of the Trusts ("CCO"). As CCO, I report solely to the Board and have no reporting obligation to, or employment relationship with, CMG or its affiliates, except for administrative purposes. I have commented on compliance matters in evaluating the quality of service provided by CWAM.
This Report, its supporting materials and the data contained in other materials submitted to the Contract Committee of the Board, in my view, provide a thorough factual basis upon which the Board, in consultation with independent counsel as it deems appropriate, may conduct management fee negotiations that are in the best interests of the Funds' shareholders.
The Fee Reductions Mandated under the Order
Under the terms of the Order, CMG agreed to secure certain management fee reductions for the mutual funds advised by its affiliate investment advisors. In some instances, breakpoints were also established. Although neither CWAM nor the Trusts was a party to the Order, CWAM offered and the Board accepted certain advisory fee reductions during 2005. By the terms of the Order, these fees may not be increased before November 30, 2009. I have used these advisory fee levels, as modified thereafter, in this evaluation because they are the fees in the current agreements that CWAM proposes should be continued. Hence, these fee levels are the starting point of an evaluation.
Conclusions
My review of the data and other material above leads to the following conclusions with respect to the factors identified in the Order.
1. Performance. The domestic WAT Funds generally have achieved good to outstanding performance over the past five years. Wanger Select has, however, suffered a precipitous decline in ranking relative to its peers for the past year, and this trend merits the Trustees' continued attention. The international WAT Funds have relatively weaker relative long term records than do the domestic funds. All the WAT Funds, however, outperform their benchmarks, expose shareholders to less risk than competitors and achieve positive "alpha," a recognized measure of the added value of an investment manager.
2. Management Fees relative to Peers. Management fees vary by WAT Fund, but, in general, the WAT Funds impose higher fees than competing funds. Wanger Select and Wanger USA in particular were ranked by both Lipper and Morningstar at or below the median, and therefore impose higher fees than do the majority of their competitors.
3. Administrative Fees. The WAT Funds' administrative fees appear competitive in relation to their peers, and CWAM provides excellent administrative support for all the WAT Funds. There are clear advantages to retaining the advisor and its affiliates to perform these services. However, while economies of scale exist above current asset levels, the WAT Funds' administrative fee schedule provides no breakpoints.
4. Management Fees relative to Institutional and Other Mutual Fund Accounts. CWAM's focus is on its mutual funds. It does not actively seek to manage separate or institutional accounts. The few institutional accounts it does manage vary in rate structures. Some pay advisory fees commensurate with or higher than the WAT Funds. In a few instances, however, institutional accounts pay lower advisory fees than do the WAT Funds. One particular institutional account is significant in size and has been under CWAM's management for over 25 years.
5. Costs to CWAM and its Affiliates. CWAM's direct costs do not appear excessive. Overhead and indirect costs allocated to CWAM by its parent organizations, however, are significant and have increased dramatically in the past year. CWAM's affiliates report operating losses and therefore do not appear to enjoy excessive "fall out" benefits from CWAM's advisory agreement with the WAT Funds.
6. Profit Margins. CWAM's pre-marketing expense profit margins are at the top of the industry, though these comparisons are hampered by limited industry data. High profit margins are not unexpected for firms that manage large, successful funds and have provided outstanding investment performance for investors.
7. Economies of Scale. Economies of scale do exist at CWAM and will expand as the assets of the WAT Funds get larger. The Board has recently imposed additional breakpoints for some of the WAT Funds that will result in greater sharing of economies of scale.
8. Nature and Quality of Services. This category includes a variety of considerations that are difficult to quantify, yet can have a significant bearing on the performance of the Funds. Several areas merit comment.
a. Capacity. The WAT Funds have continued to grow, posing ever greater challenges in deploying assets effectively. While trends here merit continued monitoring, CWAM appears to be managing assets effectively.
b. Compliance. CWAM has a reasonably designed compliance program that protects shareholders.
9. Process. In my opinion, the process of negotiating an advisory contract for the WAT Funds has been conducted thoroughly and at arms' length. Further, the Trustees have sufficient information to evaluate management's proposal, and negotiate contract terms that are in the best interests of Fund shareholders.
18
Wanger International Select 2008 Semiannual Report
Recommendations
I believe the Trustees should:
1. Consider the addition of breakpoints to the WAT administrative fee contract to reflect the economies of scale present in performing these services, and, in fashioning those breakpoints, to consider the efficiencies achieved by CWAM by supporting both Trusts with the same staff performing largely identical tasks.
2. Focus their review on the WAT Funds' management fee levels in relation to their peers, in particular the fees paid by Wanger USA and Wanger Select.
3. Monitor Wanger Select to ensure that its long term performance is sustained.
Robert P. Scales
May 27, 2008
19
Wanger International Select 2008 Semiannual Report

Columbia Wanger Funds
Trustees
Robert E. Nason
Chairman of the Board
Allan B. Muchin
Vice Chairman of the Board
Laura M. Born
Michelle L. Collins
Maureen M. Culhane
Margaret M. Eisen
Jerome Kahn, Jr.
Steven N. Kaplan
David C. Kleinman
Charles P. McQuaid
James A. Star
Ralph Wanger
John A. Wing
Officers
Charles P. McQuaid
President
Ben Andrews
Vice President
Michael G. Clarke
Assistant Treasurer
Jeffrey R. Coleman
Assistant Treasurer
J. Kevin Connaughton
Assistant Treasurer
P. Zachary Egan
Vice President
Peter T. Fariel
Assistant Secretary
John M. Kunka
Assistant Treasurer
Joseph C. LaPalm
Vice President
Bruce H. Lauer
Vice President, Secretary and Treasurer
Louis J. Mendes III
Vice President
Robert A. Mohn
Vice President
Christopher J. Olson
Vice President
Robert P. Scales
Chief Compliance Officer, Chief Legal Officer, Senior Vice President and General Counsel
Linda K. Roth-Wiszowaty
Assistant Secretary
Transfer Agent,
Dividend Disbursing Agent
Columbia Management Services, Inc.
P.O.Box 8081
Boston, Massachusetts
02266-8081
Distributor
Columbia Management Distributors, Inc.
One Financial Center
Boston, Massachusetts
02111-2621
Investment Advisor
Columbia Wanger Asset Management, L.P.
227 West Monroe Street, Suite 3000
Chicago, Illinois 60606
1-888-4-WANGER
(1-888-492-6437)
Legal Counsel
Bell, Boyd & Lloyd LLP
Chicago, Illinois
Independent Registered Public Accounting Firm
PricewaterhouseCoopers LLP
Chicago, Illinois
This report, including the schedules of investments and financial statements, is submitted for the general information of the shareholders of the Wanger Advisors Trust.
A description of the Fund's proxy voting policies and procedures and a copy of the Fund's voting record for the most recent 12-month period ended June 30 are available (i) on the Securities and Exchange Commission's website at www.sec.gov, and (ii) without charge, upon request, by calling 888-492-6437.
The Fund files a complete schedule of portfolio holdings with the SEC for the first and third quarters of each fiscal year on Form N-Q. The Fund's Form N-Q is available on the SEC's website at www.sec.gov and may be reviewed and copied at the SEC's Public Reference Room in Washington, D.C. Information on the operation of the Pubic Reference Room may be obtained by calling 800-SEC-0330.
20
Columbia Wanger Funds
0L2568S
SHC-44/155063-0608 08/55096
Wanger International
(formerly Wanger International Small Cap)
2008 Semiannual Report

| NOT FDIC INSURED | | May Lose Value | |
|
| NOT BANK ISSUED | | No Bank Guarantee | |
|

Wanger International
2008 Semiannual Report
Table of Contents
| | 1 | | | Understanding Your Expenses | |
|
| | 2 | | | Perceptions of Risk | |
|
| | 4 | | | Performance Review | |
|
| | 6 | | | Statement of Investments | |
|
| | 14 | | | Statement of Assets and Liabilities | |
|
| | 14 | | | Statement of Operations | |
|
| | 15 | | | Statement of Changes in Net Assets | |
|
| | 16 | | | Financial Highlights | |
|
| | 17 | | | Notes to Financial Statements | |
|
| | 20 | | | Management Fee Evaluation of the Senior Officer | |
|
Columbia Wanger Asset Management, L.P. ("CWAM") is one of the leading global small- and mid-cap equity managers in the United States with more than 37 years of small- and mid-cap investment experience. As of June 30, 2008, CWAM manages $32.2 billion in assets and is the investment advisor to Wanger USA, Wanger International, Wanger Select, Wanger International Select (together, the "Wanger Advisors Trust Funds") and the Columbia Acorn Family of Funds. Columbia Management Group, LLC ("Columbia Management") is the investment management division of Bank of America Corporation. Columbia Management entities furnish investment management services and products for institutional and individual investors. The Wanger Advisors Trust Funds and the Columbia Acorn Family of Funds (together with other funds advised by Columbia Management affiliates, the "Columbia Funds") are distributed by Columbia Management Distributors, Inc., member of FINRA, SIPC, part of Columbia Management and an affiliate of Bank of America Corporation. CWAM is an SEC-registered investment advisor and indirect, wholly owned subsidiary of Bank of America Corporation. CWAM is part of Columbia Management.
Please consider the investment objectives, risks, charges and expenses for the Fund carefully before investing. Contact 1-888-4-WANGER for a prospectus, which contains this and other important information about the Fund. You should read it carefully before you invest.
The views expressed in "Perceptions of Risk" and in the Performance Review reflect the current views of the respective parties. These views are not guarantees of future performance and involve certain risks, uncertainties and assumptions that are difficult to predict so actual outcomes and results may differ significantly from the views expressed. These views are subject to change at any time based upon economic, market or other conditions and the respective parties disclaim any responsibility to update such views. These views may not be relied on as investment advice and, because investment decisions for a Columbia Fund are based on numerous factors, may not be relied on as an indication of trading intent on behalf of any particular Columbia Fund. References to specific company securities should not be construed as a recommendation or investment advice.
Wanger International 2008 Semiannual Report
Understanding Your Expenses
As a Fund shareholder, you incur two types of costs. There are transaction costs, which generally include sales charges on purchases and may include redemption or exchange fees. There are also ongoing costs, which generally include investment advisory fees and other Fund expenses. The information on this page is intended to help you understand your ongoing costs of investing in the Fund and to compare these costs with the ongoing costs of investing in other mutual funds.
Analyzing your Fund's expenses
To illustrate these ongoing costs, we have provided an example and calculated the expenses paid by investors in the Fund during the period. The information in the following table is based on an initial, hypothetical investment of $1,000, which is invested at the beginning of the period and held for the entire period. Expense information is calculated two ways and each method provides you with different information. The amount listed in the "Actual" column is calculated using actual operating expenses and total return for the Fund. The amount listed in the "Hypothetical" column assumes that the return each year is 5% before expenses and then applies the Fund's actual expense ratio for the period to the hypothetical return. You should not use the hypothetical account values and expenses to estimate either your actual account balance at the end of the period or the expenses you paid during the period. See the "Compare with other fu nds" information for details on using the hypothetical data.
Estimating your actual expenses
To estimate the expenses that you actually paid over the period, first you will need your account balance at the end of the period.
1. Divide your ending account balance by $1,000. For example, if an account balance was $8,600 at the end of the period, the result would be 8.6.
2. In the section of the table below titled "Expenses paid during the period," you will find a dollar amount in the column labeled "Actual." Multiply this amount by the result from step 1. Your answer is an estimate of the expenses you paid on your account during the period.
January 1, 2008 – June 30, 2008
| | | Account value at the
beginning of the period ($) | | Account value at the
end of the period ($) | | Expenses paid during
period ($) | | Fund's annualized
expense ratio (%)* | |
| | | Actual | | Hypothetical | | Actual | | Hypothetical | | Actual | | Hypothetical | | Actual | |
| Wanger International | | | 1,000.00 | | | | 1,000.00 | | | | 906.61 | | | | 1,019.99 | | | | 4.65 | | | | 4.92 | | | | 0.98 | | |
*For the six months ended June 30, 2008.
Expenses paid during the period are equal to the Fund's annualized expense ratio, multiplied by the average account value over the period, then multiplied by the number of days in the Fund's most recent fiscal half-year and divided by 366.
It is important to note that the expense amounts shown in the table are meant to highlight only ongoing costs of investing in the Fund. Expenses paid during the period do not include any insurance charges imposed by your insurance company's separate account. The hypothetical example provided is useful in comparing ongoing costs only and will not help you determine the relative total costs of owning different funds whose shareholders may incur transaction costs.
Compare with other funds
Since all mutual funds are required to include the same hypothetical calculations about expenses in shareholder reports, you can use this information to compare the ongoing cost of investing in the Fund with other funds. To do so, compare the 5% hypothetical example with the 5% hypothetical examples of other funds. As you compare hypothetical examples of other funds, it is important to note that hypothetical examples are meant to highlight the ongoing cost of investing in a fund and do not reflect any transaction costs, such as sales charges, redemption fees or exchange fees that may be incurred by shareholders of other funds. Expenses paid during the period do not include any insurance charges imposed by your insurance company's separate accounts.
1
Wanger International 2008 Semiannual Report

Perceptions of Risk
Most people tend to calibrate risk poorly. We overestimate the likelihood of being harmed by the things that make the evening news and underestimate those that don't. In a survey, people estimated that the chance of death by accident matched the chance of death by disease. In fact, disease causes 17-times more deaths than accidents.1
Dan Gardner's, Risk, The Science and Politics of Fear,2 explains why our views and actions are often so distorted. It seems our perceptions are most influenced by preconceived notions, reinforced by recent information. Accidents are newsworthy, as are catastrophes. If fatalities occur in large numbers in a single event—instead of in small numbers dispersed over time—our perception of risk rises.3
Besides catastrophes, it won't shock too many parents to learn that we tend to worry a lot about our children. Other things that we can't control, like airplane flights, can be worrisome, while things that we can control, such as automobiles, evoke less fear despite higher risks. Things that we don't understand such as trace chemicals,4 and other man-made risks like nuclear power, are also feared. Many people worry about radiation from cell phones, while ignoring the real hazard of driving while using cell phones. Many non-headline risks caused by nature, such as radon gas, which kills an estimated 41,000 people a year in the U.S. and Europe,5 tend to be downplayed.
Gardner notes that we are living longer in the safest era ever known to mankind. Horrible diseases like smallpox have been eliminated while others have been drastically curtailed. Childhood mortality has especially plunged and accident rates are also down.
Fear Mongering Profiteers
So who is putting the scary thoughts into our heads? The media is an obvious culprit because sensational stories sell newspapers and increase viewership. Companies trying to sell certain health care products or security services and devices also find fear mongering to be profitable. The number of companies lobbying homeland security officials rose from 15 in 2001 to 861 in 2004 as fears of terrorist attacks swelled.6 Trial lawyers reaping the rewards of questionable lawsuits, politicians pandering for votes and special interest groups seeking funding also try to keep people scared.
Fear can end up increasing risks. People need to remember the classic definition of risk: probability times consequences. Avoiding immunizations or weight loss treatments due to possible side effects can be ill advised. Diabetes, a disease linked to obesity, has been diagnosed in 24 million Americans. That's eight percent of the total population.7
The American Council on Science and Health is dedicated to separating real health risks from unfounded health scares, tracking health scares reported by the press and debunking them. Among the top scares in 2007 were allegations that lipstick, fluoridated water, roses and water bottles are hazardous. Among the top scares of all time were cranberries (1959), DDT (1962), cyclamates (1969), Alar (1989), cellular phone radiation (1993) and trace PCBs in farmed salmon (2003).8 Fumes from new shower curtains may make the list this year!
Rational Understanding of Risk
Peter L. Bernstein's, Against The Gods, The Remarkable Story of Risk,9 is a fascinating review of mankind's history of approaching risk, and how to understand, measure and deal with it. He reviews the advances in probability theory, which enabled the creation of insurance and, in turn, facilitated trade and investment. He states that managing risks depends on the use of three assumptions originated by Jacob Bernoulli around the year 1700: full information, independent trials and relevance of quantitative valuation.
Bernstein explores additional progress in risk management, particularly in investing. Diversification may reduce risk. However, some quantitative techniques for investing have failed. "Portfolio insurance," a quantitative approach to reduce equity holdings in market declines via the purchase of put options, intensified the market collapse of 1987. Subsequent to the book's publication, numerous quant managers have claimed that "six sigma" events (one in a million chance of occurring) caused huge losses in their funds. These failures occurred because the investment models violated Bernoulli's "independent trials" assumption stated above. Stock price movements may look independent, until numerous people attempt the same strategies or until human emotions result in lots of investors reacting in similar manners.
Stock Market Risks
Sentiment in the stock market seems to gyrate between greed and fear, creating bull and bear markets. Because the S&P 500 Index has fallen more than 20% from its peak, a bear market has been proclaimed. This suggests that the market is currently focusing on fear.
I recall a long-ago brokerage firm ad listing people's fears each year for decades. The list likely included events like the Cuban Missile Crisis and Three Mile Island. It noted that there seemed to be a reason to avoid investing in stocks each year. But starting with $1,000 50 years ago, an investment in the S&P 500 would have resulted in $140,364 as of June 30, 2008, vs. $13,619 if invested in super safe treasury bills. Meanwhile, inflation would require $7,535 to buy in 2008 what $1,000 bought in 1958.10 This example suggests that staying out of stocks would have been a very bad decision.
Market strategist Steve Leuthold provides lots of data and perspectives. Based on his estimate of "operating" (recurring) earnings, the S&P 500 at its July 11, 2008, close of 1,239 was selling at about 14.5-times earnings.
2
Wanger International 2008 Semiannual Report
That multiple matched the depths of the 2002-2003 bear market and was below the market's average price-earnings (PE) ratio11 of 16.5-times, calculated since 1926. Leuthold notes that market price-earnings ratios vary a lot, and that inflation is a major driver of PE ratios. When inflation has varied between zero and 5%, PE ratios averaged 18- to 19-times. When inflation has been between 5% and 7%, PE ratios averaged 13.8-times, and when inflation was 7% or more, PE ratios averaged 11.4-times.12
Inflation has been boosted by fuel and food prices, and the Consumer Price Index recently spiked up to a 5% year-over-year gain. Some are concerned that we may be returning to a period of big government and stagflation. Future inflation is indeed unpredictable, but continued surges in fuel and food prices from current lofty levels seem unlikely. Low unit labor cost increases, continued globalization and the continued success of capitalism all suggest that inflation may slow. If inflation does slow, Leuthold's data suggests that PE ratios and stock prices can rise a lot.
We are stock pickers rather than economists, and we are now seeing what we believe to be many more excellent investment opportunities than we've seen for several years. Consequently, focusing on fear seems like a mistake and taking a longer term perspective seems to be more rational.


Charles P. McQuaid
President and Chief Investment Officer
Columbia Wanger Asset Management, L.P.
The information and data provided in this analysis are derived from sources that we deem to be reliable and accurate. These views are not guarantees of future performance and involve certain risks, uncertainties and assumptions that are difficult to predict so actual outcomes and results may differ significantly from the views expressed. The views/opinions expressed in this essay are those of the author and not of the Columbia Wanger Advisors Trust Board, are subject to change at any time based upon economic, market or other conditions, may differ from views expressed by other Columbia Management associates or other divisions of Bank of America and the respective parties disclaim any responsibility to update such views. These views may not be relied on as investment advice and, because investment decisions for a Columbia Wanger Fund are based on numerous factors, may not be relied on as an indication of trading intent on beha lf of any particular Columbia Wanger Fund.
1 Gardner, Dan, Risk, the Science and Politics of Fear, (Virgin Book Ltd, 2008), pg. 13.
2 In addition to Gardner's book on the subject of risk, I also recommend Panicology written by statisticians Simon Briscoe and Hugh Aldersey-Williams (Viking/Penguin Books, 2008).
3 Gardner, Dan, op. cit., pgs. 62-76.
4 Gardner notes that our ability to find trace chemicals has never been better. Today we have the technology to dissect the components of drinking water, for example, to the level of one part per billion—equivalent to a single grain of sugar in an Olympic-size swimming pool. While it's true that the elements in trace chemicals can cause cancer, science and testing almost never look at such trace amounts.
5 Gardner, Dan, op. cit., pg. 81.
6 Ibid, pg. 281.
7 Source: American Council on Science and Health, "ACSH Morning Dispatch," June 25, 2008.
8 The study titled, "Fact Versus Fears (Fourth Edition)" is available on the American Council on Science and Health website at www.acsh.org.
9 Bernstein, Peter L., Against the Gods, The Remarkable Story of Risk, (John Wiley & Sons, Inc., 1996).
10 Figures include the reinvestment of dividends and are pretax.
11 The price-earnings (PE) ratio reflects the price of a stock divided by earnings per share. This ratio gives investors an idea of how much they are paying for a company's earning power. In general, the higher the PE, the more investors are paying, and therefore the more earnings growth they are expecting.
12 Leuthold Weeden Institutional Research, "Perception For The Professional," August 2008, Vol. 28 No. 8.
3
Wanger International 2008 Semiannual Report

Performance Review Wanger International*
 | |  | |
|
Louis J. Mendes III
Co-Portfolio Manager | | Christopher J. Olson
Co-Portfolio Manager | |
|
Performance data quoted represents past performance and current performance may be lower or higher. Past performance is no guarantee of future results. The investment return and principal value of an investment in the Fund will fluctuate so that shares, when redeemed, may be worth more or less than the original cost. Performance may reflect any voluntary waivers or reimbursements of fund expenses by the advisor or its affiliates. Absent these waivers, or reimbursement arrangements, performance results may be lower. For daily and month-end performance updates, please call 1-888-4-WANGER.
Wanger International fell 9.34% in first half of 2008, holding up somewhat better than the 11.68% drop of the Fund's new primary benchmark, the S&P/Citigroup Global ex-US Cap Range $500M-$5B Index.† The Fund also outperformed the large-cap MSCI EAFE Index, which fell 10.96% in the half.
Wanger International has maintained a modest overweight in energy-related stocks for several years, with an emphasis on service companies that provide equipment and technology to the major oil companies. Many of these service providers have enjoyed strong volume growth and pricing power as exploration, drilling and pipeline projects have proliferated and grown more complex amidst higher energy prices. Atwood Oceanics, FMC Technologies, Expro International Group and Fugro have been beneficiaries of this growth, posting gains ranging from 14% to 54% in the half. Expro was acquired by a private equity fund shortly before the close of the period.
Basic materials stocks generated a modest positive return for the Fund. Sociedad Quimica y Minera de Chile was up 139% for the half as fertilizer prices nearly tripled over the last year. Impala Platinum Holdings and Randgold Resources gained 16% and 24%, respectively, as inflation fears boosted prices of precious metals.
Taiwan's Formosa International Hotels, a manager of local hotels that is expanding into China, rose 115% in the first half of the year. Recent political elections have given hope that more openness with China will stimulate Chinese tourism and investment on the island. Similarly, President Chain Store, the local 7-11 franchise operator in Taiwan, gained 33%.
Early last year, Wanger International reduced exposure to financial services stocks, particularly in the United Kingdom. The Fund's remaining financial holdings were dominated by a handful of publicly traded stock exchanges and particularly by exchanges in Asia and Latin America experiencing high trading and new listing activity. After posting generally great returns last year, these trading platform businesses suffered a sharp sell-off in the half as investors soured on emerging markets. Hong Kong Exchanges and Clearing and the Singapore Exchange declined 46% and 44%, respectively. Outside the financials sector, Ibiden, a Japanese manufacturer of electronic parts and ceramics, fell 47% in the half due to production issues and weaker demand for its semiconductor packaging.
The potential sources of anxiety in global markets are many. High input prices are stressing profitability in some areas. While this sort of disruption can represent a threat, it can also open up spaces for agile companies to gain traction with products and services better suited to the changed operating environment, as the energy service companies described above have done. It is on these sorts of situations that we, as longer-term investors, focus our research efforts. We are also somewhat encouraged by valuations, which in many cases appear to reflect overly pessimistic scenarios.
*Effective June 1, 2008, Wanger International Small Cap was renamed Wanger International.
†The Fund changed its primary benchmark effective January 1, 2008, because the advisor believes the S&P/Citigroup Global ex-US Cap Range $500M-$5B Index is more consistent with the market capitalization range of the companies in which the Fund invests.
International investments involve greater potential risks, including less or different regulation, currency fluctuations, economic instability and political developments. Investments in small- and mid-cap companies may be subject to greater volatility and price fluctuations because they may be thinly traded and less liquid. Investing in emerging markets may involve great risks than investing in more developed countries.
Fund's Positions in Mentioned Holdings
As a percentage of net assets, as of 6/30/08
| Fugro | | | 2.6 | % | |
| Atwood Oceanics | | | 1.6 | | |
| Sociedad Quimica y Minera de Chile | | | 1.4 | | |
| Impala Platinum Holdings | | | 1.3 | | |
| Singapore Exchange | | | 1.0 | | |
| Hong Kong Exchanges and Clearing | | | 0.8 | | |
| Formosa International Hotels | | | 0.7 | | |
| Randgold Resources | | | 0.7 | | |
| FMC Technologies | | | 0.7 | | |
| Ibiden | | | 0.6 | | |
| President Chain Store | | | 0.4 | | |
| Expro International Group | | | 0.2 | | |
Portfolio holdings are subject to change periodically and may not be representative of current holdings.
4
Wanger International 2008 Semiannual Report
Growth of a $10,000 Investment in
Wanger International
Total return for each period,
May 3, 1995 (inception date) through June 30, 2008
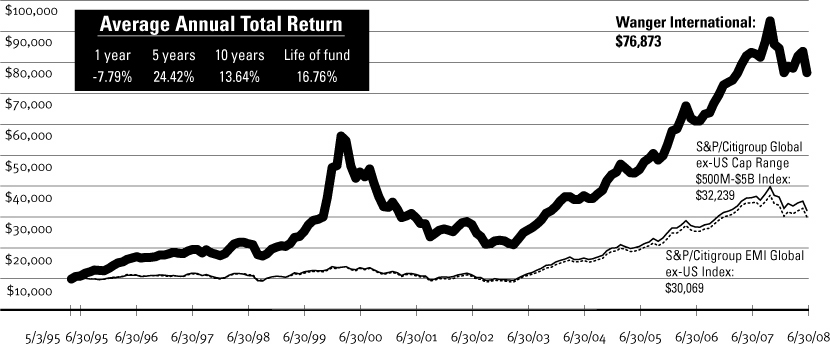
This graph compares the results of $10,000 invested in Wanger International on May 3, 1995 (the date the Fund began operations) through June 30, 2008, to the S&P/Citigroup Global ex-US Cap Range $500M-$5B Index and the S&P/Citigroup EMI Global ex-US Index, with dividends and capital gains reinvested. Performance shown here is past performance, which cannot guarantee future results. Current performance may be higher or lower. The investment return and principal value of an investment in the Fund will fluctuate so that Fund shares, when redeemed, may be worth more or less than their original cost. Performance changes over time. Current returns for the Fund may be different than that shown. For daily and most recent month-end performance updates, please contact us at 1-888-4-WANGER.
Results to June 30, 2008
| | | 2nd quarter | | Year to date | | 1 year | |
| Wanger International | | | -1.82 | % | | | -9.34 | % | | | -7.79 | % | |
S&P/Citigroup Global ex-US
Cap Range $500M-$5B Index† | | | -4.05 | | | | -11.68 | | | | -11.29 | | |
S&P/Citigroup EMI
Global ex-US Index | | | -3.31 | | | | -11.16 | | | | -13.08 | | |
| MSCI EAFE Index | | | -2.25 | | | | -10.96 | | | | -10.61 | | |
NAV as of 6/30/08: $34.48
Performance numbers reflect all Fund expenses but do not include any insurance charge imposed by your insurance company's separate accounts. If performance included the effect of these additional charges, it would be lower.
The Fund's annual operating expense ratio is 0.98%. The annual operating expense ratio is as stated in the Fund's prospectus that is current as of the date of this report. Differences in expense ratios disclosed elsewhere in this report may result from including fee waivers and reimbursements as well as different time periods used in calculating the ratios.
All results shown assume reinvestment of distributions and do not reflect taxes that a shareholder would pay on Fund distributions or the sale of Fund shares.
†The Fund changed its primary benchmark effective January 1, 2008, because the advisor believes the S&P/Citigroup Global ex-US Cap Range $500M-$5B Index is more consistent with the market capitalization range of the companies in which the Fund invests.
The S&P/Citigroup Global ex-US Cap Range $500M-$5B Index is a subset of the broad market selected by the index sponsor representing the mid- and small-cap developed and emerging markets, excluding the United States. The S&P/Citigroup EMI Global ex-US Index is an unmanaged index consisting of the bottom 20% of institutionally investable capital of developed and emerging countries, outside the United States. The Morgan Stanley Capital International Europe, Australia, Far East (MSCI EAFE) Index is a capitalization-weighted index that tracks the total return of common stocks in 21 developed-market countries within Europe, Australia and the Far East. Indexes are not managed and do not incur fees or expenses. It is not possible to invest directly in an index.
Portfolio characteristics and holdings are subject to change periodically and may not be representative of current characteristics and holdings.
Top 5 Countries
As a percentage of net assets, as of 6/30/08
| Japan | | | 16.1 | % | |
| Netherlands | | | 8.7 | | |
| United Kingdom | | | 7.6 | | |
| France | | | 6.0 | | |
| Germany | | | 5.7 | | |
Top 10 Holdings
As a percentage of net assets, as of 6/30/08
1. Fugro (Netherlands)
Oilfield Services | | | 2.6 | % | |
2. Suzano (Brazil)
Brazilian Pulp & Paper Producer | | | 1.9 | | |
3. Atwood Oceanics (United States)
Offshore Drilling Contractor | | | 1.6 | | |
4. ShawCor (Canada)
Oil & Gas Pipeline Products | | | 1.5 | | |
5. Sociedad Quimica y Minera de Chile (Chile)
Producer of Specialty Fertilizers, Lithium & Iodine | | | 1.4 | | |
6. Impala Platinum Holdings (South Africa)
Platinum Group Metals Mining & Refining | | | 1.3 | | |
7. Hexagon (Sweden)
Measurement Equipment & Polymers | | | 1.3 | | |
8. SWECO (Sweden)
Engineering Consultants | | | 1.2 | | |
9. Kansai Paint (Japan)
Paint Producer in Japan, India, China & Southeast Asia | | | 1.1 | | |
10. Intralot (Greece)
Lottery & Gaming Systems & Services | | | 1.1 | | |
5
Wanger International 2008 Semiannual Report
Wanger International
Statement of Investments (Unaudited) June 30, 2008
Number of
Shares | | | | Value | |
| | | Common Stocks – 96.7% | |
| | | Europe – 45.2% | |
| | | Netherlands – 8.7% | |
| | 457,866 | | | Fugro
Oilfield Services | | $ | 39,108,153 | | |
| | 603,000 | | | Imtech
Engineering & Technical Services | | | 14,174,452 | | |
| | 361,666 | | | Koninklijke TenCate
Advanced Textiles & Industrial Fabrics | | | 12,908,874
| | |
| | 622,600 | | | Aalberts Industries
Flow Control & Heat Treatment | | | 11,763,039 | | |
| | 117,095 | | | Smit Internationale
Harbor & Offshore Towage & Marine Services | | | 11,430,342
| | |
| | 410,000 | | | Unit 4 Agresso
Business & Security Software | | | 10,276,757 | | |
| | 125,000 | | | Vopak
World's Largest Operator of Petroleum &
Chemical Storage Terminals | | | 8,472,515 | | |
| | 311,000 | | | Arcadis
Engineering Consultant | | | 7,051,022 | | |
| | 153,658 | | | SBM Offshore
Builds & Leases Offshore Vessels to
Process & Store Crude Oil | | | 5,670,769 | | |
| | 250,000 | | | QIAGEN (a)
Life Science Company; DNA/RNA Purification | | | 5,061,860 | | |
| | 435,606 | | | Wavin
Largest European Plastic Pipe Systems Company | | | 3,607,520 | | |
| | | | 129,525,303 | | |
| | | United Kingdom – 7.6% | |
| | 650,000 | | | Intertek Testing
Testing, Inspection & Certification Services | | | 12,791,657 | | |
| | 2,300,000 | | | Charles Taylor (b)
Insurance Services | | | 11,086,634
| | |
| | 215,000 | | | Randgold Resources – ADR
Gold Mining in Western Africa | | | 9,928,700
| | |
| | 895,000 | | | Smith & Nephew
Medical Equipment & Supplies | | | 9,876,187
| | |
| | 1,200,000 | | | Informa Group
Global Publisher & Event Organizer | | | 9,871,605
| | |
| | 1,290,100 | | | RPS Group
Environmental Consulting & Planning | | | 7,696,206
| | |
| | 345,000 | | | Rotork
Valve Actuators for Oil & Water Pipelines | | | 7,538,453
| | |
Number of
Shares | | | | Value | |
| | 1,035,000 | | | Northgate
Light Commercial Vehicle Rental Specialist | | $ | 7,277,321 | | |
| | 500,000 | | | Capita Group
White Collar, Back Office Outsourcing | | | 6,846,982 | | |
| | 2,000,000 | | | Begbies Traynor
Financial Restructuring & Corporate Recovery Services | | | 6,353,999 | | |
| | 1,100,000 | | | Detica
UK IT Services Company | | | 5,811,718 | | |
| | 987,000 | | | Taylor Nelson Sofres
Market Research | | | 4,565,931 | | |
| | 230,000 | | | Tullow Oil
Oil & Gas Producer | | | 4,375,097 | | |
| | 109,000 | | | Expro International Group
Offshore Oilfield Services | | | 3,471,614
| | |
| | 270,000 | | | Keller Group
International Ground Engineering Specialist | | | 3,361,246
| | |
| | 90,405 | | | Intermediate Capital
European Provider of Mezzanine Capital | | | 2,443,593
| | |
| | | | 113,296,943 | | |
| | | France – 6.0% | |
| | 559,400 | | | SES Global
Satellite Broadcasting Services | | | 14,180,042
| | |
| | 113,000 | | | Rubis
Tank Storage & Liquefied Petroleum Gas Supplier | | | 9,785,213
| | |
| | 90,000 | | | Norbert Dentressangle
Transport | | | 8,466,611
| | |
| | 80,000 | | | Neopost
Postage Meter Machines | | | 8,465,509
| | |
| | 135,200 | | | Carbone Lorraine
Advanced Industrial Materials | | | 7,452,431
| | |
| | 70,000 | | | Iliad
Alternative Internet & Telecoms Provider | | | 6,804,463
| | |
| | 100,700 | | | April Group
Insurance Policy Construction | | | 5,896,371
| | |
| | 72,000 | | | Imerys
Industrial Minerals Producer | | | 5,215,716
| | |
| | 30,000 | | | Ciments Francais
Leading French & Emerging Markets Cement Producer | | | 4,916,538
| | |
| | 46,000 | | | Pierre & Vacances
Vacation Apartment Lets | | | 4,732,233
| | |
See accompanying notes to financial statements.
6
Wanger International 2008 Semiannual Report
Wanger International
Statement of Investments (Unaudited) June 30, 2008
Number of
Shares | | | | Value | |
| | | France – 6.0% (cont) | |
| | 192,100 | | | Trigano
Leisure Vehicles & Camping Equipment | | $ | 4,258,525 | | |
| | 41,000 | | | Eurofins Scientific
Food Screening & Testing | | | 3,453,558
| | |
| | 120,000 | | | Meetic (a)
Dating Services | | | 2,792,446
| | |
| | 330,000 | | | Hi-Media (a)
Leading Online Advertiser in Europe | | | 2,244,537
| | |
| | | | | | | | 88,664,193 | | |
| | | Germany – 5.7% | |
| | 400,000 | | | Rhoen-Klinikum
Health Care Services | | | 12,702,671
| | |
| | 85,000 | | | Vossloh
Rail Infrastructure & Diesel Locomotives | | | 11,080,987
| | |
| | 155,000 | | | Wincor Nixdorf
Retail POS Systems & ATM Machines | | | 10,791,445
| | |
| | 50,000 | | | Rational
Commercial Oven Manufacturer | | | 10,084,359
| | |
| | 101,000 | | | Elringklinger
Automobile Components | | | 9,571,387
| | |
| | 235,000 | | | CTS Eventim
Event Ticket Sales | | | 9,416,398
| | |
| | 114,000 | | | MPC Muechmeyer Petersen Capital
Alternative Asset Manager | | | 6,003,854
| | |
| | 205,000 | | | Deutsche Beteiligungs
Private Equity Investment Management | | | 5,183,565
| | |
| | 60,000 | | | Hamburger Hafen und Logistik
Terminal Operator at the Hamburg Port | | | 4,666,673
| | |
| | 255,000 | | | Takkt
Mail Order Retailer of Office & Warehouse Durables | | | 4,492,618
| | |
| | | | | | | | 83,993,957 | | |
| | | Sweden – 3.3% | |
| | 1,015,500 | | | Hexagon
Measurement Equipment & Polymers | | | 18,548,099
| | |
| | 1,974,000 | | | SWECO
Engineering Consultants | | | 17,372,000
| | |
| | 2,530,000 | | | Niscayah
Commercial Security Installation & Service | | | 5,503,242
| | |
Number of
Shares | | | | Value | |
| | 160,000 | | | Holmen
Integrated Pulp & Paper Manufacturer | | $ | 4,702,405 | | |
| | 307,185 | | | Hexpol (a)
Formulation & Production of Polymers | | | 2,563,084 | | |
| | | | | | | | 48,688,830 | | |
| | | Switzerland – 3.2% | |
| | 146,000 | | | Kuehne & Nagel
Freight Forwarding/Logistics | | | 13,870,393
| | |
| | 74,000 | | | Geberit
Plumbing Supplies | | | 10,902,061
| | |
| | 6,600 | | | Sika
Chemicals for Construction & Industrial Applications | | | 10,388,919
| | |
| | 27,000 | | | Burckhardt Compression
Gas Compression Pumps | | | 8,193,432
| | |
| | 4,900 | | | Givaudan
Fragrances & Flavors | | | 4,379,325
| | |
| | | | | | | | 47,734,130 | | |
| | | Finland – 2.2% | |
| | 488,000 | | | Poyry
Engineering Consultants | | | 12,677,480
| | |
| | 255,000 | | | Stockmann
Department Stores in Finland, Baltics & Russia | | | 9,856,457
| | |
| | 140,000 | | | Cargotec
Cargo & Load Handling Equipment | | | 4,873,556
| | |
| | 450,000 | | | Ramirent
Largest Equipment Rental Company in
Scandinavia & Central Eastern Europe | | | 4,690,290
| | |
| | | | | | | | 32,097,783 | | |
| | | Ireland – 2.1% | |
| | 500,000 | | | IAWS Group
Baked Goods | | | 12,516,886
| | |
| | 2,233,400 | | | United Drug
Irish Pharmaceutical Wholesaler & Outsourcer | | | 12,412,818
| | |
| | 190,400 | | | Paddy Power
Irish Betting Services | | | 5,995,510
| | |
| | | | | | | | 30,925,214 | | |
See accompanying notes to financial statements.
7
Wanger International 2008 Semiannual Report
Wanger International
Statement of Investments (Unaudited) June 30, 2008
Number of
Shares | | | | Value | |
| | | Italy – 1.2% | |
| | 2,742,000 | | | CIR
Italian Holding Company | | $ | 7,576,589 | | |
| | 573,000 | | | GranitiFiandre
Innovative Stoneware | | | 6,337,677 | | |
| | 1,100,000 | | | Amplifon
Hearing Aid Retailer | | | 3,013,500 | | |
| | 170,000 | | | Cobra Automotive (a)
Electronic Car Theft Protection | | | 1,252,633
| | |
| | | | | | | | 18,180,399 | | |
| | | Greece – 1.1% | |
| | 910,000 | | | Intralot
Lottery & Gaming Systems & Services | | | 15,616,980
| | |
| | | Austria – 1.0% | |
| | 367,000 | | | Zumtobel
Lighting Systems | | | 8,378,441
| | |
| | 169,000 | | | Wienerberger
Bricks & Clay Roofing Tiles | | | 7,096,413
| | |
| | | | | | | | 15,474,854 | | |
| | | Spain – 0.9% | |
| | 120,000 | | | Red Electrica de Espana
Spanish Power Grid | | | 7,812,426
| | |
| | 500,000 | | | Prisa
Leading Spanish-speaking Publisher | | | 5,353,134
| | |
| | | | | | | | 13,165,560 | | |
| | | Poland – 0.9% | |
| | 99,000 | | | Central European Distribution (a)
Vodka Production & Alcohol Distribution | | | 7,340,850
| | |
| | 28,913 | | | ING Bank Slaski
Polish Universal Bank | | | 5,630,508
| | |
| | | | | | | | 12,971,358 | | |
| | | Denmark – 0.4% | |
| | 69,000 | | | Novozymes
Industrial Enzymes | | | 6,234,852
| | |
| | | Czech Republic – 0.4% | |
| | 22,400 | | | Komercni Banka
Leading Czech Universal Bank | | | 5,238,851
| | |
Number of
Shares | | | | Value | |
| | | Russia – 0.3% | |
| | 110,800 | | | RosBusinessConsulting – ADR
Financial Information, Media & IT Services in Russia | | $ | 3,767,200 | | |
| | | Norway – 0.2% | |
| | 940,000 | | | Kongsberg Automotive (a)
Automotive Seating & Component Supplier | | | 3,654,284 | | |
| | | | | Total Europe | | | 669,230,691 | | |
| | | Asia – 33.1% | |
| | | Japan – 16.1% | |
| | 2,400,000 | | | Kansai Paint
Paint Producer in Japan, India, China &
Southeast Asia | | | 16,612,516 | | |
| | 17,500 | | | Jupiter Telecommunications
Largest Cable Service Provider in Japan | | | 13,563,592 | | |
| | 248,000 | | | Ibiden
Electronic Parts & Ceramics | | | 9,015,209
| | |
| | 920,000 | | | Topcon
Positioning & Medical Instrument | | | 8,716,109
| | |
| | 265,000 | | | Aeon Mall
Suburban Shopping Mall Developer, Owner & Operator | | | 7,836,323
| | |
| | 430,000 | | | Yusen Air & Sea Service
Airfreight Logistics | | | 7,787,258
| | |
| | 697,000 | | | Asics
Footwear & Apparel | | | 7,601,130
| | |
| | 171,000 | | | SYSMEX
In Vitro Diagnostics (IVD) Equipment &
Reagent Manufacturer | | | 6,731,459
| | |
| | 1,100,000 | | | Park24
Parking Lot Operator | | | 6,661,016
| | |
| | 256,900 | | | Kintetsu World Express
Airfreight Logistics | | | 6,568,569
| | |
| | 1,550 | | | Osaka Securities Exchange
Osaka Securities Exchange | | | 6,524,933
| | |
| | 27,000 | | | Keyence
Sensors & Measuring Devices for Automation | | | 6,430,569
| | |
| | 5,200 | | | Kenedix
Real Estate Investment Management | | | 6,366,248
| | |
| | 2,500,000 | | | Kansai Urban Banking
Regional Bank | | | 6,286,199
| | |
| | 375,000 | | | Ushio
Industrial Light Sources | | | 6,127,278
| | |
See accompanying notes to financial statements.
8
Wanger International 2008 Semiannual Report
Wanger International
Statement of Investments (Unaudited) June 30, 2008
Number of
Shares | | | | Value | |
| | | Japan – 16.1% (cont) | |
| | 540,000 | | | OSG
Consumable Cutting Tools | | $ | 6,102,557 | | |
| | 394,000 | | | FCC
Auto/Motorcycle Clutches | | | 6,062,966 | | |
| | 800,000 | | | Kamigumi
Port Cargo Handling & Logistics | | | 6,049,819 | | |
| | 194,000 | | | Unicharm PetCare
Pet Food & Pet Toiletries | | | 5,791,590 | | |
| | 195,000 | | | Union Tool
Precision Drill Bit Manufacturer | | | 5,674,530 | | |
| | 49,400 | | | Nakanishi
Dental Tools & Machinery | | | 5,322,183
| | |
| | 1,150,000 | | | Bank of Fukuoka
Regional Bank | | | 5,187,644
| | |
| | 3,300 | | | Risa Partners
Non-performing Loans & Real Estate Related Investment | | | 5,034,609
| | |
| | 325,000 | | | T. Hasegawa
Industrial Flavors & Fragrances | | | 4,943,024
| | |
| | 48,000 | | | Hirose Electric
Electrical Connectors | | | 4,818,760
| | |
| | 71,000 | | | USS
Used Car Auctioneer | | | 4,687,197
| | |
| | 330,000 | | | Suruga Bank
Regional Bank | | | 4,291,849
| | |
| | 148,000 | | | Point
Apparel Specialty Retailer | | | 4,237,133
| | |
| | 200,000 | | | Aeon Delight
Facility Maintenance & Management | | | 4,087,206
| | |
| | 210,000 | | | Tamron
Camera Lens Maker | | | 3,965,249
| | |
| | 180,400 | | | As One
Scientific Supplies Distributor | | | 3,941,498
| | |
| | 150,000 | | | Hamamatsu Photonics
Optical Sensors for Medical & Industrial Applications | | | 3,891,793
| | |
| | 162,000 | | | Glory
Currency Handling Systems & Related Equipment | | | 3,806,470
| | |
| | 222,000 | | | Ain Pharmaciez
Dispensing Pharmacy/Drugstore Operator | | | 3,754,881
| | |
| | 450,000 | | | Cosel
Industrial Standard Switching Power Supply System | | | 3,691,199
| | |
| | 600 | | | Fukuoka
Diversified REIT in Fukuoka | | | 3,152,988
| | |
Number of
Shares | | | | Value | |
| | 1,200 | | | Wacom
Computer Graphic Illustration Devices | | $ | 2,859,161 | | |
| | 232,000 | | | Casio Computer
Micro-consumer Electronic Goods | | | 2,641,503 | | |
| | 130,000 | | | Takata
Safety Related Auto Parts | | | 2,558,742 | | |
| | 110,000 | | | Hoya
Opto-electrical Components & Eyeglass Lenses | | | 2,543,203 | | |
| | 90,000 | | | NGK Insulators
Ceramic, Power & Electronics Parts | | | 1,750,247 | | |
| | 550 | | | Japan Pure Chemical
Precious Metal Plating Chemicals for Electronics | | | 1,636,766 | | |
| | 4,400 | | | FullCast
Employment Outsourcing | | | 1,601,544
| | |
| | 100 | | | Nippon Building Fund
Office REIT | | | 1,177,191
| | |
| | 107 | | | Seven Bank
ATM Processing Services | | | 236,804
| | |
| | | | | | | | 238,328,714 | | |
| | | China – 5.5% | |
| | 4,529,000 | | | China Shipping Development
China's Dominant Shipper for Oil & Coal | | | 13,591,792
| | |
| | 16,141,000 | | | Lenovo Group
Third Largest PC Vendor Globally | | | 10,930,069
| | |
| | 8,300,000 | | | China Green
Agricultural Grower & Processor in China | | | 9,857,065
| | |
| | 10,476,000 | | | Jiangsu Expressway
Chinese Toll Road Operator | | | 8,585,288
| | |
| | 4,310,000 | | | Fu Ji Food & Catering Services
Food Catering Service Provider in China | | | 6,688,384
| | |
| | 9,462,000 | | | TPV Technology
Original Design Manufacturer for LCD Monitor & Flat TV | | | 4,926,829
| | |
| | 6,000,000 | | | Hopewell Highway Infrastructure
Guangdong Tollroad Leading to Hong Kong & Macau | | | 4,547,757
| | |
| | 10,500,000 | | | Xinyu Hengdeli
A High-end Watch Retailer in China | | | 3,945,622
| | |
| | 7,803,000 | | | SPG Land
A Property Developer in China | | | 3,742,758
| | |
| | 94,000 | | | ZhongDe Waste Technology (a)
Solid Municipal Waste & Medical Waste
Incinerator Manufacturer | | | 3,732,520
| | |
See accompanying notes to financial statements.
9
Wanger International 2008 Semiannual Report
Wanger International
Statement of Investments (Unaudited) June 30, 2008
Number of
Shares | | | | Value | |
| | | China – 5.5% (cont) | |
| | 5,624,300 | | | Travelsky Technology
Online Air Travel Bookings in China | | $ | 3,700,363 | | |
| | 185,500 | | | VisionChina Media – ADR (a)
Advertising on Digital Screens in China's
Mass Transit System | | | 2,943,885 | | |
| | 24,796,200 | | | RexCapital Finance (a)
Chinese Lottery | | | 2,480,495 | | |
| | 4,299,000 | | | Sinotrans
Largest Integrated Logistics Player in China | | | 1,058,589
| | |
| | | | | | | | 80,731,416 | | |
| | | South Korea – 3.0% | |
| | 41,360 | | | MegaStudy
Online Education Service Provider | | | 13,095,389
| | |
| | 342,000 | | | Woongjin Coway
South Korean Household Appliance
Rental Service Provider | | | 10,037,188
| | |
| | 79,063 | | | Taewoong
A Player in the Niche Customized Forging Market | | | 7,626,267
| | |
| | 256,000 | | | Sung Kwang Bend
A Large Customized Industrial Pipe Fitting Manufacturer | | | 7,244,013
| | |
| | 34,800 | | | Mirae Asset Securities
Korean Largest Diversified Financial Company | | | 3,409,971
| | |
| | 48,000 | | | JVM
Automatic Tablet Dispensing & Packaging Systems | | | 1,787,295
| | |
| | 87,000 | | | YBM Sisa.com
Online Language Educator & Tester | | | 948,138
| | |
| | | | | | | | 44,148,261 | | |
| | | Singapore – 2.9% | |
| | 2,800,000 | | | Singapore Exchange
Singapore Equity & Derivatives Market Operator | | | 14,220,719
| | |
| | 6,376,100 | | | CDL Hospitality Trust
Singapore Hotel Operator | | | 8,248,088
| | |
| | 13,153,600 | | | Mapletree Logistics
Asian Logistics Landlord | | | 8,217,677
| | |
| | 6,000,000 | | | ComfortDelGro
Taxi & Mass Transit Service | | | 6,614,972
| | |
| | 3,300,000 | | | OLAM
Agriculture Supply Chain Manager | | | 5,893,940
| | |
| | | | | | | | 43,195,396 | | |
Number of
Shares | | | | Value | |
| | | Taiwan – 2.0% | |
| | 582,695 | | | Formosa International Hotels
Hotel, Food & Beverage Operation &
Hospitality Management Services | | $ | 11,000,041 | | |
| | 1,986,000 | | | President Chain Store
Taiwan's Number One Convenience Chain Store Operator | | | 6,608,441
| | |
| | 1,933,177 | | | Everlight Electronics
Led Packager | | | 4,993,282 | | |
| | 2,199,138 | | | Wah Lee Industrial
Distributor of Chemicals, Materials & Equipment | | | 4,042,826 | | |
| | 430,000 | | | GeoVision
Taiwan PC-based Video Surveillance Player | | | 2,422,495
| | |
| | | | | | | | 29,067,085 | | |
| | | Hong Kong – 1.9% | |
| | 800,000 | | | Hong Kong Exchanges and Clearing
Hong Kong Equity & Derivatives Market Operator | | | 11,696,431
| | |
| | 4,970,000 | | | Lifestyle International
Mid to High-end Department Store
Operator in Hong Kong & China | | | 6,985,950 | | |
| | 397,500 | | | Hong Kong Aircraft Engineering
Aircraft Maintenence, Repair, Overhaul Operator | | | 6,122,639
| | |
| | 12,500,000 | | | Nagacorp
Monopoly Casino in Central Cambodia | | | 3,366,572
| | |
| | 14,500,000 | | | Global Digital Creations (a)
Digital Cinema Solution Provider/Network Operator | | | 669,467
| | |
| | | | | | | | 28,841,059 | | |
| | | India – 1.3% | |
| | 300,000 | | | Housing Development Finance
Indian Mortgage Lender | | | 13,485,183
| | |
| | 230,000 | | | Asian Paints
India's Largest Paint Company | | | 6,147,589
| | |
| | | | | | | | 19,632,772 | | |
| | | Indonesia – 0.4% | |
| | 4,000,000 | | | Perusahaan Gas Negara
Gas Pipeline Operator | | | 5,639,913
| | |
| | | | | Total Asia | | | 489,584,616 | | |
See accompanying notes to financial statements.
10
Wanger International 2008 Semiannual Report
Wanger International
Statement of Investments (Unaudited) June 30, 2008
Number of
Shares | | | | Value | |
| | | Other Countries – 11.8% | |
| | | United States – 3.3% | |
| | 189,000 | | | Atwood Oceanics (a)
Offshore Drilling Contractor | | $ | 23,500,260 | | |
| | 125,800 | | | FMC Technologies (a)
Oil & Gas Wellhead Manufacturer | | | 9,677,794
| | |
| | 165,000 | | | Dresser-Rand Group (a)
Largest Manufacturer of Compressors | | | 6,451,500
| | |
| | 180,000 | | | BioMarin (a)
Biotech Focused on Orphan Diseases | | | 5,216,400
| | |
| | 100,000 | | | Tesco (a)
Developing New Well Drilling Technologies | | | 3,195,000
| | |
| | 18,000 | | | Bristow (a)
Largest Provider of Helicopter Services to
Offshore Oil & Gas Producers | | | 890,820
| | |
| | 440,000 | | | Decode Genetics (a)
Drugs for Heart Attack, Asthma & Vascular Disease | | | 404,800
| | |
| | | | | | | | 49,336,574 | | |
| | | South Africa – 2.9% | |
| | 484,000 | | | Impala Platinum Holdings
Platinum Group Metals Mining & Refining | | | 19,100,383
| | |
| | 518,000 | | | Naspers
Media & Education in Africa &
other Emerging Markets | | | 11,312,644
| | |
| | 1,575,000 | | | Uranium One (a)
Uranium Mines in South Africa, Kazakhstan,
Australia & the U.S. | | | 7,413,945
| | |
| | 2,250,000 | | | Mr. Price
South African Retailer of Apparel,
Household Goods & Sporting Goods | | | 4,310,345
| | |
| | | | | | | | 42,137,317 | | |
| | | Australia – 2.6% | |
| | 1,983,333 | | | Sino Gold (a)
Gold Mining in The People's Republic of China | | | 11,084,704
| | |
| | 1,000,000 | | | Billabong International
Action Sports Apparel Brand Manager | | | 10,353,416
| | |
| | 220,000 | | | Perpetual Trustees
Mutual Fund Management | | | 9,020,318
| | |
| | 250,000 | | | Australian Stock Exchange
Australian Equity & Derivatives Market Operator | | | 7,525,399
| | |
| | | | | | | | 37,983,837 | | |
Number of
Shares | | | | Value | |
| | | Canada – 2.4% | |
| | 630,000 | | | ShawCor
Oil & Gas Pipeline Products | | $ | 22,241,836 | | |
| | 194,000 | | | CCL
Leading Global Label Manufacturer | | | 5,618,142
| | |
| | 250,000 | | | Ivanhoe Mines (a)
Copper Mine Project in Mongolia | | | 2,709,130
| | |
| | 445,000 | | | UTS Energy (a)
Operator of Canadian Oil Sands Mines | | | 2,600,961
| | |
| | 537,100 | | | Horizon North Logistics (a)
Provides Diversified Oil Service
Offering in Northern Canada | | | 1,738,188
| | |
| | 91,100 | | | Xtreme Coil Drilling (a)
Land Driller with New Generation Drilling Technology | | | 893,400
| | |
| | | | | | | | 35,801,657 | | |
| | | Kazakhstan – 0.3% | |
| | 330,400 | | | Halyk Savings Bank of Kazakhstan – GDR
Largest Retail Bank in Kazakhstan | | | 5,098,072 | | |
| | | New Zealand – 0.3% | |
| | 1,800,000 | | | Sky City Entertainment
Casino/Entertainment Complex | | | 4,197,921
| | |
| | | | | Total Other Countries | | | 174,555,378 | | |
| | | Latin America – 6.6% | |
| | | Brazil – 4.0% | |
| | 1,780,000 | | | Suzano
Brazilian Pulp & Paper Producer | | | 28,835,756
| | |
| | 800,000 | | | Porto Seguro
Auto & Life Insurance | | | 9,232,113
| | |
| | 800,000 | | | Localiza Rent A Car
Car Rental | | | 8,832,886
| | |
| | 600,000 | | | Bovespa
Brazil Equity & Derivative Exchange | | | 7,448,069
| | |
| | 500,000 | | | Natura Cosmeticos
Direct Retailer of Cosmetics | | | 5,146,279
| | |
| | | | | | | | 59,495,103 | | |
| | | Chile – 1.4% | |
| | 450,000 | | | Sociedad Quimica y Minera de
Chile – ADR
Producer of Specialty Fertilizers, Lithium & Iodine | | | 20,970,000
| | |
See accompanying notes to financial statements.
11
Wanger International 2008 Semiannual Report
Wanger International
Statement of Investments (Unaudited) June 30, 2008
Number of Shares
or Principal Amount | | | | Value | |
| | | Mexico – 1.2% | |
| | 2,327,600 | | | Urbi Desarrollos Urbanos (a)
Affordable Housing Builder | | $ | 8,045,975 | | |
| | 140,000 | | | Grupo Aeroportuario del Surest – ADR
Cancun & Cozumel Airport Operator | | | 7,210,000 | | |
| | 2,000,000 | | | Financiera Independencia
Mexican Micro-finance Lender | | | 2,906,982 | | |
| | | | 18,162,957 | | |
| | | | | Total Latin America | | | 98,628,060 | | |
| Total Common Stocks (Cost: $1,137,562,609) – 96.7% | | | 1,431,998,745 | | |
| Short-Term Obligations – 3.4% | | | |
| | | Commercial Paper – 2.5% | |
| $ | 7,700,000 | | | E.I. Dupont (c)
2.16% due 7/08/08 | | | 7,696,766 | | |
| | 7,500,000 | | | Toyota Motor Credit
1.90% due 7/01/08 | | | 7,500,000 | | |
| | 7,400,000 | | | Nestle Capital (c)
2.09% due 7/07/08 | | | 7,397,422 | | |
| | 7,400,000 | | | General Electric
2.05% due 7/09/08 | | | 7,396,629 | | |
| | 7,300,000 | | | Walgreen (c)
2.25% due 7/10/08 | | | 7,295,894 | | |
| | | | | | | | 37,286,711 | | |
| | | Repurchase Agreement – 0.9% | |
| | 12,491,000 | | | Repurchase Agreement with Fixed
Income Clearing Corp., dated 06/30/08,
due 07/01/08 at 1.80%, collateralized
by a U.S. Treasury Obligation,
maturing 08/15/23, market value
$12,744,375 (repurchase proceeds
$12,491,625) | | | 12,491,000 | | |
| Total Short-Term Obligations (Cost: $49,777,711) – 3.4% | | | 49,777,711 | | |
| Total Investments (Cost: $1,187,340,320) – 100.1% (d)(e) | | | 1,481,776,456 | | |
| Cash and Other Assets Less Liabilities – (0.1)% | | | (919,477 | ) | |
| Total Net Assets – 100.0% | | $ | 1,480,856,979 | | |
Notes to Statement of Investments:
(a) Non-income producing security.
(b) An affiliate may include any company in which the Fund owns five percent or more of its outstanding voting shares. Transactions in affiliated companies during the six months ended June 30, 2008, are as follows:
Balance of
Affiliates | | Shares
Held
12/31/2007 | | Purchases/
Additions | | Balance of
Sales/
Reductions | | Shares
Held
06/30/2008 | | Value | | Dividend | |
Charles
Taylor | | | 2,300,000 | | | | — | | | | — | | | | 2,300,000 | | | $ | 11,086,634 | | | $ | 381,609 | | |
The aggregate cost and value of this company at June 30, 2008, was $12,583,555 and $11,086,634, respectively. Investments in affiliate companies represent 0.7% of total net assets at June 30, 2008.
(c) Securities exempt from registration under Section 4(2) of the Securities Act of 1933. These securities may only be resold in exempt transactions to qualified buyers. Private resales of these securities to qualified institutional buyers are also exempt from registration pursuant to Rule 144A under the Securities Act of 1933. At June 30, 2008, these securities amounted to $22,390,082, which represents 1.51% of net assets.
(d) At June 30, 2008, for federal income tax purposes cost of investments was $1,187,340,320 and net unrealized appreciation was $294,436,136 consisting of gross unrealized appreciation of $467,269,831 and gross unrealized depreciation of $172,833,695.
(e) On June 30, 2008, the Fund's total investments were denominated in currencies as follows:
| Currency | | Value | | % of Net
Assets | |
| Euro | | $ | 431,376,763 | | | | 29.1 | | |
| Japanese Yen | | | 238,328,714 | | | | 16.1 | | |
| U.S. Dollar | | | 156,372,992 | | | | 10.6 | | |
| British Pound | | | 103,368,243 | | | | 7.0 | | |
| Hong Kong Dollar | | | 102,896,070 | | | | 7.0 | | |
Other currencies less than
5% of total net assets | | | 449,433,674 | | | | 30.3 | | |
Cash and other assets
less liabilities | | | (919,477 | ) | | | (0.1 | ) | |
| | | $ | 1,480,856,979 | | | | 100.0 | | |
ADR = American Depositary Receipts
GDR = Global Depositary Receipts
See accompanying notes to financial statements.
12
Wanger International 2008 Semiannual Report
Wanger International
Portfolio Diversification (Unaudited) June 30, 2008
At June 30, 2008, the Fund's portfolio investments as a percent of net assets was diversified as follows:
| | | Value | | Percent | |
| Industrial Goods & Services | |
| Industrial Materials & Specialty Chemicals | | $ | 123,462,298 | | | | 8.3 | % | |
| Other Industrial Services | | | 115,267,337 | | | | 7.8 | | |
| Machinery | | | 80,690,131 | | | | 5.4 | | |
| Conglomerates | | | 48,653,184 | | | | 3.3 | | |
| Outsourcing Services | | | 33,245,669 | | | | 2.2 | | |
| Electrical Components | | | 29,446,248 | | | | 2.0 | | |
| Construction | | | 26,276,258 | | | | 1.8 | | |
| Industrial Distribution | | | 3,941,498 | | | | 0.3 | | |
| Waste Management | | | 3,732,520 | | | | 0.3 | | |
| | | | 464,715,143 | | | | 31.4 | | |
| Consumer Goods & Services | |
| Other Consumer Services | | | 45,252,361 | | | | 3.0 | | |
| Retail | | | 33,706,244 | | | | 2.3 | | |
| Casinos & Gaming | | | 31,657,477 | | | | 2.1 | | |
| Food & Beverage | | | 29,062,335 | | | | 2.0 | | |
| Other Entertainment | | | 20,416,439 | | | | 1.4 | | |
| Apparel | | | 20,209,873 | | | | 1.4 | | |
| Nondurables | | | 16,556,012 | | | | 1.1 | | |
| Travel | | | 12,533,250 | | | | 0.8 | | |
| Leisure Products | | | 12,529,122 | | | | 0.8 | | |
| Consumer Goods Distribution | | | 12,028,047 | | | | 0.8 | | |
| Consumer Electronics | | | 11,533,581 | | | | 0.8 | | |
| Other Durable Goods | | | 9,874,340 | | | | 0.7 | | |
| | | | 255,359,081 | | | | 17.2 | | |
| Energy & Minerals | |
| Oil Services | | | 116,839,334 | | | | 7.9 | | |
| Mining | | | 50,236,862 | | | | 3.4 | | |
| Agricultural Commodities | | | 33,538,161 | | | | 2.2 | | |
| Oil Refining, Marketing & Distribution | | | 23,897,642 | | | | 1.6 | | |
| Oil & Gas Producers | | | 6,976,058 | | | | 0.5 | | |
| | | | 231,488,057 | | | | 15.6 | | |
| Information | |
| Financial Processors | | | 25,917,151 | | | | 1.8 | | |
| Computer Hardware & Related Equipment | | | 24,580,675 | | | | 1.7 | | |
| Publishing | | | 15,224,739 | | | | 1.0 | | |
| Satellite Broadcasting & Services | | | 14,180,042 | | | | 1.0 | | |
| CATV | | | 13,563,592 | | | | 0.9 | | |
| Instrumentation | | | 12,607,901 | | | | 0.8 | | |
| Business Information & Marketing Services | | | 12,262,137 | | | | 0.8 | | |
| TV Broadcasting | | | 11,312,644 | | | | 0.8 | | |
| Business Software | | | 10,276,757 | | | | 0.7 | | |
| Computer Services | | | 9,578,918 | | | | 0.6 | | |
| Semiconductors & Related Equipment | | | 7,536,485 | | | | 0.5 | | |
| Internet Related | | | 6,804,463 | | | | 0.5 | | |
| Advertising | | | 5,188,422 | | | | 0.3 | | |
| Electronics Distribution | | | 4,042,826 | | | | 0.3 | | |
| | | | 173,076,752 | | | | 11.7 | | |
| | | Value | | Percent | |
| Finance | |
| Brokerage & Money Management | | $ | 32,587,323 | | | | 2.2 | % | |
| Banks | | | 31,969,927 | | | | 2.2 | | |
| Insurance | | | 26,215,117 | | | | 1.8 | | |
| Finance Companies | | | 18,229,507 | | | | 1.2 | | |
| Savings & Loans | | | 13,485,183 | | | | 0.9 | | |
| Closed End Funds | | | 6,003,854 | | | | 0.4 | | |
| | | | 128,490,911 | | | | 8.7 | | |
| Other Industries | |
| Transportation | | | 67,555,169 | | | | 4.6 | | |
| Real Estate | | | 43,985,533 | | | | 3.0 | | |
| Regulated Utilities | | | 7,812,426 | | | | 0.5 | | |
| | | | 119,353,128 | | | | 8.1 | | |
| Health Care | |
| Medical Equipment & Devices | | | 23,717,124 | | | | 1.6 | | |
| Health Care Services | | | 12,702,671 | | | | 0.9 | | |
| Pharmaceuticals | | | 12,412,818 | | | | 0.8 | | |
| Biotechnology & Drug Delivery | | | 5,621,200 | | | | 0.4 | | |
| Medical Supplies | | | 5,061,860 | | | | 0.3 | | |
| | | | 59,515,673 | | | | 4.0 | | |
| Total Common Stocks | | | 1,431,998,745 | | | | 96.7 | | |
| Short-Term Obligations | | | 49,777,711 | | | | 3.4 | | |
| Total Investments | | | 1,481,776,456 | | | | 100.1 | | |
Cash and Other Assets
Less Liabilities | | | (919,477 | ) | | | (0.1 | ) | |
| Net Assets | | | 1,480,856,979 | | | | 100.0 | | |
See accompanying notes to financial statements.
13
Wanger International 2008 Semiannual Report
Statement of Assets and Liabilities
June 30, 2008 (Unaudited)
| Assets: | |
| Unaffiliated investments, at cost | | $ | 1,174,756,765 | | |
| Affiliated investments, at cost (See Note 4) | | | 12,583,555 | | |
| Unaffiliated investments, at value | | $ | 1,470,689,822 | | |
| Affiliated investments, at value (See Note 4) | | | 11,086,634 | | |
| Cash | | | 1,163 | | |
| Foreign currency (cost of $3,535,190) | | | 3,665,031 | | |
| Receivable for: | |
| Investments sold | | | 580,375 | | |
| Fund shares sold | | | 204,665 | | |
| Interest | | | 624 | | |
| Dividends | | | 1,846,336 | | |
| Foreign tax reclaims | | | 551,544 | | |
| Trustees' deferred compensation plan | | | 66,165 | | |
| Total Assets | | | 1,488,692,359 | | |
| Liabilities: | |
| Payable for: | |
| Investments purchased | | | 5,193,415 | | |
| Fund shares repurchased | | | 1,133,158 | | |
| Investment advisory fee | | | 1,045,003 | | |
| Administration fee | | | 63,604 | | |
| Transfer agent fee | | | 31 | | |
| Trustees' fees | | | 833 | | |
| Reports to shareholders | | | 146,958 | | |
| Custody fee | | | 149,840 | | |
| Trustees' deferred compensation plan | | | 66,165 | | |
| Other liabilities | | | 36,373 | | |
| Total Liabilities | | | 7,835,380 | | |
| Net Assets | | $ | 1,480,856,979 | | |
| Composition of Net Assets: | |
| Paid-in capital | | $ | 1,092,935,798 | | |
| Undistributed net investment income | | | 15,729,282 | | |
| Accumulated net realized gain | | | 77,577,117 | | |
| Net unrealized appreciation on: | |
| Investments | | | 294,436,136 | | |
| Foreign currency translations | | | 178,646 | | |
| Net Assets | | $ | 1,480,856,979 | | |
| Fund Shares Outstanding | | | 42,944,652 | | |
Net asset value, offering price and redemption
price per share | | $ | 34.48 | | |
Statement of Operations
For the Six Months Ended June 30, 2008 (Unaudited)
| Investment Income: | |
| Dividends (net of foreign taxes withheld of $2,173,844) | | $ | 22,945,812 | | |
| Dividends from affiliates | | | 381,609 | | |
| Interest income | | | 763,676 | | |
| Total Investment Income | | | 24,091,097 | | |
| Expenses: | |
| Investment advisory fee | | | 6,364,307 | | |
| Administration fee | | | 387,577 | | |
| Transfer agent fee | | | 206 | | |
| Trustees' fees | | | 41,469 | | |
| Reports to shareholders | | | 167,187 | | |
| Legal fees | | | 32,361 | | |
| Custody fee | | | 532,483 | | |
| Chief compliance officer expenses (See Note 4) | | | 19,190 | | |
| Other expenses (See Note 5) | | | 40,476 | | |
| Total Expenses | | | 7,585,256 | | |
| Custody earnings credit | | | (151 | ) | |
| Net Expenses | | | 7,585,105 | | |
| Net Investment Income | | | 16,505,992 | | |
Net Realized and Unrealized Gain (Loss) on
Investments and Foreign Currency: | |
| Net realized gain on: | |
| Investments | | | 77,742,383 | | |
| Foreign currency transactions | | | 46,814 | | |
| Net realized gain | | | 77,789,197 | | |
Net change in unrealized appreciation
(depreciation) on: | |
| Unaffiliated investments | | | (246,368,979 | ) | |
| Affiliated investments (See Note 4) | | | (4,316,124 | ) | |
| Foreign currency translations | | | 153,684 | | |
Net change in unrealized
appreciation (depreciation) | | | (250,531,419 | ) | |
| Net Loss | | | (172,742,222 | ) | |
| Net Decrease in Net Assets from Operations | | $ | (156,236,230 | ) | |
See accompanying notes to financial statements.
14
Wanger International 2008 Semiannual Report
Statement of Changes in Net Assets
| Increase (Decrease) in Net Assets | | (Unaudited)
Six Months
Ended
June 30,
2008 | | Year Ended
December 31,
2007 | |
| From Operations: | |
| Net investment income | | $ | 16,505,992 | | | $ | 14,347,527 | | |
| Net realized gain on investments and foreign currency transactions | | | 77,789,197 | | | | 201,504,078 | | |
| Net change in unrealized appreciation (depreciation) | |
| on investments and foreign currency translations | | | (250,531,419 | ) | | | 28,586,493 | | |
| Net Increase (Decrease) in Net Assets from Operations | | | (156,236,230 | ) | | | 244,438,098 | | |
| Distributions to Shareholders: | |
| From net investment income | | | (12,975,444 | ) | | | (13,868,748 | ) | |
| From net realized gains | | | (196,263,095 | ) | | | (124,882,759 | ) | |
| Total Distributions to Shareholders | | | (209,238,539 | ) | | | (138,751,507 | ) | |
| Share Transactions: | |
| Subscriptions | | | 41,426,712 | | | | 135,196,260 | | |
| Distributions reinvested | | | 209,238,539 | | | | 138,751,507 | | |
| Redemptions | | | (97,707,848 | ) | | | (166,382,832 | ) | |
| Net Increase from Share Transactions | | | 152,957,403 | | | | 107,564,935 | | |
| Total Increase (Decrease) in Net Assets | | | (212,517,366 | ) | | | 213,251,526 | | |
| Net Assets: | |
| Beginning of period | | | 1,693,374,345 | | | | 1,480,122,819 | | |
| End of period | | $ | 1,480,856,979 | | | $ | 1,693,374,345 | | |
| Undistributed net investment income at end of period | | $ | 15,729,282 | | | $ | 12,198,734 | | |
See accompanying notes to financial statements.
15
Wanger International 2008 Semiannual Report
Financial Highlights
| | | (Unaudited)
Six Months Ended
June 30, | | Year Ended December 31, | |
| Selected data for a share outstanding throughout each period | | 2008 | | 2007 | | 2006 | | 2005 | | 2004 | | 2003 | |
| Net Asset Value, Beginning of Period | | $ | 44.04 | | | $ | 41.77 | | | $ | 30.63 | | | $ | 25.46 | | | $ | 19.68 | | | $ | 13.27 | | |
| Income from Investment Operations: | |
| Net investment income (a) | | | 0.40 | | | | 0.37 | | | | 0.29 | | | | 0.25 | | | | 0.13 | | | | 0.13 | | |
Net realized and unrealized gain (loss) on investments
and foreign currency transactions | | | (4.46 | ) | | | 5.80 | | | | 11.04 | | | | 5.20 | | | | 5.80 | | | | 6.33 | | |
| Total from Investment Operations | | | (4.06 | ) | | | 6.17 | | | | 11.33 | | | | 5.45 | | | | 5.93 | | | | 6.46 | | |
| Less Distributions to Shareholders: | |
| From net investment income | | | (0.34 | ) | | | (0.39 | ) | | | (0.19 | ) | | | (0.28 | ) | | | (0.15 | ) | | | (0.05 | ) | |
| From net realized gain | | | (5.16 | ) | | | (3.51 | ) | | | — | | | | — | | | | — | | | | — | | |
| Total Distributions to Shareholders | | | (5.50 | ) | | | (3.90 | ) | | | (0.19 | ) | | | (0.28 | ) | | | (0.15 | ) | | | (0.05 | ) | |
| Net Asset Value, End of Period | | $ | 34.48 | | | $ | 44.04 | | | $ | 41.77 | | | $ | 30.63 | | | $ | 25.46 | | | $ | 19.68 | | |
| Total Return (b) | | | (9.34 | )%(c) | | | 16.31 | % | | | 37.16 | % | | | 21.53 | %(d) | | | 30.27 | % | | | 48.86 | % | |
| Ratios to Average Net Assets/Supplemental Data: | |
| Net expenses before interest expense (e) | | | 0.98 | %(f) | | | 0.99 | % | | | 1.01 | % | | | 1.13 | % | | | 1.36 | % | | | 1.41 | % | |
| Interest expense | | | — | | | | — | | | | 0.00 | %(g) | | | — | | | | — | | | | — | | |
| Net expenses (e) | | | 0.98 | %(f) | | | 0.99 | % | | | 1.01 | % | | | 1.13 | % | | | 1.36 | % | | | 1.41 | % | |
| Net investment income (e) | | | 2.13 | %(f) | | | 0.87 | % | | | 0.81 | % | | | 0.92 | % | | | 0.59 | % | | | 0.85 | % | |
| Waiver | | | — | | | | — | | | | — | | | | 0.02 | % | | | — | | | | — | | |
| Portfolio turnover rate | | | 16 | %(c) | | | 35 | % | | | 41 | % | | | 24 | % | | | 47 | % | | | 45 | % | |
| Net assets, end of period (000's) | | $ | 1,480,857 | | | $ | 1,693,374 | | | $ | 1,480,123 | | | $ | 973,257 | | | $ | 606,773 | | | $ | 380,726 | | |
(a) Net investment income per share was based upon the average shares outstanding during the period.
(b) Total return at net asset value assuming all distributions are reinvested.
(c) Not annualized.
(d) Had the investment advisor not waived a portion of expenses, total return would have been reduced.
(e) The benefits derived from custody fees paid indirectly had an impact of less than 0.01%.
(f) Annualized.
(g) Rounds to less than 0.01%.
See accompanying notes to financial statements.
16
Wanger International 2008 Semiannual Report
Notes to Financial Statements (Unaudited)
1. Nature of Operations
Wanger International (the "Fund"), is a series of Wanger Advisors Trust (the "Trust"), an open-end management investment company organized as a Massachusetts business trust. The investment objective of the Fund is to seek long-term capital appreciation. The Fund is available only for allocation to certain life insurance company separate accounts established for the purpose of funding qualified and non-qualified variable annuity contracts and variable life insurance policies and may also be offered directly to certain types of pension plans and retirement arrangements.
Effective June 1, 2008, Wanger International Small Cap was renamed Wanger International.
2. Significant Accounting Policies
Security valuation
Securities of the Fund are valued at market value or, if a market quotation for a security is not readily available or is deemed not to be reliable because of events or circumstances that have occurred between the market quotation and the time as of which the security is to be valued, the security is valued at a fair value determined in accordance with procedures established by the Board of Trustees. A security traded on a securities exchange or in an over-the-counter market in which transaction prices are reported is valued at the last sales price at the time of valuation. A security traded principally on NASDAQ is valued at the NASDAQ official closing price. A security for which there is no reported sale on the valuation date is valued at the latest bid quotation. A short-term debt obligation having a maturity of 60 days or less from the valuation date is valued at amortized cost, which approximates fair value. A security for which a market quotation is not readily available and any other assets are valued in accordance with procedures established by the Board of Trustees. The Trust has retained an independent statistical fair value pricing service to assist in the fair valuation process for securities principally traded in a foreign market in order to adjust for possible changes in value that may occur between the close of the foreign market and the time as of which the securities are to be valued. If a security is valued at fair value, that value may be different from the last quoted market price for the security.
On January 1, 2008, the Fund adopted Statement of Financial Accounting Standard No. 157, Fair Value Measurements ("SFAS 157"). Under SFAS 157, various inputs are used in determining the value of the Fund's investments. These inputs are summarized in the three broad levels listed below:
• Level 1—quoted prices in active markets for identical securities
• Level 2—other significant observable inputs (including quoted prices for similar securities, interest rates, prepayment speeds, credit risk, and others)
• Level 3—significant unobservable inputs (including the Fund's own assumptions in determining the value of investments)
The inputs or methodology used for valuing securities are not necessarily an indication of the risk associated with investing in those securities.
The following table summarizes the inputs used, as of June 30, 2008, in valuing the Fund's assets:
| Valuation Inputs | | Investments in
Securities | | Other Financial
Instruments | |
| Level 1—Quoted Prices | | $ | 211,393,672 | | | $ | — | | |
| Level 2—Other Significant Observable Inputs | | $ | 1,270,382,784 | | | | — | | |
| Level 3—Significant Unobservable Inputs | | | — | | | | — | | |
| Total | | $ | 1,481,776,456 | | | $ | — | | |
The Fund's assets assigned to the Level 2 input category include certain foreign securities for which a third party pricing service may be employed for purposes of fair market valuation.
Repurchase agreements
The Fund may engage in repurchase agreement transactions. The Fund, through its custodians, receives delivery of underlying securities collateralizing each repurchase agreement. The Fund's custodian determines that the value of the underlying securities is at all times at least equal to the resale price. In the event of default or bankruptcy by the other party to the agreement, realization and/or retention of the collateral may be subject to legal proceedings.
Foreign currency translations
Values of investments denominated in foreign currencies are converted into U.S. dollars using the spot market rate of exchange at the time of valuation. Purchases and sales of investments and dividend and interest income are translated into U.S. dollars using the spot market rate of exchange prevailing on the respective dates of such transactions. The gain or loss resulting from changes in foreign exchange rates is included with net realized and unrealized gain or loss from investments, as appropriate.
Security transactions and investment income
Security transactions are accounted for on the trade date (date the order to buy or sell is executed) and dividend income is recorded on the ex-dividend date, except that certain dividends from foreign securities are recorded as soon as the information is available to the Fund. Interest income is recorded on the accrual basis and includes amortization of discounts on debt obligations when required for federal income tax purposes. Realized gains and losses from security transactions are recorded on an identified cost basis.
Awards, if any, from class action litigation related to securities owned may be recorded as a reduction of cost of those securities. If the applicable securities are no longer owned, the proceeds are recorded as realized gains.
In March 2008, Statement of Financial Accounting Standards No. 161 ("SFAS 161"), Disclosures about Derivative Instruments and Hedging Activities—an amendment of FASB Statement No. 133, was issued. SFAS 161 is effective for fiscal years beginning after November 15, 2008. SFAS 161 requires additional discussion about the reporting entity's derivative instruments and hedging activities, by providing for qualitative disclosures about the objectives and strategies for using derivatives, quantitative data about the fair value of and gains and losses on derivative contracts, and details of credit-risk-related contingent features in their hedged positions. Management is evaluating the impact the application of SFAS 161 will have on the Fund's financial statement disclosures.
Restricted securities
Restricted securities are securities that may only be resold upon registration under federal securities laws or in transactions exempt from registration. In some cases, the issuer of restricted securities has agreed to register such securities for resale at the issuer's expense either upon demand by the Fund or in connection with another registered offering of the securities. Many restricted securities may be resold in the secondary market in transactions exempt from registration. Such restricted securities may be determined to be liquid under criteria established by the Board of Trustees. The Fund will not incur any registration costs upon such resale.
Use of estimates
The preparation of financial statements in conformity with accounting principles generally accepted in the United States of America ("GAAP") requires management to make estimates and assumptions that affect the amounts reported in the financial statements and accompanying notes. Actual results may differ from those estimates.
17
Wanger International 2008 Semiannual Report
Notes to Financial Statements, continued (Unaudited)
Fund share valuation
Fund shares are sold and redeemed on a continuing basis at net asset value. Net asset value per share is determined daily as of the close of trading on the New York Stock Exchange ("the Exchange") on each day the Exchange is open for trading by dividing the total value of the Fund's investments and other assets, less liabilities, by the number of Fund shares outstanding.
Custody fees/Credits
Custody fees are reduced based on the Fund's cash balances maintained with the custodian. The amount is disclosed as a reduction of total expenses in the Statement of Operations.
Federal income taxes
The Fund has complied with the provisions of the Internal Revenue Code available to regulated investment companies and, in the manner provided therein, distributes all its taxable income, as well as any net realized gain on sales of investments and foreign currency transactions reportable for federal income tax purposes. Accordingly, the Fund paid no federal income taxes and no federal income tax provision was required.
Expenses
General expenses of the Trust are allocated to the Fund and the other series of the Trust based upon relative net assets or other expense allocation methodologies determined by the nature of the expense. Expenses directly attributable to the Fund are charged to the Fund.
Foreign capital gains taxes
Gains in certain countries may be subject to foreign taxes at the fund level, at rates ranging from 10%-15%. The Fund accrues for such foreign taxes on net realized and unrealized gains at the appropriate rate for each jurisdiction.
Distributions to shareholders
Distributions to shareholders are recorded on the ex-date.
Indemnification
In the normal course of business, the Fund enters into contracts that contain a variety of representations and warranties which provide general indemnities. The Fund's maximum exposure under these arrangements is unknown, as this would involve future claims against the Fund. Also under the Trust's organizational documents, the Trustees and Officers of the Trust are indemnified against certain liabilities that may arise out of their duties to the Trust. However based on experience, the Fund expects the risk of loss due to these warranties and indemnities to be minimal.
3. Federal Tax Information
The tax character of distributions paid during the year ended December 31, 2007 was as follows:
| Distributions paid from: | |
| Ordinary Income* | | $ | 27,006,414 | | |
| Long-Term Capital Gains | | | 111,745,093 | | |
* For tax purposes short-term capital gains distributions, if any, are considered ordinary income distributions.
Under Financial Accounting Standards Board ("FASB") Interpretation No. 48, Accounting for Uncertainty in Income Taxes—an Interpretation of FASB Statement No. 109 ("FIN 48") management determines whether a tax position of the Fund is more likely than not to be sustained upon examination by the applicable taxing authority, including resolution of any related appeals or litigation processes, based on the technical merits of the position. The tax benefit to be recognized is measured as the largest amount of benefit that is greater than fifty percent likely of being realized upon ultimate settlement. Management has evaluated the known impl ications of FIN 48 on its computation of net assets for the Fund. As a result of this evaluation, management believes that FIN 48 does not have any effect on the Fund's financial statements. However, management's conclusions regarding FIN 48 may be subject to review and adjustment at a later date based on factors including, but not limited to, further implementation guidance from the FASB, new tax laws, regulations, and administrative interpretations (including relevant court decisions). The Fund's federal tax returns for the prior three fiscal years remain subject to examination by the Internal Revenue Service. The Fund is not aware of any tax positions for which it is reasonably possible that the total amounts of unrecognized tax benefits will significantly change in the next twelve months.
4. Transactions With Affiliates
Columbia Wanger Asset Management, L.P., ("CWAM") is a wholly owned subsidiary of Columbia Management Group, LLC, ("Columbia Management") which in turn is an indirect wholly owned subsidiary of Bank of America Corporation ("BOA"). CWAM furnishes continuing investment supervision to the Fund and is responsible for the overall management of the Fund's business affairs.
Under the Fund's investment advisory agreement, management fees are accrued daily based on the Fund's average daily net assets and paid monthly to CWAM at the annual rates shown in the table below:
| Average Daily Net Assets | | Annual Fee Rate | |
| Up to $100 million | | | 1.10 | % | |
| $100 million to $250 million | | | 0.95 | % | |
| $250 million to $500 million | | | 0.90 | % | |
| $500 million to $1 billion | | | 0.80 | % | |
| $1 billion and over | | | 0.72 | % | |
For the six months ended June 30, 2008, the Fund's annualized effective investment advisory fee rate was 0.82% of average daily net assets.
CWAM provides administrative services and receives an administration fee from the Fund. Effective August 1, 2008, CWAM will provide administrative services and receive an administration fee from the Fund at the following annual rates:
Wanger Advisors Trust
Aggregate Average Daily
Net Assets of the Trust: | | Annual Fee Rate | |
| Up to $4 billion | | | 0.050 | % | |
| $4 billion to $6 billion | | | 0.040 | % | |
| $6 billion to $8 billion | | | 0.030 | % | |
| $8 billion and over | | | 0.020 | % | |
Prior to August 1, 2008, fees were accrued daily and paid monthly to CWAM at the annual rate of 0.05%. For the six months ended June 30, 2008, the Fund's annualized effective administration fee rate was 0.05% of average daily net assets.
CWAM has delegated to Columbia Management the responsibility for certain administrative services.
Certain officers and trustees of the Trust are also officers of CWAM. The Trust makes no direct payments to its officers and trustees who are affiliated with CWAM.
The Board of Trustees appointed a Chief Compliance Officer to the Fund in accordance with federal securities regulations. The Fund, along with other affiliated funds, pays its pro-rata share of the expenses associated with the Office of the Chief Compliance Officer. These expenses are disclosed separately as "Chief compliance officer expenses" in the Statement of Operations.
18
Wanger International 2008 Semiannual Report
Notes to Financial Statements, continued (Unaudited)
The Trust offers a deferred compensation plan for its independent trustees. Under that plan, a trustee may elect to defer all or a portion of his or her compensation. Amounts deferred are retained by the Trust and represent an unfunded obligation of the Trust. The value of amounts deferred is determined by reference to the change in value of Class Z shares of one or more series of Columbia Acorn Trust or a money market fund as specified by the trustee. Benefits under the deferred compensation plan are payable when the trustee ceases to be a member of the Board of Trustees.
Columbia Management Distributors, Inc. (the "Distributor"), a wholly owned subsidiary of BOA, serves as the principal underwriter of the Trust and receives no compensation from the Fund for its services.
Columbia Management Services, Inc. (the "Transfer Agent"), a wholly owned subsidiary of BOA, provides shareholder services to the Fund and has subcontracted with Boston Financial Data Services ("BFDS") to serve as subtransfer agent. For such services, the Transfer Agent receives a fee, paid monthly, at the annual rate of $21.00 per open account. . The Transfer Agent also receives reimbursement for certain out-of-pocket expenses.
An affiliate may include any company in which a fund owns five percent or more of its outstanding voting shares. On June 30, 2008, the Fund held five percent or more of the outstanding voting securities of one or more companies. Details of investments in those affiliated companies is presented on page 12.
During the six months ended June 30, 2008, the Fund engaged in purchase and sales transactions with funds that have a common investment advisor (or affiliated investment advisors), common directors/trustees, and/or common officers. Those purchase and sale transactions complied with provisions of Rule 17a-7 under the Investment Company Act of 1940 and were $765,865 and $0, respectively.
5. Borrowing Arrangements
The Trust participates in a $150 million credit facility, which was entered into to facilitate portfolio liquidity. Interest is charged to each participating fund based on its borrowings at a rate per annum equal to the Federal Funds rate plus 0.50%. In addition, a commitment fee of 0.08% per annum of the unutilized line of credit is accrued and apportioned among the participating funds based on their relative net assets. The commitment fee is included in "Other expenses" in the Statement of Operations. No amounts were borrowed by the Fund under this facility during the six months ended June 30, 2008.
6. Fund Share Transactions
Proceeds and payments on Fund shares as shown in the Statement of Changes in Net Assets are in respect of the following numbers of shares:
| | | Six months ended
June 30, 2008 | | Year ended
December 31, 2007 | |
| Shares sold | | | 1,084,657 | | | | 3,172,392 | | |
Shares issued in reinvestment
of dividend distributions | | | 6,005,699 | | | | 3,669,704 | | |
| Less shares redeemed | | | (2,600,532 | ) | | | (3,823,176 | ) | |
| Net increase in shares outstanding | | | 4,489,824 | | | | 3,018,920 | | |
7. Investment Transactions
The aggregate cost of purchases and proceeds from sales other than short-term obligations for the six months ended June 30, 2008 were $243,514,566 and $264,897,877, respectively.
8. Legal Proceedings
CWAM, Columbia Acorn Trust, (another mutual fund family advised by CWAM), and the trustees of Colombia Acorn Trust (collectively, the "Columbia defendants") are named as defendants in class and derivative complaints that have been consolidated in a Multi-District Action (the "MDL Action") in the federal district court of Maryland. These lawsuits contend that defendants permitted certain investors to market time their trades in certain Columbia Acorn Funds. The MDL Action is ongoing. However, all claims against Columbia Acorn Trust and the independent trustees of Columbia Acorn Trust have been dismissed.
Columbia Acorn Trust and CWAM are also defendants in a class action lawsuit that alleges, in summary, that Columbia Acorn Trust and CWAM exposed shareholders of Columbia Acorn International Fund to trading by market timers by allegedly: (a) failing to properly evaluate daily whether a significant event affecting the value of the fund's securities had occurred after foreign markets had closed but before the calculation of the funds' net asset value (NAV"); (b) failing to implement the fund's portfolio valuation and share pricing policies and procedures; and (c) failing to know and implement applicable rules and regulations concerning the calculation of NAV (the "Fair Valuation Lawsuit"). The Seventh Circuit ruled that the plaintiffs' state law claims were preempted under federal law resulting in the dismissal of plaintiffs' complaint. Plaintiffs appealed the Seventh Circuit's ruling to the United States Supreme Court. The Supreme Court reversed the Seventh Circuit's ruling on jurisdictional grounds and the case was ultimately remanded to the state court.
On March 21, 2005, a class action complaint was filed against the Columbia Acorn Trust and CWAM seeking to rescind the CDSC assessed upon redemption of Class B shares of Columbia Acorn Funds due to the alleged market timing of the Columbia Acorn Funds (the "CDSC Lawsuit"). In addition to the rescission of sales charges, plaintiffs seek recovery of actual damages, attorneys' fees and costs. The case has been transferred to the MDL Action in the federal district court of Maryland.
On September 14, 2007, the plaintiffs and the Columbia defendants named in the MDL Action, including the Columbia Funds, entered into a stipulation of settlement with respect to all Columbia-related claims in the MDL Action described above, including the CDSC and Fair Valuation Lawsuits. The settlement is subject to court approval.
CWAM, the Columbia Acorn Funds and the Trustees of the Trust are also defendants in a consolidated lawsuit filed in the federal district court of Massachusetts alleging that CWAM used Fund assets to make undisclosed payments to brokers as an incentive for the brokers to market the Funds over other mutual funds to investors. The complaint alleges CWAM and the Trustees of the Columbia Acorn Trust, along with certain affiliated entities and individuals, breached certain common law duties and federal laws.
On November 30, 2005, the judge dismissed all claims by plaintiffs and entered final judgment in favor of the defendants. The plaintiffs appealed to the United States Court of Appeals for the First Circuit on December 30, 2005. A stipulation and settlement agreement dated January 19, 2007 was filed in the First Circuit on February 14, 2007, with a joint stipulation of dismissal and motion for remand to obtain district court approval of the settlement. That joint motion was granted and the appeal was dismissed. On March 6, 2007, the case was remanded to the federal district court. The settlement, approved by the federal district court on September 18, 2007, became effective October 19, 2007. Pursuant to the settlement, the funds' advisor and/or its affiliates made certain payments, including plaintiffs' attorneys' fees and costs of notice to class members.
The Trust and CWAM intend to defend these suits vigorously.
As a result of these matters, or any adverse publicity or other developments resulting from them, there may be increased redemptions or reduced sales of Columbia Acorn fund shares, which could increase transaction costs or operating expenses, or have other adverse consequences for the Columbia Acorn funds. However, based on currently available information, the Columbia Acorn Trust believes that the likelihood that these lawsuits will have a material adverse impact on any fund is remote, and CWAM believes that the lawsuits are not likely to materially affect its ability to provide investment management services to the funds.
19
Wanger International 2008 Semiannual Report
Excerpt from:
Wanger Advisors Trust
Management Fee Evaluation of the Senior Officer
Prepared Pursuant to the New York Attorney General's
Assurance of Discontinuance
May 2008
20
Wanger International 2008 Semiannual Report
Introduction
The New York Attorney General's Assurance of Discontinuance ("Order") entered into by Columbia Management Advisors, Inc. ("CMAI") and Columbia Management Distributors, Inc., ("CMDI" and collectively with "CMAI," "CMG") in February 2005, allows CMAI to manage or advise a mutual fund only if the trustees of the fund appoint a "Senior Officer" to perform specified duties and responsibilities. One of these responsibilities includes "managing the process by which proposed management fees (including but not limited to, advisory fees) to be charged the [Funds] are negotiated so that they are negotiated in a manner which is at arms' length and reasonable and consistent with this Assurance of Discontinuance."
This is the second year that the Columbia Acorn Trust and Wanger Advisors Trust (collectively, the "Trusts") and each series thereof (the "Acorn funds," "WAT funds" or collectively, the "Funds") have been overseen by the same Board of Trustees ("Board"). The Order provides that this Board must determine the reasonableness of proposed "management fees" by using either an annual competitive bidding process supervised by the Senior Officer or Independent Fee Consultant, or by obtaining "an annual independent written evaluation prepared by or under the direction of the Senior Officer or the Independent Fee Consultant."
"Management fees" are only part of the costs and expenses paid by mutual fund shareholders. Fund expenses can vary depending upon the class of shares held but usually include: (1) investment management or advisory fees to compensate analysts and portfolio managers for stock research and portfolio management, as well as the cost of operating a trading desk; (2) administrative expenses incurred to prepare registration statements and tax returns, calculate the Funds' net asset values, maintain effective compliance procedures and perform recordkeeping services; (3) transfer agency costs for establishing accounts, accepting and disbursing funds, as well as overseeing trading in Fund shares; (4) custodial expenses incurred to hold the securities purchased by the Funds; and (5) distribution expenses, including commissions paid to brokers that sell the Fund shares to investors.
Columbia Wanger Asset Management, L.P. ("CWAM"), the advisor to the Funds, has proposed that the Trusts continue the existing separate agreements governing the first two categories listed above: an advisory agreement governing portfolio management, and an administration agreement governing certain administration and clerical services. Together the fees paid under these two agreements are referred to as "management fees." Other fund expenses are governed by separate agreements, in particular agreements with two CWAM affiliates: CMDI, the broker-dealer that underwrites and distributes the Funds' shares, and Columbia Management Services, Inc. ("CMSI"), the Funds' transfer agent. In conformity with the terms of the Order, this evaluation, therefore, addresses only the advisory and administrative contracts, and does not extend to the other agreements.
According to the Order, the Senior Officer's evaluation must consider at least the following:
(1) Management fees (including components thereof) charged to institutional and other clients of CWAM for like services;
(2) Management fees (including any components thereof) charged by other mutual fund companies for like services;
(3) Costs to CWAM and its affiliates of supplying services pursuant to the management fee agreements, excluding any intra-corporate profit;
(4) Profit margins of CWAM and its affiliates from supplying such services;
(5) Possible economies of scale as the Funds grow larger; and
(6) The nature and quality of CWAM's services, including the performance of each Fund.
In 2004, the Boards of the two Trusts, then separate groups, each appointed me Senior Officer under the Order. They also determined not to pursue a competitive bidding process and instead, charged me with the responsibility of evaluating the Funds' proposed advisory and administrative fee contracts with CWAM in conformity with the requirements of the Order. This Report is an annual evaluation required under the Order. In discharging their responsibilities, the independent Trustees have also consulted independent, outside counsel.
2007 Evaluation
This is the third annual evaluation prepared in connection with the Order. This evaluation follows the same structure as the earlier studies. Some areas are given more emphasis here, while others are given less. Still, the fundamental information gathered for this evaluation is largely the same as past years. Last year's evaluation is referred to here as the "2007 Study."
Process and Independence
The objectives of the Order are to insure the independent evaluation of the management fees paid by the Funds as well as to insure that all relevant factors are considered. In my view, this contract renewal process has been conducted at arms-length and with independence in gathering, considering and evaluating all relevant data. At the outset of the process, the Trustees sought and obtained from CWAM and CMG a comprehensive compilation of data regarding Fund performance and expenses, advisor profitability, and other information. The Board evaluated this information thoroughly. Performance and expense data was obtained from both Morningstar and Lipper, the leading consultants in this area. The rankings prepared by Morningstar and Lipper were independent and not influenced by the advisor.
In the course of its work, the Contract Committee gave careful consideration to the conclusions and recommendations contained in the 2007 Study. The Contract Committee gave particular emphasis to the issue of whether economies of scale were appropriately reflected in the Funds' fee schedules. The Board accepted and implemented several of the recommendations in this area contained in the 2007 Study.
21
Wanger International 2008 Semiannual Report
My evaluation of the advisory contract was shaped, as it was last year, by my experience as Chief Compliance Officer of the Trusts ("CCO"). As CCO, I report solely to the Board and have no reporting obligation to, or employment relationship with, CMG or its affiliates, except for administrative purposes. I have commented on compliance matters in evaluating the quality of service provided by CWAM.
This Report, its supporting materials and the data contained in other materials submitted to the Contract Committee of the Board, in my view, provide a thorough factual basis upon which the Board, in consultation with independent counsel as it deems appropriate, may conduct management fee negotiations that are in the best interests of the Funds' shareholders.
The Fee Reductions Mandated under the Order
Under the terms of the Order, CMG agreed to secure certain management fee reductions for the mutual funds advised by its affiliate investment advisors. In some instances, breakpoints were also established. Although neither CWAM nor the Trusts was a party to the Order, CWAM offered and the Board accepted certain advisory fee reductions during 2005. By the terms of the Order, these fees may not be increased before November 30, 2009. I have used these advisory fee levels, as modified thereafter, in this evaluation because they are the fees in the current agreements that CWAM proposes should be continued. Hence, these fee levels are the starting point of an evaluation.
Conclusions
My review of the data and other material above leads to the following conclusions with respect to the factors identified in the Order.
1. Performance. The domestic WAT Funds generally have achieved good to outstanding performance over the past five years. Wanger Select has, however, suffered a precipitous decline in ranking relative to its peers for the past year, and this trend merits the Trustees' continued attention. The international WAT Funds have relatively weaker relative long term records than do the domestic funds. All the WAT Funds, however, outperform their benchmarks, expose shareholders to less risk than competitors and achieve positive "alpha," a recognized measure of the added value of an investment manager.
2. Management Fees relative to Peers. Management fees vary by WAT Fund, but, in general, the WAT Funds impose higher fees than competing funds. Wanger Select and Wanger USA in particular were ranked by both Lipper and Morningstar at or below the median, and therefore impose higher fees than do the majority of their competitors.
3. Administrative Fees. The WAT Funds' administrative fees appear competitive in relation to their peers, and CWAM provides excellent administrative support for all the WAT Funds. There are clear advantages to retaining the advisor and its affiliates to perform these services. However, while economies of scale exist above current asset levels, the WAT Funds' administrative fee schedule provides no breakpoints.
4. Management Fees relative to Institutional and Other Mutual Fund Accounts. CWAM's focus is on its mutual funds. It does not actively seek to manage separate or institutional accounts. The few institutional accounts it does manage vary in rate structures. Some pay advisory fees commensurate with or higher than the WAT Funds. In a few instances, however, institutional accounts pay lower advisory fees than do the WAT Funds. One particular institutional account is significant in size and has been under CWAM's management for over 25 years.
5. Costs to CWAM and its Affiliates. CWAM's direct costs do not appear excessive. Overhead and indirect costs allocated to CWAM by its parent organizations, however, are significant and have increased dramatically in the past year. CWAM's affiliates report operating losses and therefore do not appear to enjoy excessive "fall out" benefits from CWAM's advisory agreement with the WAT Funds.
6. Profit Margins. CWAM's pre-marketing expense profit margins are at the top of the industry, though these comparisons are hampered by limited industry data. High profit margins are not unexpected for firms that manage large, successful funds and have provided outstanding investment performance for investors.
7. Economies of Scale. Economies of scale do exist at CWAM and will expand as the assets of the WAT Funds get larger. The Board has recently imposed additional breakpoints for some of the WAT Funds that will result in greater sharing of economies of scale.
8. Nature and Quality of Services. This category includes a variety of considerations that are difficult to quantify, yet can have a significant bearing on the performance of the Funds. Several areas merit comment.
a. Capacity. The WAT Funds have continued to grow, posing ever greater challenges in deploying assets effectively. While trends here merit continued monitoring, CWAM appears to be managing assets effectively.
b. Compliance. CWAM has a reasonably designed compliance program that protects shareholders.
9. Process. In my opinion, the process of negotiating an advisory contract for the WAT Funds has been conducted thoroughly and at arms' length. Further, the Trustees have sufficient information to evaluate management's proposal, and negotiate contract terms that are in the best interests of Fund shareholders.
22
Wanger International 2008 Semiannual Report
Recommendations
I believe the Trustees should:
1. Consider the addition of breakpoints to the WAT administrative fee contract to reflect the economies of scale present in performing these services, and, in fashioning those breakpoints, to consider the efficiencies achieved by CWAM by supporting both Trusts with the same staff performing largely identical tasks.
2. Focus their review on the WAT Funds' management fee levels in relation to their peers, in particular the fees paid by Wanger USA and Wanger Select.
3. Monitor Wanger Select to ensure that its long term performance is sustained.
Robert P. Scales
May 27, 2008
23
Wanger International 2008 Semiannual Report

Columbia Wanger Funds
Trustees
Robert E. Nason
Chairman of the Board
Allan B. Muchin
Vice Chairman of the Board
Laura M. Born
Michelle L. Collins
Maureen M. Culhane
Margaret M. Eisen
Jerome Kahn, Jr.
Steven N. Kaplan
David C. Kleinman
Charles P. McQuaid
James A. Star
Ralph Wanger
John A. Wing
Officers
Charles P. McQuaid
President
Ben Andrews
Vice President
Michael G. Clarke
Assistant Treasurer
Jeffrey R. Coleman
Assistant Treasurer
J. Kevin Connaughton
Assistant Treasurer
P. Zachary Egan
Vice President
Peter T. Fariel
Assistant Secretary
John M. Kunka
Assistant Treasurer
Joseph C. LaPalm
Vice President
Bruce H. Lauer
Vice President, Secretary and Treasurer
Louis J. Mendes III
Vice President
Robert A. Mohn
Vice President
Christopher J. Olson
Vice President
Robert P. Scales
Chief Compliance Officer, Chief Legal Officer, Senior Vice President and General Counsel
Linda K. Roth-Wiszowaty
Assistant Secretary
Transfer Agent,
Dividend Disbursing Agent
Columbia Management Services, Inc.
P.O.Box 8081
Boston, Massachusetts
02266-8081
Distributor
Columbia Management Distributors, Inc.
One Financial Center
Boston, Massachusetts
02111-2621
Investment Advisor
Columbia Wanger Asset Management, L.P.
227 West Monroe Street, Suite3000
Chicago, Illinois 60606
1-888-4-WANGER
(1-888-492-6437)
Legal Counsel
Bell, Boyd& Lloyd LLP
Chicago, Illinois
Independent Registered Public Accounting Firm
PricewaterhouseCoopers LLP
Chicago, Illinois
This report, including the schedules of investments and financial statements, is submitted for the general information of the shareholders of the Wanger Advisors Trust.
A description of the Fund's proxy voting policies and procedures and a copy of the Fund's voting record for the most recent 12-month period ended June 30 are available (i) on the Securities and Exchange Commission's website at www.sec.gov, and (ii) without charge, upon request, by calling 888-492-6437.
The Fund files a complete schedule of portfolio holdings with the SEC for the first and third quarters of each fiscal year on Form N-Q. The Fund's Form N-Q is available on the SEC's website at www.sec.gov and may be reviewed and copied at the SEC's Public Reference Room in Washington, D.C. Information on the operation of the Pubic Reference Room may be obtained by calling 800-SEC-0330.
24
Columbia Wanger Funds
0L2568S
SHC-44/155062-0608 08/55098
Wanger Select
2008 Semiannual Report

| NOT FDIC INSURED | | May Lose Value | |
|
| NOT BANK ISSUED | | No Bank Guarantee | |
|

Wanger Select
2008 Semiannual Report
Table of Contents
| | 1 | | | Understanding Your Expenses | |
|
| | 2 | | | Perceptions of Risk | |
|
| | 4 | | | Performance Review | |
|
| | 6 | | | Statement of Investments | |
|
| | 9 | | | Statement of Assets and Liabilities | |
|
| | 9 | | | Statement of Operations | |
|
| | 10 | | | Statement of Changes in Net Assets | |
|
| | 11 | | | Financial Highlights | |
|
| | 12 | | | Notes to Financial Statements | |
|
| | 15 | | | Management Fee Evaluation of the Senior Officer | |
|
Columbia Wanger Asset Management, L.P. ("CWAM") is one of the leading global small- and mid-cap equity managers in the United States with more than 37 years of small- and mid-cap investment experience. As of June 30, 2008, CWAM manages $32.2 billion in assets and is the investment advisor to Wanger USA, Wanger International, Wanger Select, Wanger International Select (together, the "Wanger Advisors Trust Funds") and the Columbia Acorn Family of Funds. Columbia Management Group, LLC ("Columbia Management") is the investment management division of Bank of America Corporation. Columbia Management entities furnish investment management services and products for institutional and individual investors. The Wanger Advisors Trust Funds and the Columbia Acorn Family of Funds (together with other funds advised by Columbia Management affiliates, the "Columbia Funds") are distributed by Columbia Management Distributors, Inc., member of FINRA, SIPC, part of Columbia Management and an affiliate of Bank of America Corporation. CWAM is an SEC-registered investment advisor and indirect, wholly owned subsidiary of Bank of America Corporation. CWAM is part of Columbia Management.
Please consider the investment objectives, risks, charges and expenses for the Fund carefully before investing. Contact 1-888-4-WANGER for a prospectus, which contains this and other important information about the Fund. You should read it carefully before you invest.
The views expressed in "Perceptions of Risk" and in the Performance Review reflect the current views of the respective parties. These views are not guarantees of future performance and involve certain risks, uncertainties and assumptions that are difficult to predict so actual outcomes and results may differ significantly from the views expressed. These views are subject to change at any time based upon economic, market or other conditions and the respective parties disclaim any responsibility to update such views. These views may not be relied on as investment advice and, because investment decisions for a Columbia Fund are based on numerous factors, may not be relied on as an indication of trading intent on behalf of any particular Columbia Fund. References to specific company securities should not be construed as a recommendation or investment advice.
Wanger Select 2008 Semiannual Report
Understanding Your Expenses
As a Fund shareholder, you incur two types of costs. There are transaction costs, which generally include sales charges on purchases and may include redemption or exchange fees. There are also ongoing costs, which generally include investment advisory fees and other Fund expenses. The information on this page is intended to help you understand your ongoing costs of investing in the Fund and to compare these costs with the ongoing costs of investing in other mutual funds.
Analyzing your Fund's expenses
To illustrate these ongoing costs, we have provided an example and calculated the expenses paid by investors in the Fund during the period. The information in the following table is based on an initial hypothetical investment of $1,000, which is invested at the beginning of the period and held for the entire period. Expense information is calculated two ways and each method provides you with different information. The amount listed in the "Actual" column is calculated using actual operating expenses and total return for the Fund. The amount listed in the "Hypothetical" column assumes that the return each year is 5% before expenses and then applies the Fund's actual expense ratio for the period to the hypothetical return. You should not use the hypothetical account values and expenses to estimate either your actual account balance at the end of the period or the expenses you paid during the period. See the "Compare with other fun ds" information for details on using the hypothetical data.
Estimating your actual expenses
To estimate the expenses that you actually paid over the period, first you will need your account balance at the end of the period.
1. Divide your ending account balance by $1,000. For example, if an account balance was $8,600 at the end of the period, the result would be 8.6.
2. In the section of the table below titled "Expenses paid during the period," you will find a dollar amount in the column labeled "Actual." Multiply this amount by the result from step 1. Your answer is an estimate of the expenses you paid on your account during the period.
January 1, 2008 – June 30, 2008
| | | Account value at the
beginning of the period ($) | | Account value at the
end of the period ($) | | Expenses paid during
period ($) | | Fund's annualized
expense ratio (%)* | |
| | | Actual | | Hypothetical | | Actual | | Hypothetical | | Actual | | Hypothetical | | Actual | |
| Wanger Select | | | 1,000.00 | | | | 1,000.00 | | | | 942.42 | | | | 1,020.39 | | | | 4.35 | | | | 4.52 | | | | 0.90 | | |
*For the six months ended June 30, 2008.
Expenses paid during the period are equal to the Fund's annualized expense ratio, multiplied by the average account value over the period, then multiplied by the number of days in the Fund's most recent fiscal half-year and divided by 366.
It is important to note that the expense amounts shown in the table are meant to highlight only ongoing costs of investing in the Fund. Expenses paid during the period do not include any insurance charges imposed by your insurance company's separate account. The hypothetical example provided is useful in comparing ongoing costs only and will not help you determine the relative total costs of owning different funds whose shareholders may incur transaction costs.
Compare with other funds
Since all mutual funds are required to include the same hypothetical calculations about expenses in shareholder reports, you can use this information to compare the ongoing cost of investing in the Fund with other funds. To do so, compare the 5% hypothetical example with the 5% hypothetical examples of other funds. As you compare hypothetical examples of other funds, it is important to note that hypothetical examples are meant to highlight the ongoing cost of investing in a fund and do not reflect any transaction costs, such as sales charges, redemption fees or exchange fees that may be incurred by shareholders of other funds. Expenses paid during the period do not include any insurance charges imposed by your insurance company's separate accounts.
1
Wanger Select 2008 Semiannual Report

Perceptions of Risk
Most people tend to calibrate risk poorly. We overestimate the likelihood of being harmed by the things that make the evening news and underestimate those that don't. In a survey, people estimated that the chance of death by accident matched the chance of death by disease. In fact, disease causes 17-times more deaths than accidents.1
Dan Gardner's, Risk, The Science and Politics of Fear,2 explains why our views and actions are often so distorted. It seems our perceptions are most influenced by preconceived notions, reinforced by recent information. Accidents are newsworthy, as are catastrophes. If fatalities occur in large numbers in a single event—instead of in small numbers dispersed over time—our perception of risk rises.3
Besides catastrophes, it won't shock too many parents to learn that we tend to worry a lot about our children. Other things that we can't control, like airplane flights, can be worrisome, while things that we can control, such as automobiles, evoke less fear despite higher risks. Things that we don't understand such as trace chemicals,4 and other man-made risks like nuclear power, are also feared. Many people worry about radiation from cell phones, while ignoring the real hazard of driving while using cell phones. Many non-headline risks caused by nature, such as radon gas, which kills an estimated 41,000 people a year in the U.S. and Europe,5 tend to be downplayed.
Gardner notes that we are living longer in the safest era ever known to mankind. Horrible diseases like smallpox have been eliminated while others have been drastically curtailed. Childhood mortality has especially plunged and accident rates are also down.
Fear Mongering Profiteers
So who is putting the scary thoughts into our heads? The media is an obvious culprit because sensational stories sell newspapers and increase viewership. Companies trying to sell certain health care products or security services and devices also find fear mongering to be profitable. The number of companies lobbying homeland security officials rose from 15 in 2001 to 861 in 2004 as fears of terrorist attacks swelled.6 Trial lawyers reaping the rewards of questionable lawsuits, politicians pandering for votes and special interest groups seeking funding also try to keep people scared.
Fear can end up increasing risks. People need to remember the classic definition of risk: probability times consequences. Avoiding immunizations or weight loss treatments due to possible side effects can be ill advised. Diabetes, a disease linked to obesity, has been diagnosed in 24 million Americans. That's eight percent of the total population.7
The American Council on Science and Health is dedicated to separating real health risks from unfounded health scares, tracking health scares reported by the press and debunking them. Among the top scares in 2007 were allegations that lipstick, fluoridated water, roses and water bottles are hazardous. Among the top scares of all time were cranberries (1959), DDT (1962), cyclamates (1969), Alar (1989), cellular phone radiation (1993) and trace PCBs in farmed salmon (2003).8 Fumes from new shower curtains may make the list this year!
Rational Understanding of Risk
Peter L. Bernstein's, Against The Gods, The Remarkable Story of Risk,9 is a fascinating review of mankind's history of approaching risk, and how to understand, measure and deal with it. He reviews the advances in probability theory, which enabled the creation of insurance and, in turn, facilitated trade and investment. He states that managing risks depends on the use of three assumptions originated by Jacob Bernoulli around the year 1700: full information, independent trials and relevance of quantitative valuation.
Bernstein explores additional progress in risk management, particularly in investing. Diversification may reduce risk. However, some quantitative techniques for investing have failed. "Portfolio insurance," a quantitative approach to reduce equity holdings in market declines via the purchase of put options, intensified the market collapse of 1987. Subsequent to the book's publication, numerous quant managers have claimed that "six sigma" events (one in a million chance of occurring) caused huge losses in their funds. These failures occurred because the investment models violated Bernoulli's "independent trials" assumption stated above. Stock price movements may look independent, until numerous people attempt the same strategies or until human emotions result in lots of investors reacting in similar manners.
Stock Market Risks
Sentiment in the stock market seems to gyrate between greed and fear, creating bull and bear markets. Because the S&P 500 Index has fallen more than 20% from its peak, a bear market has been proclaimed. This suggests that the market is currently focusing on fear.
I recall a long-ago brokerage firm ad listing people's fears each year for decades. The list likely included events like the Cuban Missile Crisis and Three Mile Island. It noted that there seemed to be a reason to avoid investing in stocks each year. But starting with $1,000 50 years ago, an investment in the S&P 500 would have resulted in $140,364 as of June 30, 2008, vs. $13,619 if invested in super safe treasury bills. Meanwhile, inflation would require $7,535 to buy in 2008 what $1,000 bought in 1958.10 This example suggests that staying out of stocks would have been a very bad decision.
Market strategist Steve Leuthold provides lots of data and perspectives. Based on his estimate of "operating" (recurring) earnings, the S&P 500 at its July 11, 2008, close of 1,239 was selling at about 14.5-times earnings.
2
Wanger Select 2008 Semiannual Report
That multiple matched the depths of the 2002-2003 bear market and was below the market's average price-earnings (PE) ratio11 of 16.5-times, calculated since 1926. Leuthold notes that market price-earnings ratios vary a lot, and that inflation is a major driver of PE ratios. When inflation has varied between zero and 5%, PE ratios averaged 18- to 19-times. When inflation has been between 5% and 7%, PE ratios averaged 13.8-times, and when inflation was 7% or more, PE ratios averaged 11.4-times.12
Inflation has been boosted by fuel and food prices, and the Consumer Price Index recently spiked up to a 5% year-over-year gain. Some are concerned that we may be returning to a period of big government and stagflation. Future inflation is indeed unpredictable, but continued surges in fuel and food prices from current lofty levels seem unlikely. Low unit labor cost increases, continued globalization and the continued success of capitalism all suggest that inflation may slow. If inflation does slow, Leuthold's data suggests that PE ratios and stock prices can rise a lot.
We are stock pickers rather than economists, and we are now seeing what we believe to be many more excellent investment opportunities than we've seen for several years. Consequently, focusing on fear seems like a mistake and taking a longer term perspective seems to be more rational.


Charles P. McQuaid
President and Chief Investment Officer
Columbia Wanger Asset Management, L.P.
The information and data provided in this analysis are derived from sources that we deem to be reliable and accurate. These views are not guarantees of future performance and involve certain risks, uncertainties and assumptions that are difficult to predict so actual outcomes and results may differ significantly from the views expressed. The views/opinions expressed in this essay are those of the author and not of the Columbia Wanger Advisors Trust Board, are subject to change at any time based upon economic, market or other conditions, may differ from views expressed by other Columbia Management associates or other divisions of Bank of America and the respective parties disclaim any responsibility to update such views. These views may not be relied on as investment advice and, because investment decisions for a Columbia Wanger Fund are based on numerous factors, may not be relied on as an indication of trading intent on beha lf of any particular Columbia Wanger Fund.
1 Gardner, Dan, Risk, the Science and Politics of Fear, (Virgin Book Ltd, 2008), pg. 13.
2 In addition to Gardner's book on the subject of risk, I also recommend Panicology written by statisticians Simon Briscoe and Hugh Aldersey-Williams (Viking/Penguin Books, 2008).
3 Gardner, Dan, op. cit., pgs. 62-76.
4 Gardner notes that our ability to find trace chemicals has never been better. Today we have the technology to dissect the components of drinking water, for example, to the level of one part per billion—equivalent to a single grain of sugar in an Olympic-size swimming pool. While it's true that the elements in trace chemicals can cause cancer, science and testing almost never look at such trace amounts.
5 Gardner, Dan, op. cit., pg. 81.
6 Ibid, pg. 281.
7 Source: American Council on Science and Health, "ACSH Morning Dispatch," June 25, 2008.
8 The study titled, "Fact Versus Fears (Fourth Edition)" is available on the American Council on Science and Health website at www.acsh.org.
9 Bernstein, Peter L., Against the Gods, The Remarkable Story of Risk, (John Wiley & Sons, Inc., 1996).
10 Figures include the reinvestment of dividends and are pretax.
11 The price-earnings (PE) ratio reflects the price of a stock divided by earnings per share. This ratio gives investors an idea of how much they are paying for a company's earning power. In general, the higher the PE, the more investors are paying, and therefore the more earnings growth they are expecting.
12 Leuthold Weeden Institutional Research, "Perception For The Professional," August 2008, Vol. 28 No. 8.
3
Wanger Select 2008 Semiannual Report

Performance Review Wanger Select

Ben Andrews
Portfolio Manager
Performance data quoted represents past performance and current performance may be lower or higher. Past performance is no guarantee of future results. The investment return and principal value of an investment in the Fund will fluctuate so that shares, when redeemed, may be worth more or less than the original cost. Performance may reflect any voluntary waivers or reimbursements of fund expenses by the advisor or its affiliates. Absent these waivers, or reimbursement arrangements, performance results may be lower. For daily and month-end performance updates, please call 1-888-4-WANGER.
Wanger Select ended the six-month period down 5.76%. This compares to a 3.90% decline for the S&P MidCap 400 Index and a decline of 11.91% for the S&P 500 Index.
Potash Corp. of Saskatchewan was the Fund's top contributor for the half year. Its stock has continued to move up on the strong price increases in the potash market. The spot potash price in some international markets is now over $1,000 per ton, which is up about four-fold from the price at which it was selling when we first added the stock to the Fund's portfolio. Pacific Rubiales Energy and Tetra Technologies, which have an energy or raw materials focus, were also upside drivers.
On the down side, Globalstar dropped 66% in the half. The valuation multiple of the stock has continued to compress over the last few quarters. In this market environment, if a company is not showing solid growth characteristics, no matter what its assets might be worth, its valuation multiple has contracted. Online travel service provider Expedia plunged 42% in the half, also on macroeconomic concerns, despite fine earnings growth. Uranium One fell 47% due to price softness in the spot uranium market and continued delays in the ramp-up of commercial production at several mines.
Though the market rallied in the second quarter, many stocks are still trading in downward trend patterns, or are establishing lower highs on market advances and lower lows on market sell offs. As I write this in early July, the stock market sentiment is again quite negative with many economic and market sages saying they aren't sure when the U.S. housing market will recover. But a lot of damage has already been done to sectors outside of energy and raw materials, even more so than when I commented on this in the first two weeks of January. We most likely haven't seen the end of the financial distress. How much deleveraging is to come of personal, as well as business, balance sheets is still unknown.
With that being said, I am finding more potential ideas to add to the portfolio than at any other time since I became manager of this Fund in 2004. Our CWAM internal stock database, built by our analysts, shows numerous names with strong potential returns. Banks have been absent from the portfolio for over a year now but are being studied as possible additions into the Fund. Many other groups like consumer services, media, semiconductors and telecom are off more than 17% year to date. Our style of being eclectic, opportunistic and concentrated should prove valuable in this environment.
Risks include stock market fluctuations due to economic and business developments. The Fund also has potentially greater price volatility due to the Fund's concentration in a limited number of stocks of mid-size companies. The Fund is a non-diversified fund and may, therefore, have a greater risk of loss from a few issuers than a similar fund that invests more broadly. The Fund may not operate as a nondiversified fund at all times. International investments involve greater potential risks, including less regulation, currency fluctuations, economic instability and political developments.
Fund's Positions in Mentioned Holdings
As a percentage of net assets, as of 6/30/08
| Potash Corp. of Saskatchewan | | | 8.1 | % | |
| Pacific Rubiales Energy | | | 5.5 | | |
| Tetra Technologies | | | 4.7 | | |
| Uranium One | | | 3.6 | | |
| Expedia | | | 2.3 | | |
| Globalstar | | | 1.1 | | |
Portfolio holdings are subject to change periodically and may not be representative of current holdings.
4
Wanger Select 2008 Semiannual Report
Growth of a $10,000 Investment in
Wanger Select
Total return for each period,
February 1, 1999 (inception date) through June 30, 2008

This graph compares the results of $10,000 invested in Wanger Select on February 1, 1999 (the date the Fund began operations) through June 30, 2008, to the S&P MidCap 400 Index, with dividends and capital gains reinvested. Part of the performance shown is due to the Fund's purchase of securities in IPOs. The impact of IPO purchases declines as a Fund grows large. Performance results reflect any fee waivers or reimbursements of Fund expenses by CWAM or any of its affiliates. Absent these fee waivers or expense reimbursement arrangements, performance results would have been lower. Performance shown here is past performance, which cannot guarantee future results. Current performance may be higher or lower. The investment return and principal value of an investment in the Fund will fluctuate so that Fund shares, when redeemed, may be worth more or less than their original cost. Performance changes over time. Current returns f or the Fund may be different than that shown. For daily and most recent month-end performance updates, please contact us at 1-888-4-WANGER.
Results to June 30, 2008
| | | 2nd quarter | | Year to date | | 1 year | |
| Wanger Select | | | 9.71 | % | | | -5.76 | % | | | -11.47 | % | |
| S&P MidCap 400 Index | | | 5.43 | | | | -3.90 | | | | -7.34 | | |
| S&P 500 Index | | | -2.73 | | | | -11.91 | | | | -13.12 | | |
NAV as of 6/30/08: $25.66
Performance numbers reflect all Fund expenses but do not include any insurance charge imposed by your insurance company's separate accounts. If performance included the effect of these additional charges, it would be lower.
The Fund's annual operating expense ratio is 0.90%. The annual operating expense ratio is as stated in the Fund's prospectus that is current as of the date of this report. Differences in expense ratios disclosed elsewhere in this report may result from including fee waivers and expense reimbursements as well as different time periods used in calculating the ratios.
All results shown assume reinvesment of distributions and do not reflect taxes that a shareholder would pay on Fund distributions or the sale of Fund shares.
The S&P MidCap 400 Index is a market value-weighted index that tracks the performance of 400 mid-cap U.S. companies. The S&P 500 tracks the performance of 500 widely-held large capitalization U.S. stocks. Indexes are not managed and do not incur fees or expenses. It is not possible to invest directly in an index.
Portfolio characteristics and holdings are subject to change periodically and may not be representative of current characteristics and holdings.
Top 5 Industries
As a percentage of net assets, as of 6/30/08
| Energy & Minerals | | | 29.0 | % | |
| Consumer Goods & Services | | | 25.0 | | |
| Information | | | 19.6 | | |
| Industrial Goods & Services | | | 11.4 | | |
| Finance | | | 10.1 | | |
Top 10 Holdings
As a percentage of net assets, as of 6/30/08
1. Potash Corp. of Saskatchewan (Canada)
World's Largest Producer of Potash | | | 8.1 | % | |
2. ITT Educational Services
Post-secondary Degree Services | | | 6.2 | | |
3. Pacific Rubiales Energy (Canada)
Oil Production & Exploration in Colombia | | | 5.5 | | |
4. Tetra Technologies
U.S.-based Services Company with Life of Field Approach | | | 4.7 | | |
5. Abercrombie & Fitch
Teen Apparel Retailer | | | 3.7 | | |
6. Safeway
Supermarkets | | | 3.6 | | |
7. Conseco
Life, Long-term Care & Medical Supplemental Insurance | | | 3.6 | | |
8. Quanta Services
Electrical & Telecom Construction Services | | | 3.6 | | |
9. Uranium One (South Africa)
Uranium Mines in South Africa, Kazakhstan, Australia & the U.S. | | | 3.6 | | |
10. Janus Capital Group
Manages Mutual Funds | | | 3.5 | | |
5
Wanger Select 2008 Semiannual Report
Wanger Select
Statement of Investments (Unaudited) June 30, 2008
Number of
Shares | | | | Value | |
| | | Common Stocks – 98.6% | |
| | | Energy & Minerals – 29.0% | |
| | | Mining – 11.7% | |
| | 105,000 | | | Potash Corp. of Saskatchewan (Canada)
World's Largest Producer of Potash | | $ | 23,999,850 | | |
| | 2,255,600 | | | Uranium One (South Africa) (a)
Uranium Mines in South Africa,
Kazakhstan, Australia & the U.S. | | | 10,617,711 | | |
| | | | | | | | 34,617,561 | | |
| | | Oil Services – 8.6% | |
| | 591,500 | | | Tetra Technologies (a)
U.S.-based Service Company
with Life of Field Approach | | | 14,024,465 | | |
| | 128,000 | | | FMC Technologies (a)
Oil & Gas Wellhead Manufacturer | | | 9,847,040 | | |
| | 13,000 | | | Diamond Offshore
Contract Driller | | | 1,808,820 | | |
| | | | | | | | 25,680,325 | | |
| | | Oil & Gas Producers – 5.5% | |
| | 917,500 | | | Pacific Rubiales Energy (Canada) (a)(b) | | | 11,963,131 | | |
| | 322,158 | | | Pacific Rubiales Energy-Warrants
(Canada) (a) (b) | | | 2,205,062 | | |
| | 160,166 | | | Pacific Rubiales Energy (Canada) (a)
Oil Production & Exploration in Colombia | | | 2,109,473 | | |
| | | | | | | | 16,277,666 | | |
| | | Alternative Energy – 3.2% | |
| | 157,100 | | | Canadian Solar (a)
Solar Cell & Module Manufacturer | | | 6,313,849 | | |
| | 255,000 | | | Synthesis Energy Systems (a)
Owner/Operator of Gasification Plants | | | 2,295,000 | | |
| | 159,000 | | | Real Goods Solar (a)
Residential Solar Energy Installer | | | 977,850 | | |
| | | | 9,586,699 | | |
| | | | | Total Energy & Minerals | | | 86,162,251 | | |
| | | Consumer Goods & Services – 25.0% | |
| | | Retail – 10.4% | |
| | 176,000 | | | Abercrombie & Fitch
Teen Apparel Retailer | | | 11,031,680 | | |
| | 378,000 | | | Safeway
Supermarkets | | | 10,791,900 | | |
Number of
Shares | | | | Value | |
| | 91,000 | | | Costco Wholesale | | $ | 6,382,740 | | |
| | | | | Warehouse Superstores | | | | | |
| | 474,000 | | | Chico's FAS (a)
Women's Specialty Retailer | | | 2,545,380 | | |
| | | | | | | | 30,751,700 | | |
| | | Other Consumer Services – 7.5% | |
| | 224,100 | | | ITT Educational Services (a)
Post-secondary Degree Services | | | 18,517,383 | | |
| | 160,000 | | | Career Education (a)
Post-secondary Education | | | 2,337,600 | | |
| | 118,100 | | | Universal Technical Institute (a)
Vocational Training | | | 1,471,526 | | |
| | | | | | | | 22,326,509 | | |
| | | Travel – 3.0% | |
| | 378,000 | | | Expedia (a)
Online Travel Services Company | | | 6,947,640 | | |
| | 210,000 | | | Hertz (a)
Largest U.S. Rental Car Operator | | | 2,016,000 | | |
| | | | | | | | 8,963,640 | | |
| | | Apparel – 1.6% | |
| | 170,000 | | | Coach (a)
Designer & Retailer of Branded
Leather Accessories | | | 4,909,600 | | |
| | | Furniture & Textiles – 0.8% | |
| | 192,000 | | | Knoll
Office Furniture | | | 2,332,800 | | |
| | | Leisure Products – 0.8% | |
| | 64,000 | | | Harley-Davidson
Motorcycles & Related Merchandise | | | 2,320,640 | | |
| | | Food & Beverage – 0.5% | |
| | 956,900 | | | Fu Ji Food & Catering Services (China)
Food Catering Service Provider in China | | | 1,484,945 | | |
| | | Casinos & Gaming – 0.4% | |
| | 3,865,100 | | | Nagacorp (Hong Kong)
Monopoly Casino in Central Cambodia | | | 1,040,971 | | |
| | 826,600 | | | RexCapital Finance (China) (a)
Chinese Lottery | | | 82,689 | | |
| | | | 1,123,660 | | |
| | | | | Total Consumer Goods & Services | | | 74,213,494 | | |
See accompanying notes to financial statements.
6
Wanger Select 2008 Semiannual Report
Wanger Select
Statement of Investments (Unaudited) June 30, 2008
Number of
Shares | | | | Value | |
| | | Information – 19.6% | |
| | | Mobile Communications – 4.5% | |
| | 245,000 | | | American Tower (a)
Communications Towers in USA & Mexico | | $ | 10,351,250 | | |
| | 1,107,900 | | | Globalstar (a)
Satellite Mobile Voice & Data Carrier | | | 3,135,357 | | |
| | | | | | | | 13,486,607 | | |
| | | Business Software – 3.1% | |
| | 959,000 | | | Novell (a)
Directory, Operating System &
Identity Management Software | | | 5,648,510 | | |
| | 211,000 | | | Avid Technology (a)
Digital Nonlinear Editing Software & Systems | | | 3,584,890 | | |
| | | | | | | | 9,233,400 | | |
| | | Telecommunications Equipment – 2.8% | |
| | 1,785,000 | | | Tellabs (a)
Telecommunications Equipment | | | 8,300,250 | | |
| | | CATV – 2.0% | |
| | 266,000 | | | Discovery Holding (a)
CATV Programming | | | 5,841,360 | | |
| | | Contract Manufacturing – 1.8% | |
| | 4,255,000 | | | Sanmina-SCI (a)
Electronic Manufacturing Services | | | 5,446,400 | | |
| | | Internet Related – 1.8% | |
| | 600,000 | | | SkillSoft – ADR (a)
Web-based Learning Solutions (E-Learning) | | | 5,424,000 | | |
| | | Advertising – 1.5% | |
| | 284,000 | | | VisionChina Media – ADR (China) (a)
Advertising on Digital Screens in
China's Mass Transit System | | | 4,507,080 | | |
| | | Financial Processors – 1.1% | |
| | 352,000 | | | Cardtronics (a)
Operates the World's Largest Network of ATMs | | | 3,122,240 | | |
| | | Computer Services – 1.0% | |
| | 143,600 | | | WNS – ADR (a)
Offshore BPO (Business Process
Outsourcing) Services | | | 2,419,660 | | |
| | 86,500 | | | Hackett Group (a)
IT Integration & Best Practice Research | | | 496,510 | | |
| | | | 2,916,170 | | |
| | | | | Total Information | | | 58,277,507 | | |
Number of
Shares | | | | Value | |
| | | Industrial Goods & Services – 11.4% | |
| | | Other Industrial Services – 5.0% | |
| | 152,000 | | | Expeditors International of Washington
International Freight Forwarder | | $ | 6,536,000 | | |
| | 310,000 | | | American Commercial Lines (a)
Operator/Builder of Inland Barges | | | 3,388,300 | | |
| | 132,000 | | | Mobile Mini (a)
Portable Storage Units Leasing | | | 2,640,000 | | |
| | 140,700 | | | American Reprographics (a)
Document Management & Logistics | | | 2,342,655 | | |
| | | | | | | | 14,906,955 | | |
| | | Outsourcing Services – 3.6% | |
| | 320,000 | | | Quanta Services (a)
Electrical & Telecom Construction Services | | | 10,646,400 | | |
| | | Waste Management – 2.0% | |
| | 160,000 | | | Waste Management
U.S. Garbage Collection & Disposal | | | 6,033,600 | | |
| | | Industrial Materials & Specialty Chemicals – 0.8% | |
| | 101,000 | | | Israel Chemicals (Israel)
Producer of Potash, Phosphates,
Bromine and Specialty Chemicals | | | 2,353,398 | | |
| | | | | Total Industrial Goods & Services | | | 33,940,353 | | |
| | | Finance – 10.1% | |
| | | Brokerage & Money Management – 5.7% | |
| | 395,000 | | | Janus Capital Group
Manages Mutual Funds | | | 10,455,650 | | |
| | 170,000 | | | SEI Investments
Mutual Fund Administration &
Investment Management | | | 3,998,400 | | |
| | 391,800 | | | MF Global (a)
Futures Broker | | | 2,472,258 | | |
| | | | | | | | 16,926,308 | | |
| | | Insurance – 4.4% | |
| | 1,080,000 | | | Conseco (a)
Life, Long-term Care & Medical Supplement Insurance | | | 10,713,600 | | |
| | 5,900 | | | Markel (a)
Specialty Insurance | | | 2,165,300 | | |
| | | | 12,878,900 | | |
| | | | | Total Finance | | | 29,805,208 | | |
See accompanying notes to financial statements.
7
Wanger Select 2008 Semiannual Report
Wanger Select
Statement of Investments (Unaudited) June 30, 2008
Number of Shares
or Principal Amount | | | | Value | |
| | | Other Industries – 2.1% | |
| | | Transportation – 2.1% | |
| | 186,000 | | | JB Hunt Transport Services
Truck & Intermodal Carrier | | $ | 6,190,080 | | |
| | | | | Total Other Industries | | | 6,190,080 | | |
| | | Health Care – 1.4% | |
| | | Pharmaceuticals – 1.4% | |
| | 64,000 | | | Cephalon (a)
Specialty Pharmaceuticals for Pain,
Central Nervous System & Oncology | | | 4,268,160 | | |
| | | | | Total Health Care | | | 4,268,160 | | |
| Total Common Stocks (Cost: $260,762,333) – 98.6% | | | 292,857,053 | | |
| Short-Term Obligations – 1.8% | | | |
| | | Commercial Paper – 1.5% | |
| $ | 1,500,000 | | | Toyota Motor Credit
1.900% due 07/01/08 | | | 1,500,000 | | |
| | 1,500,000 | | | General Electric Capital
1.950% due 07/02/08 | | | 1,499,919 | | |
| | 1,500,000 | | | Nestle Capital
2.160% due 07/08/08 (c) | | | 1,499,370 | | |
| | | | | | | | 4,499,289 | | |
| | | Repurchase Agreement – 0.3% | |
| | 703,000 | | | Repurchase Agreement with
Fixed Income Clearing Corp.,
dated 06/30/08, due 07/01/08 at 1.80%,
collateralized by a U.S. Treasury Obligation,
maturing 02/15/10, market value of $720,963
(repurchase proceeds $703,035) | | | 703,000 | | |
| Total Short-Term Obligations (Cost: $5,202,289) | | | 5,202,289 | | |
| Total Investments (Cost: $265,964,622) – 100.4% (d)(e) | | | 298,059,342 | | |
| Cash and Other Assets Less Liabilities – (0.4)% | | | (1,154,936 | ) | |
| Total Net Assets – 100.0% | | $ | 296,904,406 | | |
Notes to Statement of Investments:
(a) Non-income producing security.
(b) Denotes a restricted security, which is subject to restrictions on resale under federal securities laws. These securities are valued in good faith by the Board of Trustees. At June 30, 2008, these securities amounted to $14,168,193 which represents 4.77% of total net assets.
Additional information on these securities is as follows:
Acquisition
Security | | Dates | | Shares | | Cost | | Value | |
Pacific Rubiales
Energy | | 7/12/07 | | | 917,500 | | | $ | 4,132,484 | | | $ | 11,963,131 | | |
Pacific Rubiales
Energy-Warrants | | 7/12/07 | | | 322,158 | | | | 551,426 | | | | 2,205,062 | | |
| | | | | | | $ | 4,683,910 | | | $ | 14,168,193 | | |
(c) Securities exempt from registration under Section 4(2) of the Securities Act of 1933. These securities may only be resold in exempt transactions to qualified buyers. Private resales of these securities to qualified institutional buyers are also exempt from registration pursuant to Rule 144A under the Securities Act of 1933. At June 30, 2008, this security represents 0.51% of net assets.
(d) On June 30, 2008, the market value of foreign securities represents 14.04% of total net assets. The Fund's foreign portfolio was diversified as follows:
| Currency | | Value | | Cost | | % of
Net Assets | |
| Canadian Dollar | | $ | 36,727,034 | | | $ | 18,844,706 | | | | 12.37 | | |
| Hong Kong Dollar | | | 2,608,605 | | | | 2,748,945 | | | | 0.88 | | |
| Israel Shekel | | | 2,353,398 | | | | 1,681,084 | | | | 0.79 | | |
| | | $ | 41,689,037 | | | $ | 23,274,735 | | | | 14.04 | | |
(e) At June 30, 2008, for federal income tax purposes cost of investments was $265,964,622 and net unrealized appreciation was $32,094,720 consisting of gross unrealized appreciation of $88,308,710 and gross unrealized depreciation of $56,213,990.
At June 30, 2008, the Fund held investments in the following sectors:
| Sector | | % of
Net Assets | |
| Energy & Minerals | | | 29.0 | | |
| Consumer Goods & Services | | | 25.0 | | |
| Information | | | 19.6 | | |
| Industrial Goods & Services | | | 11.4 | | |
| Finance | | | 10.1 | | |
| Other Industries | | | 2.1 | | |
| Health Care | | | 1.4 | | |
| Short-Term Obligations | | | 1.8 | | |
| Cash and Other Assets Less Liabilities | | | (0.4 | ) | |
| | | | 100.0 | | |
ADR = American Depositary Receipts
See accompanying notes to financial statements.
8
Wanger Select 2008 Semiannual Report
Statement of Assets and Liabilities
June 30, 2008 (Unaudited)
| Assets: | |
| Investments, at cost | | $ | 265,964,622 | | |
| Investments, at value | | $ | 298,059,342 | | |
| Cash | | | 995 | | |
| Foreign currency (cost of $11,095) | | | 11,113 | | |
| Receivable for: | |
| Investments sold | | | 921,177 | | |
| Fund shares sold | | | 664 | | |
| Interest | | | 35 | | |
| Dividends | | | 39,157 | | |
| Total Assets | | | 299,032,483 | | |
| Liabilities: | |
| Payable for: | |
| Investments purchased | | | 764,386 | | |
| Fund shares repurchased | | | 1,114,760 | | |
| Investment advisory fee | | | 202,883 | | |
| Administration fee | | | 12,680 | | |
| Transfer agent fee | | | 17 | | |
| Trustees' fees | | | 481 | | |
| Custody fee | | | 1,041 | | |
| Trustees' deferred compensation plan | | | 10,622 | | |
| Other liabilities | | | 21,207 | | |
| Total Liabilities | | | 2,128,077 | | |
| Net Assets | | $ | 296,904,406 | | |
| Composition of Net Assets: | |
| Paid-in capital | | $ | 264,455,721 | | |
| Overdistributed net investment income | | | (1,256,160 | ) | |
| Accumulated net realized gain | | | 1,610,107 | | |
| Net unrealized appreciation on: | |
| Investments | | | 32,094,720 | | |
| Foreign currency translations | | | 18 | | |
| Net Assets | | $ | 296,904,406 | | |
| Fund Shares Outstanding | | | 11,570,263 | | |
Net asset value, offering price and redemption
price per share | | $ | 25.66 | | |
Statement of Operations
For the Six Months Ended June 30, 2008 (Unaudited)
| Investment Income: | |
| Dividends (net of foreign taxes withheld of $8,537) | | $ | 547,135 | | |
| Interest | | | 148,751 | | |
| Total Investment Income | | | 695,886 | | |
| Expenses: | |
| Investment advisory fee | | | 1,165,891 | | |
| Administration fee | | | 72,868 | | |
| Transfer agent fee | | | 133 | | |
| Trustees' fees | | | 7,280 | | |
| Custody fee | | | 11,714 | | |
| Chief compliance officer expenses (See Note 4) | | | 3,322 | | |
| Other expenses (See Note 5) | | | 44,764 | | |
| Total Expenses | | | 1,305,972 | | |
| Custody earnings credit | | | (311 | ) | |
| Net Expenses | | | 1,305,661 | | |
| Net Investment Loss | | | (609,775 | ) | |
Net Realized and Unrealized Gain (Loss) on
Investments and Foreign Currency: | |
| Net realized gain (loss) on: | |
| Investments | | | 1,674,862 | | |
| Foreign currency transactions | | | (1,654 | ) | |
| Net realized gain | | | 1,673,208 | | |
| Net change in unrealized appreciation (depreciation) on: | |
| Investments | | | (19,486,490 | ) | |
| Foreign currency translations | | | 18 | | |
Net change in unrealized
appreciation (depreciation) | | | (19,486,472 | ) | |
| Net Loss | | | (17,813,264 | ) | |
| Net Decrease in Net Assets from Operations | | $ | (18,423,039 | ) | |
See accompanying notes to financial statements.
9
Wanger Select 2008 Semiannual Report
Statement of Changes in Net Assets
| Increase (Decrease) in Net Assets | | (Unaudited)
Six Months
Ended
June 30,
2008 | | Year Ended
December 31,
2007 | |
| Operations: | |
| Net investment loss | | $ | (609,775 | ) | | $ | (396,026 | ) | |
| Net realized gain on investments and foreign currency transactions | | | 1,673,208 | | | | 8,594,537 | | |
Net change in unrealized appreciation (depreciation) on investments and foreign
currency translations | | | (19,486,472 | ) | | | 6,555,041 | | |
| Net Increase (Decrease) in Net Assets from Operations | | | (18,423,039 | ) | | | 14,753,552 | | |
| Distributions to Shareholders: | |
| From net realized gains | | | (8,211,851 | ) | | | (3,866,407 | ) | |
| Share Transactions: | |
| Subscriptions | | | 21,659,258 | | | | 152,805,878 | | |
| Distributions reinvested | | | 8,211,851 | | | | 3,866,407 | | |
| Redemptions | | | (22,711,411 | ) | | | (26,526,225 | ) | |
| Net Increase from Share Transactions | | | 7,159,698 | | | | 130,146,060 | | |
| Total Increase (Decrease) in Net Assets | | | (19,475,192 | ) | | | 141,033,205 | | |
| Net Assets: | |
| Beginning of period | | | 316,379,598 | | | | 175,346,393 | | |
| End of period | | $ | 296,904,406 | | | $ | 316,379,598 | | |
| Overdistributed net investment income at end of period | | $ | (1,256,160 | ) | | $ | (646,385 | ) | |
See accompanying notes to financial statements.
10
Wanger Select 2008 Semiannual Report
Financial Highlights
| | | (Unaudited)
Six Months Ended
June 30, | | Year Ended December 31, | |
| Selected data for a share outstanding throughout each period | | 2008 | | 2007 | | 2006 | | 2005 | | 2004 | | 2003 | |
| Net Asset Value, Beginning of Period | | $ | 28.08 | | | $ | 26.15 | | | $ | 22.66 | | | $ | 22.11 | | | $ | 18.55 | | | $ | 14.19 | | |
| Income from Investment Operations: | |
| Net investment loss (a) | | | (0.05 | ) | | | (0.04 | ) | | | (0.05 | ) | | | (0.04 | ) | | | (0.10 | ) | | | (0.11 | ) | |
Net realized and unrealized gain (loss) on investments
and foreign currency transactions | | | (1.64 | ) | | | 2.47 | | | | 4.38 | | | | 2.12 | | | | 3.68 | | | | 4.47 | | |
| Total from Investment Operations | | | (1.69 | ) | | | 2.43 | | | | 4.33 | | | | 2.08 | | | | 3.58 | | | | 4.36 | | |
| Less Distributions to Shareholders: | |
| From net investment income | | | — | | | | — | | | | (0.09 | ) | | | — | | | | — | | | | — | | |
| From net realized gains | | | (0.73 | ) | | | (0.50 | ) | | | (0.75 | ) | | | (1.53 | ) | | | (0.02 | ) | | | — | | |
| Total Distributions to Shareholders | | | (0.73 | ) | | | (0.50 | ) | | | (0.84 | ) | | | (1.53 | ) | | | (0.02 | ) | | | — | | |
| Net Asset Value, End of Period | | $ | 25.66 | | | $ | 28.08 | | | $ | 26.15 | | | $ | 22.66 | | | $ | 22.11 | | | $ | 18.55 | | |
| Total Return (b) | | | (5.76 | )%(c) | | | 9.39 | % | | | 19.70 | % | | | 10.49 | %(d) | | | 19.31 | % | | | 30.73 | % | |
| Ratios to Average Net Assets/Supplemental Data: | |
| Net expenses (e) | | | 0.90 | %(f) | | | 0.90 | % | | | 0.94 | % | | | 0.96 | % | | | 1.10 | % | | | 1.15 | % | |
| Net investment loss (e) | | | (0.42 | )%(f) | | | (0.15 | )% | | | (0.20 | )% | | | (0.20 | )% | | | (0.49 | )% | | | (0.65 | )% | |
| Waiver | | | — | | | | — | | | | — | | | | 0.02 | % | | | — | | | | — | | |
| Portfolio turnover rate | | | 13 | %(c) | | | 15 | % | | | 21 | % | | | 26 | % | | | 36 | % | | | 21 | % | |
| Net assets, end of period (000's) | | $ | 296,904 | | | $ | 316,380 | | | $ | 175,346 | | | $ | 102,674 | | | $ | 82,465 | | | $ | 52,112 | | |
(a) Net investment loss per share was based upon the average shares outstanding during the period.
(b) Total return at net asset value assuming all distributions reinvested.
(c) Not annualized.
(d) Had the investment advisor not waived a portion of expenses, total return would have been reduced.
(e) The benefits derived from custody fees paid indirectly had an impact of less than 0.01%.
(f) Annualized.
See accompanying notes to financial statements.
11
Wanger Select 2008 Semiannual Report
Notes to Financial Statements (Unaudited)
1. Nature of Operations
Wanger Select (the "Fund"), is a series of Wanger Advisors Trust (the "Trust"), an open-end management investment company organized as a Massachusetts business trust. The investment objective of the Fund is to seek long-term capital appreciation. The Fund is available only for allocation to certain life insurance company separate accounts established for the purpose of funding qualified and non-qualified variable annuity contracts and variable life insurance policies and may also be offered directly to certain types of pension plans and retirement arrangements.
2. Significant Accounting Policies
Security valuation
Securities of the Fund are valued at market value or, if a market quotation for a security is not readily available or is deemed not to be reliable because of events or circumstances that have occurred between the market quotation and the time as of which the security is to be valued, the security is valued at a fair value determined in accordance with procedures established by the Board of Trustees. A security traded on a securities exchange or in an over-the-counter market in which transaction prices are reported is valued at the last sales price at the time of valuation. A security traded principally on NASDAQ is valued at the NASDAQ official closing price. A security for which there is no reported sale on the valuation date is valued at the latest bid quotation. A short-term debt obligation having a maturity of 60 days or less from the valuation date is valued at amortized cost, which approximates fair value. A security for which a market quotation is not readily available and any other assets are valued in accordance with procedures established by the Board of Trustees. The Trust has retained an independent statistical fair value pricing service to assist in the fair valuation process for securities principally traded in a foreign market in order to adjust for possible changes in value that may occur between the close of the foreign market and the time as of which the securities are to be valued. If a security is valued at fair value, that value may be different from the last quoted market price for the security.
On January 1, 2008, the Fund adopted Statement of Financial Accounting Standards No. 157, Fair Value Measurements ("SFAS 157"). Under SFAS 157, various inputs are used in determining the value of the Fund's investments. These inputs are summarized in the three broad levels listed below:
• Level 1—quoted prices in active markets for identical securities
• Level 2—other significant observable inputs (including quoted prices for similar securities, interest rates, prepayment speeds, credit risk, and others)
• Level 3—significant unobservable inputs (including the Fund's own assumptions in determining the value of investments)
The inputs or methodology used for valuing securities are not necessarily an indication of the risk associated with investing in those securities.
The following table summarizes the inputs used, as of June 30, 2008, in valuing the Fund's assets:
| Valuation Inputs | | Investments in
Securities | | Other Financial
Instruments | |
| Level 1—Quoted Prices | | $ | 273,726,857 | | | $ | — | | |
| Level 2—Other Significant Observable Inputs | | $ | 24,332,485 | | | | — | | |
| Level 3—Significant Unobservable Inputs | | | — | | | | — | | |
| Total | | $ | 298,059,342 | | | $ | — | | |
The Fund's assets assigned to the Level 2 input category include certain foreign securities for which a third party pricing service may be employed for purposes of fair market valuation.
Repurchase agreements
The Fund may engage in repurchase agreement transactions. The Fund, through its custodians, receives delivery of underlying securities collateralizing each repurchase agreement. The Fund's custodian determines that the value of the underlying securities is at all times at least equal to the resale price. In the event of default or bankruptcy by the other party to the agreement, realization and/or retention of the collateral may be subject to legal proceedings.
Foreign currency translations
Values of investments denominated in foreign currencies are converted into U.S. dollars using the spot market rate of exchange at the time of valuation. Purchases and sales of investments and dividend and interest income are translated into U.S. dollars using the spot market rate of exchange prevailing on the respective dates of such transactions. The gain or loss resulting from changes in foreign exchange rates is included with net realized and unrealized gain or loss from investments, as appropriate.
Security transactions and investment income
Security transactions are accounted for on the trade date (date the order to buy or sell is executed) and dividend income is recorded on the ex-dividend date, except that certain dividends from foreign securities are recorded as soon as the information is available to the Fund. Interest income is recorded on the accrual basis and includes amortization of discounts on debt obligations when required for federal income tax purposes. Realized gains and losses from security transactions are recorded on an identified cost basis.
Awards, if any, from class action litigation related to securities owned may be recorded as a reduction of cost of those securities. If the applicable securities are no longer owned, the proceeds are recorded as realized gains.
In March 2008, Statement of Financial Accounting Standards No. 161 ("SFAS 161"), Disclosures about Derivative Instruments and Hedging Activities—an amendment of FASB Statement No. 133, was issued. SFAS 161 is effective for fiscal years beginning after November 15, 2008. SFAS 161 requires additional discussion about the reporting entity's derivative instruments and hedging activities, by providing for qualitative disclosures about the objectives and strategies for using derivatives, quantitative data about the fair value of and gains and losses on derivative contracts, and details of credit-risk-related contingent features in their hedged positions. Management is evaluating the impact the application of SFAS 161 will have on the Fund's financial statement disclosures.
Restricted securities
Restricted securities are securities that may only be resold upon registration under federal securities laws or in transactions exempt from registration. In some cases, the issuer of restricted securities has agreed to register such securities for resale at the issuer's expense either upon demand by the Fund or in connection with another registered offering of the securities. Many restricted securities may be resold in the secondary market in transactions exempt from registration. Such restricted securities may be determined to be liquid under criteria established by the Board of Trustees. The Fund will not incur any registration costs upon such resale.
Use of estimates
The preparation of financial statements in conformity with accounting principles generally accepted in the United States of America ("GAAP") requires management to make estimates and assumptions that affect the amounts reported in the financial statements and accompanying notes. Actual results may differ from those estimates.
12
Wanger Select 2008 Semiannual Report
Notes to Financial Statements, continued (Unaudited)
Fund share valuation
Fund shares are sold and redeemed on a continuing basis at net asset value. Net asset value per share is determined daily as of the close of trading on the New York Stock Exchange ("the Exchange") on each day the Exchange is open for trading by dividing the total value of the Fund's investments and other assets, less liabilities, by the number of Fund shares outstanding.
Custody fees/Credits
Custody fees are reduced based on the Fund's cash balances maintained with the custodian. The amount is disclosed as a reduction of total expenses in the Statement of Operations.
Federal income taxes
The Fund has complied with the provisions of the Internal Revenue Code available to regulated investment companies and, in the manner provided therein, distributes all its taxable income, as well as any net realized gain on sales of investments and foreign currency transactions reportable for federal income tax purposes. Accordingly, the Fund paid no federal income taxes and no federal income tax provision was required.
Expenses
General expenses of the Trust are allocated to the Fund and the other series of the Trust based upon relative net assets or other expense allocation methodologies determined by the nature of the expense. Expenses directly attributable to the Fund are charged to the Fund.
Distributions to shareholders
Distributions to shareholders are recorded on the ex-date.
Indemnification
In the normal course of business, the Fund enters into contracts that contain a variety of representations and warranties which provide general indemnities. The Fund's maximum exposure under these arrangements is unknown, as this would involve future claims against the Fund. Also under the Trust's organizational documents, the Trustees and Officers of the Trust are indemnified against certain liabilities that may arise out of their duties to the Trust. However based on experience, the Fund expects the risk of loss due to these warranties and indemnities to be minimal.
3. Federal Tax Information
The tax character of distributions paid during the year ended December 31, 2007 was as follows:
| Distributions paid from: | |
| Ordinary Income* | | $ | 1,343,353 | | |
| Long-Term Capital Gains | | | 2,523,054 | | |
* For tax purposes short-term capital gains distributions, if any, are considered ordinary income distributions.
Under Financial Accounting Standards Board ("FASB") Interpretation No. 48, Accounting for Uncertainty in Income Taxes—an Interpretation of FASB Statement No. 109 ("FIN 48") management determines whether a tax position of the Fund is more likely than not to be sustained upon examination by the applicable taxing authority, including resolution of any related appeals or litigation processes, based on the technical merits of the position. The tax benefit to be recognized is measured as the largest amount of benefit that is greater than fifty percent likely of being realized upon ultimate settlement. Management has evaluated the known implications of FIN 48 on its computation of net assets for the Fund. As a result of this evaluation, management believes that FIN 48 does not have any effect on the Fund's financial statements. However, management's conclusions regarding FIN 48 may be subject to review and adjustment at a later date based on factors including, but not limited to, further implementation guidance from the FASB, new tax laws, regulations, and administrative interpretations (including relevant court decisions). The Fund's federal tax returns for the prior three fiscal years remain subject to examination by the Internal Revenue Service. The Fund is not aware of any tax positions for which it is reasonably possible that the total amounts of unrecognized tax benefits will significantly change in the next twelve months.
4. Transactions With Affiliates
Columbia Wanger Asset Management, L.P., ("CWAM") is a wholly owned subsidiary of Columbia Management Group, LLC ("Columbia Management"), which in turn is an indirect wholly owned subsidiary of Bank of America Corporation ("BOA"). CWAM furnishes continuing investment supervision to the Fund and is responsible for the overall management of the Fund's business affairs.
Under the Fund's investment advisory agreement, management fees are accrued daily based on the Fund's average daily net assets and paid monthly to CWAM at the annual rates shown in the table below:
| Average Daily Net Assets | | Annual Fee Rate | |
| Up to $500 million | | | 0.80 | % | |
| $500 million and over | | | 0.78 | % | |
For the six months ended June 30, 2008, the Fund's annualized effective investment advisory fee rate was 0.80% of average daily net assets.
Through April 30, 2009, CWAM will reimburse the Fund to the extent that ordinary operating expenses (including custodial charges relating to overdrafts, if any), after giving effect to any balance credits from the Fund's custodian, exceed an annual percentage of 1.35% of average daily net assets. There was no reimbursement for the six months ended June 30, 2008.
CWAM provides administrative services and receives an administration fee from the Fund. Effective August 1, 2008, CWAM will provide administrative services and receive an administration fee from the Fund at the following annual rates:
Wanger Advisors Trust
Aggregate Average Daily
Net Assets of the Trust: | | Annual Fee Rate | |
| Up to $4 billion | | | 0.050 | % | |
| $4 billion to $6 billion | | | 0.040 | % | |
| $6 billion to $8 billion | | | 0.030 | % | |
| $8 billion and over | | | 0.020 | % | |
Prior to August 1, 2008, fees were accrued daily and paid monthly to CWAM at the annual rate of 0.05%. For the six months ended June 30, 2008, the Fund's annualized effective administration fee rate was 0.05% of average daily net assets.
CWAM has delegated to Columbia Management the responsibility for certain administrative services.
Certain officers and trustees of the Trust are also officers of CWAM. The Trust makes no direct payments to its officers and trustees who are affiliated with CWAM.
The Board of Trustees appointed a Chief Compliance Officer to the Fund in accordance with federal securities regulations. The Fund, along with other affiliated funds, pays its pro-rata share of the expenses associated with the Office of the Chief Compliance Officer. These expenses are disclosed separately as "Chief compliance officer expenses" in the Statement of Operations.
13
Wanger Select 2008 Semiannual Report
Notes to Financial Statements, continued (Unaudited)
The Trust offers a deferred compensation plan for its independent trustees. Under that plan, a trustee may elect to defer all or a portion of his or her compensation. Amounts deferred are retained by the Trust and represent an unfunded obligation of the Trust. The value of amounts deferred is determined by reference to the change in value of Class Z shares of one or more series of Columbia Acorn Trust or a money market fund as specified by the trustee. Benefits under the deferred compensation plan are payable when the trustee ceases to be a member of the Board of Trustees.
Columbia Management Distributors, Inc. (the "Distributor"), a wholly owned subsidiary of BOA, serves as the principal underwriter of the Trust and receives no compensation from the Fund for its services.
Columbia Management Services, Inc. (the "Transfer Agent"), a wholly owned subsidiary of BOA, provides shareholder services to the Fund and has subcontracted with Boston Financial Data Services ("BFDS") to serve as subtransfer agent. For such services, the Transfer Agent receives a fee, paid monthly, at the annual rate of $21.00 per open account. The Transfer Agent also receives reimbursement for certain out-of-pocket expenses.
During the six months ended June 30, 2008, the Fund engaged in purchase and sale transactions with funds that have a common investment advisor (or affiliated investment advisors), common directors/trustees, and/or common officers. Those purchase and sale transactions complied with provisions of Rule 17a-7 under the Investment Company Act of 1940 and were $177,078 and $0, respectively.
5. Borrowing Arrangements
The Trust participates in a $150 million credit facility, which was entered into to facilitate portfolio liquidity. Interest is charged to each participating fund based on its borrowings at a rate per annum equal to the Federal Funds rate plus 0.50%. In addition, a commitment fee of 0.08% per annum of the unutilized line of credit is accrued and apportioned among the participating funds based on their relative net assets. The commitment fee is included in "Other expenses" in the Statement of Operations. No amounts were borrowed by the Fund under this facility during the six months ended June 30, 2008.
6. Fund Share Transactions
Proceeds and payments on Fund shares as shown in the Statement of Changes in Net Assets are in respect of the following numbers of shares:
| | | Six months ended
June 30, 2008 | | Year ended
December 31, 2007 | |
| Shares sold | | | 846,747 | | | | 5,354,321 | | |
Shares issued in reinvestment
of dividend distributions | | | 349,440 | | | | 145,354 | | |
| Less shares redeemed | | | (893,675 | ) | | | (937,722 | ) | |
| Net increase in shares outstanding | | | 302,512 | | | | 4,561,953 | | |
7. Investment Transactions
The aggregate cost of purchases and proceeds from sales other than short-term obligations for the six months ended June 30, 2008 were $49,482,831 and $36,084,106, respectively.
8. Legal Proceedings
CWAM, Columbia Acorn Trust, (another mutual fund family advised by CWAM), and the trustees of Colombia Acorn Trust (collectively, the "Columbia defendants") are named as defendants in class and derivative complaints that have been consolidated in a Multi-District Action (the "MDL Action") in the federal district court of Maryland. These lawsuits contend that defendants permitted certain investors to market time their trades in certain Columbia Acorn Funds. The MDL Action is ongoing. However, all claims against Columbia Acorn Trust and the independent trustees of Columbia Acorn Trust have been dismissed.
Columbia Acorn Trust and CWAM are also defendants in a class action lawsuit that alleges, in summary, that Columbia Acorn Trust and CWAM exposed shareholders of Columbia Acorn International Fund to trading by market timers by allegedly: (a) failing to properly evaluate daily whether a significant event affecting the value of the fund's securities had occurred after foreign markets had closed but before the calculation of the funds' net asset value (NAV"); (b) failing to implement the fund's portfolio valuation and share pricing policies and procedures; and (c) failing to know and implement applicable rules and regulations concerning the calculation of NAV (the "Fair Valuation Lawsuit"). The Seventh Circuit ruled that the plaintiffs' state law claims were preempted under federal law resulting in the dismissal of plaintiffs' complaint. Plaintiffs appealed the Seventh Circuit's ruling to the United States Supreme Court. The Supreme Court reversed the Seventh Circuit's ruling on jurisdictional grounds and the case was ultimately remanded to the state court.
On March 21, 2005, a class action complaint was filed against the Columbia Acorn Trust and CWAM seeking to rescind the CDSC assessed upon redemption of Class B shares of Columbia Acorn Funds due to the alleged market timing of the Columbia Acorn Funds (the "CDSC Lawsuit"). In addition to the rescission of sales charges, plaintiffs seek recovery of actual damages, attorneys' fees and costs. The case has been transferred to the MDL Action in the federal district court of Maryland.
On September 14, 2007, the plaintiffs and the Columbia defendants named in the MDL Action, including the Columbia Funds, entered into a stipulation of settlement with respect to all Columbia-related claims in the MDL Action described above, including the CDSC and Fair Valuation Lawsuits. The settlement is subject to court approval.
CWAM, the Columbia Acorn Funds and the Trustees of the Trust are also defendants in a consolidated lawsuit filed in the federal district court of Massachusetts alleging that CWAM used Fund assets to make undisclosed payments to brokers as an incentive for the brokers to market the Funds over other mutual funds to investors. The complaint alleges CWAM and the Trustees of the Columbia Acorn Trust, along with certain affiliated entities and individuals, breached certain common law duties and federal laws.
On November 30, 2005, the judge dismissed all claims by plaintiffs and entered final judgment in favor of the defendants. The plaintiffs appealed to the United States Court of Appeals for the First Circuit on December 30, 2005. A stipulation and settlement agreement dated January 19, 2007 was filed in the First Circuit on February 14, 2007, with a joint stipulation of dismissal and motion for remand to obtain district court approval of the settlement. That joint motion was granted and the appeal was dismissed. On March 6, 2007, the case was remanded to the federal district court. The settlement, approved by the federal district court on September 18, 2007, became effective October 19, 2007. Pursuant to the settlement, the funds' advisor and/or its affiliates made certain payments, including plaintiffs' attorneys' fees and costs of notice to class members.
The Trust and CWAM intend to defend these suits vigorously.
As a result of these matters, or any adverse publicity or other developments resulting from them, there may be increased redemptions or reduced sales of Columbia Acorn fund shares, which could increase transaction costs or operating expenses, or have other adverse consequences for the Columbia Acorn funds. However, based on currently available information, the Columbia Acorn Trust believes that the likelihood that these lawsuits will have a material adverse impact on any fund is remote, and CWAM believes that the lawsuits are not likely to materially affect its ability to provide investment management services to the funds.
14
Wanger Select 2008 Semiannual Report
Excerpt from:
Wanger Advisors Trust
Management Fee Evaluation of the Senior Officer
Prepared Pursuant to the New York Attorney General's
Assurance of Discontinuance
May 2008
15
Wanger Select 2008 Semiannual Report
Introduction
The New York Attorney General's Assurance of Discontinuance ("Order") entered into by Columbia Management Advisors, Inc. ("CMAI") and Columbia Management Distributors, Inc., ("CMDI" and collectively with "CMAI," "CMG") in February 2005, allows CMAI to manage or advise a mutual fund only if the trustees of the fund appoint a "Senior Officer" to perform specified duties and responsibilities. One of these responsibilities includes "managing the process by which proposed management fees (including but not limited to, advisory fees) to be charged the [Funds] are negotiated so that they are negotiated in a manner which is at arms' length and reasonable and consistent with this Assurance of Discontinuance."
This is the second year that the Columbia Acorn Trust and Wanger Advisors Trust (collectively, the "Trusts") and each series thereof (the "Acorn funds," "WAT funds" or collectively, the "Funds") have been overseen by the same Board of Trustees ("Board"). The Order provides that this Board must determine the reasonableness of proposed "management fees" by using either an annual competitive bidding process supervised by the Senior Officer or Independent Fee Consultant, or by obtaining "an annual independent written evaluation prepared by or under the direction of the Senior Officer or the Independent Fee Consultant."
"Management fees" are only part of the costs and expenses paid by mutual fund shareholders. Fund expenses can vary depending upon the class of shares held but usually include: (1) investment management or advisory fees to compensate analysts and portfolio managers for stock research and portfolio management, as well as the cost of operating a trading desk; (2) administrative expenses incurred to prepare registration statements and tax returns, calculate the Funds' net asset values, maintain effective compliance procedures and perform recordkeeping services; (3) transfer agency costs for establishing accounts, accepting and disbursing funds, as well as overseeing trading in Fund shares; (4) custodial expenses incurred to hold the securities purchased by the Funds; and (5) distribution expenses, including commissions paid to brokers that sell the Fund shares to investors.
Columbia Wanger Asset Management, L.P. ("CWAM"), the advisor to the Funds, has proposed that the Trusts continue the existing separate agreements governing the first two categories listed above: an advisory agreement governing portfolio management, and an administration agreement governing certain administration and clerical services. Together the fees paid under these two agreements are referred to as "management fees." Other fund expenses are governed by separate agreements, in particular agreements with two CWAM affiliates: CMDI, the broker-dealer that underwrites and distributes the Funds' shares, and Columbia Management Services, Inc. ("CMSI"), the Funds' transfer agent. In conformity with the terms of the Order, this evaluation, therefore, addresses only the advisory and administrative contracts, and does not extend to the other agreements.
According to the Order, the Senior Officer's evaluation must consider at least the following:
(1) Management fees (including components thereof) charged to institutional and other clients of CWAM for like services;
(2) Management fees (including any components thereof) charged by other mutual fund companies for like services;
(3) Costs to CWAM and its affiliates of supplying services pursuant to the management fee agreements, excluding any intra-corporate profit;
(4) Profit margins of CWAM and its affiliates from supplying such services;
(5) Possible economies of scale as the Funds grow larger; and
(6) The nature and quality of CWAM's services, including the performance of each Fund.
In 2004, the Boards of the two Trusts, then separate groups, each appointed me Senior Officer under the Order. They also determined not to pursue a competitive bidding process and instead, charged me with the responsibility of evaluating the Funds' proposed advisory and administrative fee contracts with CWAM in conformity with the requirements of the Order. This Report is an annual evaluation required under the Order. In discharging their responsibilities, the independent Trustees have also consulted independent, outside counsel.
2007 Evaluation
This is the third annual evaluation prepared in connection with the Order. This evaluation follows the same structure as the earlier studies. Some areas are given more emphasis here, while others are given less. Still, the fundamental information gathered for this evaluation is largely the same as past years. Last year's evaluation is referred to here as the "2007 Study."
Process and Independence
The objectives of the Order are to insure the independent evaluation of the management fees paid by the Funds as well as to insure that all relevant factors are considered. In my view, this contract renewal process has been conducted at arms-length and with independence in gathering, considering and evaluating all relevant data. At the outset of the process, the Trustees sought and obtained from CWAM and CMG a comprehensive compilation of data regarding Fund performance and expenses, advisor profitability, and other information. The Board evaluated this information thoroughly. Performance and expense data was obtained from both Morningstar and Lipper, the leading consultants in this area. The rankings prepared by Morningstar and Lipper were independent and not influenced by the advisor.
In the course of its work, the Contract Committee gave careful consideration to the conclusions and recommendations contained in the 2007 Study. The Contract Committee gave particular emphasis to the issue of whether economies of scale were appropriately reflected in the Funds' fee schedules. The Board accepted and implemented several of the recommendations in this area contained in the 2007 Study.
16
Wanger Select 2008 Semiannual Report
My evaluation of the advisory contract was shaped, as it was last year, by my experience as Chief Compliance Officer of the Trusts ("CCO"). As CCO, I report solely to the Board and have no reporting obligation to, or employment relationship with, CMG or its affiliates, except for administrative purposes. I have commented on compliance matters in evaluating the quality of service provided by CWAM.
This Report, its supporting materials and the data contained in other materials submitted to the Contract Committee of the Board, in my view, provide a thorough factual basis upon which the Board, in consultation with independent counsel as it deems appropriate, may conduct management fee negotiations that are in the best interests of the Funds' shareholders.
The Fee Reductions Mandated under the Order
Under the terms of the Order, CMG agreed to secure certain management fee reductions for the mutual funds advised by its affiliate investment advisors. In some instances, breakpoints were also established. Although neither CWAM nor the Trusts was a party to the Order, CWAM offered and the Board accepted certain advisory fee reductions during 2005. By the terms of the Order, these fees may not be increased before November 30, 2009. I have used these advisory fee levels, as modified thereafter, in this evaluation because they are the fees in the current agreements that CWAM proposes should be continued. Hence, these fee levels are the starting point of an evaluation.
Conclusions
My review of the data and other material above leads to the following conclusions with respect to the factors identified in the Order.
1. Performance. The domestic WAT Funds generally have achieved good to outstanding performance over the past five years. Wanger Select has, however, suffered a precipitous decline in ranking relative to its peers for the past year, and this trend merits the Trustees' continued attention. The international WAT Funds have relatively weaker relative long term records than do the domestic funds. All the WAT Funds, however, outperform their benchmarks, expose shareholders to less risk than competitors and achieve positive "alpha," a recognized measure of the added value of an investment manager.
2. Management Fees relative to Peers. Management fees vary by WAT Fund, but, in general, the WAT Funds impose higher fees than competing funds. Wanger Select and Wanger USA in particular were ranked by both Lipper and Morningstar at or below the median, and therefore impose higher fees than do the majority of their competitors.
3. Administrative Fees. The WAT Funds' administrative fees appear competitive in relation to their peers, and CWAM provides excellent administrative support for all the WAT Funds. There are clear advantages to retaining the advisor and its affiliates to perform these services. However, while economies of scale exist above current asset levels, the WAT Funds' administrative fee schedule provides no breakpoints.
4. Management Fees relative to Institutional and Other Mutual Fund Accounts. CWAM's focus is on its mutual funds. It does not actively seek to manage separate or institutional accounts. The few institutional accounts it does manage vary in rate structures. Some pay advisory fees commensurate with or higher than the WAT Funds. In a few instances, however, institutional accounts pay lower advisory fees than do the WAT Funds. One particular institutional account is significant in size and has been under CWAM's management for over 25 years.
5. Costs to CWAM and its Affiliates. CWAM's direct costs do not appear excessive. Overhead and indirect costs allocated to CWAM by its parent organizations, however, are significant and have increased dramatically in the past year. CWAM's affiliates report operating losses and therefore do not appear to enjoy excessive "fall out" benefits from CWAM's advisory agreement with the WAT Funds.
6. Profit Margins. CWAM's pre-marketing expense profit margins are at the top of the industry, though these comparisons are hampered by limited industry data. High profit margins are not unexpected for firms that manage large, successful funds and have provided outstanding investment performance for investors.
7. Economies of Scale. Economies of scale do exist at CWAM and will expand as the assets of the WAT Funds get larger. The Board has recently imposed additional breakpoints for some of the WAT Funds that will result in greater sharing of economies of scale.
8. Nature and Quality of Services. This category includes a variety of considerations that are difficult to quantify, yet can have a significant bearing on the performance of the Funds. Several areas merit comment.
a. Capacity. The WAT Funds have continued to grow, posing ever greater challenges in deploying assets effectively. While trends here merit continued monitoring, CWAM appears to be managing assets effectively.
b. Compliance. CWAM has a reasonably designed compliance program that protects shareholders.
9. Process. In my opinion, the process of negotiating an advisory contract for the WAT Funds has been conducted thoroughly and at arms' length. Further, the Trustees have sufficient information to evaluate management's proposal, and negotiate contract terms that are in the best interests of Fund shareholders.
17
Wanger Select 2008 Semiannual Report
Recommendations
I believe the Trustees should:
1. Consider the addition of breakpoints to the WAT administrative fee contract to reflect the economies of scale present in performing these services, and, in fashioning those breakpoints, to consider the efficiencies achieved by CWAM by supporting both Trusts with the same staff performing largely identical tasks.
2. Focus their review on the WAT Funds' management fee levels in relation to their peers, in particular the fees paid by Wanger USA and Wanger Select.
3. Monitor Wanger Select to ensure that its long term performance is sustained.
Robert P. Scales
May 27, 2008
18
Wanger Select 2008 Semiannual Report
This page intentionally left blank.
19
Wanger Select 2008 Semiannual Report

Columbia Wanger Funds
Trustees
Robert E. Nason
Chairman of the Board
Allan B. Muchin
Vice Chairman of the Board
Laura M. Born
Michelle L. Collins
Maureen M. Culhane
Margaret M. Eisen
Jerome Kahn, Jr.
Steven N. Kaplan
David C. Kleinman
Charles P. McQuaid
James A. Star
Ralph Wanger
John A. Wing
Officers
Charles P. McQuaid
President
Ben Andrews
Vice President
Michael G. Clarke
Assistant Treasurer
Jeffrey R. Coleman
Assistant Treasurer
J. Kevin Connaughton
Assistant Treasurer
P. Zachary Egan
Vice President
Peter T. Fariel
Assistant Secretary
John M. Kunka
Assistant Treasurer
Joseph C. LaPalm
Vice President
Bruce H. Lauer
Vice President, Secretary and Treasurer
Louis J. Mendes III
Vice President
Robert A. Mohn
Vice President
Christopher J. Olson
Vice President
Robert P. Scales
Chief Compliance Officer, Chief Legal Officer, Senior Vice President and General Counsel
Linda K. Roth-Wiszowaty
Assistant Secretary
Transfer Agent,
Dividend Disbursing Agent
Columbia Management Services, Inc.
P.O. Box 8081
Boston, Massachusetts
02266-8081
Distributor
Columbia Management Distributors, Inc.
One Financial Center
Boston, Massachusetts
02111-2621
Investment Advisor
Columbia Wanger Asset Management, L.P.
227 West Monroe Street, Suite 3000
Chicago, Illinois 60606
1-888-4-WANGER
(1-888-492-6437)
Legal Counsel
Bell, Boyd & Lloyd LLP
Chicago, Illinois
Independent Registered Public Accounting Firm
PricewaterhouseCoopers LLP
Chicago, Illinois
This report, including the schedules of investments and financial statements, is submitted for the general information of the shareholders of the Wanger Advisors Trust.
A description of the Fund's proxy voting policies and procedures and a copy of the Fund's voting record for the most recent 12-month period ended June 30 are available (i) on the Securities and Exchange Commission's website at www.sec.gov, and (ii) without charge, upon request, by calling 888-492-6437.
The Fund files a complete schedule of portfolio holdings with the SEC for the first and third quarters of each fiscal year on Form N-Q. The Fund's Form N-Q is available on the SEC's website at www.sec.gov and may be reviewed and copied at the SEC's Public Reference Room in Washington, D.C. Information on the operation of the Pubic Reference Room may be obtained by calling 800-SEC-0330.
20
Columbia Wanger Funds
OL2568S
SHC-44/154968-0608 08/55101
Wanger USA
(formerly Wanger U.S. Smaller Companies)
2008 Semiannual Report

| NOT FDIC INSURED | | May Lose Value | |
|
| NOT BANK ISSUED | | No Bank Guarantee | |
|

Wanger USA
2008 Semiannual Report
Table of Contents
| | 1 | | | Understanding Your Expenses | |
|
| | 2 | | | Perceptions of Risk | |
|
| | 4 | | | Performance Review | |
|
| | 6 | | | Statement of Investments | |
|
| | 14 | | | Statement of Assets and Liabilities | |
|
| | 14 | | | Statement of Operations | |
|
| | 15 | | | Statement of Changes in Net Assets | |
|
| | 16 | | | Financial Highlights | |
|
| | 17 | | | Notes to Financial Statements | |
|
| | 20 | | | Management Fee Evaluation of the Senior Officer | |
|
Columbia Wanger Asset Management, L.P. ("CWAM") is one of the leading global small-and mid-cap equity managers in the United States with more than 37 years of small- and mid-cap investment experience. As of June 30, 2008, CWAM manages $32.2 billion in assets and is the investment advisor to Wanger USA, Wanger International, Wanger Select, Wanger International Select (together, the "Wanger Advisors Trust Funds") and the Columbia Acorn Family of Funds. Columbia Management Group, LLC ("Columbia Management") is the investment management division of Bank of America Corporation. Columbia Management entities furnish investment management services and products for institutional and individual investors.The Wanger Advisors Trust Funds and the Columbia Acorn Family of Funds (together with o ther funds advised by Columbia Management affiliates, the"Columbia Funds") are distributed by Columbia Management Distributors, Inc., member of FINRA, SIPC, part of Columbia Management and an affiliate of Bank of America Corporation. CWAM is an SEC-registered investment advisor and indirect, wholly owned subsidiary of Bank of America Corporation. CWAM is part of Columbia Management.
Please consider the investment objectives, risks, charges and expenses for the Fund carefully before investing. Contact 1-888-4-WANGER for a prospectus, which contains this and other important information about the Fund. You should read it carefully before you invest.
The views expressed in "Perceptions of Risk" and in the Performance Review reflect the current views of the respective parties. These views are not guarantees of future performance and involve certain risks, uncertainties and assumptions that are difficult to predict so actual outcomes and results may differ significantly from the views expressed.These views are subject to change at any time based upon economic, market or other conditions and the respective parties disclaim any responsibility to update such views. These views may not be relied on as investment advice and, because investment decisions for a Columbia Fund are based on numerous factors, may not be relied on as an indication of trading intent on behalf of any particular Columbia Fund. References to specific company securities should not be construed as a recommendation or investment advice.
Wanger USA 2008 Semiannual Report
Understanding Your Expenses
As a Fund shareholder, you incur two types of costs. There are transaction costs, which generally include sales charges on purchases and may include redemption or exchange fees. There are also ongoing costs, which generally include investment advisory fees and other Fund expenses. The information on this page is intended to help you understand your ongoing costs of investing in the Fund and to compare these costs with the ongoing costs of investing in other mutual funds.
Analyzing your Fund's expenses
To illustrate these ongoing costs, we have provided an example and calculated the expenses paid by investors in the Fund during the period. The information in the following table is based on an initial, hypothetical investment of $1,000, which is invested at the beginning of the period and held for the entire period. Expense information is calculated two ways and each method provides you with different information. The amount listed in the "Actual" column is calculated using actual operating expenses and total return for the Fund. The amount listed in the "Hypothetical" column assumes that the return each year is 5% before expenses and then applies the Fund's actual expense ratio for the period to the hypothetical return. You should not use the hypothetical account values and expenses to estimate either your actual account balance at the end of the period or the expenses you paid during the period. See the "Compare with other fu nds" information for details on using the hypothetical data.
Estimating your actual expenses
To estimate the expenses that you actually paid over the period, first you will need your account balance at the end of the period.
1. Divide your ending account balance by $1,000. For example, if an account balance was $8,600 at the end of the period, the result would be 8.6.
2. In the section of the table below titled "Expenses paid during the period," you will find a dollar amount in the column labeled "Actual." Multiply this amount by the result from step 1. Your answer is an estimate of the expenses you paid on your account during the period.
January 1, 2008 – June 30, 2008
| | | Account value at the
beginning of the period ($) | | Account value at the
end of the period ($) | | Expenses paid during
period ($) | | Fund's annualized
expense ratio (%)* | |
| | | Actual | | Hypothetical | | Actual | | Hypothetical | | Actual | | Hypothetical | | Actual | |
| Wanger USA | | | 1,000.00 | | | | 1,000.00 | | | | 918.50 | | | | 1,020.19 | | | | 4.48 | | | | 4.72 | | | | 0.94 | | |
*For the six months ended June 30, 2008.
Expenses paid during the period are equal to the Fund's annualized expense ratio, multiplied by the average account value over the period, then multiplied by the number of days in the Fund's most recent fiscal half-year and divided by 366.
It is important to note that the expense amounts shown in the table are meant to highlight only ongoing costs of investing in the Fund. Expenses paid during the period do not include any insurance charges imposed by your insurance company's separate account. The hypothetical example provided is useful in comparing ongoing costs only and will not help you determine the relative total costs of owning different funds whose shareholders may incur transaction costs.
Compare with other funds
Since all mutual funds are required to include the same hypothetical calculations about expenses in shareholder reports, you can use this information to compare the ongoing cost of investing in the Fund with other funds. To do so, compare the 5% hypothetical example with the 5% hypothetical examples of other funds. As you compare hypothetical examples of other funds, it is important to note that hypothetical examples are meant to highlight the ongoing cost of investing in a fund and do not reflect any transaction costs, such as sales charges, redemption fees or exchange fees that may be incurred by shareholders of other funds. Expenses paid during the period do not include any insurance charges imposed by your insurance company's separate accounts.
1
Wanger USA 2008 Semiannual Report

Perceptions of Risk
Most people tend to calibrate risk poorly. We overestimate the likelihood of being harmed by the things that make the evening news and underestimate those that don't. In a survey, people estimated that the chance of death by accident matched the chance of death by disease. In fact, disease causes 17-times more deaths than accidents.1
Dan Gardner's, Risk, The Science and Politics of Fear,2 explains why our views and actions are often so distorted. It seems our perceptions are most influenced by preconceived notions, reinforced by recent information. Accidents are newsworthy, as are catastrophes. If fatalities occur in large numbers in a single event—instead of in small numbers dispersed over time—our perception of risk rises.3
Besides catastrophes, it won't shock too many parents to learn that we tend to worry a lot about our children. Other things that we can't control, like airplane flights, can be worrisome, while things that we can control, such as automobiles, evoke less fear despite higher risks. Things that we don't understand such as trace chemicals,4 and other man-made risks like nuclear power, are also feared. Many people worry about radiation from cell phones, while ignoring the real hazard of driving while using cell phones. Many non-headline risks caused by nature, such as radon gas, which kills an estimated 41,000 people a year in the U.S. and Europe,5 tend to be downplayed.
Gardner notes that we are living longer in the safest era ever known to mankind. Horrible diseases like smallpox have been eliminated while others have been drastically curtailed. Childhood mortality has especially plunged and accident rates are also down.
Fear Mongering Profiteers
So who is putting the scary thoughts into our heads? The media is an obvious culprit because sensational stories sell newspapers and increase viewership. Companies trying to sell certain health care products or security services and devices also find fear mongering to be profitable. The number of companies lobbying homeland security officials rose from 15 in 2001 to 861 in 2004 as fears of terrorist attacks swelled.6 Trial lawyers reaping the rewards of questionable lawsuits, politicians pandering for votes and special interest groups seeking funding also try to keep people scared.
Fear can end up increasing risks. People need to remember the classic definition of risk: probability times consequences. Avoiding immunizations or weight loss treatments due to possible side effects can be ill advised. Diabetes, a disease linked to obesity, has been diagnosed in 24 million Americans. That's eight percent of the total population.7
The American Council on Science and Health is dedicated to separating real health risks from unfounded health scares, tracking health scares reported by the press and debunking them. Among the top scares in 2007 were allegations that lipstick, fluoridated water, roses and water bottles are hazardous. Among the top scares of all time were cranberries (1959), DDT (1962), cyclamates (1969), Alar (1989), cellular phone radiation (1993) and trace PCBs in farmed salmon (2003).8 Fumes from new shower curtains may make the list this year!
Rational Understanding of Risk
Peter L. Bernstein's, Against The Gods, The Remarkable Story of Risk,9 is a fascinating review of mankind's history of approaching risk, and how to understand, measure and deal with it. He reviews the advances in probability theory, which enabled the creation of insurance and, in turn, facilitated trade and investment. He states that managing risks depends on the use of three assumptions originated by Jacob Bernoulli around the year 1700: full information, independent trials and relevance of quantitative valuation.
Bernstein explores additional progress in risk management, particularly in investing. Diversification may reduce risk. However, some quantitative techniques for investing have failed. "Portfolio insurance," a quantitative approach to reduce equity holdings in market declines via the purchase of put options, intensified the market collapse of 1987. Subsequent to the book's publication, numerous quant managers have claimed that "six sigma" events (one in a million chance of occurring) caused huge losses in their funds. These failures occurred because the investment models violated Bernoulli's "independent trials" assumption stated above. Stock price movements may look independent, until numerous people attempt the same strategies or until human emotions result in lots of investors reacting in similar manners.
Stock Market Risks
Sentiment in the stock market seems to gyrate between greed and fear, creating bull and bear markets. Because the S&P 500 Index has fallen more than 20% from its peak, a bear market has been proclaimed. This suggests that the market is currently focusing on fear.
I recall a long-ago brokerage firm ad listing people's fears each year for decades. The list likely included events like the Cuban Missile Crisis and Three Mile Island. It noted that there seemed to be a reason to avoid investing in stocks each year. But starting with $1,000 50 years ago, an investment in the S&P 500 would have resulted in $140,364 as of June 30, 2008, vs. $13,619 if invested in super safe treasury bills. Meanwhile, inflation would require $7,535 to buy in 2008 what $1,000 bought in 1958.10 This example suggests that staying out of stocks would have been a very bad decision.
Market strategist Steve Leuthold provides lots of data and perspectives. Based on his estimate of "operating" (recurring) earnings, the S&P 500 at its July 11, 2008, close of 1,239 was selling at about 14.5-times earnings.
2
Wanger USA 2008 Semiannual Report
That multiple matched the depths of the 2002-2003 bear market and was below the market's average price-earnings (PE) ratio11 of 16.5-times, calculated since 1926. Leuthold notes that market price-earnings ratios vary a lot, and that inflation is a major driver of PE ratios. When inflation has varied between zero and 5%, PE ratios averaged 18- to 19-times. When inflation has been between 5% and 7%, PE ratios averaged 13.8-times, and when inflation was 7% or more, PE ratios averaged 11.4-times.12
Inflation has been boosted by fuel and food prices, and the Consumer Price Index recently spiked up to a 5% year-over-year gain. Some are concerned that we may be returning to a period of big government and stagflation. Future inflation is indeed unpredictable, but continued surges in fuel and food prices from current lofty levels seem unlikely. Low unit labor cost increases, continued globalization and the continued success of capitalism all suggest that inflation may slow. If inflation does slow, Leuthold's data suggests that PE ratios and stock prices can rise a lot.
We are stock pickers rather than economists, and we are now seeing what we believe to be many more excellent investment opportunities than we've seen for several years. Consequently, focusing on fear seems like a mistake and taking a longer term perspective seems to be more rational.


Charles P. McQuaid
President and Chief Investment Officer
Columbia Wanger Asset Management, L.P.
The information and data provided in this analysis are derived from sources that we deem to be reliable and accurate. These views are not guarantees of future performance and involve certain risks, uncertainties and assumptions that are difficult to predict so actual outcomes and results may differ significantly from the views expressed. The views/opinions expressed in this essay are those of the author and not of the Columbia Wanger Advisors Trust Board, are subject to change at any time based upon economic, market or other conditions, may differ from views expressed by other Columbia Management associates or other divisions of Bank of America and the respective parties disclaim any responsibility to update such views. These views may not be relied on as investment advice and, because investment decisions for a Columbia Wanger Fund are based on numerous factors, may not be relied on as an indication of trading intent on beha lf of any particular Columbia Wanger Fund.
1 Gardner, Dan, Risk, the Science and Politics of Fear, (Virgin Book Ltd, 2008), pg. 13.
2 In addition to Gardner's book on the subject of risk, I also recommend Panicology written by statisticians Simon Briscoe and Hugh Aldersey-Williams (Viking/Penguin Books, 2008).
3 Gardner, Dan, op. cit., pgs. 62-76.
4 Gardner notes that our ability to find trace chemicals has never been better. Today we have the technology to dissect the components of drinking water, for example, to the level of one part per billion—equivalent to a single grain of sugar in an Olympic-size swimming pool. While it's true that the elements in trace chemicals can cause cancer, science and testing almost never look at such trace amounts.
5 Gardner, Dan, op. cit., pg. 81.
6 Ibid, pg. 281.
7 Source: American Council on Science and Health, "ACSH Morning Dispatch," June 25, 2008.
8 The study titled, "Fact Versus Fears (Fourth Edition)" is available on the American Council on Science and Health website at www.acsh.org.
9 Bernstein, Peter L., Against the Gods, The Remarkable Story of Risk, (John Wiley & Sons, Inc., 1996).
10 Figures include the reinvestment of dividends and are pretax.
11 The price-earnings (PE) ratio reflects the price of a stock divided by earnings per share. This ratio gives investors an idea of how much they are paying for a company's earning power. In general, the higher the PE, the more investors are paying, and therefore the more earnings growth they are expecting.
12 Leuthold Weeden Institutional Research, "Perception For The Professional," August 2008, Vol. 28 No. 8.
3
Wanger USA 2008 Semiannual Report

Performance Review Wanger USA*

Robert A. Mohn
Portfolio Manager
Performance data quoted represents past performance and current performance may be lower or higher. Past performance is no guarantee of future results. The investment return and principal value of an investment in the Fund will fluctuate so that shares, when redeemed, may be worth more or less than the original cost. Performance may reflect any voluntary waivers or reimbursements of fund expenses by the advisor or its affiliates. Absent these waivers, or reimbursement arrangements, performance results may be lower. For daily and month-end performance updates, please call 1-888-4-WANGER.
While the second quarter of 2008 provided some relief in the markets, it was not enough to undo the damage caused in the first three months of the year. Wanger USA ended the half year down 8.15% vs. a 9.37% drop for the Fund's small-cap benchmark, the Russell 2000 Index. Large caps, as measured by the S&P 500 Index, did even worse, falling 11.91% in the six-month period.
Within the Fund's top 15 contributors to performance, seven were energy stocks. FMC Technologies gained 35% and Atwood Oceanics increased 24% in the period. Growing interest in offshore oil exploration fueled demand for FMC's deep water oil production systems and Atwood's deep water drilling rigs. Natural gas producers Ultra Petroleum, Equitable Resources, Quicksilver Resources, Southwestern Energy and Carrizo Oil & Gas enjoyed year-to-date returns ranging from 24% to 71%. These companies benefited from rising natural gas prices as well as their ability to increase production and reserves.
Other strong performers included Flir Systems, a manufacturer of infrared cameras. The company continued to win new military contracts and the stock increased 30% on its strong earnings growth. Retail stocks struggled along in the first half of the year but Fund holdings True Religion Apparel and Urban Outfitters bucked the trend. True Religion, a maker of premium jeans, is opening new retail stores and enjoyed strong revenue growth. Its stock gained 25% in the half year. Urban Outfitters saw strong same-store sales growth thanks to its unique Anthropologie and Free People concepts. The stock was up 14% for the half.
TheStreet.com fell 59% during the six-month period due to slowed revenue growth caused, in part, by tightened ad spending by financial companies. Regional casino operator Pinnacle Entertainment fell 55% on weak gaming revenues and the elimination of its takeout premium as private equity money for hotel/casino acquisitions dried up. TW Telecom and Abercrombie & Fitch both fell 21%, suffering from the impact of doing business in a rough economy. PDL BioPharma fell 39% after announcing it was terminating efforts to sell the company. The Fund no longer holds the stock.
Investors are an anxious lot these days. Granted, there is plenty to worry about, but don't ignore the positives. The Fed has significantly lowered interest rates, exports are surging and we believe stock market valuations appear reasonable. Remember, it's always darkest before the dawn.
*Effective June 1, 2008, Wanger U.S. Smaller Companies was renamed Wanger USA.
Risks include stock market fluctuations due to economic and business developments. Investments in small- and mid-cap companies may be subject to greater volatility and price fluctuations because they may be thinly traded and less liquid.
Fund's Positions in Mentioned Holdings
As a percentage of net assets, as of 6/30/08
| FMC Technologies | | | 4.0 | % | |
| Ultra Petroleum | | | 2.7 | | |
| Equitable Resources | | | 1.9 | | |
| Atwood Oceanics | | | 1.9 | | |
| TW Telecom | | | 1.9 | | |
| Urban Outfitters | | | 1.9 | | |
| Abercrombie & Fitch | | | 1.8 | | |
| True Religion Apparel | | | 1.7 | | |
| Carrizo Oil & Gas | | | 1.5 | | |
| Flir Systems | | | 1.4 | | |
| Quicksilver Resources | | | 1.0 | | |
| Southwestern Energy | | | 1.0 | | |
| Pinnacle Entertainment | | | 0.4 | | |
| TheStreet.com | | | 0.4 | | |
Portfolio holdings are subject to change periodically and may not be representative of current holdings.
4
Wanger USA 2008 Semiannual Report
Growth of a $10,000 Investment in
Wanger USA
Total return for each period,
May 3, 1995 (inception date) through June 30, 2008
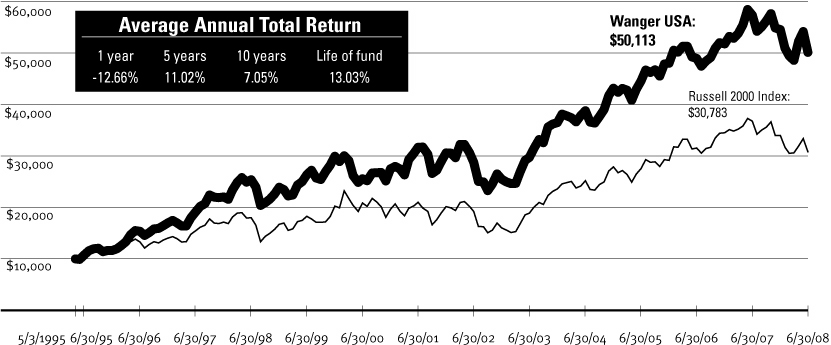
This graph compares the results of $10,000 invested in Wanger USA on May 3, 1995 (the date the Fund began operations) through June 30, 2008, to the Russell 2000 Index, with dividends and capital gains reinvested. Performance shown here is past performance, which cannot guarantee future results. Current performance may be higher or lower. The investment return and principal value of an investment in the Fund will fluctuate so that Fund shares, when redeemed, may be worth more or less than their original cost. Performance changes over time. Current returns for the Fund may be different than that shown. For daily and most recent month-end performance updates, please contact us at 1-888-4-WANGER.
Results as of June 30, 2008
| | | 2nd quarter | | Year to date | | 1 year | |
| Wanger USA | | | 3.16 | % | | | -8.15 | % | | | -12.66 | % | |
| Russell 2000 Index | | | 0.58 | | | | -9.37 | | | | -16.19 | | |
| S&P MidCap 400 Index | | | 5.43 | | | | -3.90 | | | | -7.34 | | |
| S&P 500 Index | | | -2.73 | | | | -11.91 | | | | -13.12 | | |
NAV as of 6/30/08: $29.39
Performance numbers reflect all Fund expenses but do not include any insurance charge imposed by your insurance company's separate accounts. If performance included the effect of these additional charges, it would be lower.
The Fund's annual operating expense ratio is 0.95%. The annual operating expense ratio is as stated in the Fund's prospectus that is current as of the date of this report. Differences in expense ratios disclosed elsewhere in this report may result from including fee waivers and expense reimbursements as well as different time periods used in calculating the ratios.
All results shown assume reinvestment of distributions and do not reflect taxes that a shareholder would pay on Fund distributions or the sale of Fund shares.
The Russell 2000 Index measures the performance of the 2,000 smallest companies in the Russell 3000 Index, which represents approximately 7% of the total market capitalization of the Russell 3000 Index. The S&P MidCap 400 Index is a market value-weighted index that tracks the performance of 400 mid-cap U.S. companies. The S&P 500 Index tracks the performance of 500 widely held, large-capitalization U.S. stocks. Indexes are not managed and do not incur fees or expenses. It is not possible to invest directly in an index.
Portfolio characteristics and holdings are subject to change periodically and may not be representative of current characteristics and holdings.
Top 5 Industries
As a percentage of net assets, as of 6/30/08
| Information | | | 28.9 | % | |
| Energy & Minerals | | | 16.0 | | |
| Consumer Goods & Services | | | 16.0 | | |
| Industrial Goods & Services | | | 15.4 | | |
| Finance | | | 12.4 | | |
Top 10 Holdings
As a percentage of net assets, as of 6/30/08
1. FMC Technologies
Oil & Gas Wellhead Manufacturer | | | 4.0 | % | |
2. ITT Educational Services
Post-secondary Degree Services | | | 3.3 | | |
3. Ultra Petroleum
Oil & Gas Producer | | | 2.7 | | |
4. Ametek
Aerospace/Industrial Instruments | | | 2.5 | | |
5. Equitable Resources
Natural Gas Producer & Utility | | | 1.9 | | |
6. Atwood Oceanics
Offshore Drilling Contractor | | | 1.9 | | |
7. TW Telecom
Fiber Optic Telephone/Data Services | | | 1.9 | | |
8. Urban Outfitters
Apparel & Home Specialty Retailer | | | 1.9 | | |
9. Global Payments
Credit Card Processor | | | 1.9 | | |
10. American Tower
Communications Towers in USA & Mexico | | | 1.8 | | |
5
Wanger USA 2008 Semiannual Report
Wanger USA
Statement of Investments (Unaudited) June 30, 2008
Number of
Shares | | | | Value | |
| | | Common Stocks – 98.9% | |
| | | Information – 28.9% | |
| | | Business Software – 6.0% | |
| | 757,310 | | | Micros Systems (a)
Information Systems for
Restaurants & Hotels | | | $23,090,382
| | |
| | 2,280,000 | | | Novell (a)
Directory, Operating System &
Identity Management Software | | | 13,429,200
| | |
| | 575,000 | | | Blackbaud
Software & Services for Non-profits | | | 12,305,000 | | |
| | 745,000 | | | Informatica (a)
Enterprise Data Integration Software | | | 11,204,800 | | |
| | 235,000 | | | ANSYS (a)
Simulation Software for
Engineers & Designers | | | 11,073,200
| | |
| | 304,000 | | | Concur Technologies (a)
Web Enabled Cost & Expense
Management Software | | | 10,101,920
| | |
| | 178,000 | | | Avid Technology (a)
Digital Nonlinear Editing Software & Systems | | | 3,024,220 | | |
| | 100,000 | | | Quality Systems
IT Systems for Medical Groups &
Ambulatory Care Centers | | | 2,928,000 | | |
| | 167,396 | | | Epicor (a)
Software Systems to Run Small Businesses | | | 1,156,706
| | |
| | | | | | | | 88,313,428 | | |
| | | Instrumentation – 4.1% | |
| | 500,000 | | | Flir Systems (a)
Infrared Cameras | | | 20,285,000
| | |
| | 160,000 | | | Mettler Toledo (a)
Laboratory Equipment | | | 15,177,600
| | |
| | 368,000 | | | Trimble Navigation (a)
GPS-based Instruments | | | 13,137,600
| | |
| | 485,000 | | | IPG Photonics (a)
Fiber Lasers | | | 9,122,850
| | |
| | 45,000 | | | Varian (a)
Analytical Instruments | | | 2,297,700
| | |
| | | | | | | | 60,020,750 | | |
| | | Semiconductors & Related Equipment – 3.4% | |
| | 743,000 | | | Microsemi (a)
Analog/Mixed-signal Semiconductors | | | 18,708,740
| | |
| | 1,180,000 | | | Integrated Device Technology (a)
Communications Semiconductors | | | 11,729,200
| | |
Number of
Shares | | | | Value | |
| | 1,179,750 | | | ON Semiconductor (a)
Mixed-signal & Power
Management Semiconductors | | | $10,818,308
| | |
| | 189,300 | | | Supertex (a)
Mixed-signal Semiconductors | | | 4,418,262
| | |
| | 140,000 | | | Littelfuse (a)
Little Fuses | | | 4,417,000
| | |
| | | | | | | | 50,091,510 | | |
| | | Mobile Communications – 3.1% | |
| | 640,000 | | | American Tower (a)
Communications Towers in USA & Mexico | | | 27,040,000
| | |
| | 495,000 | | | Crown Castle International (a)
Communications Towers | | | 19,171,350
| | |
| | 88,000 | | | Globalstar (a)
Satellite Mobile Voice & Data Carrier | | | 249,040 | | |
| | | | | | | | 46,460,390 | | |
| | | Telephone Services – 2.3% | |
| | 1,731,000 | | | TW Telecom (a)
Fiber Optic Telephone/Data Services | | | 27,747,930
| | |
| | 280,000 | | | Cogent Communications (a)
Internet Data Pipelines | | | 3,752,000
| | |
| | 400,000 | | | PAETEC Holding (a)
Telephone/Data Services for Business | | | 2,540,000
| | |
| | | | | | | | 34,039,930 | | |
| | | Computer Hardware & Related Equipment – 1.9% | |
| | 375,600 | | | Amphenol
Electronic Connectors | | | 16,856,928
| | |
| | 160,000 | | | II-VI (a)
Laser Components | | | 5,587,200
| | |
| | 120,000 | | | Nice Systems – ADR (Israel) (a)
Audio & Video Recording Solutions | | | 3,548,400
| | |
| | 85,000 | | | Zebra Technologies (a)
Bar Code Printers | | | 2,774,400
| | |
| | | | | | | | 28,766,928 | | |
| | | Telecommunications Equipment – 1.9% | |
| | 2,889,900 | | | Tellabs (a)
Telecommunications Equipment | | | 13,438,035
| | |
| | 475,000 | | | Polycom (a)
Video Conferencing Equipment | | | 11,571,000 | | |
See accompanying notes to financial statements.
6
Wanger USA 2008 Semiannual Report
Wanger USA
Statement of Investments (Unaudited) June 30, 2008
Number of
Shares | | | | Value | |
| | | Telecommunications Equipment – 1.9% (cont) | |
| | 125,000 | | | Ciena (a)
Optical Transport & Broadband
Access Equipment | | $ | 2,896,250 | | |
| | | | | | | | 27,905,285 | | |
| | | Financial Processors – 1.9% | |
| | 586,880 | | | Global Payments
Credit Card Processor | | | 27,348,608
| | |
| | | Internet Related – 1.1% | |
| | 530,000 | | | ValueClick (a)
Internet Advertising | | | 8,029,500
| | |
| | 875,000 | | | TheStreet.com
Financial Information Website Publisher | | | 5,696,250 | | |
| | 310,000 | | | SkillSoft – ADR (a)
Web-based Learning Solutions (E-Learning) | | | 2,802,400 | | |
| | | | | | | | 16,528,150 | | |
| | | Business Information & Marketing Services – 0.8% | |
| | 443,200 | | | Navigant Consulting (a)
Financial Consulting Firm | | | 8,668,992 | | |
| | 100,000 | | | Viad
Trade Show Services, Travel & Tours | | | 2,579,000 | | |
| | | | | | | | 11,247,992 | | |
| | | Computer Services – 0.7% | |
| | 705,500 | | | Hackett Group (a)
IT Integration & Best Practice Research | | | 4,049,570 | | |
| | 155,000 | | | SRA International (a)
Government IT Services | | | 3,481,300 | | |
| | 753,000 | | | RCM Technologies (a)(b)
Technology & Engineering Services | | | 3,245,430 | | |
| | | | | | | | 10,776,300 | | |
| | | Gaming Equipment & Services – 0.6% | |
| | 155,000 | | | Bally Technologies (a)
Slot Machines & Software | | | 5,239,000
| | |
| | 100,000 | | | Scientific Games (a)
Lottery Services Provider | | | 2,962,000
| | |
| | | | | | | | 8,201,000 | | |
Number of
Shares | | | | Value | |
| | | CATV – 0.4% | |
| | 240,000 | | | Discovery Holding (a)
CATV Programming | | $ | 5,270,400 | | |
| | | Contract Manufacturing – 0.3% | |
| | 115,000 | | | Plexus (a)
Electronic Manufacturing Services | | | 3,183,200 | | |
| | 1,500,000 | | | Sanmina-SCI (a)
Electronic Manufacturing Services | | | 1,920,000 | | |
| | | | | | | | 5,103,200 | | |
| | | TV Broadcasting – 0.2% | |
| | 880,000 | | | Entravision Communications (a)
Spanish Language TV, Radio & Outdoor | | | 3,537,600 | | |
| | | Radio – 0.2% | |
| | 561,900 | | | Salem Communications
Radio Stations for Religious Programming | | | 1,106,943 | | |
| | 260,000 | | | Cumulus Media (a)
Radio Stations in Small Cities | | | 1,024,400 | | |
| | 515,000 | | | Spanish Broadcasting System (a)
Spanish Language Radio Stations | | | 587,100 | | |
| | | | 2,718,443 | | |
| | | | | Total Information | | | 426,329,914 | | |
| | | Energy & Minerals – 16.0% | |
| | | Oil & Gas Producers – 8.1% | |
| | 400,000 | | | Ultra Petroleum (a)
Oil & Gas Producer | | | 39,280,000
| | |
| | 416,000 | | | Equitable Resources
Natural Gas Producer & Utility | | | 28,728,960
| | |
| | 325,000 | | | Carrizo Oil & Gas (a)
Explores for Natural Gas & Crude Oil | | | 22,129,250
| | |
| | 390,000 | | | Quicksilver Resources (a)
Natural Gas & Coal Seam Gas Producer | | | 15,069,600
| | |
| | 307,200 | | | Southwestern Energy (a)
Oil & Gas Producer | | | 14,625,792
| | |
| | | | | | | | 119,833,602 | | |
| | | Oil Services – 7.7% | |
| | 761,400 | | | FMC Technologies (a)
Oil & Gas Wellhead Manufacturer | | | 58,574,502
| | |
| | 230,000 | | | Atwood Oceanics (a)
Offshore Drilling Contractor | | | 28,598,200
| | |
See accompanying notes to financial statements.
7
Wanger USA 2008 Semiannual Report
Wanger USA
Statement of Investments (Unaudited) June 30, 2008
Number of
Shares | | | | Value | |
| | | Oil Services – 7.7% (cont) | |
| | 203,125 | | | Exterran Holdings (a)
Natural Gas Compressor Rental & Fabrication | | | $14,521,406
| | |
| | 241,500 | | | Tetra Technologies (a)
U.S.-based Service Company with Life of
Field Approach | | | 5,725,965
| | |
| | 108,700 | | | Tesco (a)
Developing New Well Drilling Technologies | | | 3,472,965 | | |
| | 69,800 | | | Dresser-Rand Group (a)
Largest Manufacturer of Compressors | | | 2,729,180 | | |
| | | | | | | | 113,622,218 | | |
| | | Oil Refining, Marketing & Distribution – 0.2% | |
| | 50,000 | | | Oneok
Natural Gas Distribution, Pipeline
Processing & Trading | | | 2,441,500 | | |
| | | | | Total Energy & Minerals | | | 235,897,320 | | |
| | | Consumer Goods & Services – 16.0% | |
| | | Retail 4.9% | |
| | 885,000 | | | Urban Outfitters (a)
Apparel & Home Specialty Retailer | | | 27,603,150 | | |
| | 431,000 | | | Abercrombie & Fitch
Teen Apparel Retailer | | | 27,015,080 | | |
| | 240,000 | | | J Crew Group (a)
Multi-channel Branded Retailer | | | 7,922,400 | | |
| | 350,000 | | | Talbots
Women's Specialty Retailer | | | 4,056,500 | | |
| | 409,150 | | | Christopher & Banks
Women's Apparel Retailer | | | 2,782,220 | | |
| | 150,000 | | | Gaiam (a)
Healthy Living Catalogs & E-Commerce | | | 2,026,500 | | |
| | | | | | | | 71,405,850 | | |
| | | Other Consumer Services – 3.6% | |
| | 585,000 | | | ITT Educational Services (a)
Post-secondary Degree Services | | | 48,338,550 | | |
| | 150,000 | | | Weight Watchers International
Weight Loss Programs | | | 5,341,500 | | |
| | | | | | | | 53,680,050 | | |
| | | Apparel – 3.1% | |
| | 925,000 | | | True Religion Apparel (a)
Premium Denim | | | 24,651,250 | | |
Number of
Shares | | | | Value | |
| | 459,000 | | | Coach (a)
Designer & Retailer of Branded
Leather Accessories | | $ | 13,255,920 | | |
| | 394,200 | | | Oxford Industries
Branded & Private Label Apparel | | | 7,548,930 | | |
| | | | | | | | 45,456,100 | | |
| | | Other Durable Goods – 1.2% | |
| | 288,400 | | | Cavco Industries (a)
Higher End Manufactured Homes | | | 9,439,332 | | |
| | 1,478,300 | | | Champion Enterprises (a)
Manufactured Homes | | | 8,648,055 | | |
| | | | | | | | 18,087,387 | | |
| | | Leisure Products – 0.7% | |
| | 80,200 | | | International Speedway
Largest Motorsports Racetrack
Owner & Operator | | | 3,130,206 | | |
| | 140,000 | | | Thor Industries
RV & Bus Manufacturer | | | 2,976,400 | | |
| | 130,000 | | | Speedway Motorsports
Motorsports Racetrack Owner & Operator | | | 2,649,400 | | |
| | 150,000 | | | Winnebago
Premier Motorhome Maker | | | 1,528,500 | | |
| | | | | | | | 10,284,506 | | |
| | | Furniture & Textiles – 0.6% | |
| | 200,000 | | | Herman Miller
Office Furniture | | | 4,978,000 | | |
| | 335,000 | | | Knoll
Office Furniture | | | 4,070,250 | | |
| | | | | | | | 9,048,250 | | |
| | | Consumer Goods Distribution – 0.5% | |
| | 433,500 | | | Pool
Distributor of Swimming Pool
Supplies & Equipment | | | 7,698,960 | | |
| | | Travel – 0.5% | |
| | 160,000 | | | Vail Resorts (a)
Ski Resort Operator & Developer | | | 6,852,800 | | |
| | | Casinos & Gaming – 0.4% | |
| | 555,000 | | | Pinnacle Entertainment (a)
Regional Casino Operator | | | 5,821,950 | | |
See accompanying notes to financial statements.
8
Wanger USA 2008 Semiannual Report
Wanger USA
Statement of Investments (Unaudited) June 30, 2008
Number of
Shares | | | | Value | |
| | | Restaurants – 0.3% | |
| | 337,500 | | | Sonic (a)
Quick Service Restaurant | | $ | 4,995,000 | | |
| | | Nondurables – 0.2% | |
| | 122,000 | | | Jarden (a)
Branded Household Products | | | 2,225,280 | | |
| | | | | Total Consumer Goods & Services | | | 235,556,133 | | |
| | | Industrial Goods & Services – 15.4% | |
| | | Machinery – 10.5% | |
| | 795,000 | | | Ametek
Aerospace/Industrial Instruments | | | 37,539,900 | | |
| | 365,100 | | | Nordson
Dispensing Systems for Adhesives & Coatings | | | 26,612,139 | | |
| | 527,300 | | | ESCO Technologies (a)
Automatic Electric Meter Readers | | | 24,740,916 | | |
| | 690,600 | | | Pentair
Pumps & Water Treatment | | | 24,184,812 | | |
| | 392,300 | | | Donaldson
Industrial Air Filtration | | | 17,512,272 | | |
| | 182,200 | | | Mine Safety Appliances
Safety Equipment | | | 7,286,178 | | |
| | 196,000 | | | Clarcor
Mobile & Industrial Filters | | | 6,879,600 | | |
| | 140,000 | | | MOOG (a)
Motion Control Products for Aerospace,
Defense & Industrial Markets | | | 5,213,600 | | |
| | 50,000 | | | Kaydon
Specialized Friction & Motion
Control Products | | | 2,570,500 | | |
| | 22,974 | | | Lincoln Electric
Welding Equipment & Consumables | | | 1,808,054 | | |
| | | | | | | | 154,347,971 | | |
| | | Outsourcing Services – 1.5% | |
| | 400,000 | | | Quanta Services (a)
Electrical & Telecom Construction Services | | | 13,308,000 | | |
| | 305,000 | | | Administaff
Professional Employer Organization | | | 8,506,450 | | |
| | | | | | | | 21,814,450 | | |
Number of
Shares | | | | Value | |
| | | Industrial Materials & Specialty
Chemicals – 0.9% | |
| | 100,000 | | | Cytec Industries
Aerospace Composites & Specialty Chemicals | | $ | 5,456,000 | | |
| | 50,000 | | | Greif
Industrial Packaging | | | 3,201,500 | | |
| | 90,000 | | | Albany International
Paper Machine Clothing & Advanced Textiles | | | 2,610,000 | | |
| | 155,000 | | | Drew Industries (a)
RV & Manufactured Home Components | | | 2,472,250 | | |
| | | | | | | | 13,739,750 | | |
| | | Other Industrial Services – 0.7% | |
| | 365,000 | | | American Reprographics (a)
Document Management & Logistics | | | 6,077,250 | | |
| | 180,000 | | | TrueBlue (a)
Temporary Manual Labor | | | 2,377,800 | | |
| | 200,000 | | | American Commercial Lines (a)
Operator/Builder of Inland Barges | | | 2,186,000 | | |
| | | | | | | | 10,641,050 | | |
| | | Construction – 0.6% | |
| | 35,000 | | | Martin Marietta Materials
Aggregates | | | 3,625,650 | | |
| | 50,000 | | | Texas Industries
Aggregates, Cement & Concrete | | | 2,806,500 | | |
| | 140,000 | | | M/I Homes
Home Builder | | | 2,202,200 | | |
| | | | | | | | 8,634,350 | | |
| | | Electrical Components – 0.4% | |
| | 145,000 | | | Acuity Brands
Commercial Lighting Fixtures | | | 6,971,600 | | |
| | | Waste Management – 0.4% | |
| | 184,200 | | | Waste Connections (a)
Solid Waste Management | | | 5,881,506 | | |
| | | Industrial Distribution – 0.2% | |
| | 50,000 | | | Airgas
Industrial Gas Distributor | | | 2,919,500 | | |
See accompanying notes to financial statements.
9
Wanger USA 2008 Semiannual Report
Wanger USA
Statement of Investments (Unaudited) June 30, 2008
Number of
Shares | | | | Value | |
| | | Steel – 0.2% | |
| | 46,100 | | | Haynes International (a)
Producer of High Performance Alloys | | $ | 2,653,055 | | |
| | | | | Total Industrial Goods & Services | | | 227,603,232 | | |
| | | Finance – 12.4% | |
| | | Banks – 4.0% | |
| | 455,100 | | | MB Financial
Chicago Bank | | | 10,226,097 | | |
| | 614,250 | | | Valley National Bancorp
New Jersey/New York Bank | | | 9,686,723 | | |
| | 689,700 | | | TCF Financial
Great Lakes Bank | | | 8,297,091 | | |
| | 424,305 | | | Lakeland Financial
Indiana Bank | | | 8,095,739 | | |
| | 437,000 | | | Pacific Continental
Niche Pacific N.W. Bank | | | 4,802,630 | | |
| | 280,816 | | | Glacier Bancorp
Mountain States Bank | | | 4,490,248 | | |
| | 155,600 | | | Associated Banc-Corp
Midwest Bank | | | 3,001,524 | | |
| | 60,000 | | | SVB Financial Group (a)
Bank to Venture Capitalists | | | 2,886,600 | | |
| | 192,928 | | | Old Second Bancorp
Illinois Bank | | | 2,241,823 | | |
| | 500,000 | | | Guaranty Bancorp (a)
Colorado Bank | | | 1,800,000 | | |
| | 100,000 | | | Greene County Bancshares
Tennessee Bank | | | 1,402,000 | | |
| | 82,154 | | | First Busey
Illinois Bank | | | 1,086,076 | | |
| | | | | | | | 58,016,551 | | |
| | | Insurance – 3.0% | |
| | 720,500 | | | HCC Insurance Holdings
Specialty Insurance | | | 15,231,370 | | |
| | 276,000 | | | Leucadia National
Insurance Holding Company | | | 12,955,440 | | |
| | 19,300 | | | Markel (a)
Specialty Insurance | | | 7,083,100 | | |
| | 105,000 | | | Philadelphia Consolidated Holding (a)
Specialty Insurance | | | 3,566,850 | | |
Number of
Shares | | | | Value | |
| | 62,800 | | | Navigators Group (a)
Specialty Insurance | | $ | 3,394,340 | | |
| | 75,000 | | | Endurance Specialty Holdings
Commercial Lines Insurance/Reinsurance | | | 2,309,250 | | |
| | | | | | | | 44,540,350 | | |
| | | Finance Companies – 2.8% | |
| | 1,142,400 | | | AmeriCredit (a)
Auto Lending | | | 9,847,488 | | |
| | 270,000 | | | McGrath Rentcorp
Temporary Space & IT Rentals | | | 6,639,300 | | |
| | 145,000 | | | GATX
Rail Car Lessor | | | 6,427,850 | | |
| | 144,800 | | | World Acceptance (a)
Personal Loans | | | 4,875,416 | | |
| | 350,000 | | | H&E Equipment Services (a)
Heavy Equipment Leasing | | | 4,207,000 | | |
| | 230,000 | | | CAI International (a)
International Container Leasing & Management | | | 4,002,000 | | |
| | 140,000 | | | Aaron Rents
Rent-to-Own | | | 3,126,200 | | |
| | 200,000 | | | Electro Rent
Test & Measurement Rentals | | | 2,508,000 | | |
| | | | | | | | 41,633,254 | | |
| | | Savings & Loans – 1.6% | |
| | 734,030 | | | People's United
Connecticut Savings & Loan | | | 11,450,868 | | |
| | 600,000 | | | ViewPoint Financial
Texas Thrfit | | | 8,832,000 | | |
| | 138,500 | | | Berkshire Hills Bancorp
Northeast Thrift | | | 3,275,525 | | |
| | 10,900 | | | Anchor Bancorp Wisconsin
Wisconsin Thrift | | | 76,409 | | |
| | | | | | | | 23,634,802 | | |
| | | Brokerage & Money Management – 1.0% | |
| | 642,000 | | | SEI Investments
Mutual Fund Administration &
Investment Management | | | 15,099,840 | | |
| | | | | Total Finance | | | 182,924,797 | | |
See accompanying notes to financial statements.
10
Wanger USA 2008 Semiannual Report
Wanger USA
Statement of Investments (Unaudited) June 30, 2008
Number of
Shares | | | | Value | |
| | | Health Care – 7.4% | |
| | | Biotechnology & Drug Delivery – 2.8% | |
| | 405,000 | | | BioMarin (a)
Biotech Focused on Orphan Diseases | | $ | 11,736,900 | | |
| | 53,000 | | | United Therapeutics (a)
Biotech Focused on Rare Diseases | | | 5,180,750 | | |
| | 100,000 | | | Myriad Genetics (a)
Drugs/Diagnostics Hybrid | | | 4,552,000 | | |
| | 501,400 | | | Seattle Genetics (a)
Antibody-based Therapies for Cancer | | | 4,241,844 | | |
| | 125,000 | | | Auxilium Pharmaceuticals (a)
Biotech Focused on Niche Disease Areas | | | 4,202,500 | | |
| | 545,000 | | | Array Biopharma (a)
Drugs for Cancer & Inflammatory Diseases | | | 2,561,500 | | |
| | 320,000 | | | Medarex (a)
Humanized Antibodies | | | 2,115,200 | | |
| | 401,000 | | | Arena Pharmaceuticals (a)
Novel Drug Targeting Technology | | | 2,081,190 | | |
| | 535,000 | | | Nektar Therapeutics (a)
Drug Delivery Technologies | | | 1,792,250 | | |
| | 320,000 | | | Pharmacopeia (a)
Biotech Company with Broad
Early-stage Pipeline | | | 1,225,600 | | |
| | 515,000 | | | Decode Genetics (a)
Drugs for Heart Attack, Asthma &
Vascular Disease | | | 473,800 | | |
| | 400,000 | | | Neurogen (a)
Development-stage Biotech Focused
on Neurology | | | 412,000 | | |
| | 500,000 | | | IsoRay (a) | | | 275,000 | | |
| | 100,000 | | | IsoRay – Warrants (a)(c)
Radiology Cancer Company | | | 5,000 | | |
| | 25,000 | | | Locus Pharmaceuticals,
Series A-1, Pfd. (a)(c) | | | 25,000 | | |
| | 12,886 | | | Locus Pharmaceuticals,
Series B-1, Pfd. (a)(c)
High Throughput Rational Drug Design | | | 12,886 | | |
| | 738,060 | | | Medicure – Warrants (a)(c)
Cardiovascular Biotech Company | | | 14,761 | | |
| | | | | | | | 40,908,181 | | |
| | | Medical Equipment & Devices – 1.5% | |
| | 105,000 | | | Alexion Pharmaceuticals (a)
Biotech Focused on Orphan Diseases | | | 7,612,500 | | |
Number of
Shares | | | | Value | |
| | 85,000 | | | Illumina (a)
Leading Tools & Service Provider for
Genetic Analysis | | $ | 7,404,350 | | |
| | 105,000 | | | Vital Signs
Anesthesia, Respiratory & Sleep Products | | | 5,961,900 | | |
| | 36,800 | | | Orthofix International (a)
Bone Fixation & Stimulation Devices | | | 1,065,360 | | |
| | | | | | | | 22,044,110 | | |
| | | Medical Supplies – 1.3% | |
| | 280,000 | | | QIAGEN (Netherlands) (a)
Life Science Company; DNA/RNA Purification | | | 5,636,400 | | |
| | 70,700 | | | Techne (a)
Cytokines, Antibodies & Other Reagents for
Life Science | | | 5,471,473 | | |
| | 105,000 | | | Meridian Biosciences
Niche Diagnostics/Life Science Company | | | 2,826,600 | | |
| | 100,000 | | | Immucor, Inc. (a)
Automated Blood Typing | | | 2,588,000 | | |
| | 53,000 | | | Idexx Laboratories (a)
Diagnostic Equipment & Services for Veterinarians | | | 2,583,220 | | |
| | | | | | | | 19,105,693 | | |
| | | Health Care Services – 1.0% | |
| | 435,000 | | | PSS World Medical (a)
Medical Supplies | | | 7,090,500 | | |
| | 180,000 | | | Psychiatric Solutions (a)
Behavioral Health Services | | | 6,811,200 | | |
| | | | | | | | 13,901,700 | | |
| | | Pharmaceuticals – 0.8% | |
| | 145,000 | | | Cephalon (a)
Specialty Pharmaceuticals for Pain,
Central Nervous System & Oncology | | | 9,670,050 | | |
| | 765,000 | | | QLT (a)
Specialty Pharmaceuticals for
Ophthalmology & Dermatology | | | 2,623,950 | | |
| | | | 12,294,000 | | |
| | | | | Total Health Care | | | 108,253,684 | | |
| | | Other Industries – 2.8% | |
| | | Real Estate – 1.4% | |
| | 222,500 | | | Gaylord Entertainment (a)
Convention Hotels | | | 5,331,100 | | |
See accompanying notes to financial statements.
11
Wanger USA 2008 Semiannual Report
Wanger USA
Statement of Investments (Unaudited) June 30, 2008
Number of Shares
or Principal Amount | | | | Value | |
| | | Real Estate – 1.4% (cont) | |
| | 100,000 | | | Digital Realty Trust
Technology-focused Office Buildings | | $ | 4,091,000 | | |
| | 120,000 | | | BioMed Realty Trust
Life Science-focused Office Buildings | | | 2,943,600 | | |
| | 85,000 | | | Corporate Office Properties
Office Buildings | | | 2,918,050 | | |
| | 90,000 | | | American Campus Communities
Student Housing | | | 2,505,600 | | |
| | 150,000 | | | Kite Realty Group
Community Shopping Centers | | | 1,875,000 | | |
| | | | | | | | 19,664,350 | | |
| | | Transportation – 1.1% | |
| | 580,800 | | | Heartland Express
Regional Trucker | | | 8,659,728 | | |
| | 160,000 | | | JB Hunt Transport Services
Truck & Intermodal Carrier | | | 5,324,800 | | |
| | 180,000 | | | Rush Enterprises (a)
Truck Distribution | | | 2,161,800 | | |
| | | | | | | | 16,146,328 | | |
| | | Regulated Utilities – 0.3% | |
| | 185,000 | | | Northeast Utilities
Regulated Electric Utility | | | 4,723,050 | | |
| | | | | Total Other Industries | | | 40,533,728 | | |
| Total Common Stocks (Cost: $1,122,608,066) – 98.9% | | | 1,457,098,808 | | |
| Short-Term Obligations – 1.0% | | | |
| | | Repurchase Agreement – 0.5% | |
| $ | 8,130,000 | | | Repurchase Agreement with
Fixed Income Clearing Corp.,
dated 06/30/08, due 07/01/08
at 1.80%, collateralized by
a U.S. Treasury Obligation
maturing 08/15/23, market
value $8,295,981 (repurchase
proceeds $8,130,407) | | | 8,130,000 | | |
| | | Commercial Paper – 0.5% | |
| | 7,400,000 | | | Toyota Motor Credit
2.00% due 07/02/08 | | | 7,399,589 | | |
| Total Short-Term Obligations (Cost: $15,529,589) – 1.0% | | | 15,529,589 | | |
| | | Value | |
| Total Investments (Cost: $1,138,137,655) – 99.9% (d) | | $ | 1,472,628,397 | | |
| Cash and Other Assets Less Liabilities – 0.1% | | | 1,083,211 | | |
| Total Net Assets – 100.0% | | $ | 1,473,711,608 | | |
Notes to Statement of Investments:
(a) Non-income producing security.
(b) An affiliate may include any company in which the Fund owns five percent or more of its outstanding voting shares. Transactions in affiliated companies during the six months ended June 30, 2008 are as follows:
Affiliates | | Balance
of Shares
Held
12/31/2007 | |
Purchases/
Additions | |
Sales/
Reductions | | Balance
of Shares
Held
06/30/2008 | |
Value | |
Dividend | |
RCM
Technologies | | | 753,000 | | | | — | | | | — | | | | 753,000 | | | $ | 3,245,430 | | | | — | | |
The aggregate cost and value of this company at June 30, 2008, was $5,474,962 and $3,245,430 respectively. Investments in affiliate companies represent 0.22% of total net assets at June 30, 2008.
(c) Denotes a restricted security, which is subject to restrictions on resale under federal securities laws. These securities are valued in good faith by the Board of Trustees. At June 30, 2008, these securities amounted to $57,647 which represents less than 0.01% of total net assets.
Additional information on these securities is as follows:
Security | | Acquisition
Dates | |
Shares | |
Cost | |
Value | |
Locus Pharmaceuticals,
Series A-1, Pfd. | | 9/5/01 | | | 25,000 | | | $ | 1,000,000 | | | $ | 25,000 | | |
Locus Pharmaceuticals,
Series B-1, Pfd. | | 2/8/07 | | | 12,886 | | | | 37,369 | | | | 12,886 | | |
| IsoRay – Warrants | | 3/21/07 | | | 100,000 | | | | — | | | | 5,000 | | |
| Medicure – Warrants | | 12/22/06 | | | 738,060 | | | | — | | | | 14,761 | | |
| | | | | | | | | $ | 1,037,369 | | | $ | 57,647 | | |
See accompanying notes to financial statements.
12
Wanger USA 2008 Semiannual Report
Wanger USA
Statement of Investments (Unaudited) June 30, 2008
(d) At June 30, 2008, for federal income tax purposes cost of investments was $1,138,137,655 and net unrealized appreciation was $334,490,742 consisting of gross unrealized appreciation of $541,686,222 and gross unrealized depreciation of $207,195,480.
At June 30, 2008, the Fund held investments in the following sectors:
| Sector | | % of
Net Assets | |
| Information | | | 28.9 | | |
| Energy & Minerals | | | 16.0 | | |
| Consumer Goods & Services | | | 16.0 | | |
| Industrial Goods & Services | | | 15.4 | | |
| Finance | | | 12.4 | | |
| Health Care | | | 7.4 | | |
| Other Industries | | | 2.8 | | |
| Short-Term Obligations | | | 1.0 | | |
| Cash and Other Assets Less Liabilities | | | 0.1 | | |
| | | | 100.0 | | |
ADR = American Depositary Receipts
See accompanying notes to financial statements.
13
Wanger USA 2008 Semiannual Report
Statement of Assets and Liabilities
June 30, 2008 (Unaudited)
| Assets: | |
| Unaffiliated investments, at cost | | $ | 1,132,662,693 | | |
| Affiliated investments, at cost (See Note 4) | | | 5,474,962 | | |
| Unaffiliated investments, at value | | $ | 1,469,382,967 | | |
| Affiliated investments, at value (See Note 4) | | | 3,245,430 | | |
| Cash | | | 377,028 | | |
| Receivable for: | |
| Investments sold | | | 10,668,414 | | |
| Fund shares sold | | | 32,050 | | |
| Interest | | | 406 | | |
| Dividends | | | 527,708 | | |
| Trustees' deferred compensation plan | | | 59,103 | | |
| Total Assets | | | 1,484,293,106 | | |
| Liabilities: | |
| Payable for: | |
| Investments purchased | | | 6,654,540 | | |
| Fund shares repurchased | | | 2,523,081 | | |
| Investment advisory fee | | | 1,090,774 | | |
| Administration fee | | | 64,073 | | |
| Transfer agent fee | | | 48 | | |
| Trustees' fees | | | 1,101 | | |
| Custody fee | | | 5,645 | | |
| Trustees' deferred compensation plan | | | 59,103 | | |
| Other liabilities | | | 183,133 | | |
| Total Liabilities | | | 10,581,498 | | |
| Net Assets | | $ | 1,473,711,608 | | |
| Composition of Net Assets: | |
| Paid-in capital | | $ | 1,181,128,252 | | |
| Overdistributed net investment income | | | (2,523,308 | ) | |
| Accumulated net realized loss | | | (39,384,078 | ) | |
| Net unrealized appreciation on investments | | | 334,490,742 | | |
| Net Assets | | $ | 1,473,711,608 | | |
| Fund Shares Outstanding | | | 50,142,858 | | |
Net asset value, offering price and redemption
price per share | | $ | 29.39 | | |
Statement of Operations
For the Six Months Ended June 30, 2008 (Unaudited)
| Investment Income: | |
| Dividends | | $ | 4,427,763 | | |
| Interest income | | | 306,894 | | |
| Total Investment Income | | | 4,734,657 | | |
| Expenses: | |
| Investment advisory fee | | | 6,516,056 | | |
| Administration fee | | | 382,681 | | |
| Transfer agent fee | | | 309 | | |
| Trustees' fees | | | 38,063 | | |
| Custody fee | | | 22,402 | | |
| Reports to shareholders | | | 177,863 | | |
| Legal fees | | | 30,623 | | |
| Chief compliance officer expenses (See Note 4) | | | 19,503 | | |
| Other expenses (See Note 5) | | | 31,154 | | |
| Total Expenses | | | 7,218,654 | | |
| Custody earnings credit | | | (2,021 | ) | |
| Net Expenses | | | 7,216,633 | | |
| Net Investment Loss | | | (2,481,976 | ) | |
| Net Realized and Unrealized Loss on Investments: | |
| Net realized loss on: | |
| Investments | | | (39,025,566 | ) | |
| Net realized loss | | | (39,025,566 | ) | |
| Net change in unrealized depreciation on: | |
| Unaffiliated investments | | | (93,127,098 | ) | |
| Affiliated investments (See Note 4) | | | (1,182,210 | ) | |
Net change in unrealized depreciation
on investments | | | (94,309,308 | ) | |
| Net Loss | | | (133,334,874 | ) | |
| Net Decrease in Net Assets from Operations | | $ | (135,816,850 | ) | |
See accompanying notes to financial statements.
14
Wanger USA 2008 Semiannual Report
Statement of Changes in Net Assets
| Increase (Decrease) in Net Assets | | (Unaudited)
Six Months
Ended
June 30,
2008 | | Year Ended
December 31,
2007 | |
| From Operations: | |
| Net investment loss | | $ | (2,481,976 | ) | | $ | (2,803,605 | ) | |
| Net realized gain (loss) on investments | | | (39,025,566 | ) | | | 170,386,161 | | |
| Net change in unrealized depreciation on investments | | | (94,309,308 | ) | | | (89,827,618 | ) | |
| Net Increase (Decrease) in Net Assets from Operations | | | (135,816,850 | ) | | | 77,754,938 | | |
| Distributions to Shareholders: | |
| From net realized gains | | | (170,275,092 | ) | | | (85,256,052 | ) | |
| Share Transactions: | |
| Subscriptions | | | 36,656,229 | | | | 217,123,775 | | |
| Distributions reinvested | | | 170,275,092 | | | | 85,256,052 | | |
| Redemptions | | | (115,167,924 | ) | | | (215,178,752 | ) | |
| Net Increase from Share Transactions | | | 91,763,397 | | | | 87,201,075 | | |
| Total Increase (Decrease) in Net Assets | | | (214,328,545 | ) | | | 79,699,961 | | |
| Net Assets: | |
| Beginning of period | | | 1,688,040,153 | | | | 1,608,340,192 | | |
| End of period | | $ | 1,473,711,608 | | | $ | 1,688,040,153 | | |
| Overdistributed net investment income at end of period | | $ | (2,523,308 | ) | | $ | (41,332 | ) | |
See accompanying notes to financial statements.
15
Wanger USA 2008 Semiannual Report
Financial Highlights
| | | (Unaudited)
Six Months Ended
June 30, | | Year Ended December 31, | |
| Selected data for a share outstanding throughout each period | | 2008 | | 2007 | | 2006 | | 2005 | | 2004 | | 2003 | |
| Net Asset Value, Beginning of Period | | $ | 36.26 | | | $ | 36.36 | | | $ | 34.90 | | | $ | 31.37 | | | $ | 26.51 | | | $ | 18.51 | | |
| Income from Investment Operations: | |
| Net investment income (loss) (a) | | | (0.05 | ) | | | (0.05 | )(b) | | | (0.02 | ) | | | 0.09 | | | | (0.14 | ) | | | (0.11 | ) | |
| Net realized and unrealized gain (loss) on investments | | | (3.09 | ) | | | 1.91 | | | | 2.71 | | | | 3.44 | | | | 5.00 | | | | 8.11 | | |
| Total from Investment Operations | | | (3.14 | ) | | | 1.86 | | | | 2.69 | | | | 3.53 | | | | 4.86 | | | | 8.00 | | |
| Less Distributions to Shareholders: | |
| From net investment income | | | — | | | | — | | | | (0.08 | ) | | | — | | | | — | | | | — | | |
| From net realized gains | | | (3.73 | ) | | | (1.96 | ) | | | (1.15 | ) | | | — | | | | — | | | | — | | |
| Total Distributions to Shareholders | | | (3.73 | ) | | | (1.96 | ) | | | (1.23 | ) | | | — | | | | — | | | | — | | |
| Net Asset Value, End of Period | | $ | 29.39 | | | $ | 36.26 | | | $ | 36.36 | | | $ | 34.90 | | | $ | 31.37 | | | $ | 26.51 | | |
| Total Return (c) | | | (8.15 | )%(d) | | | 5.39 | % | | | 7.87 | % | | | 11.25 | %(e) | | | 18.33 | % | | | 43.22 | % | |
| Ratios to Average Net Assets/Supplemental Data: | |
| Net expenses before interest expense (f) | | | 0.94 | %(g) | | | 0.95 | % | | | 0.95 | % | | | 0.95 | % | | | 1.00 | % | | | 0.99 | % | |
| Interest expense | | | — | | | | — | | | | 0.00 | %(h) | | | — | | | | — | | | | — | | |
| Net expenses (f) | | | 0.94 | %(g) | | | 0.95 | % | | | 0.95 | % | | | 0.95 | % | | | 1.00 | % | | | 0.99 | % | |
| Net investment income (loss) (f) | | | (0.32 | )%(g) | | | (0.15 | )% | | | (0.07 | )% | | | 0.29 | % | | | (0.49 | )% | | | (0.48 | )% | |
| Waiver | | | — | | | | — | | | | — | | | | 0.00 | %(h) | | | — | | | | — | | |
| Portfolio turnover rate | | | 11 | %(d) | | | 27 | % | | | 19 | % | | | 11 | % | | | 15 | % | | | 10 | % | |
| Net assets, end of period (000's) | | $ | 1,473,712 | | | $ | 1,688,040 | | | $ | 1,608,340 | | | $ | 1,493,695 | | | $ | 1,153,553 | | | $ | 822,658 | | |
(a) Net investment income/(loss) per share was based upon the average shares outstanding during the period.
(b) Net investment income per share reflects special dividends. The effect of these dividends amounted to $0.08 per share.
(c) Total return at net asset value assuming all distributions are reinvested.
(d) Not annualized.
(e) Had the investment advisor not waived a portion of expenses, total return would have been reduced.
(f) The benefits derived from custody fees paid indirectly had an impact of less than 0.01%.
(g) Annualized.
(h) Rounds to less than 0.01%.
See accompanying notes to financial statements.
16
Wanger USA 2008 Semiannual Report
Notes to Financial Statements (Unaudited)
1. Nature of Operations
Wanger USA (the "Fund"), is a series of Wanger Advisors Trust (the "Trust"), an open-end management investment company organized as a Massachusetts business trust. The investment objective of the Fund is to seek long-term capital appreciation. The Fund is available only for allocation to certain life insurance company separate accounts established for the purpose of funding qualified and non-qualified variable annuity contracts and variable life insurance policies and may also be offered directly to certain types of pension plans and retirement arrangements.
Effective June 1, 2008, Wanger U.S. Smaller Companies was renamed Wanger USA.
2. Significant Accounting Policies
Security valuation
Securities of the Fund are valued at market value or, if a market quotation for a security is not readily available or is deemed not to be reliable because of events or circumstances that have occurred between the market quotation and the time as of which the security is to be valued, the security is valued at a fair value determined in accordance with procedures established by the Board of Trustees. A security traded on a securities exchange or in an over-the-counter market in which transaction prices are reported is valued at the last sales price at the time of valuation. A security traded principally on NASDAQ is valued at the NASDAQ official closing price. A security for which there is no reported sale on the valuation date is valued at the latest bid quotation. A short-term debt obligation having a maturity of 60 days or less from the valuation date is valued at amortized cost, which approximates fair value. A security for which a market quotation is not readily available and any other assets are valued in accordance with procedures established by the Board of Trustees. The Trust has retained an independent statistical fair value pricing service to assist in the fair valuation process for securities principally traded in a foreign market in order to adjust for possible changes in value that may occur between the close of the foreign market and the time as of which the securities are to be valued. If a security is valued at fair value, that value may be different from the last quoted market price for the security.
On January 1, 2008, the Fund adopted Statement of Financial Accounting Standards No. 157, Fair Value Measurements ("SFAS 157"). Under SFAS 157, various inputs are used in determining the value of the fund's investments. These inputs are summarized in the three broad levels listed below:
• Level 1—quoted prices in active markets for identical securities
• Level 2—other significant observable inputs (including quoted prices for similar securities, interest rates, prepayment speeds, credit risk, and others)
• Level 3—significant unobservable inputs (including the Fund's own assumptions in determining the value of investments)
The inputs or methodology used for valuing securities are not necessarily an indication of the risk associated with investing in those securities.
The following table summarizes the inputs used, as of June 30, 2008 in valuing the Fund's assets:
| Valuation Inputs | | Investments in
Securities | | Other Financial
Instruments | |
| Level 1—Quoted Prices | | $ | 1,457,041,161 | | | $ | — | | |
| Level 2—Other Significant Observable Inputs | | | 15,549,350 | | | | — | | |
| Level 3—Significant Unobservable Inputs | | | 37,886 | | | | — | | |
| Total | | $ | 1,472,628,397 | | | $ | — | | |
The Fund's assets assigned to the Level 2 input category include certain foreign securities for which a third party pricing service may be employed for purposes of fair market valuation.
The following table reconciles asset balances for the six month period ending June 30, 2008 in which significant unobservable inputs (Level 3) were used in determining value:
| | | Investments in
Securities | | Other Financial
Instruments | |
| Balance as of December 31, 2007 | | $ | 98,504 | | | $ | — | | |
Accretion of discounts/
amortization of premiums | | | — | | | | — | | |
| Realized gain (loss) | | | — | | | | — | | |
Change in unrealized appreciation
(depreciation) | | | (60,618 | ) | | | — | | |
| Net purchases (sales) | | | — | | | | — | | |
| Transfers in and or out of Level 3 | | | — | | | | — | | |
| Balance as of June 30, 2008 | | $ | 37,886 | | | $ | — | | |
Repurchase agreements
The Fund may engage in repurchase agreement transactions. The Fund, through its custodians, receives delivery of underlying securities collateralizing each repurchase agreement. The Fund's custodian determines that the value of the underlying securities is at all times at least equal to the resale price. In the event of default or bankruptcy by the other party to the agreement, realization and/or retention of the collateral may be subject to legal proceedings.
Foreign currency translations
Values of investments denominated in foreign currencies are converted into U.S. dollars using the spot market rate of exchange at the time of valuation. Purchases and sales of investments and dividend and interest income are translated into U.S. dollars using the spot market rate of exchange prevailing on the respective dates of such transactions. The gain or loss resulting from changes in foreign exchange rates is included with net realized and unrealized gain or loss from investments, as appropriate.
Security transactions and investment income
Security transactions are accounted for on the trade date (date the order to buy or sell is executed) and dividend income is recorded on the ex-dividend date, except that certain dividends from foreign securities are recorded as soon as the information is available to the Fund. Interest income is recorded on the accrual basis and includes amortization of discounts on debt obligations when required for federal income tax purposes. Realized gains and losses from security transactions are recorded on an identified cost basis.
Awards, if any, from class action litigation related to securities owned may be recorded as a reduction of cost of those securities. If the applicable securities are no longer owned, the proceeds are recorded as realized gains.
The Fund estimates the tax character of distributions from real estate investment trusts ("REITS"). Distributions received in excess of income are recorded as a reduction of the cost of the related investments. If the applicable securities are no longer owned, any distributions received in excess of income are recorded as realized gains.
In March 2008, Statement of Financial Accounting Standards No. 161 ("SFAS 161"), Disclosures about Derivative Instruments and Hedging Activities—an amendment of FASB Statement No. 133, was issued. SFAS 161 is effective for fiscal years beginning after November 15, 2008. SFAS 161 requires additional discussion about the reporting entity's derivative instruments and hedging activities, by providing for qualitative disclosures about the objectives and strategies for using derivatives, quantitative data about the fair value of and gains and losses on derivative contracts, and details of credit-risk-related contingent features in their hedged positions. Management is evaluating the impact the application of SFAS 161 will have on the Fund's financial statement disclosures.
17
Wanger USA 2008 Semiannual Report
Notes to Financial Statements, continued (Unaudited)
Restricted securities
Restricted securities are securities that may only be resold upon registration under federal securities laws or in transactions exempt from registration. In some cases, the issuer of restricted securities has agreed to register such securities for resale at the issuer's expense either upon demand by the Fund or in connection with another registered offering of the securities. Many restricted securities may be resold in the secondary market in transactions exempt from registration. Such restricted securities may be determined to be liquid under criteria established by the Board of Trustees. The Fund will not incur any registration costs upon such resale.
Use of estimates
The preparation of financial statements in conformity with accounting principles generally accepted in the United States of America ("GAAP") requires management to make estimates and assumptions that affect the amounts reported in the financial statements and accompanying notes. Actual results may differ from those estimates.
Fund share valuation
Fund shares are sold and redeemed on a continuing basis at net asset value. Net asset value per share is determined daily as of the close of trading on the New York Stock Exchange ("the Exchange") on each day the Exchange is open for trading by dividing the total value of the Fund's investments and other assets, less liabilities, by the number of Fund shares outstanding.
Custody fees/Credits
Custody fees are reduced based on the Fund's cash balances maintained with the custodian. The amount is disclosed as a reduction of total expenses in the Statement of Operations.
Federal income taxes
The Fund has complied with the provisions of the Internal Revenue Code available to regulated investment companies and, in the manner provided therein, distributes all its taxable income, as well as any net realized gain on sales of investments and foreign currency transactions reportable for federal income tax purposes. Accordingly, the Fund paid no federal income taxes and no federal income tax provision was required.
Expenses
General expenses of the Trust are allocated to the Fund and the other series of the Trust based upon relative net assets or other expense allocation methodologies determined by the nature of the expense. Expenses directly attributable to the Fund are charged to the Fund.
Foreign capital gains taxes
Gains in certain countries may be subject to foreign taxes at the fund level, at rates ranging from 10%-15%. The Fund accrues for such foreign taxes on net realized and unrealized gains at the appropriate rate for each jurisdiction.
Distributions to shareholders
Distributions to shareholders are recorded on the ex-date.
Indemnification
In the normal course of business, the Fund enters into contracts that contain a variety of representations and warranties which provide general indemnities. The Fund's maximum exposure under these arrangements is unknown, as this would involve future claims against the Fund. Also under the Trust's organizational documents, the Trustees and Officers of the Trust are indemnified against certain liabilities that may arise out of their duties to the Trust. However based on experience, the Fund expects the risk of loss due to these warranties and indemnities to be minimal.
3. Federal Tax Information
The tax character of distributions paid during the year ended December 31, 2007 was as follows:
| Distributions paid from: | |
| Ordinary Income* | | $ | 1,760,549 | | |
| Long-Term Capital Gains | | | 83,495,503 | | |
* For tax purposes short-term capital gains distributions, if any, are considered ordinary income distributions.
Under Financial Accounting Standards Board ("FASB") Interpretation No. 48, Accounting for Uncertainty in Income Taxes—an Interpretation of FASB Statement No. 109 ("FIN 48") management determines whether a tax position of the Fund is more likely than not to be sustained upon examination by the applicable taxing authority, including resolution of any related appeals or litigation processes, based on the technical merits of the position. The tax benefit to be recognized is measured as the largest amount of benefit that is greater than fifty percent likely of being realized upon ultimate settlement. Management has evaluated the known implications of FIN 48 on its computation of net assets for the Fund. As a result of this evaluation, management believes that FIN 48 does not have any effect on the Fund's financial statements. However, management's conclusions regarding FIN 48 may be subject to review and adjustment at a later date based on factors including, but not limited to, further implementation guidance from the FASB, new tax laws, regulations, and administrative interpretations (including relevant court decisions). The Fund's federal tax returns for the prior three fiscal years remain subject to examination by the Internal Revenue Service. The Fund is not aware of any tax positions for which it is reasonably possible that the total amounts of unrecognized tax benefits will significantly change in the next twelve months.
4. Transactions With Affiliates
Columbia Wanger Asset Management, L.P., ("CWAM") is a wholly owned subsidiary of Columbia Management Group, LLC ("Columbia Management"), which in turn is an indirect wholly owned subsidiary of Bank of America Corporation ("BOA"). CWAM furnishes continuing investment supervision to the Fund and is responsible for the overall management of the Fund's business affairs.
Under the Fund's investment advisory agreement, management fees are accrued daily based on the Fund's average daily net assets and paid monthly to CWAM at the annual rates shown in the table below:
| Average Daily Net Assets | | Annual Fee Rate | |
| Up to $100 million | | | 0.94 | % | |
| $100 million to $250 million | | | 0.89 | % | |
| $250 million to $2 billion | | | 0.84 | % | |
| $2 billion and over | | | 0.80 | % | |
For the six months ended June 30, 2008, the Fund's annualized effective investment advisory fee rate was 0.85% of average daily net assets.
CWAM provides administrative services and receives an administration fee from the Fund. Effective August 1, 2008, CWAM will provide administrative services and receive an administration fee from the Fund at the following annual rates:
Wanger Advisors Trust
Aggregate Average Daily
Net Assets of the Trust: | | Annual Fee Rate | |
| Up to $4 billion | | | 0.050 | % | |
| $4 billion to $6 billion | | | 0.040 | % | |
| $6 billion to $8 billion | | | 0.030 | % | |
| $8 billion and over | | | 0.020 | % | |
Prior to August 1, 2008, fees were accrued daily and paid monthly to CWAM at the annual rate of 0.05%. For the six months ended June 30, 2008, the Fund's annualized effective administration fee rate was 0.05% of average daily net assets.
18
Wanger USA 2008 Semiannual Report
Notes to Financial Statements, continued (Unaudited)
CWAM has delegated to Columbia Management the responsibility for certain administrative services.
Certain officers and trustees of the Trust are also officers of CWAM. The Trust makes no direct payments to its officers and trustees who are affiliated with CWAM.
The Board of Trustees appointed a Chief Compliance Officer to the Fund in accordance with federal securities regulations. The Fund, along with other affiliated funds, pays its pro-rata share of the expenses associated with the Office of the Chief Compliance Officer. These expenses are disclosed separately as "Chief compliance officer expenses" in the Statement of Operations.
The Trust offers a deferred compensation plan for its independent trustees. Under that plan, a trustee may elect to defer all or a portion of his or her compensation. Amounts deferred are retained by the Trust and represent an unfunded obligation of the Trust. The value of amounts deferred is determined by reference to the change in value of Class Z shares of one or more series of Columbia Acorn Trust or a money market fund as specified by the trustee. Benefits under the deferred compensation plan are payable when the trustee ceases to be a member of the Board of Trustees.
Columbia Management Distributors, Inc. (the "Distributor"), a wholly owned subsidiary of BOA, serves as the principal underwriter of the Trust and receives no compensation from the Fund for its services.
Columbia Management Services, Inc. (the "Transfer Agent"), a wholly owned subsidiary of BOA, provides shareholder services to the Fund and has subcontracted with Boston Financial Data Services ("BFDS") to serve as subtransfer agent. For such services, the Transfer Agent receives a fee, paid monthly, at the annual rate of $21.00 per open account. The Transfer Agent also receives reimbursement for certain out-of-pocket expenses.
An affiliate may include any company in which a fund owns five percent or more of its outstanding voting shares. On June 30, 2008, the Fund held five percent or more of the outstanding voting securities of one or more companies. Details of investments in those affiliated companies is presented on page 12.
During the six months ended June 30, 2008, the Fund engaged in purchase and sales transactions with funds that have a common investment advisor (or affiliated investment advisors), common directors/trustees, and/or common officers. Those purchase and sale transactions complied with provisions of Rule 17a-7 under the Investment Company Act of 1940 and were $0 and $704,000, respectively.
5. Borrowing Arrangements
The Trust participates in a $150 million credit facility, which was entered into to facilitate portfolio liquidity. Interest is charged to each participating fund based on its borrowings at a rate per annum equal to the Federal Funds rate plus 0.50%. In addition, a commitment fee of 0.08% per annum of the unutilized line of credit is accrued and apportioned among the participating funds based on their relative net assets. The commitment fee is included in "Other expenses" in the Statement of Operations. No amounts were borrowed by the Fund under this facility during the six months ended June 30, 2008.
6. Fund Share Transactions
Proceeds and payments on Fund shares as shown in the Statement of Changes in Net Assets are in respect of the following numbers of shares:
| | | Six months ended
June 30, 2008 | | Year ended
December 31, 2007 | |
| Shares sold | | | 1,176,040 | | | | 5,698,486 | | |
Shares issued in reinvestment
of dividend distributions | | | 6,081,253 | | | | 2,466,900 | | |
| Less shares redeemed | | | (3,668,061 | ) | | | (5,844,748 | ) | |
| Net increase in shares outstanding | | | 3,589,232 | | | | 2,320,638 | | |
7. Investment Transactions
The aggregate cost of purchases and proceeds from sales other than short-term obligations for the six months ended June 30, 2008 were $170,901,761 and $232,640,183, respectively.
8. Legal Proceedings
CWAM, Columbia Acorn Trust, (another mutual fund family advised by CWAM), and the trustees of Colombia Acorn Trust (collectively, the "Columbia defendants") are named as defendants in class and derivative complaints that have been consolidated in a Multi-District Action (the "MDL Action") in the federal district court of Maryland. These lawsuits contend that defendants permitted certain investors to market time their trades in certain Columbia Acorn Funds. The MDL Action is ongoing. However, all claims against Columbia Acorn Trust and the independent trustees of Columbia Acorn Trust have been dismissed.
Columbia Acorn Trust and CWAM are also defendants in a class action lawsuit that alleges, in summary, that Columbia Acorn Trust and CWAM exposed shareholders of Columbia Acorn International Fund to trading by market timers by allegedly: (a) failing to properly evaluate daily whether a significant event affecting the value of the fund's securities had occurred after foreign markets had closed but before the calculation of the funds' net asset value (NAV"); (b) failing to implement the fund's portfolio valuation and share pricing policies and procedures; and (c) failing to know and implement applicable rules and regulations concerning the calculation of NAV (the "Fair Valuation Lawsuit"). The Seventh Circuit ruled that the plaintiffs' state law claims were preempted under federal law resulting in the dismissal of plaintiffs' complaint. Plaintiffs appealed the Seventh Circuit's ruling to the United States Supreme Court. The Supreme Court reversed the Seventh Circuit's ruling on jurisdictional grounds and the case was ultimately remanded to the state court.
On March 21, 2005, a class action complaint was filed against the Columbia Acorn Trust and CWAM seeking to rescind the CDSC assessed upon redemption of Class B shares of Columbia Acorn Funds due to the alleged market timing of the Columbia Acorn Funds (the "CDSC Lawsuit"). In addition to the rescission of sales charges, plaintiffs seek recovery of actual damages, attorneys' fees and costs. The case has been transferred to the MDL Action in the federal district court of Maryland.
On September 14, 2007, the plaintiffs and the Columbia defendants named in the MDL Action, including the Columbia Funds, entered into a stipulation of settlement with respect to all Columbia-related claims in the MDL Action described above, including the CDSC and Fair Valuation Lawsuits. The settlement is subject to court approval.
CWAM, the Columbia Acorn Funds and the Trustees of the Trust are also defendants in a consolidated lawsuit filed in the federal district court of Massachusetts alleging that CWAM used Fund assets to make undisclosed payments to brokers as an incentive for the brokers to market the Funds over other mutual funds to investors. The complaint alleges CWAM and the Trustees of the Columbia Acorn Trust, along with certain affiliated entities and individuals, breached certain common law duties and federal laws.
On November 30, 2005, the judge dismissed all claims by plaintiffs and entered final judgment in favor of the defendants. The plaintiffs appealed to the United States Court of Appeals for the First Circuit on December 30, 2005. A stipulation and settlement agreement dated January 19, 2007 was filed in the First Circuit on February 14, 2007, with a joint stipulation of dismissal and motion for remand to obtain district court approval of the settlement. That joint motion was granted and the appeal was dismissed. On March 6, 2007, the case was remanded to the federal district court. The settlement, approved by the federal district court on September 18, 2007, became effective October 19, 2007. Pursuant to the settlement, the funds' advisor and/or its affiliates made certain payments, including plaintiffs' attorneys' fees and costs of notice to class members.
The Trust and CWAM intend to defend these suits vigorously.
As a result of these matters, or any adverse publicity or other developments resulting from them, there may be increased redemptions or reduced sales of Columbia Acorn fund shares, which could increase transaction costs or operating expenses, or have other adverse consequences for the Columbia Acorn funds. However, based on currently available information, the Columbia Acorn Trust believes that the likelihood that these lawsuits will have a material adverse impact on any fund is remote, and CWAM believes that the lawsuits are not likely to materially affect its ability to provide investment management services to the funds.
19
Wanger USA 2008 Semiannual Report
Excerpt from:
Wanger Advisors Trust
Management Fee Evaluation of the Senior Officer
Prepared Pursuant to the New York Attorney General's
Assurance of Discontinuance
May 2008
20
Wanger USA 2008 Semiannual Report
Introduction
The New York Attorney General's Assurance of Discontinuance ("Order") entered into by Columbia Management Advisors, Inc. ("CMAI") and Columbia Management Distributors, Inc., ("CMDI" and collectively with "CMAI," "CMG") in February 2005, allows CMAI to manage or advise a mutual fund only if the trustees of the fund appoint a "Senior Officer" to perform specified duties and responsibilities. One of these responsibilities includes "managing the process by which proposed management fees (including but not limited to, advisory fees) to be charged the [Funds] are negotiated so that they are negotiated in a manner which is at arms' length and reasonable and consistent with this Assurance of Discontinuance."
This is the second year that the Columbia Acorn Trust and Wanger Advisors Trust (collectively, the "Trusts") and each series thereof (the "Acorn funds," "WAT funds" or collectively, the "Funds") have been overseen by the same Board of Trustees ("Board"). The Order provides that this Board must determine the reasonableness of proposed "management fees" by using either an annual competitive bidding process supervised by the Senior Officer or Independent Fee Consultant, or by obtaining "an annual independent written evaluation prepared by or under the direction of the Senior Officer or the Independent Fee Consultant."
"Management fees" are only part of the costs and expenses paid by mutual fund shareholders. Fund expenses can vary depending upon the class of shares held but usually include: (1) investment management or advisory fees to compensate analysts and portfolio managers for stock research and portfolio management, as well as the cost of operating a trading desk; (2) administrative expenses incurred to prepare registration statements and tax returns, calculate the Funds' net asset values, maintain effective compliance procedures and perform recordkeeping services; (3) transfer agency costs for establishing accounts, accepting and disbursing funds, as well as overseeing trading in Fund shares; (4) custodial expenses incurred to hold the securities purchased by the Funds; and (5) distribution expenses, including commissions paid to brokers that sell the Fund shares to investors.
Columbia Wanger Asset Management, L.P. ("CWAM"), the advisor to the Funds, has proposed that the Trusts continue the existing separate agreements governing the first two categories listed above: an advisory agreement governing portfolio management, and an administration agreement governing certain administration and clerical services. Together the fees paid under these two agreements are referred to as "management fees." Other fund expenses are governed by separate agreements, in particular agreements with two CWAM affiliates: CMDI, the broker-dealer that underwrites and distributes the Funds' shares, and Columbia Management Services, Inc. ("CMSI"), the Funds' transfer agent. In conformity with the terms of the Order, this evaluation, therefore, addresses only the advisory and administrative contracts, and does not extend to the other agreements.
According to the Order, the Senior Officer's evaluation must consider at least the following:
(1) Management fees (including components thereof) charged to institutional and other clients of CWAM for like services;
(2) Management fees (including any components thereof) charged by other mutual fund companies for like services;
(3) Costs to CWAM and its affiliates of supplying services pursuant to the management fee agreements, excluding any intra-corporate profit;
(4) Profit margins of CWAM and its affiliates from supplying such services;
(5) Possible economies of scale as the Funds grow larger; and
(6) The nature and quality of CWAM's services, including the performance of each Fund.
In 2004, the Boards of the two Trusts, then separate groups, each appointed me Senior Officer under the Order. They also determined not to pursue a competitive bidding process and instead, charged me with the responsibility of evaluating the Funds' proposed advisory and administrative fee contracts with CWAM in conformity with the requirements of the Order. This Report is an annual evaluation required under the Order. In discharging their responsibilities, the independent Trustees have also consulted independent, outside counsel.
2007 Evaluation
This is the third annual evaluation prepared in connection with the Order. This evaluation follows the same structure as the earlier studies. Some areas are given more emphasis here, while others are given less. Still, the fundamental information gathered for this evaluation is largely the same as past years. Last year's evaluation is referred to here as the "2007 Study."
Process and Independence
The objectives of the Order are to insure the independent evaluation of the management fees paid by the Funds as well as to insure that all relevant factors are considered. In my view, this contract renewal process has been conducted at arms-length and with independence in gathering, considering and evaluating all relevant data. At the outset of the process, the Trustees sought and obtained from CWAM and CMG a comprehensive compilation of data regarding Fund performance and expenses, advisor profitability, and other information. The Board evaluated this information thoroughly. Performance and expense data was obtained from both Morningstar and Lipper, the leading consultants in this area. The rankings prepared by Morningstar and Lipper were independent and not influenced by the advisor.
In the course of its work, the Contract Committee gave careful consideration to the conclusions and recommendations contained in the 2007 Study. The Contract Committee gave particular emphasis to the issue of whether economies of scale were appropriately reflected in the Funds' fee schedules. The Board accepted and implemented several of the recommendations in this area contained in the 2007 Study.
21
Wanger USA 2008 Semiannual Report
My evaluation of the advisory contract was shaped, as it was last year, by my experience as Chief Compliance Officer of the Trusts ("CCO"). As CCO, I report solely to the Board and have no reporting obligation to, or employment relationship with, CMG or its affiliates, except for administrative purposes. I have commented on compliance matters in evaluating the quality of service provided by CWAM.
This Report, its supporting materials and the data contained in other materials submitted to the Contract Committee of the Board, in my view, provide a thorough factual basis upon which the Board, in consultation with independent counsel as it deems appropriate, may conduct management fee negotiations that are in the best interests of the Funds' shareholders.
The Fee Reductions Mandated under the Order
Under the terms of the Order, CMG agreed to secure certain management fee reductions for the mutual funds advised by its affiliate investment advisors. In some instances, breakpoints were also established. Although neither CWAM nor the Trusts was a party to the Order, CWAM offered and the Board accepted certain advisory fee reductions during 2005. By the terms of the Order, these fees may not be increased before November 30, 2009. I have used these advisory fee levels, as modified thereafter, in this evaluation because they are the fees in the current agreements that CWAM proposes should be continued. Hence, these fee levels are the starting point of an evaluation.
Conclusions
My review of the data and other material above leads to the following conclusions with respect to the factors identified in the Order.
1. Performance. The domestic WAT Funds generally have achieved good to outstanding performance over the past five years. Wanger Select has, however, suffered a precipitous decline in ranking relative to its peers for the past year, and this trend merits the Trustees' continued attention. The international WAT Funds have relatively weaker relative long term records than do the domestic funds. All the WAT Funds, however, outperform their benchmarks, expose shareholders to less risk than competitors and achieve positive "alpha," a recognized measure of the added value of an investment manager.
2. Management Fees relative to Peers. Management fees vary by WAT Fund, but, in general, the WAT Funds impose higher fees than competing funds. Wanger Select and Wanger USA in particular were ranked by both Lipper and Morningstar at or below the median, and therefore impose higher fees than do the majority of their competitors.
3. Administrative Fees. The WAT Funds' administrative fees appear competitive in relation to their peers, and CWAM provides excellent administrative support for all the WAT Funds. There are clear advantages to retaining the advisor and its affiliates to perform these services. However, while economies of scale exist above current asset levels, the WAT Funds' administrative fee schedule provides no breakpoints.
4. Management Fees relative to Institutional and Other Mutual Fund Accounts. CWAM's focus is on its mutual funds. It does not actively seek to manage separate or institutional accounts. The few institutional accounts it does manage vary in rate structures. Some pay advisory fees commensurate with or higher than the WAT Funds. In a few instances, however, institutional accounts pay lower advisory fees than do the WAT Funds. One particular institutional account is significant in size and has been under CWAM's management for over 25 years.
5. Costs to CWAM and its Affiliates. CWAM's direct costs do not appear excessive. Overhead and indirect costs allocated to CWAM by its parent organizations, however, are significant and have increased dramatically in the past year. CWAM's affiliates report operating losses and therefore do not appear to enjoy excessive "fall out" benefits from CWAM's advisory agreement with the WAT Funds.
6. Profit Margins. CWAM's pre-marketing expense profit margins are at the top of the industry, though these comparisons are hampered by limited industry data. High profit margins are not unexpected for firms that manage large, successful funds and have provided outstanding investment performance for investors.
7. Economies of Scale. Economies of scale do exist at CWAM and will expand as the assets of the WAT Funds get larger. The Board has recently imposed additional breakpoints for some of the WAT Funds that will result in greater sharing of economies of scale.
8. Nature and Quality of Services. This category includes a variety of considerations that are difficult to quantify, yet can have a significant bearing on the performance of the Funds. Several areas merit comment.
a. Capacity. The WAT Funds have continued to grow, posing ever greater challenges in deploying assets effectively. While trends here merit continued monitoring, CWAM appears to be managing assets effectively.
b. Compliance. CWAM has a reasonably designed compliance program that protects shareholders.
9. Process. In my opinion, the process of negotiating an advisory contract for the WAT Funds has been conducted thoroughly and at arms' length. Further, the Trustees have sufficient information to evaluate management's proposal, and negotiate contract terms that are in the best interests of Fund shareholders.
22
Wanger USA 2008 Semiannual Report
Recommendations
I believe the Trustees should:
1. Consider the addition of breakpoints to the WAT administrative fee contract to reflect the economies of scale present in performing these services, and, in fashioning those breakpoints, to consider the efficiencies achieved by CWAM by supporting both Trusts with the same staff performing largely identical tasks.
2. Focus their review on the WAT Funds' management fee levels in relation to their peers, in particular the fees paid by Wanger USA and Wanger Select.
3. Monitor Wanger Select to ensure that its long term performance is sustained.
Robert P. Scales
May 27, 2008
23
Wanger USA 2008 Semiannual Report

Columbia Wanger Funds
Trustees
Robert E. Nason
Chairman of the Board
Allan B. Muchin
Vice Chairman of the Board
Laura M. Born
Michelle L. Collins
Maureen M. Culhane
Margaret M. Eisen
Jerome Kahn, Jr.
Steven N. Kaplan
David C. Kleinman
Charles P. McQuaid
James A. Star
Ralph Wanger
John A. Wing
Officers
Charles P. McQuaid
President
Ben Andrews
Vice President
Michael G. Clarke
Assistant Treasurer
Jeffrey R. Coleman
Assistant Treasurer
J. Kevin Connaughton
Assistant Treasurer
P. Zachary Egan
Vice President
Peter T. Fariel
Assistant Secretary
John M. Kunka
Assistant Treasurer
Joseph C. LaPalm
Vice President
Bruce H. Lauer
Vice President, Secretary and Treasurer
Louis J. Mendes III
Vice President
Robert A. Mohn
Vice President
Christopher J. Olson
Vice President
Robert P. Scales
Chief Compliance Officer, Chief Legal Officer, Senior Vice President and General Counsel
Linda K. Roth-Wiszowaty
Assistant Secretary
Transfer Agent,
Dividend Disbursing Agent
Columbia Management Services, Inc.
P.O. Box 8081
Boston, Massachusetts
02266-8081
Distributor
Columbia Management Distributors, Inc.
One Financial Center
Boston, Massachusetts
02111-2621
Investment Advisor
Columbia Wanger Asset Management, L.P.
227 West Monroe Street, Suite 3000
Chicago, Illinois 60606
1-888-4-WANGER
(1-888-492-6437)
Legal Counsel
Bell, Boyd & Lloyd LLP
Chicago, Illinois
Independent Registered Public Accounting Firm
PricewaterhouseCoopers LLP
Chicago, Illinois
This report, including the schedules of investments and financial statements, is submitted for the general information of the shareholders of the Wanger Advisors Trust.
A description of the Fund's proxy voting policies and procedures and a copy of the Fund's voting record for the most recent 12-month period ended June 30 are available (i) on the Securities and Exchange Commission's website at www.sec.gov, and (ii) without charge, upon request, by calling 888-492-6437.
The Fund files a complete schedule of portfolio holdings with the SEC for the first and third quarters of each fiscal year on Form N-Q. The Fund's Form N-Q is available on the SEC's website at www.sec.gov and may be reviewed and copied at the SEC's Public Reference Room in Washington, D.C. Information on the operation of the Pubic Reference Room may be obtained by calling 800-SEC-0330.
24
Columbia Wanger Funds
0L2568S
SHC-44/154734-0608 08/55099
Item 2. Code of Ethics.
Not applicable for semi-annual reports.
Item 3. Audit Committee Financial Expert.
Not applicable for semi-annual reports.
Item 4. Principal Accountant Fees and Services.
Not applicable for semi-annual reports.
Item 5. Audit Committee of Listed Registrants.
Not applicable.
Item 6. Schedule of Investments
(a) The registrant’s “Schedule I – Investments in securities of unaffiliated issuers” (as set forth in 17 CFR 210.12-12) is included in Item 1 of this Form N-CSR.
(b) Not applicable.
Item 7. Disclosure of Proxy Voting Policies and Procedures for Closed-End Management Investment Companies.
Not applicable.
Item 8. Portfolio Managers of Closed-End Management Investment Companies.
Not applicable.
Item 9. Purchases of Equity Securities by Closed-End Management Investment Company and Affiliated Purchasers.
Not applicable.
Item 10. Submission of Matters to a Vote of Security Holders.
There have not been any material changes to the procedures by which shareholders may recommend nominees to the registrant’s board of directors, since those procedures were last disclosed in response to requirements of Item 7(d)(2)(ii)(G) of Schedule 14A or this Item.
Item 11. Controls and Procedures.
(a) The registrant’s principal executive officer and principal financial officers, based on their evaluation of the registrant’s disclosure controls and procedures as of a date within 90 days of the filing of this report, have concluded that such controls and procedures are adequately designed to ensure that information required to be disclosed by the registrant in Form N-CSR is accumulated and communicated to the registrant’s management, including the principal executive officer and principal financial officer, or persons performing similar functions, as appropriate to allow timely decisions regarding required disclosure.
(b) There was no change in the registrant’s internal control over financial reporting that occurred during the registrant’s second fiscal quarter of the period covered by this report that has materially affected, or is reasonably likely to materially affect, the registrant’s internal control over financial reporting.
Item 12. Exhibits.
(a)(1) Code of ethics required to be disclosed under Item 2 of Form N-CSR: Not applicable at this time.
(a)(2) Certifications pursuant to Rule 30a-2(a) under the Investment Company Act of 1940 (17 CFR 270.30a-2(a)) attached hereto as Exhibit 99.CERT.
(a)(3) Not applicable.
(b) Certification pursuant to Rule 30a-2(b) under the Investment Company Act of 1940 (17 CFR 270.30a-2(b)) attached hereto as Exhibit 99.906CERT.
SIGNATURES
Pursuant to the requirements of the Securities Exchange Act of 1934 and the Investment Company Act of 1940, the registrant has duly caused this report to be signed on its behalf by the undersigned, thereunto duly authorized.
(registrant) | Wanger Advisors Trust | |
| |
| |
By (Signature and Title) | /s/ Charles P. Mc Quaid | |
| Charles P. McQuaid, President | |
| |
| |
Date | August 22, 2008 | |
| | | | |
Pursuant to the requirements of the Securities Exchange Act of 1934 and the Investment Company Act of 1940, this report has been signed below by the following persons on behalf of the registrant and in the capacities and on the dates indicated.
By (Signature and Title) | /s/ Charles P. Mc Quaid | |
| Charles P. McQuaid, President | |
| |
| |
Date | August 22, 2008 | |
| |
| |
By (Signature and Title) | /s/ Bruce H. Lauer | |
| Bruce H. Lauer, Treasurer | |
| |
| |
Date | August 22, 2008 | |
| | | |