UNITED STATES
SECURITIES AND EXCHANGE COMMISSION
FORM N-CSR
CERTIFIED SHAREHOLDER REPORT OF REGISTERED MANAGEMENT INVESTMENT COMPANIES
Investment Company Act file number 811-08748
Wanger Advisors Trust
(Exact name of registrant as specified in charter)
71 S Wacker Dr.
Suite 2500
Chicago, IL 60606, USA
(Address of principal executive offices) (Zip code)
Ryan C. Larrenaga
c/o Columbia Management
Investment Advisers, LLC
225 Franklin Street
Boston, MA 02110
Matthew Litfin
Wanger Advisors Trust
71 S Wacker Dr.
Suite 2500
Chicago, IL 60606, USA
Mary C. Moynihan
Perkins Coie LLP
700 13th Street, NW
Suite 800
Washington, DC 20005
(Name and address of agent for service)
Registrant's telephone number, including area code: (312) 634-9200
Date of fiscal year end: December 31
Date of reporting period: December 31, 2020
Form N-CSR is to be used by management investment companies to file reports with the Commission not later than 10 days after the transmission to stockholders of any report that is required to be transmitted to stockholders under Rule 30e-1 under the Investment Company Act of 1940 (17 CFR 270.30e-1). The Commission may use the information provided on Form N-CSR in its regulatory, disclosure review, inspection, and policymaking roles.
A registrant is required to disclose the information specified by Form N-CSR, and the Commission will make this information public. A registrant is not required to respond to the collection of information contained in Form N-CSR unless the Form displays a currently valid Office of Management and Budget ("OMB") control number. Please direct comments concerning the accuracy of the information collection burden estimate and any suggestions for reducing the burden to Secretary, Securities and Exchange Commission, 100 F Street, NE, Washington, DC 20549. The OMB has reviewed this collection of information under the clearance requirements of 44 U.S.C. § 3507.
Item 1. Reports to Stockholders.

December 31, 2020

| 3 | |
| 5 | |
| 7 | |
| 8 | |
| 12 | |
| 13 | |
| 14 | |
| 15 | |
| 16 | |
| 27 | |
| 28 | |
| 28 |
| Average annual total returns (%) (for the period ended December 31, 2020) | ||||||
| Inception | 1 Year | 5 Years | 10 Years | Life of Fund | ||
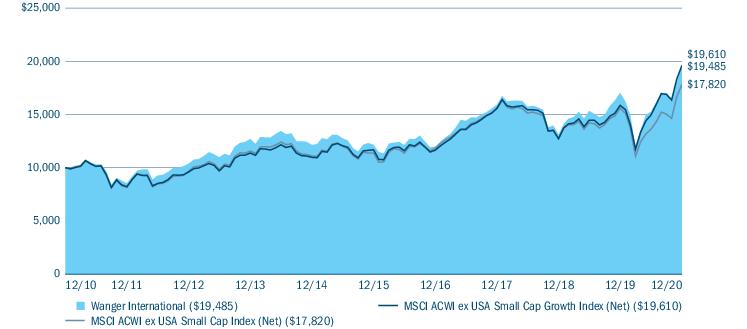
| Wanger International | 05/03/95 | 14.36 | 9.90 | 6.90 | 11.62 | |
| MSCI ACWI ex USA Small Cap Growth Index (Net) | 23.69 | 10.92 | 6.97 | - | ||
| MSCI ACWI ex USA Small Cap Index (Net) | 14.24 | 9.37 | 5.95 | - | ||
| Wanger International | Annual Report 2020 | 3 |
| Equity sector breakdown (%) (at December 31, 2020) | |
| Communication Services | 5.1 |
| Consumer Discretionary | 10.1 |
| Consumer Staples | 2.8 |
| Financials | 8.6 |
| Health Care | 16.2 |
| Industrials | 21.6 |
| Information Technology | 23.2 |
| Materials | 7.5 |
| Real Estate | 4.9 |
| Total | 100.0 |
| Country breakdown (%) (at December 31, 2020) | |
| Australia | 5.0 |
| Austria | 0.8 |
| Brazil | 2.1 |
| Cambodia | 1.0 |
| Canada | 1.9 |
| China | 2.8 |
| Cyprus | 0.8 |
| Denmark | 2.8 |
| France | 0.8 |
| Germany | 6.6 |
| Country breakdown (%) (at December 31, 2020) | |
| Greece | 0.4 |
| Hong Kong | 1.1 |
| Ireland | 1.0 |
| Italy | 3.5 |
| Japan | 19.5 |
| Malta | 1.4 |
| Mexico | 0.5 |
| Netherlands | 3.7 |
| Singapore | 2.3 |
| South Korea | 4.1 |
| Spain | 2.6 |
| Sweden | 10.6 |
| Switzerland | 4.2 |
| Taiwan | 3.6 |
| Thailand | 0.8 |
| United Kingdom | 12.3 |
| United States(a) | 3.8 |
| Total | 100.0 |
| (a) | Includes investments in Money Market Funds. |
| 4 | Wanger International | Annual Report 2020 |
| Wanger International | Annual Report 2020 | 5 |
| 6 | Wanger International | Annual Report 2020 |
(Unaudited)
| July 1, 2020 — December 31, 2020 | |||||||
| Account value at the beginning of the period ($) | Account value at the end of the period ($) | Expenses paid during the period ($) | Fund’s annualized expense ratio (%) | ||||
| Actual | Hypothetical | Actual | Hypothetical | Actual | Hypothetical | Actual | |
| Wanger International | 1,000.00 | 1,000.00 | 1,278.20 | 1,018.90 | 7.10 | 6.29 | 1.24 |
| Wanger International | Annual Report 2020 | 7 |
December 31, 2020
| Common Stocks 98.2% | ||
| Issuer | Shares | Value ($) |
| Australia 5.0% | ||
| Bapcor Ltd. | 1,108,000 | 6,663,104 |
| carsales.com Ltd. | 626,748 | 9,680,751 |
| Technology One Ltd. | 826,512 | 5,231,462 |
| Temple & Webster Group Ltd.(a) | 211,388 | 1,809,725 |
| Total | 23,385,042 | |
| Austria 0.8% | ||
| S&T AG(a) | 150,800 | 3,558,493 |
| Brazil 2.1% | ||
| Notre Dame Intermedica Participacoes SA | 353,000 | 5,324,019 |
| TOTVS SA | 829,400 | 4,585,955 |
| Total | 9,909,974 | |
| Cambodia 1.0% | ||
| NagaCorp Ltd. | 3,588,000 | 4,712,629 |
| Canada 1.9% | ||
| CCL Industries, Inc. | 73,599 | 3,341,414 |
| Osisko Gold Royalties Ltd. | 436,912 | 5,536,484 |
| Total | 8,877,898 | |
| China 2.9% | ||
| A-Living Smart City Services Co., Ltd. | 940,000 | 4,172,233 |
| Silergy Corp. | 107,000 | 9,208,600 |
| Total | 13,380,833 | |
| Cyprus 0.8% | ||
| TCS Group Holding PLC, GDR(b) | 113,103 | 3,721,253 |
| Denmark 2.8% | ||
| ALK-Abello AS(a) | 10,550 | 4,345,607 |
| SimCorp AS | 58,767 | 8,737,260 |
| Total | 13,082,867 | |
| France 0.8% | ||
| Robertet SA | 3,248 | 3,590,967 |
| Germany 6.6% | ||
| Eckert & Ziegler Strahlen- und Medizintechnik AG | 95,586 | 5,236,085 |
| Exasol AG(a) | 69,401 | 2,362,075 |
| Hypoport SE(a) | 14,916 | 9,478,802 |
| Jenoptik AG | 118,000 | 3,604,312 |
| Common Stocks (continued) | ||
| Issuer | Shares | Value ($) |
| Nemetschek SE | 73,800 | 5,484,696 |
| Washtec AG(a) | 85,496 | 4,604,012 |
| Total | 30,769,982 | |
| Greece 0.4% | ||
| JUMBO SA | 114,000 | 1,965,931 |
| Hong Kong 1.1% | ||
| Vitasoy International Holdings Ltd. | 1,322,000 | 5,149,417 |
| Ireland 1.0% | ||
| UDG Healthcare PLC | 436,929 | 4,663,747 |
| Italy 3.5% | ||
| Amplifon SpA(a) | 114,210 | 4,747,274 |
| Carel Industries SpA | 233,487 | 5,470,892 |
| GVS SpA(a) | 330,570 | 6,158,573 |
| Total | 16,376,739 | |
| Japan 19.6% | ||
| Aica Kogyo Co., Ltd. | 34,100 | 1,180,396 |
| Aruhi Corp. | 370,800 | 6,514,737 |
| Avant Corp. | 227,800 | 2,558,605 |
| Azbil Corp. | 44,528 | 2,435,776 |
| Daiseki Co., Ltd. | 240,700 | 7,067,579 |
| Daiwa Securities Living Investments Corp. | 1,082 | 1,004,446 |
| Elecom Co., Ltd. | 94,600 | 4,885,313 |
| Fuso Chemical Co., Ltd. | 162,000 | 5,841,562 |
| Glory Ltd. | 60,000 | 1,211,746 |
| Invesco Office J-REIT, Inc. | 28,894 | 4,240,857 |
| Lasertec Corp. | 51,000 | 5,986,020 |
| Nihon M&A Center, Inc. | 75,400 | 5,042,242 |
| Nihon Unisys Ltd. | 215,000 | 8,427,110 |
| NSD Co., Ltd. | 225,000 | 4,853,941 |
| Seiren Co., Ltd. | 447,900 | 6,782,296 |
| Sekisui Chemical Co., Ltd. | 329,800 | 6,253,445 |
| Seria Co., Ltd. | 86,000 | 3,157,091 |
| Solasto Corp. | 520,600 | 8,069,465 |
| Valqua Ltd. | 310,600 | 6,188,075 |
| Total | 91,700,702 | |
| 8 | Wanger International | Annual Report 2020 |
December 31, 2020
| Common Stocks (continued) | ||
| Issuer | Shares | Value ($) |
| Malta 1.4% | ||
| Kindred Group PLC(a) | 681,141 | 6,664,518 |
| Mexico 0.5% | ||
| Corporación Inmobiliaria Vesta SAB de CV | 1,291,600 | 2,531,340 |
| Netherlands 3.7% | ||
| Argenx SE, ADR(a) | 15,438 | 4,540,161 |
| BE Semiconductor Industries NV | 57,700 | 3,464,963 |
| IMCD NV | 72,505 | 9,228,438 |
| Total | 17,233,562 | |
| Singapore 2.3% | ||
| Mapletree Commercial Trust | 3,317,207 | 5,347,244 |
| Mapletree Logistics Trust | 3,646,085 | 5,549,217 |
| Total | 10,896,461 | |
| South Korea 4.1% | ||
| Koh Young Technology, Inc.(a) | 108,553 | 10,502,755 |
| Korea Investment Holdings Co., Ltd.(a) | 119,096 | 8,678,329 |
| Total | 19,181,084 | |
| Spain 2.6% | ||
| Befesa SA | 96,442 | 6,082,938 |
| Vidrala SA | 51,266 | 5,943,503 |
| Total | 12,026,441 | |
| Sweden 10.6% | ||
| AddTech AB, B Shares | 705,504 | 9,375,791 |
| Dometic Group AB(a) | 366,069 | 4,854,639 |
| Dustin Group AB | 436,170 | 3,408,419 |
| Munters Group AB(a) | 837,317 | 8,446,851 |
| Sectra AB, Class B(a) | 134,693 | 11,925,252 |
| Sweco AB, Class B | 344,298 | 6,318,853 |
| Trelleborg AB, Class B(a) | 248,479 | 5,519,218 |
| Total | 49,849,023 | |
| Switzerland 4.2% | ||
| Belimo Holding AG, Registered Shares | 764 | 6,637,257 |
| Gurit Holding AG | 1,375 | 3,873,469 |
| Inficon Holding AG | 6,623 | 6,066,922 |
| Kardex Energy AG | 13,758 | 3,031,846 |
| Total | 19,609,494 | |
| Common Stocks (continued) | ||
| Issuer | Shares | Value ($) |
| Taiwan 3.7% | ||
| Parade Technologies Ltd. | 109,000 | 4,315,452 |
| Sinbon Electronics Co., Ltd. | 636,000 | 4,902,915 |
| Voltronic Power Technology Corp. | 198,495 | 7,931,375 |
| Total | 17,149,742 | |
| Thailand 0.8% | ||
| Muangthai Capital PCL, Foreign Registered Shares | 1,873,800 | 3,680,074 |
| United Kingdom 12.3% | ||
| Abcam PLC | 232,750 | 4,933,430 |
| Auto Trader Group PLC | 747,150 | 6,081,608 |
| Dechra Pharmaceuticals PLC | 181,970 | 8,570,194 |
| Diploma PLC | 195,940 | 5,858,761 |
| Genus PLC | 102,950 | 5,890,795 |
| Intermediate Capital Group PLC | 311,634 | 7,332,778 |
| Porvair PLC | 490,000 | 3,551,400 |
| Rightmove PLC(a) | 886,448 | 7,875,898 |
| RWS Holdings PLC | 515,000 | 3,772,925 |
| Safestore Holdings PLC | 369,475 | 3,948,966 |
| Total | 57,816,755 | |
| United States 1.7% | ||
| Inter Parfums, Inc. | 131,604 | 7,960,726 |
| Total Common Stocks (Cost $300,458,979) | 459,445,694 | |
| Money Market Funds 2.1% | ||
| Shares | Value ($) | |
| Columbia Short-Term Cash Fund, 0.107%(c),(d) | 9,880,241 | 9,879,253 |
| Total Money Market Funds (Cost $9,878,652) | 9,879,253 | |
| Total Investments in Securities (Cost $310,337,631) | 469,324,947 | |
| Other Assets & Liabilities, Net | (1,513,586) | |
| Net Assets | $467,811,361 | |
| Wanger International | Annual Report 2020 | 9 |
December 31, 2020
| Long futures contracts | ||||||
| Description | Number of contracts | Expiration date | Trading currency | Notional amount | Value/Unrealized appreciation ($) | Value/Unrealized depreciation ($) |
| Mini MSCI Emerging Markets Index | 51 | 03/2021 | USD | 3,284,910 | 103,180 | — |
| (a) | Non-income producing investment. |
| (b) | Represents privately placed and other securities and instruments exempt from Securities and Exchange Commission registration (collectively, private placements), such as Section 4(a)(2) and Rule 144A eligible securities, which are often sold only to qualified institutional buyers. At December 31, 2020, the total value of these securities amounted to $3,721,253, which represents 0.80% of total net assets. |
| (c) | The rate shown is the seven-day current annualized yield at December 31, 2020. |
| (d) | As defined in the Investment Company Act of 1940, an affiliated company is one in which the Fund owns 5% or more of the company’s outstanding voting securities, or a company which is under common ownership or control with the Fund. The value of the holdings and transactions in these affiliated companies during the year ended December 31, 2020 are as follows: |
| Affiliated issuers | Beginning of period($) | Purchases($) | Sales($) | Net change in unrealized appreciation (depreciation)($) | End of period($) | Realized gain (loss)($) | Dividends($) | End of period shares |
| Columbia Short-Term Cash Fund, 0.107% | ||||||||
| 10,893,073 | 127,923,386 | (128,937,807) | 601 | 9,879,253 | (1,989) | 76,635 | 9,880,241 | |
| ADR | American Depositary Receipt |
| GDR | Global Depositary Receipt |
| USD | US Dollar |
| ■ | Level 1 – quoted prices in active markets for identical securities |
| ■ | Level 2 – prices determined using other significant observable inputs (including quoted prices for similar securities, interest rates, prepayment speeds, credit risk and others) |
| ■ | Level 3 – prices determined using significant unobservable inputs where quoted prices or observable inputs are unavailable or less reliable (including management’s own assumptions about the factors market participants would use in pricing an investment) |
| 10 | Wanger International | Annual Report 2020 |
December 31, 2020
The following table is a summary of the inputs used to value the Fund’s investments at December 31, 2020:
| Level 1 ($) | Level 2 ($) | Level 3 ($) | Total ($) | |
| Investments in Securities | ||||
| Common Stocks | ||||
| Australia | — | 23,385,042 | — | 23,385,042 |
| Austria | — | 3,558,493 | — | 3,558,493 |
| Brazil | 9,909,974 | — | — | 9,909,974 |
| Cambodia | — | 4,712,629 | — | 4,712,629 |
| Canada | 8,877,898 | — | — | 8,877,898 |
| China | — | 13,380,833 | — | 13,380,833 |
| Cyprus | — | 3,721,253 | — | 3,721,253 |
| Denmark | — | 13,082,867 | — | 13,082,867 |
| France | — | 3,590,967 | — | 3,590,967 |
| Germany | — | 30,769,982 | — | 30,769,982 |
| Greece | — | 1,965,931 | — | 1,965,931 |
| Hong Kong | — | 5,149,417 | — | 5,149,417 |
| Ireland | — | 4,663,747 | — | 4,663,747 |
| Italy | — | 16,376,739 | — | 16,376,739 |
| Japan | — | 91,700,702 | — | 91,700,702 |
| Malta | — | 6,664,518 | — | 6,664,518 |
| Mexico | 2,531,340 | — | — | 2,531,340 |
| Netherlands | 4,540,161 | 12,693,401 | — | 17,233,562 |
| Singapore | — | 10,896,461 | — | 10,896,461 |
| South Korea | — | 19,181,084 | — | 19,181,084 |
| Spain | — | 12,026,441 | — | 12,026,441 |
| Sweden | — | 49,849,023 | — | 49,849,023 |
| Switzerland | — | 19,609,494 | — | 19,609,494 |
| Taiwan | — | 17,149,742 | — | 17,149,742 |
| Thailand | — | 3,680,074 | — | 3,680,074 |
| United Kingdom | — | 57,816,755 | — | 57,816,755 |
| United States | 7,960,726 | — | — | 7,960,726 |
| Total Common Stocks | 33,820,099 | 425,625,595 | — | 459,445,694 |
| Money Market Funds | 9,879,253 | — | — | 9,879,253 |
| Total Investments in Securities | 43,699,352 | 425,625,595 | — | 469,324,947 |
| Investments in Derivatives | ||||
| Asset | ||||
| Futures Contracts | 103,180 | — | — | 103,180 |
| Total | 43,802,532 | 425,625,595 | — | 469,428,127 |
| Wanger International | Annual Report 2020 | 11 |
December 31, 2020
| Assets | |
| Investments in securities, at value | |
| Unaffiliated issuers (cost $300,458,979) | $459,445,694 |
| Affiliated issuers (cost $9,878,652) | 9,879,253 |
| Margin deposits on: | |
| Futures contracts | 362,520 |
| Receivable for: | |
| Investments sold | 2,542,199 |
| Capital shares sold | 4,747 |
| Dividends | 568,067 |
| Securities lending income | 1,458 |
| Foreign tax reclaims | 527,726 |
| Prepaid expenses | 11,180 |
| Trustees’ deferred compensation plan | 328,240 |
| Total assets | 473,671,084 |
| Liabilities | |
| Due to custodian | 6,120 |
| Payable for: | |
| Investments purchased | 4,932,246 |
| Capital shares purchased | 404,474 |
| Variation margin for futures contracts | 16,963 |
| Investment advisory fee | 12,277 |
| Service fees | 68,855 |
| Administration fees | 640 |
| Trustees’ fees | 612 |
| Compensation of chief compliance officer | 854 |
| Other expenses | 88,442 |
| Trustees’ deferred compensation plan | 328,240 |
| Total liabilities | 5,859,723 |
| Net assets applicable to outstanding capital stock | $467,811,361 |
| Represented by | |
| Paid in capital | 305,872,626 |
| Total distributable earnings (loss) | 161,938,735 |
| Total - representing net assets applicable to outstanding capital stock | $467,811,361 |
| Shares outstanding | 16,687,894 |
| Net asset value per share | 28.03 |
| 12 | Wanger International | Annual Report 2020 |
Year Ended December 31, 2020
| Net investment income | |
| Income: | |
| Dividends — unaffiliated issuers | $6,855,466 |
| Dividends — affiliated issuers | 76,635 |
| Income from securities lending — net | 133,048 |
| Foreign taxes withheld | (513,502) |
| Total income | 6,551,647 |
| Expenses: | |
| Investment advisory fee | 3,989,777 |
| Service fees | 449,340 |
| Administration fees | 206,376 |
| Trustees’ fees | 48,991 |
| Custodian fees | 122,992 |
| Printing and postage fees | 147,623 |
| Audit fees | 62,459 |
| Legal fees | 87,904 |
| Compensation of chief compliance officer | 1,853 |
| Other | 34,839 |
| Total expenses | 5,152,154 |
| Net investment income | 1,399,493 |
| Realized and unrealized gain (loss) — net | |
| Net realized gain (loss) on: | |
| Investments — unaffiliated issuers | 9,491,638 |
| Investments — affiliated issuers | (1,989) |
| Foreign currency translations | (42,522) |
| Futures contracts | 1,789,083 |
| Net realized gain | 11,236,210 |
| Net change in unrealized appreciation (depreciation) on: | |
| Investments — unaffiliated issuers | 43,137,255 |
| Investments — affiliated issuers | 601 |
| Foreign currency translations | 36,718 |
| Futures contracts | 65,434 |
| Net change in unrealized appreciation (depreciation) | 43,240,008 |
| Net realized and unrealized gain | 54,476,218 |
| Net increase in net assets resulting from operations | $55,875,711 |
| Wanger International | Annual Report 2020 | 13 |
| Year Ended December 31, 2020 | Year Ended December 31, 2019 | |
| Operations | ||
| Net investment income | $1,399,493 | $4,570,752 |
| Net realized gain | 11,236,210 | 15,700,868 |
| Net change in unrealized appreciation (depreciation) | 43,240,008 | 98,450,422 |
| Net increase in net assets resulting from operations | 55,875,711 | 118,722,042 |
| Distributions to shareholders | ||
| Net investment income and net realized gains | (23,557,869) | (45,173,034) |
| Total distributions to shareholders | (23,557,869) | (45,173,034) |
| Decrease in net assets from capital stock activity | (40,068,079) | (24,346,877) |
| Total increase (decrease) in net assets | (7,750,237) | 49,202,131 |
| Net assets at beginning of year | 475,561,598 | 426,359,467 |
| Net assets at end of year | $467,811,361 | $475,561,598 |
| Year Ended | Year Ended | |||
| December 31, 2020 | December 31, 2019 | |||
| Shares | Dollars ($) | Shares | Dollars ($) | |
| Capital stock activity | ||||
| Subscriptions | 442,771 | 9,071,329 | 208,640 | 4,991,862 |
| Distributions reinvested | 1,060,210 | 23,557,869 | 1,957,373 | 45,173,034 |
| Redemptions | (3,107,958) | (72,697,277) | (3,076,078) | (74,511,773) |
| Total net decrease | (1,604,977) | (40,068,079) | (910,065) | (24,346,877) |
| 14 | Wanger International | Annual Report 2020 |
| Year Ended December 31, | |||||
| 2020 | 2019 | 2018 | 2017 | 2016 | |
| Per share data | |||||
| Net asset value, beginning of period | $26.00 | $22.20 | $30.84 | $23.64 | $26.32 |
| Income from investment operations: | |||||
| Net investment income | 0.07 | 0.24 | 0.29 | 0.25 | 0.31 |
| Net realized and unrealized gain (loss) | 3.31 | 6.08 | (4.93) | 7.49 | (0.56) |
| Total from investment operations | 3.38 | 6.32 | (4.64) | 7.74 | (0.25) |
| Less distributions to shareholders from: | |||||
| Net investment income | (0.48) | (0.20) | (0.60) | (0.34) | (0.29) |
| Net realized gains | (0.87) | (2.32) | (3.40) | (0.20) | (2.14) |
| Total distributions to shareholders | (1.35) | (2.52) | (4.00) | (0.54) | (2.43) |
| Net asset value, end of period | $28.03 | $26.00 | $22.20 | $30.84 | $23.64 |
| Total return | 14.36% | 29.99%(a) | (17.70)%(a) | 32.91%(a) | (1.41)% |
| Ratios to average net assets | |||||
| Total gross expenses(b) | 1.25% | 1.23% | 1.19% | 1.16% | 1.08%(c) |
| Total net expenses(b) | 1.25% | 1.20% | 1.13% | 1.12% | 1.08%(c) |
| Net investment income | 0.34% | 1.01% | 1.03% | 0.92% | 1.23% |
| Supplemental data | |||||
| Portfolio turnover | 60% | 42% | 47% | 55% | 56% |
| Net assets, end of period (in thousands) | $467,811 | $475,562 | $426,359 | $578,088 | $494,795 |
| Notes to Financial Highlights | |
| (a) | Had the Investment Manager and/or its affiliates not waived a portion of expenses, total return would have been reduced. |
| (b) | In addition to the fees and expenses that the Fund bears directly, the Fund indirectly bears a pro rata share of the fees and expenses of any other funds in which it invests, if any. Such indirect expenses are not included in the Fund’s reported expense ratios. |
| (c) | Expenses have been reduced due to a reimbursement of expenses overbilled by a third party. If the reimbursement had been excluded, the expense ratios would have been higher by 0.05%. All fee waivers and expense reimbursements by the Investment Manager and its affiliates were applied before giving effect to this third party reimbursement. |
| Wanger International | Annual Report 2020 | 15 |
December 31, 2020
| 16 | Wanger International | Annual Report 2020 |
December 31, 2020
| Wanger International | Annual Report 2020 | 17 |
December 31, 2020
| 18 | Wanger International | Annual Report 2020 |
December 31, 2020
| Asset derivatives | ||
| Risk exposure category | Statement of assets and liabilities location | Fair value ($) |
| Equity risk | Component of total distributable earnings (loss) — unrealized appreciation on futures contracts | 103,180* |
| * | Includes cumulative appreciation (depreciation) as reported in the tables following the Portfolio of Investments. Only the current day’s variation margin is reported in receivables or payables in the Statement of Assets and Liabilities. |
| Amount of realized gain (loss) on derivatives recognized in income | |
| Risk exposure category | Futures contracts ($) |
| Equity risk | 1,789,083 |
| Change in unrealized appreciation (depreciation) on derivatives recognized in income | |
| Risk exposure category | Futures contracts ($) |
| Equity risk | 65,434 |
| Derivative instrument | Average notional amounts ($)* |
| Futures contracts — long | 13,246,824 |
| * | Based on the ending quarterly outstanding amounts for the year ended December 31, 2020. |
| Wanger International | Annual Report 2020 | 19 |
December 31, 2020
| 20 | Wanger International | Annual Report 2020 |
December 31, 2020
| Average daily net assets | Annual fee rate |
| Up to $100 million | 1.10% |
| $100 million to $250 million | 0.95% |
| $250 million to $500 million | 0.90% |
| $500 million to $1 billion | 0.80% |
| $1 billion and over | 0.72% |
| Aggregate average daily net assets of the Trust | Annual fee rate |
| Up to $4 billion | 0.05% |
| $4 billion to $6 billion | 0.04% |
| $6 billion to $8 billion | 0.03% |
| $8 billion and over | 0.02% |
| Wanger International | Annual Report 2020 | 21 |
December 31, 2020
| Excess of distributions over net investment income ($) | Accumulated net realized gain ($) | Paid in capital ($) |
| 3,434,290 | (3,585,648) | 151,358 |
| Year Ended December 31, 2020 | Year Ended December 31, 2019 | ||||
| Ordinary income ($) | Long-term capital gains ($) | Total ($) | Ordinary income ($) | Long-term capital gains ($) | Total ($) |
| 8,459,559 | 15,098,310 | 23,557,869 | 3,644,597 | 41,528,437 | 45,173,034 |
| Undistributed ordinary income ($) | Undistributed long-term capital gains ($) | Capital loss carryforwards ($) | Net unrealized appreciation ($) |
| 2,464,288 | 7,363,424 | — | 152,365,555 |
| Federal tax cost ($) | Gross unrealized appreciation ($) | Gross unrealized (depreciation) ($) | Net unrealized appreciation ($) |
| 317,062,572 | 154,095,979 | (1,730,424) | 152,365,555 |
| 22 | Wanger International | Annual Report 2020 |
December 31, 2020
| Wanger International | Annual Report 2020 | 23 |
December 31, 2020
| 24 | Wanger International | Annual Report 2020 |
December 31, 2020
| Wanger International | Annual Report 2020 | 25 |
December 31, 2020
| 26 | Wanger International | Annual Report 2020 |
| Wanger International | Annual Report 2020 | 27 |
| Dividends received deduction | Capital gain dividend | Foreign taxes paid to foreign countries | Foreign taxes paid per share to foreign countries | Foreign source income | Foreign source income per share |
| 0.61% | $7,777,833 | $738,791 | $0.04 | $6,864,231 | $0.41 |
Shareholder Services Group
71 S Wacker Drive, Suite 2500
Chicago, IL 60606
800.922.6769
| 28 | Wanger International | Annual Report 2020 |
| Name and age at December 31, 2020 | Year first appointed or elected to a Board in the Columbia Funds Complex | Principal occupation(s) during the past five years | Number of Funds in the Columbia Funds Complex overseen (1) | Other directorships held by the Trustee during the past five years in addition to Columbia Acorn Trust and Wanger Advisors Trust |
| Laura M. Born, 55, Chair* | 2007 | Adjunct Professor of Finance, University of Chicago Booth School of Business since 2007; Advisory Board Member, Driehaus Capital Management since 2018; Director and Audit Committee Chair, Carlson Inc. (private global travel company) since 2015; Managing Director – Investment Banking, JP Morgan Chase & Co. (broker-dealer) 2002-2007. | 9 | None. |
| Maureen M. Culhane, 72 | 2007 | Retired. Formerly, Vice President, Goldman Sachs Asset Management, L.P. (investment adviser), 2005-2007; Vice President (Consultant) – Strategic Relationship Management, Goldman, Sachs & Co., 1999-2005. | 9 | None. |
| Margaret M. Eisen, 67 | 2002 | Trustee, Smith College, 2012-2016; Chief Investment Officer, EAM International LLC (corporate finance and asset management), 2003-2013; Managing Director, CFA Institute, 2005-2008. | 9 | Chair, RMB Investors Trust (9 series). |
| John C. Heaton, 61 | 2010 | Joseph L. Gidwitz Professor of Finance, University of Chicago Booth School of Business since July 2000; Deputy Dean for Faculty, University of Chicago Booth School of Business, 2012-2019. | 9 | None. |
| Charles R. Phillips, 64 | 2015 | Retired. Formerly, Vice Chairman, J.P. Morgan Private Bank, 2011-2014; Managing Director, J.P. Morgan Private Bank, 2001-2011; Managing Director, J.P. Morgan Private Bank, 2001-2011. | 9 | None. |
| David J. Rudis, 67, Vice Chair* | 2010 | Chief Executive Officer, Finger Rock, LLC (strategic consulting business). Formerly, National Checking and Debit Executive, and Illinois President, Bank of America, 2007-2009; President, Consumer Banking Group, LaSalle National Bank, 2004-2007. | 9 | None. |
| Name and age at December 31, 2020 | Year first appointed or elected to a Board in the Columbia Funds Complex | Principal occupation(s) during the past five years | Number of Funds in the Columbia Funds Complex overseen (1) | Other directorships held by the Trustee during the past five years in addition to Columbia Acorn Trust and Wanger Advisors Trust |
| Ralph Wanger, 86 (2) | 1970 (3) | Founder, CWAM. Formerly, President, Chief Investment Officer and portfolio manager, CWAM or its predecessors, July 1992-September 2003; Director, Wanger Investment Company PLC; Consultant, CWAM or its predecessors, September 2003-September 2005. | 9 | None. |
| * | On December 10, 2020, the Board of Trustees appointed Mr. Rudis as Chair, effective January 1, 2021. |
| (1) | The Trustees oversee the series of Wanger Advisors Trust and Columbia Acorn Trust. |
| (2) | As permitted under the Trust’s Bylaws, Mr. Wanger serves as a non-voting Trustee Emeritus of Columbia Acorn Trust and Wanger Advisors Trust. Prior to September 2009, Mr. Wanger served as an “interested” trustee of the Columbia Acorn Trust and Wanger Advisors Trust. Mr. Wanger was considered an “interested person” of the Trusts and of CWAM within the meaning of the 1940 Act because of certain ownership interests. |
| (3) | Dates prior to April 1992 correspond to the date first elected as a director of The Acorn Fund, Inc., the Trust’s predecessor. |
| Wanger International | Annual Report 2020 | 29 |
| Name and age at December 31, 2020 | Position held with Columbia Acorn Trust and Wanger Advisors Trust | Year first appointed or elected to office | Principal occupation(s) during the past five years |
| Michael G. Clarke, 50 | Assistant Treasurer* | 2004 | Vice President, Head of North American Operations, and Tax Co-Head of Global Operations, Columbia Management since June 2019 (previously Vice President, Accounting and Tax, May 2010-May 2019); senior officer of Columbia Funds and affiliated funds since 2002. |
| John L. Emerson, 45 | Vice President | 2020 | Portfolio manager and/or analyst, CWAM or its predecessors since 2003. |
| Paul B. Goucher, 51 | Assistant Secretary | 2015 | Senior Vice President and Assistant General Counsel, Ameriprise Financial, Inc. since January 2017 (previously Vice President and Lead Chief Counsel, November 2008 - January 2017 and January 2013 - January 2017, respectively); Vice President, Chief Legal Officer and Assistant Secretary, Columbia Management Investment Advisers, LLC since March 2015. |
| Tae Han (Simon) Kim, 39 | Vice President | 2018 | Portfolio manager and/or analyst, CWAM since 2011. |
| Stephen Kusmierczak, 53 | Co-President | 2011 | Portfolio manager and/or analyst, CWAM or its predecessors since 2001. Vice President, Columbia Acorn Trust and Wanger Advisors Trust, 2011 - 2020. |
| Joseph C. LaPalm, 50 | Vice President | 2006 | Chief Compliance Officer, CWAM since 2005. |
| Ryan C. Larrenaga, 49 | Chief Legal Officer and Assistant Secretary | 2015 | Vice President and Chief Counsel, Ameriprise Financial, Inc. since August 2018 (previously, Vice President and Group Counsel, August 2011 - August 2018); officer of Columbia Funds and affiliated funds since 2005. |
| Matthew A. Litfin, 48 | Co-President | 2019 | Director of Research (U.S.) and portfolio manager, CWAM since December 2015; Vice President, Columbia Acorn Trust and Wanger Advisors Trust, 2016 - March 2019; formerly, portfolio manager, William Blair & Company 1993-2015. |
| Erika K. Maschmeyer, 39 | Vice President | 2020 | Portfolio manager and/or analyst, CWAM or its predecessors since 2016. |
| Thomas P. McGuire, 47 | Chief Compliance Officer | 2015 | Senior Vice President and Chief Compliance Officer of the Columbia Funds since 2012; Vice President – Asset Management Compliance, Ameriprise Financial, Inc., since May 2010; Chief Compliance Officer, Ameriprise Certificate Company since September 2010. |
| Julian Quero, 53 | Assistant Treasurer | 2015 | Vice President – Tax, Columbia Management Investment Advisers, LLC since 2009. |
| Martha A. Skinner, 45 | Assistant Treasurer | 2016 | Vice President of Financial Reporting and Administration, Columbia Management since November 2015; Director of Financial Reporting, Columbia Management, April 2013-November 2015. |
| Hans F. Stege, 36 | Vice President | 2020 | Portfolio manager and/or analyst, CWAM or its predecessors since 2017. |
| Richard Watson, 51 | Vice President | 2018 | Portfolio manager and/or analyst, CWAM or its predecessors since 2006. |
| Linda Roth-Wiszowaty, 50 | Secretary | 2006 | Business support analyst, CWAM since April 2007. |
| * | On December 10, 2020, the Board of Trustees appointed Mr. Clarke as the Treasurer and Principal Accounting and Financial Officer of the Trust, effective January 1, 2021. |
| 30 | Wanger International | Annual Report 2020 |

December 31, 2020

| 3 | |
| 5 | |
| 7 | |
| 8 | |
| 12 | |
| 13 | |
| 14 | |
| 15 | |
| 16 | |
| 26 | |
| 27 | |
| 27 |
| Average annual total returns (%) (for the period ended December 31, 2020) | ||||||
| Inception | 1 Year | 5 Years | 10 Years | Life of Fund | ||
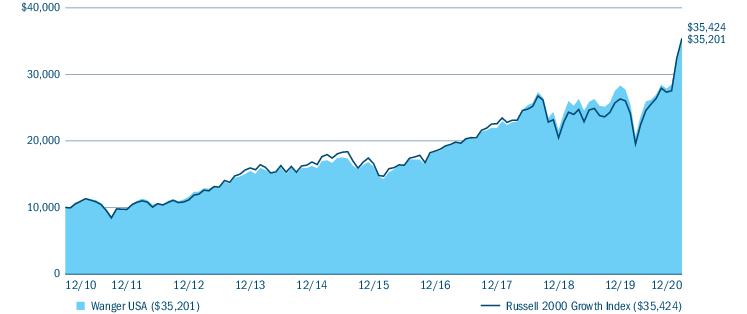
| Wanger USA | 05/03/95 | 24.23 | 16.89 | 13.41 | 12.45 | |
| Russell 2000 Growth Index | 34.63 | 16.36 | 13.48 | - | ||
| Wanger USA | Annual Report 2020 | 3 |
| Portfolio breakdown (%) (at December 31, 2020) | |
| Common Stocks | 96.1 |
| Limited Partnerships | 0.7 |
| Money Market Funds | 0.4 |
| Securities Lending Collateral | 2.8 |
| Total | 100.0 |
| Equity sector breakdown (%) (at December 31, 2020) | |
| Consumer Discretionary | 14.7 |
| Consumer Staples | 3.2 |
| Financials | 5.5 |
| Health Care | 38.1 |
| Industrials | 14.8 |
| Information Technology | 19.2 |
| Materials | 1.6 |
| Real Estate | 2.9 |
| Total | 100.0 |
| 4 | Wanger USA | Annual Report 2020 |
| Wanger USA | Annual Report 2020 | 5 |
| 6 | Wanger USA | Annual Report 2020 |
(Unaudited)
| July 1, 2020 — December 31, 2020 | |||||||
| Account value at the beginning of the period ($) | Account value at the end of the period ($) | Expenses paid during the period ($) | Fund’s annualized expense ratio (%) | ||||
| Actual | Hypothetical | Actual | Hypothetical | Actual | Hypothetical | Actual | |
| Wanger USA | 1,000.00 | 1,000.00 | 1,345.20 | 1,019.66 | 6.43 | 5.53 | 1.09 |
| Wanger USA | Annual Report 2020 | 7 |
December 31, 2020
| Common Stocks 98.9% | ||
| Issuer | Shares | Value ($) |
| Consumer Discretionary 13.9% | ||
| Auto Components 1.7% | ||
| Dorman Products, Inc.(a) | 59,500 | 5,165,790 |
| LCI Industries | 53,000 | 6,873,040 |
| Total | 12,038,830 | |
| Diversified Consumer Services 0.8% | ||
| Grand Canyon Education, Inc.(a) | 61,693 | 5,744,235 |
| Hotels, Restaurants & Leisure 4.5% | ||
| Choice Hotels International, Inc. | 55,979 | 5,974,639 |
| Churchill Downs, Inc. | 48,162 | 9,381,476 |
| Planet Fitness, Inc., Class A(a) | 78,100 | 6,062,903 |
| Wendy’s Co. (The) | 214,000 | 4,690,880 |
| Wingstop, Inc. | 45,000 | 5,964,750 |
| Total | 32,074,648 | |
| Household Durables 2.4% | ||
| Helen of Troy Ltd.(a) | 31,870 | 7,081,195 |
| Skyline Champion Corp.(a) | 318,358 | 9,849,997 |
| Total | 16,931,192 | |
| Leisure Products 1.3% | ||
| Brunswick Corp. | 123,673 | 9,428,830 |
| Specialty Retail 3.2% | ||
| Boot Barn Holdings, Inc.(a) | 203,532 | 8,825,147 |
| Five Below, Inc.(a) | 53,558 | 9,371,579 |
| Vroom, Inc.(a) | 104,063 | 4,263,461 |
| Total | 22,460,187 | |
| Total Consumer Discretionary | 98,677,922 | |
| Consumer Staples 3.2% | ||
| Food & Staples Retailing 1.0% | ||
| BJ’s Wholesale Club Holdings, Inc.(a) | 180,158 | 6,716,290 |
| Household Products 1.0% | ||
| WD-40 Co. | 26,414 | 7,017,672 |
| Personal Products 1.2% | ||
| Inter Parfums, Inc. | 146,096 | 8,837,347 |
| Total Consumer Staples | 22,571,309 | |
| Common Stocks (continued) | ||
| Issuer | Shares | Value ($) |
| Financials 5.5% | ||
| Banks 1.0% | ||
| Lakeland Financial Corp. | 128,331 | 6,875,975 |
| Capital Markets 2.6% | ||
| GCM Grosvenor, Inc., Class A(a),(b) | 340,000 | 4,528,800 |
| Hamilton Lane, Inc., Class A | 63,873 | 4,985,288 |
| Houlihan Lokey, Inc. | 129,958 | 8,737,076 |
| Total | 18,251,164 | |
| Consumer Finance 0.8% | ||
| FirstCash, Inc. | 87,430 | 6,123,597 |
| Thrifts & Mortgage Finance 1.1% | ||
| Merchants Bancorp | 283,419 | 7,830,867 |
| Total Financials | 39,081,603 | |
| Health Care 37.9% | ||
| Biotechnology 17.0% | ||
| ACADIA Pharmaceuticals, Inc.(a) | 79,801 | 4,266,160 |
| Acceleron Pharma, Inc.(a) | 90,087 | 11,525,731 |
| Anika Therapeutics, Inc.(a) | 194,082 | 8,784,151 |
| Arcus Biosciences, Inc.(a) | 207,544 | 5,387,842 |
| CRISPR Therapeutics AG(a) | 51,944 | 7,953,146 |
| Fate Therapeutics, Inc.(a) | 161,762 | 14,709,019 |
| Immunogen, Inc.(a) | 1,253,000 | 8,081,850 |
| Insmed, Inc.(a) | 364,474 | 12,133,340 |
| Intercept Pharmaceuticals, Inc.(a) | 189,749 | 4,686,800 |
| Kiniksa Pharmaceuticals Ltd., Class A(a) | 513,328 | 9,070,506 |
| Kura Oncology, Inc.(a) | 169,168 | 5,525,027 |
| Mirati Therapeutics, Inc.(a) | 45,106 | 9,907,082 |
| Natera, Inc.(a) | 185,325 | 18,443,544 |
| Total | 120,474,198 | |
| Health Care Equipment & Supplies 6.2% | ||
| Atrion Corp. | 9,619 | 6,177,706 |
| Eargo, Inc.(a),(b) | 139,752 | 6,263,685 |
| Globus Medical, Inc., Class A(a) | 196,867 | 12,839,666 |
| Haemonetics Corp.(a) | 64,873 | 7,703,669 |
| SI-BONE, Inc.(a) | 363,286 | 10,862,251 |
| Total | 43,846,977 | |
| 8 | Wanger USA | Annual Report 2020 |
December 31, 2020
| Common Stocks (continued) | ||
| Issuer | Shares | Value ($) |
| Health Care Providers & Services 8.4% | ||
| Amedisys, Inc.(a) | 43,712 | 12,822,041 |
| Chemed Corp. | 22,888 | 12,190,378 |
| Corvel Corp.(a) | 88,730 | 9,405,380 |
| HealthEquity, Inc.(a) | 103,000 | 7,180,130 |
| LHC Group, Inc.(a) | 44,400 | 9,471,408 |
| National Research Corp., Class A | 207,160 | 8,856,090 |
| Total | 59,925,427 | |
| Health Care Technology 0.9% | ||
| American Well Corp., Class A(a),(b) | 257,250 | 6,516,142 |
| Life Sciences Tools & Services 3.9% | ||
| NanoString Technologies, Inc.(a) | 125,759 | 8,410,762 |
| Pacific Biosciences of California, Inc.(a) | 352,000 | 9,130,880 |
| Repligen Corp.(a) | 51,333 | 9,836,943 |
| Total | 27,378,585 | |
| Pharmaceuticals 1.5% | ||
| Reata Pharmaceuticals, Inc., Class A(a) | 52,300 | 6,465,326 |
| Theravance Biopharma, Inc.(a) | 229,782 | 4,083,226 |
| Total | 10,548,552 | |
| Total Health Care | 268,689,881 | |
| Industrials 14.8% | ||
| Aerospace & Defense 2.1% | ||
| BWX Technologies, Inc. | 131,500 | 7,926,820 |
| Curtiss-Wright Corp. | 59,144 | 6,881,405 |
| Total | 14,808,225 | |
| Commercial Services & Supplies 0.8% | ||
| Unifirst Corp. | 25,538 | 5,406,139 |
| Construction & Engineering 1.5% | ||
| Comfort Systems U.S.A., Inc. | 199,736 | 10,518,098 |
| Electrical Equipment 1.5% | ||
| Atkore International Group, Inc.(a) | 261,028 | 10,730,861 |
| Machinery 3.6% | ||
| ITT, Inc. | 123,642 | 9,522,907 |
| SPX Corp.(a) | 122,810 | 6,698,057 |
| Watts Water Technologies, Inc., Class A | 78,140 | 9,509,638 |
| Total | 25,730,602 | |
| Common Stocks (continued) | ||
| Issuer | Shares | Value ($) |
| Professional Services 2.9% | ||
| Exponent, Inc. | 157,742 | 14,201,512 |
| ICF International, Inc. | 86,210 | 6,407,990 |
| Total | 20,609,502 | |
| Road & Rail 1.2% | ||
| Saia, Inc.(a) | 47,643 | 8,613,854 |
| Trading Companies & Distributors 1.2% | ||
| SiteOne Landscape Supply, Inc.(a) | 51,386 | 8,151,361 |
| Total Industrials | 104,568,642 | |
| Information Technology 19.1% | ||
| Electronic Equipment, Instruments & Components 2.8% | ||
| Badger Meter, Inc. | 94,338 | 8,873,432 |
| ePlus, Inc.(a) | 119,512 | 10,511,080 |
| Total | 19,384,512 | |
| IT Services 1.4% | ||
| Endava PLC, ADR(a) | 75,599 | 5,802,223 |
| LiveRamp Holdings, Inc.(a) | 59,113 | 4,326,481 |
| Total | 10,128,704 | |
| Semiconductors & Semiconductor Equipment 2.3% | ||
| Advanced Energy Industries, Inc.(a) | 104,122 | 10,096,710 |
| Inphi Corp.(a) | 39,069 | 6,269,403 |
| Total | 16,366,113 | |
| Software 12.6% | ||
| Blackline, Inc.(a) | 66,039 | 8,808,282 |
| CyberArk Software Ltd.(a) | 51,366 | 8,300,232 |
| Elastic NV(a) | 41,064 | 6,000,682 |
| j2 Global, Inc.(a) | 69,150 | 6,755,264 |
| JFrog Ltd.(a),(b) | 88,415 | 5,555,114 |
| Manhattan Associates, Inc.(a) | 122,824 | 12,918,628 |
| Mimecast Ltd.(a) | 162,454 | 9,233,885 |
| Qualys, Inc.(a) | 90,915 | 11,079,811 |
| Sprout Social, Inc., Class A(a) | 261,302 | 11,865,724 |
| Upstart Holdings, Inc.(a) | 218,882 | 8,919,442 |
| Total | 89,437,064 | |
| Total Information Technology | 135,316,393 | |
| Wanger USA | Annual Report 2020 | 9 |
December 31, 2020
| Common Stocks (continued) | ||
| Issuer | Shares | Value ($) |
| Materials 1.6% | ||
| Chemicals 1.6% | ||
| Avient Corp. | 281,572 | 11,341,720 |
| Total Materials | 11,341,720 | |
| Real Estate 2.9% | ||
| Equity Real Estate Investment Trusts (REITS) 0.2% | ||
| UMH Properties, Inc. | 74,813 | 1,107,981 |
| Real Estate Management & Development 2.7% | ||
| Colliers International Group, Inc. | 78,000 | 6,952,140 |
| FirstService Corp. | 30,840 | 4,217,678 |
| Redfin Corp.(a) | 114,706 | 7,872,273 |
| Total | 19,042,091 | |
| Total Real Estate | 20,150,072 | |
| Total Common Stocks (Cost $454,798,604) | 700,397,542 | |
| Limited Partnerships 0.7% | ||
| Consumer Discretionary 0.7% | ||
| Hotels, Restaurants & Leisure 0.7% | ||
| Cedar Fair LP | 121,000 | 4,760,140 |
| Total Consumer Discretionary | 4,760,140 | |
| Total Limited Partnerships (Cost $3,172,492) | 4,760,140 | |
| Securities Lending Collateral 2.9% | ||
| Issuer | Shares | Value ($) |
| Dreyfus Government Cash Management Fund, Instutional Shares, 0.030%(c),(d) | 20,609,459 | 20,609,459 |
| Total Securities Lending Collateral (Cost $20,609,459) | 20,609,459 | |
| Money Market Funds 0.4% | ||
| Shares | Value ($) | |
| Columbia Short-Term Cash Fund, 0.107%(c),(e) | 3,274,054 | 3,273,726 |
| Total Money Market Funds (Cost $3,272,850) | 3,273,726 | |
| Total Investments in Securities (Cost: $481,853,405) | 729,040,867 | |
| Obligation to Return Collateral for Securities Loaned | (20,609,459) | |
| Other Assets & Liabilities, Net | (88,752) | |
| Net Assets | 708,342,656 | |
| (a) | Non-income producing investment. |
| (b) | All or a portion of this security was on loan at December 31, 2020. The total market value of securities on loan at December 31, 2020 was $19,189,748. |
| (c) | The rate shown is the seven-day current annualized yield at December 31, 2020. |
| (d) | Investment made with cash collateral received from securities lending activity. |
| (e) | As defined in the Investment Company Act of 1940, an affiliated company is one in which the Fund owns 5% or more of the company’s outstanding voting securities, or a company which is under common ownership or control with the Fund. The value of the holdings and transactions in these affiliated companies during the year ended December 31, 2020 are as follows: |
| Affiliated issuers | Beginning of period($) | Purchases($) | Sales($) | Net change in unrealized appreciation (depreciation)($) | End of period($) | Realized gain (loss)($) | Dividends($) | End of period shares |
| Columbia Short-Term Cash Fund, 0.107% | ||||||||
| 30,585,835 | 322,264,256 | (349,577,241) | 876 | 3,273,726 | (7,684) | 161,283 | 3,274,054 | |
| ADR | American Depositary Receipt |
| 10 | Wanger USA | Annual Report 2020 |
December 31, 2020
| ■ | Level 1 – quoted prices in active markets for identical securities |
| ■ | Level 2 – prices determined using other significant observable inputs (including quoted prices for similar securities, interest rates, prepayment speeds, credit risk and others) |
| ■ | Level 3 – prices determined using significant unobservable inputs where quoted prices or observable inputs are unavailable or less reliable (including management’s own assumptions about the factors market participants would use in pricing an investment) |
| Level 1 ($) | Level 2 ($) | Level 3 ($) | Total ($) | |
| Investments in Securities | ||||
| Common Stocks | ||||
| Consumer Discretionary | 98,677,922 | — | — | 98,677,922 |
| Consumer Staples | 22,571,309 | — | — | 22,571,309 |
| Financials | 39,081,603 | — | — | 39,081,603 |
| Health Care | 268,689,881 | — | — | 268,689,881 |
| Industrials | 104,568,642 | — | — | 104,568,642 |
| Information Technology | 135,316,393 | — | — | 135,316,393 |
| Materials | 11,341,720 | — | — | 11,341,720 |
| Real Estate | 20,150,072 | — | — | 20,150,072 |
| Total Common Stocks | 700,397,542 | — | — | 700,397,542 |
| Limited Partnerships | ||||
| Consumer Discretionary | 4,760,140 | — | — | 4,760,140 |
| Total Limited Partnerships | 4,760,140 | — | — | 4,760,140 |
| Securities Lending Collateral | 20,609,459 | — | — | 20,609,459 |
| Money Market Funds | 3,273,726 | — | — | 3,273,726 |
| Total Investments in Securities | 729,040,867 | — | — | 729,040,867 |
| Wanger USA | Annual Report 2020 | 11 |
December 31, 2020
| Assets | |
| Investments in securities, at value* | |
| Unaffiliated issuers (cost $478,580,555) | $725,767,141 |
| Affiliated issuers (cost $3,272,850) | 3,273,726 |
| Receivable for: | |
| Investments sold | 876,557 |
| Capital shares sold | 5,195 |
| Dividends | 159,189 |
| Securities lending income | 52,787 |
| Foreign tax reclaims | 899 |
| Prepaid expenses | 15,369 |
| Trustees’ deferred compensation plan | 341,643 |
| Total assets | 730,492,506 |
| Liabilities | |
| Due upon return of securities on loan | 20,609,459 |
| Payable for: | |
| Capital shares purchased | 1,009,186 |
| Investment advisory fee | 16,856 |
| Service fees | 105,671 |
| Administration fees | 975 |
| Trustees’ fees | 807 |
| Compensation of chief compliance officer | 1,208 |
| Other expenses | 64,045 |
| Trustees’ deferred compensation plan | 341,643 |
| Total liabilities | 22,149,850 |
| Net assets applicable to outstanding capital stock | $708,342,656 |
| Represented by | |
| Paid in capital | 443,632,973 |
| Total distributable earnings (loss) | 264,709,683 |
| Total - representing net assets applicable to outstanding capital stock | $708,342,656 |
| Shares outstanding | 28,763,524 |
| Net asset value per share | 24.63 |
| * Includes the value of securities on loan | 19,189,748 |
| 12 | Wanger USA | Annual Report 2020 |
Year Ended December 31, 2020
| Net investment income | |
| Income: | |
| Dividends — unaffiliated issuers | $2,687,298 |
| Dividends — affiliated issuers | 161,283 |
| Income from securities lending — net | 99,324 |
| Foreign taxes withheld | (16,551) |
| Total income | 2,931,354 |
| Expenses: | |
| Investment advisory fee | 5,195,256 |
| Service fees | 648,006 |
| Administration fees | 298,825 |
| Trustees’ fees | 70,361 |
| Custodian fees | 10,707 |
| Printing and postage fees | 118,077 |
| Audit fees | 33,268 |
| Legal fees | 126,365 |
| Compensation of chief compliance officer | 2,603 |
| Other | 45,937 |
| Total expenses | 6,549,405 |
| Net investment loss | (3,618,051) |
| Realized and unrealized gain (loss) — net | |
| Net realized gain (loss) on: | |
| Investments — unaffiliated issuers | 19,204,180 |
| Investments — affiliated issuers | (7,684) |
| Futures contracts | 5,110,705 |
| Net realized gain | 24,307,201 |
| Net change in unrealized appreciation (depreciation) on: | |
| Investments — unaffiliated issuers | 115,817,338 |
| Investments — affiliated issuers | 876 |
| Net change in unrealized appreciation (depreciation) | 115,818,214 |
| Net realized and unrealized gain | 140,125,415 |
| Net increase in net assets resulting from operations | $136,507,364 |
| Wanger USA | Annual Report 2020 | 13 |
| Year Ended December 31, 2020 | Year Ended December 31, 2019 | |
| Operations | ||
| Net investment loss | $(3,618,051) | $(528,026) |
| Net realized gain | 24,307,201 | 65,313,747 |
| Net change in unrealized appreciation (depreciation) | 115,818,214 | 107,201,072 |
| Net increase in net assets resulting from operations | 136,507,364 | 171,986,793 |
| Distributions to shareholders | ||
| Net investment income and net realized gains | (64,805,114) | (115,476,309) |
| Total distributions to shareholders | (64,805,114) | (115,476,309) |
| Increase (decrease) in net assets from capital stock activity | (30,313,016) | 28,452,376 |
| Total increase in net assets | 41,389,234 | 84,962,860 |
| Net assets at beginning of year | 666,953,422 | 581,990,562 |
| Net assets at end of year | $708,342,656 | $666,953,422 |
| Year Ended | Year Ended | |||
| December 31, 2020 | December 31, 2019 | |||
| Shares | Dollars ($) | Shares | Dollars ($) | |
| Capital stock activity | ||||
| Subscriptions | 473,106 | 9,018,672 | 440,992 | 9,950,457 |
| Distributions reinvested | 3,474,805 | 64,805,114 | 5,823,314 | 115,476,309 |
| Redemptions | (5,141,351) | (104,136,802) | (4,421,151) | (96,974,390) |
| Total net increase (decrease) | (1,193,440) | (30,313,016) | 1,843,155 | 28,452,376 |
| 14 | Wanger USA | Annual Report 2020 |
| Year Ended December 31, | |||||
| 2020 | 2019 | 2018 | 2017 | 2016 | |
| Per share data | |||||
| Net asset value, beginning of period | $22.26 | $20.70 | $26.74 | $26.53 | $31.75 |
| Income from investment operations: | |||||
| Net investment income (loss) | (0.12) | (0.02) | (0.02) | (0.02) | (0.04) |
| Net realized and unrealized gain | 4.78 | 5.93 | 0.75 | 4.81 | 3.56 |
| Total from investment operations | 4.66 | 5.91 | 0.73 | 4.79 | 3.52 |
| Less distributions to shareholders from: | |||||
| Net investment income | — | (0.07) | (0.03) | — | — |
| Net realized gains | (2.29) | (4.28) | (6.74) | (4.58) | (8.74) |
| Total distributions to shareholders | (2.29) | (4.35) | (6.77) | (4.58) | (8.74) |
| Net asset value, end of period | $24.63 | $22.26 | $20.70 | $26.74 | $26.53 |
| Total return | 24.23% | 31.10%(a) | (1.46)%(a) | 19.58%(a) | 13.69% |
| Ratios to average net assets | |||||
| Total gross expenses(b) | 1.10% | 1.09% | 1.05% | 1.03% | 1.00% |
| Total net expenses(b) | 1.10% | 1.06% | 1.00% | 0.99% | 1.00% |
| Net investment loss | (0.61)% | (0.08)% | (0.09)% | (0.08)% | (0.16)% |
| Supplemental data | |||||
| Portfolio turnover | 92% | 90% | 81% | 96% | 118% |
| Net assets, end of period (in thousands) | $708,343 | $666,953 | $581,991 | $684,712 | $664,236 |
| Notes to Financial Highlights | |
| (a) | Had the Investment Manager and/or its affiliates not waived a portion of expenses, total return would have been reduced. |
| (b) | In addition to the fees and expenses that the Fund bears directly, the Fund indirectly bears a pro rata share of the fees and expenses of any other funds in which it invests. Such indirect expenses are not included in the Fund’s reported expense ratios. |
| Wanger USA | Annual Report 2020 | 15 |
December 31, 2020
| 16 | Wanger USA | Annual Report 2020 |
December 31, 2020
| Wanger USA | Annual Report 2020 | 17 |
December 31, 2020
| Amount of realized gain (loss) on derivatives recognized in income | |
| Risk exposure category | Futures contracts ($) |
| Equity risk | 5,110,705 |
| 18 | Wanger USA | Annual Report 2020 |
December 31, 2020
| Derivative instrument | Average notional amounts ($)* |
| Futures contracts — long | 10,271,100 |
| * | Based on the ending quarterly outstanding amounts for the year ended December 31, 2020. |
| Overnight and continuous | Up to 30 days | 30-90 days | Greater than 90 days | Total | |
| Wanger USA | |||||
| Securities lending transactions | |||||
| Equity securities | $19,189,748 | $— | $— | $— | $19,189,748 |
| Gross amount of recognized liabilities for securities lending (collateral received) | 20,609,459 | ||||
| Amounts due to counterparty in the event of default | $1,419,711 |
| Goldman Sachs ($) | |
| Liabilities | |
| Collateral on Securities Loaned | 20,609,459 |
| Total Liabilities | 20,609,459 |
| Total Financial and Derivative Net Assets | (20,609,459) |
| Financial Instruments | 19,189,748 |
| Net Amount (a) | (1,419,711) |
| (a) | Represents the net amount due from/(to) counterparties in the event of default. |
| Wanger USA | Annual Report 2020 | 19 |
December 31, 2020
| 20 | Wanger USA | Annual Report 2020 |
December 31, 2020
| Average daily net assets | Annual fee rate |
| Up to $100 million | 0.94% |
| $100 million to $250 million | 0.89% |
| $250 million to $2 billion | 0.84% |
| $2 billion and over | 0.80% |
| Aggregate average daily net assets of the Trust | Annual fee rate |
| Up to $4 billion | 0.05% |
| $4 billion to $6 billion | 0.04% |
| $6 billion to $8 billion | 0.03% |
| $8 billion and over | 0.02% |
| Wanger USA | Annual Report 2020 | 21 |
December 31, 2020
| Excess of distributions over net investment income ($) | Accumulated net realized gain ($) | Paid in capital ($) |
| 868,820 | (823,042) | (45,778) |
| Year Ended December 31, 2020 | Year Ended December 31, 2019 | ||||
| Ordinary income ($) | Long-term capital gains ($) | Total ($) | Ordinary income ($) | Long-term capital gains ($) | Total ($) |
| 11,175,433 | 53,629,681 | 64,805,114 | 28,410,551 | 87,065,758 | 115,476,309 |
| Undistributed ordinary income ($) | Undistributed long-term capital gains ($) | Capital loss carryforwards ($) | Net unrealized appreciation ($) |
| 16,191,240 | 7,092,755 | — | 241,727,168 |
| Federal tax cost ($) | Gross unrealized appreciation ($) | Gross unrealized (depreciation) ($) | Net unrealized appreciation ($) |
| 487,313,699 | 250,657,629 | (8,930,461) | 241,727,168 |
| 22 | Wanger USA | Annual Report 2020 |
December 31, 2020
| Wanger USA | Annual Report 2020 | 23 |
December 31, 2020
| 24 | Wanger USA | Annual Report 2020 |
December 31, 2020
| Wanger USA | Annual Report 2020 | 25 |
| 26 | Wanger USA | Annual Report 2020 |
| Dividends received deduction | Capital gain dividend |
| 38.74% | $7,521,041 |
Shareholder Services Group
71 S Wacker Drive, Suite 2500
Chicago, IL 60606
800.922.6769
| Name and age at December 31, 2020 | Year first appointed or elected to a Board in the Columbia Funds Complex | Principal occupation(s) during the past five years | Number of Funds in the Columbia Funds Complex overseen (1) | Other directorships held by the Trustee during the past five years in addition to Columbia Acorn Trust and Wanger Advisors Trust |
| Laura M. Born, 55, Chair* | 2007 | Adjunct Professor of Finance, University of Chicago Booth School of Business since 2007; Advisory Board Member, Driehaus Capital Management since 2018; Director and Audit Committee Chair, Carlson Inc. (private global travel company) since 2015; Managing Director – Investment Banking, JP Morgan Chase & Co. (broker-dealer) 2002-2007. | 9 | None. |
| Wanger USA | Annual Report 2020 | 27 |
Independent trustees (continued)
| Name and age at December 31, 2020 | Year first appointed or elected to a Board in the Columbia Funds Complex | Principal occupation(s) during the past five years | Number of Funds in the Columbia Funds Complex overseen (1) | Other directorships held by the Trustee during the past five years in addition to Columbia Acorn Trust and Wanger Advisors Trust |
| Maureen M. Culhane, 72 | 2007 | Retired. Formerly, Vice President, Goldman Sachs Asset Management, L.P. (investment adviser), 2005-2007; Vice President (Consultant) – Strategic Relationship Management, Goldman, Sachs & Co., 1999-2005. | 9 | None. |
| Margaret M. Eisen, 67 | 2002 | Trustee, Smith College, 2012-2016; Chief Investment Officer, EAM International LLC (corporate finance and asset management), 2003-2013; Managing Director, CFA Institute, 2005-2008. | 9 | Chair, RMB Investors Trust (9 series). |
| John C. Heaton, 61 | 2010 | Joseph L. Gidwitz Professor of Finance, University of Chicago Booth School of Business since July 2000; Deputy Dean for Faculty, University of Chicago Booth School of Business, 2012-2019. | 9 | None. |
| Charles R. Phillips, 64 | 2015 | Retired. Formerly, Vice Chairman, J.P. Morgan Private Bank, 2011-2014; Managing Director, J.P. Morgan Private Bank, 2001-2011; Managing Director, J.P. Morgan Private Bank, 2001-2011. | 9 | None. |
| David J. Rudis, 67, Vice Chair* | 2010 | Chief Executive Officer, Finger Rock, LLC (strategic consulting business). Formerly, National Checking and Debit Executive, and Illinois President, Bank of America, 2007-2009; President, Consumer Banking Group, LaSalle National Bank, 2004-2007. | 9 | None. |
| Name and age at December 31, 2020 | Year first appointed or elected to a Board in the Columbia Funds Complex | Principal occupation(s) during the past five years | Number of Funds in the Columbia Funds Complex overseen (1) | Other directorships held by the Trustee during the past five years in addition to Columbia Acorn Trust and Wanger Advisors Trust |
| Ralph Wanger, 86 (2) | 1970 (3) | Founder, CWAM. Formerly, President, Chief Investment Officer and portfolio manager, CWAM or its predecessors, July 1992-September 2003; Director, Wanger Investment Company PLC; Consultant, CWAM or its predecessors, September 2003-September 2005. | 9 | None. |
| * | On December 10, 2020, the Board of Trustees appointed Mr. Rudis as Chair, effective January 1, 2021. |
| (1) | The Trustees oversee the series of Wanger Advisors Trust and Columbia Acorn Trust. |
| (2) | As permitted under the Trust’s Bylaws, Mr. Wanger serves as a non-voting Trustee Emeritus of Columbia Acorn Trust and Wanger Advisors Trust. Prior to September 2009, Mr. Wanger served as an “interested” trustee of the Columbia Acorn Trust and Wanger Advisors Trust. Mr. Wanger was considered an “interested person” of the Trusts and of CWAM within the meaning of the 1940 Act because of certain ownership interests. |
| (3) | Dates prior to April 1992 correspond to the date first elected as a director of The Acorn Fund, Inc., the Trust’s predecessor. |
| 28 | Wanger USA | Annual Report 2020 |
| Name and age at December 31, 2020 | Position held with Columbia Acorn Trust and Wanger Advisors Trust | Year first appointed or elected to office | Principal occupation(s) during the past five years |
| Michael G. Clarke, 50 | Assistant Treasurer* | 2004 | Vice President, Head of North American Operations, and Tax Co-Head of Global Operations, Columbia Management since June 2019 (previously Vice President, Accounting and Tax, May 2010-May 2019); senior officer of Columbia Funds and affiliated funds since 2002. |
| John L. Emerson, 45 | Vice President | 2020 | Portfolio manager and/or analyst, CWAM or its predecessors since 2003. |
| Paul B. Goucher, 51 | Assistant Secretary | 2015 | Senior Vice President and Assistant General Counsel, Ameriprise Financial, Inc. since January 2017 (previously Vice President and Lead Chief Counsel, November 2008 - January 2017 and January 2013 - January 2017, respectively); Vice President, Chief Legal Officer and Assistant Secretary, Columbia Management Investment Advisers, LLC since March 2015. |
| Tae Han (Simon) Kim, 39 | Vice President | 2018 | Portfolio manager and/or analyst, CWAM since 2011. |
| Stephen Kusmierczak, 53 | Co-President | 2011 | Portfolio manager and/or analyst, CWAM or its predecessors since 2001. Vice President, Columbia Acorn Trust and Wanger Advisors Trust, 2011 - 2020. |
| Joseph C. LaPalm, 50 | Vice President | 2006 | Chief Compliance Officer, CWAM since 2005. |
| Ryan C. Larrenaga, 49 | Chief Legal Officer and Assistant Secretary | 2015 | Vice President and Chief Counsel, Ameriprise Financial, Inc. since August 2018 (previously, Vice President and Group Counsel, August 2011 - August 2018); officer of Columbia Funds and affiliated funds since 2005. |
| Matthew A. Litfin, 48 | Co-President | 2019 | Director of Research (U.S.) and portfolio manager, CWAM since December 2015; Vice President, Columbia Acorn Trust and Wanger Advisors Trust, 2016 - March 2019; formerly, portfolio manager, William Blair & Company 1993-2015. |
| Erika K. Maschmeyer, 39 | Vice President | 2020 | Portfolio manager and/or analyst, CWAM or its predecessors since 2016. |
| Thomas P. McGuire, 47 | Chief Compliance Officer | 2015 | Senior Vice President and Chief Compliance Officer of the Columbia Funds since 2012; Vice President – Asset Management Compliance, Ameriprise Financial, Inc., since May 2010; Chief Compliance Officer, Ameriprise Certificate Company since September 2010. |
| Julian Quero, 53 | Assistant Treasurer | 2015 | Vice President – Tax, Columbia Management Investment Advisers, LLC since 2009. |
| Martha A. Skinner, 45 | Assistant Treasurer | 2016 | Vice President of Financial Reporting and Administration, Columbia Management since November 2015; Director of Financial Reporting, Columbia Management, April 2013-November 2015. |
| Hans F. Stege, 36 | Vice President | 2020 | Portfolio manager and/or analyst, CWAM or its predecessors since 2017. |
| Richard Watson, 51 | Vice President | 2018 | Portfolio manager and/or analyst, CWAM or its predecessors since 2006. |
| Linda Roth-Wiszowaty, 50 | Secretary | 2006 | Business support analyst, CWAM since April 2007. |
| * | On December 10, 2020, the Board of Trustees appointed Mr. Clarke as the Treasurer and Principal Accounting and Financial Officer of the Trust, effective January 1, 2021. |
| Wanger USA | Annual Report 2020 | 29 |

December 31, 2020

| 3 | |
| 5 | |
| 7 | |
| 8 | |
| 11 | |
| 12 | |
| 13 | |
| 14 | |
| 15 | |
| 23 | |
| 24 | |
| 24 |
| Average annual total returns (%) (for the period ended December 31, 2020) | ||||||
| Inception | 1 Year | 5 Years | 10 Years | Life of Fund | ||
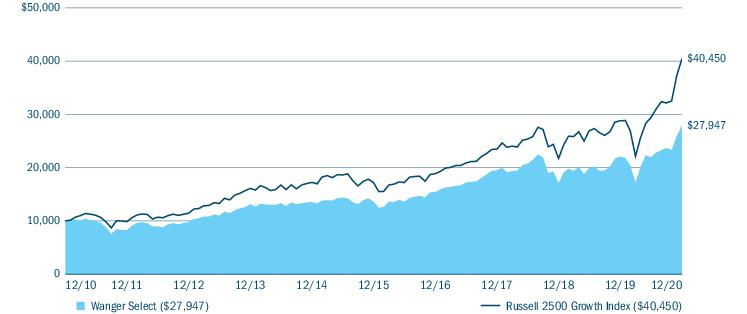
| Wanger Select | 02/01/99 | 26.65 | 15.54 | 10.82 | 11.08 | |
| Russell 2500 Growth Index | 40.47 | 18.68 | 15.00 | - | ||
| Wanger Select | Annual Report 2020 | 3 |
| Portfolio breakdown (%) (at December 31, 2020) | |
| Common Stocks | 99.4 |
| Money Market Funds | 0.6 |
| Total | 100.0 |
| Equity sector breakdown (%) (at December 31, 2020) | |
| Communication Services | 6.4 |
| Consumer Discretionary | 14.7 |
| Consumer Staples | 2.1 |
| Financials | 2.6 |
| Health Care | 27.3 |
| Industrials | 10.5 |
| Information Technology | 29.2 |
| Materials | 7.2 |
| Total | 100.0 |
| 4 | Wanger Select | Annual Report 2020 |
| Wanger Select | Annual Report 2020 | 5 |
| 6 | Wanger Select | Annual Report 2020 |
(Unaudited)
| July 1, 2020 — December 31, 2020 | |||||||
| Account value at the beginning of the period ($) | Account value at the end of the period ($) | Expenses paid during the period ($) | Fund’s annualized expense ratio (%) | ||||
| Actual | Hypothetical | Actual | Hypothetical | Actual | Hypothetical | Actual | |
| Wanger Select | 1,000.00 | 1,000.00 | 1,273.90 | 1,020.66 | 5.09 | 4.52 | 0.89 |
| Wanger Select | Annual Report 2020 | 7 |
December 31, 2020
| Common Stocks 99.8% | ||
| Issuer | Shares | Value ($) |
| Communication Services 6.4% | ||
| Entertainment 6.4% | ||
| Take-Two Interactive Software, Inc.(a) | 21,400 | 4,446,706 |
| Zynga, Inc., Class A(a) | 340,809 | 3,363,785 |
| Total | 7,810,491 | |
| Total Communication Services | 7,810,491 | |
| Consumer Discretionary 14.7% | ||
| Hotels, Restaurants & Leisure 9.9% | ||
| Chipotle Mexican Grill, Inc.(a) | 2,070 | 2,870,490 |
| Churchill Downs, Inc. | 14,900 | 2,902,371 |
| Planet Fitness, Inc., Class A(a) | 39,500 | 3,066,385 |
| Wingstop, Inc. | 23,750 | 3,148,062 |
| Total | 11,987,308 | |
| Household Durables 2.7% | ||
| Skyline Champion Corp.(a) | 106,300 | 3,288,922 |
| Specialty Retail 2.1% | ||
| Vroom, Inc.(a) | 63,000 | 2,581,110 |
| Total Consumer Discretionary | 17,857,340 | |
| Consumer Staples 2.0% | ||
| Food & Staples Retailing 2.0% | ||
| BJ’s Wholesale Club Holdings, Inc.(a) | 67,000 | 2,497,760 |
| Total Consumer Staples | 2,497,760 | |
| Financials 2.6% | ||
| Banks 2.6% | ||
| SVB Financial Group(a) | 8,179 | 3,172,062 |
| Total Financials | 3,172,062 | |
| Health Care 27.3% | ||
| Biotechnology 12.2% | ||
| Acceleron Pharma, Inc.(a) | 23,700 | 3,032,178 |
| Insmed, Inc.(a) | 83,700 | 2,786,373 |
| Intercept Pharmaceuticals, Inc.(a) | 53,100 | 1,311,570 |
| Natera, Inc.(a) | 39,100 | 3,891,232 |
| Sarepta Therapeutics, Inc.(a) | 22,175 | 3,780,616 |
| Total | 14,801,969 | |
| Common Stocks (continued) | ||
| Issuer | Shares | Value ($) |
| Health Care Equipment & Supplies 7.5% | ||
| Globus Medical, Inc., Class A(a) | 55,200 | 3,600,144 |
| Masimo Corp.(a) | 20,385 | 5,470,926 |
| Total | 9,071,070 | |
| Health Care Providers & Services 7.6% | ||
| Chemed Corp. | 9,208 | 4,904,273 |
| Encompass Health Corp. | 52,984 | 4,381,247 |
| Total | 9,285,520 | |
| Total Health Care | 33,158,559 | |
| Industrials 10.5% | ||
| Building Products 2.3% | ||
| Lennox International, Inc. | 10,200 | 2,794,494 |
| Electrical Equipment 2.8% | ||
| Generac Holdings, Inc.(a) | 14,850 | 3,377,038 |
| Machinery 3.2% | ||
| IDEX Corp. | 19,625 | 3,909,300 |
| Trading Companies & Distributors 2.2% | ||
| Watsco, Inc. | 11,900 | 2,695,945 |
| Total Industrials | 12,776,777 | |
| Information Technology 29.1% | ||
| IT Services 4.0% | ||
| GoDaddy, Inc., Class A(a) | 58,833 | 4,880,197 |
| Semiconductors & Semiconductor Equipment 4.9% | ||
| Teradyne, Inc. | 49,700 | 5,958,533 |
| Software 20.2% | ||
| Alteryx, Inc., Class A(a) | 23,258 | 2,832,592 |
| Blackline, Inc.(a) | 30,100 | 4,014,738 |
| Cadence Design Systems, Inc.(a) | 32,741 | 4,466,855 |
| Elastic NV(a) | 29,825 | 4,358,327 |
| Mimecast Ltd.(a) | 99,050 | 5,630,002 |
| Qualys, Inc.(a) | 26,593 | 3,240,889 |
| Total | 24,543,403 | |
| Total Information Technology | 35,382,133 | |
| 8 | Wanger Select | Annual Report 2020 |
December 31, 2020
| Common Stocks (continued) | ||
| Issuer | Shares | Value ($) |
| Materials 7.2% | ||
| Chemicals 3.6% | ||
| Avient Corp. | 108,100 | 4,354,268 |
| Containers & Packaging 3.6% | ||
| Avery Dennison Corp. | 28,100 | 4,358,591 |
| Total Materials | 8,712,859 | |
| Total Common Stocks (Cost $88,826,843) | 121,367,981 | |
| Money Market Funds 0.6% | ||
| Shares | Value ($) | |
| Columbia Short-Term Cash Fund, 0.107%(b),(c) | 736,356 | 736,282 |
| Total Money Market Funds (Cost $736,282) | 736,282 | |
| Total Investments in Securities (Cost: $89,563,125) | 122,104,263 | |
| Other Assets & Liabilities, Net | (452,902) | |
| Net Assets | 121,651,361 | |
| (a) | Non-income producing investment. |
| (b) | The rate shown is the seven-day current annualized yield at December 31, 2020. |
| (c) | As defined in the Investment Company Act of 1940, an affiliated company is one in which the Fund owns 5% or more of the company’s outstanding voting securities, or a company which is under common ownership or control with the Fund. The value of the holdings and transactions in these affiliated companies during the year ended December 31, 2020 are as follows: |
| Affiliated issuers | Beginning of period($) | Purchases($) | Sales($) | Net change in unrealized appreciation (depreciation)($) | End of period($) | Realized gain (loss)($) | Dividends($) | End of period shares |
| Columbia Short-Term Cash Fund, 0.107% | ||||||||
| 2,808,242 | 48,678,531 | (50,750,491) | — | 736,282 | 1,690 | 16,716 | 736,356 | |
| ■ | Level 1 – quoted prices in active markets for identical securities |
| ■ | Level 2 – prices determined using other significant observable inputs (including quoted prices for similar securities, interest rates, prepayment speeds, credit risk and others) |
| ■ | Level 3 – prices determined using significant unobservable inputs where quoted prices or observable inputs are unavailable or less reliable (including management’s own assumptions about the factors market participants would use in pricing an investment) |
| Wanger Select | Annual Report 2020 | 9 |
December 31, 2020
The following table is a summary of the inputs used to value the Fund’s investments at December 31, 2020:
| Level 1 ($) | Level 2 ($) | Level 3 ($) | Total ($) | |
| Investments in Securities | ||||
| Common Stocks | ||||
| Communication Services | 7,810,491 | — | — | 7,810,491 |
| Consumer Discretionary | 17,857,340 | — | — | 17,857,340 |
| Consumer Staples | 2,497,760 | — | — | 2,497,760 |
| Financials | 3,172,062 | — | — | 3,172,062 |
| Health Care | 33,158,559 | — | — | 33,158,559 |
| Industrials | 12,776,777 | — | — | 12,776,777 |
| Information Technology | 35,382,133 | — | — | 35,382,133 |
| Materials | 8,712,859 | — | — | 8,712,859 |
| Total Common Stocks | 121,367,981 | — | — | 121,367,981 |
| Money Market Funds | 736,282 | — | — | 736,282 |
| Total Investments in Securities | 122,104,263 | — | — | 122,104,263 |
| 10 | Wanger Select | Annual Report 2020 |
December 31, 2020
| Assets | |
| Investments in securities, at value | |
| Unaffiliated issuers (cost $88,826,843) | $121,367,981 |
| Affiliated issuers (cost $736,282) | 736,282 |
| Receivable for: | |
| Dividends | 45,762 |
| Expense reimbursement due from Investment Manager | 91 |
| Prepaid expenses | 2,879 |
| Total assets | 122,152,995 |
| Liabilities | |
| Payable for: | |
| Capital shares purchased | 346,610 |
| Investment advisory fee | 2,006 |
| Service fees | 44,529 |
| Administration fees | 167 |
| Trustees’ fees | 72,531 |
| Compensation of chief compliance officer | 218 |
| Other expenses | 35,573 |
| Total liabilities | 501,634 |
| Net assets applicable to outstanding capital stock | $121,651,361 |
| Represented by | |
| Paid in capital | 76,137,265 |
| Total distributable earnings (loss) | 45,514,096 |
| Total - representing net assets applicable to outstanding capital stock | $121,651,361 |
| Shares outstanding | 5,958,875 |
| Net asset value per share | 20.42 |
| Wanger Select | Annual Report 2020 | 11 |
Year Ended December 31, 2020
| Net investment income | |
| Income: | |
| Dividends — unaffiliated issuers | $360,700 |
| Dividends — affiliated issuers | 16,716 |
| Income from securities lending — net | 735 |
| Total income | 378,151 |
| Expenses: | |
| Investment advisory fee | 862,618 |
| Service fees | 193,763 |
| Administration fees | 53,914 |
| Trustees’ fees | 23,151 |
| Custodian fees | 2,999 |
| Printing and postage fees | 48,864 |
| Audit fees | 32,938 |
| Legal fees | 23,040 |
| Line of credit interest | 35 |
| Compensation of chief compliance officer | 460 |
| Other | 12,324 |
| Total expenses | 1,254,106 |
| Fees waived or expenses reimbursed by Investment Manager and its affiliates | (67,118) |
| Fees waived by transfer agent | (13,891) |
| Advisory fee waiver | (215,655) |
| Total net expenses | 957,442 |
| Net investment loss | (579,291) |
| Realized and unrealized gain (loss) — net | |
| Net realized gain (loss) on: | |
| Investments — unaffiliated issuers | 14,060,376 |
| Investments — affiliated issuers | 1,690 |
| Net realized gain | 14,062,066 |
| Net change in unrealized appreciation (depreciation) on: | |
| Investments — unaffiliated issuers | 11,670,224 |
| Net change in unrealized appreciation (depreciation) | 11,670,224 |
| Net realized and unrealized gain | 25,732,290 |
| Net increase in net assets resulting from operations | $25,152,999 |
| 12 | Wanger Select | Annual Report 2020 |
| Year Ended December 31, 2020 | Year Ended December 31, 2019 | |
| Operations | ||
| Net investment loss | $(579,291) | $(160,769) |
| Net realized gain | 14,062,066 | 12,991,245 |
| Net change in unrealized appreciation (depreciation) | 11,670,224 | 16,185,697 |
| Net increase in net assets resulting from operations | 25,152,999 | 29,016,173 |
| Distributions to shareholders | ||
| Net investment income and net realized gains | (13,024,104) | (15,116,774) |
| Total distributions to shareholders | (13,024,104) | (15,116,774) |
| Decrease in net assets from capital stock activity | (7,156,817) | (3,688,845) |
| Total increase in net assets | 4,972,078 | 10,210,554 |
| Net assets at beginning of year | 116,679,283 | 106,468,729 |
| Net assets at end of year | $121,651,361 | $116,679,283 |
| Year Ended | Year Ended | |||
| December 31, 2020 | December 31, 2019 | |||
| Shares | Dollars ($) | Shares | Dollars ($) | |
| Capital stock activity | ||||
| Subscriptions | 200,527 | 3,552,084 | 103,393 | 1,824,654 |
| Distributions reinvested | 788,384 | 13,024,104 | 934,288 | 15,116,774 |
| Redemptions | (1,408,832) | (23,733,005) | (1,181,971) | (20,630,273) |
| Total net decrease | (419,921) | (7,156,817) | (144,290) | (3,688,845) |
| Wanger Select | Annual Report 2020 | 13 |
| Year Ended December 31, | |||||
| 2020 | 2019 | 2018 | 2017 | 2016 | |
| Per share data | |||||
| Net asset value, beginning of period | $18.29 | $16.32 | $20.84 | $19.10 | $24.18 |
| Income from investment operations: | |||||
| Net investment income (loss) | (0.09) | (0.02) | 0.07 | 0.04 | 0.03 |
| Net realized and unrealized gain (loss) | 4.44 | 4.48 | (2.15) | 4.62 | 2.48 |
| Total from investment operations | 4.35 | 4.46 | (2.08) | 4.66 | 2.51 |
| Less distributions to shareholders from: | |||||
| Net investment income | (0.14) | (0.02) | (0.04) | (0.03) | (0.03) |
| Net realized gains | (2.08) | (2.47) | (2.40) | (2.89) | (7.56) |
| Total distributions to shareholders | (2.22) | (2.49) | (2.44) | (2.92) | (7.59) |
| Net asset value, end of period | $20.42 | $18.29 | $16.32 | $20.84 | $19.10 |
| Total return(a) | 26.65% | 29.30% | (12.41)% | 26.67% | 13.31% |
| Ratios to average net assets | |||||
| Total gross expenses(b) | 1.16%(c) | 1.15% | 1.10% | 1.05% | 0.93%(d) |
| Total net expenses(b) | 0.89%(c) | 0.88% | 0.78% | 0.77% | 0.73%(d) |
| Net investment income (loss) | (0.54)% | (0.14)% | 0.34% | 0.19% | 0.17% |
| Supplemental data | |||||
| Portfolio turnover | 109% | 152% | 66% | 52% | 93% |
| Net assets, end of period (in thousands) | $121,651 | $116,679 | $106,469 | $141,213 | $125,500 |
| Notes to Financial Highlights | |
| (a) | Had the Investment Manager and/or its affiliates not waived a portion of expenses, total return would have been reduced. |
| (b) | In addition to the fees and expenses that the Fund bears directly, the Fund indirectly bears a pro rata share of the fees and expenses of any other funds in which it invests, if any. Such indirect expenses are not included in the Fund’s reported expense ratios. |
| (c) | Ratios include line of credit interest expense which is less than 0.01%. |
| (d) | Expenses have been reduced due to a reimbursement of expenses overbilled by a third party. If the reimbursement had been excluded, the expense ratios would have been higher by 0.03%. All fee waivers and expense reimbursements by the Investment Manager and its affiliates were applied before giving effect to this third party reimbursement. |
| 14 | Wanger Select | Annual Report 2020 |
December 31, 2020
| Wanger Select | Annual Report 2020 | 15 |
December 31, 2020
| 16 | Wanger Select | Annual Report 2020 |
December 31, 2020
| Average daily net assets | Annual fee rate |
| Up to $500 million | 0.80% |
| $500 million and over | 0.78% |
| Aggregate average daily net assets of the Trust | Annual fee rate |
| Up to $4 billion | 0.05% |
| $4 billion to $6 billion | 0.04% |
| $6 billion to $8 billion | 0.03% |
| $8 billion and over | 0.02% |
| Wanger Select | Annual Report 2020 | 17 |
December 31, 2020
| 18 | Wanger Select | Annual Report 2020 |
December 31, 2020
| Excess of distributions over net investment income ($) | Accumulated net realized gain ($) | Paid in capital ($) |
| 818,870 | (818,870) | — |
| Year Ended December 31, 2020 | Year Ended December 31, 2019 | ||||
| Ordinary income ($) | Long-term capital gains ($) | Total ($) | Ordinary income ($) | Long-term capital gains ($) | Total ($) |
| 822,159 | 12,201,945 | 13,024,104 | 2,097,499 | 13,019,275 | 15,116,774 |
| Undistributed ordinary income ($) | Undistributed long-term capital gains ($) | Capital loss carryforwards ($) | Net unrealized appreciation ($) |
| 3,653,626 | 9,391,701 | — | 32,541,138 |
| Federal tax cost ($) | Gross unrealized appreciation ($) | Gross unrealized (depreciation) ($) | Net unrealized appreciation ($) |
| 89,563,125 | 33,835,346 | (1,294,208) | 32,541,138 |
| Wanger Select | Annual Report 2020 | 19 |
December 31, 2020
| Average loan balance ($) | Weighted average interest rate (%) | Days outstanding |
| 333,333 | 1.23 | 3 |
| 20 | Wanger Select | Annual Report 2020 |
December 31, 2020
| Wanger Select | Annual Report 2020 | 21 |
December 31, 2020
| 22 | Wanger Select | Annual Report 2020 |
| Wanger Select | Annual Report 2020 | 23 |
| Dividends received deduction | Capital gain dividend |
| 82.60% | $9,870,548 |
Shareholder Services Group
71 S Wacker Drive, Suite 2500
Chicago, IL 60606
800.922.6769
| Name and age at December 31, 2020 | Year first appointed or elected to a Board in the Columbia Funds Complex | Principal occupation(s) during the past five years | Number of Funds in the Columbia Funds Complex overseen (1) | Other directorships held by the Trustee during the past five years in addition to Columbia Acorn Trust and Wanger Advisors Trust |
| Laura M. Born, 55, Chair* | 2007 | Adjunct Professor of Finance, University of Chicago Booth School of Business since 2007; Advisory Board Member, Driehaus Capital Management since 2018; Director and Audit Committee Chair, Carlson Inc. (private global travel company) since 2015; Managing Director – Investment Banking, JP Morgan Chase & Co. (broker-dealer) 2002-2007. | 9 | None. |
| 24 | Wanger Select | Annual Report 2020 |
Independent trustees (continued)
| Name and age at December 31, 2020 | Year first appointed or elected to a Board in the Columbia Funds Complex | Principal occupation(s) during the past five years | Number of Funds in the Columbia Funds Complex overseen (1) | Other directorships held by the Trustee during the past five years in addition to Columbia Acorn Trust and Wanger Advisors Trust |
| Maureen M. Culhane, 72 | 2007 | Retired. Formerly, Vice President, Goldman Sachs Asset Management, L.P. (investment adviser), 2005-2007; Vice President (Consultant) – Strategic Relationship Management, Goldman, Sachs & Co., 1999-2005. | 9 | None. |
| Margaret M. Eisen, 67 | 2002 | Trustee, Smith College, 2012-2016; Chief Investment Officer, EAM International LLC (corporate finance and asset management), 2003-2013; Managing Director, CFA Institute, 2005-2008. | 9 | Chair, RMB Investors Trust (9 series). |
| John C. Heaton, 61 | 2010 | Joseph L. Gidwitz Professor of Finance, University of Chicago Booth School of Business since July 2000; Deputy Dean for Faculty, University of Chicago Booth School of Business, 2012-2019. | 9 | None. |
| Charles R. Phillips, 64 | 2015 | Retired. Formerly, Vice Chairman, J.P. Morgan Private Bank, 2011-2014; Managing Director, J.P. Morgan Private Bank, 2001-2011; Managing Director, J.P. Morgan Private Bank, 2001-2011. | 9 | None. |
| David J. Rudis, 67, Vice Chair* | 2010 | Chief Executive Officer, Finger Rock, LLC (strategic consulting business). Formerly, National Checking and Debit Executive, and Illinois President, Bank of America, 2007-2009; President, Consumer Banking Group, LaSalle National Bank, 2004-2007. | 9 | None. |
| Name and age at December 31, 2020 | Year first appointed or elected to a Board in the Columbia Funds Complex | Principal occupation(s) during the past five years | Number of Funds in the Columbia Funds Complex overseen (1) | Other directorships held by the Trustee during the past five years in addition to Columbia Acorn Trust and Wanger Advisors Trust |
| Ralph Wanger, 86 (2) | 1970 (3) | Founder, CWAM. Formerly, President, Chief Investment Officer and portfolio manager, CWAM or its predecessors, July 1992-September 2003; Director, Wanger Investment Company PLC; Consultant, CWAM or its predecessors, September 2003-September 2005. | 9 | None. |
| * | On December 10, 2020, the Board of Trustees appointed Mr. Rudis as Chair, effective January 1, 2021. |
| (1) | The Trustees oversee the series of Wanger Advisors Trust and Columbia Acorn Trust. |
| (2) | As permitted under the Trust’s Bylaws, Mr. Wanger serves as a non-voting Trustee Emeritus of Columbia Acorn Trust and Wanger Advisors Trust. Prior to September 2009, Mr. Wanger served as an “interested” trustee of the Columbia Acorn Trust and Wanger Advisors Trust. Mr. Wanger was considered an “interested person” of the Trusts and of CWAM within the meaning of the 1940 Act because of certain ownership interests. |
| (3) | Dates prior to April 1992 correspond to the date first elected as a director of The Acorn Fund, Inc., the Trust’s predecessor. |
| Wanger Select | Annual Report 2020 | 25 |
| Name and age at December 31, 2020 | Position held with Columbia Acorn Trust and Wanger Advisors Trust | Year first appointed or elected to office | Principal occupation(s) during the past five years |
| Michael G. Clarke, 50 | Assistant Treasurer* | 2004 | Vice President, Head of North American Operations, and Tax Co-Head of Global Operations, Columbia Management since June 2019 (previously Vice President, Accounting and Tax, May 2010-May 2019); senior officer of Columbia Funds and affiliated funds since 2002. |
| John L. Emerson, 45 | Vice President | 2020 | Portfolio manager and/or analyst, CWAM or its predecessors since 2003. |
| Paul B. Goucher, 51 | Assistant Secretary | 2015 | Senior Vice President and Assistant General Counsel, Ameriprise Financial, Inc. since January 2017 (previously Vice President and Lead Chief Counsel, November 2008 - January 2017 and January 2013 - January 2017, respectively); Vice President, Chief Legal Officer and Assistant Secretary, Columbia Management Investment Advisers, LLC since March 2015. |
| Tae Han (Simon) Kim, 39 | Vice President | 2018 | Portfolio manager and/or analyst, CWAM since 2011. |
| Stephen Kusmierczak, 53 | Co-President | 2011 | Portfolio manager and/or analyst, CWAM or its predecessors since 2001. Vice President, Columbia Acorn Trust and Wanger Advisors Trust, 2011 - 2020. |
| Joseph C. LaPalm, 50 | Vice President | 2006 | Chief Compliance Officer, CWAM since 2005. |
| Ryan C. Larrenaga, 49 | Chief Legal Officer and Assistant Secretary | 2015 | Vice President and Chief Counsel, Ameriprise Financial, Inc. since August 2018 (previously, Vice President and Group Counsel, August 2011 - August 2018); officer of Columbia Funds and affiliated funds since 2005. |
| Matthew A. Litfin, 48 | Co-President | 2019 | Director of Research (U.S.) and portfolio manager, CWAM since December 2015; Vice President, Columbia Acorn Trust and Wanger Advisors Trust, 2016 - March 2019; formerly, portfolio manager, William Blair & Company 1993-2015. |
| Erika K. Maschmeyer, 39 | Vice President | 2020 | Portfolio manager and/or analyst, CWAM or its predecessors since 2016. |
| Thomas P. McGuire, 47 | Chief Compliance Officer | 2015 | Senior Vice President and Chief Compliance Officer of the Columbia Funds since 2012; Vice President – Asset Management Compliance, Ameriprise Financial, Inc., since May 2010; Chief Compliance Officer, Ameriprise Certificate Company since September 2010. |
| Julian Quero, 53 | Assistant Treasurer | 2015 | Vice President – Tax, Columbia Management Investment Advisers, LLC since 2009. |
| Martha A. Skinner, 45 | Assistant Treasurer | 2016 | Vice President of Financial Reporting and Administration, Columbia Management since November 2015; Director of Financial Reporting, Columbia Management, April 2013-November 2015. |
| Hans F. Stege, 36 | Vice President | 2020 | Portfolio manager and/or analyst, CWAM or its predecessors since 2017. |
| Richard Watson, 51 | Vice President | 2018 | Portfolio manager and/or analyst, CWAM or its predecessors since 2006. |
| Linda Roth-Wiszowaty, 50 | Secretary | 2006 | Business support analyst, CWAM since April 2007. |
| * | On December 10, 2020, the Board of Trustees appointed Mr. Clarke as the Treasurer and Principal Accounting and Financial Officer of the Trust, effective January 1, 2021. |
| 26 | Wanger Select | Annual Report 2020 |
Item 2. Code of Ethics.
(a)The registrant has adopted a code of ethics that applies to the registrant's principal executive officer, principal financial officer, principal accounting officer or controller, or persons performing similar functions, regardless of whether these individuals are employed by the registrant or a third party.
(b)During the period covered by this report, there were not any amendments to a provision of the code of ethics that applies to the registrant's principal executive officer, principal financial officer, principal accounting officer or controller, or persons performing similar functions, regardless of whether these individuals are employed by the registrant or a third party, and that relates to any element of the code of ethics definition enumerated in paragraph (b) of this Item.
(c)During the period covered by this report, there were no waivers, including any implicit waivers, from a provision of the code of ethics to the registrant's principal executive officer, principal financial officer, principal accounting officer or controller, or persons performing similar functions, regardless of whether these individuals are employed by the registrant or a third party that relates to one or more of the items set forth in paragraph (b) of this Item.
Item 3. Audit Committee Financial Expert.
The registrant's Board of Trustees has determined that Maureen Culhane, a member of the registrant's Board of Trustees and Audit Committee, qualifies as an audit committee financial expert. Ms. Culhane is an independent trustee, as defined in paragraph (a)(2) of this item's instructions
Item 4. Principal Accountant Fees and Services.
Fee information below is disclosed for the three series of the registrant whose reports to stockholders are included in this annual filing.
(a)Audit Fees. Aggregate Audit Fees billed by the principal accountant for professional services rendered during the fiscal years ended December 31, 2020 and December 31,
2019 are approximately as follows:
2020 | 2019 |
$88,500 | $87,000 |
Audit Fees include amounts related to the audit of the registrant's annual financial statements or services that are normally provided by the accountant in connection with statutory and regulatory filings or engagements for those fiscal years.
(b)Audit-Related Fees. Aggregate Audit-Related Fees billed to the registrant by the principal accountant for professional services rendered during the fiscal years ended December 31, 2020 and December 31, 2019 are approximately as follows:
2020 | 2019 |
$7,000 | $7,000 |
Audit-Related Fees include amounts for assurance and related services by the principal accountant that are reasonably related to the performance of the audit of the registrant's financial statements and are not reported in Audit Fees above. In both fiscal years 2020 and 2019, Audit-Related Fees consist of agreed-upon procedures performed for other audit-related additional testing.
During the fiscal years ended December 31, 2020 and December 31, 2019, there were no Audit-Related Fees billed by the registrant's principal accountant to the registrant's investment adviser (not including any sub-adviser whose role is primarily portfolio management and is subcontracted with or overseen by another investment adviser) and any entity controlling, controlled by, or under common control with the adviser that provides ongoing services to the registrant for an engagement that related directly to the operations and financial reporting of the registrant.
(c)Tax Fees. Aggregate Tax Fees billed by the principal accountant to the registrant for professional services rendered during the fiscal years ended December 31, 2020 and December 31, 2019 are approximately as follows:
2020 | 2019 |
$0 | $25,800 |
Tax Fees incurred in both fiscal years 2020 and 2019 relate to the review of annual tax returns, the review of required shareholder distribution calculations and include amounts for professional services by the principal accountant for tax compliance, tax advice and tax planning. Fiscal year 2019 also includes Tax Fees for foreign tax filings.
During the fiscal years ended December 31, 2020 and December 31, 2019, there were no Tax Fees billed by the registrant's principal accountant to the registrant's investment adviser (not including any sub-adviser whose role is primarily portfolio management and is subcontracted with or overseen by another investment adviser) and any entity controlling, controlled by, or under common control with the adviser that provides ongoing services to the registrant for an engagement that related directly to the operations and financial reporting of the registrant.
(d)All Other Fees. Aggregate All Other Fees billed by the principal accountant to the registrant for professional services rendered during the fiscal years ended December 31,
2020 and December 31, 2019 are as follows:
2020 | 2019 |
$0 | $0 |
All Other Fees include amounts for products and services provided by the principal accountant, other than the services reported in paragraphs (a) through (c) above. Aggregate All Other Fees billed by the registrant's principal accountant to the registrant's investment adviser (not including any sub-adviser whose role is primarily portfolio management and is subcontracted with or overseen by another investment adviser) and any entity controlling, controlled by, or under common control with the adviser that provides ongoing services to the registrant for an engagement that related directly to the operations and financial reporting of the registrant during the fiscal years ended December 31, 2020 and December 31, 2019 are approximately as follows:
2020 | 2019 |
$225,000 | $225,000 |
In both fiscal years 2020 and 2019, All Other Fees primarily consist of professional services rendered for internal control reviews.
(e)(1) Audit Committee Pre-Approval Policies and Procedures
The policy of the registrant's Audit Committee is to specifically pre-approve (i) all audit and non-audit (including audit related, tax and all other) services provided by the registrant's independent auditor to the registrant and individual funds (collectively "Fund Services") and (ii) all non-audit services provided by the registrant's independent auditor to the funds' adviser or a control affiliate of the adviser, that relate directly to the funds' operations and financial reporting (collectively "Fund-related Adviser Services"). A "control affiliate" is an entity controlling, controlled by, or under common control with the adviser that provides ongoing services to the funds, and the term "adviser" is deemed to exclude any unaffiliated sub-adviser whose role is primarily portfolio management and is sub-contracted or overseen by another investment adviser.
If such Fund Services or Fund-related Adviser Services are required during the period between the Audit Committee's regularly scheduled meetings, the Chairman of the Audit Committee has the authority to pre-approve the service, with reporting to the full Audit Committee at the next regularly scheduled meeting.
The Audit Committee will waive pre-approval of Fund Services or Fund-related Adviser Services provided that the requirements under paragraph (c)(7)(i)(C) of Rule 2-01 of Regulation S-X are met.
(e)(2) None, or 0%, of the Audit-Related Fees, Tax Fees and All Other Fees paid by the Fund or affiliated entities relating directly to the operations and financial reporting of the Registrant disclosed above were approved by the audit committee pursuant to paragraphs (c)(7)(i)(C) of Rule 2-01 of Regulation S-X (which permits audit committee approval after the start of the engagement with respect to services other than audit, review or attest services, if certain conditions are satisfied).
(f)Not applicable.
(g)The aggregate non-audit fees billed by the registrant's accountant for services rendered to the registrant, and rendered to the registrant's investment adviser (not including any sub-adviser whose role is primarily portfolio management and is subcontracted with or overseen by another investment adviser), and any entity controlling, controlled by, or under common control with the adviser that provides ongoing services to the registrant for the fiscal years ended December 31, 2020 and December 31, 2019 are approximately as follows:
2020 | 2019 |
$232,000 | $257,800 |
(h)The registrant's Audit Committee of the Board of Directors has considered whether the provision of non-audit services that were rendered to the registrant's adviser (not including any sub-adviser whose role is primarily portfolio management and is subcontracted with or overseen by another investment adviser), and any entity controlling, controlled by, or under common control with the investment adviser that provides ongoing services to the registrant that were not pre-approved pursuant to paragraph (c)(7)(ii) of Rule 2-01 of Regulation S-X, is compatible with maintaining the principal accountant's independence.
Item 5. Audit Committee of Listed Registrants.
Not applicable.
Item 6. Investments
(a)The registrant's "Schedule I – Investments in securities of unaffiliated issuers" (as set forth in 17 CFR 210.12-12) is included in Item 1 of this Form N-CSR.
(b)Not applicable
Item 7. Disclosure of Proxy Voting Policies and Procedures for Closed-End Management Investment Companies.
Not applicable.
Item 8. Portfolio Managers of Closed-End Management Investment Companies.
Not applicable.
Item 9. Purchases of Equity Securities by Closed-End Management Investment Company and Affiliated Purchasers.
Not applicable.
Item 10. Submission of Matters to a Vote of Security Holders.
There were no material changes to the procedures by which shareholders may recommend nominees to the registrant's board of directors.
Item 11. Controls and Procedures.
(a)The registrant's principal executive officer and principal financial officer, based on their evaluation of the registrant's disclosure controls and procedures as of a date within 90 days of the filing of this report, have concluded that such controls and procedures are adequately designed to ensure that information required to be disclosed by the registrant in Form N-CSR is accumulated and communicated to the registrant's management, including the principal executive officer and principal financial officer, or persons performing similar functions, as appropriate to allow timely decisions regarding required disclosure.
(b)There was no change in the registrant's internal control over financial reporting that occurred during the period covered by this report that has materially affected, or is reasonably likely to materially affect, the registrant's internal control over financial reporting.
Item 12. Disclosure of Securities Lending Activities for Closed-End Management Investment Companies
Not applicable.
Item 13. Exhibits.
(a)(3) Not applicable.
SIGNATURES
Pursuant to the requirements of the Securities Exchange Act of 1934 and the Investment Company Act of 1940, the registrant has duly caused this report to be signed on its behalf by the undersigned, thereunto duly authorized.
(registrant) |
| Wanger Advisors Trust |
| ||
By (Signature and Title) | /s/ Matthew A. Litfin | ||||
|
|
|
|
|
|
|
|
|
| Matthew A. Litfin, Co-President and Principal Executive Officer | |
Date |
| February 22, 2021 |
| ||
Pursuant to the requirements of the Securities Exchange Act of 1934 and the Investment Company Act of 1940, this report has been signed below by the following persons on behalf of the registrant and in the capacities and on the dates indicated.
By (Signature and Title) | /s/ Matthew A. Litfin | ||||
|
|
|
|
|
|
|
|
| Matthew A. Litfin, Co-President and Principal Executive Officer | ||
Date |
| February 22, 2021 |
| ||
By (Signature and Title) | /s/ Michael G. Clarke | ||||
|
|
|
|
| |
|
|
| Michael G. Clarke, Treasurer and Principal Accounting and Financial | ||
|
|
| Officer | ||
Date |
| February 22, 2021 |
| ||