UNITED STATES
SECURITIES AND EXCHANGE COMMISSION
FORM N-CSR
CERTIFIED SHAREHOLDER REPORT OF REGISTERED MANAGEMENT INVESTMENT COMPANIES
Investment Company Act file number 811-08748
Wanger Advisors Trust
(Exact name of registrant as specified in charter)
71 S Wacker Dr.
Suite 2500
Chicago, IL 60606, USA
(Address of principal executive offices) (Zip code)
Ryan C. Larrenaga
c/o Columbia Management
Investment Advisers, LLC
225 Franklin Street
Boston, MA 02110
Louis Mendes
Wanger Advisors Trust
71 S Wacker Dr.
Suite 2500
Chicago, IL 60606, USA
Mary C. Moynihan
Perkins Coie LLP
700 13th Street, NW
Suite 800
Washington, DC 20005
(Name and address of agent for service)
Registrant's telephone number, including area code: (312) 634-9200
Date of fiscal year end: December 31
Date of reporting period: December 31, 2019
Form N-CSR is to be used by management investment companies to file reports with the Commission not later than 10 days after the transmission to stockholders of any report that is required to be transmitted to stockholders under Rule 30e-1 under the Investment Company Act of 1940 (17 CFR 270.30e-1). The Commission may use the information provided on Form N-CSR in its regulatory, disclosure review, inspection, and policymaking roles.
A registrant is required to disclose the information specified by Form N-CSR, and the Commission will make this information public. A registrant is not required to respond to the collection of information contained in Form N-CSR unless the Form displays a currently valid Office of Management and Budget ("OMB") control number. Please direct comments concerning the accuracy of the information collection burden estimate and any suggestions for reducing the burden to Secretary, Securities and Exchange Commission, 100 F Street, NE, Washington, DC 20549. The OMB has reviewed this collection of information under the clearance requirements of 44 U.S.C. § 3507.
Item 1. Reports to Stockholders.

December 31, 2019

| 3 | |
| 5 | |
| 7 | |
| 8 | |
| 14 | |
| 15 | |
| 16 | |
| 17 | |
| 18 | |
| 25 | |
| 26 | |
| 26 |
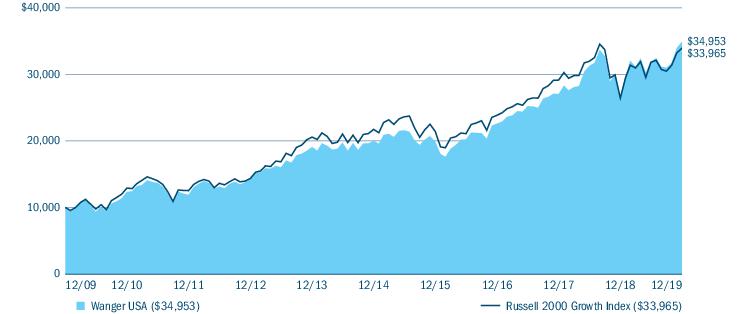
| Average annual total returns (%) (for the period ended December 31, 2019) | ||||||
| Inception | 1 Year | 5 Years | 10 Years | Life | ||
| Wanger USA | 05/03/95 | 31.10 | 11.79 | 13.33 | 12.00 | |
| Russell 2000 Growth Index | 28.48 | 9.34 | 13.01 | - | ||
| Wanger USA | Annual Report 2019 | 3 |
| Portfolio breakdown (%) (at December 31, 2019) | |
| Common Stocks | 93.5 |
| Limited Partnerships | 1.5 |
| Money Market Funds | 4.5 |
| Securities Lending Collateral | 0.5 |
| Total | 100.0 |
| Equity sector breakdown (%) (at December 31, 2019) | |
| Consumer Discretionary | 14.4 |
| Consumer Staples | 4.3 |
| Energy | 1.1 |
| Financials | 9.9 |
| Health Care | 27.8 |
| Industrials | 17.4 |
| Information Technology | 18.5 |
| Materials | 2.5 |
| Real Estate | 4.1 |
| Total | 100.0 |
| 4 | Wanger USA | Annual Report 2019 |


| Wanger USA | Annual Report 2019 | 5 |
| 6 | Wanger USA | Annual Report 2019 |
(Unaudited)
| July 1, 2019 — December 31, 2019 | |||||||
| Account value at the beginning of the period ($) | Account value at the end of the period ($) | Expenses paid during the period ($) | Fund’s annualized expense ratio (%) | ||||
| Actual | Hypothetical | Actual | Hypothetical | Actual | Hypothetical | Actual | |
| Wanger USA | 1,000.00 | 1,000.00 | 1,094.90 | 1,019.87 | 5.87 | 5.66 | 1.10 |
| Wanger USA | Annual Report 2019 | 7 |
December 31, 2019
| Common Stocks 94.0% | ||
| Issuer | Shares | Value ($) |
| Consumer Discretionary 12.2% | ||
| Auto Components 3.0% | ||
| Dorman Products, Inc.(a) Automotive products and home hardware | 86,854 | 6,576,585 |
| LCI Industries Recreational vehicles and equipment | 54,467 | 5,835,050 |
| Visteon Corp.(a) Automotive systems, modules and components | 84,462 | 7,313,564 |
| Total | 19,725,199 | |
| Hotels, Restaurants & Leisure 5.4% | ||
| Churchill Downs, Inc. Horse racing company, home of the Kentucky Derby | 64,682 | 8,874,370 |
| Dave & Buster’s Entertainment, Inc. Venues that combine dining and entertainment for adults and families | 171,912 | 6,905,705 |
| Extended Stay America, Inc. Hotels and motels | 363,491 | 5,401,476 |
| Red Rock Resorts, Inc., Class A Casino & entertainment properties | 356,666 | 8,542,151 |
| Wendy’s Co. (The) Fast-food restaurants | 276,375 | 6,138,289 |
| Total | 35,861,991 | |
| Household Durables 2.1% | ||
| Helen of Troy Ltd.(a) Brand-name hair and comfort products | 48,068 | 8,642,146 |
| Skyline Champion Corp.(a) Factory-built housing | 174,464 | 5,530,509 |
| Total | 14,172,655 | |
| Leisure Products 0.6% | ||
| Brunswick Corp. Consumer products serving the outdoor and indoor active recreation markets | 68,841 | 4,129,083 |
| Specialty Retail 1.1% | ||
| Boot Barn Holdings, Inc.(a) Western and work gear | 171,410 | 7,632,887 |
| Total Consumer Discretionary | 81,521,815 | |
| Consumer Staples 4.1% | ||
| Beverages 0.7% | ||
| Cott Corp. Route based service provider | 353,955 | 4,842,105 |
| Common Stocks (continued) | ||
| Issuer | Shares | Value ($) |
| Food & Staples Retailing 0.8% | ||
| BJ’s Wholesale Club Holdings, Inc.(a) Warehouse club | 233,149 | 5,301,808 |
| Food Products 0.6% | ||
| Calavo Growers, Inc. Avocados and other perishable foods | 40,364 | 3,656,575 |
| Household Products 1.3% | ||
| WD-40 Co. Multi-purpose lubricant products and heavy-duty hand cleaners | 43,949 | 8,532,259 |
| Personal Products 0.7% | ||
| Inter Parfums, Inc. Fragrances and related products | 65,937 | 4,794,279 |
| Total Consumer Staples | 27,127,026 | |
| Energy 1.1% | ||
| Energy Equipment & Services 0.6% | ||
| Core Laboratories NV Reservoir description, production enhancement, and reservoir management services | 101,083 | 3,807,797 |
| Oil, Gas & Consumable Fuels 0.5% | ||
| Callon Petroleum Co.(a) Independent energy company | 710,000 | 3,429,300 |
| Total Energy | 7,237,097 | |
| Financials 9.5% | ||
| Banks 2.9% | ||
| Bank of NT Butterfield & Son Ltd. (The) Community bank and specialized international financial services | 129,685 | 4,800,938 |
| Lakeland Financial Corp. Bank holding company | 124,329 | 6,083,418 |
| OFG Bancorp Holding company for Oriental Bank | 150,500 | 3,553,305 |
| Trico Bancshares Holding company for Tri Counties Bank | 126,138 | 5,147,692 |
| Total | 19,585,353 | |
| Capital Markets 1.4% | ||
| Houlihan Lokey, Inc. Investment bank | 190,449 | 9,307,243 |
| 8 | Wanger USA | Annual Report 2019 |
December 31, 2019
| Common Stocks (continued) | ||
| Issuer | Shares | Value ($) |
| Consumer Finance 1.1% | ||
| FirstCash, Inc. Owns and operates pawn stores | 92,073 | 7,423,846 |
| Insurance 0.6% | ||
| Palomar Holdings, Inc.(a) Insurance services | 73,017 | 3,686,628 |
| Thrifts & Mortgage Finance 3.5% | ||
| Merchants Bancorp Bank holding company | 478,248 | 9,426,268 |
| Walker & Dunlop, Inc. Commercial real estate financial services | 211,532 | 13,681,890 |
| Total | 23,108,158 | |
| Total Financials | 63,111,228 | |
| Health Care 26.6% | ||
| Biotechnology 10.5% | ||
| Agios Pharmaceuticals, Inc.(a) Therapeutics in the field of cancer metabolism | 140,958 | 6,730,744 |
| Anika Therapeutics, Inc.(a) Integrated orthopedic medicines company | 141,921 | 7,358,604 |
| Argenx SE, ADR(a) Anitbody based therapies | 48,857 | 7,842,526 |
| Fate Therapeutics, Inc.(a) Biotechnology services | 355,180 | 6,950,873 |
| Immunomedics, Inc.(a) Diagnostic imaging and therapeutic products | 457,720 | 9,685,355 |
| Insmed, Inc.(a) Biopharmaceuticals focused on rare diseases | 270,000 | 6,447,600 |
| Intercept Pharmaceuticals, Inc.(a) Biopharmaceutical products | 64,181 | 7,953,310 |
| Kiniksa Pharmaceuticals Ltd., Class A(a) Clinical-stage biopharmaceutical company | 632,703 | 6,997,695 |
| MacroGenics, Inc.(a) Treatments for autoimmune disorders, cancer and infectious diseases | 612,240 | 6,661,171 |
| Natera, Inc.(a) Preconception and prenatal genetic testing services | 105,000 | 3,537,450 |
| Total | 70,165,328 | |
| Common Stocks (continued) | ||
| Issuer | Shares | Value ($) |
| Health Care Equipment & Supplies 7.0% | ||
| Atrion Corp. Medical products and components | 11,837 | 8,895,506 |
| AxoGen, Inc.(a) Technologies for peripheral nerve reconstruction and regeneration | 585,989 | 10,483,343 |
| Penumbra, Inc.(a) Peripheral vascular & neurovascular devices | 38,077 | 6,254,909 |
| SI-BONE, Inc.(a) Medical devices | 366,772 | 7,885,598 |
| Tactile Systems Technology, Inc.(a) Technology for treating lymphedema, chronic swelling & venous ulcers | 192,475 | 12,993,987 |
| Total | 46,513,343 | |
| Health Care Providers & Services 5.8% | ||
| Chemed Corp. Hospice and palliative care services | 8,988 | 3,948,069 |
| Corvel Corp.(a) Managed care services | 17,093 | 1,493,245 |
| Hanger, Inc.(a) Orthotics and prosthetics | 237,658 | 6,561,737 |
| HealthEquity, Inc.(a) Technology-enabled services platforms for consumers to make healthcare saving and spending decisions | 177,185 | 13,124,093 |
| National Research Corp., Class A Survey-based healthcare performance, analysis and tracking | 127,132 | 8,383,084 |
| Tivity Health, Inc.(a) Health fitness solutions | 265,572 | 5,403,062 |
| Total | 38,913,290 | |
| Life Sciences Tools & Services 1.2% | ||
| NanoString Technologies, Inc.(a) Translational research and molecular diagnostics | 283,406 | 7,884,355 |
| Pharmaceuticals 2.1% | ||
| Menlo Therapeutics, Inc.(a) Clinical stage bio-pharmaceuticals | 559,064 | 2,594,057 |
| Optinose, Inc.(a),(b) Health care services | 558,700 | 5,151,214 |
| Theravance Biopharma, Inc.(a) Small molecule medicines | 233,181 | 6,037,056 |
| Total | 13,782,327 | |
| Total Health Care | 177,258,643 | |
| Wanger USA | Annual Report 2019 | 9 |
December 31, 2019
| Common Stocks (continued) | ||
| Issuer | Shares | Value ($) |
| Industrials 16.6% | ||
| Aerospace & Defense 1.6% | ||
| BWX Technologies, Inc. Nuclear components and fuel | 172,721 | 10,722,520 |
| Commercial Services & Supplies 3.6% | ||
| Brink’s Co. (The) Provides security services globally | 64,663 | 5,863,641 |
| Knoll, Inc. Branded office furniture products and textiles | 295,051 | 7,452,988 |
| Unifirst Corp. Workplace uniforms and protective clothing | 54,252 | 10,957,819 |
| Total | 24,274,448 | |
| Construction & Engineering 1.0% | ||
| Comfort Systems U.S.A., Inc. Heating, ventilation and air conditioning systems | 132,767 | 6,618,435 |
| Electrical Equipment 0.8% | ||
| Atkore International Group, Inc.(a) Metal products and electrical raceway solutions | 138,055 | 5,585,705 |
| Machinery 3.2% | ||
| ITT, Inc. Engineered components & customized technology solutions | 172,164 | 12,724,641 |
| SPX Corp.(a) Engineered products and technologies | 174,166 | 8,861,566 |
| Total | 21,586,207 | |
| Professional Services 2.8% | ||
| Exponent, Inc. Science and engineering consulting firm | 138,760 | 9,575,828 |
| ICF International, Inc. Management, technology, policy consulting, and implementation services | 96,136 | 8,807,980 |
| Total | 18,383,808 | |
| Road & Rail 1.0% | ||
| Saia, Inc.(a) Trucking transportation | 71,395 | 6,648,302 |
| Trading Companies & Distributors 2.6% | ||
| Air Lease Corp. Aircraft leasing company | 193,320 | 9,186,567 |
| SiteOne Landscape Supply, Inc.(a) Landscape supplies | 87,256 | 7,909,756 |
| Total | 17,096,323 | |
| Total Industrials | 110,915,748 | |
| Common Stocks (continued) | ||
| Issuer | Shares | Value ($) |
| Information Technology 17.6% | ||
| Electronic Equipment, Instruments & Components 1.6% | ||
| Badger Meter, Inc. Flow measurement and control solutions | 57,260 | 3,717,892 |
| ePlus, Inc.(a) Provides IT hardware, software and services | 84,100 | 7,088,789 |
| Total | 10,806,681 | |
| IT Services 2.2% | ||
| Endava PLC, ADR(a) IT services | 205,355 | 9,569,543 |
| LiveRamp Holdings, Inc.(a) Marketing technology company | 112,000 | 5,383,840 |
| Total | 14,953,383 | |
| Semiconductors & Semiconductor Equipment 6.6% | ||
| Advanced Energy Industries, Inc.(a) Engineered precision power conversion, measurement and control solutions | 162,500 | 11,570,000 |
| Impinj, Inc.(a) Radio-frequency identification solutions | 107,788 | 2,787,398 |
| Inphi Corp.(a) Analog semiconductor solutions | 99,716 | 7,380,978 |
| MKS Instruments, Inc. Instruments and components used to control and analyze gases in semiconductor manufacturing | 48,517 | 5,337,355 |
| Onto Innovation, Inc.(a) Process control solutions and inspection systems | 174,492 | 6,375,938 |
| Semtech Corp.(a) Analog and mixed-signal semiconductors | 196,950 | 10,418,655 |
| Total | 43,870,324 | |
| Software 7.2% | ||
| Bill.com Holdings, Inc.(a) Infrastructure software | 90,000 | 3,424,500 |
| Blackline, Inc.(a) Develops and markets enterprise software | 117,398 | 6,053,041 |
| CyberArk Software Ltd.(a) IT security solutions | 76,063 | 8,867,424 |
| j2 Global, Inc. Cloud-based communications and storage messaging services | 100,163 | 9,386,275 |
| Manhattan Associates, Inc.(a) Information technology solutions for distribution centers | 112,273 | 8,953,772 |
| 10 | Wanger USA | Annual Report 2019 |
December 31, 2019
| Common Stocks (continued) | ||
| Issuer | Shares | Value ($) |
| Mimecast Ltd.(a) Cloud security and risk management services for corporate information and email | 80,115 | 3,475,388 |
| Qualys, Inc.(a) Information technology security risk and compliance management solutions | 94,373 | 7,867,877 |
| Total | 48,028,277 | |
| Total Information Technology | 117,658,665 | |
| Materials 2.4% | ||
| Chemicals 2.4% | ||
| Ingevity Corp.(a) Specialty chemicals | 78,226 | 6,835,388 |
| PolyOne Corp. International polymer services company | 244,878 | 9,009,062 |
| Total | 15,844,450 | |
| Total Materials | 15,844,450 | |
| Real Estate 3.9% | ||
| Equity Real Estate Investment Trusts (REITS) 2.1% | ||
| Coresite Realty Corp. Develops, owns & operates data centers | 40,366 | 4,525,836 |
| UMH Properties, Inc. Real estate investment trust | 617,086 | 9,706,762 |
| Total | 14,232,598 | |
| Real Estate Management & Development 1.8% | ||
| Colliers International Group, Inc. Commercial real estate, residential property management and property services | 75,441 | 5,882,135 |
| FirstService Corp. Real estate services | 65,650 | 6,108,076 |
| Total | 11,990,211 | |
| Total Real Estate | 26,222,809 | |
| Total Common Stocks (Cost: $496,165,643) | 626,897,481 | |
| Limited Partnerships 1.5% | ||
| Issuer | Shares | Value ($) |
| Consumer Discretionary 1.5% | ||
| Hotels, Restaurants & Leisure 1.5% | ||
| Cedar Fair LP Owns and operates amusement parks | 179,335 | 9,942,332 |
| Total Consumer Discretionary | 9,942,332 | |
| Total Limited Partnerships (Cost: $9,304,922) | 9,942,332 | |
| Securities Lending Collateral 0.5% | ||
| Shares | Value ($) | |
| Dreyfus Government Cash Management Fund, Instutional Shares, 1.512%(c),(d) | 3,225,000 | 3,225,000 |
| Total Securities Lending Collateral (Cost: $3,225,000) | 3,225,000 | |
| Money Market Funds 4.6% | ||
| Columbia Short-Term Cash Fund, 1.699%(c),(e) | 30,588,894 | 30,585,835 |
| Total Money Market Funds (Cost: $30,585,835) | 30,585,835 | |
| Total Investments in Securities (Cost $539,281,400) | 670,650,648 | |
| Obligation to Return Collateral for Securities Loaned | (3,225,000) | |
| Other Assets & Liabilities, Net | (472,226) | |
| Net Assets | $666,953,422 | |
| (a) | Non-income producing security. |
| (b) | All or a portion of this security was on loan at December 31, 2019. The total market value of securities on loan at December 31, 2019 was $2,973,450. |
| (c) | The rate shown is the seven-day current annualized yield at December 31, 2019. |
| (d) | Investment made with cash collateral received from securities lending activity. |
| Wanger USA | Annual Report 2019 | 11 |
December 31, 2019
| (e) | As defined in the Investment Company Act of 1940, an affiliated company is one in which the Fund owns 5% or more of the company’s outstanding voting securities, or a company which is under common ownership or control with the Fund. Holdings and transactions in these affiliated companies during the year ended December 31, 2019 are as follows: |
| Issuer | Beginning shares | Shares purchased | Shares sold | Ending shares | Realized gain (loss) — affiliated issuers ($) | Net change in unrealized appreciation (depreciation) — affiliated issuers ($) | Dividend — affiliated issuers ($) | Value — affiliated issuers at end of period ($) |
| Columbia Short-Term Cash Fund, 1.699% | ||||||||
| 26,682,465 | 310,641,193 | (306,734,764) | 30,588,894 | (843) | — | 352,876 | 30,585,835 | |
| ADR | American Depositary Receipt |
| ■ | Level 1 – quoted prices in active markets for identical securities |
| ■ | Level 2 – prices determined using other significant observable inputs (including quoted prices for similar securities, interest rates, prepayment speeds, credit risk and others) |
| ■ | Level 3 – prices determined using significant unobservable inputs where quoted prices or observable inputs are unavailable or less reliable (including management’s own assumptions about the factors market participants would use in pricing an investment) |
| Level 1 ($) | Level 2 ($) | Level 3 ($) | Total ($) | |
| Investments in Securities | ||||
| Common Stocks | ||||
| Consumer Discretionary | 81,521,815 | — | — | 81,521,815 |
| Consumer Staples | 27,127,026 | — | — | 27,127,026 |
| Energy | 7,237,097 | — | — | 7,237,097 |
| Financials | 63,111,228 | — | — | 63,111,228 |
| Health Care | 177,258,643 | — | — | 177,258,643 |
| Industrials | 110,915,748 | — | — | 110,915,748 |
| Information Technology | 117,658,665 | — | — | 117,658,665 |
| 12 | Wanger USA | Annual Report 2019 |
December 31, 2019
| Level 1 ($) | Level 2 ($) | Level 3 ($) | Total ($) | |
| Materials | 15,844,450 | — | — | 15,844,450 |
| Real Estate | 26,222,809 | — | — | 26,222,809 |
| Total Common Stocks | 626,897,481 | — | — | 626,897,481 |
| Limited Partnerships | ||||
| Consumer Discretionary | 9,942,332 | — | — | 9,942,332 |
| Total Limited Partnerships | 9,942,332 | — | — | 9,942,332 |
| Securities Lending Collateral | 3,225,000 | — | — | 3,225,000 |
| Money Market Funds | 30,585,835 | — | — | 30,585,835 |
| Total Investments in Securities | 670,650,648 | — | — | 670,650,648 |
| Wanger USA | Annual Report 2019 | 13 |
December 31, 2019
| Assets | |
| Investments in securities, at value* | |
| Unaffiliated issuers (cost $508,695,565) | $640,064,813 |
| Affiliated issuers (cost $30,585,835) | 30,585,835 |
| Receivable for: | |
| Investments sold | 822,199 |
| Capital shares sold | 1,117 |
| Dividends | 328,163 |
| Securities lending income | 2,655 |
| Foreign tax reclaims | 1,362 |
| Prepaid expenses | 18,373 |
| Trustees’ deferred compensation plan | 264,952 |
| Total assets | 672,089,469 |
| Liabilities | |
| Due upon return of securities on loan | 3,225,000 |
| Payable for: | |
| Investments purchased | 402,058 |
| Capital shares purchased | 1,022,055 |
| Investment advisory fee | 15,897 |
| Service fees | 101,271 |
| Administration fees | 918 |
| Trustees’ fees | 737 |
| Compensation of chief compliance officer | 1,337 |
| Other expenses | 101,822 |
| Trustees’ deferred compensation plan | 264,952 |
| Total liabilities | 5,136,047 |
| Net assets applicable to outstanding capital stock | $666,953,422 |
| Represented by | |
| Paid in capital | 473,991,767 |
| Total distributable earnings (loss) | 192,961,655 |
| Total - representing net assets applicable to outstanding capital stock | $666,953,422 |
| Shares outstanding | 29,956,964 |
| Net asset value per share | 22.26 |
| * Includes the value of securities on loan | 2,973,450 |
| 14 | Wanger USA | Annual Report 2019 |
Year Ended December 31, 2019
| Net investment income | |
| Income: | |
| Dividends — unaffiliated issuers | $6,004,535 |
| Dividends — affiliated issuers | 352,876 |
| Income from securities lending — net | 40,026 |
| Foreign taxes withheld | (53,043) |
| Total income | 6,344,394 |
| Expenses: | |
| Investment advisory fee | 5,600,532 |
| Service fees | 667,204 |
| Administration fees | 322,948 |
| Trustees’ fees | 70,931 |
| Custodian fees | 15,518 |
| Printing and postage fees | 138,766 |
| Audit fees | 31,340 |
| Legal fees | 139,021 |
| Compensation of chief compliance officer | 2,733 |
| Other | 45,100 |
| Total expenses | 7,034,093 |
| Fees waived by transfer agent | (161,673) |
| Total net expenses | 6,872,420 |
| Net investment loss | (528,026) |
| Realized and unrealized gain (loss) — net | |
| Net realized gain (loss) on: | |
| Investments — unaffiliated issuers | 65,314,590 |
| Investments — affiliated issuers | (843) |
| Net realized gain | 65,313,747 |
| Net change in unrealized appreciation (depreciation) on: | |
| Investments — unaffiliated issuers | 107,201,072 |
| Net change in unrealized appreciation (depreciation) | 107,201,072 |
| Net realized and unrealized gain | 172,514,819 |
| Net increase in net assets resulting from operations | $171,986,793 |
| Wanger USA | Annual Report 2019 | 15 |
| Year Ended December 31, 2019 | Year Ended December 31, 2018 | |
| Operations | ||
| Net investment loss | $(528,026) | $(622,419) |
| Net realized gain | 65,313,747 | 115,134,937 |
| Net change in unrealized appreciation (depreciation) | 107,201,072 | (113,466,197) |
| Net increase in net assets resulting from operations | 171,986,793 | 1,046,321 |
| Distributions to shareholders | ||
| Net investment income and net realized gains | (115,476,309) | (161,967,932) |
| Total distributions to shareholders | (115,476,309) | (161,967,932) |
| Increase in net assets from capital stock activity | 28,452,376 | 58,200,283 |
| Total increase (decrease) in net assets | 84,962,860 | (102,721,328) |
| Net assets at beginning of year | 581,990,562 | 684,711,890 |
| Net assets at end of year | $666,953,422 | $581,990,562 |
| Year Ended | Year Ended | |||
| December 31, 2019 | December 31, 2018 | |||
| Shares | Dollars ($) | Shares | Dollars ($) | |
| Capital stock activity | ||||
| Subscriptions | 440,992 | 9,950,457 | 912,955 | 23,287,444 |
| Distributions reinvested | 5,823,314 | 115,476,309 | 6,526,840 | 161,967,932 |
| Redemptions | (4,421,151) | (96,974,390) | (4,929,560) | (127,055,093) |
| Total net increase | 1,843,155 | 28,452,376 | 2,510,235 | 58,200,283 |
| 16 | Wanger USA | Annual Report 2019 |
| Year Ended December 31, | |||||
| 2019 | 2018 | 2017 | 2016 | 2015 | |
| Per share data | |||||
| Net asset value, beginning of period | $20.70 | $26.74 | $26.53 | $31.75 | $37.71 |
| Income from investment operations: | |||||
| Net investment income (loss) | (0.02) | (0.02) | (0.02) | (0.04) | (0.12) |
| Net realized and unrealized gain | 5.93 | 0.75 | 4.81 | 3.56 | 0.45 |
| Total from investment operations | 5.91 | 0.73 | 4.79 | 3.52 | 0.33 |
| Less distributions to shareholders from: | |||||
| Net investment income | (0.07) | (0.03) | — | — | — |
| Net realized gains | (4.28) | (6.74) | (4.58) | (8.74) | (6.29) |
| Total distributions to shareholders | (4.35) | (6.77) | (4.58) | (8.74) | (6.29) |
| Net asset value, end of period | $22.26 | $20.70 | $26.74 | $26.53 | $31.75 |
| Total return | 31.10%(a) | (1.46)%(a) | 19.58%(a) | 13.69% | (0.61)% |
| Ratios to average net assets | |||||
| Total gross expenses(b) | 1.09% | 1.05% | 1.03% | 1.00% | 1.01% |
| Total net expenses(b) | 1.06% | 1.00% | 0.99% | 1.00% | 1.01% |
| Net investment loss | (0.08)% | (0.09)% | (0.08)% | (0.16)% | (0.34)% |
| Supplemental data | |||||
| Portfolio turnover | 90% | 81% | 96% | 118% | 45% |
| Net assets, end of period (in thousands) | $666,953 | $581,991 | $684,712 | $664,236 | $692,605 |
| Notes to Financial Highlights | |
| (a) | Had the Investment Manager and/or its affiliates not waived a portion of expenses, total return would have been reduced. |
| (b) | In addition to the fees and expenses that the Fund bears directly, the Fund indirectly bears a pro rata share of the fees and expenses of any other funds in which it invests. Such indirect expenses are not included in the Fund’s reported expense ratios. |
| Wanger USA | Annual Report 2019 | 17 |
December 31, 2019
| 18 | Wanger USA | Annual Report 2019 |
December 31, 2019
| Overnight and continuous | Up to 30 days | 30-90 days | Greater than 90 days | Total | |
| Wanger USA | |||||
| Securities lending transactions | |||||
| Equity securities | $2,973,450 | $— | $— | $— | $2,973,450 |
| Gross amount of recognized liabilities for securities lending (collateral received) | 3,225,000 | ||||
| Amounts due to counterparty in the event of default | $251,550 |
| Goldman Sachs ($) | |
| Liabilities | |
| Collateral on Securities Loaned | 3,225,000 |
| Total Liabilities | 3,225,000 |
| Total Financial and Derivative Net Assets | (3,225,000) |
| Financial Instruments | 2,973,450 |
| Net Amount (a) | (251,550) |
| (a) | Represents the net amount due from/(to) counterparties in the event of default. |
| Wanger USA | Annual Report 2019 | 19 |
December 31, 2019
| 20 | Wanger USA | Annual Report 2019 |
December 31, 2019
| Average daily net assets | Annual fee rate |
| Up to $100 million | 0.94% |
| $100 million to $250 million | 0.89% |
| $250 million to $2 billion | 0.84% |
| $2 billion and over | 0.80% |
| Aggregate average daily net assets of the Trust | Annual fee rate |
| Up to $4 billion | 0.05% |
| $4 billion to $6 billion | 0.04% |
| $6 billion to $8 billion | 0.03% |
| $8 billion and over | 0.02% |
| Wanger USA | Annual Report 2019 | 21 |
December 31, 2019
| Excess of distributions over net investment income ($) | Accumulated net realized gain ($) | Paid in capital ($) |
| 88,975 | (76,208) | (12,767) |
| 22 | Wanger USA | Annual Report 2019 |
December 31, 2019
| Year Ended December 31, 2019 | Year Ended December 31, 2018 | ||||
| Ordinary income ($) | Long-term capital gains ($) | Total ($) | Ordinary income ($) | Long-term capital gains ($) | Total ($) |
| 28,410,551 | 87,065,758 | 115,476,309 | 42,836,331 | 119,131,601 | 161,967,932 |
| Undistributed ordinary income ($) | Undistributed long-term capital gains ($) | Capital loss carryforwards ($) | Net unrealized appreciation ($) |
| 11,268,201 | 53,593,810 | — | 128,350,175 |
| Federal tax cost ($) | Gross unrealized appreciation ($) | Gross unrealized (depreciation) ($) | Net unrealized appreciation ($) |
| 542,300,473 | 143,929,981 | (15,579,806) | 128,350,175 |
| Wanger USA | Annual Report 2019 | 23 |
December 31, 2019
| 24 | Wanger USA | Annual Report 2019 |
| Wanger USA | Annual Report 2019 | 25 |
| Dividends received deduction | Capital gain dividend |
| 13.60% | $56,336,452 |
Shareholder Services Group
71 S Wacker Drive, Suite 2500
Chicago, IL 60606
800.922.6769
| Name and age at December 31, 2019 | Year first appointed or elected to a Board in the Columbia Funds Complex | Principal occupation(s) during the past five years | Number of Funds in the Columbia Funds Complex overseen (1) | Other directorships held by the Trustee during the past five years in addition to Columbia Acorn Trust and Wanger Advisors Trust |
| Laura M. Born, 54, Chair | 2007 | Adjunct Professor of Finance, University of Chicago Booth School of Business since 2007; Advisory Board Member, Driehaus Capital Management since 2018; Director, Carlson Inc. (private global travel company) since 2015; Managing Director – Investment Banking, JP Morgan Chase & Co. (broker-dealer) 2002-2007. | 11 | None. |
| 26 | Wanger USA | Annual Report 2019 |
Independent trustees (continued)
| Name and age at December 31, 2019 | Year first appointed or elected to a Board in the Columbia Funds Complex | Principal occupation(s) during the past five years | Number of Funds in the Columbia Funds Complex overseen (1) | Other directorships held by the Trustee during the past five years in addition to Columbia Acorn Trust and Wanger Advisors Trust |
| Maureen M. Culhane, 71 | 2007 | Retired. Formerly, Vice President, Goldman Sachs Asset Management, L.P. (investment adviser), 2005-2007; Vice President (Consultant) – Strategic Relationship Management, Goldman, Sachs & Co., 1999-2005. | 11 | None. |
| Margaret M. Eisen, 66 | 2002 | Trustee, Smith College, 2012-2016; Chief Investment Officer, EAM International LLC (corporate finance and asset management), 2003-2013; Managing Director, CFA Institute, 2005-2008. | 11 | Chair, RMB Investors Trust (9 series). |
| Eric A. Feldstein (2), 60 | 2018 | Chief Financial Officer, Health Care Service Corporation (HCSC) since 2016; Executive Vice President, American Express Company, 2010-2016. | 11 | Board Member, (as HCSC’s delegate), BCS Financial Corporation, 2016-2019; Board Member, Northern Trust Mutual Fund Complex (51 series), 2015-2016. |
| John C. Heaton, 60 | 2010 | Joseph L. Gidwitz Professor of Finance, University of Chicago Booth School of Business since July 2000; Deputy Dean for Faculty, University of Chicago Booth School of Business, 2012-2019. | 11 | None. |
| Charles R. Phillips, 63 | 2015 | Retired. Formerly, Vice Chairman, J.P. Morgan Private Bank, 2011-2014; Managing Director, J.P. Morgan Private Bank, 2001-2011. | 11 | None. |
| David J. Rudis, 66, Vice Chair | 2010 | Chief Executive Officer, Finger Rock, LLC (strategic consulting business). Formerly, National Checking and Debit Executive, and Illinois President, Bank of America, 2007-2009; President, Consumer Banking Group, LaSalle National Bank, 2004-2007. | 11 | None. |
| Name and age at December 31, 2019 | Year first appointed or elected to a Board in the Columbia Funds Complex | Principal occupation(s) during the past five years | Number of Funds in the Columbia Funds Complex overseen (1) | Other directorships held by the Trustee during the past five years in addition to Columbia Acorn Trust and Wanger Advisors Trust |
| Ralph Wanger, 85 (3) | 1970 (4) | Founder, CWAM. Formerly, President, Chief Investment Officer and portfolio manager, CWAM or its predecessors, July 1992-September 2003; Director, Wanger Investment Company PLC; Consultant, CWAM or its predecessors, September 2003-September 2005. | 11 | None. |
| (1) | The Trustees oversee the series of Wanger Advisors Trust and Columbia Acorn Trust. |
| (2) | Mr. Feldstein no longer serves as a trustee of the Trust effective January 1, 2020. |
| (3) | As permitted under the Trust’s Bylaws, Mr. Wanger serves as a non-voting Trustee Emeritus of Columbia Acorn Trust and Wanger Advisors Trust. |
| (4) | Dates prior to April 1992 correspond to the date first elected as a director of The Acorn Fund, Inc., the Trust’s predecessor. |
| Wanger USA | Annual Report 2019 | 27 |
| Name and age at December 31, 2019 | Position held with Columbia Acorn Trust and Wanger Advisors Trust | Year first appointed or elected to office | Principal occupation(s) during the past five years |
| Michael G. Clarke, 50 | Assistant Treasurer | 2004 | Vice President – Accounting and Tax, Columbia Management Investment Advisers, LLC since May 2010; senior officer of Columbia Funds and affiliated funds since 2002. |
| David L. Frank, 56 | Vice President | 2014 | Portfolio manager and/or analyst, CWAM or its predecessors since 2002. |
| Paul B. Goucher, 51 | Assistant Secretary | 2015 | Senior Vice President and Assistant General Counsel, Ameriprise Financial, Inc. since January 2017 (previously Vice President and Lead Chief Counsel, November 2008 - January 2017 and January 2013 - January 2017, respectively); Vice President, Chief Legal Officer and Assistant Secretary, Columbia Management Investment Advisers, LLC since March 2015. |
| Tae Han (Simon) Kim, 39 | Vice President | 2018 | Portfolio manager and/or analyst, CWAM since 2011. |
| John Kunka, 49 | Treasurer | 2006 | Vice President, Treasurer and Principal Accounting and Financial Officer, Columbia Acorn Trust and Wanger Advisors Trust since 2014; Treasurer and Chief Financial Officer, CWAM since 2014; Vice President of Accounting and Operations, CWAM since May 2006. |
| Stephen Kusmierczak, 52 | Vice President | 2011 | Portfolio manager and/or analyst, CWAM or its predecessors since 2001. |
| Joseph C. LaPalm, 50 | Vice President | 2006 | Chief Compliance Officer, CWAM since 2005. |
| Ryan C. Larrenaga, 49 | Assistant Secretary | 2015 | Vice President and Chief Counsel, Ameriprise Financial, Inc. since August 2018 (previously, Vice President and Group Counsel, August 2011 - August 2018); officer of Columbia Funds and affiliated funds since 2005. |
| Matthew A. Litfin, 48 | Co-President | 2019 | Director of Research (U.S.) and portfolio manager, CWAM since December 2015; Vice President, Columbia Acorn Trust and Wanger Advisors Trust, 2016 - 2019; formerly, portfolio manager, William Blair & Company 1993-2015. |
| Satoshi Matsunaga, 48 | Vice President | 2015 | Portfolio manager and/or analyst, CWAM or its predecessors since 2005. |
| Thomas P. McGuire, 47 | Chief Compliance Officer | 2015 | Senior Vice President and Chief Compliance Officer of the Columbia Funds since 2012; Vice President – Asset Management Compliance, Ameriprise Financial, Inc., since May 2010; Chief Compliance Officer, Ameriprise Certificate Company since September 2010. |
| Louis J. Mendes III, 55 | Co-President | 2019 | Director of International Research, CWAM, since 2015; Principal Executive Officer, Columbia Acorn Trust and Wanger Advisors Trust since 2019; Vice President, Columbia Acorn Trust and Wanger Advisors Trust, 2003-2019; portfolio manager and/or analyst, CWAM or its predecessors since 2001. |
| Julian Quero, 52 | Assistant Treasurer | 2015 | Vice President – Tax, Columbia Management Investment Advisers, LLC since 2009. |
| Martha A. Skinner, 45 | Assistant Treasurer | 2016 | Vice President of Financial Reporting and Administration, Columbia Management since November 2015; Director of Financial Reporting, Columbia Management, April 2013-November 2015. |
| Richard Watson, 50 | Vice President | 2018 | Portfolio manager and/or analyst, CWAM or its predecessors since 2006. |
| Linda Roth-Wiszowaty, 50 | Secretary | 2006 | Business support analyst, CWAM since April 2007. |
| Charles C. Young, 51 | Vice President | 2018 | Portfolio manager and/or analyst, CWAM since 2011; associated with CWAM or its predecessors since 1995. |
| 28 | Wanger USA | Annual Report 2019 |

December 31, 2019

| 3 | |
| 5 | |
| 7 | |
| 8 | |
| 12 | |
| 13 | |
| 14 | |
| 15 | |
| 16 | |
| 24 | |
| 25 | |
| 25 |
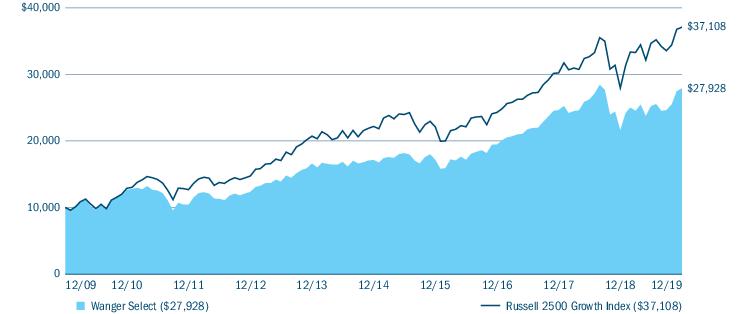
| Average annual total returns (%) (for the period ended December 31, 2019) | ||||||
| Inception | 1 Year | 5 Years | 10 Years | Life | ||
| Wanger Select | 02/01/99 | 29.30 | 10.26 | 10.82 | 10.39 | |
| Russell 2500 Growth Index | 32.65 | 10.84 | 14.01 | - | ||
| Wanger Select | Annual Report 2019 | 3 |
| Portfolio breakdown (%) (at December 31, 2019) | |
| Common Stocks | 97.1 |
| Money Market Funds | 2.4 |
| Securities Lending Collateral | 0.5 |
| Total | 100.0 |
| Equity sector breakdown (%) (at December 31, 2019) | |
| Communication Services | 6.0 |
| Consumer Discretionary | 10.8 |
| Consumer Staples | 2.0 |
| Financials | 10.4 |
| Health Care | 27.9 |
| Industrials | 15.3 |
| Information Technology | 24.9 |
| Real Estate | 2.7 |
| Total | 100.0 |
| 4 | Wanger Select | Annual Report 2019 |


| Wanger Select | Annual Report 2019 | 5 |
| 6 | Wanger Select | Annual Report 2019 |
(Unaudited)
| July 1, 2019 — December 31, 2019 | |||||||
| Account value at the beginning of the period ($) | Account value at the end of the period ($) | Expenses paid during the period ($) | Fund’s annualized expense ratio (%) | ||||
| Actual | Hypothetical | Actual | Hypothetical | Actual | Hypothetical | Actual | |
| Wanger Select | 1,000.00 | 1,000.00 | 1,107.10 | 1,020.84 | 4.89 | 4.69 | 0.91 |
| Wanger Select | Annual Report 2019 | 7 |
December 31, 2019
| Common Stocks 98.9% | ||
| Issuer | Shares | Value ($) |
| Communication Services 5.9% | ||
| Entertainment 5.9% | ||
| Madison Square Garden Co. (The), Class A(a) Sports, entertainment and media | 8,963 | 2,636,825 |
| Zynga, Inc., Class A(a) Social gaming company | 698,709 | 4,276,099 |
| Total | 6,912,924 | |
| Total Communication Services | 6,912,924 | |
| Consumer Discretionary 10.7% | ||
| Hotels, Restaurants & Leisure 2.1% | ||
| Extended Stay America, Inc. Hotels and motels | 162,500 | 2,414,750 |
| Internet & Direct Marketing Retail 2.5% | ||
| Wayfair, Inc., Class A(a) Retails household goods online | 31,678 | 2,862,741 |
| Specialty Retail 6.1% | ||
| Five Below, Inc.(a) Specialty value retailer | 36,005 | 4,603,599 |
| Ulta Beauty, Inc.(a) Chain of beauty stores | 10,146 | 2,568,359 |
| Total | 7,171,958 | |
| Total Consumer Discretionary | 12,449,449 | |
| Consumer Staples 2.0% | ||
| Food & Staples Retailing 2.0% | ||
| BJ’s Wholesale Club Holdings, Inc.(a) Warehouse club | 101,000 | 2,296,740 |
| Total Consumer Staples | 2,296,740 | |
| Financials 10.3% | ||
| Banks 3.9% | ||
| SVB Financial Group(a) Holding company for Silicon Valley Bank | 18,319 | 4,598,802 |
| Capital Markets 3.4% | ||
| Ares Management Corp., Class A Asset management firm | 110,577 | 3,946,493 |
| Thrifts & Mortgage Finance 3.0% | ||
| Walker & Dunlop, Inc. Commercial real estate financial services | 53,577 | 3,465,360 |
| Total Financials | 12,010,655 | |
| Common Stocks (continued) | ||
| Issuer | Shares | Value ($) |
| Health Care 27.6% | ||
| Biotechnology 5.9% | ||
| Agios Pharmaceuticals, Inc.(a) Therapeutics in the field of cancer metabolism | 33,687 | 1,608,554 |
| Fate Therapeutics, Inc.(a) Biotechnology services | 68,100 | 1,332,717 |
| Kiniksa Pharmaceuticals Ltd., Class A(a) Clinical-stage biopharmaceutical company | 50,557 | 559,161 |
| Seattle Genetics, Inc.(a) Monoclonal antibody-based drugs to treat cancer and related diseases | 29,358 | 3,354,445 |
| Total | 6,854,877 | |
| Health Care Equipment & Supplies 9.7% | ||
| AxoGen, Inc.(a) Technologies for peripheral nerve reconstruction and regeneration | 151,779 | 2,715,326 |
| Masimo Corp.(a) Medical signal processing and sensor technology for non-invasive monitoring of physiological parameters | 32,280 | 5,102,177 |
| Tactile Systems Technology, Inc.(a) Technology for treating lymphedema, chronic swelling & venous ulcers | 52,916 | 3,572,359 |
| Total | 11,389,862 | |
| Health Care Providers & Services 7.9% | ||
| Chemed Corp. Hospice and palliative care services | 10,805 | 4,746,204 |
| Encompass Health Corp. Inpatient rehabilitative healthcare services | 63,909 | 4,426,977 |
| Total | 9,173,181 | |
| Life Sciences Tools & Services 2.8% | ||
| Pra Health Sciences, Inc.(a) Global contract research organization | 29,736 | 3,305,156 |
| Pharmaceuticals 1.3% | ||
| Optinose, Inc.(a),(b) Health care services | 164,138 | 1,513,352 |
| Total Health Care | 32,236,428 | |
| Industrials 15.1% | ||
| Construction & Engineering 2.1% | ||
| Comfort Systems U.S.A., Inc. Heating, ventilation and air conditioning systems | 48,408 | 2,413,139 |
| 8 | Wanger Select | Annual Report 2019 |
December 31, 2019
| Common Stocks (continued) | ||
| Issuer | Shares | Value ($) |
| Electrical Equipment 3.0% | ||
| Atkore International Group, Inc.(a) Metal products and electrical raceway solutions | 88,460 | 3,579,092 |
| Machinery 6.9% | ||
| ITT, Inc. Engineered components & customized technology solutions | 41,951 | 3,100,598 |
| SPX Corp.(a) Engineered products and technologies | 96,801 | 4,925,235 |
| Total | 8,025,833 | |
| Trading Companies & Distributors 3.1% | ||
| Air Lease Corp. Aircraft leasing company | 75,430 | 3,584,433 |
| Total Industrials | 17,602,497 | |
| Information Technology 24.6% | ||
| Electronic Equipment, Instruments & Components 2.2% | ||
| Cognex Corp. Machine vision systems | 45,068 | 2,525,611 |
| IT Services 8.2% | ||
| Gartner, Inc.(a) Research and analysis on computer hardware, software, communications, and information technology | 18,955 | 2,920,966 |
| GoDaddy, Inc., Class A(a) Cloud-based web platform for small businesses, web design professionals and individuals | 61,427 | 4,172,122 |
| LiveRamp Holdings, Inc.(a) Marketing technology company | 51,878 | 2,493,775 |
| Total | 9,586,863 | |
| Semiconductors & Semiconductor Equipment 3.3% | ||
| MKS Instruments, Inc. Instruments and components used to control and analyze gases in semiconductor manufacturing | 35,526 | 3,908,215 |
| Software 10.9% | ||
| Alteryx, Inc., Class A(a) Data storage, retrieval, management, reporting, and analytics solutions | 38,863 | 3,889,020 |
| Cadence Design Systems, Inc.(a) Software technology, design and consulting services and technology | 60,463 | 4,193,714 |
| Qualys, Inc.(a) Information technology security risk and compliance management solutions | 55,574 | 4,633,204 |
| Total | 12,715,938 | |
| Total Information Technology | 28,736,627 | |
| Common Stocks (continued) | ||
| Issuer | Shares | Value ($) |
| Real Estate 2.7% | ||
| Equity Real Estate Investment Trusts (REITS) 2.7% | ||
| UMH Properties, Inc. Real estate investment trust | 200,053 | 3,146,834 |
| Total Real Estate | 3,146,834 | |
| Total Common Stocks (Cost: $94,521,240) | 115,392,154 | |
| Securities Lending Collateral 0.5% | ||
| Shares | Value ($) | |
| Dreyfus Government Cash Management Fund, Instutional Shares, 1.512%(c),(d) | 567,000 | 567,000 |
| Total Securities Lending Collateral (Cost: $567,000) | 567,000 | |
| Money Market Funds 2.4% | ||
| Columbia Short-Term Cash Fund, 1.699%(c),(e) | 2,808,523 | 2,808,242 |
| Total Money Market Funds (Cost: $2,808,242) | 2,808,242 | |
| Total Investments in Securities (Cost $97,896,482) | 118,767,396 | |
| Obligation to Return Collateral for Securities Loaned | (567,000) | |
| Other Assets & Liabilities, Net | (1,521,113) | |
| Net Assets | $116,679,283 | |
| Wanger Select | Annual Report 2019 | 9 |
December 31, 2019
| (a) | Non-income producing security. |
| (b) | All or a portion of this security was on loan at December 31, 2019. The total market value of securities on loan at December 31, 2019 was $522,774. |
| (c) | The rate shown is the seven-day current annualized yield at December 31, 2019. |
| (d) | Investment made with cash collateral received from securities lending activity. |
| (e) | As defined in the Investment Company Act of 1940, an affiliated company is one in which the Fund owns 5% or more of the company’s outstanding voting securities, or a company which is under common ownership or control with the Fund. Holdings and transactions in these affiliated companies during the year ended December 31, 2019 are as follows: |
| Issuer | Beginning shares | Shares purchased | Shares sold | Ending shares | Realized gain (loss) — affiliated issuers ($) | Net change in unrealized appreciation (depreciation) — affiliated issuers ($) | Dividend — affiliated issuers ($) | Value — affiliated issuers at end of period ($) |
| Columbia Short-Term Cash Fund, 1.699% | ||||||||
| 3,395,951 | 76,361,723 | (76,949,151) | 2,808,523 | (170) | — | 56,063 | 2,808,242 | |
| ■ | Level 1 – quoted prices in active markets for identical securities |
| ■ | Level 2 – prices determined using other significant observable inputs (including quoted prices for similar securities, interest rates, prepayment speeds, credit risk and others) |
| ■ | Level 3 – prices determined using significant unobservable inputs where quoted prices or observable inputs are unavailable or less reliable (including management’s own assumptions about the factors market participants would use in pricing an investment) |
| Level 1 ($) | Level 2 ($) | Level 3 ($) | Total ($) | |
| Investments in Securities | ||||
| Common Stocks | ||||
| Communication Services | 6,912,924 | — | — | 6,912,924 |
| Consumer Discretionary | 12,449,449 | — | — | 12,449,449 |
| Consumer Staples | 2,296,740 | — | — | 2,296,740 |
| Financials | 12,010,655 | — | — | 12,010,655 |
| Health Care | 32,236,428 | — | — | 32,236,428 |
| Industrials | 17,602,497 | — | — | 17,602,497 |
| 10 | Wanger Select | Annual Report 2019 |
December 31, 2019
| Level 1 ($) | Level 2 ($) | Level 3 ($) | Total ($) | |
| Information Technology | 28,736,627 | — | — | 28,736,627 |
| Real Estate | 3,146,834 | — | — | 3,146,834 |
| Total Common Stocks | 115,392,154 | — | — | 115,392,154 |
| Securities Lending Collateral | 567,000 | — | — | 567,000 |
| Money Market Funds | 2,808,242 | — | — | 2,808,242 |
| Total Investments in Securities | 118,767,396 | — | — | 118,767,396 |
| Wanger Select | Annual Report 2019 | 11 |
December 31, 2019
| Assets | |
| Investments in securities, at value* | |
| Unaffiliated issuers (cost $95,088,240) | $115,959,154 |
| Affiliated issuers (cost $2,808,242) | 2,808,242 |
| Receivable for: | |
| Investments sold | 4,167,999 |
| Capital shares sold | 19,620 |
| Dividends | 32,960 |
| Securities lending income | 803 |
| Prepaid expenses | 3,215 |
| Total assets | 122,991,993 |
| Liabilities | |
| Due to custodian | 300 |
| Due upon return of securities on loan | 567,000 |
| Payable for: | |
| Investments purchased | 5,546,103 |
| Capital shares purchased | 44,211 |
| Investment advisory fee | 1,920 |
| Service fees | 38,978 |
| Administration fees | 160 |
| Trustees’ fees | 60,796 |
| Compensation of chief compliance officer | 236 |
| Other expenses | 53,006 |
| Total liabilities | 6,312,710 |
| Net assets applicable to outstanding capital stock | $116,679,283 |
| Represented by | |
| Paid in capital | 83,294,082 |
| Total distributable earnings (loss) | 33,385,201 |
| Total - representing net assets applicable to outstanding capital stock | $116,679,283 |
| Shares outstanding | 6,378,796 |
| Net asset value per share | 18.29 |
| * Includes the value of securities on loan | 522,774 |
| 12 | Wanger Select | Annual Report 2019 |
Year Ended December 31, 2019
| Net investment income | |
| Income: | |
| Dividends — unaffiliated issuers | $783,869 |
| Dividends — affiliated issuers | 56,063 |
| Income from securities lending — net | 4,886 |
| Foreign taxes withheld | (4,872) |
| Total income | 839,946 |
| Expenses: | |
| Investment advisory fee | 909,350 |
| Service fees | 199,026 |
| Administration fees | 56,834 |
| Trustees’ fees | 25,532 |
| Custodian fees | 6,612 |
| Printing and postage fees | 42,179 |
| Audit fees | 31,340 |
| Legal fees | 24,507 |
| Compensation of chief compliance officer | 484 |
| Other | 11,872 |
| Total expenses | 1,307,736 |
| Fees waived by transfer agent | (79,684) |
| Advisory fee waiver | (227,337) |
| Total net expenses | 1,000,715 |
| Net investment loss | (160,769) |
| Realized and unrealized gain (loss) — net | |
| Net realized gain (loss) on: | |
| Investments — unaffiliated issuers | 12,991,415 |
| Investments — affiliated issuers | (170) |
| Net realized gain | 12,991,245 |
| Net change in unrealized appreciation (depreciation) on: | |
| Investments — unaffiliated issuers | 16,185,697 |
| Net change in unrealized appreciation (depreciation) | 16,185,697 |
| Net realized and unrealized gain | 29,176,942 |
| Net increase in net assets resulting from operations | $29,016,173 |
| Wanger Select | Annual Report 2019 | 13 |
| Year Ended December 31, 2019 | Year Ended December 31, 2018 | |
| Operations | ||
| Net investment income (loss) | $(160,769) | $465,355 |
| Net realized gain | 12,991,245 | 14,719,330 |
| Net change in unrealized appreciation (depreciation) | 16,185,697 | (29,878,533) |
| Net increase (decrease) in net assets resulting from operations | 29,016,173 | (14,693,848) |
| Distributions to shareholders | ||
| Net investment income and net realized gains | (15,116,774) | (15,240,367) |
| Total distributions to shareholders | (15,116,774) | (15,240,367) |
| Decrease in net assets from capital stock activity | (3,688,845) | (4,810,029) |
| Total increase (decrease) in net assets | 10,210,554 | (34,744,244) |
| Net assets at beginning of year | 106,468,729 | 141,212,973 |
| Net assets at end of year | $116,679,283 | $106,468,729 |
| Year Ended | Year Ended | |||
| December 31, 2019 | December 31, 2018 | |||
| Shares | Dollars ($) | Shares | Dollars ($) | |
| Capital stock activity | ||||
| Subscriptions | 103,393 | 1,824,654 | 252,736 | 5,232,746 |
| Distributions reinvested | 934,288 | 15,116,774 | 739,801 | 15,240,367 |
| Redemptions | (1,181,971) | (20,630,273) | (1,243,911) | (25,283,142) |
| Total net decrease | (144,290) | (3,688,845) | (251,374) | (4,810,029) |
| 14 | Wanger Select | Annual Report 2019 |
| Year Ended December 31, | |||||
| 2019 | 2018 | 2017 | 2016 | 2015 | |
| Per share data | |||||
| Net asset value, beginning of period | $16.32 | $20.84 | $19.10 | $24.18 | $32.99 |
| Income from investment operations: | |||||
| Net investment income (loss) | (0.02) | 0.07 | 0.04 | 0.03 | (0.02) |
| Net realized and unrealized gain (loss) | 4.48 | (2.15) | 4.62 | 2.48 | 0.69 |
| Total from investment operations | 4.46 | (2.08) | 4.66 | 2.51 | 0.67 |
| Less distributions to shareholders from: | |||||
| Net investment income | (0.02) | (0.04) | (0.03) | (0.03) | (0.00)(a) |
| Net realized gains | (2.47) | (2.40) | (2.89) | (7.56) | (9.48) |
| Total distributions to shareholders | (2.49) | (2.44) | (2.92) | (7.59) | (9.48) |
| Net asset value, end of period | $18.29 | $16.32 | $20.84 | $19.10 | $24.18 |
| Total return | 29.30%(b) | (12.41)%(b) | 26.67%(b) | 13.31%(b) | 0.26%(b) |
| Ratios to average net assets | |||||
| Total gross expenses(c) | 1.15% | 1.10% | 1.05% | 0.93%(d) | 0.98% |
| Total net expenses(c) | 0.88% | 0.78% | 0.77% | 0.73%(d) | 0.85% |
| Net investment income (loss) | (0.14)% | 0.34% | 0.19% | 0.17% | (0.06)% |
| Supplemental data | |||||
| Portfolio turnover | 152% | 66% | 52% | 93% | 59% |
| Net assets, end of period (in thousands) | $116,679 | $106,469 | $141,213 | $125,500 | $135,841 |
| Notes to Financial Highlights | |
| (a) | Rounds to zero. |
| (b) | Had the Investment Manager and/or its affiliates not waived a portion of expenses, total return would have been reduced. |
| (c) | In addition to the fees and expenses that the Fund bears directly, the Fund indirectly bears a pro rata share of the fees and expenses of any other funds in which it invests, if any. Such indirect expenses are not included in the Fund’s reported expense ratios. |
| (d) | Expenses have been reduced due to a reimbursement of expenses overbilled by a third party. If the reimbursement had been excluded, the expense ratios would have been higher by 0.03%. All fee waivers and expense reimbursements by the Investment Manager and its affiliates were applied before giving effect to this third party reimbursement. |
| Wanger Select | Annual Report 2019 | 15 |
December 31, 2019
| 16 | Wanger Select | Annual Report 2019 |
December 31, 2019
| Overnight and continuous | Up to 30 days | 30-90 days | Greater than 90 days | Total | |
| Wanger Select | |||||
| Securities lending transactions | |||||
| Equity securities | $522,774 | $— | $— | $— | $522,774 |
| Gross amount of recognized liabilities for securities lending (collateral received) | 567,000 | ||||
| Amounts due to counterparty in the event of default | $44,226 |
| Goldman Sachs ($) | |
| Liabilities | |
| Collateral on Securities Loaned | 567,000 |
| Total Liabilities | 567,000 |
| Total Financial and Derivative Net Assets | (567,000) |
| Financial Instruments | 522,774 |
| Net Amount (a) | (44,226) |
| (a) | Represents the net amount due from/(to) counterparties in the event of default. |
| Wanger Select | Annual Report 2019 | 17 |
December 31, 2019
| 18 | Wanger Select | Annual Report 2019 |
December 31, 2019
| Average daily net assets | Annual fee rate |
| Up to $500 million | 0.80% |
| $500 million and over | 0.78% |
| Aggregate average daily net assets of the Trust | Annual fee rate |
| Up to $4 billion | 0.05% |
| $4 billion to $6 billion | 0.04% |
| $6 billion to $8 billion | 0.03% |
| $8 billion and over | 0.02% |
| Wanger Select | Annual Report 2019 | 19 |
December 31, 2019
| Undistributed net investment income ($) | Accumulated net realized gain ($) | Paid in capital ($) |
| 515,938 | (515,934) | (4) |
| 20 | Wanger Select | Annual Report 2019 |
December 31, 2019
| Year Ended December 31, 2019 | Year Ended December 31, 2018 | ||||
| Ordinary income ($) | Long-term capital gains ($) | Total ($) | Ordinary income ($) | Long-term capital gains ($) | Total ($) |
| 2,097,499 | 13,019,275 | 15,116,774 | 3,605,848 | 11,634,519 | 15,240,367 |
| Undistributed ordinary income ($) | Undistributed long-term capital gains ($) | Capital loss carryforwards ($) | Net unrealized appreciation ($) |
| 839,490 | 12,203,259 | — | 20,403,122 |
| Federal tax cost ($) | Gross unrealized appreciation ($) | Gross unrealized (depreciation) ($) | Net unrealized appreciation ($) |
| 98,364,274 | 21,729,542 | (1,326,420) | 20,403,122 |
| Wanger Select | Annual Report 2019 | 21 |
December 31, 2019
| 22 | Wanger Select | Annual Report 2019 |
December 31, 2019
| Wanger Select | Annual Report 2019 | 23 |
| 24 | Wanger Select | Annual Report 2019 |
| Dividends received deduction | Capital gain dividend |
| 43.34% | $12,829,201 |
Shareholder Services Group
71 S Wacker Drive, Suite 2500
Chicago, IL 60606
800.922.6769
| Name and age at December 31, 2019 | Year first appointed or elected to a Board in the Columbia Funds Complex | Principal occupation(s) during the past five years | Number of Funds in the Columbia Funds Complex overseen (1) | Other directorships held by the Trustee during the past five years in addition to Columbia Acorn Trust and Wanger Advisors Trust |
| Laura M. Born, 54, Chair | 2007 | Adjunct Professor of Finance, University of Chicago Booth School of Business since 2007; Advisory Board Member, Driehaus Capital Management since 2018; Director, Carlson Inc. (private global travel company) since 2015; Managing Director – Investment Banking, JP Morgan Chase & Co. (broker-dealer) 2002-2007. | 11 | None. |
| Wanger Select | Annual Report 2019 | 25 |
Independent trustees (continued)
| Name and age at December 31, 2019 | Year first appointed or elected to a Board in the Columbia Funds Complex | Principal occupation(s) during the past five years | Number of Funds in the Columbia Funds Complex overseen (1) | Other directorships held by the Trustee during the past five years in addition to Columbia Acorn Trust and Wanger Advisors Trust |
| Maureen M. Culhane, 71 | 2007 | Retired. Formerly, Vice President, Goldman Sachs Asset Management, L.P. (investment adviser), 2005-2007; Vice President (Consultant) – Strategic Relationship Management, Goldman, Sachs & Co., 1999-2005. | 11 | None. |
| Margaret M. Eisen, 66 | 2002 | Trustee, Smith College, 2012-2016; Chief Investment Officer, EAM International LLC (corporate finance and asset management), 2003-2013; Managing Director, CFA Institute, 2005-2008. | 11 | Chair, RMB Investors Trust (9 series). |
| Eric A. Feldstein (2), 60 | 2018 | Chief Financial Officer, Health Care Service Corporation (HCSC) since 2016; Executive Vice President, American Express Company, 2010-2016. | 11 | Board Member, (as HCSC’s delegate), BCS Financial Corporation, 2016-2019; Board Member, Northern Trust Mutual Fund Complex (51 series), 2015-2016. |
| John C. Heaton, 60 | 2010 | Joseph L. Gidwitz Professor of Finance, University of Chicago Booth School of Business since July 2000; Deputy Dean for Faculty, University of Chicago Booth School of Business, 2012-2019. | 11 | None. |
| Charles R. Phillips, 63 | 2015 | Retired. Formerly, Vice Chairman, J.P. Morgan Private Bank, 2011-2014; Managing Director, J.P. Morgan Private Bank, 2001-2011. | 11 | None. |
| David J. Rudis, 66, Vice Chair | 2010 | Chief Executive Officer, Finger Rock, LLC (strategic consulting business). Formerly, National Checking and Debit Executive, and Illinois President, Bank of America, 2007-2009; President, Consumer Banking Group, LaSalle National Bank, 2004-2007. | 11 | None. |
| Name and age at December 31, 2019 | Year first appointed or elected to a Board in the Columbia Funds Complex | Principal occupation(s) during the past five years | Number of Funds in the Columbia Funds Complex overseen (1) | Other directorships held by the Trustee during the past five years in addition to Columbia Acorn Trust and Wanger Advisors Trust |
| Ralph Wanger, 85 (3) | 1970 (4) | Founder, CWAM. Formerly, President, Chief Investment Officer and portfolio manager, CWAM or its predecessors, July 1992-September 2003; Director, Wanger Investment Company PLC; Consultant, CWAM or its predecessors, September 2003-September 2005. | 11 | None. |
| (1) | The Trustees oversee the series of Wanger Advisors Trust and Columbia Acorn Trust. |
| (2) | Mr. Feldstein no longer serves as a trustee of the Trust effective January 1, 2020. |
| (3) | As permitted under the Trust’s Bylaws, Mr. Wanger serves as a non-voting Trustee Emeritus of Columbia Acorn Trust and Wanger Advisors Trust. |
| (4) | Dates prior to April 1992 correspond to the date first elected as a director of The Acorn Fund, Inc., the Trust’s predecessor. |
| 26 | Wanger Select | Annual Report 2019 |
| Name and age at December 31, 2019 | Position held with Columbia Acorn Trust and Wanger Advisors Trust | Year first appointed or elected to office | Principal occupation(s) during the past five years |
| Michael G. Clarke, 50 | Assistant Treasurer | 2004 | Vice President – Accounting and Tax, Columbia Management Investment Advisers, LLC since May 2010; senior officer of Columbia Funds and affiliated funds since 2002. |
| David L. Frank, 56 | Vice President | 2014 | Portfolio manager and/or analyst, CWAM or its predecessors since 2002. |
| Paul B. Goucher, 51 | Assistant Secretary | 2015 | Senior Vice President and Assistant General Counsel, Ameriprise Financial, Inc. since January 2017 (previously Vice President and Lead Chief Counsel, November 2008 - January 2017 and January 2013 - January 2017, respectively); Vice President, Chief Legal Officer and Assistant Secretary, Columbia Management Investment Advisers, LLC since March 2015. |
| Tae Han (Simon) Kim, 39 | Vice President | 2018 | Portfolio manager and/or analyst, CWAM since 2011. |
| John Kunka, 49 | Treasurer | 2006 | Vice President, Treasurer and Principal Accounting and Financial Officer, Columbia Acorn Trust and Wanger Advisors Trust since 2014; Treasurer and Chief Financial Officer, CWAM since 2014; Vice President of Accounting and Operations, CWAM since May 2006. |
| Stephen Kusmierczak, 52 | Vice President | 2011 | Portfolio manager and/or analyst, CWAM or its predecessors since 2001. |
| Joseph C. LaPalm, 50 | Vice President | 2006 | Chief Compliance Officer, CWAM since 2005. |
| Ryan C. Larrenaga, 49 | Assistant Secretary | 2015 | Vice President and Chief Counsel, Ameriprise Financial, Inc. since August 2018 (previously, Vice President and Group Counsel, August 2011 - August 2018); officer of Columbia Funds and affiliated funds since 2005. |
| Matthew A. Litfin, 48 | Co-President | 2019 | Director of Research (U.S.) and portfolio manager, CWAM since December 2015; Vice President, Columbia Acorn Trust and Wanger Advisors Trust, 2016 - 2019; formerly, portfolio manager, William Blair & Company 1993-2015. |
| Satoshi Matsunaga, 48 | Vice President | 2015 | Portfolio manager and/or analyst, CWAM or its predecessors since 2005. |
| Thomas P. McGuire, 47 | Chief Compliance Officer | 2015 | Senior Vice President and Chief Compliance Officer of the Columbia Funds since 2012; Vice President – Asset Management Compliance, Ameriprise Financial, Inc., since May 2010; Chief Compliance Officer, Ameriprise Certificate Company since September 2010. |
| Louis J. Mendes III, 55 | Co-President | 2019 | Director of International Research, CWAM, since 2015; Principal Executive Officer, Columbia Acorn Trust and Wanger Advisors Trust since 2019; Vice President, Columbia Acorn Trust and Wanger Advisors Trust, 2003-2019; portfolio manager and/or analyst, CWAM or its predecessors since 2001. |
| Julian Quero, 52 | Assistant Treasurer | 2015 | Vice President – Tax, Columbia Management Investment Advisers, LLC since 2009. |
| Martha A. Skinner, 45 | Assistant Treasurer | 2016 | Vice President of Financial Reporting and Administration, Columbia Management since November 2015; Director of Financial Reporting, Columbia Management, April 2013-November 2015. |
| Richard Watson, 50 | Vice President | 2018 | Portfolio manager and/or analyst, CWAM or its predecessors since 2006. |
| Linda Roth-Wiszowaty, 50 | Secretary | 2006 | Business support analyst, CWAM since April 2007. |
| Charles C. Young, 51 | Vice President | 2018 | Portfolio manager and/or analyst, CWAM since 2011; associated with CWAM or its predecessors since 1995. |
| Wanger Select | Annual Report 2019 | 27 |

December 31, 2019

| 3 | |
| 6 | |
| 8 | |
| 9 | |
| 15 | |
| 16 | |
| 17 | |
| 18 | |
| 19 | |
| 29 | |
| 30 | |
| 30 |
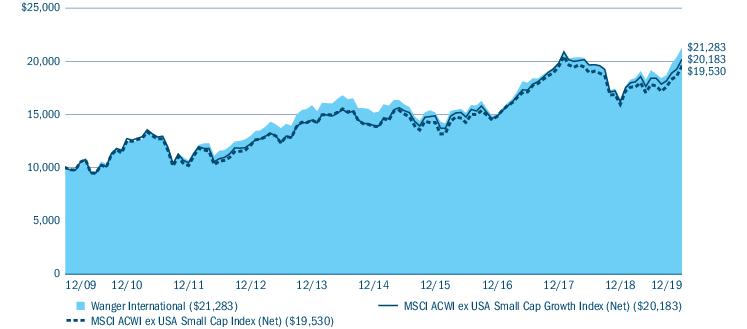
| Average annual total returns (%) (for the period ended December 31, 2019) | ||||||
| Inception | 1 Year | 5 Years | 10 Years | Life | ||
| Wanger International | 05/03/95 | 29.99 | 7.01 | 7.85 | 11.51 | |
| MSCI ACWI ex USA Small Cap Growth Index (Net) | 24.61 | 7.64 | 7.27 | - | ||
| MSCI ACWI ex USA Small Cap Index (Net) | 22.42 | 7.04 | 6.92 | - | ||
| Wanger International | Annual Report 2019 | 3 |
| Equity sector breakdown (%) (at December 31, 2019) | |
| Communication Services | 6.8 |
| Consumer Discretionary | 13.9 |
| Consumer Staples | 5.7 |
| Energy | 1.8 |
| Financials | 11.8 |
| Health Care | 9.4 |
| Industrials | 22.3 |
| Information Technology | 15.1 |
| Materials | 6.4 |
| Real Estate | 6.8 |
| Total | 100.0 |
| 4 | Wanger International | Annual Report 2019 |
| Country breakdown (%) (at December 31, 2019) | |
| Australia | 4.3 |
| Belgium | 0.7 |
| Brazil | 2.1 |
| Cambodia | 0.9 |
| Canada | 3.2 |
| China | 0.8 |
| Cyprus | 0.3 |
| Denmark | 2.2 |
| France | 2.3 |
| Germany | 6.8 |
| Hong Kong | 2.3 |
| India | 1.6 |
| Indonesia | 1.1 |
| Ireland | 1.2 |
| Italy | 4.2 |
| Japan | 21.6 |
| Malta | 0.6 |
| Mexico | 1.2 |
| Netherlands | 2.5 |
| New Zealand | 1.3 |
| Philippines | 0.5 |
| Poland | 0.8 |
| Russian Federation | 0.9 |
| Singapore | 1.5 |
| South Africa | 1.0 |
| South Korea | 3.1 |
| Spain | 0.9 |
| Sweden | 7.8 |
| Switzerland | 2.4 |
| Taiwan | 4.3 |
| Thailand | 0.6 |
| United Kingdom | 10.5 |
| United States(a) | 4.5 |
| Total | 100.0 |
| (a) | Includes investments in Money Market Funds. |
| Wanger International | Annual Report 2019 | 5 |


| 6 | Wanger International | Annual Report 2019 |
| Wanger International | Annual Report 2019 | 7 |
(Unaudited)
| July 1, 2019 — December 31, 2019 | |||||||
| Account value at the beginning of the period ($) | Account value at the end of the period ($) | Expenses paid during the period ($) | Fund’s annualized expense ratio (%) | ||||
| Actual | Hypothetical | Actual | Hypothetical | Actual | Hypothetical | Actual | |
| Wanger International | 1,000.00 | 1,000.00 | 1,111.40 | 1,019.16 | 6.67 | 6.38 | 1.24 |
| 8 | Wanger International | Annual Report 2019 |
December 31, 2019
| Common Stocks 97.5% | ||
| Issuer | Shares | Value ($) |
| Australia 4.3% | ||
| carsales.com Ltd. Automotive & related industry websites | 488,748 | 5,699,673 |
| Cleanaway Waste Management Ltd. Waste management services | 1,891,318 | 2,669,433 |
| Evolution Mining Ltd. Gold exploration | 1,422,725 | 3,782,222 |
| National Storage REIT Owns self storage facilities | 3,157,343 | 4,065,083 |
| Star Entertainment Group Ltd. (The) Casinos and hotels | 1,341,405 | 4,327,377 |
| Total | 20,543,788 | |
| Belgium 0.7% | ||
| Melexis NV Advanced integrated semiconductors, sensor ICs, and programmable sensor IC systems | 42,818 | 3,229,879 |
| Brazil 2.1% | ||
| Sul America SA Full service insurance company | 357,100 | 5,319,172 |
| TOTVS SA Software solutions | 298,700 | 4,793,070 |
| Total | 10,112,242 | |
| Cambodia 1.0% | ||
| NagaCorp Ltd. Leisure and tourism company | 2,617,000 | 4,570,574 |
| Canada 3.2% | ||
| AG Growth International, Inc. Manufacturer of Augers & Grain Handling Equipment | 70,302 | 2,514,208 |
| CES Energy Solutions Corp.(a) Oil and natural gas industry | 1,072,832 | 1,924,992 |
| Osisko Gold Royalties Ltd. Precious metal royalty and stream company | 205,350 | 1,995,701 |
| Parex Resources, Inc.(b) Oil and gas exploration and production | 156,590 | 2,912,209 |
| Pason Systems, Inc. Rental oilfield instrumentation systems | 57,910 | 584,652 |
| Seven Generations Energy Ltd.(b) Oil and gas resources | 460,839 | 3,005,896 |
| Winpak Ltd. Packaging materials and machines for the protection of perishables | 62,632 | 2,265,951 |
| Total | 15,203,609 | |
| Common Stocks (continued) | ||
| Issuer | Shares | Value ($) |
| China 0.8% | ||
| Minth Group Ltd. Exterior automobile body parts | 666,000 | 2,351,699 |
| Xiabuxiabu Catering Management China Holdings Co., Ltd.(a),(b) Chain of restaurants in China | 1,223,000 | 1,601,415 |
| Total | 3,953,114 | |
| Cyprus 0.3% | ||
| TCS Group Holding PLC, GDR(c) Online retail financial services | 60,862 | 1,308,533 |
| Denmark 2.2% | ||
| SimCorp AS Global provider of highly specialised software for the investment management industry | 91,267 | 10,377,711 |
| France 2.3% | ||
| Akka Technologies(a) High-technology engineering consulting services | 102,036 | 7,526,801 |
| Robertet SA Liquid flavorings, perfumes and associated natural aromatic ingredients | 3,248 | 3,362,749 |
| Total | 10,889,550 | |
| Germany 6.9% | ||
| Corestate Capital Holding SA(a),(b) Real estate investment company | 80,411 | 3,382,388 |
| Deutsche Beteiligungs AG Private equity company, investing in domestic medium-sized companies | 55,596 | 2,460,182 |
| Eckert & Ziegler Strahlen- und Medizintechnik AG Equipment for the pharmaceutical industry | 16,584 | 3,522,469 |
| Hypoport AG(b) Technology service provider | 14,688 | 5,181,604 |
| Stroeer SE & Co. KGaA Digital multi-channel media company | 54,458 | 4,387,463 |
| Varta AG(b) Manufactures and markets a wide range of industrial, commercial and miniaturized batteries | 68,746 | 9,319,687 |
| Washtec AG Car, truck and railroad car washing systems | 73,746 | 4,442,112 |
| Total | 32,695,905 | |
| Wanger International | Annual Report 2019 | 9 |
December 31, 2019
| Common Stocks (continued) | ||
| Issuer | Shares | Value ($) |
| Hong Kong 2.3% | ||
| ASM Pacific Technology Ltd. Machines, tools & materials used in the semiconductor industry | 223,900 | 3,107,815 |
| Stella International Holdings Ltd. Footwear products | 1,638,500 | 2,628,396 |
| Value Partners Group Ltd. Independent, value oriented asset management group | 2,853,000 | 1,758,562 |
| Vitasoy International Holdings Ltd. Food and beverages | 1,020,000 | 3,700,169 |
| Total | 11,194,942 | |
| India 1.6% | ||
| Cholamandalam Investment and Finance Co., Ltd. Financial services provider | 567,882 | 2,430,902 |
| PI Industries Ltd. Agricultural and fine chemicals and polymers | 108,571 | 2,199,312 |
| Zee Entertainment Enterprises Ltd. Hindi films, serials, game shows and children’s programs | 764,632 | 3,130,166 |
| Total | 7,760,380 | |
| Indonesia 1.1% | ||
| PT Link Net Tbk High-speed internet connection through fiber optic lines | 7,362,500 | 2,100,162 |
| PT Tower Bersama Infrastructure Tbk Telecommunication infrastructure services to Indonesian wireless carriers | 35,175,500 | 3,114,219 |
| Total | 5,214,381 | |
| Ireland 1.2% | ||
| UDG Healthcare PLC Commercialisation solutions for health care companies | 541,842 | 5,793,088 |
| Italy 4.3% | ||
| Amplifon SpA Hearing aids | 119,289 | 3,433,049 |
| Carel Industries SpA Control solutions for HVAC and humidification systems | 374,971 | 5,829,585 |
| Freni Brembo SpA Braking systems and components | 423,958 | 5,263,719 |
| Industria Macchine Automatiche SpA Packaging machinery for the food, pharmaceuticals, and cosmetics industries | 80,914 | 5,819,239 |
| Total | 20,345,592 | |
| Common Stocks (continued) | ||
| Issuer | Shares | Value ($) |
| Japan 21.8% | ||
| Aeon Credit Service Co., Ltd. Credit card company | 123,500 | 1,945,943 |
| Aeon Mall Co., Ltd. Large-scale shopping malls | 303,200 | 5,378,019 |
| Aica Kogyo Co., Ltd. Manufactures adhesives, melamine boards, and housing materials | 68,700 | 2,266,936 |
| Aruhi Corp.(a) Finance services | 123,100 | 2,527,641 |
| Azbil Corp. Provides measurement and control technologies | 141,028 | 3,972,154 |
| CyberAgent, Inc. Operates websites, internet advertising agency and creates PC and mobile contents | 167,300 | 5,828,027 |
| Daiseki Co., Ltd. Waste Disposal & Recycling | 95,900 | 2,759,019 |
| Fuji Oil Holdings, Inc. Specialty vegetable oils and fats | 159,200 | 4,282,375 |
| Fuso Chemical Co., Ltd. Manufactures fruit acid and its salts | 148,900 | 4,400,556 |
| Glory Ltd. Vending machines, coin-operated lockers, money handling machines, and data processing terminals | 117,600 | 3,553,760 |
| Invesco Office J-REIT, Inc. Commercial and office buildings | 13,562 | 2,809,203 |
| KH Neochem Co., Ltd. Manufactures and sells petroleum chemical products | 213,200 | 4,546,095 |
| Koei Tecmo Holdings Co., Ltd. Video game software | 99,200 | 2,590,059 |
| Mandom Corp. Cosmetic products for men and women | 169,300 | 4,628,299 |
| Milbon Co., Ltd. Hair Products for Salons | 62,900 | 3,566,623 |
| Miura Co., Ltd. Industrial boilers and related equipment | 92,600 | 3,199,576 |
| Nihon Unisys Ltd. Computers and peripheral equipment | 82,100 | 2,575,395 |
| NSD Co., Ltd. Computer software development | 270,600 | 4,455,763 |
| Persol Holdings Co., Ltd. Human resource solutions | 111,800 | 2,095,261 |
| SCSK Corp. IT services | 44,600 | 2,312,705 |
| Seiren Co., Ltd. Advertising services | 502,700 | 7,226,192 |
| 10 | Wanger International | Annual Report 2019 |
December 31, 2019
| Common Stocks (continued) | ||
| Issuer | Shares | Value ($) |
| Seria Co., Ltd. Operates 100 yen chain stores | 139,500 | 3,800,472 |
| Sohgo Security Services Co., Ltd. Around the clock security services | 41,600 | 2,251,597 |
| Solasto Corp. Medical related contract services | 474,700 | 5,553,167 |
| TechnoPro Holdings, Inc. Medical & electronic design and IT & software development | 51,700 | 3,608,198 |
| Ushio, Inc. Lamps and optical equipment | 181,300 | 2,688,327 |
| Valqua Ltd. Rubber, fiber and resin products | 225,600 | 5,403,682 |
| Yokogawa Electric Corp. Information technology solutions | 188,200 | 3,304,995 |
| Total | 103,530,039 | |
| Malta 0.6% | ||
| Kindred Group PLC Online gambling services | 466,979 | 2,859,803 |
| Mexico 1.2% | ||
| Corporación Inmobiliaria Vesta SAB de CV Real estate owner, developer and asset administrator | 1,554,600 | 2,805,392 |
| Qualitas Controladora SAB de CV Insurance holding company | 661,266 | 2,785,309 |
| Total | 5,590,701 | |
| Netherlands 2.5% | ||
| Aalberts NV Industrial services and flow control systems | 81,833 | 3,683,128 |
| Argenx SE, ADR(b) Anitbody based therapies | 26,438 | 4,243,828 |
| IMCD NV Specialty chemicals and food ingredients | 46,105 | 4,036,817 |
| Total | 11,963,773 | |
| New Zealand 1.3% | ||
| Restaurant Brands New Zealand Ltd.(b) Fast food restaurant chains | 642,198 | 6,030,970 |
| Philippines 0.5% | ||
| Security Bank Corp. Financial products & services | 605,130 | 2,328,153 |
| Poland 0.8% | ||
| KRUK SA Debt collection services | 91,718 | 4,049,333 |
| Common Stocks (continued) | ||
| Issuer | Shares | Value ($) |
| Russian Federation 0.9% | ||
| TCS Group Holding PLC, GDR Online retail financial services | 203,962 | 4,385,183 |
| Singapore 1.6% | ||
| Mapletree Commercial Trust Singapore-focused real estate investment trust | 4,182,207 | 7,437,024 |
| South Africa 1.0% | ||
| Clicks Group Ltd. Owns and operates chains of retail stores | 160,000 | 2,931,201 |
| PSG Group Ltd. Diversified financial services | 124,542 | 2,082,162 |
| Total | 5,013,363 | |
| South Korea 3.1% | ||
| DoubleUGames Co., Ltd.(b) Online and mobile games | 73,849 | 3,173,371 |
| Koh Young Technology, Inc.(b) 3D measurement and inspection equipment for testing various machineries | 70,817 | 6,453,302 |
| Korea Investment Holdings Co., Ltd.(b) Financial holding company | 83,973 | 5,244,238 |
| Total | 14,870,911 | |
| Spain 0.9% | ||
| Befesa SA Waste recycling services | 96,442 | 4,099,895 |
| Sweden 7.9% | ||
| AddTech AB, Class B High-tech industrial components and systems | 185,151 | 5,989,607 |
| Dometic Group AB Transportation climate control and convenience products | 519,069 | 5,235,511 |
| Dustin Group AB IT products and related services | 436,170 | 3,499,568 |
| Sectra AB, Class B(b) Medical and communication systems | 117,693 | 4,943,972 |
| Sweco AB, Class B Consulting company specializing in engineering, environmental technology, and architecture | 332,766 | 12,829,043 |
| Trelleborg AB, Class B Manufactures and distributes industrial products | 279,979 | 5,040,159 |
| Total | 37,537,860 | |
| Wanger International | Annual Report 2019 | 11 |
December 31, 2019
| Common Stocks (continued) | ||
| Issuer | Shares | Value ($) |
| Switzerland 2.4% | ||
| Belimo Holding AG, Registered Shares Manufactures heating, ventilation and air conditioning equipment | 537 | 4,044,978 |
| Inficon Holding AG Vacuum instruments used to monitor and control production processes | 5,059 | 4,017,195 |
| Kardex AG Storage, warehouse and materials handling systems | 20,503 | 3,453,182 |
| Total | 11,515,355 | |
| Taiwan 4.3% | ||
| Basso Industry Corp. Pneumatic nailers and staplers | 857,000 | 1,406,175 |
| Getac Technology Corp. Laptops | 1,434,000 | 2,236,111 |
| Grape King Bio Ltd. Beverages, nutrition, pharmaceuticals, syrups and hair care products | 329,000 | 2,140,400 |
| Parade Technologies Ltd. Fabless semiconductor company | 186,000 | 3,823,415 |
| Silergy Corp. High performance analog integrated circuits | 45,000 | 1,432,814 |
| Sinbon Electronics Co., Ltd. Cable, connectors & modems | 981,000 | 4,055,241 |
| Voltronic Power Technology Corp. Uninterruptible power supply products, inverters, multiple surface mounted devices and other power products | 224,564 | 5,360,691 |
| Total | 20,454,847 | |
| Thailand 0.7% | ||
| Muangthai Capital PCL, Foreign Registered Shares Commercial lending company | 1,471,800 | 3,128,053 |
| United Kingdom 10.6% | ||
| Abcam PLC Research-grade antibodies via an online catalog | 215,250 | 3,854,824 |
| Dechra Pharmaceuticals PLC International veterinary pharmaceuticals | 207,506 | 7,978,610 |
| Genus PLC Cattle breeding and agricultural consultancy services | 105,250 | 4,433,194 |
| Intermediate Capital Group PLC Private equity firm | 353,755 | 7,545,220 |
| Common Stocks (continued) | ||
| Issuer | Shares | Value ($) |
| Rightmove PLC Website that lists properties across Britain | 547,558 | 4,594,641 |
| Safestore Holdings PLC Self storage facilities | 548,820 | 5,859,353 |
| Spectris PLC Products for electronic control and process instrumentation sectors | 107,708 | 4,150,812 |
| Vivo Energy PLC Petroleum products | 1,019,773 | 1,669,578 |
| WH Smith PLC Retails books, magazines, newspapers, and periodicals | 253,361 | 8,731,780 |
| Zotefoams PLC Cross-linked polyethylene block foams | 277,104 | 1,633,381 |
| Total | 50,451,393 | |
| United States 1.1% | ||
| Inter Parfums, Inc. Fragrances and related products | 72,904 | 5,300,850 |
| Total Common Stocks (Cost: $347,891,334) | 463,740,794 | |
| Securities Lending Collateral 1.2% | ||
| Shares | Value ($) | |
| Dreyfus Government Cash Management Fund, Instutional Shares, 1.512%(d),(e) | 5,523,367 | 5,523,367 |
| Total Securities Lending Collateral (Cost: $5,523,367) | 5,523,367 | |
| Money Market Funds 2.3% | ||
| Columbia Short-Term Cash Fund, 1.699%(d),(f) | 10,894,163 | 10,893,073 |
| Total Money Market Funds (Cost: $10,893,073) | 10,893,073 | |
| Total Investments in Securities (Cost: $364,307,774) | 480,157,234 | |
| Obligation to Return Collateral for Securities Loaned | (5,523,367) | |
| Other Assets & Liabilities, Net | 927,731 | |
| Net Assets | $475,561,598 | |
| 12 | Wanger International | Annual Report 2019 |
December 31, 2019
| Long futures contracts | ||||||
| Description | Number of contracts | Expiration date | Trading currency | Notional amount | Value/Unrealized appreciation ($) | Value/Unrealized depreciation ($) |
| MSCI EAFE Index Future | 70 | 03/2020 | USD | 7,127,750 | 19,728 | — |
| MSCI Emerging Markets Index | 33 | 03/2020 | USD | 1,848,330 | 18,018 | — |
| Total | 37,746 | — | ||||
| (a) | All or a portion of this security was on loan at December 31, 2019. The total market value of securities on loan at December 31, 2019 was $5,245,625. |
| (b) | Non-income producing security. |
| (c) | Represents privately placed and other securities and instruments exempt from Securities and Exchange Commission registration (collectively, private placements), such as Section 4(a)(2) and Rule 144A eligible securities, which are often sold only to qualified institutional buyers. The Fund may invest in private placements determined to be liquid as well as those determined to be illiquid. Private placements may be determined to be liquid under guidelines established by the Fund’s Board of Trustees. At December 31, 2019, the total value of these securities amounted to $1,308,533, which represents 0.28% of total net assets. |
| (d) | The rate shown is the seven-day current annualized yield at December 31, 2019. |
| (e) | Investment made with cash collateral received from securities lending activity. |
| (f) | As defined in the Investment Company Act of 1940, an affiliated company is one in which the Fund owns 5% or more of the company’s outstanding voting securities, or a company which is under common ownership or control with the Fund. Holdings and transactions in these affiliated companies during the year ended December 31, 2019 are as follows: |
| Issuer | Beginning shares | Shares purchased | Shares sold | Ending shares | Realized gain (loss) — affiliated issuers ($) | Net change in unrealized appreciation (depreciation) — affiliated issuers ($) | Dividend — affiliated issuers ($) | Value — affiliated issuers at end of period ($) |
| Columbia Short-Term Cash Fund, 1.699% | ||||||||
| 10,107,748 | 122,838,976 | (122,052,561) | 10,894,163 | 117 | — | 203,497 | 10,893,073 | |
| ADR | American Depositary Receipt |
| GDR | Global Depositary Receipt |
| USD | US Dollar |
| ■ | Level 1 – quoted prices in active markets for identical securities |
| ■ | Level 2 – prices determined using other significant observable inputs (including quoted prices for similar securities, interest rates, prepayment speeds, credit risk and others) |
| ■ | Level 3 – prices determined using significant unobservable inputs where quoted prices or observable inputs are unavailable or less reliable (including management’s own assumptions about the factors market participants would use in pricing an investment) |
| Wanger International | Annual Report 2019 | 13 |
December 31, 2019
require fair valuation and fair value techniques; circumstances under which securities will be deemed to pose a potential for stale pricing, including when securities are illiquid, restricted, or in default; and certain delegations of authority to determine fair values to the Fund’s investment manager. The Committee may also meet to discuss additional valuation matters, which may include review of back-testing results, review of time-sensitive information or approval of other valuation related actions, and to review the appropriateness of the Policies.
| Level 1 ($) | Level 2 ($) | Level 3 ($) | Total ($) | |
| Investments in Securities | ||||
| Common Stocks | ||||
| Australia | — | 20,543,788 | — | 20,543,788 |
| Belgium | — | 3,229,879 | — | 3,229,879 |
| Brazil | 10,112,242 | — | — | 10,112,242 |
| Cambodia | — | 4,570,574 | — | 4,570,574 |
| Canada | 15,203,609 | — | — | 15,203,609 |
| China | — | 3,953,114 | — | 3,953,114 |
| Cyprus | — | 1,308,533 | — | 1,308,533 |
| Denmark | — | 10,377,711 | — | 10,377,711 |
| France | — | 10,889,550 | — | 10,889,550 |
| Germany | — | 32,695,905 | — | 32,695,905 |
| Hong Kong | — | 11,194,942 | — | 11,194,942 |
| India | — | 7,760,380 | — | 7,760,380 |
| Indonesia | — | 5,214,381 | — | 5,214,381 |
| Ireland | — | 5,793,088 | — | 5,793,088 |
| Italy | — | 20,345,592 | — | 20,345,592 |
| Japan | — | 103,530,039 | — | 103,530,039 |
| Malta | — | 2,859,803 | — | 2,859,803 |
| Mexico | 5,590,701 | — | — | 5,590,701 |
| Netherlands | 4,243,828 | 7,719,945 | — | 11,963,773 |
| New Zealand | — | 6,030,970 | — | 6,030,970 |
| Philippines | — | 2,328,153 | — | 2,328,153 |
| Poland | — | 4,049,333 | — | 4,049,333 |
| Russian Federation | — | 4,385,183 | — | 4,385,183 |
| Singapore | — | 7,437,024 | — | 7,437,024 |
| South Africa | — | 5,013,363 | — | 5,013,363 |
| South Korea | — | 14,870,911 | — | 14,870,911 |
| Spain | — | 4,099,895 | — | 4,099,895 |
| Sweden | — | 37,537,860 | — | 37,537,860 |
| Switzerland | — | 11,515,355 | — | 11,515,355 |
| Taiwan | — | 20,454,847 | — | 20,454,847 |
| Thailand | — | 3,128,053 | — | 3,128,053 |
| United Kingdom | — | 50,451,393 | — | 50,451,393 |
| United States | 5,300,850 | — | — | 5,300,850 |
| Total Common Stocks | 40,451,230 | 423,289,564 | — | 463,740,794 |
| Securities Lending Collateral | 5,523,367 | — | — | 5,523,367 |
| Money Market Funds | 10,893,073 | — | — | 10,893,073 |
| Total Investments in Securities | 56,867,670 | 423,289,564 | — | 480,157,234 |
| Investments in Derivatives | ||||
| Asset | ||||
| Futures Contracts | 37,746 | — | — | 37,746 |
| Total | 56,905,416 | 423,289,564 | — | 480,194,980 |
| 14 | Wanger International | Annual Report 2019 |
December 31, 2019
| Assets | |
| Investments in securities, at value* | |
| Unaffiliated issuers (cost $353,414,701) | $469,264,161 |
| Affiliated issuers (cost $10,893,073) | 10,893,073 |
| Cash | 5,667 |
| Foreign currency (cost $5,653) | 5,648 |
| Margin deposits on: | |
| Futures contracts | 400,800 |
| Receivable for: | |
| Investments sold | 397,131 |
| Capital shares sold | 129 |
| Dividends | 541,097 |
| Securities lending income | 39,743 |
| Foreign tax reclaims | 543,628 |
| Variation margin for futures contracts | 40,815 |
| Prepaid expenses | 12,941 |
| Trustees’ deferred compensation plan | 258,019 |
| Total assets | 482,402,852 |
| Liabilities | |
| Due upon return of securities on loan | 5,523,367 |
| Payable for: | |
| Investments purchased | 98,012 |
| Capital shares purchased | 689,280 |
| Investment advisory fee | 12,524 |
| Service fees | 69,656 |
| Administration fees | 654 |
| Trustees’ fees | 489 |
| Compensation of chief compliance officer | 932 |
| Other expenses | 188,321 |
| Trustees’ deferred compensation plan | 258,019 |
| Total liabilities | 6,841,254 |
| Net assets applicable to outstanding capital stock | $475,561,598 |
| Represented by | |
| Paid in capital | 345,789,347 |
| Total distributable earnings (loss) | 129,772,251 |
| Total - representing net assets applicable to outstanding capital stock | $475,561,598 |
| Shares outstanding | 18,292,871 |
| Net asset value per share | 26.00 |
| * Includes the value of securities on loan | 5,245,625 |
| Wanger International | Annual Report 2019 | 15 |
Year Ended December 31, 2019
| Net investment income | |
| Income: | |
| Dividends — unaffiliated issuers | $10,548,795 |
| Dividends — affiliated issuers | 203,497 |
| Income from securities lending — net | 168,525 |
| Foreign taxes withheld | (905,384) |
| Total income | 10,015,433 |
| Expenses: | |
| Investment advisory fee | 4,353,252 |
| Service fees | 463,951 |
| Administration fees | 226,569 |
| Trustees’ fees | 49,210 |
| Custodian fees | 129,943 |
| Printing and postage fees | 153,977 |
| Audit fees | 67,555 |
| Legal fees | 97,073 |
| Compensation of chief compliance officer | 1,890 |
| Other | 30,087 |
| Total expenses | 5,573,507 |
| Fees waived by transfer agent | (128,826) |
| Total net expenses | 5,444,681 |
| Net investment income | 4,570,752 |
| Realized and unrealized gain (loss) — net | |
| Net realized gain (loss) on: | |
| Investments — unaffiliated issuers | 15,882,052 |
| Investments — affiliated issuers | 117 |
| Foreign currency translations | (66,812) |
| Futures contracts | (114,489) |
| Net realized gain | 15,700,868 |
| Net change in unrealized appreciation (depreciation) on: | |
| Investments — unaffiliated issuers | 98,412,313 |
| Foreign currency translations | 363 |
| Futures contracts | 37,746 |
| Net change in unrealized appreciation (depreciation) | 98,450,422 |
| Net realized and unrealized gain | 114,151,290 |
| Net increase in net assets resulting from operations | $118,722,042 |
| 16 | Wanger International | Annual Report 2019 |
| Year Ended December 31, 2019 | Year Ended December 31, 2018 | |
| Operations | ||
| Net investment income | $4,570,752 | $5,509,775 |
| Net realized gain | 15,700,868 | 42,430,610 |
| Net change in unrealized appreciation (depreciation) | 98,450,422 | (140,751,833) |
| Net increase (decrease) in net assets resulting from operations | 118,722,042 | (92,811,448) |
| Distributions to shareholders | ||
| Net investment income and net realized gains | (45,173,034) | (71,062,256) |
| Total distributions to shareholders | (45,173,034) | (71,062,256) |
| Increase (decrease) in net assets from capital stock activity | (24,346,877) | 12,145,365 |
| Total increase (decrease) in net assets | 49,202,131 | (151,728,339) |
| Net assets at beginning of year | 426,359,467 | 578,087,806 |
| Net assets at end of year | $475,561,598 | $426,359,467 |
| Year Ended | Year Ended | |||
| December 31, 2019 | December 31, 2018 | |||
| Shares | Dollars ($) | Shares | Dollars ($) | |
| Capital stock activity | ||||
| Subscriptions | 208,640 | 4,991,862 | 504,907 | 13,396,267 |
| Distributions reinvested | 1,957,373 | 45,173,034 | 2,539,748 | 71,062,256 |
| Redemptions | (3,076,078) | (74,511,773) | (2,583,573) | (72,313,158) |
| Total net increase (decrease) | (910,065) | (24,346,877) | 461,082 | 12,145,365 |
| Wanger International | Annual Report 2019 | 17 |
| Year Ended December 31, | |||||
| 2019 | 2018 | 2017 | 2016 | 2015 | |
| Per share data | |||||
| Net asset value, beginning of period | $22.20 | $30.84 | $23.64 | $26.32 | $29.07 |
| Income from investment operations: | |||||
| Net investment income | 0.24 | 0.29 | 0.25 | 0.31 | 0.31 |
| Net realized and unrealized gain (loss) | 6.08 | (4.93) | 7.49 | (0.56) | (0.09) |
| Total from investment operations | 6.32 | (4.64) | 7.74 | (0.25) | 0.22 |
| Less distributions to shareholders from: | |||||
| Net investment income | (0.20) | (0.60) | (0.34) | (0.29) | (0.41) |
| Net realized gains | (2.32) | (3.40) | (0.20) | (2.14) | (2.57) |
| Total distributions to shareholders | (2.52) | (4.00) | (0.54) | (2.43) | (2.98) |
| Proceeds from regulatory settlements | — | — | — | — | 0.01 |
| Net asset value, end of period | $26.00 | $22.20 | $30.84 | $23.64 | $26.32 |
| Total return | 29.99%(a) | (17.70)%(a) | 32.91%(a) | (1.41)% | 0.10%(b) |
| Ratios to average net assets | |||||
| Total gross expenses(c) | 1.23% | 1.19% | 1.16% | 1.08%(d) | 1.12% |
| Total net expenses(c) | 1.20% | 1.13% | 1.12% | 1.08%(d) | 1.12% |
| Net investment income | 1.01% | 1.03% | 0.92% | 1.23% | 1.11% |
| Supplemental data | |||||
| Portfolio turnover | 42% | 47% | 55% | 56% | 53% |
| Net assets, end of period (in thousands) | $475,562 | $426,359 | $578,088 | $494,795 | $586,629 |
| Notes to Financial Highlights | |
| (a) | Had the Investment Manager and/or its affiliates not waived a portion of expenses, total return would have been reduced. |
| (b) | The Fund received proceeds from regulatory settlements. Had the Fund not received these proceeds, the total return would have been lower by 0.02%. |
| (c) | In addition to the fees and expenses that the Fund bears directly, the Fund indirectly bears a pro rata share of the fees and expenses of any other funds in which it invests, if any. Such indirect expenses are not included in the Fund’s reported expense ratios. |
| (d) | Expenses have been reduced due to a reimbursement of expenses overbilled by a third party. If the reimbursement had been excluded, the expense ratios would have been higher by 0.05%. All fee waivers and expense reimbursements by the Investment Manager and its affiliates were applied before giving effect to this third party reimbursement. |
| 18 | Wanger International | Annual Report 2019 |
December 31, 2019
| Wanger International | Annual Report 2019 | 19 |
December 31, 2019
| 20 | Wanger International | Annual Report 2019 |
December 31, 2019
| Wanger International | Annual Report 2019 | 21 |
December 31, 2019
| Asset derivatives | ||
| Risk exposure category | Statement of assets and liabilities location | Fair value ($) |
| Equity risk | Component of total distributable earnings (loss) — unrealized appreciation on futures contracts | 37,746* |
| * | Includes cumulative appreciation (depreciation) as reported in the tables following the Portfolio of Investments. Only the current day’s variation margin is reported in receivables or payables in the Statement of Assets and Liabilities. |
| Amount of realized gain (loss) on derivatives recognized in income | |
| Risk exposure category | Futures contracts ($) |
| Equity risk | (114,489) |
| Change in unrealized appreciation (depreciation) on derivatives recognized in income | |
| Risk exposure category | Futures contracts ($) |
| Equity risk | 37,746 |
| Derivative instrument | Average notional amounts ($)* |
| Futures contracts — long | 3,075,185 |
| * | Based on the ending quarterly outstanding amounts for the year ended December 31, 2019. |
| 22 | Wanger International | Annual Report 2019 |
December 31, 2019
| Overnight and continuous | Up to 30 days | 30-90 days | Greater than 90 days | Total | |
| Wanger International | |||||
| Securities lending transactions | |||||
| Equity securities | $5,245,625 | $— | $— | $— | $5,245,625 |
| Gross amount of recognized liabilities for securities lending (collateral received) | 5,523,367 | ||||
| Amounts due to counterparty in the event of default | $277,742 |
| Goldman Sachs ($) | |
| Liabilities | |
| Collateral on Securities Loaned | 5,523,367 |
| Total Liabilities | 5,523,367 |
| Total Financial and Derivative Net Assets | (5,523,367) |
| Financial Instruments | 5,245,625 |
| Net Amount (a) | (277,742) |
| (a) | Represents the net amount due from/(to) counterparties in the event of default. |
| Wanger International | Annual Report 2019 | 23 |
December 31, 2019
| Average daily net assets | Annual fee rate |
| Up to $100 million | 1.10% |
| $100 million to $250 million | 0.95% |
| $250 million to $500 million | 0.90% |
| $500 million to $1 billion | 0.80% |
| $1 billion and over | 0.72% |
| 24 | Wanger International | Annual Report 2019 |
December 31, 2019
| Aggregate average daily net assets of the Trust | Annual fee rate |
| Up to $4 billion | 0.05% |
| $4 billion to $6 billion | 0.04% |
| $6 billion to $8 billion | 0.03% |
| $8 billion and over | 0.02% |
| Wanger International | Annual Report 2019 | 25 |
December 31, 2019
| Excess of distributions over net investment income ($) | Accumulated net realized gain ($) | Paid in capital ($) |
| 474,033 | (474,032) | (1) |
| Year Ended December 31, 2019 | Year Ended December 31, 2018 | ||||
| Ordinary income ($) | Long-term capital gains ($) | Total ($) | Ordinary income ($) | Long-term capital gains ($) | Total ($) |
| 3,644,597 | 41,528,437 | 45,173,034 | 15,604,863 | 55,457,394 | 71,062,257 |
| Undistributed ordinary income ($) | Undistributed long-term capital gains ($) | Capital loss carryforwards ($) | Net unrealized appreciation ($) |
| 8,398,595 | 15,054,274 | — | 106,565,630 |
| Federal tax cost ($) | Gross unrealized appreciation ($) | Gross unrealized (depreciation) ($) | Net unrealized appreciation ($) |
| 373,629,350 | 118,264,188 | (11,698,558) | 106,565,630 |
| 26 | Wanger International | Annual Report 2019 |
December 31, 2019
| Wanger International | Annual Report 2019 | 27 |
December 31, 2019
| 28 | Wanger International | Annual Report 2019 |
| Wanger International | Annual Report 2019 | 29 |
| Dividends received deduction | Capital gain dividend | Foreign taxes paid to foreign countries | Foreign taxes paid per share to foreign countries | Foreign source income | Foreign source income per share |
| 0.52% | $15,863,673 | $843,640 | $0.05 | $10,356,442 | $0.57 |
Shareholder Services Group
71 S Wacker Drive, Suite 2500
Chicago, IL 60606
800.922.6769
| 30 | Wanger International | Annual Report 2019 |
| Name and age at December 31, 2019 | Year first appointed or elected to a Board in the Columbia Funds Complex | Principal occupation(s) during the past five years | Number of Funds in the Columbia Funds Complex overseen (1) | Other directorships held by the Trustee during the past five years in addition to Columbia Acorn Trust and Wanger Advisors Trust |
| Laura M. Born, 54, Chair | 2007 | Adjunct Professor of Finance, University of Chicago Booth School of Business since 2007; Advisory Board Member, Driehaus Capital Management since 2018; Director, Carlson Inc. (private global travel company) since 2015; Managing Director – Investment Banking, JP Morgan Chase & Co. (broker-dealer) 2002-2007. | 11 | None. |
| Maureen M. Culhane, 71 | 2007 | Retired. Formerly, Vice President, Goldman Sachs Asset Management, L.P. (investment adviser), 2005-2007; Vice President (Consultant) – Strategic Relationship Management, Goldman, Sachs & Co., 1999-2005. | 11 | None. |
| Margaret M. Eisen, 66 | 2002 | Trustee, Smith College, 2012-2016; Chief Investment Officer, EAM International LLC (corporate finance and asset management), 2003-2013; Managing Director, CFA Institute, 2005-2008. | 11 | Chair, RMB Investors Trust (9 series). |
| Eric A. Feldstein (2), 60 | 2018 | Chief Financial Officer, Health Care Service Corporation (HCSC) since 2016; Executive Vice President, American Express Company, 2010-2016. | 11 | Board Member, (as HCSC’s delegate), BCS Financial Corporation, 2016-2019; Board Member, Northern Trust Mutual Fund Complex (51 series), 2015-2016. |
| John C. Heaton, 60 | 2010 | Joseph L. Gidwitz Professor of Finance, University of Chicago Booth School of Business since July 2000; Deputy Dean for Faculty, University of Chicago Booth School of Business, 2012-2019. | 11 | None. |
| Charles R. Phillips, 63 | 2015 | Retired. Formerly, Vice Chairman, J.P. Morgan Private Bank, 2011-2014; Managing Director, J.P. Morgan Private Bank, 2001-2011. | 11 | None. |
| David J. Rudis, 66, Vice Chair | 2010 | Chief Executive Officer, Finger Rock, LLC (strategic consulting business). Formerly, National Checking and Debit Executive, and Illinois President, Bank of America, 2007-2009; President, Consumer Banking Group, LaSalle National Bank, 2004-2007. | 11 | None. |
| Name and age at December 31, 2019 | Year first appointed or elected to a Board in the Columbia Funds Complex | Principal occupation(s) during the past five years | Number of Funds in the Columbia Funds Complex overseen (1) | Other directorships held by the Trustee during the past five years in addition to Columbia Acorn Trust and Wanger Advisors Trust |
| Ralph Wanger, 85 (3) | 1970 (4) | Founder, CWAM. Formerly, President, Chief Investment Officer and portfolio manager, CWAM or its predecessors, July 1992-September 2003; Director, Wanger Investment Company PLC; Consultant, CWAM or its predecessors, September 2003-September 2005. | 11 | None. |
| (1) | The Trustees oversee the series of Wanger Advisors Trust and Columbia Acorn Trust. |
| Wanger International | Annual Report 2019 | 31 |
| (2) | Mr. Feldstein no longer serves as a trustee of the Trust effective January 1, 2020. |
| (3) | As permitted under the Trust’s Bylaws, Mr. Wanger serves as a non-voting Trustee Emeritus of Columbia Acorn Trust and Wanger Advisors Trust. |
| (4) | Dates prior to April 1992 correspond to the date first elected as a director of The Acorn Fund, Inc., the Trust’s predecessor. |
| Name and age at December 31, 2019 | Position held with Columbia Acorn Trust and Wanger Advisors Trust | Year first appointed or elected to office | Principal occupation(s) during the past five years |
| Michael G. Clarke, 50 | Assistant Treasurer | 2004 | Vice President – Accounting and Tax, Columbia Management Investment Advisers, LLC since May 2010; senior officer of Columbia Funds and affiliated funds since 2002. |
| David L. Frank, 56 | Vice President | 2014 | Portfolio manager and/or analyst, CWAM or its predecessors since 2002. |
| Paul B. Goucher, 51 | Assistant Secretary | 2015 | Senior Vice President and Assistant General Counsel, Ameriprise Financial, Inc. since January 2017 (previously Vice President and Lead Chief Counsel, November 2008 - January 2017 and January 2013 - January 2017, respectively); Vice President, Chief Legal Officer and Assistant Secretary, Columbia Management Investment Advisers, LLC since March 2015. |
| Tae Han (Simon) Kim, 39 | Vice President | 2018 | Portfolio manager and/or analyst, CWAM since 2011. |
| John Kunka, 49 | Treasurer | 2006 | Vice President, Treasurer and Principal Accounting and Financial Officer, Columbia Acorn Trust and Wanger Advisors Trust since 2014; Treasurer and Chief Financial Officer, CWAM since 2014; Vice President of Accounting and Operations, CWAM since May 2006. |
| Stephen Kusmierczak, 52 | Vice President | 2011 | Portfolio manager and/or analyst, CWAM or its predecessors since 2001. |
| Joseph C. LaPalm, 50 | Vice President | 2006 | Chief Compliance Officer, CWAM since 2005. |
| Ryan C. Larrenaga, 49 | Assistant Secretary | 2015 | Vice President and Chief Counsel, Ameriprise Financial, Inc. since August 2018 (previously, Vice President and Group Counsel, August 2011 - August 2018); officer of Columbia Funds and affiliated funds since 2005. |
| Matthew A. Litfin, 48 | Co-President | 2019 | Director of Research (U.S.) and portfolio manager, CWAM since December 2015; Vice President, Columbia Acorn Trust and Wanger Advisors Trust, 2016 - 2019; formerly, portfolio manager, William Blair & Company 1993-2015. |
| Satoshi Matsunaga, 48 | Vice President | 2015 | Portfolio manager and/or analyst, CWAM or its predecessors since 2005. |
| Thomas P. McGuire, 47 | Chief Compliance Officer | 2015 | Senior Vice President and Chief Compliance Officer of the Columbia Funds since 2012; Vice President – Asset Management Compliance, Ameriprise Financial, Inc., since May 2010; Chief Compliance Officer, Ameriprise Certificate Company since September 2010. |
| Louis J. Mendes III, 55 | Co-President | 2019 | Director of International Research, CWAM, since 2015; Principal Executive Officer, Columbia Acorn Trust and Wanger Advisors Trust since 2019; Vice President, Columbia Acorn Trust and Wanger Advisors Trust, 2003-2019; portfolio manager and/or analyst, CWAM or its predecessors since 2001. |
| Julian Quero, 52 | Assistant Treasurer | 2015 | Vice President – Tax, Columbia Management Investment Advisers, LLC since 2009. |
| Martha A. Skinner, 45 | Assistant Treasurer | 2016 | Vice President of Financial Reporting and Administration, Columbia Management since November 2015; Director of Financial Reporting, Columbia Management, April 2013-November 2015. |
| Richard Watson, 50 | Vice President | 2018 | Portfolio manager and/or analyst, CWAM or its predecessors since 2006. |
| Linda Roth-Wiszowaty, 50 | Secretary | 2006 | Business support analyst, CWAM since April 2007. |
| Charles C. Young, 51 | Vice President | 2018 | Portfolio manager and/or analyst, CWAM since 2011; associated with CWAM or its predecessors since 1995. |
| 32 | Wanger International | Annual Report 2019 |
Item 2. Code of Ethics.
(a)The registrant has adopted a code of ethics that applies to the registrant's principal executive officer, principal financial officer, principal accounting officer or controller, or persons performing similar functions, regardless of whether these individuals are employed by the registrant or a third party.
(b)During the period covered by this report, there were not any amendments to a provision of the code of ethics that applies to the registrant's principal executive officer, principal financial officer, principal accounting officer or controller, or persons performing similar functions, regardless of whether these individuals are employed by the registrant or a third party, and that relates to any element of the code of ethics definition enumerated in paragraph (b) of this Item.
(c)During the period covered by this report, there were no waivers, including any implicit waivers, from a provision of the code of ethics to the registrant's principal executive officer, principal financial officer, principal accounting officer or controller, or persons performing similar functions, regardless of whether these individuals are employed by the registrant or a third party that relates to one or more of the items set forth in paragraph (b) of this Item.
Item 3. Audit Committee Financial Expert.
During the period covered by this report, registrant's Board of Trustees determined that Eric Feldstein, a member of the registrant's Board of Trustees and Audit Committee, qualified as an audit committee financial expert. During the period covered by this report, Mr. Feldstein was an independent trustee, as defined in paragraph (a)(2) of this item's instructions. Mr. Feldstein no longer serves on the registrant's Board of Trustees effective January 1, 2020.
Item 4. Principal Accountant Fees and Services.
Fee information below is disclosed for the three series of the registrant whose reports to stockholders are included in this annual filing.
(a)Audit Fees. Aggregate Audit Fees billed by the principal accountant for professional services rendered during the fiscal years ended December 31, 2019 and December 31,
2018 are approximately as follows:
2019 | 2018 |
$87,000 | $95,000 |
Audit Fees include amounts related to the audit of the registrant's annual financial statements or services that are normally provided by the accountant in connection with statutory and regulatory filings or engagements for those fiscal years.
(b)Audit-Related Fees. Aggregate Audit-Related Fees billed to the registrant by the principal accountant for professional services rendered during the fiscal years ended December 31, 2019 and December 31, 2018 are approximately as follows:
2019 | 2018 |
$7,000 | $6,900 |
Audit-Related Fees include amounts for assurance and related services by the principal accountant that are reasonably related to the performance of the audit of the registrant's financial statements and are not reported in Audit Fees above. In both fiscal years 2019 and 2018, Audit-Related Fees consist of agreed-upon procedures performed for other audit-related additional testing.
During the fiscal years ended December 31, 2019 and December 31, 2018, there were no Audit-Related Fees billed by the registrant's principal accountant to the registrant's investment adviser (not including any sub-adviser whose role is primarily portfolio management and is subcontracted with or overseen by another investment adviser) and any entity controlling, controlled by, or under common control with the adviser that provides ongoing services to the registrant for an engagement that related directly to the operations and financial reporting of the registrant.
(c)Tax Fees. Aggregate Tax Fees billed by the principal accountant to the registrant for professional services rendered during the fiscal years ended December 31, 2019 and December 31, 2018 are approximately as follows:
2019 | 2018 |
$25,800 | $25,400 |
Tax Fees incurred in both fiscal years 2019 and 2018 relate to the review of annual tax returns, the review of required shareholder distribution calculations and include amounts for professional services by the principal accountant for tax compliance, tax advice and tax planning.
During the fiscal years ended December 31, 2019 and December 31, 2018, there were no Tax Fees billed by the registrant's principal accountant to the registrant's investment adviser (not including any sub-adviser whose role is primarily portfolio management and is subcontracted with or overseen by another investment adviser) and any entity controlling, controlled by, or under common control with the adviser that provides ongoing services to the registrant for an engagement that related directly to the operations and financial reporting of the registrant.
(d)All Other Fees. Aggregate All Other Fees billed by the principal accountant to the registrant for professional services rendered during the fiscal years ended December 31,
2019 and December 31, 2018 are as follows:
2019 | 2018 |
$0 | $0 |
All Other Fees include amounts for products and services provided by the principal accountant, other than the services reported in paragraphs (a) through (c) above. Aggregate All Other Fees billed by the registrant's principal accountant to the registrant's investment adviser (not including any sub-adviser whose role is primarily portfolio management and is subcontracted with or overseen by another investment adviser) and any entity controlling, controlled by, or under common control with the adviser that provides ongoing services to the registrant for an engagement that related directly to the operations and financial reporting of the registrant during the fiscal years ended December 31, 2019 and December 31, 2018 are approximately as follows:
2019 | 2018 |
$225,000 | $225,000 |
In both fiscal years 2019 and 2018, All Other Fees primarily consist of professional services rendered for internal control reviews.
(e)(1) Audit Committee Pre-Approval Policies and Procedures
The policy of the registrant's Audit Committee is to specifically pre-approve (i) all audit and non-audit (including audit related, tax and all other) services provided by the registrant's independent auditor to the registrant and individual funds (collectively "Fund Services") and (ii) all non-audit services provided by the registrant's independent auditor to the funds' adviser or a control affiliate of the adviser, that relate directly to the funds' operations and financial reporting (collectively "Fund-related Adviser Services"). A "control affiliate" is an entity controlling, controlled by, or under common control with the adviser that provides ongoing services to the funds, and the term "adviser" is deemed to exclude any unaffiliated sub-adviser whose role is primarily portfolio management and is sub-contracted or overseen by another investment adviser.
If such Fund Services or Fund-related Adviser Services are required during the period between the Audit Committee's regularly scheduled meetings, the Chairman of the Audit Committee has the authority to pre-approve the service, with reporting to the full Audit Committee at the next regularly scheduled meeting.
The Audit Committee will waive pre-approval of Fund Services or Fund-related Adviser Services provided that the requirements under paragraph (c)(7)(i)(C) of Rule 2-01 of Regulation S-X are met.
(e)(2) The percentage of services described in paragraphs (b) through (d) of this Item approved pursuant to the "de minimis" exception under paragraph (c)(7)(i)(C) of Rule 2- 01 of Regulation S-X during both fiscal years ended December 31, 2019 and December 31, 2018 was zero.
(f)Not applicable.
(g)The aggregate non-audit fees billed by the registrant's accountant for services rendered to the registrant, and rendered to the registrant's investment adviser (not including any sub-adviser whose role is primarily portfolio management and is subcontracted with or overseen by another investment adviser), and any entity controlling, controlled by, or under common control with the adviser that provides ongoing services to the registrant for the fiscal years ended December 31, 2019 and December 31, 2018 are approximately as follows:
2019 | 2018 |
$257,800 | $257,300 |
(h)The registrant's Audit Committee of the Board of Directors has considered whether the provision of non-audit services that were rendered to the registrant's adviser (not including any sub-adviser whose role is primarily portfolio management and is subcontracted with or overseen by another investment adviser), and any entity controlling, controlled by, or under common control with the investment adviser that provides ongoing services to the registrant that were not pre-approved pursuant to paragraph (c)(7)(ii) of Rule 2-01 of Regulation S-X, is compatible with maintaining the principal accountant's independence.
Item 5. Audit Committee of Listed Registrants.
Not applicable.
Item 6. Investments
(a)The registrant's "Schedule I – Investments in securities of unaffiliated issuers" (as set forth in 17 CFR 210.12-12) is included in Item 1 of this Form N-CSR.
(b)Not applicable
Item 7. Disclosure of Proxy Voting Policies and Procedures for Closed-End Management Investment Companies.
Not applicable.
Item 8. Portfolio Managers of Closed-End Management Investment Companies.
Not applicable.
Item 9. Purchases of Equity Securities by Closed-End Management Investment Company and Affiliated Purchasers.
Not applicable.
Item 10. Submission of Matters to a Vote of Security Holders.
There were no material changes to the procedures by which shareholders may recommend nominees to the registrant's board of directors.
Item 11. Controls and Procedures.
(a)The registrant's principal executive officer and principal financial officer, based on their evaluation of the registrant's disclosure controls and procedures as of a date within 90 days of the filing of this report, have concluded that such controls and procedures are adequately designed to ensure that information required to be disclosed by the registrant in Form N-CSR is accumulated and communicated to the registrant's management, including the principal executive officer and principal financial officer, or persons performing similar functions, as appropriate to allow timely decisions regarding required disclosure.
(b)There was no change in the registrant's internal control over financial reporting that occurred during the period covered by this report that has materially affected, or is reasonably likely to materially affect, the registrant's internal control over financial reporting.
Item 12. Disclosure of Securities Lending Activities for Closed-End Management Investment Companies
Not applicable.
Item 13. Exhibits.
(a)(1) Code of ethics required to be disclosed under Item 2 of Form N-CSR attached hereto as Exhibit 99.CODE ETH.
(a)(2) Certifications pursuant to Rule 30a-2(a) under the Investment Company Act of 1940 (17 CFR 270.30a-2(a)) attached hereto as Exhibit 99.CERT.
(a)(3) Not applicable.
(b)Certification pursuant to Rule 30a-2(b) under the Investment Company Act of 1940
(17 CFR 270.30a-2(b)) attached hereto as Exhibit 99.906CERT.
SIGNATURES
Pursuant to the requirements of the Securities Exchange Act of 1934 and the Investment Company Act of 1940, the registrant has duly caused this report to be signed on its behalf by the undersigned, thereunto duly authorized.
(registrant) |
| Wanger Advisors Trust |
| |
By (Signature and Title) | /s/ Louis Mendes |
| ||
|
|
| Louis Mendes, Co-President and Principal Executive Officer | |
Date |
| February 21, 2020 |
| |
Pursuant to the requirements of the Securities Exchange Act of 1934 and the Investment Company Act of 1940, this report has been signed below by the following persons on behalf of the registrant and in the capacities and on the dates indicated.
By (Signature and Title) | /s/ Louis Mendes |
| ||
|
| Louis Mendes, Co-President and Principal Executive Officer | ||
Date |
| February 21, 2020 |
| |
By (Signature and Title) | /s/ John M. Kunka |
| ||
|
| John M. Kunka, Treasurer and Principal Accounting and Financial Officer | ||
Date |
| February 21, 2020 |
| |