Table of Contents
UNITED STATES
SECURITIES AND EXCHANGE COMMISSION
Washington, D.C. 20549
FORM N-CSR
CERTIFIED SHAREHOLDER REPORT OF REGISTERED
MANAGEMENT INVESTMENT COMPANIES
Investment Company Act file number 811-08748
Wanger Advisors Trust
(Exact name of registrant as specified in charter)
227 W. Monroe Street
Suite 3000
Chicago, IL 60606
(Address of principal executive offices) (Zip code)
Mary C. Moynihan
Perkins Coie LLP
700 13th Street, NW
Suite 600
Washington, DC 20005
Paul B. Goucher, Esq.
Columbia Management Investment Advisers, LLC
100 Park Avenue
New York, New York 10017
P. Zachary Egan
Columbia Acorn Trust
227 West Monroe Street, Suite 3000
Chicago, Illinois 60606
(Name and address of agent for service)
Registrant’s telephone number, including area code: (312) 634-9200
Date of fiscal year end: December 31
Date of reporting period: December 31, 2017
Form N-CSR is to be used by management investment companies to file reports with the Commission not later than 10 days after the transmission to stockholders of any report that is required to be transmitted to stockholders under Rule 30e-1 under the Investment Company Act of 1940 (17 CFR 270.30e-1). The Commission may use the information provided on Form N-CSR in its regulatory, disclosure review, inspection, and policymaking roles.
A registrant is required to disclose the information specified by Form N-CSR, and the Commission will make this information public. A registrant is not required to respond to the collection of information contained in Form N-CSR unless the Form displays a currently valid Office of Management and Budget (“OMB”) control number. Please direct comments concerning the accuracy of the information collection burden estimate and any suggestions for reducing the burden to Secretary, Securities and Exchange Commission, 450 Fifth Street, NW, Washington, DC 20549-0609. The OMB has reviewed this collection of information under the clearance requirements of 44 U.S.C. § 3507.
Table of Contents
Item 1. Reports to Stockholders.
Table of Contents

December 31, 2017

Table of Contents
Table of Contents
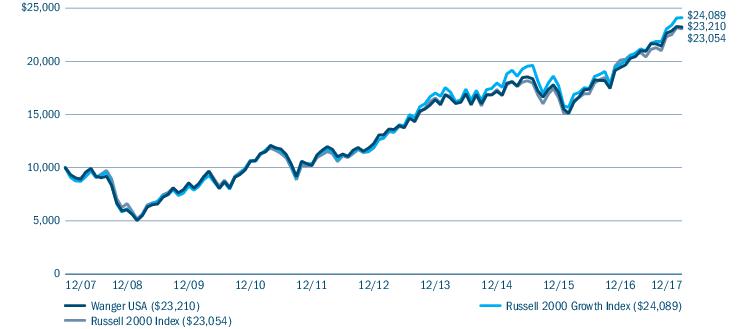
| Average annual total returns (%) (for the period ended December 31, 2017) | ||||||
| Inception | 1 Year | 5 Years | 10 Years | Life | ||
| Wanger USA | 05/03/95 | 19.58 | 13.62 | 8.78 | 11.85 | |
| Russell 2000 Growth Index | 22.17 | 15.21 | 9.19 | - | ||
| Wanger USA | Annual Report 2017 | 3 |
Table of Contents
| Top ten holdings (%) (at December 31, 2017) | |
| HealthSouth Corp. Inpatient rehabilitative healthcare services | 2.0 |
| Extended Stay America, Inc. Hotels and motels | 1.8 |
| AMN Healthcare Services, Inc. Temporary healthcare staffing | 1.6 |
| Houlihan Lokey, Inc. Investment bank | 1.6 |
| Dave & Buster’s Entertainment, Inc. Venues that combine dining and entertainment for adults and families | 1.6 |
| Monolithic Power Systems, Inc. Power management solutions | 1.5 |
| Brink’s Co. (The) Provides security services globally | 1.5 |
| First Busey Corp. Multi-bank holding company | 1.5 |
| OM Asset Management PLC Domestic and international equities, fixed income, and alternative investments | 1.4 |
| Texas Roadhouse, Inc. Moderately priced, full service restaurant chain | 1.4 |
| Portfolio breakdown (%) (at December 31, 2017) | |
| Common Stocks | 96.3 |
| Money Market Funds | 0.7 |
| Securities Lending Collateral | 3.0 |
| Total | 100.0 |
| Equity sector breakdown (%) (at December 31, 2017) | |
| Consumer Discretionary | 19.8 |
| Consumer Staples | 3.4 |
| Energy | 1.4 |
| Financials | 12.8 |
| Health Care | 28.1 |
| Industrials | 10.7 |
| Information Technology | 20.0 |
| Materials | 1.7 |
| Real Estate | 2.1 |
| Total | 100.0 |
| 4 | Wanger USA | Annual Report 2017 |
Table of Contents


| Wanger USA | Annual Report 2017 | 5 |
Table of Contents
| 6 | Wanger USA | Annual Report 2017 |
Table of Contents
(Unaudited)
| July 1, 2017 — December 31, 2017 | |||||||
| Account value at the beginning of the period ($) | Account value at the end of the period ($) | Expenses paid during the period ($) | Fund’s annualized expense ratio (%) | ||||
| Actual | Hypothetical | Actual | Hypothetical | Actual | Hypothetical | Actual | |
| Wanger USA | 1,000.00 | 1,000.00 | 1,072.60 | 1,020.00 | 5.12 | 4.99 | 0.99 |
| Wanger USA | Annual Report 2017 | 7 |
Table of Contents
December 31, 2017
| Common Stocks 99.1% | ||
| Issuer | Shares | Value ($) |
| Consumer Discretionary 19.6% | ||
| Auto Components 3.6% | ||
| Cooper-Standard Holding, Inc.(a) Sealing, fuel and brake delivery, fluid transfer systems, anti-vibration systems components, subsystems, and modules | 51,989 | 6,368,653 |
| Dorman Products, Inc.(a) Automotive products and home hardware | 107,967 | 6,601,102 |
| LCI Industries Recreational vehicles and equipment | 48,328 | 6,282,640 |
| Tenneco, Inc. Emission control and ride control products and systems | 94,109 | 5,509,141 |
| Total | 24,761,536 | |
| Distributors 0.6% | ||
| Pool Corp. Swimming pool supplies, equipment and leisure products | 33,429 | 4,334,070 |
| Diversified Consumer Services 2.6% | ||
| Adtalem Global Education, Inc.(a) Higher education institutions | 177,885 | 7,480,064 |
| Bright Horizons Family Solutions, Inc.(a) Child care and early education services | 64,733 | 6,084,902 |
| Laureate Education, Inc., Class A(a) Provides educational services | 293,552 | 3,980,565 |
| Total | 17,545,531 | |
| Hotels, Restaurants & Leisure 6.6% | ||
| Dave & Buster’s Entertainment, Inc.(a) Venues that combine dining and entertainment for adults and families | 193,647 | 10,683,505 |
| Extended Stay America, Inc. Hotels and motels | 633,763 | 12,041,497 |
| Papa John’s International, Inc. Pizza delivery and carry-out restaurants | 83,190 | 4,667,791 |
| Red Robin Gourmet Burgers, Inc.(a) Chain of specialty restaurants | 72,633 | 4,096,501 |
| Texas Roadhouse, Inc. Moderately priced, full service restaurant chain | 174,277 | 9,180,913 |
| Wingstop, Inc. Cooked-to-order chicken wings | 112,885 | 4,400,257 |
| Total | 45,070,464 | |
| Common Stocks (continued) | ||
| Issuer | Shares | Value ($) |
| Household Durables 1.8% | ||
| Cavco Industries, Inc.(a) Designs and manufactures systems-built structures | 23,032 | 3,514,683 |
| iRobot Corp.(a),(b) Manufactures robots for cleaning | 115,126 | 8,830,164 |
| Total | 12,344,847 | |
| Leisure Products 1.7% | ||
| Brunswick Corp. Consumer products serving the outdoor and indoor active recreation markets | 141,001 | 7,786,075 |
| MCBC Holdings, Inc.(a) Sport boats | 174,136 | 3,869,302 |
| Total | 11,655,377 | |
| Specialty Retail 2.7% | ||
| Camping World Holdings, Inc., Class A Recreational vehicles and accessories | 132,586 | 5,930,572 |
| Five Below, Inc.(a) Specialty value retailer | 128,788 | 8,541,220 |
| Monro, Inc. Automotive undercar repair and tire services | 75,262 | 4,286,171 |
| Total | 18,757,963 | |
| Total Consumer Discretionary | 134,469,788 | |
| Consumer Staples 3.4% | ||
| Beverages 0.7% | ||
| MGP Ingredients, Inc. Distillery ingredients and products | 61,005 | 4,690,064 |
| Food Products 0.8% | ||
| Hostess Brands, Inc.(a) Packaged baked sweet goods | 350,486 | 5,190,698 |
| Household Products 0.9% | ||
| WD-40 Co. Multi-purpose lubricant products and heavy-duty hand cleaners | 54,924 | 6,481,032 |
| Personal Products 1.0% | ||
| Inter Parfums, Inc. Fragrances and related products | 153,635 | 6,675,441 |
| Total Consumer Staples | 23,037,235 | |
| Energy 1.4% | ||
| Energy Equipment & Services 0.8% | ||
| Core Laboratories NV(b) Reservoir description, production enhancement, and reservoir management services | 48,984 | 5,366,197 |
| 8 | Wanger USA | Annual Report 2017 |
Table of Contents
December 31, 2017
| Common Stocks (continued) | ||
| Issuer | Shares | Value ($) |
| Oil, Gas & Consumable Fuels 0.6% | ||
| PDC Energy, Inc.(a) Petroleum products | 85,137 | 4,387,961 |
| Total Energy | 9,754,158 | |
| Financials 12.7% | ||
| Banks 6.1% | ||
| First Busey Corp. Multi-bank holding company | 329,325 | 9,859,991 |
| Great Southern Bancorp, Inc. Real estate, commercial real estate, commercial business, consumer, and construction loans | 108,845 | 5,621,844 |
| Lakeland Financial Corp. Bank holding company | 173,877 | 8,431,296 |
| LegacyTexas Financial Group, Inc. Bank holding company | 99,383 | 4,194,957 |
| Sandy Spring Bancorp, Inc. Holding company for Sandy Spring Bank | 174,469 | 6,807,780 |
| Trico Bancshares Holding company for Tri Counties Bank | 175,934 | 6,660,861 |
| Total | 41,576,729 | |
| Capital Markets 4.2% | ||
| Hamilton Lane, Inc., Class A Private market investment solutions | 234,139 | 8,286,179 |
| Houlihan Lokey, Inc. Investment bank | 240,250 | 10,914,558 |
| OM Asset Management PLC Domestic and international equities, fixed income, and alternative investments | 550,459 | 9,220,188 |
| Total | 28,420,925 | |
| Consumer Finance 1.0% | ||
| FirstCash, Inc. Owns and operates pawn stores | 101,281 | 6,831,403 |
| Thrifts & Mortgage Finance 1.4% | ||
| OceanFirst Financial Corp. New Jersey banks | 218,766 | 5,742,607 |
| Walker & Dunlop, Inc.(a) Commercial real estate financial services | 85,360 | 4,054,600 |
| Total | 9,797,207 | |
| Total Financials | 86,626,264 | |
| Common Stocks (continued) | ||
| Issuer | Shares | Value ($) |
| Health Care 27.8% | ||
| Biotechnology 7.2% | ||
| Agios Pharmaceuticals, Inc.(a) Therapeutics in the field of cancer metabolism | 149,939 | 8,572,013 |
| Celldex Therapeutics, Inc.(a) Uses applications of immunology to prevent and treat diseases | 1,475,441 | 4,190,252 |
| Clovis Oncology, Inc.(a) Pre-commercial Biotech Company | 77,328 | 5,258,304 |
| Genomic Health, Inc.(a) Development and commercialization of genomic-based clinical diagnostic tests for cancer | 167,118 | 5,715,436 |
| Intercept Pharmaceuticals, Inc.(a),(b) biopharmaceutical products | 65,487 | 3,825,751 |
| Ligand Pharmaceuticals, Inc.(a) Drugs that regulate hormone activated intracellular receptors | 66,298 | 9,078,185 |
| Loxo Oncology, Inc.(a) Researches and develops cancer drugs | 63,207 | 5,320,765 |
| MacroGenics, Inc.(a) Treatments for autoimmune disorders, cancer and infectious diseases | 228,655 | 4,344,445 |
| Ultragenyx Pharmaceutical, Inc.(a) Therapeutics and sialic acid for treating metabolic, body myopathy, glucuronidase, and rare genetic diseases | 61,392 | 2,847,361 |
| Total | 49,152,512 | |
| Health Care Equipment & Supplies 10.6% | ||
| Anika Therapeutics, Inc.(a) Integrated orthopedic medicines company | 131,934 | 7,112,562 |
| Atrion Corp. Medical products and components | 14,059 | 8,865,605 |
| AxoGen, Inc.(a) Technologies for peripheral nerve reconstruction and regeneration | 190,361 | 5,387,216 |
| Entellus Medical, Inc.(a),(b) Therapeutic solutions and medical devices | 223,000 | 5,438,970 |
| Haemonetics Corp.(a) Automated blood processing systems | 147,819 | 8,585,328 |
| iRhythm Technologies, Inc.(a) Medical instruments | 157,185 | 8,810,219 |
| LeMaitre Vascular, Inc. Medical devices for vascular surgeons and interventionists | 134,301 | 4,276,144 |
| Masimo Corp.(a) Medical signal processing and sensor technology for non-invasive monitoring of physiological parameters | 93,758 | 7,950,678 |
| Wanger USA | Annual Report 2017 | 9 |
Table of Contents
December 31, 2017
| Common Stocks (continued) | ||
| Issuer | Shares | Value ($) |
| Natus Medical, Inc.(a) Medical device company that develops, manufactures, and markets screening products | 103,204 | 3,942,393 |
| OraSure Technologies, Inc.(a) Medical devices and diagnostic products | 209,789 | 3,956,621 |
| Sientra, Inc.(a),(b) Plastic surgery implantable devices | 262,985 | 3,697,569 |
| Varex Imaging Corp.(a) X-ray imaging components | 115,800 | 4,651,686 |
| Total | 72,674,991 | |
| Health Care Providers & Services 6.4% | ||
| Amedisys, Inc.(a) Provider of alternate-site health care services | 77,108 | 4,064,363 |
| AMN Healthcare Services, Inc.(a) Temporary healthcare staffing | 225,944 | 11,127,742 |
| Chemed Corp. Hospice and palliative care services | 5,040 | 1,224,821 |
| HealthEquity, Inc.(a) Technology-enabled services platforms for consumers to make healthcare saving and spending decisions | 161,256 | 7,524,205 |
| HealthSouth Corp. Inpatient rehabilitative healthcare services | 277,345 | 13,703,616 |
| Tivity Health, Inc.(a) Health fitness solutions | 171,581 | 6,271,285 |
| Total | 43,916,032 | |
| Health Care Technology 1.0% | ||
| Evolent Health, Inc., Class A(a),(b) Purpose-built platform enables providers to migrate their payment models | 307,199 | 3,778,548 |
| Medidata Solutions, Inc.(a) Hosted clinical development solutions | 51,773 | 3,280,855 |
| Total | 7,059,403 | |
| Life Sciences Tools & Services 1.9% | ||
| Bio-Techne Corp. Biotechnology products and clinical diagnostic controls | 31,725 | 4,109,974 |
| Cambrex Corp.(a) Products, services, and technologies for the Life Sciences and fine chemicals industry | 187,872 | 9,017,856 |
| Total | 13,127,830 | |
| Pharmaceuticals 0.7% | ||
| Optinose, Inc.(a),(b) Health care services | 237,846 | 4,495,289 |
| Total Health Care | 190,426,057 | |
| Common Stocks (continued) | ||
| Issuer | Shares | Value ($) |
| Industrials 10.6% | ||
| Building Products 0.8% | ||
| American Woodmark Corp.(a) Kitchen cabinets and vanities | 40,392 | 5,261,058 |
| Commercial Services & Supplies 3.6% | ||
| Brink’s Co. (The) Provides security services globally | 129,679 | 10,205,737 |
| Healthcare Services Group, Inc. Housekeeping, laundry, linen, facility maintenance, and food services | 87,517 | 4,613,896 |
| Knoll, Inc. Branded office furniture products and textiles | 212,485 | 4,895,655 |
| Unifirst Corp. Workplace uniforms and protective clothing | 29,051 | 4,790,510 |
| Total | 24,505,798 | |
| Machinery 3.4% | ||
| Barnes Group, Inc. International industrial and aerospace manufacturer and service provider | 124,910 | 7,903,056 |
| ESCO Technologies, Inc. Engineered products and solutions | 85,278 | 5,137,999 |
| REV Group, Inc. Specialty vehicles and related aftermarket parts and services | 144,756 | 4,708,913 |
| Toro Co. (The) Turf equipment | 84,996 | 5,544,289 |
| Total | 23,294,257 | |
| Professional Services 1.6% | ||
| ICF International, Inc.(a) Management, technology, policy consulting, and implementation services | 110,781 | 5,816,002 |
| Wageworks, Inc.(a) Tax-advantaged programs for consumer-directed health, commuter, and other employee spending account benefits | 89,809 | 5,568,158 |
| Total | 11,384,160 | |
| Road & Rail 0.6% | ||
| Saia, Inc.(a) Trucking transportation | 62,422 | 4,416,356 |
| Trading Companies & Distributors 0.6% | ||
| SiteOne Landscape Supply, Inc.(a) Landscape supplies | 52,044 | 3,991,775 |
| Total Industrials | 72,853,404 | |
| 10 | Wanger USA | Annual Report 2017 |
Table of Contents
December 31, 2017
| Common Stocks (continued) | ||
| Issuer | Shares | Value ($) |
| Information Technology 19.8% | ||
| Electronic Equipment, Instruments & Components 1.0% | ||
| II-VI, Inc.(a) Optical and optoelectronic devices | 144,110 | 6,765,965 |
| Internet Software & Services 5.2% | ||
| Alarm.com Holdings, Inc.(a) Interactive security solutions | 88,450 | 3,338,987 |
| Alteryx, Inc., Class A(a) Data storage, retrieval, management, reporting, and analytics solutions | 322,702 | 8,154,680 |
| Apptio, Inc., Class A(a) Cloud-based business management solutions | 201,888 | 4,748,406 |
| LogMeIn, Inc. Remote connectivity services | 50,837 | 5,820,836 |
| Mimecast Ltd.(a) Cloud security and risk management services for corporate information and email | 244,231 | 7,002,103 |
| MINDBODY, Inc., Class A(a) Business management software | 102,314 | 3,115,461 |
| Q2 Holdings, Inc.(a) Secure, cloud-based virtual banking solutions | 96,516 | 3,556,615 |
| Total | 35,737,088 | |
| IT Services 3.9% | ||
| CoreLogic, Inc.(a) Consumer, financial and property information, analytics and services to business and government | 82,609 | 3,817,362 |
| Euronet Worldwide, Inc.(a) Electronic financial transaction solutions | 88,829 | 7,485,620 |
| MAXIMUS, Inc. Program management and consulting services to state and local governments | 126,364 | 9,045,135 |
| WNS Holdings Ltd., ADR(a) Business process outsourcing services | 159,211 | 6,389,137 |
| Total | 26,737,254 | |
| Semiconductors & Semiconductor Equipment 6.0% | ||
| Advanced Energy Industries, Inc.(a) Engineered precision power conversion, measurement and control solutions | 72,740 | 4,908,495 |
| Ambarella, Inc.(a) High definition video compression and image processing semiconductors | 118,024 | 6,933,910 |
| Brooks Automation, Inc. Automation solutions for the global semiconductor and related industries | 146,999 | 3,505,926 |
| Cabot Microelectronics Corp. slurries used in chemical mechanical planarization | 80,597 | 7,582,566 |
| Common Stocks (continued) | ||
| Issuer | Shares | Value ($) |
| Inphi Corp.(a),(b) Analog semiconductor solutions | 108,422 | 3,968,245 |
| Monolithic Power Systems, Inc. Power management solutions | 91,775 | 10,311,839 |
| Semtech Corp.(a) Analog and mixed-signal semiconductors | 125,650 | 4,297,230 |
| Total | 41,508,211 | |
| Software 3.7% | ||
| Aspen Technology, Inc.(a) Process optimization software, products and services | 131,514 | 8,706,227 |
| Blackline, Inc.(a) Develops and markets enterprise software | 143,372 | 4,702,602 |
| CyberArk Software Ltd.(a) IT security solutions | 74,131 | 3,068,282 |
| Qualys, Inc.(a) Information technology security risk and compliance management solutions | 145,418 | 8,630,558 |
| Total | 25,107,669 | |
| Total Information Technology | 135,856,187 | |
| Materials 1.7% | ||
| Chemicals 1.7% | ||
| Orion Engineered Carbons SA Global supplier of Carbon Black | 272,849 | 6,984,935 |
| Quaker Chemical Corp. Custom-formulated chemical specialty products | 29,199 | 4,402,917 |
| Total | 11,387,852 | |
| Total Materials | 11,387,852 | |
| Real Estate 2.1% | ||
| Equity Real Estate Investment Trusts (REITS) 1.4% | ||
| CoreCivic, Inc. Detention and corrections services | 218,864 | 4,924,440 |
| UMH Properties, Inc. Real estate investment trust | 290,198 | 4,323,950 |
| Total | 9,248,390 | |
| Real Estate Management & Development 0.7% | ||
| Colliers International Group, Inc. Commercial real estate, residential property management and property services | 80,342 | 4,848,640 |
| Total Real Estate | 14,097,030 | |
| Total Common Stocks (Cost: $540,873,602) | 678,507,975 | |
| Wanger USA | Annual Report 2017 | 11 |
Table of Contents
December 31, 2017
| Securities Lending Collateral 3.1% | ||
| Shares | Value ($) | |
| Dreyfus Government Cash Management Fund, Institutional Shares, 1.190%(c),(d) | 20,915,991 | 20,915,991 |
| Total Securities Lending Collateral (Cost: $20,915,991) | 20,915,991 | |
| Money Market Funds 0.7% | ||
| JPMorgan U.S. Government Money Market Fund, Agency Shares, 1.090%(c) | 5,021,142 | 5,021,142 |
| Total Money Market Funds (Cost: $5,021,142) | 5,021,142 | |
| Total Investments (Cost $566,810,735) | 704,445,108 | |
| Obligation to Return Collateral for Securities Loaned | (20,915,991) | |
| Other Assets & Liabilities, Net | 1,182,773 | |
| Net Assets | $684,711,890 | |
| (a) | Non-income producing security. |
| (b) | All or a portion of this security was on loan at December 31, 2017. The total market value of securities on loan at December 31, 2017 was $19,761,790. |
| (c) | The rate shown is the seven-day current annualized yield at December 31, 2017. |
| (d) | Investment made with cash collateral received from securities lending activity. |
| ADR | American Depositary Receipt |
| ¦ | Level 1 – quoted prices in active markets for identical securities |
| ¦ | Level 2 – prices determined using other significant observable inputs (including quoted prices for similar securities, interest rates, prepayment speeds, credit risk and others) |
| ¦ | Level 3 – prices determined using significant unobservable inputs where quoted prices or observable inputs are unavailable or less reliable (including management’s own assumptions about the factors market participants would use in pricing an investment) |
| 12 | Wanger USA | Annual Report 2017 |
Table of Contents
December 31, 2017
For investments categorized as Level 3, the significant unobservable inputs used in the fair value measurement of the Fund’s securities may include: (i) data specific to the issuer or comparable issuers, (ii) general market or specific sector news and (iii) quoted prices and specific or similar security transactions. The Committee considers this data and any changes from prior periods in order to assess the reasonableness of observable and unobservable inputs, any assumptions or internal models used to value those securities and changes in fair value. Significant changes in any of these factors could result in lower or higher fair value measurements. Various factors impact the frequency of monitoring (which may occur as often as daily), however the Committee may determine that changes to inputs, assumptions and models are not required with the same frequency.
| Level 1 quoted prices in active markets for identical assets ($) | Level 2 other significant observable inputs ($) | Level 3 significant unobservable inputs ($) | Total ($) | |
| Investments | ||||
| Common Stocks | ||||
| Consumer Discretionary | 134,469,788 | — | — | 134,469,788 |
| Consumer Staples | 23,037,235 | — | — | 23,037,235 |
| Energy | 9,754,158 | — | — | 9,754,158 |
| Financials | 86,626,264 | — | — | 86,626,264 |
| Health Care | 190,426,057 | — | — | 190,426,057 |
| Industrials | 72,853,404 | — | — | 72,853,404 |
| Information Technology | 135,856,187 | — | — | 135,856,187 |
| Materials | 11,387,852 | — | — | 11,387,852 |
| Real Estate | 14,097,030 | — | — | 14,097,030 |
| Total Common Stocks | 678,507,975 | — | — | 678,507,975 |
| Securities Lending Collateral | 20,915,991 | — | — | 20,915,991 |
| Money Market Funds | 5,021,142 | — | — | 5,021,142 |
| Total Investments | 704,445,108 | — | — | 704,445,108 |
| Wanger USA | Annual Report 2017 | 13 |
Table of Contents
December 31, 2017
| Assets | |
| Investments in unaffiliated issuers, at cost | $566,810,735 |
| Investments in unaffiliated issuers, at value (including securities on loan: $19,761,790) | 704,445,108 |
| Receivable for: | |
| Investments sold | 1,771,492 |
| Capital shares sold | 39,400 |
| Dividends | 316,636 |
| Securities lending income | 18,924 |
| Foreign tax reclaims | 402 |
| Prepaid expenses | 15,742 |
| Trustees’ deferred compensation plan | 204,607 |
| Total assets | 706,812,311 |
| Liabilities | |
| Due upon return of securities on loan | 20,915,991 |
| Payable for: | |
| Investments purchased | 84,842 |
| Capital shares purchased | 749,252 |
| Investment advisory fee | 16,402 |
| Administration fees | 948 |
| Trustees’ fees | 1,705 |
| Compensation of chief compliance officer | 1,026 |
| Other expenses | 125,648 |
| Trustees’ deferred compensation plan | 204,607 |
| Total liabilities | 22,100,421 |
| Net assets applicable to outstanding capital stock | $684,711,890 |
| Represented by | |
| Paid in capital | 387,351,875 |
| Excess of distributions over net investment income | (152,351) |
| Accumulated net realized gain | 159,877,993 |
| Unrealized appreciation (depreciation) on: | |
| Investments - unaffiliated issuers | 137,634,373 |
| Total - representing net assets applicable to outstanding capital stock | $684,711,890 |
| Shares outstanding | 25,603,574 |
| Net asset value per share | 26.74 |
| 14 | Wanger USA | Annual Report 2017 |
Table of Contents
Year Ended December 31, 2017
| Net investment income | |
| Income: | |
| Dividends — unaffiliated issuers | $5,647,585 |
| Income from securities lending — net | 547,502 |
| Foreign taxes withheld | (41,754) |
| Total income | 6,153,333 |
| Expenses: | |
| Investment advisory fee | 5,857,677 |
| Service fees | 280,703 |
| Transfer agent fees | 293 |
| Administration fees | 338,283 |
| Trustees’ fees | 64,335 |
| Custodian fees | 16,392 |
| Printing and postage fees | 197,625 |
| Audit fees | 40,532 |
| Legal fees | 137,314 |
| Compensation of chief compliance officer | 2,098 |
| Other | 27,261 |
| Total expenses | 6,962,513 |
| Fees waived by transfer agent | (280,703) |
| Total net expenses | 6,681,810 |
| Net investment loss | (528,477) |
| Realized and unrealized gain (loss) — net | |
| Net realized gain (loss) on: | |
| Investments — unaffiliated issuers | 163,958,845 |
| Net realized gain | 163,958,845 |
| Net change in unrealized appreciation (depreciation) on: | |
| Investments — unaffiliated issuers | (42,319,867) |
| Net change in unrealized appreciation (depreciation) | (42,319,867) |
| Net realized and unrealized gain | 121,638,978 |
| Net increase in net assets resulting from operations | $121,110,501 |
| Wanger USA | Annual Report 2017 | 15 |
Table of Contents
| Year Ended December 31, 2017 | Year Ended December 31, 2016 | |
| Operations | ||
| Net investment loss | $(528,477) | $(1,023,088) |
| Net realized gain | 163,958,845 | 107,626,627 |
| Net change in unrealized appreciation (depreciation) | (42,319,867) | (26,013,693) |
| Net increase in net assets resulting from operations | 121,110,501 | 80,589,846 |
| Distributions to shareholders | ||
| Net realized gains | (108,009,366) | (177,478,615) |
| Total distributions to shareholders | (108,009,366) | (177,478,615) |
| Increase in net assets from capital stock activity | 7,375,038 | 68,519,737 |
| Total increase (decrease) in net assets | 20,476,173 | (28,369,032) |
| Net assets at beginning of year | 664,235,717 | 692,604,749 |
| Net assets at end of year | $684,711,890 | $664,235,717 |
| Excess of distributions over net investment income | $(152,351) | $(168,676) |
| Year Ended | Year Ended | |||
| December 31, 2017 | December 31, 2016 | |||
| Shares | Dollars ($) | Shares | Dollars ($) | |
| Capital stock activity | ||||
| Subscriptions | 368,297 | 9,709,107 | 358,725 | 9,663,627 |
| Distributions reinvested | 4,399,567 | 108,009,366 | 7,321,725 | 177,478,615 |
| Redemptions | (4,199,383) | (110,343,435) | (4,460,294) | (118,622,505) |
| Total net increase | 568,481 | 7,375,038 | 3,220,156 | 68,519,737 |
| 16 | Wanger USA | Annual Report 2017 |
Table of Contents
| Year Ended December 31, | |||||
| 2017 | 2016 | 2015 | 2014 | 2013 | |
| Per share data | |||||
| Net asset value, beginning of period | $26.53 | $31.75 | $37.71 | $41.13 | $33.84 |
| Income from investment operations: | |||||
| Net investment loss | (0.02) | (0.04) | (0.12) | (0.06) | (0.05) |
| Net realized and unrealized gain | 4.81 | 3.56 | 0.45 | 1.70 | 10.79 |
| Total from investment operations | 4.79 | 3.52 | 0.33 | 1.64 | 10.74 |
| Less distributions to shareholders from: | |||||
| Net investment income | — | — | — | — | (0.06) |
| Net realized gains | (4.58) | (8.74) | (6.29) | (5.06) | (3.39) |
| Total distributions to shareholders | (4.58) | (8.74) | (6.29) | (5.06) | (3.45) |
| Net asset value, end of period | $26.74 | $26.53 | $31.75 | $37.71 | $41.13 |
| Total return | 19.58% (a) | 13.69% | (0.61)% | 4.78% | 33.75% |
| Ratios to average net assets | |||||
| Total gross expenses(b) | 1.03% | 1.00% | 1.01% | 0.96% | 0.96% |
| Total net expenses(b) | 0.99% | 1.00% | 1.01% | 0.96% | 0.96% |
| Net investment loss | (0.08)% | (0.16)% | (0.34)% | (0.15)% | (0.12)% |
| Supplemental data | |||||
| Portfolio turnover | 96% | 118% | 45% | 14% | 15% |
| Net assets, end of period (in thousands) | $684,712 | $664,236 | $692,605 | $800,933 | $912,143 |
| Notes to Financial Highlights | |
| (a) | Had the Investment Manager and/or its affiliates not waived a portion of expenses, total return would have been reduced. |
| (b) | In addition to the fees and expenses that the Fund bears directly, the Fund indirectly bears a pro rata share of the fees and expenses of any other funds in which it invests. Such indirect expenses are not included in the Fund’s reported expense ratios. |
| Wanger USA | Annual Report 2017 | 17 |
Table of Contents
December 31, 2017
| 18 | Wanger USA | Annual Report 2017 |
Table of Contents
December 31, 2017
| Overnight and continuous | Up to 30 days | 30-90 days | Greater than 90 days | Total | |
| Wanger USA | |||||
| Securities lending transactions | |||||
| Equity securities | $19,761,790 | $— | $— | $— | $19,761,790 |
| Gross amount of recognized liabilities for securities lending (collateral received) | 20,915,991 | ||||
| Amounts due to counterparty in the event of default | $1,154,201 |
| Goldman Sachs ($) | |
| Liabilities | |
| Collateral on Securities loaned | 20,915,991 |
| Total Liabilities | 20,915,991 |
| Total Financial and Derivative Net Assets | (20,915,991) |
| Financial Instruments | 19,761,790 |
| Net Amount (a) | (1,154,201) |
| (a) | Represents the net amount due from/(to) counterparties in the event of default. |
| Wanger USA | Annual Report 2017 | 19 |
Table of Contents
December 31, 2017
| 20 | Wanger USA | Annual Report 2017 |
Table of Contents
December 31, 2017
| Average daily net assets | Annual fee rate |
| Up to $100 million | 0.94% |
| $100 million to $250 million | 0.89% |
| $250 million to $2 billion | 0.84% |
| $2 billion and over | 0.80% |
| Aggregate average daily net assets of the Trust | Annual fee rate |
| Up to $4 billion | 0.05% |
| $4 billion to $6 billion | 0.04% |
| $6 billion to $8 billion | 0.03% |
| $8 billion and over | 0.02% |
| Wanger USA | Annual Report 2017 | 21 |
Table of Contents
December 31, 2017
| Excess of distributions over net investment income ($) | Accumulated net realized gain ($) | Paid in capital ($) |
| 544,802 | (544,802) | — |
| 22 | Wanger USA | Annual Report 2017 |
Table of Contents
December 31, 2017
| December 31, 2017 | December 31, 2016 | ||||
| Ordinary income ($) | Long-term capital gains ($) | Total ($) | Ordinary income ($) | Long-term capital gains ($) | Total ($) |
| — | 108,009,366 | 108,009,366 | — | 177,478,615 | 177,478,615 |
| Undistributed ordinary income ($) | Undistributed long-term capital gains ($) | Capital loss carryforwards ($) | Net unrealized appreciation ($) |
| 42,274,149 | 119,070,805 | — | 136,167,412 |
| Federal tax cost ($) | Gross unrealized appreciation ($) | Gross unrealized (depreciation) ($) | Net unrealized appreciation ($) |
| 568,277,696 | 150,730,179 | (14,562,767) | 136,167,412 |
| Wanger USA | Annual Report 2017 | 23 |
Table of Contents
December 31, 2017
| 24 | Wanger USA | Annual Report 2017 |
Table of Contents
| Wanger USA | Annual Report 2017 | 25 |
Table of Contents
(Unaudited)
| Capital gain dividend | |
| $125,129,435 |
| 26 | Wanger USA | Annual Report 2017 |
Table of Contents
Shareholder Services Group
227 W. Monroe, Suite 3000
800.922.6769
| Name and age at December 31, 2017 | Year first appointed or elected to a Board in the Columbia Funds Complex | Principal occupation(s) during the past five years | Number of Funds in the Columbia Funds Complex overseen (1) | Other directorships held by the Trustee during the past five years in addition to Columbia Acorn Trust and Wanger Advisors Trust |
| Laura M. Born, 52, Chair | 2007 | Adjunct Associate Professor of Finance, University of Chicago Booth School of Business since 2007; Director, Carlson Inc. (private global hospitalities and travel company) since 2015; Managing Director – Investment Banking, JP Morgan Chase & Co. (broker-dealer) 2002-2007. | 11 | None. |
| Maureen M. Culhane, 69 | 2007 | Retired. Formerly, Vice President, Goldman Sachs Asset Management, L.P. (investment adviser), 2005-2007; Vice President (Consultant) – Strategic Relationship Management, Goldman, Sachs & Co., 1999-2005. | 11 | None. |
| Margaret M. Eisen, 64 | 2002 | Chief Investment Officer, EAM International LLC (corporate finance and asset management), 2003-2013; Managing Director, CFA Institute, 2005-2008. | 11 | RMB Investors Trust (formerly Burnham Investors Trust) (3 series). |
| Thomas M. Goldstein, 58 | 2014 | Retired. Formerly, Chief Financial Officer, Allstate Protection Division, 2011-2014; Founding Partner, The GRG Group LLC, 2009-2011; Managing Director and Chief Financial Officer, Madison Dearborn Partners, 2007-2009. | 11 | Federal Home Loan Bank – Chicago; Federal Home Loan Mortgage Corporation; Kemper Corporation (insurance). |
| John C. Heaton, 58 | 2010 | Deputy Dean for Faculty, University of Chicago Booth School of Business; Joseph L. Gidwitz Professor of Finance, University of Chicago Booth School of Business since July 2000. | 11 | None. |
| Wanger USA | Annual Report 2017 | 27 |
Table of Contents
| Name and age at December 31, 2017 | Year first appointed or elected to a Board in the Columbia Funds Complex | Principal occupation(s) during the past five years | Number of Funds in the Columbia Funds Complex overseen (1) | Other directorships held by the Trustee during the past five years in addition to Columbia Acorn Trust and Wanger Advisors Trust |
| Charles R. Phillips, 61 | 2015 | Consultant, Finger Rock, LLC (strategic consulting business). Director, University of North Carolina School of Law Foundation since 2010. Formerly, Vice Chairman, J.P. Morgan Private Bank, 2011-2014; Managing Director, J.P. Morgan Private Bank, 2001-2011. | 11 | None. |
| David J. Rudis, 64, Vice Chair | 2010 | Retired. Formerly, National Checking and Debit Executive, and Illinois President, Bank of America, 2007-2009; President, Consumer Banking Group, LaSalle National Bank, 2004-2007. | 11 | None. |
| Name and age at December 31, 2017 | Year first appointed or elected to a Board in the Columbia Funds Complex | Principal occupation(s) during the past five years | Number of Funds in the Columbia Funds Complex overseen (1) | Other directorships held by the Trustee during the past five years in addition to Columbia Acorn Trust and Wanger Advisors Trust |
| P. Zachary Egan, 49 (2) | 2015 | President, CWAM and President, Columbia Acorn Trust and Wanger Advisors Trust since April 2014; Global Chief Investment Officer, CWAM since October 2015; International Chief Investment Officer, CWAM, April 2014-September 2015; Director of International Research, CWAM, December 2004-March 2014; Vice President of Columbia Acorn Trust, 2003-2014, and Wanger Advisors Trust, 2007-2014; portfolio manager and analyst, CWAM or its predecessors, since 1999. | 11 | None. |
| Name and age at December 31, 2017 | Year first appointed or elected to a Board in the Columbia Funds Complex | Principal occupation(s) during the past five years | Number of Funds in the Columbia Funds Complex overseen (1) | Other directorships held by the Trustee during the past five years in addition to Columbia Acorn Trust and Wanger Advisors Trust |
| Ralph Wanger, 83 (3) | 1970 (4) | Founder, CWAM. Formerly, President, Chief Investment Officer and portfolio manager, CWAM or its predecessors, July 1992-September 2003; Director, Wanger Investment Company PLC; Consultant to CWAM or its predecessors, September 2003-September 2005. | 11 | None. |
| (1) | The Trustees oversee the series of Wanger Advisors Trust and Columbia Acorn Trust. |
| (2) | Mr. Egan is an "interested person" of Wanger Advisors Trust and Columbia Acorn Trust, and of CWAM, as defined in the 1940 Act, because he is an officer of each Trust and an employee of CWAM. |
| (3) | As permitted under the Trust’s Bylaws, Mr. Wanger serves as a non-voting Trustee Emeritus of Columbia Acorn Trust and Wanger Advisors Trust. |
| 28 | Wanger USA | Annual Report 2017 |
Table of Contents
| (4) | Dates prior to 1992 relate to the Acorn Fund, Inc., the predecessor trust to Columbia Acorn Trust. |
| Name and age at December 31, 2017 | Position held with Columbia Acorn Trust and Wanger Advisors Trust | Year first appointed or elected to office | Principal occupation(s) during the past five years |
| Alan G. Berkshire, 57 | Vice President | 2015 | Chief Operating Officer, CWAM since April 2015. Formerly, Independent Director, ValueQuest India Moat Fund Limited (Mauritius), April 2014-March 2015; President – North America, Religare Global Asset Management, Inc., June 2011-November 2013; Partner, Estancia Capital Management LLC, September 2009-June 2011. |
| Michael G. Clarke, 48 | Assistant Treasurer | 2004 | Vice President – Mutual Fund Administration, Columbia Management Investment Advisers, LLC since May 2010; Managing Director of Fund Administration, Columbia Management Advisors, LLC, September 2004-April 2010; Senior officer of Columbia funds and affiliated funds since 2002. |
| P. Zachary Egan, 49 | President | 2007 | President, CWAM and President, Columbia Acorn Trust and Wanger Advisors Trust since April 2014; Global Chief Investment Officer, CWAM since October 2015; International Chief Investment Officer, CWAM, April 2014-September 2015; Director of International Research, CWAM, December 2004-March 2014; Vice President of Columbia Acorn Trust, 2003-2014, and Wanger Advisors Trust, 2007-2014; portfolio manager and analyst, CWAM or its predecessors, since 1999. |
| David L. Frank, 54 | Vice President | 2014 | Portfolio manager and/or analyst, CWAM or its predecessors since 2002; Vice President, Columbia Acorn Trust and Wanger Advisors Trust since 2014. |
| Paul B. Goucher, 49 | Assistant Secretary | 2015 | Senior Vice President and Assistant General Cousel, Ameriprise Financial, Inc. since January 2017 (previously Vice President and Lead Chief Counsel, November 2008 - January 2017 and January 2013 - January 2017, respectively, and Chief Counsel, January 2010 - January 2013); Vice President, Chief Legal Counsel and Assistant Secretary, Columbia Management Investment Advisers, LLC since May 2010. |
| John Kunka, 47 | Vice President, Treasurer and Principal Accounting and Financial Officer | 2006 | Treasurer and Principal Accounting and Financial Officer, Columbia Acorn Trust and Wanger Advisors Trust since 2014; Vice President of Accounting and Operations, CWAM since May 2006; formerly, Assistant Treasurer, Columbia Acorn Trust and Wanger Advisors Trust 2006-2014. |
| Stephen Kusmierczak, 50 | Vice President | 2011 | Portfolio manager and/or analyst, CWAM or its predecessors since 2001; Vice President, Columbia Acorn Trust and Wanger Advisors Trust since 2011. |
| Joseph C. LaPalm, 48 | Vice President | 2006 | Chief Compliance Officer, CWAM since 2005. |
| Ryan C. Larrenaga, 47 | Assistant Secretary | 2015 | Vice President and Group Counsel, Ameriprise Financial, Inc. since August 2011 (previously, Counsel, May 2010-August 2011); Assistant General Counsel, Bank of America, 2005-April 2010; officer of Columbia funds and affiliated funds since 2005. |
| Matthew A. Litfin, 46 | Vice President | 2016 | Director of Research (U.S.) and portfolio manager, CWAM since December 2015; formerly, portfolio manager, William Blair & Company 1993-2015; Vice President, Columbia Acorn Trust and Wanger Advisors Trust since 2016. |
| Satoshi Matsunaga, 46 | Vice President | 2015 | Portfolio manager and/or analyst, CWAM or its predecessors since 2005; Vice President, Columbia Acorn Trust and Wanger Advisors Trust since 2015. |
| Thomas P. McGuire, 45 | Chief Compliance Officer | 2015 | Senior Vice President and Chief Compliance Officer of the Columbia Funds since 2012; Vice President – Asset Management Compliance, Ameriprise Financial, Inc., since May 2010; Chief Compliance Officer, Ameriprise Certificate Company since September 2010; Compliance Executive, Bank of America, 2005-April 2010. |
| Wanger USA | Annual Report 2017 | 29 |
Table of Contents
| Name and age at December 31, 2017 | Position held with Columbia Acorn Trust and Wanger Advisors Trust | Year first appointed or elected to office | Principal occupation(s) during the past five years |
| Louis J. Mendes III, 53 | Vice President | 2003 | International Director of Research, CWAM, since 2015; portfolio manager and/or analyst, CWAM or its predecessors since 2001; Vice President, Columbia Acorn Trust since 2003 and Wanger Advisors Trust since 2005. |
| Julian Quero, 50 | Assistant Treasurer | 2015 | Vice President – Tax, Columbia Management Investment Advisers, LLC since 2009. |
| Martha A. Skinner, 43 | Assistant Treasurer | 2016 | Vice President of Financial Reporting and Administration, Columbia Management since November 2015; Director of Financial Reporting, Columbia Management, April 2013-November 2015; Manager of Financial Reporting, Columbia Management, August 2010-April 2013. |
| Matthew S. Szafranski, 40 | Vice President | 2015 | Portfolio manager and/or analyst, CWAM or its predecessors since 2008; Vice President, Columbia Acorn Trust and Wanger Advisors Trust since 2015. |
| Linda Roth-Wiszowaty, 48 | Secretary | 2006 | Business support analyst, CWAM since April 2007; Secretary, Columbia Acorn Trust and Wanger Advisors Trust since 2014; Assistant Secretary, Columbia Acorn Trust and Wanger Advisors Trust, 2006-2014. |
| 30 | Wanger USA | Annual Report 2017 |
Table of Contents
| Wanger USA | Annual Report 2017 | 31 |
Table of Contents
Table of Contents

December 31, 2017

Table of Contents
Table of Contents
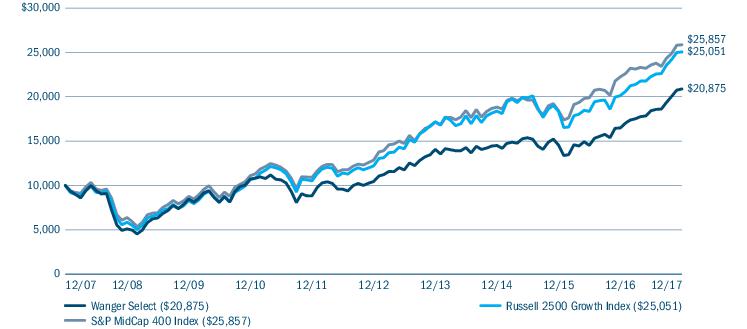
| Average annual total returns (%) (for the period ended December 31, 2017) | ||||||
| Inception | 1 Year | 5 Years | 10 Years | Life | ||
| Wanger Select | 02/01/99 | 26.67 | 14.85 | 7.64 | 10.82 | |
| Russell 2500 Growth Index | 24.46 | 15.47 | 9.62 | - | ||
| Wanger Select | Annual Report 2017 | 3 |
Table of Contents
| Top ten holdings (%) (at December 31, 2017) | |
| SVB Financial Group Holding company for Silicon Valley Bank | 5.8 |
| HealthSouth Corp. Inpatient rehabilitative healthcare services | 5.5 |
| Middleby Corp. (The) Equipment for use in cooking and preparing food | 5.3 |
| GoDaddy, Inc., Class A Cloud-based web platform for small businesses, web design professionals and individuals | 5.1 |
| Oshkosh Corp. Fire and emergency apparatuses and specialty commercial, and military trucks | 5.1 |
| LCI Industries Recreational vehicles and equipment | 5.1 |
| Snap-On, Inc. Tool and equipment solutions | 4.8 |
| LKQ Corp. Automotive products and services | 4.7 |
| Vail Resorts, Inc. Operates resorts globally | 4.7 |
| VeriSign, Inc. Domain names and Internet security services | 4.5 |
| Portfolio breakdown (%) (at December 31, 2017) | |
| Common Stocks | 98.2 |
| Money Market Funds | 1.8 |
| Total | 100.0 |
| Equity sector breakdown (%) (at December 31, 2017) | |
| Consumer Discretionary | 19.8 |
| Financials | 15.7 |
| Health Care | 17.6 |
| Industrials | 25.1 |
| Information Technology | 16.1 |
| Materials | 2.9 |
| Real Estate | 2.8 |
| Total | 100.0 |
| 4 | Wanger Select | Annual Report 2017 |
Table of Contents


| Wanger Select | Annual Report 2017 | 5 |
Table of Contents
| 6 | Wanger Select | Annual Report 2017 |
Table of Contents
(Unaudited)
| July 1, 2017 — December 31, 2017 | |||||||
| Account value at the beginning of the period ($) | Account value at the end of the period ($) | Expenses paid during the period ($) | Fund’s annualized expense ratio (%) | ||||
| Actual | Hypothetical | Actual | Hypothetical | Actual | Hypothetical | Actual | |
| Wanger Select | 1,000.00 | 1,000.00 | 1,133.30 | 1,021.04 | 4.15 | 3.93 | 0.78 |
| Wanger Select | Annual Report 2017 | 7 |
Table of Contents
December 31, 2017
| Common Stocks 98.0% | ||
| Issuer | Shares | Value ($) |
| Consumer Discretionary 19.4% | ||
| Auto Components 5.0% | ||
| LCI Industries Recreational vehicles and equipment | 53,860 | 7,001,800 |
| Distributors 4.6% | ||
| LKQ Corp.(a) Automotive products and services | 160,514 | 6,528,104 |
| Hotels, Restaurants & Leisure 6.9% | ||
| Papa John’s International, Inc. Pizza delivery and carry-out restaurants | 58,489 | 3,281,818 |
| Vail Resorts, Inc. Operates resorts globally | 30,667 | 6,515,817 |
| Total | 9,797,635 | |
| Media 2.9% | ||
| Liberty Global PLC, Class A(a) Broadband, distribution, and content companies | 114,083 | 4,088,735 |
| Total Consumer Discretionary | 27,416,274 | |
| Financials 15.4% | ||
| Banks 5.6% | ||
| SVB Financial Group(a) Holding company for Silicon Valley Bank | 34,098 | 7,971,089 |
| Capital Markets 6.9% | ||
| Eaton Vance Corp. Creates, markets, and manages mutual funds | 105,148 | 5,929,296 |
| Lazard Ltd., Class A Corporate Advisory & Asset Management | 72,916 | 3,828,090 |
| Total | 9,757,386 | |
| Consumer Finance 2.9% | ||
| FirstCash, Inc. Owns and operates pawn stores | 59,950 | 4,043,628 |
| Total Financials | 21,772,103 | |
| Health Care 17.2% | ||
| Biotechnology 2.5% | ||
| Genomic Health, Inc.(a) Development and commercialization of genomic-based clinical diagnostic tests for cancer | 81,377 | 2,783,093 |
| Ultragenyx Pharmaceutical, Inc.(a) Therapeutics and sialic acid for treating metabolic, body myopathy, glucuronidase, and rare genetic diseases | 15,638 | 725,291 |
| Total | 3,508,384 | |
| Common Stocks (continued) | ||
| Issuer | Shares | Value ($) |
| Health Care Equipment & Supplies 9.3% | ||
| Align Technology, Inc.(a) Designs, manufactures, and markets the Invisalign System | 14,215 | 3,158,431 |
| Masimo Corp.(a) Medical signal processing and sensor technology for non-invasive monitoring of physiological parameters | 56,400 | 4,782,720 |
| Natus Medical, Inc.(a) Medical device company that develops, manufactures, and markets screening products | 138,252 | 5,281,226 |
| Total | 13,222,377 | |
| Health Care Providers & Services 5.4% | ||
| HealthSouth Corp. Inpatient rehabilitative healthcare services | 154,250 | 7,621,493 |
| Total Health Care | 24,352,254 | |
| Industrials 24.6% | ||
| Machinery 17.5% | ||
| Middleby Corp. (The)(a) Equipment for use in cooking and preparing food | 54,125 | 7,304,169 |
| Nordson Corp. Systems that apply adhesives, sealants, and coatings to products during manufacturing | 24,953 | 3,653,119 |
| Oshkosh Corp. Fire and emergency apparatuses and specialty commercial, and military trucks | 77,507 | 7,044,611 |
| Snap-On, Inc. Tool and equipment solutions | 38,522 | 6,714,384 |
| Total | 24,716,283 | |
| Road & Rail 7.1% | ||
| AMERCO Rental of trucks, trailers, and self storage space, as well as property and casualty and life insurance products | 10,226 | 3,864,508 |
| JB Hunt Transport Services, Inc. Logistics services | 53,194 | 6,116,246 |
| Total | 9,980,754 | |
| Total Industrials | 34,697,037 | |
| 8 | Wanger Select | Annual Report 2017 |
Table of Contents
December 31, 2017
| Common Stocks (continued) | ||
| Issuer | Shares | Value ($) |
| Information Technology 15.8% | ||
| Internet Software & Services 11.9% | ||
| GoDaddy, Inc., Class A(a) Cloud-based web platform for small businesses, web design professionals and individuals | 140,379 | 7,058,256 |
| SPS Commerce, Inc.(a) On-demand supply chain management solutions through an online hosted software suite | 71,701 | 3,483,952 |
| VeriSign, Inc.(a) Domain names and Internet security services | 54,733 | 6,263,644 |
| Total | 16,805,852 | |
| Software 3.9% | ||
| ANSYS, Inc.(a) Software solutions for design analysis and optimization | 36,942 | 5,452,270 |
| Total Information Technology | 22,258,122 | |
| Materials 2.8% | ||
| Chemicals 2.8% | ||
| Celanese Corp., Class A Global integrated producer of chemicals and advanced materials | 37,367 | 4,001,258 |
| Total Materials | 4,001,258 | |
| Common Stocks (continued) | ||
| Issuer | Shares | Value ($) |
| Real Estate 2.8% | ||
| Equity Real Estate Investment Trusts (REITS) 2.8% | ||
| Education Realty Trust, Inc. Self-managed and self-advised real estate investment trust | 111,480 | 3,892,882 |
| Total Real Estate | 3,892,882 | |
| Total Common Stocks (Cost: $103,826,180) | 138,389,930 | |
| Money Market Funds 1.8% | ||
| Shares | Value ($) | |
| JPMorgan U.S. Government Money Market Fund, IM Shares, 1.192%(b) | 2,578,251 | 2,578,251 |
| Total Money Market Funds (Cost: $2,578,251) | 2,578,251 | |
| Total Investments (Cost $106,404,431) | 140,968,181 | |
| Other Assets & Liabilities, Net | 244,792 | |
| Net Assets | $141,212,973 | |
| (a) | Non-income producing security. |
| (b) | The rate shown is the seven-day current annualized yield at December 31, 2017. |
| ¦ | Level 1 – quoted prices in active markets for identical securities |
| ¦ | Level 2 – prices determined using other significant observable inputs (including quoted prices for similar securities, interest rates, prepayment speeds, credit risk and others) |
| ¦ | Level 3 – prices determined using significant unobservable inputs where quoted prices or observable inputs are unavailable or less reliable (including management’s own assumptions about the factors market participants would use in pricing an investment) |
| Wanger Select | Annual Report 2017 | 9 |
Table of Contents
December 31, 2017
require fair valuation and fair value techniques; circumstances under which securities will be deemed to pose a potential for stale pricing, including when securities are illiquid, restricted, or in default; and certain delegations of authority to determine fair values to the Fund’s investment manager. The Committee may also meet to discuss additional valuation matters, which may include review of back-testing results, review of time-sensitive information or approval of other valuation related actions, and to review the appropriateness of the Policies.
| Level 1 quoted prices in active markets for identical assets ($) | Level 2 other significant observable inputs ($) | Level 3 significant unobservable inputs ($) | Total ($) | |
| Investments | ||||
| Common Stocks | ||||
| Consumer Discretionary | 27,416,274 | — | — | 27,416,274 |
| Financials | 21,772,103 | — | — | 21,772,103 |
| Health Care | 24,352,254 | — | — | 24,352,254 |
| Industrials | 34,697,037 | — | — | 34,697,037 |
| Information Technology | 22,258,122 | — | — | 22,258,122 |
| Materials | 4,001,258 | — | — | 4,001,258 |
| Real Estate | 3,892,882 | — | — | 3,892,882 |
| Total Common Stocks | 138,389,930 | — | — | 138,389,930 |
| Money Market Funds | 2,578,251 | — | — | 2,578,251 |
| Total Investments | 140,968,181 | — | — | 140,968,181 |
| 10 | Wanger Select | Annual Report 2017 |
Table of Contents
December 31, 2017
| Assets | |
| Investments in unaffiliated issuers, at cost | $106,404,431 |
| Investments in unaffiliated issuers, at value | 140,968,181 |
| Receivable for: | |
| Investments sold | 574,643 |
| Capital shares sold | 167 |
| Dividends | 84,389 |
| Prepaid expenses | 3,025 |
| Total assets | 141,630,405 |
| Liabilities | |
| Payable for: | |
| Capital shares purchased | 323,585 |
| Investment advisory fee | 2,343 |
| Administration fees | 195 |
| Trustees’ fees | 44,761 |
| Compensation of chief compliance officer | 197 |
| Printing and postage fees | 24,607 |
| Other expenses | 21,744 |
| Total liabilities | 417,432 |
| Net assets applicable to outstanding capital stock | $141,212,973 |
| Represented by | |
| Paid in capital | 91,792,960 |
| Excess of distributions over net investment income | (32,311) |
| Accumulated net realized gain | 14,888,574 |
| Unrealized appreciation (depreciation) on: | |
| Investments - unaffiliated issuers | 34,563,750 |
| Total - representing net assets applicable to outstanding capital stock | $141,212,973 |
| Shares outstanding | 6,774,460 |
| Net asset value per share | 20.84 |
| Wanger Select | Annual Report 2017 | 11 |
Table of Contents
Year Ended December 31, 2017
| Net investment income | |
| Income: | |
| Dividends — unaffiliated issuers | $1,249,917 |
| Income from securities lending — net | 2,669 |
| Total income | 1,252,586 |
| Expenses: | |
| Investment advisory fee | 1,048,059 |
| Service fees | 103,053 |
| Transfer agent fees | 115 |
| Administration fees | 65,504 |
| Trustees’ fees | 12,594 |
| Custodian fees | 3,568 |
| Printing and postage fees | 60,251 |
| Audit fees | 31,145 |
| Legal fees | 26,249 |
| Compensation of chief compliance officer | 399 |
| Other | 19,401 |
| Total expenses | 1,370,338 |
| Fees waived by transfer agent | (103,053) |
| Advisory fee waiver | (262,015) |
| Total net expenses | 1,005,270 |
| Net investment income | 247,316 |
| Realized and unrealized gain (loss) — net | |
| Net realized gain (loss) on: | |
| Investments — unaffiliated issuers | 15,047,757 |
| Net realized gain | 15,047,757 |
| Net change in unrealized appreciation (depreciation) on: | |
| Investments — unaffiliated issuers | 15,936,463 |
| Net change in unrealized appreciation (depreciation) | 15,936,463 |
| Net realized and unrealized gain | 30,984,220 |
| Net increase in net assets resulting from operations | $31,231,536 |
| 12 | Wanger Select | Annual Report 2017 |
Table of Contents
| Year Ended December 31, 2017 | Year Ended December 31, 2016 | |
| Operations | ||
| Net investment income | $247,316 | $213,763 |
| Net realized gain | 15,047,757 | 17,763,750 |
| Net change in unrealized appreciation (depreciation) | 15,936,463 | (2,720,919) |
| Net increase in net assets resulting from operations | 31,231,536 | 15,256,594 |
| Distributions to shareholders | ||
| Net investment income | (229,911) | (209,776) |
| Net realized gains | (17,779,427) | (39,392,500) |
| Total distributions to shareholders | (18,009,338) | (39,602,276) |
| Increase in net assets from capital stock activity | 2,491,048 | 14,004,583 |
| Total increase (decrease) in net assets | 15,713,246 | (10,341,099) |
| Net assets at beginning of year | 125,499,727 | 135,840,826 |
| Net assets at end of year | $141,212,973 | $125,499,727 |
| Excess of distributions over net investment income | $(32,311) | $(49,893) |
| Year Ended | Year Ended | |||
| December 31, 2017 | December 31, 2016 | |||
| Shares | Dollars ($) | Shares | Dollars ($) | |
| Capital stock activity | ||||
| Subscriptions | 229,255 | 4,453,222 | 122,251 | 2,468,559 |
| Distributions reinvested | 990,881 | 18,009,338 | 2,263,039 | 39,602,276 |
| Redemptions | (1,016,605) | (19,971,512) | (1,433,386) | (28,066,252) |
| Total net increase | 203,531 | 2,491,048 | 951,904 | 14,004,583 |
| Wanger Select | Annual Report 2017 | 13 |
Table of Contents
| Year Ended December 31, | |||||
| 2017 | 2016 | 2015 | 2014 | 2013 | |
| Per share data | |||||
| Net asset value, beginning of period | $19.10 | $24.18 | $32.99 | $36.41 | $27.54 |
| Income from investment operations: | |||||
| Net investment income | 0.04 | 0.03 | (0.02) | (0.07) | (0.05) |
| Net realized and unrealized gain | 4.62 | 2.48 | 0.69 | 1.07 | 9.46 |
| Total from investment operations | 4.66 | 2.51 | 0.67 | 1.00 | 9.41 |
| Less distributions to shareholders from: | |||||
| Net investment income | (0.03) | (0.03) | (0.00) (a) | — | (0.09) |
| Net realized gains | (2.89) | (7.56) | (9.48) | (4.42) | (0.45) |
| Total distributions to shareholders | (2.92) | (7.59) | (9.48) | (4.42) | (0.54) |
| Net asset value, end of period | $20.84 | $19.10 | $24.18 | $32.99 | $36.41 |
| Total return | 26.67% (b) | 13.31% (b) | 0.26% (b) | 3.17% | 34.58% |
| Ratios to average net assets | |||||
| Total gross expenses(c) | 1.05% | 0.93% (d) | 0.98% | 0.93% (e) | 0.93% |
| Total net expenses(c) | 0.77% | 0.73% (d) | 0.85% | 0.93% (e) | 0.93% |
| Net investment income | 0.19% | 0.17% | (0.06)% | (0.20)% | (0.15)% |
| Supplemental data | |||||
| Portfolio turnover | 52% | 93% | 59% | 18% | 24% |
| Net assets, end of period (in thousands) | $141,213 | $125,500 | $135,841 | $191,647 | $257,911 |
| Notes to Financial Highlights | |
| (a) | Rounds to zero. |
| (b) | Had the Investment Manager and/or its affiliates not waived a portion of expenses, total return would have been reduced. |
| (c) | In addition to the fees and expenses that the Fund bears directly, the Fund indirectly bears a pro rata share of the fees and expenses of any other funds in which it invests, if any. Such indirect expenses are not included in the Fund’s reported expense ratios. |
| (d) | Expenses have been reduced due to a reimbursement of expenses overbilled by a third party. If the reimbursement had been excluded, the expense ratios would have been higher by 0.03%. All fee waivers and expense reimbursements by the Investment Manager and its affiliates were applied before giving effect to this third party reimbursement. |
| (e) | Ratios include line of credit interest expense which is less than 0.01%. |
| 14 | Wanger Select | Annual Report 2017 |
Table of Contents
December 31, 2017
| Wanger Select | Annual Report 2017 | 15 |
Table of Contents
December 31, 2017
| 16 | Wanger Select | Annual Report 2017 |
Table of Contents
December 31, 2017
| Average daily net assets | Annual fee rate |
| Up to $500 million | 0.80% |
| $500 million and over | 0.78% |
| Wanger Select | Annual Report 2017 | 17 |
Table of Contents
December 31, 2017
| Aggregate average daily net assets of the Trust | Annual fee rate |
| Up to $4 billion | 0.05% |
| $4 billion to $6 billion | 0.04% |
| $6 billion to $8 billion | 0.03% |
| $8 billion and over | 0.02% |
| 18 | Wanger Select | Annual Report 2017 |
Table of Contents
December 31, 2017
| Excess of distributions over net investment income ($) | Accumulated net realized gain ($) | Paid in capital ($) |
| 177 | (177) | — |
| December 31, 2017 | December 31, 2016 | ||||
| Ordinary income ($) | Long-term capital gains ($) | Total ($) | Ordinary income ($) | Long-term capital gains ($) | Total ($) |
| 229,911 | 17,779,427 | 18,009,338 | 5,992,230 | 33,610,046 | 39,602,276 |
| Undistributed ordinary income ($) | Undistributed long-term capital gains ($) | Capital loss carryforwards ($) | Net unrealized appreciation ($) |
| 3,399,053 | 11,612,509 | — | 34,452,650 |
| Wanger Select | Annual Report 2017 | 19 |
Table of Contents
December 31, 2017
| Federal tax cost ($) | Gross unrealized appreciation ($) | Gross unrealized (depreciation) ($) | Net unrealized appreciation ($) |
| 106,515,531 | 38,320,141 | (3,867,491) | 34,452,650 |
| 20 | Wanger Select | Annual Report 2017 |
Table of Contents
December 31, 2017
| Wanger Select | Annual Report 2017 | 21 |
Table of Contents
| 22 | Wanger Select | Annual Report 2017 |
Table of Contents
(Unaudited)
| Dividends received deduction | Capital gain dividend |
| 23.87% | $12,224,652 |
| Wanger Select | Annual Report 2017 | 23 |
Table of Contents
Shareholder Services Group
227 W. Monroe, Suite 3000
800.922.6769
| Name and age at December 31, 2017 | Year first appointed or elected to a Board in the Columbia Funds Complex | Principal occupation(s) during the past five years | Number of Funds in the Columbia Funds Complex overseen (1) | Other directorships held by the Trustee during the past five years in addition to Columbia Acorn Trust and Wanger Advisors Trust |
| Laura M. Born, 52, Chair | 2007 | Adjunct Associate Professor of Finance, University of Chicago Booth School of Business since 2007; Director, Carlson Inc. (private global hospitalities and travel company) since 2015; Managing Director – Investment Banking, JP Morgan Chase & Co. (broker-dealer) 2002-2007. | 11 | None. |
| Maureen M. Culhane, 69 | 2007 | Retired. Formerly, Vice President, Goldman Sachs Asset Management, L.P. (investment adviser), 2005-2007; Vice President (Consultant) – Strategic Relationship Management, Goldman, Sachs & Co., 1999-2005. | 11 | None. |
| Margaret M. Eisen, 64 | 2002 | Chief Investment Officer, EAM International LLC (corporate finance and asset management), 2003-2013; Managing Director, CFA Institute, 2005-2008. | 11 | RMB Investors Trust (formerly Burnham Investors Trust) (3 series). |
| Thomas M. Goldstein, 58 | 2014 | Retired. Formerly, Chief Financial Officer, Allstate Protection Division, 2011-2014; Founding Partner, The GRG Group LLC, 2009-2011; Managing Director and Chief Financial Officer, Madison Dearborn Partners, 2007-2009. | 11 | Federal Home Loan Bank – Chicago; Federal Home Loan Mortgage Corporation; Kemper Corporation (insurance). |
| John C. Heaton, 58 | 2010 | Deputy Dean for Faculty, University of Chicago Booth School of Business; Joseph L. Gidwitz Professor of Finance, University of Chicago Booth School of Business since July 2000. | 11 | None. |
| 24 | Wanger Select | Annual Report 2017 |
Table of Contents
| Name and age at December 31, 2017 | Year first appointed or elected to a Board in the Columbia Funds Complex | Principal occupation(s) during the past five years | Number of Funds in the Columbia Funds Complex overseen (1) | Other directorships held by the Trustee during the past five years in addition to Columbia Acorn Trust and Wanger Advisors Trust |
| Charles R. Phillips, 61 | 2015 | Consultant, Finger Rock, LLC (strategic consulting business). Director, University of North Carolina School of Law Foundation since 2010. Formerly, Vice Chairman, J.P. Morgan Private Bank, 2011-2014; Managing Director, J.P. Morgan Private Bank, 2001-2011. | 11 | None. |
| David J. Rudis, 64, Vice Chair | 2010 | Retired. Formerly, National Checking and Debit Executive, and Illinois President, Bank of America, 2007-2009; President, Consumer Banking Group, LaSalle National Bank, 2004-2007. | 11 | None. |
| Name and age at December 31, 2017 | Year first appointed or elected to a Board in the Columbia Funds Complex | Principal occupation(s) during the past five years | Number of Funds in the Columbia Funds Complex overseen (1) | Other directorships held by the Trustee during the past five years in addition to Columbia Acorn Trust and Wanger Advisors Trust |
| P. Zachary Egan, 49 (2) | 2015 | President, CWAM and President, Columbia Acorn Trust and Wanger Advisors Trust since April 2014; Global Chief Investment Officer, CWAM since October 2015; International Chief Investment Officer, CWAM, April 2014-September 2015; Director of International Research, CWAM, December 2004-March 2014; Vice President of Columbia Acorn Trust, 2003-2014, and Wanger Advisors Trust, 2007-2014; portfolio manager and analyst, CWAM or its predecessors, since 1999. | 11 | None. |
| Name and age at December 31, 2017 | Year first appointed or elected to a Board in the Columbia Funds Complex | Principal occupation(s) during the past five years | Number of Funds in the Columbia Funds Complex overseen (1) | Other directorships held by the Trustee during the past five years in addition to Columbia Acorn Trust and Wanger Advisors Trust |
| Ralph Wanger, 83 (3) | 1970 (4) | Founder, CWAM. Formerly, President, Chief Investment Officer and portfolio manager, CWAM or its predecessors, July 1992-September 2003; Director, Wanger Investment Company PLC; Consultant to CWAM or its predecessors, September 2003-September 2005. | 11 | None. |
| (1) | The Trustees oversee the series of Wanger Advisors Trust and Columbia Acorn Trust. |
| (2) | Mr. Egan is an "interested person" of Wanger Advisors Trust and Columbia Acorn Trust, and of CWAM, as defined in the 1940 Act, because he is an officer of each Trust and an employee of CWAM. |
| (3) | As permitted under the Trust’s Bylaws, Mr. Wanger serves as a non-voting Trustee Emeritus of Columbia Acorn Trust and Wanger Advisors Trust. |
| Wanger Select | Annual Report 2017 | 25 |
Table of Contents
| (4) | Dates prior to 1992 relate to the Acorn Fund, Inc., the predecessor trust to Columbia Acorn Trust. |
| Name and age at December 31, 2017 | Position held with Columbia Acorn Trust and Wanger Advisors Trust | Year first appointed or elected to office | Principal occupation(s) during the past five years |
| Alan G. Berkshire, 57 | Vice President | 2015 | Chief Operating Officer, CWAM since April 2015. Formerly, Independent Director, ValueQuest India Moat Fund Limited (Mauritius), April 2014-March 2015; President – North America, Religare Global Asset Management, Inc., June 2011-November 2013; Partner, Estancia Capital Management LLC, September 2009-June 2011. |
| Michael G. Clarke, 48 | Assistant Treasurer | 2004 | Vice President – Mutual Fund Administration, Columbia Management Investment Advisers, LLC since May 2010; Managing Director of Fund Administration, Columbia Management Advisors, LLC, September 2004-April 2010; Senior officer of Columbia funds and affiliated funds since 2002. |
| P. Zachary Egan, 49 | President | 2007 | President, CWAM and President, Columbia Acorn Trust and Wanger Advisors Trust since April 2014; Global Chief Investment Officer, CWAM since October 2015; International Chief Investment Officer, CWAM, April 2014-September 2015; Director of International Research, CWAM, December 2004-March 2014; Vice President of Columbia Acorn Trust, 2003-2014, and Wanger Advisors Trust, 2007-2014; portfolio manager and analyst, CWAM or its predecessors, since 1999. |
| David L. Frank, 54 | Vice President | 2014 | Portfolio manager and/or analyst, CWAM or its predecessors since 2002; Vice President, Columbia Acorn Trust and Wanger Advisors Trust since 2014. |
| Paul B. Goucher, 49 | Assistant Secretary | 2015 | Senior Vice President and Assistant General Cousel, Ameriprise Financial, Inc. since January 2017 (previously Vice President and Lead Chief Counsel, November 2008 - January 2017 and January 2013 - January 2017, respectively, and Chief Counsel, January 2010 - January 2013); Vice President, Chief Legal Counsel and Assistant Secretary, Columbia Management Investment Advisers, LLC since May 2010. |
| John Kunka, 47 | Vice President, Treasurer and Principal Accounting and Financial Officer | 2006 | Treasurer and Principal Accounting and Financial Officer, Columbia Acorn Trust and Wanger Advisors Trust since 2014; Vice President of Accounting and Operations, CWAM since May 2006; formerly, Assistant Treasurer, Columbia Acorn Trust and Wanger Advisors Trust 2006-2014. |
| Stephen Kusmierczak, 50 | Vice President | 2011 | Portfolio manager and/or analyst, CWAM or its predecessors since 2001; Vice President, Columbia Acorn Trust and Wanger Advisors Trust since 2011. |
| Joseph C. LaPalm, 48 | Vice President | 2006 | Chief Compliance Officer, CWAM since 2005. |
| Ryan C. Larrenaga, 47 | Assistant Secretary | 2015 | Vice President and Group Counsel, Ameriprise Financial, Inc. since August 2011 (previously, Counsel, May 2010-August 2011); Assistant General Counsel, Bank of America, 2005-April 2010; officer of Columbia funds and affiliated funds since 2005. |
| Matthew A. Litfin, 46 | Vice President | 2016 | Director of Research (U.S.) and portfolio manager, CWAM since December 2015; formerly, portfolio manager, William Blair & Company 1993-2015; Vice President, Columbia Acorn Trust and Wanger Advisors Trust since 2016. |
| Satoshi Matsunaga, 46 | Vice President | 2015 | Portfolio manager and/or analyst, CWAM or its predecessors since 2005; Vice President, Columbia Acorn Trust and Wanger Advisors Trust since 2015. |
| Thomas P. McGuire, 45 | Chief Compliance Officer | 2015 | Senior Vice President and Chief Compliance Officer of the Columbia Funds since 2012; Vice President – Asset Management Compliance, Ameriprise Financial, Inc., since May 2010; Chief Compliance Officer, Ameriprise Certificate Company since September 2010; Compliance Executive, Bank of America, 2005-April 2010. |
| 26 | Wanger Select | Annual Report 2017 |
Table of Contents
| Name and age at December 31, 2017 | Position held with Columbia Acorn Trust and Wanger Advisors Trust | Year first appointed or elected to office | Principal occupation(s) during the past five years |
| Louis J. Mendes III, 53 | Vice President | 2003 | International Director of Research, CWAM, since 2015; portfolio manager and/or analyst, CWAM or its predecessors since 2001; Vice President, Columbia Acorn Trust since 2003 and Wanger Advisors Trust since 2005. |
| Julian Quero, 50 | Assistant Treasurer | 2015 | Vice President – Tax, Columbia Management Investment Advisers, LLC since 2009. |
| Martha A. Skinner, 43 | Assistant Treasurer | 2016 | Vice President of Financial Reporting and Administration, Columbia Management since November 2015; Director of Financial Reporting, Columbia Management, April 2013-November 2015; Manager of Financial Reporting, Columbia Management, August 2010-April 2013. |
| Matthew S. Szafranski, 40 | Vice President | 2015 | Portfolio manager and/or analyst, CWAM or its predecessors since 2008; Vice President, Columbia Acorn Trust and Wanger Advisors Trust since 2015. |
| Linda Roth-Wiszowaty, 48 | Secretary | 2006 | Business support analyst, CWAM since April 2007; Secretary, Columbia Acorn Trust and Wanger Advisors Trust since 2014; Assistant Secretary, Columbia Acorn Trust and Wanger Advisors Trust, 2006-2014. |
| Wanger Select | Annual Report 2017 | 27 |
Table of Contents
| 28 | Wanger Select | Annual Report 2017 |
Table of Contents
Table of Contents
Table of Contents
Table of Contents
Table of Contents

December 31, 2017

Table of Contents
Table of Contents
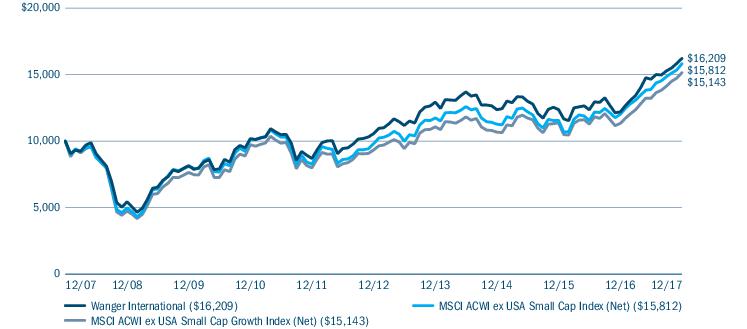
| Average annual total returns (%) (for the period ended December 31, 2017) | ||||||
| Inception | 1 Year | 5 Years | 10 Years | Life | ||
| Wanger International | 05/03/95 | 32.91 | 8.94 | 4.95 | 12.26 | |
| MSCI ACWI ex USA Small Cap Index (Net) | 31.65 | 10.03 | 4.69 | - | ||
| MSCI ACWI ex USA Small Cap Growth Index (Net) | 33.64 | 10.15 | 4.24 | - | ||
| Wanger International | Annual Report 2017 | 3 |
Table of Contents
| Top ten holdings (%) (at December 31, 2017) | |
| Kindred Group PLC (Malta) Online gambling services | 2.1 |
| Stroeer SE & Co. KGaA (Germany) Digital multi-channel media company | 2.0 |
| Nemetschek SE (Germany) Standard software for designing, constructing and managing buildings and real estate | 1.9 |
| WH Smith PLC (United Kingdom) Retails books, magazines, newspapers, and periodicals | 1.9 |
| SimCorp AS (Denmark) Global provider of highly specialised software for the investment management industry | 1.8 |
| Brembo SpA (Italy) Braking systems and components | 1.8 |
| Hastings Group Holdings PLC (United Kingdom) General insurance services to the automobile and home insurance products | 1.7 |
| NagaCorp Ltd. (Cambodia) Leisure and tourism company | 1.7 |
| Atea ASA (Norway) Nordic and Baltic supplier of IT infrastructure | 1.6 |
| Deutsche Beteiligungs AG (Germany) Private equity company, investing in domestic medium-sized companies | 1.5 |
| Equity sector breakdown (%) (at December 31, 2017) | |
| Consumer Discretionary | 28.1 |
| Consumer Staples | 5.9 |
| Energy | 0.6 |
| Financials | 11.3 |
| Health Care | 7.3 |
| Industrials | 21.9 |
| Information Technology | 17.1 |
| Materials | 2.0 |
| Real Estate | 4.6 |
| Telecommunication Services | 1.2 |
| Total | 100.0 |
| 4 | Wanger International | Annual Report 2017 |
Table of Contents
| Country breakdown (%) (at December 31, 2017) | |
| Australia | 1.1 |
| Belgium | 1.1 |
| Brazil | 0.7 |
| Cambodia | 1.6 |
| Canada | 4.0 |
| Cayman Islands | 2.4 |
| China | 2.2 |
| Denmark | 1.7 |
| Finland | 0.7 |
| France | 1.2 |
| Germany | 8.7 |
| Hong Kong | 1.6 |
| India | 3.3 |
| Indonesia | 1.6 |
| Ireland | 1.1 |
| Italy | 2.7 |
| Japan | 18.6 |
| Malta | 2.0 |
| Mexico | 1.2 |
| Country breakdown (%) (at December 31, 2017) | |
| Netherlands | 1.2 |
| New Zealand | 1.2 |
| Norway | 1.8 |
| Singapore | 0.9 |
| South Africa | 2.2 |
| South Korea | 4.1 |
| Spain | 0.9 |
| Sweden | 4.2 |
| Switzerland | 1.4 |
| Taiwan | 2.8 |
| Thailand | 2.8 |
| Turkey | 0.6 |
| United Kingdom | 13.5 |
| United States(a) | 4.9 |
| Total | 100.0 |
| (a) | Includes investments in Money Market Funds. |
| Wanger International | Annual Report 2017 | 5 |
Table of Contents


| 6 | Wanger International | Annual Report 2017 |
Table of Contents
| Wanger International | Annual Report 2017 | 7 |
Table of Contents
(Unaudited)
| July 1, 2017 — December 31, 2017 | |||||||
| Account value at the beginning of the period ($) | Account value at the end of the period ($) | Expenses paid during the period ($) | Fund’s annualized expense ratio (%) | ||||
| Actual | Hypothetical | Actual | Hypothetical | Actual | Hypothetical | Actual | |
| Wanger International | 1,000.00 | 1,000.00 | 1,106.40 | 1,019.30 | 5.93 | 5.69 | 1.13 |
| 8 | Wanger International | Annual Report 2017 |
Table of Contents
December 31, 2017
| Common Stocks 98.5% | ||
| Issuer | Shares | Value ($) |
| Australia 1.1% | ||
| Domino’s Pizza Enterprises Ltd. Pizza delivery stores | 173,920 | 6,321,292 |
| Belgium 1.1% | ||
| Melexis NV Advanced integrated semiconductors, sensor ICs, and programmable sensor IC systems | 64,423 | 6,521,623 |
| Brazil 0.8% | ||
| Odontoprev SA Dental benefits company | 932,600 | 4,473,084 |
| Cambodia 1.7% | ||
| NagaCorp Ltd. Leisure and tourism company | 12,540,000 | 9,684,880 |
| Canada 4.2% | ||
| AG Growth International, Inc. Manufacturer of Augers & Grain Handling Equipment | 170,703 | 7,243,674 |
| Boardwalk Real Estate Investment Trust(a) Real estate company | 128,662 | 4,410,538 |
| CAE, Inc. Training solutions based on simulation technology and integrated training services | 349,134 | 6,485,504 |
| ShawCor Ltd. Energy services company | 141,847 | 3,094,228 |
| Winpak Ltd. Packaging materials and machines for the protection of perishables | 75,070 | 2,794,969 |
| Total | 24,028,913 | |
| Cayman Islands 2.5% | ||
| Netshoes Cayman Ltd.(a),(b) Online sports goods and apparel | 281,221 | 2,221,646 |
| Parade Technologies Ltd. Fabless semiconductor company | 244,000 | 4,811,100 |
| Silicon Motion Technology Corp., ADR Semiconductor products | 77,269 | 4,092,166 |
| Xiabuxiabu Catering Management China Holdings Co., Ltd. Chain of restaurants in China | 1,531,000 | 3,084,398 |
| Total | 14,209,310 | |
| China 2.2% | ||
| 51job, Inc., ADR(b) Integrated human resource services | 105,751 | 6,434,948 |
| China Medical System Holdings Ltd. Pharmaceutical and medical products | 2,805,000 | 6,529,456 |
| Total | 12,964,404 | |
| Common Stocks (continued) | ||
| Issuer | Shares | Value ($) |
| Denmark 1.8% | ||
| SimCorp AS Global provider of highly specialised software for the investment management industry | 179,628 | 10,228,145 |
| Finland 0.7% | ||
| Ahlstrom-Munksjo Oyj Industrial paper | 198,618 | 4,330,123 |
| France 1.2% | ||
| Akka Technologies High-technology engineering consulting services | 66,433 | 3,690,554 |
| Elior Group SA Provides catering, cleaning, and facility management services | 157,654 | 3,258,299 |
| Total | 6,948,853 | |
| Germany 9.0% | ||
| AURELIUS Equity Opportunities SE & Co. KGaA Loans to distressed companies | 89,646 | 6,113,334 |
| CTS Eventim AG & Co. KGaA Online ticket sales | 88,757 | 4,126,458 |
| Deutsche Beteiligungs AG Private equity company, investing in domestic medium-sized companies | 149,416 | 8,416,541 |
| Nemetschek SE Standard software for designing, constructing and managing buildings and real estate | 118,799 | 10,627,770 |
| Norma Group SE Plastic and metal-based components and systems in connecting technology | 65,512 | 4,386,394 |
| Stroeer SE & Co. KGaA Digital multi-channel media company | 154,923 | 11,415,347 |
| Vapiano SE(a),(b) Chain of restaurants | 233,117 | 6,782,853 |
| Total | 51,868,697 | |
| Hong Kong 1.7% | ||
| Value Partners Group Ltd. Independent, value oriented asset management group | 1,568,000 | 1,662,047 |
| Vitasoy International Holdings Ltd. Food and beverages | 3,140,000 | 8,028,859 |
| Total | 9,690,906 | |
| Wanger International | Annual Report 2017 | 9 |
Table of Contents
December 31, 2017
| Common Stocks (continued) | ||
| Issuer | Shares | Value ($) |
| India 3.4% | ||
| Care Ratings Ltd. Credit rating services | 306,290 | 6,392,600 |
| GRUH Finance Ltd. Provides a range of home loans as well as insurance products | 802,522 | 6,314,313 |
| TVS Motor Co., Ltd. Motorcycles, mopeds and scooters | 598,933 | 7,223,941 |
| Total | 19,930,854 | |
| Indonesia 1.7% | ||
| PT Link Net Tbk High-speed internet connection through fiber optic lines | 8,983,400 | 3,645,077 |
| PT Media Nusantara Citra Tbk Integrated media company in Southeast Asia | 27,843,300 | 2,637,084 |
| PT Tower Bersama Infrastructure Tbk Telecommunication infrastructure services to Indonesian wireless carriers | 7,263,800 | 3,432,288 |
| Total | 9,714,449 | |
| Ireland 1.1% | ||
| UDG Healthcare PLC Commercialisation solutions for health care companies | 551,082 | 6,273,950 |
| Italy 2.8% | ||
| Brembo SpA Braking systems and components | 672,214 | 10,219,058 |
| Industria Macchine Automatiche SpA Packaging machinery for the food, pharmaceuticals, and cosmetics industries | 75,225 | 6,119,538 |
| Total | 16,338,596 | |
| Japan 19.1% | ||
| Aeon Credit Service Co., Ltd. Credit card company | 193,100 | 4,487,830 |
| Aeon Mall Co., Ltd. Large-scale shopping malls | 325,900 | 6,365,053 |
| Aica Kogyo Co., Ltd. Manufactures adhesives, melamine boards, and housing materials | 166,500 | 6,172,392 |
| Asahi Intecc Co., Ltd. Manufactures medical tools and stainless wire rope | 126,800 | 4,345,837 |
| CyberAgent, Inc. Operates websites, internet advertising agency and creates PC and mobile contents | 102,900 | 4,010,289 |
| Daiseki Co., Ltd. Waste Disposal & Recycling | 172,800 | 4,804,396 |
| Common Stocks (continued) | ||
| Issuer | Shares | Value ($) |
| Fuji Oil Holdings, Inc. Specialty vegetable oils and fats | 119,900 | 3,500,577 |
| Glory Ltd. Vending machines, coin-operated lockers, money handling machines, and data processing terminals | 153,000 | 5,767,223 |
| Istyle, Inc. Cosmetics Review Portal & Retailer | 405,100 | 3,154,510 |
| Mandom Corp. Cosmetic products for men and women | 122,000 | 3,992,157 |
| Milbon Co., Ltd. Hair Products for Salons | 130,100 | 4,366,655 |
| Miura Co., Ltd. Industrial boilers and related equipment | 134,700 | 3,616,222 |
| MonotaRO Co., Ltd Machine tools, engine parts, and factory consumable goods | 181,700 | 5,790,749 |
| Nabtesco Corp. Aircraft and hydraulic products | 79,800 | 3,049,296 |
| Nakanishi, Inc. Dental Tools & Machinery | 91,300 | 4,760,095 |
| NGK Spark Plug Co., Ltd. Spark plugs for automobiles, motorcycles, agricultural machinery, ships, and aircrafts | 214,800 | 5,206,180 |
| Nihon M&A Center, Inc. Provides M&A advisory services to small and medium-sized enterprises | 26,900 | 1,280,726 |
| Nippon Shinyaku Co., Ltd. Pharmaceutical & Orphan Drug Provider | 42,600 | 3,168,793 |
| NOF Corp. Diversified chemical producer | 150,300 | 4,025,685 |
| OSG Corp. Manufactures machine tool equipment | 150,700 | 3,255,418 |
| Otsuka Corp. Computer information system and software | 69,600 | 5,330,346 |
| Persol Holdings Co., Ltd. Human resource solutions | 115,300 | 2,886,694 |
| Seria Co., Ltd. Operates 100 yen chain stores | 79,400 | 4,778,055 |
| Seven Bank Ltd. Banking services through Automated Teller Machine (ATM) | 1,222,400 | 4,174,713 |
| Sohgo Security Services Co., Ltd. Around the clock security services | 102,000 | 5,543,757 |
| Ushio, Inc. Lamps and optical equipment | 198,600 | 2,832,903 |
| Total | 110,666,551 | |
| 10 | Wanger International | Annual Report 2017 |
Table of Contents
December 31, 2017
| Common Stocks (continued) | ||
| Issuer | Shares | Value ($) |
| Malta 2.1% | ||
| Kindred Group PLC Online gambling services | 853,016 | 12,208,077 |
| Mexico 1.2% | ||
| Grupo Aeroportuario del Centro Norte SAB de CV Operates international airports in the northern and central regions of Mexico | 823,200 | 4,266,615 |
| Grupo Aeroportuario del Sureste SAB de CV, ADR Operates airports in Mexico | 15,404 | 2,811,384 |
| Total | 7,077,999 | |
| Netherlands 1.2% | ||
| Aalberts Industries NV Industrial services and flow control systems | 138,649 | 7,052,743 |
| New Zealand 1.2% | ||
| Restaurant Brands New Zealand Ltd. Fast food restaurant chains | 1,363,908 | 7,051,947 |
| Norway 1.9% | ||
| Atea ASA Nordic and Baltic supplier of IT infrastructure | 661,240 | 9,301,783 |
| XXL ASA Multi-sports retail store | 142,293 | 1,473,084 |
| Total | 10,774,867 | |
| Singapore 0.9% | ||
| Mapletree Commercial Trust Singapore-focused real estate investment trust | 4,198,407 | 5,085,363 |
| South Africa 2.2% | ||
| Clicks Group Ltd. Owns and operates chains of retail stores | 281,348 | 4,118,857 |
| Famous Brands Ltd.(a),(b) Food and beverage company | 762,811 | 6,349,720 |
| PSG Group Ltd. Diversified financial services | 107,294 | 2,341,433 |
| Total | 12,810,010 | |
| Common Stocks (continued) | ||
| Issuer | Shares | Value ($) |
| South Korea 4.2% | ||
| GS Retail Co., Ltd. Chain of retail stores | 163,001 | 6,131,999 |
| Koh Young Technology, Inc. 3D measurement and inspection equipment for testing various machineries | 75,432 | 5,813,031 |
| Korea Investment Holdings Co., Ltd. Financial holding company | 94,744 | 6,100,338 |
| Modetour Network, Inc. Travel services | 217,945 | 6,209,259 |
| Total | 24,254,627 | |
| Spain 0.9% | ||
| Prosegur Cia de Seguridad SA, Registered Shares Security and transportation services | 682,272 | 5,361,984 |
| Sweden 4.3% | ||
| Byggmax Group AB Discount provider of building materials | 769,229 | 5,157,513 |
| NetEnt AB Computer gaming software | 781,116 | 5,380,046 |
| Recipharm AB, B Shares(a) Contract development and manufacture of pharmaceuticals | 444,751 | 5,353,971 |
| Sweco AB, Class B Consulting company specializing in engineering, environmental technology, and architecture | 282,076 | 6,251,468 |
| Trelleborg AB, Class B Manufactures and distributes industrial products | 111,509 | 2,582,769 |
| Total | 24,725,767 | |
| Switzerland 1.4% | ||
| Inficon Holding AG Vacuum instruments used to monitor and control production processes | 13,100 | 8,180,358 |
| Taiwan 2.9% | ||
| Basso Industry Corp. Pneumatic nailers and staplers | 1,714,000 | 3,831,552 |
| Silergy Corp. High performance analog integrated circuits | 331,000 | 7,563,553 |
| Voltronic Power Technology Corp. Uninterruptible power supply products, inverters, multiple surface mounted devices and other power products | 316,395 | 5,475,525 |
| Total | 16,870,630 | |
| Wanger International | Annual Report 2017 | 11 |
Table of Contents
December 31, 2017
| Common Stocks (continued) | ||
| Issuer | Shares | Value ($) |
| Thailand 2.9% | ||
| Beauty Community PCL Cosmetic and beauty products | 11,663,600 | 7,444,089 |
| Home Product Center PCL, Foreign Registered Shares Building materials and home improvement products | 10,963,000 | 4,305,812 |
| Tisco Financial Group PCL Bank holding company | 1,777,600 | 4,827,174 |
| Total | 16,577,075 | |
| Turkey 0.6% | ||
| Logo Yazilim Sanayi Ve Ticaret AS(b) Enterprise resource planning software | 212,508 | 3,293,720 |
| United Kingdom 13.9% | ||
| Ascential PLC Media and consultancy services | 1,280,563 | 6,641,483 |
| Assura PLC Primary healthcare property group | 5,962,850 | 5,144,427 |
| Big Yellow Group PLC Self-storage company | 430,626 | 5,055,360 |
| Connect Group PLC Distribution of newspapers and magazines, and books | 734,038 | 1,109,989 |
| Domino’s Pizza Group PLC Pizza delivery stores | 1,458,814 | 6,808,973 |
| Halma PLC Products that detect hazards and protect assets and people in public and commercial buildings | 369,715 | 6,281,888 |
| Hastings Group Holdings PLC General insurance services to the automobile and home insurance products | 2,253,047 | 9,734,250 |
| Intermediate Capital Group PLC Private equity firm | 246,902 | 3,812,382 |
| LivaNova PLC(b) Medical technology focusing on neuromodulation, cardiac surgery and rhythm management | 38,208 | 3,053,583 |
| Polypipe Group PLC Plastic piping systems | 1,086,763 | 5,769,400 |
| PureCircle Ltd.(a),(b) Natural Sweeteners | 528,012 | 3,329,224 |
| Common Stocks (continued) | ||
| Issuer | Shares | Value ($) |
| Rightmove PLC Website that lists properties across Britain | 115,396 | 7,002,891 |
| Spirax-Sarco Engineering PLC Consultation, service and products for the control and efficient management of steam and industrial fluids | 79,227 | 5,989,937 |
| WH Smith PLC Retails books, magazines, newspapers, and periodicals | 334,071 | 10,586,055 |
| Total | 80,319,842 | |
| United States 0.6% | ||
| Ultragenyx Pharmaceutical, Inc.(b) Therapeutics and sialic acid for treating metabolic, body myopathy, glucuronidase, and rare genetic diseases | 78,495 | 3,640,598 |
| Total Common Stocks (Cost: $411,308,399) | 569,480,237 | |
| Securities Lending Collateral 2.3% | ||
| Shares | Value ($) | |
| Dreyfus Government Cash Management Fund, Institutional Shares, 1.190%(c),(d) | 13,200,989 | 13,200,989 |
| Total Securities Lending Collateral (Cost: $13,200,989) | 13,200,989 | |
| Money Market Funds 2.1% | ||
| JPMorgan U.S. Government Money Market Fund, IM Shares, 1.192%(c) | 12,388,117 | 12,388,117 |
| Total Money Market Funds (Cost: $12,388,117) | 12,388,117 | |
| Total Investments (Cost: $436,897,505) | 595,069,343 | |
| Obligation to Return Collateral for Securities Loaned | (13,200,989) | |
| Other Assets & Liabilities, Net | (3,780,548) | |
| Net Assets | $578,087,806 | |
| (a) | All or a portion of this security was on loan at December 31, 2017. The total market value of securities on loan at December 31, 2017 was $12,584,508. |
| (b) | Non-income producing security. |
| (c) | The rate shown is the seven-day current annualized yield at December 31, 2017. |
| (d) | Investment made with cash collateral received from securities lending activity. |
| 12 | Wanger International | Annual Report 2017 |
Table of Contents
December 31, 2017
| ADR | American Depositary Receipt |
| ¦ | Level 1 – quoted prices in active markets for identical securities |
| ¦ | Level 2 – prices determined using other significant observable inputs (including quoted prices for similar securities, interest rates, prepayment speeds, credit risk and others) |
| ¦ | Level 3 – prices determined using significant unobservable inputs where quoted prices or observable inputs are unavailable or less reliable (including management’s own assumptions about the factors market participants would use in pricing an investment) |
| Level 1 quoted prices in active markets for identical assets ($) | Level 2 other significant observable inputs ($) | Level 3 significant unobservable inputs ($) | Total ($) | |
| Investments | ||||
| Common Stocks | ||||
| Australia | — | 6,321,292 | — | 6,321,292 |
| Belgium | — | 6,521,623 | — | 6,521,623 |
| Brazil | 4,473,084 | — | — | 4,473,084 |
| Cambodia | — | 9,684,880 | — | 9,684,880 |
| Canada | 24,028,913 | — | — | 24,028,913 |
| Cayman Islands | 6,313,812 | 7,895,498 | — | 14,209,310 |
| China | 6,434,948 | 6,529,456 | — | 12,964,404 |
| Denmark | — | 10,228,145 | — | 10,228,145 |
| Finland | — | 4,330,123 | — | 4,330,123 |
| France | — | 6,948,853 | — | 6,948,853 |
| Germany | — | 51,868,697 | — | 51,868,697 |
| Hong Kong | — | 9,690,906 | — | 9,690,906 |
| India | — | 19,930,854 | — | 19,930,854 |
| Indonesia | — | 9,714,449 | — | 9,714,449 |
| Ireland | — | 6,273,950 | — | 6,273,950 |
| Italy | — | 16,338,596 | — | 16,338,596 |
| Japan | — | 110,666,551 | — | 110,666,551 |
| Malta | — | 12,208,077 | — | 12,208,077 |
| Mexico | 7,077,999 | — | — | 7,077,999 |
| Netherlands | — | 7,052,743 | — | 7,052,743 |
| Wanger International | Annual Report 2017 | 13 |
Table of Contents
December 31, 2017
| Level 1 quoted prices in active markets for identical assets ($) | Level 2 other significant observable inputs ($) | Level 3 significant unobservable inputs ($) | Total ($) | |
| New Zealand | — | 7,051,947 | — | 7,051,947 |
| Norway | — | 10,774,867 | — | 10,774,867 |
| Singapore | — | 5,085,363 | — | 5,085,363 |
| South Africa | — | 12,810,010 | — | 12,810,010 |
| South Korea | — | 24,254,627 | — | 24,254,627 |
| Spain | — | 5,361,984 | — | 5,361,984 |
| Sweden | — | 24,725,767 | — | 24,725,767 |
| Switzerland | — | 8,180,358 | — | 8,180,358 |
| Taiwan | — | 16,870,630 | — | 16,870,630 |
| Thailand | — | 16,577,075 | — | 16,577,075 |
| Turkey | — | 3,293,720 | — | 3,293,720 |
| United Kingdom | 3,053,583 | 77,266,259 | — | 80,319,842 |
| United States | 3,640,598 | — | — | 3,640,598 |
| Total Common Stocks | 55,022,937 | 514,457,300 | — | 569,480,237 |
| Securities Lending Collateral | 13,200,989 | — | — | 13,200,989 |
| Money Market Funds | 12,388,117 | — | — | 12,388,117 |
| Total Investments | 80,612,043 | 514,457,300 | — | 595,069,343 |
| 14 | Wanger International | Annual Report 2017 |
Table of Contents
December 31, 2017
| Assets | |
| Investments in unaffiliated issuers, at cost | $436,897,505 |
| Investments in unaffiliated issuers, at value (including securities on loan: $12,584,508) | 595,069,343 |
| Receivable for: | |
| Investments sold | 688,844 |
| Capital shares sold | 36,715 |
| Regulatory settlements (Note 6) | 131,912 |
| Dividends | 695,315 |
| Securities lending income | 39,053 |
| Foreign tax reclaims | 346,390 |
| Prepaid expenses | 12,758 |
| Trustees’ deferred compensation plan | 208,993 |
| Total assets | 597,229,323 |
| Liabilities | |
| Due upon return of securities on loan | 13,200,989 |
| Payable for: | |
| Investments purchased | 4,832,615 |
| Capital shares purchased | 696,844 |
| Investment advisory fee | 14,790 |
| Administration fees | 792 |
| Trustees’ fees | 1,051 |
| Compensation of chief compliance officer | 828 |
| Other expenses | 183,689 |
| Trustees’ deferred compensation plan | 208,993 |
| Other liabilities | 926 |
| Total liabilities | 19,141,517 |
| Net assets applicable to outstanding capital stock | $578,087,806 |
| Represented by | |
| Paid in capital | 357,990,860 |
| Undistributed net investment income | 2,858,259 |
| Accumulated net realized gain | 59,051,631 |
| Unrealized appreciation (depreciation) on: | |
| Investments - unaffiliated issuers | 158,171,838 |
| Foreign currency translations | 15,218 |
| Total - representing net assets applicable to outstanding capital stock | $578,087,806 |
| Shares outstanding | 18,741,854 |
| Net asset value per share | 30.84 |
| Wanger International | Annual Report 2017 | 15 |
Table of Contents
Year Ended December 31, 2017
| Net investment income | |
| Income: | |
| Dividends — unaffiliated issuers | $11,795,788 |
| Interest | 561 |
| Income from securities lending — net | 576,077 |
| Foreign taxes withheld | (1,175,245) |
| Total income | 11,197,181 |
| Expenses: | |
| Investment advisory fee | 5,155,467 |
| Service fees | 212,875 |
| Transfer agent fees | 320 |
| Administration fees | 273,917 |
| Trustees’ fees | 51,079 |
| Custodian fees | 163,634 |
| Printing and postage fees | 251,175 |
| Audit fees | 100,156 |
| Legal fees | 108,633 |
| Compensation of chief compliance officer | 1,558 |
| Other | 30,845 |
| Total expenses | 6,349,659 |
| Fees waived by transfer agent | (212,875) |
| Total net expenses | 6,136,784 |
| Net investment income | 5,060,397 |
| Realized and unrealized gain (loss) — net | |
| Net realized gain (loss) on: | |
| Investments — unaffiliated issuers | 64,290,031 |
| Foreign currency translations | (140,462) |
| Net realized gain | 64,149,569 |
| Net change in unrealized appreciation (depreciation) on: | |
| Investments — unaffiliated issuers | 85,401,911 |
| Foreign currency translations | 47,286 |
| Net change in unrealized appreciation (depreciation) | 85,449,197 |
| Net realized and unrealized gain | 149,598,766 |
| Net increase in net assets resulting from operations | $154,659,163 |
| 16 | Wanger International | Annual Report 2017 |
Table of Contents
| Year Ended December 31, 2017 | Year Ended December 31, 2016 | |
| Operations | ||
| Net investment income | $5,060,397 | $6,634,683 |
| Net realized gain | 64,149,569 | 6,134,947 |
| Net change in unrealized appreciation (depreciation) | 85,449,197 | (19,665,305) |
| Net increase (decrease) in net assets resulting from operations | 154,659,163 | (6,895,675) |
| Distributions to shareholders | ||
| Net investment income | (6,572,360) | (6,158,671) |
| Net realized gains | (4,004,590) | (44,383,757) |
| Total distributions to shareholders | (10,576,950) | (50,542,428) |
| Decrease in net assets from capital stock activity | (60,789,221) | (34,395,890) |
| Total increase (decrease) in net assets | 83,292,992 | (91,833,993) |
| Net assets at beginning of year | 494,794,814 | 586,628,807 |
| Net assets at end of year | $578,087,806 | $494,794,814 |
| Undistributed net investment income | $2,858,259 | $1,437,848 |
| Year Ended | Year Ended | |||
| December 31, 2017 | December 31, 2016 | |||
| Shares | Dollars ($) | Shares | Dollars ($) | |
| Capital stock activity | ||||
| Subscriptions | 501,656 | 13,324,413 | 374,135 | 9,287,190 |
| Distributions reinvested | 366,553 | 10,576,950 | 2,014,153 | 50,542,428 |
| Redemptions | (3,058,127) | (84,690,584) | (3,745,214) | (94,225,508) |
| Total net decrease | (2,189,918) | (60,789,221) | (1,356,926) | (34,395,890) |
| Wanger International | Annual Report 2017 | 17 |
Table of Contents
| Year Ended December 31, | |||||
| 2017 | 2016 | 2015 | 2014 | 2013 | |
| Per share data | |||||
| Net asset value, beginning of period | $23.64 | $26.32 | $29.07 | $34.55 | $31.19 |
| Income from investment operations: | |||||
| Net investment income | 0.25 | 0.31 | 0.31 | 0.36 | 0.39 |
| Net realized and unrealized gain (loss) | 7.49 | (0.56) | (0.09) | (1.56) | 6.18 |
| Total from investment operations | 7.74 | (0.25) | 0.22 | (1.20) | 6.57 |
| Less distributions to shareholders from: | |||||
| Net investment income | (0.34) | (0.29) | (0.41) | (0.48) | (0.88) |
| Net realized gains | (0.20) | (2.14) | (2.57) | (3.80) | (2.33) |
| Total distributions to shareholders | (0.54) | (2.43) | (2.98) | (4.28) | (3.21) |
| Proceeds from regulatory settlements | — | — | 0.01 | — | — |
| Net asset value, end of period | $30.84 | $23.64 | $26.32 | $29.07 | $34.55 |
| Total return | 32.91% (a) | (1.41)% | 0.10% (b) | (4.40)% | 22.37% |
| Ratios to average net assets | |||||
| Total gross expenses(c) | 1.16% | 1.08% (d) | 1.12% | 1.05% | 1.07% |
| Total net expenses(c) | 1.12% | 1.08% (d) | 1.12% | 1.05% | 1.07% |
| Net investment income | 0.92% | 1.23% | 1.11% | 1.10% | 1.19% |
| Supplemental data | |||||
| Portfolio turnover | 55% | 56% | 53% | 28% | 44% |
| Net assets, end of period (in thousands) | $578,088 | $494,795 | $586,629 | $667,023 | $784,977 |
| Notes to Financial Highlights | |
| (a) | Had the Investment Manager and/or its affiliates not waived a portion of expenses, total return would have been reduced. |
| (b) | The Fund received proceeds from regulatory settlements. Had the Fund not received these proceeds, the total return would have been lower by 0.02%. |
| (c) | In addition to the fees and expenses that the Fund bears directly, the Fund indirectly bears a pro rata share of the fees and expenses of any other funds in which it invests. Such indirect expenses are not included in the Fund’s reported expense ratios. |
| (d) | Expenses have been reduced due to a reimbursement of expenses overbilled by a third party. If the reimbursement had been excluded, the expense ratios would have been higher by 0.05%. All fee waivers and expense reimbursements by the Investment Manager and its affiliates were applied before giving effect to this third party reimbursement. |
| 18 | Wanger International | Annual Report 2017 |
Table of Contents
December 31, 2017
| Wanger International | Annual Report 2017 | 19 |
Table of Contents
December 31, 2017
| Overnight and continuous | Up to 30 days | 30-90 days | Greater than 90 days | Total | |
| Wanger International | |||||
| Securities lending transactions | |||||
| Equity securities | $12,584,508 | $— | $— | $— | $12,584,508 |
| Gross amount of recognized liabilities for securities lending (collateral received) | 13,200,989 | ||||
| Amounts due to counterparty in the event of default | $616,481 |
| 20 | Wanger International | Annual Report 2017 |
Table of Contents
December 31, 2017
| Goldman Sachs ($) | |
| Liabilities | |
| Collateral on Securities loaned | 13,200,989 |
| Total Liabilities | 13,200,989 |
| Total Financial and Derivative Net Assets | (13,200,989) |
| Financial Instruments | 12,584,508 |
| Net Amount (a) | (616,481) |
| (a) | Represents the net amount due from/(to) counterparties in the event of default. |
| Wanger International | Annual Report 2017 | 21 |
Table of Contents
December 31, 2017
| Average daily net assets | Annual fee rate |
| Up to $100 million | 1.10% |
| $100 million to $250 million | 0.95% |
| $250 million to $500 million | 0.90% |
| $500 million to $1 billion | 0.80% |
| $1 billion and over | 0.72% |
| 22 | Wanger International | Annual Report 2017 |
Table of Contents
December 31, 2017
| Aggregate average daily net assets of the Trust | Annual fee rate |
| Up to $4 billion | 0.05% |
| $4 billion to $6 billion | 0.04% |
| $6 billion to $8 billion | 0.03% |
| $8 billion and over | 0.02% |
| Wanger International | Annual Report 2017 | 23 |
Table of Contents
December 31, 2017
| Undistributed net investment income ($) | Accumulated net realized gain ($) | Paid in capital ($) |
| 2,932,374 | (2,932,373) | (1) |
| December 31, 2017 | December 31, 2016 | ||||
| Ordinary income ($) | Long-term capital gains ($) | Total ($) | Ordinary income ($) | Long-term capital gains ($) | Total ($) |
| 6,572,360 | 4,004,590 | 10,576,950 | 6,158,671 | 44,383,757 | 50,542,428 |
| Undistributed ordinary income ($) | Undistributed long-term capital gains ($) | Capital loss carryforwards ($) | Net unrealized appreciation ($) |
| 14,854,712 | 55,417,464 | — | 149,982,946 |
| Federal tax cost ($) | Gross unrealized appreciation ($) | Gross unrealized (depreciation) ($) | Net unrealized appreciation ($) |
| 445,086,397 | 162,097,502 | (12,114,556) | 149,982,946 |
| 24 | Wanger International | Annual Report 2017 |
Table of Contents
December 31, 2017
| Wanger International | Annual Report 2017 | 25 |
Table of Contents
December 31, 2017
| 26 | Wanger International | Annual Report 2017 |
Table of Contents
| Wanger International | Annual Report 2017 | 27 |
Table of Contents
(Unaudited)
| Capital gain dividend | Foreign taxes paid to foreign countries | Foreign taxes paid per share to foreign countries | Foreign source income | Foreign source income per share |
| $58,230,235 | $935,788 | $0.05 | $10,654,941 | $0.57 |
| 28 | Wanger International | Annual Report 2017 |
Table of Contents
Shareholder Services Group
227 W. Monroe, Suite 3000
800.922.6769
| Name and age at December 31, 2017 | Year first appointed or elected to a Board in the Columbia Funds Complex | Principal occupation(s) during the past five years | Number of Funds in the Columbia Funds Complex overseen (1) | Other directorships held by the Trustee during the past five years in addition to Columbia Acorn Trust and Wanger Advisors Trust |
| Laura M. Born, 52, Chair | 2007 | Adjunct Associate Professor of Finance, University of Chicago Booth School of Business since 2007; Director, Carlson Inc. (private global hospitalities and travel company) since 2015; Managing Director – Investment Banking, JP Morgan Chase & Co. (broker-dealer) 2002-2007. | 11 | None. |
| Maureen M. Culhane, 69 | 2007 | Retired. Formerly, Vice President, Goldman Sachs Asset Management, L.P. (investment adviser), 2005-2007; Vice President (Consultant) – Strategic Relationship Management, Goldman, Sachs & Co., 1999-2005. | 11 | None. |
| Margaret M. Eisen, 64 | 2002 | Chief Investment Officer, EAM International LLC (corporate finance and asset management), 2003-2013; Managing Director, CFA Institute, 2005-2008. | 11 | RMB Investors Trust (formerly Burnham Investors Trust) (3 series). |
| Thomas M. Goldstein, 58 | 2014 | Retired. Formerly, Chief Financial Officer, Allstate Protection Division, 2011-2014; Founding Partner, The GRG Group LLC, 2009-2011; Managing Director and Chief Financial Officer, Madison Dearborn Partners, 2007-2009. | 11 | Federal Home Loan Bank – Chicago; Federal Home Loan Mortgage Corporation; Kemper Corporation (insurance). |
| John C. Heaton, 58 | 2010 | Deputy Dean for Faculty, University of Chicago Booth School of Business; Joseph L. Gidwitz Professor of Finance, University of Chicago Booth School of Business since July 2000. | 11 | None. |
| Wanger International | Annual Report 2017 | 29 |
Table of Contents
| Name and age at December 31, 2017 | Year first appointed or elected to a Board in the Columbia Funds Complex | Principal occupation(s) during the past five years | Number of Funds in the Columbia Funds Complex overseen (1) | Other directorships held by the Trustee during the past five years in addition to Columbia Acorn Trust and Wanger Advisors Trust |
| Charles R. Phillips, 61 | 2015 | Consultant, Finger Rock, LLC (strategic consulting business). Director, University of North Carolina School of Law Foundation since 2010. Formerly, Vice Chairman, J.P. Morgan Private Bank, 2011-2014; Managing Director, J.P. Morgan Private Bank, 2001-2011. | 11 | None. |
| David J. Rudis, 64, Vice Chair | 2010 | Retired. Formerly, National Checking and Debit Executive, and Illinois President, Bank of America, 2007-2009; President, Consumer Banking Group, LaSalle National Bank, 2004-2007. | 11 | None. |
| Name and age at December 31, 2017 | Year first appointed or elected to a Board in the Columbia Funds Complex | Principal occupation(s) during the past five years | Number of Funds in the Columbia Funds Complex overseen (1) | Other directorships held by the Trustee during the past five years in addition to Columbia Acorn Trust and Wanger Advisors Trust |
| P. Zachary Egan, 49 (2) | 2015 | President, CWAM and President, Columbia Acorn Trust and Wanger Advisors Trust since April 2014; Global Chief Investment Officer, CWAM since October 2015; International Chief Investment Officer, CWAM, April 2014-September 2015; Director of International Research, CWAM, December 2004-March 2014; Vice President of Columbia Acorn Trust, 2003-2014, and Wanger Advisors Trust, 2007-2014; portfolio manager and analyst, CWAM or its predecessors, since 1999. | 11 | None. |
| Name and age at December 31, 2017 | Year first appointed or elected to a Board in the Columbia Funds Complex | Principal occupation(s) during the past five years | Number of Funds in the Columbia Funds Complex overseen (1) | Other directorships held by the Trustee during the past five years in addition to Columbia Acorn Trust and Wanger Advisors Trust |
| Ralph Wanger, 83 (3) | 1970 (4) | Founder, CWAM. Formerly, President, Chief Investment Officer and portfolio manager, CWAM or its predecessors, July 1992-September 2003; Director, Wanger Investment Company PLC; Consultant to CWAM or its predecessors, September 2003-September 2005. | 11 | None. |
| (1) | The Trustees oversee the series of Wanger Advisors Trust and Columbia Acorn Trust. |
| (2) | Mr. Egan is an "interested person" of Wanger Advisors Trust and Columbia Acorn Trust, and of CWAM, as defined in the 1940 Act, because he is an officer of each Trust and an employee of CWAM. |
| (3) | As permitted under the Trust’s Bylaws, Mr. Wanger serves as a non-voting Trustee Emeritus of Columbia Acorn Trust and Wanger Advisors Trust. |
| 30 | Wanger International | Annual Report 2017 |
Table of Contents
| (4) | Dates prior to 1992 relate to the Acorn Fund, Inc., the predecessor trust to Columbia Acorn Trust. |
| Name and age at December 31, 2017 | Position held with Columbia Acorn Trust and Wanger Advisors Trust | Year first appointed or elected to office | Principal occupation(s) during the past five years |
| Alan G. Berkshire, 57 | Vice President | 2015 | Chief Operating Officer, CWAM since April 2015. Formerly, Independent Director, ValueQuest India Moat Fund Limited (Mauritius), April 2014-March 2015; President – North America, Religare Global Asset Management, Inc., June 2011-November 2013; Partner, Estancia Capital Management LLC, September 2009-June 2011. |
| Michael G. Clarke, 48 | Assistant Treasurer | 2004 | Vice President – Mutual Fund Administration, Columbia Management Investment Advisers, LLC since May 2010; Managing Director of Fund Administration, Columbia Management Advisors, LLC, September 2004-April 2010; Senior officer of Columbia funds and affiliated funds since 2002. |
| P. Zachary Egan, 49 | President | 2007 | President, CWAM and President, Columbia Acorn Trust and Wanger Advisors Trust since April 2014; Global Chief Investment Officer, CWAM since October 2015; International Chief Investment Officer, CWAM, April 2014-September 2015; Director of International Research, CWAM, December 2004-March 2014; Vice President of Columbia Acorn Trust, 2003-2014, and Wanger Advisors Trust, 2007-2014; portfolio manager and analyst, CWAM or its predecessors, since 1999. |
| David L. Frank, 54 | Vice President | 2014 | Portfolio manager and/or analyst, CWAM or its predecessors since 2002; Vice President, Columbia Acorn Trust and Wanger Advisors Trust since 2014. |
| Paul B. Goucher, 49 | Assistant Secretary | 2015 | Senior Vice President and Assistant General Cousel, Ameriprise Financial, Inc. since January 2017 (previously Vice President and Lead Chief Counsel, November 2008 - January 2017 and January 2013 - January 2017, respectively, and Chief Counsel, January 2010 - January 2013); Vice President, Chief Legal Counsel and Assistant Secretary, Columbia Management Investment Advisers, LLC since May 2010. |
| John Kunka, 47 | Vice President, Treasurer and Principal Accounting and Financial Officer | 2006 | Treasurer and Principal Accounting and Financial Officer, Columbia Acorn Trust and Wanger Advisors Trust since 2014; Vice President of Accounting and Operations, CWAM since May 2006; formerly, Assistant Treasurer, Columbia Acorn Trust and Wanger Advisors Trust 2006-2014. |
| Stephen Kusmierczak, 50 | Vice President | 2011 | Portfolio manager and/or analyst, CWAM or its predecessors since 2001; Vice President, Columbia Acorn Trust and Wanger Advisors Trust since 2011. |
| Joseph C. LaPalm, 48 | Vice President | 2006 | Chief Compliance Officer, CWAM since 2005. |
| Ryan C. Larrenaga, 47 | Assistant Secretary | 2015 | Vice President and Group Counsel, Ameriprise Financial, Inc. since August 2011 (previously, Counsel, May 2010-August 2011); Assistant General Counsel, Bank of America, 2005-April 2010; officer of Columbia funds and affiliated funds since 2005. |
| Matthew A. Litfin, 46 | Vice President | 2016 | Director of Research (U.S.) and portfolio manager, CWAM since December 2015; formerly, portfolio manager, William Blair & Company 1993-2015; Vice President, Columbia Acorn Trust and Wanger Advisors Trust since 2016. |
| Satoshi Matsunaga, 46 | Vice President | 2015 | Portfolio manager and/or analyst, CWAM or its predecessors since 2005; Vice President, Columbia Acorn Trust and Wanger Advisors Trust since 2015. |
| Thomas P. McGuire, 45 | Chief Compliance Officer | 2015 | Senior Vice President and Chief Compliance Officer of the Columbia Funds since 2012; Vice President – Asset Management Compliance, Ameriprise Financial, Inc., since May 2010; Chief Compliance Officer, Ameriprise Certificate Company since September 2010; Compliance Executive, Bank of America, 2005-April 2010. |
| Wanger International | Annual Report 2017 | 31 |
Table of Contents
| Name and age at December 31, 2017 | Position held with Columbia Acorn Trust and Wanger Advisors Trust | Year first appointed or elected to office | Principal occupation(s) during the past five years |
| Louis J. Mendes III, 53 | Vice President | 2003 | International Director of Research, CWAM, since 2015; portfolio manager and/or analyst, CWAM or its predecessors since 2001; Vice President, Columbia Acorn Trust since 2003 and Wanger Advisors Trust since 2005. |
| Julian Quero, 50 | Assistant Treasurer | 2015 | Vice President – Tax, Columbia Management Investment Advisers, LLC since 2009. |
| Martha A. Skinner, 43 | Assistant Treasurer | 2016 | Vice President of Financial Reporting and Administration, Columbia Management since November 2015; Director of Financial Reporting, Columbia Management, April 2013-November 2015; Manager of Financial Reporting, Columbia Management, August 2010-April 2013. |
| Matthew S. Szafranski, 40 | Vice President | 2015 | Portfolio manager and/or analyst, CWAM or its predecessors since 2008; Vice President, Columbia Acorn Trust and Wanger Advisors Trust since 2015. |
| Linda Roth-Wiszowaty, 48 | Secretary | 2006 | Business support analyst, CWAM since April 2007; Secretary, Columbia Acorn Trust and Wanger Advisors Trust since 2014; Assistant Secretary, Columbia Acorn Trust and Wanger Advisors Trust, 2006-2014. |
| 32 | Wanger International | Annual Report 2017 |
Table of Contents
| Wanger International | Annual Report 2017 | 33 |
Table of Contents
Table of Contents
Table of Contents
Table of Contents
Item 2. Code of Ethics.
| (a) | The registrant has adopted a code of ethics that applies to the registrant’s principal executive officer, principal financial officer, principal accounting officer or controller, or persons performing similar functions, regardless of whether these individuals are employed by the registrant or a third party. |
| (b) | During the period covered by this report, there were not any amendments to a provision of the code of ethics adopted in 2(a) above. |
| (c) | During the period covered by this report, there were no waivers, including any implicit waivers, from a provision of the code of ethics described in 2(a) above that relates to one or more of the items set forth in paragraph (b) of this item’s instructions. |
Item 3. Audit Committee Financial Expert.
The registrant’s Board of Trustees has determined that Thomas Goldstein, a member of the registrant’s Board of Trustees and Audit Committee, qualifies as an audit committee financial expert. Mr. Goldstein is an independent trustee, as defined in paragraph (a)(2) of this item’s instructions
Item 4. Principal Accountant Fees and Services.
Fee information below is disclosed for the three series of the registrant whose reports to stockholders are included in this annual filing.
(a) Audit Fees. Aggregate Audit Fees billed by the principal accountant for professional services rendered during the fiscal years ended December 31, 2017 and December 31, 2016 are approximately as follows:
| 2017 | 2016 | |
$84,100 | $81,800 |
Audit Fees include amounts related to the audit of the registrant’s annual financial statements or services that are normally provided by the accountant in connection with statutory and regulatory filings or engagements for those fiscal years.
(b) Audit-Related Fees. Aggregate Audit-Related Fees billed to the registrant by the principal accountant for professional services rendered during the fiscal years ended December 31, 2017 and December 31, 2016 are approximately as follows:
| 2017 | 2016 | |
$6,700 | $6,500 |
Audit-Related Fees include amounts for assurance and related services by the principal accountant that are reasonably related to the performance of the audit of the registrant’s
Table of Contents
financial statements and are not reported in Audit Fees above. In both fiscal years 2017 and 2016, Audit-Related Fees consist of agreed-upon procedures performed for other audit-related additional testing.
During the fiscal years ended December 31, 2017 and December 31, 2016, there were no Audit-Related Fees billed by the registrant’s principal accountant to the registrant’s investment adviser (not including any sub-adviser whose role is primarily portfolio management and is subcontracted with or overseen by another investment adviser) and any entity controlling, controlled by, or under common control with the adviser that provides ongoing services to the registrant for an engagement that related directly to the operations and financial reporting of the registrant.
(c) Tax Fees. Aggregate Tax Fees billed by the principal accountant to the registrant for professional services rendered during the fiscal years ended December 31, 2017 and December 31, 2016 are approximately as follows:
| 2017 | 2016 | |
$24,000 | $44,000 |
Tax Fees incurred in both fiscal years 2017 and 2016 relate to the review of annual tax returns, the review of required shareholder distribution calculations and include amounts for professional services by the principal accountant for tax compliance, tax advice and tax planning. Fiscal year 2016 also includes Tax Fees for agreed upon procedures related to a fund merger and review of a final tax return.
During the fiscal years ended December 31, 2017 and December 31, 2016, there were no Tax Fees billed by the registrant’s principal accountant to the registrant’s investment adviser (not including any sub-adviser whose role is primarily portfolio management and is subcontracted with or overseen by another investment adviser) and any entity controlling, controlled by, or under common control with the adviser that provides ongoing services to the registrant for an engagement that related directly to the operations and financial reporting of the registrant.
(d) All Other Fees. Aggregate All Other Fees billed by the principal accountant to the registrant for professional services rendered during the fiscal years ended December 31, 2017 and December 31, 2016 are as follows:
| 2017 | 2016 | |
$0 | $0 |
All Other Fees include amounts for products and services provided by the principal accountant, other than the services reported in paragraphs (a) through (c) above. Aggregate All Other Fees billed by the registrant’s principal accountant to the registrant’s investment adviser (not including any sub-adviser whose role is primarily portfolio management and is subcontracted with or overseen by another investment adviser) and any entity controlling, controlled by, or under common control with the adviser that
Table of Contents
provides ongoing services to the registrant for an engagement that related directly to the operations and financial reporting of the registrant during the fiscal years ended December 31, 2017 and December 31, 2016 are approximately as follows:
| 2017 | 2016 | |
$225,000 | $225,000 |
In both fiscal years 2017 and 2016, All Other Fees primarily consist of professional services rendered for internal control reviews.
(e)(1) Audit Committee Pre-Approval Policies and Procedures
The policy of the registrant’s Audit Committee is to specifically pre-approve (i) all audit and non-audit (including audit related, tax and all other) services provided by the registrant’s independent auditor to the registrant and individual funds (collectively “Fund Services”) and (ii) all non-audit services provided by the registrant’s independent auditor to the funds’ adviser or a control affiliate of the adviser, that relate directly to the funds’ operations and financial reporting (collectively “Fund-related Adviser Services”). A “control affiliate” is an entity controlling, controlled by, or under common control with the adviser that provides ongoing services to the funds, and the term “adviser” is deemed to exclude any unaffiliated sub-adviser whose role is primarily portfolio management and is sub-contracted or overseen by another investment adviser.
If such Fund Services or Fund-related Adviser Services are required during the period between the Audit Committee’s regularly scheduled meetings, the Chairman of the Audit Committee has the authority to pre-approve the service, with reporting to the full Audit Committee at the next regularly scheduled meeting.
The Audit Committee will waive pre-approval of Fund Services or Fund-related Adviser Services provided that the requirements under paragraph (c)(7)(i)(C) of Rule 2-01 of Regulation S-X are met.
(e)(2) The percentage of services described in paragraphs (b) through (d) of this Item approved pursuant to the “de minimis” exception under paragraph (c)(7)(i)(C) of Rule 2-01 of Regulation S-X during both fiscal years ended December 31, 2017 and December 31, 2016 was zero.
(f) Not applicable.
(g) The aggregate non-audit fees billed by the registrant’s accountant for services rendered to the registrant, and rendered to the registrant’s investment adviser (not including any sub-adviser whose role is primarily portfolio management and is subcontracted with or overseen by another investment adviser), and any entity controlling, controlled by, or under common control with the adviser that provides ongoing services to the registrant for the fiscal years ended December 31, 2017 and December 31, 2016 are approximately as follows:
| 2017 | 2016 | |
$255,700 | $275,500 |
Table of Contents
(h) The registrant’s Audit Committee of the Board of Directors has considered whether the provision of non-audit services that were rendered to the registrant’s adviser (not including any sub-adviser whose role is primarily portfolio management and is subcontracted with or overseen by another investment adviser), and any entity controlling, controlled by, or under common control with the investment adviser that provides ongoing services to the registrant that were not pre-approved pursuant to paragraph (c)(7)(ii) of Rule 2-01 of Regulation S-X, is compatible with maintaining the principal accountant’s independence.
Item 5. Audit Committee of Listed Registrants.
Not applicable.
Item 6. Investments
| (a) | The registrant’s “Schedule I – Investments in securities of unaffiliated issuers” (as set forth in 17 CFR 210.12-12) is included in Item 1 of this Form N-CSR. |
| (b) | Not applicable |
Item 7. Disclosure of Proxy Voting Policies and Procedures for Closed-End Management Investment Companies.
Not applicable.
Item 8. Portfolio Managers of Closed-End Management Investment Companies.
Not applicable.
Item 9. Purchases of Equity Securities by Closed-End Management Investment Company and Affiliated Purchasers.
Not applicable.
Item 10. Submission of Matters to a Vote of Security Holders.
There were no material changes to the procedures by which shareholders may recommend nominees to the registrant’s board of directors.
Table of Contents
Item 11. Controls and Procedures.
| (a) | The registrant’s principal executive officer and principal financial officer, based on their evaluation of the registrant’s disclosure controls and procedures as of a date within 90 days of the filing of this report, have concluded that such controls and procedures are adequately designed to ensure that material information required to be disclosed by the registrant in Form N-CSR is accumulated and communicated to the registrant’s management, including the principal executive officer and principal financial officer, or persons performing similar functions, as appropriate to allow timely decisions regarding required disclosure. |
| (b) | There was no change in the registrant’s internal control over financial reporting that occurred during the registrant’s second fiscal quarter of the period covered by this report that has materially affected, or is reasonably likely to materially affect, the registrant’s internal control over financial reporting. |
Item 12. Disclosure of Securities Lending Activities for Closed-End Management Investment Companies
Not applicable.
Item 13. Exhibits.
(a)(1) Code of ethics required to be disclosed under Item 2 of Form N-CSR attached hereto as Exhibit 99.CODE ETH.
(a)(2) Certifications pursuant to Rule 30a-2(a) under the Investment Company Act of 1940 (17 CFR 270.30a-2(a)) attached hereto as Exhibit 99.CERT.
(a)(3) Not applicable.
(b) Certification pursuant to Rule 30a-2(b) under the Investment Company Act of 1940 (17 CFR 270.30a-2(b)) attached hereto as Exhibit 99.906CERT.
Table of Contents
SIGNATURES
Pursuant to the requirements of the Securities Exchange Act of 1934 and the Investment Company Act of 1940, the registrant has duly caused this report to be signed on its behalf by the undersigned, thereunto duly authorized.
(registrant) Wanger Advisors Trust | ||
| By (Signature and Title) /s/ P. Zachary Egan | ||
| P. Zachary Egan, President and Principal Executive Officer | ||
| Date February 20, 2018 | ||
Pursuant to the requirements of the Securities Exchange Act of 1934 and the Investment Company Act of 1940, this report has been signed below by the following persons on behalf of the registrant and in the capacities and on the dates indicated.
| By (Signature and Title) /s/ P. Zachary Egan | ||
| P. Zachary Egan, President and Principal Executive Officer | ||
| Date February 20, 2018 | ||
| By (Signature and Title) /s/ John M. Kunka | ||
| John M. Kunka, Treasurer and Principal Accounting and Financial Officer | ||
| Date February 20, 2018 | ||