UNITED STATES
SECURITIES AND EXCHANGE COMMISSION
Washington, D.C. 20549
FORM N-CSR
CERTIFIED SHAREHOLDER REPORT OF REGISTERED
MANAGEMENT INVESTMENT COMPANIES
Investment Company Act file number | 811-08748 | |||||||
| ||||||||
Wanger Advisors Trust | ||||||||
(Exact name of registrant as specified in charter) | ||||||||
| ||||||||
227 W. Monroe Street Suite 3000 Chicago, IL |
| 60606 | ||||||
(Address of principal executive offices) |
| (Zip code) | ||||||
| ||||||||
Mary C. Moynihan Perkins Coie LLP 700 13th Street, NW Suite 600 Washington, DC 20005
Paul B. Goucher, Esq. Columbia Management Investment Advisers, LLC 100 Park Avenue New York, New York 10017
P. Zachary Egan Columbia Acorn Trust 227 West Monroe Street, Suite 3000 Chicago, Illinois 60606 | ||||||||
(Name and address of agent for service) | ||||||||
| ||||||||
Registrant’s telephone number, including area code: | (312) 634-9200 |
| ||||||
| ||||||||
Date of fiscal year end: | December 31 |
| ||||||
| ||||||||
Date of reporting period: | December 31, 2015 |
| ||||||
Form N-CSR is to be used by management investment companies to file reports with the Commission not later than 10 days after the transmission to stockholders of any report that is required to be transmitted to stockholders under Rule 30e-1 under the Investment Company Act of 1940 (17 CFR 270.30e-1). The Commission may use the information provided on Form N-CSR in its regulatory, disclosure review, inspection, and policymaking roles.
A registrant is required to disclose the information specified by Form N-CSR, and the Commission will make this information public. A registrant is not required to respond to the collection of information contained in Form N-CSR unless the Form displays a currently valid Office of Management and Budget (“OMB”) control number. Please direct comments concerning the accuracy of the information collection burden estimate and any suggestions for reducing the burden to Secretary, Securities and Exchange Commission, 450 Fifth Street, NW, Washington, DC 20549-0609. The OMB has reviewed this collection of information under the clearance requirements of 44 U.S.C. § 3507.
Item 1. Reports to Stockholders.

ANNUAL REPORT
December 31, 2015

COLUMBIA WANGER FUNDS
Managed by Columbia Wanger Asset Management, LLC
WANGER INTERNATIONAL

Wanger International
2015 Annual Report
Table of Contents
| 2 | Understanding Your Expenses | ||||||
| 3 | Behavioral Economics | ||||||
| 6 | Performance Review | ||||||
| 8 | Statement of Investments | ||||||
| 17 | Statement of Assets and Liabilities | ||||||
| 17 | Statement of Operations | ||||||
| 18 | Statement of Changes in Net Assets | ||||||
| 19 | Financial Highlights | ||||||
| 20 | Notes to Financial Statements | ||||||
| 24 | Report of Independent Registered Public Accounting Firm | ||||||
| 25 | Federal Income Tax Information (Unaudited) | ||||||
| 26 | Board of Trustees and Management of Wanger Advisors Trust | ||||||
Columbia Wanger Asset Management, LLC (CWAM) is one of the leading global small- and mid-cap equity managers in the United States with over 40 years of small- and mid-cap investment experience. As of December 31, 2015, CWAM managed $20 billion in assets. CWAM is the investment manager to Wanger USA, Wanger International, Wanger Select and Wanger International Select (together, the Columbia Wanger Funds) and the Columbia Acorn Family of Funds.
An important note: Columbia Wanger Funds are available only through variable annuity contracts and variable life insurance policies issued by participating insurance companies or certain eligible retirement plans. Columbia Wanger Funds are not offered directly to the public and are not available in all contracts, policies or plans. Contact your financial advisor or insurance representative for more information. Columbia Wanger Funds are distributed by Columbia Management Investment Distributors, Inc., member FINRA, and are managed by CWAM.
Investors should carefully consider investment objectives, risks and expenses of the Fund before investing. For variable fund and variable contract prospectuses, which contain this and other important information, including the fees and expenses imposed under your contract, investors should contact their financial advisor or insurance representative. Read the prospectus for the Fund and your variable contract carefully before investing.
The views expressed in "Behavioral Economics" and in the Performance Review reflect the current views of the respective authors. These views are not guarantees of future performance and involve certain risks, uncertainties and assumptions that are difficult to predict, so actual outcomes and results may differ significantly from the views expressed. These views are subject to change at any time based upon economic, market or other conditions and the respective parties disclaim any responsibility to update such views. These views may not be relied on as investment advice and, because investment decisions for a Columbia Wanger Fund are based on numerous factors, may not be relied on as an indication of trading intent on behalf of any particular Columbia Wanger Fund. References to specific company securities should not be construed as a recommendation or investment advice.
1
Wanger International 2015 Annual Report
Understanding Your Expenses
As a shareholder, you incur three types of costs. There are transaction costs, which generally include sales charges on purchases and may include redemption fees. There are also ongoing costs, which generally include management fees and other expenses for Wanger International (the Fund). Lastly, there may be additional fees or charges imposed by the insurance company that sponsors your variable annuity and/or variable life insurance product. The following information is intended to help you understand your ongoing costs (in dollars) of investing in the Fund and to help you compare these costs with the ongoing costs of investing in other mutual funds.
Analyzing your Fund's expenses
To illustrate these ongoing costs, we have provided an example and calculated the expenses paid by investors in the Fund during the period. The actual and hypothetical information in the table below is based on an initial investment of $1,000 at the beginning of the period indicated and held for the entire period. Expense information is calculated two ways and each method provides you with different information. The amount listed in the "Actual" column is calculated using the Fund's actual operating expenses and total return for the period. You may use the Actual information, together with the amount invested, to estimate the expenses that you paid over the period. Simply divide your account value by $1,000 (for example, an $8,600 account value divided by $1,000 = 8.6), then multiply the results by the expenses paid during the period under the Actual column. The amount listed in the "Hypothetical" column assumes a 5% annual rate of return before expenses (which is not the Fund's actual return) and then applies the Fund's actual expense ratio for the period to the hypothetical return. You should not use the hypothetical account values and expenses to estimate either your actual account balance at the end of the period or the expenses you paid during the period. See "Compare with other funds" below for details on how to use the hypothetical data.
Compare with other funds
Since all mutual funds are required to include the same hypothetical calculations about expenses in shareholder reports, you can use this information to compare the ongoing cost of investing in the Fund with other funds. To do so, compare the hypothetical example with the 5% hypothetical examples that appear in the shareholder reports of other funds. As you compare hypothetical examples of other funds, it is important to note that hypothetical examples are meant to highlight the ongoing cost of investing in a fund only and do not reflect any transaction costs, such as sales charges, redemption or exchange fees. Therefore, the hypothetical calculations are useful in comparing ongoing costs only, and will not help you determine the relative total costs of owning different funds. If transaction costs were included in these calculations, your costs would be higher.
July 1, 2015 – December 31, 2015
| Account value at the beginning of the period ($) | Account value at the end of the period ($) | Expenses paid during period ($) | Fund's annualized expense ratio (%)* | ||||||||||||||||||||||||||||
Actual | Hypothetical | Actual | Hypothetical | Actual | Hypothetical | ||||||||||||||||||||||||||
Wanger International | 1,000.00 | 1,000.00 | 951.80 | 1,019.41 | 5.66 | 5.85 | 1.15 | ||||||||||||||||||||||||
* Expenses paid during the period are equal to the Fund's annualized expense ratio, multiplied by the average account value over the period, then multiplied by the number of days in the Fund's most recent fiscal half-year and divided by 365.
It is important to note that the expense amounts shown in the table are meant to highlight only ongoing costs of investing in the Fund. Expenses paid during the period do not include any insurance charges imposed by your insurance company's separate account. The hypothetical example provided is useful in comparing ongoing costs only and will not help you determine the relative total costs of owning different funds whose shareholders may incur transaction costs.
2
Wanger International 2015 Annual Report
Behavioral Economics
People Occasionally Behave Irrationally
Economists have traditionally assumed that people rationally optimize in their own self-interest. A free-market economy dominated by "homo economicus" prospers as producers of goods and services trade with each other, as if driven by an invisible hand. In the past few decades, however, behavioral economics has emerged, refuting the rational optimization assumption. Nobel Prize winning Princeton professor Daniel Kahneman's book Thinking, Fast and Slow explains the habits and biases that cause people to make predictable errors.
Illustrating that people tend to make quick, intuitive decisions rather than well thought out ones, Kahneman asked Ivy League students the following question: A bat and a ball cost $1.10. The bat costs $1.00 more than the ball. How much does the ball cost? Over half of students answered $0.10, though the correct answer is $0.05.
Kahneman also points out that people generally have a confirmation bias.1 Good scientific method calls for people to test a hypothesis by attempting to refute it, but instead people seek data that confirms their beliefs. We would rather keep our beliefs than seriously analyze and challenge them.
Individuals also exhibit an anchoring effect. Kahneman and his associate Amos Tversky devised several experiments that first provided a high or low number (from a rigged "wheel of fortune" or in a text) and then asked for best-guess estimates for unrelated data. Subjects who were provided high numbers gave high estimates and vice versa. People tend to "anchor" on an initial number provided and then move toward an unbiased estimate. When the Exploratorium Museum in San Francisco polled visitors about contributing to a particular cause without providing a suggested contribution amount, visitors on average said they would donate $64. When $5 was suggested as a donation, the average response was $20, and when $400 was suggested, the average jumped to $143.2 It seems as though many charities understand the anchoring effect.
Kahneman identified an availability bias. People base their knowledge, opinions and actions on small samples of information readily available to them. Estimates of causes of death are warped by media coverage. For example, strokes cause almost twice as many deaths as all accidents combined, but 80% of respondents said accidental deaths were more likely.3
Kahneman and Tversky did many behavioral studies, and their largest contribution to behavioral economics is their work on decision making in risky situations. Subjects were asked to make the following two choices concurrently:
Choose between:
A. a sure gain of $240
B. 25% chance to win $1,000 and a 75% chance to gain nothing
Choose between:
C. a sure loss of $750
D. 75% chance to lose $1,000 and a 25% chance to lose nothing
People are risk averse with respect to gains; 84% of subjects chose A, accepting a lower expected value than B.4 However, people are risk seeking with respect to losses. People hate to lose and will take a chance of a greater loss in exchange for a chance not to lose; 87% chose D.5
Despite the instructions, subjects appeared to make these choices sequentially rather than concurrently. They framed the exercise as two separate choices. Choosing A and D provides a net result of a 75% chance to lose $760 and a 25% chance of gaining $240. People solving the problems concurrently and rationally would have chosen C and B, which provides a net result of a 75% chance to lose $750 and a 25% chance to gain $250. Choosing C and B together results in the same odds, yet $10 more under either scenario.
Given our biases, how a choice is framed heavily influences our decisions. Would you accept a gamble that offers a 10% chance to win $95 and a 90% chance to lose $5? Would you pay $5 to participate in a lottery that offers a 10% chance to win $100 and a 90% chance to win nothing?
Many more people accept the second opportunity than the first, even though the choices are identical. The first clearly frames the $5 as a loss, while the second suggests the $5 is a sunk cost. 6
Kahneman and Tversky also did a study to determine values people assign to probabilities, what they called decision weights. People provided zero value to a zero probability and a value of 100 to a sure thing, but the values in between were interesting:7
Probability | 1 | % | 10 | % | 50 | % | 90 | % | 99 | % | |||||||||||||
| Decision Weight | 5.5 | 18.6 | 42.1 | 71.2 | 91.2 | ||||||||||||||||||
What the data shows is that people are often willing to overpay for small probabilities, a tendency known as the possibility effect. That is why lotteries exist. Yet people underpay relatively more for large but not certain probabilities. To eliminate those last bits of uncertainty, people are willing to pay a lot, a tendency known as the certainty effect.
Richard Thaler, a University of Chicago professor of behavioral science and economics, worked with Kahneman and Tversky on several studies. Jointly, they defined the endowment effect, which states that once someone owns something, he tends to place an irrationally high value on it. Thaler and Kahneman experimented by giving some subjects coffee mugs decorated with university insignia. Participants were asked to provide the prices at which they would sell. Other subjects were not given mugs and were asked what prices they would bid for the mugs. The average selling price was about double the average buying price!8
Thaler agrees with Kahneman's findings that people are risk seeking with respect to losses, both prospectively and retrospectively. People who are losing money at a racetrack tend to bet on longshots for the last race of the day, hoping to recoup losses, effectively driving the expected return of the last race even more against them!9 Financial institutions need to watch losing traders very closely, as rogue traders repeatedly double down in hopes of recouping losses.
3
Wanger International 2015 Annual Report
Thaler's work indicates that people create mental accounts, treating some money differently depending on its intended use. Cash accounts are for spending, other funds are for savings, and retirement accounts are sacrosanct.10 People may borrow at high interest rates on their charge cards while receiving low interest rates on savings, which appears irrational.
Thaler notes that Economics 101 classes typically teach that prices should rationally rise when there is an unanticipated increase in demand. I remember learning that it would be rational for merchants to raise the price of snow shovels after a blizzard and plywood before a hurricane. The products would be rationed by price to those most in need and capable of paying, and additional revenues would induce costly special increases in supply. Thaler's work, however, indicates that most people would consider such increases as unfair price gouging, and would later penalize those merchants.
Policy Implications
Public policies are often impacted by people's emotional reaction under the availability bias. Former Administrator of the White House Office of Information and Regulatory Affairs, Cass Sunstein, has analyzed resulting regulations and notes that poor regulations waste time and money. Rational weighting of costs and benefits would result in better regulations and improved outcomes.11
Kahneman points out that as an extension of the possibility effect, people tend to be confounded by exceptionally small probabilities,12 and either ignore them or give them way too much attention. The precautionary principle, which prohibits any action that might cause harm, is the result. Sunstein believes that many innovations including airplanes, antibiotics, automobiles, chlorination, vaccinations and x-rays would have not passed strict interpretation of the precautionary principle.13
Thaler's work explains one of the reasons why policy makers prefer modest inflation. People consider outright wage cuts as unfair, even when unemployment is high and the employer is
earning only a small profit. But a flat wage when there is inflation is not considered unfair, even though real wages drop.14 Therefore, the economy can more easily rationalize costs in a recession with some inflation rather than none.
Thaler devised a plan to induce people to contribute more to 401K plans called "Save More Tomorrow." Many people don't contribute to their 401K plan because that would mean an immediate take-home pay cut, frowned on by the endowment effect. Instead, the plan has people sign up now to contribute upon their next raise in pay. They then forgo some or the entire raise, but save for retirement without taking a pay cut. Employees of the first company that adopted the plan nearly quadrupled their savings rate after four annual raises.15
Thaler and Sunstein's book Nudge cites numerous ways that individuals can be "nudged" to make better decisions. For example, default options are considered standard and most people don't extend the effort to make a different choice. Germans need to opt in for organ donations, and only 12% do. Austrians need to opt out of organ donations, and 99% allow their organs to be donated.16
Investment Implications
Kahneman notes that experienced traders in financial markets tend to more rationally deal with risk aversion than individual investors. Most people weight losses twice as much as gains,17 and if each transaction is framed individually, irrational risk aversion results. By framing gains and losses over longer periods rather than individually, traders can accept individual rational risks. To mitigate this bias, Kahneman suggests that individual investors view the market prices of their investments less frequently.18
Thaler agrees, as he conducted an experiment simulating endowment management. Some subjects were shown results eight times per simulated calendar year, while others were shown results once per simulated year. Those seeing results more frequently chose to invest 41% in stocks and those seeing results just
once a year had 70% in stocks.19 Myopic risk aversion helps explain why stocks provided a 7% premium compound rate of return over risk-free securities for the last two centuries,20 a huge premium that cannot be otherwise explained by economic theory.21
Individuals tend to be terrible stock traders. One study indicated that stocks sold by individuals outperformed stocks they bought by 3.2% per year, before transactions costs. Individual investors tend to sell winners even though recent winners on average outperform recent losers in the short term. Individuals tend to keep losers, as they are averse to taking losses and have anchored on purchase prices as target sale prices for losers.22 Losers on average underperform in the short term.23
Mental accounts result in the house money effect for gamblers and investors. People are more prone to lose their risk aversion on gains when they are ahead. This can result in gamblers not knowing when to quit, and investors creating bubbles.24
Humans, including many professional money managers, seem to be hard wired to invest poorly, to "buy high and sell low." Behavioral economics helps explain why. One solution to offset this tendency is to own Columbia Thermostat Fund, which takes emotions out of investing and automatically invests more in stocks when the market drops and automatically sells stocks when the market rises.25


Charles P. McQuaid
Portfolio Manager, Analyst and Advisor
Columbia Wanger Asset Management, LLC
4
Wanger International 2015 Annual Report
The information and data provided in this analysis are derived from sources that we deem to be reliable and accurate. These views are not guarantees of future performance and involve certain risks, uncertainties and assumptions that are difficult to predict so actual outcomes and results may differ significantly from the views expressed. The views/opinions expressed here are those of the author and not of the Wanger Advisors Trust Board of Trustees, are subject to change at any time based upon economic, market or other conditions, may differ from views expressed by other Columbia Management associates and the respective parties disclaim any responsibility to update such views. These views may not be relied on as investment advice and, because investment decisions for a Columbia Wanger Fund are based on numerous factors, may not be relied on as an indication of trading intent on behalf of any particular Columbia Wanger Fund.
The author would like to thank Colin Moore, Global Chief Investment Officer of Columbia Threadneedle Investments, for suggesting Beyond Greed and Fear, which summarizes behavioral economics for investors. He would also like to thank recently retired Wanger Advisors Trust Chief Compliance Officer Robert Scales for suggesting Thinking, Fast and Slow.
1 Daniel Kahneman, Thinking, Fast and Slow (New York, Farrar, Straus and Giroux, 2011), p. 81.
2 Ibid., p. 125.
3 Ibid., p. 138.
4 Expected value is the sum of probabilities times dollars.
5 Kahneman, op. cit., p. 437.
6 Ibid., p. 364.
7 Ibid., p. 315.
8 Ibid., p. 295.
9 Richard H. Thaler, Misbehaving: The Making of Behavioral Economics (New York, W. W. Norton & Company, Inc., 2015), p. 80.
10 Ibid., p. 76.
11 Kahneman, op. cit., p. 141.
12 Somehow this one is not labelled as a particular bias or effect.
13 Kahneman, op. cit., p. 351.
14 Thaler, op. cit., p. 132.
15 Ibid., p. 318.
16 Richard H. Thaler and Cass R. Sunstein, Nudge: Improving Decisions About Health, Wealth, and Happiness (New Haven, Connecticut, Yale University Press, 2008), p. 178-179.
17 Kahneman, op. cit., p. 349.
18 Ibid., p. 339.
19 Thaler, op. cit., p. 197.
20 Hersh Shefrin, Beyond Greed and Fear: Understanding Behavioral Finance and the Psychology of Investing (New York, Oxford University Press, 2002), p. 37.
21 Thaler, op. cit., p. 192.
22 In Beyond Greed and Fear, Shefrin labels this as "Get-evenitis."
23 Kahneman, op. cit., p. 213-214.
24 Thaler, op. cit., p. 83.
25 If interested, please see Columbia Thermostat Fund's prospectus, which can be found at columbiathreadneedle.com/us.
5
Wanger International 2015 Annual Report
Performance Review Wanger International
|
| ||||||
| P. Zachary Egan Co-Portfolio Manager* | Louis J. Mendes Co-Portfolio Manager | ||||||


Market risk may affect a single issuer, sector of the economy, industry or the market as a whole. International investing involves certain risks and volatility due to potential political, economic or currency instabilities and different, potentially less stringent, financial and accounting standards than those generally applicable to U.S. issuers. Risks are enhanced for emerging market issuers. Investments in small- and mid-cap companies involve risks and volatility and possible illiquidity greater than investments in larger, more established companies.
Wanger International ended the year up 0.10%, slightly behind the 0.21% gain of the Fund's primary benchmark, the S&P Global ex-U.S. Between $500M and $5B® Index.
Looking back on 2015, one of the major changes to the portfolio was the movement of assets from some emerging markets to Europe. At December 31, 2015, the Fund had a 30% exposure to Europe (excluding the UK), up about 10 percentage points from the end of 2014. Meanwhile, the Fund's emerging markets exposure was scaled back from 22% to 14%. There were several considerations behind these moves: European gross domestic product (GDP) growth remains positive, if anemic, while certain emerging markets, such as Brazil, are experiencing contraction and credit rating downgrades. Moreover, ongoing monetary easing policies in Europe support both credit expansion and equity valuations, which are above long-term historical levels, but that we believe are warranted by the long-term outlook for interest rates. Emerging market countries that export commodities, on the other hand, are suffering from slumping commodity prices, which is exerting pressure on their fiscal situations and currencies, with the latter effect raising borrowing costs for companies that fund themselves in U.S. dollars.
Notwithstanding the Fund's general reduction in emerging markets exposure, this is a heterogeneous space and, over the last year, the Fund has maintained its weight in India, and increased its weight in China. India remains largely insulated from commodity price turmoil and is a beneficiary of cheap oil, which was previously stressing both its current account and, through consumer fuel subsidies, its fiscal position. While we have concerns about China's slowdown and its impact on the global economy, we now see a reasonably clear policy framework in China that we believe is supportive of companies addressing the energy and environmental challenges that have accompanied the country's rise to a US$10 trillion economy, as well as companies addressing increasing demand for health care. Our increased exposure to China is focused in these sectors.
Stock selection in Europe was positive for Fund performance in the year. SimCorp, a Danish company that produces software for the financial services sector, and the Fund's largest position at the end of the year, was a top contributor to performance in an environment of improving demand from large asset managers. An investment initiated in 2010, SimCorp fits into our "regulation" theme. Under this theme, we have worked to identify companies benefiting from increasingly stringent regulatory standards, typically around health, safety and the environment, but extending to the
financial realm in the wake of the 2008 financial crisis. SimCorp's products help investment managers meet new compliance requirements in a cost-effective way. Its stock gained 117% for the year.
The Fund's single largest country weight at the end of 2015 was Japan. At 21% of assets at year end, this weighting is up slightly year over year. As with Europe, loose Japanese monetary policy is supportive of valuations, and we are encouraged by increasing sensitivity among corporates in general toward capital efficiency, which is underpinned by explicit financial sector regulation. Ariake Japan, a maker of commercial soup and sauce extracts, was a top contributor for the year, gaining 130%.
As part of our repositioning of the Fund regionally, we have taken the opportunity to reduce the number of names in the portfolio in order to ensure that our highest conviction ideas have a meaningful impact on returns. At the end of 2015, Wanger International had 174 positions, down from 240 at the end of 2014.
Detractors for the year included South African fund manager Coronation Fund Managers, down 64%. Poor performance and asset outflows significantly reduced the firm's performance-based fees and negatively impacted its stock. Spotless, an Australian facility management and catering company, was hurt by an earnings downgrade, as integration of new acquisitions has taken longer than expected and new business growth has slowed. Its stock was down 45% for the year.
2015 was a challenging year for international investors. The bifurcation of performance between developed and emerging markets was more pronounced than it has been in recent years, and was compounded by currency weakness against the strong U.S. dollar. As the second-largest economy in the world and with a contribution to global GDP of around 15%, China's slowdown raised concerns and cast a shadow over many emerging economies. In developed markets, investors were willing to pay more for companies showing growth in anticipation of higher earnings in the future. But these names were few and far between.
*Effective January 1, 2016, P. Zachary Egan replaced Christopher J. Olson as co-portfolio manager of Wanger International. Mr. Mendes continues in his role as co-portfolio manager of the Fund. Mr. Egan is the President and Global Chief Investment Officer of CWAM, and also serves as a co-portfolio manager on two of the largest Columbia Acorn Funds. Mr. Egan did not serve as a co-portfolio manager of the Fund during 2015.
Fund holdings are as of the date given, are subject to change at any time, and are not recommendations to buy or sell any security.
6
Wanger International 2015 Annual Report
Growth of a $10,000 Investment in Wanger International
May 3, 1995 (inception date) through December 31, 2015
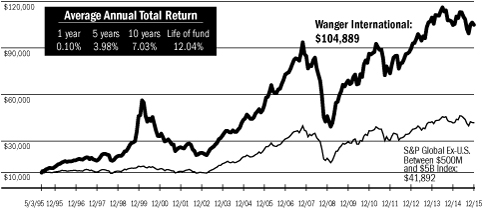
Performance data shown represents past performance and is not a guarantee of future results. The investment return and principal value will fluctuate so that shares, when redeemed, may be worth more or less than the original cost. Current performance may be lower or higher than the performance data shown. Performance results reflect any fee waivers or reimbursements of Fund expenses by the investment manager and/or any of its affiliates. Absent these fee waivers and/or expense reimbursement arrangements, performance results would have been lower. For most recent month-end performance updates, please visit columbiathreadneedle.com/us.
This graph compares the results of $10,000 invested in Wanger International on May 3, 1995 (the date the Fund began operations) through December 31, 2015, to the S&P Global Ex-U.S. Between $500M and $5B Index with dividends and capital gains reinvested. Although the index is provided for use in assessing the Fund's performance, the Fund's holdings may differ significantly from those in the index.
Top 10 Holdings
As a percentage of net assets, as of 12/31/15
| 1. SimCorp (Denmark) Software for Investment Managers | 1.6 | % | |||||
| 2. Wirecard (Germany) Online Payment Processing & Risk Management | 1.5 | ||||||
| 3. CCL Industries (Canada) Global Label Converter | 1.5 | ||||||
| 4. Distribuidora Internacional de Alimentación (Spain) Discount Retailer in Spain & Latin America | 1.4 | ||||||
| 5. Unibet (Sweden) European Online Gaming Operator | 1.4 | ||||||
| 6. Domino's Pizza Enterprises (Australia) Domino's Pizza Operator in Australia & New Zealand | 1.4 | ||||||
| 7. Zee Entertainment Enterprises (India) Indian Programmer of Pay Television Content | 1.3 | ||||||
| 8. Rightmove (United Kingdom) Internet Real Estate Listings | 1.3 | ||||||
| 9. Charles Taylor (United Kingdom) Insurance Services | 1.2 | ||||||
| 10. Aurelius (Germany) European Turnaround Investor | 1.2 | ||||||
Top holdings exclude short-term holdings and cash, if applicable.
Top 5 Countries
As a percentage of net assets, as of 12/31/15
Japan | 20.9 | % | |||||
United Kingdom | 13.0 | ||||||
Germany | 5.6 | ||||||
Sweden | 5.4 | ||||||
Canada | 4.8 | ||||||
Results as of December 31, 2015
4th quarter* | 1 year | 5 years | 10 years | ||||||||||||||||
Wanger International | 5.52 | % | 0.10 | % | 3.98 | % | 7.03 | % | |||||||||||
| S&P Global Ex-U.S. Between $500M and $5B Index** | 4.87 | 0.21 | 2.63 | 5.36 | |||||||||||||||
MSCI EAFE Index (Net) | 4.71 | -0.81 | 3.60 | 3.03 | |||||||||||||||
NAV as of 12/31/15: $26.32
* Not annualized.
** The Fund's primary benchmark as of December 31, 2015. Effective January 1, 2016, the primary benchmark for Wanger International was changed to the MSCI ACWI Ex USA Small Cap Index (Net).
Performance numbers reflect all Fund expenses but do not include any fees and expenses imposed under your variable annuity contract or life insurance policy or qualified pension or retirement plan. If performance numbers included the effect of these additional charges, they would be lower.
The Fund's annual operating expense ratio of 1.05% is stated as of the Fund's prospectus dated May 1, 2015, and differences in expense ratios disclosed elsewhere in this report may result from including fee waivers and/or expense reimbursements as well as different time periods used in calculating the ratios.
All results shown assume reinvestment of distributions.
The S&P Global Ex-U.S. Between $500M and $5B Index is a subset of the broad market selected by the index sponsor representing the mid- and small-cap developed and emerging markets, excluding the United States. The MSCI Europe, Australasia, Far East (EAFE) Index (Net) is a capitalization-weighted index that tracks the total return of common stocks in 21 developed-market countries within Europe, Australasia and the Far East. The returns of the MSCI EAFE Index (Net) are presented net of the withholding tax rate applicable to foreign non-resident institutional investors in the foreign companies included in the index who do not benefit from double taxation treaties. The performance of the MSCI EAFE Index (Net) is provided to show how the Fund's performance compares to a widely recognized broad-based index of foreign market performance. Indexes are not managed and do not incur fees or expenses. It is not possible to invest directly in an index.
Portfolio characteristics and holdings are subject to change periodically and may not be representative of current characteristics and holdings.
7
Wanger International 2015 Annual Report
Wanger International
Statement of Investments, December 31, 2015
| Number of Shares | Value | ||||||||||
Equities – 97.2% | |||||||||||
Europe – 43.3% | |||||||||||
United Kingdom – 13.0% | |||||||||||
124,807 | Rightmove Internet Real Estate Listings | $ | 7,584,524 | ||||||||
1,862,635 | Charles Taylor Insurance Services | 7,139,331 | |||||||||
1,277,005 | Polypipe Manufacturer of Plastic Piping & Fittings | 6,570,137 | |||||||||
223,482 | WH Smith Newsprint, Books & General Stationery Retailer | 5,806,940 | |||||||||
1,164,000 | Regus Rental of Office Space in Full Service Business Centers | 5,719,398 | |||||||||
105,487 | Spirax Sarco Steam Systems for Manufacturing & Process Industries | 5,101,643 | |||||||||
369,000 | Halma Health & Safety Sensor Technology | 4,698,731 | |||||||||
254,860 | Domino's Pizza UK & Ireland Pizza Delivery in the UK, Ireland & Germany | 3,950,077 | |||||||||
1,365,000 | Rentokil Initial Pest Control, Washroom & Workwear Service Provider | 3,202,619 | |||||||||
201,000 | Babcock International Public Sector Outsourcer | 3,007,996 | |||||||||
1,210,014 | Connect Group Newspaper & Magazine Distributor | 2,995,104 | |||||||||
3,545,000 | Assura UK Primary Health Care Property Developer | 2,890,000 | |||||||||
491,000 | DS Smith (a) Packaging | 2,872,137 | |||||||||
264,067 | Abcam Online Sales of Antibodies | 2,586,748 | |||||||||
521,400 | Halfords UK Retailer of Leisure Goods & Auto Parts | 2,569,149 | |||||||||
170,000 | Shaftesbury London Prime Retail REIT | 2,290,225 | |||||||||
1,676,773 | Cable and Wireless Telecommunications Service Provider in the Caribbean | 1,834,421 | |||||||||
396,510 | Ocado (a) Online Grocery Retailer | 1,771,499 | |||||||||
474,031 | Elementis Specialty Chemicals | 1,596,407 | |||||||||
| Number of Shares | Value | ||||||||||
262,952 | PureCircle (a) | $ | 1,561,235 | ||||||||
Natural Sweeteners | |||||||||||
13,956 | Fidessa Group Software for Financial Trading Systems | 412,096 | |||||||||
76,160,417 | |||||||||||
Germany – 5.6% | |||||||||||
180,820 | Wirecard Online Payment Processing & Risk Management | 9,038,294 | |||||||||
135,696 | Aurelius European Turnaround Investor | 7,043,671 | |||||||||
58,205 | MTU Aero Engines Airplane Engine Components & Services | 5,672,951 | |||||||||
89,629 | NORMA Group Clamps for Automotive & Industrial Applications | 4,953,928 | |||||||||
130,083 | Elringklinger Automobile Components | 3,302,191 | |||||||||
6,449 | Rational Commercial Ovens | 2,927,277 | |||||||||
32,938,312 | |||||||||||
Sweden – 5.4% | |||||||||||
81,762 | Unibet European Online Gaming Operator | 8,336,885 | |||||||||
314,000 | Recipharm (b) Contract Development Manufacturing Organization | 4,705,471 | |||||||||
275,730 | Sweco (b) Engineering Consultants | 4,058,479 | |||||||||
177,076 | Mekonomen (b) Nordic Integrated Wholesaler/Retailer of Automotive Parts & Service | 3,624,238 | |||||||||
95,417 | Hexagon Design, Measurement & Visualization Software & Equipment | 3,529,745 | |||||||||
81,106 | Swedish Match Swedish Snus | 2,866,076 | |||||||||
89,256 | Modern Times Group Nordic TV Broadcaster | 2,279,043 | |||||||||
See accompanying notes to financial statements.
8
Wanger International 2015 Annual Report
Wanger International
Statement of Investments, December 31, 2015
| Number of Shares | Value | ||||||||||
Sweden – 5.4% (cont) | |||||||||||
108,000 | Trelleborg Manufacturer of Sealing, Dampening & Protective Solutions for Industry | $ | 2,096,044 | ||||||||
31,495,981 | |||||||||||
Denmark – 3.7% | |||||||||||
169,227 | SimCorp Software for Investment Managers | 9,541,934 | |||||||||
136,724 | Novozymes Industrial Enzymes | 6,546,193 | |||||||||
59,000 | William Demant Holding (a) Manufacture & Distribution of Hearing Aids & Diagnostic Equipment | 5,620,016 | |||||||||
21,708,143 | |||||||||||
Netherlands – 3.5% | |||||||||||
181,144 | Aalberts Industries Flow Control & Heat Treatment | 6,241,451 | |||||||||
54,000 | Gemalto (b) Digital Security Solutions | 3,240,110 | |||||||||
161,387 | Brunel Temporary Specialist & Energy Staffing | 2,939,316 | |||||||||
26,669 | Core Labs (b) Oil & Gas Reservoir Consulting | 2,899,987 | |||||||||
130,843 | Arcadis Engineering Consultants | 2,630,380 | |||||||||
60,905 | Vopak Operator of Petroleum & Chemical Storage Terminals | 2,622,863 | |||||||||
20,574,107 | |||||||||||
Spain – 3.0% | |||||||||||
1,430,718 | Distribuidora Internacional de Alimentación Discount Retailer in Spain & Latin America | 8,438,508 | |||||||||
716,279 | Prosegur Security Guards | 3,298,747 | |||||||||
53,000 | Viscofan Sausage Casings Maker | 3,197,097 | |||||||||
83,000 | Bolsas y Mercados Españoles Spanish Stock Markets | 2,797,054 | |||||||||
17,731,406 | |||||||||||
| Number of Shares | Value | ||||||||||
France – 2.3% | |||||||||||
333,000 | Elior Contract Catering & Concession Services | $ | 6,976,557 | ||||||||
127,392 | Eutelsat Fixed Satellite Services | 3,814,174 | |||||||||
8,328 | Eurofins Scientific Food, Pharmaceuticals & Materials Screening & Testing | 2,904,975 | |||||||||
13,695,706 | |||||||||||
Switzerland – 2.2% | |||||||||||
18,384 | Partners Group (b) Private Markets Asset Management | 6,611,515 | |||||||||
10,581 | INFICON Gas Detection Instruments | 3,373,451 | |||||||||
26,700 | Panalpina Welttransport Holding Air & Sea Freight Forwarding | 2,980,971 | |||||||||
12,965,937 | |||||||||||
Finland – 1.9% | |||||||||||
325,189 | Tikkurila Decorative & Industrial Paint in Scandinavia, Central & Eastern Europe | 5,693,259 | |||||||||
116,251 | Konecranes (b) Manufacture & Service of Industrial Cranes & Port Handling Equipment | 2,877,296 | |||||||||
651,561 | Sponda Office, Retail & Logistics Properties | 2,767,573 | |||||||||
11,338,128 | |||||||||||
Norway – 1.3% | |||||||||||
610,594 | Atea Nordic IT Hardware/Software Reseller & Integrator | 5,042,974 | |||||||||
336,507 | Orkla Food & Brands, Aluminum, Chemicals Conglomerate | 2,654,677 | |||||||||
7,697,651 | |||||||||||
Italy – 0.9% | |||||||||||
59,000 | Industria Macchine Automatiche (b) Food & Drugs Packaging & Machinery | 3,062,561 | |||||||||
750,000 | Hera Northern Italian Utility | 1,987,648 | |||||||||
5,050,209 | |||||||||||
See accompanying notes to financial statements.
9
Wanger International 2015 Annual Report
Wanger International
Statement of Investments, December 31, 2015
| Number of Shares | Value | ||||||||||
Kazakhstan – 0.4% | |||||||||||
432,778 | Halyk Savings Bank of Kazakhstan – GDR Retail Bank & Insurer in Kazakhstan | $ | 2,142,251 | ||||||||
Belgium – 0.1% | |||||||||||
22,378 | EVS Broadcast Equipment Digital Live Mobile Production Software & Systems | 705,259 | |||||||||
Total Europe | 254,203,507 | ||||||||||
Asia – 41.2% | |||||||||||
Japan – 20.9% | |||||||||||
157,520 | Milbon Hair Products for Salons | 6,431,532 | |||||||||
120,400 | FamilyMart Convenience Store Operator | 5,602,799 | |||||||||
281,100 | Aeon Mall Suburban Shopping Mall Developer, Owner & Operator | 4,821,462 | |||||||||
153,000 | Glory Currency Handling Systems & Related Equipment | 4,697,360 | |||||||||
229,000 | Doshisha Consumer Goods Wholesaler | 4,619,046 | |||||||||
90,700 | Seria 100 Yen Discount Stores | 4,393,593 | |||||||||
305,000 | Ushio Industrial Light Sources | 4,205,916 | |||||||||
71,240 | Ariake Japan Commercial Soup & Sauce Extracts | 3,941,258 | |||||||||
230,000 | Daiseki Waste Disposal & Recycling | 3,666,466 | |||||||||
1,320,000 | IHI Industrial Conglomerates | 3,643,858 | |||||||||
89,000 | Nakanishi Dental Tools & Machinery | 3,468,836 | |||||||||
208,200 | Santen Pharmaceutical Specialty Pharma (Ophthalmic Medicine) | 3,427,684 | |||||||||
25,150 | Hirose Electric Electrical Connectors | 3,044,966 | |||||||||
66,000 | Asahi Intecc Medical Guidewires for Surgery | 3,032,964 | |||||||||
| Number of Shares | Value | ||||||||||
123,000 | Park24 | $ | 2,979,974 | ||||||||
Parking Lot Operator | |||||||||||
244,000 | Yamaguchi Financial Group Regional Bank in Yamaguchi, Fukuoka & Hiroshima | 2,890,719 | |||||||||
78,000 | JIN (b) Eyeglasses Retailer | 2,876,963 | |||||||||
821,000 | Aozora Bank Commercial Bank | 2,865,145 | |||||||||
602,000 | Ebara Pumps, Compressors, Turbines & Related Products & Services | 2,860,792 | |||||||||
362,000 | NOF Specialty Chemicals, Life Science & Rocket Fuels | 2,784,774 | |||||||||
28,900 | Disco Semiconductor Dicing & Grinding Equipment | 2,721,556 | |||||||||
119,000 | NGK Insulators Ceramic Products for Auto, Power & Electronics | 2,682,283 | |||||||||
99,300 | NGK Spark Plug Automobile Parts | 2,614,417 | |||||||||
47,400 | OBIC Computer Software | 2,509,102 | |||||||||
515 | Kenedix Office Investment Tokyo Mid-size Office REIT | 2,407,640 | |||||||||
544,000 | Seven Bank ATM Processing Services | 2,385,711 | |||||||||
105,000 | Aeon Financial Service Diversified Consumer-related Finance Company in Japan | 2,345,566 | |||||||||
33,200 | Nippon Shokubai Producer of Acrylic Acid & Super Absorbent Polymers Used in Disposable Diapers | 2,310,224 | |||||||||
130,200 | Kintetsu World Express Airfreight Logistics | 2,291,157 | |||||||||
63,500 | Toto Toilets & Bathroom Fittings | 2,230,884 | |||||||||
90,692 | Capcom Packaged, Online & Mobile Games | 2,186,926 | |||||||||
432 | Industrial & Infrastructure Fund Industrial REIT in Japan | 2,061,426 | |||||||||
102,700 | OSG Consumable Cutting Tools | 1,941,545 | |||||||||
See accompanying notes to financial statements.
10
Wanger International 2015 Annual Report
Wanger International
Statement of Investments, December 31, 2015
| Number of Shares | Value | ||||||||||
Japan – 20.9% (cont) | |||||||||||
74,300 | Yonex (b) Branded Sporting Goods Manufacturer | $ | 1,909,523 | ||||||||
219,900 | Relia Call Center Operator | 1,886,780 | |||||||||
95,100 | Aica Kogyo Laminated Sheets, Building Materials & Chemical Adhesives | 1,868,754 | |||||||||
27,000 | Hoshizaki Electric Commercial Kitchen Equipment | 1,678,463 | |||||||||
37,000 | Japan Airport Terminal Airport Terminal Operator at Haneda | 1,637,955 | |||||||||
92,700 | iStyle Cosmetics Review Portal & Retailer | 1,637,783 | |||||||||
174,000 | Sega Sammy Holdings Gaming Software/Hardware & Leisure Facilities | 1,627,482 | |||||||||
23,600 | Hikari Tsushin Office IT/Mobiles/Insurance Distribution | 1,607,156 | |||||||||
70,800 | Tamron Camera Lenses | 1,306,192 | |||||||||
36,300 | Icom Two Way Radio Communication Equipment | 754,485 | |||||||||
122,859,117 | |||||||||||
China – 3.6% | |||||||||||
2,284,000 | CAR Inc (a) (b) Consolidator of Chinese Auto Rental Sector | 3,763,676 | |||||||||
107,039 | BitAuto – ADR (a) Automotive Information Website for Buyers & Dealers | 3,027,063 | |||||||||
1,804,000 | TravelSky Technology Chinese Air Travel Transaction Processor | 2,953,690 | |||||||||
7,180,000 | Sihuan Pharmaceutical Holdings Group (c) Chinese Generic Drug Manufacturer | 2,776,146 | |||||||||
93,000 | 51job – ADR (a) (b) Integrated Human Resource Services | 2,739,780 | |||||||||
4,536,000 | NewOcean Energy Southern China Liquefied Petroleum Gas Distributor | 1,767,107 | |||||||||
8,300,000 | Jiangnan Group Cable & Wire Manufacturer | 1,621,744 | |||||||||
| Number of Shares | Value | ||||||||||
3,188,000 | AMVIG Holdings | $ | 1,324,554 | ||||||||
Chinese Tobacco Packaging Material Supplier | |||||||||||
945,000 | Phoenix Healthcare Group Private Hospital Management Group | 1,100,441 | |||||||||
21,074,201 | |||||||||||
Taiwan – 3.5% | |||||||||||
400,203 | Voltronic Power Uninterruptible Power Supply Products | 5,935,369 | |||||||||
1,900,000 | Far EasTone Telecom Mobile Operator in Taiwan | 3,904,890 | |||||||||
320,000 | Silergy Chinese Provider of Analog & Mixed Digital Integrated Circuits | 3,275,760 | |||||||||
160,000 | St. Shine Optical Disposable Contact Lens Original Equipment Manufacturer | 3,202,276 | |||||||||
170,000 | Ginko International Contact Lens Maker in China | 2,239,811 | |||||||||
302,349 | Advantech Industrial PC & Components | 1,936,180 | |||||||||
20,494,286 | |||||||||||
Korea – 3.1% | |||||||||||
191,600 | Koh Young Technology Inspection Systems for Printed Circuit Boards | 6,263,456 | |||||||||
11,707 | KCC Paint & Housing Material Manufacturer | 4,129,872 | |||||||||
16,771 | CJ Corp Holding Company of Korean Consumer Conglomerate | 3,562,282 | |||||||||
72,398 | Korea Investment Holdings Brokerage & Asset Management | 3,025,390 | |||||||||
51,770 | LF Corp Apparel Design & Retail | 1,186,032 | |||||||||
18,167,032 | |||||||||||
India – 2.6% | |||||||||||
1,150,794 | Zee Entertainment Enterprises Indian Programmer of Pay Television Content | 7,586,015 | |||||||||
129,000 | Container Corporation of India Railway Cargo Services | 2,556,783 | |||||||||
158,970 | United Breweries Indian Brewer | 2,270,317 | |||||||||
See accompanying notes to financial statements.
11
Wanger International 2015 Annual Report
Wanger International
Statement of Investments, December 31, 2015
| Number of Shares | Value | ||||||||||
India – 2.6% (cont) | |||||||||||
152,560 | Colgate Palmolive India Consumer Products in Oral Care | $ | 2,238,398 | ||||||||
43,941 | Amara Raja Indian Maker of Auto & Industrial Batteries, Mostly for the Replacement Market | 570,438 | |||||||||
15,221,951 | |||||||||||
Hong Kong – 2.5% | |||||||||||
3,000,000 | Vitasoy International Hong Kong Soy Food Brand | 6,154,799 | |||||||||
5,000,000 | Value Partners Mutual Fund Management | 5,811,747 | |||||||||
994,000 | Samsonite International Mass Market Luggage & Travel Accessories | 2,978,997 | |||||||||
14,945,543 | |||||||||||
Singapore – 2.5% | |||||||||||
950,000 | Singapore Exchange Singapore Equity & Derivatives Market Operator | 5,137,998 | |||||||||
8,400,000 | China Everbright Water (a) Waste Water Treatment Operator | 3,632,581 | |||||||||
3,300,000 | Mapletree Commercial Trust Retail & Office Property Landlord | 3,021,333 | |||||||||
2,900,000 | SIIC Environment (a) Waste Water Treatment Operator | 1,561,574 | |||||||||
707,000 | Petra Foods Chocolate Manufacturer in Southeast Asia | 1,046,151 | |||||||||
14,399,637 | |||||||||||
Indonesia – 0.9% | |||||||||||
1,260,900 | Matahari Department Store Department Store Chain in Indonesia | 1,596,216 | |||||||||
4,169,000 | Link Net (a) Fixed Broadband & Cable TV Service Provider | 1,200,611 | |||||||||
5,185,021 | Surya Citra Media Free to Air TV Station in Indonesia | 1,156,182 | |||||||||
2,431,000 | Tower Bersama Infrastructure (a) Communications Towers | 1,028,356 | |||||||||
4,859,200 | MNC Sky Vision (a) Satellite Pay TV Operator in Indonesia | 470,586 | |||||||||
5,451,951 | |||||||||||
| Number of Shares | Value | ||||||||||
Thailand – 0.6% | |||||||||||
357,000 | Airports of Thailand Airport Operator of Thailand | $ | 3,413,152 | ||||||||
Philippines – 0.6% | |||||||||||
2,504,000 | Puregold Price Club Supermarket Operator in the Philippines | 1,846,537 | |||||||||
812,000 | Robinsons Retail Holdings Multi-format Retailer in the Philippines | 1,087,903 | |||||||||
7,468,300 | Melco Crown (Philippines) Resorts (a) Integrated Resort Operator in Manila | 361,485 | |||||||||
3,295,925 | |||||||||||
Cambodia – 0.4% | |||||||||||
3,946,000 | Nagacorp Casino & Entertainment Complex in Cambodia | 2,485,580 | |||||||||
Total Asia | 241,808,375 | ||||||||||
Other Countries – 11.0% | |||||||||||
Canada – 4.8% | |||||||||||
53,446 | CCL Industries Global Label Converter | 8,666,387 | |||||||||
129,000 | Vermilion Energy (b) Canadian Exploration & Production Company | 3,506,316 | |||||||||
268,267 | CAE Flight Simulator Equipment & Training Centers | 2,976,005 | |||||||||
101,000 | Keyera (b) Integrated Supply of Hydrocarbon Processing, Transport & Storage | 2,938,686 | |||||||||
41,250 | Onex Capital Private Equity | 2,528,601 | |||||||||
159,000 | PrairieSky Royalty (b) Canadian Owner of Oil & Gas Mineral Interests | 2,518,812 | |||||||||
104,849 | ShawCor Oil & Gas Pipeline Products | 2,126,987 | |||||||||
190,995 | Rona Canadian Home Improvement Retailer | 1,704,696 | |||||||||
46,170 | Ag Growth Manufacturer of Augers & Grain Handling Equipment | 1,109,455 | |||||||||
28,075,945 | |||||||||||
See accompanying notes to financial statements.
12
Wanger International 2015 Annual Report
Wanger International
Statement of Investments, December 31, 2015
| Number of Shares | Value | ||||||||||
Australia – 3.8% | |||||||||||
190,000 | Domino's Pizza Enterprises Domino's Pizza Operator in Australia & New Zealand | $ | 7,927,454 | ||||||||
5,300,000 | Spotless Facility Management & Catering Company | 4,152,780 | |||||||||
1,001,381 | IAG General Insurance Provider | 4,021,558 | |||||||||
279,000 | Amcor Global Leader in Flexible & Rigid Packaging | 2,710,551 | |||||||||
340,000 | Estia Health Residential Aged Care Operator | 1,795,401 | |||||||||
230,000 | Challenger Financial Annuity Provider in Australia | 1,449,548 | |||||||||
22,057,292 | |||||||||||
South Africa – 0.8% | |||||||||||
710,581 | Coronation Fund Managers South African Fund Manager | 2,433,696 | |||||||||
935,177 | Rand Merchant Insurance Directly Sold Property & Casualty Insurance; Holdings in other Insurers | 2,337,749 | |||||||||
4,771,445 | |||||||||||
New Zealand – 0.6% | |||||||||||
900,000 | Auckland International Airport Auckland Airport Operator | 3,530,797 | |||||||||
Egypt – 0.5% | |||||||||||
627,736 | Commercial International Bank of Egypt Private Universal Bank in Egypt | 3,053,680 | |||||||||
United States – 0.5% | |||||||||||
110,000 | Bladex Latin American Trade Financing House | 2,852,300 | |||||||||
Total Other Countries | 64,341,459 | ||||||||||
Latin America – 1.7% | |||||||||||
Mexico – 0.9% | |||||||||||
25,000 | Grupo Aeroportuario del Sureste – ADR Mexican Airport Operator | 3,516,750 | |||||||||
1,121,000 | Qualitas (a) Auto Insurer in Mexico & Central America | 1,412,755 | |||||||||
4,929,505 | |||||||||||
| Number of Shares | Value | ||||||||||
Brazil – 0.3% | |||||||||||
300,000 | Localiza Rent a Car Car Rental | $ | 1,882,085 | ||||||||
Guatemala – 0.3% | |||||||||||
195,010 | Tahoe Resources Silver & Gold Projects in Guatemala & Peru | 1,686,977 | |||||||||
Uruguay – 0.2% | |||||||||||
230,870 | Union Agriculture Group (a) (c) (d) Farmland Operator in Uruguay | 1,172,819 | |||||||||
Total Latin America | 9,671,386 | ||||||||||
| Total Equities (Cost: $477,584,893) – 97.2% | 570,024,727 | (e) | |||||||||
Short-Term Investments – 2.9% | |||||||||||
17,415,390 | JPMorgan U.S. Government Money Market Fund, IM Shares (7 day yield of 0.01%) | 17,415,390 | |||||||||
| Total Short-Term Investments (Cost: $17,415,390) – 2.9% | 17,415,390 | ||||||||||
Securities Lending Collateral – 3.9% | |||||||||||
22,917,951 | Dreyfus Government Cash Management Fund, Institutional Shares (7 day yield of 0.03%) (f) | 22,917,951 | |||||||||
| Total Securities Lending Collateral (Cost: $22,917,951) – 3.9% | 22,917,951 | ||||||||||
| Total Investments (Cost: $517,918,234) (g) – 104.0% | 610,358,068 | ||||||||||
| Obligation to Return Collateral for Securities Loaned – (3.9)% | (22,917,951 | ) | |||||||||
Cash and Other Assets Less Liabilities – (0.1)% | (811,310 | ) | |||||||||
Net Assets – 100.0% | $ | 586,628,807 | |||||||||
ADR – American Depositary Receipts
GDR – Global Depositary Receipts
REIT – Real Estate Investment Trust
See accompanying notes to financial statements.
13
Wanger International 2015 Annual Report
Wanger International
Statement of Investments, December 31, 2015
Notes to Statement of Investments
(a) Non-income producing security.
(b) All or a portion of this security was on loan at December 31, 2015. The total market value of securities on loan at December 31, 2015 was $21,850,755.
(c) Illiquid security.
(d) Denotes a restricted security, which is subject to restrictions on resale under federal securities laws. This security is valued at fair value determined in good faith under consistently applied procedures established by the Fund's Board of Trustees. At December 31, 2015, the market value of this security amounted to $1,172,819, which represented 0.20% of total net assets. Additional information on this security is as follows:
Security | Acquisition Dates | Shares | Cost | Value | |||||||||||||||
Union Agriculture Group | 12/8/10 - 6/27/12 | 230,870 | $ | 2,649,999 | $ | 1,172,819 | |||||||||||||
(e) On December 31, 2015, the Fund's total equity investments were denominated in currencies as follows:
Currency | Value | Percentage of Net Assets | |||||||||
Japanese Yen | $ | 122,859,117 | 20.9 | ||||||||
Euro | 99,133,140 | 16.9 | |||||||||
British Pound | 76,160,417 | 13.0 | |||||||||
Hong Kong Dollar | 32,738,481 | 5.6 | |||||||||
Swedish Krona | 31,495,981 | 5.4 | |||||||||
Canadian Dollar | 29,762,922 | 5.1 | |||||||||
| Other currencies less than 5% of total net assets | 177,874,669 | 30.3 | |||||||||
Total Equities | $ | 570,024,727 | 97.2 | ||||||||
(f) Investment made with cash collateral received from securities lending activity.
(g) At December 31, 2015, for federal income tax purposes, the cost of investments was $522,809,006 and net unrealized appreciation was $87,549,062 consisting of gross unrealized appreciation of $129,446,972 and gross unrealized depreciation of $41,897,910.
Fair Value Measurements
Various inputs are used in determining the value of the Fund's investments, following the input prioritization hierarchy established by accounting principles generally accepted in the United States of America (GAAP). These inputs are summarized in the three broad levels listed below:
• Level 1 – quoted prices in active markets for identical securities
• Level 2 – prices determined using other significant observable inputs (including quoted prices for similar securities, interest rates, prepayment speeds, credit risk and others)
• Level 3 – prices determined using significant unobservable inputs where quoted prices or observable inputs are unavailable or less reliable (including management's own assumptions about the factors market participants would use in pricing an investment)
The inputs or methodology used for valuing securities are not necessarily an indication of the risk associated with investing in those securities.
Examples of the types of securities in which the Fund would typically invest and how they are classified within this hierarchy are as follows. Typical Level 1 securities include exchange traded domestic equities, mutual funds whose NAVs are published each day and exchange traded foreign equities that are not statistically fair valued. Typical Level 2 securities include exchange traded foreign equities that are statistically fair valued, forward foreign currency exchange contracts and short-term investments valued at amortized cost. Additionally, securities fair valued by CWAM's Valuation Committee (the Committee) that rely on significant observable inputs are also included in Level 2. Typical Level 3 securities include any security fair valued by the Committee that relies on significant uunobservable inputs.
The Committee is responsible for applying the Trust's Portfolio Pricing Policy and the CWAM pricing procedures (the Policies), which are approved by and subject to the oversight of the Board.
The Committee meets as necessary, and no less frequently than quarterly, to determine fair values for securities for which market quotations are not readily available or for which the investment manager believes that available market quotations are unreliable. The Committee also reviews the continuing appropriateness of the Policies. In circumstances where a security has been fair valued, the Committee will also review the continuing appropriateness of the current value of the security. The Policies address, among other things: circumstances under which market quotations will be deemed readily available; selection of third party pricing vendors; appropriate pricing methodologies; events that require fair valuation and fair value techniques; circumstances under which securities will be deemed to pose a potential for stale pricing, including when securities are illiquid, restricted, or in default; and certain delegations of authority to determine fair values to the Fund's investment manager. The Committee may also meet to discuss additional valuation matters, which may include review of back-testing results, review of time-sensitive information or approval of other valuation related actions, and to review the appropriateness of the Policies.
For investments categorized as Level 3, the significant unobservable inputs used in the fair value measurement of the Fund's securities may include: (i) data specific to the issuer or comparable issuers, (ii) general market or specific sector news and (iii) quoted prices and specific or similar security transactions. The Committee considers this data and any changes from prior periods in order to assess the reasonableness of observable and unobservable inputs, any assumptions or internal models used to value those securities and changes in fair value. Significant changes in any of these factors could result in lower or higher fair value measurements. Various factors impact the frequency of monitoring (which may occur as often as daily), however the Committee may determine that changes to inputs, assumptions and models are not required with the same frequency.
See accompanying notes to financial statements.
14
Wanger International 2015 Annual Report
Wanger International
Statement of Investments, December 31, 2015
The following table summarizes the inputs used, as of December 31, 2015, in valuing the Fund's assets:
Investment Type | Quoted Prices (Level 1) | Other Significant Observable Inputs (Level 2) | Significant Unobservable Inputs (Level 3) | Total | |||||||||||||||
Equities | |||||||||||||||||||
Europe | $ | 2,899,987 | $ | 251,303,520 | $ | — | $ | 254,203,507 | |||||||||||
Asia | 5,766,843 | 233,265,386 | 2,776,146 | 241,808,375 | |||||||||||||||
Other Countries | 30,928,245 | 33,413,214 | — | 64,341,459 | |||||||||||||||
Latin America | 8,498,567 | — | 1,172,819 | 9,671,386 | |||||||||||||||
Total Equities | 48,093,642 | 517,982,120 | 3,948,965 | 570,024,727 | |||||||||||||||
| Total Short-Term Investments | 17,415,390 | — | — | 17,415,390 | |||||||||||||||
| Total Securities Lending Collateral | 22,917,951 | — | — | 22,917,951 | |||||||||||||||
Total Investments | $ | 88,426,983 | $ | 517,982,120 | $ | 3,948,965 | $ | 610,358,068 | |||||||||||
The Fund's assets assigned to the Level 2 input category are generally valued using a market approach, in which a security's value is determined through its correlation to prices and information from observable market transactions for similar or identical assets. Foreign equities are generally valued at the last sale price on the foreign exchange or market on which they trade. The Fund may use a statistical fair valuation model, in accordance with the policy adopted by the Board, provided by an independent third party to value securities principally traded in foreign markets in order to adjust for possible stale pricing that may occur between the close of the foreign exchanges and the time for valuation. These models take into account available market data including intraday index, ADR, and ETF movements.
There were no transfers of financial assets between Levels 1 and 2 during the period.
The Fund does not hold any significant investments (greater than one percent of net assets) categorized as Level 3.
Financial assets were transferred from Level 2 to Level 3 as trading halted during the period. As a result, as of period end, the Committee determined to value the security(s) under consistently applied procedures established by and under the general supervision of the Board.
The following table shows transfers between Level 2 and Level 3 of the fair value hierarchy:
Transfers In | Transfers Out | ||||||||||||||
| Level 2 | Level 3 | Level 2 | Level 3 | ||||||||||||
| $ | — | $ | 4,496,473 | $ | 4,496,473 | $ | — | ||||||||
Transfers into and/or out of Level 3 are determined based on the fair value at the beginning of the period for security positions held throughout the period.
Certain securities classified as Level 3 are fair valued by the Committee using a market approach, as determined in good faith under consistently applied procedures established by and under the general supervision of the Board. To determine fair value for these securities, for which no market exists, the Committee utilizes the valuation technique it deems most appropriate in the circumstances, using some unobservable inputs, which may include, but are not limited to estimated earnings of the company and the position of the security within the company's capital structure. The Committee also may use some observable inputs, which may include, but are not limited to, trades of similar securities and market
multiples derived from a set of comparable companies. Significant increases or decreases to any of these inputs could result in a significantly lower or higher fair value measurement.
See accompanying notes to financial statements.
15
Wanger International 2015 Annual Report
Wanger International (Unaudited)
Portfolio Diversification, December 31, 2015
At December 31, 2015, the Fund's portfolio investments as a percentage of net assets were diversified as follows:
Value | Percentage of Net Assets | ||||||||||
Industrial Goods & Services | |||||||||||
Machinery | $ | 38,227,630 | 6.5 | ||||||||
Industrial Materials & Specialty Chemicals | 34,362,823 | 5.9 | |||||||||
Other Industrial Services | 32,392,244 | 5.5 | |||||||||
Outsourcing Services | 22,320,857 | 3.8 | |||||||||
Conglomerates | 19,502,082 | 3.3 | |||||||||
Electrical Components | 11,554,909 | 2.0 | |||||||||
Construction | 6,570,137 | 1.1 | |||||||||
Water | 5,194,155 | 0.9 | |||||||||
170,124,837 | 29.0 | ||||||||||
Consumer Goods & Services | |||||||||||
Retail | 42,956,825 | 7.3 | |||||||||
Food & Beverage | 21,036,932 | 3.6 | |||||||||
Restaurants | 18,854,087 | 3.2 | |||||||||
Nondurables | 15,097,919 | 2.6 | |||||||||
Casinos & Gaming | 12,811,432 | 2.2 | |||||||||
Consumer Goods Distribution | 11,459,704 | 2.0 | |||||||||
Travel | 5,645,761 | 1.0 | |||||||||
Leisure Products | 4,888,519 | 0.8 | |||||||||
Other Durable Goods | 3,184,855 | 0.5 | |||||||||
Consumer Electronics | 1,306,192 | 0.2 | |||||||||
Apparel | 1,186,032 | 0.2 | |||||||||
138,428,258 | 23.6 | ||||||||||
Information | |||||||||||
Business Software | 18,946,567 | 3.2 | |||||||||
Financial Processors | 14,176,292 | 2.4 | |||||||||
Internet Related | 13,351,367 | 2.3 | |||||||||
Computer Hardware & Related Equipment | 11,816,919 | 2.0 | |||||||||
Instrumentation | 10,962,186 | 1.9 | |||||||||
Entertainment Programming | 7,586,015 | 1.3 | |||||||||
Semiconductors & Related Equipment | 5,997,316 | 1.0 | |||||||||
Mobile Communications | 5,687,730 | 1.0 | |||||||||
Computer Services | 5,042,974 | 0.9 | |||||||||
Satellite Broadcasting & Services | 4,284,760 | 0.7 | |||||||||
TV Broadcasting | 3,435,224 | 0.6 | |||||||||
Consumer Software | 2,186,925 | 0.4 | |||||||||
Business Information & Marketing Services | 1,886,780 | 0.3 | |||||||||
Telephone & Data Services | 1,834,421 | 0.3 | |||||||||
Cable TV | 1,200,611 | 0.2 | |||||||||
108,396,087 | 18.5 | ||||||||||
Value | Percentage of Net Assets | ||||||||||
Finance | |||||||||||
Banks | $ | 18,535,372 | 3.2 | ||||||||
Insurance | 16,360,942 | 2.8 | |||||||||
Brokerage & Money Management | 14,856,958 | 2.5 | |||||||||
Diversified Financial Companies | 3,025,390 | 0.5 | |||||||||
Financial Processors | 2,797,053 | 0.5 | |||||||||
Finance Companies | 2,528,601 | 0.4 | |||||||||
58,104,316 | 9.9 | ||||||||||
Other Industries | |||||||||||
Real Estate | 20,259,658 | 3.5 | |||||||||
Transportation | 14,655,437 | 2.5 | |||||||||
Containers & Packaging | 2,872,137 | 0.5 | |||||||||
Regulated Utilities | 1,987,648 | 0.3 | |||||||||
39,774,880 | 6.8 | ||||||||||
Health Care | |||||||||||
Medical Equipment & Devices | 12,121,816 | 2.0 | |||||||||
Pharmaceuticals | 10,909,301 | 1.9 | |||||||||
Medical Supplies | 8,028,834 | 1.4 | |||||||||
Health Care Services | 1,795,402 | 0.3 | |||||||||
Hospital Management | 1,100,441 | 0.2 | |||||||||
33,955,794 | 5.8 | ||||||||||
Energy & Minerals | |||||||||||
Oil Refining, Marketing & Distribution | 7,328,657 | 1.2 | |||||||||
Oil & Gas Producers | 6,025,128 | 1.0 | |||||||||
Mining | 4,586,964 | 0.8 | |||||||||
Oil Services | 2,126,987 | 0.4 | |||||||||
Agricultural Commodities | 1,172,819 | 0.2 | |||||||||
21,240,555 | 3.6 | ||||||||||
Total Equities: | 570,024,727 | 97.2 | |||||||||
Short-Term Investments: | 17,415,390 | 2.9 | |||||||||
Securities Lending Collateral: | 22,917,951 | 3.9 | |||||||||
Total Investments: | 610,358,068 | 104.0 | |||||||||
| Obligation to Return Collateral for Securities Loaned: | (22,917,951 | ) | (3.9 | ) | |||||||
| Cash and Other Assets Less Liabilities: | (811,310 | ) | (0.1 | ) | |||||||
Net Assets: | $ | 586,628,807 | 100.0 | % | |||||||
See accompanying notes to financial statements.
16
Wanger International 2015 Annual Report
Statement of Assets and Liabilities
December 31, 2015
Assets: | |||||||
Investments, at cost | $ | 517,918,234 | |||||
| Investments, at value (including securities on loan of $21,850,755) | $ | 610,358,068 | |||||
Foreign currency (cost of $262,041) | 261,777 | ||||||
Receivable for: | |||||||
Investments sold | 415,459 | ||||||
Fund shares sold | 52,867 | ||||||
Securities lending income | 25,629 | ||||||
Dividends | 612,531 | ||||||
Foreign tax reclaims | 371,153 | ||||||
Regulatory Settlements (Note 8) | 131,912 | ||||||
Trustees' deferred compensation plan | 161,437 | ||||||
Prepaid expenses | 9,877 | ||||||
Total Assets | 612,400,710 | ||||||
Liabilities: | |||||||
Collateral on securities loaned | 22,917,951 | ||||||
Payable for: | |||||||
Investments purchased | 322,974 | ||||||
Fund shares redeemed | 2,149,917 | ||||||
Investment advisory fee | 15,097 | ||||||
Administration fee | 811 | ||||||
Transfer agent fee | 2 | ||||||
Trustees' fees | 2,682 | ||||||
Custody fee | 66,493 | ||||||
Reports to shareholders | 61,261 | ||||||
Chief compliance officer expenses | 5,690 | ||||||
Trustees' deferred compensation plan | 161,437 | ||||||
Other liabilities | 67,588 | ||||||
Total Liabilities | 25,771,903 | ||||||
Net Assets | $ | 586,628,807 | |||||
Composition of Net Assets: | |||||||
Paid-in capital | $ | 453,175,972 | |||||
Overdistributed net investment income | (1,515,320 | ) | |||||
Accumulated net realized gain | 42,564,991 | ||||||
Net unrealized appreciation (depreciation) on: | |||||||
Investments | 92,439,834 | ||||||
Foreign currency translations | (36,670 | ) | |||||
Net Assets | $ | 586,628,807 | |||||
Fund Shares Outstanding | 22,288,698 | ||||||
| Net asset value, offering price and redemption price per share | $ | 26.32 | |||||
Statement of Operations
For the Year Ended December 31, 2015
Investment Income: | |||||||
Dividends (net foreign taxes withheld of $1,569,158) | $ | 14,023,167 | |||||
Interest | 113,574 | ||||||
Income from securities lending—net | 221,271 | ||||||
Total Investment Income | 14,358,012 | ||||||
Expenses: | |||||||
Investment advisory fee | 5,931,518 | ||||||
Transfer agent fees | 520 | ||||||
Administration fee | 322,282 | ||||||
Trustees' fees | 48,828 | ||||||
Custody fees | 264,957 | ||||||
Reports to shareholders | 351,278 | ||||||
Audit fees | 71,031 | ||||||
Legal fees | 111,432 | ||||||
Chief compliance officer expenses | 29,572 | ||||||
Commitment fee for line of credit (Note 5) | 15,900 | ||||||
Other expenses | 45,149 | ||||||
Total Expenses | 7,192,467 | ||||||
Net Investment Income | 7,165,545 | ||||||
Net Realized and Unrealized Gain (Loss) on Investments: | |||||||
Net realized gain (loss) on: | |||||||
Investments | 50,409,289 | ||||||
Foreign currency translations | (346,363 | ) | |||||
Net realized gain | 50,062,926 | ||||||
| Net change in unrealized appreciation (depreciation) on: | |||||||
Investments | (55,119,081 | ) | |||||
Foreign currency translations | 29,388 | ||||||
Net change in unrealized depreciation | (55,089,693 | ) | |||||
Net realized and unrealized loss | (5,026,767 | ) | |||||
Net Increase in Net Assets from Operations | $ | 2,138,778 | |||||
See accompanying notes to financial statements.
17
Wanger International 2015 Annual Report
Statements of Changes in Net Assets
Year Ended December 31, | |||||||||||
Increase (Decrease) in Net Assets | 2015 | 2014 | |||||||||
Operations: | |||||||||||
Net investment income | $ | 7,165,545 | $ | 8,213,120 | |||||||
Net realized gain (loss) on: | |||||||||||
Investments | 50,409,289 | 63,453,238 | |||||||||
Foreign currency translations | (346,363 | ) | (389,212 | ) | |||||||
Net change in unrealized appreciation (depreciation) on: | |||||||||||
Investments | (55,119,081 | ) | (101,516,032 | ) | |||||||
Foreign currency translations | 29,388 | (90,874 | ) | ||||||||
Options | — | (269,054 | ) | ||||||||
Net Increase (Decrease) in Net Assets from Operations | 2,138,778 | (30,598,814 | ) | ||||||||
Distributions to Shareholders From: | |||||||||||
Net investment income | (9,178,114 | ) | (10,651,101 | ) | |||||||
Net realized gains | (56,072,696 | ) | (82,758,323 | ) | |||||||
Total Distributions to Shareholders | (65,250,810 | ) | (93,409,424 | ) | |||||||
Share Transactions: | |||||||||||
Subscriptions | 12,302,455 | 23,205,601 | |||||||||
Distributions reinvested | 65,250,810 | 93,409,424 | |||||||||
Redemptions | (94,967,225 | ) | (110,560,733 | ) | |||||||
Net Increase (Decrease) from Share Transactions | (17,413,960 | ) | 6,054,292 | ||||||||
Proceeds from regulatory settlements (Note 8) | 131,912 | — | |||||||||
Total Decrease in Net Assets | (80,394,080 | ) | (117,953,946 | ) | |||||||
Net Assets: | |||||||||||
Beginning of period | 667,022,887 | 784,976,833 | |||||||||
End of period | $ | 586,628,807 | $ | 667,022,887 | |||||||
Overdistributed net investment income | $ | (1,515,320 | ) | $ | (5,231,819 | ) | |||||
See accompanying notes to financial statements.
18
Wanger International 2015 Annual Report
Financial Highlights
The following table is intended to help you understand the Fund's financial performance. Certain information reflects financial results for a single share held for the periods shown. Per share net investment income (loss) amounts are calculated based on average shares outstanding during the period. Total return assumes reinvestment of all dividends and distributions, if any. Total return does not reflect payment of the expenses that apply to the variable accounts or contract charges, if any. Total return and portfolio turnover are not annualized for periods of less than one year. The portfolio turnover rate is calculated without regard to purchase and sales transactions of short-term instruments and certain derivatives, if any. If such transactions were included, the Fund's portfolio turnover rate may be higher.
Year Ended December 31, | |||||||||||||||||||||||
Selected data for a share outstanding throughout each period | 2015 | 2014 | 2013 | 2012 | 2011 | ||||||||||||||||||
Net Asset Value, Beginning of Period | $ | 29.07 | $ | 34.55 | $ | 31.19 | $ | 28.79 | $ | 36.16 | |||||||||||||
Income from Investment Operations: | |||||||||||||||||||||||
Net investment income | 0.31 | 0.36 | 0.39 | 0.46 | 0.42 | ||||||||||||||||||
Net realized and unrealized gain (loss) | (0.09 | ) | (1.56 | ) | 6.18 | 5.27 | (5.31 | ) | |||||||||||||||
Reimbursement from affiliate | — | — | — | — | 0.00 | (a) | |||||||||||||||||
Total from Investment Operations | 0.22 | (1.20 | ) | 6.57 | 5.73 | (4.89 | ) | ||||||||||||||||
Less Distributions to Shareholders: | |||||||||||||||||||||||
Net investment income | (0.41 | ) | (0.48 | ) | (0.88 | ) | (0.38 | ) | (1.64 | ) | |||||||||||||
Net realized gains | (2.57 | ) | (3.80 | ) | (2.33 | ) | (2.95 | ) | (0.84 | ) | |||||||||||||
Total Distributions to Shareholders | (2.98 | ) | (4.28 | ) | (3.21 | ) | (3.33 | ) | (2.48 | ) | |||||||||||||
Proceeds from regulatory settlements | 0.01 | — | — | — | — | ||||||||||||||||||
Net Asset Value, End of Period | $ | 26.32 | $ | 29.07 | $ | 34.55 | $ | 31.19 | $ | 28.79 | |||||||||||||
Total Return | 0.10 | %(c) | (4.40 | )% | 22.37 | % | 21.56 | %(b) | (14.62 | )%(b) | |||||||||||||
Ratios to Average Net Assets/Supplemental Data: | |||||||||||||||||||||||
Total gross expenses (d) | 1.12 | % | 1.05 | % | 1.07 | % | 1.08 | % | 1.06 | % | |||||||||||||
Total net expenses (d) | 1.12 | % | 1.05 | % | 1.07 | % | 1.05 | %(e) | 1.00 | %(e) | |||||||||||||
Net investment income | 1.11 | % | 1.10 | % | 1.19 | % | 1.51 | % | 1.25 | % | |||||||||||||
Portfolio turnover rate | 53 | % | 28 | % | 44 | % | 34 | % | 36 | % | |||||||||||||
Net assets, end of period (000s) | $ | 586,629 | $ | 667,023 | $ | 784,977 | $ | 702,667 | $ | 682,217 | |||||||||||||
Notes to Financial Highlights
(a) Rounds to zero.
(b) Had the Investment Manager and/or its affiliates not waived a portion of expenses, total return would have been reduced.
(c) The Fund received proceeds from regulatory settlements. Had the Fund not received these proceeds, the total return would have been lower by 0.02%.
(d) In addition to the fees and expenses that the Fund bears directly, the Fund indirectly bears a pro rata share of the fees and expenses of any other funds in which it invests, if any. Such indirect expenses are not included in the Fund's reported expense ratios.
(e) The benefits derived from custody fees paid indirectly had an impact of less than 0.01%.
See accompanying notes to financial statements.
19
Wanger International 2015 Annual Report
Notes to Financial Statements
1. Nature of Operations
Wanger International (the Fund), a series of Wanger Advisors Trust (the Trust), is registered under the Investment Company Act of 1940, as amended (the 1940 Act), as an open-end management investment company organized as a Massachusetts business trust. The investment objective of the Fund is to seek long-term capital appreciation. The Fund is available only for allocation to certain life insurance company separate accounts established for the purpose of funding participating variable annuity contracts and variable life insurance policies and may also be offered directly to certain qualified pension and retirement plans.
2. Summary of Significant Accounting Policies
Basis of Preparation
The Fund is an investment company that applies the accounting and reporting guidance in the Financial Accounting Standards Board (FASB) Accounting Standards Codification Topic 946, Financial Services—Investment Companies (ASC 946). The financial statements are prepared in accordance with U.S. generally accepted accounting principles (GAAP) which requires management to make certain estimates and assumptions that affect the reported amounts of assets and liabilities, the disclosure of contingent assets and liabilities at the date of the financial statements and the reported amounts of income and expenses during the reporting period. Actual results could differ from those estimates.
The following is a summary of significant accounting policies followed by the Fund in the preparation of its financial statements.
Security valuation
Securities of the Fund are valued at market value or, if a market quotation for a security is not readily available or is deemed not to be reliable because of events or circumstances that have occurred between the market quotation and the time as of which the security is to be valued, the security is valued at its fair value determined in good faith under consistently applied procedures established by the Board of Trustees (the Board). A security traded on a securities exchange or in an over-the-counter market in which transaction prices are reported is valued at the last sales price at the time of valuation. A security traded principally on NASDAQ is valued at the NASDAQ official closing price. Exchange traded funds (ETFs) are valued at their closing net asset value as reported on the applicable exchange. A security for which there is no reported sale on the valuation date is valued at the mean of the latest bid and ask quotations.
Short-term investments maturing in 60 days or less are valued at amortized cost, which approximates market value.
The Trust has retained an independent statistical fair value pricing service that employs a systematic methodology to assist in the fair valuation process for securities principally traded in a foreign market in order to adjust for possible changes in value that may occur between the close of the foreign market and the time as of which the securities are to be valued. If a security is valued at a fair value, that value may be different from the last quoted market price for the security.
Foreign currency translations
Values of investments denominated in foreign currencies are converted into U.S. dollars using the New York spot market rate of exchange at the time of valuation. Purchases and sales of investments and dividend and interest income are translated into U.S. dollars using the spot market rate of exchange prevailing on the respective dates of such transactions. The gain or loss resulting from changes in foreign exchange rates is included with net realized and unrealized gain or loss from investments, as appropriate.
Restricted securities
Restricted securities are securities that may only be resold upon registration under federal securities laws or in transactions exempt from registration. In some cases, the issuer of restricted securities has agreed to register such securities for resale at the issuer's expense either upon demand by the Fund or in connection with another registered offering of the securities. Many restricted securities may be resold in the
secondary market in transactions exempt from registration. Such restricted securities may be determined to be liquid under criteria established by the Board.
Security transactions and investment income
Security transactions are accounted for on the trade date (date the order to buy or sell is executed) and dividend income is recorded on the ex-dividend date, except that certain dividends from foreign securities are recorded as soon as the information is available to the Fund. Interest income is recorded on the accrual basis and includes amortization of discounts on debt obligations when required for federal income tax purposes. Realized gains and losses from security transactions are recorded on an identified cost basis.
Awards, if any, from class action litigation related to securities owned may be recorded as a reduction of cost of those securities. If the applicable securities are no longer owned, the proceeds are recorded as realized gains.
The Fund may receive distributions from holdings in equity securities, ETFs, other regulated investment companies (RICs), and real estate investment trusts (REITs), which report information on the tax character of their distributions annually. These distributions are allocated to dividend income, capital gain and return of capital based on actual information reported. Return of capital is recorded as a reduction of the cost basis of securities held. If the Fund no longer owns the applicable securities, return of capital is recorded as a realized gain. With respect to REITs, to the extent actual information has not yet been reported, estimates for return of capital may be made by the Fund's management. Management's estimates are subsequently adjusted when the actual character of the distributions is disclosed by the REITs, which could result in a proportionate change in return of capital to shareholders.
Expenses
General expenses of the Trust are allocated to the Fund and the other series of the Trust based upon relative net assets or other expense allocation methodologies determined by the nature of the expense. Expenses directly attributable to the Fund are charged to the Fund.
Fund share valuation
Fund shares are sold and redeemed on a continuing basis at net asset value. Net asset value per share is determined daily as of the close of trading on the New York Stock Exchange (the Exchange) on each day the Exchange is open for trading by dividing the total value of the Fund's investments and other assets, less liabilities, by the number of Fund shares outstanding.
Securities lending
The Fund may lend securities up to one-third of the value of its total assets to certain approved brokers, dealers and other financial institutions to earn additional income. The Fund retains the benefits of owning the securities, including the economic equivalent of dividends or interest generated by the security. The Fund also receives a fee for the loan. The Fund has the ability to recall the loans at any time and could do so in order to vote proxies or to sell the loaned securities. Each loan is collateralized by cash that exceeded the value of the securities on loan. The market value of the loaned securities is determined daily at the close of business of the Fund and any additional required collateral is delivered to each Fund on the next business day. The Fund has elected to invest the cash collateral in the Dreyfus Government Cash Management Fund. The income earned from the securities lending program is paid to the Fund, net of any fees remitted to Goldman Sachs Agency Lending, the Fund's lending agent, and borrower rebates. The Fund's investment manager, Columbia Wanger Asset Management, LLC (CWAM), does not retain any fees earned by the lending program. Generally, in the event of borrower default, the Fund has the right to use the collateral to offset any losses incurred. In the event the Fund is delayed or prevented from exercising its right to dispose of the collateral, there may be a potential loss to the Fund. Some of these losses may be indemnified by the lending agent. The Fund bears the risk of loss with respect to the investment of collateral. The net lending income earned by the Fund as of December 31, 2015, is included in the Statement of Operations.
20
Wanger International 2015 Annual Report
Notes to Financial Statements, continued
Offsetting of assets and liabilities
The following table presents the Fund's gross and net amount of assets and liabilities available for offset under netting agreements and under a securities lending agreement as well as the related collateral received by the Fund as of December 31, 2015:
Goldman Sachs | |||||||
Liabilities | |||||||
Collateral on securities loaned | $ | 22,917,951 | |||||
Total liabilities | 22,917,951 | ||||||
Total financial and derivative net assets | (22,917,951 | ) | |||||
Financial instruments | 21,850,755 | ||||||
Net amount (a) | $ | (1,067,196 | ) | ||||
(a) Represents the net amount due from/(to) counterparties in the event of default.
Securities lending transactions
The following table indicates the total amount of securities loaned by type, reconciled to gross liability payable upon return of the securities loaned by the Fund as of December 31, 2015:
| Overnight and Continuous | Up to 30 Days | 30 – 90 Days | Greater than 90 Days | Total | |||||||||||||||||||
| Securities lending transactions | |||||||||||||||||||||||
Equity securities | $ | 21,850,755 | $ | — | $ | — | $ | — | $ | 21,850,755 | |||||||||||||
| Gross amount of recognized liabilities for securities lending (collateral received) | 22,917,951 | ||||||||||||||||||||||
| Amounts due to counterparty | $ | 1,067,196 | |||||||||||||||||||||
Federal income taxes
The Fund has complied with the provisions of the Internal Revenue Code available to regulated investment companies and, in the manner provided therein, distributes substantially all its taxable income, as well as any net realized gain on sales of investments and foreign currency transactions reportable for federal income tax purposes. Accordingly, the Fund paid no federal income taxes and no federal income tax provision was required.
Foreign capital gains taxes
Gains in certain countries may be subject to foreign taxes at the fund level. The Fund accrues for such foreign taxes on realized and unrealized gains at the appropriate rate for each jurisdiction. The amount, if any, is disclosed as a liability on the Statement of Assets and Liabilities.
Distributions to shareholders
Distributions to shareholders are recorded on the ex-dividend date.
Indemnification
In the normal course of business, the Trust on behalf of the Fund enters into contracts that contain a variety of representations and warranties and that provide general indemnities. The Fund's maximum exposure under these arrangements is unknown, as this would involve future claims against the Fund. Also under the Trust's organizational documents, the trustees and officers of the Trust are indemnified against certain liabilities that may arise out of their duties to the Trust. However, based on experience, the Fund expects the risk of loss due to these warranties and indemnities to be remote.
Recent Accounting Pronouncement
Fair Value Measurement (Topic 820), Disclosure for Investments in Certain Entities That Calculate Net Asset Value per Share (or Its Equivalent)
In May 2015, FASB issued Accounting Standards Update (ASU) No. 2015-07, Fair Value Measurement (Topic 820), Disclosure for Investments in Certain Entities That Calculate Net Asset Value per Share (or Its Equivalent). ASU No. 2015-07 changes the disclosure requirements for investments for which fair value is measured using the net asset value per share practical expedient. The disclosure requirements are effective for annual periods beginning after December 15, 2015 and interim periods within those fiscal years. At this time, management is evaluating the implications of this guidance and the impact it will have on the financial statement amounts and footnote disclosures, if any.
3. Federal Tax Information
The timing and character of income and capital gain distributions are determined in accordance with income tax regulations, which may differ from GAAP. Reclassifications are made to the Fund's capital accounts for permanent tax differences to reflect income and gains available for distribution (or available capital loss carryforwards) under income tax regulations.
For the year ended December 31, 2015, permanent book and tax basis differences resulting primarily from foreign currency transactions, passive foreign investment company (PFIC) holdings, former PFIC holdings and proceeds from regulatory settlements were identified and reclassified among the components of the Fund's net assets as follows:
| Accumulated Net Investment Income | Accumulated Net Realized Gain (Loss) | Paid-In Capital | |||||||||
| $ | 5,729,068 | $ | (5,597,156 | ) | $ | (131,912 | ) | ||||
Net investment income and net realized gains (losses), as disclosed on the Statement of Operations, and net assets were not affected by this reclassification.
The tax character of distributions paid during the years ended December 31, 2015 and December 31, 2014 were as follows:
December 31, 2015 | December 31, 2014 | ||||||||||
Ordinary Income* | $ | 9,178,114 | $ | 15,292,314 | |||||||
Long-Term Capital Gains | 56,072,696 | 78,117,110 | |||||||||
* For tax purposes short-term capital gain distributions, if any, are considered ordinary income distributions.
As of December 31, 2015, the components of distributable earnings on a tax basis were as follows:
| Undistributed Ordinary Income | Undistributed Long-Term Capital Gains | Net Unrealized Appreciation (Depreciation)* | |||||||||
| $ | 1,779,830 | $ | 44,331,731 | $ | 87,549,062 | ||||||
* The differences between book-basis and tax-basis net unrealized appreciation (depreciation) are primarily due to deferral of losses from wash sales, PFIC adjustments and former PFIC holdings.
Management is required to determine whether a tax position of the Fund is more likely than not to be sustained upon examination by the applicable taxing authority, including resolution of any related appeals or litigation processes, based on the technical merits of the position. The tax benefit to be recognized by the Fund is measured as the largest amount of benefit that is greater than fifty percent likely of being realized upon ultimate settlement. Management is not aware of any tax
21
Wanger International 2015 Annual Report
Notes to Financial Statements, continued
positions in the Fund for which it is reasonably possible that the total amounts of unrecognized tax benefits will significantly change in the next twelve months. However, management's conclusions may be subject to review and adjustment at a later date based on factors including, but not limited to, new tax laws, regulations, and administrative interpretations (including relevant court decisions). The Fund's federal tax returns for the prior three fiscal years remain subject to examination by the Internal Revenue Service.
4. Transactions with Affiliates
CWAM is a wholly owned subsidiary of Columbia Management Investment Advisers, LLC (Columbia Management), which in turn is a wholly owned subsidiary of Ameriprise Financial, Inc. (Ameriprise Financial). CWAM furnishes continuing investment supervision to the Fund and is responsible for the overall management of the Fund's business affairs.
CWAM receives a monthly advisory fee based on the Fund's average daily net assets at the following annual rates:
Average Daily Net Assets | Annual Fee Rate | ||||||
Up to $100 million | 1.10 | % | |||||
$100 million to $250 million | 0.95 | % | |||||
$250 million to $500 million | 0.90 | % | |||||
$500 million to $1 billion | 0.80 | % | |||||
| $1 billion and over | 0.72 | % | |||||
For the year ended December 31, 2015, the effective investment advisory fee rate was 0.92% of the Fund's average daily net assets.
CWAM provides administrative services and receives an administration fee from the Fund at the following annual rates:
| Wanger Advisors Trust Aggregate Average Daily Net Assets of the Trust | Annual Fee Rate | ||||||
Up to $4 billion | 0.05 | % | |||||
$4 billion to $6 billion | 0.04 | % | |||||
$6 billion to $8 billion | 0.03 | % | |||||
| $8 billion and over | 0.02 | % | |||||
For the year ended December 31, 2015, the effective administration fee rate was 0.05% of the Fund's average daily net assets. CWAM has delegated to Columbia Management responsibility to provide certain sub-administrative services to the Fund.
Columbia Management Investment Distributors, Inc. (CMID), a wholly owned subsidiary of Ameriprise Financial, serves as the Fund's distributor and principal underwriter.
Columbia Management Investment Services Corp. (CMIS), a wholly owned subsidiary of Ameriprise Financial, is the transfer agent to the Fund. For its services, the Fund pays CMIS a monthly fee at the annual rate of $21.00 per open account. CMIS also receives reimbursement from the Fund for certain out-of-pocket expenses.
Certain officers and trustees of the Trust are also officers of CWAM. The Trust makes no direct payments to its officers and trustees who are affiliated with CWAM.
The Board has appointed a Chief Compliance Officer of the Trust in accordance with federal securities regulations. The Fund, along with other affiliated funds, pays its pro-rata share of the expenses associated with the office of the Chief Compliance Officer.
The Trust offers a deferred compensation plan for its independent trustees. Under that plan, a trustee may elect to defer all or a portion of his or her compensation. Amounts deferred are retained by the Trust and may represent an unfunded obligation of the Trust. The value of amounts deferred is determined by reference to the change in value of Class Z shares of one or more series of Columbia Acorn Trust or a money market fund as specified by the trustee. Benefits under the deferred compensation plan are payable in accordance with the plan.
For the year ended December 31, 2015, the Fund engaged in purchase and sales transactions with funds that have a common investment manager (or affiliated investment managers), common directors/trustees, and/or common officers. Those
purchase and sale transactions complied with provisions of Rule 17a-7 under the Investment Company Act of 1940 and were $29,633,840 and $17,496,926, respectively. The sale transactions resulted in a net realized gain of $3,762,976.
5. Borrowing Arrangements
During the period January 1, 2015 through April 29, 2015, the Trust participated in a credit facility with JPMorgan Chase Bank, N.A., along with Columbia Acorn Trust, another trust managed by CWAM, in the amount of $150 million. Effective April 30, 2015, the first facility was terminated and the Trust entered into a revolving credit facility in the amount of $400 million with a syndicate of banks led by JPMorgan Chase Bank, N.A. to facilitate portfolio liquidity. Under each facility, interest is charged to each participating Fund based on its borrowings at a rate per annum equal to the Federal Funds Rate plus 1.00%. In addition, a commitment fee of 0.08% per annum of the unutilized line of credit is accrued and apportioned among the participating Funds based on their relative net assets. The commitment fee is disclosed as a part of "Other expenses" in the Statement of Operations. The Trust expects to renew this line of credit for one year durations each April at then current market rates and terms.
No amounts were borrowed for the benefit of the Fund under the line of credit during the year ended December 31, 2015.
6. Fund Share Transactions
Proceeds and payments on Fund shares as shown in the Statement of Changes in Net Assets are in respect of the following numbers of shares:
| Year Ended December 31, 2015 | Year Ended December 31, 2014 | ||||||||||
Shares sold | 431,818 | 720,170 | |||||||||
| Shares issued in reinvestment of dividend distributions | 2,291,751 | 2,952,780 | |||||||||
Less shares redeemed | (3,377,227 | ) | (3,448,109 | ) | |||||||
Net increase (decrease) in shares outstanding | (653,658 | ) | 224,841 | ||||||||
7. Investment Transactions
The aggregate cost of purchases and proceeds from sales other than short-term obligations for the year ended December 31, 2015, were $330,578,466 and $384,848,092, respectively. The amount of purchase and sales activity impacts the portfolio turnover rate reported in the Financial Highlights.
8. Regulatory Settlements with Third Parties
During the year ended December 31, 2015, the Fund recorded a receivable of $131,912 as a result of a regulatory settlement proceeding brought by the Securities and Exchange Commission against third parties relating to market timing and/or late trading of mutual funds. This amount represented the Fund's portion of the proceeds from the settlement (neither the Fund nor the Investment Manager were a party to the proceeding). The payments have been included in "Proceeds from regulatory settlements" in the Statement of Changes in Net Assets.
9. Shareholder Concentration
At December 31, 2015, two unaffiliated shareholder accounts owned an aggregate of 29.1% of the outstanding shares of the Fund. The Fund has no knowledge about whether any portion of those shares was owned beneficially by such accounts. Affiliated shareholder accounts owned 60.4% of the outstanding shares of the Fund. Subscription and redemption activity by concentrated accounts may have a significant effect on the operations of the Fund.
10. Subsequent Events
Management has evaluated the events and transactions that have occurred through the date the financial statements were issued and noted no items requiring adjustment of the financial statements or additional disclosure.
22
Wanger International 2015 Annual Report
Notes to Financial Statements, continued
11. Information Regarding Pending and Settled Legal Proceedings
Ameriprise Financial and certain of its affiliates have historically been involved in a number of legal, arbitration and regulatory proceedings, including routine litigation, class actions, and governmental actions, concerning matters arising in connection with the conduct of their business activities. Ameriprise Financial believes that the Fund is not currently the subject of, and that neither Ameriprise Financial nor any of its affiliates are the subject of, any pending legal, arbitration or regulatory proceedings that are likely to have a material adverse effect on the Fund or the ability of Ameriprise Financial or its affiliates to perform under their contracts with the Fund. Ameriprise Financial is required to make quarterly (10-Q), annual (10-K) and, as necessary, 8-K filings with the Securities and Exchange Commission on legal and regulatory matters that relate to Ameriprise Financial and its affiliates. Copies of these filings may be obtained by accessing the SEC website at www.sec.gov.
There can be no assurance that these matters, or the adverse publicity associated with them, will not result in increased fund redemptions, reduced sale of fund shares or other adverse consequences to the Fund. Further, although we believe proceedings are not likely to have a material adverse effect on the Fund or the ability of Ameriprise Financial or its affiliates to perform under their contracts with the Fund, these proceedings are subject to uncertainties and, as such, we are unable to estimate the possible loss or range of loss that may result. An adverse outcome in one or more of these proceedings could result in adverse judgments, settlements, fines, penalties or other relief that could have a material adverse effect on the consolidated financial condition or results of operations of Ameriprise Financial.
23
Wanger International 2015 Annual Report
Report of Independent Registered Public Accounting Firm
To the Board of Trustees and Shareholders of Wanger International:
In our opinion, the accompanying statement of assets and liabilities, including the statement of investments, and the related statements of operations and of changes in net assets and the financial highlights present fairly, in all material respects, the financial position of Wanger International (a series of the Wanger Advisors Trust, hereinafter referred to as the "Fund") at December 31, 2015, the results of its operations for the year then ended, the changes in its net assets for each of the two years in the period then ended and the financial highlights for each of the five years in the period then ended, in conformity with accounting principles generally accepted in the United States of America. These financial statements and financial highlights (hereafter referred to as "financial statements") are the responsibility of the Fund's management; our responsibility is to express an opinion on these financial statements based on our audits. We conducted our audits of these financial statements in accordance with the standards of the Public Company Accounting Oversight Board (United States). Those standards require that we plan and perform the audit to obtain reasonable assurance about whether the financial statements are free of material misstatement. An audit includes examining, on a test basis, evidence supporting the amounts and disclosures in the financial statements, assessing the accounting principles used and significant estimates made by management, and evaluating the overall financial statement presentation. We believe that our audits, which included confirmation of securities at December 31, 2015 by correspondence with the custodian and brokers, provide a reasonable basis for our opinion.
PricewaterhouseCoopers LLP
Chicago, Illinois
February 18, 2016
24
Wanger International 2015 Annual Report
Federal Income Tax Information (Unaudited)
The Fund hereby designates the following tax attributes in the fiscal year ended December 31, 2015.
Tax Designations | |||||||
Dividends Received Deduction | 0.08 | % | |||||
Capital Gain Dividend | $ | 46,648,195 | |||||
Foreign Taxes Paid | $ | 1,142,111 | |||||
Foreign Taxes Paid Per Share | $ | 0.05 | |||||
Foreign Source Income | $ | 14,724,616 | |||||
Foreign Source Income Per Share | $ | 0.66 | |||||
Dividends Received Deduction. The percentage of ordinary income distributed during the fiscal year that qualifies for the corporate dividends received deduction.
Capital Gain Dividend. The Fund designates as a capital gain dividend the amount reflected above, or if subsequently determined to be different, the net capital gain of such fiscal period.
Foreign Taxes. The Fund makes the election to pass through to shareholders the foreign taxes paid. Eligible shareholders may claim a foreign tax credit. These taxes, and the corresponding foreign source income, are provided.
25
Wanger International 2015 Annual Report
Board of Trustees and Management of Wanger Advisors Trust
Each trustee may serve a term of unlimited duration. The Trust's Bylaws generally require that a trustee retire at the end of the calendar year in which the trustee attains the age of 75 years. The trustees appoint their own successors, provided that at least two-thirds of the trustees, after such appointment, have been elected by shareholders. Shareholders may remove a trustee, with or without cause, upon the vote of two-thirds of the Trust's outstanding shares at any meeting called for that purpose. A trustee may be removed, with or without cause, upon the vote of a majority of the trustees. The names of the trustees and officers of the Trust, the date each was first elected or appointed to office and the principal business occupations of each during at least the last five years, and for the trustees, the number of portfolios in the fund complex they oversee and other directorships they hold, are shown below. Each trustee and officer serves in such capacity for each of the four series of Wanger Advisors Trust and for each of the eight series of Columbia Acorn Trust.
The address for the trustees and officers of the Trust is Columbia Wanger Asset Management, LLC, 227 West Monroe Street, Suite 3000, Chicago, Illinois 60606. The Funds' Statement of Additional Information includes additional information about the Funds' trustees and officers. You may obtain a free copy of the Statement of Additional Information by writing or calling toll-free:
Columbia Wanger Asset Management, LLC
Shareholder Services Group
227 W. Monroe, Suite 3000
Chicago IL 60606
1-800-922-6769
| Name and Age at December 31, 2015 | Year First Appointed or Elected to a Board in the Columbia Funds Complex | Principal Occupation(s) During the Past Five Years | Number of Funds in the Columbia Funds Complex Overseen (1) | Other Directorships Held by the Trustee During the Past Five Years in Addition to Columbia Acorn Trust and Wanger Advisors Trust | |||||||||||||||
Independent Trustees: | |||||||||||||||||||
| Laura M. Born, 50, Chair | 2007 | Adjunct Associate Professor of Finance, University of Chicago Booth School of Business since 2007; Director, Carlson Inc. (private global hospitalities and travel company) since 2015; Managing Director—Investment Banking, JP Morgan Chase & Co. (broker-dealer) 2002-2007. | 12 | None. | |||||||||||||||
| Maureen M. Culhane, 67 | 2007 | Retired. Formerly, Vice President, Goldman Sachs Asset Management, L.P. (investment adviser), 2005-2007; Vice President (Consultant)—Strategic Relationship Management, Goldman, Sachs & Co., 1999-2005. | 12 | None. | |||||||||||||||
| Margaret M. Eisen, 62 | 2002 | Trustee, Smith College since 2012; Chief Investment Officer, EAM International LLC (corporate finance and asset management), 2003-2013; Managing Director, CFA Institute, 2005-2008. | 12 | Burnham Investors Trust (3 series). | |||||||||||||||
| Thomas M. Goldstein, 56 | 2014 | Retired. Formerly, Chief Financial Officer, Allstate Protection Division, 2011-2014; Founding Partner, The GRG Group LLC, 2009-2011; Managing Director and Chief Financial Officer, Madison Dearborn Partners, 2007-2009. | 12 | Federal Home Loan Bank—Chicago; Federal Home Loan Mortgage Corporation. | |||||||||||||||
| John C. Heaton, 56 | 2010 | Deputy Dean for Faculty, University of Chicago Booth School of Business; Joseph L. Gidwitz Professor of Finance, University of Chicago Booth School of Business since July 2000. | 12 | None. | |||||||||||||||
| Steven N. Kaplan, 56 | 1999 | Neubauer Family Distinguished Service Professor of Entrepreneurship and Finance, University of Chicago Booth School of Business; faculty member of the University of Chicago Booth School of Business since 1988. | 12 | Accretive Health, Inc. (healthcare management services provider); Morningstar, Inc. (provider of independent investment research). | |||||||||||||||
| Charles R. Phillips, 59 | 2015 | Retired. Director, University of North Carolina School of Law Foundation since 2010. Formerly, Vice Chairman, J.P. Morgan Private Bank, 2011-2014; Managing Director, J.P. Morgan Private Bank, 2001-2011. | 12 | None. | |||||||||||||||
26
Wanger International 2015 Annual Report
Board of Trustees and Management of Wanger Advisors Trust
| Name and Age at December 31, 2015 | Year First Appointed or Elected to a Board in the Columbia Funds Complex | Principal Occupation(s) During the Past Five Years | Number of Funds in the Columbia Funds Complex Overseen (1) | Other Directorships Held by the Trustee During the Past Five Years in Addition to Columbia Acorn Trust and Wanger Advisors Trust | |||||||||||||||
| David J. Rudis, 62, Vice Chair | 2010 | Retired. Formerly, National Checking and Debit Executive, and Illinois President, Bank of America, 2007-2009; President, Consumer Banking Group, LaSalle National Bank, 2004-2007. | 12 | None. | |||||||||||||||
Interested Trustees: | |||||||||||||||||||
| P. Zachary Egan, 47 (2) | 2015 | President, CWAM and President, Wanger Advisors Trust and Columbia Acorn Trust since April 2014; Global Chief Investment Officer, CWAM since October 2015; International Chief Investment Officer, CWAM, April 2014-September 2015; Director of International Research, CWAM, December 2004-March 2014; Vice President of Columbia Acorn Trust, 2003-2014, and Wanger Advisors Trust, 2007-2014; portfolio manager and analyst, CWAM or its predecessors, since 1999. | 12 | None. | |||||||||||||||
| Ralph Wanger, 81 (3) | 1970 | (4) | Founder, CWAM. Formerly, President, Chief Investment Officer and portfolio manager, CWAM or its predecessors, July 1992-September 2003; Director, Wanger Investment Company PLC; Consultant to CWAM or its predecessors, September 2003-September 2005. | 12 | None. | ||||||||||||||
* * * * *
| Name at Age at December 31, 2015 | Position Held with Columbia Acorn Trust and Wanger Advisors Trust | Year First Appointed or Elected to Office | Principal Occupation(s) During the Past Five Years | ||||||||||||
Officers: | |||||||||||||||
| Alan G. Berkshire, 55 | Vice President | 2015 | Chief Operating Officer, CWAM since April 2015. Formerly, Independent Director, ValueQuest India Moat Fund Limited (Mauritius), April 2014-March 2015; President—North America, Religare Global Asset Management, Inc., June 2011-November 2013; Partner, Estancia Capital Management LLC, September 2009-June 2011. | ||||||||||||
| Michael G. Clarke, 46 | Assistant Treasurer | 2004 | Vice President—Mutual Fund Administration, Columbia Management Investment Advisers, LLC since May 2010; Managing Director of Fund Administration, Columbia Management Advisors, LLC, September 2004-April 2010; Senior officer of Columbia funds and affiliated funds since 2002. | ||||||||||||
| William J. Doyle, 51 | Vice President | 2014 | Portfolio manager and/or analyst, CWAM or its predecessors since 2006; Vice President, Columbia Acorn Trust and Wanger Advisors Trust since 2014. | ||||||||||||
| P. Zachary Egan, 47 (2) | President | 2007 | President, CWAM and President, Wanger Advisors Trust and Columbia Acorn Trust since April 2014; Global Chief Investment Officer, CWAM since October 2015; International Chief Investment Officer, CWAM, April 2014-September 2015; Director of International Research, CWAM, December 2004-March 2014; Vice President of Columbia Acorn Trust, 2003-2014, and Wanger Advisors Trust, 2007-2014; portfolio manager and analyst, CWAM or its predecessors, since 1999. | ||||||||||||
| David L. Frank, 52 | Vice President | 2014 | Portfolio manager and/or analyst, CWAM or its predecessors since 2002; Vice President, Columbia Acorn Trust and Wanger Advisors Trust since 2014. | ||||||||||||
| Paul B. Goucher, 47 | Assistant Secretary | 2015 | Vice President and Lead Chief Counsel, Ameriprise Financial, Inc. since November 2008 and January 2013, respectively (previously Chief Counsel, January 2010-January 2013 and Group Counsel, November 2008-January 2010). | ||||||||||||
| Fritz Kaegi, 44 | Vice President | 2011 | Portfolio manager and/or analyst, CWAM or its predecessors since 2004; Vice President, Columbia Acorn Trust and Wanger Advisors Trust since 2011. | ||||||||||||
27
Wanger International 2015 Annual Report
Board of Trustees and Management of Wanger Advisors Trust
| Name at Age at December 31, 2015 | Position Held with Columbia Acorn Trust and Wanger Advisors Trust | Year First Appointed or Elected to Office | Principal Occupation(s) During the Past Five Years | ||||||||||||
| John Kunka, 45 | Treasurer | 2006 | Treasurer and Principal Accounting and Financial Officer, Columbia Acorn Trust and Wanger Advisors Trust since 2014; Director of Accounting and Operations, CWAM since May 2006; formerly, Assistant Treasurer, Columbia Acorn Trust and Wanger Advisors Trust 2006-2014. | ||||||||||||
| Stephen Kusmierczak, 48 | Vice President | 2011 | Portfolio manager and/or analyst, CWAM or its predecessors since 2001; Vice President, Columbia Acorn Trust and Wanger Advisors Trust since 2011. | ||||||||||||
| Joseph C. LaPalm, 46 | Vice President | 2006 | Chief Compliance Officer, CWAM since 2005. | ||||||||||||
| Ryan C. Larrenaga, 45 | Assistant Secretary | 2015 | Vice President and Group Counsel, Ameriprise Financial, Inc. since August 2011 (previously, Counsel, May 2010-August 2011); Assistant General Counsel, Bank of America, 2005-April 2010; officer of Columbia funds and affiliated funds since 2005. | ||||||||||||
| Satoshi Matsunaga, 44 | Vice President | 2015 | Portfolio manager and/or analyst, CWAM or its predecessors since 2005; Vice President, Columbia Acorn Trust and Wanger Advisors Trust since 2015. | ||||||||||||
| Thomas P. McGuire, 43 | Chief Compliance Officer | 2015 | Chief Compliance Officer of the Columbia family of mutual funds for which Columbia Management Investment Advisers, LLC serves as investment adviser since 2012; Vice President—Asset Management Compliance, Ameriprise Financial, Inc., since May 2010; Chief Compliance Officer, Ameriprise Certificate Company since September 2010; Compliance Executive, Bank of America, 2005-April 2010. | ||||||||||||
| Charles P. McQuaid, 62 | Vice President | 1992 | (4) | Portfolio manager and/or analyst, CWAM or its predecessors since 1978; Vice President, Columbia Acorn Trust and Wanger Advisors Trust since April 2014; President and Chief Investment Officer, CWAM or its predecessors, October 2003-March 2014, and President, Columbia Acorn Trust and Wanger Advisors Trust, October 2003-March 2014. | |||||||||||
| Louis J. Mendes III, 51 | Vice President | 2003 | International Director of Research, CWAM, since 2015; portfolio manager and/or analyst, CWAM or its predecessors since 2001; Vice President, Columbia Acorn Trust since 2003 and Wanger Advisors Trust since 2005. | ||||||||||||
| Christopher J. Olson, 51 | Vice President | 2001 | Portfolio manager and/or analyst, CWAM or its predecessors since January 2001; Vice President, Columbia Acorn Trust and Wanger Advisors Trust since 2001. | ||||||||||||
| Julian Quero, 48 | Assistant Treasurer | 2015 | Vice President—Tax, Columbia Management Investment Advisers, LLC since 2009. | ||||||||||||
| Matthew S. Szafranski, 38 | Vice President | 2015 | Portfolio manager and/or analyst, CWAM or its predecessors since 2008; Vice President, Columbia Acorn Trust and Wanger Advisors Trust since 2015. | ||||||||||||
| Andreas Waldburg-Wolfegg, 50 | Vice President | 2011 | Portfolio manager and/or analyst, CWAM or its predecessors since 2002; Vice President, Columbia Acorn Trust and Wanger Advisors Trust since 2011. | ||||||||||||
| Linda Roth-Wiszowaty, 46 | Secretary | 2006 | Business support analyst, CWAM since April 2007; Secretary, Columbia Acorn Trust and Wanger Advisors Trust since 2014; Assistant Secretary, Columbia Acorn Trust and Wanger Advisors Trust, 2006-2014. | ||||||||||||
(1) The Trustees oversee the series of Wanger Advisors Trust and Columbia Acorn Trust.
(2) Mr. Egan is an "interested person" of Wanger Advisors Trust, Columbia Acorn Trust, and CWAM, as defined in the 1940 Act, because he is an officer of each Trust and an employee of CWAM.
(3) As permitted under the Trust's Bylaws, Mr. Wanger serves as a non-voting Trustee Emeritus of Wanger Advisors Trust and Columbia Acorn Trust.
(4) Dates prior to 1992 relate to The Acorn Fund, Inc., the predecessor trust to Columbia Acorn Trust.
28
Wanger International 2015 Annual Report
Columbia Wanger Funds
Trustees
Laura M. Born, Chair of the Board
David J. Rudis, Vice Chair of the Board
Maureen M. Culhane
P. Zachary Egan
Margaret M. Eisen
Thomas M. Goldstein
John C. Heaton
Charles R. Phillips
Steven N. Kaplan
Ralph Wanger (Trustee Emeritus)
Officers
P. Zachary Egan
President
Alan G. Berkshire
Vice President
Michael G. Clarke
Assistant Treasurer
William J. Doyle
Vice President
David L. Frank
Vice President
Paul B. Goucher
Assistant Secretary
Fritz Kaegi
Vice President
John M. Kunka
Treasurer and Principal Financial and Accounting Officer
Stephen Kusmierczak
Vice President
Joseph C. LaPalm
Vice President
Ryan C. Larrenaga
Assistant Secretary
Satoshi Matsunaga
Vice President
Thomas P. McGuire
Chief Compliance Officer
Charles P. McQuaid
Vice President
Louis J. Mendes
Vice President
Christopher J. Olson
Vice President
Julian Quero
Assistant Treasurer
Matthew S. Szafranski
Vice President
Andreas Waldburg-Wolfegg
Vice President
Linda K. Roth-Wiszowaty
Secretary
Investment Manager
Columbia Wanger Asset Management, LLC
227 West Monroe Street, Suite 3000
Chicago, Illinois 60606
1-888-4-WANGER
(1-888-492-6437)
Transfer Agent,
Dividend Disbursing Agent
Columbia Management Investment Services Corp.
P.O. Box 8081
Boston, Massachusetts
02266-8081
Distributor
Columbia Management Investment Distributors, Inc.
225 Franklin Street
Boston, Massachusetts
02110
Legal Counsel to the Funds
Perkins Coie LLP
Washington, DC
Legal Counsel to the Independent Trustees
Drinker Biddle & Reath LLP
Philadelphia, Pennsylvania
Independent Registered Public Accounting Firm
PricewaterhouseCoopers LLP
Chicago, Illinois
This document contains Global Industry Classification Standard data. The Global Industry Classification Standard ("GICS") was developed by and is the exclusive property and a service mark of MSCI Inc. ("MSCI") and Standard & Poor's Financial Services LLC ("S&P") and is licensed for use by Columbia Wanger Asset Management, LLC ("CWAM"). Neither MSCI, S&P, nor any other party involved in making or compiling the GICS or any GICS classifications makes any express or implied warranties or representations with respect to such standard or classification (or the results to be obtained by the use thereof), and all such parties hereby expressly disclaim all warranties of originality, accuracy, completeness, merchantability and fitness for a particular purpose with respect to any of such standard or classification. Without limiting any of the foregoing, in no event shall MSCI, S&P, any of their affiliates or any third party involved in making or compiling the GICS or any GICS classifications have any liability for any direct, indirect, special, punitive, consequential or any other damages (including lost profits) even if notified of the possibility of such damages.
This report, including the schedules of investments and financial statements, is submitted for the general information of the shareholders of the Wanger Advisors Trust.
A description of the Fund's proxy voting policies and procedures and a copy of the Fund's voting record for the most recent 12-month period ended June 30 are available (i) on our website, columbiathreadneedle.com/us, (ii) on the Securities and Exchange Commission's website at www.sec.gov, and (iii) without charge, upon request, by calling 888-492-6437.
The Fund files a complete schedule of portfolio holdings with the SEC for the first and third quarters of each fiscal year on Form N-Q. The Fund's Form N-Q is available on the SEC's website at www.sec.gov and may be reviewed and copied at the SEC's Public Reference Room in Washington, D.C. Information on the operation of the Pubic Reference Room may be obtained by calling 800-SEC-0330. The Fund's complete portfolio holdings are disclosed at www.columbiathreadneedle.com/us approximately 30 to 40 days after each month-end.

COLUMBIA WANGER FUNDS
© 2016 Columbia Management Investment Advisers, LLC. All rights reserved. C-1456 F (2/16) 1422083

ANNUAL REPORT
December 31, 2015

COLUMBIA WANGER FUNDS
Managed by Columbia Wanger Asset Management, LLC
WANGER INTERNATIONAL SELECT

Wanger International Select
2015 Annual Report
Table of Contents
| 2 | Understanding Your Expenses | ||||||
| 3 | Behavioral Economics | ||||||
| 6 | Performance Review | ||||||
| 8 | Statement of Investments | ||||||
| 13 | Statement of Assets and Liabilities | ||||||
| 13 | Statement of Operations | ||||||
| 14 | Statement of Changes in Net Assets | ||||||
| 15 | Financial Highlights | ||||||
| 16 | Notes to Financial Statements | ||||||
| 20 | Report of Independent Registered Public Accounting Firm | ||||||
| 21 | Federal Income Tax Information (Unaudited) | ||||||
| 22 | Board of Trustees and Management of Wanger Advisors Trust | ||||||
Columbia Wanger Asset Management, LLC (CWAM) is one of the leading global small- and mid-cap equity managers in the United States with over 40 years of small- and mid-cap investment experience. As of December 31, 2015, CWAM managed $20 billion in assets. CWAM is the investment manager to Wanger USA, Wanger International, Wanger Select and Wanger International Select (together, the Columbia Wanger Funds) and the Columbia Acorn Family of Funds.
An important note: Columbia Wanger Funds are available only through variable annuity contracts and variable life insurance policies issued by participating insurance companies or certain eligible retirement plans. Columbia Wanger Funds are not offered directly to the public and are not available in all contracts, policies or plans. Contact your financial advisor or insurance representative for more information. Columbia Wanger Funds are distributed by Columbia Management Investment Distributors, Inc., member FINRA, and are managed by CWAM.
Investors should carefully consider investment objectives, risks and expenses of the Fund before investing. For variable fund and variable contract prospectuses, which contain this and other important information, including the fees and expenses imposed under your contract, investors should contact their financial advisor or insurance representative. Read the prospectus for the Fund and your variable contract carefully before investing.
The views expressed in "Behavioral Economics" and in the Performance Review reflect the current views of the respective authors. These views are not guarantees of future performance and involve certain risks, uncertainties and assumptions that are difficult to predict, so actual outcomes and results may differ significantly from the views expressed. These views are subject to change at any time based upon economic, market or other conditions and the respective parties disclaim any responsibility to update such views. These views may not be relied on as investment advice and, because investment decisions for a Columbia Wanger Fund are based on numerous factors, may not be relied on as an indication of trading intent on behalf of any particular Columbia Wanger Fund. References to specific company securities should not be construed as a recommendation or investment advice.
1
Wanger International Select 2015 Annual Report
Understanding Your Expenses
As a shareholder, you incur three types of costs. There are transaction costs, which generally include sales charges on purchases and may include redemption fees. There are also ongoing costs, which generally include management fees and other expenses for Wanger International Select (the Fund). Lastly, there may be additional fees or charges imposed by the insurance company that sponsors your variable annuity and/or variable life insurance product. The following information is intended to help you understand your ongoing costs (in dollars) of investing in the Fund and to help you compare these costs with the ongoing costs of investing in other mutual funds.
Analyzing your Fund's expenses
To illustrate these ongoing costs, we have provided an example and calculated the expenses paid by investors in the Fund during the period. The actual and hypothetical information in the table below is based on an initial investment of $1,000 at the beginning of the period indicated and held for the entire period. Expense information is calculated two ways and each method provides you with different information. The amount listed in the "Actual" column is calculated using the Fund's actual operating expenses and total return for the period. You may use the Actual information, together with the amount invested, to estimate the expenses that you paid over the period. Simply divide your account value by $1,000 (for example, an $8,600 account value divided by $1,000 = 8.6), then multiply the results by the expenses paid during the period under the Actual column. The amount listed in the "Hypothetical" column assumes a 5% annual rate of return before expenses (which is not the Fund's actual return) and then applies the Fund's actual expense ratio for the period to the hypothetical return. You should not use the hypothetical account values and expenses to estimate either your actual account balance at the end of the period or the expenses you paid during the period. See "Compare with other funds" below for details on how to use the hypothetical data.
Compare with other funds
Since all mutual funds are required to include the same hypothetical calculations about expenses in shareholder reports, you can use this information to compare the ongoing cost of investing in the Fund with other funds. To do so, compare the hypothetical example with the 5% hypothetical examples that appear in the shareholder reports of other funds. As you compare hypothetical examples of other funds, it is important to note that hypothetical examples are meant to highlight the ongoing cost of investing in a fund only and do not reflect any transaction costs, such as sales charges, redemption or exchange fees. Therefore, the hypothetical calculations are useful in comparing ongoing costs only, and will not help you determine the relative total costs of owning different funds. If transaction costs were included in these calculations, your costs would be higher.
July 1, 2015 – December 31, 2015
| Account value at the beginning of the period ($) | Account value at the end of the period ($) | Expenses paid during period ($) | Fund's annualized expense ratio (%)* | ||||||||||||||||||||||||||||
Actual | Hypothetical | Actual | Hypothetical | Actual | Hypothetical | ||||||||||||||||||||||||||
Wanger International Select | 1,000.00 | 1,000.00 | 953.10 | 1,017.90 | 7.14 | 7.37 | 1.45 | ||||||||||||||||||||||||
* Expenses paid during the period are equal to the Fund's annualized expense ratio, multiplied by the average account value over the period, then multiplied by the number of days in the Fund's most recent fiscal half-year and divided by 365.
Had the investment manager and/or certain of its affiliates not waived/reimbursed certain fees and expenses, account value at the end of the period would have been reduced. See Note 4 to the Financial Statements.
It is important to note that the expense amounts shown in the table are meant to highlight only ongoing costs of investing in the Fund. Expenses paid during the period do not include any insurance charges imposed by your insurance company's separate account. The hypothetical example provided is useful in comparing ongoing costs only and will not help you determine the relative total costs of owning different funds whose shareholders may incur transaction costs.
2
Wanger International Select 2015 Annual Report
Behavioral Economics
People Occasionally Behave Irrationally
Economists have traditionally assumed that people rationally optimize in their own self-interest. A free-market economy dominated by "homo economicus" prospers as producers of goods and services trade with each other, as if driven by an invisible hand. In the past few decades, however, behavioral economics has emerged, refuting the rational optimization assumption. Nobel Prize winning Princeton professor Daniel Kahneman's book Thinking, Fast and Slow explains the habits and biases that cause people to make predictable errors.
Illustrating that people tend to make quick, intuitive decisions rather than well thought out ones, Kahneman asked Ivy League students the following question: A bat and a ball cost $1.10. The bat costs $1.00 more than the ball. How much does the ball cost? Over half of students answered $0.10, though the correct answer is $0.05.
Kahneman also points out that people generally have a confirmation bias.1 Good scientific method calls for people to test a hypothesis by attempting to refute it, but instead people seek data that confirms their beliefs. We would rather keep our beliefs than seriously analyze and challenge them.
Individuals also exhibit an anchoring effect. Kahneman and his associate Amos Tversky devised several experiments that first provided a high or low number (from a rigged "wheel of fortune" or in a text) and then asked for best-guess estimates for unrelated data. Subjects who were provided high numbers gave high estimates and vice versa. People tend to "anchor" on an initial number provided and then move toward an unbiased estimate. When the Exploratorium Museum in San Francisco polled visitors about contributing to a particular cause without providing a suggested contribution amount, visitors on average said they would donate $64. When $5 was suggested as a donation, the average response was $20, and when $400 was suggested, the average jumped to $143.2 It seems as though many charities understand the anchoring effect.
Kahneman identified an availability bias. People base their knowledge, opinions and actions on small samples of information readily available to them. Estimates of causes of death are warped by media coverage. For example, strokes cause almost twice as many deaths as all accidents combined, but 80% of respondents said accidental deaths were more likely.3
Kahneman and Tversky did many behavioral studies, and their largest contribution to behavioral economics is their work on decision making in risky situations. Subjects were asked to make the following two choices concurrently:
Choose between:
A. a sure gain of $240
B. 25% chance to win $1,000 and a 75% chance to gain nothing
Choose between:
C. a sure loss of $750
D. 75% chance to lose $1,000 and a 25% chance to lose nothing
People are risk averse with respect to gains; 84% of subjects chose A, accepting a lower expected value than B.4 However, people are risk seeking with respect to losses. People hate to lose and will take a chance of a greater loss in exchange for a chance not to lose; 87% chose D.5
Despite the instructions, subjects appeared to make these choices sequentially rather than concurrently. They framed the exercise as two separate choices. Choosing A and D provides a net result of a 75% chance to lose $760 and a 25% chance of gaining $240. People solving the problems concurrently and rationally would have chosen C and B, which provides a net result of a 75% chance to lose $750 and a 25% chance to gain $250. Choosing C and B together results in the same odds, yet $10 more under either scenario.
Given our biases, how a choice is framed heavily influences our decisions. Would you accept a gamble that offers a 10% chance to win $95 and a 90% chance to lose $5? Would you pay $5 to participate in a lottery that offers a 10% chance to win $100 and a 90% chance to win nothing?
Many more people accept the second opportunity than the first, even though the choices are identical. The first clearly frames the $5 as a loss, while the second suggests the $5 is a sunk cost. 6
Kahneman and Tversky also did a study to determine values people assign to probabilities, what they called decision weights. People provided zero value to a zero probability and a value of 100 to a sure thing, but the values in between were interesting:7
Probability | 1 | % | 10 | % | 50 | % | 90 | % | 99 | % | |||||||||||||
| Decision Weight | 5.5 | 18.6 | 42.1 | 71.2 | 91.2 | ||||||||||||||||||
What the data shows is that people are often willing to overpay for small probabilities, a tendency known as the possibility effect. That is why lotteries exist. Yet people underpay relatively more for large but not certain probabilities. To eliminate those last bits of uncertainty, people are willing to pay a lot, a tendency known as the certainty effect.
Richard Thaler, a University of Chicago professor of behavioral science and economics, worked with Kahneman and Tversky on several studies. Jointly, they defined the endowment effect, which states that once someone owns something, he tends to place an irrationally high value on it. Thaler and Kahneman experimented by giving some subjects coffee mugs decorated with university insignia. Participants were asked to provide the prices at which they would sell. Other subjects were not given mugs and were asked what prices they would bid for the mugs. The average selling price was about double the average buying price!8
Thaler agrees with Kahneman's findings that people are risk seeking with respect to losses, both prospectively and retrospectively. People who are losing money at a racetrack tend to bet on longshots for the last race of the day, hoping to recoup losses, effectively driving the expected return of the last race even more against them!9 Financial institutions need to watch losing traders very closely, as rogue traders repeatedly double down in hopes of recouping losses.
3
Wanger International Select 2015 Annual Report
Thaler's work indicates that people create mental accounts, treating some money differently depending on its intended use. Cash accounts are for spending, other funds are for savings, and retirement accounts are sacrosanct.10 People may borrow at high interest rates on their charge cards while receiving low interest rates on savings, which appears irrational.
Thaler notes that Economics 101 classes typically teach that prices should rationally rise when there is an unanticipated increase in demand. I remember learning that it would be rational for merchants to raise the price of snow shovels after a blizzard and plywood before a hurricane. The products would be rationed by price to those most in need and capable of paying, and additional revenues would induce costly special increases in supply. Thaler's work, however, indicates that most people would consider such increases as unfair price gouging, and would later penalize those merchants.
Policy Implications
Public policies are often impacted by people's emotional reaction under the availability bias. Former Administrator of the White House Office of Information and Regulatory Affairs, Cass Sunstein, has analyzed resulting regulations and notes that poor regulations waste time and money. Rational weighting of costs and benefits would result in better regulations and improved outcomes.11
Kahneman points out that as an extension of the possibility effect, people tend to be confounded by exceptionally small probabilities,12 and either ignore them or give them way too much attention. The precautionary principle, which prohibits any action that might cause harm, is the result. Sunstein believes that many innovations including airplanes, antibiotics, automobiles, chlorination, vaccinations and x-rays would have not passed strict interpretation of the precautionary principle.13
Thaler's work explains one of the reasons why policy makers prefer modest inflation. People consider outright wage cuts as unfair, even when unemployment is high and the employer is
earning only a small profit. But a flat wage when there is inflation is not considered unfair, even though real wages drop.14 Therefore, the economy can more easily rationalize costs in a recession with some inflation rather than none.
Thaler devised a plan to induce people to contribute more to 401K plans called "Save More Tomorrow." Many people don't contribute to their 401K plan because that would mean an immediate take-home pay cut, frowned on by the endowment effect. Instead, the plan has people sign up now to contribute upon their next raise in pay. They then forgo some or the entire raise, but save for retirement without taking a pay cut. Employees of the first company that adopted the plan nearly quadrupled their savings rate after four annual raises.15
Thaler and Sunstein's book Nudge cites numerous ways that individuals can be "nudged" to make better decisions. For example, default options are considered standard and most people don't extend the effort to make a different choice. Germans need to opt in for organ donations, and only 12% do. Austrians need to opt out of organ donations, and 99% allow their organs to be donated.16
Investment Implications
Kahneman notes that experienced traders in financial markets tend to more rationally deal with risk aversion than individual investors. Most people weight losses twice as much as gains,17 and if each transaction is framed individually, irrational risk aversion results. By framing gains and losses over longer periods rather than individually, traders can accept individual rational risks. To mitigate this bias, Kahneman suggests that individual investors view the market prices of their investments less frequently.18
Thaler agrees, as he conducted an experiment simulating endowment management. Some subjects were shown results eight times per simulated calendar year, while others were shown results once per simulated year. Those seeing results more frequently chose to invest 41% in stocks and those seeing results just
once a year had 70% in stocks.19 Myopic risk aversion helps explain why stocks provided a 7% premium compound rate of return over risk-free securities for the last two centuries,20 a huge premium that cannot be otherwise explained by economic theory.21
Individuals tend to be terrible stock traders. One study indicated that stocks sold by individuals outperformed stocks they bought by 3.2% per year, before transactions costs. Individual investors tend to sell winners even though recent winners on average outperform recent losers in the short term. Individuals tend to keep losers, as they are averse to taking losses and have anchored on purchase prices as target sale prices for losers.22 Losers on average underperform in the short term.23
Mental accounts result in the house money effect for gamblers and investors. People are more prone to lose their risk aversion on gains when they are ahead. This can result in gamblers not knowing when to quit, and investors creating bubbles.24
Humans, including many professional money managers, seem to be hard wired to invest poorly, to "buy high and sell low." Behavioral economics helps explain why. One solution to offset this tendency is to own Columbia Thermostat Fund, which takes emotions out of investing and automatically invests more in stocks when the market drops and automatically sells stocks when the market rises.25


Charles P. McQuaid
Portfolio Manager, Analyst and Advisor
Columbia Wanger Asset Management, LLC
4
Wanger International Select 2015 Annual Report
The information and data provided in this analysis are derived from sources that we deem to be reliable and accurate. These views are not guarantees of future performance and involve certain risks, uncertainties and assumptions that are difficult to predict so actual outcomes and results may differ significantly from the views expressed. The views/opinions expressed here are those of the author and not of the Wanger Advisors Trust Board of Trustees, are subject to change at any time based upon economic, market or other conditions, may differ from views expressed by other Columbia Management associates and the respective parties disclaim any responsibility to update such views. These views may not be relied on as investment advice and, because investment decisions for a Columbia Wanger Fund are based on numerous factors, may not be relied on as an indication of trading intent on behalf of any particular Columbia Wanger Fund.
The author would like to thank Colin Moore, Global Chief Investment Officer of Columbia Threadneedle Investments, for suggesting Beyond Greed and Fear, which summarizes behavioral economics for investors. He would also like to thank recently retired Wanger Advisors Trust Chief Compliance Officer Robert Scales for suggesting Thinking, Fast and Slow.
1 Daniel Kahneman, Thinking, Fast and Slow (New York, Farrar, Straus and Giroux, 2011), p. 81.
2 Ibid., p. 125.
3 Ibid., p. 138.
4 Expected value is the sum of probabilities times dollars.
5 Kahneman, op. cit., p. 437.
6 Ibid., p. 364.
7 Ibid., p. 315.
8 Ibid., p. 295.
9 Richard H. Thaler, Misbehaving: The Making of Behavioral Economics (New York, W. W. Norton & Company, Inc., 2015), p. 80.
10 Ibid., p. 76.
11 Kahneman, op. cit., p. 141.
12 Somehow this one is not labelled as a particular bias or effect.
13 Kahneman, op. cit., p. 351.
14 Thaler, op. cit., p. 132.
15 Ibid., p. 318.
16 Richard H. Thaler and Cass R. Sunstein, Nudge: Improving Decisions About Health, Wealth, and Happiness (New Haven, Connecticut, Yale University Press, 2008), p. 178-179.
17 Kahneman, op. cit., p. 349.
18 Ibid., p. 339.
19 Thaler, op. cit., p. 197.
20 Hersh Shefrin, Beyond Greed and Fear: Understanding Behavioral Finance and the Psychology of Investing (New York, Oxford University Press, 2002), p. 37.
21 Thaler, op. cit., p. 192.
22 In Beyond Greed and Fear, Shefrin labels this as "Get-evenitis."
23 Kahneman, op. cit., p. 213-214.
24 Thaler, op. cit., p. 83.
25 If interested, please see Columbia Thermostat Fund's prospectus, which can be found at columbiathreadneedle.com/us.
5
Wanger International Select 2015 Annual Report
Performance Review Wanger International Select
|
| ||||||
| Stephen Kusmierczak Co-Portfolio Manager* | Andreas Waldburg-Wolfegg Co-Portfolio Manager | ||||||


Market risk may affect a single issuer, sector of the economy, industry or the market as a whole. Foreign investments subject the Fund to political, economic, market, social and other risks within a particular country, as well as to potential currency instabilities and less stringent financial and accounting standards generally applicable to U.S. issuers. Risks are enhanced for emerging market issuers. Investments in small- and mid-cap companies involve risks and volatility and possible illiquidity greater than investments in larger, more established companies. The Fund may invest significantly in issuers within a particular sector, which may be negatively affected by market, economic or other conditions, making the Fund more vulnerable to unfavorable developments in the sector.
Wanger International Select ended the year down 1.03%, underperforming the 3.96% gain of the Fund's primary benchmark, the S&P Developed Ex-U.S. Between $2B and $10B® Index. Fund underperformance for the year was largely due to poor relative performance in the financials and materials sectors. Over the course of the year, we reduced Fund exposure in each sector.
We also repositioned the Fund to be more mid- to large-cap oriented during the year. As we reviewed Fund holdings and added new positions to the Fund, we focused on names that have a market capitalization of $5 billion or more. While there is overlap between the Fund's holdings and Wanger International, another mid-cap international fund that we manage, Wanger International Select has substantially fewer holdings and is more concentrated.
Three Japanese stocks ranked among the top-contributing names in the Fund for the year. Japanese markets outperformed most world markets, as loosening monetary policy and improving corporate governance proved relatively attractive amidst a slowing global economy. KDDI, a mobile and fixed-line communication service provider in Japan, gained 27% for the year and Secom, a provider of security services, was up 20%. Both KDDI and Secom have enjoyed steady growth, as their businesses are not affected by the global economic slowdown. Japan Tobacco, a maker of cigarettes, gained 37%. Japan Tobacco's profit growth exceeded expectations, as strong pricing power offset market fears of volume contraction.
On the downside, laggards for the year came largely from the materials, energy and financial sectors. Weak gold and oil prices were to blame for much of the material and energy sector declines. Gold miners Tahoe Resources and Goldcorp were sold in the second half of the year but ranked among the Fund's largest detractors for the annual period with losses of 41% and 31%, respectively. Oil exploration and production companies Vermillion Energy and Anadarko Petroleum were added to the Fund in the year and both traded down with the dramatic fall in oil prices, ending the year among the Fund's largest detractors. We bought these stocks because we believe they are well-positioned to benefit when oil prices return to
levels closer to their long-term averages and the world's cost of production. In the financial sector, we sold the Fund's position in Coronation Fund Managers, a South African investment manager, as poor performance and asset outflows significantly reduced the firm's performance-based fees. Down 48%, its stock was a top detractor for the year.
As announced in a supplement to the Fund's prospectus dated February 5, 2016, the Board of Trustees of Wanger Advisors Trust approved a plan to liquidate and dissolve Wanger International Select on or about April 29, 2016. The Board of Trustees believes that the liquidation and dissolution of the Fund are in the best interest of the Fund and its shareholders. As of the liquidation date, the Fund will cease its investment operations and liquidate its assets in order to make final distributions to shareholders of record as of that date.
Owners of the variable annuity contracts and variable life insurance policies offered by the participating insurance companies whose separate accounts are invested in the Fund should consult with their participating insurance company for information regarding the possibility of transferring their investment to other Columbia Wanger Funds and the redirection of their assets that will occur on or about the liquidation date. The liquidation and dissolution of the Fund may be postponed or abandoned by action of the Board of Trustees at any time prior to the liquidation date.
*Effective January 1, 2016, Stephen Kusmierczak replaced Christopher J. Olson as co-portfolio manager of Wanger International Select. Mr. Waldburg-Wolfegg continues in his role as co-portfolio manager of the Fund. Mr. Kusmierczak also serves as co-portfolio manager of several of the Columbia Acorn Funds. Mr. Kusmierczak did not serve as a portfolio manager of the Fund during 2015.
Fund holdings are as of the date given, are subject to change at any time, and are not recommendations to buy or sell any security.
6
Wanger International Select 2015 Annual Report
Growth of a $10,000 Investment in Wanger International Select
February 1, 1999 (inception date) through December 31, 2015
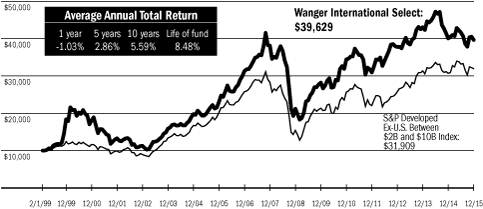
Performance data shown represents past performance and is not a guarantee of future results. The investment return and principal value will fluctuate so that shares, when redeemed, may be worth more or less than the original cost. Current performance may be lower or higher than the performance data shown. Performance results reflect any fee waivers or reimbursements of Fund expenses by the investment manager and/or any of its affiliates. Absent these fee waivers and/or expense reimbursement arrangements, performance results would have been lower. For most recent month-end performance updates, please visit columbiathreadneedle.com/us.
This graph compares the results of $10,000 invested in Wanger International Select on February 1, 1999 (the date the Fund began operations) through December 31, 2015, to the S&P Developed Ex-U.S. Between $2B and $10B Index, with dividends and capital gains reinvested. Although the index is provided for use in assessing the Fund's performance, the Fund's holdings may differ significantly from those in the index.
Top 10 Holdings
As a percentage of net assets, as of 12/31/15
| 1. CCL Industries (Canada) Global Label Converter | 4.1 | % | |||||
| 2. Novozymes (Denmark) Industrial Enzymes | 3.8 | ||||||
| 3. Recruit Holdings (Japan) Recruitment & Media Services | 3.3 | ||||||
| 4. Partners Group (Switzerland) Private Markets Asset Management | 3.0 | ||||||
| 5. Sony Financial Holdings (Japan) Life Insurance, Assurance & Internet Banking | 3.0 | ||||||
| 6. Distribuidora Internacional de Alimentación (Spain) Discount Retailer in Spain & Latin America | 2.9 | ||||||
| 7. Telefonica Deutschland (Germany) Mobile & Fixed-line Communications in Germany | 2.9 | ||||||
| 8. WH Smith (United Kingdom) Newsprint, Books & General Stationery Retailer | 2.8 | ||||||
| 9. Wirecard (Germany) Online Payment Processing & Risk Management | 2.5 | ||||||
| 10. Anadarko Petroleum (United States) Worldwide Production of Oil & Gas | 2.2 | ||||||
Top holdings exclude short-term holdings and cash, if applicable.
Top 5 Countries
As a percentage of net assets, as of 12/31/15
Japan | 18.2 | % | |||||
United Kingdom | 10.9 | ||||||
Germany | 7.4 | ||||||
Canada | 6.2 | ||||||
Sweden | 5.1 | ||||||
Results as of December 31, 2015
4th quarter* | 1 year | 5 years | 10 years | ||||||||||||||||
Wanger International Select | 4.77 | % | -1.03 | % | 2.86 | % | 5.59 | % | |||||||||||
| S&P Developed Ex-U.S. Between $2B and $10B Index** | 5.52 | 3.96 | 4.46 | 4.71 | |||||||||||||||
MSCI EAFE Index (Net) | 4.71 | -0.81 | 3.60 | 3.03 | |||||||||||||||
NAV as of 12/31/15: $16.40
* Not annualized.
** The Fund's primary benchmark as of December 31, 2015. Effective January 1, 2016, the primary benchmark for Wanger International Select was changed to the MSCI ACWI Ex USA Index (Net).
Performance numbers reflect all Fund expenses but do not include any fees and expenses imposed under your variable annuity contract or life insurance policy or qualified pension or retirement plan. If performance numbers included the effect of these additional charges, they would be lower.
The Fund's annual operating expense ratio of 1.43% is stated as of the Fund's prospectus dated May 1, 2015, and differences in expense ratios disclosed elsewhere in this report may result from including fee waivers and/or expense reimbursements as well as different time periods used in calculating the ratios.
All results shown assume reinvestment of distributions.
The S&P Developed Ex-U.S. Between $2B and $10B Index is a subset of the broad market selected by the index sponsor representing the mid-cap developed market, excluding the United States. The MSCI Europe, Australasia, Far East (EAFE) Index (Net) is a capitalization-weighted index that tracks the total return of common stocks in 21 developed-market countries within Europe, Australasia and the Far East. The returns of the MSCI EAFE Index (Net) are presented net of the withholding tax rate applicable to foreign non-resident institutional investors in the foreign companies included in the index who do not benefit from double taxation treaties. The performance of the MSCI EAFE Index (Net) is provided to show how the Fund's performance compares to a widely recognized broad-based index of foreign market performance. Indexes are not managed and do not incur fees or expenses. It is not possible to invest directly in an index.
Portfolio characteristics and holdings are subject to change periodically and may not be representative of current characteristics and holdings.
7
Wanger International Select 2015 Annual Report
Wanger International Select
Statement of Investments, December 31, 2015
| Number of Shares | Value | ||||||||||
Equities – 88.8% | |||||||||||
Europe – 40.1% | |||||||||||
United Kingdom – 10.9% | |||||||||||
19,000 | WH Smith Newsprint, Books & General Stationery Retailer | $ | 493,695 | ||||||||
24,000 | Babcock International Public Sector Outsourcer | 359,164 | |||||||||
20,000 | Smith & Nephew Medical Equipment & Supplies | 356,441 | |||||||||
5,000 | Whitbread UK Hotelier & Coffee Shop | 324,083 | |||||||||
2,000 | Next Clothes & Home Retailer in the UK | 214,742 | |||||||||
11,000 | Compass Group Catering & Support Services | 190,610 | |||||||||
1,938,735 | |||||||||||
Germany – 7.4% | |||||||||||
96,900 | Telefonica Deutschland Mobile & Fixed-line Communications in Germany | 511,117 | |||||||||
9,000 | Wirecard Online Payment Processing & Risk Management | 449,865 | |||||||||
3,700 | MTU Aero Engines Airplane Engine Components & Services | 360,621 | |||||||||
1,321,603 | |||||||||||
Sweden – 5.1% | |||||||||||
10,000 | Hennes & Mauritz Discount Fashion Retailer | 355,703 | |||||||||
9,906 | Swedish Match Swedish Snus | 350,052 | |||||||||
5,270 | Hexagon Design, Measurement & Visualization Software & Equipment | 194,952 | |||||||||
900,707 | |||||||||||
Switzerland – 5.0% | |||||||||||
1,500 | Partners Group (a) Private Markets Asset Management | 539,451 | |||||||||
1,060 | Geberit Plumbing Systems | 359,025 | |||||||||
898,476 | |||||||||||
Denmark – 3.8% | |||||||||||
14,121 | Novozymes Industrial Enzymes | 676,098 | |||||||||
| Number of Shares | Value | ||||||||||
Spain – 2.9% | |||||||||||
87,000 | Distribuidora Internacional de Alimentación Discount Retailer in Spain & Latin America | $ | 513,134 | ||||||||
France – 2.8% | |||||||||||
12,427 | Eutelsat Fixed Satellite Services | 372,070 | |||||||||
1,000 | Essilor International Eyeglass Lenses | 124,636 | |||||||||
496,706 | |||||||||||
Netherlands – 2.2% | |||||||||||
9,000 | Vopak Operator of Petroleum & Chemical Storage Terminals | 387,583 | |||||||||
Total Europe | 7,133,042 | ||||||||||
Asia – 33.9% | |||||||||||
Japan – 18.2% | |||||||||||
20,100 | Recruit Holdings Recruitment & Media Services | 590,815 | |||||||||
30,000 | Sony Financial Holdings Life Insurance, Assurance & Internet Banking | 536,617 | |||||||||
5,500 | Secom Security Services | 372,734 | |||||||||
10,000 | Japan Tobacco Cigarettes | 367,138 | |||||||||
14,000 | KDDI Mobile & Fixed Line Communication Service Provider in Japan | 363,583 | |||||||||
21,000 | Santen Pharmaceutical Specialty Pharma (Ophthalmic Medicine) | 345,732 | |||||||||
20,000 | Aeon Mall Suburban Shopping Mall Developer, Owner & Operator | 343,042 | |||||||||
8,000 | Hoya Corp Opto-electrical Components & Eyeglass Lenses | 327,140 | |||||||||
3,246,801 | |||||||||||
Korea – 4.4% | |||||||||||
2,900 | KT&G Tobacco & Ginseng Products | 257,709 | |||||||||
1,108 | CJ Corp Holding Company of Korean Consumer Conglomerate | 235,347 | |||||||||
See accompanying notes to financial statements.
8
Wanger International Select 2015 Annual Report
Wanger International Select
Statement of Investments, December 31, 2015
| Number of Shares | Value | ||||||||||
Korea – 4.4% (cont) | |||||||||||
700 | Samsung Fire and Marine | $ | 182,985 | ||||||||
665 | Samsung Fire & Marine Preferred Non-life Insurance | 106,768 | |||||||||
782,809 | |||||||||||
Taiwan – 3.9% | |||||||||||
170,000 | Far EasTone Telecom Mobile Operator in Taiwan | 349,385 | |||||||||
5,000 | Largan Precision Mobile Device Camera Lenses & Modules | 342,124 | |||||||||
691,509 | |||||||||||
China – 3.8% | |||||||||||
2,000 | NetEase.com – ADR Chinese Online Gaming Services | 362,480 | |||||||||
240,000 | China Everbright International Municipal Waste Operator | 306,883 | |||||||||
669,363 | |||||||||||
Singapore – 2.0% | |||||||||||
67,000 | Singapore Exchange Singapore Equity & Derivatives Market Operator | 362,364 | |||||||||
Hong Kong – 1.6% | |||||||||||
11,245 | Hong Kong Exchanges and Clearing Hong Kong Equity & Derivatives Market Operator | 286,464 | |||||||||
Total Asia | 6,039,310 | ||||||||||
Other Countries – 14.4% | |||||||||||
Canada – 6.2% | |||||||||||
4,500 | CCL Industries Global Label Converter | 729,685 | |||||||||
14,000 | Vermilion Energy (a) Canadian Exploration & Production Company | 380,530 | |||||||||
1,110,215 | |||||||||||
Australia – 4.1% | |||||||||||
38,000 | Amcor Global Leader in Flexible & Rigid Packaging | 369,179 | |||||||||
91,035 | IAG General Insurance Provider | 365,598 | |||||||||
734,777 | |||||||||||
| Number of Shares | Value | ||||||||||
United States – 2.2% | |||||||||||
8,000 | Anadarko Petroleum Worldwide Production of Oil & Gas | $ | 388,640 | ||||||||
South Africa – 1.9% | |||||||||||
2,400 | Naspers Media in Africa, China, Russia & other Emerging Markets | 328,043 | |||||||||
Total Other Countries | 2,561,675 | ||||||||||
Latin America – 0.4% | |||||||||||
Uruguay – 0.4% | |||||||||||
13,068 | Union Agriculture Group (b) (c) (d) Farmland Operator in Uruguay | 66,385 | |||||||||
Total Latin America | 66,385 | ||||||||||
| Total Equities (Cost: $14,180,668) – 88.8% | 15,800,412 | (e) | |||||||||
Short-Term Investments – 11.4% | |||||||||||
2,029,382 | JPMorgan U.S. Government Money Market Fund, IM Shares (7 day yield of 0.01%) | 2,029,382 | |||||||||
| Total Short-Term Investments (Cost: $2,029,382) – 11.4% | 2,029,382 | ||||||||||
Securities Lending Collateral – 2.4% | |||||||||||
424,733 | Dreyfus Government Cash Management Fund, Institutional Shares (7 day yield of 0.03%) (f) | 424,733 | |||||||||
| Total Securities Lending Collateral (Cost: $424,733) – 2.4% | 424,733 | ||||||||||
| Total Investments (Cost: $16,634,783) (g) – 102.6% | 18,254,527 | ||||||||||
| Obligation to Return Collateral for Securities Loaned – (2.4)% | (424,733 | ) | |||||||||
Cash and Other Assets Less Liabilities – (0.2)% | (34,454 | ) | |||||||||
Net Assets – 100.0% | $ | 17,795,340 | |||||||||
ADR – American Depositary Receipts
See accompanying notes to financial statements.
9
Wanger International Select 2015 Annual Report
Wanger International Select
Statement of Investments, December 31, 2015
Notes to Statement of Investments
(a) All or a portion of this security was on loan at December 31, 2015. The total market value of securities on loan at December 31, 2015 was $403,067.
(b) Non-income producing security.
(c) Illiquid security.
(d) Denotes a restricted security, which is subject to restrictions on resale under federal securities laws. This security is valued at fair value determined in good faith under consistently applied procedures established by the Fund's Board of Trustees. At December 31, 2015, the market value of this security amounted to $66,385, which represented 0.37% of total net assets. Additional information on this security is as follows:
Security | Acquisition Dates | Shares | Cost | Value | |||||||||||||||
Union Agriculture Group | 12/8/10 - 6/27/12 | 13,068 | $ | 150,000 | $ | 66,385 | |||||||||||||
(e) On December 31, 2015, the Fund's total equity investments were denominated in currencies as follows:
Currency | Value | Percentage of Net Assets | |||||||||
Japanese Yen | $ | 3,246,801 | 18.2 | ||||||||
Euro | 2,719,026 | 15.3 | |||||||||
British Pound | 1,938,735 | 10.9 | |||||||||
Canadian Dollar | 1,110,215 | 6.2 | |||||||||
Swedish Krona | 900,707 | 5.1 | |||||||||
Swiss Franc | 898,476 | 5.1 | |||||||||
| Other currencies less than 5% of total net assets | 4,986,452 | 28.0 | |||||||||
Total Equities | $ | 15,800,412 | 88.8 | ||||||||
(f) Investment made with cash collateral received from securities lending activity.
(g) At December 31, 2015, for federal income tax purposes, the cost of investments was $16,644,670 and net unrealized appreciation was $1,609,857 consisting of gross unrealized appreciation of $2,556,638 and gross unrealized depreciation of $946,781.
Fair Value Measurements
Various inputs are used in determining the value of the Fund's investments, following the input prioritization hierarchy established by accounting principles generally accepted in the United States of America (GAAP). These inputs are summarized in the three broad levels listed below:
• Level 1 – quoted prices in active markets for identical securities
• Level 2 – prices determined using other significant observable inputs (including quoted prices for similar securities, interest rates, prepayment speeds, credit risk and others)
• Level 3 – prices determined using significant unobservable inputs where quoted prices or observable inputs are unavailable or less reliable (including management's own assumptions about the factors market participants would use in pricing an investment)
The inputs or methodology used for valuing securities are not necessarily an indication of the risk associated with investing in those securities.
Examples of the types of securities in which the Fund would typically invest and how they are classified within this hierarchy are as follows. Typical Level 1 securities include exchange traded domestic equities, mutual funds whose NAVs are published each day and exchange traded foreign equities that are not statistically fair valued. Typical Level 2 securities include exchange traded foreign equities that are statistically fair valued, forward foreign currency exchange contracts and short-term investments valued at amortized cost. Additionally, securities fair valued by CWAM's Valuation Committee (the Committee) that rely on significant observable inputs are also included in Level 2. Typical Level 3 securities include any security fair valued by the Committee that relies on significant unobservable inputs.
The Committee is responsible for applying the Trust's Portfolio Pricing Policy and the CWAM pricing procedures (the Policies), which are approved by and subject to the oversight of the Board.
The Committee meets as necessary, and no less frequently than quarterly, to determine fair values for securities for which market quotations are not readily available or for which the investment manager believes that available market quotations are unreliable. The Committee also reviews the continuing appropriateness of the Policies. In circumstances where a security has been fair valued, the Committee will also review the continuing appropriateness of the current value of the security. The Policies address, among other things: circumstances under which market quotations will be deemed readily available; selection of third party pricing vendors; appropriate pricing methodologies; events that require fair valuation and fair value techniques; circumstances under which securities will be deemed to pose a potential for stale pricing, including when securities are illiquid, restricted, or in default; and certain delegations of authority to determine fair values to the Fund's investment manager. The Committee may also meet to discuss additional valuation matters, which may include review of back-testing results, review of time-sensitive information or approval of other valuation related actions, and to review the appropriateness of the Policies.
For investments categorized as Level 3, the significant unobservable inputs used in the fair value measurement of the Fund's securities may include: (i) data specific to the issuer or comparable issuers, (ii) general market or specific sector news and (iii) quoted prices and specific or similar security transactions. The Committee considers this data and any changes from prior periods in order to assess the reasonableness of observable and unobservable inputs, any assumptions or internal models used to value those securities and changes in fair value. Significant changes in any of these factors could result in lower or higher fair value measurements. Various factors impact the frequency of monitoring (which may occur as often as daily), however the Committee may determine that changes to inputs, assumptions and models are not required with the same frequency.
See accompanying notes to financial statements.
10
Wanger International Select 2015 Annual Report
Wanger International Select
Statement of Investments, December 31, 2015
The following table summarizes the inputs used, as of December 31, 2015, in valuing the Fund's assets:
Investment Type | Quoted Prices (Level 1) | Other Significant Observable Inputs (Level 2) | Significant Unobservable Inputs (Level 3) | Total | |||||||||||||||
Equities | |||||||||||||||||||
Europe | $ | — | $ | 7,133,042 | $ | — | $ | 7,133,042 | |||||||||||
Asia | 362,480 | 5,676,830 | — | 6,039,310 | |||||||||||||||
Other Countries | 1,498,855 | 1,062,820 | — | 2,561,675 | |||||||||||||||
Latin America | — | — | 66,385 | 66,385 | |||||||||||||||
Total Equities | 1,861,335 | 13,872,692 | 66,385 | 15,800,412 | |||||||||||||||
| Total Short-Term Investments | 2,029,382 | — | — | 2,029,382 | |||||||||||||||
| Total Securities Lending Collateral | 424,733 | — | — | 424,733 | |||||||||||||||
Total Investments | $ | 4,315,450 | $ | 13,872,692 | $ | 66,385 | $ | 18,254,527 | |||||||||||
The Fund's assets assigned to the Level 2 input category are generally valued using a market approach, in which a security's value is determined through its correlation to prices and information from observable market transactions for similar or identical assets. Foreign equities are generally valued at the last sale price on the foreign exchange or market on which they trade. The Fund may use a statistical fair valuation model, in accordance with the policy adopted by the Board, provided by an independent third party to value securities principally traded in foreign markets in order to adjust for possible stale pricing that may occur between the close of the foreign exchanges and the time for valuation. These models take into account available market data including intraday index, ADR, and ETF movements.
There were no transfers of financial assets between levels during the period.
The Fund does not hold any significant investments (greater than one percent of net assets) categorized as Level 3.
Certain securities classified as Level 3 are valued by the Committee using a market approach, as determined in good faith under consistently applied procedures established by and under the general supervision of the Board. To determine fair value for these securities, for which no market exists, the Committee utilizes the valuation technique it deems most appropriate in the circumstances, using some unobservable inputs, which may include, but are not limited to estimated earnings of the company and the position of the security within the company's capital structure. The Committee also may use some observable inputs, which may include, but are not limited to, trades of similar securities and market multiples derived from a set of comparable companies. Significant increases or decreases to any of these inputs could result in a significantly lower or higher fair value measurement.
See accompanying notes to financial statements.
11
Wanger International Select 2015 Annual Report
Wanger International Select (Unaudited)
Portfolio Diversification, December 31, 2015
At December 31, 2015, the Fund's portfolio investments as a percentage of net assets were diversified as follows:
Value | Percentage of Net Assets | ||||||||||
Information | |||||||||||
Financial Processors | $ | 1,098,694 | 6.2 | ||||||||
Mobile Communications | 712,968 | 4.0 | |||||||||
Internet Related | 690,522 | 3.9 | |||||||||
Advertising | 590,815 | 3.3 | |||||||||
Telephone & Data Services | 511,117 | 2.9 | |||||||||
Satellite Broadcasting & Services | 372,070 | 2.1 | |||||||||
Telecommunications Equipment | 342,124 | 1.9 | |||||||||
Semiconductors & Related Equipment | 327,140 | 1.8 | |||||||||
Business Software | 194,952 | 1.1 | |||||||||
4,840,402 | 27.2 | ||||||||||
Consumer Goods & Services | |||||||||||
Retail | 1,577,274 | 8.8 | |||||||||
Nondurables | 1,354,532 | 7.6 | |||||||||
Restaurants | 514,693 | 2.9 | |||||||||
Food & Beverage | 350,052 | 2.0 | |||||||||
3,796,551 | 21.3 | ||||||||||
Industrial Goods & Services | |||||||||||
Industrial Materials & Specialty Chemicals | 1,045,277 | 5.9 | |||||||||
Other Industrial Services | 733,354 | 4.1 | |||||||||
Outsourcing Services | 359,164 | 2.0 | |||||||||
Construction | 359,025 | 2.0 | |||||||||
Waste Management | 306,883 | 1.8 | |||||||||
Conglomerates | 235,347 | 1.3 | |||||||||
3,039,050 | 17.1 | ||||||||||
Value | Percentage of Net Assets | ||||||||||
Finance | |||||||||||
Insurance | $ | 1,191,968 | 6.7 | ||||||||
Brokerage & Money Management | 539,451 | 3.0 | |||||||||
1,731,419 | 9.7 | ||||||||||
Energy & Minerals | |||||||||||
Oil & Gas Producers | 769,171 | 4.3 | |||||||||
Oil Refining, Marketing & Distribution | 387,583 | 2.2 | |||||||||
Agricultural Commodities | 66,385 | 0.4 | |||||||||
1,223,139 | 6.9 | ||||||||||
Health Care | |||||||||||
Medical Equipment & Devices | 481,077 | 2.7 | |||||||||
Pharmaceuticals | 345,732 | 2.0 | |||||||||
826,809 | 4.7 | ||||||||||
Other Industries | |||||||||||
Real Estate | 343,042 | 1.9 | |||||||||
343,042 | 1.9 | ||||||||||
Total Equities: | 15,800,412 | 88.8 | |||||||||
Short-Term Investments: | 2,029,382 | 11.4 | |||||||||
Securities Lending Collateral: | 424,733 | 2.4 | |||||||||
Total Investments: | 18,254,527 | 102.6 | |||||||||
| Obligation to Return Collateral for Securities Loaned: | (424,733 | ) | (2.4 | ) | |||||||
| Cash and Other Assets Less Liabilities: | (34,454 | ) | (0.2 | ) | |||||||
Net Assets: | $ | 17,795,340 | 100.0 | ||||||||
See accompanying notes to financial statements.
12
Wanger International Select 2015 Annual Report
Statement of Assets and Liabilities
December 31, 2015
Assets: | |||||||
Investments, at cost | $ | 16,634,783 | |||||
| Investments, at value (including securities on loan of $403,067) | $ | 18,254,527 | |||||
Foreign currency (cost of $5) | 5 | ||||||
Receivable for: | |||||||
Investments sold | 334,440 | ||||||
Fund shares sold | 7,034 | ||||||
Securities lending income | 45 | ||||||
Dividends | 20,376 | ||||||
Foreign tax reclaims | 10,965 | ||||||
Regulatory Settlements (Note 8) | 10,826 | ||||||
Expense reimbursement due from investment advisor | 81 | ||||||
Prepaid expenses | 291 | ||||||
Total Assets | 18,638,590 | ||||||
Liabilities: | |||||||
Collateral on securities loaned | 424,733 | ||||||
Payable for: | |||||||
Investments purchased | 351,800 | ||||||
Fund shares redeemed | 8,856 | ||||||
Investment advisory fee | 461 | ||||||
Administration fee | 25 | ||||||
Trustees' fees | 10,377 | ||||||
Custody fee | 3,249 | ||||||
Reports to shareholders | 8,252 | ||||||
Chief compliance officer expenses | 170 | ||||||
Other liabilities | 35,327 | ||||||
Total Liabilities | 843,250 | ||||||
Net Assets | $ | 17,795,340 | |||||
Composition of Net Assets: | |||||||
Paid-in capital | $ | 16,941,052 | |||||
Undistributed net investment income | 94,881 | ||||||
Accumulated net realized loss | (858,938 | ) | |||||
Net unrealized appreciation (depreciation) on: | |||||||
Investments | 1,619,744 | ||||||
Foreign currency translations | (1,399 | ) | |||||
Net Assets | $ | 17,795,340 | |||||
Fund Shares Outstanding | 1,085,065 | ||||||
| Net asset value, offering price and redemption price per share | $ | 16.40 | |||||
Statement of Operations
For the Year Ended December 31, 2015
Investment Income: | |||||||
Dividends (net foreign taxes withheld of $36,081) | $ | 379,665 | |||||
Interest | 27,181 | ||||||
Income from securities lending—net | 6,068 | ||||||
Total Investment Income | 412,914 | ||||||
Expenses: | |||||||
Investment advisory fee | 182,489 | ||||||
Transfer agent fees | 168 | ||||||
Administration fee | 9,707 | ||||||
Trustees' fees | 5,163 | ||||||
Custody fees | 16,349 | ||||||
Reports to shareholders | 41,922 | ||||||
Audit fees | 43,578 | ||||||
Legal fees | 3,313 | ||||||
Chief compliance officer expenses | 880 | ||||||
Commitment fee for line of credit (Note 5) | 508 | ||||||
Other expenses | 14,705 | ||||||
Total Expenses | 318,782 | ||||||
Less reimbursement of expenses by Investment Manager | (37,284 | ) | |||||
Net Expenses | 281,498 | ||||||
Net Investment Income | 131,416 | ||||||
Net Realized and Unrealized Gain (Loss) on Investments: | |||||||
Net realized gain (loss) on: | |||||||
Investments | (252,313 | ) | |||||
Foreign currency translations | (15,294 | ) | |||||
Forward foreign currency exchange contracts | 83,928 | ||||||
Net realized loss | (183,679 | ) | |||||
Net change in unrealized appreciation (depreciation) on: | |||||||
Investments | (119,478 | ) | |||||
Foreign currency translations | 139 | ||||||
Forward foreign currency exchange contracts | 6,479 | ||||||
Net change in unrealized depreciation | (112,860 | ) | |||||
Net realized and unrealized loss | (296,539 | ) | |||||
Net Decrease in Net Assets from Operations | $ | (165,123 | ) | ||||
See accompanying notes to financial statements.
13
Wanger International Select 2015 Annual Report
Statements of Changes in Net Assets
Year Ended December 31, | |||||||||||
Increase (Decrease) in Net Assets | 2015 | 2014 | |||||||||
Operations: | |||||||||||
Net investment income | $ | 131,416 | $ | 257,118 | |||||||
Net realized gain (loss) on: | |||||||||||
Investments | (252,313 | ) | 1,432,817 | ||||||||
Foreign currency translations | (15,294 | ) | (12,926 | ) | |||||||
Forward foreign currency exchange contracts | 83,928 | 31,269 | |||||||||
Net change in unrealized appreciation (depreciation) on: | |||||||||||
Investments | (119,478 | ) | (3,148,383 | ) | |||||||
Foreign currency translations | 139 | (1,653 | ) | ||||||||
Forward foreign currency exchange contracts | 6,479 | (10,867 | ) | ||||||||
Options | — | (64,830 | ) | ||||||||
Net Decrease in Net Assets from Operations | (165,123 | ) | (1,517,455 | ) | |||||||
Distributions to Shareholders From: | |||||||||||
Net investment income | (289,467 | ) | (328,166 | ) | |||||||
Net realized gains | (1,261,912 | ) | (1,083,089 | ) | |||||||
Total Distributions to Shareholders | (1,551,379 | ) | (1,411,255 | ) | |||||||
Share Transactions: | |||||||||||
Subscriptions | 993,256 | 2,223,810 | |||||||||
Distributions reinvested | 1,551,379 | 1,411,255 | |||||||||
Redemptions | (3,409,004 | ) | (5,267,340 | ) | |||||||
Net Decrease from Share Transactions | (864,369 | ) | (1,632,275 | ) | |||||||
Proceeds from regulatory settlements (Note 8) | 10,826 | 3,626 | |||||||||
Total Decrease in Net Assets | (2,570,045 | ) | (4,557,359 | ) | |||||||
Net Assets: | |||||||||||
Beginning of period | 20,365,385 | 24,922,744 | |||||||||
End of period | $ | 17,795,340 | $ | 20,365,385 | |||||||
Undistributed (Overdistributed) net investment income | $ | 94,881 | $ | (358,209 | ) | ||||||
See accompanying notes to financial statements.
14
Wanger International Select 2015 Annual Report
Financial Highlights
The following table is intended to help you understand the Fund's financial performance. Certain information reflects financial results for a single share held for the periods shown. Per share net investment income (loss) amounts are calculated based on average shares outstanding during the period. Total return assumes reinvestment of all dividends and distributions, if any. Total return does not reflect payment of the expenses that apply to the variable accounts or contract charges, if any. Total return and portfolio turnover are not annualized for periods of less than one year. The portfolio turnover rate is calculated without regard to purchase and sales transactions of short-term instruments and certain derivatives, if any. If such transactions were included, the Fund's portfolio turnover rate may be higher.
Year Ended December 31, | |||||||||||||||||||||||
Selected data for a share outstanding throughout each period | 2015 | 2014 | 2013 | 2012 | 2011 | ||||||||||||||||||
Net Asset Value, Beginning of Period | $ | 17.93 | $ | 20.45 | $ | 19.83 | $ | 16.44 | $ | 18.57 | |||||||||||||
Income from Investment Operations: | |||||||||||||||||||||||
Net investment income | 0.12 | 0.22 | 0.21 | 0.29 | 0.14 | ||||||||||||||||||
Net realized and unrealized gain (loss) | (0.22 | ) | (1.51 | ) | 2.37 | 3.32 | (1.99 | ) | |||||||||||||||
Total from Investment Operations | (0.10 | ) | (1.29 | ) | 2.58 | 3.61 | (1.85 | ) | |||||||||||||||
Less Distributions to Shareholders: | |||||||||||||||||||||||
Net investment income | (0.27 | ) | (0.29 | ) | (1.22 | ) | (0.22 | ) | (0.28 | ) | |||||||||||||
Net realized gains | (1.17 | ) | (0.94 | ) | (0.74 | ) | — | — | |||||||||||||||
Total Distributions to Shareholders | (1.44 | ) | (1.23 | ) | (1.96 | ) | (0.22 | ) | (0.28 | ) | |||||||||||||
Proceeds from regulatory settlements | 0.01 | 0.00 | (a) | — | — | — | |||||||||||||||||
Net Asset Value, End of Period | $ | 16.40 | $ | 17.93 | $ | 20.45 | $ | 19.83 | $ | 16.44 | |||||||||||||
Total Return | (1.03 | )%(b)(c) | (6.96 | )%(c) | 14.04 | %(b) | 22.00 | % | (10.11 | )%(b) | |||||||||||||
Ratios to Average Net Assets/Supplemental Data: | |||||||||||||||||||||||
Total gross expenses (d) | 1.64 | % | 1.42 | % | 1.51 | % | 1.43 | % | 1.45 | % | |||||||||||||
Total net expenses (d) | 1.45 | % | 1.42 | % | 1.45 | % | 1.42 | %(e) | 1.40 | %(e) | |||||||||||||
Net investment income | 0.68 | % | 1.06 | % | 1.05 | % | 1.57 | % | 0.77 | % | |||||||||||||
Portfolio turnover rate | 72 | % | 61 | % | 74 | % | 58 | % | 44 | % | |||||||||||||
Net assets, end of period (000s) | $ | 17,795 | $ | 20,365 | $ | 24,923 | $ | 24,816 | $ | 24,019 | |||||||||||||
Notes to Financial Highlights
(a) Rounds to zero.
(b) Had the Investment Manager and/or its affiliates not waived a portion of expenses, total return would have been reduced.
(c) The Fund received proceeds from regulatory settlements. Had the Fund not received these proceeds, the total return would have been lower by 0.05%.
(d) In addition to the fees and expenses that the Fund bears directly, the Fund indirectly bears a pro rata share of the fees and expenses of any other funds in which it invests, if any. Such indirect expenses are not included in the Fund's reported expense ratios.
(e) The benefits derived from custody fees paid indirectly had an impact of less than 0.01%.
See accompanying notes to financial statements.
15
Wanger International Select 2015 Annual Report
Notes to Financial Statements
1. Nature of Operations
Wanger International Select (the Fund), a series of Wanger Advisors Trust (the Trust), is registered under the Investment Company Act of 1940, as amended (the 1940 Act), as an open-end management investment company organized as a Massachusetts business trust. The investment objective of the Fund is to seek long-term capital appreciation. The Fund is available only for allocation to certain life insurance company separate accounts established for the purpose of funding participating variable annuity contracts and variable life insurance policies and may also be offered directly to certain qualified pension and retirement plans.
2. Summary of Significant Accounting Policies
Basis of Preparation
The Fund is an investment company that applies the accounting and reporting guidance in the Financial Accounting Standards Board (FASB) Accounting Standards Codification Topic 946, Financial Services—Investment Companies (ASC 946). The financial statements are prepared in accordance with U.S. generally accepted accounting principles (GAAP) which requires management to make certain estimates and assumptions that affect the reported amounts of assets and liabilities, the disclosure of contingent assets and liabilities at the date of the financial statements and the reported amounts of income and expenses during the reporting period. Actual results could differ from those estimates.
The following is a summary of significant accounting policies followed by the Fund in the preparation of its financial statements.
Security valuation
Securities of the Fund are valued at market value or, if a market quotation for a security is not readily available or is deemed not to be reliable because of events or circumstances that have occurred between the market quotation and the time as of which the security is to be valued, the security is valued at its fair value determined in good faith under consistently applied procedures established by the Board of Trustees (the Board). A security traded on a securities exchange or in an over-the-counter market in which transaction prices are reported is valued at the last sales price at the time of valuation. A security traded principally on NASDAQ is valued at the NASDAQ official closing price. Exchange traded funds (ETFs) are valued at their closing net asset value as reported on the applicable exchange. A security for which there is no reported sale on the valuation date is valued at the mean of the latest bid and ask quotations.
Short-term investments maturing in 60 days or less are valued at amortized cost, which approximates market value.
Forward foreign currency exchange contracts are marked-to-market based upon foreign currency exchange rates provided by a pricing service.
The Trust has retained an independent statistical fair value pricing service that employs a systematic methodology to assist in the fair valuation process for securities principally traded in a foreign market in order to adjust for possible changes in value that may occur between the close of the foreign market and the time as of which the securities are to be valued. If a security is valued at a fair value, that value may be different from the last quoted market price for the security.
Foreign currency translations
Values of investments denominated in foreign currencies are converted into U.S. dollars using the New York spot market rate of exchange at the time of valuation. Purchases and sales of investments and dividend and interest income are translated into U.S. dollars using the spot market rate of exchange prevailing on the respective dates of such transactions. The gain or loss resulting from changes in foreign exchange rates is included with net realized and unrealized gain or loss from investments, as appropriate.
Restricted securities
Restricted securities are securities that may only be resold upon registration under federal securities laws or in transactions exempt from registration. In some cases, the
issuer of restricted securities has agreed to register such securities for resale at the issuer's expense either upon demand by the Fund or in connection with another registered offering of the securities. Many restricted securities may be resold in the secondary market in transactions exempt from registration. Such restricted securities may be determined to be liquid under criteria established by the Board.
Derivative instruments
The Fund invests in forward foreign currency exchange contracts on a very limited basis, as detailed below. Forward foreign currency exchange contracts are derivative instruments whose values depend on, or are derived from, in whole or in part, the value of one or more other assets, in this case, currencies. Derivatives may involve various risks, including the potential inability of the counterparty to fulfill its obligation under the terms of the contract, the potential for an illiquid secondary market (making it difficult for the Fund to sell, including at favorable prices) and the potential for market movements which may expose the Fund to gains or losses in excess of the amount shown in the Statement of Assets and Liabilities.
For financial reporting purposes, the Fund does not offset derivative assets and derivative liabilities that are subject to netting arrangements in the Statement of Assets and Liabilities.
Forward foreign currency exchange contracts
Forward foreign currency exchange contracts are agreements between two parties to buy and sell a currency at a set price on a future date. The Fund utilized forward foreign currency exchange contracts to hedge the currency exposure associated with some or all of the Fund's securities. These instruments may be used for other purposes in the future. The Fund's use of forward foreign currency exchange contracts was not material to the net assets of the Fund.
The values of forward foreign currency exchange contracts fluctuate daily with changes in foreign currency exchange rates. Changes in the value of these contracts are recorded as unrealized appreciation or depreciation until the contracts is exercised or has expired. The Fund will realize a gain or loss when the forward foreign currency exchange contract is closed or expires.
The use of forward foreign currency exchange contracts does not eliminate fluctuations in the prices of the Fund's portfolio securities. The risks of forward foreign currency exchange contracts include movement in the values of the foreign currencies relative to the U.S. dollar (or other foreign currencies) and the possibility that counterparties will not complete their contractual obligations, which may be in excess of the amount reflected, if any, in the Statement of Assets and Liabilities.
Effects of derivative transactions in the financial statements
The following tables are intended to provide additional information about the effect of derivatives on the financial statements of the Fund, including: the fair value of derivatives by risk category and the location of those fair values in the Statement of Assets and Liabilities; and the impact of derivative transactions over the period in the Statement of Operations, including realized gains or losses and unrealized gains or losses. The derivative schedules following the Statement of Investments present additional information regarding derivative instruments outstanding at the end of the period, if any.
At December 31, 2015, the Fund had no outstanding derivatives.
The following table indicates the effect of derivative instruments (not considered to be hedging instruments for accounting disclosure purposes) in the Statement of Operations for the year ended December 31, 2015:
Amount of Realized Gain (Loss) on Derivatives Recognized in Income
Risk Exposure Category | Forward Foreign Currency Exchange Contracts | ||||||
Foreign exchange risk | $ | 83,928 | |||||
16
Wanger International Select 2015 Annual Report
Notes to Financial Statements, continued
Change in Unrealized Appreciation (Depreciation) on Derivatives
Recognized in Income
Risk Exposure Category | Forward Foreign Currency Exchange Contracts | ||||||
Foreign exchange risk | $ | 6,479 | |||||
The following table provides a summary of the average outstanding volume by derivative instrument for the year ended December 31 , 2015:
Derivative Instrument | Average unrealized appreciation* | Average unrealized depreciation* | |||||||||
Forward foreign currency exchange contracts | $ | 3,173 | $ | (5,505 | ) | ||||||
* Based on the ending quarterly outstanding amounts for the year ended December 31, 2015.
Security transactions and investment income
Security transactions are accounted for on the trade date (date the order to buy or sell is executed) and dividend income is recorded on the ex-dividend date, except that certain dividends from foreign securities are recorded as soon as the information is available to the Fund. Interest income is recorded on the accrual basis and includes amortization of discounts on debt obligations when required for federal income tax purposes. Realized gains and losses from security transactions are recorded on an identified cost basis.
Awards, if any, from class action litigation related to securities owned may be recorded as a reduction of cost of those securities. If the applicable securities are no longer owned, the proceeds are recorded as realized gains.
The Fund may receive distributions from holdings in equity securities, ETFs, other regulated investment companies (RICs), and real estate investment trusts (REITs), which report information on the tax character of their distributions annually. These distributions are allocated to dividend income, capital gain and return of capital based on actual information reported. Return of capital is recorded as a reduction of the cost basis of securities held. If the Fund no longer owns the applicable securities, return of capital is recorded as a realized gain. With respect to REITs, to the extent actual information has not yet been reported, estimates for return of capital may be made by the Fund's management. Management's estimates are subsequently adjusted when the actual character of the distributions is disclosed by the REITs, which could result in a proportionate change in return of capital to shareholders.
Expenses
General expenses of the Trust are allocated to the Fund and the other series of the Trust based upon relative net assets or other expense allocation methodologies determined by the nature of the expense. Expenses directly attributable to the Fund are charged to the Fund.
Fund share valuation
Fund shares are sold and redeemed on a continuing basis at net asset value. Net asset value per share is determined daily as of the close of trading on the New York Stock Exchange (the Exchange) on each day the Exchange is open for trading by dividing the total value of the Fund's investments and other assets, less liabilities, by the number of Fund shares outstanding.
Securities lending
The Fund may lend securities up to one-third of the value of its total assets to certain approved brokers, dealers and other financial institutions to earn additional income. The Fund retains the benefits of owning the securities, including the economic equivalent of dividends or interest generated by the security. The Fund also receives a fee for the loan. The Fund has the ability to recall the loans at any time and could do so in order to vote proxies or to sell the loaned securities. Each loan is collateralized by cash that exceeded the value of the securities on loan. The market value of the
loaned securities is determined daily at the close of business of the Fund and any additional required collateral is delivered to each Fund on the next business day. The Fund has elected to invest the cash collateral in the Dreyfus Government Cash Management Fund. The income earned from the securities lending program is paid to the Fund, net of any fees remitted to Goldman Sachs Agency Lending, the Fund's lending agent, and borrower rebates. The Fund's investment manager, Columbia Wanger Asset Management, LLC (CWAM), does not retain any fees earned by the lending program. Generally, in the event of borrower default, the Fund has the right to use the collateral to offset any losses incurred. In the event the Fund is delayed or prevented from exercising its right to dispose of the collateral, there may be a potential loss to the Fund. Some of these losses may be indemnified by the lending agent. The Fund bears the risk of loss with respect to the investment of collateral. The net lending income earned by the Fund as of December 31, 2015, is included in the Statement of Operations.
Offsetting of assets and liabilities
The following table presents the Fund's gross and net amount of assets and liabilities available for offset under netting agreements and under a securities lending agreement as well as the related collateral received by the Fund as of December 31, 2015:
Liabilities | Goldman Sachs | ||||||
Collateral on securities loaned | $ | 424,733 | |||||
Total liabilities | 424,733 | ||||||
Total financial and derivative net assets | (424,733 | ) | |||||
Financial instruments | 403,067 | ||||||
Net amount (a) | $ | (21,666 | ) | ||||
(a) Represents the net amount due from/(to) counterparties in the event of default.
Securities lending transactions
The following table indicates the total amount of securities loaned by type, reconciled to gross liability payable upon return of the securities loaned by the Fund as of December 31, 2015:
| Overnight and Continuous | Up to 30 Days | 30 – 90 Days | Greater than 90 Days | Total | |||||||||||||||||||
| Securities lending transactions | |||||||||||||||||||||||
Equity securities | $ | 403,067 | $ | — | $ | — | $ | — | $ | 403,067 | |||||||||||||
| Gross amount of recognized liabilities for securities lending (collateral received) | 424,733 | ||||||||||||||||||||||
| Amounts due to counterparty | $ | 21,666 | |||||||||||||||||||||
Federal income taxes
The Fund has complied with the provisions of the Internal Revenue Code available to regulated investment companies and, in the manner provided therein, distributes substantially all its taxable income, as well as any net realized gain on sales of investments and foreign currency transactions reportable for federal income tax purposes. Accordingly, the Fund paid no federal income taxes and no federal income tax provision was required.
Foreign capital gains taxes
Gains in certain countries may be subject to foreign taxes at the fund level. The Fund accrues for such foreign taxes on realized and unrealized gains at the appropriate rate for each jurisdiction. The amount, if any, is disclosed as a liability on the Statement of Assets and Liabilities.
Distributions to shareholders
Distributions to shareholders are recorded on the ex-dividend date.
17
Wanger International Select 2015 Annual Report
Notes to Financial Statements, continued
Indemnification
In the normal course of business, the Trust on behalf of the Fund enters into contracts that contain a variety of representations and warranties and that provide general indemnities. The Fund's maximum exposure under these arrangements is unknown, as this would involve future claims against the Fund. Also under the Trust's organizational documents, the trustees and officers of the Trust are indemnified against certain liabilities that may arise out of their duties to the Trust. However, based on experience, the Fund expects the risk of loss due to these warranties and indemnities to be remote.
Recent Accounting Pronouncement
Fair Value Measurement (Topic 820), Disclosure for Investments in Certain Entities That Calculate Net Asset Value per Share (or Its Equivalent)
In May 2015, FASB issued Accounting Standards Update (ASU) No. 2015-07, Fair Value Measurement (Topic 820), Disclosure for Investments in Certain Entities That Calculate Net Asset Value per Share (or Its Equivalent). ASU No. 2015-07 changes the disclosure requirements for investments for which fair value is measured using the net asset value per share practical expedient. The disclosure requirements are effective for annual periods beginning after December 15, 2015 and interim periods within those fiscal years. At this time, management is evaluating the implications of this guidance and the impact it will have on the financial statement amounts and footnote disclosures, if any.
3. Federal Tax Information
The timing and character of income and capital gain distributions are determined in accordance with income tax regulations, which may differ from GAAP. Reclassifications are made to the Fund's capital accounts for permanent tax differences to reflect income and gains available for distribution (or available capital loss carryforwards) under income tax regulations.
For the year ended December 31, 2015, permanent book and tax basis differences resulting primarily from proceeds from regulatory settlements, foreign currency transactions, passive foreign investment company (PFIC) holdings, former PFIC holdings, investments in partnerships and distribution reclassifications were identified and reclassified among the components of the Fund's net assets as follows:
| Accumulated Net Investment Income | Accumulated Net Realized Gain (Loss) | Paid-In Capital | |||||||||
| $ | 611,141 | $ | (600,318 | ) | $ | (10,823 | ) | ||||
Net investment income and net realized gains (losses), as disclosed on the Statement of Operations, and net assets were not affected by this reclassification.
The tax character of distributions paid during the years ended December 31, 2015 and December 31, 2014 were as follows:
December 31, 2015 | December 31, 2014 | ||||||||||
Ordinary Income* | $ | 304,469 | $ | 328,166 | |||||||
Long-Term Capital Gains | 1,246,910 | 1,083,089 | |||||||||
* For tax purposes short-term capital gain distributions, if any, are considered ordinary income distributions.
As of December 31, 2015, the components of distributable earnings on a tax basis were as follows:
| Undistributed Ordinary Income | Capital Loss Carryforwards | Net Unrealized Appreciation (Depreciation)* | |||||||||
| $ | 105,176 | $ | (849,051 | ) | $ | 1,609,857 | |||||
* The differences between book-basis and tax-basis net unrealized appreciation (depreciation) are primarily due to deferral of losses from wash sales and PFIC adjustments.
The following capital loss carryforward, determined as of December 31, 2015, may be available to reduce taxable income arising from future net realized gains on investments, if any, to the extent permitted by the Internal Revenue Code:
| Year of Expiration | Amount | ||||||
No expiration—short-term | $ | 849,051 | |||||
Management is required to determine whether a tax position of the Fund is more likely than not to be sustained upon examination by the applicable taxing authority, including resolution of any related appeals or litigation processes, based on the technical merits of the position. The tax benefit to be recognized by the Fund is measured as the largest amount of benefit that is greater than fifty percent likely of being realized upon ultimate settlement. Management is not aware of any tax positions in the Fund for which it is reasonably possible that the total amounts of unrecognized tax benefits will significantly change in the next twelve months. However, management's conclusions may be subject to review and adjustment at a later date based on factors including, but not limited to, new tax laws, regulations, and administrative interpretations (including relevant court decisions). The Fund's federal tax returns for the prior three fiscal years remain subject to examination by the Internal Revenue Service.
4. Transactions with Affiliates
CWAM is a wholly owned subsidiary of Columbia Management Investment Advisers, LLC (Columbia Management), which in turn is a wholly owned subsidiary of Ameriprise Financial, Inc. (Ameriprise Financial). CWAM furnishes continuing investment supervision to the Fund and is responsible for the overall management of the Fund's business affairs.
CWAM receives a monthly advisory fee based on the Fund's average daily net assets at the following annual rates:
Average Daily Net Assets | Annual Fee Rate | ||||||
Up to $500 million | 0.94 | % | |||||
| $500 million and over | 0.89 | % | |||||
For the year ended December 31, 2015, the effective investment advisory fee rate, net of fee waivers, was 0.94% of the Fund's average daily net assets.
Through April 30, 2016, CWAM has contractually agreed to bear a portion of the Fund's expenses so that its ordinary operating expenses (excluding transaction costs and certain other investment-related expenses, interest and fees on borrowings and expenses associated with the Fund's investment in other investment companies, if any), after giving effect to any balance credits from the Fund's custodian, do not exceed the annual rate of 1.45% of the Fund's average daily net assets. The reimbursement to the Fund for the year ended December 31, 2015, was $37,284.
CWAM provides administrative services and receives an administration fee from the Fund at the following annual rates:
| Wanger Advisors Trust Aggregate Average Daily Net Assets of the Trust | Annual Fee Rate | ||||||
Up to $4 billion | 0.05 | % | |||||
$4 billion to $6 billion | 0.04 | % | |||||
$6 billion to $8 billion | 0.03 | % | |||||
| $8 billion and over | 0.02 | % | |||||
For the year ended December 31, 2015, the effective administration fee rate was 0.05% of the Fund's average daily net assets. CWAM has delegated to Columbia Management responsibility to provide certain sub-administrative services to the Fund.
Columbia Management Investment Distributors, Inc. (CMID), a wholly owned subsidiary of Ameriprise Financial, serves as the Fund's distributor and principal underwriter.
Columbia Management Investment Services Corp. (CMIS), a wholly owned subsidiary of Ameriprise Financial, is the transfer agent to the Fund. For its services, the Fund pays CMIS a monthly fee at the annual rate of $21.00 per open account. CMIS also receives reimbursement from the Fund for certain out-of-pocket expenses.
18
Wanger International Select 2015 Annual Report
Notes to Financial Statements, continued
Certain officers and trustees of the Trust are also officers of CWAM. The Trust makes no direct payments to its officers and trustees who are affiliated with CWAM.
The Board has appointed a Chief Compliance Officer of the Trust in accordance with federal securities regulations. The Fund, along with other affiliated funds, pays its pro-rata share of the expenses associated with the office of the Chief Compliance Officer.
The Trust offers a deferred compensation plan for its independent trustees. Under that plan, a trustee may elect to defer all or a portion of his or her compensation. Amounts deferred are retained by the Trust and may represent an unfunded obligation of the Trust. The value of amounts deferred is determined by reference to the change in value of Class Z shares of one or more series of Columbia Acorn Trust or a money market fund as specified by the trustee. Benefits under the deferred compensation plan are payable in accordance with the plan.
For the year ended December 31, 2015, the Fund engaged in purchase and sales transactions with funds that have a common investment manager (or affiliated investment managers), common directors/trustees, and/or common officers. Those purchase and sale transactions complied with provisions of Rule 17a-7 under the Investment Company Act of 1940 and were $530,431 and $312,512, respectively. The sale transactions resulted in a net realized gain of $23,356.
5. Borrowing Arrangements
During the period January 1, 2015 through April 29, 2015, the Trust participated in a credit facility with JPMorgan Chase Bank, N.A., along with Columbia Acorn Trust, another trust managed by CWAM, in the amount of $150 million. Effective April 30, 2015, the first facility was terminated and the Trust entered into a revolving credit facility in the amount of $400 million with a syndicate of banks led by JPMorgan Chase Bank, N.A. to facilitate portfolio liquidity. Under each facility, interest is charged to each participating Fund based on its borrowings at a rate per annum equal to the Federal Funds Rate plus 1.00%. In addition, a commitment fee of 0.08% per annum of the unutilized line of credit is accrued and apportioned among the participating Funds based on their relative net assets. The commitment fee is disclosed as a part of "Other expenses" in the Statement of Operations. The Trust expects to renew this line of credit for one year durations each April at then current market rates and terms.
No amounts were borrowed for the benefit of the Fund under the line of credit during the year ended December 31, 2015.
6. Fund Share Transactions
Proceeds and payments on Fund shares as shown in the Statement of Changes in Net Assets are in respect of the following numbers of shares:
| Year Ended December 31, 2015 | Year Ended December 31, 2014 | ||||||||||
Shares sold | 55,516 | 109,349 | |||||||||
| Shares issued in reinvestment of dividend distributions | 88,217 | 69,611 | |||||||||
Less shares redeemed | (194,679 | ) | (261,572 | ) | |||||||
Net decrease in shares outstanding | (50,946 | ) | (82,612 | ) | |||||||
7. Investment Transactions
The aggregate cost of purchases and proceeds from sales other than short-term obligations for the year ended December 31, 2015, were $12,660,224 and $13,953,413, respectively. The amount of purchase and sales activity impacts the portfolio turnover rate reported in the Financial Highlights.
8. Regulatory Settlements with Third Parties
During the year ended December 31, 2015, the Fund recorded a receivable of $10,826 and during the year ended December 31, 2014, the Fund received $3,626 as a result of a regulatory settlement proceedings brought by the Securities and Exchange Commission against an unaffiliated third party relating to market timing and/or late trading of mutual funds. These amounts represented the Fund's portion of the proceeds from the settlement (neither the Fund nor the Investment Manager were
a party to the proceeding). The payments have been included in "Proceeds from regulatory settlements" in the Statement of Changes in Net Assets.
9. Shareholder Concentration
At December 31, 2015, three unaffiliated shareholder accounts owned an aggregate of 100.0% of the outstanding shares of the Fund. The Fund has no knowledge about whether any portion of those shares was owned beneficially by such accounts. Subscription and redemption activity by concentrated accounts may have a significant effect on the operations of the Fund.
10. Subsequent Events
Management has evaluated the events and transactions that have occurred through the date the financial statements were issued. Other than as noted below, there were no items requiring adjustment of the financial statements or additional disclosure.
The Board of Trustees of Wanger Advisors Trust has approved a Plan of Liquidation and Termination (the Plan) pursuant to which the Fund will be liquidated and terminated. Under the terms of the Plan, it is anticipated that the liquidation of the Fund will occur on or about April 29, 2016.
11. Information Regarding Pending and Settled Legal Proceedings
Ameriprise Financial and certain of its affiliates have historically been involved in a number of legal, arbitration and regulatory proceedings, including routine litigation, class actions, and governmental actions, concerning matters arising in connection with the conduct of their business activities. Ameriprise Financial believes that the Fund is not currently the subject of, and that neither Ameriprise Financial nor any of its affiliates are the subject of, any pending legal, arbitration or regulatory proceedings that are likely to have a material adverse effect on the Fund or the ability of Ameriprise Financial or its affiliates to perform under their contracts with the Funds. Ameriprise Financial is required to make quarterly (10-Q), annual (10-K) and, as necessary, 8-K filings with the Securities and Exchange Commission on legal and regulatory matters that relate to Ameriprise Financial and its affiliates. Copies of these filings may be obtained by accessing the SEC website at www.sec.gov.
There can be no assurance that these matters, or the adverse publicity associated with them, will not result in increased fund redemptions, reduced sale of fund shares or other adverse consequences to the Fund. Further, although we believe proceedings are not likely to have a material adverse effect on the Fund or the ability of Ameriprise Financial or its affiliates to perform under their contracts with the Fund, these proceedings are subject to uncertainties and, as such, we are unable to estimate the possible loss or range of loss that may result. An adverse outcome in one or more of these proceedings could result in adverse judgments, settlements, fines, penalties or other relief that could have a material adverse effect on the consolidated financial condition or results of operations of Ameriprise Financial.
19
Wanger International Select 2015 Annual Report
Report of Independent Registered Public Accounting Firm
To the Board of Trustees and Shareholders of Wanger International Select:
In our opinion, the accompanying statement of assets and liabilities, including the statement of investments, and the related statements of operations and of changes in net assets and the financial highlights present fairly, in all material respects, the financial position of Wanger International Select (a series of the Wanger Advisors Trust, hereinafter referred to as the "Fund") at December 31, 2015, the results of its operations for the year then ended, the changes in its net assets for each of the two years in the period then ended and the financial highlights for each of the five years in the period then ended, in conformity with accounting principles generally accepted in the United States of America. These financial statements and financial highlights (hereafter referred to as "financial statements") are the responsibility of the Fund's management; our responsibility is to express an opinion on these financial statements based on our audits. We conducted our audits of these financial statements in accordance with the standards of the Public Company Accounting Oversight Board (United States). Those standards require that we plan and perform the audit to obtain reasonable assurance about whether the financial statements are free of material misstatement. An audit includes examining, on a test basis, evidence supporting the amounts and disclosures in the financial statements, assessing the accounting principles used and significant estimates made by management, and evaluating the overall financial statement presentation. We believe that our audits, which included confirmation of securities at December 31, 2015 by correspondence with the custodian and brokers, provide a reasonable basis for our opinion. As disclosed in Note 10 to the financial statements, Wanger International Select will liquidate on or about April 29, 2016.
PricewaterhouseCoopers LLP
Chicago, Illinois
February 18, 2016
20
Wanger International Select 2015 Annual Report
Federal Income Tax Information (Unaudited)
The Fund hereby designates the following tax attributes in the fiscal year ended December 31, 2015.
Tax Designations | |||||||
Dividends Received Deduction | 1.28 | % | |||||
Foreign Taxes Paid | $ | 23,604 | |||||
Foreign Taxes Paid Per Share | $ | 0.02 | |||||
Foreign Source Income | $ | 451,250 | |||||
Foreign Source Income Per Share | $ | 0.42 | |||||
Dividends Received Deduction. The percentage of ordinary income distributed during the fiscal year that qualifies for the corporate dividends received deduction.
Foreign Taxes. The Fund makes the election to pass through to shareholders the foreign taxes paid. Eligible shareholders may claim a foreign tax credit. These taxes, and the corresponding foreign source income, are provided.
21
Wanger International Select 2015 Annual Report
Board of Trustees and Management of Wanger Advisors Trust
Each trustee may serve a term of unlimited duration. The Trust's Bylaws generally require that a trustee retire at the end of the calendar year in which the trustee attains the age of 75 years. The trustees appoint their own successors, provided that at least two-thirds of the trustees, after such appointment, have been elected by shareholders. Shareholders may remove a trustee, with or without cause, upon the vote of two-thirds of the Trust's outstanding shares at any meeting called for that purpose. A trustee may be removed, with or without cause, upon the vote of a majority of the trustees. The names of the trustees and officers of the Trust, the date each was first elected or appointed to office and the principal business occupations of each during at least the last five years, and for the trustees, the number of portfolios in the fund complex they oversee and other directorships they hold, are shown below. Each trustee and officer serves in such capacity for each of the four series of Wanger Advisors Trust and for each of the eight series of Columbia Acorn Trust.
The address for the trustees and officers of the Trust is Columbia Wanger Asset Management, LLC, 227 West Monroe Street, Suite 3000, Chicago, Illinois 60606. The Funds' Statement of Additional Information includes additional information about the Funds' trustees and officers. You may obtain a free copy of the Statement of Additional Information by writing or calling toll-free:
Columbia Wanger Asset Management, LLC
Shareholder Services Group
227 W. Monroe, Suite 3000
Chicago IL 60606
1-800-922-6769
| Name and Age at December 31, 2015 | Year First Appointed or Elected to a Board in the Columbia Funds Complex | Principal Occupation(s) During the Past Five Years | Number of Funds in the Columbia Funds Complex Overseen (1) | Other Directorships Held by the Trustee During the Past Five Years in Addition to Columbia Acorn Trust and Wanger Advisors Trust | |||||||||||||||
Independent Trustees: | |||||||||||||||||||
| Laura M. Born, 50, Chair | 2007 | Adjunct Associate Professor of Finance, University of Chicago Booth School of Business since 2007; Director, Carlson Inc. (private global hospitalities and travel company) since 2015; Managing Director—Investment Banking, JP Morgan Chase & Co. (broker-dealer) 2002-2007. | 12 | None. | |||||||||||||||
| Maureen M. Culhane, 67 | 2007 | Retired. Formerly, Vice President, Goldman Sachs Asset Management, L.P. (investment adviser), 2005-2007; Vice President (Consultant)—Strategic Relationship Management, Goldman, Sachs & Co., 1999-2005. | 12 | None. | |||||||||||||||
| Margaret M. Eisen, 62 | 2002 | Trustee, Smith College since 2012; Chief Investment Officer, EAM International LLC (corporate finance and asset management), 2003-2013; Managing Director, CFA Institute, 2005-2008. | 12 | Burnham Investors Trust (3 series). | |||||||||||||||
| Thomas M. Goldstein, 56 | 2014 | Retired. Formerly, Chief Financial Officer, Allstate Protection Division, 2011-2014; Founding Partner, The GRG Group LLC, 2009-2011; Managing Director and Chief Financial Officer, Madison Dearborn Partners, 2007-2009. | 12 | Federal Home Loan Bank—Chicago; Federal Home Loan Mortgage Corporation. | |||||||||||||||
| John C. Heaton, 56 | 2010 | Deputy Dean for Faculty, University of Chicago Booth School of Business; Joseph L. Gidwitz Professor of Finance, University of Chicago Booth School of Business since July 2000. | 12 | None. | |||||||||||||||
| Steven N. Kaplan, 56 | 1999 | Neubauer Family Distinguished Service Professor of Entrepreneurship and Finance, University of Chicago Booth School of Business; faculty member of the University of Chicago Booth School of Business since 1988. | 12 | Accretive Health, Inc. (healthcare management services provider); Morningstar, Inc. (provider of independent investment research). | |||||||||||||||
| Charles R. Phillips, 59 | 2015 | Retired. Director, University of North Carolina School of Law Foundation since 2010. Formerly, Vice Chairman, J.P. Morgan Private Bank, 2011-2014; Managing Director, J.P. Morgan Private Bank, 2001-2011. | 12 | None. | |||||||||||||||
22
Wanger International Select 2015 Annual Report
Board of Trustees and Management of Wanger Advisors Trust
| Name and Age at December 31, 2015 | Year First Appointed or Elected to a Board in the Columbia Funds Complex | Principal Occupation(s) During the Past Five Years | Number of Funds in the Columbia Funds Complex Overseen (1) | Other Directorships Held by the Trustee During the Past Five Years in Addition to Columbia Acorn Trust and Wanger Advisors Trust | |||||||||||||||
| David J. Rudis, 62, Vice Chair | 2010 | Retired. Formerly, National Checking and Debit Executive, and Illinois President, Bank of America, 2007-2009; President, Consumer Banking Group, LaSalle National Bank, 2004-2007. | 12 | None. | |||||||||||||||
Interested Trustees: | |||||||||||||||||||
| P. Zachary Egan, 47 (2) | 2015 | President, CWAM and President, Wanger Advisors Trust and Columbia Acorn Trust since April 2014; Global Chief Investment Officer, CWAM since October 2015; International Chief Investment Officer, CWAM, April 2014-September 2015; Director of International Research, CWAM, December 2004-March 2014; Vice President of Columbia Acorn Trust, 2003-2014, and Wanger Advisors Trust, 2007-2014; portfolio manager and analyst, CWAM or its predecessors, since 1999. | 12 | None. | |||||||||||||||
| Ralph Wanger, 81 (3) | 1970 | (4) | Founder, CWAM. Formerly, President, Chief Investment Officer and portfolio manager, CWAM or its predecessors, July 1992-September 2003; Director, Wanger Investment Company PLC; Consultant to CWAM or its predecessors, September 2003-September 2005. | 12 | None. | ||||||||||||||
* * * * *
| Name at Age at December 31, 2015 | Position Held with Columbia Acorn Trust and Wanger Advisors Trust | Year First Appointed or Elected to Office | Principal Occupation(s) During the Past Five Years | ||||||||||||
Officers: | |||||||||||||||
| Alan G. Berkshire, 55 | Vice President | 2015 | Chief Operating Officer, CWAM since April 2015. Formerly, Independent Director, ValueQuest India Moat Fund Limited (Mauritius), April 2014-March 2015; President—North America, Religare Global Asset Management, Inc., June 2011-November 2013; Partner, Estancia Capital Management LLC, September 2009-June 2011. | ||||||||||||
| Michael G. Clarke, 46 | Assistant Treasurer | 2004 | Vice President—Mutual Fund Administration, Columbia Management Investment Advisers, LLC since May 2010; Managing Director of Fund Administration, Columbia Management Advisors, LLC, September 2004-April 2010; Senior officer of Columbia funds and affiliated funds since 2002. | ||||||||||||
| William J. Doyle, 51 | Vice President | 2014 | Portfolio manager and/or analyst, CWAM or its predecessors since 2006; Vice President, Columbia Acorn Trust and Wanger Advisors Trust since 2014. | ||||||||||||
| P. Zachary Egan, 47 (2) | President | 2007 | President, CWAM and President, Wanger Advisors Trust and Columbia Acorn Trust since April 2014; Global Chief Investment Officer, CWAM since October 2015; International Chief Investment Officer, CWAM, April 2014-September 2015; Director of International Research, CWAM, December 2004-March 2014; Vice President of Columbia Acorn Trust, 2003-2014, and Wanger Advisors Trust, 2007-2014; portfolio manager and analyst, CWAM or its predecessors, since 1999. | ||||||||||||
| David L. Frank, 52 | Vice President | 2014 | Portfolio manager and/or analyst, CWAM or its predecessors since 2002; Vice President, Columbia Acorn Trust and Wanger Advisors Trust since 2014. | ||||||||||||
| Paul B. Goucher, 47 | Assistant Secretary | 2015 | Vice President and Lead Chief Counsel, Ameriprise Financial, Inc. since November 2008 and January 2013, respectively (previously Chief Counsel, January 2010-January 2013 and Group Counsel, November 2008-January 2010). | ||||||||||||
| Fritz Kaegi, 44 | Vice President | 2011 | Portfolio manager and/or analyst, CWAM or its predecessors since 2004; Vice President, Columbia Acorn Trust and Wanger Advisors Trust since 2011. | ||||||||||||
23
Wanger International Select 2015 Annual Report
Board of Trustees and Management of Wanger Advisors Trust
| Name at Age at December 31, 2015 | Position Held with Columbia Acorn Trust and Wanger Advisors Trust | Year First Appointed or Elected to Office | Principal Occupation(s) During the Past Five Years | ||||||||||||
| John Kunka, 45 | Treasurer | 2006 | Treasurer and Principal Accounting and Financial Officer, Columbia Acorn Trust and Wanger Advisors Trust since 2014; Director of Accounting and Operations, CWAM since May 2006; formerly, Assistant Treasurer, Columbia Acorn Trust and Wanger Advisors Trust 2006-2014. | ||||||||||||
| Stephen Kusmierczak, 48 | Vice President | 2011 | Portfolio manager and/or analyst, CWAM or its predecessors since 2001; Vice President, Columbia Acorn Trust and Wanger Advisors Trust since 2011. | ||||||||||||
| Joseph C. LaPalm, 46 | Vice President | 2006 | Chief Compliance Officer, CWAM since 2005. | ||||||||||||
| Ryan C. Larrenaga, 45 | Assistant Secretary | 2015 | Vice President and Group Counsel, Ameriprise Financial, Inc. since August 2011 (previously, Counsel, May 2010-August 2011); Assistant General Counsel, Bank of America, 2005-April 2010; officer of Columbia funds and affiliated funds since 2005. | ||||||||||||
| Satoshi Matsunaga, 44 | Vice President | 2015 | Portfolio manager and/or analyst, CWAM or its predecessors since 2005; Vice President, Columbia Acorn Trust and Wanger Advisors Trust since 2015. | ||||||||||||
| Thomas P. McGuire, 43 | Chief Compliance Officer | 2015 | Chief Compliance Officer of the Columbia family of mutual funds for which Columbia Management Investment Advisers, LLC serves as investment adviser since 2012; Vice President—Asset Management Compliance, Ameriprise Financial, Inc., since May 2010; Chief Compliance Officer, Ameriprise Certificate Company since September 2010; Compliance Executive, Bank of America, 2005-April 2010. | ||||||||||||
| Charles P. McQuaid, 62 | Vice President | 1992 | (4) | Portfolio manager and/or analyst, CWAM or its predecessors since 1978; Vice President, Columbia Acorn Trust and Wanger Advisors Trust since April 2014; President and Chief Investment Officer, CWAM or its predecessors, October 2003-March 2014, and President, Columbia Acorn Trust and Wanger Advisors Trust, October 2003-March 2014. | |||||||||||
| Louis J. Mendes III, 51 | Vice President | 2003 | International Director of Research, CWAM, since 2015; portfolio manager and/or analyst, CWAM or its predecessors since 2001; Vice President, Columbia Acorn Trust since 2003 and Wanger Advisors Trust since 2005. | ||||||||||||
| Christopher J. Olson, 51 | Vice President | 2001 | Portfolio manager and/or analyst, CWAM or its predecessors since January 2001; Vice President, Columbia Acorn Trust and Wanger Advisors Trust since 2001. | ||||||||||||
| Julian Quero, 48 | Assistant Treasurer | 2015 | Vice President—Tax, Columbia Management Investment Advisers, LLC since 2009. | ||||||||||||
| Matthew S. Szafranski, 38 | Vice President | 2015 | Portfolio manager and/or analyst, CWAM or its predecessors since 2008; Vice President, Columbia Acorn Trust and Wanger Advisors Trust since 2015. | ||||||||||||
| Andreas Waldburg-Wolfegg, 50 | Vice President | 2011 | Portfolio manager and/or analyst, CWAM or its predecessors since 2002; Vice President, Columbia Acorn Trust and Wanger Advisors Trust since 2011. | ||||||||||||
| Linda Roth-Wiszowaty, 46 | Secretary | 2006 | Business support analyst, CWAM since April 2007; Secretary, Columbia Acorn Trust and Wanger Advisors Trust since 2014; Assistant Secretary, Columbia Acorn Trust and Wanger Advisors Trust, 2006-2014. | ||||||||||||
(1) The Trustees oversee the series of Wanger Advisors Trust and Columbia Acorn Trust.
(2) Mr. Egan is an "interested person" of Wanger Advisors Trust, Columbia Acorn Trust, and CWAM, as defined in the 1940 Act, because he is an officer of each Trust and an employee of CWAM.
(3) As permitted under the Trust's Bylaws, Mr. Wanger serves as a non-voting Trustee Emeritus of Wanger Advisors Trust and Columbia Acorn Trust.
(4) Dates prior to 1992 relate to The Acorn Fund, Inc., the predecessor trust to Columbia Acorn Trust.
24
Wanger International Select 2015 Annual Report
Columbia Wanger Funds
Trustees
Laura M. Born, Chair of the Board
David J. Rudis, Vice Chair of the Board
Maureen M. Culhane
P. Zachary Egan
Margaret M. Eisen
Thomas M. Goldstein
John C. Heaton
Charles R. Phillips
Steven N. Kaplan
Ralph Wanger (Trustee Emeritus)
Officers
P. Zachary Egan
President
Alan G. Berkshire
Vice President
Michael G. Clarke
Assistant Treasurer
William J. Doyle
Vice President
David L. Frank
Vice President
Paul B. Goucher
Assistant Secretary
Fritz Kaegi
Vice President
John M. Kunka
Treasurer and Principal
Financial and
Accounting Officer
Stephen Kusmierczak
Vice President
Joseph C. LaPalm
Vice President
Ryan C. Larrenaga
Assistant Secretary
Satoshi Matsunaga
Vice President
Thomas P. McGuire
Chief Compliance Officer
Charles P. McQuaid
Vice President
Louis J. Mendes
Vice President
Christopher J. Olson
Vice President
Julian Quero
Assistant Treasurer
Matthew S. Szafranski
Vice President
Andreas Waldburg-Wolfegg
Vice President
Linda K. Roth-Wiszowaty
Secretary
Investment Manager
Columbia Wanger Asset Management, LLC
227 West Monroe Street, Suite 3000
Chicago, Illinois 60606
1-888-4-WANGER
(1-888-492-6437)
Transfer Agent,
Dividend Disbursing Agent
Columbia Management Investment Services Corp.
P.O. Box 8081
Boston, Massachusetts
02266-8081
Distributor
Columbia Management Investment Distributors, Inc.
225 Franklin Street
Boston, Massachusetts
02110
Legal Counsel to the Funds
Perkins Coie LLP
Washington, DC
Legal Counsel to the Independent Trustees
Drinker Biddle & Reath LLP
Philadelphia, Pennsylvania
Independent Registered Public Accounting Firm
PricewaterhouseCoopers LLP
Chicago, Illinois
This document contains Global Industry Classification Standard data. The Global Industry Classification Standard ("GICS") was developed by and is the exclusive property and a service mark of MSCI Inc. ("MSCI") and Standard & Poor's Financial Services LLC ("S&P") and is licensed for use by Columbia Wanger Asset Management, LLC ("CWAM"). Neither MSCI, S&P, nor any other party involved in making or compiling the GICS or any GICS classifications makes any express or implied warranties or representations with respect to such standard or classification (or the results to be obtained by the use thereof), and all such parties hereby expressly disclaim all warranties of originality, accuracy, completeness, merchantability and fitness for a particular purpose with respect to any of such standard or classification. Without limiting any of the foregoing, in no event shall MSCI, S&P, any of their affiliates or any third party involved in making or compiling the GICS or any GICS classifications have any liability for any direct, indirect, special, punitive, consequential or any other damages (including lost profits) even if notified of the possibility of such damages.
This report, including the schedules of investments and financial statements, is submitted for the general information of the shareholders of the Wanger Advisors Trust.
A description of the Fund's proxy voting policies and procedures and a copy of the Fund's voting record for the most recent 12-month period ended June 30 are available (i) on our website, columbiathreadneedle.com/us, (ii) on the Securities and Exchange Commission's website at www.sec.gov, and (iii) without charge, upon request, by calling 888-492-6437.
The Fund files a complete schedule of portfolio holdings with the SEC for the first and third quarters of each fiscal year on Form N-Q. The Fund's Form N-Q is available on the SEC's website at www.sec.gov and may be reviewed and copied at the SEC's Public Reference Room in Washington, D.C. Information on the operation of the Pubic Reference Room may be obtained by calling 800-SEC-0330. The Fund's complete portfolio holdings are disclosed at www.columbiathreadneedle.com/us approximately 30 to 40 days after each month-end.

COLUMBIA WANGER FUNDS
© 2016 Columbia Management Investment Advisers, LLC. All rights reserved. C-1451 G (2/16) 1422024

ANNUAL REPORT
December 31, 2015

COLUMBIA WANGER FUNDS
Managed by Columbia Wanger Asset Management, LLC
WANGER SELECT

Wanger Select
2015 Annual Report
Table of Contents
| 2 | Understanding Your Expenses | ||||||
| 3 | Behavioral Economics | ||||||
| 6 | Performance Review | ||||||
| 8 | Statement of Investments | ||||||
| 12 | Statement of Assets and Liabilities | ||||||
| 12 | Statement of Operations | ||||||
| 13 | Statement of Changes in Net Assets | ||||||
| 14 | Financial Highlights | ||||||
| 15 | Notes to Financial Statements | ||||||
| 19 | Report of Independent Registered Public Accounting Firm | ||||||
| 20 | Federal Income Tax Information (Unaudited) | ||||||
21 | Board of Trustees and Management of Wanger Advisors Trust | ||||||
Columbia Wanger Asset Management, LLC (CWAM) is one of the leading global small- and mid-cap equity managers in the United States with over 40 years of small- and mid-cap investment experience. As of December 31, 2015, CWAM managed $20 billion in assets. CWAM is the investment manager to Wanger USA, Wanger International, Wanger Select and Wanger International Select (together, the Columbia Wanger Funds) and the Columbia Acorn Family of Funds.
An important note: Columbia Wanger Funds are available only through variable annuity contracts and variable life insurance policies issued by participating insurance companies or certain eligible retirement plans. Columbia Wanger Funds are not offered directly to the public and are not available in all contracts, policies or plans. Contact your financial advisor or insurance representative for more information. Columbia Wanger Funds are distributed by Columbia Management Investment Distributors, Inc., member FINRA, and are managed by CWAM.
Investors should carefully consider investment objectives, risks and expenses of the Fund before investing. For variable fund and variable contract prospectuses, which contain this and other important information, including the fees and expenses imposed under your contract, investors should contact their financial advisor or insurance representative. Read the prospectus for the Fund and your variable contract carefully before investing.
The views expressed in "Behavioral Economics" and in the Performance Review reflect the current views of the respective authors. These views are not guarantees of future performance and involve certain risks, uncertainties and assumptions that are difficult to predict, so actual outcomes and results may differ significantly from the views expressed. These views are subject to change at any time based upon economic, market or other conditions and the respective parties disclaim any responsibility to update such views. These views may not be relied on as investment advice and, because investment decisions for a Columbia Wanger Fund are based on numerous factors, may not be relied on as an indication of trading intent on behalf of any particular Columbia Wanger Fund. References to specific company securities should not be construed as a recommendation or investment advice.
1
Wanger Select 2015 Annual Report
Understanding Your Expenses
As a shareholder, you incur three types of costs. There are transaction costs, which generally include sales charges on purchases and may include redemption fees. There are also ongoing costs, which generally include management fees and other expenses for Wanger Select (the Fund). Lastly, there may be additional fees or charges imposed by the insurance company that sponsors your variable annuity and/or variable life insurance product. The following information is intended to help you understand your ongoing costs (in dollars) of investing in the Fund and to help you compare these costs with the ongoing costs of investing in other mutual funds.
Analyzing your Fund's expenses
To illustrate these ongoing costs, we have provided an example and calculated the expenses paid by investors in the Fund during the period. The actual and hypothetical information in the table below is based on an initial investment of $1,000 at the beginning of the period indicated and held for the entire period. Expense information is calculated two ways and each method provides you with different information. The amount listed in the "Actual" column is calculated using the Fund's actual operating expenses and total return for the period. You may use the Actual information, together with the amount invested, to estimate the expenses that you paid over the period. Simply divide your account value by $1,000 (for example, an $8,600 account value divided by $1,000 = 8.6), then multiply the results by the expenses paid during the period under the Actual column. The amount listed in the "Hypothetical" column assumes a 5% annual rate of return before expenses (which is not the Fund's actual return) and then applies the Fund's actual expense ratio for the period to the hypothetical return. You should not use the hypothetical account values and expenses to estimate either your actual account balance at the end of the period or the expenses you paid during the period. See "Compare with other funds" below for details on how to use the hypothetical data.
Compare with other funds
Since all mutual funds are required to include the same hypothetical calculations about expenses in shareholder reports, you can use this information to compare the ongoing cost of investing in the Fund with other funds. To do so, compare the hypothetical example with the 5% hypothetical examples that appear in the shareholder reports of other funds. As you compare hypothetical examples of other funds, it is important to note that hypothetical examples are meant to highlight the ongoing cost of investing in a fund only and do not reflect any transaction costs, such as sales charges, redemption or exchange fees. Therefore, the hypothetical calculations are useful in comparing ongoing costs only, and will not help you determine the relative total costs of owning different funds. If transaction costs were included in these calculations, your costs would be higher.
July 1, 2015 – December 31, 2015
| Account value at the beginning of the period ($) | Account value at the end of the period ($) | Expenses paid during period ($) | Fund's annualized expense ratio (%)* | ||||||||||||||||||||||||||||
Actual | Hypothetical | Actual | Hypothetical | Actual | Hypothetical | ||||||||||||||||||||||||||
Wanger Select | 1,000.00 | 1,000.00 | 946.10 | 1,021.17 | 3.92 | 4.08 | 0.80 | ||||||||||||||||||||||||
* Expenses paid during the period are equal to the Fund's annualized expense ratio, multiplied by the average account value over the period, then multiplied by the number of days in the Fund's most recent fiscal half-year and divided by 365.
Had the investment manager and/or certain of its affiliates not waived/reimbursed certain fees and expenses, account value at the end of the period would have been reduced. See Note 4 to the Financial Statements.
It is important to note that the expense amounts shown in the table are meant to highlight only ongoing costs of investing in the Fund. Expenses paid during the period do not include any insurance charges imposed by your insurance company's separate account. The hypothetical example provided is useful in comparing ongoing costs only and will not help you determine the relative total costs of owning different funds whose shareholders may incur transaction costs.
2
Wanger Select 2015 Annual Report
Behavioral Economics
People Occasionally Behave Irrationally
Economists have traditionally assumed that people rationally optimize in their own self-interest. A free-market economy dominated by "homo economicus" prospers as producers of goods and services trade with each other, as if driven by an invisible hand. In the past few decades, however, behavioral economics has emerged, refuting the rational optimization assumption. Nobel Prize winning Princeton professor Daniel Kahneman's book Thinking, Fast and Slow explains the habits and biases that cause people to make predictable errors.
Illustrating that people tend to make quick, intuitive decisions rather than well thought out ones, Kahneman asked Ivy League students the following question: A bat and a ball cost $1.10. The bat costs $1.00 more than the ball. How much does the ball cost? Over half of students answered $0.10, though the correct answer is $0.05.
Kahneman also points out that people generally have a confirmation bias.1 Good scientific method calls for people to test a hypothesis by attempting to refute it, but instead people seek data that confirms their beliefs. We would rather keep our beliefs than seriously analyze and challenge them.
Individuals also exhibit an anchoring effect. Kahneman and his associate Amos Tversky devised several experiments that first provided a high or low number (from a rigged "wheel of fortune" or in a text) and then asked for best-guess estimates for unrelated data. Subjects who were provided high numbers gave high estimates and vice versa. People tend to "anchor" on an initial number provided and then move toward an unbiased estimate. When the Exploratorium Museum in San Francisco polled visitors about contributing to a particular cause without providing a suggested contribution amount, visitors on average said they would donate $64. When $5 was suggested as a donation, the average response was $20, and when $400 was suggested, the average jumped to $143.2 It seems as though many charities understand the anchoring effect.
Kahneman identified an availability bias. People base their knowledge, opinions and actions on small samples of information readily available to them. Estimates of causes of death are warped by media coverage. For example, strokes cause almost twice as many deaths as all accidents combined, but 80% of respondents said accidental deaths were more likely.3
Kahneman and Tversky did many behavioral studies, and their largest contribution to behavioral economics is their work on decision making in risky situations. Subjects were asked to make the following two choices concurrently:
Choose between:
A. a sure gain of $240
B. 25% chance to win $1,000 and a 75% chance to gain nothing
Choose between:
C. a sure loss of $750
D. 75% chance to lose $1,000 and a 25% chance to lose nothing
People are risk averse with respect to gains; 84% of subjects chose A, accepting a lower expected value than B.4 However, people are risk seeking with respect to losses. People hate to lose and will take a chance of a greater loss in exchange for a chance not to lose; 87% chose D.5
Despite the instructions, subjects appeared to make these choices sequentially rather than concurrently. They framed the exercise as two separate choices. Choosing A and D provides a net result of a 75% chance to lose $760 and a 25% chance of gaining $240. People solving the problems concurrently and rationally would have chosen C and B, which provides a net result of a 75% chance to lose $750 and a 25% chance to gain $250. Choosing C and B together results in the same odds, yet $10 more under either scenario.
Given our biases, how a choice is framed heavily influences our decisions. Would you accept a gamble that offers a 10% chance to win $95 and a 90% chance to lose $5? Would you pay $5 to participate in a lottery that offers a 10% chance to win $100 and a 90% chance to win nothing?
Many more people accept the second opportunity than the first, even though the choices are identical. The first clearly frames the $5 as a loss, while the second suggests the $5 is a sunk cost. 6
Kahneman and Tversky also did a study to determine values people assign to probabilities, what they called decision weights. People provided zero value to a zero probability and a value of 100 to a sure thing, but the values in between were interesting:7
Probability | 1 | % | 10 | % | 50 | % | 90 | % | 99 | % | |||||||||||||
| Decision Weight | 5.5 | 18.6 | 42.1 | 71.2 | 91.2 | ||||||||||||||||||
What the data shows is that people are often willing to overpay for small probabilities, a tendency known as the possibility effect. That is why lotteries exist. Yet people underpay relatively more for large but not certain probabilities. To eliminate those last bits of uncertainty, people are willing to pay a lot, a tendency known as the certainty effect.
Richard Thaler, a University of Chicago professor of behavioral science and economics, worked with Kahneman and Tversky on several studies. Jointly, they defined the endowment effect, which states that once someone owns something, he tends to place an irrationally high value on it. Thaler and Kahneman experimented by giving some subjects coffee mugs decorated with university insignia. Participants were asked to provide the prices at which they would sell. Other subjects were not given mugs and were asked what prices they would bid for the mugs. The average selling price was about double the average buying price!8
Thaler agrees with Kahneman's findings that people are risk seeking with respect to losses, both prospectively and retrospectively. People who are losing money at a racetrack tend to bet on longshots for the last race of the day, hoping to recoup losses, effectively driving the expected return of the last race even more against them!9 Financial institutions need to watch losing traders very closely, as rogue traders repeatedly double down in hopes of recouping losses.
3
Wanger Select 2015 Annual Report
Thaler's work indicates that people create mental accounts, treating some money differently depending on its intended use. Cash accounts are for spending, other funds are for savings, and retirement accounts are sacrosanct.10 People may borrow at high interest rates on their charge cards while receiving low interest rates on savings, which appears irrational.
Thaler notes that Economics 101 classes typically teach that prices should rationally rise when there is an unanticipated increase in demand. I remember learning that it would be rational for merchants to raise the price of snow shovels after a blizzard and plywood before a hurricane. The products would be rationed by price to those most in need and capable of paying, and additional revenues would induce costly special increases in supply. Thaler's work, however, indicates that most people would consider such increases as unfair price gouging, and would later penalize those merchants.
Policy Implications
Public policies are often impacted by people's emotional reaction under the availability bias. Former Administrator of the White House Office of Information and Regulatory Affairs, Cass Sunstein, has analyzed resulting regulations and notes that poor regulations waste time and money. Rational weighting of costs and benefits would result in better regulations and improved outcomes.11
Kahneman points out that as an extension of the possibility effect, people tend to be confounded by exceptionally small probabilities,12 and either ignore them or give them way too much attention. The precautionary principle, which prohibits any action that might cause harm, is the result. Sunstein believes that many innovations including airplanes, antibiotics, automobiles, chlorination, vaccinations and x-rays would have not passed strict interpretation of the precautionary principle.13
Thaler's work explains one of the reasons why policy makers prefer modest inflation. People consider outright wage cuts as unfair, even when unemployment is high and the employer is
earning only a small profit. But a flat wage when there is inflation is not considered unfair, even though real wages drop.14 Therefore, the economy can more easily rationalize costs in a recession with some inflation rather than none.
Thaler devised a plan to induce people to contribute more to 401K plans called "Save More Tomorrow." Many people don't contribute to their 401K plan because that would mean an immediate take-home pay cut, frowned on by the endowment effect. Instead, the plan has people sign up now to contribute upon their next raise in pay. They then forgo some or the entire raise, but save for retirement without taking a pay cut. Employees of the first company that adopted the plan nearly quadrupled their savings rate after four annual raises.15
Thaler and Sunstein's book Nudge cites numerous ways that individuals can be "nudged" to make better decisions. For example, default options are considered standard and most people don't extend the effort to make a different choice. Germans need to opt in for organ donations, and only 12% do. Austrians need to opt out of organ donations, and 99% allow their organs to be donated.16
Investment Implications
Kahneman notes that experienced traders in financial markets tend to more rationally deal with risk aversion than individual investors. Most people weight losses twice as much as gains,17 and if each transaction is framed individually, irrational risk aversion results. By framing gains and losses over longer periods rather than individually, traders can accept individual rational risks. To mitigate this bias, Kahneman suggests that individual investors view the market prices of their investments less frequently.18
Thaler agrees, as he conducted an experiment simulating endowment management. Some subjects were shown results eight times per simulated calendar year, while others were shown results once per simulated year. Those seeing results more frequently chose to invest 41% in stocks and those seeing results just
once a year had 70% in stocks.19 Myopic risk aversion helps explain why stocks provided a 7% premium compound rate of return over risk-free securities for the last two centuries,20 a huge premium that cannot be otherwise explained by economic theory.21
Individuals tend to be terrible stock traders. One study indicated that stocks sold by individuals outperformed stocks they bought by 3.2% per year, before transactions costs. Individual investors tend to sell winners even though recent winners on average outperform recent losers in the short term. Individuals tend to keep losers, as they are averse to taking losses and have anchored on purchase prices as target sale prices for losers.22 Losers on average underperform in the short term.23
Mental accounts result in the house money effect for gamblers and investors. People are more prone to lose their risk aversion on gains when they are ahead. This can result in gamblers not knowing when to quit, and investors creating bubbles.24
Humans, including many professional money managers, seem to be hard wired to invest poorly, to "buy high and sell low." Behavioral economics helps explain why. One solution to offset this tendency is to own Columbia Thermostat Fund, which takes emotions out of investing and automatically invests more in stocks when the market drops and automatically sells stocks when the market rises.25


Charles P. McQuaid
Portfolio Manager, Analyst and Advisor
Columbia Wanger Asset Management, LLC
4
Wanger Select 2015 Annual Report
The information and data provided in this analysis are derived from sources that we deem to be reliable and accurate. These views are not guarantees of future performance and involve certain risks, uncertainties and assumptions that are difficult to predict so actual outcomes and results may differ significantly from the views expressed. The views/opinions expressed here are those of the author and not of the Wanger Advisors Trust Board of Trustees, are subject to change at any time based upon economic, market or other conditions, may differ from views expressed by other Columbia Management associates and the respective parties disclaim any responsibility to update such views. These views may not be relied on as investment advice and, because investment decisions for a Columbia Wanger Fund are based on numerous factors, may not be relied on as an indication of trading intent on behalf of any particular Columbia Wanger Fund.
The author would like to thank Colin Moore, Global Chief Investment Officer of Columbia Threadneedle Investments, for suggesting Beyond Greed and Fear, which summarizes behavioral economics for investors. He would also like to thank recently retired Wanger Advisors Trust Chief Compliance Officer Robert Scales for suggesting Thinking, Fast and Slow.
1 Daniel Kahneman, Thinking, Fast and Slow (New York, Farrar, Straus and Giroux, 2011), p. 81.
2 Ibid., p. 125.
3 Ibid., p. 138.
4 Expected value is the sum of probabilities times dollars.
5 Kahneman, op. cit., p. 437.
6 Ibid., p. 364.
7 Ibid., p. 315.
8 Ibid., p. 295.
9 Richard H. Thaler, Misbehaving: The Making of Behavioral Economics (New York, W. W. Norton & Company, Inc., 2015), p. 80.
10 Ibid., p. 76.
11 Kahneman, op. cit., p. 141.
12 Somehow this one is not labelled as a particular bias or effect.
13 Kahneman, op. cit., p. 351.
14 Thaler, op. cit., p. 132.
15 Ibid., p. 318.
16 Richard H. Thaler and Cass R. Sunstein, Nudge: Improving Decisions About Health, Wealth, and Happiness (New Haven, Connecticut, Yale University Press, 2008), p. 178-179.
17 Kahneman, op. cit., p. 349.
18 Ibid., p. 339.
19 Thaler, op. cit., p. 197.
20 Hersh Shefrin, Beyond Greed and Fear: Understanding Behavioral Finance and the Psychology of Investing (New York, Oxford University Press, 2002), p. 37.
21 Thaler, op. cit., p. 192.
22 In Beyond Greed and Fear, Shefrin labels this as "Get-evenitis."
23 Kahneman, op. cit., p. 213-214.
24 Thaler, op. cit., p. 83.
25 If interested, please see Columbia Thermostat Fund's prospectus, which can be found at columbiathreadneedle.com/us.
5
Wanger Select 2015 Annual Report
Performance Review Wanger Select
|
| ||||||
| David L. Frank Co-Portfolio Manager* | Matthew S. Szafranski Co-Portfolio Manager | ||||||


Market risk may affect a single issuer, sector of the economy, industry or the market as a whole. Investments in small- and mid-cap companies involve risks and volatility and possible illiquidity greater than investments in larger, more established companies. Foreign investments subject the Fund to risks, including political, economic, market, social and other risks, within a particular country, as well as to potential currency instabilities and less stringent financial and accounting standards generally applicable to U.S. issuers. Risks are enhanced for emerging market issuers. The Fund may invest significantly in issuers within a particular sector, which may be negatively affected by market, economic or other conditions, making the Fund more vulnerable to unfavorable developments in the sector.
For the year ended December 31, 2015, Wanger Select gained 0.26% versus a 2.18% drop in the Fund's primary benchmark, the S&P MidCap 400 Index. An increase in takeout activity drove Fund relative outperformance in the health care and materials sectors for the year, and was a strong contributor to the Fund's outperformance overall. Seven of the Fund's holdings were acquired during the year, equal to roughly 18% of the number of portfolio holdings at year end. In the fourth quarter, industrial gas distributor Airgas was added to the list of acquisitions after announcing that it was being acquired by Air Liquide. We sold the position on the news, capturing a 21% gain for the annual period.
Other winners included ski resort operator and developer Vail Resorts, which gained 44% for the year. Vail's stock has benefited from strong pass sales leading into the 2015-2016 ski season. The company's strategy of bundling its resorts into one unlimited season-long lift ticket (called EPIC pass) has set Vail apart from its competitors. Extra Space Storage, a self-storage facility operator, was also a top contributor for the year, gaining 55%. The company enjoyed same-store operating income growth driven by limited new storage space development across the industry, record occupancies and increasing rents.
Top contributors in the health care sector for the annual period included orphan drug developers Synageva BioPharma and Ultragenyx Pharmaceutical, up 120% and 132%, respectively. Synageva gained on its acquisition announcement at mid-year, and Ultragenyx reported favorable news for several of its pipeline drugs over the course of the year. We sold Synageva following its takeout announcement, but continued to hold Ultragenyx at year end. Following the strong run in Fund health care names, we believed valuations were getting high, so we reduced the Fund's weighting in biotechnology and drug delivery names in the second half of the year.
Detractors for the year included watch designer and retailer Fossil. Off 54% for the year, the company missed its earnings and lowered guidance, citing declines in overseas sales and a shift in interest toward wearable technology. Specialty food retailer The Fresh Market came back in the fourth quarter of the year, but was the top
detractor from performance for the annual period, falling 46%. The company was negatively impacted by increased competition and lower produce prices, but rebounded following reports that The Fresh Market's founder and chairman was considering a bid to take the company private. Cepheid, a provider of medical diagnostic supplies, was also a detractor for the year, falling 32% on disappointing quarterly results and reduced 2015 financial guidance. We took advantage of the downturn and added to the Fund's position in the stock during the fourth quarter. Union Agriculture Group, a farmland operator in Uruguay, was down 44% for the year, hurt by the slowdown in commodities and weakness in emerging markets, among other factors.
Across the portfolio, we have lowered Fund weightings in manufacturers of industrial goods and have further trimmed emerging market resource plays. Strategically, we reduced the number of holdings in the Fund to concentrate on our highest-conviction ideas. At year end, the Fund had 39 holdings. These moves are intended to bring the Fund back to its focus at inception: high quality, unique companies with good returns on capital and long-term secular growth drivers. We were pleased with the Fund's performance amid turbulent markets in 2015 and are working hard to continue that success in 2016.
It is with great sadness that we report the November 2015 death of the Fund's former lead portfolio manager, Robert Chalupnik. Rob's approach to investing included exhaustive research and detailed analysis that were driven by his strong work ethic and deep intellectual curiosity. He always acted with integrity, generosity and humility. Rob was an esteemed colleague, a highly successful investor and a cherished friend, and he is greatly missed by all of us at CWAM.
*Effective December 2, 2015, David L. Frank became a co-portfolio manager for the Fund, joining Mr. Szafranski. Mr. Frank also serves as co-portfolio manager of one of the Columbia Acorn Funds.
Fund holdings are as of the date given, are subject to change at any time, and are not recommendations to buy or sell any security.
6
Wanger Select 2015 Annual Report
Growth of a $10,000 Investment in Wanger Select
February 1, 1999 (inception date) through December 31, 2015

Performance data shown represents past performance and is not a guarantee of future results. The investment return and principal value will fluctuate so that shares, when redeemed, may be worth more or less than the original cost. Current performance may be lower or higher than the performance data shown. Performance results reflect any fee waivers or reimbursements of Fund expenses by the investment manager and/or any of its affiliates. Absent these fee waivers and/or expense reimbursement arrangements, performance results would have been lower. For most recent month-end performance updates, please visit columbiathreadneedle.com/us.
This graph compares the results of $10,000 invested in Wanger Select on February 1, 1999 (the date the Fund began operations) through December 31, 2015, to the S&P MidCap 400 Index, with dividends and capital gains reinvested. Although the index is provided for use in assessing the Fund's performance, the Fund's holdings may differ significantly from those in the index.
Top 10 Holdings
As a percentage of net assets, as of 12/31/15
| 1. LKQ Alternative Auto Parts Distribution | 5.1 | % | |||||
| 2. Vail Resorts Ski Resort Operator & Developer | 4.6 | ||||||
| 3. Ametek Aerospace/Industrial Instruments | 4.0 | ||||||
| 4. Nordson Dispensing Systems for Adhesives & Coatings | 3.9 | ||||||
| 5. Crown Castle International Communications Towers | 3.6 | ||||||
| 6. EdR Student Housing | 3.5 | ||||||
| 7. Expeditors International of Washington International Freight Forwarder | 3.4 | ||||||
| 8. Align Technology Invisalign System to Correct Malocclusion (Crooked Teeth) | 3.4 | ||||||
| 9. Bankrate Internet Advertising for the Insurance, Credit Card & Banking Markets | 3.1 | ||||||
| 10. CNO Financial Group Life, Long-term Care & Medical Supplement Insurance | 3.1 | ||||||
Top holdings exclude short-term holdings and cash, if applicable.
Top 5 Industries
As a percentage of net assets, as of 12/31/15
Industrial Goods & Services | 26.3 | % | |||||
Information | 21.1 | ||||||
Consumer Goods & Services | 19.8 | ||||||
Finance | 10.9 | ||||||
Health Care | 7.6 | ||||||
Results as of December 31, 2015
4th quarter* | 1 year | 5 years | 10 years | ||||||||||||||||
Wanger Select | 3.39 | % | 0.26 | % | 6.30 | % | 6.65 | % | |||||||||||
S&P MidCap 400 Index** | 2.60 | -2.18 | 10.68 | 8.18 | |||||||||||||||
S&P 500 Index | 7.04 | 1.38 | 12.57 | 7.31 | |||||||||||||||
* Not annualized.
** The Fund's primary benchmark.
NAV as of 12/31/15: $24.18
Performance numbers reflect all Fund expenses but do not include any fees and expenses imposed under your variable annuity contract or life insurance policy or qualified pension or retirement plan. If performance numbers included the effect of these additional charges, they would be lower.
The Fund's annual operating expense ratio of 0.73% is stated in the Fund's prospectus dated May 1, 2015, as supplemented May 1, 2015. Differences in expense ratios disclosed elsewhere in this report may result from including fee waivers and/or expense reimbursements as well as different time periods used in calculating the ratios.
All results shown assume reinvestment of distributions.
The S&P MidCap 400 Index is a market value-weighted index that tracks the performance of 400 mid-cap U.S. companies. The S&P 500 Index tracks the performance of 500 widely-held large capitalization U.S. stocks. Although the Fund typically invests in companies with market caps under $20 billion at the time of investment, the comparison to the S&P 500 Index is presented to show performance against a widely recognized market index. Indexes are not managed and do not incur fees or expenses. It is not possible to invest directly in an index.
Portfolio characteristics and holdings are subject to change periodically and may not be representative of current characteristics and holdings.
7
Wanger Select 2015 Annual Report
Wanger Select
Statement of Investments, December 31, 2015
| Number of Shares | Value | ||||||||||
Equities – 95.0% | |||||||||||
Industrial Goods & Services – 26.3% | |||||||||||
Machinery – 12.5% | |||||||||||
102,030 | Ametek Aerospace/Industrial Instruments | $ | 5,467,788 | ||||||||
82,915 | Nordson Dispensing Systems for Adhesives & Coatings | 5,318,997 | |||||||||
108,940 | Generac (a) (b) Standby Power Generators | 3,243,144 | |||||||||
104,450 | Donaldson Industrial Air Filtration | 2,993,537 | |||||||||
17,023,466 | |||||||||||
Other Industrial Services – 11.0% | |||||||||||
232,170 | LKQ (a) Alternative Auto Parts Distribution | 6,879,197 | |||||||||
102,510 | Expeditors International of Washington International Freight Forwarder | 4,623,201 | |||||||||
72,740 | Robert Half International Temporary & Permanent Staffing in Finance, Accounting & other Professions | 3,428,964 | |||||||||
14,931,362 | |||||||||||
Industrial Materials & Specialty Chemicals – 2.0% | |||||||||||
103,876 | Axalta Coating Systems (a) Global Manufacturer of High Performance Coatings | 2,768,295 | |||||||||
Outsourcing Services – 0.8% | |||||||||||
51,190 | Quanta Services (a) Electrical Transmission & Pipeline Contracting Services | 1,036,597 | |||||||||
Total Industrial Goods & Services | 35,759,720 | ||||||||||
Information – 21.1% | |||||||||||
Business Software – 4.6% | |||||||||||
38,390 | Ansys (a) Simulation Software for Engineers & Designers | 3,551,075 | |||||||||
13,660 | Ultimate Software (a) Human Capital Management Systems | 2,670,667 | |||||||||
6,221,742 | |||||||||||
Mobile Communications – 3.6% | |||||||||||
56,865 | Crown Castle International Communications Towers | 4,915,979 | |||||||||
Business Information & Marketing Services – 3.1% | |||||||||||
316,900 | Bankrate (a) Internet Advertising for the Insurance, Credit Card & Banking Markets | 4,214,770 | |||||||||
| Number of Shares | Value | ||||||||||
Telecommunications Equipment – 2.9% | |||||||||||
40,740 | F5 Networks (a) Internet Traffic Management Equipment | $ | 3,950,150 | ||||||||
Computer Hardware & Related Equipment – 2.7% | |||||||||||
69,420 | Amphenol Electronic Connectors | 3,625,807 | |||||||||
Computer Services – 2.3% | |||||||||||
100,427 | WNS – ADR (a) Offshore Business Process Outsourcing Services | 3,132,318 | |||||||||
Internet Related – 1.9% | |||||||||||
447,150 | Vonage (a) Business & Consumer Internet Telephony | 2,566,641 | |||||||||
Total Information | 28,627,407 | ||||||||||
Consumer Goods & Services – 19.8% | |||||||||||
Travel – 4.6% | |||||||||||
49,264 | Vail Resorts Ski Resort Operator & Developer | 6,305,299 | |||||||||
Retail – 4.4% | |||||||||||
147,615 | The Fresh Market (a) Specialty Food Retailer | 3,457,143 | |||||||||
69,300 | Fossil (a) (b) Watch Designer & Retailer | 2,533,608 | |||||||||
5,990,751 | |||||||||||
Other Durable Goods – 3.3% | |||||||||||
196,345 | Gentex Manufacturer of Auto Parts | 3,143,484 | |||||||||
63,000 | Select Comfort (a) Specialty Mattresses | 1,348,830 | |||||||||
4,492,314 | |||||||||||
Leisure Products – 3.0% | |||||||||||
47,500 | Polaris Industries Leisure Vehicles & Related Products | 4,082,625 | |||||||||
Other Consumer Services – 2.6% | |||||||||||
80,300 | Blackhawk Network (a) Third-party Distributor of Prepaid Content, Mostly Gift Cards | 3,550,063 | |||||||||
Restaurants – 1.9% | |||||||||||
44,800 | Papa John's International Franchisor of Pizza Restaurants | 2,502,976 | |||||||||
Total Consumer Goods & Services | 26,924,028 | ||||||||||
See accompanying notes to financial statements.
8
Wanger Select 2015 Annual Report
Wanger Select
Statement of Investments, December 31, 2015
| Number of Shares | Value | ||||||||||
Finance – 10.9% | |||||||||||
Brokerage & Money Management – 4.0% | |||||||||||
94,160 | Eaton Vance Specialty Mutual Funds | $ | 3,053,609 | ||||||||
47,100 | SEI Investments Mutual Fund Administration & Investment Management | 2,468,040 | |||||||||
5,521,649 | |||||||||||
Insurance – 3.1% | |||||||||||
219,340 | CNO Financial Group Life, Long-term Care & Medical Supplement Insurance | 4,187,200 | |||||||||
Banks – 2.8% | |||||||||||
200,320 | Associated Banc-Corp Midwest Bank | 3,756,000 | |||||||||
Credit Cards – 1.0% | |||||||||||
15,000 | WEX (a) Card Processor | 1,326,000 | |||||||||
Total Finance | 14,790,849 | ||||||||||
Health Care – 7.6% | |||||||||||
Medical Supplies – 3.7% | |||||||||||
68,690 | Cepheid (a) Molecular Diagnostics | 2,509,246 | |||||||||
87,400 | VWR (a) Distributor of Lab Supplies | 2,474,294 | |||||||||
4,983,540 | |||||||||||
Medical Equipment & Devices – 3.3% | |||||||||||
69,142 | Align Technology (a) Invisalign System to Correct Malocclusion (Crooked Teeth) | 4,553,001 | |||||||||
Biotechnology & Drug Delivery – 0.6% | |||||||||||
6,895 | Ultragenyx Pharmaceutical (a) Biotech Focused on "Ultra-Orphan" Drugs | 773,481 | |||||||||
Total Health Care | 10,310,022 | ||||||||||
Other Industries – 6.5% | |||||||||||
Real Estate – 5.8% | |||||||||||
123,977 | EdR Student Housing | 4,696,249 | |||||||||
35,770 | Extra Space Storage Self Storage Facilities | 3,155,272 | |||||||||
7,851,521 | |||||||||||
| Number of Shares | Value | ||||||||||
Transportation – 0.7% | |||||||||||
61,000 | Heartland Express Regional Trucker | $ | 1,038,220 | ||||||||
Total Other Industries | 8,889,741 | ||||||||||
Energy & Minerals – 2.8% | |||||||||||
Mining – 1.8% | |||||||||||
22,910 | Core Labs (Netherlands) (b) Oil & Gas Reservoir Consulting | 2,491,233 | |||||||||
Agricultural Commodities – 1.0% | |||||||||||
261,363 | Union Agriculture Group (Uruguay) (a) (c) (d) Farmland Operator in Uruguay | 1,327,724 | |||||||||
Total Energy & Minerals | 3,818,957 | ||||||||||
| Total Equities (Cost: $107,772,763) — 95.0% | 129,120,724 | (e) | |||||||||
Short-Term Investments – 5.0% | |||||||||||
6,767,769 | JPMorgan U.S. Government Money Market Fund, IM Shares (7 day yield of 0.01%) | 6,767,769 | |||||||||
| Total Short-Term Investments (Cost: $6,767,769) — 5.0% | 6,767,769 | ||||||||||
Securities Lending Collateral – 4.5% | |||||||||||
6,065,375 | Dreyfus Government Cash Management Fund, Institutional Shares (7 day yield of 0.03%) (f) | 6,065,375 | |||||||||
| Total Securities Lending Collateral (Cost: $6,065,375) – 4.5% | 6,065,375 | ||||||||||
| Total Investments (Cost: $120,605,907) (g) – 104.5% | 141,953,868 | ||||||||||
| Obligation to Return Collateral for Securities Loaned – (4.5)% | (6,065,375 | ) | |||||||||
Cash and Other Assets Less Liabilities – —% | (47,667 | ) | |||||||||
Net Assets – 100.0% | $ | 135,840,826 | |||||||||
ADR – American Depositary Receipts
See accompanying notes to financial statements.
9
Wanger Select 2015 Annual Report
Wanger Select
Statement of Investments, December 31, 2015
Notes to Statement of Investments
(a) Non-income producing security.
(b) All or a portion of this security was on loan at December 31, 2015. The total market value of securities on loan at December 31, 2015 was $5,876,542.
(c) Illiquid security.
(d) Denotes a restricted security, which is subject to restrictions on resale under federal securities laws. This security is valued at fair value determined in good faith under consistently applied procedures established by the Fund's Board of Trustees. At December 31, 2015, the market value of this security amounted to $1,327,724, which represented 0.98% of total net assets. Additional information on this security is as follows:
Security | Acquisition Dates | Shares | Cost | Value | |||||||||||||||
Union Agriculture Group | 12/8/10 - 6/27/12 | 261,363 | $ | 2,999,999 | $ | 1,327,724 | |||||||||||||
(e) On December 31, 2015, the market value of foreign securities represented 2.81% of total net assets. The Fund's foreign portfolio was diversified as follows:
Country | Value | Percentage of Net Assets | |||||||||
Netherlands | $ | 2,491,233 | 1.83 | ||||||||
Uruguay | 1,327,724 | 0.98 | |||||||||
Total Foreign Portfolio | $ | 3,818,957 | 2.81 | ||||||||
(f) Investment made with cash collateral received from securities lending activity.
(g) At December 31, 2015, for federal income tax purposes, the cost of investments was $120,733,235 and net unrealized appreciation was $21,220,633 consisting of gross unrealized appreciation of $30,552,471 and gross unrealized depreciation of $9,331,838.
Fair Value Measurements
Various inputs are used in determining the value of the Fund's investments, following the input prioritization hierarchy established by accounting principles generally accepted in the United States of America (GAAP). These inputs are summarized in the three broad levels listed below:
• Level 1 — quoted prices in active markets for identical securities
• Level 2 — prices determined using other significant observable inputs (including quoted prices for similar securities, interest rates, prepayment speeds, credit risk and others)
• Level 3 — prices determined using significant unobservable inputs where quoted prices or observable inputs are unavailable or less reliable (including management's own assumptions about the factors market participants would use in pricing an investment)
The inputs or methodology used for valuing securities are not necessarily an indication of the risk associated with investing in those securities.
Examples of the types of securities in which the Fund would typically invest and how they are classified within this hierarchy are as follows. Typical Level 1 securities include exchange traded domestic equities, mutual funds whose NAVs are published each day and exchange traded foreign equities that are not statistically fair valued. Typical Level 2 securities include exchange traded foreign equities that are statistically fair valued, forward foreign currency exchange contracts and short-term investments valued at amortized cost. Additionally, securities fair valued by CWAM's Valuation Committee (the Committee) that rely on significant observable inputs are also included in Level 2. Typical Level 3 securities include any security fair valued by the Committee that relies on significant unobservable inputs.
The Committee is responsible for applying the Trust's Portfolio Pricing Policy and the CWAM pricing procedures (the Policies), which are approved by and subject to the oversight of the Board.
The Committee meets as necessary, and no less frequently than quarterly, to determine fair values for securities for which market quotations are not readily available or for which the investment manager believes that available market quotations are unreliable. The Committee also reviews the continuing appropriateness of the Policies. In circumstances where a security has been fair valued, the Committee will also review the continuing appropriateness of the current value of the security. The Policies address, among other things: circumstances under which market quotations will be deemed readily available; selection of third party pricing vendors; appropriate pricing methodologies; events that require fair valuation and fair value techniques; circumstances under which securities will be deemed to pose a potential for stale pricing, including when securities are illiquid, restricted, or in default; and certain delegations of authority to determine fair values to the Fund's investment manager. The Committee may also meet to discuss additional valuation matters, which may include review of back-testing results, review of time-sensitive information or approval of other valuation related actions, and to review the appropriateness of the Policies.
For investments categorized as Level 3, the significant unobservable inputs used in the fair value measurement of the Fund's securities may include: (i) data specific to the issuer or comparable issuers, (ii) general market or specific sector news and (iii) quoted prices and specific or similar security transactions. The Committee considers this data and any changes from prior periods in order to assess the reasonableness of observable and unobservable inputs, any assumptions or internal models used to value those securities and changes in fair value. Significant changes in any of these factors could result in lower or higher fair value measurements. Various factors impact the frequency of monitoring (which may occur as often as daily), however the Committee may determine that changes to inputs, assumptions and models are not required with the same frequency.
See accompanying notes to financial statements.
10
Wanger Select 2015 Annual Report
Wanger Select
Statement of Investments, December 31, 2015
The following table summarizes the inputs used, as of December 31, 2015, in valuing the Fund's assets:
Investment Type | Quoted Prices (Level 1) | Other Significant Observable Inputs (Level 2) | Significant Unobservable Inputs (Level 3) | Total | |||||||||||||||
Equities | |||||||||||||||||||
| Industrial Goods & Services | $ | 35,759,720 | $ | — | $ | — | $ | 35,759,720 | |||||||||||
Information | 28,627,407 | — | — | 28,627,407 | |||||||||||||||
| Consumer Goods & Services | 26,924,028 | — | — | 26,924,028 | |||||||||||||||
Finance | 14,790,849 | — | — | 14,790,849 | |||||||||||||||
Health Care | 10,310,022 | — | — | 10,310,022 | |||||||||||||||
Other Industries | 8,889,741 | — | — | 8,889,741 | |||||||||||||||
Energy & Minerals | 2,491,233 | — | 1,327,724 | 3,818,957 | |||||||||||||||
Total Equities | 127,793,000 | — | 1,327,724 | 129,120,724 | |||||||||||||||
| Total Short-Term Investments | 6,767,769 | — | — | 6,767,769 | |||||||||||||||
| Total Securities Lending Collateral | 6,065,375 | — | — | 6,065,375 | |||||||||||||||
Total Investments | $ | 140,626,144 | $ | — | $ | 1,327,724 | $ | 141,953,868 | |||||||||||
There were no transfers of financial assets between levels during the period.
The following table reconciles asset balances for the period ending December 31, 2015, in which significant observable and/or unobservable inputs (Level 3) were used in determining value:
| Investments in Securities | Balance as of December 31, 2014 | Realized Gain (Loss) | Change in Unrealized Appreciation (Depreciation) | Purchases | Sales | Transfers Into Level 3 | Transfers out of Level 3 | Balance as of December 31, 2015 | |||||||||||||||||||||||||||
Equities | |||||||||||||||||||||||||||||||||||
Energy & Minerals | $ | 2,386,244 | $ | — | $ | (1,058,520 | ) | $ | — | $ | — | $ | — | $ | — | $ | 1,327,724 | ||||||||||||||||||
The information in the above reconciliation table represents fiscal year to date activity for any securities identified as using Level 3 inputs at either the beginning or the end of the current fiscal period.
The change in unrealized depreciation attributed to securities owned at December 31, 2015, which were valued using significant unobservable inputs (Level 3), amounted to $1,058,520.
Quantitative information pertaining to Level 3 unobservable fair value measurements
| Fair Value at December 31, 2015 | Valuation Technique(s) | Unobservable Input(s) | Range (Weighted Average) | ||||||||||||||||
Equities | |||||||||||||||||||
Energy & Minerals | $ | 1,327,724 | Market comparable companies | Discount for lack of marketability | 7 | % to 40% | |||||||||||||
Certain securities classified as Level 3 are valued by the Committee using a market approach, as determined in good faith under consistently applied procedures established by and under the general supervision of the Board. To determine fair value for these securities, for which no market exists, the Committee utilizes the valuation technique it deems most appropriate in the circumstances, using some unobservable inputs, which may include, but are not limited to estimated earnings of the company and the position of the security within the company's capital structure. The Committee also may use some observable inputs, which may include, but are not limited to, trades of similar securities and market multiples derived from a set of comparable companies. Significant increases or decreases to any of these inputs could result in a significantly lower or higher fair value measurement.
See accompanying notes to financial statements.
11
Wanger Select 2015 Annual Report
Statement of Assets and Liabilities
December 31, 2015
Assets: | |||||||
Investments, at cost | $ | 120,605,907 | |||||
| Investments, at value (including securities on loan of $5,876,542) | $ | 141,953,868 | |||||
Receivable for: | |||||||
Investments sold | 2,062,450 | ||||||
Fund shares sold | 94,658 | ||||||
Securities lending income | 1,051 | ||||||
Dividends | 74,399 | ||||||
Prepaid expenses | 2,413 | ||||||
Total Assets | 144,188,839 | ||||||
Liabilities: | |||||||
Collateral on securities loaned | 6,065,375 | ||||||
Payable for: | |||||||
Investments purchased | 1,985,211 | ||||||
Fund shares redeemed | 190,227 | ||||||
Investment advisory fee | 2,255 | ||||||
Administration fee | 188 | ||||||
Transfer agent fee | 1 | ||||||
Trustees' fees | 44,429 | ||||||
Custody fee | 1,917 | ||||||
Reports to shareholders | 20,066 | ||||||
Chief compliance officer expenses | 1,405 | ||||||
Other liabilities | 36,939 | ||||||
Total Liabilities | 8,348,013 | ||||||
Net Assets | $ | 135,840,826 | |||||
Composition of Net Assets: | |||||||
Paid-in capital | $ | 75,297,329 | |||||
Overdistributed net investment income | (43,785 | ) | |||||
Accumulated net realized gain | 39,239,076 | ||||||
Net unrealized appreciation (depreciation) on: | |||||||
Investments | 21,347,961 | ||||||
Foreign currency translations | 245 | ||||||
Net Assets | $ | 135,840,826 | |||||
Fund Shares Outstanding | 5,619,025 | ||||||
| Net asset value, offering price and redemption price per share | $ | 24.18 | |||||
Statement of Operations
For the Year Ended December 31, 2015
Investment Income: | |||||||
Dividends (net foreign taxes withheld of $5,273) | $ | 1,259,044 | |||||
Income from securities lending—net | 15,307 | ||||||
Total Investment Income | 1,274,351 | ||||||
Expenses: | |||||||
Investment advisory fee | 1,282,443 | ||||||
Transfer agent fees | 230 | ||||||
Administration fee | 80,153 | ||||||
Trustees' fees | 13,957 | ||||||
Custody fees | 8,343 | ||||||
Reports to shareholders | 93,498 | ||||||
Audit fees | 33,308 | ||||||
Legal fees | 28,019 | ||||||
Chief compliance officer expenses | 7,363 | ||||||
Commitment fee for line of credit (Note 5) | 3,953 | ||||||
Other expenses | 20,197 | ||||||
Total Expenses | 1,571,464 | ||||||
Less advisory fee waiver | (206,308 | ) | |||||
Net Expenses | 1,365,156 | ||||||
Net Investment loss | (90,805 | ) | |||||
| Net Realized and Unrealized Gain (Loss) on Investments: | |||||||
Net realized gain (loss) on: | |||||||
Investments | 39,599,660 | ||||||
Foreign currency translations | (933 | ) | |||||
Net realized gain | 39,598,727 | ||||||
| Net change in unrealized appreciation (depreciation) on: | |||||||
Investments | (38,165,496 | ) | |||||
Foreign currency translations | 245 | ||||||
Net change in unrealized depreciation | (38,165,251 | ) | |||||
Net realized and unrealized gain | 1,433,476 | ||||||
Net Increase in Net Assets from Operations | $ | 1,342,671 | |||||
See accompanying notes to financial statements.
12
Wanger Select 2015 Annual Report
Statements of Changes in Net Assets
Year Ended December 31, | |||||||||||
Increase (Decrease) in Net Assets | 2015 | 2014 | |||||||||
Operations: | |||||||||||
Net investment loss | $ | (90,805 | ) | $ | (444,641 | ) | |||||
Net realized gain (loss) on: | |||||||||||
Investments | 39,599,660 | 47,154,484 | |||||||||
Foreign currency translations | (933 | ) | (1,001 | ) | |||||||
Net change in unrealized appreciation (depreciation) on: | |||||||||||
Investments | (38,165,496 | ) | (41,047,938 | ) | |||||||
Foreign currency translations | 245 | — | |||||||||
Net Increase in Net Assets from Operations | 1,342,671 | 5,660,904 | |||||||||
Distributions to Shareholders From: | |||||||||||
Net investment income | (17,514 | ) | — | ||||||||
Net realized gains | (46,251,052 | ) | (27,182,215 | ) | |||||||
Total Distributions to Shareholders | (46,268,566 | ) | (27,182,215 | ) | |||||||
Share Transactions: | |||||||||||
Subscriptions | 2,861,649 | 3,027,845 | |||||||||
Distributions reinvested | 46,268,566 | 27,182,215 | |||||||||
Redemptions | (60,010,018 | ) | (74,952,830 | ) | |||||||
Net Decrease from Share Transactions | (10,879,803 | ) | (44,742,770 | ) | |||||||
Total Decrease in Net Assets | (55,805,698 | ) | (66,264,081 | ) | |||||||
Net Assets: | |||||||||||
Beginning of period | 191,646,524 | 257,910,605 | |||||||||
End of period | $ | 135,840,826 | $ | 191,646,524 | |||||||
Overdistributed net investment income | $ | (43,785 | ) | $ | (39,494 | ) | |||||
See accompanying notes to financial statements.
13
Wanger Select 2015 Annual Report
Financial Highlights
The following table is intended to help you understand the Fund's financial performance. Certain information reflects financial results for a single share held for the periods shown. Per share net investment income (loss) amounts are calculated based on average shares outstanding during the period. Total return assumes reinvestment of all dividends and distributions, if any. Total return does not reflect payment of the expenses that apply to the variable accounts or contract charges, if any. Total return and portfolio turnover are not annualized for periods of less than one year. The portfolio turnover rate is calculated without regard to purchase and sales transactions of short-term instruments and certain derivatives, if any. If such transactions were included, the Fund's portfolio turnover rate may be higher.
Year Ended December 31, | |||||||||||||||||||||||
Selected data for a share outstanding throughout each period | 2015 | 2014 | 2013 | 2012 | 2011 | ||||||||||||||||||
Net Asset Value, Beginning of Period | $ | 32.99 | $ | 36.41 | $ | 27.54 | $ | 23.35 | $ | 28.99 | |||||||||||||
Income from Investment Operations: | |||||||||||||||||||||||
Net investment income (loss) | (0.02 | ) | (0.07 | ) | (0.05 | ) | 0.16 | (0.06 | ) | ||||||||||||||
Net realized and unrealized gain (loss) | 0.69 | 1.07 | 9.46 | 4.15 | (4.99 | ) | |||||||||||||||||
Total from Investment Operations | 0.67 | 1.00 | 9.41 | 4.31 | (5.05 | ) | |||||||||||||||||
Less Distributions to Shareholders: | |||||||||||||||||||||||
Net investment income | (0.00 | )(a) | — | (0.09 | ) | (0.12 | ) | (0.59 | ) | ||||||||||||||
Net realized gains | (9.48 | ) | (4.42 | ) | (0.45 | ) | — | — | |||||||||||||||
Total Distributions to Shareholders | (9.48 | ) | (4.42 | ) | (0.54 | ) | (0.12 | ) | (0.59 | ) | |||||||||||||
Net Asset Value, End of Period | $ | 24.18 | $ | 32.99 | $ | 36.41 | $ | 27.54 | $ | 23.35 | |||||||||||||
Total Return | 0.26 | %(b) | 3.17 | % | 34.58 | % | 18.46 | % | (17.68 | )% | |||||||||||||
Ratios to Average Net Assets/Supplemental Data: | |||||||||||||||||||||||
Total gross expenses (c) | 0.98 | % | 0.93 | %(d) | 0.93 | % | 0.92 | % | 0.93 | % | |||||||||||||
Total net expenses (c) | 0.85 | % | 0.93 | %(d) | 0.93 | % | 0.91 | %(e) | 0.93 | %(e) | |||||||||||||
Net investment income (loss) | (0.06 | )% | (0.20 | )% | (0.15 | )% | 0.60 | % | (0.24 | )% | |||||||||||||
Portfolio turnover rate | 59 | % | 18 | % | 24 | % | 20 | % | 23 | % | |||||||||||||
Net assets, end of period (000s) | $ | 135,841 | $ | 191,647 | $ | 257,911 | $ | 235,155 | $ | 242,543 | |||||||||||||
Notes to Financial Highlights
(a) Rounds to zero.
(b) Had the Investment Manager and/or its affiliates not waived a portion of expenses, total return would have been reduced.
(c) In addition to the fees and expenses that the Fund bears directly, the Fund indirectly bears a pro rata share of the fees and expenses of any other funds in which it invests, if any. Such indirect expenses are not included in the Fund's reported expense ratios.
(d) Ratios include line of credit interest expense which is less than 0.01%.
(e) The benefits derived from custody fees paid indirectly had an impact of less than 0.01%.
See accompanying notes to financial statements.
14
Wanger Select 2015 Annual Report
Notes to Financial Statements
1. Nature of Operations
Wanger Select (the Fund), a series of Wanger Advisors Trust (the Trust), is registered under the Investment Company Act of 1940, as amended (the 1940 Act), as an open-end management investment company organized as a Massachusetts business trust. The investment objective of the Fund is to seek long-term capital appreciation. The Fund is available only for allocation to certain life insurance company separate accounts established for the purpose of funding participating variable annuity contracts and variable life insurance policies and may also be offered directly to certain qualified pension and retirement plans.
2. Summary of Significant Accounting Policies
Basis of Preparation
The Fund is an investment company that applies the accounting and reporting guidance in the Financial Accounting Standards Board (FASB) Accounting Standards Codification Topic 946, Financial Services—Investment Companies (ASC 946). The financial statements are prepared in accordance with U.S. generally accepted accounting principles (GAAP) which requires management to make certain estimates and assumptions that affect the reported amounts of assets and liabilities, the disclosure of contingent assets and liabilities at the date of the financial statements and the reported amounts of income and expenses during the reporting period. Actual results could differ from those estimates.
The following is a summary of significant accounting policies followed by the Fund in the preparation of its financial statements.
Security valuation
Securities of the Fund are valued at market value or, if a market quotation for a security is not readily available or is deemed not to be reliable because of events or circumstances that have occurred between the market quotation and the time as of which the security is to be valued, the security is valued at its fair value determined in good faith under consistently applied procedures established by the Board of Trustees (the Board). A security traded on a securities exchange or in an over-the-counter market in which transaction prices are reported is valued at the last sales price at the time of valuation. A security traded principally on NASDAQ is valued at the NASDAQ official closing price. Exchange traded funds (ETFs) are valued at their closing net asset value as reported on the applicable exchange. A security for which there is no reported sale on the valuation date is valued at the mean of the latest bid and ask quotations.
Short-term investments maturing in 60 days or less are valued at amortized cost, which approximates market value.
The Trust has retained an independent statistical fair value pricing service that employs a systematic methodology to assist in the fair valuation process for securities principally traded in a foreign market in order to adjust for possible changes in value that may occur between the close of the foreign market and the time as of which the securities are to be valued. If a security is valued at a fair value, that value may be different from the last quoted market price for the security.
Foreign currency translations
Values of investments denominated in foreign currencies are converted into U.S. dollars using the New York spot market rate of exchange at the time of valuation. Purchases and sales of investments and dividend and interest income are translated into U.S. dollars using the spot market rate of exchange prevailing on the respective dates of such transactions. The gain or loss resulting from changes in foreign exchange rates is included with net realized and unrealized gain or loss from investments, as appropriate.
Restricted securities
Restricted securities are securities that may only be resold upon registration under federal securities laws or in transactions exempt from registration. In some cases, the issuer of restricted securities has agreed to register such securities for resale at the issuer's expense either upon demand by the Fund or in connection with another registered offering of the securities. Many restricted securities may be resold in the
secondary market in transactions exempt from registration. Such restricted securities may be determined to be liquid under criteria established by the Board.
Security transactions and investment income
Security transactions are accounted for on the trade date (date the order to buy or sell is executed) and dividend income is recorded on the ex-dividend date, except that certain dividends from foreign securities are recorded as soon as the information is available to the Fund. Interest income is recorded on the accrual basis and includes amortization of discounts on debt obligations when required for federal income tax purposes. Realized gains and losses from security transactions are recorded on an identified cost basis.
Awards, if any, from class action litigation related to securities owned may be recorded as a reduction of cost of those securities. If the applicable securities are no longer owned, the proceeds are recorded as realized gains.
The Fund may receive distributions from holdings in equity securities, ETFs, other regulated investment companies (RICs), and real estate investment trusts (REITs), which report information on the tax character of their distributions annually. These distributions are allocated to dividend income, capital gain and return of capital based on actual information reported. Return of capital is recorded as a reduction of the cost basis of securities held. If the Fund no longer owns the applicable securities, return of capital is recorded as a realized gain. With respect to REITs, to the extent actual information has not yet been reported, estimates for return of capital may be made by the Fund's management. Management's estimates are subsequently adjusted when the actual character of the distributions is disclosed by the REITs, which could result in a proportionate change in return of capital to shareholders.
Expenses
General expenses of the Trust are allocated to the Fund and the other series of the Trust based upon relative net assets or other expense allocation methodologies determined by the nature of the expense. Expenses directly attributable to the Fund are charged to the Fund.
Fund share valuation
Fund shares are sold and redeemed on a continuing basis at net asset value. Net asset value per share is determined daily as of the close of trading on the New York Stock Exchange (the Exchange) on each day the Exchange is open for trading by dividing the total value of the Fund's investments and other assets, less liabilities, by the number of Fund shares outstanding.
Securities lending
The Fund may lend securities up to one-third of the value of its total assets to certain approved brokers, dealers and other financial institutions to earn additional income. The Fund retains the benefits of owning the securities, including the economic equivalent of dividends or interest generated by the security. The Fund also receives a fee for the loan. The Fund has the ability to recall the loans at any time and could do so in order to vote proxies or to sell the loaned securities. Each loan is collateralized by cash that exceeded the value of the securities on loan. The market value of the loaned securities is determined daily at the close of business of the Fund and any additional required collateral is delivered to each Fund on the next business day. The Fund has elected to invest the cash collateral in the Dreyfus Government Cash Management Fund. The income earned from the securities lending program is paid to the Fund, net of any fees remitted to Goldman Sachs Agency Lending, the Fund's lending agent, and borrower rebates. The Fund's investment manager, Columbia Wanger Asset Management, LLC (CWAM), does not retain any fees earned by the lending program. Generally, in the event of borrower default, the Fund has the right to use the collateral to offset any losses incurred. In the event the Fund is delayed or prevented from exercising its right to dispose of the collateral, there may be a potential loss to the Fund. Some of these losses may be indemnified by the lending agent. The Fund bears the risk of loss with respect to the investment of collateral. The net lending income earned by the Fund as of December 31, 2015, is included in the Statement of Operations.
15
Wanger Select 2015 Annual Report
Notes to Financial Statements, continued
Offsetting of assets and liabilities
The following table presents the Fund's gross and net amount of assets and liabilities available for offset under netting agreements and under a securities lending agreement as well as the related collateral received by the Fund as of December 31, 2015:
Goldman Sachs | |||||||
Liabilities | |||||||
Collateral on securities loaned | $ | 6,065,375 | |||||
Total liabilities | 6,065,375 | ||||||
Total financial and derivative net assets | (6,065,375 | ) | |||||
Financial instruments | 5,876,542 | ||||||
Net amount (a) | $ | (188,833 | ) | ||||
(a) Represents the net amount due from/(to) counterparties in the event of default.
Securities lending transactions
The following table indicates the total amount of securities loaned by type, reconciled to gross liability payable upon return of the securities loaned by the Fund as of December 31, 2015:
| Overnight and Continuous | Up to 30 Days | 30 – 90 Days | Greater than 90 Days | Total | |||||||||||||||||||
| Securities lending transactions | |||||||||||||||||||||||
Equity securities | $ | 5,876,542 | $ | — | $ | — | $ | — | $ | 5,876,542 | |||||||||||||
| Gross amount of recognized liabilities for securities lending (collateral received) | 6,065,375 | ||||||||||||||||||||||
| Amounts due to counterparty | $ | 188,833 | |||||||||||||||||||||
Federal income taxes
The Fund has complied with the provisions of the Internal Revenue Code available to regulated investment companies and, in the manner provided therein, distributes substantially all its taxable income, as well as any net realized gain on sales of investments and foreign currency transactions reportable for federal income tax purposes. Accordingly, the Fund paid no federal income taxes and no federal income tax provision was required.
Foreign capital gains taxes
Gains in certain countries may be subject to foreign taxes at the fund level. The Fund accrues for such foreign taxes on realized and unrealized gains at the appropriate rate for each jurisdiction. The amount, if any, is disclosed as a liability on the Statement of Assets and Liabilities.
Distributions to shareholders
Distributions to shareholders are recorded on the ex-dividend date.
Indemnification
In the normal course of business, the Trust on behalf of the Fund enters into contracts that contain a variety of representations and warranties and that provide general indemnities. The Fund's maximum exposure under these arrangements is unknown, as this would involve future claims against the Fund. Also under the Trust's organizational documents, the trustees and officers of the Trust are indemnified against certain liabilities that may arise out of their duties to the Trust. However, based on experience, the Fund expects the risk of loss due to these warranties and indemnities to be remote.
Recent Accounting Pronouncement
Fair Value Measurement (Topic 820), Disclosure for Investments in Certain Entities That Calculate Net Asset Value per Share (or Its Equivalent)
In May 2015, FASB issued Accounting Standards Update (ASU) No. 2015-07, Fair Value Measurement (Topic 820), Disclosure for Investments in Certain Entities That Calculate Net Asset Value per Share (or Its Equivalent). ASU No. 2015-07 changes the disclosure requirements for investments for which fair value is measured using the net asset value per share practical expedient. The disclosure requirements are effective for annual periods beginning after December 15, 2015 and interim periods within those fiscal years. At this time, management is evaluating the implications of this guidance and the impact it will have on the financial statement amounts and footnote disclosures, if any.
3. Federal Tax Information
The timing and character of income and capital gain distributions are determined in accordance with income tax regulations, which may differ from GAAP. Reclassifications are made to the Fund's capital accounts for permanent tax differences to reflect income and gains available for distribution (or available capital loss carryforwards) under income tax regulations.
For the year ended December 31, 2015, permanent book and tax basis differences resulting primarily from foreign currency transactions, passive foreign investment company (PFIC), re-characterization of distributions from investments, distribution reclassifications and net operating loss reclassification were identified and reclassified among the components of the Fund's net assets as follows:
| Accumulated Net Investment Income | Accumulated Net Realized Gain (Loss) | Paid-In Capital | |||||||||
| $ | 104,028 | $ | (104,028 | ) | $ | — | |||||
Net investment income and net realized gains (losses), as disclosed on the Statement of Operations, and net assets were not affected by this reclassification.
The tax character of distributions paid during the years ended December 31, 2015 and December 31, 2014 were as follows:
December 31, 2015 | December 31, 2014 | ||||||||||
Ordinary Income* | $ | 17,514 | $ | — | |||||||
Long-Term Capital Gains | 46,251,052 | 27,182,215 | |||||||||
* For tax purposes short-term capital gain distributions, if any, are considered ordinary income distributions.
As of December 31, 2015, the components of distributable earnings on a tax basis were as follows:
| Undistributed Ordinary Income | Undistributed Long-Term Capital Gains | Net Unrealized Appreciation (Depreciation)* | |||||||||
| $ | 5,790,559 | $ | 33,575,845 | $ | 21,220,633 | ||||||
* The differences between book-basis and tax-basis net unrealized appreciation (depreciation) are primarily due to deferral of losses from wash sales.
Management is required to determine whether a tax position of the Fund is more likely than not to be sustained upon examination by the applicable taxing authority, including resolution of any related appeals or litigation processes, based on the technical merits of the position. The tax benefit to be recognized by the Fund is measured as the largest amount of benefit that is greater than fifty percent likely of being realized upon ultimate settlement. Management is not aware of any tax positions in the Fund for which it is reasonably possible that the total amounts of unrecognized tax benefits will significantly change in the next twelve months. However, management's conclusions may be subject to review and adjustment at a later date
16
Wanger Select 2015 Annual Report
Notes to Financial Statements, continued
based on factors including, but not limited to, new tax laws, regulations, and administrative interpretations (including relevant court decisions). The Fund's federal tax returns for the prior three fiscal years remain subject to examination by the Internal Revenue Service.
4. Transactions with Affiliates
CWAM is a wholly owned subsidiary of Columbia Management Investment Advisers, LLC (Columbia Management), which in turn is a wholly owned subsidiary of Ameriprise Financial, Inc. (Ameriprise Financial). CWAM furnishes continuing investment supervision to the Fund and is responsible for the overall management of the Fund's business affairs.
CWAM receives a monthly advisory fee based on the Fund's average daily net assets at the following annual rates:
Average Daily Net Assets | Annual Fee Rate | ||||||
Up to $500 million | 0.80 | % | |||||
| $500 million and over | 0.78 | % | |||||
For the year ended December 31, 2015, the effective investment advisory fee rate, net of fee waivers, was 0.67% of the Fund's average daily net assets.
Effective May 1, 2015, CWAM has contractually agreed to waive 0.20% of the advisory fee through April 30, 2016. When determining whether the Fund's total expenses exceed the voluntary expense cap provided below, the Fund's net advisory fee, reflecting application of the 0.20% waiver, will be used to calculate the Fund's total expenses. This arrangement may be modified or amended with approval from all parties to the arrangement.
Through April 30, 2016, CWAM has contractually agreed to bear a portion of the Fund's expenses so that its ordinary operating expenses (excluding transaction costs and certain other investment-related expenses, interest and fees on borrowings and expenses associated with the Fund's investment in other investment companies, if any), after giving effect to any balance credits from the Fund's custodian, do not exceed the annual rate of 1.35% of the Fund's average daily net assets. For the year ended December 31, 2015, the Fund was not reimbursed any expenses by CWAM.
CWAM provides administrative services and receives an administration fee from the Fund at the following annual rates:
| Wanger Advisors Trust Aggregate Average Daily Net Assets of the Trust | Annual Fee Rate | ||||||
Up to $4 billion | 0.05 | % | |||||
$4 billion to $6 billion | 0.04 | % | |||||
$6 billion to $8 billion | 0.03 | % | |||||
| $8 billion and over | 0.02 | % | |||||
For the year ended December 31, 2015, the effective administration fee rate was 0.05% of the Fund's average daily net assets. CWAM has delegated to Columbia Management responsibility to provide certain sub-administrative services to the Fund.
Columbia Management Investment Distributors, Inc. (CMID), a wholly owned subsidiary of Ameriprise Financial, serves as the Fund's distributor and principal underwriter.
Columbia Management Investment Services Corp. (CMIS), a wholly owned subsidiary of Ameriprise Financial, is the transfer agent to the Fund. For its services, the Fund pays CMIS a monthly fee at the annual rate of $21.00 per open account. CMIS also receives reimbursement from the Fund for certain out-of-pocket expenses.
Certain officers and trustees of the Trust are also officers of CWAM. The Trust makes no direct payments to its officers and trustees who are affiliated with CWAM.
The Board has appointed a Chief Compliance Officer of the Trust in accordance with federal securities regulations. The Fund, along with other affiliated funds, pays its pro-rata share of the expenses associated with the office of the Chief Compliance Officer.
The Trust offers a deferred compensation plan for its independent trustees. Under that plan, a trustee may elect to defer all or a portion of his or her compensation.
Amounts deferred are retained by the Trust and may represent an unfunded obligation of the Trust. The value of amounts deferred is determined by reference to the change in value of Class Z shares of one or more series of Columbia Acorn Trust or a money market fund as specified by the trustee. Benefits under the deferred compensation plan are payable in accordance with the plan.
For the year ended December 31, 2015, the Fund engaged in purchase and sales transactions with funds that have a common investment manager (or affiliated investment managers), common directors/trustees, and/or common officers. Those purchase and sale transactions complied with provisions of Rule 17a-7 under the Investment Company Act of 1940 and were $86,119 and $470,195, respectively. The sale transactions resulted in a net realized loss of $2,213,920.
5. Borrowing Arrangements
During the period January 1, 2015 through April 29, 2015, the Trust participated in a credit facility with JPMorgan Chase Bank, N.A., along with Columbia Acorn Trust, another trust managed by CWAM, in the amount of $150 million. Effective April 30, 2015, the first facility was terminated the Trust entered into a revolving credit facility in the amount of $400 million with a syndicate of banks led by JPMorgan Chase Bank, N.A. to facilitate portfolio liquidity. Under each facility, interest is charged to each participating Fund based on its borrowings at a rate per annum equal to the Federal Funds Rate plus 1.00%. In addition, a commitment fee of 0.08% per annum of the unutilized line of credit is accrued and apportioned among the participating Funds based on their relative net assets. The commitment fee is disclosed as a part of "Other expenses" in the Statement of Operations. The Trust expects to renew this line of credit for one year durations each April at then current market rates and terms.
No amounts were borrowed for the benefit of the Fund under the line of credit during the year ended December 31, 2015.
6. Fund Share Transactions
Proceeds and payments on Fund shares as shown in the Statement of Changes in Net Assets are in respect of the following numbers of shares:
| Year Ended December 31, 2015 | Year Ended December 31, 2014 | ||||||||||
Shares sold | 107,262 | 89,274 | |||||||||
| Shares issued in reinvestment of dividend distributions | 1,795,481 | 852,642 | |||||||||
Less shares redeemed | (2,093,759 | ) | (2,214,780 | ) | |||||||
Net decrease in shares outstanding | (191,016 | ) | (1,272,864 | ) | |||||||
7. Investment Transactions
The aggregate cost of purchases and proceeds from sales other than short-term obligations for the year ended December 31, 2015, were $90,793,077 and $149,419,629, respectively. The amount of purchase and sales activity impacts the portfolio turnover rate reported in the Financial Highlights.
8. Shareholder Concentration
At December 31, 2015, two unaffiliated shareholder accounts owned an aggregate of 89.6% of the outstanding shares of the Fund. The Fund has no knowledge about whether any portion of those shares was owned beneficially by such accounts. Subscription and redemption activity by concentrated accounts may have a significant effect on the operations of the Fund.
9. Subsequent Events
Management has evaluated the events and transactions that have occurred through the date the financial statements were issued and noted no items requiring adjustment of the financial statements or additional disclosure.
10. Information Regarding Pending and Settled Legal Proceedings
Ameriprise Financial and certain of its affiliates have historically been involved in a number of legal, arbitration and regulatory proceedings, including routine litigation,
17
Wanger Select 2015 Annual Report
Notes to Financial Statements, continued
class actions, and governmental actions, concerning matters arising in connection with the conduct of their business activities. Ameriprise Financial believes that the Fund is not currently the subject of, and that neither Ameriprise Financial nor any of its affiliates are the subject of, any pending legal, arbitration or regulatory proceedings that are likely to have a material adverse effect on the Fund or the ability of Ameriprise Financial or its affiliates to perform under their contracts with the Fund. Ameriprise Financial is required to make quarterly (10-Q), annual (10-K) and, as necessary, 8-K filings with the Securities and Exchange Commission on legal and regulatory matters that relate to Ameriprise Financial and its affiliates. Copies of these filings may be obtained by accessing the SEC website at www.sec.gov.
There can be no assurance that these matters, or the adverse publicity associated with them, will not result in increased fund redemptions, reduced sale of fund shares or other adverse consequences to the Fund. Further, although we believe proceedings are not likely to have a material adverse effect on the Fund or the ability of Ameriprise Financial or its affiliates to perform under their contracts with the Fund, these proceedings are subject to uncertainties and, as such, we are unable to estimate the possible loss or range of loss that may result. An adverse outcome in one or more of these proceedings could result in adverse judgments, settlements, fines, penalties or other relief that could have a material adverse effect on the consolidated financial condition or results of operations of Ameriprise Financial.
18
Wanger Select 2015 Annual Report
Report of Independent Registered Public Accounting Firm
To the Board of Trustees and Shareholders of Wanger Select:
In our opinion, the accompanying statement of assets and liabilities, including the statement of investments, and the related statements of operations and of changes in net assets and the financial highlights present fairly, in all material respects, the financial position of Wanger Select (a series of the Wanger Advisors Trust, hereinafter referred to as the "Fund") at December 31, 2015, the results of its operations for the year then ended, the changes in its net assets for each of the two years in the period then ended and the financial highlights for each of the five years in the period then ended, in conformity with accounting principles generally accepted in the United States of America. These financial statements and financial highlights (hereafter referred to as "financial statements") are the responsibility of the Fund's management; our responsibility is to express an opinion on these financial statements based on our audits. We conducted our audits of these financial statements in accordance with the standards of the Public Company Accounting Oversight Board (United States). Those standards require that we plan and perform the audit to obtain reasonable assurance about whether the financial statements are free of material misstatement. An audit includes examining, on a test basis, evidence supporting the amounts and disclosures in the financial statements, assessing the accounting principles used and significant estimates made by management, and evaluating the overall financial statement presentation. We believe that our audits, which included confirmation of securities at December 31, 2015 by correspondence with the custodian and brokers, provide a reasonable basis for our opinion.
PricewaterhouseCoopers LLP
Chicago, Illinois
February 18, 2016
19
Wanger Select 2015 Annual Report
Federal Income Tax Information (Unaudited)
The Fund hereby designates the following tax attributes in the fiscal year ended December 31, 2015.
Tax Designations | |||||||
Dividends Received Deduction | 17.03 | % | |||||
Capital Gain Dividend | $ | 35,279,832 | |||||
Dividends Received Deduction. The percentage of ordinary income distributed during the fiscal year that qualifies for the corporate dividends received deduction.
Capital Gain Dividend. The Fund designates as a capital gain dividend the amount reflected above, or if subsequently determined to be different, the net capital gain of such fiscal period.
20
Wanger Select 2015 Annual Report
Board of Trustees and Management of Wanger Advisors Trust
Each trustee may serve a term of unlimited duration. The Trust's Bylaws generally require that a trustee retire at the end of the calendar year in which the trustee attains the age of 75 years. The trustees appoint their own successors, provided that at least two-thirds of the trustees, after such appointment, have been elected by shareholders. Shareholders may remove a trustee, with or without cause, upon the vote of two-thirds of the Trust's outstanding shares at any meeting called for that purpose. A trustee may be removed, with or without cause, upon the vote of a majority of the trustees. The names of the trustees and officers of the Trust, the date each was first elected or appointed to office and the principal business occupations of each during at least the last five years, and for the trustees, the number of portfolios in the fund complex they oversee and other directorships they hold, are shown below. Each trustee and officer serves in such capacity for each of the four series of Wanger Advisors Trust and for each of the eight series of Columbia Acorn Trust.
The address for the trustees and officers of the Trust is Columbia Wanger Asset Management, LLC, 227 West Monroe Street, Suite 3000, Chicago, Illinois 60606. The Funds' Statement of Additional Information includes additional information about the Funds' trustees and officers. You may obtain a free copy of the Statement of Additional Information by writing or calling toll-free:
Columbia Wanger Asset Management, LLC
Shareholder Services Group
227 W. Monroe, Suite 3000
Chicago IL 60606
1-800-922-6769
| Name and Age at December 31, 2015 | Year First Appointed or Elected to a Board in the Columbia Funds Complex | Principal Occupation(s) During the Past Five Years | Number of Funds in the Columbia Funds Complex Overseen (1) | Other Directorships Held by the Trustee During the Past Five Years in Addition to Columbia Acorn Trust and Wanger Advisors Trust | |||||||||||||||
Independent Trustees: | |||||||||||||||||||
| Laura M. Born, 50, Chair | 2007 | Adjunct Associate Professor of Finance, University of Chicago Booth School of Business since 2007; Director, Carlson Inc. (private global hospitalities and travel company) since 2015; Managing Director—Investment Banking, JP Morgan Chase & Co. (broker-dealer) 2002-2007. | 12 | None. | |||||||||||||||
| Maureen M. Culhane, 67 | 2007 | Retired. Formerly, Vice President, Goldman Sachs Asset Management, L.P. (investment adviser), 2005-2007; Vice President (Consultant)—Strategic Relationship Management, Goldman, Sachs & Co., 1999-2005. | 12 | None. | |||||||||||||||
| Margaret M. Eisen, 62 | 2002 | Trustee, Smith College since 2012; Chief Investment Officer, EAM International LLC (corporate finance and asset management), 2003-2013; Managing Director, CFA Institute, 2005-2008. | 12 | Burnham Investors Trust (3 series). | |||||||||||||||
| Thomas M. Goldstein, 56 | 2014 | Retired. Formerly, Chief Financial Officer, Allstate Protection Division, 2011-2014; Founding Partner, The GRG Group LLC, 2009-2011; Managing Director and Chief Financial Officer, Madison Dearborn Partners, 2007-2009. | 12 | Federal Home Loan Bank—Chicago; Federal Home Loan Mortgage Corporation. | |||||||||||||||
| John C. Heaton, 56 | 2010 | Deputy Dean for Faculty, University of Chicago Booth School of Business; Joseph L. Gidwitz Professor of Finance, University of Chicago Booth School of Business since July 2000. | 12 | None. | |||||||||||||||
| Steven N. Kaplan, 56 | 1999 | Neubauer Family Distinguished Service Professor of Entrepreneurship and Finance, University of Chicago Booth School of Business; faculty member of the University of Chicago Booth School of Business since 1988. | 12 | Accretive Health, Inc. (healthcare management services provider); Morningstar, Inc. (provider of independent investment research). | |||||||||||||||
| Charles R. Phillips, 59 | 2015 | Retired. Director, University of North Carolina School of Law Foundation since 2010. Formerly, Vice Chairman, J.P. Morgan Private Bank, 2011-2014; Managing Director, J.P. Morgan Private Bank, 2001-2011. | 12 | None. | |||||||||||||||
21
Wanger Select 2015 Annual Report
Board of Trustees and Management of Wanger Advisors Trust
| Name and Age at December 31, 2015 | Year First Appointed or Elected to a Board in the Columbia Funds Complex | Principal Occupation(s) During the Past Five Years | Number of Funds in the Columbia Funds Complex Overseen (1) | Other Directorships Held by the Trustee During the Past Five Years in Addition to Columbia Acorn Trust and Wanger Advisors Trust | |||||||||||||||
| David J. Rudis, 62, Vice Chair | 2010 | Retired. Formerly, National Checking and Debit Executive, and Illinois President, Bank of America, 2007-2009; President, Consumer Banking Group, LaSalle National Bank, 2004-2007. | 12 | None. | |||||||||||||||
Interested Trustees: | |||||||||||||||||||
| P. Zachary Egan, 47 (2) | 2015 | President, CWAM and President, Wanger Advisors Trust and Columbia Acorn Trust since April 2014; Global Chief Investment Officer, CWAM since October 2015; International Chief Investment Officer, CWAM, April 2014-September 2015; Director of International Research, CWAM, December 2004-March 2014; Vice President of Columbia Acorn Trust, 2003-2014, and Wanger Advisors Trust, 2007-2014; portfolio manager and analyst, CWAM or its predecessors, since 1999. | 12 | None. | |||||||||||||||
| Ralph Wanger, 81 (3) | 1970 | (4) | Founder, CWAM. Formerly, President, Chief Investment Officer and portfolio manager, CWAM or its predecessors, July 1992-September 2003; Director, Wanger Investment Company PLC; Consultant to CWAM or its predecessors, September 2003-September 2005. | 12 | None. | ||||||||||||||
* * * * *
| Name at Age at December 31, 2015 | Position Held with Columbia Acorn Trust and Wanger Advisors Trust | Year First Appointed or Elected to Office | Principal Occupation(s) During the Past Five Years | ||||||||||||
Officers: | |||||||||||||||
| Alan G. Berkshire, 55 | Vice President | 2015 | Chief Operating Officer, CWAM since April 2015. Formerly, Independent Director, ValueQuest India Moat Fund Limited (Mauritius), April 2014-March 2015; President—North America, Religare Global Asset Management, Inc., June 2011-November 2013; Partner, Estancia Capital Management LLC, September 2009-June 2011. | ||||||||||||
| Michael G. Clarke, 46 | Assistant Treasurer | 2004 | Vice President—Mutual Fund Administration, Columbia Management Investment Advisers, LLC since May 2010; Managing Director of Fund Administration, Columbia Management Advisors, LLC, September 2004-April 2010; Senior officer of Columbia funds and affiliated funds since 2002. | ||||||||||||
| William J. Doyle, 51 | Vice President | 2014 | Portfolio manager and/or analyst, CWAM or its predecessors since 2006; Vice President, Columbia Acorn Trust and Wanger Advisors Trust since 2014. | ||||||||||||
| P. Zachary Egan, 47 (2) | President | 2007 | President, CWAM and President, Wanger Advisors Trust and Columbia Acorn Trust since April 2014; Global Chief Investment Officer, CWAM since October 2015; International Chief Investment Officer, CWAM, April 2014-September 2015; Director of International Research, CWAM, December 2004-March 2014; Vice President of Columbia Acorn Trust, 2003-2014, and Wanger Advisors Trust, 2007-2014; portfolio manager and analyst, CWAM or its predecessors, since 1999. | ||||||||||||
| David L. Frank, 52 | Vice President | 2014 | Portfolio manager and/or analyst, CWAM or its predecessors since 2002; Vice President, Columbia Acorn Trust and Wanger Advisors Trust since 2014. | ||||||||||||
| Paul B. Goucher, 47 | Assistant Secretary | 2015 | Vice President and Lead Chief Counsel, Ameriprise Financial, Inc. since November 2008 and January 2013, respectively (previously Chief Counsel, January 2010-January 2013 and Group Counsel, November 2008-January 2010). | ||||||||||||
| Fritz Kaegi, 44 | Vice President | 2011 | Portfolio manager and/or analyst, CWAM or its predecessors since 2004; Vice President, Columbia Acorn Trust and Wanger Advisors Trust since 2011. | ||||||||||||
22
Wanger Select 2015 Annual Report
Board of Trustees and Management of Wanger Advisors Trust
| Name at Age at December 31, 2015 | Position Held with Columbia Acorn Trust and Wanger Advisors Trust | Year First Appointed or Elected to Office | Principal Occupation(s) During the Past Five Years | ||||||||||||
| John Kunka, 45 | Treasurer | 2006 | Treasurer and Principal Accounting and Financial Officer, Columbia Acorn Trust and Wanger Advisors Trust since 2014; Director of Accounting and Operations, CWAM since May 2006; formerly, Assistant Treasurer, Columbia Acorn Trust and Wanger Advisors Trust 2006-2014. | ||||||||||||
| Stephen Kusmierczak, 48 | Vice President | 2011 | Portfolio manager and/or analyst, CWAM or its predecessors since 2001; Vice President, Columbia Acorn Trust and Wanger Advisors Trust since 2011. | ||||||||||||
| Joseph C. LaPalm, 46 | Vice President | 2006 | Chief Compliance Officer, CWAM since 2005. | ||||||||||||
| Ryan C. Larrenaga, 45 | Assistant Secretary | 2015 | Vice President and Group Counsel, Ameriprise Financial, Inc. since August 2011 (previously, Counsel, May 2010-August 2011); Assistant General Counsel, Bank of America, 2005-April 2010; officer of Columbia funds and affiliated funds since 2005. | ||||||||||||
| Satoshi Matsunaga, 44 | Vice President | 2015 | Portfolio manager and/or analyst, CWAM or its predecessors since 2005; Vice President, Columbia Acorn Trust and Wanger Advisors Trust since 2015. | ||||||||||||
| Thomas P. McGuire, 43 | Chief Compliance Officer | 2015 | Chief Compliance Officer of the Columbia family of mutual funds for which Columbia Management Investment Advisers, LLC serves as investment adviser since 2012; Vice President—Asset Management Compliance, Ameriprise Financial, Inc., since May 2010; Chief Compliance Officer, Ameriprise Certificate Company since September 2010; Compliance Executive, Bank of America, 2005-April 2010. | ||||||||||||
| Charles P. McQuaid, 62 | Vice President | 1992 | (4) | Portfolio manager and/or analyst, CWAM or its predecessors since 1978; Vice President, Columbia Acorn Trust and Wanger Advisors Trust since April 2014; President and Chief Investment Officer, CWAM or its predecessors, October 2003-March 2014, and President, Columbia Acorn Trust and Wanger Advisors Trust, October 2003-March 2014. | |||||||||||
| Louis J. Mendes III, 51 | Vice President | 2003 | International Director of Research, CWAM, since 2015; portfolio manager and/or analyst, CWAM or its predecessors since 2001; Vice President, Columbia Acorn Trust since 2003 and Wanger Advisors Trust since 2005. | ||||||||||||
| Christopher J. Olson, 51 | Vice President | 2001 | Portfolio manager and/or analyst, CWAM or its predecessors since January 2001; Vice President, Columbia Acorn Trust and Wanger Advisors Trust since 2001. | ||||||||||||
| Julian Quero, 48 | Assistant Treasurer | 2015 | Vice President—Tax, Columbia Management Investment Advisers, LLC since 2009. | ||||||||||||
| Matthew S. Szafranski, 38 | Vice President | 2015 | Portfolio manager and/or analyst, CWAM or its predecessors since 2008; Vice President, Columbia Acorn Trust and Wanger Advisors Trust since 2015. | ||||||||||||
| Andreas Waldburg-Wolfegg, 50 | Vice President | 2011 | Portfolio manager and/or analyst, CWAM or its predecessors since 2002; Vice President, Columbia Acorn Trust and Wanger Advisors Trust since 2011. | ||||||||||||
| Linda Roth-Wiszowaty, 46 | Secretary | 2006 | Business support analyst, CWAM since April 2007; Secretary, Columbia Acorn Trust and Wanger Advisors Trust since 2014; Assistant Secretary, Columbia Acorn Trust and Wanger Advisors Trust, 2006-2014. | ||||||||||||
(1) The Trustees oversee the series of Wanger Advisors Trust and Columbia Acorn Trust.
(2) Mr. Egan is an "interested person" of Wanger Advisors Trust, Columbia Acorn Trust, and CWAM, as defined in the 1940 Act, because he is an officer of each Trust and an employee of CWAM.
(3) As permitted under the Trust's Bylaws, Mr. Wanger serves as a non-voting Trustee Emeritus of Wanger Advisors Trust and Columbia Acorn Trust.
(4) Dates prior to 1992 relate to The Acorn Fund, Inc., the predecessor trust to Columbia Acorn Trust.
23
Wanger Select 2015 Annual Report
This page intentionally left blank.
24
Wanger Select 2015 Annual Report
Columbia Wanger Funds
Trustees
Laura M. Born, Chair of the Board
David J. Rudis, Vice Chair of the Board
Maureen M. Culhane
P. Zachary Egan
Margaret M. Eisen
Thomas M. Goldstein
John C. Heaton
Charles R. Phillips
Steven N. Kaplan
Ralph Wanger (Trustee Emeritus)
Officers
P. Zachary Egan
President
Alan G. Berkshire
Vice President
Michael G. Clarke
Assistant Treasurer
William J. Doyle
Vice President
David L. Frank
Vice President
Paul B. Goucher
Assistant Secretary
Fritz Kaegi
Vice President
John M. Kunka
Treasurer and Principal Financial and Accounting Officer
Stephen Kusmierczak
Vice President
Joseph C. LaPalm
Vice President
Ryan C. Larrenaga
Assistant Secretary
Satoshi Matsunaga
Vice President
Thomas P. McGuire
Chief Compliance Officer
Charles P. McQuaid
Vice President
Louis J. Mendes
Vice President
Christopher J. Olson
Vice President
Julian Quero
Assistant Treasurer
Matthew S. Szafranski
Vice President
Andreas Waldburg-Wolfegg
Vice President
Linda K. Roth-Wiszowaty
Secretary
Investment Manager
Columbia Wanger Asset Management, LLC
227 West Monroe Street, Suite 3000
Chicago, Illinois 60606
1-888-4-WANGER
(1-888-492-6437)
Transfer Agent,
Dividend Disbursing Agent
Columbia Management Investment Services Corp.
P.O. Box 8081
Boston, Massachusetts
02266-8081
Distributor
Columbia Management Investment Distributors, Inc.
225 Franklin Street
Boston, Massachusetts
02110
Legal Counsel to the Funds
Perkins Coie LLP
Washington, DC
Legal Counsel to the Independent Trustees
Drinker Biddle & Reath LLP
Philadelphia, Pennsylvania
Independent Registered Public Accounting Firm
PricewaterhouseCoopers LLP
Chicago, Illinois
This document contains Global Industry Classification Standard data. The Global Industry Classification Standard ("GICS") was developed by and is the exclusive property and a service mark of MSCI Inc. ("MSCI") and Standard & Poor's Financial Services LLC ("S&P") and is licensed for use by Columbia Wanger Asset Management, LLC ("CWAM"). Neither MSCI, S&P, nor any other party involved in making or compiling the GICS or any GICS classifications makes any express or implied warranties or representations with respect to such standard or classification (or the results to be obtained by the use thereof), and all such parties hereby expressly disclaim all warranties of originality, accuracy, completeness, merchantability and fitness for a particular purpose with respect to any of such standard or classification. Without limiting any of the foregoing, in no event shall MSCI, S&P, any of their affiliates or any third party involved in making or compiling the GICS or any GICS classifications have any liability for any direct, indirect, special, punitive, consequential or any other damages (including lost profits) even if notified of the possibility of such damages.
This report, including the schedules of investments and financial statements, is submitted for the general information of the shareholders of the Wanger Advisors Trust.
A description of the Fund's proxy voting policies and procedures and a copy of the Fund's voting record for the most recent 12-month period ended June 30 are available (i) on our website, columbiathreadneedle.com/us, (ii) on the Securities and Exchange Commission's website at www.sec.gov, and (iii) without charge, upon request, by calling 888-492-6437.
The Fund files a complete schedule of portfolio holdings with the SEC for the first and third quarters of each fiscal year on Form N-Q. The Fund's Form N-Q is available on the SEC's website at www.sec.gov and may be reviewed and copied at the SEC's Public Reference Room in Washington, D.C. Information on the operation of the Pubic Reference Room may be obtained by calling 800-SEC-0330. The Fund's complete portfolio holdings are disclosed at www.columbiathreadneedle.com/us approximately 30 to 40 days after each month-end.

COLUMBIA WANGER FUNDS
© 2016 Columbia Management Investment Advisers, LLC. All rights reserved. C-1461 G (2/16) 1422101

ANNUAL REPORT
December 31, 2015

COLUMBIA WANGER FUNDS
Managed by Columbia Wanger Asset Management, LLC
WANGER USA

Wanger USA
2015 Annual Report
Table of Contents
| 2 | Understanding Your Expenses | ||||||
| 3 | Behavioral Economics | ||||||
| 6 | Performance Review | ||||||
| 8 | Statement of Investments | ||||||
| 14 | Statement of Assets and Liabilities | ||||||
| 14 | Statement of Operations | ||||||
| 15 | Statement of Changes in Net Assets | ||||||
| 16 | Financial Highlights | ||||||
| 17 | Notes to Financial Statements | ||||||
| 20 | Report of Independent Registered Public Accounting Firm | ||||||
| 21 | Federal Income Tax Information (Unaudited) | ||||||
22 | Board of Trustees and Management of Wanger Advisors Trust | ||||||
Columbia Wanger Asset Management, LLC (CWAM) is one of the leading global small- and mid-cap equity managers in the United States with over 40 years of small- and mid-cap investment experience. As of December 31, 2015, CWAM managed $20 billion in assets. CWAM is the investment manager to Wanger USA, Wanger International, Wanger Select and Wanger International Select (together, the Columbia Wanger Funds) and the Columbia Acorn Family of Funds.
An important note: Columbia Wanger Funds are available only through variable annuity contracts and variable life insurance policies issued by participating insurance companies or certain eligible retirement plans. Columbia Wanger Funds are not offered directly to the public and are not available in all contracts, policies or plans. Contact your financial advisor or insurance representative for more information. Columbia Wanger Funds are distributed by Columbia Management Investment Distributors, Inc., member FINRA, and are managed by CWAM.
Investors should carefully consider investment objectives, risks and expenses of the Fund before investing. For variable fund and variable contract prospectuses, which contain this and other important information, including the fees and expenses imposed under your contract, investors should contact their financial advisor or insurance representative. Read the prospectus for the Fund and your variable contract carefully before investing.
The views expressed in "Behavioral Economics" and in the Performance Review reflect the current views of the respective authors. These views are not guarantees of future performance and involve certain risks, uncertainties and assumptions that are difficult to predict, so actual outcomes and results may differ significantly from the views expressed. These views are subject to change at any time based upon economic, market or other conditions and the respective parties disclaim any responsibility to update such views. These views may not be relied on as investment advice and, because investment decisions for a Columbia Wanger Fund are based on numerous factors, may not be relied on as an indication of trading intent on behalf of any particular Columbia Wanger Fund. References to specific company securities should not be construed as a recommendation or investment advice.
1
Wanger USA 2015 Annual Report
Understanding Your Expenses
As a shareholder, you incur three types of costs. There are transaction costs, which generally include sales charges on purchases and may include redemption fees. There are also ongoing costs, which generally include management fees and other expenses for Wanger USA (the Fund). Lastly, there may be additional fees or charges imposed by the insurance company that sponsors your variable annuity and/or variable life insurance product. The following information is intended to help you understand your ongoing costs (in dollars) of investing in the Fund and to help you compare these costs with the ongoing costs of investing in other mutual funds.
Analyzing your Fund's expenses
To illustrate these ongoing costs, we have provided an example and calculated the expenses paid by investors in the Fund during the period. The actual and hypothetical information in the table below is based on an initial investment of $1,000 at the beginning of the period indicated and held for the entire period. Expense information is calculated two ways and each method provides you with different information. The amount listed in the "Actual" column is calculated using the Fund's actual operating expenses and total return for the period. You may use the Actual information, together with the amount invested, to estimate the expenses that you paid over the period. Simply divide your account value by $1,000 (for example, an $8,600 account value divided by $1,000 = 8.6), then multiply the results by the expenses paid during the period under the Actual column. The amount listed in the "Hypothetical" column assumes a 5% annual rate of return before expenses (which is not the Fund's actual return) and then applies the Fund's actual expense ratio for the period to the hypothetical return. You should not use the hypothetical account values and expenses to estimate either your actual account balance at the end of the period or the expenses you paid during the period. See "Compare with other funds" below for details on how to use the hypothetical data.
Compare with other funds
Since all mutual funds are required to include the same hypothetical calculations about expenses in shareholder reports, you can use this information to compare the ongoing cost of investing in the Fund with other funds. To do so, compare the hypothetical example with the 5% hypothetical examples that appear in the shareholder reports of other funds. As you compare hypothetical examples of other funds, it is important to note that hypothetical examples are meant to highlight the ongoing cost of investing in a fund only and do not reflect any transaction costs, such as sales charges, redemption or exchange fees. Therefore, the hypothetical calculations are useful in comparing ongoing costs only, and will not help you determine the relative total costs of owning different funds. If transaction costs were included in these calculations, your costs would be higher.
July 1, 2015 – December 31, 2015
| Account value at the beginning of the period ($) | Account value at the end of the period ($) | Expenses paid during period ($) | Fund's annualized expense ratio (%)* | ||||||||||||||||||||||||||||
Actual | Hypothetical | Actual | Hypothetical | Actual | Hypothetical | ||||||||||||||||||||||||||
Wanger USA | 1,000.00 | 1,000.00 | 921.40 | 1,019.96 | 5.04 | 5.30 | 1.04 | ||||||||||||||||||||||||
* Expenses paid during the period are equal to the Fund's annualized expense ratio, multiplied by the average account value over the period, then multiplied by the number of days in the Fund's most recent fiscal half-year and divided by 365.
It is important to note that the expense amounts shown in the table are meant to highlight only ongoing costs of investing in the Fund. Expenses paid during the period do not include any insurance charges imposed by your insurance company's separate account. The hypothetical example provided is useful in comparing ongoing costs only and will not help you determine the relative total costs of owning different funds whose shareholders may incur transaction costs.
2
Wanger USA 2015 Annual Report
Behavioral Economics
People Occasionally Behave Irrationally
Economists have traditionally assumed that people rationally optimize in their own self-interest. A free-market economy dominated by "homo economicus" prospers as producers of goods and services trade with each other, as if driven by an invisible hand. In the past few decades, however, behavioral economics has emerged, refuting the rational optimization assumption. Nobel Prize winning Princeton professor Daniel Kahneman's book Thinking, Fast and Slow explains the habits and biases that cause people to make predictable errors.
Illustrating that people tend to make quick, intuitive decisions rather than well thought out ones, Kahneman asked Ivy League students the following question: A bat and a ball cost $1.10. The bat costs $1.00 more than the ball. How much does the ball cost? Over half of students answered $0.10, though the correct answer is $0.05.
Kahneman also points out that people generally have a confirmation bias.1 Good scientific method calls for people to test a hypothesis by attempting to refute it, but instead people seek data that confirms their beliefs. We would rather keep our beliefs than seriously analyze and challenge them.
Individuals also exhibit an anchoring effect. Kahneman and his associate Amos Tversky devised several experiments that first provided a high or low number (from a rigged "wheel of fortune" or in a text) and then asked for best-guess estimates for unrelated data. Subjects who were provided high numbers gave high estimates and vice versa. People tend to "anchor" on an initial number provided and then move toward an unbiased estimate. When the Exploratorium Museum in San Francisco polled visitors about contributing to a particular cause without providing a suggested contribution amount, visitors on average said they would donate $64. When $5 was suggested as a donation, the average response was $20, and when $400 was suggested, the average jumped to $143.2 It seems as though many charities understand the anchoring effect.
Kahneman identified an availability bias. People base their knowledge, opinions and actions on small samples of information readily available to them. Estimates of causes of death are warped by media coverage. For example, strokes cause almost twice as many deaths as all accidents combined, but 80% of respondents said accidental deaths were more likely.3
Kahneman and Tversky did many behavioral studies, and their largest contribution to behavioral economics is their work on decision making in risky situations. Subjects were asked to make the following two choices concurrently:
Choose between:
A. a sure gain of $240
B. 25% chance to win $1,000 and a 75% chance to gain nothing
Choose between:
C. a sure loss of $750
D. 75% chance to lose $1,000 and a 25% chance to lose nothing
People are risk averse with respect to gains; 84% of subjects chose A, accepting a lower expected value than B.4 However, people are risk seeking with respect to losses. People hate to lose and will take a chance of a greater loss in exchange for a chance not to lose; 87% chose D.5
Despite the instructions, subjects appeared to make these choices sequentially rather than concurrently. They framed the exercise as two separate choices. Choosing A and D provides a net result of a 75% chance to lose $760 and a 25% chance of gaining $240. People solving the problems concurrently and rationally would have chosen C and B, which provides a net result of a 75% chance to lose $750 and a 25% chance to gain $250. Choosing C and B together results in the same odds, yet $10 more under either scenario.
Given our biases, how a choice is framed heavily influences our decisions. Would you accept a gamble that offers a 10% chance to win $95 and a 90% chance to lose $5? Would you pay $5 to participate in a lottery that offers a 10% chance to win $100 and a 90% chance to win nothing?
Many more people accept the second opportunity than the first, even though the choices are identical. The first clearly frames the $5 as a loss, while the second suggests the $5 is a sunk cost. 6
Kahneman and Tversky also did a study to determine values people assign to probabilities, what they called decision weights. People provided zero value to a zero probability and a value of 100 to a sure thing, but the values in between were interesting:7
Probability | 1 | % | 10 | % | 50 | % | 90 | % | 99 | % | |||||||||||||
| Decision Weight | 5.5 | 18.6 | 42.1 | 71.2 | 91.2 | ||||||||||||||||||
What the data shows is that people are often willing to overpay for small probabilities, a tendency known as the possibility effect. That is why lotteries exist. Yet people underpay relatively more for large but not certain probabilities. To eliminate those last bits of uncertainty, people are willing to pay a lot, a tendency known as the certainty effect.
Richard Thaler, a University of Chicago professor of behavioral science and economics, worked with Kahneman and Tversky on several studies. Jointly, they defined the endowment effect, which states that once someone owns something, he tends to place an irrationally high value on it. Thaler and Kahneman experimented by giving some subjects coffee mugs decorated with university insignia. Participants were asked to provide the prices at which they would sell. Other subjects were not given mugs and were asked what prices they would bid for the mugs. The average selling price was about double the average buying price!8
Thaler agrees with Kahneman's findings that people are risk seeking with respect to losses, both prospectively and retrospectively. People who are losing money at a racetrack tend to bet on longshots for the last race of the day, hoping to recoup losses, effectively driving the expected return of the last race even more against them!9 Financial institutions need to watch losing traders very closely, as rogue traders repeatedly double down in hopes of recouping losses.
3
Wanger USA 2015 Annual Report
Thaler's work indicates that people create mental accounts, treating some money differently depending on its intended use. Cash accounts are for spending, other funds are for savings, and retirement accounts are sacrosanct.10 People may borrow at high interest rates on their charge cards while receiving low interest rates on savings, which appears irrational.
Thaler notes that Economics 101 classes typically teach that prices should rationally rise when there is an unanticipated increase in demand. I remember learning that it would be rational for merchants to raise the price of snow shovels after a blizzard and plywood before a hurricane. The products would be rationed by price to those most in need and capable of paying, and additional revenues would induce costly special increases in supply. Thaler's work, however, indicates that most people would consider such increases as unfair price gouging, and would later penalize those merchants.
Policy Implications
Public policies are often impacted by people's emotional reaction under the availability bias. Former Administrator of the White House Office of Information and Regulatory Affairs, Cass Sunstein, has analyzed resulting regulations and notes that poor regulations waste time and money. Rational weighting of costs and benefits would result in better regulations and improved outcomes.11
Kahneman points out that as an extension of the possibility effect, people tend to be confounded by exceptionally small probabilities,12 and either ignore them or give them way too much attention. The precautionary principle, which prohibits any action that might cause harm, is the result. Sunstein believes that many innovations including airplanes, antibiotics, automobiles, chlorination, vaccinations and x-rays would have not passed strict interpretation of the precautionary principle.13
Thaler's work explains one of the reasons why policy makers prefer modest inflation. People consider outright wage cuts as unfair, even when unemployment is high and the employer is
earning only a small profit. But a flat wage when there is inflation is not considered unfair, even though real wages drop.14 Therefore, the economy can more easily rationalize costs in a recession with some inflation rather than none.
Thaler devised a plan to induce people to contribute more to 401K plans called "Save More Tomorrow." Many people don't contribute to their 401K plan because that would mean an immediate take-home pay cut, frowned on by the endowment effect. Instead, the plan has people sign up now to contribute upon their next raise in pay. They then forgo some or the entire raise, but save for retirement without taking a pay cut. Employees of the first company that adopted the plan nearly quadrupled their savings rate after four annual raises.15
Thaler and Sunstein's book Nudge cites numerous ways that individuals can be "nudged" to make better decisions. For example, default options are considered standard and most people don't extend the effort to make a different choice. Germans need to opt in for organ donations, and only 12% do. Austrians need to opt out of organ donations, and 99% allow their organs to be donated.16
Investment Implications
Kahneman notes that experienced traders in financial markets tend to more rationally deal with risk aversion than individual investors. Most people weight losses twice as much as gains,17 and if each transaction is framed individually, irrational risk aversion results. By framing gains and losses over longer periods rather than individually, traders can accept individual rational risks. To mitigate this bias, Kahneman suggests that individual investors view the market prices of their investments less frequently.18
Thaler agrees, as he conducted an experiment simulating endowment management. Some subjects were shown results eight times per simulated calendar year, while others were shown results once per simulated year. Those seeing results more frequently chose to invest 41% in stocks and those seeing results just
once a year had 70% in stocks.19 Myopic risk aversion helps explain why stocks provided a 7% premium compound rate of return over risk-free securities for the last two centuries,20 a huge premium that cannot be otherwise explained by economic theory.21
Individuals tend to be terrible stock traders. One study indicated that stocks sold by individuals outperformed stocks they bought by 3.2% per year, before transactions costs. Individual investors tend to sell winners even though recent winners on average outperform recent losers in the short term. Individuals tend to keep losers, as they are averse to taking losses and have anchored on purchase prices as target sale prices for losers.22 Losers on average underperform in the short term.23
Mental accounts result in the house money effect for gamblers and investors. People are more prone to lose their risk aversion on gains when they are ahead. This can result in gamblers not knowing when to quit, and investors creating bubbles.24
Humans, including many professional money managers, seem to be hard wired to invest poorly, to "buy high and sell low." Behavioral economics helps explain why. One solution to offset this tendency is to own Columbia Thermostat Fund, which takes emotions out of investing and automatically invests more in stocks when the market drops and automatically sells stocks when the market rises.25


Charles P. McQuaid
Portfolio Manager, Analyst and Advisor
Columbia Wanger Asset Management, LLC
4
Wanger USA 2015 Annual Report
The information and data provided in this analysis are derived from sources that we deem to be reliable and accurate. These views are not guarantees of future performance and involve certain risks, uncertainties and assumptions that are difficult to predict so actual outcomes and results may differ significantly from the views expressed. The views/opinions expressed here are those of the author and not of the Wanger Advisors Trust Board of Trustees, are subject to change at any time based upon economic, market or other conditions, may differ from views expressed by other Columbia Management associates and the respective parties disclaim any responsibility to update such views. These views may not be relied on as investment advice and, because investment decisions for a Columbia Wanger Fund are based on numerous factors, may not be relied on as an indication of trading intent on behalf of any particular Columbia Wanger Fund.
The author would like to thank Colin Moore, Global Chief Investment Officer of Columbia Threadneedle Investments, for suggesting Beyond Greed and Fear, which summarizes behavioral economics for investors. He would also like to thank recently retired Wanger Advisors Trust Chief Compliance Officer Robert Scales for suggesting Thinking, Fast and Slow.
1 Daniel Kahneman, Thinking, Fast and Slow (New York, Farrar, Straus and Giroux, 2011), p. 81.
2 Ibid., p. 125.
3 Ibid., p. 138.
4 Expected value is the sum of probabilities times dollars.
5 Kahneman, op. cit., p. 437.
6 Ibid., p. 364.
7 Ibid., p. 315.
8 Ibid., p. 295.
9 Richard H. Thaler, Misbehaving: The Making of Behavioral Economics (New York, W. W. Norton & Company, Inc., 2015), p. 80.
10 Ibid., p. 76.
11 Kahneman, op. cit., p. 141.
12 Somehow this one is not labelled as a particular bias or effect.
13 Kahneman, op. cit., p. 351.
14 Thaler, op. cit., p. 132.
15 Ibid., p. 318.
16 Richard H. Thaler and Cass R. Sunstein, Nudge: Improving Decisions About Health, Wealth, and Happiness (New Haven, Connecticut, Yale University Press, 2008), p. 178-179.
17 Kahneman, op. cit., p. 349.
18 Ibid., p. 339.
19 Thaler, op. cit., p. 197.
20 Hersh Shefrin, Beyond Greed and Fear: Understanding Behavioral Finance and the Psychology of Investing (New York, Oxford University Press, 2002), p. 37.
21 Thaler, op. cit., p. 192.
22 In Beyond Greed and Fear, Shefrin labels this as "Get-evenitis."
23 Kahneman, op. cit., p. 213-214.
24 Thaler, op. cit., p. 83.
25 If interested, please see Columbia Thermostat Fund's prospectus, which can be found at columbiathreadneedle.com/us.
5
Wanger USA 2015 Annual Report
Performance Review Wanger USA
|
| ||||||
| Matthew A. Litfin Lead Portfolio Manager* | William J. Doyle Co-Portfolio Manager | ||||||


Market risk may affect a single issuer, sector of the economy, industry or the market as a whole. Investments in small- and mid-cap companies involve risks and volatility and possible illiquidity greater than investments in larger, more established companies. The Fund may invest significantly in issuers within a particular sector, which may be negatively affected by market, economic or other conditions, making the Fund more vulnerable to unfavorable developments in the sector.
Wanger USA ended the year 380 basis points† ahead of the Russell 2000 Index, its primary benchmark. While the benchmark declined 4.41%, the Fund was down 0.61%. Strong stock selection in the health care, information technology and financial sectors contributed to the Fund's relative outperformance.
Increased acquisition activity also boosted Fund performance in 2015. Within the health care sector, biotech Synageva BioPharma's mid-year acquisition announcement drove a 120% gain in its stock. In the fourth quarter, HomeAway, a vacation rental online marketplace, announced that it was being acquired by Expedia, making it the twelfth Fund holding acquired during the year. We sold HomeAway on the news, capturing an 18% gain for the annual period.
We reduced the Fund's exposure to the industrial sector in the last few months of the year, although we maintained an overweight position relative to the benchmark. The strong U.S. dollar has created a headwind for global industrials, and falling oil prices have hurt companies tied to the energy market. We reduced our weighting in underperforming names like Donaldson, a manufacturer of industrial air filtration equipment, and Nordson, a provider of dispensing systems for adhesives and coatings, which are exposed to these macroeconomic factors. We focused the majority of the Fund's industrial weighting in more U.S.-oriented companies that we believe are well positioned in the current economic environment. HEICO, a manufacturer of aircraft replacement parts, was the Fund's largest position at year end. Up 4% for the year, HEICO's replacement part business is less economically sensitive and its management has been a creator of value over a multi-year period. Benefiting from a continued recovery in demand for recreational vehicles, Drew Industries, a provider of RV and manufactured home components, was a top contributor within the industrial sector, up 23% for the year.
Other winners for the annual period included orphan drug developers Ultragenyx Pharmaceutical and Sarepta Therapeutics, which gained over 150% each in Wanger USA for the year. As a real estate investment trust, the strong performance of Extra Space Storage contributed to the
Fund's relative outperformance in the financial sector for the year. Up 54%, Extra Space's same-store operating income growth was driven by limited new storage space development across the industry, record occupancies and increasing rents.
Car rental companies Avis Budget Group and Hertz each declined roughly 45% in 2015 and ranked among the Fund's largest detractors, falling as overcapacity negatively impacted pricing. Cepheid, a provider of molecular diagnostic supplies, dropped 32% on softer-than-expected quarterly results and reduced 2015 financial guidance.
Profitable growth has been harder to find throughout the world, even in the United States. We will continue to focus on what we believe to be high-quality, small-cap growth stocks that have the potential to grow even in an uncertain environment. We believe high-quality companies, with industry-leading positions and strong balance sheets that are underpriced relative to their true value, will likely fare relatively well in 2016.
*Effective January 1, 2016, Matthew A. Litfin was named lead portfolio manager of Wanger USA. Mr. Doyle continues in his role as co-portfolio manager of the Fund. Mr. Litfin joined CWAM in December 2015 and also serves as the firm's Domestic Director of Research. He brings more than 20 years of investment experience to the Fund. Mr. Litfin did not serve as a portfolio manager of the Fund during 2015.
Fund holdings are as of the date given, are subject to change at any time, and are not recommendations to buy or sell any security.
† A basis point is 1/100 of a percent.
6
Wanger USA 2015 Annual Report
Growth of a $10,000 Investment in Wanger USA
May 3, 1995 (inception date) through December 31, 2015
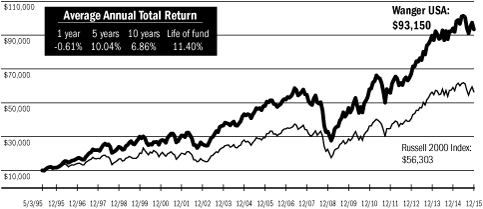
Performance data shown represents past performance and is not a guarantee of future results. The investment return and principal value will fluctuate so that shares, when redeemed, may be worth more or less than the original cost. Current performance may be lower or higher than the performance data shown. Performance results reflect any fee waivers or reimbursements of Fund expenses by the investment manager and/or any of its affiliates. Absent these fee waivers and/or expense reimbursement arrangements, performance results would have been lower. For most recent month-end performance updates, please visit columbiathreadneedle.com/us.
This graph compares the results of $10,000 invested in Wanger USA on May 3, 1995 (the date the Fund began operations) through December 31, 2015, to the Russell 2000 Index, with dividends and capital gains reinvested. Although the index is provided for use in assessing the Fund's performance, the Fund's holdings may differ significantly from those in the index.
Top 10 Holdings
As a percentage of net assets, as of 12/31/15
| 1. HEICO FAA-approved Aircraft Replacement Parts | 3.4 | % | |||||
| 2. Extra Space Storage Self Storage Facilities | 3.0 | ||||||
| 3. Ametek Aerospace/Industrial Instruments | 3.0 | ||||||
| 4. Nordson Dispensing Systems for Adhesives & Coatings | 2.8 | ||||||
| 5. Drew Industries RV & Manufactured Home Components | 2.3 | ||||||
| 6. Ansys Simulation Software for Engineers & Designers | 2.2 | ||||||
| 7. ExlService Holdings Business Process Outsourcing | 2.0 | ||||||
| 8. Cepheid Molecular Diagnostics | 1.9 | ||||||
| 9. Donaldson Industrial Air Filtration | 1.8 | ||||||
| 10. SPS Commerce Supply Chain Management Software Delivered via the Web | 1.8 | ||||||
Top holdings exclude short-term holdings and cash, if applicable.
Top 5 Industries
As a percentage of net assets, as of 12/31/15
Information | 26.6 | % | |||||
Industrial Goods & Services | 20.8 | ||||||
Consumer Goods & Services | 16.1 | ||||||
Health Care | 12.8 | ||||||
Finance | 10.7 | ||||||
Results as of December 31, 2015
4th quarter* | 1 year | 5 years | 10 years | ||||||||||||||||
Wanger USA | 2.62 | % | -0.61 | % | 10.04 | % | 6.86 | % | |||||||||||
Russell 2000 Index** | 3.59 | -4.41 | 9.19 | 6.80 | |||||||||||||||
* Not annualized.
** The Fund's primary benchmark.
NAV as of 12/31/15: $31.75
Performance numbers reflect all Fund expenses but do not include any fees and expenses imposed under your variable annuity contract or life insurance policy or qualified pension or retirement plan. If performance numbers included the effect of these additional charges, they would be lower.
The Fund's annual operating expense ratio of 0.96% is stated as of the Fund's prospectus dated May 1, 2015, and differences in expense ratios disclosed elsewhere in this report may result from including fee waivers and/or expense reimbursements as well as different time periods used in calculating the ratios.
All results shown assume reinvestment of distributions.
The Russell 2000 Index measures the performance of the 2,000 smallest companies in the Russell 3000 Index, which represents approximately 10% of the total market capitalization of the Russell 3000 Index. Indexes are not managed and do not incur fees or expenses. It is not possible to invest directly in an index.
Portfolio characteristics and holdings are subject to change periodically and may not be representative of current characteristics and holdings.
7
Wanger USA 2015 Annual Report
Wanger USA
Statement of Investments, December 31, 2015
| Number of Shares | Value | ||||||||||
Equities – 93.9% | |||||||||||
Information – 26.6% | |||||||||||
Business Software – 8.5% | |||||||||||
166,946 | Ansys (a) Simulation Software for Engineers & Designers | $ | 15,442,505 | ||||||||
178,330 | SPS Commerce (a) Supply Chain Management Software Delivered via the Web | 12,520,549 | |||||||||
152,484 | DemandWare (a) E-Commerce Website Platform for Retailers & Apparel Manufacturers | 8,229,562 | |||||||||
329,006 | Textura (a) (b) Construction Vendor Management Software | 7,099,949 | |||||||||
184,062 | Cvent (a) Software for Corporate Event Planners & Marketing Platform for Hotels | 6,425,604 | |||||||||
71,169 | NetSuite (a) (b) Enterprise Software Delivered via the Web | 6,022,321 | |||||||||
491,228 | Amber Road (a) (b) Global Trade Management Software Delivered via the Web | 2,500,351 | |||||||||
95,611 | inContact (a) Call Center Systems Delivered via the Web & Telco Services | 912,129 | |||||||||
59,152,970 | |||||||||||
Computer Services – 4.2% | |||||||||||
300,619 | ExlService Holdings (a) Business Process Outsourcing | 13,506,812 | |||||||||
168,038 | Virtusa (a) Offshore IT Outsourcing | 6,946,691 | |||||||||
198,749 | WNS – ADR (a) Offshore Business Process Outsourcing Services | 6,198,981 | |||||||||
159,482 | Hackett Group IT Integration & Best Practice Research | 2,562,876 | |||||||||
29,215,360 | |||||||||||
Instrumentation – 3.0% | |||||||||||
136,106 | IPG Photonics (a) Fiber Lasers | 12,135,211 | |||||||||
25,787 | Mettler-Toledo International (a) Laboratory Equipment | 8,745,145 | |||||||||
20,880,356 | |||||||||||
| Number of Shares | Value | ||||||||||
Semiconductors & Related Equipment – 2.1% | |||||||||||
100,336 | Monolithic Power Systems High Performance Analog & Mixed Signal Integrated Circuits | $ | 6,392,406 | ||||||||
37,379 | Littelfuse Little Fuses | 3,999,927 | |||||||||
| 48,996 | MA-COM Technology Solutions Holdings (a) Radio Frequency, Microwave & Millimeterwave Semiconductors | 2,003,446 | |||||||||
114,600 | Knowles (a) (b) Microphones & Speakers for Mobile Devices & other Electronics | 1,527,618 | |||||||||
848,754 | Rubicon Technology (a) (b) Producer of Sapphire for the Lighting, Electronics & Automotive Industries | 967,580 | |||||||||
14,890,977 | |||||||||||
Financial Processors – 1.6% | |||||||||||
172,325 | CoreLogic (a) Data Processing Services for Real Estate, Insurance, & Mortgages | 5,834,925 | |||||||||
81,294 | Global Payments Credit Card Processor | 5,244,276 | |||||||||
11,079,201 | |||||||||||
Business Information & Marketing Services – 1.5% | |||||||||||
490,631 | Bankrate (a) Internet Advertising for the Insurance, Credit Card & Banking Markets | 6,525,392 | |||||||||
259,558 | Navigant Consulting (a) Financial Consulting Firm | 4,168,502 | |||||||||
10,693,894 | |||||||||||
Telephone & Data Services – 1.4% | |||||||||||
505,623 | Lumos Networks Telephone & Fiber Optic Data Services | 5,662,978 | |||||||||
450,759 | Boingo Wireless (a) Wi-Fi & Cellular Communications Networks | 2,984,024 | |||||||||
69,835 | GTT Communications (a) Provider of High Capacity Data Transit | 1,191,385 | |||||||||
9,838,387 | |||||||||||
See accompanying notes to financial statements.
8
Wanger USA 2015 Annual Report
Wanger USA
Statement of Investments, December 31, 2015
| Number of Shares | Value | ||||||||||
Mobile Communications – 1.1% | |||||||||||
232,878 | Gogo (a) (b) Provider of Wi-Fi on Airplanes | $ | 4,145,228 | ||||||||
1,303,148 | Globalstar (a) Satellite Mobile Voice & Data Carrier | 1,876,533 | |||||||||
128,333 | Global Eagle Entertainment (a) Provider of Entertainment & Wi-Fi on Airplanes | 1,266,647 | |||||||||
7,288,408 | |||||||||||
Telecommunications Equipment – 1.0% | |||||||||||
256,543 | Infinera (a) Optical Networking Equipment | 4,648,559 | |||||||||
104,398 | CalAmp (a) Machine-to-machine Communications | 2,080,652 | |||||||||
6,729,211 | |||||||||||
Contract Manufacturing – 0.8% | |||||||||||
254,633 | Sanmina (a) Electronic Manufacturing Services | 5,240,347 | |||||||||
Internet Related – 0.8% | |||||||||||
599,618 | Vonage (a) Business & Consumer Internet Telephony | 3,441,808 | |||||||||
181,148 | RetailMeNot (a) Digital Coupon Marketplace | 1,796,988 | |||||||||
5,238,796 | |||||||||||
Computer Hardware & Related Equipment – 0.6% | |||||||||||
79,202 | Rogers (a) Printed Circuit Materials & High Performance Foams | 4,084,447 | |||||||||
Total Information | 184,332,354 | ||||||||||
Industrial Goods & Services – 20.8% | |||||||||||
Machinery – 17.6% | |||||||||||
476,003 | HEICO FAA-approved Aircraft Replacement Parts | 23,419,348 | |||||||||
381,268 | Ametek Aerospace/Industrial Instruments | 20,432,152 | |||||||||
301,077 | Nordson Dispensing Systems for Adhesives & Coatings | 19,314,089 | |||||||||
440,547 | Donaldson Industrial Air Filtration | 12,626,077 | |||||||||
161,139 | Toro Turf Maintenance Equipment | 11,774,427 | |||||||||
| Number of Shares | Value | ||||||||||
217,153 | Generac (a) (b) Standby Power Generators | $ | 6,464,645 | ||||||||
132,163 | Dorman Products (a) Aftermarket Auto Parts Distributor | 6,273,778 | |||||||||
99,758 | Moog (a) Motion Control Products for Aerospace, Defense & Industrial Markets | 6,045,335 | |||||||||
154,153 | ESCO Technologies Industrial Filtration & Advanced Measurement Equipment | 5,571,089 | |||||||||
51,024 | Middleby (a) Manufacturer of Cooking Equipment | 5,503,959 | |||||||||
120,889 | Oshkosh Corporation Specialty Truck Manufacturer | 4,719,506 | |||||||||
122,144,405 | |||||||||||
Industrial Materials & Specialty Chemicals – 2.4% | |||||||||||
265,757 | Drew Industries RV & Manufactured Home Components | 16,181,944 | |||||||||
Construction – 0.6% | |||||||||||
374,160 | PGT (a) Wind Resistant Windows & Doors | 4,261,682 | |||||||||
Electrical Components – 0.2% | |||||||||||
83,344 | Thermon (a) Global Engineered Thermal Solutions | 1,410,181 | |||||||||
Total Industrial Goods & Services | 143,998,212 | ||||||||||
Consumer Goods & Services – 16.1% | |||||||||||
Retail – 3.9% | |||||||||||
291,179 | The Fresh Market (a) Specialty Food Retailer | 6,819,412 | |||||||||
153,318 | Blue Nile (a) Online Jewelry Retailer | 5,692,698 | |||||||||
152,962 | Cato Women's Apparel Retailing, Focusing on Private Labels & Low Prices | 5,632,061 | |||||||||
38,807 | Casey's General Stores Owner/Operator of Convenience Stores | 4,674,303 | |||||||||
59,016 | Fossil (a) (b) Watch Designer & Retailer | 2,157,625 | |||||||||
34,551 | Five Below (a) Low-price Specialty Retailer Targeting Pre-teens, Teens & Parents | 1,109,087 | |||||||||
See accompanying notes to financial statements.
9
Wanger USA 2015 Annual Report
Wanger USA
Statement of Investments, December 31, 2015
| Number of Shares | Value | ||||||||||
Retail – 3.9% (cont) | |||||||||||
125,272 | Gaiam (a) Promoter of Healthy Living through Catalogs, E-Commerce & Gaiam TV | $ | 781,697 | ||||||||
26,866,883 | |||||||||||
Travel – 3.0% | |||||||||||
58,408 | Vail Resorts Ski Resort Operator & Developer | 7,475,640 | |||||||||
116,003 | Liberty TripAdvisor Holdings Class A (a) Holdings Company for Trip Advisor | 3,519,531 | |||||||||
245,048 | Hertz (a) U.S. Rental Car Operator | 3,487,033 | |||||||||
95,677 | Avis Budget Group (a) Car Rental Company | 3,472,118 | |||||||||
51,755 | Choice Hotels Franchisor of Budget Hotel Brands | 2,608,970 | |||||||||
20,563,292 | |||||||||||
Other Durable Goods – 2.9% | |||||||||||
114,199 | Cavco Industries (a) Manufactured Homes | 9,513,919 | |||||||||
273,965 | Select Comfort (a) Specialty Mattresses | 5,865,591 | |||||||||
289,963 | Gentex Manufacturer of Auto Parts | 4,642,307 | |||||||||
20,021,817 | |||||||||||
Restaurants – 1.9% | |||||||||||
136,071 | Papa John's International Franchisor of Pizza Restaurants | 7,602,287 | |||||||||
171,930 | Fiesta Restaurant Group (a) Owner/Operator of Two Restaurant Chains: Pollo Tropical & Taco Cabana | 5,776,848 | |||||||||
13,379,135 | |||||||||||
Other Consumer Services – 1.7% | |||||||||||
216,998 | Blackhawk Network (a) Third-party Distributor of Prepaid Content, Mostly Gift Cards | 9,593,481 | |||||||||
362,929 | Quotient Technology (a) (b) Allows CPGs to Digitally Distribute Coupons, Advertising & Trade Promotion | 2,475,176 | |||||||||
12,068,657 | |||||||||||
| Number of Shares | Value | ||||||||||
Furniture & Textiles – 0.8% | |||||||||||
278,046 | Knoll Office Furniture | $ | 5,227,265 | ||||||||
Nondurables – 0.8% | |||||||||||
381,507 | HRG Group (a) Holding Company | 5,173,235 | |||||||||
Consumer Goods Distribution – 0.5% | |||||||||||
33,904 | Pool Swimming Pool Supplies & Equipment Distributor | 2,738,765 | |||||||||
49,408 | The Chefs' Warehouse (a) Distributor of Specialty Foods to Fine Dining Restaurants | 824,125 | |||||||||
3,562,890 | |||||||||||
Leisure Products – 0.4% | |||||||||||
187,645 | Arctic Cat Manufacturer of ATVs & Snowmobiles | 3,073,625 | |||||||||
Consumer Electronics – 0.2% | |||||||||||
44,100 | iRobot (a) (b) Home Robots (Vacuums, Pool Cleaners) & Battlefield Reconnaissance Robots | 1,561,140 | |||||||||
Total Consumer Goods & Services | 111,497,939 | ||||||||||
Health Care – 12.8% | |||||||||||
Medical Supplies – 3.9% | |||||||||||
354,562 | Cepheid (a) Molecular Diagnostics | 12,952,150 | |||||||||
232,077 | VWR (a) Distributor of Lab Supplies | 6,570,100 | |||||||||
53,062 | Bio-Techne Maker of Consumables & Systems for the Life Science Market | 4,775,580 | |||||||||
234,539 | Fluidigm (a) Life Sciences Equipment & Consumables | 2,535,366 | |||||||||
26,833,196 | |||||||||||
Biotechnology & Drug Delivery – 3.8% | |||||||||||
85,708 | Ultragenyx Pharmaceutical (a) Biotech Focused on "Ultra-Orphan" Drugs | 9,614,723 | |||||||||
106,846 | Seattle Genetics (a) Antibody-based Therapies for Cancer | 4,795,249 | |||||||||
See accompanying notes to financial statements.
10
Wanger USA 2015 Annual Report
Wanger USA
Statement of Investments, December 31, 2015
| Number of Shares | Value | ||||||||||
Biotechnology & Drug Delivery – 3.8% (cont) | |||||||||||
280,766 | Celldex Therapeutics (a) (b) Biotech Developing Drugs for Cancer | $ | 4,402,411 | ||||||||
97,486 | Sarepta Therapeutics (a) (b) Biotech Focused on Rare Diseases | 3,761,010 | |||||||||
35,769 | Agios Pharmaceuticals (a) (b) Biotech Focused on Cancer & Orphan Diseases | 2,322,123 | |||||||||
9,183 | Intercept Pharmaceuticals (a) Biotech Developing Drugs for Several Diseases | 1,371,481 | |||||||||
26,266,997 | |||||||||||
Medical Equipment & Devices – 2.2% | |||||||||||
299,074 | Wright Medical Group (a) Foot & Ankle Replacement | 7,231,609 | |||||||||
45,935 | Sirona Dental Systems (a) Manufacturer of Dental Equipment | 5,033,098 | |||||||||
56,586 | Abaxis Instruments & Tests for Vet & Medical Markets | 3,150,709 | |||||||||
15,415,416 | |||||||||||
Health Care Services – 1.8% | |||||||||||
158,918 | Medidata Solutions (a) Cloud-based Software for Drug Studies | 7,833,068 | |||||||||
101,215 | Envision Healthcare Holdings (a) Provider of Health Care Outsourcing Services | 2,628,554 | |||||||||
64,224 | HealthSouth Inpatient Rehabilitation Facilities & Home Health Care | 2,235,637 | |||||||||
12,697,259 | |||||||||||
Pharmaceuticals – 1.1% | |||||||||||
208,790 | Akorn (a) Developer, Manufacturer & Distributor of Specialty Generic Drugs | 7,789,955 | |||||||||
Total Health Care | 89,002,823 | ||||||||||
Finance – 10.7% | |||||||||||
Banks – 7.3% | |||||||||||
384,431 | MB Financial Chicago Bank | 12,444,032 | |||||||||
233,336 | Lakeland Financial Indiana Bank | 10,878,124 | |||||||||
551,511 | Associated Banc-Corp Midwest Bank | 10,340,831 | |||||||||
| Number of Shares | Value | ||||||||||
83,370 | SVB Financial Group (a) Bank to Venture Capitalists | $ | 9,912,693 | ||||||||
133,203 | First Busey Illinois Bank | 2,747,978 | |||||||||
76,931 | Sandy Spring Bancorp Baltimore & Washington, D.C. Bank | 2,074,060 | |||||||||
112,858 | Guaranty Bancorp Colorado Bank | 1,866,671 | |||||||||
50,264,389 | |||||||||||
Savings & Loans – 1.1% | |||||||||||
298,928 | LegacyTexas Texas Thrift | 7,479,178 | |||||||||
Brokerage & Money Management – 0.8% | |||||||||||
105,957 | SEI Investments Mutual Fund Administration & Investment Management | 5,552,147 | |||||||||
Insurance – 0.5% | |||||||||||
97,919 | Allied World Assurance Company Holdings Commercial Lines Insurance/Reinsurance | 3,641,608 | |||||||||
Diversified Financial Companies – 0.4% | |||||||||||
177,102 | Leucadia National Holding Company | 3,079,804 | |||||||||
Credit Cards – 0.4% | |||||||||||
32,000 | WEX (a) Card Processor | 2,828,800 | |||||||||
Finance Companies – 0.2% | |||||||||||
52,649 | McGrath Rentcorp Mini-rental Conglomerate | 1,326,228 | |||||||||
Total Finance | 74,172,154 | ||||||||||
Other Industries – 5.0% | |||||||||||
Real Estate – 3.9% | |||||||||||
232,049 | Extra Space Storage Self Storage Facilities | 20,469,042 | |||||||||
165,980 | EdR Student Housing | 6,287,323 | |||||||||
26,756,365 | |||||||||||
See accompanying notes to financial statements.
11
Wanger USA 2015 Annual Report
Wanger USA
Statement of Investments, December 31, 2015
| Number of Shares | Value | ||||||||||
Transportation – 1.1% | |||||||||||
231,684 | Heartland Express (b) Regional Trucker | $ | 3,943,262 | ||||||||
100,296 | Rush Enterprises, Class A (a) | 2,195,479 | |||||||||
71,600 | Rush Enterprises, Class B (a) Truck Sales & Service | 1,568,040 | |||||||||
7,706,781 | |||||||||||
Total Other Industries | 34,463,146 | ||||||||||
Energy & Minerals – 1.9% | |||||||||||
Oil & Gas Producers – 1.2% | |||||||||||
71,089 | PDC Energy (a) Oil & Gas Producer in the United States | 3,794,731 | |||||||||
100,336 | Carrizo Oil & Gas (a) Oil & Gas Producer | 2,967,939 | |||||||||
73,742 | SM Energy (b) Oil & Gas Producer | 1,449,767 | |||||||||
8,212,437 | |||||||||||
Mining – 0.6% | |||||||||||
36,263 | Core Labs (Netherlands) (b) Oil & Gas Reservoir Consulting | 3,943,239 | |||||||||
Oil Services – 0.1% | |||||||||||
96,709 | Hornbeck Offshore (a) (b) Supply Vessel Operator in Gulf of Mexico | 961,288 | |||||||||
Total Energy & Minerals | 13,116,964 | ||||||||||
| Total Equities (Cost: $444,615,659) – 93.9% | 650,583,592 | (c) | |||||||||
Short-Term Investments – 5.6% | |||||||||||
38,398,305 | JPMorgan U.S. Government Money Market Fund, Agency Shares (7 day yield of 0.04%) | 38,398,305 | |||||||||
| Total Short-Term Investments (Cost: $38,398,305) – 5.6% | 38,398,305 | ||||||||||
| Number of Shares | Value | ||||||||||
Securities Lending Collateral – 5.0% | |||||||||||
34,971,750 | Dreyfus Government Cash Management Fund, Institutional Shares (7 day yield of 0.03%) (d) | $ | 34,971,750 | ||||||||
| Total Securities Lending Collateral (Cost: $34,971,750) – 5.0% | 34,971,750 | ||||||||||
| Total Investments (Cost: $517,985,714) (e) – 104.5% | 723,953,647 | ||||||||||
| Obligation to Return Collateral for Securities Loaned – (5.0)% | (34,971,750 | ) | |||||||||
Cash and Other Assets Less Liabilities – 0.5% | 3,622,852 | ||||||||||
Net Assets – 100.0% | $ | 692,604,749 | |||||||||
ADR – American Depositary Receipts
Notes to Statement of Investments
(a) Non-income producing security.
(b) All or a portion of this security was on loan at December 31, 2015. The total market value of securities on loan at December 31, 2015 was $33,794,208.
(c) On December 31, 2015, the market value of foreign securities represented 0.57% of total net assets. The Fund's foreign portfolio was diversified as follows:
Country | Value | Percentage of Net Assets | |||||||||
Netherlands | $ | 3,943,239 | 0.57 | ||||||||
(d) Investment made with cash collateral received from securities lending activity.
(e) At December 31, 2015, for federal income tax purposes, the cost of investments was $521,049,364 and net unrealized appreciation was $202,904,283 consisting of gross unrealized appreciation of $238,436,278 and gross unrealized depreciation of $35,531,995.
See accompanying notes to financial statements.
12
Wanger USA 2015 Annual Report
Wanger USA
Statement of Investments, December 31, 2015
Fair Value Measurements
Various inputs are used in determining the value of the Fund's investments, following the input prioritization hierarchy established by accounting principles generally accepted in the United States of America (GAAP). These inputs are summarized in the three broad levels listed below:
• Level 1 – quoted prices in active markets for identical securities
• Level 2 – prices determined using other significant observable inputs (including quoted prices for similar securities, interest rates, prepayment speeds, credit risk and others)
• Level 3 – prices determined using significant unobservable inputs where quoted prices or observable inputs are unavailable or less reliable (including management's own assumptions about the factors market participants would use in pricing an investment)
The inputs or methodology used for valuing securities are not necessarily an indication of the risk associated with investing in those securities.
Examples of the types of securities in which the Fund would typically invest and how they are classified within this hierarchy are as follows. Typical Level 1 securities include exchange traded domestic equities, mutual funds whose NAVs are published each day and exchange traded foreign equities that are not statistically fair valued. Typical Level 2 securities include exchange traded foreign equities that are statistically fair valued, forward foreign currency exchange contracts and short-term investments valued at amortized cost. Additionally, securities fair valued by CWAM's Valuation Committee (the Committee) that rely on significant observable inputs are also included in Level 2. Typical Level 3 securities include any security fair valued by the Committee that relies on significant unobservable inputs.
The Committee is responsible for applying the Trust's Portfolio Pricing Policy and the CWAM pricing procedures (the Policies), which are approved by and subject to the oversight of the Board.
The Committee meets as necessary, and no less frequently than quarterly, to determine fair values for securities for which market quotations are not readily available or for which the investment manager believes that available market quotations are unreliable. The Committee also reviews the continuing appropriateness of the Policies. In circumstances where a security has been fair valued, the Committee will also review the continuing appropriateness of the current value of the security. The Policies address, among other things: circumstances under which market quotations will be deemed readily available; selection of third party pricing vendors; appropriate pricing methodologies; events that require fair valuation and fair value techniques; circumstances under which securities will be deemed to pose a potential for stale pricing, including when securities are illiquid, restricted, or in default; and certain delegations of authority to determine fair values to the Fund's investment manager. The Committee may also meet to discuss additional valuation matters, which may include review of back-testing results, review of time-sensitive information or approval of other valuation related actions, and to review the appropriateness of the Policies.
For investments categorized as Level 3, the significant unobservable inputs used in the fair value measurement of the Fund's securities may include: (i) data specific to the issuer or comparable issuers, (ii) general market or specific sector news and (iii) quoted prices and specific or similar security transactions. The Committee considers this data and any changes from prior periods in order to assess the reasonableness of observable and unobservable inputs, any assumptions or internal models used to value those securities and changes in fair value. Significant
changes in any of these factors could result in lower or higher fair value measurements. Various factors impact the frequency of monitoring (which may occur as often as daily), however the Committee may determine that changes to inputs, assumptions and models are not required with the same frequency.
The following table summarizes the inputs used, as of December 31, 2015, in valuing the Fund's assets:
Investment Type | Quoted Prices (Level 1) | Other Significant Observable Inputs (Level 2) | Significant Unobservable Inputs (Level 3) | Total | |||||||||||||||
Equities | |||||||||||||||||||
Information | $ | 184,332,354 | $ | — | $ | — | $ | 184,332,354 | |||||||||||
| Industrial Goods & Services | 143,998,212 | — | — | 143,998,212 | |||||||||||||||
| Consumer Goods & Services | 111,497,939 | — | — | 111,497,939 | |||||||||||||||
Health Care | 89,002,823 | — | — | 89,002,823 | |||||||||||||||
Finance | 74,172,154 | — | — | 74,172,154 | |||||||||||||||
Other Industries | 34,463,146 | — | — | 34,463,146 | |||||||||||||||
Energy & Minerals | 13,116,964 | — | — | 13,116,964 | |||||||||||||||
Total Equities | 650,583,592 | — | — | 650,583,592 | |||||||||||||||
| Total Short-Term Investments | 38,398,305 | — | — | 38,398,305 | |||||||||||||||
| Total Securities Lending Collateral | 34,971,750 | — | — | 34,971,750 | |||||||||||||||
Total Investments | $ | 723,953,647 | $ | — | $ | — | $ | 723,953,647 | |||||||||||
There were no transfers of financial assets between levels during the period.
See accompanying notes to financial statements.
13
Wanger USA 2015 Annual Report
Statement of Assets and Liabilities
December 31, 2015
Assets: | |||||||
Investments, at cost | $ | 517,985,714 | |||||
| Investments, at value (including securities on loan of $33,794,208) | $ | 723,953,647 | |||||
Receivable for: | |||||||
Investments sold | 4,148,605 | ||||||
Fund shares sold | 134,601 | ||||||
Securities lending income | 16,199 | ||||||
Dividends | 354,848 | ||||||
Trustees' deferred compensation plan | 148,972 | ||||||
Prepaid expenses | 12,292 | ||||||
Total Assets | 728,769,164 | ||||||
Liabilities: | |||||||
Collateral on securities loaned | 34,971,750 | ||||||
Payable for: | |||||||
Fund shares redeemed | 881,506 | ||||||
Investment advisory fee | 16,606 | ||||||
Administration fee | 960 | ||||||
Transfer agent fee | 2 | ||||||
Trustees' fees | 3,214 | ||||||
Custody fee | 3,252 | ||||||
Reports to shareholders | 62,721 | ||||||
Chief compliance officer expenses | 7,001 | ||||||
Trustees' deferred compensation plan | 148,972 | ||||||
Other liabilities | 68,431 | ||||||
Total Liabilities | 36,164,415 | ||||||
Net Assets | $ | 692,604,749 | |||||
Composition of Net Assets: | |||||||
Paid-in capital | $ | 312,462,476 | |||||
Overdistributed net investment income | (140,539 | ) | |||||
Accumulated net realized gain | 174,314,879 | ||||||
Net unrealized appreciation (depreciation) on: | |||||||
Investments | 205,967,933 | ||||||
Net Assets | $ | 692,604,749 | |||||
Fund Shares Outstanding | 21,814,937 | ||||||
| Net asset value, offering price and redemption price per share | $ | 31.75 | |||||
Statement of Operations
For the Year Ended December 31, 2015
Investment Income: | |||||||
Dividends (net foreign taxes withheld of $10,129) | $ | 4,910,686 | |||||
Income from securities lending—net | 262,768 | ||||||
Total Investment Income | 5,173,454 | ||||||
Expenses: | |||||||
Investment advisory fee | 6,645,234 | ||||||
Transfer agent fees | 588 | ||||||
Administration fee | 385,133 | ||||||
Trustees' fees | 52,252 | ||||||
Custody fees | 17,776 | ||||||
Reports to shareholders | 416,528 | ||||||
Audit fees | 45,708 | ||||||
Legal fees | 133,797 | ||||||
Chief compliance officer expenses | 35,650 | ||||||
Commitment fee for line of credit (Note 5) | 19,048 | ||||||
Other expenses | 40,732 | ||||||
Total Expenses | 7,792,446 | ||||||
Net Investment Loss | (2,618,992 | ) | |||||
Net Realized and Unrealized Gain (Loss) on Investments: | |||||||
Net realized gain (loss) on: | |||||||
Investments | 176,459,137 | ||||||
Net realized gain | 176,459,137 | ||||||
| Net change in unrealized appreciation (depreciation) on: | |||||||
Investments | (175,148,605 | ) | |||||
Net change in unrealized depreciation | (175,148,605 | ) | |||||
Net realized and unrealized gain | 1,310,532 | ||||||
Net Decrease in Net Assets from Operations | $ | (1,308,460 | ) | ||||
See accompanying notes to financial statements.
14
Wanger USA 2015 Annual Report
Statements of Changes in Net Assets
Year Ended December 31, | |||||||||||
Increase (Decrease) in Net Assets | 2015 | 2014 | |||||||||
Operations: | |||||||||||
Net investment loss | $ | (2,618,992 | ) | $ | (1,263,876 | ) | |||||
Net realized gain (loss) on: | |||||||||||
Investments | 176,459,137 | 126,938,117 | |||||||||
Net change in unrealized appreciation (depreciation) on: | |||||||||||
Investments | (175,148,605 | ) | (89,118,632 | ) | |||||||
Net Increase (Decrease) in Net Assets from Operations | (1,308,460 | ) | 36,555,609 | ||||||||
Distributions to Shareholders From: | |||||||||||
Net realized gains | (125,247,249 | ) | (104,323,181 | ) | |||||||
Total Distributions to Shareholders | (125,247,249 | ) | (104,323,181 | ) | |||||||
Share Transactions: | |||||||||||
Subscriptions | 13,842,692 | 7,982,236 | |||||||||
Distributions reinvested | 125,247,249 | 104,323,181 | |||||||||
Redemptions | (120,862,266 | ) | (155,747,913 | ) | |||||||
Net Increase (Decrease) from Share Transactions | 18,227,675 | (43,442,496 | ) | ||||||||
Total Decrease in Net Assets | (108,328,034 | ) | (111,210,068 | ) | |||||||
Net Assets: | |||||||||||
Beginning of period | 800,932,783 | 912,142,851 | |||||||||
End of period | $ | 692,604,749 | $ | 800,932,783 | |||||||
Overdistributed net investment income | $ | (140,539 | ) | $ | (136,344 | ) | |||||
See accompanying notes to financial statements.
15
Wanger USA 2015 Annual Report
Financial Highlights
The following table is intended to help you understand the Fund's financial performance. Certain information reflects financial results for a single share held for the periods shown. Per share net investment income (loss) amounts are calculated based on average shares outstanding during the period. Total return assumes reinvestment of all dividends and distributions, if any. Total return does not reflect payment of the expenses that apply to the variable accounts or contract charges, if any. Total return and portfolio turnover are not annualized for periods of less than one year. The portfolio turnover rate is calculated without regard to purchase and sales transactions of short-term instruments and certain derivatives, if any. If such transactions were included, the Fund's portfolio turnover rate may be higher.
Year Ended December 31, | |||||||||||||||||||||||
Selected data for a share outstanding throughout each period | 2015 | 2014 | 2013 | 2012 | 2011 | ||||||||||||||||||
Net Asset Value, Beginning of Period | $ | 37.71 | $ | 41.13 | $ | 33.84 | $ | 29.80 | $ | 33.86 | |||||||||||||
Income from Investment Operations: | |||||||||||||||||||||||
Net investment income (loss) | (0.12 | ) | (0.06 | ) | (0.05 | ) | 0.15 | (0.13 | ) | ||||||||||||||
Net realized and unrealized gain (loss) | 0.45 | 1.70 | 10.79 | 5.63 | (0.82 | ) | |||||||||||||||||
Total from Investment Operations | 0.33 | 1.64 | 10.74 | 5.78 | (0.95 | ) | |||||||||||||||||
Less Distributions to Shareholders: | |||||||||||||||||||||||
Net investment income | — | — | (0.06 | ) | (0.11 | ) | — | ||||||||||||||||
Net realized gains | (6.29 | ) | (5.06 | ) | (3.39 | ) | (1.63 | ) | (3.11 | ) | |||||||||||||
Total Distributions to Shareholders | (6.29 | ) | (5.06 | ) | (3.45 | ) | (1.74 | ) | (3.11 | ) | |||||||||||||
Net Asset Value, End of Period | $ | 31.75 | $ | 37.71 | $ | 41.13 | $ | 33.84 | $ | 29.80 | |||||||||||||
Total Return | (0.61 | )% | 4.78 | % | 33.75 | % | 20.02 | %(a) | (3.49 | )%(a) | |||||||||||||
Ratios to Average Net Assets/Supplemental Data: | |||||||||||||||||||||||
Total gross expenses (b) | 1.01 | % | 0.96 | % | 0.96 | % | 0.96 | % | 0.94 | % | |||||||||||||
Total net expenses (b) | 1.01 | % | 0.96 | % | 0.96 | % | 0.96 | %(c) | 0.93 | %(c) | |||||||||||||
Net investment income (loss) | (0.34 | )% | (0.15 | )% | (0.12 | )% | 0.45 | % | (0.40 | )% | |||||||||||||
Portfolio turnover rate | 45 | % | 14 | % | 15 | % | 12 | % | 10 | % | |||||||||||||
Net assets, end of period (000s) | $ | 692,605 | $ | 800,933 | $ | 912,143 | $ | 782,222 | $ | 757,562 | |||||||||||||
Notes to Financial Highlights
(a) Had the Investment Manager and/or its affiliates not waived a portion of expenses, total return would have been reduced.
(b) In addition to the fees and expenses that the Fund bears directly, the Fund indirectly bears a pro rata share of the fees and expenses of any other funds in which it invests, if any. Such indirect expenses are not included in the Fund's reported expense ratios.
(c) The benefits derived from custody fees paid indirectly had an impact of less than 0.01%.
See accompanying notes to financial statements.
16
Wanger USA 2015 Annual Report
Notes to Financial Statements
1. Nature of Operations
Wanger USA (the Fund), a series of Wanger Advisors Trust (the Trust), is registered under the Investment Company Act of 1940, as amended (the 1940 Act), as an open-end management investment company organized as a Massachusetts business trust. The investment objective of the Fund is to seek long-term capital appreciation. The Fund is available only for allocation to certain life insurance company separate accounts established for the purpose of funding participating variable annuity contracts and variable life insurance policies and may also be offered directly to certain qualified pension and retirement plans.
2. Summary of Significant Accounting Policies
Basis of Preparation
The Fund is an investment company that applies the accounting and reporting guidance in the Financial Accounting Standards Board (FASB) Accounting Standards Codification Topic 946, Financial Services—Investment Companies (ASC 946). The financial statements are prepared in accordance with U.S. generally accepted accounting principles (GAAP) which requires management to make certain estimates and assumptions that affect the reported amounts of assets and liabilities, the disclosure of contingent assets and liabilities at the date of the financial statements and the reported amounts of income and expenses during the reporting period. Actual results could differ from those estimates.
The following is a summary of significant accounting policies followed by the Fund in the preparation of its financial statements.
Security valuation
Securities of the Fund are valued at market value or, if a market quotation for a security is not readily available or is deemed not to be reliable because of events or circumstances that have occurred between the market quotation and the time as of which the security is to be valued, the security is valued at its fair value determined in good faith under consistently applied procedures established by the Board of Trustees (the Board). A security traded on a securities exchange or in an over-the-counter market in which transaction prices are reported is valued at the last sales price at the time of valuation. A security traded principally on NASDAQ is valued at the NASDAQ official closing price. Exchange traded funds (ETFs) are valued at their closing net asset value as reported on the applicable exchange. A security for which there is no reported sale on the valuation date is valued at the mean of the latest bid and ask quotations.
Short-term investments maturing in 60 days or less are valued at amortized cost, which approximates market value.
The Trust has retained an independent statistical fair value pricing service that employs a systematic methodology to assist in the fair valuation process for securities principally traded in a foreign market in order to adjust for possible changes in value that may occur between the close of the foreign market and the time as of which the securities are to be valued. If a security is valued at a fair value, that value may be different from the last quoted market price for the security.
Security transactions and investment income
Security transactions are accounted for on the trade date (date the order to buy or sell is executed) and dividend income is recorded on the ex-dividend date, except that certain dividends from foreign securities are recorded as soon as the information is available to the Fund. Interest income is recorded on the accrual basis and includes amortization of discounts on debt obligations when required for federal income tax purposes. Realized gains and losses from security transactions are recorded on an identified cost basis.
Awards, if any, from class action litigation related to securities owned may be recorded as a reduction of cost of those securities. If the applicable securities are no longer owned, the proceeds are recorded as realized gains.
The Fund may receive distributions from holdings in equity securities, ETFs, other regulated investment companies (RICs), and real estate investment trusts (REITs), which report information on the tax character of their distributions annually. These
distributions are allocated to dividend income, capital gain and return of capital based on actual information reported. Return of capital is recorded as a reduction of the cost basis of securities held. If the Fund no longer owns the applicable securities, return of capital is recorded as a realized gain. With respect to REITs, to the extent actual information has not yet been reported, estimates for return of capital may be made by the Fund's management. Management's estimates are subsequently adjusted when the actual character of the distributions is disclosed by the REITs, which could result in a proportionate change in return of capital to shareholders.
Expenses
General expenses of the Trust are allocated to the Fund and the other series of the Trust based upon relative net assets or other expense allocation methodologies determined by the nature of the expense. Expenses directly attributable to the Fund are charged to the Fund.
Fund share valuation
Fund shares are sold and redeemed on a continuing basis at net asset value. Net asset value per share is determined daily as of the close of trading on the New York Stock Exchange (the Exchange) on each day the Exchange is open for trading by dividing the total value of the Fund's investments and other assets, less liabilities, by the number of Fund shares outstanding.
Securities lending
The Fund may lend securities up to one-third of the value of its total assets to certain approved brokers, dealers and other financial institutions to earn additional income. The Fund retains the benefits of owning the securities, including the economic equivalent of dividends or interest generated by the security. The Fund also receives a fee for the loan. The Fund has the ability to recall the loans at any time and could do so in order to vote proxies or to sell the loaned securities. Each loan is collateralized by cash that exceeded the value of the securities on loan. The market value of the loaned securities is determined daily at the close of business of the Fund and any additional required collateral is delivered to each Fund on the next business day. The Fund has elected to invest the cash collateral in the Dreyfus Government Cash Management Fund. The income earned from the securities lending program is paid to the Fund, net of any fees remitted to Goldman Sachs Agency Lending, the Fund's lending agent, and borrower rebates. The Fund's investment manager, Columbia Wanger Asset Management, LLC (CWAM), does not retain any fees earned by the lending program. Generally, in the event of borrower default, the Fund has the right to use the collateral to offset any losses incurred. In the event the Fund is delayed or prevented from exercising its right to dispose of the collateral, there may be a potential loss to the Fund. Some of these losses may be indemnified by the lending agent. The Fund bears the risk of loss with respect to the investment of collateral. The net lending income earned by the Fund as of December 31, 2015, is included in the Statement of Operations.
Offsetting of assets and liabilities
The following table presents the Fund's gross and net amount of assets and liabilities available for offset under netting agreements and under a securities lending agreement as well as the related collateral received by the Fund as of December 31, 2015:
Goldman Sachs | |||||||
Liabilities | |||||||
Collateral on securities loaned | $ | 34,971,750 | |||||
Total liabilities | 34,971,750 | ||||||
Total financial and derivative net assets | (34,971,750 | ) | |||||
Financial instruments | 33,794,208 | ||||||
Net amount (a) | $ | (1,177,542 | ) | ||||
(a) Represents the net amount due from/(to) counterparties in the event of default.
17
Wanger USA 2015 Annual Report
Notes to Financial Statements, continued
Securities lending transactions
The following table indicates the total amount of securities loaned by type, reconciled to gross liability payable upon return of the securities loaned by the Fund as of December 31, 2015:
| Overnight and Continuous | Up to 30 Days | 30 – 90 Days | Greater than 90 Days | Total | |||||||||||||||||||
| Securities lending transactions | |||||||||||||||||||||||
Equity securities | $ | 33,794,208 | $ | — | $ | — | $ | — | $ | 33,794,208 | |||||||||||||
| Gross amount of recognized liabilities for securities lending (collateral received) | 34,971,750 | ||||||||||||||||||||||
| Amounts due to counterparty | $ | 1,177,542 | |||||||||||||||||||||
Federal income taxes
The Fund has complied with the provisions of the Internal Revenue Code available to regulated investment companies and, in the manner provided therein, distributes substantially all its taxable income, as well as any net realized gain on sales of investments and foreign currency transactions reportable for federal income tax purposes. Accordingly, the Fund paid no federal income taxes and no federal income tax provision was required.
Foreign capital gains taxes
Gains in certain countries may be subject to foreign taxes at the fund level. The Fund accrues for such foreign taxes on realized and unrealized gains at the appropriate rate for each jurisdiction. The amount, if any, is disclosed as a liability on the Statement of Assets and Liabilities.
Distributions to shareholders
Distributions to shareholders are recorded on the ex-dividend date.
Indemnification
In the normal course of business, the Trust on behalf of the Fund enters into contracts that contain a variety of representations and warranties and that provide general indemnities. The Fund's maximum exposure under these arrangements is unknown, as this would involve future claims against the Fund. Also under the Trust's organizational documents, the trustees and officers of the Trust are indemnified against certain liabilities that may arise out of their duties to the Trust. However, based on experience, the Fund expects the risk of loss due to these warranties and indemnities to be remote.
Recent Accounting Pronouncement
Fair Value Measurement (Topic 820), Disclosure for Investments in Certain Entities That Calculate Net Asset Value per Share (or Its Equivalent)
In May 2015, FASB issued Accounting Standards Update (ASU) No. 2015-07, Fair Value Measurement (Topic 820), Disclosure for Investments in Certain Entities That Calculate Net Asset Value per Share (or Its Equivalent). ASU No. 2015-07 changes the disclosure requirements for investments for which fair value is measured using the net asset value per share practical expedient. The disclosure requirements are effective for annual periods beginning after December 15, 2015 and interim periods within those fiscal years. At this time, management is evaluating the implications of this guidance and the impact it will have on the financial statement amounts and footnote disclosures, if any.
3. Federal Tax Information
The timing and character of income and capital gain distributions are determined in accordance with income tax regulations, which may differ from GAAP. Reclassifications are made to the Fund's capital accounts for permanent tax differences to reflect
income and gains available for distribution (or available capital loss carryforwards) under income tax regulations.
For the year ended December 31, 2015, permanent book and tax basis differences resulting primarily from net operating loss reclassification and re-characterization of distributions from investments were identified and reclassified among the components of the Fund's net assets as follows:
| Accumulated Net Investment Income | Accumulated Net Realized Gain (Loss) | Paid-In Capital | |||||||||
| $ | 2,614,797 | $ | (422,309 | ) | $ | (2,192,488 | ) | ||||
Net investment income and net realized gains (losses), as disclosed on the Statement of Operations, and net assets were not affected by this reclassification.
The tax character of distributions paid during the years ended December 31, 2015 and December 31, 2014 were as follows:
December 31, 2015 | December 31, 2014 | ||||||||||
Ordinary Income* | $ | 210,772 | $ | 1,514,705 | |||||||
Long-Term Capital Gains | 125,036,477 | 102,808,476 | |||||||||
* For tax purposes short-term capital gain distributions, if any, are considered ordinary income distributions.
As of December 31, 2015, the components of distributable earnings on a tax basis were as follows:
| Undistributed Long-Term Capital Gains | Net Unrealized Appreciation (Depreciation)* | ||||||
| $ | 177,378,529 | $ | 202,904,283 | ||||
* The differences between book-basis and tax-basis net unrealized appreciation (depreciation) are primarily due to deferral of losses from wash sales.
Management is required to determine whether a tax position of the Fund is more likely than not to be sustained upon examination by the applicable taxing authority, including resolution of any related appeals or litigation processes, based on the technical merits of the position. The tax benefit to be recognized by the Fund is measured as the largest amount of benefit that is greater than fifty percent likely of being realized upon ultimate settlement. Management is not aware of any tax positions in the Fund for which it is reasonably possible that the total amounts of unrecognized tax benefits will significantly change in the next twelve months. However, management's conclusions may be subject to review and adjustment at a later date based on factors including, but not limited to, new tax laws, regulations, and administrative interpretations (including relevant court decisions). The Fund's federal tax returns for the prior three fiscal years remain subject to examination by the Internal Revenue Service.
4. Transactions with Affiliates
CWAM is a wholly owned subsidiary of Columbia Management Investment Advisers, LLC (Columbia Management), which in turn is a wholly owned subsidiary of Ameriprise Financial, Inc. (Ameriprise Financial). CWAM furnishes continuing investment supervision to the Fund and is responsible for the overall management of the Fund's business affairs.
CWAM receives a monthly advisory fee based on the Fund's average daily net assets at the following annual rates:
Average Daily Net Assets | Annual Fee Rate | ||||||
Up to $100 million | 0.94 | % | |||||
$100 million to $250 million | 0.89 | % | |||||
$250 million to $2 billion | 0.84 | % | |||||
| $2 billion and over | 0.80 | % | |||||
18
Wanger USA 2015 Annual Report
Notes to Financial Statements, continued
For the year ended December 31, 2015, the effective investment advisory fee rate was 0.86% of the Fund's average daily net assets.
CWAM provides administrative services and receives an administration fee from the Fund at the following annual rates:
| Wanger Advisors Trust Aggregate Average Daily Net Assets of the Trust | Annual Fee Rate | ||||||
Up to $4 billion | 0.05 | % | |||||
$4 billion to $6 billion | 0.04 | % | |||||
$6 billion to $8 billion | 0.03 | % | |||||
| $8 billion and over | 0.02 | % | |||||
For the year ended December 31, 2015, the effective administration fee rate was 0.05% of the Fund's average daily net assets. CWAM has delegated to Columbia Management responsibility to provide certain sub-administrative services to the Fund.
Columbia Management Investment Distributors, Inc. (CMID), a wholly owned subsidiary of Ameriprise Financial, serves as the Fund's distributor and principal underwriter.
Columbia Management Investment Services Corp. (CMIS), a wholly owned subsidiary of Ameriprise Financial, is the transfer agent to the Fund. For its services, the Fund pays CMIS a monthly fee at the annual rate of $21.00 per open account. CMIS also receives reimbursement from the Fund for certain out-of-pocket expenses.
Certain officers and trustees of the Trust are also officers of CWAM. The Trust makes no direct payments to its officers and trustees who are affiliated with CWAM.
The Board has appointed a Chief Compliance Officer of the Trust in accordance with federal securities regulations. The Fund, along with other affiliated funds, pays its pro-rata share of the expenses associated with the office of the Chief Compliance Officer.
The Trust offers a deferred compensation plan for its independent trustees. Under that plan, a trustee may elect to defer all or a portion of his or her compensation. Amounts deferred are retained by the Trust and may represent an unfunded obligation of the Trust. The value of amounts deferred is determined by reference to the change in value of Class Z shares of one or more series of Columbia Acorn Trust or a money market fund as specified by the trustee. Benefits under the deferred compensation plan are payable in accordance with the plan.
For the year ended December 31, 2015, the Fund engaged in purchase transactions with funds that have a common investment manager (or affiliated investment managers), common directors/trustees, and/or common officers. Those purchase transactions complied with provisions of Rule 17a-7 under the Investment Company Act of 1940 and were $24,185,266.
5. Borrowing Arrangements
During the period January 1, 2015 through April 29, 2015, the Trust participated in a credit facility with JPMorgan Chase Bank, N.A., along with Columbia Acorn Trust, another trust managed by CWAM, in the amount of $150 million. Effective April 30, 2015, the first facility was terminated and the Trust entered into a revolving credit facility in the amount of $400 million with a syndicate of banks led by JPMorgan Chase Bank, N.A. to facilitate portfolio liquidity. Under each facility, interest is charged to each participating Fund based on its borrowings at a rate per annum equal to the Federal Funds Rate plus 1.00%. In addition, a commitment fee of 0.08% per annum of the unutilized line of credit is accrued and apportioned among the participating Funds based on their relative net assets. The commitment fee is disclosed as a part of "Other expenses" in the Statement of Operations. The Trust expects to renew this line of credit for one year durations each April at then current market rates and terms.
No amounts were borrowed for the benefit of the Fund under the line of credit during the year ended December 31, 2015.
6. Fund Share Transactions
Proceeds and payments on Fund shares as shown in the Statement of Changes in Net Assets are in respect of the following numbers of shares:
| Year Ended December 31, 2015 | Year Ended December 31, 2014 | ||||||||||
Shares sold | 393,619 | 208,916 | |||||||||
| Shares issued in reinvestment of dividend distributions | 3,591,834 | 2,944,487 | |||||||||
Less shares redeemed | (3,411,642 | ) | (4,090,881 | ) | |||||||
Net increase (decrease) in shares outstanding | 573,811 | (937,478 | ) | ||||||||
7. Investment Transactions
The aggregate cost of purchases and proceeds from sales other than short-term obligations for the year ended December 31, 2015, were $322,607,261 and $448,419,365, respectively. The amount of purchase and sales activity impacts the portfolio turnover rate reported in the Financial Highlights.
8. Shareholder Concentration
At December 31, 2015, two unaffiliated shareholder accounts owned 32.8% of the outstanding shares of the Fund. The Fund has no knowledge about whether any portion of those shares was owned beneficially by such accounts. Affiliated shareholder accounts owned 60.4% of the outstanding shares of the Fund. Subscription and redemption activity by concentrated accounts may have a significant effect on the operations of the Fund.
9. Subsequent Events
Management has evaluated the events and transactions that have occurred through the date the financial statements were issued and noted no items requiring adjustment of the financial statements or additional disclosure.
10. Information Regarding Pending and Settled Legal Proceedings
Ameriprise Financial and certain of its affiliates have historically been involved in a number of legal, arbitration and regulatory proceedings, including routine litigation, class actions, and governmental actions, concerning matters arising in connection with the conduct of their business activities. Ameriprise Financial believes that the Fund is not currently the subject of, and that neither Ameriprise Financial nor any of its affiliates are the subject of, any pending legal, arbitration or regulatory proceedings that are likely to have a material adverse effect on the Fund or the ability of Ameriprise Financial or its affiliates to perform under their contracts with the Fund. Ameriprise Financial is required to make quarterly (10-Q), annual (10-K) and, as necessary, 8-K filings with the Securities and Exchange Commission on legal and regulatory matters that relate to Ameriprise Financial and its affiliates. Copies of these filings may be obtained by accessing the SEC website at www.sec.gov.
There can be no assurance that these matters, or the adverse publicity associated with them, will not result in increased fund redemptions, reduced sale of fund shares or other adverse consequences to the Fund. Further, although we believe proceedings are not likely to have a material adverse effect on the Fund or the ability of Ameriprise Financial or its affiliates to perform under their contracts with the Fund, these proceedings are subject to uncertainties and, as such, we are unable to estimate the possible loss or range of loss that may result. An adverse outcome in one or more of these proceedings could result in adverse judgments, settlements, fines, penalties or other relief that could have a material adverse effect on the consolidated financial condition or results of operations of Ameriprise Financial.
19
Wanger USA 2015 Annual Report
Report of Independent Registered Public Accounting Firm
To the Board of Trustees and Shareholders of Wanger USA:
In our opinion, the accompanying statement of assets and liabilities, including the statement of investments, and the related statements of operations and of changes in net assets and the financial highlights present fairly, in all material respects, the financial position of Wanger USA (a series of the Wanger Advisors Trust, hereinafter referred to as the "Fund") at December 31, 2015, the results of its operations for the year then ended, the changes in its net assets for each of the two years in the period then ended and the financial highlights for each of the five years in the period then ended, in conformity with accounting principles generally accepted in the United States of America. These financial statements and financial highlights (hereafter referred to as "financial statements") are the responsibility of the Fund's management; our responsibility is to express an opinion on these financial statements based on our audits. We conducted our audits of these financial statements in accordance with the standards of the Public Company Accounting Oversight Board (United States). Those standards require that we plan and perform the audit to obtain reasonable assurance about whether the financial statements are free of material misstatement. An audit includes examining, on a test basis, evidence supporting the amounts and disclosures in the financial statements, assessing the accounting principles used and significant estimates made by management, and evaluating the overall financial statement presentation. We believe that our audits, which included confirmation of securities at December 31, 2015 by correspondence with the custodian and brokers, provide a reasonable basis for our opinion.
PricewaterhouseCoopers LLP
Chicago, Illinois
February 18, 2016
20
Wanger USA 2015 Annual Report
Federal Income Tax Information (Unaudited)
The Fund hereby designates the following tax attributes in the fiscal year ended December 31, 2015.
Tax Designations | |||||||
Dividends Received Deduction | 100.00 | % | |||||
Capital Gain Dividend | $ | 186,341,950 | |||||
Dividends Received Deduction. The percentage of ordinary income distributed during the fiscal year that qualifies for the corporate dividends received deduction.
Capital Gain Dividend. The Fund designates as a capital gain dividend the amount reflected above, or if subsequently determined to be different, the net capital gain of such fiscal period.
21
Wanger USA 2015 Annual Report
Board of Trustees and Management of Wanger Advisors Trust
Each trustee may serve a term of unlimited duration. The Trust's Bylaws generally require that a trustee retire at the end of the calendar year in which the trustee attains the age of 75 years. The trustees appoint their own successors, provided that at least two-thirds of the trustees, after such appointment, have been elected by shareholders. Shareholders may remove a trustee, with or without cause, upon the vote of two-thirds of the Trust's outstanding shares at any meeting called for that purpose. A trustee may be removed, with or without cause, upon the vote of a majority of the trustees. The names of the trustees and officers of the Trust, the date each was first elected or appointed to office and the principal business occupations of each during at least the last five years, and for the trustees, the number of portfolios in the fund complex they oversee and other directorships they hold, are shown below. Each trustee and officer serves in such capacity for each of the four series of Wanger Advisors Trust and for each of the eight series of Columbia Acorn Trust.
The address for the trustees and officers of the Trust is Columbia Wanger Asset Management, LLC, 227 West Monroe Street, Suite 3000, Chicago, Illinois 60606. The Funds' Statement of Additional Information includes additional information about the Funds' trustees and officers. You may obtain a free copy of the Statement of Additional Information by writing or calling toll-free:
Columbia Wanger Asset Management, LLC
Shareholder Services Group
227 W. Monroe, Suite 3000
Chicago IL 60606
1-800-922-6769
| Name and Age at December 31, 2015 | Year First Appointed or Elected to a Board in the Columbia Funds Complex | Principal Occupation(s) During the Past Five Years | Number of Funds in the Columbia Funds Complex Overseen (1) | Other Directorships Held by the Trustee During the Past Five Years in Addition to Columbia Acorn Trust and Wanger Advisors Trust | |||||||||||||||
Independent Trustees: | |||||||||||||||||||
| Laura M. Born, 50, Chair | 2007 | Adjunct Associate Professor of Finance, University of Chicago Booth School of Business since 2007; Director, Carlson Inc. (private global hospitalities and travel company) since 2015; Managing Director—Investment Banking, JP Morgan Chase & Co. (broker-dealer) 2002-2007. | 12 | None. | |||||||||||||||
| Maureen M. Culhane, 67 | 2007 | Retired. Formerly, Vice President, Goldman Sachs Asset Management, L.P. (investment adviser), 2005-2007; Vice President (Consultant)—Strategic Relationship Management, Goldman, Sachs & Co., 1999-2005. | 12 | None. | |||||||||||||||
| Margaret M. Eisen, 62 | 2002 | Trustee, Smith College since 2012; Chief Investment Officer, EAM International LLC (corporate finance and asset management), 2003-2013; Managing Director, CFA Institute, 2005-2008. | 12 | Burnham Investors Trust (3 series). | |||||||||||||||
| Thomas M. Goldstein, 56 | 2014 | Retired. Formerly, Chief Financial Officer, Allstate Protection Division, 2011-2014; Founding Partner, The GRG Group LLC, 2009-2011; Managing Director and Chief Financial Officer, Madison Dearborn Partners, 2007-2009. | 12 | Federal Home Loan Bank—Chicago; Federal Home Loan Mortgage Corporation. | |||||||||||||||
| John C. Heaton, 56 | 2010 | Deputy Dean for Faculty, University of Chicago Booth School of Business; Joseph L. Gidwitz Professor of Finance, University of Chicago Booth School of Business since July 2000. | 12 | None. | |||||||||||||||
| Steven N. Kaplan, 56 | 1999 | Neubauer Family Distinguished Service Professor of Entrepreneurship and Finance, University of Chicago Booth School of Business; faculty member of the University of Chicago Booth School of Business since 1988. | 12 | Accretive Health, Inc. (healthcare management services provider); Morningstar, Inc. (provider of independent investment research). | |||||||||||||||
| Charles R. Phillips, 59 | 2015 | Retired. Director, University of North Carolina School of Law Foundation since 2010. Formerly, Vice Chairman, J.P. Morgan Private Bank, 2011-2014; Managing Director, J.P. Morgan Private Bank, 2001-2011. | 12 | None. | |||||||||||||||
22
Wanger USA 2015 Annual Report
Board of Trustees and Management of Wanger Advisors Trust
| Name and Age at December 31, 2015 | Year First Appointed or Elected to a Board in the Columbia Funds Complex | Principal Occupation(s) During the Past Five Years | Number of Funds in the Columbia Funds Complex Overseen (1) | Other Directorships Held by the Trustee During the Past Five Years in Addition to Columbia Acorn Trust and Wanger Advisors Trust | |||||||||||||||
| David J. Rudis, 62, Vice Chair | 2010 | Retired. Formerly, National Checking and Debit Executive, and Illinois President, Bank of America, 2007-2009; President, Consumer Banking Group, LaSalle National Bank, 2004-2007. | 12 | None. | |||||||||||||||
Interested Trustees: | |||||||||||||||||||
| P. Zachary Egan, 47 (2) | 2015 | President, CWAM and President, Wanger Advisors Trust and Columbia Acorn Trust since April 2014; Global Chief Investment Officer, CWAM since October 2015; International Chief Investment Officer, CWAM, April 2014-September 2015; Director of International Research, CWAM, December 2004-March 2014; Vice President of Columbia Acorn Trust, 2003-2014, and Wanger Advisors Trust, 2007-2014; portfolio manager and analyst, CWAM or its predecessors, since 1999. | 12 | None. | |||||||||||||||
| Ralph Wanger, 81 (3) | 1970 | (4) | Founder, CWAM. Formerly, President, Chief Investment Officer and portfolio manager, CWAM or its predecessors, July 1992-September 2003; Director, Wanger Investment Company PLC; Consultant to CWAM or its predecessors, September 2003-September 2005. | 12 | None. | ||||||||||||||
* * * * *
| Name at Age at December 31, 2015 | Position Held with Columbia Acorn Trust and Wanger Advisors Trust | Year First Appointed or Elected to Office | Principal Occupation(s) During the Past Five Years | ||||||||||||
Officers: | |||||||||||||||
| Alan G. Berkshire, 55 | Vice President | 2015 | Chief Operating Officer, CWAM since April 2015. Formerly, Independent Director, ValueQuest India Moat Fund Limited (Mauritius), April 2014-March 2015; President—North America, Religare Global Asset Management, Inc., June 2011-November 2013; Partner, Estancia Capital Management LLC, September 2009-June 2011. | ||||||||||||
| Michael G. Clarke, 46 | Assistant Treasurer | 2004 | Vice President—Mutual Fund Administration, Columbia Management Investment Advisers, LLC since May 2010; Managing Director of Fund Administration, Columbia Management Advisors, LLC, September 2004-April 2010; Senior officer of Columbia funds and affiliated funds since 2002. | ||||||||||||
| William J. Doyle, 51 | Vice President | 2014 | Portfolio manager and/or analyst, CWAM or its predecessors since 2006; Vice President, Columbia Acorn Trust and Wanger Advisors Trust since 2014. | ||||||||||||
| P. Zachary Egan, 47 (2) | President | 2007 | President, CWAM and President, Wanger Advisors Trust and Columbia Acorn Trust since April 2014; Global Chief Investment Officer, CWAM since October 2015; International Chief Investment Officer, CWAM, April 2014-September 2015; Director of International Research, CWAM, December 2004-March 2014; Vice President of Columbia Acorn Trust, 2003-2014, and Wanger Advisors Trust, 2007-2014; portfolio manager and analyst, CWAM or its predecessors, since 1999. | ||||||||||||
| David L. Frank, 52 | Vice President | 2014 | Portfolio manager and/or analyst, CWAM or its predecessors since 2002; Vice President, Columbia Acorn Trust and Wanger Advisors Trust since 2014. | ||||||||||||
| Paul B. Goucher, 47 | Assistant Secretary | 2015 | Vice President and Lead Chief Counsel, Ameriprise Financial, Inc. since November 2008 and January 2013, respectively (previously Chief Counsel, January 2010-January 2013 and Group Counsel, November 2008-January 2010). | ||||||||||||
| Fritz Kaegi, 44 | Vice President | 2011 | Portfolio manager and/or analyst, CWAM or its predecessors since 2004; Vice President, Columbia Acorn Trust and Wanger Advisors Trust since 2011. | ||||||||||||
23
Wanger USA 2015 Annual Report
Board of Trustees and Management of Wanger Advisors Trust
| Name at Age at December 31, 2015 | Position Held with Columbia Acorn Trust and Wanger Advisors Trust | Year First Appointed or Elected to Office | Principal Occupation(s) During the Past Five Years | ||||||||||||
| John Kunka, 45 | Treasurer | 2006 | Treasurer and Principal Accounting and Financial Officer, Columbia Acorn Trust and Wanger Advisors Trust since 2014; Director of Accounting and Operations, CWAM since May 2006; formerly, Assistant Treasurer, Columbia Acorn Trust and Wanger Advisors Trust 2006-2014. | ||||||||||||
| Stephen Kusmierczak, 48 | Vice President | 2011 | Portfolio manager and/or analyst, CWAM or its predecessors since 2001; Vice President, Columbia Acorn Trust and Wanger Advisors Trust since 2011. | ||||||||||||
| Joseph C. LaPalm, 46 | Vice President | 2006 | Chief Compliance Officer, CWAM since 2005. | ||||||||||||
| Ryan C. Larrenaga, 45 | Assistant Secretary | 2015 | Vice President and Group Counsel, Ameriprise Financial, Inc. since August 2011 (previously, Counsel, May 2010-August 2011); Assistant General Counsel, Bank of America, 2005-April 2010; officer of Columbia funds and affiliated funds since 2005. | ||||||||||||
| Satoshi Matsunaga, 44 | Vice President | 2015 | Portfolio manager and/or analyst, CWAM or its predecessors since 2005; Vice President, Columbia Acorn Trust and Wanger Advisors Trust since 2015. | ||||||||||||
| Thomas P. McGuire, 43 | Chief Compliance Officer | 2015 | Chief Compliance Officer of the Columbia family of mutual funds for which Columbia Management Investment Advisers, LLC serves as investment adviser since 2012; Vice President—Asset Management Compliance, Ameriprise Financial, Inc., since May 2010; Chief Compliance Officer, Ameriprise Certificate Company since September 2010; Compliance Executive, Bank of America, 2005-April 2010. | ||||||||||||
| Charles P. McQuaid, 62 | Vice President | 1992 | (4) | Portfolio manager and/or analyst, CWAM or its predecessors since 1978; Vice President, Columbia Acorn Trust and Wanger Advisors Trust since April 2014; President and Chief Investment Officer, CWAM or its predecessors, October 2003-March 2014, and President, Columbia Acorn Trust and Wanger Advisors Trust, October 2003-March 2014. | |||||||||||
| Louis J. Mendes III, 51 | Vice President | 2003 | International Director of Research, CWAM, since 2015; portfolio manager and/or analyst, CWAM or its predecessors since 2001; Vice President, Columbia Acorn Trust since 2003 and Wanger Advisors Trust since 2005. | ||||||||||||
| Christopher J. Olson, 51 | Vice President | 2001 | Portfolio manager and/or analyst, CWAM or its predecessors since January 2001; Vice President, Columbia Acorn Trust and Wanger Advisors Trust since 2001. | ||||||||||||
| Julian Quero, 48 | Assistant Treasurer | 2015 | Vice President—Tax, Columbia Management Investment Advisers, LLC since 2009. | ||||||||||||
| Matthew S. Szafranski, 38 | Vice President | 2015 | Portfolio manager and/or analyst, CWAM or its predecessors since 2008; Vice President, Columbia Acorn Trust and Wanger Advisors Trust since 2015. | ||||||||||||
| Andreas Waldburg-Wolfegg, 50 | Vice President | 2011 | Portfolio manager and/or analyst, CWAM or its predecessors since 2002; Vice President, Columbia Acorn Trust and Wanger Advisors Trust since 2011. | ||||||||||||
| Linda Roth-Wiszowaty, 46 | Secretary | 2006 | Business support analyst, CWAM since April 2007; Secretary, Columbia Acorn Trust and Wanger Advisors Trust since 2014; Assistant Secretary, Columbia Acorn Trust and Wanger Advisors Trust, 2006-2014. | ||||||||||||
(1) The Trustees oversee the series of Wanger Advisors Trust and Columbia Acorn Trust.
(2) Mr. Egan is an "interested person" of Wanger Advisors Trust, Columbia Acorn Trust, and CWAM, as defined in the 1940 Act, because he is an officer of each Trust and an employee of CWAM.
(3) As permitted under the Trust's Bylaws, Mr. Wanger serves as a non-voting Trustee Emeritus of Wanger Advisors Trust and Columbia Acorn Trust.
(4) Dates prior to 1992 relate to The Acorn Fund, Inc., the predecessor trust to Columbia Acorn Trust.
24
Wanger USA 2015 Annual Report
Columbia Wanger Funds
Trustees
Laura M. Born, Chair of the Board
David J. Rudis, Vice Chair of the Board
Maureen M. Culhane
P. Zachary Egan
Margaret M. Eisen
Thomas M. Goldstein
John C. Heaton
Charles R. Phillips
Steven N. Kaplan
Ralph Wanger (Trustee Emeritus)
Officers
P. Zachary Egan
President
Alan G. Berkshire
Vice President
Michael G. Clarke
Assistant Treasurer
William J. Doyle
Vice President
David L. Frank
Vice President
Paul B. Goucher
Assistant Secretary
Fritz Kaegi
Vice President
John M. Kunka
Treasurer and Principal Financial and Accounting Officer
Stephen Kusmierczak
Vice President
Joseph C. LaPalm
Vice President
Ryan C. Larrenaga
Assistant Secretary
Satoshi Matsunaga
Vice President
Thomas P. McGuire
Chief Compliance Officer
Charles P. McQuaid
Vice President
Louis J. Mendes
Vice President
Christopher J. Olson
Vice President
Julian Quero
Assistant Treasurer
Matthew S. Szafranski
Vice President
Andreas Waldburg-Wolfegg
Vice President
Linda K. Roth-Wiszowaty
Secretary
Investment Manager
Columbia Wanger Asset Management,LLC
227 West Monroe Street, Suite 3000
Chicago, Illinois 60606
1-888-4-WANGER
(1-888-492-6437)
Transfer Agent,
Dividend Disbursing Agent
Columbia Management Investment Services Corp.
P.O.Box 8081
Boston, Massachusetts
02266-8081
Distributor
Columbia Management Investment Distributors, Inc.
225 Franklin Street
Boston, Massachusetts
02110
Legal Counsel to the Funds
Perkins Coie LLP
Washington, DC
Legal Counsel to the Independent Trustees
Drinker Biddle & Reath LLP
Philadelphia, Pennsylvania
Independent Registered Public Accounting Firm
PricewaterhouseCoopers LLP
Chicago, Illinois
This document contains Global Industry Classification Standard data. The Global Industry Classification Standard ("GICS") was developed by and is the exclusive property and a service mark of MSCI Inc. ("MSCI") and Standard & Poor's Financial Services LLC ("S&P") and is licensed for use by Columbia Wanger Asset Management, LLC ("CWAM"). Neither MSCI, S&P, nor any other party involved in making or compiling the GICS or any GICS classifications makes any express or implied warranties or representations with respect to such standard or classification (or the results to be obtained by the use thereof), and all such parties hereby expressly disclaim all warranties of originality, accuracy, completeness, merchantability and fitness for a particular purpose with respect to any of such standard or classification. Without limiting any of the foregoing, in no event shall MSCI, S&P, any of their affiliates or any third party involved in making or compiling the GICS or any GICS classifications have any liability for any direct, indirect, special, punitive, consequential or any other damages (including lost profits) even if notified of the possibility of such damages.
This report, including the schedules of investments and financial statements, is submitted for the general information of the shareholders of the Wanger Advisors Trust.
A description of the Fund's proxy voting policies and procedures and a copy of the Fund's voting record for the most recent 12-month period ended June 30 are available (i) on our website, columbiathreadneedle.com/us, (ii) on the Securities and Exchange Commission's website at www.sec.gov, and (iii) without charge, upon request, by calling 888-492-6437.
The Fund files a complete schedule of portfolio holdings with the SEC for the first and third quarters of each fiscal year on Form N-Q. The Fund's Form N-Q is available on the SEC's website at www.sec.gov and may be reviewed and copied at the SEC's Public Reference Room in Washington, D.C. Information on the operation of the Pubic Reference Room may be obtained by calling 800-SEC-0330. The Fund's complete portfolio holdings are disclosed at www.columbiathreadneedle.com/us approximately 30 to 40 days after each month end.

COLUMBIA WANGER FUNDS
© 2016 Columbia Management Investment Advisers, LLC. All rights reserved. C-1466 G (2/16) 1422120
Item 2. Code of Ethics.
(a) The registrant has adopted a code of ethics that applies to the registrant’s principal executive officer, principal financial officer, principal accounting officer or controller, or persons performing similar functions, regardless of whether these individuals are employed by the registrant or a third party.
(b) During the period covered by this report, there were not any amendments to a provision of the code of ethics adopted in 2(a) above.
(c) During the period covered by this report, there were no waivers, including any implicit waivers, from a provision of the code of ethics described in 2(a) above that relates to one or more of the items set forth in paragraph (b) of this item’s instructions.
Item 3. Audit Committee Financial Expert.
The registrant’s Board of Trustees has determined that Thomas Goldstein, a member of the registrant’s Board of Trustees and Audit Committee, qualifies as an audit committee financial expert. Mr. Goldstein is an independent trustee, as defined in paragraph (a)(2) of this item’s instructions.
Item 4. Principal Accountant Fees and Services.
(a) Audit Fees. Aggregate Audit Fees billed by the principal accountant for professional services rendered during the fiscal years ended December 31, 2015 and December 31, 2014 are approximately as follows:
2015 |
| 2014 |
| ||
$ | 99,800 |
| $ | 110,900 |
|
Audit Fees include amounts related to the audit of the registrant’s annual financial statements or services that are normally provided by the accountant in connection with statutory and regulatory filings or engagements for those fiscal years.
(b) Audit-Related Fees. Aggregate Audit-Related Fees billed to the registrant by the principal accountant for professional services rendered during the fiscal years ended December 31, 2015 and December 31, 2014 are approximately as follows:
2015 |
| 2014 |
| ||
$ | 16,900 |
| $ | 22,700 |
|
Audit-Related Fees include amounts for assurance and related services by the principal accountant that are reasonably related to the performance of the audit of the registrant’s financial statements and are not reported in Audit Fees above. In both fiscal years 2015 and 2014, Audit-Related Fees consist of agreed-upon procedures performed for other audit-related additional testing.
During the fiscal years ended December 31, 2015 and December 31, 2014, there were no Audit-Related Fees billed by the registrant’s principal accountant to the registrant’s investment adviser (not including any sub-adviser whose role is primarily portfolio management and is subcontracted with or overseen by another investment adviser) and any entity controlling, controlled by, or under common control with the adviser that provides ongoing services to the registrant for an engagement that related directly to the operations and financial reporting of the registrant.
(c) Tax Fees. Aggregate Tax Fees billed by the principal accountant to the registrant for professional services rendered during the fiscal years ended December 31, 2015 and December 31, 2014 are approximately as follows:
2015 |
| 2014 |
| ||
$ | 34,700 |
| $ | 26,800 |
|
Tax Fees incurred in both fiscal years 2015 and 2014 relate to the review of annual tax returns, the review of required shareholder distribution calculations and include amounts for professional services by the principal accountant for tax compliance, tax advice and tax planning.
During the fiscal years ended December 31, 2015 and December 31, 2014, there were no Tax Fees billed by the registrant’s principal accountant to the registrant’s investment adviser (not including any sub-adviser whose role is primarily portfolio management and is subcontracted with or overseen by another investment adviser) and any entity controlling, controlled by, or under common control with the adviser that provides ongoing services to the registrant for an engagement that related directly to the operations and financial reporting of the registrant.
(d) All Other Fees. Aggregate All Other Fees billed by the principal accountant to the registrant for professional services rendered during the fiscal years ended December 31, 2015 and December 31, 2014 are as follows:
2015 |
| 2014 |
| ||
$ | 0 |
| $ | 0 |
|
All Other Fees include amounts for products and services provided by the principal accountant, other than the services reported in paragraphs (a) through (c) above.
Aggregate All Other Fees billed by the registrant’s principal accountant to the registrant’s investment adviser (not including any sub-adviser whose role is primarily portfolio management and is subcontracted with or overseen by another investment adviser) and any entity controlling, controlled by, or under common control with the adviser that provides ongoing services to the registrant for an engagement that related directly to the operations and financial reporting of the registrant during the fiscal years ended December 31, 2015 and December 31, 2014 are approximately as follows:
2015 |
| 2014 |
| ||
$ | 225,000 |
| $ | 325,000 |
|
In both fiscal years 2015 and 2014, All Other Fees primarily consist of professional services rendered for internal control reviews.
(e)(1) Audit Committee Pre-Approval Policies and Procedures
The policy of the registrant’s Audit Committee is to specifically pre-approve (i) all audit and non-audit (including audit related, tax and all other) services provided by the registrant’s independent auditor to the registrant and individual funds (collectively “Fund Services”) and (ii) all non-audit services provided by the registrant’s independent auditor to the funds’ adviser or a control affiliate of the adviser, that relate directly to the funds’ operations and financial reporting (collectively “Fund-related Adviser Services”). A “control affiliate” is an entity controlling, controlled by, or under common control with the adviser that provides ongoing services to the funds, and the term “adviser” is deemed to exclude any unaffiliated sub-adviser whose role is primarily portfolio management and is sub-contracted or overseen by another investment adviser.
If such Fund Services or Fund-related Adviser Services are required during the period between the Audit Committee’s regularly scheduled meetings, the Chairman of the Audit Committee has the authority to pre-approve the service, with reporting to the full Audit Committee at the next regularly scheduled meeting.
The Audit Committee will waive pre-approval of Fund Services or Fund-related Adviser Services provided that the requirements under paragraph (c)(7)(i)(C) of Rule 2-01 of Regulation S-X are met.
(e)(2) The percentage of services described in paragraphs (b) through (d) of this Item approved pursuant to the “de minimis” exception under paragraph (c)(7)(i)(C) of Rule 2-01 of Regulation S-X during both fiscal years ended December 31, 2015 and December 31, 2014 was zero.
(f) Not applicable.
(g) The aggregate non-audit fees billed by the registrant’s accountant for services rendered to the registrant, and rendered to the registrant’s investment adviser (not including any sub-adviser whose role is primarily portfolio management and is
subcontracted with or overseen by another investment adviser), and any entity controlling, controlled by, or under common control with the adviser that provides ongoing services to the registrant for the fiscal years ended December 31, 2015 and December 31, 2014 are approximately as follows:
2015 |
| 2014 |
| ||
$ | 276,600 |
| $ | 374,500 |
|
(h) The registrant’s Audit Committee of the Board of Trustees has considered whether the provision of non-audit services that were rendered to the registrant’s adviser (not including any sub-adviser whose role is primarily portfolio management and is subcontracted with or overseen by another investment adviser), and any entity controlling, controlled by, or under common control with the investment adviser that provides ongoing services to the registrant that were not pre-approved pursuant to paragraph (c)(7)(ii) of Rule 2-01 of Regulation S-X, is compatible with maintaining the principal accountant’s independence.
Item 5. Audit Committee of Listed Registrants.
Not applicable.
Item 6. Investments
(a) The registrant’s “Schedule I — Investments in securities of unaffiliated issuers” (as set forth in 17 CFR 210.12-12) is included in Item 1 of this Form N-CSR.
(b) Not applicable
Item 7. Disclosure of Proxy Voting Policies and Procedures for Closed-End Management Investment Companies.
Not applicable.
Item 8. Portfolio Managers of Closed-End Management Investment Companies.
Not applicable.
Item 9. Purchases of Equity Securities by Closed-End Management Investment Company and Affiliated Purchasers.
Not applicable.
Item 10. Submission of Matters to a Vote of Security Holders.
There were no material changes to the procedures by which shareholders may recommend nominees to the registrant’s board of directors.
Item 11. Controls and Procedures.
(a) The registrant’s principal executive officer and principal financial officers, based on their evaluation of the registrant’s disclosure controls and procedures as of a date within 90 days of the filing of this report, have concluded that such controls and procedures are adequately designed to ensure that material information required to be disclosed by the registrant in Form N-CSR is accumulated and communicated to the registrant’s management, including the principal executive officer and principal financial officer, or persons performing similar functions, as appropriate to allow timely decisions regarding required disclosure.
(b) There was no change in the registrant’s internal control over financial reporting that occurred during the registrant’s second fiscal quarter of the period covered by this report that has materially affected, or is reasonably likely to materially affect, the registrant’s internal control over financial reporting.
Item 12. Exhibits.
(a)(1) Code of ethics required to be disclosed under Item 2 of Form N-CSR attached hereto as Exhibit 99.CODE ETH.
(a)(2) Certifications pursuant to Rule 30a-2(a) under the Investment Company Act of 1940 (17 CFR 270.30a-2(a)) attached hereto as Exhibit 99.CERT.
(a)(3) Not applicable.
(b) Certification pursuant to Rule 30a-2(b) under the Investment Company Act of 1940 (17 CFR 270.30a-2(b)) attached hereto as Exhibit 99.906CERT.
SIGNATURES
Pursuant to the requirements of the Securities Exchange Act of 1934 and the Investment Company Act of 1940, the registrant has duly caused this report to be signed on its behalf by the undersigned, thereunto duly authorized.
(registrant) |
| Wanger Advisors Trust |
| ||
|
|
| |||
|
|
| |||
By (Signature and Title) |
| /s/ P. Zachary Egan |
| ||
| P. Zachary Egan, President | ||||
|
|
| |||
|
|
| |||
Date |
| February 19, 2016 |
| ||
Pursuant to the requirements of the Securities Exchange Act of 1934 and the Investment Company Act of 1940, this report has been signed below by the following persons on behalf of the registrant and in the capacities and on the dates indicated.
By (Signature and Title) |
| /s/ P. Zachary Egan |
| |
| P. Zachary Egan, President | |||
|
|
| ||
|
|
| ||
Date |
| February 19, 2016 |
| |
|
|
| ||
|
|
| ||
By (Signature and Title) |
| /s/ John M. Kunka |
| |
| John M. Kunka, Treasurer | |||
|
|
| ||
|
|
| ||
Date |
| February 19, 2016 |
| |