UNITED STATES
SECURITIES AND EXCHANGE COMMISSION
Washington, D.C. 20549
FORM N-CSR
CERTIFIED SHAREHOLDER REPORT OF REGISTERED
MANAGEMENT INVESTMENT COMPANIES
Investment Company Act file number | 811-08748 | |||||||
| ||||||||
Wanger Advisors Trust | ||||||||
(Exact name of registrant as specified in charter) | ||||||||
| ||||||||
227 W. Monroe Street Suite 3000 Chicago, IL |
| 60606 | ||||||
(Address of principal executive offices) |
| (Zip code) | ||||||
| ||||||||
Mary C. Moynihan Perkins Coie LLP 700 13th Street, NW Suite 600 Washington, DC 20005 | ||||||||
(Name and address of agent for service) | ||||||||
| ||||||||
Registrant’s telephone number, including area code: | (312) 634-9200 |
| ||||||
| ||||||||
Date of fiscal year end: | December 31 |
| ||||||
| ||||||||
Date of reporting period: | December 31, 2013 |
| ||||||
Form N-CSR is to be used by management investment companies to file reports with the Commission not later than 10 days after the transmission to stockholders of any report that is required to be transmitted to stockholders under Rule 30e-1 under the Investment Company Act of 1940 (17 CFR 270.30e-1). The Commission may use the information provided on Form N-CSR in its regulatory, disclosure review, inspection, and policymaking roles.
A registrant is required to disclose the information specified by Form N-CSR, and the Commission will make this information public. A registrant is not required to respond to the collection of information contained in Form N-CSR unless the Form displays a currently valid Office of Management and Budget (“OMB”) control number. Please direct comments concerning the accuracy of the information collection burden estimate and any suggestions for reducing the burden to Secretary, Securities and Exchange Commission, 450 Fifth Street, NW, Washington, DC 20549-0609. The OMB has reviewed this collection of information under the clearance requirements of 44 U.S.C. § 3507.
Item 1. Reports to Stockholders.
Wanger International
2013 Annual Report

Not FDIC insured • No bank guarantee • May lose value

Wanger International
2013 Annual Report
Table of Contents
1 | Understanding Your Expenses | ||||||
2 | Containerized Cargo and the Man Who Popularized It | ||||||
4 | Performance Review | ||||||
6 | Statement of Investments | ||||||
17 | Statement of Assets and Liabilities | ||||||
17 | Statement of Operations | ||||||
18 | Statement of Changes in Net Assets | ||||||
19 | Financial Highlights | ||||||
20 | Notes to Financial Statements | ||||||
24 | Report of Independent Registered Public Accounting Firm | ||||||
25 | Federal Income Tax Information (Unaudited) | ||||||
26 | Board of Trustees and Management of Wanger Advisors Trust | ||||||
A Comment on Trading Volumes
Market conditions are always changing and vary by country and industry sector, and investing in international markets involves unique risks. In the wake of the 2007-2009 financial crisis, trading volumes in both emerging and developed international markets declined significantly and have stayed at generally reduced levels since then. Although it is difficult to accurately assess trends in trading volumes in foreign markets, because some amount of activity has migrated to alternative trading venues, a reduction in trading volumes poses challenges to the Fund. This is particularly so because the Fund focuses on small- and mid-cap companies that usually have lower trading volumes and often takes sizeable positions in portfolio companies. As a result of lower trading volumes, it may take longer to buy or sell securities, which can exacerbate the Fund's exposure to volatile markets. The Fund may also be limited in its ability to execute favorable trades in portfolio securities in response to changes in company prices and fundamentals. If the Fund is forced to sell securities to meet redemption requests or other cash needs, or in the case of an event affecting liquidity in a particular market or markets, it may be forced to dispose of those securities under disadvantageous circumstances and at a loss. As the Fund grows in size, these considerations take on increasing significance and may adversely impact performance.
Columbia Wanger Asset Management, LLC (CWAM) is one of the leading global small- and mid-cap equity managers in the United States with over 40 years of small- and mid-cap investment experience. As of December 31, 2013, CWAM managed $39.7 billion in assets. CWAM is the investment manager to Wanger USA, Wanger International, Wanger Select and Wanger International Select (together, the Columbia Wanger Funds) and the Columbia Acorn Family of Funds.
An important note: Columbia Wanger Funds are available only through variable annuity contracts and variable life insurance policies issued by participating insurance companies or certain eligible retirement plans. Columbia Wanger Funds are not offered directly to the public and are not available in all contracts, policies or plans. Contact your financial advisor or insurance representative for more information. Columbia Wanger Funds are distributed by Columbia Management Investment Distributors, Inc., member FINRA, and are managed by Columbia Wanger Asset Management, LLC.
Investors should carefully consider investment objectives, risks, charges and expenses before investing. For variable fund and variable contract prospectuses, which contain this and other important information, investors should contact their financial advisor or insurance representative. Read the prospectus carefully before investing.
The views expressed in "Containerized Cargo and the Man Who Popularized It" and in the Performance Review reflect the current views of the respective authors. These views are not guarantees of future performance and involve certain risks, uncertainties and assumptions that are difficult to predict so actual outcomes and results may differ significantly from the views expressed. These views are subject to change at any time based upon economic, market or other conditions and the respective parties disclaim any responsibility to update such views. These views may not be relied on as investment advice and, because investment decisions for a Columbia Wanger Fund are based on numerous factors, may not be relied on as an indication of trading intent on behalf of any particular Columbia Wanger Fund. References to specific company securities should not be construed as a recommendation or investment advice.
Wanger International 2013 Annual Report
Understanding Your Expenses
As a shareholder, you incur three types of costs. There are transaction costs, which generally include sales charges on purchases and may include redemption fees. There are also ongoing costs, which generally include management fees and other expenses for Wanger International (the Fund). Lastly, there may be additional fees or charges imposed by the insurance company that sponsors your variable annuity and/or variable life insurance product. The following information is intended to help you understand your ongoing costs (in dollars) of investing in the Fund and to help you compare these costs with the ongoing costs of investing in other mutual funds.
Analyzing your Fund's expenses
To illustrate these ongoing costs, we have provided an example and calculated the expenses paid by investors in the Fund during the period. The actual and hypothetical information in the table below is based on an initial investment of $1,000 at the beginning of the period indicated and held for the entire period. Expense information is calculated two ways and each method provides you with different information. The amount listed in the "Actual" column is calculated using the Fund's actual operating expenses and total return for the period. You may use the Actual information, together with the amount invested, to estimate the expenses that you paid over the period. Simply divide your account value by $1,000 (for example, an $8,600 account value divided by $1,000 = 8.6), then multiply the results by the expenses paid during the period under the Actual column. The amount listed in the "Hypothetical" column assumes a 5% annual rate of return before expenses (which is not the Fund's actual return) and then applies the Fund's actual expense ratio for the period to the hypothetical return. You should not use the hypothetical account values and expenses to estimate either your actual account balance at the end of the period or the expenses you paid during the period. See "Compare with other funds" below for details on how to use the hypothetical data.
Compare with other funds
Since all mutual funds are required to include the same hypothetical calculations about expenses in shareholder reports, you can use this information to compare the ongoing cost of investing in the Fund with other funds. To do so, compare the hypothetical example with the 5% hypothetical examples that appear in the shareholder reports of other funds. As you compare hypothetical examples of other funds, it is important to note that hypothetical examples are meant to highlight the ongoing cost of investing in a fund only and do not reflect any transaction costs, such as sales charges, redemption or exchange fees. Therefore, the hypothetical calculations are useful in comparing ongoing costs only, and will not help you determine the relative total costs of owning different funds. If transaction costs were included in these calculations, your costs would be higher.
July 1, 2013 – December 31, 2013
| Account value at the beginning of the period ($) | Account value at the end of the period ($) | Expenses paid during period ($) | Fund's annualized expense ratio (%)* | ||||||||||||||||||||||||||||
Actual | Hypothetical | Actual | Hypothetical | Actual | Hypothetical | ||||||||||||||||||||||||||
Wanger International | 1,000.00 | 1,000.00 | 1,156.90 | 1,019.98 | 5.94 | 5.56 | 1.08 | ||||||||||||||||||||||||
*Expenses paid during the period are equal to the Fund's annualized expense ratio, multiplied by the average account value over the period, then multiplied by the number of days in the Fund's most recent fiscal half-year and divided by 365.
It is important to note that the expense amounts shown in the table are meant to highlight only ongoing costs of investing in the Fund. Expenses paid during the period do not include any insurance charges imposed by your insurance company's separate account. The hypothetical example provided is useful in comparing ongoing costs only and will not help you determine the relative total costs of owning different funds whose shareholders may incur transaction costs.
1
Wanger International 2013 Annual Report

Containerized Cargo and the Man Who Popularized It
Born in a small town in North Carolina, Malcom McLean had little formal schooling beyond grade school. He first worked as a farmer and then operated a gas station. When, in 1934, a road builder asked him where he could hire a truck and a driver, Malcom bought a used truck for $150 and signed on. Malcom went on to build McLean Trucking, one of the largest trucking firms in the country.1 The company was an early adopter of diesel engines and conveyors, and acquired other truckers in order to transport backhauls under Interstate Commerce Commission rules.2
Early in his trucking career, McLean personally had the job of delivering cotton to the port of New York and returning with a truck full of roofing material. He grew impatient waiting for the stevedores to unload and reload his truck and thought that switching full containers would save time and money.3
In 1955, McLean sold his trucking business and bought Pan-Atlantic Steamship Company for $7 million cash. He then bought Pan-Atlantic's former parent company, Waterman, in a $42 million leveraged buyout using Pan-Atlantic as collateral.4 Combined, the companies operated 37 World War II surplus C-2 cargo ships. He also bought four World War II surplus T-2 tankers and had them equipped with spar decks on top, similar to those used during the war to haul large equipment across the Atlantic.
McLean now had the opportunity to put his shipping-by-container idea to work. Until the 1950s, general ocean cargo arrived at ports in crates, boxes, bags and on pallets. It was then meticulously packed by longshoremen; a typical ship took 150 of them four days to load.5 One steamship executive said it cost more to move cargo from the street to the hold of a ship, than it did to move the cargo across the sea.6 McLean decided to save time and space by utilizing detachable truck trailers, and transporting only the container section of the trailer on the vessels.7 In April 1956, service commenced between Port Newark, New Jersey, Miami, Florida and Houston,
Texas. Each of the four ships could accommodate 58 containers that were thirty-three feet long.8
Shipping by container did cost substantially less. As an extreme example, McLean calculated that the cost of hauling bottled beer from Newark to Miami was 94% cheaper by containership than by conventional shipping. More realistically, a government-sponsored study calculated that container shipping cost 39% to 74% less.9 McLean named his intermodal operation Sea-Land Service.
Sea-Land then set about converting six of the C-2 cargo ships in its fleet into dedicated containerships. Containers were to be stacked four high in the hold and two high on the deck, resulting in a capacity of 226 containers per vessel. In order to allow stacking, frames of the containers were strengthened and twist locks were invented to hold adjacent containers in place. The first converted C-2 began hauling containers in October 1957. These containerships could be loaded by a crew of 14 during a single eight-hour shift for a cost nearly 90% less than loading a similar sized break-bulk ship, a ship with cargo loaded individually.10
Imitators soon followed. In August 1958 Matson Line began service between California and Hawaii, carrying 20 containers on deck and conventional break-bulk cargo below. In 1960, Matson began launching dedicated containerships, again converted World War II cargo ships, accommodating up to 356 containers each. In 1960, Grace Line inserted mid-sections into C-2 cargo ships and converted them to containerships capable of carrying 476 containers for shipments between the United States and Latin America. But Grace Line abandoned the service within a few years due to labor problems. McLean launched ships that could carry 476 much larger containers in 1962, and put them into service between the East and West coasts of the United States,11 as well as between the continental United States and Puerto Rico.12 On its tenth anniversary in 1966, Sea-Land had 19 containerships.13 By 1969,
Sea-Land had also converted C-4s to carry 622 containers.14
McLean recognized that to achieve the full benefit of containers, the entire system of ports, labor, trucks and ships would have to change.15 Port Elizabeth, New Jersey, was designed for containerships. Opening in 1962, it had a wide and deep channel and plenty of paved area shore-side for containers in transit.16 New Jersey's share of the Port of New York cargo jumped from 9% in 1956 to 63% in 1970. Around the country, the few ports that had room for containers, good road and rail connections (and a penchant for spending on infrastructure) gained share, while ports relying on piers within congested cities lost out.17 McLean also signed agreements with unions, providing regular work, safe working conditions and provisions for early retirement in exchange for fewer paid employee hours and more flexible work rules.
Trans-Atlantic container shipping started in 1966 and competition increased. McLean decided to build all-new containerships rather than convert old vessels. He specified ships for both size and speed that could carry over 1,200 containers of varying sizes.18 The ships were to steam at 33 knots, well above most others that operated at 18 to 24 knots. The new containerships cost a total of $435 million. In May of 1969, McLean orchestrated a $530 million takeover of Sea-Land by R.J. Reynolds, a cash-rich tobacco company, as Sea-Land needed investment capital and R.J. Reynolds wanted to diversify.19
The first of eight ships launched in 1972. It crossed the Atlantic in under five days and averaged 31 knots, a cargo ship record. After refinements, sister ships were able to make the crossing in under four days, beating the record of all passenger ships except for a ship named the United States.20 Six of the eight ships were eventually assigned to trans-Pacific crossings.
But fast ships use far more fuel than slower ships. Sea-Land's new containerships consumed nearly twice as much fuel per mile at 33 knots than at 24 knots, and at 24 knots consumed
2
Wanger International 2013 Annual Report
more fuel per container than ships that were designed for 24 knots or less. After two oil price spikes in the 1970s, the ships became unprofitable and were sold in 1981, at less than half their cost of construction, to the U.S. Navy for use as fast supply vessels.21
McLean reduced his role at Sea-Land after the fast ships launched in 1972, resigned from the R.J. Reynolds board in 1977 and sold his last shares in the company in 1980. R.J. Reynolds spun off Sea-Land in 1984; CSX bought it in 1986, and sold it to Maersk in 1999.
McLean re-entered the shipping industry by buying United States Lines from Walter Kidde in April 1978. Later that year, the company placed a record order to construct 12 new containerships, each with a capacity somewhat over 4,250 containers. These ships were 40% larger than the largest containership in existence and would provide United States Lines with the most capacity in the industry. Per container, the ships would be by far the most efficient and would cruise at a fuel-efficient 16 knots. The ships were highly automated and were able to carry nearly 50 times as much cargo per crewmember as the first dedicated cargo ships.22
Tragically for McLean and United States Lines, the price of oil then plunged, fuel efficiency mattered a lot less, and speed became more important. The ships were underpowered and had trouble keeping schedules in rough seas. They could not compete and in 1986 the company filed the biggest bankruptcy in U.S. history. The ships were sold at $0.28 on the dollar 16 months later.23 McLean was mortified by the failure, which cost thousands of jobs and millions of dollars. He died in 2001 at the age of 87, after yet another attempt to re-enter the industry.
Containerships kept getting larger and speeds gradually increased. Beginning in 2006, Maersk launched eight ships capable of carrying over 14,000 containers. Larger containerships had costs per container nearly 50% less than smaller ships.24 In 2013, Maersk launched the Mc-Kinney Moller with a capacity of 18,000
containers and had 19 more on order. These ships are longer than the height of the Empire State Building's occupied floors. Echoing McLean's 1978 order, the ships are designed to be at least 30% more fuel efficient than competitors and cruise at 16 knots.25 Worldwide containership capacity currently exceeds 17 million containers, which, if laid end-to-end, exceeds twice the circumference of the world.26
Containerships made freight transport reliable and incredibly cheap. At least three-quarters of vessels in the Far East/North America trade arrive within a day of schedule. In 2004, 4,000 video recorders could be shipped from the Far East to Europe for $0.83 each and Scotch whisky could be shipped from Europe to Japan for $0.05 per bottle.27 In 2013, it was cheaper to ship Scottish cod 10,000 miles to China for filleting and back to Scotland than to fillet it in Scotland!28
Containerized cargo hiked supplies and reduced prices of consumer goods, raising living standards around the world. The containership industry has high fixed costs and is very cyclical. Also, new more efficient ships increase industry capacity and depress pricing, hurting profitability of existing ships. As investors, we've found more stable opportunities in this industry by investing in adjunct businesses that benefit from increased container volumes. These include freight forwarders, which tend to benefit from declining costs or transport, and container owners, which exist today thanks to the ingenuity of Malcom McLean.


Charles P. McQuaid
President and Chief Investment Officer
Columbia Wanger Asset Management, LLC
The information and data provided in this analysis are derived from sources that we deem to be reliable and accurate. These views are not guarantees of future performance and involve certain risks, uncertainties and assumptions that are difficult to predict so actual outcomes and results may differ significantly from the views expressed. The views/opinions expressed here are those of the author and not of the Wanger Advisors Trust Board, are subject to change at any time based upon economic, market or other conditions, may differ from views expressed by other Columbia Management associates and the respective parties disclaim any responsibility to update such views. These views may not be relied on as investment advice and, because investment decisions for a Columbia Wanger Fund are based on numerous factors, may not be relied on as an indication of trading intent on behalf of any particular Columbia Wanger Fund.
1 Cudahy, Brian J., Box Boats, How Container Ships Changed the World (New York, New York, Fordham University Press, 2006) p. 21.
2 Levinson, Marc, The Box, How the Shipping Container Made the World Smaller and the World Economy Bigger (Princeton, New Jersey, Princeton University Press, 2006), p. 40-41.
3 Cudahy, Brian J., op. cit., p. 10.
4 Ibid., p. 24.
5 Ibid., p. 35.
6 Ibid., p. 9.
7 Ibid., p. 27.
8 Levinson, Marc, op. cit., p. 49, 51.
9 Ibid., p. 48, 91.
10 Cudahy, Brian J., op. cit., p. 35.
11 Ibid., p. 80.
12 Levinson, Marc, op. cit., p. 72.
13 Cudahy, Brian J., op. cit., p. 90.
14 Ibid., p. 100.
15 Levinson, Marc, op. cit., p. 53.
16 Ibid., p. 91.
17 Ibid., p. 91, 96, 193.
18 Sea-Land's initial containers were 33 and 35 feet long, while Matson Lines' were 24 feet and Grace Lines' measured 17 feet, lengths determined by ship sizes and road regulations. Going forward in this essay, capacity refers to standardized 20-foot trailer equivalent units (TEU), though most containers today are 40 feet long.
19 Levinson, Marc, op. cit., p. 216-217.
20 Cudahy, Brian J., op. cit., p. 123.
21 Ibid., p. 136-137.
22 Ibid., p. 149-150.
23 Levinson, Marc, op. cit., p. 243.
24 Stopford, Martin, Maritime Economics, Third Edition (New York, New York, Routledge, Taylor & Francis Group, 2009) p. 540.
25 Bennett, Drake, "Risk Ahoy: Maersk, Daewoo Build the World's Biggest Boat," Bloomberg Businessweek, September 5, 2013.
26 World Shipping Council website, http://www.worldshipping.org/about-the-industry/liner-ships/container-vessel-fleet.
27 Stopford, Martin, op. cit., p. 512, 522.
28 George, Rose, Ninety Percent of Everything, Inside Shipping, The Invisible Industry that Puts Clothes on Your Back, Gas in Your Car, and Food on Your Plate (New York, New York, Metropolitan Books, Henry Hold and Company, 2013), p. 18.
3
Wanger International 2013 Annual Report

Performance Review Wanger International
|
| ||||||
| Louis J. Mendes III Co-Portfolio Manager | Christopher J. Olson Co-Portfolio Manager | ||||||


Performance data shown represents past performance and is not a guarantee of future results. The investment return and principal value will fluctuate so that shares, when redeemed, may be worth more or less than the original cost. Current performance may be lower or higher than the performance data shown. Please visit columbiamanagement.com for most recent month-end performance updates.
Wanger International returned 22.37% for the one-year period, outperforming its primary benchmark, the S&P Global Ex-U.S. Between $500M and $5B Index, which was up 16.77%. For comparison, the large-cap, developed market MSCI EAFE Index (Net) rose 22.78% during the year.
2013 was a banner year for many equity markets in the developed world as optimism about economic recovery in Japan, Europe and the United States sent most major market indexes up more than 20%. This optimistic outlook was underpinned by the U.S. Federal Reserve Bank, which in the second quarter indicated that its bond purchase program might be wound down sooner rather than later due to the Fed's rising expectations for economic growth. The resultant jump of approximately 100 basis points in long-term government bond rates had a particularly pronounced effect on the developing world, which was already struggling with deteriorated economic outlooks. Many emerging markets posted weak local market returns, exacerbated in U.S. dollar terms by weakening currencies. The Fund's holdings in Europe and Japan returned over 35% in the year, while holdings elsewhere in Asia, Latin America and Africa averaged 13% gains.
The Fund's top percentage return in the annual period came from QIWI, a Russian provider of electronic payment services that rose 247% on growing payment volumes, strong expected growth in Russian e-commerce, management's decision to return cash to shareholders through special dividends, and broader investor recognition of the quality of the company's business model. Hong Kong-based casino operator Melco International was up 214% for the year. Thanks to ongoing heavy visitation by mainland Chinese to its Macau casino, gaming revenue exceeded both management and analyst expectations. Caesarstone, an Israel-based manufacturer of quartz countertops, rose 210%. The company's innovative products are gaining acceptance internationally as an alternative building material in modern homes.
On the downside, Imtech, a Dutch engineering and consulting company, declined 75% in the year as fraud uncovered in its German subsidiary worked through the company's balance sheet and share price. Mongolian Mining, a Mongolia-based coal producer, fell over 68% as it struggled to make deliveries to the Chinese market on economics consistent with its original projections. In Brazil,
loyalty program operator Multiplus fell over 50% as management changes weighed on sentiment that was already soured by downward pressure on the value of its loyalty points from some of its business partners. We opted to remove all of these positions from Wanger International's portfolio during the period.
As we look ahead to 2014, many developed market companies are now trading at valuations higher than mid-term medians, as a result of two years of strong returns. However, we believe that operating fundamentals in many cases continue to show signs of a recovery, which is cause for optimism. In contrast, many emerging market companies are struggling with the twin overhang of rising interest rates and weaker domestic economic growth. Of course, these headwinds are in many cases also reflected in lower valuations, which could create opportunity. As always, we will work to identify situations where we believe that companies with good or improving fundamentals can be bought for shareholders at a reasonable price.
International investing involves special risks, including foreign taxation, currency risks, risks associated with possible differences in financial standards, operational and settlement risks and other risks associated with future political and economic developments. Stocks of small- and mid-cap companies pose special risks, including illiquidity and greater price volatility than stocks of larger, more established companies. Investing in emerging markets may involve greater risks than investing in more developed countries. In addition, concentration of investments in a single region may result in greater volatility. Please also see "A Comment on Trading Volumes" on the table of contents page of this report.
Fund holdings are as of the date given, are subject to change at any time and are not recommendations to buy or sell any security. Top holdings exclude short-term holdings and cash, if applicable.
Fund's Positions in Mentioned Holdings
As a percentage of net assets, as of 12/31/13
Melco International | 0.9 | % | |||||
Caesarstone | 0.4 | ||||||
QIWI | 0.3 | ||||||
4
Wanger International 2013 Annual Report
Growth of a $10,000 Investment in Wanger International
May 3, 1995 (inception date) through December 31, 2013
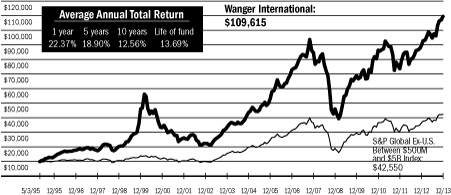
Performance data shown represents past performance and is not a guarantee of future results. The investment return and principal value will fluctuate so that shares, when redeemed, may be worth more or less than the original cost. Current performance may be lower or higher than the performance data shown. Performance results reflect any fee waivers or reimbursements of Fund expenses by the investment manager and/or any of its affiliates. Absent these fee waivers and/or expense reimbursement arrangements, performance results would have been lower. For most recent month-end performance updates, please visit columbiamanagement.com.
This graph compares the results of $10,000 invested in Wanger International on May 3, 1995 (the date the Fund began operations) through December 31, 2013, to the S&P Global Ex-U.S. Between $500M and $5B Index with dividends and capital gains reinvested. Although the index is provided for use in assessing the Fund's performance, the Fund's holdings may differ significantly from those in the index.
Top 10 Holdings
As a percentage of net assets, as of 12/31/13
| 1. Melco Crown Entertainment - ADR (Hong Kong) Macau Casino Operator | 1.4 | % | |||||
| 2. Coronation Fund Managers (South Africa) South African Fund Manager | 1.3 | ||||||
| 3. Charles Taylor (United Kingdom) Insurance Services | 1.1 | ||||||
| 4. Aalberts Industries (Netherlands) Flow Control & Heat Treatment | 1.1 | ||||||
| 5. WuXi Pharma Tech - ADR (China) Largest Contract Research Organization Business in China | 1.0 | ||||||
| 6. CCL Industries (Canada) Largest Global Label Converter | 1.0 | ||||||
| 7. Neopost (France) Postage Meter Machines | 1.0 | ||||||
| 8. Hexagon (Sweden) Design, Measurement & Visualization Software & Equipment | 1.0 | ||||||
| 9. Eurofins Scientific (France) Food, Pharmaceuticals & Materials Screening & Testing | 1.0 | ||||||
| 10. Naspers (South Africa) Media in Africa, China, Russia & Other Emerging Markets | 0.9 | ||||||
Top 5 Countries
As a percentage of net assets, as of 12/31/13
Japan | 20.0 | % | |||||
United Kingdom | 11.1 | ||||||
Taiwan | 4.7 | ||||||
Hong Kong | 4.7 | ||||||
South Africa | 4.0 | ||||||
Results as of December 31, 2013
4th quarter* | 1 year | 5 years | 10 years | ||||||||||||||||
Wanger International | 6.07 | % | 22.37 | % | 18.90 | % | 12.56 | % | |||||||||||
| S&P Global Ex-U.S. Between $500M and $5B Index** | 4.06 | 16.77 | 17.45 | 10.62 | |||||||||||||||
MSCI EAFE Index (Net) | 5.71 | 22.78 | 12.44 | 6.91 | |||||||||||||||
| Lipper Variable Underlying International Growth Funds Index | 6.41 | 19.93 | 14.01 | 7.51 | |||||||||||||||
* Not annualized.
** The Fund's primary benchmark.
NAV as of 12/31/13: $34.55
Performance numbers reflect all Fund expenses but do not include any fees and expenses imposed under your variable annuity or life insurance policy or qualified pension or retirement plan. If performance included the effect of these additional charges, it would be lower.
The Fund's annual operating expense ratio of 1.07% is stated as of the Fund's prospectus dated May 1, 2013, and differences in expense ratios disclosed elsewhere in this report may result from including fee waivers and expense reimbursements as well as different time periods used in calculating the ratios.
All results shown assume reinvestment of distributions.
The S&P Global Ex-U.S. Between $500M and $5B Index is a subset of the broad market selected by the index sponsor representing the mid- and small-cap developed and emerging markets, excluding the United States. The MSCI Europe, Australasia, Far East (EAFE) Index (Net) is a capitalization-weighted index that tracks the total return of common stocks in 22 developed-market countries within Europe, Australasia and the Far East. The returns of the MSCI EAFE Index (Net) are presented net of the withholding tax rate applicable to foreign non-resident institutional investors in the foreign companies included in the index who do not benefit from double taxation treaties. The performance of the MSCI EAFE Index (Net) is provided to show how the Fund's performance compares to a widely recognized broad-based index of foreign market performance. The Lipper Variable Underlying International Growth Funds Index is an equally weighted representation of the 30 largest variable insurance underlying funds in the Lipper Variable Underlying International Growth Funds Classification, and shows how the Fund's performance compares with returns of an index of funds with similar investment objectives. Indexes are not managed and do not incur fees or expenses. It is not possible to invest directly in an index.
Lipper Inc., a widely respected data provider in the industry, calculates an average total return (assuming reinvestment of distributions) for mutual funds with investment objectives similar to those of the Fund.
Portfolio characteristics and holdings are subject to change periodically and may not be representative of current characteristics and holdings.
5
Wanger International 2013 Annual Report
Wanger International
Statement of Investments, December 31, 2013
| Number of Shares | Value | ||||||||||
Equities – 96.4% | |||||||||||
Asia – 42.7% | |||||||||||
Japan – 20.0% | |||||||||||
443,589 | Kansai Paint Paint Producer in Japan, India, China & Southeast Asia | $ | 6,559,764 | ||||||||
102,000 | Omron Electric Components for Factory Automation | 4,507,715 | |||||||||
216,000 | Park24 Parking Lot Operator | 4,073,524 | |||||||||
3,070 | Orix JREIT Diversified REIT | 3,840,731 | |||||||||
87,000 | JIN (a) Eyeglasses Retailer | 3,680,666 | |||||||||
47,000 | Rinnai Gas Appliances for Household & Commercial Use | 3,661,685 | |||||||||
88,300 | Benesse Education Service Provider | 3,547,386 | |||||||||
147,000 | NGK Spark Plug Automobile Parts | 3,483,992 | |||||||||
131,000 | Glory Currency Handling Systems & Related Equipment | 3,399,710 | |||||||||
697 | Kenedix Realty Investment Tokyo Mid-size Office REIT | 3,308,077 | |||||||||
226,000 | Nippon Kayaku Functional Chemicals, Pharmaceuticals & Auto Safety Systems | 3,213,915 | |||||||||
129,440 | Ariake Japan Manufacturer of Soup/Sauce Extracts | 3,187,810 | |||||||||
134,200 | Nabtesco Machinery Components | 3,097,173 | |||||||||
87,000 | Hoshizaki Electric Commercial Kitchen Equipment | 3,093,781 | |||||||||
156,000 | Aica Kogyo Laminated Sheets, Building Materials & Chemical Adhesives | 3,085,240 | |||||||||
135,000 | Japan Airport Terminal Airport Terminal Operator at Haneda | 3,055,279 | |||||||||
100,900 | Toyo Suisan Kaisha Instant Noodle Manufacturer | 3,031,115 | |||||||||
75,000 | Kintetsu World Express Airfreight Logistics | 3,017,858 | |||||||||
118,900 | Start Today Online Japanese Apparel Retailer | 2,956,510 | |||||||||
220,500 | Ushio Industrial Light Sources | 2,930,859 | |||||||||
| Number of Shares | Value | ||||||||||
20,400 | Nakanishi Dental Tools & Machinery | $ | 2,914,736 | ||||||||
146,000 | Daiseki Waste Disposal & Recycling | 2,858,870 | |||||||||
1,006,000 | Aozora Bank Commercial Bank | 2,850,892 | |||||||||
292 | Nippon Prologis REIT Logistics REIT in Japan | 2,797,058 | |||||||||
19,400 | Hirose Electric Electrical Connectors | 2,765,495 | |||||||||
704,000 | Seven Bank ATM Processing Services | 2,753,389 | |||||||||
55,711 | Ain Pharmaciez Dispensing Pharmacy/Drugstore Operator | 2,736,043 | |||||||||
223,900 | Kuraray Special Resin, Fine Chemical, Fibers & Textures | 2,672,650 | |||||||||
56,500 | Santen Pharmaceutical Specialty Pharma (Ophthalmic Medicine) | 2,632,462 | |||||||||
65,500 | Hamamatsu Photonics Optical Sensors for Medical & Industrial Applications | 2,620,994 | |||||||||
141,000 | Suruga Bank Regional Bank | 2,531,970 | |||||||||
37,300 | Disco Semiconductor Dicing & Grinding Equipment | 2,475,716 | |||||||||
144,000 | OSG Consumable Cutting Tools | 2,445,299 | |||||||||
360 | Global One Real Estate Office REIT | 2,444,548 | |||||||||
28,000 | Shimano Manufacturer of Bicycle Components & Fishing Tackle | 2,403,777 | |||||||||
76,300 | Misumi Group Industrial Components Distributor | 2,398,913 | |||||||||
50,736 | Miraca Holdings Outsourced Lab Testing, Diagnostic Equipment & Reagents | 2,393,537 | |||||||||
45,000 | Makita Power Tools | 2,366,670 | |||||||||
109,039 | Nihon Parkerizing Metal Surface Treatment Agents & Processing Service | 2,277,025 | |||||||||
321,000 | Wacom Computer Graphic Illustration Devices | 2,257,105 | |||||||||
118,000 | NGK Insulators Ceramic Products for Auto, Power & Electronics | 2,245,644 | |||||||||
See accompanying notes to financial statements.
6
Wanger International 2013 Annual Report
Wanger International
Statement of Investments, December 31, 2013
| Number of Shares | Value | ||||||||||
Japan – 20.0% (cont) | |||||||||||
315,000 | NOF Specialty Chemicals, Life Science & Rocket Fuels | $ | 2,242,451 | ||||||||
53,000 | Sanrio (a) Character Goods & Licensing | 2,231,685 | |||||||||
54,000 | Itochu Techno-Science IT Network Equipment Sales & Services | 2,188,802 | |||||||||
47,300 | FamilyMart Convenience Store Operator | 2,160,973 | |||||||||
30,100 | FP Corporation Disposable Food Trays & Containers | 2,146,165 | |||||||||
72,000 | OBIC Computer Software | 2,127,430 | |||||||||
150,000 | Doshisha Wholesaler of Household Products | 2,114,192 | |||||||||
250 | Industrial & Infrastructure Fund Industrial REIT in Japan | 2,083,103 | |||||||||
124,000 | Nippon Paint Paints for Automotive, Decorative & Industrial Usage | 2,063,124 | |||||||||
197,000 | Asahi Diamond Industrial Consumable Diamond Tools | 2,026,265 | |||||||||
51,720 | Milbon Manufacturer of Hair Products | 2,024,329 | |||||||||
80,000 | Icom Two Way Radio Communication Equipment | 1,930,404 | |||||||||
24,500 | Hikari Tsushin Distribution of Office IT/Mobiles/Insurance | 1,848,174 | |||||||||
70,000 | MonotaRO (a) Online MRO (Maintenance, Repair, Operations) Goods Distributor in Japan | 1,425,153 | |||||||||
53,700 | Tamron Camera Lens Maker | 1,302,613 | |||||||||
189 | Mori Hills REIT Investment Tokyo-centric Diversified REIT | 1,252,450 | |||||||||
155,000 | Lifenet Insurance (a) (b) Online Life Insurance Company in Japan | 803,096 | |||||||||
25,400 | Sintokogio Automated Casting Machines, Surface Treatment System & Consumables | 190,761 | |||||||||
156,736,753 | |||||||||||
| Number of Shares | Value | ||||||||||
Taiwan – 4.7% | |||||||||||
2,800,000 | Far EasTone Telecom Taiwan's Third Largest Mobile Operator | $ | 6,151,240 | ||||||||
210,000 | St. Shine Optical World's Leading Disposable Contact Lens OEM (Original Equipment Manufacturer) | 6,008,868 | |||||||||
662,000 | Delta Electronics Industrial Automation, Switching Power Supplies & Passive Components | 3,790,936 | |||||||||
200,000 | Ginko International Largest Contact Lens Maker in China | 3,777,787 | |||||||||
1,914,835 | Lite-On Technology Mobile Device, LED & PC Server Component Supplier | 3,077,259 | |||||||||
424,000 | Advantech Industrial PC & Components | 2,941,700 | |||||||||
1,460,000 | CTCI Corp International Engineering Firm | 2,369,851 | |||||||||
696,000 | Taiwan Mobile Taiwan's Second Largest Mobile Operator | 2,249,620 | |||||||||
270,000 | President Chain Store Convenience Chain Store Operator | 1,874,619 | |||||||||
196,000 | PC Home Taiwanese Internet Retail Company | 1,574,971 | |||||||||
695,000 | Chroma Ate Automatic Test Systems, Testing & Measurement Instruments | 1,460,398 | |||||||||
308,523 | Flexium Interconnect Flexible Printed Circuit for Mobile Electronics | 996,715 | |||||||||
198,000 | Radiant Opto-Electronics LCD Back Light Units & Modules | 726,310 | |||||||||
37,000,274 | |||||||||||
Hong Kong – 4.7% | |||||||||||
271,547 | Melco Crown Entertainment – ADR (b) Macau Casino Operator | 10,650,073 | |||||||||
1,835,000 | Melco International Macau Casino Operator | 6,768,888 | |||||||||
917,800 | MGM China Holdings Macau Casino Operator | 3,928,065 | |||||||||
2,888,000 | Sa Sa International Cosmetics Retailer | 3,392,217 | |||||||||
1,777,890 | Vitasoy International Hong Kong Soy Food Brand | 2,741,332 | |||||||||
See accompanying notes to financial statements.
7
Wanger International 2013 Annual Report
Wanger International
Statement of Investments, December 31, 2013
| Number of Shares | Value | ||||||||||
Hong Kong – 4.7% (cont) | |||||||||||
1,031,000 | Kingboard Chemicals Paper & Glass Laminates, PCB, Specialty Chemicals & Properties | $ | 2,698,456 | ||||||||
454,000 | AAC Technologies Miniature Acoustic Components | 2,209,068 | |||||||||
1,161,030 | Lifestyle International Mid- to High-end Department Store Operator in Hong Kong & China | 2,150,083 | |||||||||
2,500,000 | Mapletree Greater China Commercial Trust Retail & Office Property Landlord | 1,667,031 | |||||||||
52,600 | ASM Pacific Semi Back-end & Surface Mounting Equipment | 440,238 | |||||||||
36,645,451 | |||||||||||
Korea – 2.7% | |||||||||||
129,143 | Paradise Co Korean 'Foreigner Only' Casino Operator | 3,239,507 | |||||||||
48,785 | Coway Household Appliance Rental Service Provider | 3,073,334 | |||||||||
6,865 | KCC Paint & Housing Material Manufacturer | 3,052,632 | |||||||||
46,334 | LS Industrial Systems Manufacturer of Electrical & Automation Equipment | 2,888,847 | |||||||||
23,800 | CJ Corp Holding Company of Korean Consumer Conglomerate | 2,632,430 | |||||||||
53,000 | Samsung Securities Brokerage & Wealth Management | 2,216,070 | |||||||||
41,392 | Kepco Plant Service & Engineering Power Plant & Grid Maintenance | 2,150,477 | |||||||||
74,000 | Nexen Tire Tire Manufacturer | 1,022,665 | |||||||||
1,640 | AmorePacific Group Holding Company of Korea's Leading Cosmetics Manufacturer | 723,531 | |||||||||
190 | Lotte Chilsung Beverage Beverages & Liquor Manufacturer | 274,554 | |||||||||
21,274,047 | |||||||||||
China – 2.3% | |||||||||||
209,530 | WuXi PharmaTech – ADR (b) Largest Contract Research Organization Business in China | 8,041,761 | |||||||||
410,000 | Biostime (a) Pediatric Nutrition & Baby Care Products Provider | 3,661,697 | |||||||||
| Number of Shares | Value | ||||||||||
22,784 | SouFun - ADR (a) Chinese Real Estate Internet Portal | $ | 1,877,630 | ||||||||
1,067,000 | Want Want Chinese Branded Consumer Food Company | 1,544,318 | |||||||||
3,022,000 | AMVIG Holdings Chinese Tobacco Packaging Material Supplier | 1,438,064 | |||||||||
21,942 | 58.com - ADR (a) (b) Online Classified Service Provider | 841,256 | |||||||||
461,000 | Sihuan Pharmaceuticals Leading Chinese Generic Drug Manufacturer | 421,882 | |||||||||
17,826,608 | |||||||||||
Singapore – 2.2% | |||||||||||
3,850,000 | Mapletree Commercial Trust Retail & Office Property Landlord | 3,640,081 | |||||||||
922,000 | Super Group Instant Food & Beverages in Southeast Asia | 2,783,696 | |||||||||
1,777,890 | CDL Hospitality Trust Hotel Owner/Operator | 2,311,602 | |||||||||
1,239,000 | Ascendas REIT Industrial Property Landlord | 2,168,426 | |||||||||
360,000 | Singapore Exchange Singapore Equity & Derivatives Market Operator | 2,075,972 | |||||||||
1,500,000 | Mapletree Industrial Trust Industrial Property Landlord | 1,589,372 | |||||||||
1,793,000 | Mapletree Logistics Trust Industrial Property Landlord | 1,500,728 | |||||||||
532,000 | Petra Foods Cocoa Processor & Chocolate Manufacturer | 1,357,455 | |||||||||
17,427,332 | |||||||||||
Indonesia – 1.5% | |||||||||||
3,249,542 | Archipelago Resources (c) (d) (e) Gold Mining Projects in Indonesia, Vietnam & the Philippines | 2,798,161 | |||||||||
4,522,000 | Tower Bersama Infrastructure (b) Communications Towers | 2,158,091 | |||||||||
40,000,000 | Ace Indonesia Home Improvement Retailer | 1,941,909 | |||||||||
1,318,500 | Matahari Department Store (b) Largest Department Store Chain in Indonesia | 1,193,213 | |||||||||
5,300,000 | Surya Citra Media Free to Air TV Station in Indonesia | 1,143,590 | |||||||||
See accompanying notes to financial statements.
8
Wanger International 2013 Annual Report
Wanger International
Statement of Investments, December 31, 2013
| Number of Shares | Value | ||||||||||
Indonesia – 1.5% (cont) | |||||||||||
497,817 | Mayora Indah Consumer Branded Food Manufacturer | $ | 1,066,138 | ||||||||
4,681,000 | MNC Skyvision Largest Satellite Pay TV Operator in Indonesia | 770,418 | |||||||||
8,948,000 | Arwana Citramulia Ceramic Tiles for Home Decoration | 602,905 | |||||||||
165,500 | Mitra Adiperkasa Operator of Department Store & Specialty Retail Stores | 74,795 | |||||||||
11,749,220 | |||||||||||
India – 1.5% | |||||||||||
329,424 | Asian Paints India's Largest Paint Company | 2,613,233 | |||||||||
161,000 | United Breweries India's Largest Brewer | 2,016,572 | |||||||||
91,100 | Colgate Palmolive India Consumer Products in Oral Care | 1,994,591 | |||||||||
694,809 | Adani Ports & Special Economic Zone Indian West Coast Shipping Port | 1,749,566 | |||||||||
1,197,000 | Redington India Supply Chain Solutions for IT & Mobile Handsets in Emerging Markets | 1,450,965 | |||||||||
8,620 | Bosch Automotive Parts | 1,404,200 | |||||||||
9,100 | TTK Prestige Branded Cooking Equipment | 512,305 | |||||||||
199,131 | SKIL Ports and Logistics (b) Indian Container Port Project | 235,632 | |||||||||
11,977,064 | |||||||||||
Philippines – 1.1% | |||||||||||
5,500,000 | Melco Crown (Philippines) Resorts (b) Integrated Resort Operator in Manila | 1,699,161 | |||||||||
624,000 | Security Bank Commercial Bank in Philippines | 1,629,517 | |||||||||
4,700,000 | SM Prime Holdings Shopping Mall Operator | 1,560,428 | |||||||||
1,720,000 | Puregold Price Club Supermarket Operator in Philippines | 1,472,110 | |||||||||
1,080,190 | Robinsons Retail Holdings (b) Multi-format Retailer in Philippines | 1,343,468 | |||||||||
| Number of Shares | Value | ||||||||||
306,330 | Int'l Container Terminal Container Handling Terminals & Port Management | $ | 705,194 | ||||||||
8,409,878 | |||||||||||
Thailand – 1.0% | |||||||||||
10,371,013 | Home Product Center Home Improvement Retailer | 2,965,331 | |||||||||
1,500,000 | Robinson's Department Store Department Store Operator in Thailand | 2,204,346 | |||||||||
412,900 | Airports of Thailand Airport Operator of Thailand | 1,998,629 | |||||||||
1,000,000 | Samui Airport Property Fund Thai Airport Operator | 487,456 | |||||||||
7,655,762 | |||||||||||
Cambodia – 0.7% | |||||||||||
5,432,000 | Nagacorp Casino/Entertainment Complex in Cambodia | 5,737,930 | |||||||||
Malaysia – 0.3% | |||||||||||
500,000 | Aeon Shopping Center & Department Store Operator | 2,137,078 | |||||||||
Total Asia | 334,577,397 | ||||||||||
Europe – 34.7% | |||||||||||
United Kingdom – 11.1% | |||||||||||
2,000,000 | Charles Taylor Insurance Services | 8,380,706 | |||||||||
405,450 | Jardine Lloyd Thompson Group International Business Insurance Broker | 6,843,905 | |||||||||
133,900 | Spirax Sarco Steam Systems for Manufacturing & Process Industries | 6,645,567 | |||||||||
240,000 | Babcock International Public Sector Outsourcer | 5,392,809 | |||||||||
305,000 | Smith & Nephew Medical Equipment & Supplies | 4,356,220 | |||||||||
356,361 | Telecity European Data Center Provider | 4,286,944 | |||||||||
255,320 | WH Smith Newsprint, Books & General Stationery Retailer | 4,239,575 | |||||||||
972,870 | Smiths News Newspaper & Magazine Distributor | 3,802,017 | |||||||||
See accompanying notes to financial statements.
9
Wanger International 2013 Annual Report
Wanger International
Statement of Investments, December 31, 2013
| Number of Shares | Value | ||||||||||
United Kingdom – 11.1% (cont) | |||||||||||
93,000 | Croda Oleochemicals & Industrial Chemicals | $ | 3,790,956 | ||||||||
91,250 | Fidessa Group Software for Financial Trading Systems | 3,412,589 | |||||||||
316,910 | Shaftesbury London Prime Retail REIT | 3,300,239 | |||||||||
687,966 | Elementis Clay-based Additives | 3,071,557 | |||||||||
3,145,599 | Cable and Wireless Leading Telecoms Service Provider in the Caribbean | 2,935,126 | |||||||||
360,000 | Abcam Online Sales of Antibodies | 2,927,057 | |||||||||
80,800 | AVEVA Engineering Software | 2,900,249 | |||||||||
63,000 | Rightmove Internet Real Estate Listings | 2,861,119 | |||||||||
45,000 | Whitbread The UK's Leading Hotelier & Coffee Shop | 2,800,547 | |||||||||
292,632 | PureCircle (b) Natural Sweeteners | 2,786,358 | |||||||||
96,700 | Aggreko Temporary Power & Temperature Control Services | 2,742,473 | |||||||||
318,516 | Domino's Pizza UK & Ireland Pizza Delivery in UK, Ireland & Germany | 2,709,723 | |||||||||
303,000 | Halford's The UK's Leading Retailer of Leisure Goods & Auto Parts | 2,246,015 | |||||||||
291,127 | RPS Group Consultant Specializing in Energy, Water, Urban Planning, Health & Safety | 1,619,253 | |||||||||
189,615 | Ocado (b) Leading Online Grocery Retailer | 1,390,715 | |||||||||
16,000 | Intertek Group Testing, Inspection, Certification Services | 835,062 | |||||||||
132,000 | Foxtons (b) London-centric Residential Real Estate Broker | 731,898 | |||||||||
31,815 | Tullow Oil Oil & Gas Producer | 451,537 | |||||||||
87,460,216 | |||||||||||
France – 3.5% | |||||||||||
100,376 | Neopost (a) Postage Meter Machines | 7,745,765 | |||||||||
| Number of Shares | Value | ||||||||||
28,422 | Eurofins Scientific Food, Pharmaceuticals & Materials Screening & Testing | $ | 7,692,715 | ||||||||
48,128 | Gemalto Digital Security Solutions | 5,296,749 | |||||||||
27,423 | Norbert Dentressangle Leading European Logistics & Transport Group | 3,527,363 | |||||||||
78,000 | Saft Niche Battery Manufacturer | 2,682,246 | |||||||||
220,933 | Hi-Media (b) Online Advertiser in Europe | 568,408 | |||||||||
27,513,246 | |||||||||||
Germany – 2.9% | |||||||||||
150,528 | Wirecard Online Payment Processing & Risk Management | 5,958,243 | |||||||||
13,447 | Rational Commercial Ovens | 4,460,795 | |||||||||
76,000 | NORMA Group Clamps for Automotive & Industrial Applications | 3,778,147 | |||||||||
77,179 | Aurelius European Turnaround Investor | 3,135,941 | |||||||||
223,000 | TAG Immobilien Owner of Residential Properties in Germany | 2,697,335 | |||||||||
57,000 | Elringklinger Automobile Components | 2,322,111 | |||||||||
23,027 | Deutsche Beteiligungs Private Equity Investment Management | 656,840 | |||||||||
23,009,412 | |||||||||||
Switzerland – 2.8% | |||||||||||
26,881 | Partners Group Private Markets Asset Management | 7,168,869 | |||||||||
1,478 | Sika Chemicals for Construction & Industrial Applications | 5,266,774 | |||||||||
17,080 | Geberit Plumbing Supplies | 5,181,749 | |||||||||
6,970 | INFICON Gas Detection Instruments | 2,692,170 | |||||||||
37,840 | Zehnder Radiators & Heat Recovery Ventilation Systems | 1,739,185 | |||||||||
22,048,747 | |||||||||||
See accompanying notes to financial statements.
10
Wanger International 2013 Annual Report
Wanger International
Statement of Investments, December 31, 2013
| Number of Shares | Value | ||||||||||
Netherlands – 2.7% | |||||||||||
260,179 | Aalberts Industries Flow Control & Heat Treatment | $ | 8,304,776 | ||||||||
113,383 | TKH Group Dutch Industrial Conglomerate | 3,963,198 | |||||||||
98,582 | Arcadis Engineering Consultants | 3,476,580 | |||||||||
12,980 | Core Labs Oil & Gas Reservoir Consulting | 2,478,531 | |||||||||
23,666 | Vopak World's Largest Operator of Petroleum & Chemical Storage Terminals | 1,385,461 | |||||||||
20,144 | Fugro Subsea Oilfield Services | 1,201,621 | |||||||||
20,810,167 | |||||||||||
Sweden – 2.1% | |||||||||||
244,247 | Hexagon Design, Measurement & Visualization Software & Equipment | 7,726,082 | |||||||||
294,631 | Sweco Engineering Consultants | 4,855,661 | |||||||||
81,007 | Unibet European Online Gaming Operator | 3,910,644 | |||||||||
16,492,387 | |||||||||||
Denmark – 1.9% | |||||||||||
158,797 | SimCorp Software for Investment Managers | 6,239,936 | |||||||||
116,971 | Novozymes Industrial Enzymes | 4,940,883 | |||||||||
65,327 | Jyske Bank (b) Danish Bank | 3,532,196 | |||||||||
14,713,015 | |||||||||||
Finland – 1.5% | |||||||||||
57,071 | Vacon Leading Independent Manufacturer of Variable Speed Alternating Current Drives | 4,592,983 | |||||||||
151,071 | Tikkurila Decorative & Industrial Paint in Scandinavia, Central & Eastern Europe | 4,135,783 | |||||||||
| Number of Shares | Value | ||||||||||
74,000 | Konecranes Manufacture & Service of Industrial Cranes & Port Handling Equipment | $ | 2,625,464 | ||||||||
11,354,230 | |||||||||||
Spain – 1.4% | |||||||||||
548,887 | Dia Leading Hard Discounter in Spain, Latin America & the Eastern Mediterranean | 4,914,688 | |||||||||
66,000 | Viscofan Sausage Casings Maker | 3,754,421 | |||||||||
68,058 | Bolsas y Mercados Españoles Spanish Stock Markets | 2,591,207 | |||||||||
11,260,316 | |||||||||||
Russia – 1.4% | |||||||||||
143,297 | Yandex (b) Search Engine for Russian & Turkish Languages | 6,183,266 | |||||||||
45,163 | QIWI – ADR Electronic Payments Network Serving Russia & the Commonwealth of Independent States | 2,529,128 | |||||||||
1,224,000 | Moscow Exchange Russia's Main Exchange for Stocks, Bonds, Derivatives, Currencies & Repo | 2,418,898 | |||||||||
11,131,292 | |||||||||||
Norway – 1.1% | |||||||||||
394,000 | Orkla Food & Brands, Aluminum, Chemicals Conglomerate | 3,079,653 | |||||||||
291,741 | Atea Leading Nordic IT Hardware/Software Reseller & Installation Company | 2,877,165 | |||||||||
126,000 | Subsea 7 Offshore Subsea Contractor | 2,415,532 | |||||||||
8,372,350 | |||||||||||
Kazakhstan – 0.6% | |||||||||||
465,522 | Halyk Savings Bank of Kazakhstan – GDR Largest Retail Bank & Insurer in Kazakhstan | 4,779,802 | |||||||||
Italy – 0.6% | |||||||||||
270,099 | Pirelli Global Tire Supplier | 4,672,746 | |||||||||
See accompanying notes to financial statements.
11
Wanger International 2013 Annual Report
Wanger International
Statement of Investments, December 31, 2013
| Number of Shares | Value | ||||||||||
Iceland – 0.5% | |||||||||||
1,700,000 | Marel (f) | $ | 1,962,418 | ||||||||
| 2,404,301 | Marel (f) Largest Manufacturer of Poultry & Fish Processing Equipment | 1,915,773 | |||||||||
3,878,191 | |||||||||||
Belgium – 0.4% | |||||||||||
42,093 | EVS Broadcast Equipment Digital Live Mobile Production Software & Systems | 2,726,171 | |||||||||
Turkey – 0.2% | |||||||||||
172,830 | Bizim Toptan Cash & Carry Stores in Turkey | 1,902,015 | |||||||||
Total Europe | 272,124,303 | ||||||||||
Other Countries – 14.3% | |||||||||||
South Africa – 4.0% | |||||||||||
1,302,438 | Coronation Fund Managers South African Fund Manager | 9,940,457 | |||||||||
69,093 | Naspers Media in Africa, China, Russia & Other Emerging Markets | 7,232,274 | |||||||||
1,697,733 | Rand Merchant Insurance Directly Sold Property & Casualty Insurance; Holdings in Other Insurers | 4,445,814 | |||||||||
254,433 | Mr. Price South African Retailer of Apparel, Household & Sporting Goods | 3,976,723 | |||||||||
835,245 | Northam Platinum (b) Platinum Mining in South Africa | 3,356,326 | |||||||||
198,284 | Massmart Holdings General Merchandise, Food & Home Improvement Stores; Wal-Mart Subsidiary | 2,458,882 | |||||||||
31,410,476 | |||||||||||
Canada – 4.0% | |||||||||||
104,663 | CCL Industries Largest Global Label Converter | 7,805,510 | |||||||||
96,422 | ShawCor Oil & Gas Pipeline Products | 3,855,972 | |||||||||
283,398 | CAE Flight Simulator Equipment & Training Centers | 3,604,337 | |||||||||
| Number of Shares | Value | ||||||||||
62,856 | Onex Capital Private Equity | $ | 3,393,544 | ||||||||
60,369 | AG Growth Leading Manufacturer of Augers & Grain Handling Equipment | 2,537,516 | |||||||||
72,000 | Trilogy Energy Oil & Gas Producer in Canada | 1,870,746 | |||||||||
65,101 | Black Diamond Group Accommodations/Equipment for Oil Sands Development | 1,838,578 | |||||||||
198,985 | DeeThree Exploration (b) | 1,792,691 | |||||||||
| 158,516 | DeeThree Exploration (b) (d) Canadian Oil & Gas Producer | 1,399,537 | |||||||||
169,038 | Horizon North Logistics (a) Diversified Oil Service Offering in Northern Canada | 1,583,364 | |||||||||
26,123 | Baytex (a) Oil & Gas Producer in Canada | 1,024,017 | |||||||||
53,000 | Athabasca Oil Sands (b) Oil Sands & Unconventional Oil Development | 323,314 | |||||||||
134,987 | Pan Orient (b) Growth Oriented, Return Focused Asian Explorer | 251,611 | |||||||||
31,280,737 | |||||||||||
Australia – 3.0% | |||||||||||
1,050,000 | IAG General Insurance Provider | 5,466,972 | |||||||||
947,000 | Challenger Financial Largest Annuity Provider | 5,259,436 | |||||||||
311,140 | Domino's Pizza Enterprises Domino's Pizza Operator in Australia/New Zealand & France/Benelux | 4,495,161 | |||||||||
960,000 | SAI Global Publishing, Certification, Compliance Services | 3,333,256 | |||||||||
342,000 | Amcor Global Leader in Flexible & Rigid Packaging | 3,230,461 | |||||||||
140,000 | Austbrokers Local Australian Small Business Insurance Broker | 1,501,429 | |||||||||
342,000 | Orora (b) Australasia Fiber & Packaging | 354,231 | |||||||||
23,640,946 | |||||||||||
See accompanying notes to financial statements.
12
Wanger International 2013 Annual Report
Wanger International
Statement of Investments, December 31, 2013
| Number of Shares | Value | ||||||||||
United States – 2.3% | |||||||||||
113,102 | Textainer Group Holdings (a) Top International Container Leaser | $ | 4,548,962 | ||||||||
73,179 | Atwood Oceanics (b) Offshore Drilling Contractor | 3,907,027 | |||||||||
96,621 | Rowan (b) Contract Offshore Driller | 3,416,519 | |||||||||
57,853 | FMC Technologies (b) Oil & Gas Well Head Manufacturer | 3,020,505 | |||||||||
56,084 | Hornbeck Offshore (b) Supply Vessel Operator in U.S. Gulf of Mexico | 2,761,015 | |||||||||
17,654,028 | |||||||||||
New Zealand – 0.6% | |||||||||||
1,066,740 | Auckland International Airport Auckland Airport Operator | 3,098,028 | |||||||||
633,610 | Sky City Entertainment Casino/Entertainment Complex | 1,944,643 | |||||||||
5,042,671 | |||||||||||
Israel – 0.4% | |||||||||||
70,320 | Caesarstone Quartz Countertops | 3,492,794 | |||||||||
Total Other Countries | 112,521,652 | ||||||||||
Latin America – 4.7% | |||||||||||
Brazil – 1.8% | |||||||||||
370,000 | Localiza Rent A Car Car Rental | 5,219,286 | |||||||||
5,495,807 | Beadell Resources (b) Gold Mining in Brazil | 3,913,939 | |||||||||
136,100 | Linx Retail Management Software in Brazil | 2,763,824 | |||||||||
533,370 | Odontoprev Dental Insurance | 2,222,328 | |||||||||
14,119,377 | |||||||||||
Mexico – 1.5% | |||||||||||
1,477,823 | Genomma Lab Internacional (b) Developer, Marketer & Distributor of Consumer Products | 4,144,899 | |||||||||
1,360,000 | Qualitas Leading Auto Insurer in Mexico & Central America | 3,293,624 | |||||||||
| Number of Shares | Value | ||||||||||
326,000 | Gruma (b) Tortilla Producer & Distributor | $ | 2,466,379 | ||||||||
18,104 | Grupo Aeroportuario del Sureste – ADR Mexican Airport Operator | 2,256,302 | |||||||||
12,161,204 | |||||||||||
Chile – 0.5% | |||||||||||
80,000 | Sociedad Quimica y Minera de Chile – ADR (a) | 2,070,400 | |||||||||
Producer of Specialty Fertilizers, Lithium & Iodine | |||||||||||
2,288,407 | Empresas Hites Mass Retailer for the Lower Income Strata | 1,612,185 | |||||||||
3,682,585 | |||||||||||
Guatemala – 0.3% | |||||||||||
149,268 | Tahoe Resources (b) Silver Project in Guatemala | 2,482,999 | |||||||||
Uruguay – 0.3% | |||||||||||
230,870 | Union Agriculture Group (b) (c) (d) Farmland Operator in Uruguay | 2,468,000 | |||||||||
Colombia – 0.3% | |||||||||||
1,309,330 | Isagen Leading Colombian Electricity Provider | 2,204,830 | |||||||||
Total Latin America | 37,118,995 | ||||||||||
| Total Equities (Cost: $507,267,400) – 96.4% | 756,342,347 | (g) | |||||||||
Short-Term Investments – 3.2% | |||||||||||
18,000,000 | JPMorgan U.S. Government Money Market Fund, IM Shares (7 day yield of 0.01%) | 18,000,000 | |||||||||
7,606,894 | JPMorgan U.S. Government Money Market Fund, Agency Shares (7 day yield of 0.01%) | 7,606,894 | |||||||||
| Total Short-Term Investments (Cost: $25,606,894) – 3.2% | 25,606,894 | ||||||||||
See accompanying notes to financial statements.
13
Wanger International 2013 Annual Report
Wanger International
Statement of Investments, December 31, 2013
| Number of Shares | Value | ||||||||||
Securities Lending Collateral – 1.8% | |||||||||||
14,121,653 | Dreyfus Government Cash Management Fund, Institutional Shares (7 day yield of 0.01%) (h) | $ | 14,121,653 | ||||||||
| Total Securities Lending Collateral (Cost: $14,121,653) | 14,121,653 | ||||||||||
| Total Investments (Cost: $546,995,947) (i) – 101.4% | 796,070,894 | ||||||||||
| Obligation to Return Collateral for Securities Loaned – (1.8)% | (14,121,653 | ) | |||||||||
Cash and Other Assets Less Liabilities – 0.4% | 3,027,592 | ||||||||||
Net Assets – 100.0% | $ | 784,976,833 | |||||||||
ADR = American Depositary Receipts
GDR = Global Depositary Receipts
REIT = Real Estate Investment Trust
Notes to Statement of Investments
(a) All or a portion of this security was on loan at December 31, 2013. The total market value of securities on loan at December 31, 2013 was $13,614,481.
(b) Non-income producing security.
(c) Illiquid security.
(d) Denotes a restricted security, which is subject to restrictions on resale under federal securities laws. These securities are valued at fair value determined in good faith under consistently applied procedures established by the Board of Trustees. At December 31, 2013, the market value of these securities amounted to $6,665,698, which represented 0.85% of total net assets. Additional information on these securities is as follows:
Security | Acquisition Dates | Shares | Cost | Value | |||||||||||||||
Archipelago Resources | 02/23/10- 9/26/13 | 3,249,542 | $ | 1,512,012 | $ | 2,798,161 | |||||||||||||
Union Agriculture Group | 12/8/10- 6/27/12 | 230,870 | 2,649,999 | 2,468,000 | |||||||||||||||
DeeThree Exploration | 9/7/10 | 158,516 | 413,939 | 1,399,537 | |||||||||||||||
| $4,575,950 | $6,665,698 | ||||||||||||||||||
(e) The Fund also received put options through a transaction related to a proposed company restructuring of Archipelago Resources. Additional information on the put options received is as follows:
Security | Option Shares | Exercise Price | Expiration Date | Value | |||||||||||||||
Option1 | 3,249,542 | GBP | 0.58 | August 13, 2014 | $ | 269,054 | |||||||||||||
GPB = British Pound
1 Archipelago Resources is expected to restructure into a new company during 2014. From January 31, 2014, the option is exercisable until the earlier of (i) the date the company is restructured and prices the shares for its initial public offering or (ii) August 13, 2014, subject to extension until the date the company is restructured and prices the shares for its initial public offering (but not later than September 26, 2016). After August 13, 2014, the valuation of the option will fluctuate based upon its fair market value as determined in accordance with the put option agreement. These put options are valued at fair value determined in good faith under consistently applied procedures established by the Board of Trustees.
(f) The common stock equity holdings of Marel are stated separately on the Statement of Investments due to the application of the onshore or offshore foreign currency exchange rate. The appropriate exchange rate is applied to each purchased security lot based on the applicable registration obtained from Marel's regulatory governing body, the Icelandic Central Bank.
(g) On December 31, 2013, the Fund's total investments were denominated in currencies as follows:
Currency | Value | Percentage of Net Assets | |||||||||
Japanese Yen | $ | 156,736,753 | 20.0 | ||||||||
Euro | 98,867,758 | 12.6 | |||||||||
British Pound | 90,494,009 | 11.6 | |||||||||
United States Dollar | 67,741,869 | 8.6 | |||||||||
| Other currencies less than 5% of total net assets | 342,501,958 | 43.6 | |||||||||
Total Equities | $ | 756,342,347 | 96.4 | ||||||||
(h) Investment made with cash collateral received from securities lending activity.
(i) At December 31, 2013, for federal income tax purposes, the cost of investments was $563,840,136 and net unrealized appreciation was $232,230,758 consisting of gross unrealized appreciation of $252,628,642 and gross unrealized depreciation of $20,397,884.
Fair Value Measurements
Various inputs are used in determining the value of the Fund's investments, following the input prioritization hierarchy established by accounting principles generally accepted in the United States of America (GAAP). These inputs are summarized in the three broad levels listed below:
• Level 1 – quoted prices in active markets for identical securities
• Level 2 – prices determined using other significant observable inputs (including quoted prices for similar securities, interest rates, prepayment speeds, credit risk and others)
• Level 3 – prices determined using significant unobservable inputs where quoted prices or observable inputs are unavailable or less reliable (including management's own assumptions about the factors market participants would use in pricing an investment)
See accompanying notes to financial statements.
14
Wanger International 2013 Annual Report
Wanger International
Statement of Investments, December 31, 2013
The inputs or methodology used for valuing securities are not necessarily an indication of the risk associated with investing in those securities.
Examples of the types of securities in which the Fund would typically invest and how they are classified within this hierarchy are as follows. Typical Level 1 securities include exchange traded domestic equities, mutual funds whose NAVs are published each day and exchange traded foreign equities that are not statistically fair valued. Typical Level 2 securities include exchange traded foreign equities that are statistically fair valued, forward foreign currency exchange contracts and short-term investments valued at amortized cost. Additionally, securities fair valued by the Valuation Committee (the Committee) of the Fund's Board of Trustees (the Board) that rely on significant observable inputs are also included in Level 2. Typical Level 3 securities include any security fair valued by the Committee that relies on significant unobservable inputs.
Under the direction of the Board, the Committee is responsible for overseeing the valuation procedures approved by the Board.
The Committee meets as necessary, and no less frequently than quarterly, to determine fair values for securities for which market quotations are not readily available or for which the investment manager believes that available market quotations are unreliable, to review the appropriateness of the Trust's Portfolio Pricing Policy and the pricing procedures of the investment manager (the Policies), and to review the continuing appropriateness of the current value of any security subject to the Policies. The Policies address, among other things: circumstances under which market quotations will be deemed readily available; selection of third party pricing vendors; appropriate pricing methodologies; events that require fair valuation and fair value techniques; circumstances under which securities will be deemed to pose a potential for stale pricing, including when securities are illiquid, restricted, or in default; and certain delegations of authority to determine fair values to the Fund's investment manager. The Committee may also meet to discuss additional valuation matters, which may include review of back-testing results, review of time-sensitive information or approval of other valuation related actions, and to review the appropriateness of the Policies.
For investments and derivatives categorized as Level 3, the significant unobservable inputs used in the fair value measurement of the Funds' securities may include: (i) data specific to the issuer or comparable issuers, (ii) general market or specific sector news and (iii) quoted prices and specific or similar security transactions. The Committee considers this data and any changes from prior periods in order to assess the reasonableness of observable and unobservable inputs, any assumptions or internal models used to value those securities and changes in fair value. Significant changes in any of these factors could result in lower or higher fair value measurements. Various factors impact the frequency of monitoring (which may occur as often as daily), however the Committee may determine that changes to inputs, assumptions and models are not required with the same frequency.
The following table summarizes the inputs used, as of December 31, 2013, in valuing the Fund's assets:
Investment Type | Quoted Prices (Level 1) | Other Significant Observable Inputs (Level 2) | Significant Unobservable Inputs (Level 3) | Total | |||||||||||||||
Equities | |||||||||||||||||||
Asia | $ | 21,410,720 | $ | 310,368,516 | $ | 2,798,161 | $ | 334,577,397 | |||||||||||
Europe | 11,190,925 | 260,933,378 | — | 272,124,303 | |||||||||||||||
Other Countries | 51,028,022 | 61,493,630 | — | 112,521,652 | |||||||||||||||
Latin America | 30,737,056 | 3,913,939 | 2,468,000 | 37,118,995 | |||||||||||||||
Total Equities | 114,366,723 | 636,709,463 | 5,266,161 | 756,342,347 | |||||||||||||||
| Total Short-Term Investments | 25,606,894 | — | — | 25,606,894 | |||||||||||||||
| Total Securities Lending Collateral | 14,121,653 | — | — | 14,121,653 | |||||||||||||||
Total Investments | 154,095,270 | 636,709,463 | 5,266,161 | 796,070,894 | |||||||||||||||
Unrealized Appreciation: | |||||||||||||||||||
Options | — | — | 269,054 | 269,054 | |||||||||||||||
Total | $ | 154,095,270 | $ | 636,709,463 | $ | 5,535,215 | $ | 796,339,948 | |||||||||||
The Fund's assets assigned to the Level 2 input category are generally valued using a market approach, in which a security's value is determined through its correlation to prices and information from observable market transactions for similar or identical assets. Foreign equities are generally valued at the last sale price on the foreign exchange or market on which they trade. The Fund may use a statistical fair valuation model, in accordance with the policy adopted by the Board, provided by an independent third party to value securities principally traded in foreign markets in order to adjust for possible stale pricing that may occur between the close of the foreign exchanges and the time for valuation. These models take into account available market data including intraday index, ADR, and ETF movements. Securities acquired via private placement that have a holding period or an extended settlement period are valued at a discount to the same shares that are trading freely on the market. These discounts are determined by the investment manager's experience with similar securities or situations. Factors may include, but are not limited to, trade volume, shares outstanding and stock price.
There were no transfers of financial assets between levels 1 and 2 during the period.
The Fund does not hold any significant investments categorized as Level 3.
Certain common stock classified as Level 3 are valued at fair value, using a market approach, as determined in good faith under consistently applied procedures established by and under the general supervision of the Board. To determine fair value for these securities, for which no market exists, the Committee utilizes the valuation technique it deems most appropriate in the circumstances, using some unobservable inputs, which may include, but are not limited to, estimated earnings of the company, and the position of the security within the company's capital structure. The Committee also may use some observable inputs, which may include, but are not limited to, trades of similar securities and market multiples derived from a set of comparable companies. Significant increases or decreases to any of these inputs could result in a significantly lower or higher fair value measurement.
See accompanying notes to financial statements.
15
Wanger International 2013 Annual Report
Wanger International
Portfolio Diversification December 31, 2013
At December 31, 2013, the Fund's portfolio investments as a percentage of net assets were diversified as follows:
Value | Percentage of Net Assets | ||||||||||
Industrial Goods & Services | |||||||||||
Industrial Materials & Specialty Chemicals | $ | 63,848,782 | 8.0 | ||||||||
Machinery | 52,387,473 | 6.7 | |||||||||
Other Industrial Services | 43,198,894 | 5.5 | |||||||||
Electrical Components | 22,613,789 | 2.9 | |||||||||
Conglomerates | 18,483,568 | 2.4 | |||||||||
Construction | 7,551,599 | 1.0 | |||||||||
Outsourcing Services | 7,543,286 | 1.0 | |||||||||
Industrial Distribution | 1,425,153 | 0.2 | |||||||||
217,052,544 | 27.7 | ||||||||||
Consumer Goods & Services | |||||||||||
Retail | 56,680,733 | 7.2 | |||||||||
Casinos & Gaming | 37,878,911 | 4.8 | |||||||||
Food & Beverage | 30,671,842 | 3.9 | |||||||||
Other Durable Goods | 17,496,357 | 2.2 | |||||||||
Nondurables | 14,698,269 | 1.9 | |||||||||
Consumer Goods Distribution | 11,209,938 | 1.4 | |||||||||
Restaurants | 10,005,430 | 1.3 | |||||||||
Other Consumer Services | 7,855,847 | 1.0 | |||||||||
Travel | 5,219,286 | 0.7 | |||||||||
Educational Services | 3,547,386 | 0.5 | |||||||||
Furniture & Textiles | 3,492,794 | 0.4 | |||||||||
Consumer Electronics | 1,302,613 | 0.2 | |||||||||
200,059,406 | 25.5 | ||||||||||
Information | |||||||||||
Business Software | 25,170,110 | 3.2 | |||||||||
Computer Hardware & Related Equipment | 23,025,298 | 2.9 | |||||||||
Internet Related | 18,995,544 | 2.4 | |||||||||
Financial Processors | 12,982,242 | 1.7 | |||||||||
Mobile Communications | 12,489,354 | 1.6 | |||||||||
Computer Services | 9,352,910 | 1.2 | |||||||||
Instrumentation | 4,081,392 | 0.5 | |||||||||
Semiconductors & Related Equipment | 3,912,670 | 0.5 | |||||||||
Telephone & Data Services | 2,935,126 | 0.4 | |||||||||
TV Broadcasting | 1,143,590 | 0.1 | |||||||||
Satellite Broadcasting & Services | 770,418 | 0.1 | |||||||||
Advertising | 568,408 | 0.1 | |||||||||
115,427,062 | 14.7 | ||||||||||
Value | Percentage of Net Assets | ||||||||||
Finance | |||||||||||
Insurance | $ | 38,217,311 | 4.9 | ||||||||
Banks | 18,077,765 | 2.3 | |||||||||
Brokerage & Money Management | 17,766,166 | 2.3 | |||||||||
Finance Companies | 10,158,576 | 1.3 | |||||||||
Financial Processors | 2,591,207 | 0.3 | |||||||||
86,811,025 | 11.1 | ||||||||||
Other Industries | |||||||||||
Real Estate | 36,893,109 | 4.7 | |||||||||
Transportation | 14,423,055 | 1.8 | |||||||||
Regulated Utilities | 2,204,830 | 0.3 | |||||||||
53,520,994 | 6.8 | ||||||||||
Energy & Minerals | |||||||||||
Oil Services | 24,000,134 | 3.1 | |||||||||
Mining | 15,029,956 | 1.9 | |||||||||
Oil & Gas Producers | 7,113,454 | 0.9 | |||||||||
Agricultural Commodities | 2,468,000 | 0.3 | |||||||||
Oil Refining, Marketing & Distribution | 1,385,461 | 0.2 | |||||||||
49,997,005 | 6.4 | ||||||||||
Health Care | |||||||||||
Medical Supplies | 12,713,712 | 1.6 | |||||||||
Pharmaceuticals | 11,096,106 | 1.4 | |||||||||
Medical Equipment & Devices | 7,270,956 | 0.9 | |||||||||
Health Care Services | 2,393,537 | 0.3 | |||||||||
33,474,311 | 4.2 | ||||||||||
Total Equities: | 756,342,347 | 96.4 | |||||||||
Short-Term Investments: | 25,606,894 | 3.2 | |||||||||
Securities Lending Collateral: | 14,121,653 | 1.8 | |||||||||
Total Investments: | 796,070,894 | 101.4 | |||||||||
| Obligation to Return Collateral for Securities Loaned: | (14,121,653 | ) | (1.8 | ) | |||||||
| Cash and Other Assets Less Liabilities: | 3,027,592 | 0.4 | |||||||||
Net Assets: | $ | 784,976,833 | 100.0 | % | |||||||
See accompanying notes to financial statements.
16
Wanger International 2013 Annual Report
Statement of Assets and Liabilities
December 31, 2013
Assets: | |||||||
Investments, at cost | $ | 546,995,947 | |||||
| Investments, at value (including securities on loan of $13,614,481) | $ | 796,070,894 | |||||
Options, at value | 269,054 | ||||||
Foreign currency (cost of $911,196) | 913,729 | ||||||
Receivable for: | |||||||
Investments sold | 2,435,992 | ||||||
Fund shares sold | 56,638 | ||||||
Securities lending income | 16,902 | ||||||
Dividends | 646,222 | ||||||
Foreign tax reclaims | 762,700 | ||||||
Trustees' deferred compensation plan | 140,707 | ||||||
Prepaid expenses | 14,033 | ||||||
Total Assets | 801,326,871 | ||||||
Liabilities: | |||||||
Collateral on securities loaned | 14,121,653 | ||||||
Payable for: | |||||||
Investments purchased | 1,178,288 | ||||||
Fund shares redeemed | 654,949 | ||||||
Investment advisory fee | 19,326 | ||||||
Administration fee | 1,075 | ||||||
Transfer agent fee | 1 | ||||||
Trustees' fees | 416 | ||||||
Custody fee | 97,471 | ||||||
Reports to shareholders | 88,959 | ||||||
Chief compliance officer expenses | 1,719 | ||||||
Trustees' deferred compensation plan | 140,707 | ||||||
Other liabilities | 45,474 | ||||||
Total Liabilities | 16,350,038 | ||||||
Net Assets | $ | 784,976,833 | |||||
Composition of Net Assets: | |||||||
Paid-in capital | $ | 464,535,638 | |||||
Overdistributed net investment income | (8,604,068 | ) | |||||
Accumulated net realized gain | 79,676,446 | ||||||
Net unrealized appreciation (depreciation) on: | |||||||
Investments | 249,074,947 | ||||||
Foreign currency translations | 24,816 | ||||||
Options | 269,054 | ||||||
Net Assets | $ | 784,976,833 | |||||
Fund Shares Outstanding | 22,717,515 | ||||||
| Net asset value, offering price and redemption price per share | $ | 34.55 | |||||
Statement of Operations
For the Year Ended December 31, 2013
Investment Income: | |||||||
| Dividends (net foreign taxes withheld of $1,822,810) | $ | 16,483,374 | |||||
Interest | 9 | ||||||
Income from securities lending—net | 263,957 | ||||||
Total Investment Income | 16,747,340 | ||||||
Expenses: | |||||||
Investment advisory fee | 6,709,967 | ||||||
Transfer agent fees | 478 | ||||||
Administration fee | 370,936 | ||||||
Trustees' fees | 31,380 | ||||||
Custody fees | 381,634 | ||||||
Reports to shareholders | 205,148 | ||||||
Audit fees | 101,621 | ||||||
Legal fees | 69,493 | ||||||
Chief compliance officer expenses | 21,749 | ||||||
Commitment fee for line of credit (Note 5) | 4,435 | ||||||
Other expenses | 50,897 | ||||||
Total Expenses | 7,947,738 | ||||||
Net Investment Income | 8,799,602 | ||||||
| Net Realized and Unrealized Gain (Loss) on Investments: | |||||||
Net realized gain (loss) on: | |||||||
Investments | 92,778,035 | ||||||
Foreign currency translations | (796,528 | ) | |||||
Net realized gain | 91,981,507 | ||||||
Net change in unrealized appreciation (depreciation) on: | |||||||
Investments | 48,742,410 | ||||||
Foreign currency translations | 49,166 | ||||||
Options | 269,054 | ||||||
Net change in unrealized appreciation | 49,060,630 | ||||||
Net Realized and Unrealized Gain | 141,042,137 | ||||||
Net Increase in Net Assets from Operations | $ | 149,841,739 | |||||
See accompanying notes to financial statements.
17
Wanger International 2013 Annual Report
Statements of Changes in Net Assets
Year Ended December 31, | |||||||||||
Increase (Decrease) in Net Assets | 2013 | 2012 | |||||||||
Operations: | |||||||||||
Net investment income | $ | 8,799,602 | $ | 10,657,545 | |||||||
Net realized gain (loss) on: | |||||||||||
Investments | 92,778,035 | 59,347,239 | |||||||||
Foreign currency translations | (796,528 | ) | (293,590 | ) | |||||||
Forward foreign currency exchange contracts | — | 536,207 | |||||||||
Net change in unrealized appreciation (depreciation) on: | |||||||||||
Investments | 48,742,410 | 63,222,289 | |||||||||
Affiliated investments | — | 4,709,968 | |||||||||
Foreign currency translations | 49,166 | (3,456 | ) | ||||||||
Forward foreign currency exchange contracts | — | (447,630 | ) | ||||||||
Foreign capital gains tax | — | 299,433 | |||||||||
Options | 269,054 | — | |||||||||
Net Increase in Net Assets from Operations | 149,841,739 | 138,028,005 | |||||||||
Distributions to Shareholders From: | |||||||||||
Net investment income | (19,498,933 | ) | (8,399,015 | ) | |||||||
Net realized gains | (50,758,012 | ) | (64,994,967 | ) | |||||||
Total Distributions to Shareholders | (70,256,945 | ) | (73,393,982 | ) | |||||||
Share Transactions: | |||||||||||
Subscriptions | 30,958,862 | 19,075,946 | |||||||||
Distributions reinvested | 70,256,945 | 73,393,982 | |||||||||
Redemptions | (98,490,431 | ) | (136,654,538 | ) | |||||||
Net Increase (Decrease) from Share Transactions | 2,725,376 | (44,184,610 | ) | ||||||||
Total Increase in Net Assets | 82,310,170 | 20,449,413 | |||||||||
Net Assets: | |||||||||||
Beginning of period | 702,666,663 | 682,217,250 | |||||||||
End of period | $ | 784,976,833 | $ | 702,666,663 | |||||||
Overdistributed net investment income | $ | (8,604,068 | ) | $ | (6,555,066 | ) | |||||
See accompanying notes to financial statements.
18
Wanger International 2013 Annual Report
Financial Highlights
The following table is intended to help you understand the Fund's financial performance. Certain information reflects financial results for a single share held for the periods shown. Per share net investment income (loss) amounts are calculated based on average shares outstanding during the period. Total return assumes reinvestment of all dividends and distributions, if any. Total return does not reflect payment of the expenses that apply to the variable accounts or contract charges, if any. Total return and portfolio turnover are not annualized for periods of less than one year.
Year Ended December 31, | |||||||||||||||||||||||
Selected data for a share outstanding throughout each period | 2013 | 2012 | 2011 | 2010 | 2009 | ||||||||||||||||||
Net Asset Value, Beginning of Period | $ | 31.19 | $ | 28.79 | $ | 36.16 | $ | 29.68 | $ | 20.69 | |||||||||||||
Income from Investment Operations: | |||||||||||||||||||||||
Net investment income | 0.39 | 0.46 | 0.42 | 0.35 | 0.30 | ||||||||||||||||||
Net realized and unrealized gain (loss) | 6.18 | 5.27 | (5.31 | ) | 6.93 | 9.61 | |||||||||||||||||
Reimbursement from affiliate | — | — | 0.00 | (a) | — | — | |||||||||||||||||
Total from Investment Operations | 6.57 | 5.73 | (4.89 | ) | 7.28 | 9.91 | |||||||||||||||||
Less Distributions to Shareholders: | |||||||||||||||||||||||
Net investment income | (0.88 | ) | (0.38 | ) | (1.64 | ) | (0.80 | ) | (0.93 | ) | |||||||||||||
Net realized gains | (2.33 | ) | (2.95 | ) | (0.84 | ) | — | — | |||||||||||||||
Total Distributions to Shareholders | (3.21 | ) | (3.33 | ) | (2.48 | ) | (0.80 | ) | (0.93 | ) | |||||||||||||
Increase from regulatory settlements | — | — | — | — | 0.01 | ||||||||||||||||||
Net Asset Value, End of Period | $ | 34.55 | $ | 31.19 | $ | 28.79 | $ | 36.16 | $ | 29.68 | |||||||||||||
Total Return | 22.37 | % | 21.56 | %(b) | (14.62 | )%(b) | 24.92 | %(b) | 49.78 | % | |||||||||||||
Ratios to Average Net Assets/Supplemental Data: | |||||||||||||||||||||||
Total gross expenses (c) | 1.07 | % | 1.08 | % | 1.06 | % | 1.07 | % | 1.05 | % | |||||||||||||
Total net expenses (c) | 1.07 | % | 1.05 | %(d) | 1.00 | %(d) | 1.04 | %(d) | 1.05 | %(d) | |||||||||||||
Net investment income | 1.19 | % | 1.51 | % | 1.25 | % | 1.12 | % | 1.23 | % | |||||||||||||
Portfolio turnover rate | 44 | % | 34 | % | 36 | % | 32 | % | 37 | % | |||||||||||||
Net assets, end of period (000s) | $ | 784,977 | $ | 702,667 | $ | 682,217 | $ | 925,761 | $ | 1,442,428 | |||||||||||||
Notes to Financial Highlights
(a) Rounds to zero.
(b) Had the investment manager and/or its affiliates not waived a portion of expenses, total return would have been reduced.
(c) In addition to the fees and expenses which the Fund bears directly, the Fund indirectly bears a pro rata share of the fees and expenses of the acquired funds in which it invests, if any. Such indirect expenses are not included in the reported expense ratios.
(d) The benefits derived from custody fees paid indirectly had an impact of less than 0.01%.
See accompanying notes to financial statements.
19
Wanger International 2013 Annual Report
Notes to Financial Statements
1. Nature of Operations
Wanger International (the Fund), a series of Wanger Advisors Trust (the Trust), is registered under the Investment Company Act of 1940, as amended (the 1940 Act), as an open-end management investment company organized as a Massachusetts business trust. The investment objective of the Fund is to seek long-term capital appreciation. The Fund is available only for allocation to certain life insurance company separate accounts established for the purpose of funding participating variable annuity contracts and variable life insurance policies and may also be offered directly to certain qualified pension and retirement plans.
2. Significant Accounting Policies
The preparation of financial statements in accordance with accounting principles generally accepted in the United States of America (GAAP) requires management to make certain estimates and assumptions that affect the reported amounts of assets and liabilities, the disclosure of contingent assets and liabilities at the date of the financial statements and the reported amounts of revenue and expenses during the reporting period. Actual results could differ from those estimates.
Security valuation
Securities of the Fund are valued at market value or, if a market quotation for a security is not readily available or is deemed not to be reliable because of events or circumstances that have occurred between the market quotation and the time as of which the security is to be valued, the security is valued at its fair value determined in good faith under consistently applied procedures established by the Board of Trustees (the Board). A security traded on a securities exchange or in an over-the-counter market in which transaction prices are reported is valued at the last sales price at the time of valuation. A security traded principally on NASDAQ is valued at the NASDAQ official closing price. Mutual funds and exchange traded funds are valued at their closing net asset value as reported to the applicable exchange. A security for which there is no reported sale on the valuation date is valued at the mean of the latest bid and ask quotations.
Short-term investments maturing in 60 days or less are valued at amortized cost, which approximates market value.
A security for which a market quotation is not readily available and any other assets are valued at their fair value determined in good faith under consistently applied procedures established by the Board. The Trust has retained an independent statistical fair value pricing service that employs a systematic methodology to assist in the fair valuation process for securities principally traded in a foreign market in order to adjust for possible changes in value that may occur between the close of the foreign market and the time as of which the securities are to be valued. If a security is valued at a fair value, that value may be different from the last quoted market price for the security.
Foreign currency translations
Values of investments denominated in foreign currencies are converted into U.S. dollars using the New York spot market rate of exchange at the time of valuation. Purchases and sales of investments and dividend and interest income are translated into U.S. dollars using the spot market rate of exchange prevailing on the respective dates of such transactions. The gain or loss resulting from changes in foreign exchange rates is included with net realized and unrealized gain or loss from investments, as appropriate.
Restricted securities
Restricted securities are securities that may only be resold upon registration under federal securities laws or in transactions exempt from registration. In some cases, the issuer of restricted securities has agreed to register such securities for resale at the issuer's expense either upon demand by the Fund or in connection with another registered offering of the securities. Many restricted securities may be resold in the secondary market in transactions exempt from registration. Such restricted securities may be determined to be liquid under criteria established by the Board.
Derivative Instruments
The put option held at December 31, 2013 was acquired through a transaction between the Fund and the controlling shareholder of Archipelago Resources (the
"Controlling Shareholder") in connection with the delisting of the shares of Archipelago Resources in 2013 and the anticipated restructuring of Archipelago Resources into a new company during 2014 ("New Co"). Normally a put option would be bought to decrease the Fund's exposure to the underlying stock. However, in this case the put option related to the proposed restructuring of Archipelago Resources provides the Fund with the ability to sell its shares back to the Controlling Shareholder at an agreed upon price or to convert the shares held in Archipelago Resources into shares of New Co based upon the terms of the put option agreement between the Fund and the Controlling Shareholder.
Effects of derivative transactions in the financial statements
The following tables are intended to provide additional information about the effect of derivatives on the financial statements of the Fund including: the fair value of derivatives by risk category and the location of those fair values in the Statement of Assets and Liabilities; the impact of derivative transactions on the Fund's operations over the period including realized gains or losses and unrealized gains or losses. The derivative schedules following the Statement of Investments present additional information regarding derivative instruments outstanding at the end of the period, if any.
The following table is a summary of the fair value of derivative instruments at December 31, 2013:
Asset Derivatives | |||||||||||
| Risk Exposure Category | Statement of Assets and Liabilities Location | Fair Value | |||||||||
Equity risk | Options, at value | $ | 269,054 | ||||||||
The following table indicates the effect of derivative instruments in the Statement of Operations for the year ended December 31, 2013:
Change in Unrealized Appreciation (Depreciation) on Derivatives
Recognized in Income
| Risk Exposure Category | Options | ||||||
| Equity risk | $ | 269,054 | |||||
The following table is a summary of the volume of derivative instruments for the year ended December 31, 2013:
Derivative Instrument | Contracts Opened | ||||||
Option | 1 | ||||||
Security transactions and investment income
Security transactions are accounted for on the trade date (date the order to buy or sell is executed) and dividend income is recorded on the ex-dividend date, except that certain dividends from foreign securities are recorded as soon as the information is available to the Fund. Interest income is recorded on the accrual basis and includes amortization of discounts on debt obligations when required for federal income tax purposes. Realized gains and losses from security transactions are recorded on an identified cost basis.
Awards, if any, from class action litigation related to securities owned may be recorded as a reduction of cost of those securities. If the applicable securities are no longer owned, the proceeds are recorded as realized gains.
The Fund estimates the tax character of distributions from real estate investment trusts (REITs). Distributions received in excess of income are recorded as a reduction of the cost of the related investments. If the applicable securities are no longer owned, any distributions received in excess of income are recorded as realized gains.
Expenses
General expenses of the Trust are allocated to the Fund and the other series of the Trust based upon relative net assets or other expense allocation methodologies determined by the nature of the expense. Expenses directly attributable to the Fund are charged to the Fund.
20
Wanger International 2013 Annual Report
Notes to Financial Statements, continued
Fund share valuation
Fund shares are sold and redeemed on a continuing basis at net asset value. Net asset value per share is determined daily as of the close of trading on the New York Stock Exchange (the Exchange) on each day the Exchange is open for trading by dividing the total value of the Fund's investments and other assets, less liabilities, by the number of Fund shares outstanding.
Securities lending
The Fund may lend securities up to one-third of the value of its total assets to certain approved brokers, dealers and other financial institutions to earn additional income. The Fund retains the benefits of owning the securities, including receipt of dividends or interest generated by the security. The Fund also receives a fee for the loan. The Fund has the ability to recall the loans at any time and could do so in order to vote proxies or to sell the loaned securities. Each loan is collateralized by cash that
exceeded the value of the securities on loan. The market value of the loaned securities is determined daily at the close of business of the Fund and any additional required collateral is delivered to each Fund on the next business day. The Fund has elected to invest the cash collateral in the Dreyfus Government Cash Management Fund and the income earned is paid to the Fund, net of any fees remitted to Goldman Sachs Agency Lending, the Fund's lending agent, and borrower rebates. The Fund's investment manager, Columbia Wanger Asset Management, LLC (CWAM), does not retain any fees earned by the lending program. Generally, in the event of borrower default, the Fund has the right to use the collateral to offset any losses incurred. In the event the Fund is delayed or prevented from exercising its right to dispose of the collateral, there may be a potential loss to the Fund. Some or all of these losses may be indemnified by the lending agent. The Fund bears the risk of loss with respect to the investment of collateral. The net lending income earned by the Fund as of December 31, 2013, is included in the Statement of Operations.
The following table presents the Fund's gross and net amount of assets available for offset under a securities lending agreement as well as the related collateral received by the Fund as of December 31, 2013:
| Gross Amounts of | Gross Amounts Offset in the | Net Amounts of Assets Presented in the | Gross Amounts Not Offset in the Statement of Assets and Liabilities | ||||||||||||||||||||||||||||
| Recognized Assets | Statement of Assets and Liabilities | Statement of Assets and Liabilities | Financial Instruments (a) | Cash Collateral Received | Securities Collateral Received | Net Amount (b) | |||||||||||||||||||||||||
Securities loaned | $ | 13,614,481 | $ | — | $ | 13,614,481 | $ | — | $ | 13,614,481 | $ | — | $ | — | |||||||||||||||||
(a) Represents the amount of assets that could be offset by liabilities with the same counterparty under master netting or similar agreements that management elects not to offset on the Statement of Assets and Liabilities.
(b) Represents the net amount due from counterparties in the event of default.
Federal income taxes
The Fund has complied with the provisions of the Internal Revenue Code available to regulated investment companies and, in the manner provided therein, distributes substantially all its taxable income, as well as any net realized gain on sales of investments and foreign currency transactions reportable for federal income tax purposes. Accordingly, the Fund paid no federal income taxes and no federal income tax provision was required.
Foreign capital gains taxes
Gains in certain countries may be subject to foreign taxes at the fund level. The Fund accrues for such foreign taxes on realized and unrealized gains at the appropriate rate for each jurisdiction. The amount, if any, is disclosed as a liability on the Statement of Assets and Liabilities.
Distributions to shareholders
Distributions to shareholders are recorded on the ex-dividend date.
Indemnification
In the normal course of business, the Trust on behalf of the Fund enters into contracts that contain a variety of representations and warranties and that provide general indemnities. The Fund's maximum exposure under these arrangements is unknown, as this would involve future claims against the Fund. Also under the Trust's organizational documents, the trustees and officers of the Trust are indemnified against certain liabilities that may arise out of their duties to the Trust. However based on experience, the Fund expects the risk of loss due to these warranties and indemnities to be remote.
3. Federal Tax Information
The timing and character of income and capital gain distributions are determined in accordance with income tax regulations, which may differ from GAAP. Reclassifications are made to the Fund's capital accounts for permanent tax differences to reflect income and gains available for distribution (or available capital loss carryforwards) under income tax regulations.
For the year ended December 31, 2013, permanent book and tax basis differences resulting primarily from foreign currency transactions and passive foreign investment company (PFIC) holdings were identified and reclassified among the components of the Fund's net assets as follows:
| Accumulated Net Investment Income | Accumulated Net Realized Gain (Loss) | Paid-In Capital | |||||||||
| $ | 8,650,329 | $ | (8,650,323 | ) | $ | (6 | ) | ||||
Net investment income and net realized gains (losses), as disclosed on the Statement of Operations, and net assets were not affected by this reclassification.
The tax character of distributions paid during the years ended December 31, 2013 and December 31, 2012 were as follows:
December 31, 2013 | December 31, 2012 | ||||||||||
Ordinary Income* | $ | 22,419,581 | $ | 8,399,016 | |||||||
Long-Term Capital Gains | 47,837,364 | 64,994,967 | |||||||||
* For tax purposes short-term capital gain distributions, if any, are considered ordinary income distributions.
As of December 31, 2013, the components of distributable earnings on a tax basis were as follows:
| Undistributed Ordinary Income | Undistributed Long-Term Capital Gains | Net Unrealized Appreciation (Depreciation)* | |||||||||
| $ | 9,963,708 | $ | 78,087,004 | $ | 232,230,758 | ||||||
* The differences between book-basis and tax-basis net unrealized appreciation/depreciation are primarily due to deferral of losses from wash sales and passive foreign investment company (PFIC) adjustments.
21
Wanger International 2013 Annual Report
Notes to Financial Statements, continued
Management is required to determine whether a tax position of the Fund is more likely than not to be sustained upon examination by the applicable taxing authority, including resolution of any related appeals or litigation processes, based on the technical merits of the position. The tax benefit to be recognized by the Fund is measured as the largest amount of benefit that is greater than fifty percent likely of being realized upon ultimate settlement. Management is not aware of any tax positions for which it is reasonably possible that the total amounts of unrecognized tax benefits will significantly change in the next twelve months. Management has concluded that there are no significant uncertain tax positions that would require recognition in the financial statements. However, management's conclusions may be subject to review and adjustment at a later date based on factors including, but not limited to, new tax laws, regulations, and administrative interpretations (including relevant court decisions). The Fund's federal tax returns for the prior three fiscal years remain subject to examination by the Internal Revenue Service.
4. Transactions With Affiliates
CWAM is a wholly owned subsidiary of Columbia Management Investment Advisers, LLC (Columbia Management), which in turn is a wholly owned subsidiary of Ameriprise Financial, Inc. (Ameriprise Financial). CWAM furnishes continuing investment supervision to the Fund and is responsible for the overall management of the Fund's business affairs.
CWAM receives a monthly advisory fee based on the Fund's average daily net assets at the following annual rates:
Average Daily Net Assets | Annual Fee Rate | ||||||
Up to $100 million | 1.10 | % | |||||
$100 million to $250 million | 0.95 | % | |||||
$250 million to $500 million | 0.90 | % | |||||
$500 million to $1billion | 0.80 | % | |||||
| $1 billion and over | 0.72 | % | |||||
For the year ended December 31, 2013, the effective investment advisory fee rate was 0.90% of the Fund's average daily net assets.
CWAM provides administrative services and receives an administration fee from the Fund at the following annual rates:
| Wanger Advisors Trust Aggregate Average Daily Net Assets of the Trust | Annual Fee Rate | ||||||
Up to $4 billion | 0.05 | % | |||||
$4 billion to $6 billion | 0.04 | % | |||||
$6 billion to $8 billion | 0.03 | % | |||||
| $8 billion and over | 0.02 | % | |||||
For the year ended December 31, 2013, the effective administration fee rate was 0.05% of the Fund's average daily net assets. Columbia Management provides certain sub-administrative services to the Fund.
Columbia Management Investment Distributors, Inc. (CMID), a wholly owned subsidiary of Ameriprise Financial, serves as the Fund's distributor and principal underwriter.
Columbia Management Investment Services Corp. (CMIS), a wholly owned subsidiary of Ameriprise Financial, is the transfer agent to the Fund. For its services, the Fund pays CMIS a monthly fee at the annual rate of $21.00 per open account. CMIS also receives reimbursement from the Fund for certain out-of-pocket expenses.
Certain officers and trustees of the Trust are also officers of CWAM. The Trust makes no direct payments to its officers and trustees who are affiliated with CWAM.
The Board has appointed a Chief Compliance Officer of the Trust in accordance with federal securities regulations. The Fund, along with other affiliated funds, pays its pro-rata share of the expenses associated with the Office of the Chief Compliance Officer.
The Trust offers a deferred compensation plan for its independent trustees. Under that plan, a trustee may elect to defer all or a portion of his or her compensation.
Amounts deferred are retained by the Trust and may represent an unfunded obligation of the Trust. The value of amounts deferred is determined by reference to the change in value of Class Z shares of one or more series of Columbia Acorn Trust or a money market fund as specified by the trustee. Benefits under the deferred compensation plan are payable in accordance with the plan.
For the year ended December 31, 2013, the Fund engaged in purchase and sales transactions with funds that have a common investment manager (or affiliated investment managers), common directors/trustees, and/or common officers. Those sale transactions complied with provisions of Rule 17a-7 under the Investment Company Act of 1940 and totaled $121,931.
5. Borrowing Arrangements
During the year ended December 31, 2013, the Trust participated in a credit facility with JPMorgan Chase Bank, N.A., along with Columbia Acorn Trust, another trust managed by CWAM, in the amount of $150 million prior to January 11, 2013, $200 million for the period January 11, 2013 through July 21, 2013, and $150 million thereafter. The credit facility was entered into to facilitate portfolio liquidity. Under the facility, interest is charged to each participating fund based on its borrowings at a rate per annum equal to the Federal Funds Rate plus 1.00%. In addition, a commitment fee of 0.08% per annum of the unutilized line of credit is accrued and apportioned among the participating funds based on their relative net assets. The commitment fee is disclosed as a part of "Commitment fee for line of credit" in the Statement of Operations. The Trust expects to renew this line of credit for one year durations in July at then current market rates and terms.
No amounts were borrowed for the benefit of the Fund during the year ended December 31, 2013.
6. Fund Share Transactions
Proceeds and payments on Fund shares as shown in the Statement of Changes in Net Assets are in respect of the following numbers of shares:
| Year ended December 31, 2013 | Year ended December 31, 2012 | ||||||||||
Shares sold | 931,450 | 635,020 | |||||||||
| Shares issued in reinvestment of dividend distributions | 2,277,261 | 2,667,193 | |||||||||
Less shares redeemed | (3,017,840 | ) | (4,471,543 | ) | |||||||
Net increase in shares outstanding | 190,871 | (1,169,330 | ) | ||||||||
7. Investment Transactions
The aggregate cost of purchases and proceeds from sales other than short-term obligations for the year ended December 31, 2013, were $317,587,893 and $390,131,451, respectively.
8. Shareholder Concentration
At December 31, 2013, one unaffiliated shareholder account owned 19.4% of the outstanding shares of the Fund. The Fund has no knowledge about whether any portion of those shares was owned beneficially by such account. Affiliated shareholder accounts owned 56.5% of the outstanding shares of the Fund. Subscription and redemption activity by concentrated accounts may have a significant effect on the operations of the Fund.
9. Subsequent Events
Management has evaluated the events and transactions that have occurred through the date the financial statements were issued and noted no items requiring adjustment of the financial statements or additional disclosure.
10. Information Regarding Pending and Settled Legal Proceedings
Ameriprise Financial and certain of its affiliates have historically been involved in a number of legal, arbitration and regulatory proceedings, including routine litigation,
22
Wanger International 2013 Annual Report
Notes to Financial Statements, continued
class actions, and governmental actions, concerning matters arising in connection with the conduct of their business activities. Ameriprise Financial believes that the Funds are not currently the subject of, and that neither Ameriprise Financial nor any of its affiliates are the subject of, any pending legal, arbitration or regulatory proceedings that are likely to have a material adverse effect on the Funds or the ability of Ameriprise Financial or its affiliates to perform under their contracts with the Funds. Ameriprise Financial is required to make 10-Q, 10-K and, as necessary, 8-K filings with the Securities and Exchange Commission on legal and regulatory matters that relate to Ameriprise Financial and its affiliates. Copies of these filings may be obtained by accessing the SEC website at www.sec.gov.
There can be no assurance that these matters, or the adverse publicity associated with them, will not result in increased fund redemptions, reduced sale of fund shares or other adverse consequences to the Funds. Further, although we believe proceedings are not likely to have a material adverse effect on the Funds or the ability of Ameriprise Financial or its affiliates to perform under their contracts with the Funds, these proceedings are subject to uncertainties and, as such, we are unable to estimate the possible loss or range of loss that may result. An adverse outcome in one or more of these proceedings could result in adverse judgments, settlements, fines, penalties or other relief that could have a material adverse effect on the consolidated financial condition or results of operations of Ameriprise Financial.
23
Wanger International 2013 Annual Report
Report of Independent Registered Public Accounting Firm
To the Board of Trustees and Shareholders of Wanger International:
In our opinion, the accompanying statement of assets and liabilities, including the statement of investments, and the related statements of operations and of changes in net assets and the financial highlights present fairly, in all material respects, the financial position of Wanger International (a series of the Wanger Advisors Trust, hereinafter referred to as the "Fund") at December 31, 2013, the results of its operations for the year then ended, the changes in its net assets for each of the two years in the period then ended and the financial highlights for each of the five years in the period then ended, in conformity with accounting principles generally accepted in the United States of America. These financial statements and financial highlights (hereafter referred to as "financial statements") are the responsibility of the Fund's management; our responsibility is to express an opinion on these financial statements based on our audits. We conducted our audits of these financial statements in accordance with the standards of the Public Company Accounting Oversight Board (United States). Those standards require that we plan and perform the audit to obtain reasonable assurance about whether the financial statements are free of material misstatement. An audit includes examining, on a test basis, evidence supporting the amounts and disclosures in the financial statements, assessing the accounting principles used and significant estimates made by management, and evaluating the overall financial statement presentation. We believe that our audits, which included confirmation of securities at December 31, 2013 by correspondence with the custodian and brokers, provide a reasonable basis for our opinion.
PricewaterhouseCoopers LLP
Chicago, Illinois
February 18, 2014
24
Wanger International 2013 Annual Report
Federal Income Tax Information (Unaudited)
The Fund hereby designates the following tax attributes in the fiscal year ended December 31, 2013.
Tax Designations | |||||||
Dividends Received Deduction | 0.03 | % | |||||
Capital Gain Dividend | $ | 82,007,124 | |||||
Foreign Taxes Paid | $ | 1,674,479 | |||||
Foreign Source Income | $ | 17,458,411 | |||||
Dividends Received Deduction. The percentage of ordinary income dividends paid during the fiscal year that qualifies for the corporate dividends received deduction.
Capital Gain Dividend. The Fund designates as a capital gain dividend the amount reflected above, or if subsequently determined to be different, the net capital gain of such fiscal period. The Fund also designates as capital gain dividends, to the extent necessary to fully distribute such capital gains, earnings and profits distributed to shareholders on the redemption of shares.
Foreign Taxes. The Fund makes the election to pass through to shareholders the foreign taxes paid. These taxes, and the corresponding foreign source income, are provided.
25
Wanger International 2013 Annual Report
Board of Trustees and Management of Wanger Advisors Trust
Each trustee may serve a term of unlimited duration. The Trust's By-laws generally require that a trustee retire at the end of the calendar year in which the trustee attains the age of 75 years. The trustees appoint their own successors, provided that at least two-thirds of the trustees, after such appointment, have been elected by shareholders. Shareholders may remove a trustee, with or without cause, upon the vote of two-thirds of the Trust's outstanding shares at any meeting called for that purpose. A trustee may be removed, with or without cause, upon the vote of a majority of the trustees. The names of the trustees and officers of the Trust, the date each was first elected or appointed to office, their principal business occupations during at least the last five years, the number of portfolios in the fund complex they oversee, and other directorships they hold, are shown below. Each trustee serves in such capacity for each of the four series of Wanger Advisors Trust and for each of the eight series of Columbia Acorn Trust.
The address for the trustees and officers of the Trust is Columbia Wanger Asset Management, LLC, 227 West Monroe Street, Suite 3000, Chicago, Illinois 60606. The Funds' Statement of Additional Information includes additional information about the Funds' trustees and officers. You may obtain a free copy of the Statement of Additional Information by writing or calling toll-free:
Columbia Wanger Asset Management, LLC
Shareholder Services Group
227 W. Monroe, Suite 3000
Chicago IL 60606
1-800-922-6769
| Name, Position(s) with Wanger Advisors Trust and Age at December 31, 2013 | Year First Elected or Appointed to Office* | Principal Occupation(s) during Past Five Years | Number of Portfolios in Fund Complex Overseen by Trustee/Officer | Other Directorships in addition to Wanger Advisors Trust | |||||||||||||||
Trustees who are not interested persons of Wanger Advisors Trust: | |||||||||||||||||||
| Laura M. Born, 48, Trustee and Chair | 2007 | Adjunct Associate Professor of Finance, University of Chicago Booth School of Business; Managing Director – Investment Banking, JP Morgan Chase & Co. (broker/dealer) 2002-2007. | 12 | Columbia Acorn Trust; Carlson Wagonlit Travel, B.V. | |||||||||||||||
| Michelle L. Collins, 53, Trustee | 2008 | President, Cambium LLC (financial and business advisory firm) since 2007; Advisory Board Member, Svoboda Capital Partners LLC (private equity firm) since 2007. | 12 | Columbia Acorn Trust; Integrys Energy Group, Inc. (public utility); Molex, Inc. (electronics components manufacturer) 2003-2012; Bucyrus International, Inc. (manufacturer of mining equipment) 2009-2011. | |||||||||||||||
| Maureen M. Culhane, 65, Trustee | 2007 | Retired. Formerly, Vice President, Goldman Sachs Asset Management, L.P. (investment adviser), 2005-2007, and Vice President (Consultant) — Strategic Relationship Management, Goldman Sachs & Co., 1999-2005. | 12 | Columbia Acorn Trust | |||||||||||||||
| Margaret M. Eisen, 60, Trustee | 2002 | Chief Investment Officer, EAM International LLC (corporate finance and asset management) since 2003; Managing Director, CFA Institute, 2005-2008. | 12 | Columbia Acorn Trust; Burnham Investors Trust; Antigenics, Inc. (biotechnology and pharmaceuticals) 2003-2009. | |||||||||||||||
| John C. Heaton, 54, Trustee | 2010 | Deputy Dean for Faculty, University of Chicago Booth School of Business; Joseph L. Gidwitz Professor of Finance, University of Chicago Booth School of Business since 2000. | Columbia Acorn Trust | ||||||||||||||||
| Steven N. Kaplan, 54, Trustee and Vice Chair | 1999 | Neubauer Family Distinguished Service Professor of Entrepreneurship and Finance, University of Chicago Booth School of Business; faculty member of the University of Chicago Booth School of Business since 1998. | 12 | Columbia Acorn Trust; Accretive Health, Inc. (healthcare management services provider); Morningstar, Inc. (provider of independent investment research). | |||||||||||||||
26
Wanger International 2013 Annual Report
Board of Trustees and Management of Wanger Advisors Trust
| Name, Position(s) with Wanger Advisors Trust and Age at December 31, 2013 | Year First Elected or Appointed to Office* | Principal Occupation(s) during Past Five Years | Number of Portfolios in Fund Complex Overseen by Trustee/Officer | Other Directorships in addition to Wanger Advisors Trust | |||||||||||||||
Trustees who are not interested persons of Wanger Advisors Trust: (continued) | |||||||||||||||||||
| David J. Rudis, 60, Trustee | 2010 | Retired. National Checking and Debit Executive, and Illinois President, Bank of America, 2007 – 2009; President, Consumer Banking Group, LaSalle National Bank, 2004 – 2007. | 12 | Columbia Acorn Trust | |||||||||||||||
| David B. Small, 57, Trustee | 2010 | Managing Director, Grosvenor Capital Management, L.P. (investment adviser) since 1994; Adjunct Associate Professor of Finance, University of Chicago Booth School of Business. | 12 | Columbia Acorn Trust | |||||||||||||||
Trustees who are interested persons of Wanger Advisors Trust: | |||||||||||||||||||
| Charles P. McQuaid, 60, Trustee and President (1), (2) | 1992 | President and Chief Investment Officer, CWAM or its predecessors, since October 2003; associated with CWAM or its predecessors as an investment professional since 1978. | 12 | Columbia Acorn Trust | |||||||||||||||
Trustee Emeritus | |||||||||||||||||||
| Ralph Wanger, 79, Trustee Emeritus (3) | 1970 | Founder, CWAM. Formerly, President, Chief Investment Officer and portfolio manager, CWAM or its predecessors, July 1992 – September 2003; Director, Wanger Investment Company PLC; Consultant to CWAM or its predecessors, September 2003 – September 2005. | 12 | Columbia Acorn Trust | |||||||||||||||
Officers of Wanger Advisors Trust: | |||||||||||||||||||
| Robert A. Chalupnik, 47, Vice President | 2011 | Portfolio manager and/or analyst, CWAM or its predecessors since 2000; Vice President Columbia Acorn Trust and Wanger Advisors Trust since May 2011. | 12 | N/A | |||||||||||||||
| Michael G. Clarke, 44, Assistant Treasurer | 2004 | Vice President, Columbia Management Investment Advisers, LLC since May 2010; Managing Director of Fund Administration, Columbia Management Advisors, LLC, September 2004 – April 2010; Senior officer, Columbia Funds and affiliated funds since 2002. | 12 | N/A | |||||||||||||||
| Joseph F. DiMaria, 44, Assistant Treasurer | 2010 | Vice President, Mutual Fund Administration, Columbia Management Investment Advisers, LLC, since May 2010; Director of Fund Administration, Columbia Management Advisors, LLC, January 2006 – April 2010. | 12 | N/A | |||||||||||||||
| P. Zachary Egan, 44, Vice President (2) | 2003 | Director of International Research, CWAM or its predecessors since December 2004; Vice President, Columbia Acorn Trust since 2003 and Wanger Advisors Trust since 2007; portfolio manager and/or analyst, CWAM or its predecessors, since 1999. | 12 | N/A | |||||||||||||||
| Fritz Kaegi, 42, Vice President | 2011 | Portfolio manager and/or analyst, CWAM or its predecessors since 2004; Vice President Columbia Acorn Trust and Wanger Advisors Trust since September 2011. | 12 | N/A | |||||||||||||||
| John Kunka, 43, Assistant Treasurer | 2006 | Director of Accounting and Operations, CWAM since 2006. | 12 | N/A | |||||||||||||||
| Stephen Kusmierczak, 46, Vice President | 2011 | Portfolio manager and/or analyst, CWAM or its predecessors since 2001; Vice President Columbia Acorn Trust and Wanger Advisors Trust since September 2011. | 12 | N/A | |||||||||||||||
| Joseph C. LaPalm, 44, Vice President | 2006 | Chief Compliance Officer, CWAM since 2005. | 12 | N/A | |||||||||||||||
27
Wanger International 2013 Annual Report
Board of Trustees and Management of Wanger Advisors Trust
| Name, Position(s) with Wanger Advisors Trust and Age at December 31, 2013 | Year First Elected or Appointed to Office* | Principal Occupation(s) during Past Five Years | Number of Portfolios in Fund Complex Overseen by Trustee/Officer | Other Directorships in addition to Wanger Advisors Trust | |||||||||||||||
Officers of Wanger Advisors Trust: (continued) | |||||||||||||||||||
| Bruce H. Lauer, 56, Vice President, Secretary and Treasurer | 1995 | Chief Operating Officer, CWAM or its predecessors since April 2000; Vice President, Secretary and Treasurer, (Chief Financial and Accounting Officer), Columbia Acorn Trust and Wanger Advisors Trust since 1995; formerly, Director, Wanger Investment Company PLC; formerly, Director, Banc of America Capital Management (Ireland) Ltd.; and formerly, Director, Bank of America Global Liquidity Funds, PLC. | 12 | N/A | |||||||||||||||
| Louis J. Mendes III, 49, Vice President | 2003 | Portfolio manager and/or analyst, CWAM or its predecessors since 2001; Vice President, Columbia Acorn Trust since 2003 and Wanger Advisors Trust since 2005. | 12 | N/A | |||||||||||||||
| Robert A. Mohn, 52, Vice President (2) | 1997 | Director of Domestic Research, CWAM or its predecessors since March 2004; Vice President, Columbia Acorn Trust and Wanger Advisors Trust, since 1997; portfolio manager and/or analyst, CWAM or its predecessors since August 1992. | 12 | N/A | |||||||||||||||
| Christopher J. Olson, 49, Vice President | 2001 | Portfolio manager and/or analyst, CWAM or its predecessors, since January 2001; Vice President, Columbia Acorn Trust and Wanger Advisors Trust since 2001. | 12 | N/A | |||||||||||||||
| Christopher O. Petersen, 44, Assistant Secretary | 2010 | Vice President and Chief Counsel, Ameriprise Financial since January 2010 (formerly, Vice President and Group Counsel or Counsel, April 2004 – January 2010); officer, Columbia Funds and affiliated funds since 2007. | 12 | N/A | |||||||||||||||
| Scott R. Plummer, 54, Assistant Secretary | 2010 | Senior Vice President, Chief Legal Officer and Assistant Secretary, Columbia Management Investment Advisers, LLC (or its predecessors) since June 2005; Senior Vice President and Assistant General Counsel — Global Asset Management, Ameriprise Financial since February 2014 (previously, Senior Vice President and Lead Chief Counsel — Asset Management, 2012 – February 2014, Vice President and Lead Chief Counsel — Asset Management, 2010 – 2012, and Vice President and Chief Counsel — Asset Management, 2005 – 2010); Vice President, Chief Counsel and Assistant Secretary, Columbia Management Investment Distributors, Inc. (or its predecessors) since 2008; Vice President, General Counsel and Secretary, Ameriprise Certificate Company since 2005; Chief Counsel, RiverSource Distributors, Inc., 2006 – 2010; Senior officer, Columbia Funds and affiliated funds since 2006. | 12 | N/A | |||||||||||||||
| Robert P. Scales, 61, Chief Compliance Officer, Chief Legal Officer, Senior Vice President and General Counsel | 2004 | Chief Compliance Officer, Chief Legal Officer, Senior Vice President and General Counsel, Columbia Acorn Trust and Wanger Advisors Trust, since 2004. | 12 | N/A | |||||||||||||||
| Andreas Waldburg-Wolfegg, 47, Vice President | 2011 | Portfolio Manager and/or analyst of CWAM since 2002; Vice President Columbia Acorn Trust and Wanger Advisors Trust since September 2011. | 12 | N/A | |||||||||||||||
| Linda Roth-Wiszowaty, 44, Assistant Secretary | 2006 | Business support analyst, CWAM, since April 2007; prior thereto executive administrator, CWAM or its predecessors, and executive assistant to the Chief Operating Officer of CWAM or its predecessors. | 12 | N/A | |||||||||||||||
* Dates prior to April 1992 correspond to the date of first election or appointment as a trustee or officer of The Acorn Fund, Inc., the predecessor trust to Columbia Acorn Trust.
(1) Mr. McQuaid is an "interested person" of Wanger Advisors Trust and of CWAM, as defined in the Investment Company Act of 1940, because he is an officer of the Trust and of CWAM.
(2) Effective March 31, 2014, Mr. McQuaid expects to step down from his current role as President and Chief Investment Officer of CWAM. Effective April 1, 2014 it is expected that Mr. Mohn will become the Domestic Chief Investment Officer of CWAM and Mr. Egan will become the President and International Chief Investment Officer of CWAM.
(3) As permitted under the Wanger Advisors Trust's By-Laws, Mr. Wanger serves as a non-voting Trustee Emeritus of the Trust.
28
Wanger International 2013 Annual Report

Columbia Wanger Funds
Trustees
Laura M. Born
Chair of the Board
Steven N. Kaplan
Vice Chair of the Board
Michelle L. Collins
Maureen M. Culhane
Margaret M. Eisen
John C. Heaton
Charles P. McQuaid
David J. Rudis
David B. Small
Ralph Wanger (Trustee Emeritus)
Officers
Charles P. McQuaid
President
Robert A. Chalupnik
Vice President
Michael G. Clarke
Assistant Treasurer
Joseph F. DiMaria
Assistant Treasurer
P. Zachary Egan
Vice President
Fritz Kaegi
Vice President
John M. Kunka
Assistant Treasurer
Stephen Kusmierczak
Vice President
Joseph C. LaPalm
Vice President
Bruce H. Lauer
Vice President, Secretary and Treasurer
Louis J. Mendes III
Vice President
Robert A. Mohn
Vice President
Christopher J. Olson
Vice President
Christopher O. Petersen
Assistant Secretary
Scott R. Plummer
Assistant Secretary
Robert P. Scales
Chief Compliance Officer, Chief Legal Officer, Senior Vice President and
General Counsel
Andreas Waldburg-Wolfegg
Vice President
Linda K. Roth-Wiszowaty
Assistant Secretary
Investment Manager
Columbia Wanger Asset Management, LLC
227 West Monroe Street, Suite 3000
Chicago, Illinois 60606
1-888-4-WANGER
(1-888-492-6437)
Transfer Agent,
Dividend Disbursing Agent
Columbia Management Investment Services Corp.
P.O. Box 8081
Boston, Massachusetts
02266-8081
Distributor
Columbia Management Investment Distributors, Inc.
225 Franklin Street
Boston, Massachusetts
02110
Legal Counsel to the Funds
Perkins Coie LLP
Washington, DC
Legal Counsel to the Independent Trustees
Drinker Biddle & Reath LLP
Philadelphia, Pennsylvania
Independent Registered Public Accounting Firm
PricewaterhouseCoopers LLP
Chicago, Illinois
This document contains Global Industry Classification Standard data. The Global Industry Classification Standard ("GICS") was developed by and is the exclusive property and a service mark of MSCI Inc. ("MSCI") and Standard & Poor's Financial Services LLC ("S&P") and is licensed for use by Columbia Wanger Asset Management, LLC ("CWAM"). Neither MSCI, S&P, nor any other party involved in making or compiling the GICS or any GICS classifications makes any express or implied warranties or representations with respect to such standard or classification (or the results to be obtained by the use thereof), and all such parties hereby expressly disclaim all warranties of originality, accuracy, completeness, merchantability and fitness for a particular purpose with respect to any of such standard or classification. Without limiting any of the foregoing, in no event shall MSCI, S&P, any of their affiliates or any third party involved in making or compiling the GICS or any GICS classifications have any liability for any direct, indirect, special, punitive, consequential or any other damages (including lost profits) even if notified of the possibility of such damages.
This report, including the schedules of investments and financial statements, is submitted for the general information of the shareholders of the Wanger Advisors Trust.
A description of the Fund's proxy voting policies and procedures and a copy of the Fund's voting record for the most recent 12-month period ended June 30 are available (i) on our website, columbiamanagement.com, (ii) on the Securities and Exchange Commission's website at www.sec.gov, and (iii) without charge, upon request, by calling 888-492-6437.
The Fund files a complete schedule of portfolio holdings with the SEC for the first and third quarters of each fiscal year on Form N-Q. The Fund's Form N-Q is available on the SEC's website at www.sec.gov and may be reviewed and copied at the SEC's Public Reference Room in Washington, D.C. Information on the operation of the Pubic Reference Room may be obtained by calling 800-SEC-0330. The Fund's complete portfolio holdings are disclosed at www.columbiamanagement.com approximately 30 to 40 days after each month-end.
29
Columbia Wanger Funds
© 2014 Columbia Management Investment Advisers, LLC. All rights reserved.
C-1456 E (2/14) 815638
Wanger International Select
2013 Annual Report

Not FDIC insured • No bank guarantee • May lose value

Wanger International Select
2013 Annual Report
Table of Contents
1 | Understanding Your Expenses | ||||||
2 | Containerized Cargo and the Man Who Popularized It | ||||||
4 | Performance Review | ||||||
6 | Statement of Investments | ||||||
12 | Statement of Assets and Liabilities | ||||||
12 | Statement of Operations | ||||||
13 | Statement of Changes in Net Assets | ||||||
14 | Financial Highlights | ||||||
15 | Notes to Financial Statements | ||||||
| 19 | Report of Independent Registered Public Accounting Firm | ||||||
| 20 | Federal Income Tax Information (Unaudited) | ||||||
| 21 | Board of Trustees and Management of Wanger Advisors Trust | ||||||
A Comment on Trading Volumes
Market conditions are always changing and vary by country and industry sector, and investing in international markets involves unique risks. In the wake of the 2007-2009 financial crisis, trading volumes in both emerging and developed international markets declined significantly and have stayed at generally reduced levels since then. Although it is difficult to accurately assess trends in trading volumes in foreign markets, because some amount of activity has migrated to alternative trading venues, a reduction in trading volumes poses challenges to the Fund. This is particularly so because the Fund focuses on small- and mid-cap companies that usually have lower trading volumes and often takes sizeable positions in portfolio companies. As a result of lower trading volumes, it may take longer to buy or sell securities, which can exacerbate the Fund's exposure to volatile markets. The Fund may also be limited in its ability to execute favorable trades in portfolio securities in response to changes in company prices and fundamentals. If the Fund is forced to sell securities to meet redemption requests or other cash needs, or in the case of an event affecting liquidity in a particular market or markets, it may be forced to dispose of those securities under disadvantageous circumstances and at a loss. As the Fund grows in size, these considerations take on increasing significance and may adversely impact performance.
Columbia Wanger Asset Management, LLC (CWAM) is one of the leading global small- and mid-cap equity managers in the United States with over 40 years of small- and mid-cap investment experience. As of December 31, 2013, CWAM managed $39.7 billion in assets. CWAM is the investment manager to Wanger USA, Wanger International, Wanger Select and Wanger International Select (together, the Columbia Wanger Funds) and the Columbia Acorn Family of Funds.
An important note: Columbia Wanger Funds are available only through variable annuity contracts and variable life insurance policies issued by participating insurance companies or certain eligible retirement plans. Columbia Wanger Funds are not offered directly to the public and are not available in all contracts, policies or plans. Contact your financial advisor or insurance representative for more information. Columbia Wanger Funds are distributed by Columbia Management Investment Distributors, Inc., member FINRA, and are managed by Columbia Wanger Asset Management, LLC.
Investors should carefully consider investment objectives, risks, charges and expenses before investing. For variable fund and variable contract prospectuses, which contain this and other important information, investors should contact their financial advisor or insurance representative. Read the prospectus carefully before investing.
The views expressed in "Containerized Cargo and the Man Who Popularized It" and in the Performance Review reflect the current views of the respective authors. These views are not guarantees of future performance and involve certain risks, uncertainties and assumptions that are difficult to predict so actual outcomes and results may differ significantly from the views expressed. These views are subject to change at any time based upon economic, market or other conditions and the respective parties disclaim any responsibility to update such views. These views may not be relied on as investment advice and, because investment decisions for a Columbia Wanger Fund are based on numerous factors, may not be relied on as an indication of trading intent on behalf of any particular Columbia Wanger Fund. References to specific company securities should not be construed as a recommendation or investment advice.
Wanger International Select 2013 Annual Report
Understanding Your Expenses
As a shareholder, you incur three types of costs. There are transaction costs, which generally include sales charges on purchases and may include redemption fees. There are also ongoing costs, which generally include management fees and other expenses for Wanger International Select (the Fund). Lastly, there may be additional fees or charges imposed by the insurance company that sponsors your variable annuity and/or variable life insurance product. The following information is intended to help you understand your ongoing costs (in dollars) of investing in the Fund and to help you compare these costs with the ongoing costs of investing in other mutual funds.
Analyzing your Fund's expenses
To illustrate these ongoing costs, we have provided an example and calculated the expenses paid by investors in the Fund during the period. The actual and hypothetical information in the table below is based on an initial investment of $1,000 at the beginning of the period indicated and held for the entire period. Expense information is calculated two ways and each method provides you with different information. The amount listed in the "Actual" column is calculated using the Fund's actual operating expenses and total return for the period. You may use the Actual information, together with the amount invested, to estimate the expenses that you paid over the period. Simply divide your account value by $1,000 (for example, an $8,600 account value divided by $1,000 = 8.6), then multiply the results by the expenses paid during the period under the Actual column. The amount listed in the "Hypothetical" column assumes a 5% annual rate of return before expenses (which is not the Fund's actual return) and then applies the Fund's actual expense ratio for the period to the hypothetical return. You should not use the hypothetical account values and expenses to estimate either your actual account balance at the end of the period or the expenses you paid during the period. See "Compare with other funds" below for details on how to use the hypothetical data.
Compare with other funds
Since all mutual funds are required to include the same hypothetical calculations about expenses in shareholder reports, you can use this information to compare the ongoing cost of investing in the Fund with other funds. To do so, compare the hypothetical example with the 5% hypothetical examples that appear in the shareholder reports of other funds. As you compare hypothetical examples of other funds, it is important to note that hypothetical examples are meant to highlight the ongoing cost of investing in a fund only and do not reflect any transaction costs, such as sales charges, redemption or exchange fees. Therefore, the hypothetical calculations are useful in comparing ongoing costs only, and will not help you determine the relative total costs of owning different funds. If transaction costs were included in these calculations, your costs would be higher.
July 1, 2013 – December 31, 2013
| Account value at the beginning of the period ($) | Account value at the end of the period ($) | Expenses paid during period ($) | Fund's annualized expense ratio (%)* | ||||||||||||||||||||||||||||
Actual | Hypothetical | Actual | Hypothetical | Actual | Hypothetical | ||||||||||||||||||||||||||
Wanger International Select | 1,000.00 | 1,000.00 | 1,120.40 | 1,018.09 | 7.83 | 7.46 | 1.45 | ||||||||||||||||||||||||
* Expenses paid during the period are equal to the Fund's annualized expense ratio, multiplied by the average account value over the period, then multiplied by the number of days in the Fund's most recent fiscal half-year and divided by 365.
It is important to note that the expense amounts shown in the table are meant to highlight only ongoing costs of investing in the Fund. Expenses paid during the period do not include any insurance charges imposed by your insurance company's separate account. The hypothetical example provided is useful in comparing ongoing costs only and will not help you determine the relative total costs of owning different funds whose shareholders may incur transaction costs.
Had the investment manager and/or certain of its affiliates not waived/reimbursed certain fees and expenses, account value at the end of the period would have been reduced.
1
Wanger International Select 2013 Annual Report

Containerized Cargo and the Man Who Popularized It
Born in a small town in North Carolina, Malcom McLean had little formal schooling beyond grade school. He first worked as a farmer and then operated a gas station. When, in 1934, a road builder asked him where he could hire a truck and a driver, Malcom bought a used truck for $150 and signed on. Malcom went on to build McLean Trucking, one of the largest trucking firms in the country.1 The company was an early adopter of diesel engines and conveyors, and acquired other truckers in order to transport backhauls under Interstate Commerce Commission rules.2
Early in his trucking career, McLean personally had the job of delivering cotton to the port of New York and returning with a truck full of roofing material. He grew impatient waiting for the stevedores to unload and reload his truck and thought that switching full containers would save time and money.3
In 1955, McLean sold his trucking business and bought Pan-Atlantic Steamship Company for $7 million cash. He then bought Pan-Atlantic's former parent company, Waterman, in a $42 million leveraged buyout using Pan-Atlantic as collateral.4 Combined, the companies operated 37 World War II surplus C-2 cargo ships. He also bought four World War II surplus T-2 tankers and had them equipped with spar decks on top, similar to those used during the war to haul large equipment across the Atlantic.
McLean now had the opportunity to put his shipping-by-container idea to work. Until the 1950s, general ocean cargo arrived at ports in crates, boxes, bags and on pallets. It was then meticulously packed by longshoremen; a typical ship took 150 of them four days to load.5 One steamship executive said it cost more to move cargo from the street to the hold of a ship, than it did to move the cargo across the sea.6 McLean decided to save time and space by utilizing detachable truck trailers, and transporting only the container section of the trailer on the vessels.7 In April 1956, service commenced between Port Newark, New Jersey, Miami, Florida and Houston,
Texas. Each of the four ships could accommodate 58 containers that were thirty-three feet long.8
Shipping by container did cost substantially less. As an extreme example, McLean calculated that the cost of hauling bottled beer from Newark to Miami was 94% cheaper by containership than by conventional shipping. More realistically, a government-sponsored study calculated that container shipping cost 39% to 74% less.9 McLean named his intermodal operation Sea-Land Service.
Sea-Land then set about converting six of the C-2 cargo ships in its fleet into dedicated containerships. Containers were to be stacked four high in the hold and two high on the deck, resulting in a capacity of 226 containers per vessel. In order to allow stacking, frames of the containers were strengthened and twist locks were invented to hold adjacent containers in place. The first converted C-2 began hauling containers in October 1957. These containerships could be loaded by a crew of 14 during a single eight-hour shift for a cost nearly 90% less than loading a similar sized break-bulk ship, a ship with cargo loaded individually.10
Imitators soon followed. In August 1958 Matson Line began service between California and Hawaii, carrying 20 containers on deck and conventional break-bulk cargo below. In 1960, Matson began launching dedicated containerships, again converted World War II cargo ships, accommodating up to 356 containers each. In 1960, Grace Line inserted mid-sections into C-2 cargo ships and converted them to containerships capable of carrying 476 containers for shipments between the United States and Latin America. But Grace Line abandoned the service within a few years due to labor problems. McLean launched ships that could carry 476 much larger containers in 1962, and put them into service between the East and West coasts of the United States,11 as well as between the continental United States and Puerto Rico.12 On its tenth anniversary in 1966, Sea-Land had 19 containerships.13 By 1969,
Sea-Land had also converted C-4s to carry 622 containers.14
McLean recognized that to achieve the full benefit of containers, the entire system of ports, labor, trucks and ships would have to change.15 Port Elizabeth, New Jersey, was designed for containerships. Opening in 1962, it had a wide and deep channel and plenty of paved area shore-side for containers in transit.16 New Jersey's share of the Port of New York cargo jumped from 9% in 1956 to 63% in 1970. Around the country, the few ports that had room for containers, good road and rail connections (and a penchant for spending on infrastructure) gained share, while ports relying on piers within congested cities lost out.17 McLean also signed agreements with unions, providing regular work, safe working conditions and provisions for early retirement in exchange for fewer paid employee hours and more flexible work rules.
Trans-Atlantic container shipping started in 1966 and competition increased. McLean decided to build all-new containerships rather than convert old vessels. He specified ships for both size and speed that could carry over 1,200 containers of varying sizes.18 The ships were to steam at 33 knots, well above most others that operated at 18 to 24 knots. The new containerships cost a total of $435 million. In May of 1969, McLean orchestrated a $530 million takeover of Sea-Land by R.J. Reynolds, a cash-rich tobacco company, as Sea-Land needed investment capital and R.J. Reynolds wanted to diversify.19
The first of eight ships launched in 1972. It crossed the Atlantic in under five days and averaged 31 knots, a cargo ship record. After refinements, sister ships were able to make the crossing in under four days, beating the record of all passenger ships except for a ship named the United States.20 Six of the eight ships were eventually assigned to trans-Pacific crossings.
But fast ships use far more fuel than slower ships. Sea-Land's new containerships consumed nearly twice as much fuel per mile at 33 knots than at 24 knots, and at 24 knots consumed
2
Wanger International Select 2013 Annual Report
more fuel per container than ships that were designed for 24 knots or less. After two oil price spikes in the 1970s, the ships became unprofitable and were sold in 1981, at less than half their cost of construction, to the U.S. Navy for use as fast supply vessels.21
McLean reduced his role at Sea-Land after the fast ships launched in 1972, resigned from the R.J. Reynolds board in 1977 and sold his last shares in the company in 1980. R.J. Reynolds spun off Sea-Land in 1984; CSX bought it in 1986, and sold it to Maersk in 1999.
McLean re-entered the shipping industry by buying United States Lines from Walter Kidde in April 1978. Later that year, the company placed a record order to construct 12 new containerships, each with a capacity somewhat over 4,250 containers. These ships were 40% larger than the largest containership in existence and would provide United States Lines with the most capacity in the industry. Per container, the ships would be by far the most efficient and would cruise at a fuel-efficient 16 knots. The ships were highly automated and were able to carry nearly 50 times as much cargo per crewmember as the first dedicated cargo ships.22
Tragically for McLean and United States Lines, the price of oil then plunged, fuel efficiency mattered a lot less, and speed became more important. The ships were underpowered and had trouble keeping schedules in rough seas. They could not compete and in 1986 the company filed the biggest bankruptcy in U.S. history. The ships were sold at $0.28 on the dollar 16 months later.23 McLean was mortified by the failure, which cost thousands of jobs and millions of dollars. He died in 2001 at the age of 87, after yet another attempt to re-enter the industry.
Containerships kept getting larger and speeds gradually increased. Beginning in 2006, Maersk launched eight ships capable of carrying over 14,000 containers. Larger containerships had costs per container nearly 50% less than smaller ships.24 In 2013, Maersk launched the Mc-Kinney Moller with a capacity of 18,000
containers and had 19 more on order. These ships are longer than the height of the Empire State Building's occupied floors. Echoing McLean's 1978 order, the ships are designed to be at least 30% more fuel efficient than competitors and cruise at 16 knots.25 Worldwide containership capacity currently exceeds 17 million containers, which, if laid end-to-end, exceeds twice the circumference of the world.26
Containerships made freight transport reliable and incredibly cheap. At least three-quarters of vessels in the Far East/North America trade arrive within a day of schedule. In 2004, 4,000 video recorders could be shipped from the Far East to Europe for $0.83 each and Scotch whisky could be shipped from Europe to Japan for $0.05 per bottle.27 In 2013, it was cheaper to ship Scottish cod 10,000 miles to China for filleting and back to Scotland than to fillet it in Scotland!28
Containerized cargo hiked supplies and reduced prices of consumer goods, raising living standards around the world. The containership industry has high fixed costs and is very cyclical. Also, new more efficient ships increase industry capacity and depress pricing, hurting profitability of existing ships. As investors, we've found more stable opportunities in this industry by investing in adjunct businesses that benefit from increased container volumes. These include freight forwarders, which tend to benefit from declining costs or transport, and container owners, which exist today thanks to the ingenuity of Malcom McLean.


Charles P. McQuaid
President and Chief Investment Officer
Columbia Wanger Asset Management, LLC
The information and data provided in this analysis are derived from sources that we deem to be reliable and accurate. These views are not guarantees of future performance and involve certain risks, uncertainties and assumptions that are difficult to predict so actual outcomes and results may differ significantly from the views expressed. The views/opinions expressed here are those of the author and not of the Wanger Advisors Trust Board, are subject to change at any time based upon economic, market or other conditions, may differ from views expressed by other Columbia Management associates and the respective parties disclaim any responsibility to update such views. These views may not be relied on as investment advice and, because investment decisions for a Columbia Wanger Fund are based on numerous factors, may not be relied on as an indication of trading intent on behalf of any particular Columbia Wanger Fund.
1 Cudahy, Brian J., Box Boats, How Container Ships Changed the World (New York, New York, Fordham University Press, 2006) p. 21.
2 Levinson, Marc, The Box, How the Shipping Container Made the World Smaller and the World Economy Bigger (Princeton, New Jersey, Princeton University Press, 2006), p. 40-41.
3 Cudahy, Brian J., op. cit., p. 10.
4 Ibid., p. 24.
5 Ibid., p. 35.
6 Ibid., p. 9.
7 Ibid., p. 27.
8 Levinson, Marc, op. cit., p. 49, 51.
9 Ibid., p. 48, 91.
10 Cudahy, Brian J., op. cit., p. 35.
11 Ibid., p. 80.
12 Levinson, Marc, op. cit., p. 72.
13 Cudahy, Brian J., op. cit., p. 90.
14 Ibid., p. 100.
15 Levinson, Marc, op. cit., p. 53.
16 Ibid., p. 91.
17 Ibid., p. 91, 96, 193.
18 Sea-Land's initial containers were 33 and 35 feet long, while Matson Lines' were 24 feet and Grace Lines' measured 17 feet, lengths determined by ship sizes and road regulations. Going forward in this essay, capacity refers to standardized 20-foot trailer equivalent units (TEU), though most containers today are 40 feet long.
19 Levinson, Marc, op. cit., p. 216-217.
20 Cudahy, Brian J., op. cit., p. 123.
21 Ibid., p. 136-137.
22 Ibid., p. 149-150.
23 Levinson, Marc, op. cit., p. 243.
24 Stopford, Martin, Maritime Economics, Third Edition (New York, New York, Routledge, Taylor & Francis Group, 2009) p. 540.
25 Bennett, Drake, "Risk Ahoy: Maersk, Daewoo Build the World's Biggest Boat," Bloomberg Businessweek, September 5, 2013.
26 World Shipping Council website, http://www.worldshipping.org/about-the-industry/liner-ships/container-vessel-fleet.
27 Stopford, Martin, op. cit., p. 512, 522.
28 George, Rose, Ninety Percent of Everything, Inside Shipping, The Invisible Industry that Puts Clothes on Your Back, Gas in Your Car, and Food on Your Plate (New York, New York, Metropolitan Books, Henry Hold and Company, 2013), p. 18.
3
Wanger International Select 2013 Annual Report

Performance Review Wanger International Select

Christopher J. Olson
Portfolio Manager
Performance data shown represents past performance and is not a guarantee of future results. The investment return and principal value will fluctuate so that shares, when redeemed, may be worth more or less than the original cost. Current performance may be lower or higher than the performance data shown. Please visit columbiamanagement.com for most recent month-end performance updates.
Wanger International Select ended the annual period up 14.04%. This compares to a 21.70% gain for the Fund's primary benchmark, the S&P Developed Ex-U.S. Between $2B and $10B Index. The Fund's underperformance relative to the benchmark was due to its more cautious positioning and an overweight position in the poorly performing commodities sector.
Investor enthusiasm for the Japanese government's new monetary and fiscal policies provided a nice tailwind for the three top contributors to Fund gains for the year, which were all Japanese stocks. Online apparel retailer Start Today ended 2013 up a substantial 171%. The company has enjoyed strong revenue growth, boosted further by improved marketing measures, and investors globally have become quite enamored with Internet plays. NGK Spark Plug, a maker of automobile parts, ended the annual period up 81%. NGK benefited along with other exporters from the weaker yen that resulted from new government policies. Rounding out the Japanese winners, Seven Bank, a provider of ATM processing services, gained 51% for the year as investors responded favorably to both its expansion into the 7-Eleven store network in Japan and its strong, defensive cash flows.
Looking elsewhere, Macau casino operator Melco International ended the year up 133%. Gaming revenues exceeded both management and analyst expectations thanks to heavy visitation by mainland Chinese to its Macau casino. Canadian global label converter CCL Industries rose 73% during the annual period. The company benefited from the acquisition of Avery's label and office product division, which it acquired at a sharp discount. The integration of that acquisition appears to be going smoothly and revenues continue to grow at a reasonable pace.
Despite their uptick in the third quarter, materials stocks were the largest detractors to Fund performance in 2013. Mexican silver and metal byproduct miner Fresnillo fell 50% for the annual period. We sold the Fund's position in this stock in the fourth quarter. We exited the Fund's position in gold and silver miner Allied Nevada Gold in the second quarter, but its 57% decline made it a top detractor for the year. Australian gold miner Regis Resources ended the year off 49% despite reports of positive operational results.
Outside the materials sector, Taiwanese mobile operator Far EasTone Telecom had its ups and downs in 2013, but ended the year down 10%. Investor concerns about the cost of acquiring bandwidth to support new 4G networks hurt mobile operators.
Surveying 2013's investment returns, those markets that had major monetary and financial policy measures did well (Japan, the United States, the United Kingdom, and Europe, for example) while those that did not performed poorly (Australia, Singapore, the emerging markets). Whether or not such extraordinary policies will continue and whether they will have any sustainable impact on real economic growth remains to be seen. In the meantime, the Fund will continue to look for underappreciated stocks with what we believe are good business models, sound management and strong balance sheets, as it has done in the past.
International investing involves special risks, including foreign taxation, currency risks, risks associated with possible differences in financial standards, operational and settlement risks and other risks associated with future political and economic developments. Due to the Fund's concentration in a limited number of stocks, the Fund's portfolio will tend to diverge significantly from benchmark weightings and may therefore pose greater risk and volatility relative to its benchmark, or in comparison to other Wanger Fund portfolios that are supported by the same team of investment analysts. Stocks of small- and mid-cap companies pose special risks, including illiquidity and greater price volatility than stocks of larger, more established companies. Investing in emerging markets may involve greater risks than investing in more developed countries. Please also see "A Comment on Trading Volumes" on the table of contents page of this report.
Fund holdings are as of the date given, are subject to change at any time and are not recommendations to buy or sell any security. Top holdings exclude short-term holdings and cash, if applicable.
Fund's Positions in Mentioned Holdings
As a percentage of net assets, as of 12/31/13
NGK Spark Plug | 4.1 | % | |||||
Far EasTone Telecom | 4.1 | ||||||
CCL Industries | 3.0 | ||||||
Seven Bank | 2.4 | ||||||
Melco International | 2.3 | ||||||
Regis Resources | 1.2 | ||||||
Start Today | 1.0 | ||||||
4
Wanger International Select 2013 Annual Report
Growth of a $10,000 Investment in Wanger International Select
February 1, 1999 (inception date) through December 31, 2013

Performance data shown represents past performance and is not a guarantee of future results. The investment return and principal value will fluctuate so that shares, when redeemed, may be worth more or less than the original cost. Current performance may be lower or higher than the performance data shown. Performance results reflect any fee waivers or reimbursements of Fund expenses by the investment manager and/or any of its affiliates. Absent these fee waivers and/or expense reimbursement arrangements, performance results would have been lower. For most recent month-end performance updates, please visit columbiamanagement.com.
This graph compares the results of $10,000 invested in Wanger International Select on February 1, 1999 (the date the Fund began operations) through December 31, 2013, to the S&P Developed Ex-U.S. Between $2B and $10B Index, with dividends and capital gains reinvested. Although the index is provided for use in assessing the Fund's performance, the Fund's holdings may differ significantly from those in the index.
Top 10 Holdings
As a percentage of net assets, as of 12/31/13
| 1. Ascendas REIT (Singapore) Industrial Property Landlord | 4.3 | % | |||||
| 2. Jardine Lloyd Thompson Group (United Kingdom) International Business Insurance Broker | 4.3 | ||||||
| 3. NGK Spark Plug (Japan) Automobile Parts | 4.1 | ||||||
| 4. Far EasTone Telecom (Taiwan) Taiwan's Third Largest Mobile Operator | 4.1 | ||||||
| 5. Rinnai (Japan) Gas Appliances for Household & Commercial Use | 3.6 | ||||||
| 6. Neopost (France) Postage Meter Machines | 3.3 | ||||||
| 7. CCL Industries (Canada) Largest Global Label Converter | 3.0 | ||||||
| 8. Babcock International (United Kingdom) Public Sector Outsourcer | 3.0 | ||||||
| 9. Archipelago Resources (Indonesia)† Gold Mining Projects in Indonesia, Vietnam & the Philippines | 3.0 | ||||||
| 10. IAG (Australia) General Insurance Provider | 2.9 | ||||||
†Includes both stock and option.
Top 5 Countries
As a percentage of net assets, as of 12/31/13
Japan | 20.1 | % | |||||
United Kingdom | 11.7 | ||||||
Australia | 8.6 | ||||||
Singapore | 6.3 | ||||||
Korea | 5.5 | ||||||
Results as of December 31, 2013
4th quarter* | 1 year | 5 years | 10 years | ||||||||||||||||
Wanger International Select | 1.70 | % | 14.04 | % | 15.21 | % | 10.48 | % | |||||||||||
| S&P Developed Ex-U.S. Between $2B and $10B Index** | 4.42 | 21.70 | 15.27 | 8.90 | |||||||||||||||
MSCI EAFE Index (Net) | 5.71 | 22.78 | 12.44 | 6.91 | |||||||||||||||
| Lipper Variable Underlying International Growth Funds Index | 6.41 | 19.93 | 14.01 | 7.51 | |||||||||||||||
*Not annualized.
**The Fund's primary benchmark.
NAV as of 12/31/13: $20.45
Performance numbers reflect all Fund expenses but do not include any fees and expenses imposed under your variable annuity or life insurance policy or qualified pension or retirement plan. If performance included the effect of these additional charges, it would be lower.
The Fund's annual operating expense ratio of 1.42% is stated as of the Fund's prospectus dated May 1, 2013, and differences in expense ratios disclosed elsewhere in this report may result from including fee waivers and expense reimbursements as well as different time periods used in calculating the ratios.
All results shown assume reinvestment of distributions.
The S&P Developed Ex-U.S. Between $2B and $10B Index is a subset of the broad market selected by the index sponsor representing the mid-cap developed market, excluding the United States. The MSCI Europe, Australasia, Far East (EAFE) Index (Net) is a capitalization-weighted index that tracks the total return of common stocks in 22 developed-market countries within Europe, Australasia and the Far East. The returns of the MSCI EAFE Index (Net) are presented net of the withholding tax rate applicable to foreign non-resident institutional investors in the foreign companies included in the index who do not benefit from double taxation treaties. The performance of the MSCI EAFE Index (Net) is provided to show how the Fund's performance compares to a widely recognized broad-based index of foreign market performance. The Lipper Variable Underlying International Growth Funds Index is an equally weighted representation of the 30 largest variable insurance underlying funds in the Lipper Variable Underlying International Growth Funds Classification, and shows how the Fund's performance compares with returns of an index of funds with similar investment objectives. Indexes are not managed and do not incur fees or expenses. It is not possible to invest directly in an index.
Lipper Inc., a widely respected data provider in the industry, calculates an average total return (assuming reinvestment of distributions) for mutual funds with investment objectives similar to those of the Fund.
Portfolio characteristics and holdings are subject to change periodically and may not be representative of current characteristics and holdings.
5
Wanger International Select 2013 Annual Report
Wanger International Select
Statement of Investments December 31, 2013
| Number of Shares | Value | ||||||||||
Equities – 93.6% | |||||||||||
Asia – 41.5% | |||||||||||
Japan – 20.1% | |||||||||||
| 43,000 | NGK Spark Plug Automobile Parts | $ | 1,019,127 | ||||||||
| 11,400 | Rinnai Gas Appliances for Household & Commercial Use | 888,153 | |||||||||
| 154,000 | Seven Bank ATM Processing Services | 602,304 | |||||||||
| 13,000 | Dentsu Advertising Agency | 531,682 | |||||||||
| 45 | Nippon Prologis REIT Logistics REIT in Japan | 431,053 | |||||||||
| 6,400 | FamilyMart Convenience Store Operator | 292,394 | |||||||||
| 220 | Orix JREIT Diversified REIT | 275,232 | |||||||||
| 14,000 | Park24 Parking Lot Operator | 264,025 | |||||||||
| 5,000 | Makita Power Tools | 262,963 | |||||||||
| 9,900 | Start Today Online Japanese Apparel Retailer | 246,169 | |||||||||
| 29,000 | Wacom Computer Graphic Illustration Devices | 203,913 | |||||||||
5,017,015 | |||||||||||
Singapore – 6.3% | |||||||||||
| 618,000 | Ascendas REIT Industrial Property Landlord | 1,081,588 | |||||||||
| 583,000 | Mapletree Logistics Trust Industrial Property Landlord | 487,967 | |||||||||
1,569,555 | |||||||||||
Korea – 5.5% | |||||||||||
| 12,030 | Kepco Plant Service & Engineering Power Plant & Grid Maintenance | 625,006 | |||||||||
| 3,600 | CJ Corp Holding Company of Korean Consumer Conglomerate | 398,183 | |||||||||
| 4,350 | Coway Household Appliance Rental Service Provider | 274,039 | |||||||||
| Number of Shares | Value | ||||||||||
| 170 | AmorePacific Group Holding Company of Korea's Leading Cosmetics Manufacturer | $ | 75,000 | ||||||||
1,372,228 | |||||||||||
Taiwan – 4.6% | |||||||||||
| 460,000 | Far EasTone Telecom Taiwan's Third Largest Mobile Operator | 1,010,561 | |||||||||
| 37,000 | Taiwan Mobile Taiwan's Second Largest Mobile Operator | 119,592 | |||||||||
1,130,153 | |||||||||||
Indonesia – 2.7% | |||||||||||
| 783,000 | Archipelago Resources (a) (b) (c) Gold Mining Projects in Indonesia, Vietnam & the Philippines | 674,237 | |||||||||
Hong Kong – 2.3% | |||||||||||
| 157,000 | Melco International Macau Casino Operator | 579,136 | |||||||||
Total Asia | 10,342,324 | ||||||||||
Europe – 28.1% | |||||||||||
United Kingdom – 11.7% | |||||||||||
| 63,000 | Jardine Lloyd Thompson Group International Business Insurance Broker | 1,063,426 | |||||||||
| 33,000 | Babcock International Public Sector Outsourcer | 741,511 | |||||||||
| 40,000 | Smith & Nephew Medical Equipment & Supplies | 571,307 | |||||||||
| 5,000 | Whitbread The UK's Leading Hotelier & Coffee Shop | 311,172 | |||||||||
| 19,200 | Telecity European Data Center Provider | 230,972 | |||||||||
2,918,388 | |||||||||||
France – 4.2% | |||||||||||
| 10,650 | Neopost (d) Postage Meter Machines | 821,834 | |||||||||
| 2,000 | Gemalto Digital Security Solutions | 220,111 | |||||||||
1,041,945 | |||||||||||
See accompanying notes to financial statements.
6
Wanger International Select 2013 Annual Report
Wanger International Select
Statement of Investments December 31, 2013
| Number of Shares | Value | ||||||||||
Denmark – 3.7% | |||||||||||
| 9,341 | SimCorp Software for Investment Managers | $ | 367,055 | ||||||||
| 7,000 | Novozymes Industrial Enzymes | 295,682 | |||||||||
| 4,700 | Jyske Bank (e) Danish Bank | 254,126 | |||||||||
916,863 | |||||||||||
Norway – 2.9% | |||||||||||
| 50,000 | Orkla Food & Brands, Aluminum, Chemicals Conglomerate | 390,819 | |||||||||
| 18,000 | Subsea 7 Offshore Subsea Contractor | 345,076 | |||||||||
735,895 | |||||||||||
Switzerland – 2.3% | |||||||||||
| 2,150 | Partners Group Private Markets Asset Management | 573,382 | |||||||||
Germany – 1.2% | |||||||||||
| 7,400 | Wirecard Online Payment Processing & Risk Management | 292,909 | |||||||||
Spain – 1.1% | |||||||||||
| 5,000 | Viscofan Sausage Casings Maker | 284,426 | |||||||||
Sweden – 1.0% | |||||||||||
| 7,700 | Hexagon Design, Measurement & Visualization Software & Equipment | 243,568 | |||||||||
Total Europe | 7,007,376 | ||||||||||
Other Countries – 18.3% | |||||||||||
Australia – 8.6% | |||||||||||
| 140,000 | IAG General Insurance Provider | 728,930 | |||||||||
| 118,000 | Challenger Financial Largest Annuity Provider | 655,347 | |||||||||
| Number of Shares | Value | ||||||||||
| 117,000 | Regis Resources Gold Mining in Australia | $ | 307,040 | ||||||||
| 25,000 | Amcor Global Leader in Flexible & Rigid Packaging | 236,145 | |||||||||
| 15,000 | Crown Resorts Ltd. Australian Casino Operator | 226,316 | |||||||||
2,153,778 | |||||||||||
Canada – 4.0% | |||||||||||
| 10,000 | CCL Industries Largest Global Label Converter | 745,775 | |||||||||
| 11,000 | Goldcorp Gold Mining | 238,370 | |||||||||
984,145 | |||||||||||
South Africa – 3.1% | |||||||||||
| 56,047 | Coronation Fund Managers South African Fund Manager | 427,762 | |||||||||
| 3,400 | Naspers Media in Africa, China, Russia & Other Emerging Markets | 355,893 | |||||||||
783,655 | |||||||||||
United States – 2.6% | |||||||||||
| 4,600 | SM Energy Oil & Gas Producer | 382,306 | |||||||||
| 5,000 | Atwood Oceanics (e) Offshore Drilling Contractor | 266,950 | |||||||||
649,256 | |||||||||||
Total Other Countries | 4,570,834 | ||||||||||
Latin America – 5.7% | |||||||||||
Guatemala – 2.8% | |||||||||||
| 42,000 | Tahoe Resources (e) Silver Project in Guatemala | 698,649 | |||||||||
Brazil – 2.3% | |||||||||||
| 817,828 | Beadell Resources (e) Gold Mining in Brazil | 582,431 | |||||||||
See accompanying notes to financial statements.
7
Wanger International Select 2013 Annual Report
Wanger International Select
Statement of Investments December 31, 2013
| Number of Shares | Value | ||||||||||
Uruguay – 0.6% | |||||||||||
| 13,068 | Union Agriculture Group (a) (b) (e) Farmland Operator in Uruguay | $ | 139,697 | ||||||||
Total Latin America | 1,420,777 | ||||||||||
| Total Equities (Cost: $18,453,706) – 93.6% | 23,341,311 | (f) | |||||||||
Short-Term Investments — 5.8% | |||||||||||
| 1,436,464 | JPMorgan U.S. Government Money Market Fund, IM Shares (7 day yield of 0.01%) | 1,436,464 | |||||||||
| Total Short-Term Investments (Cost: $1,436,464) – 5.8% | 1,436,464 | ||||||||||
Securities Lending Collateral – 0.3% | |||||||||||
| 69,124 | Dreyfus Government Cash Management Fund, Institutional Shares (7 day yield of 0.01%) (g) | $ | 69,124 | ||||||||
| Total Securities Lending Collateral (Cost: $69,124) | 69,124 | ||||||||||
| Total Investments (Cost: $19,959,294) (h) – 99.7% | 24,846,899 | ||||||||||
| Obligation to Return Collateral for Securities Loaned – (0.3)% | (69,124 | ) | |||||||||
Cash and Other Assets Less Liabilities – 0.6% | 144,969 | ||||||||||
Net Assets – 100.0% | $ | 24,922,744 | |||||||||
REIT = Real Estate Investment Trust
Notes to Statement of Investments
(a) Illiquid security.
(b) Denotes a restricted security, which is subject to restrictions on resale under federal securities laws. These securities are valued at fair value determined in good faith under consistently applied procedures established by the Board of Trustees. At December 31, 2013, the market value of these securities amounted to $813,934, which represented
3.27% of total net assets. Additional information on these securities is as follows:
Security | Acquisition Dates | Shares | Cost | Value | |||||||||||||||
| Archipelago Resources | 12/20/10- 9/26/13 | 783,000 | $ | 810,985 | $ | 674,237 | |||||||||||||
| Union Agriculture Group | 12/8/10- 6/27/12 | 13,068 | 150,000 | 139,697 | |||||||||||||||
| $ | 960,985 | $ | 813,934 | |||||||||||||||
(c) The Fund also received put options through a transaction related to a proposed company restructuring of Archipelago Resources. Additional information on the put options received is as follows:
Security | Option Shares | Exercise Price | Expiration Date | Value | |||||||||||||||
Option1 | 783,000 | GBP | 0.58 | August 13, 2014 | $ | 64,830 | |||||||||||||
GBP = British Pound
1 Archipelago Resources is expected to restructure into a new company during 2014. From January 31, 2014, the option is exercisable until the earlier of (i) the date the company is restructured and prices the shares for its initial public offering or (ii) August 13, 2014, subject to extension until the date the company is restructured and prices the shares for its initial public offering (but not later than September 26, 2016). After August 13, 2014, the valuation of the option will fluctuate based upon its fair market value as determined in accordance with the put option agreement. These put options are valued at fair value determined in good faith under consistently applied procedures established by the Board of Trustees.
(d) All or a portion of this security was on loan at December 31, 2013. The total market value of securities on loan at December 31, 2013 was $65,150.
(e) Non-income producing security.
(f) On December 31, 2013, the Fund's total investments were denominated in currencies as follows:
Currency | Value | Percentage of Net Assets | |||||||||
Japanese Yen | $ | 5,017,015 | 20.1 | ||||||||
British Pound | 3,592,625 | 14.4 | |||||||||
Australian Dollar | 2,736,209 | 11.0 | |||||||||
Euro | 1,619,280 | 6.5 | |||||||||
Singapore Dollar | 1,569,555 | 6.3 | |||||||||
Canadian Dollar | 1,444,424 | 5.8 | |||||||||
South Korean Won | 1,372,228 | 5.5 | |||||||||
| Other currencies less than 5% of total net assets | 5,989,975 | 24.0 | |||||||||
Total Equities | $ | 23,341,311 | 93.6 | ||||||||
(g) Investment made with cash collateral received from securities lending activity.
(h) At December 31, 2013, for federal income tax purposes, the cost of investments was $20,653,764 and net unrealized appreciation was $4,193,135 consisting of gross unrealized appreciation of $4,949,840 and gross unrealized depreciation of $756,705.
See accompanying notes to financial statements.
8
Wanger International Select 2013 Annual Report
Wanger International Select
Statement of Investments December 31, 2013
At December 31, 2013, the Fund had entered into the following forward foreign currency exchange contracts:
| Forward Foreign Currency Exchange Contracts to Buy | Forward Foreign Currency Exchange Contracts to Sell | Principal Amount in Foreign Currency | Principal Amount in U.S. Dollar | Settlement Date | Unrealized Appreciation (Depreciation) | ||||||||||||||||||
USD | ZAR | 6,259,020 | $ | 600,000 | 1/15/14 | $ | 4,388 | ||||||||||||||||
The counterparty for all forward foreign currency exchange contracts is Morgan Stanley.
USD = United States Dollar
ZAR = South African Rand
Fair Value Measurements
Various inputs are used in determining the value of the Fund's investments, following the input prioritization hierarchy established by accounting principles generally accepted in the United States of America (GAAP). These inputs are summarized in the three broad levels listed below:
• Level 1 – quoted prices in active markets for identical securities
• Level 2 – prices determined using other significant observable inputs (including quoted prices for similar securities, interest rates, prepayment speeds, credit risk and others)
• Level 3 – prices determined using significant unobservable inputs where quoted prices or observable inputs are unavailable or less reliable (including management's own assumptions about the factors market participants would use in pricing an investment)
The inputs or methodology used for valuing securities are not necessarily an indication of the risk associated with investing in those securities.
Examples of the types of securities in which the Fund would typically invest and how they are classified within this hierarchy are as follows. Typical Level 1 securities include exchange traded domestic equities, mutual funds whose NAVs are published each day and exchange traded foreign equities that are not statistically fair valued. Typical Level 2 securities include exchange traded foreign equities that are statistically fair valued, forward foreign currency exchange contracts and short-term investments valued at amortized cost. Additionally, securities fair valued by the Valuation Committee (the Committee) of the Fund's Board of Trustees (the Board) that rely on significant observable inputs are also included in Level 2. Typical Level 3 securities include any security fair valued by the Committee that relies on significant unobservable inputs.
Under the direction of the Board, the Committee is responsible for overseeing the valuation procedures approved by the Board.
The Committee meets as necessary, and no less frequently than quarterly, to determine fair values for securities for which market quotations are not readily available or for which the investment manager believes that available market quotations are unreliable, to review the appropriateness of the Trust's Portfolio Pricing Policy and the pricing procedures of the investment manager (the Policies), and to review the continuing appropriateness of the current value of any security subject to the Policies. The Policies address, among other things: circumstances under which market quotations will be deemed readily available; selection of third party pricing vendors; appropriate pricing methodologies; events that require fair valuation and fair value techniques; circumstances under
which securities will be deemed to pose a potential for stale pricing, including when securities are illiquid, restricted, or in default; and certain delegations of authority to determine fair values to the Fund's investment manager. The Committee may also meet to discuss additional valuation matters, which may include review of back-testing results, review of time-sensitive information or approval of other valuation related actions, and to review the appropriateness of the Policies.
For investments categorized as Level 3, the significant unobservable inputs used in the fair value measurement of the Funds' securities may include: (i) data specific to the issuer or comparable issuers, (ii) general market or specific sector news and (iii) quoted prices and specific or similar security transactions. The Committee considers this data and any changes from prior periods in order to assess the reasonableness of observable and unobservable inputs, any assumptions or internal models used to value those securities and changes in fair value. Significant changes in any of these factors could result in lower or higher fair value measurements. Various factors impact the frequency of monitoring (which may occur as often as daily), however the Committee may determine that changes to inputs, assumptions and models are not required with the same frequency.
The following table summarizes the inputs used, as of December 31, 2013, in valuing the Fund's assets:
Investment Type | Quoted Prices (Level 1) | Other Significant Observable Inputs (Level 2) | Significant Unobservable Inputs (Level 3) | Total | |||||||||||||||
Equities | |||||||||||||||||||
Asia | $ | — | $ | 9,668,087 | $ | 674,237 | $ | 10,342,324 | |||||||||||
Europe | — | 7,007,376 | — | 7,007,376 | |||||||||||||||
Other Countries | 1,633,401 | 2,937,433 | — | 4,570,834 | |||||||||||||||
Latin America | 698,649 | 582,431 | 139,697 | 1,420,777 | |||||||||||||||
Total Equities | 2,332,050 | 20,195,327 | 813,934 | 23,341,311 | |||||||||||||||
| Total Short-Term Investments | 1,436,464 | — | — | 1,436,464 | |||||||||||||||
| Total Securities Lending Collateral | 69,124 | — | — | 69,124 | |||||||||||||||
Total Investments | $ | 3,837,638 | $ | 20,195,327 | $ | 813,934 | $ | 24,846,899 | |||||||||||
| Unrealized Appreciation: Forward Foreign Currency Exchange Contracts | — | 4,388 | — | 4,388 | |||||||||||||||
Options | — | — | 64,830 | 64,830 | |||||||||||||||
Total | $ | 3,837,638 | $ | 20,199,715 | $ | 878,764 | $ | 24,916,117 | |||||||||||
The Fund's assets assigned to the Level 2 input category are generally valued using a market approach, in which a security's value is determined through its correlation to prices and information from observable market transactions for similar or identical assets. Foreign equities are generally valued at the last sale price on the foreign exchange or market on which they trade. The Fund may use a statistical fair valuation model, in accordance with the policy adopted by the Board, provided by an independent third party to value securities principally traded in foreign markets in order to adjust for possible stale pricing that may occur between the close of the foreign exchanges and the time for valuation. These models take into account available market data including intraday index, ADR, and ETF movements. Forward foreign currency exchange contracts are valued at the prevailing forward exchange rate of the underlying currencies.
There were no transfers of financial assets between levels 1 and 2 during the period.
See accompanying notes to financial statements.
9
Wanger International Select 2013 Annual Report
Wanger International Select
Statement of Investments December 31, 2013
The following table reconciles asset balances for the period ending December 31, 2013, in which significant observable and/or unobservable inputs (Level 3) were used in determining value:
| Investments in Securities | Balance as of December 31, 2012 | Realized Gain/(Loss) | Change in Unrealized Appreciation (Depreciation) | Purchases | Sales | Transfers into Level 3 | Transfers out of Level 3 | Balance as of December 31, 2013 | |||||||||||||||||||||||||||
| Equities Asia | $ | — | $ | — | $ | (88,511 | ) | $ | 52,798 | $ | — | $ | 709,950 | $ | — | $ | 674,237 | ||||||||||||||||||
Latin America | 133,816 | — | 5,881 | — | — | — | — | $ | 139,697 | ||||||||||||||||||||||||||
| Options Asia | — | — | 64,830 | — | — | — | — | 64,830 | |||||||||||||||||||||||||||
$ | 133,816 | $ | — | $ | (17,800 | ) | $ | 52,798 | $ | — | $ | 709,950 | $ | — | $ | 878,764 | |||||||||||||||||||
The information in the above reconciliation table represents fiscal year to date activity for any securities identified as using Level 3 inputs at either the beginning or the end of the current fiscal period.
The change in unrealized depreciation attributed to securities owned at December 31, 2013, which were valued using significant unobservable inputs (Level 3), amounted to $(17,800).
Quantitative information pertaining to Level 3 unobservable fair value measurements
| Fair Value at 12/31/13 | Valuation Technique(s) | Unobservable Input(s) | Range | ||||||||||||||||
| Equities Asia | $ | 674,237 | Discounted cash flow | Enterprise valuation and illiquid discount | 19.5 | % to 22.7% | |||||||||||||
Latin America | 139,697 | Market comparable companies | Discount for lack of marketability | 8 | % to 10% | ||||||||||||||
| Options Asia | 64,830 | Income approach | Illiquid discount | 6 | % | ||||||||||||||
Certain securities classified as Level 3 are valued at fair value, using a market approach, as determined in good faith under consistently applied procedures established by and under the general supervision of the Board. To determine fair value for these securities, for which no market exists, the Committee utilizes the valuation technique it deems most appropriate in the circumstances, using some unobservable inputs, which may include, but are not limited to, estimated earnings of the company, and the position of the security within the company's capital structure. The Committee also may note some observable inputs, which may include, but are not limited to, trades of similar securities and market multiples derived from a set of comparable companies. Significant increases or decreases to any of these inputs could result in a significantly lower or higher fair value measurement.
Transfers in and/or out of Level 3 are determined based on the fair value at the beginning of the period for security positions held throughout the period.
See accompanying notes to financial statements.
10
Wanger International Select 2013 Annual Report
Wanger International Select
Portfolio Diversification December 31, 2013
At December 31, 2013, the Fund's portfolio investments as a percentage of net assets were diversified as follows:
Value | Percentage of net assets | ||||||||||
Consumer Goods & Services | |||||||||||
Other Durable Goods | $ | 1,907,280 | 7.7 | ||||||||
Nondurables | 820,776 | 3.3 | |||||||||
Casinos & Gaming | 805,453 | 3.2 | |||||||||
Other Consumer Services | 672,222 | 2.7 | |||||||||
Retail | 538,562 | 2.2 | |||||||||
Restaurants | 311,172 | 1.2 | |||||||||
Food & Beverage | 284,426 | 1.1 | |||||||||
5,339,891 | 21.4 | ||||||||||
Finance | |||||||||||
Insurance | 2,447,702 | 9.8 | |||||||||
Brokerage & Money Management | 1,001,143 | 4.0 | |||||||||
Banks | 856,431 | 3.5 | |||||||||
4,305,276 | 17.3 | ||||||||||
Industrial Goods & Services | |||||||||||
Outsourcing Services | 1,366,517 | 5.5 | |||||||||
Machinery | 1,084,797 | 4.3 | |||||||||
Industrial Materials & Specialty Chemicals | 531,826 | 2.1 | |||||||||
Conglomerates | 390,819 | 1.6 | |||||||||
Other Industrial Services | 264,025 | 1.1 | |||||||||
3,637,984 | 14.6 | ||||||||||
Energy & Minerals | |||||||||||
Mining | 2,500,727 | 10.0 | |||||||||
Oil Services | 612,026 | 2.5 | |||||||||
Oil & Gas Producers | 382,306 | 1.5 | |||||||||
Agricultural Commodities | 139,697 | 0.6 | |||||||||
3,634,756 | 14.6 | ||||||||||
Value | Percentage of net assets | ||||||||||
Information | |||||||||||
Mobile Communications | $ | 1,130,153 | 4.5 | ||||||||
Business Software | 610,623 | 2.5 | |||||||||
Advertising | 531,682 | 2.1 | |||||||||
Computer Hardware & Related Equipment | 424,024 | 1.7 | |||||||||
Internet Related | 355,893 | 1.4 | |||||||||
Financial Processors | 292,909 | 1.2 | |||||||||
Computer Services | 230,972 | 0.9 | |||||||||
3,576,256 | 14.3 | ||||||||||
Other Industries | |||||||||||
Real Estate | 2,275,840 | 9.1 | |||||||||
2,275,840 | 9.1 | ||||||||||
Health Care | |||||||||||
Medical Equipment & Devices | 571,308 | 2.3 | |||||||||
571,308 | 2.3 | ||||||||||
Total Equities: | 23,341,311 | 93.6 | |||||||||
Short-Term Investments: | 1,436,464 | 5.8 | |||||||||
Securities Lending Collateral: | 69,124 | 0.3 | |||||||||
Total Investments: | 24,846,899 | 99.7 | |||||||||
| Obligation to Return Collateral for Securities Loaned: | (69,124 | ) | (0.3 | ) | |||||||
| Cash and Other Assets Less Liabilities: | 144,969 | 0.6 | |||||||||
Net Assets: | $ | 24,922,744 | 100.0 | % | |||||||
See accompanying notes to financial statements.
11
Wanger International Select 2013 Annual Report
Statement of Assets and Liabilities
December 31, 2013
Assets: | |||||||
Investments, at cost | $ | 19,959,294 | |||||
| Investments, at value (including securities on loan of $65,150) | $ | 24,846,899 | |||||
Options, at value | 64,830 | ||||||
Foreign currency (cost of $2,224) | 2,234 | ||||||
| Unrealized appreciation on forward foreign currency exchange contracts | 4,388 | ||||||
Receivable for: | |||||||
Investments sold | 26,973 | ||||||
Fund shares sold | 59,032 | ||||||
Securities lending income | 29 | ||||||
Dividends | 17,800 | ||||||
Foreign tax reclaims | 14,014 | ||||||
Expense reimbursement due from investment advisor | 240 | ||||||
Prepaid expenses | 463 | ||||||
Total Assets | 25,036,902 | ||||||
Liabilities: | |||||||
Collateral on securities loaned | 69,124 | ||||||
Payable for: | |||||||
Investments purchased | 586 | ||||||
Investment advisory fee | 640 | ||||||
Administration fee | 34 | ||||||
Transfer agent fee | 1 | ||||||
Trustees' fees | 8,082 | ||||||
Custody fee | 6,960 | ||||||
Reports to shareholders | 7,794 | ||||||
Chief compliance officer expenses | 57 | ||||||
Other liabilities | 20,880 | ||||||
Total Liabilities | 114,158 | ||||||
Net Assets | $ | 24,922,744 | |||||
Composition of Net Assets: | |||||||
Paid-in capital | $ | 19,434,067 | |||||
Overdistributed net investment income | (539,656 | ) | |||||
Accumulated net realized gain | 1,071,395 | ||||||
Net unrealized appreciation (depreciation) on: | |||||||
Investments | 4,887,605 | ||||||
Foreign currency translations | 115 | ||||||
Forward foreign currency exchange contracts | 4,388 | ||||||
Options | 64,830 | ||||||
Net Assets | $ | 24,922,744 | |||||
Fund Shares Outstanding | 1,218,623 | ||||||
| Net asset value, offering price and redemption price per share | $ | 20.45 | |||||
Statement of Operations
For the Year Ended December 31, 2013
Investment Income: | |||||||
Dividends (net foreign taxes withheld of $78,687) | $ | 609,194 | |||||
Interest | 8 | ||||||
Income from securities lending – net | 9,268 | ||||||
Total Investment Income | 618,470 | ||||||
Expenses: | |||||||
Investment advisory fee | 232,105 | ||||||
Transfer agent fees | 168 | ||||||
Administration fee | 12,346 | ||||||
Trustees' fees | 2,685 | ||||||
Custody fees | 49,017 | ||||||
Reports to shareholders | 26,223 | ||||||
Audit fees | 34,327 | ||||||
Legal fees | 2,333 | ||||||
Chief compliance officer expenses | 731 | ||||||
Commitment fee for line of credit (Note 5) | 150 | ||||||
Other expenses | 13,870 | ||||||
Total Expenses | 373,955 | ||||||
| Less reimbursement of expenses by Investment Manager (Note 4) | (15,919 | ) | |||||
Net Expenses | 358,036 | ||||||
Net Investment Income | 260,434 | ||||||
Net Realized and Unrealized Gain (Loss) on Investments: | |||||||
Net realized gain (loss) on: | |||||||
Investments | 1,722,334 | ||||||
Foreign currency translations | (1,571 | ) | |||||
Forward foreign currency exchange contracts | 98,992 | ||||||
Net realized gain | 1,819,755 | ||||||
| Net change in unrealized appreciation (depreciation) on: | |||||||
Investments | 1,069,705 | ||||||
Foreign currency translations | 397 | ||||||
Forward foreign currency exchange contracts | 33,211 | ||||||
Options | 64,830 | ||||||
Net change in unrealized appreciation | 1,168,143 | ||||||
Net realized and unrealized gain | 2,987,898 | ||||||
Net Increase in Net Assets from Operations | $ | 3,248,332 | |||||
See accompanying notes to financial statements.
12
Wanger International Select 2013 Annual Report
Statements of Changes in Net Assets
Year Ended December 31, | |||||||||||
Increase (Decrease) in Net Assets | 2013 | 2012 | |||||||||
Operations: | |||||||||||
Net investment income | $ | 260,434 | $ | 394,578 | |||||||
Net realized gain (loss) on: | |||||||||||
Investments | 1,722,334 | 2,993,706 | |||||||||
Foreign currency translations | (1,571 | ) | (10,501 | ) | |||||||
Forward foreign currency exchange contracts | 98,992 | (13,334 | ) | ||||||||
Net change in unrealized appreciation (depreciation) on: | |||||||||||
Investments | 1,069,705 | 1,544,427 | |||||||||
Foreign currency translations | 397 | 549 | |||||||||
Forward foreign currency exchange contracts | 33,211 | 37,539 | |||||||||
Options | 64,830 | — | |||||||||
Net Increase in Net Assets from Operations | 3,248,332 | 4,946,964 | |||||||||
Distributions to Shareholders From: | |||||||||||
Net investment income | (1,451,610 | ) | (278,945 | ) | |||||||
Net realized gains | (876,210 | ) | — | ||||||||
Total Distributions to Shareholders | (2,327,820 | ) | (278,945 | ) | |||||||
Share Transactions: | |||||||||||
Subscriptions | 1,509,200 | 1,426,353 | |||||||||
Distributions reinvested | 2,327,820 | 278,945 | |||||||||
Redemptions | (4,650,985 | ) | (5,575,629 | ) | |||||||
Net Decrease from Share Transactions | (813,965 | ) | (3,870,331 | ) | |||||||
Total Increase in Net Assets | 106,547 | 797,688 | |||||||||
Net Assets: | |||||||||||
Beginning of period | 24,816,197 | 24,018,509 | |||||||||
End of period | $ | 24,922,744 | $ | 24,816,197 | |||||||
Overdistributed net investment income | $ | (539,656 | ) | $ | (60,591 | ) | |||||
See accompanying notes to financial statements.
13
Wanger International Select 2013 Annual Report
Financial Highlights
The following table is intended to help you understand the Fund's financial performance. Certain information reflects financial results for a single share held for the periods shown. Per share net investment income (loss) amounts are calculated based on average shares outstanding during the period. Total return assumes reinvestment of all dividends and distributions, if any. Total return does not reflect payment of the expenses that apply to the variable accounts or contract charges, if any. Total return and portfolio turnover are not annualized for periods of less than one year.
Year Ended December 31, | |||||||||||||||||||||||
Selected data for a share outstanding throughout each period | 2013 | 2012 | 2011 | 2010 | 2009 | ||||||||||||||||||
Net Asset Value, Beginning of Period | $ | 19.83 | $ | 16.44 | $ | 18.57 | $ | 15.42 | $ | 12.01 | |||||||||||||
Income from Investment Operations: | |||||||||||||||||||||||
Net investment income | 0.21 | 0.29 | 0.14 | 0.09 | 0.10 | ||||||||||||||||||
Net realized and unrealized gain (loss) | 2.37 | 3.32 | (1.99 | ) | 3.28 | 3.71 | |||||||||||||||||
Total from Investment Operations | 2.58 | 3.61 | (1.85 | ) | 3.37 | 3.81 | |||||||||||||||||
Less Distributions to Shareholders: | |||||||||||||||||||||||
Net investment income | (1.22 | ) | (0.22 | ) | (0.28 | ) | (0.22 | ) | (0.40 | ) | |||||||||||||
Net realized gains | (0.74 | ) | — | — | — | — | |||||||||||||||||
Total Distributions to Shareholders | (1.96 | ) | (0.22 | ) | (0.28 | ) | (0.22 | ) | (0.40 | ) | |||||||||||||
Net Asset Value, End of Period | $ | 20.45 | $ | 19.83 | $ | 16.44 | $ | 18.57 | $ | 15.42 | |||||||||||||
Total Return | 14.04 | %(a) | 22.00 | % | (10.11 | )%(a) | 22.09 | % | 32.92 | %(a) | |||||||||||||
Ratios to Average Net Assets/Supplemental Data: | |||||||||||||||||||||||
Total gross expenses (b) | 1.51 | % | 1.43 | % | 1.45 | % | 1.38 | % | 1.49 | % | |||||||||||||
Total net expenses (b) | 1.45 | % | 1.42 | %(c) | 1.40 | %(c) | 1.38 | %(c) | 1.45 | %(c) | |||||||||||||
Net investment income | 1.05 | % | 1.57 | % | 0.77 | % | 0.57 | % | 0.75 | % | |||||||||||||
Portfolio turnover rate | 74 | % | 58 | % | 44 | % | 37 | % | 62 | % | |||||||||||||
Net assets, end of period (000s) | $ | 24,923 | $ | 24,816 | $ | 24,019 | $ | 31,669 | $ | 31,454 | |||||||||||||
Notes to Financial Highlights
(a) Had the investment manager and/or its affiliates not waived a portion of expenses, total return would have been reduced.
(b) In addition to the fees and expenses which the Fund bears directly, the Fund indirectly bears a pro rata share of the fees and expenses of the acquired funds in which it invests, if any. Such indirect expenses are not included in the reported expense ratios.
(c) The benefits derived from custody fees paid indirectly had an impact of less than 0.01%.
See accompanying notes to financial statements.
14
Wanger International Select 2013 Annual Report
Notes to Financial Statements
1. Nature of Operations
Wanger International Select (the Fund), a series of Wanger Advisors Trust (the Trust), is registered under the Investment Company Act of 1940, as amended (the 1940 Act), as an open-end management investment company organized as a Massachusetts business trust. The investment objective of the Fund is to seek long-term capital appreciation. The Fund is available only for allocation to certain life insurance company separate accounts established for the purpose of funding participating variable annuity contracts and variable life insurance policies and may also be offered directly to certain qualified pension and retirement plans.
2. Significant Accounting Policies
The preparation of financial statements in accordance with accounting principles generally accepted in the United States of America (GAAP) requires management to make certain estimates and assumptions that affect the reported amounts of assets and liabilities, the disclosure of contingent assets and liabilities at the date of the financial statements and the reported amounts of revenue and expenses during the reporting period. Actual results could differ from those estimates.
Security valuation
Securities of the Fund are valued at market value or, if a market quotation for a security is not readily available or is deemed not to be reliable because of events or circumstances that have occurred between the market quotation and the time as of which the security is to be valued, the security is valued at its fair value determined in good faith under consistently applied procedures established by the Board of Trustees (the Board). A security traded on a securities exchange or in an over-the-counter market in which transaction prices are reported is valued at the last sales price at the time of valuation. A security traded principally on NASDAQ is valued at the NASDAQ official closing price. Mutual funds and exchange traded funds are valued at their closing net asset value as reported to the applicable exchange. A security for which there is no reported sale on the valuation date is valued at the mean of the latest bid and ask quotations.
Short-term investments maturing in 60 days or less are valued at amortized cost, which approximates market value.
Forward foreign currency exchange contracts are marked-to-market based upon foreign currency exchange rates provided by a pricing service.
A security for which a market quotation is not readily available and any other assets are valued at their fair value determined in good faith under consistently applied procedures established by the Board. The Trust has retained an independent statistical fair value pricing service that employs a systematic methodology to assist in the fair valuation process for securities principally traded in a foreign market in order to adjust for possible changes in value that may occur between the close of the foreign market and the time as of which the securities are to be valued. If a security is valued at a fair value, that value may be different from the last quoted market price for the security.
Foreign currency translations
Values of investments denominated in foreign currencies are converted into U.S. dollars using the New York spot market rate of exchange at the time of valuation. Purchases and sales of investments and dividend and interest income are translated into U.S. dollars using the spot market rate of exchange prevailing on the respective dates of such transactions. The gain or loss resulting from changes in foreign
exchange rates is included with net realized and unrealized gain or loss from investments, as appropriate.
Restricted securities
Restricted securities are securities that may only be resold upon registration under federal securities laws or in transactions exempt from registration. In some cases, the issuer of restricted securities has agreed to register such securities for resale at the issuer's expense either upon demand by the Fund or in connection with another registered offering of the securities. Many restricted securities may be resold in the secondary market in transactions exempt from registration. Such restricted securities may be determined to be liquid under criteria established by the Board.
Derivative instruments
The Fund invests in forward foreign currency exchange contracts on a limited basis, as detailed below. Forward foreign currency exchange contracts are derivative instruments whose values depend on, or are derived from, in whole or in part, the value of one or more other assets, in this case, currencies. Derivatives may involve various risks, including the potential inability of the counterparty to fulfill its obligation under the terms of the contract and the potential for market movements, which may expose the Fund to gains or losses in excess of the amount shown in the Statement of Assets and Liabilities.
The put option held at December 31, 2013 was acquired through a transaction between the Fund and the controlling shareholder of Archipelago Resources (the "Controlling Shareholder") in connection with the delisting of the shares of Archipelago Resources in 2013 and the anticipated restructuring of Archipelago Resources into a new company during 2014 ("New Co"). Normally a put option would be bought to decrease the Fund's exposure to the underlying stock. However, in this case the put option related to the proposed restructuring of Archipelago Resources provides the Fund with the ability to sell its shares back to the Controlling Shareholder at an agreed upon price or to convert the shares held in Archipelago Resources into shares of New Co based upon the terms of the put option agreement between the Fund and the Controlling Shareholder.
For financial reporting purposes, the Fund does not offset derivative assets and derivative liabilities that are subject to netting arrangements in the Statement of Assets and Liabilities.
Forward foreign currency exchange contracts
Forward foreign currency exchange contracts are OTC agreements between two parties to buy and sell a currency at a set price on a future date. The Fund utilized forward foreign currency exchange contracts to hedge the currency exposure associated with some or all of the Fund's securities. The Fund's use of forward foreign currency exchange contracts was not material to the net assets of the Fund.
The values of forward foreign currency exchange contracts fluctuate with changes in foreign currency exchange rates. The Fund will record a realized gain or loss when the forward foreign currency exchange contract is closed.
The use of forward foreign currency exchange contracts does not eliminate fluctuations in the prices of the Fund's portfolio securities. The risks of forward foreign currency exchange contracts include movement in the values of the foreign currencies relative to the U.S. dollar (or other foreign currencies) and the possibility that counterparties will not complete their contractual obligations, which may be in excess of the amount reflected, if any, in the Statement of Assets and Liabilities.
15
Wanger International Select 2013 Annual Report
Notes to Financial Statements, continued
Offsetting of Derivative Assets and Derivative Liabilities
The following tables present the gross and net amount of assets and liabilities of the Fund available for offset under netting arrangements as well as any related collateral received or pledged by the Fund as of December 31, 2013:
| Gross Amounts of | Gross Amounts Offset in the | Net Amounts of Assets Presented in the | Gross Amounts Not Offset in the Statement of Assets and Liabilities | ||||||||||||||||||||||||||||
| Recognized Assets | Statement of Assets and Liabilities | Statement of Assets and Liabilities | Financial Instruments (a) | Cash Collateral Received | Securities Collateral Received | Net Amount (b) | |||||||||||||||||||||||||
| Forward Foreign Currency Exchange Contracts | $ | 4,388 | $ | — | $ | 4,388 | $ | — | $ | — | $ | — | $ | 4,388 | |||||||||||||||||
(a) Represents the amount of assets that could be offset by liabilities with the same counterparty under master netting or similar agreements that management elects not to offset on the Statement of Assets and Liabilities.
(b) Represents the net amount due from counterparties in the event of default.
Effects of derivative transactions in the financial statements
The following tables are intended to provide additional information about the effect of derivatives on the financial statements of the Fund including: the fair value of derivatives by risk category and the location of those fair values in the Statement of Assets and Liabilities; the impact of derivative transactions on the Fund's operations over the period including realized gains or losses and unrealized gains or losses. The derivative schedules following the Statement of Investments present additional information regarding derivative instruments outstanding at the end of the period, if any.
The following table is a summary of the fair value of derivative instruments at December 31, 2013:
Asset Derivatives | |||||||||||
Risk Exposure Category | Statement of Assets and Liabilities Location | Fair Value | |||||||||
| Foreign exchange risk | Unrealized appreciation on forward foreign currency exchange contracts | $ | 4,388 | ||||||||
Equity risk | Options, at value | 64,830 | |||||||||
Total | $ | 69,218 | |||||||||
The following table indicates the effect of derivative instruments in the Statement of Operations for the year ended December 31, 2013:
Amount of Realized Gain (Loss) on Derivatives Recognized in Income
Risk Exposure Category | Forward Foreign Currency Exchange Contracts | ||||||
Foreign exchange risk | $ | 98,992 | |||||
Change in Unrealized Appreciation (Depreciation) on Derivatives
Recognized in Income
| Risk Exposure Category | Forward Foreign Currency Exchange Contracts | Options | Total | ||||||||||||
Foreign exchange risk | $ | 33,211 | $ | — | $ | 33,211 | |||||||||
Equity risk | — | 64,830 | 64,830 | ||||||||||||
Total | $ | 33,211 | $ | 64,830 | $ | 98,041 | |||||||||
The following table is a summary of the volume of derivative instruments for the year ended December 31, 2013:
Derivative Instrument | Contracts Opened | ||||||
| Forward foreign currency exchange contracts | 27 | ||||||
Option | 1 | ||||||
Security transactions and investment income
Security transactions are accounted for on the trade date (date the order to buy or sell is executed) and dividend income is recorded on the ex-dividend date, except that certain dividends from foreign securities are recorded as soon as the information
is available to the Fund. Interest income is recorded on the accrual basis and includes amortization of discounts on debt obligations when required for federal income tax purposes. Realized gains and losses from security transactions are recorded on an identified cost basis.
Awards, if any, from class action litigation related to securities owned may be recorded as a reduction of cost of those securities. If the applicable securities are no longer owned, the proceeds are recorded as realized gains.
The Fund estimates the tax character of distributions from real estate investment trusts (REITs). Distributions received in excess of income are recorded as a reduction of the cost of the related investments. If the applicable securities are no longer owned, any distributions received in excess of income are recorded as realized gains.
Expenses
General expenses of the Trust are allocated to the Fund and the other series of the Trust based upon relative net assets or other expense allocation methodologies determined by the nature of the expense. Expenses directly attributable to the Fund are charged to the Fund.
Fund share valuation
Fund shares are sold and redeemed on a continuing basis at net asset value. Net asset value per share is determined daily as of the close of trading on the New York Stock Exchange (the Exchange) on each day the Exchange is open for trading by dividing the total value of the Fund's investments and other assets, less liabilities, by the number of Fund shares outstanding.
Securities lending
The Fund may lend securities up to one-third of the value of its total assets to certain approved brokers, dealers and other financial institutions to earn additional income. The Fund retains the benefits of owning the securities, including receipt of dividends or interest generated by the security. The Fund also receives a fee for the loan. The Fund has the ability to recall the loans at any time and could do so in order to vote proxies or to sell the loaned securities. Each loan is collateralized by cash that exceeded the value of the securities on loan. The market value of the loaned securities is determined daily at the close of business of the Fund and any additional required collateral is delivered to each Fund on the next business day. The Fund has elected to invest the cash collateral in the Dreyfus Government Cash Management Fund and the income earned is paid to the Fund, net of any fees remitted to Goldman Sachs Agency Lending, the Fund's lending agent, and borrower rebates. The Fund's investment manager, Columbia Wanger Asset Management, LLC (CWAM), does not retain any fees earned by the lending program. Generally, in the event of borrower default, the Fund has the right to use the collateral to offset any losses incurred. In the event the Fund is delayed or prevented from exercising its right to dispose of the collateral, there may be a potential loss to the Fund. Some or all of these losses may be indemnified by the lending agent. The Fund bears the risk of loss with respect to the investment of collateral. The net lending income earned by the Fund as of December 31, 2013, is included in the Statement of Operations.
16
Wanger International Select 2013 Annual Report
Notes to Financial Statements, continued
The following table presents the Fund's gross and net amount of assets available for offset under a securities lending agreement as well as the related collateral received by the Fund as of December 31, 2013:
| Gross Amounts of | Gross Amounts Offset in the | Net Amounts of Assets Presented in the | Gross Amounts Not Offset in the Statement of Assets and Liabilities | ||||||||||||||||||||||||||||
| Recognized Assets | Statement of Assets and Liabilities | Statement of Assets and Liabilities | Financial Instruments (a) | Cash Collateral Received | Securities Collateral Received | Net Amount (b) | |||||||||||||||||||||||||
Securities loaned | $ | 65,150 | $ | — | $ | 65,150 | $ | — | $ | 65,150 | $ | — | $ | — | |||||||||||||||||
(a) Represents the amount of assets that could be offset by liabilities with the same counterparty under master netting or similar agreements that management elects not to offset on the Statement of Assets and Liabilities.
(b) Represents the net amount due from counterparties in the event of default.
Federal income taxes
The Fund has complied with the provisions of the Internal Revenue Code available to regulated investment companies and, in the manner provided therein, distributes substantially all its taxable income, as well as any net realized gain on sales of investments and foreign currency transactions reportable for federal income tax purposes. Accordingly, the Fund paid no federal income taxes and no federal income tax provision was required.
Foreign capital gains taxes
Gains in certain countries may be subject to foreign taxes at the fund level. The Fund accrues for such foreign taxes on realized and unrealized gains at the appropriate rate for each jurisdiction. The amount, if any, is disclosed as a liability on the Statement of Assets and Liabilities.
Distributions to shareholders
Distributions to shareholders are recorded on the ex-dividend date.
Indemnification
In the normal course of business, the Trust on behalf of the Fund enters into contracts that contain a variety of representations and warranties and that provide general indemnities. The Fund's maximum exposure under these arrangements is unknown, as this would involve future claims against the Fund. Also under the Trust's organizational documents, the trustees and officers of the Trust are indemnified against certain liabilities that may arise out of their duties to the Trust. However based on experience, the Fund expects the risk of loss due to these warranties and indemnities to be remote.
3. Federal Tax Information
The timing and character of income and capital gain distributions are determined in accordance with income tax regulations, which may differ from GAAP. Reclassifications are made to the Fund's capital accounts for permanent tax differences to reflect income and gains available for distribution (or available capital loss carryforwards) under income tax regulations.
For the year ended December 31, 2013, permanent book and tax basis differences resulting primarily from foreign currency transactions, passive foreign invesment company (PFIC) holdings and foreign capital gains tax were identified and reclassified among the components of the Fund's net assets as follows:
| Accumulated Net Investment Income | Accumulated Net Realized Gain (Loss) | Paid-In Capital | |||||||||
| $ | 712,111 | $ | (712,111 | ) | $ | — | |||||
Net investment income and net realized gains (losses), as disclosed on the Statement of Operations, and net assets were not affected by this reclassification.
The tax character of distributions paid during the years ended December 31, 2013 and December 31, 2012 were as follows:
December 31, 2013 | December 31, 2012 | ||||||||||
Ordinary Income* | $ | 1,451,610 | $ | 278,945 | |||||||
Long-Term Capital Gains | 876,210 | — | |||||||||
* For tax purposes short-term capital gain distributions, if any, are considered ordinary income distributions.
As of December 31, 2013, the components of distributable earnings on a tax basis were as follows:
| Undistributed Ordinary Income | Undistributed Long-Term Capital Gains | Net Unrealized Appreciation (Depreciation)* | |||||||||
| $ | 161,584 | $ | 1,077,094 | $ | 4,193,135 | ||||||
* The differences between book-basis and tax-basis net unrealized appreciation/depreciation are primarily due to deferral of losses from wash sales and passive foreign investment company (PFIC) adjustments.
Management is required to determine whether a tax position of the Fund is more likely than not to be sustained upon examination by the applicable taxing authority, including resolution of any related appeals or litigation processes, based on the technical merits of the position. The tax benefit to be recognized by the Fund is measured as the largest amount of benefit that is greater than fifty percent likely of being realized upon ultimate settlement. Management is not aware of any tax positions for which it is reasonably possible that the total amounts of unrecognized tax benefits will significantly change in the next twelve months. Management has concluded that there are no significant uncertain tax positions that would require recognition in the financial statements. However, management's conclusions may be subject to review and adjustment at a later date based on factors including, but not limited to, new tax laws, regulations, and administrative interpretations (including relevant court decisions). The Fund's federal tax returns for the prior three fiscal years remain subject to examination by the Internal Revenue Service.
4. Transactions With Affiliates
CWAM is a wholly owned subsidiary of Columbia Management Investment Advisers, LLC (Columbia Management), which in turn is a wholly owned subsidiary of Ameriprise Financial, Inc. (Ameriprise Financial). CWAM furnishes continuing investment supervision to the Fund and is responsible for the overall management of the Fund's business affairs.
CWAM receives a monthly advisory fee based on the Fund's average daily net assets at the following annual rates:
Average Daily Net Assets | Annual Fee Rate | ||||||
Up to $500 million | 0.94 | % | |||||
| $500 million and over | 0.89 | % | |||||
17
Wanger International Select 2013 Annual Report
Notes to Financial Statements, continued
For the year ended December 31, 2013, the effective investment advisory fee rate was 0.94% of the Fund's average daily net assets.
Through April 30, 2014, CWAM has contractually agreed to reimburse the Fund to the extent that ordinary operating expenses (exclusive of brokerage commissions, interest, taxes and extraordinary expenses, but inclusive of custodian charges relating to overdrafts, if any), after giving effect to any balance credits from the Fund's custodian, exceed the annual rate of 1.45% of average daily net assets on an annualized basis.
The reimbursement to the Fund for the year ended December 31, 2013, was $15,919.
CWAM provides administrative services and receives an administration fee from the Fund at the following annual rates:
| Wanger Advisors Trust Aggregate Average Daily Net Assets of the Trust | Annual Fee Rate | ||||||
Up to $4 billion | 0.05 | % | |||||
$4 billion to $6 billion | 0.04 | % | |||||
$6 billion to $8 billion | 0.03 | % | |||||
| $8 billion and over | 0.02 | % | |||||
For the year ended December 31, 2013, the effective administration fee rate was 0.05% of the Fund's average daily net assets. Columbia Management provides certain sub-administrative services to the Fund.
Columbia Management Investment Distributors, Inc. (CMID), a wholly owned subsidiary of Ameriprise Financial, serves as the Fund's distributor and principal underwriter.
Columbia Management Investment Services Corp. (CMIS), a wholly owned subsidiary of Ameriprise Financial, is the transfer agent to the Fund. For its services, the Fund pays CMIS a monthly fee at the annual rate of $21.00 per open account. CMIS also receives reimbursement from the Fund for certain out-of-pocket expenses.
Certain officers and trustees of the Trust are also officers of CWAM. The Trust makes no direct payments to its officers and trustees who are affiliated with CWAM.
The Board has appointed a Chief Compliance Officer of the Trust in accordance with federal securities regulations. The Fund, along with other affiliated funds, pays its pro-rata share of the expenses associated with the Office of the Chief Compliance Officer.
The Trust offers a deferred compensation plan for its independent trustees. Under that plan, a trustee may elect to defer all or a portion of his or her compensation. Amounts deferred are retained by the Trust and may represent an unfunded obligation of the Trust. The value of amounts deferred is determined by reference to the change in value of Class Z shares of one or more series of Columbia Acorn Trust or a money market fund as specified by the trustee. Benefits under the deferred compensation plan are payable in accordance with the plan.
5. Borrowing Arrangements
During the year ended December 31, 2013, the Trust participated in a credit facility with JPMorgan Chase Bank, N.A., along with Columbia Acorn Trust, another trust managed by CWAM, in the amount of $150 million prior to January 11, 2013, $200 million for the period January 11, 2013 through July 21, 2013, and $150 million thereafter. The credit facility was entered into to facilitate portfolio liquidity. Under the facility, interest is charged to each participating fund based on its borrowings at a rate per annum equal to the Federal Funds Rate plus 1.00%. In addition, a commitment fee of 0.08% per annum of the unutilized line of credit is accrued and apportioned among the participating funds based on their relative net assets. The commitment fee is disclosed as a part of "Commitment fee for line of credit" in the Statement of Operations. The Trust expects to renew this line of credit for one year durations in July at then current market rates and terms.
No amounts were borrowed for the benefit of the Fund during the year ended December 31, 2013.
6. Fund Share Transactions
Proceeds and payments on Fund shares as shown in the Statement of Changes in Net Assets are in respect of the following numbers of shares:
| Year ended December 31, 2013 | Year ended December 31, 2012 | ||||||||||
Shares sold | 76,127 | 77,088 | |||||||||
| Shares issued in reinvestment of dividend distributions | 124,831 | 14,145 | |||||||||
Less shares redeemed | (233,547 | ) | (301,238 | ) | |||||||
Net increase (decrease) in shares outstanding | (32,589 | ) | (210,005 | ) | |||||||
7. Investment Transactions
The aggregate cost of purchases and proceeds from sales other than short-term obligations for the year ended December 31, 2013, were $16,978,670 and $19,292,473, respectively.
8. Shareholder Concentration
At December 31, 2013, two unaffiliated shareholder accounts owned an aggregate of 93.8% of the outstanding shares of the Fund. The Fund has no knowledge about whether any portion of those shares was owned beneficially by such accounts. Subscription and redemption activity by concentrated accounts may have a significant effect on the operations of the Fund.
9. Subsequent Events
Management has evaluated the events and transactions that have occurred through the date the financial statements were issued and noted no items requiring adjustment of the financial statements or additional disclosure.
10. Information Regarding Pending and Settled Legal Proceedings
Ameriprise Financial and certain of its affiliates have historically been involved in a number of legal, arbitration and regulatory proceedings, including routine litigation, class actions, and governmental actions, concerning matters arising in connection with the conduct of their business activities. Ameriprise Financial believes that the Funds are not currently the subject of, and that neither Ameriprise Financial nor any of its affiliates are the subject of, any pending legal, arbitration or regulatory proceedings that are likely to have a material adverse effect on the Funds or the ability of Ameriprise Financial or its affiliates to perform under their contracts with the Funds. Ameriprise Financial is required to make 10-Q, 10-K and, as necessary, 8-K filings with the Securities and Exchange Commission on legal and regulatory matters that relate to Ameriprise Financial and its affiliates. Copies of these filings may be obtained by accessing the SEC website at www.sec.gov.
There can be no assurance that these matters, or the adverse publicity associated with them, will not result in increased fund redemptions, reduced sale of fund shares or other adverse consequences to the Funds. Further, although we believe proceedings are not likely to have a material adverse effect on the Funds or the ability of Ameriprise Financial or its affiliates to perform under their contracts with the Funds, these proceedings are subject to uncertainties and, as such, we are unable to estimate the possible loss or range of loss that may result. An adverse outcome in one or more of these proceedings could result in adverse judgments, settlements, fines, penalties or other relief that could have a material adverse effect on the consolidated financial condition or results of operations of Ameriprise Financial.
18
Wanger International Select 2013 Annual Report
Report of Independent Registered Public Accounting Firm
To the Board of Trustees and Shareholders of Wanger International Select:
In our opinion, the accompanying statement of assets and liabilities, including the statement of investments, and the related statements of operations and of changes in net assets and the financial highlights present fairly, in all material respects, the financial position of Wanger International Select (a series of the Wanger Advisors Trust, hereinafter referred to as the "Fund") at December 31, 2013, the results of its operations for the year then ended, the changes in its net assets for each of the two years in the period then ended and the financial highlights for each of the five years in the period then ended, in conformity with accounting principles generally accepted in the United States of America. These financial statements and financial highlights (hereafter referred to as "financial statements") are the responsibility of the Fund's management; our responsibility is to express an opinion on these financial statements based on our audits. We conducted our audits of these financial statements in accordance with the standards of the Public Company Accounting Oversight Board (United States). Those standards require that we plan and perform the audit to obtain reasonable assurance about whether the financial statements are free of material misstatement. An audit includes examining, on a test basis, evidence supporting the amounts and disclosures in the financial statements, assessing the accounting principles used and significant estimates made by management, and evaluating the overall financial statement presentation. We believe that our audits, which included confirmation of securities at December 31, 2013 by correspondence with the custodian and brokers, provide a reasonable basis for our opinion.
PricewaterhouseCoopers LLP
Chicago, Illinois
February 18, 2014
19
Wanger International Select 2013 Annual Report
Federal Income Tax Information (Unaudited)
The Fund hereby designates the following tax attributes in the fiscal year ended December 31, 2013.
Tax Designations | |||||||
Dividends Received Deduction | 0.03 | % | |||||
Capital Gain Dividend | $ | 1,137,246 | |||||
Foreign Taxes Paid | $ | 52,970 | |||||
Foreign Source Income | $ | 687,234 | |||||
Dividends Received Deduction. The percentage of ordinary income dividends paid during the fiscal year that qualifies for the corporate dividends received deduction.
Capital Gain Dividend. The Fund designates as a capital gain dividend the amount reflected above, or if subsequently determined to be different, the net capital gain of such fiscal period. The Fund also designates as capital gain dividends, to the extent necessary to fully distribute such capital gains, earnings and profits distributed to shareholders on the redemption of shares.
Foreign Taxes. The Fund makes the election to pass through to shareholders the foreign taxes paid. These taxes, and the corresponding foreign source income, are provided.
20
Wanger International Select 2013 Annual Report
Board of Trustees and Management of Wanger Advisors Trust
Each trustee may serve a term of unlimited duration. The Trust's By-laws generally require that a trustee retire at the end of the calendar year in which the trustee attains the age of 75 years. The trustees appoint their own successors, provided that at least two-thirds of the trustees, after such appointment, have been elected by shareholders. Shareholders may remove a trustee, with or without cause, upon the vote of two-thirds of the Trust's outstanding shares at any meeting called for that purpose. A trustee may be removed, with or without cause, upon the vote of a majority of the trustees. The names of the trustees and officers of the Trust, the date each was first elected or appointed to office, their principal business occupations during at least the last five years, the number of portfolios in the fund complex they oversee, and other directorships they hold, are shown below. Each trustee serves in such capacity for each of the four series of Wanger Advisors Trust and for each of the eight series of Columbia Acorn Trust.
The address for the trustees and officers of the Trust is Columbia Wanger Asset Management, LLC, 227 West Monroe Street, Suite 3000, Chicago, Illinois 60606. The Funds' Statement of Additional Information includes additional information about the Funds' trustees and officers. You may obtain a free copy of the Statement of Additional Information by writing or calling toll-free:
Columbia Wanger Asset Management, LLC
Shareholder Services Group
227 W. Monroe, Suite 3000
Chicago IL 60606
1-800-922-6769
| Name, Position(s) with Wanger Advisors Trust and Age at December 31, 2013 | Year First Elected or Appointed to Office* | Principal Occupation(s) during Past Five Years | Number of Portfolios in Fund Complex Overseen by Trustee/Officer | Other Directorships in addition to Wanger Advisors Trust | |||||||||||||||
Trustees who are not interested persons of Wanger Advisors Trust: | |||||||||||||||||||
| Laura M. Born, 48, Trustee and Chair | 2007 | Adjunct Associate Professor of Finance, University of Chicago Booth School of Business; Managing Director – Investment Banking, JP Morgan Chase & Co. (broker/dealer) 2002-2007. | 12 | Columbia Acorn Trust; Carlson Wagonlit Travel, B.V. | |||||||||||||||
| Michelle L. Collins, 53, Trustee | 2008 | President, Cambium LLC (financial and business advisory firm) since 2007; Advisory Board Member, Svoboda Capital Partners LLC (private equity firm) since 2007. | 12 | Columbia Acorn Trust; Integrys Energy Group, Inc. (public utility); Molex, Inc. (electronics components manufacturer) 2003-2012; Bucyrus International, Inc. (manufacturer of mining equipment) 2009-2011. | |||||||||||||||
| Maureen M. Culhane, 65, Trustee | 2007 | Retired. Formerly, Vice President, Goldman Sachs Asset Management, L.P. (investment adviser), 2005-2007, and Vice President (Consultant) — Strategic Relationship Management, Goldman Sachs & Co., 1999-2005. | 12 | Columbia Acorn Trust | |||||||||||||||
| Margaret M. Eisen, 60, Trustee | 2002 | Chief Investment Officer, EAM International LLC (corporate finance and asset management) since 2003; Managing Director, CFA Institute, 2005-2008. | 12 | Columbia Acorn Trust; Burnham Investors Trust; Antigenics, Inc. (biotechnology and pharmaceuticals) 2003-2009. | |||||||||||||||
| John C. Heaton, 54, Trustee | 2010 | Deputy Dean for Faculty, University of Chicago Booth School of Business; Joseph L. Gidwitz Professor of Finance, University of Chicago Booth School of Business since 2000. | Columbia Acorn Trust | ||||||||||||||||
| Steven N. Kaplan, 54, Trustee and Vice Chair | 1999 | Neubauer Family Distinguished Service Professor of Entrepreneurship and Finance, University of Chicago Booth School of Business; faculty member of the University of Chicago Booth School of Business since 1998. | 12 | Columbia Acorn Trust; Accretive Health, Inc. (healthcare management services provider); Morningstar, Inc. (provider of independent investment research). | |||||||||||||||
21
Wanger International Select 2013 Annual Report
Board of Trustees and Management of Wanger Advisors Trust
| Name, Position(s) with Wanger Advisors Trust and Age at December 31, 2013 | Year First Elected or Appointed to Office* | Principal Occupation(s) during Past Five Years | Number of Portfolios in Fund Complex Overseen by Trustee/Officer | Other Directorships in addition to Wanger Advisors Trust | |||||||||||||||
Trustees who are not interested persons of Wanger Advisors Trust: (continued) | |||||||||||||||||||
| David J. Rudis, 60, Trustee | 2010 | Retired. National Checking and Debit Executive, and Illinois President, Bank of America, 2007 – 2009; President, Consumer Banking Group, LaSalle National Bank, 2004 – 2007. | 12 | Columbia Acorn Trust | |||||||||||||||
| David B. Small, 57, Trustee | 2010 | Managing Director, Grosvenor Capital Management, L.P. (investment adviser) since 1994; Adjunct Associate Professor of Finance, University of Chicago Booth School of Business. | 12 | Columbia Acorn Trust | |||||||||||||||
Trustees who are interested persons of Wanger Advisors Trust: | |||||||||||||||||||
| Charles P. McQuaid, 60, Trustee and President (1), (2) | 1992 | President and Chief Investment Officer, CWAM or its predecessors, since October 2003; associated with CWAM or its predecessors as an investment professional since 1978. | 12 | Columbia Acorn Trust | |||||||||||||||
Trustee Emeritus | |||||||||||||||||||
| Ralph Wanger, 79, Trustee Emeritus (3) | 1970 | Founder, CWAM. Formerly, President, Chief Investment Officer and portfolio manager, CWAM or its predecessors, July 1992 – September 2003; Director, Wanger Investment Company PLC; Consultant to CWAM or its predecessors, September 2003 – September 2005. | 12 | Columbia Acorn Trust | |||||||||||||||
Officers of Wanger Advisors Trust: | |||||||||||||||||||
| Robert A. Chalupnik, 47, Vice President | 2011 | Portfolio manager and/or analyst, CWAM or its predecessors since 2000; Vice President Columbia Acorn Trust and Wanger Advisors Trust since May 2011. | 12 | N/A | |||||||||||||||
| Michael G. Clarke, 44, Assistant Treasurer | 2004 | Vice President, Columbia Management Investment Advisers, LLC since May 2010; Managing Director of Fund Administration, Columbia Management Advisors, LLC, September 2004 – April 2010; Senior officer, Columbia Funds and affiliated funds since 2002. | 12 | N/A | |||||||||||||||
| Joseph F. DiMaria, 44, Assistant Treasurer | 2010 | Vice President, Mutual Fund Administration, Columbia Management Investment Advisers, LLC, since May 2010; Director of Fund Administration, Columbia Management Advisors, LLC, January 2006 – April 2010. | 12 | N/A | |||||||||||||||
| P. Zachary Egan, 44, Vice President (2) | 2003 | Director of International Research, CWAM or its predecessors since December 2004; Vice President, Columbia Acorn Trust since 2003 and Wanger Advisors Trust since 2007; portfolio manager and/or analyst, CWAM or its predecessors, since 1999. | 12 | N/A | |||||||||||||||
| Fritz Kaegi, 42, Vice President | 2011 | Portfolio manager and/or analyst, CWAM or its predecessors since 2004; Vice President Columbia Acorn Trust and Wanger Advisors Trust since September 2011. | 12 | N/A | |||||||||||||||
| John Kunka, 43, Assistant Treasurer | 2006 | Director of Accounting and Operations, CWAM since 2006. | 12 | N/A | |||||||||||||||
| Stephen Kusmierczak, 46, Vice President | 2011 | Portfolio manager and/or analyst, CWAM or its predecessors since 2001; Vice President Columbia Acorn Trust and Wanger Advisors Trust since September 2011. | 12 | N/A | |||||||||||||||
| Joseph C. LaPalm, 44, Vice President | 2006 | Chief Compliance Officer, CWAM since 2005. | 12 | N/A | |||||||||||||||
22
Wanger International Select 2013 Annual Report
Board of Trustees and Management of Wanger Advisors Trust
| Name, Position(s) with Wanger Advisors Trust and Age at December 31, 2013 | Year First Elected or Appointed to Office* | Principal Occupation(s) during Past Five Years | Number of Portfolios in Fund Complex Overseen by Trustee/Officer | Other Directorships in addition to Wanger Advisors Trust | |||||||||||||||
Officers of Wanger Advisors Trust: (continued) | |||||||||||||||||||
| Bruce H. Lauer, 56, Vice President, Secretary and Treasurer | 1995 | Chief Operating Officer, CWAM or its predecessors since April 2000; Vice President, Secretary and Treasurer, (Chief Financial and Accounting Officer), Columbia Acorn Trust and Wanger Advisors Trust since 1995; formerly, Director, Wanger Investment Company PLC; formerly, Director, Banc of America Capital Management (Ireland) Ltd.; and formerly, Director, Bank of America Global Liquidity Funds, PLC. | 12 | N/A | |||||||||||||||
| Louis J. Mendes III, 49, Vice President | 2003 | Portfolio manager and/or analyst, CWAM or its predecessors since 2001; Vice President, Columbia Acorn Trust since 2003 and Wanger Advisors Trust since 2005. | 12 | N/A | |||||||||||||||
| Robert A. Mohn, 52, Vice President (2) | 1997 | Director of Domestic Research, CWAM or its predecessors since March 2004; Vice President, Columbia Acorn Trust and Wanger Advisors Trust, since 1997; portfolio manager and/or analyst, CWAM or its predecessors since August 1992. | 12 | N/A | |||||||||||||||
| Christopher J. Olson, 49, Vice President | 2001 | Portfolio manager and/or analyst, CWAM or its predecessors, since January 2001; Vice President, Columbia Acorn Trust and Wanger Advisors Trust since 2001. | 12 | N/A | |||||||||||||||
| Christopher O. Petersen, 44, Assistant Secretary | 2010 | Vice President and Chief Counsel, Ameriprise Financial since January 2010 (formerly, Vice President and Group Counsel or Counsel, April 2004 – January 2010); officer, Columbia Funds and affiliated funds since 2007. | 12 | N/A | |||||||||||||||
| Scott R. Plummer, 54, Assistant Secretary | 2010 | Senior Vice President, Chief Legal Officer and Assistant Secretary, Columbia Management Investment Advisers, LLC (or its predecessors) since June 2005; Senior Vice President and Assistant General Counsel — Global Asset Management, Ameriprise Financial since February 2014 (previously, Senior Vice President and Lead Chief Counsel — Asset Management, 2012 – February 2014, Vice President and Lead Chief Counsel — Asset Management, 2010 – 2012, and Vice President and Chief Counsel — Asset Management, 2005 – 2010); Vice President, Chief Counsel and Assistant Secretary, Columbia Management Investment Distributors, Inc. (or its predecessors) since 2008; Vice President, General Counsel and Secretary, Ameriprise Certificate Company since 2005; Chief Counsel, RiverSource Distributors, Inc., 2006 – 2010; Senior officer, Columbia Funds and affiliated funds since 2006. | 12 | N/A | |||||||||||||||
| Robert P. Scales, 61, Chief Compliance Officer, Chief Legal Officer, Senior Vice President and General Counsel | 2004 | Chief Compliance Officer, Chief Legal Officer, Senior Vice President and General Counsel, Columbia Acorn Trust and Wanger Advisors Trust, since 2004. | 12 | N/A | |||||||||||||||
| Andreas Waldburg-Wolfegg, 47, Vice President | 2011 | Portfolio Manager and/or analyst of CWAM since 2002; Vice President Columbia Acorn Trust and Wanger Advisors Trust since September 2011. | 12 | N/A | |||||||||||||||
| Linda Roth-Wiszowaty, 44, Assistant Secretary | 2006 | Business support analyst, CWAM, since April 2007; prior thereto executive administrator, CWAM or its predecessors, and executive assistant to the Chief Operating Officer of CWAM or its predecessors. | 12 | N/A | |||||||||||||||
* Dates prior to April 1992 correspond to the date of first election or appointment as a trustee or officer of The Acorn Fund, Inc., the predecessor trust to Columbia Acorn Trust.
(1) Mr. McQuaid is an "interested person" of Wanger Advisors Trust and of CWAM, as defined in the Investment Company Act of 1940, because he is an officer of the Trust and of CWAM.
(2) Effective March 31, 2014, Mr. McQuaid expects to step down from his current role as President and Chief Investment Officer of CWAM. Effective April 1, 2014 it is expected that Mr. Mohn will become the Domestic Chief Investment Officer of CWAM and Mr. Egan will become the President and International Chief Investment Officer of CWAM.
(3) As permitted under the Wanger Advisors Trust's By-Laws, Mr. Wanger serves as a non-voting Trustee Emeritus of the Trust.
23
Wanger International Select 2013 Annual Report
This page intentionally left blank.
24
Wanger International Select 2013 Annual Report

Columbia Wanger Funds
Trustees
Laura M. Born
Chair of the Board
Steven N. Kaplan
Vice Chair of the Board
Michelle L. Collins
Maureen M. Culhane
Margaret M. Eisen
John C. Heaton
Charles P. McQuaid
David J. Rudis
David B. Small
Ralph Wanger (Trustee Emeritus)
Officers
Charles P. McQuaid
President
Robert A. Chalupnik
Vice President
Michael G. Clarke
Assistant Treasurer
Joseph F. DiMaria
Assistant Treasurer
P. Zachary Egan
Vice President
Fritz Kaegi
Vice President
John M. Kunka
Assistant Treasurer
Stephen Kusmierczak
Vice President
Joseph C. LaPalm
Vice President
Bruce H. Lauer
Vice President, Secretary and Treasurer
Louis J. Mendes III
Vice President
Robert A. Mohn
Vice President
Christopher J. Olson
Vice President
Christopher O. Petersen
Assistant Secretary
Scott R. Plummer
Assistant Secretary
Robert P. Scales
Chief Compliance Officer, Chief Legal Officer, Senior Vice President and
General Counsel
Andreas Waldburg-Wolfegg
Vice President
Linda K. Roth-Wiszowaty
Assistant Secretary
Investment Manager
Columbia Wanger Asset Management, LLC
227 West Monroe Street, Suite 3000
Chicago, Illinois 60606
1-888-4-WANGER
(1-888-492-6437)
Transfer Agent,
Dividend Disbursing Agent
Columbia Management Investment Services Corp.
P.O.Box 8081
Boston, Massachusetts
02266-8081
Distributor
Columbia Management Investment Distributors, Inc.
225 Franklin Street
Boston, Massachusetts
02110
Legal Counsel to the Funds
Perkins Coie LLP
Washington, DC
Legal Counsel to the Independent Trustees
Drinker Biddle & Reath LLP
Philadelphia, Pennsylvania
Independent Registered Public Accounting Firm
PricewaterhouseCoopers LLP
Chicago, Illinois
This document contains Global Industry Classification Standard data. The Global Industry Classification Standard ("GICS") was developed by and is the exclusive property and a service mark of MSCI Inc. ("MSCI") and Standard & Poor's Financial Services LLC ("S&P") and is licensed for use by Columbia Wanger Asset Management, LLC ("CWAM"). Neither MSCI, S&P, nor any other party involved in making or compiling the GICS or any GICS classifications makes any express or implied warranties or representations with respect to such standard or classification (or the results to be obtained by the use thereof), and all such parties hereby expressly disclaim all warranties of originality, accuracy, completeness, merchantability and fitness for a particular purpose with respect to any of such standard or classification. Without limiting any of the foregoing, in no event shall MSCI, S&P, any of their affiliates or any third party involved in making or compiling the GICS or any GICS classifications have any liability for any direct, indirect, special, punitive, consequential or any other damages (including lost profits) even if notified of the possibility of such damages.
This report, including the schedules of investments and financial statements, is submitted for the general information of the shareholders of the Wanger Advisors Trust.
A description of the Fund's proxy voting policies and procedures and a copy of the Fund's voting record for the most recent 12-month period ended June 30 are available (i) on our website, columbiamanagement.com, (ii) on the Securities and Exchange Commission's website at www.sec.gov, and (iii) without charge, upon request, by calling 888-492-6437.
The Fund files a complete schedule of portfolio holdings with the SEC for the first and third quarters of each fiscal year on Form N-Q. The Fund's Form N-Q is available on the SEC's website at www.sec.gov and may be reviewed and copied at the SEC's Public Reference Room in Washington, D.C. Information on the operation of the Pubic Reference Room may be obtained by calling 800-SEC-0330. The Fund's complete portfolio holdings are disclosed at www.columbiamanagement.com approximately 30 to 40 days after each month-end.
25
Columbia Wanger Funds
© 2014 Columbia Management Investment Advisers, LLC. All rights reserved.
C-1451 E (2/14) 815617
Wanger Select
2013 Annual Report
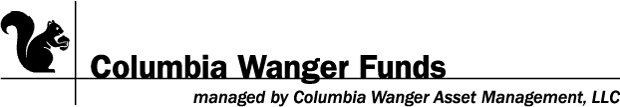
Not FDIC insured • No bank guarantee • May lose value

Wanger Select
2013 Annual Report
Table of Contents
1 | Understanding Your Expenses | ||||||
2 | Containerized Cargo and the Man Who Popularized It | ||||||
4 | Performance Review | ||||||
6 | Statement of Investments | ||||||
11 | Statement of Assets and Liabilities | ||||||
11 | Statement of Operations | ||||||
12 | Statement of Changes in Net Assets | ||||||
13 | Financial Highlights | ||||||
14 | Notes to Financial Statements | ||||||
18 | Report of Independent Registered Public Accounting Firm | ||||||
19 | Federal Income Tax Information (Unaudited) | ||||||
| 20 | Board of Trustees and Management of Wanger Advisors Trust | ||||||
A Comment on Trading Volumes
Market conditions are always changing and vary by country and industry sector, and investing in international markets involves unique risks. In the wake of the 2007-2009 financial crisis, trading volumes in both emerging and developed international markets declined significantly and have stayed at generally reduced levels since then. Although it is difficult to accurately assess trends in trading volumes in foreign markets, because some amount of activity has migrated to alternative trading venues, a reduction in trading volumes poses challenges to the Fund. This is particularly so because the Fund focuses on small- and mid-cap companies that usually have lower trading volumes and often takes sizeable positions in portfolio companies. As a result of lower trading volumes, it may take longer to buy or sell securities, which can exacerbate the Fund's exposure to volatile markets. The Fund may also be limited in its ability to execute favorable trades in portfolio securities in response to changes in company prices and fundamentals. If the Fund is forced to sell securities to meet redemption requests or other cash needs, or in the case of an event affecting liquidity in a particular market or markets, it may be forced to dispose of those securities under disadvantageous circumstances and at a loss. As the Fund grows in size, these considerations take on increasing significance and may adversely impact performance.
Columbia Wanger Asset Management, LLC (CWAM) is one of the leading global small- and mid-cap equity managers in the United States with over 40 years of small- and mid-cap investment experience. As of December 31, 2013, CWAM managed $39.7 billion in assets. CWAM is the investment manager to Wanger USA, Wanger International, Wanger Select and Wanger International Select (together, the Columbia Wanger Funds) and the Columbia Acorn Family of Funds.
An important note: Columbia Wanger Funds are available only through variable annuity contracts and variable life insurance policies issued by participating insurance companies or certain eligible retirement plans. Columbia Wanger Funds are not offered directly to the public and are not available in all contracts, policies or plans. Contact your financial advisor or insurance representative for more information. Columbia Wanger Funds are distributed by Columbia Management Investment Distributors, Inc., member FINRA, and are managed by Columbia Wanger Asset Management, LLC.
Investors should carefully consider investment objectives, risks, charges and expenses before investing. For variable fund and variable contract prospectuses, which contain this and other important information, investors should contact their financial advisor or insurance representative. Read the prospectus carefully before investing.
The views expressed in "Containerized Cargo and the Man Who Popularized It" and in the Performance Review reflect the current views of the respective authors. These views are not guarantees of future performance and involve certain risks, uncertainties and assumptions that are difficult to predict so actual outcomes and results may differ significantly from the views expressed. These views are subject to change at any time based upon economic, market or other conditions and the respective parties disclaim any responsibility to update such views. These views may not be relied on as investment advice and, because investment decisions for a Columbia Wanger Fund are based on numerous factors, may not be relied on as an indication of trading intent on behalf of any particular Columbia Wanger Fund. References to specific company securities should not be construed as a recommendation or investment advice.
Wanger Select 2013 Annual Report

Understanding Your Expenses
As a shareholder, you incur three types of costs. There are transaction costs, which generally include sales charges on purchases and may include redemption fees. There are also ongoing costs, which generally include management fees and other expenses for Wanger Select (the Fund). Lastly, there may be additional fees or charges imposed by the insurance company that sponsors your variable annuity and/or variable life insurance product. The following information is intended to help you understand your ongoing costs (in dollars) of investing in the Fund and to help you compare these costs with the ongoing costs of investing in other mutual funds.
Analyzing your Fund's expenses
To illustrate these ongoing costs, we have provided an example and calculated the expenses paid by investors in the Fund during the period. The actual and hypothetical information in the table below is based on an initial investment of $1,000 at the beginning of the period indicated and held for the entire period. Expense information is calculated two ways and each method provides you with different information. The amount listed in the "Actual" column is calculated using the Fund's actual operating expenses and total return for the period. You may use the Actual information, together with the amount invested, to estimate the expenses that you paid over the period. Simply divide your account value by $1,000 (for example, an $8,600 account value divided by $1,000 = 8.6), then multiply the results by the expenses paid during the period under the Actual column. The amount listed in the "Hypothetical" column assumes a 5% annual rate of return before expenses (which is not the Fund's actual return) and then applies the Fund's actual expense ratio for the period to the hypothetical return. You should not use the hypothetical account values and expenses to estimate either your actual account balance at the end of the period or the expenses you paid during the period. See "Compare with other funds" below for details on how to use the hypothetical data.
Compare with other funds
Since all mutual funds are required to include the same hypothetical calculations about expenses in shareholder reports, you can use this information to compare the ongoing cost of investing in the Fund with other funds. To do so, compare the hypothetical example with the 5% hypothetical examples that appear in the shareholder reports of other funds. As you compare hypothetical examples of other funds, it is important to note that hypothetical examples are meant to highlight the ongoing cost of investing in a fund only and do not reflect any transaction costs, such as sales charges, redemption or exchange fees. Therefore, the hypothetical calculations are useful in comparing ongoing costs only, and will not help you determine the relative total costs of owning different funds. If transaction costs were included in these calculations, your costs would be higher.
July 1, 2013 - December 31, 2013
| Account value at the beginning of the period ($) | Account value at the end of the period ($) | Expenses paid during period ($) | Fund's annualized expense ratio (%)* | ||||||||||||||||||||||||||||
Actual | Hypothetical | Actual | Hypothetical | Actual | Hypothetical | ||||||||||||||||||||||||||
Wanger Select | 1,000.00 | 1,000.00 | 1,196.50 | 1,020.74 | 5.20 | 4.79 | 0.93 | ||||||||||||||||||||||||
* Expenses paid during the period are equal to the Fund's annualized expense ratio, multiplied by the average account value over the period, then multiplied by the number of days in the Fund's most recent fiscal half-year and divided by 365.
It is important to note that the expense amounts shown in the table are meant to highlight only ongoing costs of investing in the Fund. Expenses paid during the period do not include any insurance charges imposed by your insurance company's separate account. The hypothetical example provided is useful in comparing ongoing costs only and will not help you determine the relative total costs of owning different funds whose shareholders may incur transaction costs.
1
Wanger Select 2013 Annual Report

Containerized Cargo and the Man Who Popularized It
Born in a small town in North Carolina, Malcom McLean had little formal schooling beyond grade school. He first worked as a farmer and then operated a gas station. When, in 1934, a road builder asked him where he could hire a truck and a driver, Malcom bought a used truck for $150 and signed on. Malcom went on to build McLean Trucking, one of the largest trucking firms in the country.1 The company was an early adopter of diesel engines and conveyors, and acquired other truckers in order to transport backhauls under Interstate Commerce Commission rules.2
Early in his trucking career, McLean personally had the job of delivering cotton to the port of New York and returning with a truck full of roofing material. He grew impatient waiting for the stevedores to unload and reload his truck and thought that switching full containers would save time and money.3
In 1955, McLean sold his trucking business and bought Pan-Atlantic Steamship Company for $7 million cash. He then bought Pan-Atlantic's former parent company, Waterman, in a $42 million leveraged buyout using Pan-Atlantic as collateral.4 Combined, the companies operated 37 World War II surplus C-2 cargo ships. He also bought four World War II surplus T-2 tankers and had them equipped with spar decks on top, similar to those used during the war to haul large equipment across the Atlantic.
McLean now had the opportunity to put his shipping-by-container idea to work. Until the 1950s, general ocean cargo arrived at ports in crates, boxes, bags and on pallets. It was then meticulously packed by longshoremen; a typical ship took 150 of them four days to load.5 One steamship executive said it cost more to move cargo from the street to the hold of a ship, than it did to move the cargo across the sea.6 McLean decided to save time and space by utilizing detachable truck trailers, and transporting only the container section of the trailer on the vessels.7 In April 1956, service commenced between Port Newark, New Jersey, Miami, Florida and Houston,
Texas. Each of the four ships could accommodate 58 containers that were thirty-three feet long.8
Shipping by container did cost substantially less. As an extreme example, McLean calculated that the cost of hauling bottled beer from Newark to Miami was 94% cheaper by containership than by conventional shipping. More realistically, a government-sponsored study calculated that container shipping cost 39% to 74% less.9 McLean named his intermodal operation Sea-Land Service.
Sea-Land then set about converting six of the C-2 cargo ships in its fleet into dedicated containerships. Containers were to be stacked four high in the hold and two high on the deck, resulting in a capacity of 226 containers per vessel. In order to allow stacking, frames of the containers were strengthened and twist locks were invented to hold adjacent containers in place. The first converted C-2 began hauling containers in October 1957. These containerships could be loaded by a crew of 14 during a single eight-hour shift for a cost nearly 90% less than loading a similar sized break-bulk ship, a ship with cargo loaded individually.10
Imitators soon followed. In August 1958 Matson Line began service between California and Hawaii, carrying 20 containers on deck and conventional break-bulk cargo below. In 1960, Matson began launching dedicated containerships, again converted World War II cargo ships, accommodating up to 356 containers each. In 1960, Grace Line inserted mid-sections into C-2 cargo ships and converted them to containerships capable of carrying 476 containers for shipments between the United States and Latin America. But Grace Line abandoned the service within a few years due to labor problems. McLean launched ships that could carry 476 much larger containers in 1962, and put them into service between the East and West coasts of the United States,11 as well as between the continental United States and Puerto Rico.12 On its tenth anniversary in 1966, Sea-Land had 19 containerships.13 By 1969,
Sea-Land had also converted C-4s to carry 622 containers.14
McLean recognized that to achieve the full benefit of containers, the entire system of ports, labor, trucks and ships would have to change.15 Port Elizabeth, New Jersey, was designed for containerships. Opening in 1962, it had a wide and deep channel and plenty of paved area shore-side for containers in transit.16 New Jersey's share of the Port of New York cargo jumped from 9% in 1956 to 63% in 1970. Around the country, the few ports that had room for containers, good road and rail connections (and a penchant for spending on infrastructure) gained share, while ports relying on piers within congested cities lost out.17 McLean also signed agreements with unions, providing regular work, safe working conditions and provisions for early retirement in exchange for fewer paid employee hours and more flexible work rules.
Trans-Atlantic container shipping started in 1966 and competition increased. McLean decided to build all-new containerships rather than convert old vessels. He specified ships for both size and speed that could carry over 1,200 containers of varying sizes.18 The ships were to steam at 33 knots, well above most others that operated at 18 to 24 knots. The new containerships cost a total of $435 million. In May of 1969, McLean orchestrated a $530 million takeover of Sea-Land by R.J. Reynolds, a cash-rich tobacco company, as Sea-Land needed investment capital and R.J. Reynolds wanted to diversify.19
The first of eight ships launched in 1972. It crossed the Atlantic in under five days and averaged 31 knots, a cargo ship record. After refinements, sister ships were able to make the crossing in under four days, beating the record of all passenger ships except for a ship named the United States.20 Six of the eight ships were eventually assigned to trans-Pacific crossings.
But fast ships use far more fuel than slower ships. Sea-Land's new containerships consumed nearly twice as much fuel per mile at 33 knots than at 24 knots, and at 24 knots consumed
2
Wanger Select 2013 Annual Report
more fuel per container than ships that were designed for 24 knots or less. After two oil price spikes in the 1970s, the ships became unprofitable and were sold in 1981, at less than half their cost of construction, to the U.S. Navy for use as fast supply vessels.21
McLean reduced his role at Sea-Land after the fast ships launched in 1972, resigned from the R.J. Reynolds board in 1977 and sold his last shares in the company in 1980. R.J. Reynolds spun off Sea-Land in 1984; CSX bought it in 1986, and sold it to Maersk in 1999.
McLean re-entered the shipping industry by buying United States Lines from Walter Kidde in April 1978. Later that year, the company placed a record order to construct 12 new containerships, each with a capacity somewhat over 4,250 containers. These ships were 40% larger than the largest containership in existence and would provide United States Lines with the most capacity in the industry. Per container, the ships would be by far the most efficient and would cruise at a fuel-efficient 16 knots. The ships were highly automated and were able to carry nearly 50 times as much cargo per crewmember as the first dedicated cargo ships.22
Tragically for McLean and United States Lines, the price of oil then plunged, fuel efficiency mattered a lot less, and speed became more important. The ships were underpowered and had trouble keeping schedules in rough seas. They could not compete and in 1986 the company filed the biggest bankruptcy in U.S. history. The ships were sold at $0.28 on the dollar 16 months later.23 McLean was mortified by the failure, which cost thousands of jobs and millions of dollars. He died in 2001 at the age of 87, after yet another attempt to re-enter the industry.
Containerships kept getting larger and speeds gradually increased. Beginning in 2006, Maersk launched eight ships capable of carrying over 14,000 containers. Larger containerships had costs per container nearly 50% less than smaller ships.24 In 2013, Maersk launched the Mc-Kinney Moller with a capacity of 18,000
containers and had 19 more on order. These ships are longer than the height of the Empire State Building's occupied floors. Echoing McLean's 1978 order, the ships are designed to be at least 30% more fuel efficient than competitors and cruise at 16 knots.25 Worldwide containership capacity currently exceeds 17 million containers, which, if laid end-to-end, exceeds twice the circumference of the world.26
Containerships made freight transport reliable and incredibly cheap. At least three-quarters of vessels in the Far East/North America trade arrive within a day of schedule. In 2004, 4,000 video recorders could be shipped from the Far East to Europe for $0.83 each and Scotch whisky could be shipped from Europe to Japan for $0.05 per bottle.27 In 2013, it was cheaper to ship Scottish cod 10,000 miles to China for filleting and back to Scotland than to fillet it in Scotland!28
Containerized cargo hiked supplies and reduced prices of consumer goods, raising living standards around the world. The containership industry has high fixed costs and is very cyclical. Also, new more efficient ships increase industry capacity and depress pricing, hurting profitability of existing ships. As investors, we've found more stable opportunities in this industry by investing in adjunct businesses that benefit from increased container volumes. These include freight forwarders, which tend to benefit from declining costs or transport, and container owners, which exist today thanks to the ingenuity of Malcom McLean.


Charles P. McQuaid
President and Chief Investment Officer
Columbia Wanger Asset Management, LLC
The information and data provided in this analysis are derived from sources that we deem to be reliable and accurate. These views are not guarantees of future performance and involve certain risks, uncertainties and assumptions that are difficult to predict so actual outcomes and results may differ significantly from the views expressed. The views/opinions expressed here are those of the author and not of the Wanger Advisors Trust Board, are subject to change at any time based upon economic, market or other conditions, may differ from views expressed by other Columbia Management associates and the respective parties disclaim any responsibility to update such views. These views may not be relied on as investment advice and, because investment decisions for a Columbia Wanger Fund are based on numerous factors, may not be relied on as an indication of trading intent on behalf of any particular Columbia Wanger Fund.
1 Cudahy, Brian J., Box Boats, How Container Ships Changed the World (New York, New York, Fordham University Press, 2006) p. 21.
2 Levinson, Marc, The Box, How the Shipping Container Made the World Smaller and the World Economy Bigger (Princeton, New Jersey, Princeton University Press, 2006), p. 40-41.
3 Cudahy, Brian J., op. cit., p. 10.
4 Ibid., p. 24.
5 Ibid., p. 35.
6 Ibid., p. 9.
7 Ibid., p. 27.
8 Levinson, Marc, op. cit., p. 49, 51.
9 Ibid., p. 48, 91.
10 Cudahy, Brian J., op. cit., p. 35.
11 Ibid., p. 80.
12 Levinson, Marc, op. cit., p. 72.
13 Cudahy, Brian J., op. cit., p. 90.
14 Ibid., p. 100.
15 Levinson, Marc, op. cit., p. 53.
16 Ibid., p. 91.
17 Ibid., p. 91, 96, 193.
18 Sea-Land's initial containers were 33 and 35 feet long, while Matson Lines' were 24 feet and Grace Lines' measured 17 feet, lengths determined by ship sizes and road regulations. Going forward in this essay, capacity refers to standardized 20-foot trailer equivalent units (TEU), though most containers today are 40 feet long.
19 Levinson, Marc, op. cit., p. 216-217.
20 Cudahy, Brian J., op. cit., p. 123.
21 Ibid., p. 136-137.
22 Ibid., p. 149-150.
23 Levinson, Marc, op. cit., p. 243.
24 Stopford, Martin, Maritime Economics, Third Edition (New York, New York, Routledge, Taylor & Francis Group, 2009) p. 540.
25 Bennett, Drake, "Risk Ahoy: Maersk, Daewoo Build the World's Biggest Boat," Bloomberg Businessweek, September 5, 2013.
26 World Shipping Council website, http://www.worldshipping.org/about-the-industry/liner-ships/container-vessel-fleet.
27 Stopford, Martin, op. cit., p. 512, 522.
28 George, Rose, Ninety Percent of Everything, Inside Shipping, The Invisible Industry that Puts Clothes on Your Back, Gas in Your Car, and Food on Your Plate (New York, New York, Metropolitan Books, Henry Hold and Company, 2013), p. 18.
3
Wanger Select 2013 Annual Report

Performance Review Wanger Select

Robert A. Chalupnik
Portfolio Manager
Performance data shown represents past performance and is not a guarantee of future results. The investment return and principal value will fluctuate so that shares, when redeemed, may be worth more or less than the original cost. Current performance may be lower or higher than the performance data shown. Please visit columbiamanagement.com for most recent month-end performance updates.
Wanger Select ended 2013 up 34.58%, outperforming the 33.50% gain of its benchmark, the S&P MidCap 400 Index. It is pleasing to end the year with performance above benchmark following a weak start to the year. Several holdings that underperformed in early 2013 recovered nicely as the year progressed, and some new positions in the Fund got off to a strong start, contributing to gains.
A top contributor for the year was insurance provider CNO Financial Group. Its stock gained 90% for the year as the company continued to make progress toward its goal of 9% return on equity (ROE) by the end of 2015. Offshore business process outsourcing services provider WNS had an annual gain of 110%. Its stock continues to benefit from growth in new business and price-to-earnings multiple expansion.
Car rental company Hertz gained 75% for the year, benefiting from lower fleet costs and higher pricing and utilization, which drove earnings growth. Its stock also received a boost on the last day of the year, rising 10% after the company adopted a shareholder rights plan in response to unusual and substantial trading of its stock. We took the opportunity to capture gains during this rally and trimmed the Fund's position. South American oil producer Canacol ended the year with an annual return of 110%. Investors responded favorably to its solid production and successful well results.
Among the detractors to returns for the year was gold miner Kirkland Lake Gold. Its stock fell along with gold prices, declining 64%. We sold out of the stock in the fourth quarter of the year due to concerns about the impact a long period of lower gold prices could have on the company. This sale also reduced the Fund's exposure to riskier micro-cap names. We have been reducing this exposure across the portfolio since 2011. Rather than invest in such companies, we have tried to emphasize more of CWAM's "best ideas." While "best ideas" do not dominate the portfolio, they do represent a significant percentage of the Fund's holdings.
Petrodorado Energy, an oil and gas exploration and production company operating in Colombia, Peru and Paraguay, was also a detractor during 2013, falling 73%. The company hit oil in Colombia, but concerns remained as to whether the well would be commercially viable.
During the second half of the year we added six new names to the Fund's portfolio. Self-storage facilities real estate investment trust (REIT) Extra Space Storage was added to replace Biomed Realty Trust, a life science-focused REIT. We view Extra Space Storage as a better-quality name with higher expected returns. Informatica, a developer of enterprise data integration software, was also added. We consider Informatica a well-managed company positioned to benefit from increasing sources and uses of data. Casey's General Stores, an owner/operator of convenience stores located in rural communities, tends to be the only game in town and the chain is experiencing growth in new stores and also adding higher margin products to existing locations. Rowan, a contract offshore driller, is enjoying strong demand for its deep water drilling services and is expanding its fleet of rigs. Antero Resources
is an oil and gas producer drilling in the Marcellus and Utica shale found in the Appalachian Basin states. Lastly, we added Post Properties, a multi-family REIT. Post's rental properties are located in faster growing markets in the South and Mid-Atlantic states and should benefit from rising rental rates in its markets.
We sold out of seven positions in the second half of the year. In addition to Kirkland Lake Gold and Biomed Realty Trust, we sold communications towers owner Crown Castle International. Within the same industry, we prefer SBA Communications at current valuations. Also among the second-half sales was RexLot Holdings, a lottery equipment supplier in China, which was sold to reduce the portfolio's exposure to micro-caps.
The U.S. stock market, as defined by the S&P 500 Index, ended the year at an all-time high and was 18% above the prior high set on October 9, 2007. Although no one can predict how the stock market will perform in 2014, we believe there are encouraging signs that the U.S. economy could continue to improve. Also, over a longer time period, it seems likely that the U.S. manufacturing base will benefit from cheaper natural gas, reasonable electricity rates and stable unit labor rates relative to increasing unit labor rates in other regions of the world. This view is reflected in the Fund's overweight position in the industrials sector.
Risks include stock market fluctuations due to economic and business developments. The Fund also has potentially greater price volatility due to the Fund's concentration in a limited number of stocks of mid-size companies. International investing involves special risks, including foreign taxation, currency risks, risks associated with possible differences in financial standards, operational and settlement risks and other risks associated with future political and economic developments. Please also see "A Comment on Trading Volumes" on the table of contents page of this report.
Fund holdings are as of the date given, are subject to change at any time and are not recommendations to buy or sell any security. Top holdings exclude short-term holdings and cash, if applicable.
Fund's Positions in Mentioned Holdings
As a percentage of net assets, as of 12/31/13
Hertz | 5.2 | % | |||||
CNO Financial Group | 4.4 | ||||||
WNS | 4.0 | ||||||
SBA Communications | 3.4 | ||||||
Canacol | 2.5 | ||||||
Post Properties | 2.2 | ||||||
Casey's General Stores | 1.6 | ||||||
Extra Space Storage | 1.1 | ||||||
Informatica | 1.1 | ||||||
Rowan | 1.0 | ||||||
Antero Resources | 0.3 | ||||||
Petrodorado Energy | 0.1 | ||||||
4
Wanger Select 2013 Annual Report

Growth of a $10,000 Investment in Wanger Select
February 1, 1999 (inception date) through December 31, 2013
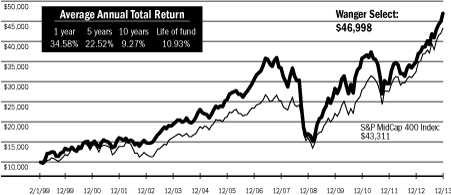
Performance data shown represents past performance and is not a guarantee of future results. The investment return and principal value will fluctuate so that shares, when redeemed, may be worth more or less than the original cost. Current performance may be lower or higher than the performance data shown. Performance results reflect any fee waivers or reimbursements of Fund expenses by the investment manager and/or any of its affiliates. Absent these fee waivers and/or expense reimbursement arrangements, performance results would have been lower. For most recent month-end performance updates, please visit columbiamanagement.com.
This graph compares the results of $10,000 invested in Wanger Select on February 1, 1999 (the date the Fund began operations) through December 31, 2013, to the S&P MidCap 400 Index, with dividends and capital gains reinvested. Although the index is provided for use in assessing the Fund's performance, the Fund's holdings may differ significantly from those in the index.
Top 10 Holdings
As a percentage of net assets, as of 12/31/13
| 1. Ametek Aerospace/Industrial Instruments | 6.5 | % | |||||
| 2. Hertz Largest U.S. Rental Car Operator | 5.2 | ||||||
| 3. CNO Financial Group Life, Long-term Care & Medical Supplement Insurance | 4.4 | ||||||
| 4. Discover Financial Services Credit Card Company | 4.2 | ||||||
| 5. Donaldson Industrial Air Filtration | 4.2 | ||||||
| 6. Amphenol Electronic Conductors | 4.0 | ||||||
| 7. WNS - ADR (India) Offshore Business Process Outsourcing Services | 4.0 | ||||||
| 8. SBA Communications Communications Towers | 3.4 | ||||||
| 9. City National Bank & Asset Manager | 3.2 | ||||||
| 10. Kennametal Consumable Cutting Tools | 3.1 | ||||||
Top 5 Industries
As a percentage of net assets, as of 12/31/13
Industrial Goods & Services | 25.9 | % | |||||
Information | 22.1 | ||||||
Consumer Goods & Services | 16.7 | ||||||
Finance | 16.3 | ||||||
Energy & Minerals | 7.4 | ||||||
Results as of December 31, 2013
4th quarter* | 1 year | 5 years | 10 years | ||||||||||||||||
Wanger Select | 9.70 | % | 34.58 | % | 22.52 | % | 9.27 | % | |||||||||||
S&P MidCap 400 Index** | 8.33 | 33.50 | 21.89 | 10.36 | |||||||||||||||
S&P 500 Index | 10.51 | 32.39 | 17.94 | 7.41 | |||||||||||||||
| Lipper Variable Underlying Mid-Cap Core Funds Index | 8.61 | 33.83 | 20.10 | 9.20 | |||||||||||||||
*Not annualized.
**The Fund's primary benchmark.
NAV as of 12/31/13: $36.41
Performance numbers reflect all Fund expenses but do not include any fees and expenses imposed under your variable annuity or life insurance policy or qualified pension or retirement plan. If performance included the effect of these additional charges, it would be lower.
The Fund's annual operating expense ratio of 0.91% is stated as of the Fund's prospectus dated May 1, 2013, and differences in expense ratios disclosed elsewhere in this report may result from including fee waivers and expense reimbursements as well as different time periods used in calculating the ratios.
All results shown assume reinvestment of distributions.
The S&P MidCap 400 Index is a market value-weighted index that tracks the performance of 400 mid-cap U.S. companies. The S&P 500 Index tracks the performance of 500 widely-held large capitalization U.S. stocks. Although the Fund typically invests in companies with market caps under $20 billion at the time of investment, the comparison to the S&P 500 Index is presented to show performance against a widely recognized market index. The Lipper Variable Underlying Mid-Cap Core Funds Index is an equally weighted representation of the 30 largest variable insurance underlying funds in the Lipper Variable Underlying Mid-Cap Core Funds Classification, and shows how the Fund's performance compares with returns of an index of funds with similar investment objectives. Indexes are not managed and do not incur fees or expenses. It is not possible to invest directly in an index.
Lipper Inc., a widely respected data provider in the industry, calculates an average total return (assuming reinvestment of distributions) for mutual funds with investment objectives similar to those of the Fund.
Portfolio characteristics and holdings are subject to change periodically and may not be representative of current characteristics and holdings.
5
Wanger Select 2013 Annual Report
Wanger Select
Statement of Investments, December 31, 2013
| Number of Shares | Value | ||||||||||
Equities – 97.8% | |||||||||||
Industrial Goods & Services – 25.9% | |||||||||||
Machinery – 19.2% | |||||||||||
| 316,000 | Ametek Aerospace/Industrial Instruments | $ | 16,643,720 | ||||||||
| 248,000 | Donaldson Industrial Air Filtration | 10,778,080 | |||||||||
| 155,000 | Kennametal Consumable Cutting Tools | 8,070,850 | |||||||||
| 90,000 | Pall Life Science, Water & Industrial Filtration | 7,681,500 | |||||||||
| 84,000 | Nordson Dispensing Systems for Adhesives & Coatings | 6,241,200 | |||||||||
49,415,350 | |||||||||||
Outsourcing Services – 2.7% | |||||||||||
| 221,000 | Quanta Services (a) Electrical & Telecom Construction Services | 6,974,760 | |||||||||
Industrial Materials & Specialty Chemicals – 2.1% | |||||||||||
| 70,000 | FMC Corporation Niche Specialty Chemicals | 5,282,200 | |||||||||
Industrial Distribution – 1.4% | |||||||||||
| 33,000 | Airgas Industrial Gas Distributor | 3,691,050 | |||||||||
Other Industrial Services – 0.5% | |||||||||||
| 30,000 | Forward Air Freight Transportation Between Airports | 1,317,300 | |||||||||
Total Industrial Goods & Services | 66,680,660 | ||||||||||
Information – 22.1% | |||||||||||
Instrumentation – 4.7% | |||||||||||
| 30,000 | Mettler-Toledo International (a) Laboratory Equipment | 7,277,700 | |||||||||
| 140,000 | Trimble Navigation (a) GPS-based Instruments | 4,858,000 | |||||||||
12,135,700 | |||||||||||
Computer Hardware & Related Equipment – 4.0% | |||||||||||
| 117,000 | Amphenol Electronic Connectors | 10,434,060 | |||||||||
Computer Services – 4.0% | |||||||||||
| 465,000 | WNS—ADR (India) (a) Offshore Business Process Outsourcing Services | 10,188,150 | |||||||||
| Number of Shares | Value | ||||||||||
Mobile Communications – 3.5% | |||||||||||
| 99,000 | SBA Communications (a) Communications Towers | $ | 8,894,160 | ||||||||
Business Software – 2.7% | |||||||||||
| 46,000 | Ansys (a) Simulation Software for Engineers & Designers | 4,011,200 | |||||||||
| 70,000 | Informatica (a) Enterprise Data Integration Software | 2,905,000 | |||||||||
6,916,200 | |||||||||||
Telecommunications Equipment – 2.0% | |||||||||||
| 57,000 | F5 Networks (a) Internet Traffic Management Equipment | 5,179,020 | |||||||||
Contract Manufacturing – 0.8% | |||||||||||
| 130,000 | Sanmina-SCI (a) Electronic Manufacturing Services | 2,171,000 | |||||||||
Semiconductors & Related Equipment – 0.4% | |||||||||||
| 130,000 | Atmel (a) Microcontrollers, Radio Frequency & Memory Semiconductors | 1,017,900 | |||||||||
Total Information | 56,936,190 | ||||||||||
Consumer Goods & Services – 16.7% | |||||||||||
Travel – 8.3% | |||||||||||
| 465,000 | Hertz (a) Largest U.S. Rental Car Operator | 13,308,300 | |||||||||
| 68,000 | Vail Resorts Ski Resort Operator & Developer | 5,115,640 | |||||||||
| 60,000 | Choice Hotels (b) Franchisor of Budget Hotel Brands | 2,946,600 | |||||||||
21,370,540 | |||||||||||
Retail – 3.8% | |||||||||||
| 57,000 | Casey's General Stores Owner/Operator of Convenience Stores | 4,004,250 | |||||||||
| 34,000 | ULTA (a) Specialty Beauty Product Retailer | 3,281,680 | |||||||||
| 66,000 | Best Buy Consumer Electronic Specialty Retailer | 2,632,080 | |||||||||
9,918,010 | |||||||||||
See accompanying notes to financial statements.
6
Wanger Select 2013 Annual Report
Wanger Select
Statement of Investments, December 31, 2013
| Number of Shares | Value | ||||||||||
Other Consumer Services – 2.6% | |||||||||||
| 70,000 | Lifetime Fitness (a) Sport & Fitness Club Operator | $ | 3,290,000 | ||||||||
| 125,000 | Blackhawk Network (a) (b) Third Party Distributer of Prepaid Content, Mostly Gift Cards | 3,157,500 | |||||||||
| 190,141 | IFM Investments (Century 21 China RE) – ADR (China) (a) Real Estate Services in China | 389,789 | |||||||||
6,837,289 | |||||||||||
Apparel – 1.4% | |||||||||||
| 26,000 | PVH Apparel Wholesaler & Retailer | 3,536,520 | |||||||||
Educational Services – 0.5% | |||||||||||
| 36,000 | ITT Educational Services (a) (b) Post-secondary Degree Services | 1,208,880 | |||||||||
Food & Beverage – 0.1% | |||||||||||
| 307,000 | GLG Life Tech (Canada) (a) Producer of an All-natural Sweetener Extracted from the Stevia Plant | 144,505 | |||||||||
Total Consumer Goods & Services | 43,015,744 | ||||||||||
Finance – 16.3% | |||||||||||
Banks – 5.0% | |||||||||||
| 105,000 | City National Bank & Asset Manager | 8,318,100 | |||||||||
| 260,000 | Associated Banc-Corp Midwest Bank | 4,524,000 | |||||||||
12,842,100 | |||||||||||
Insurance – 4.4% | |||||||||||
| 640,000 | CNO Financial Group Life, Long-term Care & Medical Supplement Insurance | 11,321,600 | |||||||||
Credit Cards – 4.2% | |||||||||||
| 194,000 | Discover Financial Services Credit Card Company | 10,854,300 | |||||||||
| Number of Shares | Value | ||||||||||
Brokerage & Money Management – 2.7% | |||||||||||
| 205,000 | SEI Investments Mutual Fund Administration & Investment Management | $ | 7,119,650 | ||||||||
Total Finance | 42,137,650 | ||||||||||
Energy & Minerals – 7.4% | |||||||||||
Oil & Gas Producers – 5.2% | |||||||||||
| 967,259 | Canacol (Colombia) (a) Oil Producer in South America | 6,492,404 | |||||||||
| 6,150,000 | Shamaran Petroleum (Iraq) (a) Oil Exploration & Production in Kurdistan | 2,663,215 | |||||||||
| 114,000 | Pacific Rubiales Energy (Colombia) Oil Production & Exploration in Colombia | 1,968,237 | |||||||||
| 3,600,000 | Canadian Overseas Petroleum (United Kingdom) (a) (c) | 853,189 | |||||||||
| 184,000 | Canadian Overseas Petroleum (United Kingdom) (a) Oil & Gas Exploration/Production in the North Sea | 45,903 | |||||||||
| 11,700 | Antero Resources (a) (b) Oil & Gas Exploration & Production in Utica & Marcellus Shale | 742,248 | |||||||||
| 2,575,000 | Petromanas (Canada) (a) Exploring for Oil in Albania | 387,856 | |||||||||
| 8,713,999 | Petrodorado Energy (Colombia) (a) Oil & Gas Exploration & Production in Colombia, Peru & Paraguay | 287,117 | |||||||||
13,440,169 | |||||||||||
Agricultural Commodities – 1.1% | |||||||||||
| 261,363 | Union Agriculture Group (Uruguay) (a) (c) (d) Farmland Operator in Uruguay | 2,793,970 | |||||||||
Oil Services – 1.0% | |||||||||||
| 75,000 | Rowan (a) Contract Offshore Driller | 2,652,000 | |||||||||
See accompanying notes to financial statements.
7
Wanger Select 2013 Annual Report
Wanger Select
Statement of Investments, December 31, 2013
| Number of Shares | Value | ||||||||||
Alternative Energy – 0.1% | |||||||||||
| 535,000 | Synthesis Energy Systems (China) (a) Owner/Operator of Gasification Plants | $ | 321,000 | ||||||||
Total Energy & Minerals | 19,207,139 | ||||||||||
Health Care – 6.1% | |||||||||||
Medical Supplies – 4.5% | |||||||||||
| 136,000 | Cepheid (a) Molecular Diagnostics | 6,353,920 | |||||||||
| 46,000 | Henry Schein (a) Largest Distributor of Healthcare Products | 5,255,960 | |||||||||
11,609,880 | |||||||||||
Biotechnology & Drug Delivery – 1.6% | |||||||||||
| 106,000 | Seattle Genetics (a) Antibody-based Therapies for Cancer | 4,228,340 | |||||||||
Total Health Care | 15,838,220 | ||||||||||
Other Industries – 3.3% | |||||||||||
Real Estate – 3.3% | |||||||||||
| 125,000 | Post Properties Multifamily Properties | 5,653,750 | |||||||||
| 70,000 | Extra Space Storage Self Storage Facilities | 2,949,100 | |||||||||
8,602,850 | |||||||||||
Total Other Industries | 8,602,850 | ||||||||||
| Total Equities (Cost: $151,857,058) – 97.8% | 252,418,453 | (e) | |||||||||
Short-Term Investments – 2.2% | |||||||||||
| 5,650,125 | JPMorgan U.S. Government Money Market Fund, IM Shares (7 day yield of 0.01%) | 5,650,125 | |||||||||
| Total Short-Term Investments (Cost: $5,650,125) – 2.2% | 5,650,125 | ||||||||||
| Number of Shares | Value | ||||||||||
Securities Lending Collateral – 1.2% | |||||||||||
| 2,992,925 | Dreyfus Government Cash Management Fund, Institutional Shares (7 day yield of 0.01%) (f) | $ | 2,992,925 | ||||||||
| Total Securities Lending Collateral (Cost: $2,992,925) | 2,992,925 | ||||||||||
| Total Investments (Cost: $160,500,108)(g) – 101.2% | 261,061,503 | ||||||||||
| Obligation to Return Collateral for Securities Loaned – (1.2)% | (2,992,925 | ) | |||||||||
Cash and Other Assets Less Liabilities – (–)% (h) | (157,973 | ) | |||||||||
Net Assets – 100.0% | $ | 257,910,605 | |||||||||
ADR = American Depositary Receipts
Notes to Statement of Investments
(a) Non-income producing security.
(b) All or a portion of this security was on loan at December 31, 2013. The total market value of securities on loan at December 31, 2013 was $2,949,729.
(c) Denotes a restricted security, which is subject to restrictions on resale under federal securities laws. These securities are valued at fair value determined in good faith under consistently applied procedures established by the Board of Trustees. At December 31, 2013, the market value of these securities amounted to $3,647,159, which represented 1.41% of total net assets. Additional information on these securities is as follows:
Security | Acquisition Dates | Shares | Cost | Value | |||||||||||||||
| Union Agriculture Group 12/8/10- | 6/27/12 | 261,363 | $ | 2,999,999 | $ | 2,793,970 | |||||||||||||
| Canadian Overseas Petroleum | 11/24/10 | 3,600,000 | 1,539,065 | 853,189 | |||||||||||||||
| $4,539,064 | $3,647,159 | ||||||||||||||||||
(d) Illiquid security.
See accompanying notes to financial statements.
8
Wanger Select 2013 Annual Report
Wanger Select
Statement of Investments, December 31, 2013
(e) On December 31, 2013, the market value of foreign securities represented 10.29% of total net assets. The Fund's foreign portfolio was diversified as follows:
Country | Value | Percentage of Net Assets | |||||||||
India | $ | 10,188,150 | 3.95 | ||||||||
Colombia | 8,747,758 | 3.39 | |||||||||
Uruguay | 2,793,970 | 1.08 | |||||||||
Iraq | 2,663,215 | 1.03 | |||||||||
United Kingdom | 899,092 | 0.35 | |||||||||
China | 710,789 | 0.28 | |||||||||
Canada | 532,361 | 0.21 | |||||||||
Total Foreign Portfolio | $ | 26,535,335 | 10.29 | ||||||||
(f) Investment made with cash collateral received from securities lending activity.
(g) At December 31, 2013, for federal income tax purposes, the cost of investments was $161,069,775 and net unrealized appreciation was $99,991,728 consisting of gross unrealized appreciation of $108,505,465 and gross unrealized depreciation of $8,513,737.
(h) Rounds to less than 0.1%.
Fair Value Measurements
Various inputs are used in determining the value of the Fund's investments, following the input prioritization hierarchy established by accounting principles generally accepted in the United States of America (GAAP). These inputs are summarized in the three broad levels listed below:
• Level 1 – quoted prices in active markets for identical securities
• Level 2 – prices determined using other significant observable inputs (including quoted prices for similar securities, interest rates, prepayment speeds, credit risk and others)
• Level 3 – prices determined using significant unobservable inputs where quoted prices or observable inputs are unavailable or less reliable (including management's own assumptions about the factors market participants would use in pricing an investment)
The inputs or methodology used for valuing securities are not necessarily an indication of the risk associated with investing in those securities.
Examples of the types of securities in which the Fund would typically invest and how they are classified within this hierarchy are as follows. Typical Level 1 securities include exchange traded domestic equities, mutual funds whose NAVs are published each day and exchange traded foreign equities that are not statistically fair valued. Typical Level 2 securities include exchange traded foreign equities that are statistically fair valued, forward foreign currency exchange contracts and short-term investments valued at amortized cost. Additionally, securities fair valued by the Valuation Committee (the Committee) of the Fund's Board of Trustees (the Board) that rely on significant observable inputs are also included in Level 2. Typical Level 3 securities include any security fair valued by the Committee that relies on significant unobservable inputs.
Under the direction of the Board, the Committee is responsible for overseeing the valuation procedures approved by the Board.
The Committee meets as necessary, and no less frequently than quarterly, to determine fair values for securities for which market quotations are not readily available or for which the investment manager believes that available market quotations are unreliable, to review the appropriateness of the Trust's Portfolio Pricing Policy and the pricing procedures of the investment manager (the Policies), and to review the continuing appropriateness of the current value of any security subject to the Policies.
The Policies address, among other things: circumstances under which market quotations will be deemed readily available; selection of third party pricing vendors; appropriate pricing methodologies; events that require fair valuation and fair value techniques; circumstances under which securities will be deemed to pose a potential for stale pricing, including when securities are illiquid, restricted, or in default; and certain delegations of authority to determine fair values to the Fund's investment manager. The Committee may also meet to discuss additional valuation matters, which may include review of back-testing results, review of time-sensitive information or approval of other valuation related actions, and to review the appropriateness of the Policies.
For investments categorized as Level 3, the significant unobservable inputs used in the fair value measurement of the Funds' securities may include: (i) data specific to the issuer or comparable issuers, (ii) general market or specific sector news and (iii) quoted prices and specific or similar security transactions. The Committee considers this data and any changes from prior periods in order to assess the reasonableness of observable and unobservable inputs, any assumptions or internal models used to value those securities and changes in fair value. Significant changes in any of these factors could result in lower or higher fair value measurements. Various factors impact the frequency of monitoring (which may occur as often as daily), however the Committee may determine that changes to inputs, assumptions and models are not required with the same frequency.
The following table summarizes the inputs used, as of December 31, 2013, in valuing the Fund's assets:
Investment Type | Quoted Prices (Level 1) | Other Significant Observable Inputs (Level 2) | Significant Unobservable Inputs (Level 3) | Total | |||||||||||||||
Equities | |||||||||||||||||||
| Industrial Goods & Services | $ | 66,680,660 | $ | — | $ | — | $ | 66,680,660 | |||||||||||
Information | 56,936,190 | — | — | 56,936,190 | |||||||||||||||
| Consumer Goods & Services | 43,015,744 | — | — | 43,015,744 | |||||||||||||||
Finance | 42,137,650 | — | — | 42,137,650 | |||||||||||||||
Energy & Minerals | 15,559,980 | 853,189 | 2,793,970 | 19,207,139 | |||||||||||||||
Health Care | 15,838,220 | — | — | 15,838,220 | |||||||||||||||
Other Industries | 8,602,850 | — | — | 8,602,850 | |||||||||||||||
Total Equities | 248,771,294 | 853,189 | 2,793,970 | 252,418,453 | |||||||||||||||
| Total Short-Term Investments | 5,650,125 | — | — | 5,650,125 | |||||||||||||||
| Total Securities Lending Collateral | 2,992,925 | — | — | 2,992,925 | |||||||||||||||
Total Investments | $ | 257,414,344 | $ | 853,189 | $ | 2,793,970 | $ | 261,061,503 | |||||||||||
The Fund's assets assigned to the Level 2 input category are generally valued using a market approach, in which a security's value is determined through its correlation to prices and information from observable market transactions for similar or identical assets. Securities acquired via private placement that have a holding period or an extended settlement period are valued at a discount to the same shares that are trading freely on the market. These discounts are determined by the investment manager's experience with similar securities or situations. Factors may include, but are not limited to, trade volume, shares outstanding and stock price.
The following table shows transfers between Level 1 and Level 2 of the fair value hierarchy:
Transfers In | Transfers Out | ||||||||||||||
| Level 1 | Level 2 | Level 1 | Level 2 | ||||||||||||
| $ | 80,127 | $ | — | $ | — | $ | 80,127 | ||||||||
Financial assets were transferred from Level 2 to Level 1 as trading resumed during the period.
See accompanying notes to financial statements.
9
Wanger Select 2013 Annual Report
Wanger Select
Statement of Investments, December 31, 2013
The following table reconciles asset balances for the period ending December 31, 2013, in which significant observable and/or unobservable inputs (Level 3) were used in determining value:
| Investments in Securities | Balance as of December 31, 2012 | Realized Gain/(Loss) | Change in Unrealized Appreciation (Depreciation) | Purchases | Sales | Transfers into Level 3 | Transfers out of Level 3 | Balance as of December 31, 2013 | |||||||||||||||||||||||||||
Equities | |||||||||||||||||||||||||||||||||||
Energy & Materials | $ | 2,676,357 | $ | — | $ | 117,613 | $ | — | $ | — | $ | — | $ | — | $ | 2,793,970 | |||||||||||||||||||
$ | 2,676,357 | $ | — | $ | 117,613 | $ | — | $ | — | $ | — | $ | — | $ | 2,793,970 | ||||||||||||||||||||
The information in the above reconciliation table represents fiscal year to date activity for any securities identified as using Level 3 inputs at either the beginning or the end of the current fiscal period.
The change in unrealized appreciation attributed to securities owned at December 31, 2013, which were valued using significant unobservable inputs (Level 3), amounted to $117,613.
Quantitative information pertaining to Level 3 unobservable fair value measurements
| Fair Value at December 31, 2013 | Valuation Technique(s) | Unobservable Input(s) | Range | ||||||||||||||||
Energy & Minerals | $ | 2,793,970 | Market comparable companies | Discount for lack of marketability | 8 | % to 10% | |||||||||||||
Certain common stock classified as Level 3 are valued at fair value, using a market approach, as determined in good faith under consistently applied procedures established by and under the general supervision of the Board. To determine fair value for these securities, for which no market exists, the Committee utilizes the valuation technique it deems most appropriate in the circumstances, using some unobservable inputs, which may include, but are not limited to, estimated earnings of the company, and the position of the security within the company's capital structure. The Committee also may use some observable inputs, which may include, but are not limited to, trades of similar securities and market multiples derived from a set of comparable companies. Significant increases or decreases to any of these inputs could result in a significantly lower or higher fair value measurement.
See accompanying notes to financial statements.
10
Wanger Select 2013 Annual Report
Statement of Assets and Liabilities
December 31, 2013
Assets: | |||||||
Investments, at cost | $ | 160,500,108 | |||||
| Investments, at value (including securities on loan of $2,949,729) | $ | 261,061,503 | |||||
Receivable for: | |||||||
Investments sold | 14,960 | ||||||
Fund shares sold | 1,926 | ||||||
Securities lending income | 3,348 | ||||||
Dividends | 159,530 | ||||||
Prepaid expenses | 4,695 | ||||||
Total Assets | 261,245,962 | ||||||
Liabilities: | |||||||
Collateral on securities loaned | 2,992,925 | ||||||
Payable for: | |||||||
Fund shares redeemed | 244,913 | ||||||
Investment advisory fee | 5,614 | ||||||
Administration fee | 351 | ||||||
Transfer agent fee | 1 | ||||||
Trustees' fees | 34,575 | ||||||
Custody fee | 4,322 | ||||||
Reports to shareholders | 26,863 | ||||||
Chief compliance officer expenses | 571 | ||||||
Other liabilities | 25,222 | ||||||
Total Liabilities | 3,335,357 | ||||||
Net Assets | $ | 257,910,605 | |||||
Composition of Net Assets: | |||||||
Paid-in capital | $ | 131,576,886 | |||||
Overdistributed net investment income | (68,314 | ) | |||||
Accumulated net realized gain | 25,840,638 | ||||||
Net unrealized appreciation (depreciation) on: | |||||||
Investments | 100,561,395 | ||||||
Net Assets | $ | 257,910,605 | |||||
Fund Shares Outstanding | 7,082,905 | ||||||
| Net asset value, offering price and redemption price per share | $ | 36.41 | |||||
Statement of Operations
For the Year Ended December 31, 2013
Investment Income: | |||||||
Dividends (net foreign taxes withheld of $13,151) | $ | 1,854,152 | |||||
Income from securities lending – net | 65,263 | ||||||
Total Investment Income | 1,919,415 | ||||||
Expenses: | |||||||
Investment advisory fee | 1,977,019 | ||||||
Transfer agent fees | 231 | ||||||
Administration fee | 123,564 | ||||||
Trustees' fees | 14,971 | ||||||
Custody fees | 14,282 | ||||||
Reports to shareholders | 70,240 | ||||||
Audit fees | 30,921 | ||||||
Legal fees | 23,065 | ||||||
Chief compliance officer expenses | 7,187 | ||||||
Commitment fee for line of credit (Note 5) | 1,486 | ||||||
Other expenses | 24,674 | ||||||
Total Expenses | 2,287,640 | ||||||
Net Investment Loss | (368,225 | ) | |||||
| Net Realized and Unrealized Gain (Loss) on Investments: | |||||||
Net realized gain (loss) on: | |||||||
Investments | 28,096,712 | ||||||
Foreign currency translations | (1,321 | ) | |||||
Net realized gain | 28,095,391 | ||||||
| Net change in unrealized appreciation (depreciation) on: | |||||||
Investments | 45,647,821 | ||||||
Net change in unrealized appreciation | 45,647,821 | ||||||
Net realized and unrealized gain | 73,743,212 | ||||||
Net Increase in Net Assets from Operations | $ | 73,374,987 | |||||
See accompanying notes to financial statements.
11
Wanger Select 2013 Annual Report
Statements of Changes in Net Assets
Year Ended December 31, | |||||||||||
Increase (Decrease) in Net Assets | 2013 | 2012 | |||||||||
Operations: | |||||||||||
Net investment income (loss) | $ | (368,225 | ) | $ | 1,520,674 | ||||||
Net realized gain (loss) on: | |||||||||||
Investments | 28,096,712 | 10,731,550 | |||||||||
Foreign currency translations | (1,321 | ) | (1,405 | ) | |||||||
Net change in unrealized appreciation (depreciation) on: | |||||||||||
Investments | 45,647,821 | 29,770,532 | |||||||||
Net Increase in Net Assets from Operations | 73,374,987 | 42,021,351 | |||||||||
Distributions to Shareholders From: | |||||||||||
Net investment income | (705,314 | ) | (1,022,230 | ) | |||||||
Net realized gains | (3,568,085 | ) | — | ||||||||
Total Distributions to Shareholders | (4,273,399 | ) | (1,022,230 | ) | |||||||
Share Transactions: | |||||||||||
Subscriptions | 6,139,599 | 7,127,843 | |||||||||
Distributions reinvested | 4,273,399 | 1,022,230 | |||||||||
Redemptions | (56,758,691 | ) | (56,537,891 | ) | |||||||
Net Decrease from Share Transactions | (46,345,693 | ) | (48,387,818 | ) | |||||||
Total Increase (Decrease) in Net Assets | 22,755,895 | (7,388,697 | ) | ||||||||
Net Assets: | |||||||||||
Beginning of period | 235,154,710 | 242,543,407 | |||||||||
End of period | $ | 257,910,605 | $ | 235,154,710 | |||||||
Undistributed (Overdistributed) net investment income | $ | (68,314 | ) | $ | 463,508 | ||||||
See accompanying notes to financial statements.
12
Wanger Select 2013 Annual Report
Financial Highlights
The following table is intended to help you understand the Fund's financial performance. Certain information reflects financial results for a single share held for the periods shown. Per share net investment income (loss) amounts are calculated based on average shares outstanding during the period. Total return assumes reinvestment of all dividends and distributions, if any. Total return does not reflect payment of the expenses that apply to the variable accounts or contract charges, if any. Total return and portfolio turnover are not annualized for periods of less than one year.
Year Ended December 31, | |||||||||||||||||||||||
Selected data for a share outstanding throughout each period | 2013 | 2012 | 2011 | 2010 | 2009 | ||||||||||||||||||
Net Asset Value, Beginning of Period | $ | 27.54 | $ | 23.35 | $ | 28.99 | $ | 23.05 | $ | 13.87 | |||||||||||||
Income from Investment Operations: | |||||||||||||||||||||||
Net investment income (loss) | (0.05 | ) | 0.16 | (0.06 | ) | (0.09 | ) | (0.08 | ) | ||||||||||||||
Net realized and unrealized gain (loss) | 9.46 | 4.15 | (4.99 | ) | 6.17 | 9.26 | |||||||||||||||||
Total from Investment Operations | 9.41 | 4.31 | (5.05 | ) | 6.08 | 9.18 | |||||||||||||||||
Less Distributions to Shareholders: | |||||||||||||||||||||||
Net investment income | (0.09 | ) | (0.12 | ) | (0.59 | ) | (0.14 | ) | — | ||||||||||||||
Net realized gains | (0.45 | ) | — | — | — | — | |||||||||||||||||
Total Distributions to Shareholders | (0.54 | ) | (0.12 | ) | (0.59 | ) | (0.14 | ) | — | ||||||||||||||
Net Asset Value, End of Period | $ | 36.41 | $ | 27.54 | $ | 23.35 | $ | 28.99 | $ | 23.05 | |||||||||||||
Total Return | 34.58 | % | 18.46 | % | (17.68 | )% | 26.57 | % | 66.19 | % | |||||||||||||
Ratios to Average Net Assets/Supplemental Data: | |||||||||||||||||||||||
Total gross expenses (a) | 0.93 | % | 0.92 | % | 0.93 | % | 0.93 | % | 0.95 | % | |||||||||||||
Total net expenses (a) | 0.93 | % | 0.91 | %(b) | 0.93 | %(b) | 0.93 | %(b) | 0.95 | %(b) | |||||||||||||
Net investment income (loss) | (0.15 | )% | 0.60 | % | (0.24 | )% | (0.38 | )% | (0.44 | )% | |||||||||||||
Portfolio turnover rate | 24 | % | 20 | % | 23 | % | 30 | % | 35 | % | |||||||||||||
Net assets, end of period (000s) | $ | 257,911 | $ | 235,155 | $ | 242,543 | $ | 345,960 | $ | 270,368 | |||||||||||||
Notes to Financial Highlights
(a) In addition to the fees and expenses which the Fund bears directly, the Fund indirectly bears a pro rata share of the fees and expenses of the acquired funds in which it invests, if any. Such indirect expenses are not included in the reported expense ratios.
(b) The benefits derived from custody fees paid indirectly had an impact of less than 0.01%.
See accompanying notes to financial statements.
13
Wanger Select 2013 Annual Report
Notes to Financial Statements
1. Nature of Operations
Wanger Select (the Fund), a series of Wanger Advisors Trust (the Trust), is registered under the Investment Company Act of 1940, as amended (the 1940 Act), as an open-end management investment company organized as a Massachusetts business trust. The investment objective of the Fund is to seek long-term capital appreciation. The Fund is available only for allocation to certain life insurance company separate accounts established for the purpose of funding participating variable annuity contracts and variable life insurance policies and may also be offered directly to certain qualified pension and retirement plans.
2. Significant Accounting Policies
The preparation of financial statements in accordance with accounting principles generally accepted in the United States of America (GAAP) requires management to make certain estimates and assumptions that affect the reported amounts of assets and liabilities, the disclosure of contingent assets and liabilities at the date of the financial statements and the reported amounts of revenue and expenses during the reporting period. Actual results could differ from those estimates.
Security valuation
Securities of the Fund are valued at market value or, if a market quotation for a security is not readily available or is deemed not to be reliable because of events or circumstances that have occurred between the market quotation and the time as of which the security is to be valued, the security is valued at its fair value determined in good faith under consistently applied procedures established by the Board of Trustees (the Board). A security traded on a securities exchange or in an over-the-counter market in which transaction prices are reported is valued at the last sales price at the time of valuation. A security traded principally on NASDAQ is valued at the NASDAQ official closing price. Mutual funds and exchange traded funds are valued at their closing net asset value as reported to the applicable exchange. A security for which there is no reported sale on the valuation date is valued at the mean of the latest bid and ask quotations.
Short-term investments maturing in 60 days or less are valued at amortized cost, which approximates market value.
A security for which a market quotation is not readily available and any other assets are valued at their fair value determined in good faith under consistently applied procedures established by the Board. The Trust has retained an independent statistical fair value pricing service that employs a systematic methodology to assist in the fair valuation process for securities principally traded in a foreign market in order to adjust for possible changes in value that may occur between the close of the foreign market and the time as of which the securities are to be valued. If a security is valued at a fair value, that value may be different from the last quoted market price for the security.
Foreign currency translations
Values of investments denominated in foreign currencies are converted into U.S. dollars using the New York spot market rate of exchange at the time of valuation. Purchases and sales of investments and dividend and interest income are translated into U.S. dollars using the spot market rate of exchange prevailing on the respective dates of such transactions. The gain or loss resulting from changes in foreign exchange rates is included with net realized and unrealized gain or loss from investments, as appropriate.
Restricted securities
Restricted securities are securities that may only be resold upon registration under federal securities laws or in transactions exempt from registration. In some cases, the issuer of restricted securities has agreed to register such securities for resale at the issuer's expense either upon demand by the Fund or in connection with another
registered offering of the securities. Many restricted securities may be resold in the secondary market in transactions exempt from registration. Such restricted securities may be determined to be liquid under criteria established by the Board.
Security transactions and investment income
Security transactions are accounted for on the trade date (date the order to buy or sell is executed) and dividend income is recorded on the ex-dividend date, except that certain dividends from foreign securities are recorded as soon as the information is available to the Fund. Interest income is recorded on the accrual basis and includes amortization of discounts on debt obligations when required for federal income tax purposes. Realized gains and losses from security transactions are recorded on an identified cost basis.
Awards, if any, from class action litigation related to securities owned may be recorded as a reduction of cost of those securities. If the applicable securities are no longer owned, the proceeds are recorded as realized gains.
The Fund estimates the tax character of distributions from real estate investment trusts (REITs). Distributions received in excess of income are recorded as a reduction of the cost of the related investments. If the applicable securities are no longer owned, any distributions received in excess of income are recorded as realized gains.
Expenses
General expenses of the Trust are allocated to the Fund and the other series of the Trust based upon relative net assets or other expense allocation methodologies determined by the nature of the expense. Expenses directly attributable to the Fund are charged to the Fund.
Fund share valuation
Fund shares are sold and redeemed on a continuing basis at net asset value. Net asset value per share is determined daily as of the close of trading on the New York Stock Exchange (the Exchange) on each day the Exchange is open for trading by dividing the total value of the Fund's investments and other assets, less liabilities, by the number of Fund shares outstanding.
Securities lending
The Fund may lend securities up to one-third of the value of its total assets to certain approved brokers, dealers and other financial institutions to earn additional income. The Fund retains the benefits of owning the securities, including receipt of dividends or interest generated by the security. The Fund also receives a fee for the loan. The Fund has the ability to recall the loans at any time and could do so in order to vote proxies or to sell the loaned securities. Each loan is collateralized by cash that exceeded the value of the securities on loan. The market value of the loaned securities is determined daily at the close of business of the Fund and any additional required collateral is delivered to each Fund on the next business day. The Fund has elected to invest the cash collateral in the Dreyfus Government Cash Management Fund and the income earned is paid to the Fund, net of any fees remitted to Goldman Sachs Agency Lending, the Fund's lending agent, and borrower rebates. The Fund's investment manager, Columbia Wanger Asset Management, LLC (CWAM), does not retain any fees earned by the lending program. Generally, in the event of borrower default, the Fund has the right to use the collateral to offset any losses incurred. In the event the Fund is delayed or prevented from exercising its right to dispose of the collateral, there may be a potential loss to the Fund. Some or all of these losses may be indemnified by the lending agent. The Fund bears the risk of loss with respect to the investment of collateral. The net lending income earned by the Fund as of December 31, 2013, is included in the Statement of Operations.
14
Wanger Select 2013 Annual Report
Notes to Financial Statements, continued
The following table presents the Fund's gross and net amount of assets available for offset under a securities lending agreement as well as the related collateral received by the Fund as of December 31, 2013:
| Gross Amounts of | Gross Amounts Offset in the | Net Amounts of Assets Presented in the | Gross Amounts Not Offset in the Statement of Assets and Liabilities | ||||||||||||||||||||||||||||
| Recognized Assets | Statement of Assets and Liabilities | Statement of Assets and Liabilities | Financial Instruments (a) | Cash Collateral Received | Securities Collateral Received | Net Amount (b) | |||||||||||||||||||||||||
Securities loaned | $ | 2,949,729 | $ | — | $ | 2,949,729 | $ | — | $ | 2,949,729 | $ | — | $ | — | |||||||||||||||||
(a) Represents the amount of assets that could be offset by liabilities with the same counterparty under master netting or similar agreements that management elects not to offset on the Statement of Assets and Liabilities.
(b) Represents the net amount due from counterparties in the event of default.
Federal income taxes
The Fund has complied with the provisions of the Internal Revenue Code available to regulated investment companies and, in the manner provided therein, distributes substantially all its taxable income, as well as any net realized gain on sales of investments and foreign currency transactions reportable for federal income tax purposes. Accordingly, the Fund paid no federal income taxes and no federal income tax provision was required.
Foreign capital gains taxes
Gains in certain countries may be subject to foreign taxes at the fund level. The Fund accrues for such foreign taxes on realized and unrealized gains at the appropriate rate for each jurisdiction. The amount, if any, is disclosed as a liability on the Statement of Assets and Liabilities.
Distributions to shareholders
Distributions to shareholders are recorded on the ex-dividend date.
Indemnification
In the normal course of business, the Trust on behalf of the Fund enters into contracts that contain a variety of representations and warranties and that provide general indemnities. The Fund's maximum exposure under these arrangements is unknown, as this would involve future claims against the Fund. Also under the Trust's organizational documents, the trustees and officers of the Trust are indemnified against certain liabilities that may arise out of their duties to the Trust. However based on experience, the Fund expects the risk of loss due to these warranties and indemnities to be remote.
3. Federal Tax Information
The timing and character of income and capital gain distributions are determined in accordance with income tax regulations, which may differ from GAAP. Reclassifications are made to the Fund's capital accounts for permanent tax differences to reflect income and gains available for distribution (or available capital loss carryforwards) under income tax regulations.
For the year ended December 31, 2013, permanent book and tax basis differences resulting primarily from foreign currency transactions, passive foreign investment company (PFIC) holdings, re-characterization of distributions for investments, distribution reclassifications and net operating loss reclassification were identified and reclassified among the components of the Fund's net assets as follows:
| Accumulated Net Investment Income | Accumulated Net Realized Gain (Loss) | Paid-In Capital | |||||||||
| $ | 541,717 | $ | 1,294,220 | $ | (1,835,937 | ) | |||||
Net investment income and net realized gains (losses), as disclosed on the Statement of Operations, and net assets were not affected by this reclassification.
The tax character of distributions paid during the years ended December 31, 2013 and December 31, 2012 were as follows:
December 31, 2013 | December 31, 2012 | ||||||||||
Ordinary Income* | $ | 693,525 | $ | 1,022,230 | |||||||
Long-Term Capital Gains | 3,579,874 | — | |||||||||
* For tax purposes short-term capital gain distributions, if any, are considered ordinary income distributions.
As of December 31, 2013, the components of distributable earnings on a tax basis were as follows:
| Undistributed Ordinary Income | Undistributed Long-Term Capital Gains | Net Unrealized Appreciation (Depreciation)* | |||||||||
| $ | — | $ | 27,152,198 | $ | 99,991,728 | ||||||
* The differences between book-basis and tax-basis net unrealized appreciation/depreciation are primarily due to deferral of losses from wash sales and passive foreign investment company (PFIC) adjustments.
Under current tax rules, regulated investment companies can elect to treat certain late-year ordinary losses incurred and post-October capital losses (capital losses realized after October 31) as arising on the first day of the following taxable year. As of December 31, 2013, the Fund will elect to treat late year ordinary losses of $4,025 and post-October capital losses of $771,973 as arising on January 1, 2014.
Management is required to determine whether a tax position of the Fund is more likely than not to be sustained upon examination by the applicable taxing authority, including resolution of any related appeals or litigation processes, based on the technical merits of the position. The tax benefit to be recognized by the Fund is measured as the largest amount of benefit that is greater than fifty percent likely of being realized upon ultimate settlement. Management is not aware of any tax positions for which it is reasonably possible that the total amounts of unrecognized tax benefits will significantly change in the next twelve months. Management has concluded that there are no significant uncertain tax positions that would require recognition in the financial statements. However, management's conclusions may be subject to review and adjustment at a later date based on factors including, but not limited to, new tax laws, regulations, and administrative interpretations (including relevant court decisions). The Fund's federal tax returns for the prior three fiscal years remain subject to examination by the Internal Revenue Service.
4. Transactions With Affiliates
CWAM is a wholly owned subsidiary of Columbia Management Investment Advisers, LLC (Columbia Management), which in turn is a wholly owned subsidiary of Ameriprise Financial, Inc. (Ameriprise Financial). CWAM furnishes continuing investment supervision to the Fund and is responsible for the overall management of the Fund's business affairs.
15
Wanger Select 2013 Annual Report
Notes to Financial Statements, continued
CWAM receives a monthly advisory fee based on the Fund's average daily net assets at the following annual rates:
Average Daily Net Assets | Annual Fee Rate | ||||||
Up to $500 million | 0.80 | % | |||||
| $500 million and over | 0.78 | % | |||||
For the year ended December 31, 2013, the effective investment advisory fee rate was 0.80% of the Fund's average daily net assets.
Through April 30, 2014, CWAM has contractually agreed to reimburse the Fund to the extent that ordinary operating expenses (exclusive of brokerage commissions, interest, taxes and extraordinary expenses, but inclusive of custodian charges relating to overdrafts, if any), after giving effect to any balance credits from the Fund's custodian, exceed the annual rate of 1.35% of average daily net assets on an annualized basis. For the year ended December 31, 2013, the Fund was not reimbursed any expenses by CWAM.
CWAM provides administrative services and receives an administration fee from the Fund at the following annual rates:
| Wanger Advisors Trust Aggregate Average Daily Net Assets of the Trust | Annual Fee Rate | ||||||
Up to $4 billion | 0.05 | % | |||||
$4 billion to $6 billion | 0.04 | % | |||||
$6 billion to $8 billion | 0.03 | % | |||||
| $8 billion and over | 0.02 | % | |||||
For the year ended December 31, 2013, the effective administration fee rate was 0.05% of the Fund's average daily net assets. Columbia Management provides certain sub-administrative services to the Fund.
Columbia Management Investment Distributors, Inc. (CMID), a wholly owned subsidiary of Ameriprise Financial, serves as the Fund's distributor and principal underwriter.
Columbia Management Investment Services Corp. (CMIS), a wholly owned subsidiary of Ameriprise Financial, is the transfer agent to the Fund. For its services, the Fund pays CMIS a monthly fee at the annual rate of $21.00 per open account. CMIS also receives reimbursement from the Fund for certain out-of-pocket expenses.
Certain officers and trustees of the Trust are also officers of CWAM. The Trust makes no direct payments to its officers and trustees who are affiliated with CWAM.
The Board has appointed a Chief Compliance Officer of the Trust in accordance with federal securities regulations. The Fund, along with other affiliated funds, pays its pro-rata share of the expenses associated with the Office of the Chief Compliance Officer.
The Trust offers a deferred compensation plan for its independent trustees. Under that plan, a trustee may elect to defer all or a portion of his or her compensation. Amounts deferred are retained by the Trust and may represent an unfunded obligation of the Trust. The value of amounts deferred is determined by reference to the change in value of Class Z shares of one or more series of Columbia Acorn Trust or a money market fund as specified by the trustee. Benefits under the deferred compensation plan are payable in accordance with the plan.
For the year ended December 31, 2013, the Fund engaged in purchase and sales transactions with funds that have a common investment manager (or affiliated investment managers), common directors/trustees, and/or common officers. Those purchase and sale transactions complied with provisions of Rule 17a-7 under the Investment Company Act of 1940 and totaled $360,128 and $1,965,370, respectively.
5. Borrowing Arrangements
During the year ended December 31, 2013, the Trust participated in a credit facility with JPMorgan Chase Bank, N.A., along with Columbia Acorn Trust, another trust managed by CWAM, in the amount of $150 million prior to January 11, 2013, $200
million for the period January 11, 2013 through July 21, 2013, and $150 million thereafter. The credit facility was entered into to facilitate portfolio liquidity. Under the facility, interest is charged to each participating fund based on its borrowings at a rate per annum equal to the Federal Funds Rate plus 1.00%. In addition, a commitment fee of 0.08% per annum of the unutilized line of credit is accrued and apportioned among the participating funds based on their relative net assets. The commitment fee is disclosed as a part of "Commitment fee for line of credit" in the Statement of Operations. The Trust expects to renew this line of credit for one year durations in July at then current market rates and terms.
No amounts were borrowed for the benefit of the Fund during the year ended December 31, 2013.
6. Fund Share Transactions
Proceeds and payments on Fund shares as shown in the Statement of Changes in Net Assets are in respect of the following numbers of shares:
| Year ended December 31, 2013 | Year ended December 31, 2012 | ||||||||||
Shares sold | 193,184 | 266,744 | |||||||||
| Shares issued in reinvestment of dividend distributions | 140,711 | 37,568 | |||||||||
Less shares redeemed | (1,790,102 | ) | (2,150,485 | ) | |||||||
| Net decrease in shares outstanding | (1,456,207 | ) | (1,846,173 | ) | |||||||
7. Investment Transactions
The aggregate cost of purchases and proceeds from sales other than short-term obligations for the year ended December 31, 2013, were $57,643,269 and $105,646,173, respectively.
8. Shareholder Concentration
At December 31, 2013, one unaffiliated shareholder account owned 82.6% of the outstanding shares of the Fund. The Fund has no knowledge about whether any portion of those shares was owned beneficially by such account. Subscription and redemption activity by concentrated accounts may have a significant effect on the operations of the Fund.
9. Subsequent Events
Management has evaluated the events and transactions that have occurred through the date the financial statements were issued and noted no items requiring adjustment of the financial statements or additional disclosure.
10. Information Regarding Pending and Settled Legal Proceedings
Ameriprise Financial and certain of its affiliates have historically been involved in a number of legal, arbitration and regulatory proceedings, including routine litigation, class actions, and governmental actions, concerning matters arising in connection with the conduct of their business activities. Ameriprise Financial believes that the Funds are not currently the subject of, and that neither Ameriprise Financial nor any of its affiliates are the subject of, any pending legal, arbitration or regulatory proceedings that are likely to have a material adverse effect on the Funds or the ability of Ameriprise Financial or its affiliates to perform under their contracts with the Funds. Ameriprise Financial is required to make 10-Q, 10-K and, as necessary, 8-K filings with the Securities and Exchange Commission on legal and regulatory matters that relate to Ameriprise Financial and its affiliates. Copies of these filings may be obtained by accessing the SEC website at www.sec.gov.
There can be no assurance that these matters, or the adverse publicity associated with them, will not result in increased fund redemptions, reduced sale of fund shares or other adverse consequences to the Funds. Further, although we believe proceedings are not likely to have a material adverse effect on the Funds or the ability of Ameriprise Financial or its affiliates to perform under their contracts with the Funds, these proceedings are subject to uncertainties and, as such, we are unable to
16
Wanger Select 2013 Annual Report
Notes to Financial Statements, continued
estimate the possible loss or range of loss that may result. An adverse outcome in one or more of these proceedings could result in adverse judgments, settlements, fines, penalties or other relief that could have a material adverse effect on the consolidated financial condition or results of operations of Ameriprise Financial.
17
Wanger Select 2013 Annual Report
Report of Independent Registered Public Accounting Firm
To the Board of Trustees and Shareholders of Wanger Select:
In our opinion, the accompanying statement of assets and liabilities, including the statement of investments, and the related statements of operations and of changes in net assets and the financial highlights present fairly, in all material respects, the financial position of Wanger Select (a series of the Wanger Advisors Trust, hereinafter referred to as the "Fund") at December 31, 2013, the results of its operations for the year then ended, the changes in its net assets for each of the two years in the period then ended and the financial highlights for each of the five years in the period then ended, in conformity with accounting principles generally accepted in the United States of America. These financial statements and financial highlights (hereafter referred to as "financial statements") are the responsibility of the Fund's management; our responsibility is to express an opinion on these financial statements based on our audits. We conducted our audits of these financial statements in accordance with the standards of the Public Company Accounting Oversight Board (United States). Those standards require that we plan and perform the audit to obtain reasonable assurance about whether the financial statements are free of material misstatement. An audit includes examining, on a test basis, evidence supporting the amounts and disclosures in the financial statements, assessing the accounting principles used and significant estimates made by management, and evaluating the overall financial statement presentation. We believe that our audits, which included confirmation of securities at December 31, 2013 by correspondence with the custodian and brokers, provide a reasonable basis for our opinion.
PricewaterhouseCoopers LLP
Chicago, Illinois
February 18, 2014
18
Wanger Select 2013 Annual Report
Federal Income Tax Information (Unaudited)
The Fund hereby designates the following tax attributes in the fiscal year ended December 31, 2013.
Tax Designations | |||||||
Dividends Received Deduction | 100.00 | % | |||||
Capital Gain Dividend | $ | 28,537,921 | |||||
Foreign Taxes Paid | $ | 0 | |||||
Foreign Source Income | $ | 0 | |||||
Dividends Received Deduction. The percentage of ordinary income dividends paid during the fiscal year that qualifies for the corporate dividends received deduction.
Capital Gain Dividend. The Fund designates as a capital gain dividend the amount reflected above, or if subsequently determined to be different, the net capital gain of such fiscal period. The Fund also designates as capital gain dividends, to the extent necessary to fully distribute such capital gains, earnings and profits distributed to shareholders on the redemption of shares.
Foreign Taxes. The Fund makes the election to pass through to shareholders the foreign taxes paid. These taxes, and the corresponding foreign source income, are provided.
19
Wanger Select 2013 Annual Report
Board of Trustees and Management of Wanger Advisors Trust
Each trustee may serve a term of unlimited duration. The Trust's By-laws generally require that a trustee retire at the end of the calendar year in which the trustee attains the age of 75 years. The trustees appoint their own successors, provided that at least two-thirds of the trustees, after such appointment, have been elected by shareholders. Shareholders may remove a trustee, with or without cause, upon the vote of two-thirds of the Trust's outstanding shares at any meeting called for that purpose. A trustee may be removed, with or without cause, upon the vote of a majority of the trustees. The names of the trustees and officers of the Trust, the date each was first elected or appointed to office, their principal business occupations during at least the last five years, the number of portfolios in the fund complex they oversee, and other directorships they hold, are shown below. Each trustee serves in such capacity for each of the four series of Wanger Advisors Trust and for each of the eight series of Columbia Acorn Trust.
The address for the trustees and officers of the Trust is Columbia Wanger Asset Management, LLC, 227 West Monroe Street, Suite 3000, Chicago, Illinois 60606. The Funds' Statement of Additional Information includes additional information about the Funds' trustees and officers. You may obtain a free copy of the Statement of Additional Information by writing or calling toll-free:
Columbia Wanger Asset Management, LLC
Shareholder Services Group
227 W. Monroe, Suite 3000
Chicago IL 60606
1-800-922-6769
Name, Position(s) with | Year First | Principal Occupation(s) during | Number of | Other | |||||||||||||||
Trustees who are not interested persons of Wanger Advisors Trust: | |||||||||||||||||||
| Laura M. Born, 48, Trustee and Chair | 2007 | Adjunct Associate Professor of Finance, University of Chicago Booth School of Business; Managing Director – Investment Banking, JP Morgan Chase & Co. (broker/dealer) 2002-2007. | 12 | Columbia Acorn Trust; Carlson Wagonlit Travel, B.V. | |||||||||||||||
| Michelle L. Collins, 53, Trustee | 2008 | President, Cambium LLC (financial and business advisory firm) since 2007; Advisory Board Member, Svoboda Capital Partners LLC (private equity firm) since 2007. | 12 | Columbia Acorn Trust; Integrys Energy Group, Inc. (public utility); Molex, Inc. (electronics components manufacturer) 2003-2012; Bucyrus International, Inc. (manufacturer of mining equipment) 2009-2011. | |||||||||||||||
| Maureen M. Culhane, 65, Trustee | 2007 | Retired. Formerly, Vice President, Goldman Sachs Asset Management, L.P. (investment adviser), 2005-2007, and Vice President (Consultant) — Strategic Relationship Management, Goldman Sachs & Co., 1999-2005. | 12 | Columbia Acorn Trust | |||||||||||||||
| Margaret M. Eisen, 60, Trustee | 2002 | Chief Investment Officer, EAM International LLC (corporate finance and asset management) since 2003; Managing Director, CFA Institute, 2005-2008. | 12 | Columbia Acorn Trust; Burnham Investors Trust; Antigenics, Inc. (biotechnology and pharmaceuticals) 2003-2009. | |||||||||||||||
| John C. Heaton, 54, Trustee | 2010 | Deputy Dean for Faculty, University of Chicago Booth School of Business; Joseph L. Gidwitz Professor of Finance, University of Chicago Booth School of Business since 2000. | Columbia Acorn Trust | ||||||||||||||||
| Steven N. Kaplan, 54, Trustee and Vice Chair | 1999 | Neubauer Family Distinguished Service Professor of Entrepreneurship and Finance, University of Chicago Booth School of Business; faculty member of the University of Chicago Booth School of Business since 1998. | 12 | Columbia Acorn Trust; Accretive Health, Inc. (healthcare management services provider); Morningstar, Inc. (provider of independent investment research). | |||||||||||||||
20
Wanger Select 2013 Annual Report
Board of Trustees and Management of Wanger Advisors Trust
Name, Position(s) with | Year First | Principal Occupation(s) during | Number of | Other | |||||||||||||||
Trustees who are not interested persons of Wanger Advisors Trust: (continued) | |||||||||||||||||||
| David J. Rudis, 60, Trustee | 2010 | Retired. National Checking and Debit Executive, and Illinois President, Bank of America, 2007 – 2009; President, Consumer Banking Group, LaSalle National Bank, 2004 – 2007. | 12 | Columbia Acorn Trust | |||||||||||||||
| David B. Small, 57, Trustee | 2010 | Managing Director, Grosvenor Capital Management, L.P. (investment adviser) since 1994; Adjunct Associate Professor of Finance, University of Chicago Booth School of Business. | 12 | Columbia Acorn Trust | |||||||||||||||
Trustees who are interested persons of Wanger Advisors Trust: | |||||||||||||||||||
| Charles P. McQuaid, 60, Trustee and President (1), (2) | 1992 | President and Chief Investment Officer, CWAM or its predecessors, since October 2003; associated with CWAM or its predecessors as an investment professional since 1978. | 12 | Columbia Acorn Trust | |||||||||||||||
Trustee Emeritus | |||||||||||||||||||
| Ralph Wanger, 79, Trustee Emeritus (3) | 1970 | Founder, CWAM. Formerly, President, Chief Investment Officer and portfolio manager, CWAM or its predecessors, July 1992 – September 2003; Director, Wanger Investment Company PLC; Consultant to CWAM or its predecessors, September 2003 – September 2005. | 12 | Columbia Acorn Trust | |||||||||||||||
Officers of Wanger Advisors Trust: | |||||||||||||||||||
| Robert A. Chalupnik, 47, Vice President | 2011 | Portfolio manager and/or analyst, CWAM or its predecessors since 2000; Vice President Columbia Acorn Trust and Wanger Advisors Trust since May 2011. | 12 | N/A | |||||||||||||||
| Michael G. Clarke, 44, Assistant Treasurer | 2004 | Vice President, Columbia Management Investment Advisers, LLC since May 2010; Managing Director of Fund Administration, Columbia Management Advisors, LLC, September 2004 – April 2010; Senior officer, Columbia Funds and affiliated funds since 2002. | 12 | N/A | |||||||||||||||
| Joseph F. DiMaria, 44, Assistant Treasurer | 2010 | Vice President, Mutual Fund Administration, Columbia Management Investment Advisers, LLC, since May 2010; Director of Fund Administration, Columbia Management Advisors, LLC, January 2006 – April 2010. | 12 | N/A | |||||||||||||||
| P. Zachary Egan, 44, Vice President (2) | 2003 | Director of International Research, CWAM or its predecessors since December 2004; Vice President, Columbia Acorn Trust since 2003 and Wanger Advisors Trust since 2007; portfolio manager and/or analyst, CWAM or its predecessors, since 1999. | 12 | N/A | |||||||||||||||
| Fritz Kaegi, 42, Vice President | 2011 | Portfolio manager and/or analyst, CWAM or its predecessors since 2004; Vice President Columbia Acorn Trust and Wanger Advisors Trust since September 2011. | 12 | N/A | |||||||||||||||
| John Kunka, 43, Assistant Treasurer | 2006 | Director of Accounting and Operations, CWAM since 2006. | 12 | N/A | |||||||||||||||
| Stephen Kusmierczak, 46, Vice President | 2011 | Portfolio manager and/or analyst, CWAM or its predecessors since 2001; Vice President Columbia Acorn Trust and Wanger Advisors Trust since September 2011. | 12 | N/A | |||||||||||||||
| Joseph C. LaPalm, 44, Vice President | 2006 | Chief Compliance Officer, CWAM since 2005. | 12 | N/A | |||||||||||||||
21
Wanger Select 2013 Annual Report
Board of Trustees and Management of Wanger Advisors Trust
Name, Position(s) with | Year First | Principal Occupation(s) during | Number of | Other | |||||||||||||||
Officers of Wanger Advisors Trust: (continued) | |||||||||||||||||||
| Bruce H. Lauer, 56, Vice President, Secretary and Treasurer | 1995 | Chief Operating Officer, CWAM or its predecessors since April 2000; Vice President, Secretary and Treasurer, (Chief Financial and Accounting Officer), Columbia Acorn Trust and Wanger Advisors Trust since 1995; formerly, Director, Wanger Investment Company PLC; formerly, Director, Banc of America Capital Management (Ireland) Ltd.; and formerly, Director, Bank of America Global Liquidity Funds, PLC. | 12 | N/A | |||||||||||||||
| Louis J. Mendes III, 49, Vice President | 2003 | Portfolio manager and/or analyst, CWAM or its predecessors since 2001; Vice President, Columbia Acorn Trust since 2003 and Wanger Advisors Trust since 2005. | 12 | N/A | |||||||||||||||
| Robert A. Mohn, 52, Vice President (2) | 1997 | Director of Domestic Research, CWAM or its predecessors since March 2004; Vice President, Columbia Acorn Trust and Wanger Advisors Trust, since 1997; portfolio manager and/or analyst, CWAM or its predecessors since August 1992. | 12 | N/A | |||||||||||||||
| Christopher J. Olson, 49, Vice President | 2001 | Portfolio manager and/or analyst, CWAM or its predecessors, since January 2001; Vice President, Columbia Acorn Trust and Wanger Advisors Trust since 2001. | 12 | N/A | |||||||||||||||
| Christopher O. Petersen, 44, Assistant Secretary | 2010 | Vice President and Chief Counsel, Ameriprise Financial since January 2010 (formerly, Vice President and Group Counsel or Counsel, April 2004 – January 2010); officer, Columbia Funds and affiliated funds since 2007. | 12 | N/A | |||||||||||||||
| Scott R. Plummer, 54, Assistant Secretary | 2010 | Senior Vice President, Chief Legal Officer and Assistant Secretary, Columbia Management Investment Advisers, LLC (or its predecessors) since June 2005; Senior Vice President and Assistant General Counsel — Global Asset Management, Ameriprise Financial since February 2014 (previously, Senior Vice President and Lead Chief Counsel — Asset Management, 2012 – February 2014, Vice President and Lead Chief Counsel — Asset Management, 2010 – 2012, and Vice President and Chief Counsel — Asset Management, 2005 – 2010); Vice President, Chief Counsel and Assistant Secretary, Columbia Management Investment Distributors, Inc. (or its predecessors) since 2008; Vice President, General Counsel and Secretary, Ameriprise Certificate Company since 2005; Chief Counsel, RiverSource Distributors, Inc., 2006 – 2010; Senior officer, Columbia Funds and affiliated funds since 2006. | 12 | N/A | |||||||||||||||
| Robert P. Scales, 61, Chief Compliance Officer, Chief Legal Officer, Senior Vice President and General Counsel | 2004 | Chief Compliance Officer, Chief Legal Officer, Senior Vice President and General Counsel, Columbia Acorn Trust and Wanger Advisors Trust, since 2004. | 12 | N/A | |||||||||||||||
| Andreas Waldburg-Wolfegg, 47, Vice President | 2011 | Portfolio Manager and/or analyst of CWAM since 2002; Vice President Columbia Acorn Trust and Wanger Advisors Trust since September 2011. | 12 | N/A | |||||||||||||||
| Linda Roth-Wiszowaty, 44, Assistant Secretary | 2006 | Business support analyst, CWAM, since April 2007; prior thereto executive administrator, CWAM or its predecessors, and executive assistant to the Chief Operating Officer of CWAM or its predecessors. | 12 | N/A | |||||||||||||||
* Dates prior to April 1992 correspond to the date of first election or appointment as a trustee or officer of The Acorn Fund, Inc., the predecessor trust to Columbia Acorn Trust.
(1) Mr. McQuaid is an "interested person" of Wanger Advisors Trust and of CWAM, as defined in the Investment Company Act of 1940, because he is an officer of the Trust and of CWAM.
(2) Effective March 31, 2014, Mr. McQuaid expects to step down from his current role as President and Chief Investment Officer of CWAM. Effective April 1, 2014 it is expected that Mr. Mohn will become the Domestic Chief Investment Officer of CWAM and Mr. Egan will become the President and International Chief Investment Officer of CWAM.
(3) As permitted under the Wanger Advisors Trust's By-Laws, Mr. Wanger serves as a non-voting Trustee Emeritus of the Trust.
22
Wanger Select 2013 Annual Report
This page intentionally left blank.
23
Wanger Select 2013 Annual Report
This page intentionally left blank.
24
Wanger Select 2013 Annual Report

Columbia Wanger Funds
Trustees
Laura M. Born
Chair of the Board
Steven N. Kaplan
Vice Chair of the Board
Michelle L. Collins
Maureen M. Culhane
Margaret M. Eisen
John C. Heaton
Charles P. McQuaid
David J. Rudis
David B. Small
Ralph Wanger (Trustee Emeritus)
Officers
Charles P. McQuaid
President
Robert A. Chalupnik
Vice President
Michael G. Clarke
Assistant Treasurer
Joseph F. DiMaria
Assistant Treasurer
P. Zachary Egan
Vice President
Fritz Kaegi
Vice President
John M. Kunka
Assistant Treasurer
Stephen Kusmierczak
Vice President
Joseph C. LaPalm
Vice President
Bruce H. Lauer
Vice President, Secretary and Treasurer
Louis J. Mendes III
Vice President
Robert A. Mohn
Vice President
Christopher J. Olson
Vice President
Christopher O. Petersen
Assistant Secretary
Scott R. Plummer
Assistant Secretary
Robert P. Scales
Chief Compliance Officer, Chief Legal Officer, Senior Vice President and
General Counsel
Andreas Waldburg-Wolfegg
Vice President
Linda K. Roth-Wiszowaty
Assistant Secretary
Investment Manager
Columbia Wanger Asset Management, LLC
227 West Monroe Street, Suite 3000
Chicago, Illinois 60606
1-888-4-WANGER
(1-888-492-6437)
Transfer Agent,
Dividend Disbursing Agent
Columbia Management Investment Services Corp.
P.O. Box 8081
Boston, Massachusetts
02266-8081
Distributor
Columbia Management Investment Distributors, Inc.
225 Franklin Street
Boston, Massachusetts
02110
Legal Counsel to the Funds
Perkins Coie LLP
Washington, DC
Legal Counsel to the Independent Trustees
Drinker Biddle & Reath LLP
Philadelphia, Pennsylvania
Independent Registered Public Accounting Firm
PricewaterhouseCoopers LLP
Chicago, Illinois
This document contains Global Industry Classification Standard data. The Global Industry Classification Standard ("GICS") was developed by and is the exclusive property and a service mark of MSCI Inc. ("MSCI") and Standard & Poor's Financial Services LLC ("S&P") and is licensed for use by Columbia Wanger Asset Management, LLC ("CWAM"). Neither MSCI, S&P, nor any other party involved in making or compiling the GICS or any GICS classifications makes any express or implied warranties or representations with respect to such standard or classification (or the results to be obtained by the use thereof), and all such parties hereby expressly disclaim all warranties of originality, accuracy, completeness, merchantability and fitness for a particular purpose with respect to any of such standard or classification. Without limiting any of the foregoing, in no event shall MSCI, S&P, any of their affiliates or any third party involved in making or compiling the GICS or any GICS classifications have any liability for any direct, indirect, special, punitive, consequential or any other damages (including lost profits) even if notified of the possibility of such damages.
This report, including the schedules of investments and financial statements, is submitted for the general information of the shareholders of the Wanger Advisors Trust.
A description of the Fund's proxy voting policies and procedures and a copy of the Fund's voting record for the most recent 12-month period ended June 30 are available (i) on our website, columbiamanagement.com, (ii) on the Securities and Exchange Commission's website at www.sec.gov, and (iii) without charge, upon request, by calling 888-492-6437.
The Fund files a complete schedule of portfolio holdings with the SEC for the first and third quarters of each fiscal year on Form N-Q. The Fund's Form N-Q is available on the SEC's website at www.sec.gov and may be reviewed and copied at the SEC's Public Reference Room in Washington, D.C. Information on the operation of the Pubic Reference Room may be obtained by calling 800-SEC-0330. The Fund's complete portfolio holdings are disclosed at www.columbiamanagement.com approximately 30 to 40 days after each month-end.
Columbia Wanger Funds
© 2014 Columbia Management Investment Advisers, LLC. All rights reserved.
C-1461 E (2/14) 815601
Wanger USA
2013 Annual Report

Not FDIC insured • No bank guarantee • May lose value

Wanger USA
2013 Annual Report
Table of Contents
1 | Understanding Your Expenses | ||||||
2 | Containerized Cargo and the Man Who Popularized It | ||||||
4 | Performance Review | ||||||
6 | Statement of Investments | ||||||
13 | Statement of Assets and Liabilities | ||||||
13 | Statement of Operations | ||||||
14 | Statement of Changes in Net Assets | ||||||
15 | Financial Highlights | ||||||
16 | Notes to Financial Statements | ||||||
19 | Report of Independent Registered Public Accounting Firm | ||||||
20 | Federal Income Tax Information (Unaudited) | ||||||
21 | Board of Trustees and Management of Wanger Advisors Trust | ||||||
A Comment on Trading Volumes
Market conditions are always changing and vary by country and industry sector, and investing in international markets involves unique risks. In the wake of the 2007-2009 financial crisis, trading volumes in both emerging and developed international markets declined significantly and have stayed at generally reduced levels since then. Although it is difficult to accurately assess trends in trading volumes in foreign markets, because some amount of activity has migrated to alternative trading venues, a reduction in trading volumes poses challenges to the Fund. This is particularly so because the Fund focuses on small- and mid-cap companies that usually have lower trading volumes and often takes sizeable positions in portfolio companies. As a result of lower trading volumes, it may take longer to buy or sell securities, which can exacerbate the Fund's exposure to volatile markets. The Fund may also be limited in its ability to execute favorable trades in portfolio securities in response to changes in company prices and fundamentals. If the Fund is forced to sell securities to meet redemption requests or other cash needs, or in the case of an event affecting liquidity in a particular market or markets, it may be forced to dispose of those securities under disadvantageous circumstances and at a loss. As the Fund grows in size, these considerations take on increasing significance and may adversely impact performance.
Columbia Wanger Asset Management, LLC (CWAM) is one of the leading global small- and mid-cap equity managers in the United States with over 40 years of small- and mid-cap investment experience. As of December 31, 2013, CWAM managed $39.7 billion in assets. CWAM is the investment manager to Wanger USA, Wanger International, Wanger Select and Wanger International Select (together, the Columbia Wanger Funds) and the Columbia Acorn Family of Funds.
An important note: Columbia Wanger Funds are available only through variable annuity contracts and variable life insurance policies issued by participating insurance companies or certain eligible retirement plans. Columbia Wanger Funds are not offered directly to the public and are not available in all contracts, policies or plans. Contact your financial advisor or insurance representative for more information. Columbia Wanger Funds are distributed by Columbia Management Investment Distributors, Inc., member FINRA, and are managed by Columbia Wanger Asset Management, LLC.
Investors should carefully consider investment objectives, risks, charges and expenses before investing. For variable fund and variable contract prospectuses, which contain this and other important information, investors should contact their financial advisor or insurance representative. Read the prospectus carefully before investing.
The views expressed in "Containerized Cargo and the Man Who Popularized It" and in the Performance Review reflect the current views of the respective authors. These views are not guarantees of future performance and involve certain risks, uncertainties and assumptions that are difficult to predict so actual outcomes and results may differ significantly from the views expressed. These views are subject to change at any time based upon economic, market or other conditions and the respective parties disclaim any responsibility to update such views. These views may not be relied on as investment advice and, because investment decisions for a Columbia Wanger Fund are based on numerous factors, may not be relied on as an indication of trading intent on behalf of any particular Columbia Wanger Fund. References to specific company securities should not be construed as a recommendation or investment advice.
Wanger USA 2013 Annual Report
Understanding Your Expenses
As a shareholder, you incur three types of costs. There are transaction costs, which generally include sales charges on purchases and may include redemption fees. There are also ongoing costs, which generally include management fees and other expenses for Wanger USA (the Fund). Lastly, there may be additional fees or charges imposed by the insurance company that sponsors your variable annuity and/or variable life insurance product. The following information is intended to help you understand your ongoing costs (in dollars) of investing in the Fund and to help you compare these costs with the ongoing costs of investing in other mutual funds.
Analyzing your Fund's expenses
To illustrate these ongoing costs, we have provided an example and calculated the expenses paid by investors in the Fund during the period. The actual and hypothetical information in the table below is based on an initial investment of $1,000 at the beginning of the period indicated and held for the entire period. Expense information is calculated two ways and each method provides you with different information. The amount listed in the "Actual" column is calculated using the Fund's actual operating expenses and total return for the period. You may use the Actual information, together with the amount invested, to estimate the expenses that you paid over the period. Simply divide your account value by $1,000 (for example, an $8,600 account value divided by $1,000 = 8.6), then multiply the results by the expenses paid during the period under the Actual column. The amount listed in the "Hypothetical" column assumes a 5% annual rate of return before expenses (which is not the Fund's actual return) and then applies the Fund's actual expense ratio for the period to the hypothetical return. You should not use the hypothetical account values and expenses to estimate either your actual account balance at the end of the period or the expenses you paid during the period. See "Compare with other funds" below for details on how to use the hypothetical data.
Compare with other funds
Since all mutual funds are required to include the same hypothetical calculations about expenses in shareholder reports, you can use this information to compare the ongoing cost of investing in the Fund with other funds. To do so, compare the hypothetical example with the 5% hypothetical examples that appear in the shareholder reports of other funds. As you compare hypothetical examples of other funds, it is important to note that hypothetical examples are meant to highlight the ongoing cost of investing in a fund only and do not reflect any transaction costs, such as sales charges, redemption or exchange fees. Therefore, the hypothetical calculations are useful in comparing ongoing costs only, and will not help you determine the relative total costs of owning different funds. If transaction costs were included in these calculations, your costs would be higher.
July 1, 2013 – December 31, 2013
| Account value at the beginning of the period ($) | Account value at the end of the period ($) | Expenses paid during period ($) | Fund's annualized expense ratio (%)* | ||||||||||||||||||||||||||||
Actual | Hypothetical | Actual | Hypothetical | Actual | Hypothetical | ||||||||||||||||||||||||||
Wanger USA | 1,000.00 | 1,000.00 | 1,191.80 | 1,020.59 | 5.36 | 4.94 | 0.96 | ||||||||||||||||||||||||
*Expenses paid during the period are equal to the Fund's annualized expense ratio, multiplied by the average account value over the period, then multiplied by the number of days in the Fund's most recent fiscal half-year and divided by 365.
It is important to note that the expense amounts shown in the table are meant to highlight only ongoing costs of investing in the Fund. Expenses paid during the period do not include any insurance charges imposed by your insurance company's separate account. The hypothetical example provided is useful in comparing ongoing costs only and will not help you determine the relative total costs of owning different funds whose shareholders may incur transaction costs.
1
Wanger USA 2013 Annual Report

Containerized Cargo and the Man Who Popularized It
Born in a small town in North Carolina, Malcom McLean had little formal schooling beyond grade school. He first worked as a farmer and then operated a gas station. When, in 1934, a road builder asked him where he could hire a truck and a driver, Malcom bought a used truck for $150 and signed on. Malcom went on to build McLean Trucking, one of the largest trucking firms in the country.1 The company was an early adopter of diesel engines and conveyors, and acquired other truckers in order to transport backhauls under Interstate Commerce Commission rules.2
Early in his trucking career, McLean personally had the job of delivering cotton to the port of New York and returning with a truck full of roofing material. He grew impatient waiting for the stevedores to unload and reload his truck and thought that switching full containers would save time and money.3
In 1955, McLean sold his trucking business and bought Pan-Atlantic Steamship Company for $7 million cash. He then bought Pan-Atlantic's former parent company, Waterman, in a $42 million leveraged buyout using Pan-Atlantic as collateral.4 Combined, the companies operated 37 World War II surplus C-2 cargo ships. He also bought four World War II surplus T-2 tankers and had them equipped with spar decks on top, similar to those used during the war to haul large equipment across the Atlantic.
McLean now had the opportunity to put his shipping-by-container idea to work. Until the 1950s, general ocean cargo arrived at ports in crates, boxes, bags and on pallets. It was then meticulously packed by longshoremen; a typical ship took 150 of them four days to load.5 One steamship executive said it cost more to move cargo from the street to the hold of a ship, than it did to move the cargo across the sea.6 McLean decided to save time and space by utilizing detachable truck trailers, and transporting only the container section of the trailer on the vessels.7 In April 1956, service commenced between Port Newark, New Jersey, Miami, Florida and Houston,
Texas. Each of the four ships could accommodate 58 containers that were thirty-three feet long.8
Shipping by container did cost substantially less. As an extreme example, McLean calculated that the cost of hauling bottled beer from Newark to Miami was 94% cheaper by containership than by conventional shipping. More realistically, a government-sponsored study calculated that container shipping cost 39% to 74% less.9 McLean named his intermodal operation Sea-Land Service.
Sea-Land then set about converting six of the C-2 cargo ships in its fleet into dedicated containerships. Containers were to be stacked four high in the hold and two high on the deck, resulting in a capacity of 226 containers per vessel. In order to allow stacking, frames of the containers were strengthened and twist locks were invented to hold adjacent containers in place. The first converted C-2 began hauling containers in October 1957. These containerships could be loaded by a crew of 14 during a single eight-hour shift for a cost nearly 90% less than loading a similar sized break-bulk ship, a ship with cargo loaded individually.10
Imitators soon followed. In August 1958 Matson Line began service between California and Hawaii, carrying 20 containers on deck and conventional break-bulk cargo below. In 1960, Matson began launching dedicated containerships, again converted World War II cargo ships, accommodating up to 356 containers each. In 1960, Grace Line inserted mid-sections into C-2 cargo ships and converted them to containerships capable of carrying 476 containers for shipments between the United States and Latin America. But Grace Line abandoned the service within a few years due to labor problems. McLean launched ships that could carry 476 much larger containers in 1962, and put them into service between the East and West coasts of the United States,11 as well as between the continental United States and Puerto Rico.12 On its tenth anniversary in 1966, Sea-Land had 19 containerships.13 By 1969,
Sea-Land had also converted C-4s to carry 622 containers.14
McLean recognized that to achieve the full benefit of containers, the entire system of ports, labor, trucks and ships would have to change.15 Port Elizabeth, New Jersey, was designed for containerships. Opening in 1962, it had a wide and deep channel and plenty of paved area shore-side for containers in transit.16 New Jersey's share of the Port of New York cargo jumped from 9% in 1956 to 63% in 1970. Around the country, the few ports that had room for containers, good road and rail connections (and a penchant for spending on infrastructure) gained share, while ports relying on piers within congested cities lost out.17 McLean also signed agreements with unions, providing regular work, safe working conditions and provisions for early retirement in exchange for fewer paid employee hours and more flexible work rules.
Trans-Atlantic container shipping started in 1966 and competition increased. McLean decided to build all-new containerships rather than convert old vessels. He specified ships for both size and speed that could carry over 1,200 containers of varying sizes.18 The ships were to steam at 33 knots, well above most others that operated at 18 to 24 knots. The new containerships cost a total of $435 million. In May of 1969, McLean orchestrated a $530 million takeover of Sea-Land by R.J. Reynolds, a cash-rich tobacco company, as Sea-Land needed investment capital and R.J. Reynolds wanted to diversify.19
The first of eight ships launched in 1972. It crossed the Atlantic in under five days and averaged 31 knots, a cargo ship record. After refinements, sister ships were able to make the crossing in under four days, beating the record of all passenger ships except for a ship named the United States.20 Six of the eight ships were eventually assigned to trans-Pacific crossings.
But fast ships use far more fuel than slower ships. Sea-Land's new containerships consumed nearly twice as much fuel per mile at 33 knots than at 24 knots, and at 24 knots consumed
2
Wanger USA 2013 Annual Report
more fuel per container than ships that were designed for 24 knots or less. After two oil price spikes in the 1970s, the ships became unprofitable and were sold in 1981, at less than half their cost of construction, to the U.S. Navy for use as fast supply vessels.21
McLean reduced his role at Sea-Land after the fast ships launched in 1972, resigned from the R.J. Reynolds board in 1977 and sold his last shares in the company in 1980. R.J. Reynolds spun off Sea-Land in 1984; CSX bought it in 1986, and sold it to Maersk in 1999.
McLean re-entered the shipping industry by buying United States Lines from Walter Kidde in April 1978. Later that year, the company placed a record order to construct 12 new containerships, each with a capacity somewhat over 4,250 containers. These ships were 40% larger than the largest containership in existence and would provide United States Lines with the most capacity in the industry. Per container, the ships would be by far the most efficient and would cruise at a fuel-efficient 16 knots. The ships were highly automated and were able to carry nearly 50 times as much cargo per crewmember as the first dedicated cargo ships.22
Tragically for McLean and United States Lines, the price of oil then plunged, fuel efficiency mattered a lot less, and speed became more important. The ships were underpowered and had trouble keeping schedules in rough seas. They could not compete and in 1986 the company filed the biggest bankruptcy in U.S. history. The ships were sold at $0.28 on the dollar 16 months later.23 McLean was mortified by the failure, which cost thousands of jobs and millions of dollars. He died in 2001 at the age of 87, after yet another attempt to re-enter the industry.
Containerships kept getting larger and speeds gradually increased. Beginning in 2006, Maersk launched eight ships capable of carrying over 14,000 containers. Larger containerships had costs per container nearly 50% less than smaller ships.24 In 2013, Maersk launched the Mc-Kinney Moller with a capacity of 18,000
containers and had 19 more on order. These ships are longer than the height of the Empire State Building's occupied floors. Echoing McLean's 1978 order, the ships are designed to be at least 30% more fuel efficient than competitors and cruise at 16 knots.25 Worldwide containership capacity currently exceeds 17 million containers, which, if laid end-to-end, exceeds twice the circumference of the world.26
Containerships made freight transport reliable and incredibly cheap. At least three-quarters of vessels in the Far East/North America trade arrive within a day of schedule. In 2004, 4,000 video recorders could be shipped from the Far East to Europe for $0.83 each and Scotch whisky could be shipped from Europe to Japan for $0.05 per bottle.27 In 2013, it was cheaper to ship Scottish cod 10,000 miles to China for filleting and back to Scotland than to fillet it in Scotland!28
Containerized cargo hiked supplies and reduced prices of consumer goods, raising living standards around the world. The containership industry has high fixed costs and is very cyclical. Also, new more efficient ships increase industry capacity and depress pricing, hurting profitability of existing ships. As investors, we've found more stable opportunities in this industry by investing in adjunct businesses that benefit from increased container volumes. These include freight forwarders, which tend to benefit from declining costs or transport, and container owners, which exist today thanks to the ingenuity of Malcom McLean.


Charles P. McQuaid
President and Chief Investment Officer
Columbia Wanger Asset Management, LLC
The information and data provided in this analysis are derived from sources that we deem to be reliable and accurate. These views are not guarantees of future performance and involve certain risks, uncertainties and assumptions that are difficult to predict so actual outcomes and results may differ significantly from the views expressed. The views/opinions expressed here are those of the author and not of the Wanger Advisors Trust Board, are subject to change at any time based upon economic, market or other conditions, may differ from views expressed by other Columbia Management associates and the respective parties disclaim any responsibility to update such views. These views may not be relied on as investment advice and, because investment decisions for a Columbia Wanger Fund are based on numerous factors, may not be relied on as an indication of trading intent on behalf of any particular Columbia Wanger Fund.
1 Cudahy, Brian J., Box Boats, How Container Ships Changed the World (New York, New York, Fordham University Press, 2006) p. 21.
2 Levinson, Marc, The Box, How the Shipping Container Made the World Smaller and the World Economy Bigger (Princeton, New Jersey, Princeton University Press, 2006), p. 40-41.
3 Cudahy, Brian J., op. cit., p. 10.
4 Ibid., p. 24.
5 Ibid., p. 35.
6 Ibid., p. 9.
7 Ibid., p. 27.
8 Levinson, Marc, op. cit., p. 49, 51.
9 Ibid., p. 48, 91.
10 Cudahy, Brian J., op. cit., p. 35.
11 Ibid., p. 80.
12 Levinson, Marc, op. cit., p. 72.
13 Cudahy, Brian J., op. cit., p. 90.
14 Ibid., p. 100.
15 Levinson, Marc, op. cit., p. 53.
16 Ibid., p. 91.
17 Ibid., p. 91, 96, 193.
18 Sea-Land's initial containers were 33 and 35 feet long, while Matson Lines' were 24 feet and Grace Lines' measured 17 feet, lengths determined by ship sizes and road regulations. Going forward in this essay, capacity refers to standardized 20-foot trailer equivalent units (TEU), though most containers today are 40 feet long.
19 Levinson, Marc, op. cit., p. 216-217.
20 Cudahy, Brian J., op. cit., p. 123.
21 Ibid., p. 136-137.
22 Ibid., p. 149-150.
23 Levinson, Marc, op. cit., p. 243.
24 Stopford, Martin, Maritime Economics, Third Edition (New York, New York, Routledge, Taylor & Francis Group, 2009) p. 540.
25 Bennett, Drake, "Risk Ahoy: Maersk, Daewoo Build the World's Biggest Boat," Bloomberg Businessweek, September 5, 2013.
26 World Shipping Council website, http://www.worldshipping.org/about-the-industry/liner-ships/container-vessel-fleet.
27 Stopford, Martin, op. cit., p. 512, 522.
28 George, Rose, Ninety Percent of Everything, Inside Shipping, The Invisible Industry that Puts Clothes on Your Back, Gas in Your Car, and Food on Your Plate (New York, New York, Metropolitan Books, Henry Hold and Company, 2013), p. 18.
3
Wanger USA 2013 Annual Report

Performance Review Wanger USA
|
| ||||||
| Robert A. Mohn Portfolio Manager | William J. Doyle* Co-Portfolio Manager | ||||||


Performance data shown represents past performance and is not a guarantee of future results. The investment return and principal value will fluctuate so that shares, when redeemed, may be worth more or less than the original cost. Current performance may be lower or higher than the performance data shown. Please visit columbiamanagement.com for most recent month-end performance updates.
*Effective January 1, 2014, William J. Doyle was named co-portfolio manager of Wanger USA. Mr. Doyle has been CWAM's energy analyst since 2006. Performance information provided in this report is for the period ended December 31, 2013, and was achieved by the portfolio management in place through that date.
Wanger USA ended the annual period up 33.75%, a pleasing absolute return but below the Fund's primary benchmark, the Russell 2000 Index, which gained 38.82%. The Fund's technology and industrials stocks lagged the performance of their respective sectors in the benchmark in 2013, dampening relative performance.
Up 104%, the Fund's top contributor for the year was car rental company Avis Budget Group. The company benefited from lower fleet costs and higher pricing and utilization. Bally Technologies, a manufacturer of slot machines and gaming software, had a 74% annual gain. Investors responded favorably to Bally's purchase of SHFL Entertainment, an acquisition that broadens its product line. Caesarstone, a manufacturer of quartz countertops, ended the year up an impressive 201%, as sales of its products in the United States were up 50% over the prior year. Moog sells motion control products used primarily in airplanes and announced strong results for the year, sending its stock up 66%.
The Fund's larger biotech positions outshone some smaller positions that were among the Fund's performance detractors in the annual period. On the winning side, orphan drug developer NPS Pharmaceuticals gained 234% for the year, benefiting from the successful launch of a medication to treat short bowel syndrome. Seattle Genetics, a developer of antibody-based therapies for cancer, rose 72% in 2013 as its drug, Adcetris, gained traction as a means for treating multiple forms of cancer.
Among the biotech detractors were ARIAD Pharmaceuticals and Coronado Biosciences. Off 71% in 2013, ARIAD's drug was placed on clinical hold by the FDA due to elevated cardiovascular risk. Coronado's drug to treat Crohn's disease failed in its FDA trials, leaving the stock with an 80% annual decline. We sold both stocks late in the period.
Outside the biotech area, premium active apparel retailer lululemon athletica left the Fund with a 15% loss in 2013. A product recall and changes in top management hurt the stock and we opted to sell the Fund's position in the second half of the year. Liquidity Services runs online
auctions for surplus and salvage goods. Its stock had an annual loss of 44%, falling on disappointing volume projections for next year.
In 2013, lower-quality turnarounds and momentum stocks with high price-to-earnings ratios were the big market winners. Stocks we consider more reasonably priced, quality investments generally underperformed. Our investment style has proven itself to work well in most market conditions but it was out of favor last year. We are uncertain how long this headwind will persist, but we believe the Fund will be well served in the long term by adhering to its historically successful strategy of investing in reasonably priced growth stocks.
Stocks of small- and mid-cap companies pose special risks, including possible illiquidity and greater price volatility than stocks of larger, more established companies. Please also see "A Comment on Trading Volumes" on the table of contents page of this report.
Fund holdings are as of the date given, are subject to change at any time and are not recommendations to buy or sell any security. Top holdings exclude short-term holdings and cash, if applicable.
Fund's Positions in Mentioned Holdings
As a percentage of net assets, as of 12/31/13
Avis Budget Group | 2.9 | % | |||||
Moog | 1.4 | ||||||
Bally Technologies | 1.4 | ||||||
Seattle Genetics | 1.1 | ||||||
Caesarstone | 1.0 | ||||||
NPS Pharmaceuticals | 0.9 | ||||||
Liquidity Services | 0.2 | ||||||
4
Wanger USA 2013 Annual Report
Growth of a $10,000 Investment in Wanger USA
May 3, 1995 (inception date) through December 31, 2013
Performance data shown represents past performance and is not a guarantee of future results. The investment return and principal value will fluctuate so that shares, when redeemed, may be worth more or less than the original cost. Current performance may be lower or higher than the performance data shown. Performance results reflect any fee waivers or reimbursements of Fund expenses by the investment manager and/or any of its affiliates. Absent these fee waivers and/or expense reimbursement arrangements, performance results would have been lower. For most recent month-end performance updates, please visit columbiamanagement.com.
This graph compares the results of $10,000 invested in Wanger USA on May 3, 1995 (the date the Fund began operations) through December 31, 2013, to the Russell 2000 Index, with dividends and capital gains reinvested. Although the index is provided for use in assessing the Fund's performance, the Fund's holdings may differ significantly from those in the index.
Top 10 Holdings
As a percentage of net assets, as of 12/31/13
| 1. Ametek Aerospace/Industrial Instruments | 3.5 | % | |||||
| 2. Nordson Dispensing Systems for Adhesives & Coatings | 3.1 | ||||||
| 3. Avis Budget Group Second Largest Car Rental Company | 2.9 | ||||||
| 4. Mettler-Toledo International Laboratory Equipment | 2.9 | ||||||
| 5. Donaldson Industrial Air Filtration | 2.8 | ||||||
| 6. tw telecom Fiber Optic Telephone/Data Services | 2.4 | ||||||
| 7. IPG Photonics Fiber Lasers | 2.4 | ||||||
| 8. Extra Space Storage Self Storage Facilities | 2.3 | ||||||
| 9. Informatica Enterprise Data Integration Software | 2.0 | ||||||
| 10. Ansys Simulation Software for Engineers & Designers | 1.9 | ||||||
Top 5 Industries
As a percentage of net assets, as of 12/31/13
Information | 25.7 | % | |||||
Industrial Goods & Services | 19.9 | ||||||
Finance | 15.7 | ||||||
Consumer Goods & Services | 15.6 | ||||||
Health Care | 11.0 | ||||||
Results as of December 31, 2013
4th quarter* | 1 year | 5 years | 10 years | ||||||||||||||||
Wanger USA | 7.03 | % | 33.75 | % | 22.14 | % | 9.39 | % | |||||||||||
Russell 2000 Index** | 8.72 | 38.82 | 20.08 | 9.07 | |||||||||||||||
| Lipper Variable Underlying Small-Cap Growth Funds Index | 8.17 | 40.99 | 22.61 | 9.37 | |||||||||||||||
* Not annualized.
** The Fund's primary benchmark.
NAV as of 12/31/13: $41.13
Performance numbers reflect all Fund expenses but do not include any fees and expenses imposed under your variable annuity or life insurance policy or qualified pension or retirement plan. If performance included the effect of these additional charges, it would be lower.
The Fund's annual operating expense ratio of 0.96% is stated as of the Fund's prospectus dated May 1, 2013, and differences in expense ratios disclosed elsewhere in this report may result from including fee waivers and expense reimbursements as well as different time periods used in calculating the ratios.
All results shown assume reinvestment of distributions.
The Russell 2000 Index measures the performance of the 2,000 smallest companies in the Russell 3000 Index, which represents approximately 10% of the total market capitalization of the Russell 3000 Index. The Lipper Variable Underlying Small-Cap Growth Funds Index is an equally weighted representation of the 30 largest variable insurance underlying funds in the Lipper Variable Underlying Small-Cap Growth Funds Classification, and shows how the Fund's performance compares with returns of an index of funds with similar investment objectives. Indexes are not managed and do not incur fees or expenses. It is not possible to invest directly in an index.
Lipper Inc., a widely respected data provider in the industry, calculates an average total return (assuming reinvestment of distributions) for mutual funds with investment objectives similar to those of the Fund.
Portfolio characteristics and holdings are subject to change periodically and may not be representative of current characteristics and holdings.
5
Wanger USA 2013 Annual Report
Wanger USA
Statement of Investments, December 31, 2013
| Number of Shares | Value | ||||||||||
Equities – 99.0% | |||||||||||
Information – 25.7% | |||||||||||
Business Software – 9.1% | |||||||||||
| 448,000 | Informatica (a) Enterprise Data Integration Software | $ | 18,592,000 | ||||||||
| 198,000 | Ansys (a) Simulation Software for Engineers & Designers | 17,265,600 | |||||||||
| 163,000 | SPS Commerce (a) Supply Chain Management Software Delivered via the Web | 10,643,900 | |||||||||
| 179,000 | Micros Systems (a) Information Systems for Hotels, Restaurants & Retailers | 10,269,230 | |||||||||
| 95,000 | NetSuite (a) End to End IT Systems Solution Delivered Over the Web | 9,786,900 | |||||||||
| 48,000 | Concur Technologies (a) Web Enabled Cost & Expense Management Software | 4,952,640 | |||||||||
| 106,000 | RealPage (a) (b) Software for Managing Rental Properties Delivered via the Web | 2,478,280 | |||||||||
| 150,000 | Exa (a) Simulation Software | 1,989,000 | |||||||||
| 29,300 | DemandWare (a) eCommerce Website Platform for Retailers & Apparel Manufacturers | 1,878,716 | |||||||||
| 43,000 | Envestnet (a) Technology Platform for Investment Advisors | 1,732,900 | |||||||||
| 198,977 | InContact (a) Call Center Systems Delivered Via the Web & Telco Services | 1,554,011 | |||||||||
| 55,214 | Ellie Mae (a) Software for Managing & Network for Facilitating Mortgage Origination | 1,483,600 | |||||||||
82,626,777 | |||||||||||
Instrumentation – 5.3% | |||||||||||
| 109,750 | Mettler-Toledo International (a) Laboratory Equipment | 26,624,252 | |||||||||
| 277,000 | IPG Photonics (a) (b) Fiber Lasers | 21,497,970 | |||||||||
48,122,222 | |||||||||||
Telephone & Data Services – 2.5% | |||||||||||
| 715,000 | tw telecom (a) Fiber Optic Telephone/Data Services | 21,786,050 | |||||||||
| 197,000 | Boingo Wireless (a) Wholesale & Retail Wi-Fi Networks | 1,262,770 | |||||||||
23,048,820 | |||||||||||
| Number of Shares | Value | ||||||||||
Computer Services – 1.9% | |||||||||||
| 333,000 | ExlService Holdings (a) Business Process Outsourcing | $ | 9,197,460 | ||||||||
| 175,000 | WNS – ADR (India) (a) Offshore Business Process Outsourcing Services | 3,834,250 | |||||||||
| 405,000 | RCM Technologies (a) Technology & Engineering Services | 2,826,900 | |||||||||
| 243,000 | Hackett Group IT Integration & Best Practice Research | 1,509,030 | |||||||||
17,367,640 | |||||||||||
Gaming Equipment & Services – 1.4% | |||||||||||
| 160,000 | Bally Technologies (a) Slot Machines & Software | 12,552,000 | |||||||||
Semiconductors & Related Equipment – 1.3% | |||||||||||
| 186,000 | Monolithic Power Systems (a) High Performance Analog & Mixed Signal Integrated Circuits | 6,446,760 | |||||||||
| 86,000 | Ultratech (a) Semiconductor Equipment | 2,494,000 | |||||||||
| 25,000 | Hittite Microwave (a) Radio Frequency, Microwave & Millimeterwave Semiconductors | 1,543,250 | |||||||||
| 150,000 | Atmel (a) Microcontrollers, Radio Frequency & Memory Semiconductors | 1,174,500 | |||||||||
11,658,510 | |||||||||||
Telecommunications Equipment – 1.0% | |||||||||||
| 200,000 | Finisar (a) Optical Subsystems & Components | 4,784,000 | |||||||||
| 235,000 | Ixia (a) Telecom Network Test Equipment | 3,127,850 | |||||||||
| 135,000 | Infinera (a) Optical Networking Equipment | 1,320,300 | |||||||||
9,232,150 | |||||||||||
Financial Processors – 0.8% | |||||||||||
| 91,000 | Global Payments Credit Card Processor | 5,914,090 | |||||||||
| 80,000 | Liquidity Services (a) E-Auctions for Surplus & Salvage Goods | 1,812,800 | |||||||||
7,726,890 | |||||||||||
See accompanying notes to financial statements.
6
Wanger USA 2013 Annual Report
Wanger USA
Statement of Investments, December 31, 2013
| Number of Shares | Value | ||||||||||
Computer Hardware & Related Equipment – 0.8% | |||||||||||
| 292,000 | II-VI (a) Laser Optics & Specialty Materials | $ | 5,139,200 | ||||||||
| 41,000 | Rogers (a) Printed Circuit Materials & High-performance Foams | 2,521,500 | |||||||||
7,660,700 | |||||||||||
Contract Manufacturing – 0.8% | |||||||||||
| 97,000 | Plexus (a) Electronic Manufacturing Services | 4,199,130 | |||||||||
| 165,000 | Sanmina-SCI (a) Electronic Manufacturing Services | 2,755,500 | |||||||||
6,954,630 | |||||||||||
Business Information & Marketing Services – 0.6% | |||||||||||
| 291,200 | Navigant Consulting (a) Financial Consulting Firm | 5,591,040 | |||||||||
Internet Related – 0.2% | |||||||||||
| 76,847 | RetailMeNot (a) Digital Coupon Marketplace | 2,212,425 | |||||||||
Total Information | 234,753,804 | ||||||||||
Industrial Goods & Services – 19.9% | |||||||||||
Machinery – 15.6% | |||||||||||
| 605,000 | Ametek Aerospace/Industrial Instruments | 31,865,350 | |||||||||
| 380,000 | Nordson Dispensing Systems for Adhesives & Coatings | 28,234,000 | |||||||||
| 580,000 | Donaldson Industrial Air Filtration | 25,206,800 | |||||||||
| 187,000 | Moog (a) Motion Control Products for Aerospace, Defense & Industrial Markets | 12,704,780 | |||||||||
| 155,000 | HEICO FAA Approved Aircraft Replacement Parts | 6,528,600 | |||||||||
| 190,077 | ESCO Technologies Automatic Electric Meter Readers | 6,512,038 | |||||||||
| 124,000 | Kennametal Consumable Cutting Tools | 6,456,680 | |||||||||
| 24,000 | Middleby (a) Manufacturer of Cooking Equipment | 5,759,280 | |||||||||
| 88,736 | Toro Turf Maintenance Equipment | 5,643,610 | |||||||||
| Number of Shares | Value | ||||||||||
| 100,000 | Oshkosh Corporation Specialty Truck Manufacturer | $ | 5,038,000 | ||||||||
| 80,000 | Generac Standby Power Generators | 4,531,200 | |||||||||
| 67,000 | Dorman Products (a) Aftermarket Auto Parts Distributor | 3,756,690 | |||||||||
142,237,028 | |||||||||||
Industrial Materials & Specialty Chemicals – 1.9% | |||||||||||
| 234,000 | Drew Industries RV & Manufactured Home Components | 11,980,800 | |||||||||
| 157,000 | Polyone Intermediate Stage Chemicals Producer | 5,549,950 | |||||||||
17,530,750 | |||||||||||
Electrical Components – 1.1% | |||||||||||
| 64,000 | Acuity Brands Commercial Lighting Fixtures | 6,996,480 | |||||||||
| 134,000 | Thermon (a) Global Engineered Thermal Solutions | 3,662,220 | |||||||||
10,658,700 | |||||||||||
Other Industrial Services – 0.5% | |||||||||||
| 80,000 | KAR Auction Services Auto Auctions | 2,364,000 | |||||||||
| 47,000 | Forward Air Freight Transportation Between Airports | 2,063,770 | |||||||||
4,427,770 | |||||||||||
Industrial Distribution – 0.5% | |||||||||||
| 26,000 | WESCO International (a) Industrial Distributor | 2,367,820 | |||||||||
| 60,000 | MRC Global (a) Industrial Distributor | 1,935,600 | |||||||||
4,303,420 | |||||||||||
Construction – 0.3% | |||||||||||
| 58,000 | Fortune Brands Home & Security Home Building Supplies & Small Locks | 2,650,600 | |||||||||
Total Industrial Goods & Services | 181,808,268 | ||||||||||
See accompanying notes to financial statements.
7
Wanger USA 2013 Annual Report
Wanger USA
Statement of Investments, December 31, 2013
| Number of Shares | Value | ||||||||||
Finance – 15.7% | |||||||||||
Banks – 8.5% | |||||||||||
| 373,000 | MB Financial Chicago Bank | $ | 11,969,570 | ||||||||
| 107,000 | SVB Financial Group (a) Bank to Venture Capitalists | 11,220,020 | |||||||||
| 253,000 | Lakeland Financial Indiana Bank | 9,867,000 | |||||||||
| 485,000 | Associated Banc-Corp Midwest Bank | 8,439,000 | |||||||||
| 103,000 | City National Bank & Asset Manager | 8,159,660 | |||||||||
| 368,000 | TCF Financial Great Lakes Bank | 5,980,000 | |||||||||
| 161,194 | Hancock Holding Gulf Coast Bank | 5,912,596 | |||||||||
| 504,000 | Valley National Bancorp (b) New Jersey/New York Bank | 5,100,480 | |||||||||
| 666,200 | First Busey Illinois Bank | 3,863,960 | |||||||||
| 330,871 | First Commonwealth Western Pennsylvania Bank | 2,918,282 | |||||||||
| 97,700 | Sandy Spring Bancorp Baltimore & Washington, D.C. Bank | 2,754,163 | |||||||||
| 100,890 | Guaranty Bancorp Colorado Bank | 1,417,505 | |||||||||
77,602,236 | |||||||||||
Finance Companies – 3.6% | |||||||||||
| 339,400 | CAI International (a) International Container Leasing | 7,999,658 | |||||||||
| 82,000 | World Acceptance (a) (b) Personal Loans | 7,177,460 | |||||||||
| 174,900 | McGrath Rentcorp Temporary Space & IT Rentals | 6,961,020 | |||||||||
| 195,040 | H & E Equipment Services (a) Heavy Equipment Leasing | 5,779,035 | |||||||||
| 115,000 | Textainer Group Holdings (b) Top International Container Leaser | 4,625,300 | |||||||||
32,542,473 | |||||||||||
| Number of Shares | Value | ||||||||||
Savings & Loans – 1.5% | |||||||||||
| 326,600 | ViewPoint Financial Texas Thrift | $ | 8,965,170 | ||||||||
| 142,000 | Berkshire Hills Bancorp Northeast Thrift | 3,872,340 | |||||||||
| 52,011 | Simplicity Bancorp Los Angeles Savings & Loan | 840,498 | |||||||||
13,678,008 | |||||||||||
Brokerage & Money Management – 1.0% | |||||||||||
| 206,000 | SEI Investments Mutual Fund Administration & Investment Management | 7,154,380 | |||||||||
| 109,000 | Kennedy-Wilson Holdings Global Distressed Real Estate | 2,425,250 | |||||||||
9,579,630 | |||||||||||
Insurance – 0.6% | |||||||||||
| 27,000 | Allied World Holdings Commercial Lines Insurance/Reinsurance | 3,045,870 | |||||||||
| 19,000 | Enstar Group (a) Insurance/Reinsurance & Related Services | 2,639,290 | |||||||||
5,685,160 | |||||||||||
Diversified Financial Companies – 0.5% | |||||||||||
| 146,500 | Leucadia National Holding Company | 4,151,810 | |||||||||
Total Finance | 143,239,317 | ||||||||||
Consumer Goods & Services – 15.6% | |||||||||||
Travel – 5.5% | |||||||||||
| 659,500 | Avis Budget Group (a) Second Largest Car Rental Company | 26,656,990 | |||||||||
| 400,000 | Hertz (a) Largest U.S. Rental Car Operator | 11,448,000 | |||||||||
| 119,000 | Ryman Hospitality Properties (b) Convention Hotels | 4,971,820 | |||||||||
| 84,814 | Choice Hotels Franchisor of Budget Hotel Brands | 4,165,215 | |||||||||
| 72,000 | HomeAway (a) Vacation Rental Online Marketplace | 2,943,360 | |||||||||
50,185,385 | |||||||||||
See accompanying notes to financial statements.
8
Wanger USA 2013 Annual Report
Wanger USA
Statement of Investments, December 31, 2013
| Number of Shares | Value | ||||||||||
Retail – 3.0% | |||||||||||
| 382,000 | Pier 1 Imports Home Furnishing Retailer | $ | 8,816,560 | ||||||||
| 99,000 | Casey's General Stores Owner/Operator of Convenience Stores | 6,954,750 | |||||||||
| 100,619 | Shutterfly (a) Internet Photo-centric Retailer | 5,124,526 | |||||||||
| 70,000 | Fifth & Pacific Companies (a) Global Lifestyle Brand | 2,244,900 | |||||||||
| 25,000 | Restoration Hardware Holdings (a) Specialty Home Furnishing Retailer | 1,682,500 | |||||||||
| 47,224 | Burlington Stores (a) (b) Off-price Apparel Retailer | 1,511,168 | |||||||||
| 116,229 | Gaiam (a) Healthy Living Catalogs & eCommerce, Non-theatrical Media | 769,436 | |||||||||
27,103,840 | |||||||||||
Furniture & Textiles – 2.5% | |||||||||||
| 178,561 | Caesarstone (Israel) Quartz Countertops | 8,869,125 | |||||||||
| 474,000 | Knoll Office Furniture | 8,678,940 | |||||||||
| 135,000 | Interface Modular Carpet | 2,964,600 | |||||||||
| 65,000 | Herman Miller Office Furniture | 1,918,800 | |||||||||
22,431,465 | |||||||||||
Consumer Goods Distribution – 1.5% | |||||||||||
| 194,000 | Pool Swimming Pool Supplies & Equipment Distributor | 11,279,160 | |||||||||
| 28,000 | United Natural Foods (a) Distributor of Natural/Organic Foods to Grocery Stores | 2,110,920 | |||||||||
13,390,080 | |||||||||||
Other Consumer Services – 1.3% | |||||||||||
| 176,000 | Lifetime Fitness (a) Sport & Fitness Club Operator | 8,272,000 | |||||||||
| 132,500 | Blackhawk Network (a) Third Party Distributer of Prepaid Content, Mostly Gift Cards | 3,346,950 | |||||||||
11,618,950 | |||||||||||
| Number of Shares | Value | ||||||||||
Nondurables – 0.5% | |||||||||||
| 60,000 | Helen of Troy (a) Personal Care, Housewares, Healthcare & Home Environment Products | $ | 2,970,600 | ||||||||
| 52,000 | Prestige Brands Holdings (a) Household & Personal Care Products | 1,861,600 | |||||||||
4,832,200 | |||||||||||
Food & Beverage – 0.4% | |||||||||||
| 142,725 | Boulder Brands Inc (a) Healthy Food Products | 2,263,618 | |||||||||
| 53,000 | B&G Foods Acquirer of Small Food Brands | 1,797,230 | |||||||||
4,060,848 | |||||||||||
Other Durable Goods – 0.4% | |||||||||||
| 156,000 | Select Comfort (a) Specialty Mattresses | 3,290,040 | |||||||||
Restaurants – 0.3% | |||||||||||
| 57,500 | Fiesta Restaurant Group (a) Owns/Operates Two Restaurant Chains: Pollo Tropical & Taco Cabana | 3,003,800 | |||||||||
Apparel – 0.2% | |||||||||||
| 250,000 | Quiksilver (a) Action Sports Lifestyle Branded Apparel & Footwear | 2,192,500 | |||||||||
Total Consumer Goods & Services | 142,109,108 | ||||||||||
Health Care – 11.0% | |||||||||||
Biotechnology & Drug Delivery – 5.3% | |||||||||||
| 171,800 | Synageva Biopharma (a) Biotech Focused on Orphan Diseases | 11,118,896 | |||||||||
| 244,000 | Seattle Genetics (a) Antibody-based Therapies for Cancer | 9,733,160 | |||||||||
| 261,400 | NPS Pharmaceuticals (a) Orphan Drugs & Healthy Royalties | 7,936,104 | |||||||||
| 105,000 | Alnylam Pharmaceuticals (a) Biotech Developing Drugs for Rare Diseases | 6,754,650 | |||||||||
| 76,000 | BioMarin Pharmaceutical (a) Biotech Focused on Orphan Diseases | 5,340,520 | |||||||||
| 201,000 | InterMune (a) Drugs for Pulmonary Fibrosis & Hepatitis C | 2,960,730 | |||||||||
See accompanying notes to financial statements.
9
Wanger USA 2013 Annual Report
Wanger USA
Statement of Investments, December 31, 2013
| Number of Shares | Value | ||||||||||
Biotechnology & Drug Delivery – 5.3% (cont) | |||||||||||
| 142,000 | Sarepta Therapeutics (a) (b) Biotech Focused on Rare Diseases | $ | 2,892,540 | ||||||||
| 88,200 | Celldex Therapeutics (a) Biotech Developing Drugs for Cancer | 2,135,322 | |||||||||
48,871,922 | |||||||||||
Medical Supplies – 2.1% | |||||||||||
| 314,600 | Cepheid (a) Molecular Diagnostics | 14,698,112 | |||||||||
| 47,000 | Techne Cytokines, Antibodies & Other Reagents for Life Science | 4,449,490 | |||||||||
19,147,602 | |||||||||||
Health Care Services – 1.5% | |||||||||||
| 486,000 | Allscripts Healthcare Solutions (a) Health Care IT | 7,513,560 | |||||||||
| 70,000 | Envision Healthcare Holdings (a) Provider of Health Care Outsourcing Services | 2,486,400 | |||||||||
| 69,000 | HealthSouth Inpatient Rehabilitation Facilities | 2,299,080 | |||||||||
| 22,000 | Medidata Solutions (a) Cloud-based Software for Drug Studies | 1,332,540 | |||||||||
13,631,580 | |||||||||||
Pharmaceuticals – 1.2% | |||||||||||
| 395,649 | Akorn (a) Developer, Manufacturer & Distributor of Specialty Generic Drugs | 9,744,835 | |||||||||
| 175,100 | Alimera Sciences (a) (b) Ophthalmology-focused Pharmaceutical Company | 824,721 | |||||||||
10,569,556 | |||||||||||
Medical Equipment & Devices – 0.9% | |||||||||||
121,000 | Sirona Dental Systems (a) Manufacturer of Dental Equipment | 8,494,200 | |||||||||
Total Health Care | 100,714,860 | ||||||||||
Other Industries – 5.6% | |||||||||||
Real Estate – 5.0% | |||||||||||
| 503,000 | Extra Space Storage Self Storage Facilities | 21,191,390 | |||||||||
| 935,000 | Kite Realty Group Community Shopping Centers | 6,142,950 | |||||||||
| Number of Shares | Value | ||||||||||
| 213,600 | Biomed Realty Trust Life Science-focused Office Buildings | $ | 3,870,432 | ||||||||
| 119,000 | Coresite Realty Data Centers | 3,830,610 | |||||||||
| 411,900 | EdR Student Housing | 3,632,958 | |||||||||
| 341,000 | DCT Industrial Trust Industrial Properties | 2,431,330 | |||||||||
| 119,000 | Associated Estates Realty Multifamily Properties | 1,909,950 | |||||||||
| 91,000 | St. Joe (a) (b) Florida Panhandle Landowner | 1,746,290 | |||||||||
| 22,500 | American Residential Properties (a) (b) Single-family Rental Properties | 386,100 | |||||||||
45,142,010 | |||||||||||
Transportation – 0.6% | |||||||||||
| 184,487 | Rush Enterprises, Class A (a) Truck Sales & Service | 5,470,039 | |||||||||
Total Other Industries | 50,612,049 | ||||||||||
Energy & Minerals – 5.5% | |||||||||||
Oil & Gas Producers – 3.0% | |||||||||||
| 89,000 | SM Energy Oil & Gas Producer | 7,396,790 | |||||||||
| 94,000 | Rosetta Resources (a) Oil & Gas Producer Exploring in Texas | 4,515,760 | |||||||||
| 120,000 | Laredo Petroleum (a) Permian Basin Oil Producer | 3,322,800 | |||||||||
| 58,000 | PDC Energy (a) Oil & Gas Producer in U.S. | 3,086,760 | |||||||||
| 124,000 | WPX Energy (a) Oil & Gas Produced in U.S. & Argentina | 2,527,120 | |||||||||
| 82,000 | Bill Barrett Corporation (a) (b) Oil & Gas Producer in U.S. Rockies | 2,195,960 | |||||||||
| 49,000 | Carrizo Oil & Gas (a) Oil & Gas Producer | 2,193,730 | |||||||||
| 24,000 | Clayton Williams Oil & Gas Producer | 1,966,800 | |||||||||
| 10,308 | Matador Resources (a) Oil & Gas Producer in Texas & Louisiana | 192,141 | |||||||||
27,397,861 | |||||||||||
See accompanying notes to financial statements.
10
Wanger USA 2013 Annual Report
Wanger USA
Statement of Investments, December 31, 2013
| Number of Shares | Value | ||||||||||
Oil Services – 1.5% | |||||||||||
| 126,100 | Atwood Oceanics (a) Offshore Drilling Contractor | $ | 6,732,479 | ||||||||
| 73,000 | Hornbeck Offshore (a) Supply Vessel Operator in U.S. Gulf of Mexico | 3,593,790 | |||||||||
| 20,000 | Chart Industries (a) Manufacturer of Natural Gas Processing/Storage Equipment | 1,912,800 | |||||||||
| 24,000 | Gulfmark Offshore Operator of Offshore Supply Vessels | 1,131,120 | |||||||||
13,370,189 | |||||||||||
Mining – 1.0% | |||||||||||
| 47,000 | Core Labs (Netherlands) Oil & Gas Reservoir Consulting | 8,974,650 | |||||||||
Total Energy & Minerals | 49,742,700 | ||||||||||
| Total Equities (Cost: $432,744,936) – 99.0% | 902,980,106 | (c) | |||||||||
| Number of Shares | Value | ||||||||||
Short-Term Investments – 1.0% | |||||||||||
| 8,770,183 | JPMorgan U.S. Government Money Market Fund, Agency Shares (7 day yield of 0.01%) | $ | 8,770,183 | ||||||||
| Total Short-Term Investments (Cost: $8,770,183) – 1.0% | 8,770,183 | ||||||||||
Securities Lending Collateral – 2.9% | |||||||||||
| 27,065,053 | Dreyfus Government Cash Management Fund, Institutional Shares (7 day yield of 0.01%) (d) | 27,065,053 | |||||||||
| Total Securities Lending Collateral (Cost: $27,065,053) | 27,065,053 | ||||||||||
| Total Investments (Cost: $468,580,172)(e) – 102.9% | 938,815,342 | ||||||||||
| Obligation to Return Collateral for Securities Loaned – (2.9)% | (27,065,053 | ) | |||||||||
Cash and Other Assets Less Liabilities – —% (f) | 392,562 | ||||||||||
Net Assets – 100.0% | $ | 912,142,851 | |||||||||
ADR = American Depositary Receipts
Notes to Statement of Investments
(a) Non-income producing security.
(b) All or a portion of this security was on loan at December 31, 2013. The total market value of securities on loan at December 31, 2013 was $26,518,745.
(c) On December 31, 2013, the market value of foreign securities represented 2.38% of total net assets. The Fund's foreign portfolio was diversified as follows:
Country | Value | Percentage of Net Assets | |||||||||
Netherlands | $ | 8,974,650 | 0.99 | ||||||||
Israel | 8,869,125 | 0.97 | |||||||||
India | 3,834,250 | 0.42 | |||||||||
Total Foreign Portfolio | $ | 21,678,025 | 2.38 | ||||||||
(d) Investment made with cash collateral received from securities lending activity.
(e) At December 31, 2013, for federal income tax purposes, the cost of investments was $470,663,358 and net unrealized appreciation was $468,151,984 consisting of gross unrealized appreciation of $478,152,296 and gross unrealized depreciation of $10,000,312.
(f) Rounds to less than 0.1%.
See accompanying notes to financial statements.
11
Wanger USA 2013 Annual Report
Wanger USA
Statement of Investments, December 31, 2013
Fair Value Measurements
Various inputs are used in determining the value of the Fund's investments, following the input prioritization hierarchy established by accounting principles generally accepted in the United States of America (GAAP). These inputs are summarized in the three broad levels listed below:
• Level 1 – quoted prices in active markets for identical securities
• Level 2 – prices determined using other significant observable inputs (including quoted prices for similar securities, interest rates, prepayment speeds, credit risk and others)
• Level 3 – prices determined using significant unobservable inputs where quoted prices or observable inputs are unavailable or less reliable (including management's own assumptions about the factors market participants would use in pricing an investment)
The inputs or methodology used for valuing securities are not necessarily an indication of the risk associated with investing in those securities.
Examples of the types of securities in which the Fund would typically invest and how they are classified within this hierarchy are as follows. Typical Level 1 securities include exchange traded domestic equities, mutual funds whose NAVs are published each day and exchange traded foreign equities that are not statistically fair valued. Typical Level 2 securities include exchange traded foreign equities that are statistically fair valued, forward foreign currency exchange contracts and short-term investments valued at amortized cost. Additionally, securities fair valued by the Valuation Committee (the Committee) of the Fund's Board of Trustees (the Board) that rely on significant observable inputs are also included in Level 2. Typical Level 3 securities include any security fair valued by the Committee that relies on significant unobservable inputs.
Under the direction of the Board, the Committee is responsible for overseeing the valuation procedures approved by the Board.
The Committee meets as necessary, and no less frequently than quarterly, to determine fair values for securities for which market quotations are not readily available or for which the investment manager believes that available market quotations are unreliable, to review the appropriateness of the Trust's Portfolio Pricing Policy and the pricing procedures of the investment manager (the Policies), and to review the continuing appropriateness of the current value of any security subject to the Policies. The Policies address, among other things: circumstances under which market quotations will be deemed readily available; selection of third party pricing vendors; appropriate pricing methodologies; events that require fair valuation and fair value techniques; circumstances under which securities will be deemed to pose a potential for stale pricing, including when securities are illiquid, restricted, or in default; and certain delegations of authority to determine fair values to the Fund's investment manager. The Committee may also meet to discuss additional valuation matters, which may include review of back-testing results, review of time-sensitive information or approval of other valuation related actions, and to review the appropriateness of the Policies.
For investments categorized as Level 3, the significant unobservable inputs used in the fair value measurement of the Funds' securities may include: (i) data specific to the issuer or comparable issuers, (ii) general market or specific sector news and (iii) quoted prices and specific or similar security transactions. The Committee considers this data and any changes from prior periods in order to assess the reasonableness of observable and unobservable inputs, any assumptions or internal models used to value those securities and changes in fair value. Significant
changes in any of these factors could result in lower or higher fair value measurements. Various factors impact the frequency of monitoring (which may occur as often as daily), however the Committee may determine that changes to inputs, assumptions and models are not required with the same frequency.
The following table summarizes the inputs used, as of December 31, 2013, in valuing the Fund's assets:
Investment Type | Quoted Prices (Level 1) | Other Significant Observable Inputs (Level 2) | Significant Unobservable Inputs (Level 3) | Total | |||||||||||||||
Equities | |||||||||||||||||||
Information | $ | 234,753,804 | $ | — | $ | — | $ | 234,753,804 | |||||||||||
| Industrial Goods & Services | 181,808,268 | — | — | 181,808,268 | |||||||||||||||
Finance | 143,239,317 | — | — | 143,239,317 | |||||||||||||||
| Consumer Goods & Services | 142,109,108 | — | — | 142,109,108 | |||||||||||||||
Health Care | 100,714,860 | — | — | 100,714,860 | |||||||||||||||
Other Industries | 50,612,049 | — | — | 50,612,049 | |||||||||||||||
Energy & Minerals | 49,742,700 | — | — | 49,742,700 | |||||||||||||||
Total Equities | 902,980,106 | — | — | 902,980,106 | |||||||||||||||
| Total Short-Term Investments | 8,770,183 | — | — | 8,770,183 | |||||||||||||||
| Total Securities Lending Collateral | 27,065,053 | — | — | 27,065,053 | |||||||||||||||
Total Investments | $ | 938,815,342 | $ | — | $ | — | $ | 938,815,342 | |||||||||||
There were no transfers of financial assets between levels 1 and 2 during the period.
See accompanying notes to financial statements.
12
Wanger USA 2013 Annual Report
Statement of Assets and Liabilities
December 31, 2013
Assets: | |||||||
Investments, at cost | $ | 468,580,172 | |||||
| Investments, at value (including securities on loan of $26,518,745) | $ | 938,815,342 | |||||
Receivable for: | |||||||
Investments sold | 442,292 | ||||||
Fund shares sold | 1,019 | ||||||
Securities lending income | 95,012 | ||||||
Dividends | 1,019,663 | ||||||
Trustees' deferred compensation plan | 123,748 | ||||||
Prepaid expenses | 16,209 | ||||||
Total Assets | 940,513,285 | ||||||
Liabilities: | |||||||
Collateral on securities loaned | 27,065,053 | ||||||
Payable for: | |||||||
Investments purchased | 119,686 | ||||||
Fund shares redeemed | 915,527 | ||||||
Investment advisory fee | 21,413 | ||||||
Administration fee | 1,246 | ||||||
Transfer agent fee | 2 | ||||||
Trustees' fees | 995 | ||||||
Custody fee | 6,173 | ||||||
Reports to shareholders | 68,672 | ||||||
Chief compliance officer expenses | 2,052 | ||||||
Trustees' deferred compensation plan | 123,748 | ||||||
Other liabilities | 45,867 | ||||||
Total Liabilities | 28,370,434 | ||||||
Net Assets | $ | 912,142,851 | |||||
Composition of Net Assets: | |||||||
Paid-in capital | $ | 339,869,785 | |||||
Overdistributed net investment income | (117,058 | ) | |||||
Accumulated net realized gain | 102,154,954 | ||||||
Net unrealized appreciation (depreciation) on: | |||||||
Investments | 470,235,170 | ||||||
Net Assets | $ | 912,142,851 | |||||
Fund Shares Outstanding | 22,178,604 | ||||||
| Net asset value, offering price and redemption price per share | $ | 41.13 | |||||
Statement of Operations
For the Year Ended December 31, 2013
Investment Income: | |||||||
Dividends (net foreign taxes withheld of $26,287) | $ | 6,720,404 | |||||
Income from securities lending—net | 464,319 | ||||||
Total Investment Income | 7,184,723 | ||||||
Expenses: | |||||||
Investment advisory fee | 7,379,494 | ||||||
Transfer agent fees | 666 | ||||||
Administration fee | 428,839 | ||||||
Trustees' fees | 31,930 | ||||||
Custody fees | 20,474 | ||||||
Reports to shareholders | 190,262 | ||||||
Audit fees | 43,211 | ||||||
Legal fees | 79,702 | ||||||
Chief compliance officer expenses | 24,898 | ||||||
Commitment fee for line of credit (Note 5) | 5,091 | ||||||
Other expenses | 31,324 | ||||||
Total Expenses | 8,235,891 | ||||||
Net Investment Loss | (1,051,168 | ) | |||||
Net Realized and Unrealized Gain (Loss) on Investments: | |||||||
Net realized gain (loss) on: | |||||||
Investments | 105,713,380 | ||||||
Net realized gain | 105,713,380 | ||||||
Net change in unrealized appreciation (depreciation) on: | |||||||
Investments | 143,376,891 | ||||||
Net change in unrealized appreciation | 143,376,891 | ||||||
Net realized and unrealized gain | 249,090,271 | ||||||
Net Increase in Net Assets from Operations | $ | 248,039,103 | |||||
See accompanying notes to financial statements.
13
Wanger USA 2013 Annual Report
Statements of Changes in Net Assets
Year Ended December 31, | |||||||||||
Increase (Decrease) in Net Assets | 2013 | 2012 | |||||||||
Operations: | |||||||||||
Net investment income (loss) | $ | (1,051,168 | ) | $ | 3,561,029 | ||||||
Net realized gain (loss) on: | |||||||||||
Investments | 105,713,380 | 75,265,335 | |||||||||
Net change in unrealized appreciation (depreciation) on: | |||||||||||
Investments | 143,376,891 | 65,032,346 | |||||||||
Net Increase in Net Assets from Operations | 248,039,103 | 143,858,710 | |||||||||
Distributions to Shareholders From: | |||||||||||
Net investment income | (1,173,697 | ) | (2,425,860 | ) | |||||||
Net realized gains | (74,442,456 | ) | (39,051,960 | ) | |||||||
Total Distributions to Shareholders | (75,616,153 | ) | (41,477,820 | ) | |||||||
Share Transactions: | |||||||||||
Subscriptions | 24,527,584 | 29,722,426 | |||||||||
Distributions reinvested | 75,616,153 | 41,477,820 | |||||||||
Redemptions | (142,645,763 | ) | (148,920,836 | ) | |||||||
Net Decrease from Share Transactions | (42,502,026 | ) | (77,720,590 | ) | |||||||
Total Increase in Net Assets | 129,920,924 | 24,660,300 | |||||||||
Net Assets: | |||||||||||
Beginning of period | 782,221,927 | 757,561,627 | |||||||||
End of period | $ | 912,142,851 | $ | 782,221,927 | |||||||
Undistributed (Overdistributed) net investment income | $ | (117,058 | ) | $ | 1,047,346 | ||||||
See accompanying notes to financial statements.
14
Wanger USA 2013 Annual Report
Financial Highlights
The following table is intended to help you understand the Fund's financial performance. Certain information reflects financial results for a single share held for the periods shown. Per share net investment income (loss) amounts are calculated based on average shares outstanding during the period. Total return assumes reinvestment of all dividends and distributions, if any. Total return does not reflect payment of the expenses that apply to the variable accounts or contract charges, if any. Total return and portfolio turnover are not annualized for periods of less than one year.
Year Ended December 31, | |||||||||||||||||||||||
Selected data for a share outstanding throughout each period | 2013 | 2012 | 2011 | 2010 | 2009 | ||||||||||||||||||
Net Asset Value, Beginning of Period | $ | 33.84 | $ | 29.80 | $ | 33.86 | $ | 27.45 | $ | 19.30 | |||||||||||||
Income from Investment Operations: | |||||||||||||||||||||||
Net investment income (loss) | (0.05 | ) | 0.15 | (0.13 | ) | (0.10 | ) | (0.06 | ) | ||||||||||||||
Net realized and unrealized gain (loss) | 10.79 | 5.63 | (0.82 | ) | 6.51 | 8.21 | |||||||||||||||||
Total from Investment Operations | 10.74 | 5.78 | (0.95 | ) | 6.41 | 8.15 | |||||||||||||||||
Less Distributions to Shareholders: | |||||||||||||||||||||||
Net investment income | (0.06 | ) | (0.11 | ) | — | — | — | ||||||||||||||||
Net realized gains | (3.39 | ) | (1.63 | ) | (3.11 | ) | — | — | |||||||||||||||
Total Distributions to Shareholders | (3.45 | ) | (1.74 | ) | (3.11 | ) | — | — | |||||||||||||||
Net Asset Value, End of Period | $ | 41.13 | $ | 33.84 | $ | 29.80 | $ | 33.86 | $ | 27.45 | |||||||||||||
Total Return | 33.75 | % | 20.02 | %(a) | (3.49 | )%(a) | 23.35 | %(a) | 42.23 | % | |||||||||||||
Ratios to Average Net Assets/Supplemental Data: | |||||||||||||||||||||||
Total gross expenses (b) | 0.96 | % | 0.96 | % | 0.94 | % | 0.98 | %(c) | 0.98 | % | |||||||||||||
Total net expenses (b) | 0.96 | % | 0.96 | %(d) | 0.93 | %(d) | 0.97 | %(c)(d) | 0.98 | %(d) | |||||||||||||
Net investment income (loss) | (0.12 | )% | 0.45 | % | (0.40 | )% | (0.35 | )% | (0.29 | )% | |||||||||||||
Portfolio turnover rate | 15 | % | 12 | % | 10 | % | 27 | % | 30 | % | |||||||||||||
Net assets, end of period (000s) | $ | 912,143 | $ | 782,222 | $ | 757,562 | $ | 911,424 | $ | 1,277,154 | |||||||||||||
Notes to Financial Highlights
(a) Had the investment manager and/or its affiliates not waived a portion of expenses, total return would have been reduced.
(b) In addition to the fees and expenses which the Fund bears directly, the Fund indirectly bears a pro rata share of the fees and expenses of the acquired funds in which it invests, if any. Such indirect expenses are not included in the reported expense ratios.
(c) Includes interest expense which rounds to less than 0.01%.
(d) The benefits derived from custody fees paid indirectly had an impact of less than 0.01%.
See accompanying notes to financial statements.
15
Wanger USA 2013 Annual Report
Notes to Financial Statements
1. Nature of Operations
Wanger USA (the Fund), a series of Wanger Advisors Trust (the Trust), is registered under the Investment Company Act of 1940, as amended (the 1940 Act), as an open-end management investment company organized as a Massachusetts business trust. The investment objective of the Fund is to seek long-term capital appreciation. The Fund is available only for allocation to certain life insurance company separate accounts established for the purpose of funding participating variable annuity contracts and variable life insurance policies and may also be offered directly to certain qualified pension and retirement plans.
2. Significant Accounting Policies
The preparation of financial statements in accordance with accounting principles generally accepted in the United States of America (GAAP) requires management to make certain estimates and assumptions that affect the reported amounts of assets and liabilities, the disclosure of contingent assets and liabilities at the date of the financial statements and the reported amounts of revenue and expenses during the reporting period. Actual results could differ from those estimates.
Security valuation
Securities of the Fund are valued at market value or, if a market quotation for a security is not readily available or is deemed not to be reliable because of events or circumstances that have occurred between the market quotation and the time as of which the security is to be valued, the security is valued at its fair value determined in good faith under consistently applied procedures established by the Board of Trustees (the Board). A security traded on a securities exchange or in an over-the-counter market in which transaction prices are reported is valued at the last sales price at the time of valuation. A security traded principally on NASDAQ is valued at the NASDAQ official closing price. Mutual funds and exchange traded funds are valued at their closing net asset value as reported to the applicable exchange. A security for which there is no reported sale on the valuation date is valued at the mean of the latest bid and ask quotations.
Short-term investments maturing in 60 days or less are valued at amortized cost, which approximates market value.
A security for which a market quotation is not readily available and any other assets are valued at their fair value determined in good faith under consistently applied procedures established by the Board. The Trust has retained an independent statistical fair value pricing service that employs a systematic methodology to assist in the fair valuation process for securities principally traded in a foreign market in order to adjust for possible changes in value that may occur between the close of the foreign market and the time as of which the securities are to be valued. If a security is valued at a fair value, that value may be different from the last quoted market price for the security.
Security transactions and investment income
Security transactions are accounted for on the trade date (date the order to buy or sell is executed) and dividend income is recorded on the ex-dividend date, except that certain dividends from foreign securities are recorded as soon as the information
is available to the Fund. Interest income is recorded on the accrual basis and includes amortization of discounts on debt obligations when required for federal income tax purposes. Realized gains and losses from security transactions are recorded on an identified cost basis.
Awards, if any, from class action litigation related to securities owned may be recorded as a reduction of cost of those securities. If the applicable securities are no longer owned, the proceeds are recorded as realized gains.
The Fund estimates the tax character of distributions from real estate investment trusts (REITs). Distributions received in excess of income are recorded as a reduction of the cost of the related investments. If the applicable securities are no longer owned, any distributions received in excess of income are recorded as realized gains.
Expenses
General expenses of the Trust are allocated to the Fund and the other series of the Trust based upon relative net assets or other expense allocation methodologies determined by the nature of the expense. Expenses directly attributable to the Fund are charged to the Fund.
Fund share valuation
Fund shares are sold and redeemed on a continuing basis at net asset value. Net asset value per share is determined daily as of the close of trading on the New York Stock Exchange (the Exchange) on each day the Exchange is open for trading by dividing the total value of the Fund's investments and other assets, less liabilities, by the number of Fund shares outstanding.
Securities lending
The Fund may lend securities up to one-third of the value of its total assets to certain approved brokers, dealers and other financial institutions to earn additional income. The Fund retains the benefits of owning the securities, including receipt of dividends or interest generated by the security. The Fund also receives a fee for the loan. The Fund has the ability to recall the loans at any time and could do so in order to vote proxies or to sell the loaned securities. Each loan is collateralized by cash that exceeded the value of the securities on loan. The market value of the loaned securities is determined daily at the close of business of the Fund and any additional required collateral is delivered to each Fund on the next business day. The Fund has elected to invest the cash collateral in the Dreyfus Government Cash Management Fund and the income earned is paid to the Fund, net of any fees remitted to Goldman Sachs Agency Lending, the Fund's lending agent, and borrower rebates. The Fund's investment manager, Columbia Wanger Asset Management, LLC (CWAM), does not retain any fees earned by the lending program. Generally, in the event of borrower default, the Fund has the right to use the collateral to offset any losses incurred. In the event the Fund is delayed or prevented from exercising its right to dispose of the collateral, there may be a potential loss to the Fund. Some or all of these losses may be indemnified by the lending agent. The Fund bears the risk of loss with respect to the investment of collateral. The net lending income earned by the Fund as of December 31, 2013, is included in the Statement of Operations.
The following table presents the Fund's gross and net amount of assets available for offset under a securities lending agreement as well as the related collateral received by the Fund as of December 31, 2013:
| Gross Amounts of | Gross Amounts Offset in the | Net Amounts of Assets Presented in the | Gross Amounts Not Offset in the Statement of Assets and Liabilities | ||||||||||||||||||||||||||||
| Recognized Assets | Statement of Assets and Liabilities | Statement of Assets and Liabilities | Financial Instruments (a) | Cash Collateral Received | Securities Collateral Received | Net Amount (b) | |||||||||||||||||||||||||
Securities loaned | $ | 26,518,745 | $ | — | $ | 26,518,745 | $ | — | $ | 26,518,745 | $ | — | $ | — | |||||||||||||||||
(a) Represents the amount of assets that could be offset by liabilities with the same counterparty under master netting or similar agreements that management elects not to offset on the Statement of Assets and Liabilities.
(b) Represents the net amount due from counterparties in the event of default.
16
Wanger USA 2013 Annual Report
Notes to Financial Statements, continued
Federal income taxes
The Fund has complied with the provisions of the Internal Revenue Code available to regulated investment companies and, in the manner provided therein, distributes substantially all its taxable income, as well as any net realized gain on sales of investments and foreign currency transactions reportable for federal income tax purposes. Accordingly, the Fund paid no federal income taxes and no federal income tax provision was required.
Foreign capital gains taxes
Gains in certain countries may be subject to foreign taxes at the fund level. The Fund accrues for such foreign taxes on realized and unrealized gains at the appropriate rate for each jurisdiction. The amount, if any, is disclosed as a liability on the Statement of Assets and Liabilities.
Distributions to shareholders
Distributions to shareholders are recorded on the ex-dividend date.
Indemnification
In the normal course of business, the Trust on behalf of the Fund enters into contracts that contain a variety of representations and warranties and that provide general indemnities. The Fund's maximum exposure under these arrangements is unknown, as this would involve future claims against the Fund. Also under the Trust's organizational documents, the trustees and officers of the Trust are indemnified against certain liabilities that may arise out of their duties to the Trust. However based on experience, the Fund expects the risk of loss due to these warranties and indemnities to be remote.
3. Federal Tax Information
The timing and character of income and capital gain distributions are determined in accordance with income tax regulations, which may differ from GAAP. Reclassifications are made to the Fund's capital accounts for permanent tax differences to reflect income and gains available for distribution (or available capital loss carryforwards) under income tax regulations.
For the year ended December 31, 2013, permanent book and tax basis differences resulting primarily from distribution reclassifications, net operating loss reclassification and re-characterization of distributions for investments were identified and reclassified among the components of the Fund's net assets as follows:
| Accumulated Net Investment Income | Accumulated Net Realized Gain (Loss) | Paid-In Capital | |||||||||
| $ | 1,060,461 | $ | (1,060,462 | ) | $ | 1 | |||||
Net investment income and net realized gains (losses), as disclosed on the Statement of Operations, and net assets were not affected by this reclassification.
The tax character of distributions paid during the years ended December 31, 2013 and December 31, 2012 were as follows:
December 31, 2013 | December 31, 2012 | ||||||||||
Ordinary Income* | $ | 1,467,670 | $ | 2,425,860 | |||||||
Long-Term Capital Gains | 74,148,483 | 39,051,960 | |||||||||
* For tax purposes short-term capital gain distributions, if any, are considered ordinary income distributions.
As of December 31, 2013, the components of distributable earnings on a tax basis were as follows:
| Undistributed Ordinary Income | Undistributed Long-Term Capital Gains | Net Unrealized Appreciation (Depreciation)* | |||||||||
| $ | 1,494,710 | $ | 102,743,430 | $ | 468,151,984 | ||||||
* The differences between book-basis and tax-basis net unrealized appreciation/depreciation are primarily due to deferral of losses from wash sales.
Management is required to determine whether a tax position of the Fund is more likely than not to be sustained upon examination by the applicable taxing authority, including resolution of any related appeals or litigation processes, based on the technical merits of the position. The tax benefit to be recognized by the Fund is measured as the largest amount of benefit that is greater than fifty percent likely of being realized upon ultimate settlement. Management is not aware of any tax positions for which it is reasonably possible that the total amounts of unrecognized tax benefits will significantly change in the next twelve months. Management has concluded that there are no significant uncertain tax positions that would require recognition in the financial statements. However, management's conclusions may be subject to review and adjustment at a later date based on factors including, but not limited to, new tax laws, regulations, and administrative interpretations (including relevant court decisions). The Fund's federal tax returns for the prior three fiscal years remain subject to examination by the Internal Revenue Service.
4. Transactions with Affiliates
CWAM is a wholly owned subsidiary of Columbia Management Investment Advisers, LLC (Columbia Management), which in turn is a wholly owned subsidiary of Ameriprise Financial, Inc. (Ameriprise Financial). CWAM furnishes continuing investment supervision to the Fund and is responsible for the overall management of the Fund's business affairs.
CWAM receives a monthly advisory fee based on the Fund's average daily net assets at the following annual rates:
Average Daily Net Assets | Annual Fee Rate | ||||||
Up to $100 million | 0.94 | % | |||||
$100 million to $250 million | 0.89 | % | |||||
$250 million to $2 billion | 0.84 | % | |||||
| $2 billion and over | 0.80 | % | |||||
For the year ended December 31, 2013, the effective investment advisory fee rate was 0.86% of the Fund's average daily net assets.
CWAM provides administrative services and receives an administration fee from the Fund at the following annual rates:
| Wanger Advisors Trust Aggregate Average Daily Net Assets of the Trust | Annual Fee Rate | ||||||
Up to $4 billion | 0.05 | % | |||||
$4 billion to $6 billion | 0.04 | % | |||||
$6 billion to $8 billion | 0.03 | % | |||||
| $8 billion and over | 0.02 | % | |||||
For the year ended December 31, 2013, the effective administration fee rate was 0.05% of the Fund's average daily net assets. Columbia Management provides certain sub-administrative services to the Fund.
Columbia Management Investment Distributors, Inc. (CMID), a wholly owned subsidiary of Ameriprise Financial, serves as the Fund's distributor and principal underwriter.
Columbia Management Investment Services Corp. (CMIS), a wholly owned subsidiary of Ameriprise Financial, is the transfer agent to the Fund. For its services,
17
Wanger USA 2013 Annual Report
Notes to Financial Statements, continued
the Fund pays CMIS a monthly fee at the annual rate of $21.00 per open account. CMIS also receives reimbursement from the Fund for certain out-of-pocket expenses.
Certain officers and trustees of the Trust are also officers of CWAM. The Trust makes no direct payments to its officers and trustees who are affiliated with CWAM.
The Board has appointed a Chief Compliance Officer of the Trust in accordance with federal securities regulations. The Fund, along with other affiliated funds, pays its pro-rata share of the expenses associated with the Office of the Chief Compliance Officer.
The Trust offers a deferred compensation plan for its independent trustees. Under that plan, a trustee may elect to defer all or a portion of his or her compensation. Amounts deferred are retained by the Trust and may represent an unfunded obligation of the Trust. The value of amounts deferred is determined by reference to the change in value of Class Z shares of one or more series of Columbia Acorn Trust or a money market fund as specified by the trustee. Benefits under the deferred compensation plan are payable in accordance with the plan.
5. Borrowing Arrangements
During the year ended December 31, 2013, the Trust participated in a credit facility with JPMorgan Chase Bank, N.A., along with Columbia Acorn Trust, another trust managed by CWAM, in the amount of $150 million prior to January 11, 2013, $200 million for the period January 11, 2013 through July 21, 2013, and $150 million thereafter. The credit facility was entered into to facilitate portfolio liquidity. Under the facility, interest is charged to each participating fund based on its borrowings at a rate per annum equal to the Federal Funds Rate plus 1.00%. In addition, a commitment fee of 0.08% per annum of the unutilized line of credit is accrued and apportioned among the participating funds based on their relative net assets. The commitment fee is disclosed as a part of "Commitment fee for line of credit" in the Statement of Operations. The Trust expects to renew this line of credit for one year durations in July at then current market rates and terms.
No amounts were borrowed for the benefit of the Fund during the year ended December 31, 2013.
6. Fund Share Transactions
Proceeds and payments on Fund shares as shown in the Statement of Changes in Net Assets are in respect of the following numbers of shares:
| Year ended December 31, 2013 | Year ended December 31, 2012 | ||||||||||
Shares sold | 666,599 | 900,062 | |||||||||
| Shares issued in reinvestment of dividend distributions | 2,203,910 | 1,353,693 | |||||||||
Less shares redeemed | (3,806,028 | ) | (4,560,981 | ) | |||||||
Net increase (decrease) in shares outstanding | (935,519 | ) | (2,307,226 | ) | |||||||
7. Investment Transactions
The aggregate cost of purchases and proceeds from sales other than short-term obligations for the year ended December 31, 2013, were $126,895,122 and $256,164,856, respectively.
8. Shareholder Concentration
At December 31, 2013, one unaffiliated shareholder account owned 18.85% of the outstanding shares of the Fund. The Fund has no knowledge about whether any portion of those shares was owned beneficially by such account. Affiliated shareholder accounts owned 54.82% of the outstanding shares of the Fund. Subscription and redemption activity by concentrated accounts may have a significant effect on the operations of the Fund.
9. Subsequent Events
Management has evaluated the events and transactions that have occurred through the date the financial statements were issued and noted no items requiring adjustment of the financial statements or additional disclosure.
10. Information Regarding Pending and Settled Legal Proceedings
Ameriprise Financial and certain of its affiliates have historically been involved in a number of legal, arbitration and regulatory proceedings, including routine litigation, class actions, and governmental actions, concerning matters arising in connection with the conduct of their business activities. Ameriprise Financial believes that the Funds are not currently the subject of, and that neither Ameriprise Financial nor any of its affiliates are the subject of, any pending legal, arbitration or regulatory proceedings that are likely to have a material adverse effect on the Funds or the ability of Ameriprise Financial or its affiliates to perform under their contracts with the Funds. Ameriprise Financial is required to make 10-Q, 10-K and, as necessary, 8-K filings with the Securities and Exchange Commission on legal and regulatory matters that relate to Ameriprise Financial and its affiliates. Copies of these filings may be obtained by accessing the SEC website at www.sec.gov.
There can be no assurance that these matters, or the adverse publicity associated with them, will not result in increased fund redemptions, reduced sale of fund shares or other adverse consequences to the Funds. Further, although we believe proceedings are not likely to have a material adverse effect on the Funds or the ability of Ameriprise Financial or its affiliates to perform under their contracts with the Funds, these proceedings are subject to uncertainties and, as such, we are unable to estimate the possible loss or range of loss that may result. An adverse outcome in one or more of these proceedings could result in adverse judgments, settlements, fines, penalties or other relief that could have a material adverse effect on the consolidated financial condition or results of operations of Ameriprise Financial.
18
Wanger USA 2013 Annual Report
Report of Independent Registered Public Accounting Firm
To the Board of Trustees and Shareholders of Wanger USA:
In our opinion, the accompanying statement of assets and liabilities, including the statement of investments, and the related statements of operations and of changes in net assets and the financial highlights present fairly, in all material respects, the financial position of Wanger USA (a series of the Wanger Advisors Trust, hereinafter referred to as the "Fund") at December 31, 2013, the results of its operations for the year then ended, the changes in its net assets for each of the two years in the period then ended and the financial highlights for each of the five years in the period then ended, in conformity with accounting principles generally accepted in the United States of America. These financial statements and financial highlights (hereafter referred to as "financial statements") are the responsibility of the Fund's management; our responsibility is to express an opinion on these financial statements based on our audits. We conducted our audits of these financial statements in accordance with the standards of the Public Company Accounting Oversight Board (United States). Those standards require that we plan and perform the audit to obtain reasonable assurance about whether the financial statements are free of material misstatement. An audit includes examining, on a test basis, evidence supporting the amounts and disclosures in the financial statements, assessing the accounting principles used and significant estimates made by management, and evaluating the overall financial statement presentation. We believe that our audits, which included confirmation of securities at December 31, 2013 by correspondence with the custodian and brokers, provide a reasonable basis for our opinion.
PricewaterhouseCoopers LLP
Chicago, Illinois
February 18, 2014
19
Wanger USA 2013 Annual Report
Federal Income Tax Information (Unaudited)
The Fund hereby designates the following tax attributes in the fiscal year ended December 31, 2013.
Tax Designations | |||||||
Dividends Received Deduction | 100.00 | % | |||||
Capital Gain Dividend | $ | 107,927,816 | |||||
Foreign Taxes Paid | $ | 0 | |||||
Foreign Source Income | $ | 0 | |||||
Dividends Received Deduction. The percentage of ordinary income dividends paid during the fiscal year that qualifies for the corporate dividends received deduction.
Capital Gain Dividend. The Fund designates as a capital gain dividend the amount reflected above, or if subsequently determined to be different, the net capital gain of such fiscal period. The Fund also designates as capital gain dividends, to the extent necessary to fully distribute such capital gains, earnings and profits distributed to shareholders on the redemption of shares.
Foreign Taxes. The Fund makes the election to pass through to shareholders the foreign taxes paid. These taxes, and the corresponding foreign source income, are provided.
20
Wanger USA 2013 Annual Report
Board of Trustees and Management of Wanger Advisors Trust
Each trustee may serve a term of unlimited duration. The Trust's By-laws generally require that a trustee retire at the end of the calendar year in which the trustee attains the age of 75 years. The trustees appoint their own successors, provided that at least two-thirds of the trustees, after such appointment, have been elected by shareholders. Shareholders may remove a trustee, with or without cause, upon the vote of two-thirds of the Trust's outstanding shares at any meeting called for that purpose. A trustee may be removed, with or without cause, upon the vote of a majority of the trustees. The names of the trustees and officers of the Trust, the date each was first elected or appointed to office, their principal business occupations during at least the last five years, the number of portfolios in the fund complex they oversee, and other directorships they hold, are shown below. Each trustee serves in such capacity for each of the four series of Wanger Advisors Trust and for each of the eight series of Columbia Acorn Trust.
The address for the trustees and officers of the Trust is Columbia Wanger Asset Management, LLC, 227 West Monroe Street, Suite 3000, Chicago, Illinois 60606. The Funds' Statement of Additional Information includes additional information about the Funds' trustees and officers. You may obtain a free copy of the Statement of Additional Information by writing or calling toll-free:
Columbia Wanger Asset Management, LLC
Shareholder Services Group
227 W. Monroe, Suite 3000
Chicago IL 60606
1-800-922-6769
| Name, Position(s) with Wanger Advisors Trust and Age at December 31, 2013 | Year First Elected or Appointed to Office* | Principal Occupation(s) during Past Five Years | Number of Portfolios in Fund Complex Overseen by Trustee/Officer | Other Directorships in addition to Wanger Advisors Trust | |||||||||||||||
Trustees who are not interested persons of Wanger Advisors Trust: | |||||||||||||||||||
| Laura M. Born, 48, Trustee and Chair | 2007 | Adjunct Associate Professor of Finance, University of Chicago Booth School of Business; Managing Director – Investment Banking, JP Morgan Chase & Co. (broker/dealer) 2002-2007. | 12 | Columbia Acorn Trust; Carlson Wagonlit Travel, B.V. | |||||||||||||||
| Michelle L. Collins, 53, Trustee | 2008 | President, Cambium LLC (financial and business advisory firm) since 2007; Advisory Board Member, Svoboda Capital Partners LLC (private equity firm) since 2007. | 12 | Columbia Acorn Trust; Integrys Energy Group, Inc. (public utility); Molex, Inc. (electronics components manufacturer) 2003-2012; Bucyrus International, Inc. (manufacturer of mining equipment) 2009-2011. | |||||||||||||||
| Maureen M. Culhane, 65, Trustee | 2007 | Retired. Formerly, Vice President, Goldman Sachs Asset Management, L.P. (investment adviser), 2005-2007, and Vice President (Consultant) — Strategic Relationship Management, Goldman Sachs & Co., 1999-2005. | 12 | Columbia Acorn Trust | |||||||||||||||
| Margaret M. Eisen, 60, Trustee | 2002 | Chief Investment Officer, EAM International LLC (corporate finance and asset management) since 2003; Managing Director, CFA Institute, 2005-2008. | 12 | Columbia Acorn Trust; Burnham Investors Trust; Antigenics, Inc. (biotechnology and pharmaceuticals) 2003-2009. | |||||||||||||||
| John C. Heaton, 54, Trustee | 2010 | Deputy Dean for Faculty, University of Chicago Booth School of Business; Joseph L. Gidwitz Professor of Finance, University of Chicago Booth School of Business since 2000. | Columbia Acorn Trust | ||||||||||||||||
| Steven N. Kaplan, 54, Trustee and Vice Chair | 1999 | Neubauer Family Distinguished Service Professor of Entrepreneurship and Finance, University of Chicago Booth School of Business; faculty member of the University of Chicago Booth School of Business since 1998. | 12 | Columbia Acorn Trust; Accretive Health, Inc. (healthcare management services provider); Morningstar, Inc. (provider of independent investment research). | |||||||||||||||
21
Wanger USA 2013 Annual Report
Board of Trustees and Management of Wanger Advisors Trust
| Name, Position(s) with Wanger Advisors Trust and Age at December 31, 2013 | Year First Elected or Appointed to Office* | Principal Occupation(s) during Past Five Years | Number of Portfolios in Fund Complex Overseen by Trustee/Officer | Other Directorships in addition to Wanger Advisors Trust | |||||||||||||||
Trustees who are not interested persons of Wanger Advisors Trust: (continued) | |||||||||||||||||||
| David J. Rudis, 60, Trustee | 2010 | Retired. National Checking and Debit Executive, and Illinois President, Bank of America, 2007 – 2009; President, Consumer Banking Group, LaSalle National Bank, 2004 – 2007. | 12 | Columbia Acorn Trust | |||||||||||||||
| David B. Small, 57, Trustee | 2010 | Managing Director, Grosvenor Capital Management, L.P. (investment adviser) since 1994; Adjunct Associate Professor of Finance, University of Chicago Booth School of Business. | 12 | Columbia Acorn Trust | |||||||||||||||
Trustees who are interested persons of Wanger Advisors Trust: | |||||||||||||||||||
| Charles P. McQuaid, 60, Trustee and President (1), (2) | 1992 | President and Chief Investment Officer, CWAM or its predecessors, since October 2003; associated with CWAM or its predecessors as an investment professional since 1978. | 12 | Columbia Acorn Trust | |||||||||||||||
Trustee Emeritus | |||||||||||||||||||
| Ralph Wanger, 79, Trustee Emeritus (3) | 1970 | Founder, CWAM. Formerly, President, Chief Investment Officer and portfolio manager, CWAM or its predecessors, July 1992 – September 2003; Director, Wanger Investment Company PLC; Consultant to CWAM or its predecessors, September 2003 – September 2005. | 12 | Columbia Acorn Trust | |||||||||||||||
Officers of Wanger Advisors Trust: | |||||||||||||||||||
| Robert A. Chalupnik, 47, Vice President | 2011 | Portfolio manager and/or analyst, CWAM or its predecessors since 2000; Vice President Columbia Acorn Trust and Wanger Advisors Trust since May 2011. | 12 | N/A | |||||||||||||||
| Michael G. Clarke, 44, Assistant Treasurer | 2004 | Vice President, Columbia Management Investment Advisers, LLC since May 2010; Managing Director of Fund Administration, Columbia Management Advisors, LLC, September 2004 – April 2010; Senior officer, Columbia Funds and affiliated funds since 2002. | 12 | N/A | |||||||||||||||
| Joseph F. DiMaria, 44, Assistant Treasurer | 2010 | Vice President, Mutual Fund Administration, Columbia Management Investment Advisers, LLC, since May 2010; Director of Fund Administration, Columbia Management Advisors, LLC, January 2006 – April 2010. | 12 | N/A | |||||||||||||||
| P. Zachary Egan, 44, Vice President (2) | 2003 | Director of International Research, CWAM or its predecessors since December 2004; Vice President, Columbia Acorn Trust since 2003 and Wanger Advisors Trust since 2007; portfolio manager and/or analyst, CWAM or its predecessors, since 1999. | 12 | N/A | |||||||||||||||
| Fritz Kaegi, 42, Vice President | 2011 | Portfolio manager and/or analyst, CWAM or its predecessors since 2004; Vice President Columbia Acorn Trust and Wanger Advisors Trust since September 2011. | 12 | N/A | |||||||||||||||
| John Kunka, 43, Assistant Treasurer | 2006 | Director of Accounting and Operations, CWAM since 2006. | 12 | N/A | |||||||||||||||
| Stephen Kusmierczak, 46, Vice President | 2011 | Portfolio manager and/or analyst, CWAM or its predecessors since 2001; Vice President Columbia Acorn Trust and Wanger Advisors Trust since September 2011. | 12 | N/A | |||||||||||||||
| Joseph C. LaPalm, 44, Vice President | 2006 | Chief Compliance Officer, CWAM since 2005. | 12 | N/A | |||||||||||||||
22
Wanger USA 2013 Annual Report
Board of Trustees and Management of Wanger Advisors Trust
| Name, Position(s) with Wanger Advisors Trust and Age at December 31, 2013 | Year First Elected or Appointed to Office* | Principal Occupation(s) during Past Five Years | Number of Portfolios in Fund Complex Overseen by Trustee/Officer | Other Directorships in addition to Wanger Advisors Trust | |||||||||||||||
Officers of Wanger Advisors Trust: (continued) | |||||||||||||||||||
| Bruce H. Lauer, 56, Vice President, Secretary and Treasurer | 1995 | Chief Operating Officer, CWAM or its predecessors since April 2000; Vice President, Secretary and Treasurer, (Chief Financial and Accounting Officer), Columbia Acorn Trust and Wanger Advisors Trust since 1995; formerly, Director, Wanger Investment Company PLC; formerly, Director, Banc of America Capital Management (Ireland) Ltd.; and formerly, Director, Bank of America Global Liquidity Funds, PLC. | 12 | N/A | |||||||||||||||
| Louis J. Mendes III, 49, Vice President | 2003 | Portfolio manager and/or analyst, CWAM or its predecessors since 2001; Vice President, Columbia Acorn Trust since 2003 and Wanger Advisors Trust since 2005. | 12 | N/A | |||||||||||||||
| Robert A. Mohn, 52, Vice President (2) | 1997 | Director of Domestic Research, CWAM or its predecessors since March 2004; Vice President, Columbia Acorn Trust and Wanger Advisors Trust, since 1997; portfolio manager and/or analyst, CWAM or its predecessors since August 1992. | 12 | N/A | |||||||||||||||
| Christopher J. Olson, 49, Vice President | 2001 | Portfolio manager and/or analyst, CWAM or its predecessors, since January 2001; Vice President, Columbia Acorn Trust and Wanger Advisors Trust since 2001. | 12 | N/A | |||||||||||||||
| Christopher O. Petersen, 44, Assistant Secretary | 2010 | Vice President and Chief Counsel, Ameriprise Financial since January 2010 (formerly, Vice President and Group Counsel or Counsel, April 2004 – January 2010); officer, Columbia Funds and affiliated funds since 2007. | 12 | N/A | |||||||||||||||
| Scott R. Plummer, 54, Assistant Secretary | 2010 | Senior Vice President, Chief Legal Officer and Assistant Secretary, Columbia Management Investment Advisers, LLC (or its predecessors) since June 2005; Senior Vice President and Assistant General Counsel — Global Asset Management, Ameriprise Financial since February 2014 (previously, Senior Vice President and Lead Chief Counsel — Asset Management, 2012 – February 2014, Vice President and Lead Chief Counsel — Asset Management, 2010 – 2012, and Vice President and Chief Counsel — Asset Management, 2005 – 2010); Vice President, Chief Counsel and Assistant Secretary, Columbia Management Investment Distributors, Inc. (or its predecessors) since 2008; Vice President, General Counsel and Secretary, Ameriprise Certificate Company since 2005; Chief Counsel, RiverSource Distributors, Inc., 2006 – 2010; Senior officer, Columbia Funds and affiliated funds since 2006. | 12 | N/A | |||||||||||||||
| Robert P. Scales, 61, Chief Compliance Officer, Chief Legal Officer, Senior Vice President and General Counsel | 2004 | Chief Compliance Officer, Chief Legal Officer, Senior Vice President and General Counsel, Columbia Acorn Trust and Wanger Advisors Trust, since 2004. | 12 | N/A | |||||||||||||||
| Andreas Waldburg-Wolfegg, 47, Vice President | 2011 | Portfolio Manager and/or analyst of CWAM since 2002; Vice President Columbia Acorn Trust and Wanger Advisors Trust since September 2011. | 12 | N/A | |||||||||||||||
| Linda Roth-Wiszowaty, 44, Assistant Secretary | 2006 | Business support analyst, CWAM, since April 2007; prior thereto executive administrator, CWAM or its predecessors, and executive assistant to the Chief Operating Officer of CWAM or its predecessors. | 12 | N/A | |||||||||||||||
* Dates prior to April 1992 correspond to the date of first election or appointment as a trustee or officer of The Acorn Fund, Inc., the predecessor trust to Columbia Acorn Trust.
(1) Mr. McQuaid is an "interested person" of Wanger Advisors Trust and of CWAM, as defined in the Investment Company Act of 1940, because he is an officer of the Trust and of CWAM.
(2) Effective March 31, 2014, Mr. McQuaid expects to step down from his current role as President and Chief Investment Officer of CWAM. Effective April 1, 2014 it is expected that Mr. Mohn will become the Domestic Chief Investment Officer of CWAM and Mr. Egan will become the President and International Chief Investment Officer of CWAM.
(3) As permitted under the Wanger Advisors Trust's By-Laws, Mr. Wanger serves as a non-voting Trustee Emeritus of the Trust.
23
Wanger USA 2013 Annual Report
This page intentionally left blank.
24
Wanger USA 2013 Annual Report

Columbia Wanger Funds
Columbia Wanger Funds
Trustees
Laura M. Born
Chair of the Board
Steven N. Kaplan
Vice Chair of the Board
Michelle L. Collins
Maureen M. Culhane
Margaret M. Eisen
John C. Heaton
Charles P. McQuaid
David J. Rudis
David B. Small
Ralph Wanger (Trustee Emeritus)
Officers
Charles P. McQuaid
President
Robert A. Chalupnik
Vice President
Michael G. Clarke
Assistant Treasurer
Joseph F. DiMaria
Assistant Treasurer
P. Zachary Egan
Vice President
Fritz Kaegi
Vice President
John M. Kunka
Assistant Treasurer
Stephen Kusmierczak
Vice President
Joseph C. LaPalm
Vice President
Bruce H. Lauer
Vice President, Secretary and Treasurer
Louis J. Mendes III
Vice President
Robert A. Mohn
Vice President
Christopher J. Olson
Vice President
Christopher O. Petersen
Assistant Secretary
Scott R. Plummer
Assistant Secretary
Robert P. Scales
Chief Compliance Officer, Chief Legal Officer,
Senior Vice President and
General Counsel
Andreas Waldburg-Wolfegg
Vice President
Linda K. Roth-Wiszowaty
Assistant Secretary
Investment Manager
Columbia Wanger Asset Management,LLC
227 West Monroe Street, Suite 3000
Chicago, Illinois 60606
1-888-4-WANGER
(1-888-492-6437)
Transfer Agent,
Dividend Disbursing Agent
Columbia Management Investment Services Corp.
P.O.Box 8081
Boston, Massachusetts
02266-8081
Distributor
Columbia Management Investment Distributors, Inc.
225 Franklin Street
Boston, Massachusetts
02110
Legal Counsel to the Funds
Perkins Coie LLP
Washington, DC
Legal Counsel to the Independent Trustees
Drinker Biddle & Reath LLP
Philadelphia, Pennsylvania
Independent Registered Public Accounting Firm
PricewaterhouseCoopers LLP
Chicago, Illinois
This document contains Global Industry Classification
Standard data. The Global Industry Classification Standard ("GICS") was developed by and is the exclusive property and a service mark of MSCI Inc. ("MSCI") and Standard & Poor's Financial Services LLC ("S&P") and is licensed for use by Columbia Wanger Asset Management, LLC ("CWAM"). Neither MSCI, S&P, nor any other party involved in making or compiling the GICS or any GICS classifications makes any express or implied warranties or representations with respect to such standard or classification (or the results to be obtained by the use thereof), and all such parties hereby expressly disclaim all warranties of originality, accuracy, completeness, merchantability and fitness for a particular purpose with respect to any of such standard or classification. Without limiting any of the foregoing, in no event shall MSCI, S&P, any of their affiliates or any third party involved in making or compiling the GICS or any GICS classifications have any liability for any direct, indirect, special, punitive, consequential or any other damages (including lost profits) even if notified of the possibility of such damages.
This report, including the schedules of investments and financial statements, is submitted for the general information of the shareholders of the Wanger Advisors Trust.
A description of the Fund's proxy voting policies and procedures and a copy of the Fund's voting record for the most recent 12-month period ended June 30 are available (i) on our website, columbiamanagement.com, (ii) on the Securities and Exchange Commission's website at www.sec.gov, and (iii) without charge, upon request, by calling 888-492-6437.
The Fund files a complete schedule of portfolio holdings with the SEC for the first and third quarters of each fiscal year on Form N-Q. The Fund's Form N-Q is available on the SEC's website at www.sec.gov and may be reviewed and copied at the SEC's Public Reference Room in Washington, D.C. Information on the operation of the Pubic Reference Room may be obtained by calling 800-SEC-0330. The Fund's complete portfolio holdings are disclosed at www.columbiamanagement.com approximately 30 to 40 days after each month end.
25
Columbia Wanger Funds
© 2014 Columbia Management Investment Advisers, LLC. All rights reserved.
C-1466 E (2/14) 815627
Item 2. Code of Ethics.
(a) The registrant has adopted a code of ethics that applies to the registrant’s principal executive officer, principal financial officer, principal accounting officer or controller, or persons performing similar functions, regardless of whether these individuals are employed by the registrant or a third party.
(b) During the period covered by this report, there were not any amendments to a provision of the code of ethics adopted in 2(a) above.
(c) During the period covered by this report, there were no waivers, including any implicit waivers, from a provision of the code of ethics described in 2(a) above that relates to one or more of the items set forth in paragraph (b) of this item’s instructions.
Item 3. Audit Committee Financial Expert.
The registrant’s Board of Trustees has determined that Michelle L. Collins, a member of the registrant’s Board of Trustees and Audit Committee, qualifies as an audit committee financial expert. Ms. Collins is an independent trustee, as defined in paragraph (a)(2) of this item’s instructions.
Item 4. Principal Accountant Fees and Services.
(a) Audit Fees. Aggregate Audit Fees billed by the principal accountant for professional services rendered during the fiscal years ended December 31, 2013 and December 31, 2012 are approximately as follows:
2013 |
| 2012 |
| ||
$ | 104,200 |
| $ | 100,900 |
|
Audit Fees include amounts related to the audit of the registrant’s annual financial statements or services that are normally provided by the accountant in connection with statutory and regulatory filings or engagements for those fiscal years.
(b) Audit-Related Fees. Aggregate Audit-Related Fees billed to the registrant by the principal accountant for professional services rendered during the fiscal years ended December 31, 2013 and December 31, 2012 are approximately as follows:
2013 |
| 2012 |
| ||
$ | 18,200 |
| $ | 17,700 |
|
Audit-Related Fees include amounts for assurance and related services by the principal accountant that are reasonably related to the performance of the audit of the registrant’s financial statements and are not reported in Audit Fees above. In both fiscal years 2013 and 2012, Audit-Related Fees consist of agreed-upon procedures performed for other audit-related additional testing.
During the fiscal years ended December 31, 2013 and December 31, 2012, there were no Audit-Related Fees billed by the registrant’s principal accountant to the registrant’s investment adviser (not including any sub-adviser whose role is primarily portfolio management and is subcontracted with or overseen by another investment adviser) and any entity controlling, controlled by, or under common control with the adviser that provides ongoing services to the registrant for an engagement that related directly to the operations and financial reporting of the registrant.
(c) Tax Fees. Aggregate Tax Fees billed by the principal accountant to the registrant for professional services rendered during the fiscal years ended December 31, 2013 and December 31, 2012 are approximately as follows:
2013 |
| 2012 |
| ||
$ | 26,000 |
| $ | 25,500 |
|
Tax Fees incurred in both fiscal years 2013 and 2012 relate to the review of annual tax returns, the review of required shareholder distribution calculations and include amounts for professional services by the principal accountant for tax compliance, tax advice and tax planning.
During the fiscal years ended December 31, 2013 and December 31, 2012, there were no Tax Fees billed by the registrant’s principal accountant to the registrant’s investment adviser (not including any sub-adviser whose role is primarily portfolio management and is subcontracted with or overseen by another investment adviser) and any entity controlling, controlled by, or under common control with the adviser that provides ongoing services to the registrant for an engagement that related directly to the operations and financial reporting of the registrant.
(d) All Other Fees. Aggregate All Other Fees billed by the principal accountant to the registrant for professional services rendered during the fiscal years ended December 31, 2013 and December 31, 2012 are as follows:
2013 |
| 2012 |
| ||
$ | 0 |
| $ | 0 |
|
All Other Fees include amounts for products and services provided by the principal accountant, other than the services reported in paragraphs (a) through (c) above.
Aggregate All Other Fees billed by the registrant’s principal accountant to the registrant’s investment adviser (not including any sub-adviser whose role is primarily portfolio management and is subcontracted with or overseen by another investment adviser) and any entity controlling, controlled by, or under common control with the adviser that provides ongoing services to the registrant for an engagement that related directly to the operations and financial reporting of the registrant during the fiscal years ended December 31, 2013 and December 31, 2012 are approximately as follows:
2013 |
| 2012 |
| ||
$ | 135,000 |
| $ | 140,000 |
|
In both fiscal years 2013 and 2012, All Other Fees consist of professional services rendered for internal control reviews.
(e)(1) Audit Committee Pre-Approval Policies and Procedures
The policy of the registrant’s Audit Committee is to specifically pre-approve (i) all audit and non-audit (including audit related, tax and all other) services provided by the registrant’s independent auditor to the registrant and individual funds (collectively “Fund Services”) and (ii) all non-audit services provided by the registrant’s independent auditor to the funds’ adviser or a control affiliate of the adviser, that relate directly to the funds’ operations and financial reporting (collectively “Fund-related Adviser Services”). A “control affiliate” is an entity controlling, controlled by, or under common control with the adviser that provides ongoing services to the funds, and the term “adviser” is deemed to exclude any unaffiliated sub-adviser whose role is primarily portfolio management and is sub-contracted or overseen by another investment adviser.
If such Fund Services or Fund-related Adviser Services are required during the period between the Audit Committee’s regularly scheduled meetings, the Chairman of the Audit Committee has the authority to pre-approve the service, with reporting to the full Audit Committee at the next regularly scheduled meeting.
The Audit Committee will waive pre-approval of Fund Services or Fund-related Adviser Services provided that the requirements under paragraph (c)(7)(i)(C) of Rule 2-01 of Regulation S-X are met.
(e)(2) The percentage of services described in paragraphs (b) through (d) of this Item approved pursuant to the “de minimis” exception under paragraph (c)(7)(i)(C) of Rule 2-01 of Regulation S-X during both fiscal years ended December 31, 2013 and December 31, 2012 was zero.
(f) Not applicable.
(g) The aggregate non-audit fees billed by the registrant’s accountant for services rendered to the registrant, and rendered to the registrant’s investment adviser (not including any sub-adviser whose role is primarily portfolio management and is
subcontracted with or overseen by another investment adviser), and any entity controlling, controlled by, or under common control with the adviser that provides ongoing services to the registrant for the fiscal years ended December 31, 2013 and December 31, 2012 are approximately as follows:
2013 |
| 2012 |
| ||
$ | 179,200 |
| $ | 183,200 |
|
(h) The registrant’s Audit Committee of the Board of Directors has considered whether the provision of non-audit services that were rendered to the registrant’s adviser (not including any sub-adviser whose role is primarily portfolio management and is subcontracted with or overseen by another investment adviser), and any entity controlling, controlled by, or under common control with the investment adviser that provides ongoing services to the registrant that were not pre-approved pursuant to paragraph (c)(7)(ii) of Rule 2-01 of Regulation S-X, is compatible with maintaining the principal accountant’s independence.
Item 5. Audit Committee of Listed Registrants.
Not applicable.
Item 6. Investments
(a) The registrant’s “Schedule I – Investments in securities of unaffiliated issuers” (as set forth in 17 CFR 210.12-12) is included in Item 1 of this Form N-CSR.
(b) Not applicable
Item 7. Disclosure of Proxy Voting Policies and Procedures for Closed-End Management Investment Companies.
Not applicable.
Item 8. Portfolio Managers of Closed-End Management Investment Companies.
Not applicable.
Item 9. Purchases of Equity Securities by Closed-End Management Investment Company and Affiliated Purchasers.
Not applicable.
Item 10. Submission of Matters to a Vote of Security Holders.
There were no material changes to the procedures by which shareholders may recommend nominees to the registrant’s board of directors.
Item 11. Controls and Procedures.
(a) The registrant’s principal executive officer and principal financial officers, based on their evaluation of the registrant’s disclosure controls and procedures as of a date within 90 days of the filing of this report, have concluded that such controls and procedures are adequately designed to ensure that material information required to be disclosed by the registrant in Form N-CSR is accumulated and communicated to the registrant’s management, including the principal executive officer and principal financial officer, or persons performing similar functions, as appropriate to allow timely decisions regarding required disclosure.
(b) There was no change in the registrant’s internal control over financial reporting that occurred during the registrant’s second fiscal quarter of the period covered by this report that has materially affected, or is reasonably likely to materially affect, the registrant’s internal control over financial reporting.
Item 12. Exhibits.
(a)(1) Code of ethics required to be disclosed under Item 2 of Form N-CSR attached hereto as Exhibit 99.CODE ETH.
(a)(2) Certifications pursuant to Rule 30a-2(a) under the Investment Company Act of 1940 (17 CFR 270.30a-2(a)) attached hereto as Exhibit 99.CERT.
(a)(3) Not applicable.
(b) Certification pursuant to Rule 30a-2(b) under the Investment Company Act of 1940 (17 CFR 270.30a-2(b)) attached hereto as Exhibit 99.906CERT.
SIGNATURES
Pursuant to the requirements of the Securities Exchange Act of 1934 and the Investment Company Act of 1940, the registrant has duly caused this report to be signed on its behalf by the undersigned, thereunto duly authorized.
(registrant) |
| Wanger Advisors Trust |
| ||
|
|
| |||
|
|
| |||
By (Signature and Title) |
| /s/ Charles P. McQuaid |
| ||
| Charles P. McQuaid, President | ||||
|
|
| |||
|
|
| |||
Date |
| February 18, 2014 |
| ||
Pursuant to the requirements of the Securities Exchange Act of 1934 and the Investment Company Act of 1940, this report has been signed below by the following persons on behalf of the registrant and in the capacities and on the dates indicated.
By (Signature and Title) |
| /s/ Charles P. McQuaid |
| |
| Charles P. McQuaid, President | |||
|
|
| ||
|
|
| ||
Date |
| February 18, 2014 |
| |
|
|
| ||
|
|
| ||
By (Signature and Title) |
| /s/ Bruce H. Lauer |
| |
| Bruce H. Lauer, Treasurer | |||
|
|
| ||
|
|
| ||
Date |
| February 18, 2014 |
| |