UNITED STATES
SECURITIES AND EXCHANGE COMMISSION
Washington, D.C. 20549
FORM N-CSR
CERTIFIED SHAREHOLDER REPORT OF REGISTERED
MANAGEMENT INVESTMENT COMPANIES
Investment Company Act file number | 811-08748 |
|
Wanger Advisors Trust |
(Exact name of registrant as specified in charter) |
|
One Financial Center, Boston, Massachusetts | | 02111 |
(Address of principal executive offices) | | (Zip code) |
|
Scott R. Plummer
5228 Ameriprise Financial Center
Minneapolis, MN 55474 |
(Name and address of agent for service) |
|
Registrant’s telephone number, including area code: | 1-612-671-1947 | |
|
Date of fiscal year end: | December 31 | |
|
Date of reporting period: | December 31, 2010 | |
| | | | | | | | |
Form N-CSR is to be used by management investment companies to file reports with the Commission not later than 10 days after the transmission to stockholders of any report that is required to be transmitted to stockholders under Rule 30e-1 under the Investment Company Act of 1940 (17 CFR 270.30e-1). The Commission may use the information provided on Form N-CSR in its regulatory, disclosure review, inspection, and policymaking roles.
A registrant is required to disclose the information specified by Form N-CSR, and the Commission will make this information public. A registrant is not required to respond to the collection of information contained in Form N-CSR unless the Form displays a currently valid Office of Management and Budget (“OMB”) control number. Please direct comments concerning the accuracy of the information collection burden estimate and any suggestions for reducing the burden to Secretary, Securities and Exchange Commission, 450 Fifth Street, NW, Washington, DC 20549-0609. The OMB has reviewed this collection of information under the clearance requirements of 44 U.S.C. § 3507.
Item 1. Reports to Stockholders.
Wanger International Select
2010 Annual Report

Not FDIC insured • No bank guarantee • May lose value

Wanger International Select
2010 Annual Report
Table of Contents
| 1 | | | Understanding Your Expenses | |
|
| 2 | | | The Keys to Prosperity | |
|
| 4 | | | Performance Review | |
|
| 6 | | | Statement of Investments | |
|
| 11 | | | Statement of Assets and Liabilities | |
|
| 11 | | | Statement of Operations | |
|
| 12 | | | Statement of Changes in Net Assets | |
|
| 13 | | | Financial Highlights | |
|
| 14 | | | Notes to Financial Statements | |
|
| 18 | | | Report of Independent Registered Public Accounting Firm | |
|
| 19 | | | Federal Income Tax Information | |
|
| 20 | | | Board of Trustees and Management of Wanger Advisors Trust | |
|
Columbia Wanger Asset Management, LLC (CWAM) is one of the leading global small- and mid-cap equity managers in the United States with 40 years of small- and mid-cap investment experience. As of December 31, 2010, CWAM managed $33.9 billion in assets, and is the investment adviser to Wanger USA, Wanger International, Wanger Select and Wanger International Select (together, the Columbia Wanger Funds) and the Columbia Acorn Family of Funds.
Investors should consider the investment objectives, risks, charges and expenses of a mutual fund carefully before investing. For a free prospectus, which contains this and other important information about the Fund, contact your financial adviser or insurance company or contact 1-888-4-WANGER. Read the prospectus carefully before investing.
An important note: Columbia Wanger Funds are sold only to certain life insurance companies in connection with certain variable annuity contracts, variable life insurance policies and eligible qualified retirement plans.
The views expressed in "The Keys to Prosperity" and in the Performance Review reflect the current views of the respective authors. These views are not guarantees of future performance and involve certain risks, uncertainties and assumptions that are difficult to predict so actual outcomes and results may differ significantly from the views expressed. These views are subject to change at any time based upon economic, market or other conditions and the respective parties disclaim any responsibility to update such views. These views may not be relied on as investment advice and, because investment decisions for a Columbia Wanger Fund are based on numerous factors, may not be relied on as an indication of trading intent on behalf of any particular Columbia Wanger Fund. References to specific company securities should not be construed as a recommendation or investment advice.
Wanger International Select 2010 Annual Report
Understanding Your Expenses
As a Fund shareholder, you incur three types of costs. There are transaction costs, which generally include sales charges on purchases and may include redemption or exchange fees. There are also ongoing costs, which generally include investment advisory fees and other Fund expenses. Lastly, there may be additional fees or charges imposed by the insurance company that sponsors your variable annuity product. The information on this page is intended to help you understand your ongoing costs of investing in the Fund and to compare these costs with the ongoing costs of investing in other mutual funds.
Analyzing your Fund's expenses
To illustrate these ongoing costs, we have provided an example and calculated the expenses paid by investors in the Fund during the period. The information in the following table is based on an initial, hypothetical investment of $1,000, which is invested at the beginning of the period and held for the entire period. Expense information is calculated two ways and each method provides you with different results. The amount listed in the "Actual" column is calculated using actual operating expenses and total return for the Fund. The amount listed in the "Hypothetical" column assumes that the return each year is 5% before expenses and then applies the Fund's actual expense ratio for the period to the hypothetical return. You should not use the hypothetical account values and expenses to estimate either your actual account balance at the end of the period or the expenses you paid during the period. See "Compare with other funds" for details on using the hypothetical data.
Estimating your actual expenses
To estimate the expenses that you actually paid over the period, first you will need your account balance at the end of the period.
1. Divide your ending account balance by $1,000. For example, if an account balance was $8,600 at the end of the period, the result would be 8.6.
2. In the section of the table below titled "Expenses paid during the period," you will find a dollar amount in the column labeled "Actual." Multiply this amount by the result from step 1. Your answer is an estimate of the expenses you paid on your account during the period.
July 1, 2010 – December 31, 2010
| | | Account value at the
beginning of the period ($) | | Account value at the
end of the period ($) | | Expenses paid during
the period ($) | | Fund's annualized
expense ratio (%)* | |
| | | Actual | | Hypothetical | | Actual | | Hypothetical | | Actual | | Hypothetical | | Actual | |
| Wanger International Select | | | 1,000.00 | | | | 1,000.00 | | | | 1,273.60 | | | | 1,018.40 | | | | 7.74 | | | | 6.87 | | | | 1.35 | | |
*Expenses paid during the period are equal to the Fund's annualized expense ratio, multiplied by the average account value over the period, then multiplied by the number of days in the Fund's most recent fiscal half-year and divided by 365.
It is important to note that the expense amounts shown in the table are meant to highlight only ongoing costs of investing in the Fund. Expenses paid during the period do not include any insurance charges imposed by your insurance company's separate account. The hypothetical example provided is useful in comparing ongoing costs only and will not help you determine the relative total costs of owning different funds whose shareholders may incur transaction costs.
Compare with other funds
Since all mutual funds are required to include the same hypothetical calculations about expenses in shareholder reports, you can use this information to compare the ongoing cost of investing in the Fund with other funds. To do so, compare the 5% hypothetical example with the 5% hypothetical examples of other funds. As you compare hypothetical examples of other funds, it is important to note that hypothetical examples are meant to highlight the ongoing cost of investing in a fund and do not reflect any transaction costs, such as sales charges, redemption fees or exchange fees that may be incurred by shareholders of other funds. Expenses paid during the period do not include any insurance charges imposed by your insurance company's separate accounts.
1
Wanger International Select 2010 Annual Report

The Keys to Prosperity
In 1651, Thomas Hobbes described human life as "poor, nasty, brutish and short." Today, 360 years later, humanity has achieved record levels of prosperity, safety and longevity. The United Nations estimates that poverty was reduced more in the last 50 years than the previous 500.1 In the developing world, life expectancy rose from 44 years to 64 years from 1950 to 1999, while in the developed world, life expectancy rose from 66 years to 78 years.2
Hobbes's perspective was accurate for his time. There was very little growth in worldwide per capita GDP until about 1820; income in Europe had dropped for centuries following the decline and collapse of the Roman Empire.3 England and much of Europe were caught in a Malthusian trap, with population gyrating up and down largely due to plagues, famines and wars. But sometime around 1820, economic growth accelerated, and per capita GDP growth has averaged over 2% yearly since then, compounding into excellent gains in living standards.4 Why?
Four Conditions for Growth
William Bernstein's The Birth of Plenty, How Prosperity in the Modern World was Created is a fascinating history of worldwide economic circumstances. He discusses reasons for the successes and failures of many empires and countries. Bernstein believes that four institutional conditions are necessary for sustained growth: property rights and civil liberties, scientific rationalism, efficient capital markets, and fast and cheap transportation and communications. He notes that these four factors existed temporarily in sixteenth century Holland, then firmly in the English speaking countries, and in the last 50 years, increasingly over much of the world.5
Physical and intellectual property rights plus civil liberties create incentives and intellectual freedom to work hard, innovate and create wealth. In empires, totalitarian states and feudalistic societies, incentives to produce beyond immediate needs are nil, because governments or lords tend to impose confiscatory taxes and arbitrarily seize property. Bernstein believes that Rome fell, in part, due to excessive taxation on farmers. He also thinks that an independent judiciary is necessary to enforce property rights and civil liberties.
Scientific rationalism is needed for technological progress and innovation. Throughout history, various regimes run by church and state ossified due to the rejection of scientific observations in favor of dogma or preconceived beliefs. During medieval times, for example, astronomers who concluded the earth revolved around the sun were tortured. Bernstein cites the trial of Galileo as a turning point toward scientific rationalism. Early inventors then tended to be tinkerers rather than scientists, but science became increasingly important. For example, by the nineteenth century the steel industry had initiated the use of modern science laboratories staffed by full-time researchers.6
Efficient capital markets enable entrepreneurs and enterprises to raise capital at reasonable costs. I remember Jesse Jackson citing a lack of capital as a cause for inner city poverty: "Capitalism without capital is just plain ism."7 Bernstein notes that entrepreneurs once had huge downside risk from failures, namely debtors prisons in recent centuries and enslavement by creditors in ancient times. The creation of limited liability corporations during the nineteenth century in Britain and the United States was a breakthrough in reducing downside risks for capitalists.
Fast and cheap transportation and communication are also needed for prosperity. Bernstein explains that before railroads and the telegraph, transportation and communication were horribly expensive and slow. Rarely could bulk goods be transported over land more than 20 miles a day, and theft was rampant. Local crop failures often caused starvation. Mass markets did not exist. The reach of rail and telegraph grew incredibly rapidly during their first decades, spurring economic growth.
Bernstein provides plenty of case studies of regimes and countries that stagnated or failed due to the lack of one or more conditions, ranging from ancient societies and Japan under the samurai to Communist countries of the twentieth century. He states, "Institutions, not the bounty of nature or freedom from imperialist domination, separate the winners from the losers in the global economy."8
Trade Drives Prosperity
Matt Ridley's The Rational Optimist, How Prosperity Evolves adds substantial perspective to Bernstein's work and provides comforting thoughts about the future. Though Ridley does not mention Bernstein by name, it is clear that he agrees with Bernstein's basic contentions. Ridley sees property rights as the primary key to prosperity. He quotes a study by MIT economist Daron Acemoglu, which compared measures of property rights to economic growth across countries and determined that three-quarters of the variation of economic growth is explained by property rights.9 Ridley adds, "In a sample of 127 countries, the sixty-three with higher economic freedom had more than four times the inco me per capita and twice the growth rate of the countries that did not."10
Ridley's emphasis is on trade, which he believes allows increasing specialization, expertise, productivity and innovation. Humans seem to be hard-wired for trade. Archaeological evidence indicates that some 100,000 years ago humans began to barter.11 People traded things and also absorbed ideas. Human intelligence became collective and cumulative. Ridley states that, more recently, the history of the modern world is a history of ideas meeting, mixing, mating and mutating.12 Innovation results from an exchange of ideas. I think of the iPhone. Steve Jobs utilizes technologies and resources developed over centuries and components originated in many countries to make an incredibly inn ovative and useful device.
Ridley notes that societies that halted trade regressed. After ocean levels rose 10,000 years ago and cut off Tasmania from Australia, people there gradually lost the ability to fish and make tools out of bones. European mariners discovered
2
Wanger International Select 2010 Annual Report
Tasmanians wearing nothing but wallaby pelts and seal-fat grease.13 As another example of a closed-off society, Ridley writes, "China went from a state of economic and technological exuberance in around AD 1000 to one of dense population, agrarian backwardness and desperate poverty in 1950;" per capita income there was about flat in those 950 years.14
Ridley takes a libertarian view, highly skeptical of government. He states, "...governments generally tend to be good things at first and bad things the longer they last. First they improve society's ability to flourish by providing central services and removing impediments to trade and specialization... But...governments gradually employ more and more ambitious elites who... give themselves more and more rules to enforce, until they kill the goose that lays the golden eggs. ... Because it is a monopoly, government brings inefficiency and stagnation to most things it runs..."15
Ridley asserts that African governments have largely caused economic problems in Africa. He writes that famines in Darfur and Zimbabwe were the result of government policies. Setting up a company in Tanzania takes 379 days and $5,500, a huge sum there. Botswana has done substantially better, growing per capita GDP nearly 8% annually since its independence in 1966. That growth exceeded China's, and is largely due to secure property rights, Ridley says. Ridley is optimistic for much of Africa, however. Cell phones are spreading rapidly, providing both communication and micro-finance (two of Bernstein's conditions for prosperity). Ridley cites wonderful examples of products and labor reaching optimal markets and payments being made over cell phones.16
Ridley has comforting thoughts about the future, debunking naysayers. He notes that (oddly enough) over time humans have temporarily exhausted or driven to extinction renewable resources like forests and certain animal species, while non-renewable resources have lasted much longer than many expected. In 1865, an economist said Britain's coal was running out, and as early as 1914 the U.S. Bureau of Mines wrote that American oil reserves would last 10 years.17
Ridley believes supplies of oil, coal and gas "will last decades, perhaps centuries, and people will find alternatives long before they run out."18 He states that prices of conventional fuels need to rise and prices of alternatives need to fall, and both will occur as conventional supplies run down and efficiencies of alternatives rise. Ridley notes that wind, solar and biomass alternatives envelop enormous quantities of land. He denounces organic farming, noting that if farm yields fell back to 1961 levels, 82% of the land area of the earth would be needed for farming, up from 38%. "The Dark Ages were a massive experiment in back-to-the-land hippy lifestyle (without the trust fund)," he says.19
Ridley largely dismisses climate change fears. The scenario that calls for significant climate change by the year 2100 is a scenario of dramatic economic growth. He believes the world, and especially developing countries, will be much, much richer and better able to adapt to and mitigate climate change. In the meantime, carbon intensity20 of the worldwide economy is rapidly dropping, as wood, dung and coal become relatively less important and natural gas and nuclear power gain share, in an environment of substantially more efficient lighting, heating, transportation and manufacturing.
While some of Ridley's arguments seem a bit over the top, I think they generally appear coherent and largely believable. As to the climate change issue, I advocate taking reasonable steps to mitigate global warming. Most of my family's road miles are in a hybrid vehicle and both my home and Columbia Wanger Asset Management have adopted compact florescent lighting. Several years ago we calculated that replacing over 100 incandescent bulbs at the office saved enough electricity to power three average-sized homes.
I agree that prosperity is driven by the factors named by Bernstein and Ridley and, though there are imbalances in world economics, I think things will be okay. The Great Recession has ended, growth has resumed and the keys to prosperity remain in place. Many parts of the developing world are booming and we have invested accordingly.


Charles P. McQuaid
President and Chief Investment Officer
Columbia Wanger Asset Management, LLC
The information and data provided in this analysis are derived from sources that we deem to be reliable and accurate. These views are not guarantees of future performance and involve certain risks, uncertainties and assumptions that are difficult to predict so actual outcomes and results may differ significantly from the views expressed. The views/opinions expressed in this essay are those of the author and not of the Wanger Advisors Trust Board, are subject to change at any time based upon economic, market or other conditions, may differ from views expressed by other Columbia Management associates and the respective parties disclaim any responsibility to update such views. These views may not be relied on as investment advice and, because investment decisions for a Columbia Wanger Fund are based on numerous factors, may not be relied on as an indication of trading intent on behalf of any particular Columbia Wanger Fund.
The information included on Pages 2 and 3 of this report is unaudited.
1 Ridley, Matt, The Rational Optimist, How Prosperity Evolves, (New York, New York, HarperCollins 2010), p. 15.
2 Bernstein, William J., The Birth of Plenty, How the Prosperity of the Modern World was Created, (New York, New York, McGraw-Hill 2004), p. 10.
3 Ibid, p. 3.
4 Ibid, p. 12, 23.
5 Ibid, p. 15-17.
6 Ibid, p. 123.
7 Rev. Jesse Jackson quoted in an article that appeared in Ebony magazine, August 1967, titled "Apostles of Economics," p. 84.
8 Bernstein, William J., op. cit, p. 293.
9 Ridley, Matt, op. cit, p. 321.
10 Ibid, p. 117.
11 Ibid, p. 350.
12 Ibid, p. 272.
13 Ibid, p. 78.
14 Ibid, p. 180.
15 Ibid, p. 182.
16 Ibid, p. 320-326.
17 Ibid, p. 237.
18 Ibid, p. 238.
19 Ibid, p. 144, 175.
20 Carbon intensity is defined as the amount of CO2 produced divided by worldwide GDP.
3
Wanger International Select 2010 Annual Report

Performance Review Wanger International Select

Christopher J. Olson
Portfolio Manager
Performance data shown represents past performance and is not a guarantee of future results. The investment return and principal value will fluctuate so that shares, when redeemed, may be worth more or less than the original cost. Current performance may be lower or higher than the performance data shown. For daily and most recent month-end performance updates, please call 1-888-4-WANGER.
Wanger International Select ended 2010 up 22.09%, outperforming its primary benchmark, the S&P Developed Ex-U.S. Between $2B and $10B Index, which gained 20.16%. 2010 turned out to be a very strong year for the global equity markets.
Top contributors to Fund performance included two names in the energy sector. Pacific Rubiales Energy, a Colombian oil exploration and development company, benefited from new oilfield discoveries. The stock was up 129% for the year. In the Netherlands, sub-sea oilfield services provider Fugro had a 48% gain as customers confirmed their commitment to deep water drilling and higher oil prices led to a recovery in oil industry exploration spending.
Two mining companies were also among the top contributors. China's Zhaojin Mining Industry ended the year up 113% as the company continued to benefit from strong production and exploration profiles and rising gold prices. In Canada, Pan American Silver, a silver miner, gained 54%. Silver prices rose 83% over the year and the company continued to move forward on two large exploration projects.
The Fund's investment in Swedish measurement equipment manufacturer Hexagon ended the year up 71%. The company has been enjoying strong sales growth both in Europe and emerging markets. Naspers, a media company with assets in South Africa, China and other emerging markets, was up 48% for the year. Results in the company's underlying businesses remained strong, driven by increasing levels of Internet usage throughout its emerging market Internet holdings.
Underperformers included Cobham, a UK manufacturer of aerospace components. Its stock fell 17% as the uncertainty regarding U.S. and UK defense budget cuts delayed sales. Other laggards included MegaStudy, a South Korean provider of online education services that fell 33% after the government moved to subsidize its publicly run competitors. We sold the Fund's position in MegaStudy in the second quarter of 2010. Micro Focus, a UK legacy software provider, had an annual loss of 26%, falling on news of the departure of the company's CFO and a revenue growth downgrade.
International investing involves special risks, including foreign taxation, currency risks, risks associated with possible differences in financial standards and other risks associated with future political and economic developments. Stocks of small- and mid-cap companies pose special risks, including possible illiquidity and greater price volatility than stocks of larger, more established companies. Investing in emerging markets may involve greater risks than investing in more developed countries.
Portfolio holdings are subject to change periodically and may not be representative of current holdings.
Fund's Positions in Mentioned Holdings
As a percentage of net assets, as of 12/31/10
| Pacific Rubiales Energy | | | 4.1 | % | |
| Hexagon | | | 4.0 | | |
| Naspers | | | 3.7 | | |
| Fugro | | | 3.6 | | |
| Pan American Silver | | | 2.6 | | |
| Zhaojin Mining Industry | | | 2.6 | | |
| Cobham | | | 1.6 | | |
| Micro Focus | | | 0.8 | | |
4
Wanger International Select 2010 Annual Report
Growth of a $10,000 Investment in Wanger International Select
February 1, 1999 (inception date) through December 31, 2010
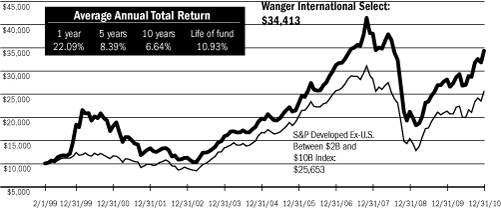
Performance data shown represents past performance and is not a guarantee of future results. The investment return and principal value will fluctuate so that shares, when redeemed, may be worth more or less than the original cost. Current performance may be lower or higher than the performance data shown. Performance results reflect any fee waivers or reimbursements of Fund expenses by the investment adviser and/or any of its affiliates. Absent these fee waivers and/or expense reimbursement arrangements, performance results would have been lower. For daily and most recent month-end performance updates, please call 1-888-4-WANGER.
This graph compares the results of $10,000 invested in Wanger International Select on February 1, 1999 (the date the Fund began operations) through December 31, 2010, to the S&P Developed Ex-U.S. Between $2B and $10B Index, with dividends and capital gains reinvested. Although the index is provided for use in assessing the Fund's performance, the Fund's holdings may differ significantly from those in the index.
Top 10 Holdings
As a percentage of net assets, as of 12/31/10
1. Serco (United Kingdom)
Facilities Management | | | 4.2
| % | |
2. Pacific Rubiales Energy (Colombia)
Oil Production & Exploration in Colombia | | | 4.1
| | |
3. Kansai Paint (Japan)
Paint Producer in Japan, India, China & Southeast Asia | | | 4.1
| | |
4. Hexagon (Sweden)
Measurement Equipment & Software | | | 4.0
| | |
5. NHN (South Korea)
South Korea's Largest Online Search Engine | | | 4.0
| | |
6. Ascendas REIT (Singapore)
Singapore Industrial Property Landlord | | | 3.9
| | |
7. Naspers (South Africa)
Media in Africa, China, Russia & Other Emerging Markets | | | 3.7
| | |
8. Fugro (Netherlands)
Sub-sea Oilfield Services | | | 3.6
| | |
9. Jiangsu Expressway (China)
Chinese Toll Road Operator | | | 3.6 | | |
10. UGL (Australia)
Engineering & Facilities Management | | | 3.2
| | |
Top 5 Countries
As a percentage of net assets, as of 12/31/10
| United Kingdom | | | 16.2 | % | |
| Japan | | | 14.2 | | |
| Netherlands | | | 8.9 | | |
| China | | | 6.2 | | |
| Singapore | | | 6.1 | | |
Results as of December 31, 2010
| | | 4th quarter | | 1 year | | 5 years | | 10 years | |
| Wanger International Select | | | 8.10 | % | | | 22.09 | % | | | 8.39 | % | | | 6.64 | % | |
S&P Developed Ex-U.S. Between
$2B and $10B Index* | | | 9.75 | | | | 20.16 | | | | 4.95 | | | | 8.22 | | |
| MSCI EAFE Index | | | 6.61 | | | | 7.75 | | | | 2.46 | | | | 3.50 | | |
Lipper International Growth Funds
Variable Underlying Index | | | 7.78 | | | | 14.25 | | | | 3.98 | | | | 2.53 | | |
NAV as of 12/31/10: $18.57
* The Fund's primary benchmark.
Performance numbers reflect all Fund expenses but do not include any insurance charge imposed by your insurance company's separate accounts. If performance included the effect of these additional charges, it would be lower.
All results shown assume reinvestment of distributions and do not reflect taxes that a shareholder may pay on Fund distributions or the sale of Fund shares.
The S&P Developed Ex-U.S. Between $2B and $1OB Index is a subset of the broad market selected by the index sponsor representing the mid-cap developed market, excluding the United Slates. The Morgan Stanley Capital International Europe, Australasia, Far East (MSCI EAFE) Index is a capitalization-weighted index that tracks the total return of common stocks in 22 developed-market countries within Europe, Australasia and the Far East. The returns of the MSCI EAFE Index are presented net of taxes. The Lipper International Growth Funds Variable Underlying Index is an equally weighted representation of the 30 largest variable insurance underlying funds in the Lipper International Growth Funds Variable Underlying Classification. Indexes are not managed and do not incur fees or expenses. It is not possible to invest directly in an index.
Lipper Inc., a widely respected data provider in the industry, calculates an average total return (assuming reinvestment of distributions) for mutual funds with investment objectives similar to those of the Fund. Lipper makes no adjustment for the effect of sales loads.
Portfolio characteristics and holdings are subject to change periodically and may not be representative of current characteristics and holdings.
5
Wanger International Select 2010 Annual Report
Wanger International Select
Statement of Investments December 31, 2010
Number of
Shares | | | | Value | |
| | | | | Equities – 95.8% | | | | | |
| | | Europe – 44.4% | |
| | | United Kingdom – 16.2% | |
| | 155,000 | | | Serco
Facilities Management | | $ | 1,342,423 | | |
| | 20,000 | | | Chemring
Defense Manufacturer of Countermeasures & Energetics | | | 905,525 | | |
| | 29,000 | | | Intertek Group
Testing, Inspection & Certification Services | | | 802,546 | | |
| | 39,000 | | | Petropavlovsk
Gold & Iron Ore Mining in Russia | | | 695,608 | | |
| | 163,000 | | | Cobham
Aerospace Components | | | 517,161 | | |
| | 929,300 | | | Workspace Group
United Kingdom Real Estate | | | 340,485 | | |
| | 25,600 | | | JLT Group
International Business Insurance Broker | | | 251,052 | | |
| | 40,000 | | | Micro Focus
United Kingdom Legacy Software Provider | | | 242,409 | | |
| | 29,700 | | | Archipelago Resources (a)
Gold Mining Projects in Indonesia, Vietnam & the Philippines | | | 28,246 | | |
| | | | | | | | 5,125,455 | | |
| | | Netherlands – 8.9% | |
| | 14,041 | | | Fugro
Sub-sea Oilfield Services | | | 1,153,924 | | |
| | 19,623 | | | Imtech
Electromechanical & ICT Installation & Maintenance | | | 744,449 | | |
| | 17,000 | | | Aalberts Industries
Flow Control & Heat Treatment | | | 358,362 | | |
| | 5,000 | | | AkzoNobel
Largest Global Supplier of Protective Paints & Coatings | | | 310,589 | | |
| | 3,000 | | | Core Laboratories
Oil & Gas Reservoir Consulting | | | 267,150 | | |
| | | | | | | | 2,834,474 | | |
| | | Germany – 4.2% | |
| | 47,000 | | | Wirecard
Online Payment Processing & Risk Management | | | 643,837 | | |
| | 4,600 | | | Rheinmetall
Defense & Automotive | | | 369,957 | | |
| | 13,900 | | | Rhoen-Klinikum
Health Care Services | | | 305,990 | | |
| | | | | | | | 1,319,784 | | |
Number of
Shares | | | | Value | |
| | | Sweden – 4.0% | |
| | 58,733 | | | Hexagon
Measurement Equipment & Software | | $ | 1,259,667 | | |
| | | Switzerland – 3.1% | |
| | 3,800 | | | Kuehne & Nagel
Freight Forwarding/Logistics | | | 527,933 | | |
| | 10,400 | | | Bank Sarasin & Cie
Private Banking | | | 473,908 | | |
| | | | | | | | 1,001,841 | | |
| | | France – 2.5% | |
| | 9,000 | | | Neopost
Postage Meter Machines | | | 784,141 | | |
| | | Ireland – 2.0% | |
| | 226,000 | | | United Drug
Irish Pharmaceutical Wholesaler & Outsourcer | | | 634,208 | | |
| | | Iceland – 0.9% | |
| | 330,000 | | | Marel (a)
Largest Manufacturer of Poultry &
Fish Processing Equipment | | | 287,518 | | |
| | | Spain – 0.9% | |
| | 6,100 | | | Red Eléctrica de España
Spanish Power Transmission | | | 286,805 | | |
| | | Denmark – 0.9% | |
| | 2,000 | | | Novozymes
Industrial Enzymes | | | 278,688 | | |
| | | Russia – 0.8% | |
| | 7,000 | | | Mail.ru – GDR (a)(b)
Internet Social Networking & Games for Russian Speakers | | | 252,000 | | |
| | | | | Total Europe | | | 14,064,581 | | |
| | | Asia – 31.7% | |
| | | Japan – 14.2% | |
| | 133,000 | | | Kansai Paint
Paint Producer in Japan, India, China & Southeast Asia | | | 1,286,814 | | |
| | 13,900 | | | Benesse
Education Service Provider | | | 640,107 | | |
See accompanying notes to financial statements.
6
Wanger International Select 2010 Annual Report
Wanger International Select
Statement of Investments December 31, 2010
Number of
Shares | | | | Value | |
| | | Japan – 14.2% (cont) | |
| | 302 | | | Seven Bank
ATM Processing Services | | $ | 639,356 | | |
| | 600 | | | Jupiter Telecommunications
Largest Cable Service Provider in Japan | | | 631,105 | | |
| | 60 | | | Orix JREIT
Diversified REIT | | | 390,078 | | |
| | 28,000 | | | Gree
Mobile Social Networking Game Developer/Platform | | | 355,967 | | |
| | 16,000 | | | Asahi Diamond Industrial
Consumable Diamond Tools | | | 303,824 | | |
| | 7,360 | | | Ain Pharmaciez
Dispensing Pharmacy/Drugstore Operator | | | 258,817 | | |
| | | | | | | | 4,506,068 | | |
| | | China – 6.2% | |
| | 1,004,000 | | | Jiangsu Expressway
Chinese Toll Road Operator | | | 1,152,182 | | |
| | 201,300 | | | Zhaojin Mining Industry
Gold Mining & Refining in China | | | 823,556 | | |
| | | | | | | | 1,975,738 | | |
| | | Singapore – 6.1% | |
| | 770,000 | | | Ascendas REIT
Singapore Industrial Property Landlord | | | 1,241,984 | | |
| | 280,000 | | | Olam International
Agriculture Supply Chain Manager | | | 685,082 | | |
| | | | | | | | 1,927,066 | | |
| | | South Korea – 5.2% | |
| | 6,300 | | | NHN (a)
South Korea's Largest Online Search Engine | | | 1,257,131 | | |
| | 10,500 | | | Woongjin Coway
South Korean Household Appliance Rental Service Provider | | | 372,577 | | |
| | | | 1,629,708 | | |
| | | | | Total Asia | | | 10,038,580 | | |
| | | Other Countries – 15.1% | |
| | | Canada – 5.4% | |
| | 20,000 | | | Pan American Silver
Silver Mining | | | 824,200 | | |
| | 14,800 | | | CCL Industries
Leading Global Label Manufacturer | | | 440,889 | | |
Number of
Shares | | | | Value | |
| | 8,700 | | | AG Growth
Leading Manufacturer of Augers &
Grain Handling Equipment | | $ | 438,106 | | |
| | | | | | | | 1,703,195 | | |
| | | South Africa – 3.7% | |
| | 20,000 | | | Naspers
Media in Africa, China, Russia & Other Emerging Markets | | | 1,177,837 | | |
| | | Australia – 3.2% | |
| | 68,000 | | | UGL
Engineering & Facilities Management | | | 1,003,613 | | |
| | | United States – 1.5% | |
| | 12,500 | | | Atwood Oceanics (a)
Offshore Drilling Contractor | | | 467,125 | | |
| | | Israel – 1.3% | |
| | 25,000 | | | Israel Chemicals
Producer of Potash, Phosphates, Bromine &
Specialty Chemicals | | | 428,738 | | |
| | | | | Total Other Countries | | | 4,780,508 | | |
| | | Latin America – 4.6% | |
| | | Colombia – 4.1% | |
| | 38,000 | | | Pacific Rubiales Energy
Oil Production & Exploration in Colombia | | | 1,289,852 | | |
| | | Argentina – 0.5% | |
| | 68,182 | | | Union Agriculture Group (a)(b)
Farmland Operator in Uruguay | | | 150,000 | | |
| | | | | Total Latin America | | | 1,439,852 | | |
Total Equities
(Cost: $21,574,528) – 95.8% | | | 30,323,521 | | |
See accompanying notes to financial statements.
7
Wanger International Select 2010 Annual Report
Wanger International Select
Statement of Investments December 31, 2010
| Principal Amount | | | | Value | |
| Short-Term Obligation – 3.9% | |
| | | Repurchase Agreement – 3.9% | |
| $ | 1,249,000 | | | Repurchase Agreement with Fixed
Income Clearing Corp., dated
12/31/10, due 1/03/11 at 0.16%,
collateralized by a U.S. Government
Agency obligation maturing 1/27/14,
market value $1,274,488 (repurchase
proceeds $1,249,017) | | $ | 1,249,000 | | |
Total Short-Term Obligation
(Cost: $1,249,000) | | | 1,249,000 | | |
Total Investments
(Cost: $22,823,528) – 99.7% (c)(d) | | | 31,572,521 | | |
| Cash and Other Assets Less Liabilities – 0.3% | | | 96,542 | | |
| Total Net Assets – 100.0% | | $ | 31,669,063 | | |
Notes to Statement of Investments:
(a) Non-income producing security.
(b) Denotes a restricted security, which is subject to restrictions on resale under federal securities laws. These securities are valued at a fair value determined in good faith under consistently applied procedures established by the Board of Trustees. At December 31, 2010, the market value of these securities amounted to $402,000 which represents 1.27% of total net assets.
Additional information on these securities is as follows:
Security | | Acquisition
Dates | |
Shares | |
Cost | |
Value | |
| Mail.ru – GDR | | 11/05/10 –
12/30/10 | | | 7,000 | | | $ | 246,364 | | | $ | 252,000 | | |
| Union Agriculture Group | | 12/08/10 | | | 68,182 | | | | 150,000 | | | | 150,000 | | |
| | | | | | | $ | 396,364 | | | $ | 402,000 | | |
(c) On December 31, 2010, the Fund's total investments were denominated in currencies as follows:
| Currency | | Value | | Percentage of
Net Assets | |
| Euro | | $ | 5,592,262 | | | | 17.7 | | |
| British Pound | | | 5,125,455 | | | | 16.2 | | |
| Japanese Yen | | | 4,506,068 | | | | 14.2 | | |
| U.S. Dollar | | | 3,209,475 | | | | 10.1 | | |
| Canadian Dollar | | | 2,168,847 | | | | 6.8 | | |
| Hong Kong Dollar | | | 1,975,738 | | | | 6.2 | | |
| Singapore Dollar | | | 1,927,066 | | | | 6.1 | | |
| Korean Won | | | 1,629,708 | | | | 5.1 | | |
Other currencies less than
5% of total net assets | | | 5,437,902 | | | | 17.3 | | |
Cash and other assets
less liabilities | | | 96,542 | | | | 0.3 | | |
| | | $ | 31,669,063 | | | | 100.0 | | |
(d) At December 31, 2010, for federal income tax purposes, the cost of investments was $23,450,872 and net unrealized appreciation was $8,121,649 consisting of gross unrealized appreciation of $8,647,816 and gross unrealized depreciation of $526,167.
GDR = Global Depositary Receipts
The following table summarizes the inputs used, as of December 31, 2010, in valuing the Fund's assets:
| Investment Type | | Quoted Prices
(Level 1) | | Other
Significant
Observable
Inputs
(Level 2) | | Significant
Unobservable
Inputs
(Level 3) | | Total | |
| Equities | |
| Europe | | $ | 519,150 | | | $ | 13,545,431 | | | $ | — | | | $ | 14,064,581 | | |
| Asia | | | — | | | | 10,038,580 | | | | — | | | | 10,038,580 | | |
| Other Countries | | | 2,170,320 | | | | 2,610,188 | | | | — | | | | 4,780,508 | | |
| Latin America | | | 1,289,852 | | | | — | | | | 150,000 | | | | 1,439,852 | | |
| Total Equities | | | 3,979,322 | | | | 26,194,199 | | | | 150,000 | | | | 30,323,521 | | |
| Total Short-Term Obligation | | | — | | | | 1,249,000 | | | | — | | | | 1,249,000 | | |
| Total Investments | | $ | 3,979,322 | | | $ | 27,443,199 | | | $ | 150,000 | | | $ | 31,572,521 | | |
The Fund's assets assigned to the Level 2 input category are generally valued using a market approach, in which a security's value is determined through its correlation to prices and information from observable market transactions for similar or identical assets. Foreign equities are generally valued at the last sales price on the foreign exchange or market on which they trade. The Fund may use a systematic fair valuation model provided by an independent third party to value securities principally traded in foreign markets in order to adjust for possible stale pricing that may occur between the close of the foreign exchanges and the time for valuation. These models take into account available market data including intraday index, ADR, and ETF movements.
Certain short-term obligations may be valued using amortized cost, an income approach which converts future cash flows to a present value based upon the discount or premium at purchase.
The Fund's assets assigned to the Level 3 input category are valued at fair value as determined in good faith under consistently applied procedures established by and under the general supervision of the Board of Trustees. To determine fair value, management will utilize the valuation technique that they deem the most appropriate in the circumstances. Securities acquired via private placement but are not yet trading are valued using a market approach for which management has determined that the original transaction price is the best representation of fair value. The original cost may be adjusted for the market movement in an index, ETF or similar security during the period it does not trade.
There were no significant transfers of financial assets between levels 1 and 2 during the period.
See accompanying notes to financial statements.
8
Wanger International Select 2010 Annual Report
Wanger International Select
Statement of Investments December 31, 2010
The following table reconciles asset balances for the year ending December 31, 2010, in which significant unobservable inputs (Level 3) were used in determining value:
Investments
in Securities | | Balance
as of
December 31,
2009 | | Realized
Gain/(Loss) | | Change in
Unrealized
Appreciation
(Depreciation) | | Purchases | | Sales | | Transfers
into
Level 3 | | Transfers
out of
Level 3 | | Balance
as of
December 31,
2010 | |
Equities
Latin America | | $ | — | | | $ | — | | | $ | — | | | $ | 150,000 | | | $ | — | | | $ | — | | | $ | — | | | $ | 150,000 | | |
| | | $ | — | | | $ | — | | | $ | — | | | $ | 150,000 | | | $ | — | | | $ | — | | | $ | — | | | $ | 150,000 | | |
The information in the above reconciliation table represents fiscal year to date activity for any securities identified as using Level 3 inputs at either the beginning or the end of the current fiscal period.
The change in unrealized appreciation (depreciation) attributed to securities owned at December 31, 2010, which were valued using significant unobservable inputs (Level 3) amounted to $—. This amount is included in net change in unrealized appreciation (depreciation) on the Statement of Changes in Net Assets.
For more information on valuation inputs, and their aggregation into the levels used in the table above, please refer to the Security Valuation section in the accompanying Notes to Financial Statements.
See accompanying notes to financial statements.
9
Wanger International Select 2010 Annual Report
Wanger International Select
Portfolio Diversification December 31, 2010
At December 31, 2010, the Fund's portfolio investments as a percentage of net assets was diversified as follows:
| | | Value | | Percentage of
Net Assets | |
| Industrial Goods & Services | |
| Other Industrial Services | | $ | 3,078,540 | | | | 9.7 | | |
| Industrial Materials & Specialty Chemicals | | | 2,304,830 | | | | 7.3 | | |
| Machinery | | | 2,183,546 | | | | 6.9 | | |
| Electrical Components | | | 1,422,686 | | | | 4.5 | | |
| Outsourcing Services | | | 1,342,423 | | | | 4.3 | | |
| Conglomerates | | | 358,362 | | | | 1.1 | | |
| | | | 10,690,387 | | | | 33.8 | | |
| Information | |
| Internet Related | | | 2,686,968 | | | | 8.5 | | |
| Instrumentation | | | 1,259,667 | | | | 4.0 | | |
| Financial Processors | | | 643,837 | | | | 2.0 | | |
| CATV | | | 631,105 | | | | 2.0 | | |
| Gaming Equipment & Services | | | 355,966 | | | | 1.1 | | |
| Business Software | | | 242,409 | | | | 0.8 | | |
| | | | 5,819,952 | | | | 18.4 | | |
| Energy & Minerals | |
| Mining | | | 2,638,760 | | | | 8.3 | | |
| Oil Services | | | 1,621,049 | | | | 5.1 | | |
| Oil & Gas Producers | | | 1,289,852 | | | | 4.1 | | |
| Agricultural Commodities | | | 150,000 | | | | 0.5 | | |
| | | | 5,699,661 | | | | 18.0 | | |
| Other Industries | |
| Real Estate | | | 1,972,547 | | | | 6.2 | | |
| Transportation | | | 1,152,182 | | | | 3.6 | | |
| Regulated Utilities | | | 286,806 | | | | 0.9 | | |
| | | | 3,411,535 | | | | 10.7 | | |
| | | Value | | Percentage of
Net Assets | |
| Consumer Goods & Services | |
| Food & Beverage | | $ | 685,082 | | | | 2.2 | | |
| Educational Services | | | 640,107 | | | | 2.0 | | |
| Nondurables | | | 440,889 | | | | 1.4 | | |
| Other Consumer Services | | | 372,577 | | | | 1.2 | | |
| Retail | | | 258,817 | | | | 0.8 | | |
| | | | 2,397,472 | | | | 7.6 | | |
| Finance | |
| Banks | | | 639,356 | | | | 2.0 | | |
| Brokerage & Money Management | | | 473,908 | | | | 1.5 | | |
| Insurance | | | 251,052 | | | | 0.8 | | |
| | | | 1,364,316 | | | | 4.3 | | |
| Health Care | |
| Pharmaceuticals | | | 634,208 | | | | 2.0 | | |
| Health Care Services | | | 305,990 | | | | 1.0 | | |
| | | | 940,198 | | | | 3.0 | | |
| Total Equities | | | 30,323,521 | | | | 95.8 | | |
| Short-Term Obligation | | | 1,249,000 | | | | 3.9 | | |
| Total Investments | | | 31,572,521 | | | | 99.7 | | |
Cash and Other Assets
Less Liabilities | | | 96,542 | | | | 0.3 | | |
| Net Assets | | $ | 31,669,063 | | | | 100.0 | % | |
See accompanying notes to financial statements.
10
Wanger International Select 2010 Annual Report
Statement of Assets and Liabilities
December 31, 2010
| Assets: | |
| Investments, at cost | | $ | 22,823,528 | | |
| Investments, at value | | $ | 31,572,521 | | |
| Cash | | | 90,844 | | |
| Foreign currency (cost of $1,478) | | | 1,487 | | |
| Receivable for: | |
| Investments sold | | | 157,955 | | |
| Fund shares sold | | | 737 | | |
| Securities lending income | | | 771 | | |
| Dividends | | | 45,170 | | |
| Interest | | | 6 | | |
| Foreign tax reclaims | | | 3,737 | | |
| Other assets | | | 406 | | |
| Total Assets | | | 31,873,634 | | |
| Liabilities: | |
| Payable for: | |
| Investments purchased | | | 103,529 | | |
| Fund shares repurchased | | | 31,583 | | |
| Investment advisory fee | | | 24,801 | | |
| Administration fee | | | 1,319 | | |
| Transfer agent fee | | | 7 | | |
| Trustees' fees | | | 5 | | |
| Professional fees | | | 13,711 | | |
| Custody fee | | | 10,835 | | |
| Reports to shareholders | | | 8,000 | | |
| Chief compliance officer expenses | | | 84 | | |
| Trustees' deferred compensation plan | | | 9,224 | | |
| Other liabilities | | | 1,473 | | |
| Total Liabilities | | | 204,571 | | |
| Net Assets | | $ | 31,669,063 | | |
| Composition of Net Assets: | |
| Paid-in capital | | $ | 28,546,367 | | |
| Overdistributed net investment income | | | (279,305 | ) | |
| Accumulated net realized loss | | | (5,347,899 | ) | |
| Net unrealized appreciation on: | | | |
| Investments | | | 8,748,993 | | |
| Foreign currency translations | | | 907 | | |
| Net Assets | | $ | 31,669,063 | | |
| Fund Shares Outstanding | | | 1,705,660 | | |
Net asset value, offering price and redemption
price per share | | $ | 18.57 | | |
Statement of Operations
For the Year Ended December 31, 2010
| Investment Income: | |
| Dividends (net foreign taxes withheld of $38,854) | | $ | 573,954 | | |
| Interest income | | | 1,581 | | |
| Securities lending income, net | | | 1,445 | | |
| Total Investment Income | | | 576,980 | | |
| Expenses: | |
| Investment advisory fee | | | 278,151 | | |
| Administration fee | | | 14,795 | | |
| Transfer agent fee | | | 150 | | |
| Trustees' fees | | | 6,884 | | |
| Custody fee | | | 48,332 | | |
| Reports to shareholders | | | 24,765 | | |
| Professional fees | | | 25,910 | | |
| Chief compliance officer expenses (See Note 4) | | | 965 | | |
| Other expenses (See Note 5) | | | 8,647 | | |
| Total Expenses | | | 408,599 | | |
| Custody earnings credit | | | (9 | ) | |
| Net Expenses | | | 408,590 | | |
| Net Investment Income | | | 168,390 | | |
Net Realized and Unrealized Gain (Loss) on
Investments and Foreign Currency: | |
| Net realized gain (loss) on: | |
| Investments | | | 3,639,153 | | |
| Foreign currency transactions | | | (1,282 | ) | |
| Net realized gain | | | 3,637,871 | | |
| Net change in unrealized appreciation on: | | | |
| Investments | | | 2,081,860 | | |
| Foreign currency translations | | | 1,629 | | |
| Net change in unrealized appreciation | | | 2,083,489 | | |
| Net Gain | | | 5,721,360 | | |
| Net Increase in Net Assets from Operations | | $ | 5,889,750 | | |
See accompanying notes to financial statements.
11
Wanger International Select 2010 Annual Report
Statement of Changes in Net Assets
| | | Year Ended December 31, | |
| Increase (Decrease) in Net Assets | | 2010 | | 2009 | |
| Operations: | |
| Net investment income | | $ | 168,390 | | | $ | 211,983 | | |
| Net realized gain (loss) on investments and foreign currency transactions | | | 3,637,871 | | | | (3,445,751 | ) | |
| Net change in unrealized appreciation on investments and foreign currency translations | | | 2,083,489 | | | | 11,080,753 | | |
| Net Increase in Net Assets from Operations | | | 5,889,750 | | | | 7,846,985 | | |
| Distributions to Shareholders: | |
| From net investment income | | | (385,292 | ) | | | (867,446 | ) | |
| Share Transactions: | |
| Subscriptions | | | 2,051,847 | | | | 1,881,562 | | |
| Distributions reinvested | | | 385,292 | | | | 867,446 | | |
| Redemptions | | | (7,726,656 | ) | | | (7,878,859 | ) | |
| Net Decrease from Fund Share Transactions | | | (5,289,517 | ) | | | (5,129,851 | ) | |
| Total Increase in Net Assets | | | 214,941 | | | | 1,849,688 | | |
| Net Assets: | |
| Beginning of period | | | 31,454,122 | | | | 29,604,434 | | |
| End of period | | $ | 31,669,063 | | | $ | 31,454,122 | | |
| Overdistributed net investment income at end of period | | $ | (279,305 | ) | | $ | (77,609 | ) | |
See accompanying notes to financial statements.
12
Wanger International Select 2010 Annual Report
Financial Highlights
| | | Year Ended December 31, | |
| Selected data for a share outstanding throughout each period | | 2010 | | 2009 | | 2008 | | 2007 | | 2006 | |
| Net Asset Value, Beginning of Period | | $ | 15.42 | | | $ | 12.01 | | | $ | 28.07 | | | $ | 26.62 | | | $ | 19.63 | | |
| Income from Investment Operations: | |
| Net investment income (a) | | | 0.09 | | | | 0.10 | | | | 0.21 | | | | 0.10 | | | | 0.11 | | |
| Net realized and unrealized gain (loss) on investments and foreign currency | | | 3.28 | | | | 3.71 | | | | (10.31 | ) | | | 4.92 | | | | 6.94 | | |
| Total from Investment Operations | | | 3.37 | | | | 3.81 | | | | (10.10 | ) | | | 5.02 | | | | 7.05 | | |
| Less Distributions to Shareholders: | |
| From net investment income | | | (0.22 | ) | | | (0.40 | ) | | | (0.09 | ) | | | (0.21 | ) | | | (0.06 | ) | |
| From net realized gains | | | — | | | | — | | | | (5.87 | ) | | | (3.36 | ) | | | — | | |
| Total Distributions to Shareholders | | | (0.22 | ) | | | (0.40 | ) | | | (5.96 | ) | | | (3.57 | ) | | | (0.06 | ) | |
| Net Asset Value, End of Period | | $ | 18.57 | | | $ | 15.42 | | | $ | 12.01 | | | $ | 28.07 | | | $ | 26.62 | | |
| Total Return (b) | | | 22.09 | % | | | 32.92 | %(c) | | | (44.35 | )% | | | 21.78 | % | | | 36.00 | % | |
| Ratios to Average Net Assets/Supplemental Data: | |
| Net expenses (d) | | | 1.38 | % | | | 1.45 | % | | | 1.24 | % | | | 1.18 | % | | | 1.19 | % | |
| Net investment income (d) | | | 0.57 | % | | | 0.75 | % | | | 1.10 | % | | | 0.37 | % | | | 0.47 | % | |
| Waiver/Reimbursement | | | — | | | | 0.04 | % | | | — | | | | — | | | | — | | |
| Portfolio turnover rate | | | 37 | % | | | 62 | % | | | 68 | % | | | 69 | % | | | 61 | % | |
| Net assets, end of period (000s) | | $ | 31,669 | | | $ | 31,454 | | | $ | 29,604 | | | $ | 73,485 | | | $ | 62,594 | | |
(a) Net investment income per share was based upon the average shares outstanding during the period.
(b) Total return at net asset value assuming all distributions reinvested.
(c) Had the investment adviser not waived a portion of expenses, total return would have been reduced.
(d) The benefits derived from custody fees paid indirectly had an impact of less than 0.01%.
See accompanying notes to financial statements.
13
Wanger International Select 2010 Annual Report
Notes to Financial Statements
1. Nature of Operations
Wanger International Select (the Fund), is a series of Wanger Advisors Trust (the Trust), an open-end management investment company organized as a Massachusetts business trust. The investment objective of the Fund is to seek long-term capital appreciation. The Fund is available only for allocation to certain life insurance company separate accounts established for the purpose of funding qualified and non-qualified variable annuity contracts and variable life insurance policies and may also be offered directly to certain types of pension plans and retirement arrangements.
2. Significant Accounting Policies
The preparation of financial statements in accordance with accounting principles generally accepted in the United States of America (GAAP) requires management to make certain estimates and assumptions that affect the reported amounts of assets and liabilities, the disclosure of contingent assets and liabilities at the date of the financial statements and the reported amounts of revenue and expenses during the reporting period. Actual results could differ from those estimates.
Security valuation
Securities of the Fund are valued at market value or, if a market quotation for a security is not readily available or is deemed not to be reliable because of events or circumstances that have occurred between the market quotation and the time as of which the security is to be valued, the security is valued at its fair value determined in good faith under consistently applied procedures established by the Board of Trustees. A security traded on a securities exchange or in an over-the-counter market in which transaction prices are reported is valued at the last sales price at the time of valuation. A security traded principally on NASDAQ is valued at the NASDAQ official closing price. Mutual Funds and Exchange Traded Funds are valued at their closing net asset value as reported to NASDAQ. A security for which there is no reported sale on the valuation date is valued at the latest bid quotation. Short-term investments maturing in 60 days or l ess are valued at amortized cost, which approximates market value. A security for which a market quotation is not readily available and any other assets are valued at their fair value determined in good faith under consistently applied procedures established by the Board of Trustees. The Trust has retained an independent statistical fair value pricing service that employs a systematic methodology to assist in the fair valuation process for securities principally traded in a foreign market in order to adjust for possible changes in value that may occur between the close of the foreign market and the time as of which the securities are to be valued. If a security is valued at a "fair value", that value may be different from the last quoted market price for the security.
Various inputs are used in determining the value of the Fund's investments; following the input prioritization hierarchy established by GAAP. These inputs are summarized in the three broad levels listed below:
• Level 1—quoted prices in active markets for identical securities
• Level 2—prices determined using other significant observable inputs (including quoted prices for similar securities, interest rates, prepayment speeds, credit risk and others)
• Level 3—prices determined using significant unobservable inputs when quoted prices or observable inputs are unavailable or less reliable (including management's own assumptions about the factors market participants would use in pricing an investment)
The inputs or methodologies used for valuing securities are not necessarily an indication of the risk associated with investing in those securities.
Examples of the types of securities in which the Fund would typically invest and how they are classified within this hierarchy are as follows. Typical Level 1 securities include exchange traded domestic equities, mutual funds whose NAVs are published each day and exchange traded foreign equities that are not statistically fair valued. Typical Level 2 securities include exchange traded foreign equities that are statistically fair valued and short-term investments valued at amortized cost. Additionally, securities fair valued by the Fund's valuation committee that rely on significant observable inputs are also included in Level 2. Typical Level 3 securities include any security fair valued by the Fund's Valuation Committee that relies on significant unobservable inputs.
Repurchase agreements
The Fund may engage in repurchase agreement transactions. The Fund, through its custodian, receives delivery of underlying securities collateralizing each repurchase agreement. The counterparty is required to maintain collateral that is at all times at least equal to the repurchase price including interest. In the event of default or bankruptcy by the other party to the agreement, realization and/or retention of the collateral may be subject to legal proceedings.
Foreign currency translations
Values of investments denominated in foreign currencies are converted into U.S. dollars using the New York spot market rate of exchange at the time of valuation. Purchases and sales of investments and dividend and interest income are translated into U.S. dollars using the spot market rate of exchange prevailing on the respective dates of such transactions. The gain or loss resulting from changes in foreign exchange rates is included with net realized and unrealized gain or loss from investments, as appropriate.
Security transactions and investment income
Security transactions are accounted for on the trade date (date the order to buy or sell is executed) and dividend income is recorded on the ex-dividend date, except that certain dividends from foreign securities are recorded as soon as the information is available to the Fund. Interest income is recorded on the accrual basis and includes amortization of discounts on debt obligations when required for federal income tax purposes. Realized gains and losses from security transactions are recorded on an identified cost basis.
Awards, if any, from class action litigation related to securities owned may be recorded as a reduction of cost of those securities. If the applicable securities are no longer owned, the proceeds are recorded as realized gains.
Restricted securities
Restricted securities are securities that may only be resold upon registration under federal securities laws or in transactions exempt from registration. In some cases, the issuer of restricted securities has agreed to register such securities for resale at the issuer's expense either upon demand by the Fund or in connection with another registered offering of the securities. Many restricted securities may be resold in the secondary market in transactions exempt from registration. Such restricted securities may be determined to be liquid under criteria established by the Board of Trustees.
Securities lending
The Fund may lend securities up to one-third of the value of its total assets to certain approved brokers, dealers and other financial institutions to earn additional income. The Fund retains the benefits of owning the securities, including receipt of dividends or interest generated by the security. The Fund also receives a fee for the loan. The Fund has the ability to recall the loans at any time and could do so in order to vote proxies or to sell the loaned securities. Each loan is collateralized by cash that exceeded the value of the securities on loan. The market value of the loaned securities is determined daily at the close of business of the Fund and any additional required collateral is delivered to each Fund on the next business day. The Fund has elected to invest the cash collateral in the Dreyfus Government Cash Management Fund and the income earned is paid to the Fund, net of any fees remitted to Goldman Sachs Agency Lending as the lending agent and borrower rebates. The Fund's adviser, Columbia Wanger Asset Management, LLC (CWAM), does not retain any fees earned by the lending program. Generally, in the event of borrower default, the Fund has the right to use the collateral to offset any losses incurred. In the event the Fund is delayed or prevented from exercising its right to dispose of the collateral, there may be a
14
Wanger International Select 2010 Annual Report
Notes to Financial Statements, continued
potential loss to the Fund. Some of these losses may be indemnified by the lending agent. The Fund bears the risk of loss with respect to the investment of collateral.
The net lending income earned in 2010 by the Fund is included in the Statement of Operations. There were no loans outstanding on December 31, 2010.
Fund share valuation
Fund shares are sold and redeemed on a daily basis at net asset value. Net asset value per share is determined daily as of the close of trading on the New York Stock Exchange (the Exchange) on each day the Exchange is open for trading by dividing the total value of the Fund's investments and other assets, less liabilities, by the number of Fund shares outstanding.
Custody fees/Credits
Custody fees are reduced based on the Fund's cash balances maintained with the custodian. The amount is disclosed as a reduction of total expenses in the Statement of Operations.
Federal income taxes
It is the Fund's policy to comply with the provisions of the Internal Revenue Code available to regulated investment companies and, in the manner provided therein, distributes substantially all its taxable income, as well as any net realized gain on sales of investments and foreign currency transactions reportable for federal income tax purposes. Accordingly, the Fund paid no federal income taxes and no federal income tax provision was required.
Expenses
General expenses of the Trust are allocated to the Fund and the other series of the Trust based upon relative net assets or other expense allocation methodologies determined by the nature of the expense. Expenses directly attributable to the Fund are charged to the Fund.
Foreign capital gains taxes
Gains in certain countries may be subject to foreign taxes at the fund level, at rates ranging from 10%-15%. The Fund accrues for such foreign taxes on net realized and unrealized gains at the appropriate rate for each jurisdiction.
Distributions to shareholders
Distributions to shareholders are recorded on the ex-dividend date.
Indemnification
In the normal course of business, the Trust on behalf of the Fund enters into contracts that contain a variety of representations and warranties and that provide general indemnities. The Fund's maximum exposure under these arrangements is unknown, as this would involve future claims against the Fund. Also, under the Trust's organizational documents, the trustees and officers of the Trust are indemnified against certain liabilities that may arise out of their duties to the Trust. However based on experience, the Fund expects the risk of loss due to these warranties and indemnities to be remote.
3. Federal Tax Information
The timing and character of income and capital gain distributions are determined in accordance with income tax regulations, which may differ from GAAP. Reclassifications are made to the Fund's capital accounts for permanent tax differences to reflect income and gains available for distribution (or available capital loss carryforwards) under income tax regulations.
For the year ended December 31, 2010, permanent book and tax basis differences resulting primarily from foreign currency transactions and passive foreign investment company (PFIC) adjustments were identified and reclassified among the components of the Fund's net assets as follows:
Accumulated
Net Investment
Income | | Accumulated
Net Realized
Loss | | Paid-In Capital | |
| $ | 15,206 | | | $ | (15,207 | ) | | $ | 1 | | |
Net investment income and net realized gains (losses), as disclosed on the Statement of Operations, and net assets were not affected by this reclassification.
The tax character of distributions paid during the years ended December 31, 2010 and December 31, 2009 were as follows:
| | | December 31, 2010 | | December 31, 2009 | |
| Distributions paid from: | |
| Ordinary Income* | | $ | 385,292 | | | $ | 867,446 | | |
* For tax purposes short-term capital gain distributions, if any, are considered ordinary income distributions.
As of December 31, 2010, the components of distributable earnings on a tax basis were as follows:
Undistributed
Ordinary
Income | | Undistributed
Long-Term
Capital Gains | | Net Unrealized
Appreciation* | |
| $ | 216,137 | | | $ | — | | | $ | 8,121,649 | | |
* The differences between book-basis and tax-basis net unrealized appreciation/depreciation are primarily due to deferral of losses from wash sales and passive foreign investment company (PFIC) adjustments.
The following capital loss carryforwards, determined as of December 31, 2010, may be available to reduce taxable income arising from future net realized gains on investments, if any, to the extent permitted by the Internal Revenue Code:
Year of
Expiration | | Capital Loss
Carryforwards | |
| | 2017 | | | $ | 5,206,746 | | |
Capital loss carryforwards that were utilized for the Fund during the year ended December 31, 2010 were $3,419,974.
Management is required to determine whether a tax position of the Fund is more likely than not to be sustained upon examination by the applicable taxing authority, including resolution of any related appeals or litigation processes, based on the technical merits of the position. The tax benefit to be recognized by the Fund is measured as the largest amount of benefit that is greater than fifty percent likely of being realized upon ultimate settlement. Management is not aware of any tax positions for which it is reasonably possible that the total amounts of unrecognized tax benefits will significantly change in the next twelve months. However, management's conclusions may be subject to review and adjustment at a later date based on factors including, but not limited to, new tax laws, regulations, and administrative interpretations (including relevant court decisions). The Fund's federal tax returns for the prior three fiscal years remain sub ject to examination by the Internal Revenue Service.
4. Transactions With Affiliates
CWAM is a wholly owned subsidiary of Columbia Management Investment Advisers, LLC (Columbia Management), which in turn is an indirect, wholly owned subsidiary of Ameriprise Financial, Inc. (Ameriprise Financial). CWAM furnishes continuing investment supervision to the Fund and is responsible for the overall management of the Fund's business affairs.
After the close of business on April 30, 2010, (the Closing), Ameriprise Financial acquired from Bank of America Corporation (BOA), a portion of the asset management business of Columbia Management Group, LLC, including 100% of CWAM. On May 27, 2010, the shareholders of the Fund approved a new investment advisory agreement with CWAM to provide advisory services to the Fund. There were no changes to the Fund's advisory fee rate under the new agreement.
15
Wanger International Select 2010 Annual Report
Notes to Financial Statements, continued
CWAM receives a monthly advisory fee based on the Fund's average daily net assets at the following annual rates:
| Average Daily Net Assets | | Annual Fee Rate | |
| Up to $500 million | | | 0.94 | % | |
| $500 million and over | | | 0.89 | % | |
For the year ended December 31, 2010, the Fund's effective investment advisory fee rate was 0.94% of average daily net assets.
Through April 30, 2011, CWAM has contractually agreed to reimburse the Fund to the extent that ordinary operating expenses (exclusive of brokerage commissions, interest, taxes and extraordinary expenses, but inclusive of custodian charges relating to overdrafts, if any), after giving effect to any balance credits from the Fund's custodian, exceed an annual percentage of 1.45% of average daily net assets on an annualized basis. There was no reimbursement to the Fund for the year ended December 31, 2010.
CWAM provides administrative services and receives an administration fee from the Fund at the following annual rates:
Wanger Advisors Trust Aggregate
Average Daily Net Assets of the Trust | | Annual Fee Rate | |
| Up to $4 billion | | | 0.05 | % | |
| $4 billion to $6 billion | | | 0.04 | % | |
| $6 billion to $8 billion | | | 0.03 | % | |
| $8 billion and over | | | 0.02 | % | |
For the year ended December 31, 2010, the Fund's effective administration fee rate was 0.05% of average daily net assets. Prior to the Closing, CWAM had delegated to Columbia Management Advisors, LLC (CMA) an indirect, wholly owned subsidiary of BOA, responsibility to provide certain sub-administrative services to the Fund. Following the Closing, Columbia Management, a wholly owned subsidiary of Ameriprise Financial, acquired the assets of CMA and subsequently changed its name to Columbia Management, and thereafter continued providing certain sub-administrative services to the Fund.
Prior to the Closing, Columbia Management Distributors, Inc., a wholly owned subsidiary of BOA, served as the Fund's distributor and principal underwriter. In connection with the Closing, RiverSource Fund Distributors, Inc., a wholly owned subsidiary of Ameriprise Financial, became the distributor of the Fund and subsequently changed its name to Columbia Management Investment Distributors, Inc. (CMDI). There were no changes to the underwriting discount structure of the Fund or the service or distribution fee rates paid by the Fund as a result of the Closing.
Prior to the Closing, Columbia Management Services, Inc., an indirect, wholly owned subsidiary of BOA, provided shareholder services to the Fund and contracted with Boston Financial Data Services (BFDS) to serve as sub-transfer agent. In connection with the Closing, RiverSource Service Corporation, a wholly owned subsidiary of Ameriprise Financial, became the transfer agent of the Fund and subsequently changed its name to Columbia Management Investment Services Corp. (CMIS). The transfer agent fee rates paid by the Fund did not change as a result of the change in transfer agent. For its services, the Fund pays CMIS a monthly fee at the annual rate of $21.00 per open account. CMIS also receives reimbursement for certain out-of-pocket expenses. The arrangement with BFDS has been continued by CMIS.
Certain officers and trustees of the Trust are also officers of CWAM. The Trust makes no direct payments to its officers and trustees who are affiliated with CWAM.
The Board of Trustees has appointed a Chief Compliance Officer of the Trust in accordance with federal securities regulations. The Fund, along with other affiliated funds, pays its pro-rata share of the expenses associated with the Office of the Chief Compliance Officer. These expenses are disclosed separately as "Chief compliance officer expenses" in the Statement of Operations.
The Trust offers a deferred compensation plan for its independent trustees. Under that plan, a trustee may elect to defer all or a portion of his or her compensation. Amounts deferred are retained by the Trust and may represent an unfunded obligation of the Trust. The value of amounts deferred is determined by reference to the change in value of Class Z shares of one or more series of Columbia Acorn Trust or a money market fund as specified by the trustee. Benefits under the deferred compensation plan are payable when the trustee ceases to be a member of the Board of Trustees.
During the year ended December 31, 2010, the Fund engaged in purchase and sales transactions with funds that have a common investment adviser (or affiliated investment advisers), common directors/trustees, and/or common officers. Those purchase and sale transactions complied with provisions of Rule 17a-7 under the Investment Company Act of 1940 and were $- and $61,419, respectively.
5. Borrowing Arrangements
The Trust participates in a $150 million credit facility, along with another Trust managed by CWAM, which was entered into to facilitate portfolio liquidity. Under the facility, interest is charged to each participating fund based on its borrowings at a rate per annum equal to the higher of Federal Funds Rate or Overnight LIBOR plus 1.25%. In addition, a commitment fee of 0.15% per annum of the unutilized line of credit is accrued and apportioned among the participating funds based on their relative net assets. The commitment fee is included in "Other expenses" in the Statement of Operations. No amounts were borrowed by the Fund under this facility during the year ended December 31, 2010. The Trust enters into this line of credit for one year durations. The Trust has secured the line of credit for the entire year of 2011.
6. Fund Share Transactions
Proceeds and payments on Fund shares as shown in the Statement of Changes in Net Assets are in respect of the following numbers of shares:
| | | Year ended
December 31, 2010 | | Year ended
December 31, 2009 | |
| Shares sold | | | 125,113 | | | | 143,216 | | |
Shares issued in reinvestment
of dividend distributions | | | 24,723 | | | | 77,552 | | |
| Less shares redeemed | | | (483,784 | ) | | | (645,637 | ) | |
| Net decrease in shares outstanding | | | (333,948 | ) | | | (424,869 | ) | |
7. Investment Transactions
The aggregate cost of purchases and proceeds from sales other than short-term obligations for the year ended December 31, 2010 were $10,474,384 and $16,703,483, respectively.
8. Information Regarding Pending and Settled Legal Proceedings
In June 2004, an action captioned John E. Gallus et al. v. American Express Financial Corp. and American Express Financial Advisors Inc. was filed in the United States District Court for the District of Arizona. The plaintiffs allege that they are investors in several American Express Company (now known as legacy RiverSource) mutual funds and they purport to bring the action derivatively on behalf of those funds under the Investment Company Act of 1940. The plaintiffs allege that fees allegedly paid to the defendants by the funds for investment advisory and administrative services are excessive. The plaintiffs seek remedies including restitution and rescission of investment advisory and distribution agreements. The plaintiffs voluntarily agreed to transfer this case to the United States District Court for the Distri ct of Minnesota (the District Court). In response to defendants' motion to dismiss the complaint, the District Court dismissed one of plaintiffs' four claims and granted plaintiffs limited discovery. Defendants moved for summary judgment in April 2007. Summary judgment was granted in the defendants' favor on July 9, 2007. The plaintiffs filed a notice of appeal with the Eighth Circuit Court of Appeals (the Eighth Circuit) on August 8, 2007. On April 8, 2009, the Eighth Circuit reversed summary judgment and remanded to the District Court for further proceedings. On August 6, 2009, defendants filed a writ of certiorari with the U.S. Supreme Court (the Supreme Court), asking the Supreme Court to stay the District Court proceedings while the Supreme Court considers and rules in a case captioned Jones v. Harris Associates, which
16
Wanger International Select 2010 Annual Report
Notes to Financial Statements, continued
involves issues of law similar to those presented in the Gallus case. On March 30, 2010, the Supreme Court issued its ruling in Jones v. Harris Associates, and on April 5, 2010, the Supreme Court vacated the Eighth Circuit's decision in the Gallus case and remanded the case to the Eighth Circuit for further consideration in light of the Supreme Court's decision in Jones v. Harris Associates. On June 4, 2010, the Eighth Circuit remanded the Gallus case to the District Court for further consideration in light of the Supreme Court's decision in Jones v. Harris Associates. On December 9, 2010, the District Court reinstated its July 9, 2007 summary judgment order in favor of the defendants. On January 10, 2011, plaintiffs filed a notice of appeal with the Eighth Circuit.
In December 2005, without admitting or denying the allegations, American Express Financial Corporation (AEFC, which is now known as Ameriprise Financial, Inc. (Ameriprise Financial)), entered into settlement agreements with the Securities and Exchange Commission (SEC) and Minnesota Department of Commerce (MDOC) related to market timing activities. As a result, AEFC was censured and ordered to cease and desist from committing or causing any violations of certain provisions of the Investment Advisers Act of 1940, the Investment Company Act of 1940, and various Minnesota laws. AEFC agreed to pay disgorgement of $10 million and civil money penalties of $7 million. AEFC also agreed to retain an independent distribution consultant to assist in developing a plan for distribution of all disgorgement and civil penalties ordered by the SEC in accordance with various undertakings detailed at http://www.sec.gov/litigation/admin/ia-2451.pdf. Ameriprise Financial and its affiliates have cooperated with the SEC and the MDOC in these legal proceedings, and have made regular reports to the RiverSource, Seligman and Threadneedle funds' Boards of Directors/Trustees.
Ameriprise Financial and certain of its affiliates have historically been involved in a number of legal, arbitration and regulatory proceedings, including routine litigation, class actions, and governmental actions, concerning matters arising in connection with the conduct of their business activities. Ameriprise Financial believes that the Funds are not currently the subject of, and that neither Ameriprise Financial nor any of its affiliates are the subject of, any pending legal, arbitration or regulatory proceedings that are likely to have a material adverse effect on the Funds or the ability of Ameriprise Financial or its affiliates to perform under their contracts with the Funds. Ameriprise Financial is required to make 10-Q, 10-K and, as necessary, 8-K filings with the SEC on legal and regulatory matters that relate to Ameriprise Financial and its affiliates. Copies of these filings may be obtained by accessing the SEC website at www.s ec.gov.
There can be no assurance that these matters, or the adverse publicity associated with them, will not result in increased fund redemptions, reduced sale of fund shares or other adverse consequences to the Funds. Further, although we believe proceedings are not likely to have a material adverse effect on the Funds or the ability of Ameriprise Financial or its affiliates to perform under their contracts with the Funds, these proceedings are subject to uncertainties and, as such, we are unable to estimate the possible loss or range of loss that may result. An adverse outcome in one or more of these proceedings could result in adverse judgments, settlements, fines, penalties or other relief that could have a material adverse effect on the consolidated financial condition or results of operations of Ameriprise Financial.
*****
CWAM, Columbia Acorn Trust (another mutual fund family advised by CWAM), and the trustees of Columbia Acorn Trust (collectively, the "Columbia defendants") were named as defendants in class and derivative complaints that were consolidated in a Multi-District Action (the MDL Action) in the federal district court of Maryland. These lawsuits contend that defendants permitted certain investors to market time their trades in certain Columbia Acorn Funds. The MDL Action is ongoing. However, all claims against the Trust and the Independent Trustees of the Trust have been dismissed. Columbia Acorn and CWAM are also defendants in a state court class action lawsuit that alleges, in summary, that the Trust and CWAM exposed shareholders of Columbia Acorn International to trading by market timers by allegedly: (a) failing to properly evaluate daily whether a significant event affecting the value of the Fund's securities had occurred after foreign market s had closed but before the calculation of the Fund's net asset value (NAV); (b) failing to implement the Fund's portfolio valuation and share pricing policies and procedures; and (c) failing to know and implement applicable rules and regulations concerning the calculation of NAV (the Fair Valuation Lawsuit). The United States Court of Appeals for the Seventh Circuit ruled that the plaintiffs' state law claims were preempted under federal law, resulting in the dismissal of plaintiffs' complaint. Plaintiffs appealed the Seventh Circuit's ruling to the United States Supreme Court. The Supreme Court reversed the Seventh Circuit's ruling on jurisdictional grounds and the case was remanded to the state court.
On March 21, 2005, a class action complaint was filed against the Trust and CWAM seeking to rescind the contingent deferred sales charge (CDSC) assessed upon redemption of Class B shares of the Columbia Acorn Funds (the CDSC Lawsuit). In addition to the rescission of sales charges, plaintiffs seek recovery of actual damages, attorneys' fees and costs. The case was transferred to the MDL Action in the federal district court of Maryland. On September 14, 2007, the plaintiffs and the Columbia defendants named in the MDL Action, including the Columbia family of funds, entered into a stipulation of settlement with respect to all Columbia-related claims in the MDL Action described above, including the CDSC and Fair Valuation Lawsuits.
On April 23, 2010, the parties of the MDL Action filed a motion seeking: (a) preliminary approval of the MDL settlements; (b) the conditional certification of the plaintiff class for purposes of settlement; (c) approval of the form and manner of giving notice to the plaintiff class of the proposed settlements; and (d) approval of the proposed schedule for various deadlines in connection with the final settlement hearing. The motion was presented to and approved by the court on May 7, 2010.
On October 21, 2010, the court held a final hearing regarding the MDL settlements and on October 25, 2010 issued a final judgment and related orders that: (a) approved the settlements as fair, reasonable and adequate, and in the best interests of members of both the plaintiff class and current shareholders of the Columbia funds, including the Columbia Acorn Funds; (b) dismissed with prejudice all complaints against the Columbia defendants; and (c) approved a plan of distribution for the amounts due to the plaintiff class as established in the settlements. The orders of settlement do not create any liability for the Columbia Acorn Funds.
CWAM believes that the lawsuits described in the four preceeding paragraphs are not likely to materially affect its ability to provide investment management services to the Funds.
17
Wanger International Select 2010 Annual Report
Report of Independent Registered Public Accounting Firm
To the Board of Trustees and Shareholders of Wanger International Select:
In our opinion, the accompanying statement of assets and liabilities, including the statement of investments, and the related statements of operations and of changes in net assets and the financial highlights present fairly, in all material respects, the financial position of Wanger International Select (a series of the Wanger Advisers Trust, hereinafter referred to as the "Fund") at December 31, 2010, the results of its operations for the year then ended, the changes in its net assets for each of the two years in the period then ended and the financial highlights for each of the five years in the period then ended, in conformity with accounting principles generally accepted in the United States of America. These financial statements and financial highlights (hereafter referred to as "financial statements") are the responsibility of the Fund's management; our responsibility is to express an opinion on these financial statements based on ou r audits. We conducted our audits of these financial statements in accordance with the standards of the Public Company Accounting Oversight Board (United States). Those standards require that we plan and perform the audit to obtain reasonable assurance about whether the financial statements are free of material misstatement. An audit includes examining, on a test basis, evidence supporting the amounts and disclosures in the financial statements, assessing the accounting principles used and significant estimates made by management, and evaluating the overall financial statement presentation. We believe that our audits, which included confirmation of securities at December 31, 2010 by correspondence with the custodian and brokers, provide a reasonable basis for our opinion.
PricewaterhouseCoopers LLP
Chicago, Illinois
February 15, 2011
18
Wanger International Select 2010 Annual Report
Federal Income Tax Information (Unaudited)
Foreign taxes paid during the fiscal year ended December 31, 2010 of $38,854 are expected to be passed through to shareholders. This represents $0.02 per share. Eligible shareholders may claim this amount as a foreign tax credit.
Gross income derived from sources within foreign countries was $603,408 ($0.35 per share) for the fiscal year ended December 31, 2010.
6.52% of the ordinary income distributed by the Fund for the fiscal year ended December 31, 2010, qualified for the corporate dividends received deduction.
19
Wanger International Select 2010 Annual Report
Board of Trustees and Management of Wanger Advisors Trust
Each trustee may serve a term of unlimited duration. The Trust's By-laws generally require that a trustee retire at the end of the calendar year in which the trustee attains the age of 75 years. The trustees appoint their own successors, provided that at least two-thirds of the trustees, after such appointment, have been elected by shareholders. Shareholders may remove a trustee, with or without cause, upon the vote of two-thirds of the Trust's outstanding shares at any meeting called for that purpose. A trustee may be removed, with or without cause, upon the vote of a majority of the trustees. The names of the trustees and officers of the Trust, the date each was first elected or appointed to office, their principal business occupations during at least the last five years, number of portfolios in the fund complex they oversee, and other directorships they hold, are shown below. Each trustee serves in such capacity for each of the six serie s of Columbia Acorn Trust and for each of the four series of Wanger Advisors Trust.
The address for the trustees and officers of the Trust is Columbia Wanger Asset Management, LLC, 227 West Monroe Street, Suite 3000, Chicago, Illinois 60606. The Funds' Statement of Additional Information includes additional information about the Funds' trustees and officers. You may obtain a free copy of the Statement of Additional Information by writing or calling toll-free:
Columbia Wanger Asset Management, LLC
Shareholder Services Group
227 W. Monroe, Suite 3000
Chicago IL 60606
1-800-922-6769
Name, Position(s) with
Wanger Advisors Trust
and Age at
December 31, 2010 | | Year First
Elected or
Appointed
to Office* | | Principal Occupation(s) during
Past Five Years | | Number of
Portfolios in
Fund Complex
Overseen by
Trustee/Officer | | Other
Directorships
in addition to
Wanger Advisors Trust | |
| Trustees who are not interested persons of Wanger Advisors Trust: | | | | | | | |
|
Laura M. Born, 45,
Trustee | | | 2007 | | | Adjunct Assistant Professor of Finance, University of Chicago Booth School of Business; formerly, Managing Director – Investment Banking, JP Morgan Chase & Co. (broker/dealer) 2002-2007; prior thereto, associated with JP Morgan as an investment professional since 1991. | | | 10 | | | Columbia Acorn Trust | |
|
Michelle L. Collins, 50,
Trustee | | | 2008 | | | President, Cambium LLC (financial advisory firm) since 2007; Advisory Board Member, Svoboda Capital Partners LLC (private equity firm) since 2007; Managing Director Svoboda Capital Partners LLC, 1998-2006. | | | 10 | | | Columbia Acorn Trust; Bucyrus International, Inc. (mining equipment manufacturer); Molex, Inc. (electronics components manufacturer); CDW Corporation (electronics components manufacturer) (until October 2007). | |
|
Maureen M. Culhane, 62,
Trustee | | | 2007 | | | Retired. Formerly, Vice President, Goldman Sachs Asset Management, L.P. (investment adviser), 2005-2007, and Vice President (Consultant) — Strategic Relationship Management, Goldman Sachs & Co., 1999-2005. | | | 10 | | | Columbia Acorn Trust | |
|
Margaret M. Eisen, 57,
Trustee | | | 2002 | | | Chief Investment Officer, EAM International LLC (corporate finance and asset management) since 2003; Managing Director, CFA Institute, 2005-2008. | | | 10 | | | Columbia Acorn Trust; Antigenics, Inc. (biotechnology and pharmaceuticals) (until June 2009). | |
|
John C. Heaton, 51,
Trustee | | | 2010 | | | Joseph L. Gidwitz Professor of Finance, University of Chicago Booth School of Business; financial consultant. | | | | Columbia Acorn Trust | |
|
Steven N. Kaplan, 51,
Trustee and Vice Chairman of the Board | | | 1999 | | | Neubauer Family Professor of Entrepreneurship and Finance, University of Chicago Booth School of Business. | | | 10 | | | Columbia Acorn Trust; Accretive Health, Inc. (healthcare management services provider); Morningstar, Inc. (provider of independent investment research). | |
|
20
Wanger International Select 2010 Annual Report
Board of Trustees and Management of Wanger Advisors Trust
Name, Position(s) with
Wanger Advisors Trust
and Age at
December 31, 2010 | | Year First
Elected or
Appointed
to Office* | | Principal Occupation(s) during
Past Five Years | | Number of
Portfolios in
Fund Complex
Overseen by
Trustee/Officer | | Other
Directorships
in addition to
Wanger Advisors Trust | |
| Trustees who are not interested persons of Wanger Advisors Trust: (continued) | | | | | | | |
|
David C. Kleinman, 75,
Trustee(1) | | | 1972 | | | Adjunct Professor of Strategic Management, University of Chicago Booth School of Business; business consultant. | | | 10 | | | Columbia Acorn Trust; Sonic Foundry, Inc. (rich media systems and software). | |
|
Allan B. Muchin, 74,
Trustee | | | 1998 | | | Chairman Emeritus, Katten Muchin Rosenman LLP (law firm). | | | 10 | | | Columbia Acorn Trust | |
|
David B. Small, 54,
Trustee | | | 2010 | | | Managing Director, Chairman of Investment Committee, Grosvenor Capital Management, L.P. (investment adviser). | | | 10 | | | Columbia Acorn Trust | |
|
James A. Star, 49,
Trustee and Chairman of the Board | | | 2006 | | | President, Longview Asset Management LLC (investment adviser) since 2003; associated with Longview or its predecessors and affiliates since 1994. | | | 10 | | | Columbia Acorn Trust | |
|
| Trustees who are interested persons of Wanger Advisors Trust: | | | | | | | |
|
Charles P. McQuaid, 57,
Trustee and President (2) | | | 1992 | | | President and Chief Investment Officer, CWAM or its predecessors, since October 2003; associated with CWAM or its predecessors as an investment professional since 1978. | | | 10 | | | Columbia Acorn Trust | |
|
David J. Rudis, 57,
Trustee (3) | | | 2010 | | | National Checking and Debit Executive, and Illinois President, Bank of America, 2007 to 2009; President, Consumer Banking Group, LaSalle National Bank, 2004 to 2007. | | | 10 | | | Columbia Acorn Trust | |
|
| Trustee Emeritus | | | | | | | |
|
Ralph Wanger, 76,
Trustee Emeritus (4) | | | 1970 | | | Founder, CWAM. Formerly, President, Chief Investment Officer and portfolio manager, CWAM or its predecessors, July 1992 – September 2003; Director, Wanger Investment Company PLC; Consultant, CWAM or its predecessors, September 2003 – September 2005. | | | 10 | | | Columbia Acorn Trust | |
|
| Officers of Wanger Advisors Trust: | | | | | | | |
|
Ben Andrews, 44,
Vice President | | | 2004 | | | Portfolio manager and analyst, CWAM or its predecessors, since 1998; Vice President, Columbia Acorn Trust and Wanger Advisors Trust since 2004. | | | 10 | | | None | |
|
Michael G. Clarke, 41,
Assistant Treasurer | | | 2004 | | | Vice President, Columbia Management Investment Advisers, LLC since May 2010; Managing Director of Fund Administration, Columbia Management Advisors, LLC, from September 2004 to April 2010; senior officer of Columbia Family of Funds and affiliated funds since 2002. | | | 10 | | | None | |
|
Joseph F. DiMaria, 43,
Assistant Treasurer | | | 2010 | | | Vice President, Mutual Fund Administration, Columbia Management Investment Advisers, LLC, since May 2010; Director of Fund Administration, Columbia Management Advisors, LLC from January 2006 to April 2010; Head of Tax/Compliance and Assistant Treasurer, Columbia Management Advisors, LLC, from November 2004 to December 2005. | | | 10 | | | None | |
|
P. Zachary Egan, 42,
Vice President | | | 2003 | | | Director of International Research, CWAM or its predecessors, since December 2004; Vice President, Columbia Acorn Trust since 2003 and Wanger Advisors Trust since 2007; portfolio manager and analyst, CWAM or its predecessors, since 1999. | | | 10 | | | None | |
|
John Kunka, 40,
Assistant Treasurer | | | 2006 | | | Director of Accounting and Operations, CWAM or its predecessors, since May 2006; Manager of Mutual Fund Operations, Calamos Advisors, Inc. (investment advisor), September 2005 – May 2006; prior thereto, Manager of Mutual Fund Administration, Van Kampen Investments. | | | 10 | | | None | |
|
21
Wanger International Select 2010 Annual Report
Board of Trustees and Management of Wanger Advisors Trust
Name, Position(s) with
Wanger Advisors Trust
and Age at
December 31, 2010 | | Year First
Elected or
Appointed
to Office* | | Principal Occupation(s) during
Past Five Years | | Number of
Portfolios in
Fund Complex
Overseen by
Trustee/Officer | | Other
Directorships
in addition to
Wanger Advisors Trust | |
| Officers of Columbia Acorn Trust: (continued) | | | | | | | |
|
Joseph C. LaPalm, 41,
Vice President | | | 2006 | | | Chief Compliance Officer, CWAM since 2005; prior thereto, compliance officer, William Blair & Company (investment firm). | | | 10 | | | None | |
|
Bruce H. Lauer, 53,
Vice President, Secretary and Treasurer | | | 1995 | | | Chief Operating Officer, CWAM or its predecessors, since April 2000; Vice President, Secretary and Treasurer, Columbia Acorn Trust and Wanger Advisors Trust, since 1995; Director, Wanger Investment Company PLC; formerly, Director, Banc of America Capital Management (Ireland) Ltd.; and formerly, Director, Bank of America Global Liquidity Funds, PLC. | | | 10 | | | None | |
|
Louis J. Mendes III, 46,
Vice President | | | 2003 | | | Portfolio manager and analyst, CWAM or its predecessors, since 2001; Vice President, Columbia Acorn Trust since 2003 and Wanger Advisors Trust since 2005. | | | 10 | | | None | |
|
Robert A. Mohn, 49,
Vice President | | | 1997 | | | Director of Domestic Research, CWAM or its predecessors, since March 2004; Vice President, Columbia Acorn Trust and Wanger Advisors Trust, since 1997; portfolio manager and analyst, CWAM or its predecessors, since August 1992. | | | 10 | | | None | |
|
Christopher J. Olson, 46,
Vice President | | | 2001 | | | Portfolio manager and analyst, CWAM or its predecessors, since January 2001; Vice President, Columbia Acorn Trust and Wanger Advisors Trust, since 2001. | | | 10 | | | None | |
|
Scott R. Plummer, 51,
Assistant Secretary | | | 2010 | | | Chief Legal Officer and Assistant Secretary, Columbia Management Investment Advisers, LLC since June 2005; Vice President and Lead Chief Counsel — Asset Management, Ameriprise Financial since May 2010 (previously Vice President and Chief Counsel — Asset Management, from 2005 to April 2010, and Vice President — Asset Management Compliance from 2004 to 2005); Vice President, Chief Counsel and Assistant Secretary, Columbia Management Investment Distributors, Inc. since 2008; Vice President, General Counsel and Secretary, Ameriprise Certificate Company since 2005; Chief Counsel, RiverSource Distributors, Inc. from 2006 to 2010; Vice President, General Counsel and Secretary, RiverSource Funds, since December 2006; Senior Vice President, Secretary and Chief Legal Officer, Columbia Family of Funds since May 2010. | | | 10 | | | None | |
|
Christopher O. Petersen, 41,
Assistant Secretary | | | 2010 | | | Vice President and Chief Counsel, Ameriprise Financial since January 2010 (formerly Vice President and Group Counsel or Counsel from April 2004 to January 2010); Assistant Secretary of RiverSource Funds since January 2007. | | | 10 | | | None | |
|
Robert P. Scales, 58,
Chief Compliance Officer, Chief Legal Officer, Senior Vice President and General Counsel | | | 2004 | | | Chief Compliance Officer, Chief Legal Officer, Senior Vice President and General Counsel, Columbia Acorn Trust and Wanger Advisors Trust, since 2004. | | | 10 | | | None | |
|
Linda Roth-Wiszowaty, 41,
Assistant Secretary | | | 2006 | | | Business support analyst, CWAM, since April 2007; prior thereto executive administrator, CWAM or its predecessors, and executive assistant to the Chief Operating Officer of CWAM or its predecessors. | | | 10 | | | None | |
|
* Dates prior to April 1992 correspond to the date of first election or appointment as a trustee or officers of The Acorn Fund, Inc., the predecessor trust to Columbia Acorn Trust.
(1) Mr. Kleinman retired at the end of calendar year 2010.
(2) Mr. McQuaid is an "interested person" of Wanger Advisors Trust and of CWAM, as defined in the Investment Company Act of 1940 because he is an officer of the Trust and of CWAM.
(3) Mr. Rudis commenced service as a Trustee on January 1, 2011. Mr. Rudis is an "interested person" of Wanger Advisors Trust, as defined in the New York Attorney General's Assurance of Discontinuance ("Order") entered into in February 2005 by Columbia Management Advisors, LLC (an indirect subsidiary of Bank of America Corporate ("BOA")) and Columbia Management Distributors, Inc. (an indirect subsidiary of BOA), because of his former employment as a BOA executive.
(4) As permitted under the Wanger Advisors Trust's By-Laws, Mr. Wanger serves as a non-voting Trustee Emeritus of the Trust.
22
Wanger International Select 2010 Annual Report
This page intentionally left blank.
23
Wanger International Select 2010 Annual Report
This page intentionally left blank.
24
Wanger International Select 2010 Annual Report

Columbia Wanger Funds
Transfer Agent,
Dividend Disbursing Agent*
Columbia Management Investment Services Corp.
P.O. Box 8081
Boston, Massachusetts
02266-8081
Distributor*
Columbia Management Investment Distributors, Inc.
One Financial Center
Boston, Massachusetts
02111-2621
Investment Adviser
Columbia Wanger Asset Management, LLC
227 West Monroe Street, Suite 3000
Chicago, Illinois 60606
1-888-4-WANGER
(1-888-492-6437)
Legal Counsel to the Funds
Perkins Coie, LLP
Washington, DC
Legal Counsel to the Independent Trustees
Drinker Biddle & Reath LLP
Philadelphia, Pennsylvania
Independent Registered Public Accounting Firm
PricewaterhouseCoopers LLP
Chicago, Illinois
* As of May 1, 2010
This report, including the schedules of investments and financial statements, is submitted for the general information of the shareholders of the Wanger Advisors Trust.
A description of the Fund's proxy voting policies and procedures and a copy of the Fund's voting record for the most recent 12-month period ended June 30 are available (i) on the Securities and Exchange Commission's website at www.sec.gov, and (ii) without charge, upon request, by calling 888-492-6437.
The Fund files a complete schedule of portfolio holdings with the SEC for the first and third quarters of each fiscal year on Form N-Q. The Fund's Form N-Q is available on the SEC's website at www.sec.gov and may be reviewed and copied at the SEC's Public Reference Room in Washington, D.C. Information on the operation of the Pubic Reference Room may be obtained by calling 800-SEC-0330. The Fund's complete portfolio holdings are disclosed at www.columbiafunds.com approximately 30 days after each month end.
25
Columbia Wanger Funds
© 2011 Columbia Management Investment Advisers, LLC. All rights reserved.
C-1451 A (2/11) 113560
Wanger International
2010 Annual Report

Not FDIC insured • No bank guarantee • May lose value

Wanger International
2010 Annual Report
Table of Contents
| 1 | | | Understanding Your Expenses | |
|
| 2 | | | The Keys to Prosperity | |
|
| 4 | | | Performance Review | |
|
| 6 | | | Statement of Investments | |
|
| 16 | | | Statement of Assets and Liabilities | |
|
| 16 | | | Statement of Operations | |
|
| 17 | | | Statement of Changes in Net Assets | |
|
| 18 | | | Financial Highlights | |
|
| 19 | | | Notes to Financial Statements | |
|
| 24 | | | Report of Independent Registered Public Accounting Firm | |
|
| 25 | | | Federal Income Tax Information | |
|
| 26 | | | Board of Trustees and Management of Wanger Advisors Trust | |
|
Columbia Wanger Asset Management, LLC (CWAM) is one of the leading global small- and mid-cap equity managers in the United States with 40 years of small- and mid-cap investment experience. As of December 31, 2010, CWAM managed $33.9 billion in assets, and is the investment adviser to Wanger USA, Wanger International, Wanger Select and Wanger International Select (together, the Columbia Wanger Funds) and the Columbia Acorn Family of Funds.
Investors should consider the investment objectives, risks, charges and expenses of a mutual fund carefully before investing. For a free prospectus, which contains this and other important information about the Fund, contact your financial adviser or insurance company or contact 1-888-4-WANGER. Read the prospectus carefully before investing.
An important note: Columbia Wanger Funds are sold only to certain life insurance companies in connection with certain variable annuity contracts, variable life insurance policies and eligible qualified retirement plans.
The views expressed in "The Keys to Prosperity" and in the Performance Review reflect the current views of the respective authors. These views are not guarantees of future performance and involve certain risks, uncertainties and assumptions that are difficult to predict so actual outcomes and results may differ significantly from the views expressed. These views are subject to change at any time based upon economic, market or other conditions and the respective parties disclaim any responsibility to update such views. These views may not be relied on as investment advice and, because investment decisions for a Columbia Wanger Fund are based on numerous factors, may not be relied on as an indication of trading intent on behalf of any particular Columbia Wanger Fund. References to specific company securities should not be construed as a recommendation or investment advice.
Wanger International 2010 Annual Report
Understanding Your Expenses
As a Fund shareholder, you incur three types of costs. There are transaction costs, which generally include sales charges on purchases and may include redemption or exchange fees. There are also ongoing costs, which generally include investment advisory fees and other Fund expenses. Lastly, there may be additional fees or charges imposed by the insurance company that sponsors your variable annuity product. The information on this page is intended to help you understand your ongoing costs of investing in the Fund and to compare these costs with the ongoing costs of investing in other mutual funds.
Analyzing your Fund's expenses
To illustrate these ongoing costs, we have provided an example and calculated the expenses paid by investors in the Fund during the period. The information in the following table is based on an initial, hypothetical investment of $1,000, which is invested at the beginning of the period and held for the entire period. Expense information is calculated two ways and each method provides you with different results. The amount listed in the "Actual" column is calculated using actual operating expenses and total return for the Fund. The amount listed in the "Hypothetical" column assumes that the return each year is 5% before expenses and then applies the Fund's actual expense ratio for the period to the hypothetical return. You should not use the hypothetical account values and expenses to estimate either your actual account balance at the end of the period or the expenses you paid during the period. See "Compare with other funds" for details on using the hypothetical data.
Estimating your actual expenses
To estimate the expenses that you actually paid over the period, first you will need your account balance at the end of the period.
1. Divide your ending account balance by $1,000. For example, if an account balance was $8,600 at the end of the period, the result would be 8.6.
2. In the section of the table below titled "Expenses paid during the period," you will find a dollar amount in the column labeled "Actual." Multiply this amount by the result from step 1. Your answer is an estimate of the expenses you paid on your account during the period.
July 1, 2010 – December 31, 2010
| | | Account value at the
beginning of the period ($) | | Account value at the
end of the period ($) | | Expenses paid during
the period ($) | | Fund's annualized
expense ratio (%)* | |
| | | Actual | | Hypothetical | | Actual | | Hypothetical | | Actual | | Hypothetical | | Actual | |
| Wanger International | | | 1,000.00 | | | | 1,000.00 | | | | 1,287.70 | | | | 1,019.91 | | | | 6.05 | | | | 5.35 | | | | 1.05 | | |
*Expenses paid during the period are equal to the Fund's annualized expense ratio, multiplied by the average account value over the period, then multiplied by the number of days in the Fund's most recent fiscal half-year and divided by 365.
Had the investment adviser not waived fees or reimbursed a portion of expenses, account value at the end of the period would have been reduced.
It is important to note that the expense amounts shown in the table are meant to highlight only ongoing costs of investing in the Fund. Expenses paid during the period do not include any insurance charges imposed by your insurance company's separate account. The hypothetical example provided is useful in comparing ongoing costs only and will not help you determine the relative total costs of owning different funds whose shareholders may incur transaction costs.
Compare with other funds
Since all mutual funds are required to include the same hypothetical calculations about expenses in shareholder reports, you can use this information to compare the ongoing cost of investing in the Fund with other funds. To do so, compare the 5% hypothetical example with the 5% hypothetical examples of other funds. As you compare hypothetical examples of other funds, it is important to note that hypothetical examples are meant to highlight the ongoing cost of investing in a fund and do not reflect any transaction costs, such as sales charges, redemption fees or exchange fees that may be incurred by shareholders of other funds. Expenses paid during the period do not include any insurance charges imposed by your insurance company's separate accounts.
1
Wanger International 2010 Annual Report

The Keys to Prosperity
In 1651, Thomas Hobbes described human life as "poor, nasty, brutish and short." Today, 360 years later, humanity has achieved record levels of prosperity, safety and longevity. The United Nations estimates that poverty was reduced more in the last 50 years than the previous 500.1 In the developing world, life expectancy rose from 44 years to 64 years from 1950 to 1999, while in the developed world, life expectancy rose from 66 years to 78 years.2
Hobbes's perspective was accurate for his time. There was very little growth in worldwide per capita GDP until about 1820; income in Europe had dropped for centuries following the decline and collapse of the Roman Empire.3 England and much of Europe were caught in a Malthusian trap, with population gyrating up and down largely due to plagues, famines and wars. But sometime around 1820, economic growth accelerated, and per capita GDP growth has averaged over 2% yearly since then, compounding into excellent gains in living standards.4 Why?
Four Conditions for Growth
William Bernstein's The Birth of Plenty, How Prosperity in the Modern World was Created is a fascinating history of worldwide economic circumstances. He discusses reasons for the successes and failures of many empires and countries. Bernstein believes that four institutional conditions are necessary for sustained growth: property rights and civil liberties, scientific rationalism, efficient capital markets, and fast and cheap transportation and communications. He notes that these four factors existed temporarily in sixteenth century Holland, then firmly in the English speaking countries, and in the last 50 years, increasingly over much of the world.5
Physical and intellectual property rights plus civil liberties create incentives and intellectual freedom to work hard, innovate and create wealth. In empires, totalitarian states and feudalistic societies, incentives to produce beyond immediate needs are nil, because governments or lords tend to impose confiscatory taxes and arbitrarily seize property. Bernstein believes that Rome fell, in part, due to excessive taxation on farmers. He also thinks that an independent judiciary is necessary to enforce property rights and civil liberties.
Scientific rationalism is needed for technological progress and innovation. Throughout history, various regimes run by church and state ossified due to the rejection of scientific observations in favor of dogma or preconceived beliefs. During medieval times, for example, astronomers who concluded the earth revolved around the sun were tortured. Bernstein cites the trial of Galileo as a turning point toward scientific rationalism. Early inventors then tended to be tinkerers rather than scientists, but science became increasingly important. For example, by the nineteenth century the steel industry had initiated the use of modern science laboratories staffed by full-time researchers.6
Efficient capital markets enable entrepreneurs and enterprises to raise capital at reasonable costs. I remember Jesse Jackson citing a lack of capital as a cause for inner city poverty: "Capitalism without capital is just plain ism."7 Bernstein notes that entrepreneurs once had huge downside risk from failures, namely debtors prisons in recent centuries and enslavement by creditors in ancient times. The creation of limited liability corporations during the nineteenth century in Britain and the United States was a breakthrough in reducing downside risks for capitalists.
Fast and cheap transportation and communication are also needed for prosperity. Bernstein explains that before railroads and the telegraph, transportation and communication were horribly expensive and slow. Rarely could bulk goods be transported over land more than 20 miles a day, and theft was rampant. Local crop failures often caused starvation. Mass markets did not exist. The reach of rail and telegraph grew incredibly rapidly during their first decades, spurring economic growth.
Bernstein provides plenty of case studies of regimes and countries that stagnated or failed due to the lack of one or more conditions, ranging from ancient societies and Japan under the samurai to Communist countries of the twentieth century. He states, "Institutions, not the bounty of nature or freedom from imperialist domination, separate the winners from the losers in the global economy."8
Trade Drives Prosperity
Matt Ridley's The Rational Optimist, How Prosperity Evolves adds substantial perspective to Bernstein's work and provides comforting thoughts about the future. Though Ridley does not mention Bernstein by name, it is clear that he agrees with Bernstein's basic contentions. Ridley sees property rights as the primary key to prosperity. He quotes a study by MIT economist Daron Acemoglu, which compared measures of property rights to economic growth across countries and determined that three-quarters of the variation of economic growth is explained by property rights.9 Ridley adds, "In a sample of 127 countries, the sixty-three with higher economic freedom had more than four times the inco me per capita and twice the growth rate of the countries that did not."10
Ridley's emphasis is on trade, which he believes allows increasing specialization, expertise, productivity and innovation. Humans seem to be hard-wired for trade. Archaeological evidence indicates that some 100,000 years ago humans began to barter.11 People traded things and also absorbed ideas. Human intelligence became collective and cumulative. Ridley states that, more recently, the history of the modern world is a history of ideas meeting, mixing, mating and mutating.12 Innovation results from an exchange of ideas. I think of the iPhone. Steve Jobs utilizes technologies and resources developed over centuries and components originated in many countries to make an incredibly inn ovative and useful device.
Ridley notes that societies that halted trade regressed. After ocean levels rose 10,000 years ago and cut off Tasmania from Australia, people there gradually lost the ability to fish and make tools out of bones. European mariners discovered
2
Wanger International 2010 Annual Report
Tasmanians wearing nothing but wallaby pelts and seal-fat grease.13 As another example of a closed-off society, Ridley writes, "China went from a state of economic and technological exuberance in around AD 1000 to one of dense population, agrarian backwardness and desperate poverty in 1950;" per capita income there was about flat in those 950 years.14
Ridley takes a libertarian view, highly skeptical of government. He states, "...governments generally tend to be good things at first and bad things the longer they last. First they improve society's ability to flourish by providing central services and removing impediments to trade and specialization... But...governments gradually employ more and more ambitious elites who... give themselves more and more rules to enforce, until they kill the goose that lays the golden eggs. ... Because it is a monopoly, government brings inefficiency and stagnation to most things it runs..."15
Ridley asserts that African governments have largely caused economic problems in Africa. He writes that famines in Darfur and Zimbabwe were the result of government policies. Setting up a company in Tanzania takes 379 days and $5,500, a huge sum there. Botswana has done substantially better, growing per capita GDP nearly 8% annually since its independence in 1966. That growth exceeded China's, and is largely due to secure property rights, Ridley says. Ridley is optimistic for much of Africa, however. Cell phones are spreading rapidly, providing both communication and micro-finance (two of Bernstein's conditions for prosperity). Ridley cites wonderful examples of products and labor reaching optimal markets and payments being made over cell phones.16
Ridley has comforting thoughts about the future, debunking naysayers. He notes that (oddly enough) over time humans have temporarily exhausted or driven to extinction renewable resources like forests and certain animal species, while non-renewable resources have lasted much longer than many expected. In 1865, an economist said Britain's coal was running out, and as early as 1914 the U.S. Bureau of Mines wrote that American oil reserves would last 10 years.17
Ridley believes supplies of oil, coal and gas "will last decades, perhaps centuries, and people will find alternatives long before they run out."18 He states that prices of conventional fuels need to rise and prices of alternatives need to fall, and both will occur as conventional supplies run down and efficiencies of alternatives rise. Ridley notes that wind, solar and biomass alternatives envelop enormous quantities of land. He denounces organic farming, noting that if farm yields fell back to 1961 levels, 82% of the land area of the earth would be needed for farming, up from 38%. "The Dark Ages were a massive experiment in back-to-the-land hippy lifestyle (without the trust fund)," he says.19
Ridley largely dismisses climate change fears. The scenario that calls for significant climate change by the year 2100 is a scenario of dramatic economic growth. He believes the world, and especially developing countries, will be much, much richer and better able to adapt to and mitigate climate change. In the meantime, carbon intensity20 of the worldwide economy is rapidly dropping, as wood, dung and coal become relatively less important and natural gas and nuclear power gain share, in an environment of substantially more efficient lighting, heating, transportation and manufacturing.
While some of Ridley's arguments seem a bit over the top, I think they generally appear coherent and largely believable. As to the climate change issue, I advocate taking reasonable steps to mitigate global warming. Most of my family's road miles are in a hybrid vehicle and both my home and Columbia Wanger Asset Management have adopted compact florescent lighting. Several years ago we calculated that replacing over 100 incandescent bulbs at the office saved enough electricity to power three average-sized homes.
I agree that prosperity is driven by the factors named by Bernstein and Ridley and, though there are imbalances in world economics, I think things will be okay. The Great Recession has ended, growth has resumed and the keys to prosperity remain in place. Many parts of the developing world are booming and we have invested accordingly.


Charles P. McQuaid
President and Chief Investment Officer
Columbia Wanger Asset Management, LLC
The information and data provided in this analysis are derived from sources that we deem to be reliable and accurate. These views are not guarantees of future performance and involve certain risks, uncertainties and assumptions that are difficult to predict so actual outcomes and results may differ significantly from the views expressed. The views/opinions expressed in this essay are those of the author and not of the Wanger Advisors Trust Board, are subject to change at any time based upon economic, market or other conditions, may differ from views expressed by other Columbia Management associates and the respective parties disclaim any responsibility to update such views. These views may not be relied on as investment advice and, because investment decisions for a Columbia Wanger Fund are based on numerous factors, may not be relied on as an indication of trading intent on behalf of any particular Columbia Wanger Fund.
The information included on Pages 2 and 3 of this report is unaudited.
1 Ridley, Matt, The Rational Optimist, How Prosperity Evolves, (New York, New York, HarperCollins 2010), p. 15.
2 Bernstein, William J., The Birth of Plenty, How the Prosperity of the Modern World was Created, (New York, New York, McGraw-Hill 2004), p. 10.
3 Ibid, p. 3.
4 Ibid, p. 12, 23.
5 Ibid, p. 15-17.
6 Ibid, p. 123.
7 Rev. Jesse Jackson quoted in an article that appeared in Ebony magazine, August 1967, titled "Apostles of Economics," p. 84.
8 Bernstein, William J., op. cit, p. 293.
9 Ridley, Matt, op. cit, p. 321.
10 Ibid, p. 117.
11 Ibid, p. 350.
12 Ibid, p. 272.
13 Ibid, p. 78.
14 Ibid, p. 180.
15 Ibid, p. 182.
16 Ibid, p. 320-326.
17 Ibid, p. 237.
18 Ibid, p. 238.
19 Ibid, p. 144, 175.
20 Carbon intensity is defined as the amount of CO2 produced divided by worldwide GDP.
3
Wanger International 2010 Annual Report

Performance Review Wanger International
 | |  | |
|
Louis J. Mendes III
Co-Portfolio Manager | | Christopher J. Olson
Co-Portfolio Manager | |
|
Performance data shown represents past performance and is not a guarantee of future results. The investment return and principal value will fluctuate so that shares, when redeemed, may be worth more or less than the original cost. Current performance may be lower or higher than the performance data shown. For daily and most recent month-end performance updates, please call 1-888-4-WANGER.
Wanger International finished 2010 up 24.92% versus the 24.36% return of the S&P Global Ex-U.S. Between $500M and $5B Index, the Fund's primary benchmark. Smaller international stocks continued to outperform their larger-cap counterparts for the second consecutive year, and for four out of the last five years. The large-cap MSCI EAFE Index returned 7.75% in the year.
Emerging market demand continues to explain much of the ongoing rebound from 2008 in corporate earnings and stock returns around the world. While the U.S. grapples with rising budget deficits and Europeans ponder the possibility of default among one or more euro zone members, formerly troubled economies such as Thailand and Brazil now enjoy strong economic growth and corporate earnings and comparatively good public balance sheets. Indeed, as reported in the Financial Times, the World Bank calculates that domestic demand in developing economies contributed fully 46% of global growth in 2010.*
We believe this represents a significant opportunity for investors, although a highly differentiated one, as valuation and other intervening variables often stand between GDP growth and stock returns. While China, for example, continued to post high growth in 2010, its stock market (as measured by the Hang Seng China Enterprises Index) rose less than 2%. Emerging market stocks represented, in the course of the year, almost one quarter of Wanger International's assets. However, emerging market demand for goods and services provided by companies domiciled elsewhere remains a core component of the Fund's strategy, so implicit emerging market exposure is higher. With these companies we seek to access growth at either a more reasonable price or with less risk.
Unsurprisingly, emerging market stocks were among the largest contributors to positive returns in 2010. South African apparel, household and sporting goods retailer Mr. Price rose 120% as improved merchandising and working capital levels bolstered the company's already strong fundamentals. Zhaojin Mining Industry, a Chinese gold miner, posted a 109% gain on the back of rising gold prices, value-accretive acquisitions, exploration on current properties, and rising production. Also in China, Shandong Weigao, a manufacturer of vertically integrated hospital consumables, rose over 70% on strong demand for medical consumables and improving results from its joint venture with Medtronic. In India, Shriram Transport Finance increased 74% on high growth and low defaults in its core used truck finance business.
Disappointments in 2010 included Greek lottery company Intralot, which declined 38% on adverse tax developments in Bulgaria and Greece and start-up costs in the United States and Italy. A weak currency in Bulgaria further impacted earnings. Japanese retailer Point fell 29% on weak same-store sales and heavy upfront investments. We no longer hold this name in the Fund. Italian holding company CIR fell 29% as gas prices squeezed its electricity generation business.
It is notable that the U.S. dollar has fallen over 30% versus the yen, 28% versus the Swiss franc, and over 55% versus gold over the last five years. As managers, we take an agnostic view on currency, notwithstanding volatile movements and long-term uncertainties about the creditworthiness of certain countries. Instead, we consider carefully how currency movements might impact competitiveness and profitability within individual companies. And we seek to hedge out some of the risk relative to our benchmark caused by overweighting or underweighting countries or regions. Particularly in the present context of "quantitative easing" (printing money) and competitive devaluation, however, we take comfort as managers and investors in the Fund, knowing that equities confer claims on real businesses. Among the attractions of an internationally diversified equity portfolio is the possibility it offers of retaining purchasing power through economic cy cles and bouts of monetary experimentation. We believe it may prove to be an important component of a capital preservation strategy.
* Beattie, Alan, "World Bank backs efforts to counter rapid inflows," Financial Times, January 13, 2011, p. 4.
International investing involves special risks, including foreign taxation, currency risks, risks associated with possible differences in financial standards and other risks associated with future political and economic developments. Stocks of small- and mid-cap companies pose special risks, including possible illiquidity and greater price volatility than stocks of larger, more established companies. Investing in emerging markets may involve greater risks than investing in more developed countries. In addition, concentration of investments in a single region may result in greater volatility.
Portfolio holdings are subject to change periodically and may not be representative of current holdings.
Fund's Positions in Mentioned Holdings
As a percentage of net assets, as of 12/31/10
| Zhaojin Mining Industry | | | 1.1 | % | |
| Mr. Price | | | 0.7 | | |
| Shandong Weigao | | | 0.6 | | |
| Shriram Transport Finance | | | 0.5 | | |
| Intralot | | | 0.4 | | |
| CIR | | | 0.3 | | |
4
Wanger International 2010 Annual Report
Growth of a $10,000 Investment in Wanger International
May 3, 1995 (inception date) through December 31, 2010
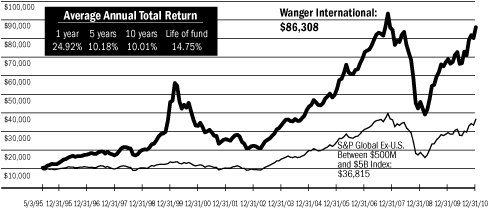
Performance data shown represents past performance and is not a guarantee of future results. The investment return and principal value will fluctuate so that shares, when redeemed, may be worth more or less than the original cost. Current performance may be lower or higher than the performance data shown. Performance results reflect any fee waivers or reimbursements of Fund expenses by the investment adviser and/or any of its affiliates. Absent these fee waivers and/or expense reimbursement arrangements, performance results would have been lower. For daily and most recent month-end performance updates, please call 1-888-4-WANGER.
This graph compares the results of $10,000 invested in Wanger International on May 3, 1995 (the date the Fund began operations) through December 31, 2010, to the S&P Global Ex-U.S. Between $500M and $5B Index with dividends and capital gains reinvested. Although the index is provided for use in assessing the Fund's performance, the Fund's holdings may differ significantly from those in the index.
Top 10 Holdings
As a percentage of net assets, as of 12/31/10
1. Naspers (South Africa)
Media in Africa, China, Russia & Other Emerging Markets | | | 1.5
| % | |
2. Hexagon (Sweden)
Measurement Equipment & Software | | | 1.5
| | |
3. Olam International (Singapore)
Agriculture Supply Chain Manager | | | 1.4
| | |
4. Localiza Rent A Car (Brazil)
Car Rental | | | 1.2
| | |
5. Imtech (Netherlands)
Electromechanical & Information & Communications Technologies Installation & Maintenance | | | 1.2
| | |
6. Kansai Paint (Japan)
Paint Producer in Japan, India, China & Southeast Asia | | | 1.1
| | |
7. Zhaojin Mining Industry (China)
Gold Mining & Refining in China | | | 1.1
| | |
8. Fugro (Netherlands)
Sub-sea Oilfield Services | | | 1.0
| | |
9. NHN (South Korea)
South Korea's Largest Online Search Engine | | | 1.0
| | |
10. Advance Residence Investment (Japan)
Residential REIT | | | 1.0
| | |
Top 5 Countries
As a percentage of net assets, as of 12/31/10
| Japan | | | 15.9 | % | |
| United Kingdom | | | 7.7 | | |
| China | | | 6.4 | | |
| Netherlands | | | 6.4 | | |
| Canada | | | 5.1 | | |
Results as of December 31, 2010
| | | 4th quarter | | 1 year | | 5 years | | 10 years | |
| Wanger International | | | 8.78 | % | | | 24.92 | % | | | 10.18 | % | | | 10.01 | % | |
S&P Global Ex-U.S. Between $500M
and $5B Index* | | | 10.58 | | | | 24.36 | | | | 8.19 | | | | 11.75 | | |
| MSCI EAFE Index | | | 6.61 | | | | 7.75 | | | | 2.46 | | | | 3.50 | | |
Lipper International Core Funds
Variable Underlying Index | | | 7.26 | | | | 11.09 | | | | 2.49 | | | | 2.50 | | |
NAV as of 12/31/10: $36.16
* The Fund's primary benchmark.
Performance numbers reflect all Fund expenses but do not include any insurance charge imposed by your insurance company's separate accounts. If performance included the effect of these additional charges, it would be lower.
All results shown assume reinvestment of distributions and do not reflect taxes that a shareholder may pay on Fund distributions or the sale of Fund shares.
The S&P Global Ex-U.S. Between $500M and $5B Index is a subset of the broad market selected by the index sponsor representing the mid- and small-cap developed and emerging markets, excluding the United States. The Morgan Stanley Capital International Europe, Australasia, Far East (MSCI EAFE) Index is a capitalization-weighted index that tracks the total return of common stocks in 22 developed-market countries within Europe, Australasia and the Far East. The returns of the MSCI EAFE Index are presented net of taxes. The Lipper International Core Funds Variable Underlying Index is an equally weighted representation of the 30 largest variable insurance underlying funds in the Lipper International Core Funds Variable Underlying Classification. Indexes are not managed and do not incur fees or expenses. It is not possible to invest directly in an index.
Lipper Inc., a widely respected data provider in the industry, calculates an average total return (assuming reinvestment of distributions) for mutual funds with investment objectives similar to those of the Fund. Lipper makes no adjustment for the effect of sales loads.
Portfolio characteristics and holdings are subject to change periodically and may not be representative of current characteristics and holdings.
5
Wanger International 2010 Annual Report
Wanger International
Statement of Investments, December 31, 2010
Number of
Shares | | | | Value | |
| | | Equities – 93.2% | |
| | | Asia – 36.8% | |
| | | Japan – 15.9% | |
| | 1,088,189 | | | Kansai Paint
Paint Producer in Japan, India, China & Southeast Asia | | $ | 10,528,548
| | |
| | 3,950 | | | Advance Residence Investment (a)
Residential REIT | | | 8,841,023
| | |
| | 3,160 | | | Seven Bank
ATM Processing Services | | | 6,689,953
| | |
| | 950 | | | Orix JREIT
Diversified REIT | | | 6,176,235
| | |
| | 277,242 | | | Aeon Delight
Facility Maintenance & Management | | | 5,457,954
| | |
| | 3,184 | | | Wacom
Computer Graphic Illustration Devices | | | 5,058,592
| | |
| | 1,197 | | | Start Today
Online Japanese Apparel Retailer | | | 4,782,411
| | |
| | 40,699 | | | Nakanishi
Dental Tools & Machinery | | | 4,309,326
| | |
| | 501,151 | | | Kamigumi
Port Cargo Handling & Logistics | | | 4,206,658
| | |
| | 775 | | | Osaka Securities Exchange
Osaka Securities Exchange | | | 3,907,452
| | |
| | 106,686 | | | Hamamatsu Photonics
Optical Sensors for Medical & Industrial Applications | | | 3,897,296
| | |
| | 120,316 | | | Tsumura
Traditional Chinese/Japanese Herbal Rx Drugs (Kampo) | | | 3,894,495
| | |
| | 294,454 | | | Asics
Footwear & Apparel | | | 3,782,661
| | |
| | 3,570 | | | Jupiter Telecommunications
Largest Cable Service Provider in Japan | | | 3,755,076
| | |
| | 130,341 | | | Kintetsu World Express
Airfreight Logistics | | | 3,726,121
| | |
| | 177,347 | | | Daiseki (b)
Waste Disposal & Recycling | | | 3,698,611
| | |
| | 199,700 | | | Hoshizaki Electric
Commercial Kitchen Equipment | | | 3,696,251
| | |
| | 104,711 | | | Ain Pharmaciez
Dispensing Pharmacy/Drugstore Operator | | | 3,682,203
| | |
| | 134,725 | | | Aeon Mall
Suburban Shopping Mall Developer, Owner & Operator | | | 3,615,023
| | |
| | 146,718 | | | Glory
Currency Handling Systems & Related Equipment | | | 3,611,218
| | |
Number of
Shares | | | | Value | |
| | 456 | | | Fukuoka
Diversified REIT in Fukuoka | | $ | 3,571,858
| | |
| | 106,803 | | | Ibiden
Electronic Parts & Ceramics | | | 3,365,640
| | |
| | 146,066 | | | Torishima Pump Manufacturing
Industrial Pump for Power Generation &
Water Supply Systems | | | 3,080,617
| | |
| | 160,760 | | | Ushio
Industrial Light Sources | | | 3,062,357
| | |
| | 240,000 | | | Gree
Mobile Social Networking Game Developer/Platform | | | 3,051,141
| | |
| | 74,286 | | | Makita
Power Tools | | | 3,037,082
| | |
| | 141,501 | | | Tamron
Camera Lens Maker | | | 2,945,038
| | |
| | 105,246 | | | Icom
Two Way Radio Communication Equipment | | | 2,883,305
| | |
| | 1,067,000 | | | Nippon Sheet Glass
Sheet Glass for Building & Automotive Use | | | 2,877,407
| | |
| | 60,722 | | | Benesse
Education Service Provider | | | 2,796,301
| | |
| | 231,893 | | | Rohto Pharmaceutical
Health & Beauty Products | | | 2,709,601
| | |
| | 138,000 | | | Asahi Diamond Industrial
Consumable Diamond Tools | | | 2,620,478
| | |
| | 92,758 | | | Miura
Industrial Boiler Manufacturer | | | 2,475,298
| | |
| | 259,239 | | | Suruga Bank
Regional Bank | | | 2,412,545
| | |
| | 400 | | | Kakaku.com
Online Price Comparison Services for Consumers | | | 2,378,635
| | |
| | 69,500 | | | Pigeon
Baby Care Products | | | 2,362,424
| | |
| | 141,809 | | | Japan Airport Terminal
Airport Terminal Operator at Haneda | | | 2,187,328
| | |
| | 55,571 | | | Olympus
Medical Equipment (Endoscopes) & Cameras | | | 1,680,395
| | |
| | 100 | | | Mori Hills
Tokyo Centric Diversified REIT | | | 386,716 | | |
| | 14 | | | As One
Scientific Supplies Distributor | | | 288 | | |
| | | | 147,201,561 | | |
See accompanying notes to financial statements.
6
Wanger International 2010 Annual Report
Wanger International
Statement of Investments, December 31, 2010
Number of
Shares | | | | Value | |
| | | China – 6.4% | |
| | 2,419,705 | | | Zhaojin Mining Industry
Gold Mining & Refining in China | | $ | 9,899,472
| | |
| | 5,438,000 | | | Jiangsu Expressway
Chinese Toll Road Operator | | | 6,240,603
| | |
| | 1,834,000 | | | China Yurun Food
Meat Processor in China | | | 6,063,941
| | |
| | 1,865,670 | | | Shandong Weigao
Vertically Integrated Hospital Consumable Manufacturing | | | 5,280,560
| | |
| | 5,047,800 | | | China Green
Chinese Fruit & Vegetable Grower & Processor | | | 4,935,580
| | |
| | 42,400 | | | New Oriental Education &
Technology – ADR (a)
China's Largest Private Education Service Provider | | | 4,461,752
| | |
| | 166,710 | | | Mindray – ADR (b)
Medical Device Manufacturer | | | 4,401,144
| | |
| | 6,760,000 | | | China Communication Services
China's Telecom Infrastructure Service Provider | | | 4,026,709
| | |
| | 36,184,524 | | | RexLot Holdings
Lottery Equipment Supplier in China | | | 3,817,326
| | |
| | 4,419,901 | | | Wasion Group
Electronic Power Meter Total Solution Provider | | | 2,922,794
| | |
| | 275,400 | | | China Xiniya Fashion – ADR (a)(b)
Men's Apparel Provider in China | | | 2,522,664
| | |
| | 2,954,300 | | | Sino Ocean Land
Property Developer in China | | | 1,934,616
| | |
| | 37,000 | | | 51job – ADR (a)
Integrated Human Resources Service Provider | | | 1,822,250
| | |
| | 36,800 | | | Noah Holdings – ADR (a)(b)
Wealth Management Product Distributor in China | | | 719,440
| | |
| | 19,700 | | | XueDa Education Group – ADR (a)
Chinese Tutoring | | | 222,019
| | |
| | 4,580,000 | | | Fu Ji Food & Catering Services (a)(c)
Food Catering Service Provider in China | | | 23,569
| | |
| | | | 59,294,439 | | |
| | | Singapore – 4.4% | |
| | 5,200,000 | | | Olam International
Agriculture Supply Chain Manager | | | 12,722,952
| | |
| | 9,750,000 | | | Mapletree Logistics Trust
Asian Logistics Landlord | | | 7,331,398
| | |
| | 3,000,000 | | | CDL Hospitality Trust
Hotel Owner/Operator | | | 4,862,275
| | |
Number of
Shares | | | | Value | |
| | 3,003,072 | | | Ascendas REIT
Singapore Industrial Property Landlord | | $ | 4,843,853
| | |
| | 5,640,000 | | | Mapletree Industrial Trust (a)
Singapore Industrial REIT | | | 4,790,276
| | |
| | 600,000 | | | Singapore Exchange
Singapore Equity & Derivatives Market Operator | | | 3,936,572
| | |
| | 1,600,000 | | | Goodpack
International Bulk Container Leasing | | | 2,555,811
| | |
| | | | 41,043,137 | | |
| | | Hong Kong – 3.2% | |
| | 3,327,892 | | | Lifestyle International
Mid- to High-end Department Store Operator
in Hong Kong & China | | | 8,177,586 | | |
| | 1,000,000 | | | Melco Crown Entertainment – ADR (a)(b)
Macau Casino Operator | | | 6,360,000
| | |
| | 5,056,000 | | | Mongolian Mining (a)
Coking Coal Mining in Mongolia | | | 5,899,794
| | |
| | 1,577,000 | | | L'Occitane International (a)
Skin Care & Cosmetics Producer | | | 4,362,070
| | |
| | 110,000 | | | Hong Kong Exchanges and Clearing
Hong Kong Equity & Derivatives Market Operator | | | 2,494,982
| | |
| | 3,243,600 | | | Sa Sa International
Chinese Discount Cosmetics Retailer | | | 2,019,739
| | |
| | | | 29,314,171 | | |
| | | India – 3.2% | |
| | 84,900 | | | Asian Paints
India's Largest Paint Company | | | 5,477,726
| | |
| | 270,000 | | | Shriram Transport Finance
Truck Financing in India | | | 4,740,020
| | |
| | 961,300 | | | Jain Irrigation Systems
Agricultural Micro-irrigation Systems & Food Processing | | | 4,527,558
| | |
| | 684,500 | | | Infrastructure Development Finance
Infrastructure Finance in India | | | 2,802,141
| | |
| | 4,570,000 | | | REI Agro
Basmati Rice Processing | | | 2,785,027
| | |
| | 1,430,800 | | | S. Kumars Nationwide (a)
Textiles, Clothing & Retail | | | 2,769,445
| | |
| | 750,000 | | | Mundra Port & Special Economic Zone
Indian West Coast Shipping Port | | | 2,411,104
| | |
See accompanying notes to financial statements.
7
Wanger International 2010 Annual Report
Wanger International
Statement of Investments, December 31, 2010
Number of
Shares | | | | Value | |
| | | India – 3.2% (cont) | |
| | 319,100 | | | Patel Engineering
Civil Engineering & Construction | | $ | 2,176,574
| | |
| | 475,000 | | | Manappuram General Finance
Short-term Lending Collateralized by Household Gold | | | 1,582,802
| | |
| | | | 29,272,397 | | |
| | | South Korea – 2.0% | |
| | 45,200 | | | NHN (a)
South Korea's Largest Online Search Engine | | | 9,019,415
| | |
| | 172,100 | | | Woongjin Coway
South Korean Household Appliance Rental Service Provider | | | 6,106,716
| | |
| | 18,700 | | | MegaStudy (a)
Online Education Service Provider | | | 2,903,057
| | |
| | 10,893 | | | Taewoong (a)
Niche Custom Forging | | | 450,683
| | |
| | | | 18,479,871 | | |
| | | Taiwan – 1.6% | |
| | 1,071,000 | | | Simplo Technology
World's Largest Notebook Battery Pack Supplier | | | 7,787,355
| | |
| | 240,500 | | | Formosa International Hotels
Hotel, Food & Beverage Operation &
Hospitality Management Services | | | 4,256,272 | | |
| | 1,082,500 | | | Everlight Electronics
LED Packager | | | 3,133,538
| | |
| | | | 15,177,165 | | |
| | | Thailand – 0.1% | |
| | 4,276,400 | | | Home Product Center
DIY Home Improvement Retailer | | | 1,248,377
| | |
| | | | | Total Asia | | | 341,031,118 | | |
| | | Europe – 36.0% | |
| | | United Kingdom – 7.7% | |
| | 996,000 | | | Serco
Facilities Management | | | 8,626,153
| | |
| | 300,428 | | | Intertek Group
Testing, Inspection & Certification Services | | | 8,314,048
| | |
| | 7,592,066 | | | Archipelago Resources (a)
Gold Mining Projects in Indonesia, Vietnam &
the Philippines | | | 7,220,438 | | |
Number of
Shares | | | | Value | |
| | 144,002 | | | Chemring
Defense Manufacturer of Countermeasures & Energetics | | $ | 6,519,869
| | |
| | 2,250,000 | | | Charles Taylor (d)
Insurance Services | | | 5,840,775
| | |
| | 259,000 | | | Petropavlovsk
Gold & Iron Ore Mining in Russia | | | 4,619,549
| | |
| | 1,332,984 | | | Cobham
Aerospace Components | | | 4,229,248
| | |
| | 9,315,826 | | | Workspace Group
United Kingdom Real Estate | | | 3,413,210
| | |
| | 91,875 | | | Rotork
Valve Actuators for Oil & Water Pipelines | | | 2,618,468
| | |
| | 489,935 | | | Abcam
Online Sales of Antibodies | | | 2,444,343
| | |
| | 652,534 | | | RPS Group
Environmental Consulting & Planning | | | 2,344,010
| | |
| | 219,118 | | | JLT Group
International Business Insurance Broker | | | 2,148,832
| | |
| | 200,158 | | | Smith & Nephew
Medical Equipment & Supplies | | | 2,111,128
| | |
| | 339,200 | | | Micro Focus
United Kingdom Legacy Software Provider | | | 2,055,626
| | |
| | 103,604 | | | Tullow Oil
Oil & Gas Producer | | | 2,036,880
| | |
| | 409,300 | | | FlyBe (a)
Largest European Regional Airline | | | 2,026,092
| | |
| | 49,000 | | | Premier Oil (a)
Oil & Gas Producer in Europe, Pakistan & Asia | | | 1,489,719
| | |
| | 556,698 | | | PureCircle (a)
Natural Sweeteners | | | 1,436,453
| | |
| | 250,000 | | | SKIL Ports & Logistics (a)
Indian Container Port Project | | | 956,897
| | |
| | 238,400 | | | Sterling Resources (a) | | | 827,195 | | |
| | 161,600 | | | Sterling Resources (a)(e)
Oil & Gas Exploration – Europe | �� | | 549,502
| | |
| | | | 71,828,435 | | |
| | | Netherlands – 6.4% | |
| | 288,786 | | | Imtech
Electromechanical & Information & Communications
Technologies Installation & Maintenance | | | 10,955,834 | | |
| | 114,680 | | | Fugro
Sub-sea Oilfield Services | | | 9,424,683
| | |
See accompanying notes to financial statements.
8
Wanger International 2010 Annual Report
Wanger International
Statement of Investments, December 31, 2010
Number of
Shares | | | | Value | |
| | | Netherlands – 6.4% (cont) | |
| | 154,474 | | | Vopak
World's Largest Operator of Petroleum &
Chemical Storage Terminals | | $ | 7,297,074 | | |
| | 223,514 | | | Unit 4 Agresso
Business Software Development | | | 7,235,565
| | |
| | 186,301 | | | Koninklijke TenCate
Advanced Textiles & Industrial Fabrics | | | 6,970,712
| | |
| | 312,364 | | | Aalberts Industries
Flow Control & Heat Treatment | | | 6,584,674
| | |
| | 193,566 | | | Arcadis
Engineering Consultants | | | 4,504,603
| | |
| | 169,900 | | | USG People (a)
Temporary Staffing Services | | | 3,450,968
| | |
| | 30,034 | | | Core Laboratories
Oil & Gas Reservoir Consulting | | | 2,674,528
| | |
| | | | 59,098,641 | | |
| | | France – 4.5% | |
| | 87,000 | | | Neopost
Postage Meter Machines | | | 7,580,028
| | |
| | 85,100 | | | Eurofins Scientific
Food, Pharmaceuticals & Materials Screening & Testing | | | 6,129,461
| | |
| | 135,200 | | | Saft
Niche Battery Manufacturer | | | 4,977,396
| | |
| | 41,200 | | | Rubis
Tank Storage & Liquefied Petroleum Gas Distribution | | | 4,798,092
| | |
| | 80,200 | | | Mersen
Advanced Industrial Materials | | | 3,675,974
| | |
| | 44,000 | | | Pierre & Vacances
Vacation Apartment Lets | | | 3,550,175
| | |
| | 99,500 | | | Teleperformance
Call Center Operator | | | 3,357,286
| | |
| | 29,544 | | | Norbert Dentressangle
Leading European Logistics & Transport Group | | | 2,617,500
| | |
| | 61,000 | | | Gemalto
Smart Card Products & Solutions | | | 2,595,823
| | |
| | 261,133 | | | Hi-Media (a)(b)
Online Advertiser in Europe | | | 1,221,332
| | |
| | 56,000 | | | Toreador Resources (a)(b)
Drilling for Oil in France's Paris Basin | | | 869,120
| | |
| | | | 41,372,187 | | |
Number of
Shares | | | | Value | |
| | | Germany – 3.5% | |
| | 45,200 | | | Vossloh
Rail Infrastructure & Diesel Locomotives | | $ | 5,772,177
| | |
| | 91,636 | | | CTS Eventim
Event Ticket Sales | | | 5,658,568
| | |
| | 56,000 | | | Rheinmetall
Defense & Automotive | | | 4,503,824
| | |
| | 318,394 | | | Wirecard
Online Payment Processing & Risk Management | | | 4,361,572
| | |
| | 190,582 | | | Rhoen-Klinikum
Health Care Services | | | 4,195,403
| | |
| | 16,409 | | | Rational
Commercial Ovens | | | 3,622,253
| | |
| | 80,600 | | | Elringklinger
Automobile Components | | | 2,852,393
| | |
| | 49,890 | | | Deutsche Beteiligungs
Private Equity Investment Management | | | 1,399,946
| | |
| | | | 32,366,136 | | |
| | | Switzerland – 3.0% | |
| | 48,116 | | | Kuehne & Nagel
Freight Forwarding/Logistics | | | 6,684,741
| | |
| | 27,386 | | | Geberit
Plumbing Supplies | | | 6,332,539
| | |
| | 27,830 | | | Partners Group
Private Markets Asset Management | | | 5,281,721
| | |
| | 2,313 | | | Sika
Chemicals for Construction & Industrial Applications | | | 5,076,213
| | |
| | 108,131 | | | Bank Sarasin & Cie
Private Banking | | | 4,927,320
| | |
| | | | 28,302,534 | | |
| | | Sweden – 2.5% | |
| | 640,469 | | | Hexagon
Measurement Equipment & Software | | | 13,736,356
| | |
| | 592,610 | | | Sweco
Engineering Consultants | | | 5,132,227
| | |
| | 110,614 | | | Orc Software (b)
Software for Securities Trading, Analysis &
Risk Management | | | 2,101,426 | | |
| | 160,329 | | | East Capital Explorer (a)
Sweden-based Russia/Central Eastern Europe
Investment Fund | | | 2,020,720 | | |
| | | | 22,990,729 | | |
See accompanying notes to financial statements.
9
Wanger International 2010 Annual Report
Wanger International
Statement of Investments, December 31, 2010
Number of
Shares | | | | Value | |
| | | Italy – 2.2% | |
| | 67,900 | | | Tod's
Leather Shoes & Bags | | $ | 6,710,831
| | |
| | 317,600 | | | Ansaldo STS
Railway Systems Integrator | | | 4,547,670
| | |
| | 615,959 | | | Credito Emiliano
Italian Regional Bank | | | 3,811,200
| | |
| | 621,000 | | | Terna
Italian Power Transmission | | | 2,623,138
| | |
| | 1,422,000 | | | CIR (a)
Italian Holding Company | | | 2,612,572
| | |
| | | | 20,305,411 | | |
| | | Ireland – 1.1% | |
| | 1,859,500 | | | United Drug
Irish Pharmaceutical Wholesaler & Outsourcer | | | 5,218,184
| | |
| | 65,507 | | | Paddy Power
Irish Betting Services | | | 2,687,386
| | |
| | 42,721 | | | Aryzta (a)
Baked Goods | | | 1,997,512
| | |
| | | | 9,903,082 | | |
| | | Finland – 0.9% | |
| | 143,341 | | | Stockmann
Department Store & Fashion Retailer in
Scandinavia & Russia | | | 5,421,408 | | |
| | 269,613 | | | Poyry
Engineering Consultants | | | 3,296,214
| | |
| | | | 8,717,622 | | |
| | | Denmark – 0.9% | |
| | 45,950 | | | Novozymes
Industrial Enzymes | | | 6,402,859
| | |
| | 10,200 | | | SimCorp
Software for Investment Managers | | | 1,636,430
| | |
| | | | 8,039,289 | | |
| | | Portugal – 0.7% | |
| | 1,087,200 | | | Redes Energéticas Nacionais
Portuguese Power Transmission & Gas Transportation | | | 3,748,289
| | |
| | 3,184,112 | | | Banco Comercial Português
Largest Portuguese Banking Franchise | | | 2,476,369
| | |
| | | | 6,224,658 | | |
Number of
Shares | | | | Value | |
| | | Iceland – 0.5% | |
| | 5,336,401 | | | Marel (a)
Largest Manufacturer of Poultry & Fish
Processing Equipment | | $ | 4,649,429 | | |
| | | Czech Republic – 0.5% | |
| | 18,191 | | | Komercni Banka
Leading Czech Republic Universal Bank | | | 4,304,766
| | |
| | | | | Russia – 0.5% | | | | | |
| | 118,300 | | | Mail.ru – GDR (a)(e)
Internet Social Networking & Games for Russian Speakers | | | 4,258,800
| | |
| | | | | Spain – 0.4% | | | | | |
| | 88,200 | | | Red Eléctrica de España
Spanish Power Transmission | | | 4,146,925
| | |
| | | Greece – 0.3% | |
| | 1,000,000 | | | Intralot
Lottery & Gaming Systems & Services | | | 3,327,387
| | |
| | | Poland – 0.3% | |
| | 136,143 | | | Central European Distribution (a)
Largest Spirits Company in Central & Eastern Europe | | | 3,117,675
| | |
| | | Norway – 0.1% | |
| | 53,948 | | | Atea
Leading Nordic IT Hardware/Software
Re-seller & Installation Company | | | 542,848 | | |
| | | | | Total Europe | | | 333,496,554 | | |
| | | Other Countries – 14.6% | |
| | | Canada – 5.1% | |
| | 254,315 | | | ShawCor
Oil & Gas Pipeline Products | | | 8,468,641
| | |
| | 195,549 | | | CCL Industries
Leading Global Label Manufacturer | | | 5,825,366
| | |
| | 110,400 | | | Baytex
Oil & Gas Producer in Canada | | | 5,175,243
| | |
| | 309,100 | | | Tahoe Resources (a)(e)
Silver Project in Guatemala | | | 4,478,422 | | |
| | 81,142 | | | AG Growth
Leading Manufacturer of Augers & Grain
Handling Equipment | | | 4,086,070 | | |
See accompanying notes to financial statements.
10
Wanger International 2010 Annual Report
Wanger International
Statement of Investments, December 31, 2010
Number of
Shares | | | | Value | |
| | | Canada – 5.1% (cont) | |
| | 135,221 | | | Ivanhoe Mines (a) | | $ | 3,127,912 | | |
| | 110,428 | | | Ivanhoe Mines (a)(b)(f) | | | 2,531,010 | | |
| | 135,221 | | | Ivanhoe Mines – Rights (a) | | | 182,235 | | |
| | 110,428 | | | Ivanhoe Mines – Rights (a)(f)
Copper Mine Project in Mongolia | | | 154,599
| | |
| | 4,000,000 | | | Eacom Timber (a)(e)
Canadian Lumber Producer | | | 2,562,607
| | |
| | 222,000 | | | Guyana Goldfields (a)(e)
Gold Mining Projects in Guyana | | | 2,377,072
| | |
| | 119,940 | | | Eldorado Gold
Gold Miner in Turkey, Greece, China & Brazil | | | 2,231,610
| | |
| | 78,815 | | | Black Diamond Group
Provides Accommodations/Equipment for
Oil Sands Exploitation | | | 1,705,029
| | |
| | 228,671 | | | Pan Orient (a)
Growth Oriented & Return Focused Asian Explorer | | | 1,529,380
| | |
| | 349,177 | | | Horizon North Logistics (a)
Provides Diversified Oil Service Offering
in Northern Canada | | | 1,043,001
| | |
| | 216,182 | | | DeeThree Exploration (a)(e) | | | 916,213 | | |
| | 133,000 | | | DeeThree Exploration (a)
Canadian Oil & Gas Producer | | | 575,178
| | |
| | 585,000 | | | Bowood Energy (a)(e)
Small E&P Targeting Alberta Bakken | | | 345,952
| | |
| | 10,000 | | | WestFire Energy (a)
Oil Producer in Alberta & Saskatchewan | | | 69,396
| | |
| | | | 47,384,936 | | |
| | | United States – 3.4% | |
| | 201,235 | | | Atwood Oceanics (a)
Offshore Drilling Contractor | | | 7,520,152
| | |
| | 137,910 | | | World Fuel Services
Global Fuel Broker | | | 4,986,826
| | |
| | 61,123 | | | Alexion Pharmaceuticals (a)
Biotech Focused on Orphan Diseases | | | 4,923,458
| | |
| | 49,361 | | | FMC Technologies (a)
Oil & Gas Wellhead Manufacturer | | | 4,388,686
| | |
| | 59,415 | | | Bristow (a)
Largest Provider of Helicopter Services to
Offshore Oil & Gas Producers | | | 2,813,300 | | |
| | 89,251 | | | BioMarin Pharmaceutical (a)
Biotech Focused on Orphan Diseases | | | 2,403,529
| | |
Number of
Shares | | | | Value | |
| | 84,361 | | | Textainer Group Holdings
Top International Container Leasor | | $ | 2,403,445
| | |
| | 27,500 | | | Onex Capital
Private Equity Firm | | | 836,091
| | |
| | 48,154 | | | Tesco (a)
Developing New Well Drilling Technologies | | | 764,685
| | |
| | 3,600 | | | Sodastream (a)
Home Beverage Carbonation System | | | 113,688 | | |
| | | | 31,153,860 | | |
| | | South Africa – 2.8% | |
| | 243,500 | | | Naspers
Media in Africa, China, Russia & Other Emerging Markets | | | 14,340,164
| | |
| | 684,185 | | | Mr. Price
South African Retailer of Apparel,
Household & Sporting Goods | | | 6,906,763 | | |
| | 707,200 | | | Northam Platinum
Platinum Mining in South Africa | | | 4,863,174
| | |
| | | | 26,110,101 | | |
| | | Australia – 1.8% | |
| | 1,096,258 | | | SAI Global
Publishing, Certification & Compliance Services | | | 5,471,714
| | |
| | 369,125 | | | UGL
Engineering & Facilities Management | | | 5,447,919
| | |
| | 47,885 | | | Cochlear
Cochlear Implants | | | 3,938,224
| | |
| | 1,113,163 | | | Hastie Group
Mechanical, Electrical & Hydraulic (MEH) Engineering | | | 1,087,309
| | |
| | 107,503 | | | Seek
Online Job Listing & Education | | | 728,996
| | |
| | | | 16,674,162 | | |
| | | Israel – 0.8% | |
| | 434,004 | | | Israel Chemicals
Producer of Potash, Phosphates, Bromine &
Specialty Chemicals | | | 7,442,959 | | |
| | | Senegal – 0.3% | |
| | 10,000 | | | Sonatel
Leading Telecoms Operator in Western Africa | | | 3,137,251
| | |
See accompanying notes to financial statements.
11
Wanger International 2010 Annual Report
Wanger International
Statement of Investments, December 31, 2010
Number of
Shares | | | | Value | |
| | | Kazakhstan – 0.3% | |
| | 262,500 | | | Halyk Savings Bank of
Kazakhstan – GDR (a)
Largest Retail Bank & Insurer in Kazakhstan | | $ | 2,638,125
| | |
| | | Egypt – 0.1% | |
| | 67,066 | | | Paints & Chemical Industries (Pachin)
Paints & Inks in Egypt | | | 623,877
| | |
| | | | | Total Other Countries | | | 135,165,271 | | |
| | | Latin America – 5.8% | |
| | | Brazil – 4.2% | |
| | 690,000 | | | Localiza Rent A Car
Car Rental | | | 11,183,740
| | |
| | 836,500 | | | Suzano
Brazilian Pulp & Paper Producer | | | 7,447,612
| | |
| | 193,300 | | | Natura
Direct Retailer of Cosmetics | | | 5,554,777
| | |
| | 444,300 | | | Mills Estruturas e Serviços de Engenharia
Civil Engineering & Construction | | | 5,513,498
| | |
| | 489,800 | | | MRV Engenharia
Brazilian Low-income Property Developer | | | 4,608,004
| | |
| | 740,700 | | | PDG Realty
Brazilian Low-income Property Developer | | | 4,535,195
| | |
| | | | 38,842,826 | | |
| | | Chile – 0.7% | |
| | 111,689 | | | Sociedad Quimica y | | | | | |
| | | | | Minera de Chile – ADR
Producer of Specialty Fertilizers, Lithium & Iodine | | | 6,524,871
| | |
| | | Mexico – 0.5% | |
| | 83,000 | | | Grupo Aeroportuario del Sureste – ADR
Mexican Airport Operator | | | 4,685,350
| | |
| | | Argentina – 0.4% | |
| | 1,204,545 | | | Union Agriculture Group (a)(e)
Farmland Operator in Uruguay | | | 2,649,999
| | |
| | 845,000 | | | Madalena Ventures (a)(e)
Oil & Gas Exploration in Argentina | | | 682,935
| | |
| | | | 3,332,934 | | |
| | | | | Total Latin America | | | 53,385,981 | | |
| Total Equities (Cost: $527,923,699) – 93.2% | | | 863,078,924 | | |
Number of Shares
or Principal Amount | | | | Value | |
| Securities Lending Collateral – 1.2% | | | |
| | 11,170,097 | | | Dreyfus Government Cash | |
| |
| | | | | Management Fund (g) | |
| |
| | | | | (7 day yield of 0.01%) | | $ | 11,170,097 | | |
| | | Total Securities Lending Collateral
(Cost: $11,170,097) | | | 11,170,097 | | |
| Short-Term Obligations – 2.9% | | | |
| | | Repurchase Agreement – 2.4% | |
| $ | 22,691,000 | | | Repurchase Agreement with Fixed
Income Clearing Corp., dated
12/31/10, due 1/03/11 at 0.16%,
collateralized by a U.S. Government
Agency obligation maturing 4/28/14,
market value $23,148,900
(repurchase proceeds $22,691,303) | | | 22,691,000 | | |
| | | Commercial Paper – 0.5% | |
| | 4,300,000 | | | Toyota Motor Credit 0.20% due 1/21/11 | | | 4,299,522 | | |
Total Short-Term Obligations
(Amortized Cost: $26,990,522) | | | 26,990,522 | | |
Total Investments
(Cost: $566,084,318) – 97.3% (h)(i) | | | 901,239,543 | | |
Obligation to Return Collateral for Securities
Loaned – (1.2)% | | | (11,170,097 | ) | |
| Cash and Other Assets Less Liabilities: 3.9% | | | 35,691,054 | | |
| Total Net Assets: 100.0% | | $ | 925,760,500 | | |
Notes to Statement of Investments:
(a) Non-income producing security.
(b) All or a portion of this security was on loan at December 31, 2010. The total market value of securities on loan at December 31, 2010 is $10,795,334.
(c) Illiquid security.
(d) An affiliated person of the Fund may include any company in which the Fund owns five percent or more of its outstanding voting shares. Holdings and transactions in this affiliated company during the year ended December 31, 2010, are as follows:
Affiliate | | Balance
of Shares
Held at
12/31/2009 | |
Purchases/
Additions | |
Sales/
Reductions | | Balance
of Shares
Held at
12/31/2010 | |
Value | |
Dividend | |
Charles
Taylor | | | 3,000,000 | | | | 150,000 | | | | 900,000 | | | | 2,250,000 | | | $ | 5,840,775 | | | $ | 637,621 | | |
See accompanying notes to financial statements.
12
Wanger International 2010 Annual Report
Wanger International
Statement of Investments, December 31, 2010
The aggregate cost and value of this company at December 31, 2010, was $9,152,033 and $5,840,775, respectively. Investments in the affiliated company represented 0.63% of the total net assets at December 31, 2010.
(e) Denotes a restricted security, which is subject to restrictions on resale under federal securities laws. These securities are valued at a fair value determined in good faith under consistently applied procedures established by the Board of Trustees. At December 31, 2010, the market value of these securities amounted to $18,821,502 which represented 2.03% of total net assets.
Additional information on these securities is as follows:
Security | | Acquisition
Dates | | Shares | | Cost | | Value | |
| Tahoe Resources | | 5/28/10 | | | 309,100 | | | $ | 1,765,109 | | | $ | 4,478,422 | | |
| Mail.ru – GDR | | 11/05/10 –
12/31/10 | | | 118,300 | | | | 3,953,850 | | | | 4,258,800 | | |
| Union Agriculture Group | | 12/08/10 | | | 1,204,545 | | | | 2,649,999 | | | | 2,649,999 | | |
| Eacom Timber | | 3/17/10 | | | 4,000,000 | | | | 1,980,198 | | | | 2,562,607 | | |
| Guyana Goldfields | | 1/19/10 | | | 222,000 | | | | 1,496,508 | | | | 2,377,072 | | |
| DeeThree Exploration | | 9/07/10 | | | 216,182 | | | | 564,524 | | | | 916,213 | | |
| Madalena Ventures | | 10/21/10 | | | 845,000 | | | | 535,436 | | | | 682,935 | | |
| Sterling Resources | | 12/02/10 | | | 161,600 | | | | 482,244 | | | | 549,502 | | |
| Bowood Energy | | 9/17/10 | | | 585,000 | | | | 142,239 | | | | 345,952 | | |
| | | | | | | $ | 13,570,107 | | | $ | 18,821,502 | | |
(f) Security is traded on a U.S. exchange.
(g) Investment made with cash collateral received from securities lending activity.
(h) At December 31, 2010, for federal income tax purposes cost of investments was $599,510,744 and net unrealized appreciation was $301,728,799 consisting of gross unrealized appreciation of $326,988,345 and gross unrealized depreciation of $25,259,546.
(i) On December 31, 2010, the Fund's total investments were denominated in currencies as follows:
| Currency | | Value | | Percentage of
Net Assets | |
| Euro | | $ | 181,918,402 | | | | 19.7 | | |
| Japanese Yen | | | 147,201,561 | | | | 15.9 | | |
| U.S. Dollar | | | 107,921,638 | | | | 11.7 | | |
| British Pound | | | 70,451,738 | | | | 7.6 | | |
| Hong Kong Dollar | | | 68,099,342 | | | | 7.3 | | |
| Canadian Dollar | | | 47,595,050 | | | | 5.1 | | |
Other currencies less than
5% of total net assets | | | 266,881,715 | | | | 28.8 | | |
Cash and other assets
less liabilities | | | 35,691,054 | | | | 3.9 | | |
| | | $ | 925,760,500 | | | | 100.0 | | |
ADR = American Depositary Receipts
GDR = Global Depositary Receipts
AUD = Australian Dollar
CAD = Canadian Dollar
EUR = Euro
JPY = Japanese Yen
USD = United States Dollar
At December 31, 2010, the Fund had entered into the following forward foreign currency exchange contracts:
| Foreign Exchange Rate Risk | |
Forward
Foreign
Currency
Exchange
Contracts
to Buy | | Forward
Foreign
Currency
Exchange
Contracts
to Sell | |
Principal
Amount in
Foreign
Currency | |
Principal
Amount in
U.S. Dollar | |
Settlement
Date | |
Unrealized
Appreciation | |
| AUD | | | | USD | | | | | 4,377,125 | | | $ | 4,300,000 | | | 1/14/11 | | $ | 171,932 | | |
| AUD | | | | USD | | | | | 703,298 | | | | 700,000 | | | 1/14/11 | | | 18,532 | | |
| AUD | | | | USD | | | | | 4,396,279 | | | | 4,300,000 | | | 2/15/11 | | | 173,674 | | |
| AUD | | | | USD | | | | | 706,129 | | | | 700,000 | | | 2/15/11 | | | 18,560 | | |
| AUD | | | | USD | | | | | 5,061,753 | | | | 5,000,000 | | | 3/15/11 | | | 132,642 | | |
| CAD | | | | USD | | | | | 4,031,720 | | | | 4,000,000 | | | 1/14/11 | | | 54,070 | | |
| CAD | | | | USD | | | | | 503,645 | | | | 500,000 | | | 1/14/11 | | | 6,437 | | |
| CAD | | | | USD | | | | | 4,047,600 | | | | 4,000,000 | | | 2/15/11 | | | 67,386 | | |
| CAD | | | | USD | | | | | 503,980 | | | | 500,000 | | | 2/15/11 | | | 6,444 | | |
| CAD | | | | USD | | | | | 4,538,745 | | | | 4,500,000 | | | 3/15/11 | | | 57,808 | | |
| USD | | | | EUR | | | | | 7,404,770 | | | | 10,400,000 | | | 1/14/11 | | | 505,173 | | |
| USD | | | | EUR | | | | | 1,196,745 | | | | 1,600,000 | | | 1/14/11 | | | 817 | | |
| USD | | | | EUR | | | | | 7,586,811 | | | | 10,400,000 | | | 2/15/11 | | | 262,813 | | |
| USD | | | | EUR | | | | | 1,196,888 | | | | 1,600,000 | | | 2/15/11 | | | 767 | | |
| USD | | | | EUR | | | | | 8,978,474 | | | | 12,000,000 | | | 3/15/11 | | | 4,884 | | |
| JPY | | | | USD | | | | | 170,940,000 | | | | 2,100,000 | | | 1/14/11 | | | 5,635 | | |
| JPY | | | | USD | | | | | 33,393,200 | | | | 400,000 | | | 1/14/11 | | | 11,337 | | |
| JPY | | | | USD | | | | | 172,851,000 | | | | 2,100,000 | | | 2/15/11 | | | 29,889 | | |
| JPY | | | | USD | | | | | 33,381,600 | | | | 400,000 | | | 2/15/11 | | | 11,332 | | |
| JPY | | | | USD | | | | | 208,577,500 | | | | 2,500,000 | | | 3/15/11 | | | 70,859 | | |
| | | | | | | | | $ | 72,000,000 | | | | | | | $ | 1,610,991 | | |
The counterparty for all forward foreign currency exchange contracts is State Street Bank and Trust Company.
See accompanying notes to financial statements.
13
Wanger International 2010 Annual Report
Wanger International
Statement of Investments, December 31, 2010
The following table summarizes the inputs used, as of December 31, 2010, in valuing the Fund's assets:
| Investment Type | | Other
(Level 1) | | Significant
Observable
Quoted Prices
(Level 2) | | Significant
Unobservable
Inputs
(Level 3) | | Inputs
Total | |
| Equities | |
| Asia | | $ | 20,509,269 | | | $ | 320,498,280 | | | $ | 23,569 | | | $ | 341,031,118 | | |
| Europe | | | 11,747,318 | | | | 321,749,236 | | | | — | | | | 333,496,554 | | |
| Other Countries | | | 67,858,530 | | | | 67,306,741 | | | | — | | | | 135,165,271 | | |
| Latin America | | | 11,210,221 | | | | 39,525,761 | | | | 2,649,999 | | | | 53,385,981 | | |
| Total Equities | | | 111,325,338 | | | | 749,080,018 | | | | 2,673,568 | | | | 863,078,924 | | |
Total Securities
Lending Collateral | | | 11,170,097 | | | | — | | | | — | | | | 11,170,097 | | |
Total Short-Term
Obligations | | | — | | | | 26,990,522 | | | | — | | | | 26,990,522 | | |
| Total Investments | | | 122,495,435 | | | | 776,070,540 | | | | 2,673,568 | | | | 901,239,543 | | |
Unrealized
Appreciation on
Forward Foreign
Currency Exchange
Contracts | | | — | | | | 1,610,991 | | | | — | | | | 1,610,991 | | |
| Total | | $ | 122,495,435 | | | $ | 777,681,531 | | | $ | 2,673,568 | | | $ | 902,850,534 | | |
The Fund's assets assigned to the Level 2 input category are generally valued using a market approach, in which a security's value is determined through its correlation to prices and information from observable market transactions for similar or identical assets. Foreign equities are generally valued at the last sales price on the foreign exchange or market on which they trade. The Fund may use a systematic fair valuation model provided by an independent third party to value securities principally traded in foreign markets in order to adjust for possible stale pricing that may occur between the close of the foreign exchanges and the time for valuation. These models take into account available market data including intraday index, ADR, and ETF movements. Forward foreign currency exchange contracts are valued at the prevailing forward exchange rate of the underlying currencies. Secur ities acquired via private placement that have a holding period or an extended settlement period are valued at a discount to the same shares that are trading freely on the market. These discounts are determined by the adviser's experience with similar securities or situations. Factors may include, but are not limited to, trade volume, shares outstanding and stock price.
Certain short-term obligations may be valued using amortized cost, an income approach which converts future cash flows to a present value based upon the discount or premium at purchase.
The Fund's assets assigned to the Level 3 input category are valued at fair value as determined in good faith under consistently applied procedures established by and under the general supervision of the Board of Trustees. To determine fair value, management will utilize the valuation technique that they deem the most appropriate in the circumstances. Securities acquired via private placement but are not yet trading are valued using a market approach for which management has determined that the original transaction price is the best representation of fair value. The original cost may be adjusted for the market movement in an index, ETF or similar security during the period it does not trade. Securities for which no market exists are valued based upon a market approach using some unobservable inputs which may include, but are not limited to, projected earnings, available cash, line of business, multiples, and consideration of the prioritizat ion of the equity in a company's capital structure.
The following table reconciles asset balances for the year ending December 31, 2010, in which significant unobservable inputs (Level 3) were used in determining value:
Investments
in Securities | | Balance as of
December 31,
2009 | | Realized
Gain/(Loss) | | Change in
Unrealized
Appreciation
(Depreciation) | | Purchases | | Sales | | Transfers
into
Level 3 | | Transfers
out of
Level 3 | | Balance
as of
December 31,
2010 | |
| Equities | |
| Asia | | $ | 47,257 | | | $ | — | | | $ | (23,688 | ) | | $ | — | | | $ | — | | | $ | — | | | $ | — | | | $ | 23,569 | | |
| Latin America | | | — | | | | — | | | | — | | | | 2,649,999 | | | | — | | | | — | | | | — | | | | 2,649,999 | | |
| | | $ | 47,257 | | | $ | — | | | $ | (23,688 | ) | | $ | 2,649,999 | | | $ | — | | | $ | — | | | $ | — | | | $ | 2,673,568 | | |
The information in the above reconciliation table represents fiscal year to date activity for any securities identified as using Level 3 inputs at either the beginning or the end of the current fiscal period.
The change in unrealized depreciation attributed to securities owned at December 31, 2010, which were valued using significant unobservable inputs (Level 3) amounted to $23,688. This amount is included in net change in unrealized appreciation (depreciation) on the Statement of Changes in Net Assets.
The following table shows transfers between Level 1 and Level 2 of the fair value hierarchy:
| Transfers In | | Transfers Out | |
| Level 1 | | Level 2 | | Level 1 | | Level 2 | |
| $ | 50,404,067 | | | $ | — | | | $ | — | | | $ | 50,404,067 | | |
Financial assets were transferred from Level 2 to Level 1 as they resumed trading during the period.
For more information on valuation inputs, and their aggregation into the levels used in the tables above, please refer to the Security Valuation section in the accompanying Notes to Financial Statements.
See accompanying notes to financial statements.
14
Wanger International 2010 Annual Report
Wanger International
Portfolio Diversification December 31, 2010
At December 31, 2010, the Fund's portfolio investments as a percentage of net assets was diversified as follows:
| | | Value | | Percentage of
Net Assets | |
| Industrial Goods & Services | |
| Other Industrial Services | | $ | 76,865,530 | | | | 8.3 | | |
| Machinery | | | 59,254,228 | | | | 6.4 | | |
| Industrial Materials & Specialty Chemicals | | | 58,453,539 | | | | 6.3 | | |
| Electrical Components | | | 22,154,510 | | | | 2.4 | | |
| Construction | | | 14,022,611 | | | | 1.5 | | |
| Outsourcing Services | | | 12,077,121 | | | | 1.3 | | |
| Conglomerates | | | 6,584,674 | | | | 0.7 | | |
| Medical Equipment & Devices | | | 4,309,326 | | | | 0.5 | | |
| Industrial Distribution | | | 2,556,099 | | | | 0.3 | | |
| Educational Services | | | 956,897 | | | | 0.1 | | |
| | | | 257,234,535 | | | | 27.8 | | |
| Consumer Goods & Services | |
| Food & Beverage | | | 33,196,397 | | | | 3.6 | | |
| Nondurables | | | 27,525,069 | | | | 3.0 | | |
| Retail | | | 22,254,516 | | | | 2.4 | | |
| Other Consumer Services | | | 21,805,910 | | | | 2.4 | | |
| Travel | | | 16,760,007 | | | | 1.8 | | |
| Casinos & Gaming | | | 16,192,099 | | | | 1.7 | | |
| Apparel | | | 14,496,178 | | | | 1.5 | | |
| Other Entertainment | | | 9,914,840 | | | | 1.1 | | |
| Educational Services | | | 4,683,771 | | | | 0.5 | | |
| Consumer Electronics | | | 2,945,038 | | | | 0.3 | | |
| | | | 169,773,825 | | | | 18.3 | | |
| Energy & Minerals | |
| Mining | | | 50,259,815 | | | | 5.4 | | |
| Oil Services | | | 36,128,177 | | | | 3.9 | | |
| Oil & Gas Producers | | | 15,066,713 | | | | 1.6 | | |
| Agricultural Commodities | | | 12,660,218 | | | | 1.4 | | |
| Oil Refining, Marketing & Distribution | | | 12,095,166 | | | | 1.3 | | |
| | | | 126,210,089 | | | | 13.6 | | |
| Information | |
| Internet Related | | | 30,726,010 | | | | 3.3 | | |
| Instrumentation | | | 17,633,652 | | | | 1.9 | | |
| Computer Hardware & Related Equipment | | | 15,441,770 | | | | 1.7 | | |
| Business Software | | | 10,927,621 | | | | 1.2 | | |
| Financial Processors | | | 10,793,126 | | | | 1.2 | | |
| Telephone and Data Services | | | 6,494,537 | | | | 0.7 | | |
| Telecommunications Equipment | | | 4,026,709 | | | | 0.4 | | |
| CATV | | | 3,755,076 | | | | 0.4 | | |
| Semiconductors & Related Equipment | | | 3,133,538 | | | | 0.3 | | |
| Gaming Equipment & Services | | | 3,051,141 | | | | 0.3 | | |
| Mobile Communications | | | 2,883,305 | | | | 0.3 | | |
| Computer Services | | | 2,644,274 | | | | 0.3 | | |
| Business Information & Marketing Services | | | 2,344,010 | | | | 0.3 | | |
| Advertising | | | 1,221,332 | | | | 0.1 | | |
| | | | 115,076,101 | | | | 12.4 | | |
| | | Value | | Percentage of
Net Assets | |
| Other Industries | |
| Real Estate | | $ | 55,294,659 | | | | 6.0 | | |
| Transportation | | | 24,924,265 | | | | 2.7 | | |
| Regulated Utilities | | | 10,518,352 | | | | 1.1 | | |
| Conglomerates | | | 2,612,572 | | | | 0.3 | | |
| | | | 93,349,848 | | | | 10.1 | | |
| Finance | |
| Banks | | | 25,135,099 | | | | 2.7 | | |
| Finance Companies | | | 14,189,250 | | | | 1.5 | | |
| Brokerage & Money Management | | | 13,629,707 | | | | 1.5 | | |
| Insurance | | | 7,989,607 | | | | 0.9 | | |
| | | | 60,943,663 | | | | 6.6 | | |
| Health Care | |
| Medical Equipment & Devices | | | 22,334,909 | | | | 2.4 | | |
| Pharmaceuticals | | | 9,112,679 | | | | 1.0 | | |
| Health Care Services | | | 4,195,403 | | | | 0.4 | | |
| Medical Supplies | | | 2,444,343 | | | | 0.3 | | |
| Biotechnology & Drug Delivery | | | 2,403,529 | | | | 0.3 | | |
| | | | 40,490,863 | | | | 4.4 | | |
| Total Equities | | | 863,078,924 | | | | 93.2 | | |
| Securities Lending Collateral | | | 11,170,097 | | | | 1.2 | | |
| Short-Term Obligations | | | 26,990,522 | | | | 2.9 | | |
| Total Investments | | | 901,239,543 | | | | 97.3 | | |
Obligation to Return Collateral for
Securities Loaned | | | (11,170,097 | ) | | | (1.2 | ) | |
Cash and Other Assets
Less Liabilities | | | 35,691,054 | | | | 3.9 | | |
| Net Assets | | $ | 925,760,500 | | | | 100.0 | % | |
See accompanying notes to financial statements.
15
Wanger International 2010 Annual Report
Statement of Assets and Liabilities
December 31, 2010
| Assets: | |
| Unaffiliated investments, at cost | | $ | 556,932,285 | | |
| Affiliated investments, at cost (See Note 4) | | | 9,152,033 | | |
Unaffiliated investments, at value (including
securities on loan of $10,795,334) | | $ | 895,398,768 | | |
| Affiliated investments, at value (See Note 4) | | | 5,840,775 | | |
| Cash | | | 224,583 | | |
| Foreign currency (cost of $5,430,101) | | | 5,601,816 | | |
Unrealized appreciation on forward foreign currency
exchange contracts | | | 1,610,991 | | |
| Receivable for: | |
| Investments sold | | | 310,931 | | |
| Fund shares sold | | | 29,560,318 | | |
| Securities lending income | | | 19,456 | | |
| Dividends | | | 946,101 | | |
| Interest | | | 101 | | |
| Foreign tax reclaims | | | 367,039 | | |
| Trustees' deferred compensation plan | | | 139,139 | | |
| Other assets | | | 10,334 | | |
| Total Assets | | | 940,030,352 | | |
| Liabilities: | |
| Collateral on securities loaned | | | 11,170,097 | | |
| Payable for: | |
| Investments purchased | | | 743,956 | | |
| Fund shares repurchased | | | 1,066,476 | | |
| Investment advisory fee | | | 617,829 | | |
| Administration fee | | | 37,217 | | |
| Transfer agent fee | | | 40 | | |
| Trustees' fees | | | 32 | | |
| Custody fee | | | 246,000 | | |
| Reports to shareholders | | | 155,483 | | |
| Deferred foreign capital gains tax payable | | | 50,945 | | |
| Chief compliance officer expenses | | | 2,587 | | |
| Trustees' deferred compensation plan | | | 139,139 | | |
| Other liabilities | | | 40,051 | | |
| Total Liabilities | | | 14,269,852 | | |
| Net Assets | | $ | 925,760,500 | | |
| Composition of Net Assets: | |
| Paid-in capital | | $ | 568,361,618 | | |
| Undistributed net investment income | | | 4,477,110 | | |
| Accumulated net realized gain | | | 15,987,231 | | |
| Net unrealized appreciation (depreciation) on: | |
| Investments | | | 335,155,225 | | |
| Foreign currency translations | | | 1,830,261 | | |
| Foreign capital gains tax | | | (50,945 | ) | |
| Net Assets | | $ | 925,760,500 | | |
| Fund Shares Outstanding | | | 25,600,994 | | |
Net asset value, offering price and redemption
price per share | | $ | 36.16 | | |
Statement of Operations
For the Year Ended December 31, 2010
| Investment Income: | |
| Dividends (net foreign taxes withheld of $1,895,159) | | $ | 22,213,560 | | |
| Dividends from affiliates | | | 637,621 | | |
| Securities lending income, net | | | 191,079 | | |
| Interest income | | | 44,329 | | |
| Total Investment Income | | | 23,086,589 | | |
| Expenses: | |
| Investment advisory fee | | | 9,178,297 | | |
| Administration fee | | | 533,799 | | |
| Transfer agent fee | | | 495 | | |
| Trustees' fees | | | 69,053 | | |
| Custody fee | | | 1,076,790 | | |
| Reports to shareholders | | | 363,086 | | |
| Chief compliance officer expenses (See Note 4) | | | 40,670 | | |
| Other expenses (See Note 6) | | | 149,121 | | |
| Total Expenses | | | 11,411,311 | | |
| Advisory fee waiver (See Note 4) | | | (327,817 | ) | |
| Custody earnings credit | | | (225 | ) | |
| Net Expenses | | | 11,083,269 | | |
| Net Investment Income | | | 12,003,320 | | |
Net Realized and Unrealized Gain (Loss) on
Investments, Foreign Currency and Forward
Foreign Currency Exchange Contracts: | |
| Net realized gain (loss) on: | |
| Unaffiliated investments | | | 193,180,518 | | |
| Affiliated investments | | | (3,212,313 | ) | |
Foreign currency transactions and forward
foreign currency exchange contracts | | | 10,380,255 | | |
| Reimbursement from transaction costs (See Note 4) | | | 335,670 | | |
| Net realized gain | | | 200,684,130 | | |
Net change in unrealized appreciation
(depreciation) on: | | | |
| Unaffiliated investments | | | (51,331,757 | ) | |
| Affiliated investments (See Note 4) | | | 1,311,053 | | |
Foreign currency translations and forward
foreign currency exchange contracts | | | 961,314 | | |
| Foreign capital gains tax | | | 1,892,799 | | |
Net change in unrealized
appreciation (depreciation) | | | (47,166,591 | ) | |
| Net Gain | | | 153,517,539 | | |
| Net Increase in Net Assets from Operations | | $ | 165,520,859 | | |
See accompanying notes to financial statements.
16
Wanger International 2010 Annual Report
Statement of Changes in Net Assets
| | | Year Ended December 31, | |
| Increase (Decrease) in Net Assets | | 2010 | | 2009 | |
| Operations: | |
| Net investment income | | $ | 12,003,320 | | | $ | 14,183,367 | | |
| Net realized gain (loss) on: | |
| Unaffiliated investments | | | 193,180,518 | | | | (70,795,081 | ) | |
| Affiliated investments (See Note 4) | | | (3,212,313 | ) | | | — | | |
| Foreign currency transactions and forward foreign currency exchange contracts | | | 10,380,255 | | | | 797,283 | | |
| Foreign capital gains tax | | | — | | | | (298,151 | ) | |
| Reimbursement from transaction costs (See Note 4) | | | 335,670 | | | | — | | |
| Net change in unrealized appreciation (depreciation) on: | |
| Unaffiliated investments | | | (51,331,757 | ) | | | 531,420,177 | | |
| Affiliated investments (See Note 4) | | | 1,311,053 | | | | (644,429 | ) | |
| Foreign currency transactions and forward foreign currency exchange contracts | | | 961,314 | | | | 1,880,189 | | |
| Foreign capital gains tax | | | 1,892,799 | | | | (1,943,744 | ) | |
| Net Increase in Net Assets from Operations | | | 165,520,859 | | | | 474,599,611 | | |
| Distributions to Shareholders: | |
| From net investment income | | | (20,131,055 | ) | | | (43,225,419 | ) | |
| Share Transactions: | |
| Subscriptions | | | 68,202,656 | | | | 158,196,950 | | |
| Distributions reinvested | | | 20,131,055 | | | | 43,225,419 | | |
| Redemptions (See Note 4) | | | (750,391,189 | ) | | | (163,728,038 | ) | |
| Net Increase (Decrease) from Fund Share Transactions | | | (662,057,478 | ) | | | 37,694,331 | | |
| Increase from regulatory settlements | | | — | | | | 500,054 | | |
| Total Increase (Decrease) in Net Assets | | | (516,667,674 | ) | | | 469,568,577 | | |
| Net Assets: | |
| Beginning of period | | | 1,442,428,174 | | | | 972,859,597 | | |
| End of period | | $ | 925,760,500 | | | $ | 1,442,428,174 | | |
| Undistributed/(overdistributed) net investment income at end of period | | $ | 4,477,110 | | | $ | (6,203,054 | ) | |
See accompanying notes to financial statements.
17
Wanger International 2010 Annual Report
Financial Highlights
| | | Year Ended December 31, | |
| Selected data for a share outstanding throughout each period | | 2010 | | 2009 | | 2008 | | 2007 | | 2006 | |
| Net Asset Value, Beginning of Period | | $ | 29.68 | | | $ | 20.69 | | | $ | 44.04 | | | $ | 41.77 | | | $ | 30.63 | | |
| Income from Investment Operations: | |
| Net investment income (a) | | | 0.35 | | | | 0.30 | | | | 0.52 | | | | 0.37 | | | | 0.29 | | |
Net realized and unrealized gain (loss) on investments, foreign
currency and foreign capital gains tax | | | 6.93 | | | | 9.61 | | | | (18.37 | ) | | | 5.80 | | | | 11.04 | | |
| Total from Investment Operations | | | 7.28 | | | | 9.91 | | | | (17.85 | ) | | | 6.17 | | | | 11.33 | | |
| Less Distributions to Shareholders: | |
| From net investment income | | | (0.80 | ) | | | (0.93 | ) | | | (0.34 | ) | | | (0.39 | ) | | | (0.19 | ) | |
| From net realized gains | | | — | | | | — | | | | (5.16 | ) | | | (3.51 | ) | | | — | | |
| Total Distributions to Shareholders | | | (0.80 | ) | | | (0.93 | ) | | | (5.50 | ) | | | (3.90 | ) | | | (0.19 | ) | |
| Increase from Regulatory Settlements | | | — | | | | 0.01 | | | | — | | | | — | | | | — | | |
| Net Asset Value, End of Period | | $ | 36.16 | | | $ | 29.68 | | | $ | 20.69 | | | $ | 44.04 | | | $ | 41.77 | | |
| Total Return (b) | | | 24.92 | %(c) | | | 49.78 | % | | | (45.60 | )% | | | 16.31 | % | | | 37.16 | % | |
| Ratios to Average Net Assets/Supplemental Data: | |
| Net expenses before interest expense (d) | | | 1.04 | % | | | 1.05 | % | | | 1.02 | % | | | 0.99 | % | | | 1.01 | % | |
| Interest expense | | | — | | | | — | | | | — | | | | — | | | | 0.00 | %(e) | |
| Net expenses (d) | | | 1.04 | % | | | 1.05 | % | | | 1.02 | % | | | 0.99 | % | | | 1.01 | % | |
| Net investment income (d) | | | 1.12 | % | | | 1.23 | % | | | 1.67 | % | | | 0.87 | % | | | 0.81 | % | |
| Waiver/Reimbursement | | | 0.03 | % | | | — | | | | — | | | | — | | | | — | | |
| Portfolio turnover rate | | | 32 | % | | | 37 | % | | | 36 | % | | | 35 | % | | | 41 | % | |
| Net assets, end of period (000s) | | $ | 925,761 | | | $ | 1,442,428 | | | $ | 972,860 | | | $ | 1,693,374 | | | $ | 1,480,123 | | |
(a) Net investment income per share was based upon the average shares outstanding during the period.
(b) Total return at net asset value assuming all distributions reinvested.
(c) Had the investment adviser not waived a portion of expenses, total return would have been reduced.
(d) The benefits derived from custody fees paid indirectly had an impact of less than 0.01%.
(e) Rounds to less than 0.01%.
See accompanying notes to financial statements.
18
Wanger International 2010 Annual Report
Notes to Financial Statements
1. Nature of Operations
Wanger International (the Fund), is a series of Wanger Advisors Trust (the Trust), an open-end management investment company organized as a Massachusetts business trust. The investment objective of the Fund is to seek long-term capital appreciation. The Fund is available only for allocation to certain life insurance company separate accounts established for the purpose of funding qualified and non-qualified variable annuity contracts and variable life insurance policies and may also be offered directly to certain types of pension plans and retirement arrangements.
2. Significant Accounting Policies
The preparation of financial statements in accordance with accounting principles generally accepted in the United States of America (GAAP) requires management to make certain estimates and assumptions that affect the reported amounts of assets and liabilities, the disclosure of contingent assets and liabilities at the date of the financial statements and the reported amounts of revenue and expenses during the reporting period. Actual results could differ from those estimates.
Security valuation
Securities of the Fund are valued at market value or, if a market quotation for a security is not readily available or is deemed not to be reliable because of events or circumstances that have occurred between the market quotation and the time as of which the security is to be valued, the security is valued at its fair value determined in good faith under consistently applied procedures established by the Board of Trustees. A security traded on a securities exchange or in an over-the-counter market in which transaction prices are reported is valued at the last sales price at the time of valuation. A security traded principally on NASDAQ is valued at the NASDAQ official closing price. Mutual Funds and Exchange Traded Funds are valued at their closing net asset value as reported to NASDAQ. A security for which there is no reported sale on the valuation date is valued at the latest bid quotation. Short-term investments maturing in 60 days or l ess are valued at amortized cost, which approximates market value. A security for which a market quotation is not readily available and any other assets are valued at their fair value determined in good faith under consistently applied procedures established by the Board of Trustees. The Trust has retained an independent statistical fair value pricing service that employs a systematic methodology to assist in the fair valuation process for securities principally traded in a foreign market in order to adjust for possible changes in value that may occur between the close of the foreign market and the time as of which the securities are to be valued. If a security is valued at a "fair value", that value may be different from the last quoted market price for the security.
Various inputs are used in determining the value of the Fund's investments, following the input prioritization hierarchy established by GAAP. These inputs are summarized in the three broad levels listed below:
• Level 1—quoted prices in active markets for identical securities
• Level 2—prices determined using other significant observable inputs (including quoted prices for similar securities, interest rates, prepayment speeds, credit risk and others)
• Level 3—prices determined using significant unobservable inputs where quoted prices or observable inputs are unavailable or less reliable (including management's own assumptions about the factors market participants would use in pricing an investment)
The inputs or methodologies used for valuing securities are not necessarily an indication of the risk associated with investing in those securities.
Examples of the types of securities in which the Fund would typically invest and how they are classified within this hierarchy are as follows. Typical Level 1 securities include exchange traded domestic equities, mutual funds whose NAVs are published each day and exchange traded foreign equities that are not statistically fair valued. Typical Level 2 securities include exchange traded foreign equities that are statistically fair valued, forward foreign currency exchange contracts and short-term investments valued at amortized cost. Additionally, securities fair valued by the Fund's Valuation Committee that rely on significant observable inputs are also included in Level 2. Typical Level 3 securities include any security fair valued by the Fund's Valuation Committee that relies on significant unobservable inputs.
Repurchase agreements
The Fund may engage in repurchase agreement transactions. The Fund, through its custodian, receives delivery of underlying securities collateralizing each repurchase agreement. The counterparty is required to maintain collateral that is at all times at least equal to the repurchase price including interest. In the event of default or bankruptcy by the other party to the agreement, realization and/or retention of the collateral may be subject to legal proceedings.
Foreign currency translations
Values of investments denominated in foreign currencies are converted into U.S. dollars using the New York spot market rate of exchange at the time of valuation. Purchases and sales of investments and dividend and interest income are translated into U.S. dollars using the spot market rate of exchange prevailing on the respective dates of such transactions. The gain or loss resulting from changes in foreign exchange rates is included with net realized and unrealized gain or loss from investments, as appropriate.
Forward foreign currency exchange contracts
The Fund may enter into forward foreign currency exchange contracts in order to seek to minimize the risk from adverse changes in the relationship between the U.S. dollar and foreign currencies. A forward foreign currency exchange contract is a commitment to purchase or sell a foreign currency at a future date at a negotiated forward rate. Forward foreign currency exchange contracts are valued at the interpolated forward exchange rate of the underlying currencies and any market gain or loss, arising from the difference between the original value and the current value of such contract, is included as a component of unrealized gain/(loss) on the Statement of Operations. Open forward foreign currency exchange contracts, if any, are disclosed in the Notes to the Statement of Investments. As forward foreign currency exchange contracts are closed the resulting gain or loss, arising from the difference between the original value of the contract an d the closing value of such contract, is included as a component of realized gain/(loss) on the Statement of Operations.
A forward foreign currency exchange contract would limit the risk of loss due to a decline in the value of a particular currency; however, it also would limit any potential gain that might result should the value of the currency increase instead of decrease. These contracts may involve market risk in excess of the unrealized gain or loss reflected on the Statement of Assets and Liabilities. In addition, a Fund could be exposed to risks if counterparties to the contracts are unable to meet the terms of their contracts. The counterparty risk exposure is, therefore, closely monitored and contracts are only executed with high credit quality financial institutions.
The Fund may use forward contracts to buy or sell a foreign currency when the Adviser believes it has exposure to a foreign currency which may suffer or enjoy a movement against another foreign currency to which the Fund has exposure. The Fund will not attempt to hedge all of its foreign portfolio positions
For additional information on derivative instruments, please see Note 5.
Securities lending
The Fund may lend securities up to one-third of the value of its total assets to certain approved brokers, dealers and other financial institutions to earn additional income. The Fund retains the benefits of owning the securities, including receipt of dividends or interest generated by the security. The Fund also receives a fee for the loan. The Fund has the ability to recall the loans at any time and could do so in order to vote proxies or to sell the loaned securities. Each loan is collateralized by cash that exceeded the value of the securities on loan. The market value of the loaned securities is determined daily at the close of business of the Fund and any additional required collateral is delivered to each Fund on the next business day. The Fund has elected to invest the cash collateral in the Dreyfus Government Cash Management Fund and the income earned is paid to the Fund, net of any fees remitted to Goldman Sachs Agency Lending as the lending agent and borrower rebates. The Fund's adviser,
19
Wanger International 2010 Annual Report
Notes to Financial Statements, continued
Columbia Wanger Asset Management, LLC (CWAM), does not retain any fees earned by the lending program. Generally, in the event of borrower default, the Fund has the right to use the collateral to offset any losses incurred. In the event the Fund is delayed or prevented from exercising its right to dispose of the collateral, there may be a potential loss to the Fund. Some of these losses may be indemnified by the lending agent. The Fund bears the risk of loss with respect to the investment of collateral.
The net lending income earned in 2010 by the Fund is included in the Statement of Operations.
Security transactions and investment income
Security transactions are accounted for on the trade date (date the order to buy or sell is executed) and dividend income is recorded on the ex-dividend date, except that certain dividends from foreign securities are recorded as soon as the information is available to the Fund. Interest income is recorded on the accrual basis and includes amortization of discounts on debt obligations when required for federal income tax purposes. Realized gains and losses from security transactions are recorded on an identified cost basis.
Awards, if any, from class action litigation related to securities owned may be recorded as a reduction of cost of those securities. If the applicable securities are no longer owned, the proceeds are recorded as realized gains.
Restricted securities
Restricted securities are securities that may only be resold upon registration under federal securities laws or in transactions exempt from registration. In some cases, the issuer of restricted securities has agreed to register such securities for resale at the issuer's expense either upon demand by the Fund or in connection with another registered offering of the securities. Many restricted securities may be resold in the secondary market in transactions exempt from registration. Such restricted securities may be determined to be liquid under criteria established by the Board of Trustees.
Fund share valuation
Fund shares are sold and redeemed on a daily basis at net asset value. Net asset value per share is determined daily as of the close of trading on the New York Stock Exchange (the Exchange) on each day the Exchange is open for trading by dividing the total value of the Fund's investments and other assets, less liabilities, by the number of Fund shares outstanding.
Custody fees/Credits
Custody fees are reduced based on the Fund's cash balances maintained with the custodian. The amount is disclosed as a reduction of total expenses in the Statement of Operations.
Federal income taxes
It is the Fund's policy to comply with the provisions of the Internal Revenue Code available to regulated investment companies and, in the manner provided therein, distributes substantially all its taxable income, as well as any net realized gain on sales of investments and foreign currency transactions reportable for federal income tax purposes. Accordingly, the Fund paid no federal income taxes and no federal income tax provision was required.
Expenses
General expenses of the Trust are allocated to the Fund and the other series of the Trust based upon relative net assets or other expense allocation methodologies determined by the nature of the expense. Expenses directly attributable to the Fund are charged to the Fund.
Foreign capital gains taxes
Gains in certain countries may be subject to foreign taxes at the fund level, at rates ranging from 10%-15%. The Fund accrues for such foreign taxes on net realized and unrealized gains at the appropriate rate for each jurisdiction.
Distributions to shareholders
Distributions to shareholders are recorded on the ex-dividend date.
Indemnification
In the normal course of business, the Trust on behalf of the Fund enters into contracts that contain a variety of representations and warranties and that provide general indemnities. The Fund's maximum exposure under these arrangements is unknown, as this would involve future claims against the Fund. Also, under the Trust's organizational documents, the trustees and officers of the Trust are indemnified against certain liabilities that may arise out of their duties to the Trust. However based on experience, the Fund expects the risk of loss due to these warranties and indemnities to be remote.
3. Federal Tax Information
The timing and character of income and capital gain distributions are determined in accordance with income tax regulations, which may differ from GAAP. Reclassifications are made to the Fund's capital accounts for permanent tax differences to reflect income and gains available for distribution (or available capital loss carryforwards) under income tax regulations.
For the year ended December 31, 2010, permanent book and tax basis differences resulting primarily from differing treatments for foreign currency transactions, passive foreign investment company (PFIC) adjustments and foreign capital gains tax were identified and reclassified among the components of the Fund's net assets as follows:
Accumulated
Net Investment
Income | | Accumulated
Net Realized
Loss | | Paid-In Capital | |
| $ | 18,807,899 | | | $ | (18,807,899 | ) | | $ | — | | |
Net investment income and net realized gains (losses), as disclosed on the Statement of Operations, and net assets were not affected by this reclassification.
The tax character of distributions paid during the years ended December 31, 2010 and December 31, 2009 were as follows:
| | | December 31, 2010 | | December 31, 2009 | |
| Distributions paid from: | |
| Ordinary Income* | | $ | 20,131,055 | | | $ | 43,225,419 | | |
* For tax purposes short-term capital gain distributions, if any, are considered ordinary income distributions.
As of December 31, 2010, the components of distributable earnings on a tax basis were as follows:
Undistributed
Ordinary
Income | | Undistributed
Long-Term
Capital Gains | | Net Unrealized
Appreciation* | |
| $ | 36,052,476 | | | $ | 19,588,719 | | | $ | 301,728,799 | | |
* The differences between book-basis and tax-basis net unrealized appreciation/depreciation are primarily due to deferral of losses from wash sales and passive foreign investment company (PFIC) adjustments.
Capital loss carryforwards that were utilized for the Fund during the year ended December 31, 2010 were $162,166,735.
Management is required to determine whether a tax position of the Fund is more likely than not to be sustained upon examination by the applicable taxing authority, including resolution of any related appeals or litigation processes, based on the technical merits of the position. The tax benefit to be recognized by the Fund is measured as the largest amount of benefit that is greater than fifty percent likely of being realized upon ultimate settlement. Management is not aware of any tax
20
Wanger International 2010 Annual Report
Notes to Financial Statements, continued
positions for which it is reasonably possible that the total amounts of unrecognized tax benefits will significantly change in the next twelve months. However, management's conclusions may be subject to review and adjustment at a later date based on factors including, but not limited to, new tax laws, regulations, and administrative interpretations (including relevant court decisions). The Funds' federal tax returns for the prior three fiscal years remain subject to examination by the Internal Revenue Service.
4. Transactions With Affiliates
CWAM is a wholly owned subsidiary of Columbia Management Investment Advisers, LLC (Columbia Management), which in turn is an indirect, wholly owned subsidiary of Ameriprise Financial, Inc. (Ameriprise Financial). CWAM furnishes continuing investment supervision to the Fund and is responsible for the overall management of the Fund's business affairs.
After the close of business on April 30, 2010, (the Closing), Ameriprise Financial acquired from Bank of America Corporation (BOA), a portion of the asset management business of Columbia Management Group, LLC, including 100% of CWAM. On May 27, 2010, the shareholders of the Fund approved a new investment advisory agreement with CWAM to provide advisory services to the Fund. There were no changes to the Fund's advisory fee rate under the new agreement.
CWAM receives a monthly advisory fee based on the Fund's average daily net assets at the following annual rates:
| Average Daily Net Assets | | Annual Fee Rate | |
| Up to $100 million | | | 1.10 | % | |
| $100 million to $250 million | | | 0.95 | % | |
| $250 million to $500 million | | | 0.90 | % | |
| $500 million to $1 billion | | | 0.80 | % | |
| $1 billion and over | | | 0.72 | % | |
For the year ended December 31, 2010, the Fund's effective investment advisory fee rate, net of fee waivers, was 0.83% of average daily net assets. Effective April 30, 2010, CWAM has contractually agreed to reimburse the Fund to the extent that investment advisory fees exceed an annual percentage of 0.83% of average daily net assets on an annualized basis, through April 30, 2012. The reimbursement to the Fund for the year ended December 31, 2010 was $327,817.
CWAM provides administrative services and receives an administration fee from the Fund at the following annual rates.
Wanger Advisors Trust
Average Daily Net Assets of the Trust | | Aggregate
Annual Fee Rate | |
| Up to $4 billion | | | 0.05 | % | |
| $4 billion to $6 billion | | | 0.04 | % | |
| $6 billion to $8 billion | | | 0.03 | % | |
| $8 billion and over | | | 0.02 | % | |
For the year ended December 31, 2010, the Fund's effective administration fee rate was 0.05% of average daily net assets. Prior to the Closing, CWAM had delegated to Columbia Management Advisors, LLC (CMA) an indirect, wholly owned subsidiary of BOA, responsibility to provide certain sub-administrative services to the Fund. Following the Closing, Columbia Management, a wholly owned subsidiary of Ameriprise Financial, acquired the assets of CMA and subsequently changed its name to Columbia Management, and thereafter continued providing certain sub-administrative services to the Fund.
Prior to the Closing, Columbia Management Distributors, Inc., a wholly owned subsidiary of BOA, served as the Fund's distributor and principal underwriter. In connection with the Closing, RiverSource Fund Distributors, Inc., a wholly owned subsidiary of Ameriprise Financial, became the distributor of the Fund and subsequently changed its name to Columbia Management Investment Distributors, Inc. (CMID). There were no changes to the underwriting discount structure of the Fund or the service or distribution fee rates paid by the Fund as a result of the Closing.
Prior to the Closing, Columbia Management Services, Inc., an indirect, wholly owned subsidiary of BOA, provided shareholder services to the Fund and contracted with Boston Financial Data Services (BFDS) to serve as subtransfer agent. In connection with the Closing, RiverSource Service Corporation, a wholly owned subsidiary of Ameriprise Financial, became the transfer agent of the Fund and subsequently changed its name to Columbia Management Investment Services Corp. (CMIS). The transfer agent fee rates paid by the Fund did not change as a result of the change in transfer agent. For its services, the Fund pays CMIS a monthly fee at the annual rate of $21.00 per open account. CMIS also receives reimbursement for certain out-of-pocket expenses. The arrangement with BFDS has been continued by CMIS.
Certain officers and trustees of the Trust are also officers of CWAM. The Trust makes no direct payments to its officers and trustees who are affiliated with CWAM.
The Board of Trustees has appointed a Chief Compliance Officer of the Trust in accordance with federal securities regulations. The Fund, along with other affiliated funds, pays its pro-rata share of the expenses associated with the Office of the Chief Compliance Officer. These expenses are disclosed separately as "Chief compliance officer expenses" in the Statement of Operations.
The Trust offers a deferred compensation plan for its independent trustees. Under that plan, a trustee may elect to defer all or a portion of his or her compensation. Amounts deferred are retained by the Trust and may represent an unfunded obligation of the Trust. The value of amounts deferred is determined by reference to the change in value of Class Z shares of one or more series of Columbia Acorn Trust or a money market fund as specified by the trustee. Benefits under the deferred compensation plan are payable when the trustee ceases to be a member of the Board of Trustees.
An affiliated person of the Fund may include any company in which the Fund owns five percent or more of its outstanding voting shares. On December 31, 2010, the Fund held five percent or more of the outstanding voting securities of one company. Details of investments in those affiliated companies are presented in the Notes to the Statement of Investments on pages 12 and 13.
During the year ended December 31, 2010, the Fund engaged in purchase and sales transactions with funds that have a common investment adviser (or affiliated investment advisers), common directors/trustees, and/or common officers. Those purchase and sale transactions complied with provisions of Rule 17a-7 under the Investment Company Act of 1940 and were $1,300,869 and $480,533,742, respectively.
During May and June 2010, a significant number of shares of the Fund, representing the interests of owners of contracts issued by insurance companies affiliated with Ameriprise Financial, were redeemed. In an effort to minimize the impact on the remaining shareholders, Ameriprise Financial agreed to reimburse the Fund $335,670 in certain transaction costs that were incurred as a result of the redemption.
5. Objectives and Strategies for Investing in Derivative Instruments
The Fund uses derivatives instruments including foreign forward currency exchange contracts in order to meet its investment objectives. The Fund employs strategies in differing combinations to permit it to increase, decrease or change the level of exposure to market risk factors. The achievement of any strategy involving derivatives depends on analysis of various risk factors, and if the strategies for the use of derivatives do not work as intended, the Fund may not achieve its investment objectives.
In pursuit of its investment objectives, the Fund is exposed to the following market risks:
Foreign Exchange Rate Risk: Foreign exchange rate risk relates to the change in the U.S. dollar value of a security held that is denominated in a foreign currency. The U.S. dollar value of a foreign-currency-denominated security will decrease as the dollar appreciates against the currency, while the U.S. dollar value will increase as the dollar depreciates against the currency.
21
Wanger International 2010 Annual Report
Notes to Financial Statements, continued
The following provides more detailed information about the derivative type held by the Fund:
Forward Foreign Currency Exchange Contracts
• The Fund entered into forward foreign currency exchange contracts to shift its investment exposure from one currency to another.
• The Fund used forward foreign currency exchange contracts to shift its U.S. dollar exposure in order to achieve a representative weighted mix of major currencies relative to its benchmark and/or to recover an underweight country exposure in its portfolio relative to its benchmark.
Forward foreign currency exchange contracts are agreements to exchange one currency for another at a future date at a specified price. These contracts are used to seek to minimize the exposure to foreign exchange rate fluctuations during the period between the trade and settlement dates of the contract. The Fund may utilize forward foreign currency exchange contracts in connection with the settlement of purchases and sales of securities. The Fund may also enter into these contracts to seek to reduce the exposure to adverse price movements in certain other foreign-currency-denominated assets. Contracts to buy are used to acquire exposure to foreign currencies, while contracts to sell are used to reduce the exposure to foreign exchange rate fluctuations. Forward foreign currency exchange contracts are valued daily at the current exchange rate of the underlying currency, resulting in unrealized gains (losses) which become realized at the time the forward foreign currency exchange contracts are closed or mature. Realized and unrealized gains (losses) arising from such transactions are included in net realized and unrealized gains (losses) on foreign currency transactions. The use of forward foreign currency exchange contracts does not eliminate fluctuations in the prices of the Fund's portfolio securities. While the maximum potential loss from such contracts is the aggregate face value in U.S. dollars at the time the contract was opened, exposure is typically limited to the change in value of the contract (in U.S. dollars) over the period it remains open. The Fund could also be exposed to risk that counterparties of the contracts may be unable to fulfill the terms of the contracts.
During the year ended December 31, 2010, the Fund entered into 130 forward foreign currency exchange contracts.
The following table is a summary of the value of the Fund's derivative instruments as of December 31, 2010.
Fair Value of Derivative Instruments
| Asset | | Liability | |
Statement of Assets
and Liabilities | | Fair
Value | | Statement of Assets
and Liabilities | | Fair
Value | |
Unrealized appreciation
on forward foreign
currency exchange
contracts | | | $1,610,991 | | | Unrealized depreciation
on forward foreign
currency exchange
contracts | | | $— | | |
The effect of derivative instruments on the Statement of Operations for the year ended December 31, 2010:
Amount of Realized Gain or (Loss) and Change in Unrealized Appreciation or (Depreciation) on Derivatives Recognized in Income
| | | Risk
Exposure | | Realized
Gain (Loss) | | Change in
Unrealized
Appreciation
(Depreciation) | |
Forward Foreign Currency
Exchange Contracts | | Foreign
Exchange
Rate Risk | | $ | 11,548,114
| | | $ | 770,735
| | |
6. Borrowing Arrangements
The Trust participates in a $150 million credit facility, along with another Trust managed by CWAM, which was entered into to facilitate portfolio liquidity. Under the facility, interest is charged to each participating fund based on its borrowings at a rate per annum equal to the higher of Federal Funds Rate or Overnight LIBOR plus 1.25%. In addition, a commitment fee of 0.15% per annum of the unutilized line of credit is accrued and apportioned among the participating funds based on their relative net assets. The commitment fee is included in "Other expenses" in the Statement of Operations. No amounts were borrowed by the Fund under this facility during the year ended December 31, 2010. The Trust enters into this line of credit for one year durations. The Trust has secured the line of credit for the entire year of 2011.
7. Fund Share Transactions
Proceeds and payments on Fund shares as shown in the Statement of Changes in Net Assets are in respect of the following numbers of shares:
| | | Year ended
December 31, 2010 | | Year ended
December 31, 2009 | |
| Shares sold | | | 2,055,268 | | | | 6,481,672 | | |
Shares issued in reinvestment
of dividend distributions | | | 635,576 | | | | 2,019,809 | | |
| Less shares redeemed | | | (25,686,043 | ) | | | (6,922,363 | ) | |
| Net increase (decrease) in shares outstanding | | | (22,995,199 | ) | | | 1,579,118 | | |
8. Investment Transactions
The aggregate cost of purchases and proceeds from sales other than short-term obligations for the year ended December 31, 2010 were $328,139,487 and $1,008,353,705, respectively.
9. Information Regarding Pending and Settled Legal Proceedings
In June 2004, an action captioned John E. Gallus et al. v. American Express Financial Corp. and American Express Financial Advisors Inc. was filed in the United States District Court for the District of Arizona. The plaintiffs allege that they are investors in several American Express Company (now known as legacy RiverSource) mutual funds and they purport to bring the action derivatively on behalf of those funds under the Investment Company Act of 1940. The plaintiffs allege that fees allegedly paid to the defendants by the funds for investment advisory and administrative services are excessive. The plaintiffs seek remedies including restitution and rescission of investment advisory and distribution agreements. The plaintiffs voluntarily agreed to transfer this case to the United States District Court for the Distri ct of Minnesota (the District Court). In response to defendants' motion to dismiss the complaint, the District Court dismissed one of plaintiffs' four claims and granted plaintiffs limited discovery. Defendants moved for summary judgment in April 2007. Summary judgment was granted in the defendants' favor on July 9, 2007. The plaintiffs filed a notice of appeal with the Eighth Circuit Court of Appeals (the Eighth Circuit) on August 8, 2007. On April 8, 2009, the Eighth Circuit reversed summary judgment and remanded to the District Court for further proceedings. On August 6, 2009, defendants filed a writ of certiorari with the U.S. Supreme Court (the Supreme Court), asking the Supreme Court to stay the District Court proceedings while the Supreme Court considers and rules in a case captioned Jones v. Harris Associates, which involves issues of law similar to those presented in the Gal lus case. On March 30, 2010, the Supreme Court issued its ruling in Jones v. Harris Associates, and on April 5, 2010, the Supreme Court vacated the Eighth Circuit's decision in the Gallus case and remanded the case to the Eighth Circuit for further consideration in light of the Supreme Court's decision in Jones v. Harris Associates. On June 4, 2010, the Eighth Circuit remanded the Gallus case to the District Court for further consideration in light of the Supreme Court's decision in Jones v. Harris Associates. On December 9, 2010, the District Court reinstated its July 9, 2007 summary judgment order in favor of the defendants. On Janu ary 10, 2011, plaintiffs filed a notice of appeal with the Eighth Circuit.
22
Wanger International 2010 Annual Report
Notes to Financial Statements, continued
In December 2005, without admitting or denying the allegations, American Express Financial Corporation (AEFC, which is now known as Ameriprise Financial, Inc. (Ameriprise Financial)), entered into settlement agreements with the Securities and Exchange Commission (SEC) and Minnesota Department of Commerce (MDOC) related to market timing activities. As a result, AEFC was censured and ordered to cease and desist from committing or causing any violations of certain provisions of the Investment Advisers Act of 1940, the Investment Company Act of 1940, and various Minnesota laws. AEFC agreed to pay disgorgement of $10 million and civil money penalties of $7 million. AEFC also agreed to retain an independent distribution consultant to assist in developing a plan for distribution of all disgorgement and civil penalties ordered by the SEC in accordance with various undertakings detailed at http://www.sec.gov/litigation/admin/ia-2451.pdf. Ameriprise Financial and its affiliates have cooperated with the SEC and the MDOC in these legal proceedings, and have made regular reports to the RiverSource, Seligman and Threadneedle funds' Boards of Directors/Trustees.
Ameriprise Financial and certain of its affiliates have historically been involved in a number of legal, arbitration and regulatory proceedings, including routine litigation, class actions, and governmental actions, concerning matters arising in connection with the conduct of their business activities. Ameriprise Financial believes that the Funds are not currently the subject of, and that neither Ameriprise Financial nor any of its affiliates are the subject of, any pending legal, arbitration or regulatory proceedings that are likely to have a material adverse effect on the Funds or the ability of Ameriprise Financial or its affiliates to perform under their contracts with the Funds. Ameriprise Financial is required to make 10-Q, 10-K and, as necessary, 8-K filings with the SEC on legal and regulatory matters that relate to Ameriprise Financial and its affiliates. Copies of these filings may be obtained by accessing the SEC website at www.s ec.gov.
There can be no assurance that these matters, or the adverse publicity associated with them, will not result in increased fund redemptions, reduced sale of fund shares or other adverse consequences to the Funds. Further, although we believe proceedings are not likely to have a material adverse effect on the Funds or the ability of Ameriprise Financial or its affiliates to perform under their contracts with the Funds, these proceedings are subject to uncertainties and, as such, we are unable to estimate the possible loss or range of loss that may result. An adverse outcome in one or more of these proceedings could result in adverse judgments, settlements, fines, penalties or other relief that could have a material adverse effect on the consolidated financial condition or results of operations of Ameriprise Financial.
*****
CWAM, Columbia Acorn Trust (another mutual fund family advised by CWAM), and the trustees of Columbia Acorn Trust (collectively, the "Columbia defendants") were named as defendants in class and derivative complaints that were consolidated in a Multi-District Action (the MDL Action) in the federal district court of Maryland. These lawsuits contend that defendants permitted certain investors to market time their trades in certain Columbia Acorn Funds. The MDL Action is ongoing. However, all claims against the Trust and the Independent Trustees of the Trust have been dismissed. Columbia Acorn and CWAM are also defendants in a state court class action lawsuit that alleges, in summary, that the Trust and CWAM exposed shareholders of Columbia Acorn International to trading by market timers by allegedly: (a) failing to properly evaluate daily whether a significant event affecting the value of the Fund's securities had occurred after foreign market s had closed but before the calculation of the Fund's net asset value (NAV); (b) failing to implement the Fund's portfolio valuation and share pricing policies and procedures; and (c) failing to know and implement applicable rules and regulations concerning the calculation of NAV (the Fair Valuation Lawsuit). The United States Court of Appeals for the Seventh Circuit ruled that the plaintiffs' state law claims were preempted under federal law, resulting in the dismissal of plaintiffs' complaint. Plaintiffs appealed the Seventh Circuit's ruling to the United States Supreme Court. The Supreme Court reversed the Seventh Circuit's ruling on jurisdictional grounds and the case was remanded to the state court.
On March 21, 2005, a class action complaint was filed against the Trust and CWAM seeking to rescind the contingent deferred sales charge (CDSC) assessed upon redemption of Class B shares of the Columbia Acorn Funds (the CDSC Lawsuit). In addition to the rescission of sales charges, plaintiffs seek recovery of actual damages, attorneys' fees and costs. The case was transferred to the MDL Action in the federal district court of Maryland. On September 14, 2007, the plaintiffs and the Columbia defendants named in the MDL Action, including the Columbia family of funds, entered into a stipulation of settlement with respect to all Columbia-related claims in the MDL Action described above, including the CDSC and Fair Valuation Lawsuits.
On April 23, 2010, the parties of the MDL Action filed a motion seeking: (a) preliminary approval of the MDL settlements; (b) the conditional certification of the plaintiff class for purposes of settlement; (c) approval of the form and manner of giving notice to the plaintiff class of the proposed settlements; and (d) approval of the proposed schedule for various deadlines in connection with the final settlement hearing. The motion was presented to and approved by the court on May 7, 2010.
On October 21, 2010, the court held a final hearing regarding the MDL settlements and on October 25, 2010 issued a final judgment and related orders that: (a) approved the settlements as fair, reasonable and adequate, and in the best interests of members of both the plaintiff class and current shareholders of the Columbia funds, including the Columbia Acorn Funds; (b) dismissed with prejudice all complaints against the Columbia defendants; and (c) approved a plan of distribution for the amounts due to the plaintiff class as established in the settlements. The orders of settlement do not create any liability for the Columbia Acorn Funds.
CWAM believes that the lawsuits described in the four preceding paragraphs are not likely to materially affect its ability to provide investment management services to the Funds.
23
Wanger International 2010 Annual Report
Report of Independent Registered Public Accounting Firm
To the Board of Trustees and Shareholders of Wanger International:
In our opinion, the accompanying statement of assets and liabilities, including the statement of investments, and the related statements of operations and of changes in net assets and the financial highlights present fairly, in all material respects, the financial position of Wanger International (a series of the Wanger Advisers Trust, hereinafter referred to as the "Fund") at December 31, 2010, the results of its operations for the year then ended, the changes in its net assets for each of the two years in the period then ended and the financial highlights for each of the five years in the period then ended, in conformity with accounting principles generally accepted in the United States of America. These financial statements and financial highlights (hereafter referred to as "financial statements") are the responsibility of the Fund's management; our responsibility is to express an opinion on these financial statements based on our audit s. We conducted our audits of these financial statements in accordance with the standards of the Public Company Accounting Oversight Board (United States). Those standards require that we plan and perform the audit to obtain reasonable assurance about whether the financial statements are free of material misstatement. An audit includes examining, on a test basis, evidence supporting the amounts and disclosures in the financial statements, assessing the accounting principles used and significant estimates made by management, and evaluating the overall financial statement presentation. We believe that our audits, which included confirmation of securities at December 31, 2010 by correspondence with the custodian and brokers, provide a reasonable basis for our opinion.
PricewaterhouseCoopers LLP
Chicago, Illinois
February 15, 2011
24
Wanger International 2010 Annual Report
Federal Income Tax Information (Unaudited)
The Fund hereby designates as a capital gain dividend with respect to the fiscal year ended December 31, 2010, $20,568,155, or, if subsequently determined to be different, the net capital gain of such year.
Foreign taxes paid during the fiscal year ended December 31, 2010, of $1,964,069 are being passed through to shareholders. This represents $0.08 per share. Eligible shareholders may claim this amount as a foreign tax credit.
Gross income derived from sources within foreign countries was $24,720,774 ($0.97 per share) for the fiscal year ended December 31, 2010.
29.18% of the ordinary income distributed by the Fund for the fiscal year ended December 31, 2010, qualifies for the corporate dividends received deduction.
25
Wanger International 2010 Annual Report
Board of Trustees and Management of Wanger Advisors Trust
Each trustee may serve a term of unlimited duration. The Trust's By-laws generally require that a trustee retire at the end of the calendar year in which the trustee attains the age of 75 years. The trustees appoint their own successors, provided that at least two-thirds of the trustees, after such appointment, have been elected by shareholders. Shareholders may remove a trustee, with or without cause, upon the vote of two-thirds of the Trust's outstanding shares at any meeting called for that purpose. A trustee may be removed, with or without cause, upon the vote of a majority of the trustees. The names of the trustees and officers of the Trust, the date each was first elected or appointed to office, their principal business occupations during at least the last five years, number of portfolios in the fund complex they oversee, and other directorships they hold, are shown below. Each trustee serves in such capacity for each of the six serie s of Columbia Acorn Trust and for each of the four series of Wanger Advisors Trust.
The address for the trustees and officers of the Trust is Columbia Wanger Asset Management, LLC, 227 West Monroe Street, Suite 3000, Chicago, Illinois 60606. The Funds' Statement of Additional Information includes additional information about the Funds' trustees and officers. You may obtain a free copy of the Statement of Additional Information by writing or calling toll-free:
Columbia Wanger Asset Management, LLC
Shareholder Services Group
227 W. Monroe, Suite 3000
Chicago IL 60606
1-800-922-6769
Name, Position(s) with
Wanger Advisors Trust
and Age at
December 31, 2010 | | Year First
Elected or
Appointed
to Office* | | Principal Occupation(s) during
Past Five Years | | Number of
Portfolios in
Fund Complex
Overseen by
Trustee/Officer | | Other
Directorships
in addition to
Wanger Advisors Trust | |
| Trustees who are not interested persons of Wanger Advisors Trust: | | | | | | | |
|
Laura M. Born, 45,
Trustee | | | 2007 | | | Adjunct Assistant Professor of Finance, University of Chicago Booth School of Business; formerly, Managing Director – Investment Banking, JP Morgan Chase & Co. (broker/dealer) 2002-2007; prior thereto, associated with JP Morgan as an investment professional since 1991. | | | 10 | | | Columbia Acorn Trust | |
|
Michelle L. Collins, 50,
Trustee | | | 2008 | | | President, Cambium LLC (financial advisory firm) since 2007; Advisory Board Member, Svoboda Capital Partners LLC (private equity firm) since 2007; Managing Director Svoboda Capital Partners LLC, 1998-2006. | | | 10 | | | Columbia Acorn Trust; Bucyrus International, Inc. (mining equipment manufacturer); Molex, Inc. (electronics components manufacturer); CDW Corporation (electronics components manufacturer) (until October 2007). | |
|
Maureen M. Culhane, 62,
Trustee | | | 2007 | | | Retired. Formerly, Vice President, Goldman Sachs Asset Management, L.P. (investment adviser), 2005-2007, and Vice President (Consultant) — Strategic Relationship Management, Goldman Sachs & Co., 1999-2005. | | | 10 | | | Columbia Acorn Trust | |
|
Margaret M. Eisen, 57,
Trustee | | | 2002 | | | Chief Investment Officer, EAM International LLC (corporate finance and asset management) since 2003; Managing Director, CFA Institute, 2005-2008. | | | 10 | | | Columbia Acorn Trust; Antigenics, Inc. (biotechnology and pharmaceuticals) (until June 2009). | |
|
John C. Heaton, 51,
Trustee | | | 2010 | | | Joseph L. Gidwitz Professor of Finance, University of Chicago Booth School of Business; financial consultant. | | | | Columbia Acorn Trust | |
|
Steven N. Kaplan, 51,
Trustee and Vice Chairman of the Board | | | 1999 | | | Neubauer Family Professor of Entrepreneurship and Finance, University of Chicago Booth School of Business. | | | 10 | | | Columbia Acorn Trust; Accretive Health, Inc. (healthcare management services provider); Morningstar, Inc. (provider of independent investment research). | |
|
26
Wanger International 2010 Annual Report
Board of Trustees and Management of Wanger Advisors Trust
Name, Position(s) with
Wanger Advisors Trust
and Age at
December 31, 2010 | | Year First
Elected or
Appointed
to Office* | | Principal Occupation(s) during
Past Five Years | | Number of
Portfolios in
Fund Complex
Overseen by
Trustee/Officer | | Other
Directorships
in addition to
Wanger Advisors Trust | |
| Trustees who are not interested persons of Wanger Advisors Trust: (continued) | | | | | | | |
|
David C. Kleinman, 75,
Trustee (1) | | | 1972 | | | Adjunct Professor of Strategic Management, University of Chicago Booth School of Business; business consultant. | | | 10 | | | Columbia Acorn Trust; Sonic Foundry, Inc. (rich media systems and software). | |
|
Allan B. Muchin, 74,
Trustee | | | 1998 | | | Chairman Emeritus, Katten Muchin Rosenman LLP (law firm). | | | 10 | | | Columbia Acorn Trust | |
|
David B. Small, 54,
Trustee | | | 2010 | | | Managing Director, Chairman of Investment Committee, Grosvenor Capital Management, L.P. (investment adviser). | | | 10 | | | Columbia Acorn Trust | |
|
James A. Star, 49,
Trustee and Chairman of the Board | | | 2006 | | | President, Longview Asset Management LLC (investment adviser) since 2003; associated with Longview or its predecessors and affiliates since 1994. | | | 10 | | | Columbia Acorn Trust | |
|
| Trustees who are interested persons of Wanger Advisors Trust: | | | | | | | |
|
Charles P. McQuaid, 57,
Trustee and President (2) | | | 1992 | | | President and Chief Investment Officer, CWAM or its predecessors, since October 2003; associated with CWAM or its predecessors as an investment professional since 1978. | | | 10 | | | Columbia Acorn Trust | |
|
David J. Rudis, 57,
Trustee (3) | | | 2010 | | | National Checking and Debit Executive, and Illinois President, Bank of America, 2007 to 2009; President, Consumer Banking Group, LaSalle National Bank, 2004 to 2007. | | | 10 | | | Columbia Acorn Trust | |
|
| Trustee Emeritus | | | | | | | |
|
Ralph Wanger, 76,
Trustee Emeritus (4) | | | 1970 | | | Founder, CWAM. Formerly, President, Chief Investment Officer and portfolio manager, CWAM or its predecessors, July 1992 – September 2003; Director, Wanger Investment Company PLC; Consultant, CWAM or its predecessors, September 2003 – September 2005. | | | 10 | | | Columbia Acorn Trust | |
|
| Officers of Wanger Advisors Trust: | | | | | | | |
|
Ben Andrews, 44,
Vice President | | | 2004 | | | Portfolio manager and analyst, CWAM or its predecessors, since 1998; Vice President, Columbia Acorn Trust and Wanger Advisors Trust since 2004. | | | 10 | | | None | |
|
Michael G. Clarke, 41,
Assistant Treasurer | | | 2004 | | | Vice President, Columbia Management Investment Advisers, LLC since May 2010; Managing Director of Fund Administration, Columbia Management Advisors, LLC, from September 2004 to April 2010; senior officer of Columbia Family of Funds and affiliated funds since 2002. | | | 10 | | | None | |
|
Joseph F. DiMaria, 43,
Assistant Treasurer | | | 2010 | | | Vice President, Mutual Fund Administration, Columbia Management Investment Advisers, LLC, since May 2010; Director of Fund Administration, Columbia Management Advisors, LLC from January 2006 to April 2010; Head of Tax/Compliance and Assistant Treasurer, Columbia Management Advisors, LLC, from November 2004 to December 2005. | | | 10 | | | None | |
|
P. Zachary Egan, 42,
Vice President | | | 2003 | | | Director of International Research, CWAM or its predecessors, since December 2004; Vice President, Columbia Acorn Trust since 2003 and Wanger Advisors Trust since 2007; portfolio manager and analyst, CWAM or its predecessors, since 1999. | | | 10 | | | None | |
|
John Kunka, 40,
Assistant Treasurer | | | 2006 | | | Director of Accounting and Operations, CWAM or its predecessors, since May 2006; Manager of Mutual Fund Operations, Calamos Advisors, Inc. (investment advisor), September 2005 – May 2006; prior thereto, Manager of Mutual Fund Administration, Van Kampen Investments. | | | 10 | | | None | |
|
27
Wanger International 2010 Annual Report
Board of Trustees and Management of Wanger Advisors Trust
Name, Position(s) with
Wanger Advisors Trust
and Age at
December 31, 2010 | | Year First
Elected or
Appointed
to Office* | | Principal Occupation(s) during
Past Five Years | | Number of
Portfolios in
Fund Complex
Overseen by
Trustee/Officer | | Other
Directorships
in addition to
Wanger Advisors Trust | |
| Officers of Columbia Acorn Trust: (continued) | | | | | | | |
|
Joseph C. LaPalm, 41,
Vice President | | | 2006 | | | Chief Compliance Officer, CWAM since 2005; prior thereto, compliance officer, William Blair & Company (investment firm). | | | 10 | | | None | |
|
Bruce H. Lauer, 53,
Vice President, Secretary and Treasurer | | | 1995 | | | Chief Operating Officer, CWAM or its predecessors, since April 2000; Vice President, Secretary and Treasurer, Columbia Acorn Trust and Wanger Advisors Trust, since 1995; Director, Wanger Investment Company PLC; formerly, Director, Banc of America Capital Management (Ireland) Ltd.; and formerly, Director, Bank of America Global Liquidity Funds, PLC. | | | 10 | | | None | |
|
Louis J. Mendes III, 46,
Vice President | | | 2003 | | | Portfolio manager and analyst, CWAM or its predecessors, since 2001; Vice President, Columbia Acorn Trust since 2003 and Wanger Advisors Trust since 2005. | | | 10 | | | None | |
|
Robert A. Mohn, 49,
Vice President | | | 1997 | | | Director of Domestic Research, CWAM or its predecessors, since March 2004; Vice President, Columbia Acorn Trust and Wanger Advisors Trust, since 1997; portfolio manager and analyst, CWAM or its predecessors, since August 1992. | | | 10 | | | None | |
|
Christopher J. Olson, 46,
Vice President | | | 2001 | | | Portfolio manager and analyst, CWAM or its predecessors, since January 2001; Vice President, Columbia Acorn Trust and Wanger Advisors Trust, since 2001. | | | 10 | | | None | |
|
Scott R. Plummer, 51,
Assistant Secretary | | | 2010 | | | Chief Legal Officer and Assistant Secretary, Columbia Management Investment Advisers, LLC since June 2005; Vice President and Lead Chief Counsel — Asset Management, Ameriprise Financial since May 2010 (previously Vice President and Chief Counsel — Asset Management, from 2005 to April 2010, and Vice President — Asset Management Compliance from 2004 to 2005); Vice President, Chief Counsel and Assistant Secretary, Columbia Management Investment Distributors, Inc. since 2008; Vice President, General Counsel and Secretary, Ameriprise Certificate Company since 2005; Chief Counsel, RiverSource Distributors, Inc. from 2006 to 2010; Vice President, General Counsel and Secretary, RiverSource Funds, since December 2006; Senior Vice President, Secretary and Chief Legal Officer, Columbia Family of Funds since May 2010. | | | 10 | | | None | |
|
Christopher O. Petersen, 41,
Assistant Secretary | | | 2010 | | | Vice President and Chief Counsel, Ameriprise Financial since January 2010 (formerly Vice President and Group Counsel or Counsel from April 2004 to January 2010); Assistant Secretary of RiverSource Funds since January 2007. | | | 10 | | | None | |
|
Robert P. Scales, 58,
Chief Compliance Officer, Chief Legal Officer, Senior Vice President and General Counsel | | | 2004 | | | Chief Compliance Officer, Chief Legal Officer, Senior Vice President and General Counsel, Columbia Acorn Trust and Wanger Advisors Trust, since 2004. | | | 10 | | | None | |
|
Linda Roth-Wiszowaty, 41,
Assistant Secretary | | | 2006 | | | Business support analyst, CWAM, since April 2007; prior thereto executive administrator, CWAM or its predecessors, and executive assistant to the Chief Operating Officer of CWAM or its predecessors. | | | 10 | | | None | |
|
* Dates prior to April 1992 correspond to the date of first election or appointment as a trustee or officers of The Acorn Fund, Inc., the predecessor trust to Columbia Acorn Trust.
(1) Mr. Kleinman retired at the end of calendar year 2010.
(2) Mr. McQuaid is an "interested person" of Wanger Advisors Trust and of CWAM, as defined in the Investment Company Act of 1940 because he is an officer of the Trust and of CWAM.
(3) Mr. Rudis commenced service as a Trustee on January 1, 2011. Mr. Rudis is an "interested person" of Wanger Advisors Trust, as defined in the New York Attorney General's Assurance of Discontinuance ("Order") entered into in February 2005 by Columbia Management Advisors, LLC (an indirect subsidiary of Bank of America Corporate ("BOA")) and Columbia Management Distributors, Inc. (an indirect subsidiary of BOA), because of his former employment as a BOA executive.
(4) As permitted under the Wanger Advisors Trust's By-Laws, Mr. Wanger serves as a non-voting Trustee Emeritus of the Trust.
28
Wanger International 2010 Annual Report

Columbia Wanger Funds
Transfer Agent,
Dividend Disbursing Agent*
Columbia Management Investment
Services Corp.
P.O. Box 8081
Boston, Massachusetts
02266-8081
Distributor*
Columbia Management Investment
Distributors, Inc.
One Financial Center
Boston, Massachusetts
02111-2621
Investment Adviser
Columbia Wanger Asset Management, LLC
227 West Monroe Street, Suite 3000
Chicago, Illinois 60606
1-888-4-WANGER
(1-888-492-6437)
Legal Counsel to the Funds
Perkins Coie, LLP
Washington, DC
Legal Counsel to the Independent Trustees
Drinker Biddle & Reath LLP
Philadelphia, Pennsylvania
Independent Registered Public
Accounting Firm
PricewaterhouseCoopers LLP
Chicago, Illinois
* As of May 1, 2010
This report, including the schedules of investments and financial statements, is submitted for the general information of the shareholders of the Wanger Advisors Trust.
A description of the Fund's proxy voting policies and procedures and a copy of the Fund's voting record for the most recent 12-month period ended June 30 are available (i) on the Securities and Exchange Commission's website at www.sec.gov, and (ii) without charge, upon request, by calling 888-492-6437.
The Fund files a complete schedule of portfolio holdings with the SEC for the first and third quarters of each fiscal year on Form N-Q. The Fund's Form N-Q is available on the SEC's website at www.sec.gov and may be reviewed and copied at the SEC's Public Reference Room in Washington, D.C. Information on the operation of the Pubic Reference Room may be obtained by calling 800-SEC-0330. The Fund's complete portfolio holdings are disclosed at www.columbiafunds.com approximately 30 days after each month-end.
29
Columbia Wanger Funds
© 2011 Columbia Management Investment Advisers, LLC. All rights reserved.
C-1456 A (2/11) 113565
Wanger Select
2010 Annual Report

Not FDIC insured • No bank guarantee • May lose value

Wanger Select
2010 Annual Report
Table of Contents
| 1 | | | Understanding Your Expenses | |
|
| 2 | | | The Keys to Prosperity | |
|
| 4 | | | Performance Review | |
|
| 6 | | | Statement of Investments | |
|
| 11 | | | Statement of Assets and Liabilities | |
|
| 11 | | | Statement of Operations | |
|
| 12 | | | Statement of Changes in Net Assets | |
|
| 13 | | | Financial Highlights | |
|
| 14 | | | Notes to Financial Statements | |
|
| 18 | | | Report of Independent Registered Public Accounting Firm | |
|
| 19 | | | Federal Income Tax Information | |
|
| 20 | | | Board of Trustees and Management of Wanger Advisors Trust | |
|
Columbia Wanger Asset Management, LLC (CWAM) is one of the leading global small- and mid-cap equity managers in the United States with 40 years of small- and mid-cap investment experience. As of December 31, 2010, CWAM managed $33.9 billion in assets, and is the investment adviser to Wanger USA, Wanger International, Wanger Select and Wanger International Select (together, the Columbia Wanger Funds) and the Columbia Acorn Family of Funds.
Investors should consider the investment objectives, risks, charges and expenses of a mutual fund carefully before investing. For a free prospectus, which contains this and other important information about the Fund, contact your financial adviser or insurance company or contact 1-888-4-WANGER. Read the prospectus carefully before investing.
An important note: Columbia Wanger Funds are sold only to certain life insurance companies in connection with certain variable annuity contracts, variable life insurance policies and eligible qualified retirement plans.
The views expressed in "The Keys to Prosperity" and in the Performance Review reflect the current views of the respective authors. These views are not guarantees of future performance and involve certain risks, uncertainties and assumptions that are difficult to predict so actual outcomes and results may differ significantly from the views expressed. These views are subject to change at any time based upon economic, market or other conditions and the respective parties disclaim any responsibility to update such views. These views may not be relied on as investment advice and, because investment decisions for a Columbia Wanger Fund are based on numerous factors, may not be relied on as an indication of trading intent on behalf of any particular Columbia Wanger Fund. References to specific company securities should not be construed as a recommendation or investment advice.
Wanger Select 2010 Annual Report
Understanding Your Expenses
As a Fund shareholder, you incur three types of costs. There are transaction costs, which generally include sales charges on purchases and may include redemption or exchange fees. There are also ongoing costs, which generally include investment advisory fees and other Fund expenses. Lastly, there may be additional fees or charges imposed by the insurance company that sponsors your variable annuity product. The information on this page is intended to help you understand your ongoing costs of investing in the Fund and to compare these costs with the ongoing costs of investing in other mutual funds.
Analyzing your Fund's expenses
To illustrate these ongoing costs, we have provided an example and calculated the expenses paid by investors in the Fund during the period. The information in the following table is based on an initial hypothetical investment of $1,000, which is invested at the beginning of the period and held for the entire period. Expense information is calculated two ways and each method provides you with different results. The amount listed in the "Actual" column is calculated using actual operating expenses and total return for the Fund. The amount listed in the "Hypothetical" column assumes that the return each year is 5% before expenses and then applies the Fund's actual expense ratio for the period to the hypothetical return. You should not use the hypothetical account values and expenses to estimate either your actual account balance at the end of the period or the expenses you paid during the period. See "Compare with other funds" for details on using the hypothetical data.
Estimating your actual expenses
To estimate the expenses that you actually paid over the period, first you will need your account balance at the end of the period.
1. Divide your ending account balance by $1,000. For example, if an account balance was $8,600 at the end of the period, the result would be 8.6.
2. In the section of the table below titled "Expenses paid during the period," you will find a dollar amount in the column labeled "Actual." Multiply this amount by the result from step 1. Your answer is an estimate of the expenses you paid on your account during the period.
July 1, 2010 – December 31, 2010
| | | Account value at the
beginning of the period ($) | | Account value at the
end of the period ($) | | Expenses paid during
the period ($) | | Fund's annualized
expense ratio (%)* | |
| | | Actual | | Hypothetical | | Actual | | Hypothetical | | Actual | | Hypothetical | | Actual | |
| Wanger Select | | | 1,000.00 | | | | 1,000.00 | | | | 1,325.60 | | | | 1,020.52 | | | | 5.45 | | | | 4.74 | | | | 0.93 | | |
*Expenses paid during the period are equal to the Fund's annualized expense ratio, multiplied by the average account value over the period, then multiplied by the number of days in the Fund's most recent fiscal half-year and divided by 365.
It is important to note that the expense amounts shown in the table are meant to highlight only ongoing costs of investing in the Fund. Expenses paid during the period do not include any insurance charges imposed by your insurance company's separate account. The hypothetical example provided is useful in comparing ongoing costs only and will not help you determine the relative total costs of owning different funds whose shareholders may incur transaction costs.
Compare with other funds
Since all mutual funds are required to include the same hypothetical calculations about expenses in shareholder reports, you can use this information to compare the ongoing cost of investing in the Fund with other funds. To do so, compare the 5% hypothetical example with the 5% hypothetical examples of other funds. As you compare hypothetical examples of other funds, it is important to note that hypothetical examples are meant to highlight the ongoing cost of investing in a fund and do not reflect any transaction costs, such as sales charges, redemption fees or exchange fees that may be incurred by shareholders of other funds. Expenses paid during the period do not include any insurance charges imposed by your insurance company's separate accounts.
1
Wanger Select 2010 Annual Report

The Keys to Prosperity
In 1651, Thomas Hobbes described human life as "poor, nasty, brutish and short." Today, 360 years later, humanity has achieved record levels of prosperity, safety and longevity. The United Nations estimates that poverty was reduced more in the last 50 years than the previous 500.1 In the developing world, life expectancy rose from 44 years to 64 years from 1950 to 1999, while in the developed world, life expectancy rose from 66 years to 78 years.2
Hobbes's perspective was accurate for his time. There was very little growth in worldwide per capita GDP until about 1820; income in Europe had dropped for centuries following the decline and collapse of the Roman Empire.3 England and much of Europe were caught in a Malthusian trap, with population gyrating up and down largely due to plagues, famines and wars. But sometime around 1820, economic growth accelerated, and per capita GDP growth has averaged over 2% yearly since then, compounding into excellent gains in living standards.4 Why?
Four Conditions for Growth
William Bernstein's The Birth of Plenty, How Prosperity in the Modern World was Created is a fascinating history of worldwide economic circumstances. He discusses reasons for the successes and failures of many empires and countries. Bernstein believes that four institutional conditions are necessary for sustained growth: property rights and civil liberties, scientific rationalism, efficient capital markets, and fast and cheap transportation and communications. He notes that these four factors existed temporarily in sixteenth century Holland, then firmly in the English speaking countries, and in the last 50 years, increasingly over much of the world.5
Physical and intellectual property rights plus civil liberties create incentives and intellectual freedom to work hard, innovate and create wealth. In empires, totalitarian states and feudalistic societies, incentives to produce beyond immediate needs are nil, because governments or lords tend to impose confiscatory taxes and arbitrarily seize property. Bernstein believes that Rome fell, in part, due to excessive taxation on farmers. He also thinks that an independent judiciary is necessary to enforce property rights and civil liberties.
Scientific rationalism is needed for technological progress and innovation. Throughout history, various regimes run by church and state ossified due to the rejection of scientific observations in favor of dogma or preconceived beliefs. During medieval times, for example, astronomers who concluded the earth revolved around the sun were tortured. Bernstein cites the trial of Galileo as a turning point toward scientific rationalism. Early inventors then tended to be tinkerers rather than scientists, but science became increasingly important. For example, by the nineteenth century the steel industry had initiated the use of modern science laboratories staffed by full-time researchers.6
Efficient capital markets enable entrepreneurs and enterprises to raise capital at reasonable costs. I remember Jesse Jackson citing a lack of capital as a cause for inner city poverty: "Capitalism without capital is just plain ism."7 Bernstein notes that entrepreneurs once had huge downside risk from failures, namely debtors prisons in recent centuries and enslavement by creditors in ancient times. The creation of limited liability corporations during the nineteenth century in Britain and the United States was a breakthrough in reducing downside risks for capitalists.
Fast and cheap transportation and communication are also needed for prosperity. Bernstein explains that before railroads and the telegraph, transportation and communication were horribly expensive and slow. Rarely could bulk goods be transported over land more than 20 miles a day, and theft was rampant. Local crop failures often caused starvation. Mass markets did not exist. The reach of rail and telegraph grew incredibly rapidly during their first decades, spurring economic growth.
Bernstein provides plenty of case studies of regimes and countries that stagnated or failed due to the lack of one or more conditions, ranging from ancient societies and Japan under the samurai to Communist countries of the twentieth century. He states, "Institutions, not the bounty of nature or freedom from imperialist domination, separate the winners from the losers in the global economy."8
Trade Drives Prosperity
Matt Ridley's The Rational Optimist, How Prosperity Evolves adds substantial perspective to Bernstein's work and provides comforting thoughts about the future. Though Ridley does not mention Bernstein by name, it is clear that he agrees with Bernstein's basic contentions. Ridley sees property rights as the primary key to prosperity. He quotes a study by MIT economist Daron Acemoglu, which compared measures of property rights to economic growth across countries and determined that three-quarters of the variation of economic growth is explained by property rights.9 Ridley adds, "In a sample of 127 countries, the sixty-three with higher economic freedom had more than four times the inco me per capita and twice the growth rate of the countries that did not."10
Ridley's emphasis is on trade, which he believes allows increasing specialization, expertise, productivity and innovation. Humans seem to be hard-wired for trade. Archaeological evidence indicates that some 100,000 years ago humans began to barter.11 People traded things and also absorbed ideas. Human intelligence became collective and cumulative. Ridley states that, more recently, the history of the modern world is a history of ideas meeting, mixing, mating and mutating.12 Innovation results from an exchange of ideas. I think of the iPhone. Steve Jobs utilizes technologies and resources developed over centuries and components originated in many countries to make an incredibly inn ovative and useful device.
Ridley notes that societies that halted trade regressed. After ocean levels rose 10,000 years ago and cut off Tasmania from Australia, people there gradually lost the ability to fish and make tools out of bones. European mariners discovered
2
Wanger Select 2010 Annual Report
Tasmanians wearing nothing but wallaby pelts and seal-fat grease.13 As another example of a closed-off society, Ridley writes, "China went from a state of economic and technological exuberance in around AD 1000 to one of dense population, agrarian backwardness and desperate poverty in 1950;" per capita income there was about flat in those 950 years.14
Ridley takes a libertarian view, highly skeptical of government. He states, "...governments generally tend to be good things at first and bad things the longer they last. First they improve society's ability to flourish by providing central services and removing impediments to trade and specialization... But...governments gradually employ more and more ambitious elites who... give themselves more and more rules to enforce, until they kill the goose that lays the golden eggs. ... Because it is a monopoly, government brings inefficiency and stagnation to most things it runs..."15
Ridley asserts that African governments have largely caused economic problems in Africa. He writes that famines in Darfur and Zimbabwe were the result of government policies. Setting up a company in Tanzania takes 379 days and $5,500, a huge sum there. Botswana has done substantially better, growing per capita GDP nearly 8% annually since its independence in 1966. That growth exceeded China's, and is largely due to secure property rights, Ridley says. Ridley is optimistic for much of Africa, however. Cell phones are spreading rapidly, providing both communication and micro-finance (two of Bernstein's conditions for prosperity). Ridley cites wonderful examples of products and labor reaching optimal markets and payments being made over cell phones.16
Ridley has comforting thoughts about the future, debunking naysayers. He notes that (oddly enough) over time humans have temporarily exhausted or driven to extinction renewable resources like forests and certain animal species, while non-renewable resources have lasted much longer than many expected. In 1865, an economist said Britain's coal was running out, and as early as 1914 the U.S. Bureau of Mines wrote that American oil reserves would last 10 years.17
Ridley believes supplies of oil, coal and gas "will last decades, perhaps centuries, and people will find alternatives long before they run out."18 He states that prices of conventional fuels need to rise and prices of alternatives need to fall, and both will occur as conventional supplies run down and efficiencies of alternatives rise. Ridley notes that wind, solar and biomass alternatives envelop enormous quantities of land. He denounces organic farming, noting that if farm yields fell back to 1961 levels, 82% of the land area of the earth would be needed for farming, up from 38%. "The Dark Ages were a massive experiment in back-to-the-land hippy lifestyle (without the trust fund)," he says.19
Ridley largely dismisses climate change fears. The scenario that calls for significant climate change by the year 2100 is a scenario of dramatic economic growth. He believes the world, and especially developing countries, will be much, much richer and better able to adapt to and mitigate climate change. In the meantime, carbon intensity20 of the worldwide economy is rapidly dropping, as wood, dung and coal become relatively less important and natural gas and nuclear power gain share, in an environment of substantially more efficient lighting, heating, transportation and manufacturing.
While some of Ridley's arguments seem a bit over the top, I think they generally appear coherent and largely believable. As to the climate change issue, I advocate taking reasonable steps to mitigate global warming. Most of my family's road miles are in a hybrid vehicle and both my home and Columbia Wanger Asset Management have adopted compact florescent lighting. Several years ago we calculated that replacing over 100 incandescent bulbs at the office saved enough electricity to power three average-sized homes.
I agree that prosperity is driven by the factors named by Bernstein and Ridley and, though there are imbalances in world economics, I think things will be okay. The Great Recession has ended, growth has resumed and the keys to prosperity remain in place. Many parts of the developing world are booming and we have invested accordingly.


Charles P. McQuaid
President and Chief Investment Officer
Columbia Wanger Asset Management, L.P.
The information and data provided in this analysis are derived from sources that we deem to be reliable and accurate. These views are not guarantees of future performance and involve certain risks, uncertainties and assumptions that are difficult to predict so actual outcomes and results may differ significantly from the views expressed. The views/opinions expressed in this essay are those of the author and not of the Wanger Advisors Trust Board, are subject to change at any time based upon economic, market or other conditions, may differ from views expressed by other Columbia Management associates and the respective parties disclaim any responsibility to update such views. These views may not be relied on as investment advice and, because investment decisions for a Columbia Wanger Fund are based on numerous factors, may not be relied on as an indication of trading intent on behalf of any particular Columbia Wanger Fund.
The information included on Pages 2 and 3 of this report is unaudited.
1 Ridley, Matt, The Rational Optimist, How Prosperity Evolves, (New York, New York, HarperCollins 2010), p. 15.
2 Bernstein, William J., The Birth of Plenty, How the Prosperity of the Modern World was Created, (New York, New York, McGraw-Hill 2004), p. 10.
3 Ibid, p. 3.
4 Ibid, p. 12, 23.
5 Ibid, p. 15-17.
6 Ibid, p. 123.
7 Rev. Jesse Jackson quoted in an article that appeared in Ebony magazine, August 1967, titled "Apostles of Economics," p. 84.
8 Bernstein, William J., op. cit, p. 293.
9 Ridley, Matt, op. cit, p. 321.
10 Ibid, p. 117.
11 Ibid, p. 350.
12 Ibid, p. 272.
13 Ibid, p. 78.
14 Ibid, p. 180.
15 Ibid, p. 182.
16 Ibid, p. 320-326.
17 Ibid, p. 237.
18 Ibid, p. 238.
19 Ibid, p. 144, 175.
20 Carbon intensity is defined as the amount of CO2 produced divided by worldwide GDP.
3
Wanger Select 2010 Annual Report

Performance Review Wanger Select

Ben Andrews
Portfolio Manager
Performance data shown represents past performance and is not a guarantee of future results. The investment return and principal value will fluctuate so that shares, when redeemed, may be worth more or less than the original cost. Current performance may be lower or higher than the performance data shown. For daily and most recent month-end performance updates, please call 1-888-4-WANGER.
Wanger Select gained 26.57% for the 2010 annual period, performing in line with the 26.64% gain of its primary benchmark, the S&P MidCap 400 Index. The Fund, and small- and mid-cap stocks in general, handily beat the large-cap S&P 500 Index's 15.06% annual return.
Our investments in the oil industry helped the portfolio greatly, not so much because the price of oil went up 15% a barrel in 2010, but because the oil companies we owned were successful at finding oil, which was our thesis for making the investments. Over the past three years, we've focused on Colombia and the area known as Kurdistan in northern Iraq. Fund investments in Colombia have been a multi-year success for the portfolio, with Pacific Rubiales Energy, an oil exploration and development company, and Canacol Energy, an oil production company, together adding 12.86% to performance in 2010. The improved security provided by government forces has allowed small petroleum companies in Colombia to look more broadly for oil for the first time in more than 20 years. The fall of Saddam Hussein in Iraq allowed the Kurds to open up their semi-autonomous region within Iraq to outside investment. ShaMaran Petroleum, a company that cobbled togeth er several exploration blocks in Kurdistan, found oil this year and its stock added 1.83% to our portfolio for the year.
On the downside, Fund investments in for-profit, post-secondary education companies ITT Educational Services and Career Education hurt returns. We've been investors in for-profit education stocks for a long time. We are believers in this industry as its student placement rates, and the career earnings of its graduates, have always been consistent and strong. We believe that many of these schools will continue to provide the same benefits for their students and make a solid profit, even if proposed "gainful employment standards" are implemented by the U.S. Department of Education. We did decrease the Fund's exposure to this sector upon realizing the negative impact that this proposed legislation could have. We intend to watch the for-profit education industry to see whether solid student and earnings growth return under the new standards and to evaluate the Fund's investments in the industry.
Canadian Solar, a solar cell and module manufacturer based in China, cost the portfolio 2.02% for the year. Solar panel pricing has been erratic as the industry is often in over supply or under supply due to its reliance on government subsidies. We invested in one of the low-cost producers of solar panels, believing that the industry is close to standing on its own two feet without big subsidies, which should fuel growth. While Canadian Solar is becoming one of the main players in the solar industry, the sector needs to improve for its stock to benefit.
During the annual period we made our first investments in the precious metals and farmland industries. We purchased Kirkland Lake Gold, a Canadian gold mining company that is expanding existing operations to increase production, and Union Agriculture Group, a farmland operator in Uruguay.
I'm relieved that the expiring income tax cuts were extended for another two years and I believe that the 2% cut in payroll taxes is another positive. My hope is that consumers continue to repair their balance sheets and the government starts to cut spending! Overall, I'm optimistic as a slow economic recovery is evident, but stock market valuations are not cheap, so caution is in order.
Risks include stock market fluctuations due to economic and business developments. The Fund also has potentially greater price volatility due to the Fund's concentration in a limited number of stocks of mid-size companies. The Fund is a non-diversified fund and may, therefore, have a greater risk of loss from a few issuers than a similar fund that invests more broadly. The Fund may not operate as a non-diversified fund at all times. International investments involve greater potential risks, including less regulation, currency fluctuations, economic instability and political developments.
Portfolio holdings are subject to change periodically and may not be representative of current holdings.
Fund's Positions in Mentioned Holdings
As a percentage of net assets, as of 12/31/10
| Pacific Rubiales Energy | | | 6.8 | % | |
| Canacol Energy | | | 4.7 | | |
| ITT Educational Services | | | 2.8 | | |
| ShaMaran Petroleum | | | 2.1 | | |
| Canadian Solar | | | 1.7 | | |
| Career Education | | | 1.7 | | |
| Union Agriculture Group | | | 0.9 | | |
| Kirkland Lake Gold | | | 0.7 | | |
4
Wanger Select 2010 Annual Report
Growth of a $10,000 Investment in Wanger Select
February 1, 1999 (inception date) through December 31, 2010
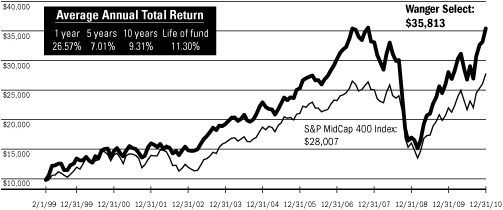
Performance data shown represents past performance and is not a guarantee of future results. The investment return and principal value will fluctuate so that shares, when redeemed, may be worth more or less than the original cost. Current performance may be lower or higher than the performance data shown. Performance results reflect any fee waivers or reimbursements of Fund expenses by the investment adviser and/or any of its affiliates. Absent these fee waivers and/or expense reimbursement arrangements, performance results would have been lower. For daily and most recent month-end performance updates, please call 1-888-4-WANGER.
This graph compares the results of $10,000 invested in Wanger Select on February 1, 1999 (the date the Fund began operations) through December 31, 2010, to the S&P MidCap 400 Index, with dividends and capital gains reinvested. Although the index is provided for use in assessing the Fund's performance, the Fund's holdings may differ significantly from those in the index.
Top 10 Holdings
As a percentage of net assets, as of 12/31/10
1. Pacific Rubiales Energy (Colombia)
Oil Production & Exploration in Colombia | | | 6.8
| % | |
2. Hertz
Largest U.S. Rental Car Operator | | | 5.5
| | |
3. Canacol Energy (Colombia)
Oil Producer in South America | | | 4.7
| | |
4. Discover Financial Services
Credit Card Company | | | 4.2
| | |
5. Abercrombie & Fitch
Teen Apparel Retailer | | | 4.0
| | |
6. Safeway
Supermarkets | | | 3.7
| | |
7. Sanmina-SCI
Electronic Manufacturing Services | | | 3.5
| | |
8. CNO Financial Group
Life, Long-term Care & Medical Supplement Insurance | | | 3.4
| | |
9. Ametek
Aerospace/Industrial Instruments | | | 3.2
| | |
10. Crown Castle International
Communications Towers | | | 3.0
| | |
Top 5 Industries
As a percentage of net assets, as of 12/31/10
| Consumer Goods & Services | | | 25.9 | % | |
| Energy & Minerals | | | 23.5 | | |
| Information | | | 19.9 | | |
| Industrial Goods & Services | | | 12.8 | | |
| Finance | | | 10.9 | | |
Results as of December 31, 2010
| | | 4th quarter | | 1 year | | 5 years | | 10 years | |
| Wanger Select | | | 15.27 | % | | | 26.57 | % | | | 7.01 | % | | | 9.31 | % | |
| S&P MidCap 400 Index* | | | 13.50 | | | | 26.64 | | | | 5.74 | | | | 7.16 | | |
| S&P 500 Index | | | 10.76 | | | | 15.06 | | | | 2.29 | | | | 1.41 | | |
Lipper Mid-Cap Growth Funds
Variable Underlying Index | | | 13.77 | | | | 27.62 | | | | 5.70 | | | | 2.00 | | |
NAV as of 12/31/10: $28.99
* The Fund's primary benchmark.
Performance numbers reflect all Fund expenses but do not include any insurance charge imposed by your insurance company's separate accounts. If performance included the effect of these additional charges, it would be lower.
All results shown assume reinvestment of distributions and do not reflect taxes that a shareholder may pay on Fund distributions or the sale of Fund shares.
The S&P MidCap 400 Index is a market value-weighted index that tracks the performance of 400 mid-cap U.S. companies. The S&P 500 tracks the performance of 500 widely-held large capitalization U.S. stocks. Although the Fund typically invests in small- and mid-sized companies, the comparison to the S&P 500 is presented to show performance against a widely recognized market index over the life of the Fund. The Lipper Mid-Cap Growth Funds Variable Underlying Index is an equally weighted representation of the 30 largest variable insurance underlying funds in the Lipper Mid-Cap Growth Funds Variable Underlying Classification. Indexes are not managed and do not incur fees or expenses. It is not possible to invest directly in an index.
Lipper Inc., a widely respected data provider in the industry, calculates an average total return (assuming reinvestment of distributions) for mutual funds with investment objectives similar to those of the Fund. Lipper makes no adjustment for the effect of sales loads.
Portfolio characteristics and holdings are subject to change periodically and may not be representative of current characteristics and holdings.
5
Wanger Select 2010 Annual Report
Wanger Select
Statement of Investments December 31, 2010
Number of
Shares | | | | Value | |
| | | Equities – 97.7% | |
| | | Consumer Goods & Services – 25.9% | |
| | | Retail – 9.4% | |
| | 242,000 | | | Abercrombie & Fitch
Teen Apparel Retailer | | $ | 13,946,460 | | |
| | 575,000 | | | Safeway
Supermarkets | | | 12,931,750 | | |
| | 53,550 | | | lululemon athletica (a)(b)
Premium Active Apparel Retailer | | | 3,663,891 | | |
| | 512,000 | | | Wet Seal (a)
Specialty Apparel Retailer | | | 1,894,400 | | |
| | | | 32,436,501 | | |
| | | Travel – 6.0% | |
| | 1,308,500 | | | Hertz (a)
Largest U.S. Rental Car Operator | | | 18,960,165 | | |
| | 73,900 | | | Expedia
Online Travel Services Company | | | 1,854,151 | | |
| | | | 20,814,316 | | |
| | | Educational Services – 4.5% | |
| | 151,500 | | | ITT Educational Services (a)
Post-secondary Degree Services | | | 9,649,035 | | |
| | 287,000 | | | Career Education (a)
Post-secondary Education | | | 5,949,510 | | |
| | | | 15,598,545 | | |
| | | Apparel – 2.8% | |
| | 172,000 | | | Coach
Designer & Retailer of Branded Leather Accessories | | | 9,513,320 | | |
| | | Casinos & Gaming – 1.5% | |
| | 50,663,000 | | | RexLot Holdings (China)
Lottery Equipment Supplier in China | | | 5,344,749 | | |
| | | Leisure Products – 0.7% | |
| | 75,200 | | | Thor Industries
RV & Bus Manufacturer | | | 2,553,792 | | |
| | | Other Consumer Services – 0.5% | |
| | 347,950 | | | IFM Investments (Century 21 China RE) –
ADR (China) (a)
Provides Real Estate Services in China | | | 1,739,750 | | |
Number of
Shares | | | | Value | |
| | | Food & Beverage – 0.5% | |
| | 146,000 | | | GLG Life Tech (Canada) (a)
Produce an All-natural Sweetener
Extracted from the Stevia Plant | | $ | 1,568,040 | | |
| | | | | Total Consumer Goods & Services | | | 89,569,013 | | |
| | | Energy & Minerals – 23.5% | |
| | | Oil & Gas Producers – 17.6% | |
| | 696,000 | | | Pacific Rubiales Energy (Colombia)
Oil Production & Exploration in Colombia | | | 23,624,661 | | |
| | 10,210,000 | | | Canacol Energy (Columbia) (a)
Oil Producer in South America | | | 16,121,593 | | |
| | 5,436,900 | | | ShaMaran Petroleum (Iraq) (a)
Oil Exploration in Kurdistan | | | 7,436,573 | | |
| | 5,714,000 | | | Petrodorado (Colombia) (a)(c) | | | 3,998,593 | | |
| | 5,714,000 | | | Petrodorado – Warrants (Colombia) (a)(c)
Oil & Gas Exploration & Production in
Colombia, Peru & Paraguay | | | 2,413,638 | | |
| | 176,800 | | | Houston American Energy (b)
Oil & Gas Exploration & Production in Colombia | | | 3,198,312 | | |
| | 2,520,000 | | | Canadian Overseas Petroleum –
Subscription Receipts
(United Kingdom) (a)(c) | | | 2,111,194 | | |
| | 1,080,000 | | | Canadian Overseas Petroleum
(United Kingdom) (a)(c) | | | 777,061 | | |
| | 540,000 | | | Canadian Overseas Petroleum –
Warrants (United Kingdom) (a)(c)
Oil & Gas Exploration & Production in the North Sea | | | 127,736 | | |
| | 1,875,000 | | | Petromanas (Canada) (a)(c) | | | 729,973 | | |
| | 700,000 | | | Petromanas (Canada) (a) | | | 278,085 | | |
| | 937,500 | | | Petromanas – Warrants (Canada) (a)(c)
Exploring for Oil in Albania | | | 110,882 | | |
| | | | 60,928,301 | | |
| | | Alternative Energy – 2.1% | |
| | 483,600 | | | Canadian Solar (China) (a)(b)
Solar Cell & Module Manufacturer | | | 5,991,804 | | |
| | 681,000 | | | Synthesis Energy Systems (China) (a)
Owner/Operator of Gasification Plants | | | 796,770 | | |
| | 211,000 | | | Real Goods Solar (a)
Residential Solar Energy Installer | | | 527,500 | | |
| | | | 7,316,074 | | |
See accompanying notes to financial statements.
6
Wanger Select 2010 Annual Report
Wanger Select
Statement of Investments December 31, 2010
Number of
Shares | | | | Value | |
| | | Agricultural Commodities – 1.9% | |
| | 5,000,000 | | | Eacom Timber (Canada) (a)(c) | | $ | 3,203,258 | | |
| | 162,000 | | | Eacom Timber (Canada) (a)
Canadian Lumber Producer | | | 105,904 | | |
| | 1,363,636 | | | Union Agriculture Group (Argentina) (a)(c)
Farmland Operator in Uruguay | | | 2,999,999 | | |
| | | | 6,309,161 | | |
| | | Oil Services – 1.2% | |
| | 3,004,800 | | | Tuscany International Drilling
(Colombia) (a)(c) | | | 4,146,219 | | |
| | 500,000 | | | Tuscany International Drilling –
Warrants (Colombia) (a)(c)
South America-based Drilling Rig Contractor | | | 64,065 | | |
| | | | 4,210,284 | | |
| | | Mining – 0.7% | |
| | 152,000 | | | Kirkland Lake Gold (Canada) (a)
Gold Mining | | | 2,441,356 | | |
| | | | | Total Energy & Minerals | | | 81,205,176 | | |
| | | Information – 19.9% | |
| | | Mobile Communications – 6.9% | |
| | 234,000 | | | Crown Castle International (a)
Communications Towers | | | 10,256,220 | | |
| | 136,000 | | | American Tower (a)
Communications Towers | | | 7,023,040 | | |
| | 2,268,900 | | | Globalstar (a)
Satellite Mobile Voice & Data Carrier | | | 3,289,905 | | |
| | 76,000 | | | SBA Communications (a)
Communications Towers | | | 3,111,440 | | |
| | | | 23,680,605 | | |
| | | Contract Manufacturing – 3.5% | |
| | 1,060,833 | | | Sanmina-SCI (a)
Electronic Manufacturing Services | | | 12,178,363 | | |
| | | Computer Services – 2.1% | |
| | 635,000 | | | WNS – ADR (India) (a)
Offshore BPO (Business Process Outsourcing) Services | | | 7,346,950 | | |
| | | Business Software – 1.8% | |
| | 1,025,000 | | | Novell (a)
Directory, Operating System & Identity
Management Software | | | 6,068,000 | | |
Number of
Shares | | | | Value | |
| | | Computer Hardware & Related Equipment – 1.7% | |
| | 113,000 | | | Amphenol
Electronic Connectors | | $ | 5,964,140 | | |
| | | Business Information & Marketing Services – 0.9% | |
| | 346,000 | | | Navigant Consulting (a)
Financial Consulting Firm | | | 3,183,200 | | |
| | | Instrumentation – 0.8% | |
| | 18,500 | | | Mettler Toledo (a)
Laboratory Equipment | | | 2,797,385 | | |
| | | Internet Related – 0.8% | |
| | 77,100 | | | Mail.ru – GDR (Russia) (a)(c)
Internet Social Networking & Games for Russian Speakers | | | 2,775,600 | | |
| | | Advertising – 0.8% | |
| | 555,000 | | | VisionChina Media – ADR (China) (a)(b)
Advertising on Digital Screens in China's
Mass Transit System | | | 2,575,200 | | |
| | | Financial Processors – 0.6% | |
| | 118,800 | | | CardTronics (a)
Operates the World's Largest Network of ATMs | | | 2,102,760 | | |
| | | | | Total Information | | | 68,672,203 | | |
| | | Industrial Goods & Services – 12.8% | |
| | | Machinery – 4.5% | |
| | 282,000 | | | Ametek
Aerospace/Industrial Instruments | | | 11,068,500 | | |
| | 60,000 | | | Pall
Filtration & Fluids Clarification | | | 2,974,800 | | |
| | 16,000 | | | Neopost (France)
Postage Meter Machines | | | 1,394,028 | | |
| | | | 15,437,328 | | |
| | | Waste Management – 2.4% | |
| | 227,000 | | | Waste Management | | | 8,369,490 | | |
| | | | | U.S. Garbage Collection & Disposal | | | |
| | | Industrial Materials & Specialty Chemicals – 2.0% | |
| | 151,000 | | | Nalco Holding Company
Provider of Water Treatment & Process
Chemicals & Services | | | 4,822,940 | | |
See accompanying notes to financial statements.
7
Wanger Select 2010 Annual Report
Wanger Select
Statement of Investments December 31, 2010
Number of
Shares | | | | Value | |
| | | Industrial Materials & Specialty
Chemicals – 2.0% (cont) | |
| | 272,600 | | | ChemSpec International – ADR (China)
Specialty Chemicals with Focus on
Fluorinated Chemical Manufacturing | | $ | 2,039,048 | | |
| | | | 6,861,988 | | |
| | | Other Industrial Services – 1.8% | |
| | 113,500 | | | Expeditors International of Washington
International Freight Forwarder | | | 6,197,100 | | |
| | | Industrial Distribution – 1.3% | |
| | 33,500 | | | WW Grainger
Industrial Distribution | | | 4,626,685 | | |
| | | Outsourcing Services – 0.8% | |
| | 140,500 | | | Quanta Services (a)
Electrical & Telecom Construction Services | | | 2,798,760 | | |
| | | | | Total Industrial Goods & Services | | | 44,291,351 | | |
| | | Finance – 10.9% | |
| | | Credit Cards 4.2% | |
| | 778,200 | | | Discover Financial Services
Credit Card Company | | | 14,420,046 | | |
| | | Insurance – 3.4% | |
| | 1,751,000 | | | CNO Financial Group (a)
Life, Long-term Care & Medical Supplement Insurance | | | 11,871,780 | | |
| | | Brokerage & Money Management – 3.3% | |
| | 907,000 | | | MF Global (a)
Futures Broker | | | 7,582,520 | | |
| | 166,000 | | | SEI Investments
Mutual Fund Administration & Investment Management | | | 3,949,140 | | |
| | | | 11,531,660 | | |
| | | | | Total Finance | | | 37,823,486 | | |
| | | Other Industries – 3.9% | |
| | | Transportation – 2.3% | |
| | 197,000 | | | JB Hunt Transport Services
Truck & Intermodal Carrier | | | 8,039,570 | | |
| | | Real Estate – 1.0% | |
| | 181,500 | | | BioMed Realty Trust
Life Science-focused Office Buildings | | | 3,384,975 | | |
Number of Shares
or Principal Amount | | | | Value | |
| | | Regulated Utilities – 0.6% | |
| | 38,000 | | | Wisconsin Energy
Wisconsin Utility | | $ | 2,236,680 | | |
| | | | | Total Other Industries | | | 13,661,225 | | |
| | | Health Care – 0.8% | |
| | | Biotechnology & Drug Delivery – 0.5% | |
| | 220,000 | | | NPS Pharmaceuticals (a)
Orphan Drugs & Healthy Royalties | | | 1,738,000 | | |
| | | Pharmaceuticals – 0.3% | |
| | 148,300 | | | Akorn (a)
Develops, Manufactures & Sells Specialty Generic Drugs | | | 900,181 | | |
| | | | | Total Health Care | | | 2,638,181 | | |
Total Equities
(Cost: $235,691,540) – 97.7% | | | 337,860,635 | | |
| Securities Lending Collateral – 0.2% | | | |
| | 878,607 | | | Dreyfus Government Cash
Management Fund (d)
(7 day yield of 0.01%) | | | 878,607 | | |
Total Securities Lending Collateral
(Cost: $878,607) | | | 878,607 | | |
| Short-Term Obligation – 1.8% | | | |
| | | Repurchase Agreement – 1.8% | |
| $ | 6,226,000 | | | Repurchase Agreement with Fixed
Income Clearing Corp., dated 12/31/10,
due 1/03/11 at 0.16%, collateralized
by a U.S. Government Agency obligation
maturing 4/28/14, market value
$6,352,931 (repurchase proceeds
$6,226,083) | | | 6,226,000 | | |
Total Short-Term Obligation
(Amortized Cost: $6,226,000) | | | 6,226,000 | | |
Total Investments
(Cost: $242,796,147) – 99.7% (e)(f) | | | 344,965,242 | | |
Obligation to Return Collateral for
Securities Loaned – (0.2)% | | | (878,607 | ) | |
| Cash and Other Assets Less Liabilities – 0.5% | | | 1,872,894 | | |
| Total Net Assets – 100.0% | | $ | 345,959,529 | | |
See accompanying notes to financial statements.
8
Wanger Select 2010 Annual Report
Wanger Select
Statement of Investments December 31, 2010
Notes to Statement of Investments:
(a) Non-income producing security.
(b) All or a portion of this security was on loan at December 31, 2010. The total market value of Fund securities on loan at December 31, 2010 was $850,627.
(c) Denotes a restricted security, which is subject to restrictions on resale under federal securities laws. These securities are valued at a fair value determined in good faith under consistently applied procedures established by the Board of Trustees. At December 31, 2010, the market value of these securities amounted to $23,458,218 which represented 6.78% of total net assets.
Additional information on these securities is as follows:
Security | | Acquisition
Dates | | Shares | | Cost | | Value | |
Tuscany International
Drilling | | 2/12/10-
3/23/10 | | | 3,004,800 | | | $ | 3,442,850 | | | $ | 4,146,219 | | |
| Petrodorado | | 11/20/09 | | | 5,714,000 | | | | 1,202,115 | | | | 3,998,593 | | |
| Eacom Timber | | 3/17/10 | | | 5,000,000 | | | | 2,475,248 | | | | 3,203,258 | | |
| Union Agriculture Group | | 12/08/10 | | | 1,363,636 | | | | 2,999,999 | | | | 2,999,999 | | |
| Mail.ru – GDR | | 11/05/10-
12/31/10 | | | 77,100 | | | | 2,704,855 | | | | 2,775,600 | | |
| Petrodorado – Warrants | | 11/20/09 | | | 5,714,000 | | | | 706,004 | | | | 2,413,638 | | |
Canadian Overseas
Petroleum –
Subscription
Receipts | | 11/24/10 | | | 2,520,000 | | | | 1,235,052 | | | | 2,111,194 | | |
Canadian Overseas
Petroleum | | 11/24/10 | | | 1,080,000 | | | | 478,156 | | | | 777,061 | | |
| Petromanas | | 5/20/10 | | | 1,875,000 | | | | 651,600 | | | | 729,973 | | |
Canadian Overseas
Petroleum – Warrants | | 11/24/10 | | | 540,000 | | | | 51,152 | | | | 127,736 | | |
| Petromanas – Warrants | | 5/20/10 | | | 937,500 | | | | 54,282 | | | | 110,882 | | |
Tuscany International
Drilling – Warrants | | 2/12/10 | | | 500,000 | | | | 61,950 | | | | 64,065 | | |
| | | | | | | $ | 16,063,263 | | | $ | 23,458,218 | | |
(d) Investment made with cash collateral received from securities lending activity.
(e) On December 31, 2010, the market value of foreign securities represents 21.5% of total net assets. The Fund's foreign portfolio was diversified as follows:
| Currency | | Value | | Cost | | Percentage of
Net Assets | |
| Canadian Dollar | | $ | 67,690,791 | | | $ | 22,206,730 | | | | 19.6 | | |
| Hong Kong Dollar | | | 5,344,749 | | | | 3,210,487 | | | | 1.5 | | |
| Euro | | | 1,394,028 | | | | 1,334,807 | | | | 0.4 | | |
| | | $ | 74,429,568 | | | $ | 26,752,024 | | | | 21.5 | | |
(f) At December 31, 2010, for federal income tax purposes cost of investments was $256,130,578 and net unrealized appreciation was $88,834,664 consisting of gross unrealized appreciation of $115,373,454 and gross unrealized depreciation of $26,538,790.
An affiliated person of the Fund may include any company in which the Fund owns five percent or more of its outstanding voting shares. Transactions in this affiliated company during the year ended December 31, 2010 are as follows:
Affiliate | | Balance
of Shares
Held
12/31/2009 | |
Purchases/
Additions | |
Sales/
Reductions | | Balance of
Shares
Held
12/31/10 | | Value | | Dividend | |
Canacol
Energy* | | | 16,460,000 | | | | — | | | | 6,250,000 | | | | 10,210,000 | | | $ | 16,121,593 | | | $ | — | | |
* At December 31, 2010, the Fund owned less than five percent of the company's outstanding voting shares.
ADR = American Depositary Receipts.
GDR = Global Depositary Receipts.
The following table summarizes the inputs used, as of December 31, 2010, in valuing the Fund's assets:
| Investment Type | | Other
Quoted Prices
(Level 1) | | Significant
Observable
Inputs
(Level 2) | | Significant
Unobservable
Inputs
(Level 3) | | Total | |
| Equities | |
Consumer Goods &
Services | | $ | 84,224,264 | | | $ | 5,344,749 | | | $ | — | | | $ | 89,569,013 | | |
| Energy & Minerals | | | 60,522,558 | | | | 17,682,619 | | | | 2,999,999 | | | | 81,205,176 | | |
| Information | | | 68,672,203 | | | | — | | | | — | | | | 68,672,203 | | |
Industrial Goods &
Services | | | 42,897,323 | | | | 1,394,028 | | | | — | | | | 44,291,351 | | |
| Finance | | | 37,823,486 | | | | — | | | | — | | | | 37,823,486 | | |
| Other Industries | | | 13,661,225 | | | | — | | | | — | | | | 13,661,225 | | |
| Health Care | | | 2,638,181 | | | | — | | | | — | | | | 2,638,181 | | |
| Total Equities | | | 310,439,240 | | | | 24,421,396 | | | | 2,999,999 | | | | 337,860,635 | | |
Total Securities
Lending Collateral | | | 878,607 | | | | — | | | | — | | | | 878,607 | | |
Total Short-Term
Obligation | | | — | | | | 6,226,000 | | | | — | | | | 6,226,000 | | |
| Total Investments | | $ | 311,317,847 | | | $ | 30,647,396 | | | $ | 2,999,999 | | | $ | 344,965,242 | | |
The Fund's assets assigned to the Level 2 input category are generally valued using a market approach, in which a security's value is determined through its correlation to prices and information from observable market transactions for similar or identical assets. Securities acquired via private placement that have a holding period or an extended settlement period are valued at a discount to the same shares that are trading freely on the market. These discounts are determined by the adviser's experience with similar securities or situations. Factors may include, but are not limited to, trade volume, shares outstanding and stock price. Foreign equities are generally valued at the last sales price on the foreign exchange or market on which they trade. The Fund may use a systematic fair valuation model provided by an independent third party to value securities principally traded in foreign markets in order to adjust for possible stale pricing t hat may occur between the close of the foreign exchanges and the time for valuation. These models take into account available market data including intraday index, ADR, and ETF movements. Warrants which do not trade are valued as a percentage of the actively trading common stock using a model, based on Black Scholes.
See accompanying notes to financial statements.
9
Wanger Select 2010 Annual Report
Wanger Select
Statement of Investments December 31, 2010
Certain short-term obligations may be valued using amortized cost, an income approach which converts future cash flows to a present value based upon the discount or premium at purchase.
The Fund's assets assigned to the Level 3 input category are valued at fair value as determined in good faith under consistently applied procedures established by and under the general supervision of the Board of Trustees. To determine fair value, management will utilize the valuation technique that they deem the most appropriate in the circumstances. Securities acquired via private placement but are not yet trading are valued using a market approach for which management has determined that the original transaction price is the best representation of fair value. The original cost may be adjusted for the market movement in an index, ETF or similar security during the period it does not trade.
There were no significant transfers of financial assets between levels 1 and 2 during the period.
The following table reconciles asset balances for the year ending December 31, 2010, in which significant unobservable inputs (Level 3) were used in determining value:
Investments
in Securities | | Balance as of
December 31,
2009 | | Realized
Gain/(Loss) | | Change in
Unrealized
Appreciation
(Depreciation) | | Purchases | | Sales | | Transfers
into
Level 3 | | Transfers
out of
Level 3 | | Balance
as of
December 31,
2010 | |
Equities
Energy & Minerals | | $ | — | | | $ | — | | | $ | — | | | $ | 2,999,999 | | | $ | — | | | $ | — | | | $ | — | | | $ | 2,999,999 | | |
| Consumer Goods & Services | | | 23,515 | | | | (2,424,408 | ) | | | 2,400,893 | | | | — | | | | — | | | | — | | | | — | | | | — | | |
| | | $ | 23,515 | | | $ | (2,424,408 | ) | | $ | 2,400,893 | | | $ | 2,999,999 | | | $ | — | | | $ | — | | | $ | — | | | $ | 2,999,999 | | |
The information in the above reconciliation table represents fiscal year to date activity for any securities identified as using Level 3 inputs at either the beginning or the end of the current fiscal period.
The change in unrealized appreciation attributed to securities owned at December 31, 2010, which were valued using significant unobservable inputs (Level 3) amounted to $2,400,893. This amount is included in net change in unrealized appreciation (depreciation) on the Statement of Changes in Net Assets.
For more information on valuation inputs, and their aggregation into the levels used in the table above, please refer to the Security Valuation section in the accompanying Notes to Financial Statements.
At December 31, 2010, the Fund held investments in the following sectors:
| Sector | | Percentage of
Net Assets | |
| Consumer Goods & Services | | | 25.9 | | |
| Energy & Minerals | | | 23.5 | | |
| Information | | | 19.9 | | |
| Industrial Goods & Services | | | 12.8 | | |
| Finance | | | 10.9 | | |
| Other Industries | | | 3.9 | | |
| Health Care | | | 0.8 | | |
| | | | | | 97.7 | | |
| Securities Lending Collateral | | | 0.2 | | |
| Short-Term Obligation | | | 1.8 | | |
| Obligation to Return Collateral for Securities Loaned | | | (0.2 | ) | |
| Cash and Other Assets less Liabilities | | | 0.5 | | |
| | | | 100.0 | | |
See accompanying notes to financial statements.
10
Wanger Select 2010 Annual Report
Statement of Assets and Liabilities
December 31, 2010
| Assets: | |
| Investments, at cost | | $ | 242,796,147 | | |
Investments, at value
(including securities on loan of $850,627) | | $ | 344,965,242 | | |
| Cash | | | 183,858 | | |
| Foreign currency (cost of $21,758) | | | 21,738 | | |
| Receivable for: | |
| Investments sold | | | 4,013,316 | | |
| Fund shares sold | | | 14,722 | | |
| Securities lending income | | | 1,180 | | |
| Dividends | | | 185,705 | | |
| Interest | | | 28 | | |
| Other assets | | | 4,098 | | |
| Total Assets | | | 349,389,887 | | |
| Liabilities: | |
| Collateral on securities loaned | | | 878,607 | | |
| Payable for: | |
| Investments purchased | | | 1,070,777 | | |
| Fund shares repurchased | | | 1,151,186 | | |
| Investment advisory fee | | | 229,793 | | |
| Administration fee | | | 14,362 | | |
| Transfer agent fee | | | 19 | | |
| Trustees' fees | | | 6 | | |
| Professional fees | | | 16,686 | | |
| Custody fee | | | 8,700 | | |
| Chief compliance officer expenses | | | 870 | | |
| Trustees' deferred compensation plan | | | 26,324 | | |
| Other liabilities | | | 33,028 | | |
| Total Liabilities | | | 3,430,358 | | |
| Net Assets | | $ | 345,959,529 | | |
| Composition of Net Assets: | |
| Paid-in capital | | $ | 274,061,585 | | |
| Accumulated net investment loss | | | (2,901,264 | ) | |
| Accumulated net realized loss | | | (27,370,141 | ) | |
| Net unrealized appreciation on: | |
| Investments | | | 102,169,095 | | |
| Foreign currency translations | | | 254 | | |
| Net Assets | | $ | 345,959,529 | | |
| Fund Shares Outstanding | | | 11,934,749 | | |
Net asset value, offering price and redemption
price per share | | $ | 28.99 | | |
Statement of Operations
For the Year Ended December 31, 2010
| Investment Income: | |
| Dividends (net foreign taxes withheld of $15,156) | | $ | 1,547,916 | | |
| Interest income | | | 16,178 | | |
| Securities lending income, net | | | 3,886 | | |
| Total Investment Income | | | 1,567,980 | | |
| Expenses: | |
| Investment advisory fee | | | 2,308,082 | | |
| Administration fee | | | 144,255 | | |
| Transfer agent fee | | | 260 | | |
| Trustees' fees | | | 24,054 | | |
| Custody fee | | | 51,693 | | |
| Chief compliance officer expenses (See Note 4) | | | 9,508 | | |
| Other expenses (See Note 5) | | | 133,107 | | |
| Total Expenses | | | 2,670,959 | | |
| Custody earnings credit | | | (127 | ) | |
| Net Expenses | | | 2,670,832 | | |
| Net Investment Loss | | | (1,102,852 | ) | |
Net Realized and Unrealized Gain (Loss) on
Investments and Foreign Currency: | |
| Net realized gain on: | |
| Unaffiliated investments | | | 6,624,963 | | |
| Affiliated investments | | | 5,633,250 | | |
| Foreign currency transactions | | | 81,501 | | |
| Net realized gain | | | 12,339,714 | | |
| Net change in unrealized appreciation on: | |
| Unaffiliated investments | | | 58,926,777 | | |
| Affiliated investments (See Note 4) | | | 813,341 | | |
| Foreign currency translations | | | 254 | | |
| Net change in unrealized appreciation | | | 59,740,372 | | |
| Net Gain | | | 72,080,086 | | |
| Net Increase in Net Assets from Operations | | $ | 70,977,234 | | |
See accompanying notes to financial statements.
11
Wanger Select 2010 Annual Report
Statement of Changes in Net Assets
| | | Year Ended December 31, | |
| Increase (Decrease) in Net Assets | | 2010 | | 2009 | |
| Operations: | |
| Net investment loss | | $ | (1,102,852 | ) | | $ | (872,018 | ) | |
| Net realized gain (loss) on: | |
| Unaffiliated investments | | | 6,624,963 | | | | (14,804,246 | ) | |
| Affiliated investments (See Note 4) | | | 5,633,250 | | | | — | | |
| Foreign currency transactions | | | 81,501 | | | | (112,113 | ) | |
| Net change in unrealized appreciation on: | |
| Unaffiliated investments | | | 58,926,777 | | | | 114,979,225 | | |
| Affiliated investments (See Note 4) | | | 813,341 | | | | 5,328,903 | | |
| Foreign currency translations | | | 254 | | | | — | | |
| Net Increase in Net Assets from Operations | | | 70,977,234 | | | | 104,519,751 | | |
| Distributions to Shareholders: | |
| From net investment income | | | (1,632,499 | ) | | | — | | |
| Share Transactions: | |
| Subscriptions | | | 40,253,904 | | | | 34,296,345 | | |
| Distributions reinvested | | | 1,632,499 | | | | — | | |
| Redemptions | | | (35,639,991 | ) | | | (25,035,845 | ) | |
| Net Increase from Fund Share Transactions | | | 6,246,412 | | | | 9,260,500 | | |
| Total Increase in Net Assets | | | 75,591,147 | | | | 113,780,251 | | |
| Net Assets: | |
| Beginning of period | | | 270,368,382 | | | | 156,588,131 | | |
| End of period | | $ | 345,959,529 | | | $ | 270,368,382 | | |
| Accumulated net investment loss at end of period | | $ | (2,901,264 | ) | | $ | (775,601 | ) | |
See accompanying notes to financial statements.
12
Wanger Select 2010 Annual Report
Financial Highlights
| | | Year Ended December 31, | |
| Selected data for a share outstanding throughout each period | | 2010 | | 2009 | | 2008 | | 2007 | | 2006 | |
| Net Asset Value, Beginning of Period | | $ | 23.05 | | | $ | 13.87 | | | $ | 28.08 | | | $ | 26.15 | | | $ | 22.66 | | |
| Income from Investment Operations: | |
| Net investment loss (a) | | | (0.09 | ) | | | (0.08 | ) | | | (0.10 | ) | | | (0.04 | ) | | | (0.05 | ) | |
| Net realized and unrealized gain (loss) on investments and foreign currency | | | 6.17 | | | | 9.26 | | | | (13.38 | ) | | | 2.47 | | | | 4.38 | | |
| Total from Investment Operations | | | 6.08 | | | | 9.18 | | | | (13.48 | ) | | | 2.43 | | | | 4.33 | | |
| Less Distributions to Shareholders: | |
| From net investment income | | | (0.14 | ) | | | — | | | | — | | | | — | | | | (0.09 | ) | |
| From net realized gains | | | — | | | | — | | | | (0.73 | ) | | | (0.50 | ) | | | (0.75 | ) | |
| Total Distributions to Shareholders | | | (0.14 | ) | | | — | | | | (0.73 | ) | | | (0.50 | ) | | | (0.84 | ) | |
| Net Asset Value, End of Period | | $ | 28.99 | | | $ | 23.05 | | | $ | 13.87 | | | $ | 28.08 | | | $ | 26.15 | | |
| Total Return (b) | | | 26.57 | % | | | 66.19 | % | | | (49.06 | )% | | | 9.39 | % | | | 19.70 | % | |
| Ratios to Average Net Assets/Supplemental Data: | |
| Net expenses (c) | | | 0.93 | % | | | 0.95 | % | | | 0.91 | % | | | 0.90 | % | | | 0.94 | % | |
| Net investment loss (c) | | | (0.38 | )% | | | (0.44 | )% | | | (0.45 | )% | | | (0.15 | )% | | | (0.20 | )% | |
| Portfolio turnover rate | | | 30 | % | | | 35 | % | | | 36 | % | | | 15 | % | | | 21 | % | |
| Net assets, end of period (000s) | | $ | 345,960 | | | $ | 270,368 | | | $ | 156,588 | | | $ | 316,380 | | | $ | 175,346 | | |
(a) Net investment loss per share was based upon the average shares outstanding during the period.
(b) Total return at net asset value assuming all distributions reinvested.
(c) The benefits derived from custody fees paid indirectly had an impact of less than 0.01%.
See accompanying notes to financial statements.
13
Wanger Select 2010 Annual Report
Notes to Financial Statements
1. Nature of Operations
Wanger Select (the Fund), is a series of Wanger Advisors Trust (the Trust), an open-end management investment company organized as a Massachusetts business trust. The investment objective of the Fund is to seek long-term capital appreciation. The Fund is available only for allocation to certain life insurance company separate accounts established for the purpose of funding qualified and non-qualified variable annuity contracts and variable life insurance policies and may also be offered directly to certain types of pension plans and retirement arrangements.
2. Significant Accounting Policies
The preparation of financial statements in accordance with accounting principles generally accepted in the United States of America (GAAP) requires management to make certain estimates and assumptions that affect the reported amounts of assets and liabilities, the disclosure of contingent assets and liabilities at the date of the financial statements and the reported amounts of revenue and expenses during the reporting period. Actual results could differ from those estimates.
Security valuation
Securities of the Fund are valued at market value or, if a market quotation for a security is not readily available or is deemed not to be reliable because of events or circumstances that have occurred between the market quotation and the time as of which the security is to be valued, the security is valued at its fair value determined in good faith under consistently applied procedures established by the Board of Trustees. A security traded on a securities exchange or in an over-the-counter market in which transaction prices are reported is valued at the last sales price at the time of valuation. A security traded principally on NASDAQ is valued at the NASDAQ official closing price. Mutual Funds and Exchange Traded Funds are valued at their closing net asset value as reported to NASDAQ. A security for which there is no reported sale on the valuation date is valued at the latest bid quotation. Short-term investments maturing in 60 days or l ess are valued at amortized cost, which approximates market value. A security for which a market quotation is not readily available and any other assets are valued at their fair value determined in good faith under consistently applied procedures established by the Board of Trustees. The Trust has retained an independent statistical fair value pricing service that employs a systematic methodology to assist in the fair valuation process for securities principally traded in a foreign market in order to adjust for possible changes in value that may occur between the close of the foreign market and the time as of which the securities are to be valued. If a security is valued at a "fair value", that value may be different from the last quoted market price for the security.
Various inputs are used in determining the value of the Fund's investments; following the input prioritization hierarchy established by GAAP. These inputs are summarized in the three broad levels listed below:
• Level 1—quoted prices in active markets for identical securities
• Level 2—prices determined using other significant observable inputs (including quoted prices for similar securities, interest rates, prepayment speeds, credit risk and others)
• Level 3—prices determined using significant unobservable inputs when quoted prices or observable inputs are unavailable or less reliable (including management's own assumptions about the factors market participants would use in pricing an investment)
The inputs or methodologies used for valuing securities are not necessarily an indication of the risk associated with investing in those securities.
Examples of the types of securities in which the Fund would typically invest and how they are classified within this hierarchy are as follows. Typical Level 1 securities include exchange traded domestic equities, mutual funds whose NAVs are published each day and exchange traded foreign equities that are not statistically fair valued. Typical Level 2 securities include exchange traded foreign equities that are statistically fair valued and short-term investments valued at amortized cost. Additionally, securities fair valued by the Fund's valuation committee that rely on significant observable inputs are also included in Level 2. Typical Level 3 securities include any security fair valued by the Fund's Valuation Committee that relies on significant unobservable inputs.
Repurchase agreements
The Fund may engage in repurchase agreement transactions. The Fund, through its custodian, receives delivery of underlying securities collateralizing each repurchase agreement. The counterparty is required to maintain collateral that is at all times at least equal to the repurchase price including interest. In the event of default or bankruptcy by the other party to the agreement, realization and/or retention of the collateral may be subject to legal proceedings.
Foreign currency translations
Values of investments denominated in foreign currencies are converted into U.S. dollars using the New York spot market rate of exchange at the time of valuation. Purchases and sales of investments and dividend and interest income are translated into U.S. dollars using the spot market rate of exchange prevailing on the respective dates of such transactions. The gain or loss resulting from changes in foreign exchange rates is included with net realized and unrealized gain or loss from investments, as appropriate.
Securities lending
The Fund may lend securities up to one-third of the value of its total assets to certain approved brokers, dealers and other financial institutions to earn additional income. The Fund retains the benefits of owning the securities, including receipt of dividends or interest generated by the security. The Fund also receives a fee for the loan. The Fund has the ability to recall the loans at any time and could do so in order to vote proxies or to sell the loaned securities. Each loan is collateralized by cash that exceeded the value of the securities on loan. The market value of the loaned securities is determined daily at the close of business of the Fund and any additional required collateral is delivered to each Fund on the next business day. The Fund has elected to invest the cash collateral in the Dreyfus Government Cash Management Fund and the income earned is paid to the Fund, net of any fees remitted to Goldman Sachs Agency Lending as the lending agent and borrower rebates. The Fund's adviser, Columbia Wanger Asset Management, LLC (CWAM), does not retain any fees earned by the lending program. Generally, in the event of borrower default, the Fund has the right to use the collateral to offset any losses incurred. In the event the Fund is delayed or prevented from exercising its right to dispose of the collateral, there may be a potential loss to the Fund. Some of these losses may be indemnified by the lending agent. The Fund bears the risk of loss with respect to the investment of collateral.
The net lending income earned in 2010 by the Fund is included in the Statement of Operations.
Security transactions and investment income
Security transactions are accounted for on the trade date (date the order to buy or sell is executed) and dividend income is recorded on the ex-dividend date, except that certain dividends from foreign securities are recorded as soon as the information is available to the Fund. Interest income is recorded on the accrual basis and includes amortization of discounts on debt obligations when required for federal income tax purposes. Realized gains and losses from security transactions are recorded on an identified cost basis.
Awards, if any, from class action litigation related to securities owned may be recorded as a reduction of cost of those securities. If the applicable securities are no longer owned, the proceeds are recorded as realized gains.
Restricted securities
Restricted securities are securities that may only be resold upon registration under federal securities laws or in transactions exempt from registration. In some cases, the issuer of restricted securities has agreed to register such securities for resale at the issuer's expense either upon demand by the Fund or in connection with another
14
Wanger Select 2010 Annual Report
Notes to Financial Statements, continued
registered offering of the securities. Many restricted securities may be resold in the secondary market in transactions exempt from registration. Such restricted securities may be determined to be liquid under criteria established by the Board of Trustees.
Fund share valuation
Fund shares are sold and redeemed on a daily basis at net asset value. Net asset value per share is determined daily as of the close of trading on the New York Stock Exchange (the Exchange) on each day the Exchange is open for trading by dividing the total value of the Fund's investments and other assets, less liabilities, by the number of Fund shares outstanding.
Custody fees/Credits
Custody fees are reduced based on the Fund's cash balances maintained with the custodian. The amount is disclosed as a reduction of total expenses in the Statement of Operations.
Federal income taxes
It is the Fund's policy to comply with the provisions of the Internal Revenue Code available to regulated investment companies and, in the manner provided therein, distributes substantially all its taxable income, as well as any net realized gain on sales of investments and foreign currency transactions reportable for federal income tax purposes. Accordingly, the Fund paid no federal income taxes and no federal income tax provision was required.
Expenses
General expenses of the Trust are allocated to the Fund and the other series of the Trust based upon relative net assets or other expense allocation methodologies determined by the nature of the expense. Expenses directly attributable to the Fund are charged to the Fund.
Foreign capital gains taxes
Gains in certain countries may be subject to foreign taxes at the fund level, at rates ranging from 10%-15%. The Fund accrues for such foreign taxes on net realized and unrealized gains at the appropriate rate for each jurisdiction.
Distributions to shareholders
Distributions to shareholders are recorded on the ex-dividend date.
Indemnification
In the normal course of business, the Trust on behalf of the Fund enters into contracts that contain a variety of representations and warranties and that provide general indemnities. The Fund's maximum exposure under these arrangements is unknown, as this would involve future claims against the Fund. Also, under the Trust's organizational documents, the trustees and officers of the Trust are indemnified against certain liabilities that may arise out of their duties to the Trust. However based on experience, the Fund expects the risk of loss due to these warranties and indemnities to be remote.
3. Federal Tax Information
The timing and character of income and capital gain distributions are determined in accordance with income tax regulations, which may differ from GAAP. Reclassifications are made to the Fund's capital accounts for permanent tax differences to reflect income and gains available for distribution (or available capital loss carryforwards) under income tax regulations.
For the year ended December 31, 2010, permanent book and tax basis differences resulting primarily from differing treatments for foreign currency transactions and passive foreign investment company (PFIC) adjustments were identified and reclassified among the components of the Fund's net assets as follows:
Accumulated
Net Investment
Income | | Accumulated
Net Realized
Loss | | Paid-In Capital | |
| $ | 609,688 | | | $ | (609,688 | ) | | $ | — | | |
Net investment loss and net realized gains (losses), as disclosed on the Statement of Operations, and net assets were not affected by this reclassification.
The tax character of distributions paid during the years ended December 31, 2010 and December 31, 2009 were as follows:
| | | December 31, 2010 | | December 31, 2009 | |
| Distributions paid from: | |
| Ordinary Income* | | $ | 1,632,499 | | | $ | — | | |
* For tax purposes short-term capital gain distributions, if any, are considered ordinary income distributions.
As of December 31, 2010, the components of distributable earnings on a tax basis were as follows:
Undistributed
Ordinary
Income | | Undistributed
Long-Term
Capital Gains | | Net Unrealized
Appreciation* | |
| $ | 6,529,786 | | | $ | — | | | $ | 88,834,664 | | |
* The differences between book-basis and tax-basis net unrealized appreciation/depreciation are primarily due to deferral of losses from wash sales and passive foreign investment company (PFIC) adjustments.
The following capital loss carryforwards, determined as of December 31, 2010, may be available to reduce taxable income arising from future net realized gains on investments, if any, to the extent permitted by the Internal Revenue Code:
Year of
Expiration | | Capital Loss
Carryforwards | |
| | 2017 | | | $ | 23,440,437 | | |
Capital loss carryforwards that were utilized for the Fund during the year ended December 31, 2010 were $10,275,226.
Management is required to determine whether a tax position of the Fund is more likely than not to be sustained upon examination by the applicable taxing authority, including resolution of any related appeals or litigation processes, based on the technical merits of the position. The tax benefit to be recognized by the Fund is measured as the largest amount of benefit that is greater than fifty percent likely of being realized upon ultimate settlement. Management is not aware of any tax positions for which it is reasonably possible that the total amounts of unrecognized tax benefits will significantly change in the next twelve months. However, management's conclusions may be subject to review and adjustment at a later date based on factors including, but not limited to, new tax laws, regulations, and administrative interpretations (including relevant court decisions). The Funds' federal tax returns for the prior three fiscal years remain sub ject to examination by the Internal Revenue Service.
4. Transactions With Affiliates
CWAM is a wholly owned subsidiary of Columbia Management Investment Advisers, LLC (Columbia Management), which in turn is an indirect, wholly owned subsidiary of Ameriprise Financial, Inc. (Ameriprise Financial). CWAM furnishes continuing investment supervision to the Fund and is responsible for the overall management of the Fund's business affairs.
After the close of business on April 30, 2010, (the Closing), Ameriprise Financial acquired from Bank of America Corporation (BOA), a portion of the asset management business of Columbia Management Group, LLC, including 100% of CWAM. On May 27, 2010, the shareholders of the Fund approved a new investment advisory agreement with CWAM to provide advisory services to the Fund. There were no changes to the Fund's advisory fee rate under the new agreement.
15
Wanger Select 2010 Annual Report
Notes to Financial Statements, continued
CWAM receives a monthly advisory fee based on the Fund's average daily net assets at the following annual rates:
| Average Daily Net Assets | | Annual Fee Rate | |
| Up to $500 million | | | 0.80 | % | |
| $500 million and over | | | 0.78 | % | |
For the year ended December 31, 2010, the Fund's effective investment advisory fee rate was 0.80% of average daily net assets.
Through April 30, 2011, CWAM has contractually agreed to reimburse the Fund to the extent that ordinary operating expenses (exclusive of brokerage commissions, interest, taxes and extraordinary expenses, but inclusive of custodian charges relating to overdrafts, if any), after giving effect to any balance credits from the Fund's custodian, exceed an annual percentage of 1.35% of average daily net assets on an annualized basis. There was no reimbursement to the Fund for the year ended December 31, 2010.
CWAM provides administrative services and receives an administration fee from the Fund at the following annual rates.
Wanger Advisors Trust Aggregate
Average Daily Net Assets of the Trust | | Annual Fee Rate | |
| Up to $4 billion | | | 0.05 | % | |
| $4 billion to $6 billion | | | 0.04 | % | |
| $6 billion to $8 billion | | | 0.03 | % | |
| $8 billion and over | | | 0.02 | % | |
For the year ended December 31, 2010, the Fund's effective administration fee rate was 0.05% of average daily net assets. Prior to the Closing, CWAM had delegated to Columbia Management Advisors, LLC (CMA) an indirect, wholly owned subsidiary of BOA, responsibility to provide certain sub-administrative services to the Fund. Following the Closing, Columbia Management, a wholly owned subsidiary of Ameriprise Financial, acquired the assets of CMA and subsequently changed its name to Columbia Management, and thereafter continued providing certain sub-administrative services to the Fund.
Prior to the Closing, Columbia Management Distributors, Inc., a wholly owned subsidiary of BOA, served as the Fund's distributor and principal underwriter. In connection with the Closing, RiverSource Fund Distributors, Inc., a wholly owned subsidiary of Ameriprise Financial, became the distributor of the Fund and subsequently changed its name to Columbia Management Investment Distributors, Inc. (CMDI). There were no changes to the underwriting discount structure of the Fund or the service or distribution fee rates paid by the Fund as a result of the Closing.
Prior to the Closing, Columbia Management Services, Inc., an indirect, wholly owned subsidiary of BOA, provided shareholder services to the Fund and contracted with Boston Financial Data Services (BFDS) to serve as sub-transfer agent. In connection with the Closing, RiverSource Service Corporation, a wholly owned subsidiary of Ameriprise Financial, became the transfer agent of the Fund and subsequently changed its name to Columbia Management Investment Services Corp. (CMIS). The transfer agent fee rates paid by the Fund did not change as a result of the change in transfer agent. For its services, the Fund pays CMIS a monthly fee at the annual rate of $21.00 per open account. CMIS also receives reimbursement for certain out-of-pocket expenses. The arrangement with BFDS has been continued by CMIS.
Certain officers and trustees of the Trust are also officers of CWAM. The Trust makes no direct payments to its officers and trustees who are affiliated with CWAM.
The Board of Trustees has appointed a Chief Compliance Officer of the Trust in accordance with federal securities regulations. The Fund, along with other affiliated funds, pays its pro-rata share of the expenses associated with the Office of the Chief Compliance Officer. These expenses are disclosed separately as "Chief compliance officer expenses" in the Statement of Operations.
The Trust offers a deferred compensation plan for its independent trustees. Under that plan, a trustee may elect to defer all or a portion of his or her compensation. Amounts deferred are retained by the Trust and may represent an unfunded obligation of the Trust. The value of amounts deferred is determined by reference to the change in value of Class Z shares of one or more series of Columbia Acorn Trust or a money market fund as specified by the trustee. Benefits under the deferred compensation plan are payable when the trustee ceases to be a member of the Board of Trustees.
An affiliated person of the Fund may include any company in which the Fund owns five percent or more of its outstanding voting shares. On December 31, 2010, the Fund held five percent of more of the outstanding voting securities of one of more companies. Details of investments in those affiliated companies are presented in the Notes to the Statement of Investments on page 9.
During the year ended December 31, 2010, the Fund engaged in purchase and sales transactions with funds that have a common investment adviser (or affiliated investment advisers), common directors/trustees, and/or common officers. Those purchase and sale transactions complied with provisions of Rule 17a-7 under the Investment Company Act of 1940 and were $2,730,583 and $1,411,822, respectively.
5. Borrowing Arrangements
The Trust participates in a $150 million credit facility, along with another Trust managed by CWAM, which was entered into to facilitate portfolio liquidity. Under the facility, interest is charged to each participating fund based on its borrowings at a rate per annum equal to the higher of Federal Funds Rate or Overnight LIBOR plus 1.25%. In addition, a commitment fee of 0.15% per annum of the unutilized line of credit is accrued and apportioned among the participating funds based on their relative net assets. The commitment fee is included in "Other expenses" in the Statement of Operations. No amounts were borrowed by the Fund under this facility during the year ended December 31, 2010. The Trust enters into this line of credit for one year durations. The Trust has secured the line of credit for the entire year of 2011.
6. Fund Share Transactions
Proceeds and payments on Fund shares as shown in the Statement of Changes in Net Assets are in respect of the following numbers of shares:
| | | Year ended
December 31, 2010 | | Year ended
December 31, 2009 | |
| Shares sold | | | 1,613,837 | | | | 1,920,232 | | |
Shares issued in reinvestment
of dividend distributions | | | 74,306 | | | | — | | |
| Less shares redeemed | | | (1,485,474 | ) | | | (1,481,433 | ) | |
| Net increase in shares outstanding | | | 202,669 | | | | 438,799 | | |
7. Investment Transactions
The aggregate cost of purchases and proceeds from sales other than short-term obligations for the year ended December 31, 2010 were $112,267,802 and $83,122,418, respectively.
8. Information Regarding Pending and Settled Legal Proceedings
In June 2004, an action captioned John E. Gallus et al. v. American Express Financial Corp. and American Express Financial Advisors Inc. was filed in the United States District Court for the District of Arizona. The plaintiffs allege that they are investors in several American Express Company (now known as legacy RiverSource) mutual funds and they purport to bring the action derivatively on behalf of those funds under the Investment Company Act of 1940. The plaintiffs allege that fees allegedly paid to the defendants by the funds for investment advisory and administrative services are excessive. The plaintiffs seek remedies including restitution and rescission of investment advisory and distribution agreements. The plaintiffs voluntarily agreed to transfer this case to the United States District Court for the Distri ct of Minnesota (the District Court). In response to defendants' motion to dismiss the complaint, the District Court dismissed one of plaintiffs' four claims and granted plaintiffs limited discovery. Defendants moved for summary judgment in April 2007. Summary judgment was granted in the defendants' favor on July 9, 2007. The plaintiffs filed a
16
Wanger Select 2010 Annual Report
Notes to Financial Statements, continued
notice of appeal with the Eighth Circuit Court of Appeals (the Eighth Circuit) on August 8, 2007. On April 8, 2009, the Eighth Circuit reversed summary judgment and remanded to the District Court for further proceedings. On August 6, 2009, defendants filed a writ of certiorari with the U.S. Supreme Court (the Supreme Court), asking the Supreme Court to stay the District Court proceedings while the Supreme Court considers and rules in a case captioned Jones v. Harris Associates, which involves issues of law similar to those presented in the Gallus case. On March 30, 2010, the Supreme Court issued its ruling in Jones v. Harris Associates, and on April 5, 2010, the Supreme Court vacated the Eig hth Circuit's decision in the Gallus case and remanded the case to the Eighth Circuit for further consideration in light of the Supreme Court's decision in Jones v. Harris Associates. On June 4, 2010, the Eighth Circuit remanded the Gallus case to the District Court for further consideration in light of the Supreme Court's decision in Jones v. Harris Associates. On December 9, 2010, the District Court reinstated its July 9, 2007 summary judgment order in favor of the defendants. On January 10, 2011, plaintiffs filed a notice of appeal with the Eighth Circuit.
In December 2005, without admitting or denying the allegations, American Express Financial Corporation (AEFC, which is now known as Ameriprise Financial, Inc. (Ameriprise Financial)), entered into settlement agreements with the Securities and Exchange Commission (SEC) and Minnesota Department of Commerce (MDOC) related to market timing activities. As a result, AEFC was censured and ordered to cease and desist from committing or causing any violations of certain provisions of the Investment Advisers Act of 1940, the Investment Company Act of 1940, and various Minnesota laws. AEFC agreed to pay disgorgement of $10 million and civil money penalties of $7 million. AEFC also agreed to retain an independent distribution consultant to assist in developing a plan for distribution of all disgorgement and civil penalties ordered by the SEC in accordance with various undertakings detailed at http://www.sec.gov/litigation/admin/ia-2451.pdf. Ameriprise Financial and its affiliates have cooperated with the SEC and the MDOC in these legal proceedings, and have made regular reports to the RiverSource, Seligman and Threadneedle funds' Boards of Directors/Trustees.
Ameriprise Financial and certain of its affiliates have historically been involved in a number of legal, arbitration and regulatory proceedings, including routine litigation, class actions, and governmental actions, concerning matters arising in connection with the conduct of their business activities. Ameriprise Financial believes that the Funds are not currently the subject of, and that neither Ameriprise Financial nor any of its affiliates are the subject of, any pending legal, arbitration or regulatory proceedings that are likely to have a material adverse effect on the Funds or the ability of Ameriprise Financial or its affiliates to perform under their contracts with the Funds. Ameriprise Financial is required to make 10-Q, 10-K and, as necessary, 8-K filings with the SEC on legal and regulatory matters that relate to Ameriprise Financial and its affiliates. Copies of these filings may be obtained by accessing the SEC website at www.s ec.gov.
There can be no assurance that these matters, or the adverse publicity associated with them, will not result in increased fund redemptions, reduced sale of fund shares or other adverse consequences to the Funds. Further, although we believe proceedings are not likely to have a material adverse effect on the Funds or the ability of Ameriprise Financial or its affiliates to perform under their contracts with the Funds, these proceedings are subject to uncertainties and, as such, we are unable to estimate the possible loss or range of loss that may result. An adverse outcome in one or more of these proceedings could result in adverse judgments, settlements, fines, penalties or other relief that could have a material adverse effect on the consolidated financial condition or results of operations of Ameriprise Financial.
*****
CWAM, Columbia Acorn Trust (another mutual fund family advised by CWAM), and the trustees of Columbia Acorn Trust (collectively, the "Columbia defendants") were named as defendants in class and derivative complaints that were consolidated in a Multi-District Action (the MDL Action) in the federal district court of Maryland. These lawsuits contend that defendants permitted certain investors to market time their trades in certain Columbia Acorn Funds. The MDL Action is ongoing. However, all claims against the Trust and the Independent Trustees of the Trust have been dismissed. Columbia Acorn and CWAM are also defendants in a state court class action lawsuit that alleges, in summary, that the Trust and CWAM exposed shareholders of Columbia Acorn International to trading by market timers by allegedly: (a) failing to properly evaluate daily whether a significant event affecting the value of the Fund's securities had occurred after foreign market s had closed but before the calculation of the Fund's net asset value (NAV); (b) failing to implement the Fund's portfolio valuation and share pricing policies and procedures; and (c) failing to know and implement applicable rules and regulations concerning the calculation of NAV (the Fair Valuation Lawsuit). The United States Court of Appeals for the Seventh Circuit ruled that the plaintiffs' state law claims were preempted under federal law, resulting in the dismissal of plaintiffs' complaint. Plaintiffs appealed the Seventh Circuit's ruling to the United States Supreme Court. The Supreme Court reversed the Seventh Circuit's ruling on jurisdictional grounds and the case was remanded to the state court.
On March 21, 2005, a class action complaint was filed against the Trust and CWAM seeking to rescind the contingent deferred sales charge (CDSC) assessed upon redemption of Class B shares of the Columbia Acorn Funds (the CDSC Lawsuit). In addition to the rescission of sales charges, plaintiffs seek recovery of actual damages, attorneys' fees and costs. The case was transferred to the MDL Action in the federal district court of Maryland. On September 14, 2007, the plaintiffs and the Columbia defendants named in the MDL Action, including the Columbia family of funds, entered into a stipulation of settlement with respect to all Columbia-related claims in the MDL Action described above, including the CDSC and Fair Valuation Lawsuits.
On April 23, 2010, the parties of the MDL Action filed a motion seeking: (a) preliminary approval of the MDL settlements; (b) the conditional certification of the plaintiff class for purposes of settlement; (c) approval of the form and manner of giving notice to the plaintiff class of the proposed settlements; and (d) approval of the proposed schedule for various deadlines in connection with the final settlement hearing. The motion was presented to and approved by the court on May 7, 2010.
On October 21, 2010, the court held a final hearing regarding the MDL settlements and on October 25, 2010 issued a final judgment and related orders that: (a) approved the settlements as fair, reasonable and adequate, and in the best interests of members of both the plaintiff class and current shareholders of the Columbia funds, including the Columbia Acorn Funds; (b) dismissed with prejudice all complaints against the Columbia defendants; and (c) approved a plan of distribution for the amounts due to the plaintiff class as established in the settlements. The orders of settlement do not create any liability for the Columbia Acorn Funds.
CWAM believes that the lawsuits described in the four preceeding paragraphs are not likely to materially affect its ability to provide investment management services to the Funds.
17
Wanger Select 2010 Annual Report
Report of Independent Registered Public Accounting Firm
To the Board of Trustees and Shareholders of Wanger Select:
In our opinion, the accompanying statement of assets and liabilities, including the statement of investments, and the related statements of operations and of changes in net assets and the financial highlights present fairly, in all material respects, the financial position of Wanger Select (a series of the Wanger Advisers Trust, hereinafter referred to as the "Fund") at December 31, 2010, the results of its operations for the year then ended, the changes in its net assets for each of the two years in the period then ended and the financial highlights for each of the five years in the period then ended, in conformity with accounting principles generally accepted in the United States of America. These financial statements and financial highlights (hereafter referred to as "financial statements") are the responsibility of the Fund's management; our responsibility is to express an opinion on these financial statements based on our audits. We c onducted our audits of these financial statements in accordance with the standards of the Public Company Accounting Oversight Board (United States). Those standards require that we plan and perform the audit to obtain reasonable assurance about whether the financial statements are free of material misstatement. An audit includes examining, on a test basis, evidence supporting the amounts and disclosures in the financial statements, assessing the accounting principles used and significant estimates made by management, and evaluating the overall financial statement presentation. We believe that our audits, which included confirmation of securities at December 31, 2010 by correspondence with the custodian and brokers, provide a reasonable basis for our opinion.
PricewaterhouseCoopers LLP
Chicago, Illinois
February 15, 2011
18
Wanger Select 2010 Annual Report
Federal Income Tax Information (Unaudited)
58.26% of the ordinary income distributed by the Fund, for the year ended December 31, 2010, qualified for the corporate dividends received deduction.
19
Wanger Select 2010 Annual Report
Board of Trustees and Management of Wanger Advisors Trust
Each trustee may serve a term of unlimited duration. The Trust's By-laws generally require that a trustee retire at the end of the calendar year in which the trustee attains the age of 75 years. The trustees appoint their own successors, provided that at least two-thirds of the trustees, after such appointment, have been elected by shareholders. Shareholders may remove a trustee, with or without cause, upon the vote of two-thirds of the Trust's outstanding shares at any meeting called for that purpose. A trustee may be removed, with or without cause, upon the vote of a majority of the trustees. The names of the trustees and officers of the Trust, the date each was first elected or appointed to office, their principal business occupations during at least the last five years, number of portfolios in the fund complex they oversee, and other directorships they hold, are shown below. Each trustee serves in such capacity for each of the six serie s of Columbia Acorn Trust and for each of the four series of Wanger Advisors Trust.
The address for the trustees and officers of the Trust is Columbia Wanger Asset Management, LLC, 227 West Monroe Street, Suite 3000, Chicago, Illinois 60606. The Funds' Statement of Additional Information includes additional information about the Funds' trustees and officers. You may obtain a free copy of the Statement of Additional Information by writing or calling toll-free:
Columbia Wanger Asset Management, LLC
Shareholder Services Group
227 W. Monroe, Suite 3000
Chicago IL 60606
1-800-922-6769
Name, Position(s) with
Wanger Advisors Trust
and Age at
December 31, 2010 | | Year First
Elected or
Appointed
to Office* | | Principal Occupation(s) during
Past Five Years | | Number of
Portfolios in
Fund Complex
Overseen by
Trustee/Officer | | Other
Directorships
in addition to
Wanger Advisors Trust | |
| Trustees who are not interested persons of Wanger Advisors Trust: | | | | | | | |
|
Laura M. Born, 45,
Trustee | | | 2007 | | | Adjunct Assistant Professor of Finance, University of Chicago Booth School of Business; formerly, Managing Director – Investment Banking, JP Morgan Chase & Co. (broker/dealer) 2002-2007; prior thereto, associated with JP Morgan as an investment professional since 1991. | | | 10 | | | Columbia Acorn Trust | |
|
Michelle L. Collins, 50,
Trustee | | | 2008 | | | President, Cambium LLC (financial advisory firm) since 2007; Advisory Board Member, Svoboda Capital Partners LLC (private equity firm) since 2007; Managing Director Svoboda Capital Partners LLC, 1998-2006. | | | 10 | | | Columbia Acorn Trust; Bucyrus International, Inc. (mining equipment manufacturer); Molex, Inc. (electronics components manufacturer); CDW Corporation (electronics components manufacturer) (until October 2007). | |
|
Maureen M. Culhane, 62,
Trustee | | | 2007 | | | Retired. Formerly, Vice President, Goldman Sachs Asset Management, L.P. (investment adviser), 2005-2007, and Vice President (Consultant) — Strategic Relationship Management, Goldman Sachs & Co., 1999-2005. | | | 10 | | | Columbia Acorn Trust | |
|
Margaret M. Eisen, 57,
Trustee | | | 2002 | | | Chief Investment Officer, EAM International LLC (corporate finance and asset management) since 2003; Managing Director, CFA Institute, 2005-2008. | | | 10 | | | Columbia Acorn Trust; Antigenics, Inc. (biotechnology and pharmaceuticals) (until June 2009). | |
|
John C. Heaton, 51,
Trustee | | | 2010 | | | Joseph L. Gidwitz Professor of Finance, University of Chicago Booth School of Business; financial consultant. | | | | Columbia Acorn Trust | |
|
Steven N. Kaplan, 51,
Trustee and Vice Chairman of the Board | | | 1999 | | | Neubauer Family Professor of Entrepreneurship and Finance, University of Chicago Booth School of Business. | | | 10 | | | Columbia Acorn Trust; Accretive Health, Inc. (healthcare management services provider); Morningstar, Inc. (provider of independent investment research). | |
|
20
Wanger Select 2010 Annual Report
Board of Trustees and Management of Wanger Advisors Trust
Name, Position(s) with
Wanger Advisors Trust
and Age at
December 31, 2010 | | Year First
Elected or
Appointed
to Office* | | Principal Occupation(s) during
Past Five Years | | Number of
Portfolios in
Fund Complex
Overseen by
Trustee/Officer | | Other
Directorships
in addition to
Wanger Advisors Trust | |
| Trustees who are not interested persons of Wanger Advisors Trust: (continued) | | | | | | | |
|
David C. Kleinman, 75,
Trustee(1) | | | 1972 | | | Adjunct Professor of Strategic Management, University of Chicago Booth School of Business; business consultant. | | | 10 | | | Columbia Acorn Trust; Sonic Foundry, Inc. (rich media systems and software). | |
|
Allan B. Muchin, 74,
Trustee | | | 1998 | | | Chairman Emeritus, Katten Muchin Rosenman LLP (law firm). | | | 10 | | | Columbia Acorn Trust | |
|
David B. Small, 54,
Trustee | | | 2010 | | | Managing Director, Chairman of Investment Committee, Grosvenor Capital Management, L.P. (investment adviser). | | | 10 | | | Columbia Acorn Trust | |
|
James A. Star, 49,
Trustee and Chairman of the Board | | | 2006 | | | President, Longview Asset Management LLC (investment adviser) since 2003; associated with Longview or its predecessors and affiliates since 1994. | | | 10 | | | Columbia Acorn Trust | |
|
| Trustees who are interested persons of Wanger Advisors Trust: | | | | | | | |
|
Charles P. McQuaid, 57,
Trustee and President (2) | | | 1992 | | | President and Chief Investment Officer, CWAM or its predecessors, since October 2003; associated with CWAM or its predecessors as an investment professional since 1978. | | | 10 | | | Columbia Acorn Trust | |
|
David J. Rudis, 57,
Trustee (3) | | | 2010 | | | National Checking and Debit Executive, and Illinois President, Bank of America, 2007 to 2009; President, Consumer Banking Group, LaSalle National Bank, 2004 to 2007. | | | 10 | | | Columbia Acorn Trust | |
|
| Trustee Emeritus | | | | | | | |
|
Ralph Wanger, 76,
Trustee Emeritus (4) | | | 1970 | | | Founder, CWAM. Formerly, President, Chief Investment Officer and portfolio manager, CWAM or its predecessors, July 1992 – September 2003; Director, Wanger Investment Company PLC; Consultant, CWAM or its predecessors, September 2003 – September 2005. | | | 10 | | | Columbia Acorn Trust | |
|
| Officers of Wanger Advisors Trust: | | | | | | | |
|
Ben Andrews, 44,
Vice President | | | 2004 | | | Portfolio manager and analyst, CWAM or its predecessors, since 1998; Vice President, Columbia Acorn Trust and Wanger Advisors Trust since 2004. | | | 10 | | | None | |
|
Michael G. Clarke, 41,
Assistant Treasurer | | | 2004 | | | Vice President, Columbia Management Investment Advisers, LLC since May 2010; Managing Director of Fund Administration, Columbia Management Advisors, LLC, from September 2004 to April 2010; senior officer of Columbia Family of Funds and affiliated funds since 2002. | | | 10 | | | None | |
|
Joseph F. DiMaria, 43,
Assistant Treasurer | | | 2010 | | | Vice President, Mutual Fund Administration, Columbia Management Investment Advisers, LLC, since May 2010; Director of Fund Administration, Columbia Management Advisors, LLC from January 2006 to April 2010; Head of Tax/Compliance and Assistant Treasurer, Columbia Management Advisors, LLC, from November 2004 to December 2005. | | | 10 | | | None | |
|
P. Zachary Egan, 42,
Vice President | | | 2003 | | | Director of International Research, CWAM or its predecessors, since December 2004; Vice President, Columbia Acorn Trust since 2003 and Wanger Advisors Trust since 2007; portfolio manager and analyst, CWAM or its predecessors, since 1999. | | | 10 | | | None | |
|
John Kunka, 40,
Assistant Treasurer | | | 2006 | | | Director of Accounting and Operations, CWAM or its predecessors, since May 2006; Manager of Mutual Fund Operations, Calamos Advisors, Inc. (investment advisor), September 2005 – May 2006; prior thereto, Manager of Mutual Fund Administration, Van Kampen Investments. | | | 10 | | | None | |
|
21
Wanger Select 2010 Annual Report
Board of Trustees and Management of Wanger Advisors Trust
Name, Position(s) with
Wanger Advisors Trust
and Age at
December 31, 2010 | | Year First
Elected or
Appointed
to Office* | | Principal Occupation(s) during
Past Five Years | | Number of
Portfolios in
Fund Complex
Overseen by
Trustee/Officer | | Other
Directorships
in addition to
Wanger Advisors Trust | |
| Officers of Columbia Acorn Trust: (continued) | | | | | | | |
|
Joseph C. LaPalm, 41,
Vice President | | | 2006 | | | Chief Compliance Officer, CWAM since 2005; prior thereto, compliance officer, William Blair & Company (investment firm). | | | 10 | | | None | |
|
Bruce H. Lauer, 53,
Vice President, Secretary and Treasurer | | | 1995 | | | Chief Operating Officer, CWAM or its predecessors, since April 2000; Vice President, Secretary and Treasurer, Columbia Acorn Trust and Wanger Advisors Trust, since 1995; Director, Wanger Investment Company PLC; formerly, Director, Banc of America Capital Management (Ireland) Ltd.; and formerly, Director, Bank of America Global Liquidity Funds, PLC. | | | 10 | | | None | |
|
Louis J. Mendes III, 46,
Vice President | | | 2003 | | | Portfolio manager and analyst, CWAM or its predecessors, since 2001; Vice President, Columbia Acorn Trust since 2003 and Wanger Advisors Trust since 2005. | | | 10 | | | None | |
|
Robert A. Mohn, 49,
Vice President | | | 1997 | | | Director of Domestic Research, CWAM or its predecessors, since March 2004; Vice President, Columbia Acorn Trust and Wanger Advisors Trust, since 1997; portfolio manager and analyst, CWAM or its predecessors, since August 1992. | | | 10 | | | None | |
|
Christopher J. Olson, 46,
Vice President | | | 2001 | | | Portfolio manager and analyst, CWAM or its predecessors, since January 2001; Vice President, Columbia Acorn Trust and Wanger Advisors Trust, since 2001. | | | 10 | | | None | |
|
Scott R. Plummer, 51,
Assistant Secretary | | | 2010 | | | Chief Legal Officer and Assistant Secretary, Columbia Management Investment Advisers, LLC since June 2005; Vice President and Lead Chief Counsel — Asset Management, Ameriprise Financial since May 2010 (previously Vice President and Chief Counsel — Asset Management, from 2005 to April 2010, and Vice President — Asset Management Compliance from 2004 to 2005); Vice President, Chief Counsel and Assistant Secretary, Columbia Management Investment Distributors, Inc. since 2008; Vice President, General Counsel and Secretary, Ameriprise Certificate Company since 2005; Chief Counsel, RiverSource Distributors, Inc. from 2006 to 2010; Vice President, General Counsel and Secretary, RiverSource Funds, since December 2006; Senior Vice President, Secretary and Chief Legal Officer, Columbia Family of Funds since May 2010. | | | 10 | | | None | |
|
Christopher O. Petersen, 41,
Assistant Secretary | | | 2010 | | | Vice President and Chief Counsel, Ameriprise Financial since January 2010 (formerly Vice President and Group Counsel or Counsel from April 2004 to January 2010); Assistant Secretary of RiverSource Funds since January 2007. | | | 10 | | | None | |
|
Robert P. Scales, 58,
Chief Compliance Officer, Chief Legal Officer, Senior Vice President and General Counsel | | | 2004 | | | Chief Compliance Officer, Chief Legal Officer, Senior Vice President and General Counsel, Columbia Acorn Trust and Wanger Advisors Trust, since 2004. | | | 10 | | | None | |
|
Linda Roth-Wiszowaty, 41,
Assistant Secretary | | | 2006 | | | Business support analyst, CWAM, since April 2007; prior thereto executive administrator, CWAM or its predecessors, and executive assistant to the Chief Operating Officer of CWAM or its predecessors. | | | 10 | | | None | |
|
* Dates prior to April 1992 correspond to the date of first election or appointment as a trustee or officers of The Acorn Fund, Inc., the predecessor trust to Columbia Acorn Trust.
(1) Mr. Kleinman retired at the end of calendar year 2010.
(2) Mr. McQuaid is an "interested person" of Wanger Advisors Trust and of CWAM, as defined in the Investment Company Act of 1940 because he is an officer of the Trust and of CWAM.
(3) Mr. Rudis commenced service as a Trustee on January 1, 2011. Mr. Rudis is an "interested person" of Wanger Advisors Trust, as defined in the New York Attorney General's Assurance of Discontinuance ("Order") entered into in February 2005 by Columbia Management Advisors, LLC (an indirect subsidiary of Bank of America Corporate ("BOA")) and Columbia Management Distributors, Inc. (an indirect subsidiary of BOA), because of his former employment as a BOA executive.
(4) As permitted under the Wanger Advisors Trust's By-Laws, Mr. Wanger serves as a non-voting Trustee Emeritus of the Trust.
22
Wanger Select 2010 Annual Report
This page intentionally left blank.
23
Wanger Select 2010 Annual Report
This page intentionally left blank.
24
Wanger Select 2010 Annual Report

Columbia Wanger Funds
Transfer Agent,
Dividend Disbursing Agent*
Columbia Management Investment
Services Corp.
P.O. Box 8081
Boston, Massachusetts
02266-8081
Distributor*
Columbia Management Investment
Distributors, Inc.
One Financial Center
Boston, Massachusetts
02111-2621
Investment Adviser
Columbia Wanger Asset Management, LLC
227 West Monroe Street, Suite 3000
Chicago, Illinois 60606
1-888-4-WANGER
(1-888-492-6437)
Legal Counsel to the Funds
Perkins Coie, LLP
Washington, DC
Legal Counsel to the Independent Trustees
Drinker Biddle & Reath LLP
Philadelphia, Pennsylvania
Independent Registered Public
Accounting Firm
PricewaterhouseCoopers LLP
Chicago, Illinois
* As of May 1, 2010
This report, including the schedules of investments and financial statements, is submitted for the general information of the shareholders of the Wanger Advisors Trust.
A description of the Fund's proxy voting policies and procedures and a copy of the Fund's voting record for the most recent 12-month period ended June 30 are available (i) on the Securities and Exchange Commission's website at www.sec.gov, and (ii) without charge, upon request, by calling 888-492-6437.
The Fund files a complete schedule of portfolio holdings with the SEC for the first and third quarters of each fiscal year on Form N-Q. The Fund's Form N-Q is available on the SEC's website at www.sec.gov and may be reviewed and copied at the SEC's Public Reference Room in Washington, D.C. Information on the operation of the Pubic Reference Room may be obtained by calling 800-SEC-0330. The Fund's complete portfolio holdings are disclosed at www.columbiafunds.com approximately 30 days after each month-end.
25
Columbia Wanger Funds
© 2011 Columbia Management Investment Advisers, LLC. All rights reserved.
C-1461 A (2/11) 113557
Wanger USA
2010 Annual Report

Not FDIC insured • No bank guarantee • May lose value

Wanger USA
2010 Annual Report
Table of Contents
| 1 | | | Understanding Your Expenses | |
|
| 2 | | | The Keys to Prosperity | |
|
| 4 | | | Performance Review | |
|
| 6 | | | Statement of Investments | |
|
| 15 | | | Statement of Assets and Liabilities | |
|
| 15 | | | Statement of Operations | |
|
| 16 | | | Statement of Changes in Net Assets | |
|
| 17 | | | Financial Highlights | |
|
| 18 | | | Notes to Financial Statements | |
|
| 22 | | | Report of Independent Registered Public Accounting Firm | |
|
| 23 | | | Federal Income Tax Information | |
|
| 24 | | | Board of Trustees and Management of Wanger Advisors Trust | |
|
Columbia Wanger Asset Management, LLC (CWAM) is one of the leading global small- and mid-cap equity managers in the United States with 40 years of small- and mid-cap investment experience. As of December 31, 2010, CWAM managed $33.9 billion in assets, and is the investment adviser to Wanger USA, Wanger International, Wanger Select and Wanger International Select (together, the Columbia Wanger Funds) and the Columbia Acorn Family of Funds.
Investors should consider the investment objectives, risks, charges and expenses of a mutual fund carefully before investing. For a free prospectus, which contains this and other important information about the Fund, contact your financial adviser or insurance company or contact 1-888-4-WANGER. Read the prospectus carefully before investing.
An important note: Columbia Wanger Funds are sold only to certain life insurance companies in connection with certain variable annuity contracts, variable life insurance policies and eligible qualified retirement plans.
The views expressed in "The Keys to Prosperity" and in the Performance Review reflect the current views of the respective authors. These views are not guarantees of future performance and involve certain risks, uncertainties and assumptions that are difficult to predict so actual outcomes and results may differ significantly from the views expressed. These views are subject to change at any time based upon economic, market or other conditions and the respective parties disclaim any responsibility to update such views. These views may not be relied on as investment advice and, because investment decisions for a Columbia Wanger Fund are based on numerous factors, may not be relied on as an indication of trading intent on behalf of any particular Columbia Wanger Fund. References to specific company securities should not be construed as a recommendation or investment advice.
Wanger USA 2010 Annual Report
Understanding Your Expenses
As a Fund shareholder, you incur three types of costs. There are transaction costs, which generally include sales charges on purchases and may include redemption or exchange fees. There are also ongoing costs, which generally include investment advisory fees and other Fund expenses. Lastly, there may be additional fees or charges imposed by the insurance company that sponsors your variable annuity product. The information on this page is intended to help you understand your ongoing costs of investing in the Fund and to compare these costs with the ongoing costs of investing in other mutual funds.
Analyzing your Fund's expenses
To illustrate these ongoing costs, we have provided an example and calculated the expenses paid by investors in the Fund during the period. The information in the following table is based on an initial, hypothetical investment of $1,000, which is invested at the beginning of the period and held for the entire period. Expense information is calculated two ways and each method provides you with different results. The amount listed in the "Actual" column is calculated using actual operating expenses and total return for the Fund. The amount listed in the "Hypothetical" column assumes that the return each year is 5% before expenses and then applies the Fund's actual expense ratio for the period to the hypothetical return. You should not use the hypothetical account values and expenses to estimate either your actual account balance at the end of the period or the expenses you paid during the period. See "Compare with other funds" for details on using the hypothetical data.
Estimating your actual expenses
To estimate the expenses that you actually paid over the period, first you will need your account balance at the end of the period.
1. Divide your ending account balance by $1,000. For example, if an account balance was $8,600 at the end of the period, the result would be 8.6.
2. In the section of the table below titled "Expenses paid during the period," you will find a dollar amount in the column labeled "Actual." Multiply this amount by the result from step 1. Your answer is an estimate of the expenses you paid on your account during the period.
July 1, 2010 – December 31, 2010
| | | Account value at the
beginning of the period ($) | | Account value at the
end of the period ($) | | Expenses paid during
the period ($) | | Fund's annualized
expense ratio (%)* | |
| | | Actual | | Hypothetical | | Actual | | Hypothetical | | Actual | | Hypothetical | | Actual | |
| Wanger USA | | | 1,000.00 | | | | 1,000.00 | | | | 1,315.00 | | | | 1,020.27 | | | | 5.72 | | | | 4.99 | | | | 0.98 | | |
*Expenses paid during the period are equal to the Fund's annualized expense ratio, multiplied by the average account value over the period, then multiplied by the number of days in the Fund's most recent fiscal half-year and divided by 365.
Had the investment adviser not waived fees or reimbursed a portion of expenses, account value at the end of the period would have been reduced.
It is important to note that the expense amounts shown in the table are meant to highlight only ongoing costs of investing in the Fund. Expenses paid during the period do not include any insurance charges imposed by your insurance company's separate account. The hypothetical example provided is useful in comparing ongoing costs only and will not help you determine the relative total costs of owning different funds whose shareholders may incur transaction costs.
Compare with other funds
Since all mutual funds are required to include the same hypothetical calculations about expenses in shareholder reports, you can use this information to compare the ongoing cost of investing in the Fund with other funds. To do so, compare the 5% hypothetical example with the 5% hypothetical examples of other funds. As you compare hypothetical examples of other funds, it is important to note that hypothetical examples are meant to highlight the ongoing cost of investing in a fund and do not reflect any transaction costs, such as sales charges, redemption fees or exchange fees that may be incurred by shareholders of other funds. Expenses paid during the period do not include any insurance charges imposed by your insurance company's separate accounts.
1
Wanger USA 2010 Annual Report

The Keys to Prosperity
In 1651, Thomas Hobbes described human life as "poor, nasty, brutish and short." Today, 360 years later, humanity has achieved record levels of prosperity, safety and longevity. The United Nations estimates that poverty was reduced more in the last 50 years than the previous 500.1 In the developing world, life expectancy rose from 44 years to 64 years from 1950 to 1999, while in the developed world, life expectancy rose from 66 years to 78 years.2
Hobbes's perspective was accurate for his time. There was very little growth in worldwide per capita GDP until about 1820; income in Europe had dropped for centuries following the decline and collapse of the Roman Empire.3 England and much of Europe were caught in a Malthusian trap, with population gyrating up and down largely due to plagues, famines and wars. But sometime around 1820, economic growth accelerated, and per capita GDP growth has averaged over 2% yearly since then, compounding into excellent gains in living standards.4 Why?
Four Conditions for Growth
William Bernstein's The Birth of Plenty, How Prosperity in the Modern World was Created is a fascinating history of worldwide economic circumstances. He discusses reasons for the successes and failures of many empires and countries. Bernstein believes that four institutional conditions are necessary for sustained growth: property rights and civil liberties, scientific rationalism, efficient capital markets, and fast and cheap transportation and communications. He notes that these four factors existed temporarily in sixteenth century Holland, then firmly in the English speaking countries, and in the last 50 years, increasingly over much of the world.5
Physical and intellectual property rights plus civil liberties create incentives and intellectual freedom to work hard, innovate and create wealth. In empires, totalitarian states and feudalistic societies, incentives to produce beyond immediate needs are nil, because governments or lords tend to impose confiscatory taxes and arbitrarily seize property. Bernstein believes that Rome fell, in part, due to excessive taxation on farmers. He also thinks that an independent judiciary is necessary to enforce property rights and civil liberties.
Scientific rationalism is needed for technological progress and innovation. Throughout history, various regimes run by church and state ossified due to the rejection of scientific observations in favor of dogma or preconceived beliefs. During medieval times, for example, astronomers who concluded the earth revolved around the sun were tortured. Bernstein cites the trial of Galileo as a turning point toward scientific rationalism. Early inventors then tended to be tinkerers rather than scientists, but science became increasingly important. For example, by the nineteenth century the steel industry had initiated the use of modern science laboratories staffed by full-time researchers.6
Efficient capital markets enable entrepreneurs and enterprises to raise capital at reasonable costs. I remember Jesse Jackson citing a lack of capital as a cause for inner city poverty: "Capitalism without capital is just plain ism."7 Bernstein notes that entrepreneurs once had huge downside risk from failures, namely debtors prisons in recent centuries and enslavement by creditors in ancient times. The creation of limited liability corporations during the nineteenth century in Britain and the United States was a breakthrough in reducing downside risks for capitalists.
Fast and cheap transportation and communication are also needed for prosperity. Bernstein explains that before railroads and the telegraph, transportation and communication were horribly expensive and slow. Rarely could bulk goods be transported over land more than 20 miles a day, and theft was rampant. Local crop failures often caused starvation. Mass markets did not exist. The reach of rail and telegraph grew incredibly rapidly during their first decades, spurring economic growth.
Bernstein provides plenty of case studies of regimes and countries that stagnated or failed due to the lack of one or more conditions, ranging from ancient societies and Japan under the samurai to Communist countries of the twentieth century. He states, "Institutions, not the bounty of nature or freedom from imperialist domination, separate the winners from the losers in the global economy."8
Trade Drives Prosperity
Matt Ridley's The Rational Optimist, How Prosperity Evolves adds substantial perspective to Bernstein's work and provides comforting thoughts about the future. Though Ridley does not mention Bernstein by name, it is clear that he agrees with Bernstein's basic contentions. Ridley sees property rights as the primary key to prosperity. He quotes a study by MIT economist Daron Acemoglu, which compared measures of property rights to economic growth across countries and determined that three-quarters of the variation of economic growth is explained by property rights.9 Ridley adds, "In a sample of 127 countries, the sixty-three with higher economic freedom had more than four times the inco me per capita and twice the growth rate of the countries that did not."10
Ridley's emphasis is on trade, which he believes allows increasing specialization, expertise, productivity and innovation. Humans seem to be hard-wired for trade. Archaeological evidence indicates that some 100,000 years ago humans began to barter.11 People traded things and also absorbed ideas. Human intelligence became collective and cumulative. Ridley states that, more recently, the history of the modern world is a history of ideas meeting, mixing, mating and mutating.12 Innovation results from an exchange of ideas. I think of the iPhone. Steve Jobs utilizes technologies and resources developed over centuries and components originated in many countries to make an incredibly inn ovative and useful device.
Ridley notes that societies that halted trade regressed. After ocean levels rose 10,000 years ago and cut off Tasmania from Australia, people there gradually lost the ability to fish and make tools out of bones. European mariners discovered
2
Wanger USA 2010 Annual Report
Tasmanians wearing nothing but wallaby pelts and seal-fat grease.13 As another example of a closed-off society, Ridley writes, "China went from a state of economic and technological exuberance in around AD 1000 to one of dense population, agrarian backwardness and desperate poverty in 1950;" per capita income there was about flat in those 950 years.14
Ridley takes a libertarian view, highly skeptical of government. He states, "...governments generally tend to be good things at first and bad things the longer they last. First they improve society's ability to flourish by providing central services and removing impediments to trade and specialization... But...governments gradually employ more and more ambitious elites who... give themselves more and more rules to enforce, until they kill the goose that lays the golden eggs. ... Because it is a monopoly, government brings inefficiency and stagnation to most things it runs..."15
Ridley asserts that African governments have largely caused economic problems in Africa. He writes that famines in Darfur and Zimbabwe were the result of government policies. Setting up a company in Tanzania takes 379 days and $5,500, a huge sum there. Botswana has done substantially better, growing per capita GDP nearly 8% annually since its independence in 1966. That growth exceeded China's, and is largely due to secure property rights, Ridley says. Ridley is optimistic for much of Africa, however. Cell phones are spreading rapidly, providing both communication and micro-finance (two of Bernstein's conditions for prosperity). Ridley cites wonderful examples of products and labor reaching optimal markets and payments being made over cell phones.16
Ridley has comforting thoughts about the future, debunking naysayers. He notes that (oddly enough) over time humans have temporarily exhausted or driven to extinction renewable resources like forests and certain animal species, while non-renewable resources have lasted much longer than many expected. In 1865, an economist said Britain's coal was running out, and as early as 1914 the U.S. Bureau of Mines wrote that American oil reserves would last 10 years.17
Ridley believes supplies of oil, coal and gas "will last decades, perhaps centuries, and people will find alternatives long before they run out."18 He states that prices of conventional fuels need to rise and prices of alternatives need to fall, and both will occur as conventional supplies run down and efficiencies of alternatives rise. Ridley notes that wind, solar and biomass alternatives envelop enormous quantities of land. He denounces organic farming, noting that if farm yields fell back to 1961 levels, 82% of the land area of the earth would be needed for farming, up from 38%. "The Dark Ages were a massive experiment in back-to-the-land hippy lifestyle (without the trust fund)," he says.19
Ridley largely dismisses climate change fears. The scenario that calls for significant climate change by the year 2100 is a scenario of dramatic economic growth. He believes the world, and especially developing countries, will be much, much richer and better able to adapt to and mitigate climate change. In the meantime, carbon intensity20 of the worldwide economy is rapidly dropping, as wood, dung and coal become relatively less important and natural gas and nuclear power gain share, in an environment of substantially more efficient lighting, heating, transportation and manufacturing.
While some of Ridley's arguments seem a bit over the top, I think they generally appear coherent and largely believable. As to the climate change issue, I advocate taking reasonable steps to mitigate global warming. Most of my family's road miles are in a hybrid vehicle and both my home and Columbia Wanger Asset Management have adopted compact florescent lighting. Several years ago we calculated that replacing over 100 incandescent bulbs at the office saved enough electricity to power three average-sized homes.
I agree that prosperity is driven by the factors named by Bernstein and Ridley and, though there are imbalances in world economics, I think things will be okay. The Great Recession has ended, growth has resumed and the keys to prosperity remain in place. Many parts of the developing world are booming and we have invested accordingly.


Charles P. McQuaid
President and Chief Investment Officer
Columbia Wanger Asset Management, LLC
The information and data provided in this analysis are derived from sources that we deem to be reliable and accurate. These views are not guarantees of future performance and involve certain risks, uncertainties and assumptions that are difficult to predict so actual outcomes and results may differ significantly from the views expressed. The views/opinions expressed in this essay are those of the author and not of the Wanger Advisors Trust Board, are subject to change at any time based upon economic, market or other conditions, may differ from views expressed by other Columbia Management associates and the respective parties disclaim any responsibility to update such views. These views may not be relied on as investment advice and, because investment decisions for a Columbia Wanger Fund are based on numerous factors, may not be relied on as an indication of trading intent on behalf of any particular Columbia Wanger Fund.
The information included on Pages 2 and 3 of this report is unaudited.
1 Ridley, Matt, The Rational Optimist, How Prosperity Evolves, (New York, New York, HarperCollins 2010), p. 15.
2 Bernstein, William J., The Birth of Plenty, How the Prosperity of the Modern World was Created, (New York, New York, McGraw-Hill 2004), p. 10.
3 Ibid, p. 3.
4 Ibid, p. 12, 23.
5 Ibid, p. 15-17.
6 Ibid, p. 123.
7 Rev. Jesse Jackson quoted in an article that appeared in Ebony magazine, August 1967, titled "Apostles of Economics," p. 84.
8 Bernstein, William J., op. cit, p. 293.
9 Ridley, Matt, op. cit, p. 321.
10 Ibid, p. 117.
11 Ibid, p. 350.
12 Ibid, p. 272.
13 Ibid, p. 78.
14 Ibid, p. 180.
15 Ibid, p. 182.
16 Ibid, p. 320-326.
17 Ibid, p. 237.
18 Ibid, p. 238.
19 Ibid, p. 144, 175.
20 Carbon intensity is defined as the amount of CO2 produced divided by worldwide GDP.
3
Wanger USA 2010 Annual Report

Performance Review Wanger USA

Robert A. Mohn
Portfolio Manager
Performance data shown represents past performance and is not a guarantee of future results. The investment return and principal value will fluctuate so that shares, when redeemed, may be worth more or less than the original cost. Current performance may be lower or higher than the performance data shown. For daily and most recent month-end performance updates, please call 1-888-4-WANGER.
Small-cap stocks were very strong in 2010 and Wanger USA ended the year up 23.35%. This compares to a 26.85% gain for the Fund's primary benchmark, the Russell 2000 Index. The Fund's return relative to its benchmark was hurt by poor performance of some of its positions in women's apparel stocks and small-cap semiconductor names, as well as the Fund's overweight position in the lagging telecom sector.
Several stocks in the retail, technology and industrial sectors were among the Fund's winners for the year. lululemon athletica, a premium active apparel retailer, enjoyed blistering sales growth of 56% over the prior year, driving the stock up 128% in Wanger USA for the year. Teen apparel retailer Abercrombie & Fitch grew same-store sales by 15% in December, outpacing competitors, most of whom posted negative year-over-year sales for this important retail month. The stock had an annual gain of 70%.
Technology winners included Atmel, a leader in touchscreen microcontrollers, radio frequency and memory semiconductors. Its business has benefited from surging sales of smart phones and tablet computers and its stock gained 131% for the Fund during the year. Finisar provides optical sub-systems and components for communications networks. Its stock rose 159% in Wanger USA for the year as the company benefited from a surge in demand for data transmission and storage. Informatica, a data integration software provider that helps companies manage their disparate data streams, has also enjoyed strong revenue growth and gained 71% for the Fund during the year.
Two niche industrial companies rounded out the list of top contributors in 2010. Ametek, a manufacturer of aerospace and industrial instruments, gained 54% for the Fund. Nordson, a maker of dispensing systems for adhesives and coatings, had a 53% gain for the Fund during the year. Both companies have benefited from strong revenue growth and productivity improvements through wise expense control.
Outside these winning sectors, FMC Technologies, the largest position in the Fund at the end of 2010, rose 54% during the annual period. Order flow at this oil and gas wellhead manufacturer climbed dramatically, nearly reaching pre-recession peaks.
Laggards for the annual period included ITT Educational Services, a provider of for-profit, post-secondary degree education. Down 36% in the Fund, this stock suffered as new regulatory requirements dogged the for-profit education sector, leading to declines in new enrollment. Credit card processor Global Payments fell 14% during the annual period as a pricing war in its Canadian credit and debit processing business drove down margins. Monolithic Power Systems, a manufacturer of high performance analog and mixed-signal integrated circuits, fell 31% for the year due to pricing pressure and management's reduction of company profit margin targets.
Here are some fun facts for long-term stock investors: at the end of 2010, the S&P 500 large-cap index was higher than it was that fateful day before Lehman Brothers went bankrupt in September 2008, and so was Wanger USA; the Russell 2000 small-cap index was trading higher than at any point during the entire year of 2008; and the S&P 400 mid-cap index ended 2010 a mere 2% below its all-time high! Wanger USA was 4% below its all-time high.* A stock market Rip Van Winkle waking up from his stress-free, two-year nap would find the market just as he left it. Turns out, buy and HOLD actually works quite well.
Stocks of small- and mid-cap companies pose special risks, including possible illiquidity and greater price volatility than stocks of larger, more established companies.
Portfolio holdings are subject to change periodically and may not be representative of current holdings.
Fund Positions in Mentioned Holdings
As a percentage of net assets, as of 12/31/10
| FMC Technologies | | | 3.1 | % | |
| Ametek | | | 2.7 | | |
| Informatica | | | 2.6 | | |
| Nordson | | | 2.4 | | |
| lululemon athletica | | | 2.1 | | |
| Atmel | | | 1.5 | | |
| Abercrombie & Fitch | | | 1.4 | | |
| Finisar | | | 0.8 | | |
| ITT Educational Services | | | 0.5 | | |
| Global Payments | | | 0.5 | | |
| Monolithic Power Systems | | | 0.4 | | |
*The Lehman Brothers bankruptcy was announced on Monday, September 15, 2008. On Friday, September 12, 2008, Wanger USA's net asset value (NAV) was $28.48. On December 31, 2010, the Fund's NAV was $33.86. In 2008, the Fund's peak NAV was reached on January 2, 2008, and was $35.76. Unlike the Russell 2000 Index, the Fund did not top its 2008 peak in 2010. As of December 31, 2010, the Fund was 4.33% below its dividend-adjusted, all-time high, which it reached on July 13, 2007.
4
Wanger USA 2010 Annual Report
Growth of a $10,000 Investment in Wanger USA
May 3, 1995 (inception date) through December 31, 2010
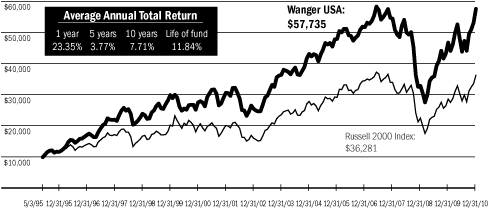
Performance data shown represents past performance and is not a guarantee of future results. The investment return and principal value will fluctuate so that shares, when redeemed, may be worth more or less than the original cost. Current performance may be lower or higher than the performance data shown. Performance results reflect any fee waivers or reimbursements of Fund expenses by the investment adviser and/or any of its affiliates. Absent these fee waivers and/or expense reimbursement arrangements, performance results would have been lower. For daily and most recent month-end performance updates, please call 1-888-4-WANGER.
This graph compares the results of $10,000 invested in Wanger USA on May 3, 1995 (the date the Fund began operations) through December 31, 2010, to the Russell 2000 Index, with dividends and capital gains reinvested. Although the index is provided for use in assessing the Fund's performance, the Fund's holdings may differ significantly from those in the index.
Top 10 Holdings
As a percentage of net assets, as of 12/31/10
1. FMC Technologies
Oil & Gas Wellhead Manufacturer | | | 3.1
| % | |
2. Ametek
Aerospace/Industrial Instruments | | | 2.7
| | |
3. Informatica
Enterprise Data Integration Software | | | 2.6
| | |
4. Nordson
Dispensing Systems for Adhesives & Coatings | | | 2.4
| | |
5. Atwood Oceanics
Offshore Drilling Contractor | | | 2.2
| | |
6. lululemon athletica
Premium Active Apparel Retailer | | | 2.1
| | |
7. Mettler Toledo
Laboratory Equipment | | | 2.0
| | |
8. tw telecom
Fiber Optic Telephone/Data Services | | | 2.0
| | |
9. Micros Systems
Information Systems for Restaurants, Hotels & Retailers | | | 2.0
| | |
10. Donaldson
Industrial Air Filtration | | | 1.9
| | |
Top 5 Industries
As a percentage of net assets, as of 12/31/10
| Information | | | 32.3 | % | |
| Consumer Goods & Services | | | 17.5 | | |
| Industrial Goods & Services | | | 14.2 | | |
| Finance | | | 11.8 | | |
| Energy & Minerals | | | 10.3 | | |
Results as of December 31, 2010
| | | 4th quarter | | 1 year | | 5 years | | 10 years | |
| Wanger USA | | | 16.44 | % | | | 23.35 | % | | | 3.77 | % | | | 7.71 | % | |
| Russell 2000 Index* | | | 16.25 | | | | 26.85 | | | | 4.47 | | | | 6.33 | | |
Lipper Small-Cap Growth Funds
Variable Underlying Index | | | 15.81 | | | | 28.25 | | | | 4.60 | | | | 4.34 | | |
NAV as of 12/31/10: $33.86
* The Fund's primary benchmark.
Performance numbers reflect all Fund expenses but do not include any insurance charge imposed by your insurance company's separate accounts. If performance included the effect of these additional charges, it would be lower.
All results shown assume reinvestment of distributions and do not reflect taxes that a shareholder may pay on Fund distributions or the sale of Fund shares.
The Russell 2000 Index measures the performance of the 2,000 smallest companies in the Russell 3000 Index, which represents approximately 8% of the total market capitalization of the Russell 3000 Index. The Lipper Small-Cap Growth Funds Variable Underlying Index is an equally weighted representation of the 30 largest variable insurance underlying funds in the Lipper Small-Cap Growth Funds Variable Underlying Classification. Indexes are not managed and do not incur fees or expenses. It is not possible to invest directly in an index.
Lipper Inc., a widely respected data provider in the industry, calculates an average total return (assuming reinvestment of distributions) for mutual funds with investment objectives similar to those of the Fund. Lipper makes no adjustment for the effect of sales loads.
Portfolio characteristics and holdings are subject to change periodically and may not be representative of current characteristics and holdings.
5
Wanger USA 2010 Annual Report
Wanger USA
Statement of Investments December 31, 2010
Number of
Shares | | | | Value | |
| | | Equities – 99.8% | |
| | | Information – 32.3% | |
| | | Business Software – 8.8% | |
| | 533,000 | | | Informatica (a)
Enterprise Data Integration Software | | $ | 23,467,990
| | |
| | 413,000 | | | Micros Systems (a)
Information Systems for Hotels, Restaurants & Retailers | | | 18,114,180
| | |
| | 246,000 | | | ANSYS (a)
Simulation Software for Engineers & Designers | | | 12,809,220
| | |
| | 106,000 | | | Concur Technologies (a)
Web Enabled Cost & Expense Management Software | | | 5,504,580
| | |
| | 189,000 | | | Blackbaud
Software & Services for Non-profits | | | 4,895,100
| | |
| | 132,000 | | | Ariba (a)
Cost Management Software | | | 3,100,680
| | |
| | 98,000 | | | Jack Henry & Associates
Systems Financial Institutions | | | 2,856,700
| | |
| | 163,000 | | | SPS Commerce (a)
Supply Chain Management Software Delivered via the Web | | | 2,575,400
| | |
| | 35,000 | | | Quality Systems
IT Systems for Medical Groups & Ambulatory Care Centers | | | 2,443,700
| | |
| | 59,000 | | | Blackboard (a)
Education Software | | | 2,436,700
| | |
| | 32,000 | | | Advent Software (a)
Asset Management & Trading Systems | | | 1,853,440
| | |
| | | | 80,057,690 | | |
| | | Semiconductors & Related Equipment – 5.1% | |
| | 1,111,000 | | | Atmel (a)
Microcontrollers, Radio Frequency &
Memory Semiconductors | | | 13,687,520
| | |
| | 488,000 | | | Microsemi (a)
Analog/Mixed-signal Semiconductors | | | 11,175,200
| | |
| | 698,950 | | | ON Semiconductor (a)
Mixed-signal & Power Management Semiconductors | | | 6,905,626
| | |
| | 226,000 | | | Monolithic Power Systems (a)
High Performance Analog & Mixed-signal Integrated
Circuits (ICs) | | | 3,733,520
| | |
| | 140,000 | | | Supertex (a)
Analog/Mixed-signal Semiconductors | | | 3,385,200
| | |
| | 445,000 | | | Entegris (a)
Semiconductor Materials Management Products | | | 3,324,150
| | |
| | 205,000 | | | Pericom Semiconductor (a)
Interface Integrated Circuits (ICs) & Frequency
Control Products | | | 2,250,900
| | |
Number of
Shares | | | | Value | |
| | 157,000 | | | Applied Micro Circuits (a)
Communications Semiconductors | | $ | 1,676,760
| | |
| | | | 46,138,876 | | |
| | | Instrumentation – 3.4% | |
| | 122,000 | | | Mettler Toledo (a)
Laboratory Equipment | | | 18,447,620
| | |
| | 394,000 | | | IPG Photonics (a)
Fiber Lasers | | | 12,458,280
| | |
| | | | 30,905,900 | | |
| | | Computer Hardware & Related Equipment – 3.2% | |
| | 201,600 | | | Amphenol
Electronic Connectors | | | 10,640,448
| | |
| | 179,000 | | | II-VI (a)
Laser Optics & Specialty Materials | | | 8,298,440
| | |
| | 112,000 | | | Zebra Technologies (a)
Bar Code Printers | | | 4,254,880
| | |
| | 123,000 | | | Netgear (a)
Networking Products for Small Business & Home | | | 4,142,640
| | |
| | 48,000 | | | Nice Systems – ADR (Israel) (a)
Audio & Video Recording Solutions | | | 1,675,200
| | |
| | | | 29,011,608 | | |
| | | Telephone and Data Services – 3.1% | |
| | 1,070,000 | | | tw telecom (a)
Fiber Optic Telephone/Data Services | | | 18,243,500
| | |
| | 94,000 | | | AboveNet
Metropolitan Fiber Communications Services | | | 5,495,240
| | |
| | 1,241,000 | | | PAETEC Holding (a)
Telephone/Data Services for Business | | | 4,641,340
| | |
| | | | 28,380,080 | | |
| | | Telecommunications Equipment – 2.6% | |
| | 214,000 | | | Polycom (a)
Video Conferencing Equipment | | | 8,341,720
| | |
| | 237,800 | | | Finisar (a)
Optical Sub-systems & Components | | | 7,060,282
| | |
| | 164,000 | | | Blue Coat Systems (a)
WAN Acceleration & Network Security | | | 4,898,680
| | |
| | 133,000 | | | Ixia (a)
Telecom Network Test Equipment | | | 2,231,740
| | |
See accompanying notes to financial statements.
6
Wanger USA 2010 Annual Report
Wanger USA
Statement of Investments December 31, 2010
Number of
Shares | | | | Value | |
| | | Telecommunications Equipment – 2.6% (cont) | |
| | 135,000 | | | Infinera (a)
Optical Networking Equipment | | $ | 1,394,550
| | |
| | | | 23,926,972 | | |
| | | Computer Services – 1.6% | |
| | 324,800 | | | ExlService Holdings (a)
BPO (Business Process Outsourcing) | | | 6,976,704
| | |
| | 106,000 | | | SRA International (a)
Government IT Services | | | 2,167,700
| | |
| | 450,000 | | | RCM Technologies (a)
Technology & Engineering Services | | | 2,088,000
| | |
| | 92,000 | | | Acxiom (a)
Database Marketing Services | | | 1,577,800
| | |
| | 375,500 | | | Hackett Group (a)
IT Integration & Best Practice Research | | | 1,318,005
| | |
| | | | 14,128,209 | | |
| | | Gaming Equipment & Services – 1.4% | |
| | 264,000 | | | Bally Technologies (a)
Slot Machines & Software | | | 11,138,160
| | |
| | 42,000 | | | WMS Industries (a)
Slot Machine Provider | | | 1,900,080
| | |
| | | | 13,038,240 | | |
| | | Mobile Communications – 0.8% | |
| | 174,500 | | | SBA Communications (a)
Communications Towers | | | 7,144,030
| | |
| | 51,000 | | | Globalstar (a)
Satellite Mobile Voice & Data Carrier | | | 73,950
| | |
| | | | 7,217,980 | | |
| | | Contract Manufacturing – 0.7% | |
| | 150,000 | | | Plexus (a)
Electronic Manufacturing Services | | | 4,641,000
| | |
| | 165,000 | | | Sanmina-SCI (a)
Electronic Manufacturing Services | | | 1,894,200
| | |
| | | | 6,535,200 | | |
| | | Internet Related – 0.6% | |
| | 44,000 | | | Equinix (a)
Network Neutral Data Centers | | | 3,575,440
| | |
Number of
Shares | | | | Value | |
| | 575,000 | | | TheStreet.com
Financial Information Websites | | $ | 1,535,250
| | |
| | | | 5,110,690 | | |
| | | Financial Processors – 0.5% | |
| | 91,000 | | | Global Payments
Credit Card Processor | | | 4,205,110
| | |
| | | Business Information & Marketing Services – 0.3% | |
| | 291,200 | | | Navigant Consulting (a)
Financial Consulting Firm | | | 2,679,040
| | |
| | | TV Broadcasting – 0.1% | |
| | 522,000 | | | Entravision Communications (a)
Spanish Language TV & Radio Stations | | | 1,341,540
| | |
| | | Radio – 0.1% | |
| | 333,900 | | | Salem Communications
Radio Stations for Religious Programming | | | 1,058,463
| | |
| | 305,000 | | | Spanish Broadcasting System (a)
Spanish Language Radio Stations | | | 215,940
| | |
| | | | 1,274,403 | | |
| | | | | Total Information | | | 293,951,538 | | |
| | | Consumer Goods & Services – 17.5% | |
| | | Retail – 6.8% | |
| | 275,000 | | | lululemon athletica (a)(b)
Premium Active Apparel Retailer | | | 18,815,500
| | |
| | 223,000 | | | Abercrombie & Fitch
Teen Apparel Retailer | | | 12,851,490
| | |
| | 526,000 | | | Saks (a)
Luxury Department Store Retailer | | | 5,628,200
| | |
| | 137,000 | | | Urban Outfitters (a)
Apparel & Home Specialty Retailer | | | 4,905,970
| | |
| | 129,000 | | | Shutterfly (a)
Internet Photo-centric Retailer | | | 4,518,870
| | |
| | 424,000 | | | Pier 1 Imports (a)
Home Furnishing Retailer | | | 4,452,000
| | |
| | 368,000 | | | Chico's FAS
Women's Specialty Retailer | | | 4,427,040
| | |
| | 315,000 | | | Talbots (a)
Women's Specialty Retailer | | | 2,683,800
| | |
See accompanying notes to financial statements.
7
Wanger USA 2010 Annual Report
Wanger USA
Statement of Investments December 31, 2010
Number of
Shares | | | | Value | |
| | | Retail – 6.8% (cont) | |
| | 405,400 | | | Wet Seal (a)
Specialty Apparel Retailer | | $ | 1,499,980
| | |
| | 60,700 | | | Express
Dual Gender Fashion Retailer | | | 1,141,160
| | |
| | 116,229 | | | Gaiam
Healthy Living Catalogs & E-Commerce | | | 894,963
| | |
| | 87,527 | | | Coldwater Creek (a)
Women's Apparel Retailer | | | 277,461
| | |
| | 6,000 | | | The Fresh Market (a)
Specialty Food Retailer | | | 247,200
| | |
| | | | 62,343,634 | | |
| | | Travel – 3.6% | |
| | 449,700 | | | Gaylord Entertainment (a)
Convention Hotels | | | 16,162,218
| | |
| | 659,500 | | | Avis Budget Group (a)
Second Largest Car Rental Company | | | 10,261,820
| | |
| | 444,000 | | | Hertz (a)
Largest U.S. Rental Car Operator | | | 6,433,560
| | |
| | | | 32,857,598 | | |
| | | Furniture & Textiles – 1.8% | |
| | 700,000 | | | Knoll
Office Furniture | | | 11,711,000
| | |
| | 184,000 | | | Herman Miller
Office Furniture | | | 4,655,200
| | |
| | | | 16,366,200 | | |
| | | Casinos & Gaming – 1.1% | |
| | 365,000 | | | Pinnacle Entertainment (a)
Regional Casino Operator | | | 5,117,300
| | |
| | 128,000 | | | Penn National Gaming (a)
Regional Casino Operator | | | 4,499,200
| | |
| | | | 9,616,500 | | |
| | | Apparel – 1.0% | |
| | 93,500 | | | Warnaco Group (a)
Global Branded Apparel Manufacturer | | | 5,149,045
| | |
| | 153,945 | | | True Religion Apparel (a)
Premium Denim | | | 3,426,816
| | |
| | | | 8,575,861 | | |
Number of
Shares | | | | Value | |
| | | Other Consumer Services – 0.7% | |
| | 163,000 | | | Lifetime Fitness (a)
Sport & Fitness Club Operator | | $ | 6,681,370
| | |
| | | Food & Beverage – 0.7% | |
| | 117,000 | | | Diamond Foods
Culinary Ingredients & Snack Foods | | | 6,222,060
| | |
| | | Consumer Goods Distribution – 0.6% | |
| | 257,000 | | | Pool
Distributor of Swimming Pool Supplies & Equipment | | | 5,792,780
| | |
| | | Educational Services – 0.6% | |
| | 77,600 | | | ITT Educational Services (a)
Post-secondary Degree Services | | | 4,942,344
| | |
| | | Leisure Products – 0.3% | |
| | 83,000 | | | Thor Industries
RV & Bus Manufacturer | | | 2,818,680
| | |
| | | Other Durable Goods – 0.3% | |
| | 85,000 | | | Jarden
Branded Household Products | | | 2,623,950
| | |
| | | Restaurants – 0.0% | |
| | 17,700 | | | Bravo Brio Restaurant Group (a)
Upscale Casual Italian Restaurants | | | 339,309
| | |
| | | | | Total Consumer Goods & Services | | | 159,180,286 | | |
| | | Industrial Goods & Services – 14.2% | |
| | | Machinery – 11.1% | |
| | 631,500 | | | Ametek
Aerospace/Industrial Instruments | | | 24,786,375
| | |
| | 240,100 | | | Nordson
Dispensing Systems for Adhesives & Coatings | | | 22,060,388
| | |
| | 290,000 | | | Donaldson
Industrial Air Filtration | | | 16,901,200
| | |
| | 319,000 | | | Pentair
Pumps & Water Treatment | | | 11,646,690
| | |
| | 297,300 | | | ESCO Technologies
Automatic Electric Meter Readers | | | 11,249,832
| | |
| | 128,000 | | | MOOG (a)
Motion Control Products for Aerospace,
Defense & Industrial Markets | | | 5,094,400
| | |
See accompanying notes to financial statements.
8
Wanger USA 2010 Annual Report
Wanger USA
Statement of Investments December 31, 2010
Number of
Shares | | | | Value | |
| | | Machinery – 11.1% (cont) | |
| | 111,000 | | | Oshkosh (a)
Specialty Truck Manufacturer | | $ | 3,911,640
| | |
| | 42,000 | | | WABCO Holdings (a)
Truck & Bus Component Supplier | | | 2,559,060
| | |
| | 57,000 | | | Kennametal
Consumable Cutting Tools | | | 2,249,220
| | |
| | 10,463 | | | HEICO
FAA Approved Aircraft Replacement Parts | | | 390,479
| | |
| | | | 100,849,284 | | |
| | | Industrial Materials & Specialty Chemicals – 1.3% | |
| | 208,000 | | | Drew Industries
RV & Manufactured Home Components | | | 4,725,760
| | |
| | 71,000 | | | Albemarle
Refinery Catalysts & Other Specialty Chemicals | | | 3,960,380
| | |
| | 150,000 | | | Albany International
Paper Machine Clothing & Advanced Textiles | | | 3,553,500
| | |
| | | | 12,239,640 | | |
| | | Electrical Components – 0.7% | |
| | 115,000 | | | Acuity Brands
Commercial Lighting Fixtures | | | 6,632,050
| | |
| | | Steel – 0.7% | |
| | 320,400 | | | GrafTech International (a)
Industrial Graphite Materials Producer | | | 6,356,736
| | |
| | | Construction – 0.2% | |
| | 98,000 | | | St. Joe (a)(b)
Florida Panhandle Landowner | | | 2,141,300
| | |
| | | Water – 0.2% | |
| | 326,000 | | | Mueller Water Products
Fire Hydrants, Valves & Ductile Iron Pipes | | | 1,359,420
| | |
| | | | | Total Industrial Goods & Services | | | 129,578,430 | | |
| | | Finance – 11.8% | |
| | | Banks – 5.7% | |
| | 645,837 | | | Valley National Bancorp
New Jersey/New York Bank | | | 9,235,469
| | |
| | 281,779 | | | Lakeland Financial
Indiana Bank | | | 6,046,977
| | |
Number of
Shares | | | | Value | |
| | 408,000 | | | TCF Financial
Great Lakes Bank | | $ | 6,042,480
| | |
| | 107,000 | | | SVB Financial Group (a)
Bank to Venture Capitalists | | | 5,676,350
| | |
| | 314,100 | | | MB Financial
Chicago Bank | | | 5,440,212
| | |
| | 333,000 | | | Whitney Holding
Gulf Coast Bank | | | 4,711,950
| | |
| | 301,600 | | | Associated Banc-Corp
Midwest Bank | | | 4,569,240
| | |
| | 666,200 | | | First Busey
Illinois Bank | | | 3,131,140
| | |
| | 300,260 | | | Pacific Continental
Pacific Northwest Bank | | | 3,020,616
| | |
| | 97,700 | | | Sandy Spring Bancorp
Baltimore/D.C. Bank | | | 1,800,611
| | |
| | 260,000 | | | Wilmington Trust
Delaware Trust Bank | | | 1,128,400
| | |
| | 504,451 | | | Guaranty Bancorp (a)
Colorado Bank | | | 711,276
| | |
| | 119,582 | | | Green Bankshares (a)(b)
Tennessee Bank | | | 382,662
| | |
| | | | 51,897,383 | | |
| | | Finance Companies – 2.5% | |
| | 138,000 | | | World Acceptance (a)
Personal Loans | | | 7,286,400
| | |
| | 230,400 | | | McGrath Rentcorp
Temporary Space & IT Rentals | | | 6,041,088
| | |
| | 151,000 | | | CAI International (a)
International Container Leasing | | | 2,959,600
| | |
| | 61,500 | | | GATX
Rail Car Lessor | | | 2,169,720
| | |
| | 160,000 | | | H&E Equipment Services (a)
Heavy Equipment Leasing | | | 1,851,200
| | |
| | 71,000 | | | Aaron Rents
Rent to Own | | | 1,447,690
| | |
| | 30,000 | | | Textainer Group Holdings
Top International Container Leasor | | | 854,700
| | |
| | | | 22,610,398 | | |
See accompanying notes to financial statements.
9
Wanger USA 2010 Annual Report
Wanger USA
Statement of Investments December 31, 2010
Number of
Shares | | | | Value | |
| | | Brokerage & Money Management – 1.5% | |
| | 229,000 | | | SEI Investments
Mutual Fund Administration & Investment Management | | $ | 5,447,910
| | |
| | 444,000 | | | MF Global (a)
Futures Broker | | | 3,711,840
| | |
| | 85,000 | | | Eaton Vance
Specialty Mutual Funds | | | 2,569,550
| | |
| | 101,000 | | | Investment Technology Group (a)
Electronic Trading | | | 1,653,370
| | |
| | 52,011 | | | Kaiser Federal Financial Group
Los Angeles Savings & Loan | | | 602,288
| | |
| | | | 13,984,958 | | |
| | | Insurance – 1.1% | |
| | 222,000 | | | Leucadia National
Insurance Holding Company | | | 6,477,960
| | |
| | 151,000 | | | Tower Group
Commercial & Personal Lines Insurance | | | 3,862,580
| | |
| | | | 10,340,540 | | |
| | | Savings & Loans – 1.0% | |
| | 496,400 | | | ViewPoint Financial
Texas Thrift | | | 5,802,916
| | |
| | 142,000 | | | Berkshire Hills Bancorp
Northeast Thrift | | | 3,138,200
| | |
| | | | 8,941,116 | | |
| | | | | Total Finance | | | 107,774,395 | | |
| | | Energy & Minerals – 10.3% | |
| | | Oil Services – 6.3% | |
| | 319,000 | | | FMC Technologies (a)
Oil & Gas Wellhead Manufacturer | | | 28,362,290
| | |
| | 541,100 | | | Atwood Oceanics (a)
Offshore Drilling Contractor | | | 20,220,907
| | |
| | 105,000 | | | Bristow (a)
Largest Provider of Helicopter Services to
Offshore Oil & Gas Producers | | | 4,971,750
| | |
| | 120,000 | | | Exterran Holdings (a)
Natural Gas Compressor Rental & Fabrication | | | 2,874,000
| | |
| | 64,700 | | | Tesco (a)
Developing New Well Drilling Technologies | | | 1,027,436
| | |
| | | | 57,456,383 | | |
Number of
Shares | | | | Value | |
| | | Oil & Gas Producers – 3.3% | |
| | 162,000 | | | Carrizo Oil & Gas (a)
Oil & Gas Producer | | $ | 5,587,380
| | |
| | 92,000 | | | SM Energy
Oil & Gas Producer | | | 5,421,560
| | |
| | 98,000 | | | Ultra Petroleum (a)
Oil & Gas Producer | | | 4,681,460
| | |
| | 145,000 | | | Northern Oil & Gas (a)
Small E&P Company in North Dakota Bakken | | | 3,945,450
| | |
| | 81,000 | | | Rosetta Resources (a)
Oil & Gas Producer Exploring in South Texas & Montana | | | 3,048,840
| | |
| | 144,950 | | | Houston American Energy (b)
Oil & Gas Exploration & Production in Colombia | | | 2,622,145
| | |
| | 174,000 | | | Quicksilver Resources (a)
Natural Gas & Coal Steam Gas Producer | | | 2,564,760
| | |
| | 47,000 | | | Swift Energy (a)
Oil & Gas Exploration & Production Co. | | | 1,840,050
| | |
| | 19,800 | | | Oasis Petroleum (a)
Oil Producer in North Dakota | | | 536,976
| | |
| | | | 30,248,621 | | |
| | | Mining – 0.7% | |
| | 66,000 | | | Core Laboratories (Netherlands)
Oil & Gas Reservoir Consulting | | | 5,877,300
| | |
| | 100,000 | | | Augusta Resource (a)
U.S. Copper/Molybdenum Mine | | | 381,000
| | |
| | | | 6,258,300 | | |
| | | | | Total Energy & Minerals | | | 93,963,304 | | |
| | | Health Care – 8.6% | |
| | | Biotechnology & Drug Delivery – 5.3% | |
| | 196,800 | | | BioMarin Pharmaceutical (a)
Biotech Focused on Orphan Diseases | | | 5,299,824
| | |
| | 79,000 | | | United Therapeutics (a)
Biotech Focused on Rare Diseases | | | 4,994,380
| | |
| | 318,200 | | | Seattle Genetics (a)
Antibody-based Therapies for Cancer | | | 4,757,090
| | |
| | 501,000 | | | Micromet (a)
Next-generation Antibody Technology | | | 4,068,120
| | |
| | 103,000 | | | Onyx Pharmaceuticals (a)
Commercial-stage Biotech Focused on Cancer | | | 3,797,610
| | |
| | 352,000 | | | Isis Pharmaceuticals (a)
Biotech Pioneer in Anti-sense Drugs | | | 3,562,240
| | |
See accompanying notes to financial statements.
10
Wanger USA 2010 Annual Report
Wanger USA
Statement of Investments December 31, 2010
Number of
Shares | | | | Value | |
| | | Biotechnology & Drug Delivery – 5.3% (cont) | |
| | 250,000 | | | Nektar Therapeutics (a)
Drug Delivery Technologies | | $ | 3,212,500
| | |
| | 384,000 | | | NPS Pharmaceuticals (a)
Orphan Drugs & Healthy Royalties | | | 3,033,600
| | |
| | 590,000 | | | Allos Therapeutics (a)
Cancer Drug Development | | | 2,719,900
| | |
| | 345,000 | | | Chelsea Therapeutics (a)
Biotech Focused on Rare Diseases | | | 2,587,500
| | |
| | 122,000 | | | Auxilium Pharmaceuticals (a)(b)
Biotech Focused on Niche Disease Areas | | | 2,574,200
| | |
| | 69,900 | | | Acorda Therapeutics (a)
Biopharma Company Focused on Nervous Disorder Drugs | | | 1,905,474
| | |
| | 50,300 | | | InterMune (a)
Drugs for Pulmonary Fibrosis & Hepatitis C | | | 1,830,920
| | |
| | 332,400 | | | Idenix Pharmaceuticals (a)
Developer of Drugs for Infectious Diseases | | | 1,675,296
| | |
| | 242,000 | | | Array Biopharma (a)
Drugs for Cancer & Inflammatory Diseases | | | 723,580
| | |
| | 106,900 | | | Nabi Biopharmaceuticals (a)
Biotech Focused on Vaccines | | | 618,951
| | |
| | 107,000 | | | Anthera Pharmaceuticals (a)
Biotech Focused on Cardiovascular, Cancer & Immunology | | | 522,160
| | |
| | 738,060 | | | Medicure – Warrants (a)(c)
Cardiovascular Biotech Company | | | 1,882
| | |
| | 100,000 | | | IsoRay – Warrants (a)(c)
Radiology Cancer Company | | | 1,000
| | |
| | 25,000 | | | Locus Pharmaceuticals,
Series A-1, Pfd. (a)(c) | | | 750 | | |
| | 12,886 | | | Locus Pharmaceuticals,
Series B-1, Pfd. (a)(c)
High Throughput Rational Drug Design | | | 387
| | |
| | | | 47,887,364 | | |
| | | Medical Equipment & Devices – 2.4% | |
| | 109,000 | | | Alexion Pharmaceuticals (a)
Biotech Focused on Orphan Diseases | | | 8,779,950
| | |
| | 123,000 | | | Sirona Dental Systems (a)
Manufacturer of Dental Equipment | | | 5,138,940
| | |
| | 43,000 | | | Gen-Probe (a)
Molecular In-vitro Diagnostics | | | 2,509,050
| | |
| | 34,000 | | | Idexx Laboratories (a)
Diagnostic Equipment & Services for Veterinarians | | | 2,353,480
| | |
Number of
Shares | | | | Value | |
| | 45,000 | | | American Medical Systems (a)
Medical Devices to Treat Urological Conditions | | $ | 848,700
| | |
| | 13,000 | | | Illumina (a)
Leading Tools & Service Provider for Genetic Analysis | | | 823,420
| | |
| | 51,000 | | | Pacific Biosciences of California (a)
Genome Sequencing | | | 811,410
| | |
| | 155,900 | | | Nanosphere (a)
Molecular Diagnostics Company with Best of Breed Platform | | | 679,724
| | |
| | | | 21,944,674 | | |
| | | Medical Supplies – 0.4% | |
| | 164,600 | | | Cepheid (a)
Molecular Diagnostics | | | 3,744,650
| | |
| | 6,900 | | | Neogen (a)
Food & Animal Safety Products | | | 283,107
| | |
| | | | 4,027,757 | | |
| | | Health Care Services – 0.3% | |
| | 23,000 | | | Mednax (a)
Physician Management for Pediatric & Anesthesia Practices | | | 1,547,670
| | |
| | 100,000 | | | Health Management Associates (a)
Non-urban Hospitals | | | 954,000
| | |
| | | | 2,501,670 | | |
| | | Pharmaceuticals – 0.2% | |
| | 266,000 | | | Akorn (a)
Develops, Manufactures & Sells Specialty Generic Drugs | | | 1,614,620
| | |
| | 19,700 | | | Alimera Sciences (a)
Ophthalmogy-focused Pharmaceutical Company | | | 204,486
| | |
| | | | 1,819,106 | | |
| | | | | Total Health Care | | | 78,180,571 | | |
| | | Other Industries – 5.1% | |
| | | Real Estate – 4.2% | |
| | 469,600 | | | BioMed Realty Trust
Life Science-focused Office Buildings | | | 8,758,040
| | |
| | 503,000 | | | Extra Space Storage
Self Storage Facilities | | | 8,752,200
| | |
| | 955,000 | | | Kite Realty Group
Community Shopping Centers | | | 5,166,550
| | |
| | 102,000 | | | Kilroy Realty
Southern California Office & Industrial Properties | | | 3,719,940
| | |
See accompanying notes to financial statements.
11
Wanger USA 2010 Annual Report
Wanger USA
Statement of Investments December 31, 2010
Number of
Shares | | | | Value | |
| | | Real Estate – 4.2% (cont) | |
| | 100,000 | | | Corporate Office Properties
Office Buildings | | $ | 3,495,000
| | |
| | 122,200 | | | Dupont Fabros Technology
Technology-focused Office Buildings | | | 2,599,194
| | |
| | 264,000 | | | Education Realty Trust
Student Housing | | | 2,051,280
| | |
| | 119,000 | | | Associated Estates Realty
Multi-family Properties | | | 1,819,510
| | |
| | 341,000 | | | DCT Industrial Trust
Industrial Properties | | | 1,810,710
| | |
| | | | 38,172,424 | | |
| | | Transportation – 0.9% | |
| | 100,500 | | | World Fuel Services
Global Fuel Broker | | | 3,634,080
| | |
| | 134,487 | | | Rush Enterprises, Class A (a)
Truck Sales & Services | | | 2,748,914
| | |
| | 140,000 | | | Heartland Express
Regional Trucker | | | 2,242,800
| | |
| | | | 8,625,794 | | |
| | | | | Total Other Industries | | | 46,798,218 | | |
Total Equities
(Cost: $586,101,593) – 99.8% | | | 909,426,742 | | |
| Securities Lending Collateral – 0.5% | | | |
| | 4,644,502 | | | Dreyfus Government Cash
Management Fund (d)
(7 day yield of 0.01%) | | | 4,644,502 | | |
Total Securities Lending Collateral
(Cost: $4,644,502) | | | 4,644,502 | | |
| Principal Amount | | | | Value | |
| Short-Term Obligation – 0.3% | |
| | | Repurchase Agreement – 0.3% | |
| $ | 3,053,000 | | | Repurchase Agreement with Fixed
Income Clearing Corp., dated 12/31/10,
due 1/03/11 at 0.16%, collateralized
by a U.S. Government Agency obligation
maturing 9/08/14, market value $3,118,263 (repurchase proceeds $3,053,041) | | $ | 3,053,000 | | |
Total Short-Term Obligation
(Cost: $3,053,000) | | | 3,053,000 | | |
Total Investments
(Cost: $593,799,095) – 100.6% (e) | | | 917,124,244 | | |
Obligation to Return Collateral for
Securities Loaned – (0.5)% | | | (4,644,502 | ) | |
| Cash and Other Assets Less Liabilities – (0.1)% | | | (1,055,967 | ) | |
| Total Net Assets – 100.0% | | $ | 911,423,775 | | |
Notes to Statement of Investments:
(a) Non-income producing security.
(b) All or a portion of this security was on loan at December 31, 2010. The total market value of Fund securities on loan at December 31, 2010 was $4,494,894.
(c) Denotes a restricted security, which is subject to restrictions on resale under federal securities laws. These securities are valued at a fair value determined in good faith under consistently applied procedures established by the Board of Trustees. At December 31, 2010, the market value of these securities amounted to $4,019 which represents less than 0.01% of total net assets.
Additional information on these securities is as follows:
Security | | Acquisition
Dates | | Shares | |
Cost | | Value | |
| Medicure – Warrants | | 12/22/06 | | | 738,060 | | | $ | — | | | $ | 1,882 | | |
| IsoRay – Warrants | | 3/21/07 | | | 100,000 | | | | — | | | | 1,000 | | |
Locus Pharmaceuticals,
Series A-1, Pfd. | | 9/05/01 | | | 25,000 | | | | 1,000,000 | | | | 750 | | |
Locus Pharmaceuticals,
Series B-1, Pfd. | | 2/08/07 | | | 12,886 | | | | 37,369 | | | | 387 | | |
| | | | | | | $ | 1,037,369 | | | $ | 4,019 | | |
(d) Investment made with cash collateral received from securities lending activity.
(e) At December 31, 2010, for federal income tax purposes, the cost of investments was $597,834,150 and net unrealized appreciation was $319,290,094 consisting of gross unrealized appreciation of $367,113,719 and gross unrealized depreciation of $47,823,625.
See accompanying notes to financial statements.
12
Wanger USA 2010 Annual Report
Wanger USA
Statement of Investments December 31, 2010
An affiliated person of the Fund may include any company in which the Fund owns five percent or more of its outstanding voting shares. Holdings and transactions in these affiliated companies during the year ended December 31, 2010, are as follows:
Affiliates | | Balance
of Shares
Held at
12/31/09 | |
Purchases/
Additions | |
Sales/
Reductions | | Balance of
Shares
Held at
12/31/10 | |
Value | |
Dividend | |
Cavco
Industries* | | | 272,184 | | | | — | | | | 272,184 | | | | — | | | $ | — | | | $ | — | | |
RCM
Technolo-
gies* | | | 753,000 | | | | — | | | | 303,000 | | | | 450,000 | | | | 2,088,000 | | | | — | | |
Total of
affiliated
trans-
actions | | | 1,025,184 | | | | — | | | | 575,184 | | | | 450,000 | | | $ | 2,088,000 | | | $ | — | | |
* At December 31, 2010, the Fund owned less than five percent of the company's outstanding voting shares.
ADR = American Depositary Receipts
At December 31, 2010, the Fund held investments in the following sectors:
| Sector | | Percentage of
Net Assets | |
| Information | | | 32.3 | | |
| Consumer Goods & Services | | | 17.5 | | |
| Industrial Goods & Services | | | 14.2 | | |
| Finance | | | 11.8 | | |
| Energy & Minerals | | | 10.3 | | |
| Health Care | | | 8.6 | | |
| Other Industries | | | 5.1 | | |
| | | | 99.8 | | |
| Securities Lending Collateral | | | 0.5 | | |
| Short-Term Obligation | | | 0.3 | | |
| Obligation to Return Collateral for Securities Loaned | | | (0.5 | ) | |
| Cash and Other Assets less Liabilities | | | (0.1 | ) | |
| | | | 100.0 | | |
The following table summarizes the inputs used, as of December 31, 2010, in valuing the Fund's assets:
| Investment Type | | Quoted Prices
(Level 1) | | Other
Significant
Observable
Inputs
(Level 2) | | Significant
Unobservable
Inputs
(Level 3) | | Total | |
| Equities | |
| Information | | $ | 293,951,538 | | | $ | — | | | $ | — | | | $ | 293,951,538 | | |
Consumer Goods &
Services | | | 159,180,286 | | | | — | | | | — | | | | 159,180,286 | | |
Industrial Goods &
Services | | | 129,578,430 | | | | — | | | | — | | | | 129,578,430 | | |
| Finance | | | 107,774,395 | | | | — | | | | — | | | | 107,774,395 | | |
| Energy & Minerals | | | 93,963,304 | | | | — | | | | — | | | | 93,963,304 | | |
| Health Care | | | 78,176,552 | | | | 2,882 | | | | 1,137 | | | | 78,180,571 | | |
| Other Industries | | | 46,798,218 | | | | — | | | | — | | | | 46,798,218 | | |
| Total Equities | | | 909,422,723 | | | | 2,882 | | | | 1,137 | | | | 909,426,742 | | |
Total Securities Lending
Collateral | | | 4,644,502 | | | | — | | | | — | | | | 4,644,502 | | |
Total Short-Term
Obligation | | | — | | | | 3,053,000 | | | | — | | | | 3,053,000 | | |
| Total Investments | | $ | 914,067,225 | | | $ | 3,055,882 | | | $ | 1,137 | | | $ | 917,124,244 | | |
The Fund's assets assigned to the Level 2 input category are generally valued using a market approach, in which a security's value is determined through its correlation to prices and information from observable market transactions for similar or identical assets. Warrants which do not trade are valued as a percentage of the actively trading common stock using a model, based on Black Scholes.
Certain short-term obligations may be valued using amortized cost, an income approach which converts future cash flows to a present value based upon the discount or premium at purchase.
The Fund's assets assigned to the Level 3 input category are valued at fair value as determined in good faith under consistently applied procedures established by and under the general supervision of the Board of Trustees. To determine fair value, management will utilize the valuation technique that they deem the most appropriate in the circumstances. Securities for which no market exists are valued based upon a market approach using some unobservable inputs which may include, but are not limited to, projected earnings, available cash, line of business, multiples, and consideration of the prioritization of the equity in a company's capital structure.
There were no significant transfers of financial assets between levels 1 and 2 during the period.
See accompanying notes to financial statements.
13
Wanger USA 2010 Annual Report
Wanger USA
Statement of Investments December 31, 2010
The following table reconciles asset balances for the year ending December 31, 2010, in which significant unobservable inputs (Level 3) were used in determining value:
Investments
in Securities | | Balance
as of
December 31,
2009 | | Realized
Gain/(Loss) | | Change in
Unrealized
Appreciation
(Depreciation) | | Purchases | | Sales | | Transfers
into
Level 3 | | Transfers
out of
Level 3 | | Balance
as of
December 31,
2010 | |
Equities
Health Care | | $ | 1,894 | | | $ | — | | | $ | (757 | ) | | $ | — | | | $ | — | | | $ | — | | | $ | — | | | $ | 1,137 | | |
| | | $ | 1,894 | | | $ | — | | | $ | (757 | ) | | $ | — | | | $ | — | | | $ | — | | | $ | — | | | $ | 1,137 | | |
The information in the above reconciliation table represents fiscal year to date activity for any securities identified as using Level 3 inputs at either the beginning or the end of the current fiscal period.
The change in unrealized depreciation attributed to securities owned at December 31, 2010, which were valued using significant unobservable inputs (Level 3) amounted to $757. This amount is included in net change in unrealized appreciation (depreciation) on the Statement of Changes in Net Assets.
For more information on valuation inputs, and their aggregation into the levels used in the table above, please refer to the Security Valuation section in the accompanying Notes to Financial Statements.
See accompanying notes to financial statements.
14
Wanger USA 2010 Annual Report
Statement of Assets and Liabilities
December 31, 2010
| Assets: | |
| Investments, at cost | | $ | 593,799,095 | | |
Investments, at value
(including securities on loan of $4,494,894) | | $ | 917,124,244 | | |
| Cash | | | 7,806 | | |
| Receivable for: | |
| Investments sold | | | 5,266,416 | | |
| Fund shares sold | | | 27 | | |
| Securities lending income | | | 4,490 | | |
| Dividends | | | 430,938 | | |
| Interest | | | 14 | | |
| Trustees' deferred compensation plan | | | 121,589 | | |
| Other assets | | | 10,670 | | |
| Total Assets | | | 922,966,194 | | |
| Liabilities: | |
| Collateral on securities loaned | | | 4,644,502 | | |
| Payable for: | |
| Investments purchased | | | 168,233 | | |
| Fund shares repurchased | | | 5,632,913 | | |
| Investment advisory fee | | | 654,926 | | |
| Administration fee | | | 38,526 | | |
| Transfer agent fee | | | 58 | | |
| Trustees' fees | | | 30 | | |
| Custody fee | | | 10,206 | | |
| Reports to shareholders | | | 235,035 | | |
| Chief compliance officer expenses | | | 2,487 | | |
| Trustees' deferred compensation plan | | | 121,589 | | |
| Other liabilities | | | 33,914 | | |
| Total Liabilities | | | 11,542,419 | | |
| Net Assets | | $ | 911,423,775 | | |
| Composition of Net Assets: | |
| Paid-in capital | | $ | 513,877,213 | | |
| Accumulated net investment loss | | | (121,588 | ) | |
| Accumulated net realized gain | | | 74,343,001 | | |
| Net unrealized appreciation on investments | | | 323,325,149 | | |
| Net Assets | | $ | 911,423,775 | | |
| Fund Shares Outstanding | | | 26,917,111 | | |
Net asset value, offering price and redemption
price per share | | $ | 33.86 | | |
Statement of Operations
For the Year Ended December 31, 2010
| Investment Income: | |
| Dividends (net foreign taxes withheld of $9,423) | | $ | 6,197,740 | | |
| Securities lending income, net | | | 55,348 | | |
| Interest income | | | 4,246 | | |
| Total Investment Income | | | 6,257,334 | | |
| Expenses: | |
| Investment advisory fee | | | 8,679,155 | | |
| Administration fee | | | 506,210 | | |
| Transfer agent fee | | | 713 | | |
| Trustees' fees | | | 57,953 | | |
| Custody fee | | | 50,591 | | |
| Reports to shareholders | | | 427,966 | | |
| Chief compliance officer expenses (See Note 4) | | | 37,842 | | |
| Other expenses (See Note 5) | | | 132,859 | | |
| Expenses before interest expense | | | 9,893,289 | | |
| Interest expense | | | 34,624 | | |
| Total Expenses | | | 9,927,913 | | |
| Advisory fee waiver (See Note 4) | | | (59,212 | ) | |
| Interest expense waiver (See Note 4) | | | (34,624 | ) | |
| Custody earnings credit | | | (20 | ) | |
| Net Expenses | | | 9,834,057 | | |
| Net Investment Loss | | | (3,576,723 | ) | |
Net Realized and Unrealized Gain (Loss) on
Investments: | |
| Net realized gain (loss) on: | |
| Unaffiliated investments | | | 146,415,741 | | |
| Affiliated investments (See Note 4) | | | (1,462,746 | ) | |
| Reimbursement from transaction costs (See Note 4) | | | 19,197 | | |
| Net realized gain | | | 144,972,192 | | |
Net change in unrealized appreciation
(depreciation) on: | | | |
| Unaffiliated investments | | | 50,758,257 | | |
| Affiliated investments (See Note 4) | | | (2,077,908 | ) | |
| Net change in unrealized appreciation | | | 48,680,349 | | |
| Net Gain | | | 193,652,541 | | |
| Net Increase in Net Assets from Operations | | $ | 190,075,818 | | |
See accompanying notes to financial statements.
15
Wanger USA 2010 Annual Report
Statement of Changes in Net Assets
| | | Year Ended December 31, | |
| Increase (Decrease) in Net Assets | | 2010 | | 2009 | |
| Operations: | |
| Net investment loss | | $ | (3,576,723 | ) | | $ | (3,035,972 | ) | |
| Net realized gain (loss) on: | |
| Unaffiliated investments | | | 146,415,741 | | | | (2,149,140 | ) | |
| Affiliated investments (See Note 4) | | | (1,462,746 | ) | | | (484,084 | ) | |
| Reimbursement from transaction costs (See Note 4) | | | 19,197 | | | | — | | |
| Net change in unrealized appreciation (depreciation) on: | |
| Unaffiliated investments | | | 50,758,257 | | | | 396,200,017 | | |
| Affiliated investments (See Note 4) | | | (2,077,908 | ) | | | 2,245,347 | | |
| Net Increase in Net Assets from Operations | | | 190,075,818 | | | | 392,776,168 | | |
| Share Transactions: | |
| Subscriptions | | | 40,189,516 | | | | 67,709,638 | | |
| Redemptions (See Note 4) | | | (595,995,083 | ) | | | (135,581,347 | ) | |
| Net Decrease from Fund Share Transactions | | | (555,805,567 | ) | | | (67,871,709 | ) | |
| Total Increase (Decrease) in Net Assets | | | (365,729,749 | ) | | | 324,904,459 | | |
| Net Assets: | |
| Beginning of period | | | 1,277,153,524 | | | | 952,249,065 | | |
| End of period | | $ | 911,423,775 | | | $ | 1,277,153,524 | | |
| Accumulated net investment loss at end of period | | $ | (121,588 | ) | | $ | (145,168 | ) | |
See accompanying notes to financial statements.
16
Wanger USA 2010 Annual Report
Financial Highlights
| | | Year Ended December 31, | |
| Selected data for a share outstanding throughout each period | | 2010 | | 2009 | | 2008 | | 2007 | | 2006 | |
| Net Asset Value, Beginning of Period | | $ | 27.45 | | | $ | 19.30 | | | $ | 36.26 | | | $ | 36.36 | | | $ | 34.90 | | |
| Income from Investment Operations: | |
| Net investment loss (a) | | | (0.10 | ) | | | (0.06 | ) | | | (0.07 | ) | | | (0.05 | )(b) | | | (0.02 | ) | |
| Net realized and unrealized gain (loss) on investments | | | 6.51 | | | | 8.21 | | | | (13.16 | ) | | | 1.91 | | | | 2.71 | | |
| Total from Investment Operations | | | 6.41 | | | | 8.15 | | | | (13.23 | ) | | | 1.86 | | | | 2.69 | | |
| Less Distributions to Shareholders: | |
| From net investment income | | | — | | | | — | | | | — | | | | — | | | | (0.08 | ) | |
| From net realized gains | | | — | | | | — | | | | (3.73 | ) | | | (1.96 | ) | | | (1.15 | ) | |
| Total Distributions to Shareholders | | | — | | | | — | | | | (3.73 | ) | | | (1.96 | ) | | | (1.23 | ) | |
| Net Asset Value, End of Period | | $ | 33.86 | | | $ | 27.45 | | | $ | 19.30 | | | $ | 36.26 | | | $ | 36.36 | | |
| Total Return (c) | | | 23.35 | %(d) | | | 42.23 | % | | | (39.68 | )% | | | 5.39 | % | | | 7.87 | % | |
| Ratios to Average Net Assets/Supplemental Data: | |
| Net expenses before interest expense (e) | | | 0.97 | % | | | 0.98 | % | | | 0.96 | % | | | 0.95 | % | | | 0.95 | % | |
| Interest expense | | | 0.00 | %(f) | | | — | | | | — | | | | — | | | | 0.00 | %(f) | |
| Interest expense waiver | | | 0.00 | %(f) | | | — | | | | — | | | | — | | | | — | | |
| Net expenses (e) | | | 0.97 | % | | | 0.98 | % | | | 0.96 | % | | | 0.95 | % | | | 0.95 | % | |
| Net investment loss (e) | | | (0.35 | )% | | | (0.29 | )% | | | (0.26 | )% | | | (0.15 | )% | | | (0.07 | )% | |
| Waiver/Reimbursement | | | 0.01 | % | | | — | | | | — | | | | — | | | | — | | |
| Portfolio turnover rate | | | 27 | % | | | 30 | % | | | 22 | % | | | 27 | % | | | 19 | % | |
| Net assets, end of period (000s) | | $ | 911,424 | | | $ | 1,277,154 | | | $ | 952,249 | | | $ | 1,688,040 | | | $ | 1,608,340 | | |
(a) Net investment loss per share was based upon the average shares outstanding during the period.
(b) Net investment loss per share reflects special dividends. The effect of these dividends amounted to $0.08 per share.
(c) Total return at net asset value assuming all distributions reinvested.
(d) Had the investment adviser and/or any of its affiliates not waived a portion of expenses, total return would have been reduced.
(e) The benefits derived from custody fees paid indirectly had an impact of less than 0.01%.
(f) Rounds to less than 0.01%.
See accompanying notes to financial statements.
17
Wanger USA 2010 Annual Report
Notes to Financial Statements
1. Nature of Operations
Wanger USA (the Fund), is a series of Wanger Advisors Trust (the Trust), an open-end management investment company organized as a Massachusetts business trust. The investment objective of the Fund is to seek long-term capital appreciation. The Fund is available only for allocation to certain life insurance company separate accounts established for the purpose of funding qualified and non-qualified variable annuity contracts and variable life insurance policies and may also be offered directly to certain types of pension plans and retirement arrangements.
2. Significant Accounting Policies
The preparation of financial statements in accordance with accounting principles generally accepted in the United States of America (GAAP) requires management to make certain estimates and assumptions that affect the reported amounts of assets and liabilities, the disclosure of contingent assets and liabilities at the date of the financial statements and the reported amounts of revenue and expenses during the reporting period. Actual results could differ from those estimates.
Security valuation
Securities of the Fund are valued at market value or, if a market quotation for a security is not readily available or is deemed not to be reliable because of events or circumstances that have occurred between the market quotation and the time as of which the security is to be valued, the security is valued at its fair value determined in good faith under consistently applied procedures established by the Board of Trustees. A security traded on a securities exchange or in an over-the-counter market in which transaction prices are reported is valued at the last sales price at the time of valuation. A security traded principally on NASDAQ is valued at the NASDAQ official closing price. Mutual Funds and Exchange Traded Funds are valued at their closing net asset value as reported to NASDAQ. A security for which there is no reported sale on the valuation date is valued at the latest bid quotation. Short-term investments maturing in 60 days or l ess are valued at amortized cost, which approximates market value. A security for which a market quotation is not readily available and any other assets are valued at their fair value determined in good faith under consistently applied procedures established by the Board of Trustees. The Trust has retained an independent statistical fair value pricing service that employs a systematic methodology to assist in the fair valuation process for securities principally traded in a foreign market in order to adjust for possible changes in value that may occur between the close of the foreign market and the time as of which the securities are to be valued. If a security is valued at a "fair value", that value may be different from the last quoted market price for the security.
Various inputs are used in determining the value of the Fund's investments, following the input prioritization hierarchy established by GAAP. These inputs are summarized in the three broad levels listed below:
• Level 1—quoted prices in active markets for identical securities
• Level 2—prices determined using other significant observable inputs where quoted prices or observable inputs are unavailable or less reliable (including quoted prices for similar securities, interest rates, prepayment speeds, credit risk and others)
• Level 3—prices determined using significant unobservable inputs (including management's own assumptions about the factors market participants would use in pricing an investment)
The inputs or methodologies used for valuing securities are not necessarily an indication of the risk associated with investing in those securities.
Examples of the types of securities in which the Fund would typically invest and how they are classified within this hierarchy are as follows. Typical Level 1 securities include exchange traded domestic equities, mutual funds whose NAVs are published each day and exchange traded foreign equities that are not statistically fair valued. Typical Level 2 securities include exchange traded foreign equities that are statistically fair valued and short-term investments valued at amortized cost. Additionally, securities fair valued by the Fund's valuation committee that rely on significant observable inputs are also included in Level 2. Typical Level 3 securities include any security fair valued by the Fund's Valuation Committee that relies on significant unobservable inputs.
Repurchase agreements
The Fund may engage in repurchase agreement transactions. The Fund, through its custodian, receives delivery of underlying securities collateralizing each repurchase agreement. The counterparty is required to maintain collateral that is at all times at least equal to the repurchase price including interest. In the event of default or bankruptcy by the other party to the agreement, realization and/or retention of the collateral may be subject to legal proceedings.
Foreign currency translations
Values of investments denominated in foreign currencies are converted into U.S. dollars using the New York spot market rate of exchange at the time of valuation. Purchases and sales of investments and dividend and interest income are translated into U.S. dollars using the spot market rate of exchange prevailing on the respective dates of such transactions. The gain or loss resulting from changes in foreign exchange rates is included with net realized and unrealized gain or loss from investments, as appropriate.
Securities lending
The Fund may lend securities up to one-third of the value of its total assets to certain approved brokers, dealers and other financial institutions to earn additional income. The Fund retains the benefits of owning the securities, including receipt of dividends or interest generated by the security. The Fund also receives a fee for the loan. The Fund has the ability to recall the loans at any time and could do so in order to vote proxies or to sell the loaned securities. Each loan is collateralized by cash that exceeded the value of the securities on loan. The market value of the loaned securities is determined daily at the close of business of the Fund and any additional required collateral is delivered to each Fund on the next business day. The Fund has elected to invest the cash collateral in the Dreyfus Government Cash Management Fund and the income earned is paid to the Fund, net of any fees remitted to Goldman Sachs Agency Lending as the lending agent and borrower rebates. The Fund's adviser, Columbia Wanger Asset Management, LLC (CWAM), does not retain any fees earned by the lending program. Generally, in the event of borrower default, the Fund has the right to use the collateral to offset any losses incurred. In the event the Fund is delayed or prevented from exercising its right to dispose of the collateral, there may be a potential loss to the Fund. Some of these losses may be indemnified by the lending agent. The Fund bears the risk of loss with respect to the investment of collateral. The net lending income earned in 2010 by the Fund is included in the Statement of Operations.
Security transactions and investment income
Security transactions are accounted for on the trade date (date the order to buy or sell is executed) and dividend income is recorded on the ex-dividend date, except that certain dividends from foreign securities are recorded as soon as the information is available to the Fund. Interest income is recorded on the accrual basis and includes amortization of discounts on debt obligations when required for federal income tax purposes. Realized gains and losses from security transactions are recorded on an identified cost basis. Awards, if any, from class action litigation related to securities owned may be recorded as a reduction of cost of those securities. If the applicable securities are no longer owned, the proceeds are recorded as realized gains. The Fund estimates the tax character of distributions from real estate investment trusts (REITs). Distributions received in excess of income are recorded as a reduction of the cost of the related i nvestments. If the applicable securities are no longer owned, any distributions received in excess of income are recorded as realized gains.
Restricted securities
Restricted securities are securities that may only be resold upon registration under federal securities laws or in transactions exempt from registration. In some cases, the issuer of restricted securities has agreed to register such securities for resale at the
18
Wanger USA 2010 Annual Report
Notes to Financial Statements, continued
issuer's expense either upon demand by the Fund or in connection with another registered offering of the securities. Many restricted securities may be resold in the secondary market in transactions exempt from registration. Such restricted securities may be determined to be liquid under criteria established by the Board of Trustees.
Fund share valuation
Fund shares are sold and redeemed on a daily basis at net asset value. Net asset value per share is determined daily as of the close of trading on the New York Stock Exchange (the Exchange) on each day the Exchange is open for trading by dividing the total value of the Fund's investments and other assets, less liabilities, by the number of Fund shares outstanding.
Custody fees/Credits
Custody fees are reduced based on the Fund's cash balances maintained with the custodian. The amount is disclosed as a reduction of total expenses in the Statement of Operations.
Federal income taxes
It is the Fund's policy to comply with the provisions of the Internal Revenue Code available to regulated investment companies and, in the manner provided therein, distributes substantially all its taxable income, as well as any net realized gain on sales of investments and foreign currency transactions reportable for federal income tax purposes. Accordingly, the Fund paid no federal income taxes and no federal income tax provision was required.
Expenses
General expenses of the Trust are allocated to the Fund and the other series of the Trust based upon relative net assets or other expense allocation methodologies determined by the nature of the expense. Expenses directly attributable to the Fund are charged to the Fund.
Distributions to shareholders
Distributions to shareholders are recorded on the ex-dividend date.
Indemnification
In the normal course of business, the Trust on behalf of the Fund enters into contracts that contain a variety of representations and warranties and that provide general indemnities. The Fund's maximum exposure under these arrangements is unknown, as this would involve future claims against the Fund. Also, under the Trust's organizational documents, the trustees and officers of the Trust are indemnified against certain liabilities that may arise out of their duties to the Trust. However based on experience, the Fund expects the risk of loss due to these warranties and indemnities to be remote.
3. Federal Tax Information
The timing and character of income and capital gain distributions are determined in accordance with income tax regulations, which may differ from GAAP. Reclassifications are made to the Fund's capital accounts for permanent tax differences to reflect income and gains available for distribution (or available capital loss carryforwards) under income tax regulations.
For the year ended December 31, 2010, permanent book and tax basis differences resulting primarily from differing treatments for net operating losses were identified and reclassified among the components of the Fund's net assets as follows:
Accumulated
Net Investment
Loss | | Accumulated
Net Realized
Gain | | Paid-In Capital | |
| $ | 3,600,303 | | | $ | (205,721 | ) | | $ | (3,394,582 | ) | |
Net investment loss and net realized gains (losses), as disclosed on the Statement of Operations, and net assets were not affected by this reclassification.
The tax character of distributions paid during the years ended December 31, 2010 and December 31, 2009 were as follows:
| | | December 31, 2010 | | December 31, 2009 | |
| Distributions paid from: | |
| Ordinary Income* | | $ | — | | | $ | — | | |
| Long-Term Capital Gains | | | — | | | | — | | |
* For tax purposes short-term capital gain distributions, if any, are considered ordinary income distributions.
As of December 31, 2010, the components of distributable earnings on a tax basis were as follows:
Undistributed
Ordinary
Income | | Undistributed
Long-Term
Capital Gains | | Net Unrealized
Appreciation* | |
| $ | — | | | $ | 78,378,070 | | | $ | 319,290,094 | | |
* The differences between book-basis and tax-basis net unrealized appreciation/depreciation are primarily due to deferral of losses from wash sales.
Capital loss carryforwards that were utilized for the Fund during the year ended December 31, 2010 were $64,124,065.
Management is required to determine whether a tax position of the Fund is more likely than not to be sustained upon examination by the applicable taxing authority, including resolution of any related appeals or litigation processes, based on the technical merits of the position. The tax benefit to be recognized by the Fund is measured as the largest amount of benefit that is greater than fifty percent likely of being realized upon ultimate settlement. Management is not aware of any tax positions for which it is reasonably possible that the total amounts of unrecognized tax benefits will significantly change in the next twelve months. However, management's conclusions may be subject to review and adjustment at a later date based on factors including, but not limited to, new tax laws, regulations, and administrative interpretations (including relevant court decisions). The Fund's federal tax returns for the prior three fiscal years remain sub ject to examination by the Internal Revenue Service.
4. Transactions With Affiliates
CWAM is a wholly owned subsidiary of Columbia Management Investment Advisers, LLC (Columbia Management), which in turn is an indirect, wholly owned subsidiary of Ameriprise Financial, Inc. (Ameriprise Financial). CWAM furnishes continuing investment supervision to the Fund and is responsible for the overall management of the Fund's business affairs.
After the close of business on April 30, 2010, (the Closing), Ameriprise Financial acquired from Bank of America Corporation (BOA), a portion of the asset management business of Columbia Management Group, LLC, including 100% of CWAM. On May 27, 2010, the shareholders of the Fund approved a new investment advisory agreement with CWAM to provide advisory services to the Fund. There were no changes to the Fund's advisory fee rate under the new agreement.
CWAM receives a monthly advisory fee based on the Fund's average daily net assets at the following annual rates:
| Average Daily Net Assets | | Annual Fee Rate | |
| Up to $100 million | | | 0.94 | % | |
| $100 million to $250 million | | | 0.89 | % | |
| $250 million to $2 billion | | | 0.84 | % | |
| $2 billion and over | | | 0.80 | % | |
19
Wanger USA 2010 Annual Report
Notes to Financial Statements, continued
For the year ended December 31, 2010, the Fund's effective investment advisory fee rate, net of fee waivers, was 0.85% of average daily net assets. Effective April 30, 2010, CWAM has contractually agreed to reimburse the Fund to the extent that investment advisory fees exceed an annual percentage of 0.85% of average daily net assets on an annualized basis, through April 30, 2012. The reimbursement to the Fund for the year ended December 31, 2010 was $59,212.
CWAM provides administrative services and receives an administration fee from the Fund at the following annual rates.
Wanger Advisors Trust Aggregate
Average Daily Net Assets of the Trust | | Annual Fee Rate | |
| Up to $4 billion | | | 0.05 | % | |
| $4 billion to $6 billion | | | 0.04 | % | |
| $6 billion to $8 billion | | | 0.03 | % | |
| $8 billion and over | | | 0.02 | % | |
For the year ended December 31, 2010, the Fund's effective administration fee rate was 0.05% of average daily net assets. Prior to the Closing, CWAM had delegated to Columbia Management Advisors, LLC (CMA) an indirect, wholly owned subsidiary of BOA, responsibility to provide certain sub-administrative services to the Fund.
Following the Closing, Columbia Management, a wholly owned subsidiary of Ameriprise Financial, acquired the assets of CMA and subsequently changed its name to Columbia Management, and thereafter continued providing certain sub-administrative services to the Fund. Prior to the Closing, Columbia Management Distributors, Inc., a wholly owned subsidiary of BOA, served as the Fund's distributor and principal underwriter. In connection with the Closing, RiverSource Fund Distributors, Inc., a wholly owned subsidiary of Ameriprise Financial, became the distributor of the Fund and subsequently changed its name to Columbia Management Investment Distributors, Inc. (CMDI). There were no changes to the underwriting discount structure of the Fund or the service or distribution fee rates paid by the Fund as a result of the Closing.
Prior to the Closing, Columbia Management Services, Inc., an indirect, wholly owned subsidiary of BOA, provided shareholder services to the Fund and contracted with Boston Financial Data Services (BFDS) to serve as subtransfer agent. In connection with the Closing, RiverSource Service Corporation, a wholly owned subsidiary of Ameriprise Financial, became the transfer agent of the Fund and subsequently changed its name to Columbia Management Investment Services Corp. (CMIS). The transfer agent fee rates paid by the Fund did not change as a result of the change in transfer agent. For its services, the Fund pays CMIS a monthly fee at the annual rate of $21.00 per open account. CMIS also receives reimbursement for certain out-of-pocket expenses. The arrangement with BFDS has been continued by CMIS.
Certain officers and trustees of the Trust are also officers of CWAM. The Trust makes no direct payments to its officers and trustees who are affiliated with CWAM.
The Board of Trustees has appointed a Chief Compliance Officer of the Trust in accordance with federal securities regulations. The Fund, along with other affiliated funds, pays its pro-rata share of the expenses associated with the Office of the Chief Compliance Officer. These expenses are disclosed separately as "Chief compliance officer expenses" in the Statement of Operations.
The Trust offers a deferred compensation plan for its independent trustees. Under that plan, a trustee may elect to defer all or a portion of his or her compensation. Amounts deferred are retained by the Trust and may represent an unfunded obligation of the Trust. The value of amounts deferred is determined by reference to the change in value of Class Z shares of one or more series of Columbia Acorn Trust or a money market fund as specified by the trustee. Benefits under the deferred compensation plan are payable when the trustee ceases to be a member of the Board of Trustees.
An affiliated person of the Fund may include any company in which the Fund owns five percent or more of its outstanding voting shares. Details of investments in those affiliated companies are presented in the Notes to the Statement of Investments on page 13.
During the year ended December 31, 2010, the Fund engaged in purchase and sales transactions with funds that have a common investment adviser (or affiliated investment advisers), common directors/trustees, and/or common officers. Those purchase and sale transactions complied with provisions of Rule 17a-7 under the Investment Company Act of 1940 and were $485,760 and $428,527,897, respectively.
During May and June 2010, a significant number of shares of the Fund, representing the interests of owners of contracts issued by insurance companies affiliated with Ameriprise Financial, were redeemed. In an effort to minimize the impact on the remaining shareholders, Ameriprise Financial agreed to reimburse the Fund $34,624 in interest charges and $19,197 in certain transaction costs that were incurred as a result of the redemption.
5. Borrowing Arrangements
The Trust participates in a $150 million credit facility, along with another Trust managed by CWAM, which was entered into to facilitate portfolio liquidity. Under the facility, interest is charged to each participating fund based on its borrowings at a rate per annum equal to the higher of Federal Funds Rate or Overnight LIBOR plus 1.25%. In addition, a commitment fee of 0.15% per annum of the unutilized line of credit is accrued and apportioned among the participating funds based on their relative net assets. The commitment fee is included in "Other expenses" in the Statement of Operations. For the year ended December 31, 2010, the average daily loan balance outstanding on days where borrowing existed was $100,537,500 at a weighted average interest rate of 1.55%. The Trust enters into this line of credit for one year durations. The Trust has secured the line of credit for the entire year of 2011.
6. Fund Share Transactions
Proceeds and payments on Fund shares as shown in the Statement of Changes in Net Assets are in respect of the following numbers of shares:
| | | Year ended
December 31, 2010 | | Year ended
December 31, 2009 | |
| Shares sold | | | 1,377,861 | | | | 3,261,189 | | |
| Less shares redeemed | | | (20,982,637 | ) | | | (6,075,892 | ) | |
| Net decrease in shares outstanding | | | (19,604,776 | ) | | | (2,814,703 | ) | |
7. Investment Transactions
The aggregate cost of purchases and proceeds from sales other than short-term obligations for the year ended December 31, 2010 were $273,869,096 and $826,414,047, respectively.
8. Information Regarding Pending and Settled Legal Proceedings
In June 2004, an action captioned John E. Gallus et al. v. American Express Financial Corp. and American Express Financial Advisors Inc. was filed in the United States District Court for the District of Arizona. The plaintiffs allege that they are investors in several American Express Company (now known as legacy RiverSource) mutual funds and they purport to bring the action derivatively on behalf of those funds under the Investment Company Act of 1940. The plaintiffs allege that fees allegedly paid to the defendants by the funds for investment advisory and administrative services are excessive. The plaintiffs seek remedies including restitution and rescission of investment advisory and distribution agreements. The plaintiffs voluntarily agreed to transfer this case to the United States District Court for the Distri ct of Minnesota (the District Court). In response to defendants' motion to dismiss the complaint, the District Court dismissed one of plaintiffs' four claims and granted plaintiffs limited discovery. Defendants moved for summary judgment in April 2007. Summary judgment was granted in the defendants' favor on July 9, 2007. The plaintiffs filed a notice of appeal with the Eighth Circuit Court of Appeals (the Eighth Circuit) on August 8, 2007. On April 8, 2009, the Eighth Circuit reversed summary judgment and remanded to the District Court for further proceedings. On August 6, 2009, defendants filed a writ of certiorari with the U.S. Supreme Court (the Supreme Court), asking the Supreme Court to stay the District Court proceedings while the Supreme Court considers and rules in a case captioned Jones v. Harris Associates, which involves issues of law similar to those presented in the Gal lus case. On March 30,
20
Wanger USA 2010 Annual Report
Notes to Financial Statements, continued
2010, the Supreme Court issued its ruling in Jones v. Harris Associates, and on April 5, 2010, the Supreme Court vacated the Eighth Circuit's decision in the Gallus case and remanded the case to the Eighth Circuit for further consideration in light of the Supreme Court's decision in Jones v. Harris Associates. On June 4, 2010, the Eighth Circuit remanded the Gallus case to the District Court for further consideration in light of the Supreme Court's decision in Jones v. Harris Associates. On December 9, 2010, the District Court reinstated its July 9, 2007 summary judg ment order in favor of the defendants. On January 10, 2011, plaintiffs filed a notice of appeal with the Eighth Circuit.
In December 2005, without admitting or denying the allegations, American Express Financial Corporation (AEFC, which is now known as Ameriprise Financial, Inc. (Ameriprise Financial)), entered into settlement agreements with the Securities and Exchange Commission (SEC) and Minnesota Department of Commerce (MDOC) related to market timing activities. As a result, AEFC was censured and ordered to cease and desist from committing or causing any violations of certain provisions of the Investment Advisers Act of 1940, the Investment Company Act of 1940, and various Minnesota laws. AEFC agreed to pay disgorgement of $10 million and civil money penalties of $7 million. AEFC also agreed to retain an independent distribution consultant to assist in developing a plan for distribution of all disgorgement and civil penalties ordered by the SEC in accordance with various undertakings detailed at http://www.sec.gov/litigation/admin/ia-2451.pdf. Ameriprise Financial and its affiliates have cooperated with the SEC and the MDOC in these legal proceedings, and have made regular reports to the RiverSource, Seligman and Threadneedle funds' Boards of Directors/Trustees.
Ameriprise Financial and certain of its affiliates have historically been involved in a number of legal, arbitration and regulatory proceedings, including routine litigation, class actions, and governmental actions, concerning matters arising in connection with the conduct of their business activities. Ameriprise Financial believes that the Funds are not currently the subject of, and that neither Ameriprise Financial nor any of its affiliates are the subject of, any pending legal, arbitration or regulatory proceedings that are likely to have a material adverse effect on the Funds or the ability of Ameriprise Financial or its affiliates to perform under their contracts with the Funds. Ameriprise Financial is required to make 10-Q, 10-K and, as necessary, 8-K filings with the SEC on legal and regulatory matters that relate to Ameriprise Financial and its affiliates. Copies of these filings may be obtained by accessing the SEC website at www.s ec.gov.
There can be no assurance that these matters, or the adverse publicity associated with them, will not result in increased fund redemptions, reduced sale of fund shares or other adverse consequences to the Funds. Further, although we believe proceedings are not likely to have a material adverse effect on the Funds or the ability of Ameriprise Financial or its affiliates to perform under their contracts with the Funds, these proceedings are subject to uncertainties and, as such, we are unable to estimate the possible loss or range of loss that may result. An adverse outcome in one or more of these proceedings could result in adverse judgments, settlements, fines, penalties or other relief that could have a material adverse effect on the consolidated financial condition or results of operations of Ameriprise Financial.
*****
CWAM, Columbia Acorn Trust (another mutual fund family advised by CWAM), and the trustees of Columbia Acorn Trust (collectively, the "Columbia defendants") were named as defendants in class and derivative complaints that were consolidated in a Multi-District Action (the MDL Action) in the federal district court of Maryland. These lawsuits contend that defendants permitted certain investors to market time their trades in certain Columbia Acorn Funds. The MDL Action is ongoing. However, all claims against the Trust and the Independent Trustees of the Trust have been dismissed. Columbia Acorn and CWAM are also defendants in a state court class action lawsuit that alleges, in summary, that the Trust and CWAM exposed shareholders of Columbia Acorn International to trading by market timers by allegedly: (a) failing to properly evaluate daily whether a significant event affecting the value of the Fund's securities had occurred after foreign market s had closed but before the calculation of the Fund's net asset value (NAV); (b) failing to implement the Fund's portfolio valuation and share pricing policies and procedures; and (c) failing to know and implement applicable rules and regulations concerning the calculation of NAV (the Fair Valuation Lawsuit). The United States Court of Appeals for the Seventh Circuit ruled that the plaintiffs' state law claims were preempted under federal law, resulting in the dismissal of plaintiffs' complaint. Plaintiffs appealed the Seventh Circuit's ruling to the United States Supreme Court. The Supreme Court reversed the Seventh Circuit's ruling on jurisdictional grounds and the case was remanded to the state court.
On March 21, 2005, a class action complaint was filed against the Trust and CWAM seeking to rescind the contingent deferred sales charge (CDSC) assessed upon redemption of Class B shares of the Columbia Acorn Funds (the CDSC Lawsuit). In addition to the rescission of sales charges, plaintiffs seek recovery of actual damages, attorneys' fees and costs. The case was transferred to the MDL Action in the federal district court of Maryland. On September 14, 2007, the plaintiffs and the Columbia defendants named in the MDL Action, including the Columbia family of funds, entered into a stipulation of settlement with respect to all Columbia-related claims in the MDL Action described above, including the CDSC and Fair Valuation Lawsuits.
On April 23, 2010, the parties of the MDL Action filed a motion seeking: (a) preliminary approval of the MDL settlements; (b) the conditional certification of the plaintiff class for purposes of settlement; (c) approval of the form and manner of giving notice to the plaintiff class of the proposed settlements; and (d) approval of the proposed schedule for various deadlines in connection with the final settlement hearing. The motion was presented to and approved by the court on May 7, 2010.
On October 21, 2010, the court held a final hearing regarding the MDL settlements and on October 25, 2010 issued a final judgment and related orders that: (a) approved the settlements as fair, reasonable and adequate, and in the best interests of members of both the plaintiff class and current shareholders of the Columbia funds, including the Columbia Acorn Funds; (b) dismissed with prejudice all complaints against the Columbia defendants; and (c) approved a plan of distribution for the amounts due to the plaintiff class as established in the settlements. The orders of settlement do not create any liability for the Columbia Acorn Funds.
CWAM believes that the lawsuits described in the four preceeding paragraphs are not likely to materially affect its ability to provide investment management services to the Funds.
21
Wanger USA 2010 Annual Report
Report of Independent Registered Public Accounting Firm
To the Board of Trustees and Shareholders of Wanger USA:
In our opinion, the accompanying statement of assets and liabilities, including the statement of investments, and the related statements of operations and of changes in net assets and the financial highlights present fairly, in all material respects, the financial position of Wanger USA (a series of the Wanger Advisers Trust, hereinafter referred to as the "Fund") at December 31, 2010, the results of its operations for the year then ended, the changes in its net assets for each of the two years in the period then ended and the financial highlights for each of the five years in the period then ended, in conformity with accounting principles generally accepted in the United States of America. These financial statements and financial highlights (hereafter referred to as "financial statements") are the responsibility of the Fund's management; our responsibility is to express an opinion on these financial statements based on our audits. We cond ucted our audits of these financial statements in accordance with the standards of the Public Company Accounting Oversight Board (United States). Those standards require that we plan and perform the audit to obtain reasonable assurance about whether the financial statements are free of material misstatement. An audit includes examining, on a test basis, evidence supporting the amounts and disclosures in the financial statements, assessing the accounting principles used and significant estimates made by management, and evaluating the overall financial statement presentation. We believe that our audits, which included confirmation of securities at December 31, 2010 by correspondence with the custodian and brokers, provide a reasonable basis for our opinion.
PricewaterhouseCoopers LLP
Chicago, Illinois
February 15, 2011
22
Wanger USA 2010 Annual Report
Federal Income Tax Information (Unaudited)
The Fund hereby designates as a capital gain dividend with respect to the fiscal year ended December 31, 2010, $82,296,974, or, if subsequently determined to be different, the net capital gain of such year.
23
Wanger USA 2010 Annual Report
Board of Trustees and Management of Wanger Advisors Trust
Each trustee may serve a term of unlimited duration. The Trust's By-laws generally require that a trustee retire at the end of the calendar year in which the trustee attains the age of 75 years. The trustees appoint their own successors, provided that at least two-thirds of the trustees, after such appointment, have been elected by shareholders. Shareholders may remove a trustee, with or without cause, upon the vote of two-thirds of the Trust's outstanding shares at any meeting called for that purpose. A trustee may be removed, with or without cause, upon the vote of a majority of the trustees. The names of the trustees and officers of the Trust, the date each was first elected or appointed to office, their principal business occupations during at least the last five years, number of portfolios in the fund complex they oversee, and other directorships they hold, are shown below. Each trustee serves in such capacity for each of the six serie s of Columbia Acorn Trust and for each of the four series of Wanger Advisors Trust.
The address for the trustees and officers of the Trust is Columbia Wanger Asset Management, LLC, 227 West Monroe Street, Suite 3000, Chicago, Illinois 60606. The Funds' Statement of Additional Information includes additional information about the Funds' trustees and officers. You may obtain a free copy of the Statement of Additional Information by writing or calling toll-free:
Columbia Wanger Asset Management, LLC
Shareholder Services Group
227 W. Monroe, Suite 3000
Chicago IL 60606
1-800-922-6769
Name, Position(s) with
Wanger Advisors Trust
and Age at
December 31, 2010 | | Year First
Elected or
Appointed
to Office* | | Principal Occupation(s) during
Past Five Years | | Number of
Portfolios in
Fund Complex
Overseen by
Trustee/Officer | | Other
Directorships
in addition to
Wanger Advisors Trust | |
| Trustees who are not interested persons of Wanger Advisors Trust: | | | | | | | |
|
Laura M. Born, 45,
Trustee | | | 2007 | | | Adjunct Assistant Professor of Finance, University of Chicago Booth School of Business; formerly, Managing Director – Investment Banking, JP Morgan Chase & Co. (broker/dealer) 2002-2007; prior thereto, associated with JP Morgan as an investment professional since 1991. | | | 10 | | | Columbia Acorn Trust | |
|
Michelle L. Collins, 50,
Trustee | | | 2008 | | | President, Cambium LLC (financial advisory firm) since 2007; Advisory Board Member, Svoboda Capital Partners LLC (private equity firm) since 2007; Managing Director Svoboda Capital Partners LLC, 1998-2006. | | | 10 | | | Columbia Acorn Trust; Bucyrus International, Inc. (mining equipment manufacturer); Molex, Inc. (electronics components manufacturer); CDW Corporation (electronics components manufacturer) (until October 2007). | |
|
Maureen M. Culhane, 62,
Trustee | | | 2007 | | | Retired. Formerly, Vice President, Goldman Sachs Asset Management, L.P. (investment adviser), 2005-2007, and Vice President (Consultant) — Strategic Relationship Management, Goldman Sachs & Co., 1999-2005. | | | 10 | | | Columbia Acorn Trust | |
|
Margaret M. Eisen, 57,
Trustee | | | 2002 | | | Chief Investment Officer, EAM International LLC (corporate finance and asset management) since 2003; Managing Director, CFA Institute, 2005-2008. | | | 10 | | | Columbia Acorn Trust; Antigenics, Inc. (biotechnology and pharmaceuticals) (until June 2009). | |
|
John C. Heaton, 51,
Trustee | | | 2010 | | | Joseph L. Gidwitz Professor of Finance, University of Chicago Booth School of Business; financial consultant. | | | | Columbia Acorn Trust | |
|
Steven N. Kaplan, 51,
Trustee and Vice Chairman of the Board | | | 1999 | | | Neubauer Family Professor of Entrepreneurship and Finance, University of Chicago Booth School of Business. | | | 10 | | | Columbia Acorn Trust; Accretive Health, Inc. (healthcare management services provider); Morningstar, Inc. (provider of independent investment research). | |
|
24
Wanger USA 2010 Annual Report
Board of Trustees and Management of Wanger Advisors Trust
Name, Position(s) with
Wanger Advisors Trust
and Age at
December 31, 2010 | | Year First
Elected or
Appointed
to Office* | | Principal Occupation(s) during
Past Five Years | | Number of
Portfolios in
Fund Complex
Overseen by
Trustee/Officer | | Other
Directorships
in addition to
Wanger Advisors Trust | |
| Trustees who are not interested persons of Wanger Advisors Trust: (continued) | | | | | | | |
|
David C. Kleinman, 75,
Trustee (1) | | | 1972 | | | Adjunct Professor of Strategic Management, University of Chicago Booth School of Business; business consultant. | | | 10 | | | Columbia Acorn Trust; Sonic Foundry, Inc. (rich media systems and software). | |
|
Allan B. Muchin, 74,
Trustee | | | 1998 | | | Chairman Emeritus, Katten Muchin Rosenman LLP (law firm). | | | 10 | | | Columbia Acorn Trust | |
|
David B. Small, 54,
Trustee | | | 2010 | | | Managing Director, Chairman of Investment Committee, Grosvenor Capital Management, L.P. (investment adviser). | | | 10 | | | Columbia Acorn Trust | |
|
James A. Star, 49,
Trustee and Chairman of the Board | | | 2006 | | | President, Longview Asset Management LLC (investment adviser) since 2003; associated with Longview or its predecessors and affiliates since 1994. | | | 10 | | | Columbia Acorn Trust | |
|
| Trustees who are interested persons of Wanger Advisors Trust: | | | | | | | |
|
Charles P. McQuaid, 57,
Trustee and President (2) | | | 1992 | | | President and Chief Investment Officer, CWAM or its predecessors, since October 2003; associated with CWAM or its predecessors as an investment professional since 1978. | | | 10 | | | Columbia Acorn Trust | |
|
David J. Rudis, 57,
Trustee (3) | | | 2010 | | | National Checking and Debit Executive, and Illinois President, Bank of America, 2007 to 2009; President, Consumer Banking Group, LaSalle National Bank, 2004 to 2007. | | | 10 | | | Columbia Acorn Trust | |
|
| Trustee Emeritus | | | | | | | |
|
Ralph Wanger, 76,
Trustee Emeritus (4) | | | 1970 | | | Founder, CWAM. Formerly, President, Chief Investment Officer and portfolio manager, CWAM or its predecessors, July 1992 – September 2003; Director, Wanger Investment Company PLC; Consultant, CWAM or its predecessors, September 2003 – September 2005. | | | 10 | | | Columbia Acorn Trust | |
|
| Officers of Wanger Advisors Trust: | | | | | | | |
|
Ben Andrews, 44,
Vice President | | | 2004 | | | Portfolio manager and analyst, CWAM or its predecessors, since 1998; Vice President, Columbia Acorn Trust and Wanger Advisors Trust since 2004. | | | 10 | | | None | |
|
Michael G. Clarke, 41,
Assistant Treasurer | | | 2004 | | | Vice President, Columbia Management Investment Advisers, LLC since May 2010; Managing Director of Fund Administration, Columbia Management Advisors, LLC, from September 2004 to April 2010; senior officer of Columbia Family of Funds and affiliated funds since 2002. | | | 10 | | | None | |
|
Joseph F. DiMaria, 43,
Assistant Treasurer | | | 2010 | | | Vice President, Mutual Fund Administration, Columbia Management Investment Advisers, LLC, since May 2010; Director of Fund Administration, Columbia Management Advisors, LLC from January 2006 to April 2010; Head of Tax/Compliance and Assistant Treasurer, Columbia Management Advisors, LLC, from November 2004 to December 2005. | | | 10 | | | None | |
|
P. Zachary Egan, 42,
Vice President | | | 2003 | | | Director of International Research, CWAM or its predecessors, since December 2004; Vice President, Columbia Acorn Trust since 2003 and Wanger Advisors Trust since 2007; portfolio manager and analyst, CWAM or its predecessors, since 1999. | | | 10 | | | None | |
|
John Kunka, 40,
Assistant Treasurer | | | 2006 | | | Director of Accounting and Operations, CWAM or its predecessors, since May 2006; Manager of Mutual Fund Operations, Calamos Advisors, Inc. (investment advisor), September 2005 – May 2006; prior thereto, Manager of Mutual Fund Administration, Van Kampen Investments. | | | 10 | | | None | |
|
25
Wanger USA 2010 Annual Report
Board of Trustees and Management of Wanger Advisors Trust
Name, Position(s) with
Wanger Advisors Trust
and Age at
December 31, 2010 | | Year First
Elected or
Appointed
to Office* | | Principal Occupation(s) during
Past Five Years | | Number of
Portfolios in
Fund Complex
Overseen by
Trustee/Officer | | Other
Directorships
in addition to
Wanger Advisors Trust | |
| Officers of Columbia Acorn Trust: (continued) | | | | | | | |
|
Joseph C. LaPalm, 41,
Vice President | | | 2006 | | | Chief Compliance Officer, CWAM since 2005; prior thereto, compliance officer, William Blair & Company (investment firm). | | | 10 | | | None | |
|
Bruce H. Lauer, 53,
Vice President, Secretary and Treasurer | | | 1995 | | | Chief Operating Officer, CWAM or its predecessors, since April 2000; Vice President, Secretary and Treasurer, Columbia Acorn Trust and Wanger Advisors Trust, since 1995; Director, Wanger Investment Company PLC; formerly, Director, Banc of America Capital Management (Ireland) Ltd.; and formerly, Director, Bank of America Global Liquidity Funds, PLC. | | | 10 | | | None | |
|
Louis J. Mendes III, 46,
Vice President | | | 2003 | | | Portfolio manager and analyst, CWAM or its predecessors, since 2001; Vice President, Columbia Acorn Trust since 2003 and Wanger Advisors Trust since 2005. | | | 10 | | | None | |
|
Robert A. Mohn, 49,
Vice President | | | 1997 | | | Director of Domestic Research, CWAM or its predecessors, since March 2004; Vice President, Columbia Acorn Trust and Wanger Advisors Trust, since 1997; portfolio manager and analyst, CWAM or its predecessors, since August 1992. | | | 10 | | | None | |
|
Christopher J. Olson, 46,
Vice President | | | 2001 | | | Portfolio manager and analyst, CWAM or its predecessors, since January 2001; Vice President, Columbia Acorn Trust and Wanger Advisors Trust, since 2001. | | | 10 | | | None | |
|
Scott R. Plummer, 51,
Assistant Secretary | | | 2010 | | | Chief Legal Officer and Assistant Secretary, Columbia Management Investment Advisers, LLC since June 2005; Vice President and Lead Chief Counsel — Asset Management, Ameriprise Financial since May 2010 (previously Vice President and Chief Counsel — Asset Management, from 2005 to April 2010, and Vice President — Asset Management Compliance from 2004 to 2005); Vice President, Chief Counsel and Assistant Secretary, Columbia Management Investment Distributors, Inc. since 2008; Vice President, General Counsel and Secretary, Ameriprise Certificate Company since 2005; Chief Counsel, RiverSource Distributors, Inc. from 2006 to 2010; Vice President, General Counsel and Secretary, RiverSource Funds, since December 2006; Senior Vice President, Secretary and Chief Legal Officer, Columbia Family of Funds since May 2010. | | | 10 | | | None | |
|
Christopher O. Petersen, 41,
Assistant Secretary | | | 2010 | | | Vice President and Chief Counsel, Ameriprise Financial since January 2010 (formerly Vice President and Group Counsel or Counsel from April 2004 to January 2010); Assistant Secretary of RiverSource Funds since January 2007. | | | 10 | | | None | |
|
Robert P. Scales, 58,
Chief Compliance Officer, Chief Legal Officer, Senior Vice President and General Counsel | | | 2004 | | | Chief Compliance Officer, Chief Legal Officer, Senior Vice President and General Counsel, Columbia Acorn Trust and Wanger Advisors Trust, since 2004. | | | 10 | | | None | |
|
Linda Roth-Wiszowaty, 41,
Assistant Secretary | | | 2006 | | | Business support analyst, CWAM, since April 2007; prior thereto executive administrator, CWAM or its predecessors, and executive assistant to the Chief Operating Officer of CWAM or its predecessors. | | | 10 | | | None | |
|
* Dates prior to April 1992 correspond to the date of first election or appointment as a trustee or officers of The Acorn Fund, Inc., the predecessor trust to Columbia Acorn Trust.
(1) Mr. Kleinman retired at the end of calendar year 2010.
(2) Mr. McQuaid is an "interested person" of Wanger Advisors Trust and of CWAM, as defined in the Investment Company Act of 1940 because he is an officer of the Trust and of CWAM.
(3) Mr. Rudis commenced service as a Trustee on January 1, 2011. Mr. Rudis is an "interested person" of Wanger Advisors Trust, as defined in the New York Attorney General's Assurance of Discontinuance ("Order") entered into in February 2005 by Columbia Management Advisors, LLC (an indirect subsidiary of Bank of America Corporate ("BOA")) and Columbia Management Distributors, Inc. (an indirect subsidiary of BOA), because of his former employment as a BOA executive.
(4) As permitted under the Wanger Advisors Trust's By-Laws, Mr. Wanger serves as a non-voting Trustee Emeritus of the Trust.
26
Wanger USA 2010 Annual Report
This page intentionally left blank.
27
Wanger USA 2010 Annual Report
This page intentionally left blank.
28
Wanger USA 2010 Annual Report

Columbia Wanger Funds
Transfer Agent,
Dividend Disbursing Agent*
Columbia Management Investment
Services Corp.
P.O. Box 8081
Boston, Massachusetts
02266-8081
Distributor*
Columbia Management Investment
Distributors, Inc.
One Financial Center
Boston, Massachusetts
02111-2621
Investment Adviser
Columbia Wanger Asset Management, LLC
227 West Monroe Street, Suite 3000
Chicago, Illinois 60606
1-888-4-WANGER
(1-888-492-6437)
Legal Counsel to the Funds
Perkins Coie, LLP
Washington, DC
Legal Counsel to the Independent Trustees
Drinker Biddle & Reath LLP
Philadelphia, Pennsylvania
Independent Registered Public
Accounting Firm
PricewaterhouseCoopers LLP
Chicago, Illinois
* As of May 1, 2010
This report, including the schedules of investments and financial statements, is submitted for the general information of the shareholders of the Wanger Advisors Trust.
A description of the Fund's proxy voting policies and procedures and a copy of the Fund's voting record for the most recent 12-month period ended June 30 are available (i) on the Securities and Exchange Commission's website at www.sec.gov, and (ii) without charge, upon request, by calling 888-492-6437.
The Fund files a complete schedule of portfolio holdings with the SEC for the first and third quarters of each fiscal year on Form N-Q. The Fund's Form N-Q is available on the SEC's website at www.sec.gov and may be reviewed and copied at the SEC's Public Reference Room in Washington, D.C. Information on the operation of the Pubic Reference Room may be obtained by calling 800-SEC-0330. The Fund's complete portfolio holdings are disclosed at www.columbiafunds.com approximately 30 days after each month-end.
29
Columbia Wanger Funds
© 2011 Columbia Management Investments Advisers, LLC. All rights reserved.
C-1466 A (2/11) 113552
Item 2. Code of Ethics.
(a) The registrant has adopted a code of ethics that applies to the registrant’s principal executive officer, principal financial officer, principal accounting officer or controller, or persons performing similar functions, regardless of whether these individuals are employed by the registrant or a third party.
(b) During the period covered by this report, there were not any amendments to a provision of the code of ethics adopted in 2(a) above.
(c) During the period covered by this report, there were no waivers, including any implicit waivers, from a provision of the code of ethics described in 2(a) above that relates to one or more of the items set forth in paragraph (b) of this item’s instructions.
Item 3. Audit Committee Financial Expert.
The registrant’s Board of Trustees has determined that Laura M. Born, Michelle L. Collins and David C. Kleinman, each of whom are members of the registrant’s Board of Trustees and Audit Committee, each qualify as an audit committee financial expert. Ms. Born, Ms. Collins and Mr. Kleinman are each independent trustees, as defined in paragraph (a)(2) of this item’s instructions.
Item 4. Principal Accountant Fees and Services.
(a) Audit Fees. Aggregate Audit Fees billed by the principal accountant for professional services rendered during the fiscal years ended December 31, 2010 and December 31, 2009 are approximately as follows:
2010 | | 2009 | |
$ | 93,300 | | $ | 91,500 | |
| | | | | |
Audit Fees include amounts related to the audit of the registrant’s annual financial statements or services that are normally provided by the accountant in connection with statutory and regulatory filings or engagements for those fiscal years.
(b) Audit-Related Fees. Aggregate Audit-Related Fees billed to the registrant by the principal accountant for professional services rendered during the fiscal years ended December 31, 2010 and December 31, 2009 are approximately as follows:
Audit-Related Fees include amounts for assurance and related services by the principal accountant that are reasonably related to the performance of the audit of the registrant’s financial statements and are not reported in Audit Fees above. In both fiscal years 2010 and 2009, Audit-Related Fees consist of agreed-upon procedures performed for other audit-related additional testing.
During the fiscal years ended December 31, 2010 and December 31, 2009, there were no Audit-Related Fees billed by the registrant’s principal accountant to the registrant’s investment adviser (not including any sub-adviser whose role is primarily portfolio management and is subcontracted with or overseen by another investment adviser) and any entity controlling, controlled by, or under common control with the adviser that provides ongoing services to the registrant for an engagement that related directly to the operations and financial reporting of the registrant.
(c) Tax Fees. Aggregate Tax Fees billed by the principal accountant to the registrant for professional services rendered during the fiscal years ended December 31, 2010 and December 31, 2009 are approximately as follows:
2010 | | 2009 | |
$ | 26,200 | | $ | 14,500 | |
| | | | | |
Tax Fees incurred in both fiscal years 2010 and 2009 relate to the review of annual tax returns, the review of required shareholder distribution calculations and include amounts for professional services by the principal accountant for tax compliance, tax advice and tax planning.
During the fiscal years ended December 31, 2010 and December 31, 2009, there were no Tax Fees billed by the registrant’s principal accountant to the registrant’s investment adviser (not including any sub-adviser whose role is primarily portfolio management and is subcontracted with or overseen by another investment adviser) and any entity controlling, controlled by, or under common control with the adviser that provides ongoing services to the registrant for an engagement that related directly to the operations and financial reporting of the registrant.
(d) All Other Fees. Aggregate All Other Fees billed by the principal accountant to the registrant for professional services rendered during the fiscal years ended December 31, 2010 and December 31, 2009 are as follows:
All Other Fees include amounts for products and services provided by the principal accountant, other than the services reported in paragraphs (a) through (c) above.
Aggregate All Other Fees billed by the registrant’s principal accountant to the registrant’s investment adviser (not including any sub-adviser whose role is primarily portfolio management and is subcontracted with or overseen by another investment adviser) and any entity controlling, controlled by, or under common control with the adviser that provides ongoing services to the registrant for an engagement that related directly to the operations and financial reporting of the registrant during the fiscal years ended December 31, 2010 and December 31, 2009 are approximately as follows:
2010 | | 2009 | |
$ | 135,000 | | $ | 136,200 | |
| | | | | |
In both fiscal years 2010 and 2009, All Other Fees consist of professional services rendered for internal control reviews of the registrant’s transfer agent.
(e)(1) Audit Committee Pre-Approval Policies and Procedures
The policy of the registrant’s Audit Committee is to specifically pre-approve (i) all audit and non-audit (including audit related, tax and all other) services provided by the registrant’s independent auditor to the registrant and individual funds (collectively “Fund Services”) and (ii) all non-audit services provided by the registrant’s independent auditor to the funds’ adviser or a control affiliate of the adviser, that relate directly to the funds’ operations and financial reporting (collectively “Fund-related Adviser Services”). A “control affiliate” is an entity controlling, controlled by, or under common control with the adviser that provides ongoing services to the funds, and the term “adviser” is deemed to exclude any unaffiliated sub-adviser whose role is primarily portfolio management and is sub-contracted or overseen by another investment adviser.
If such Fund Services or Fund-related Adviser Services are required during the period between the Audit Committee’s regularly scheduled meetings, the Chairman of the Audit Committee has the authority to pre-approve the service, with reporting to the full Audit Committee at the next regularly scheduled meeting.
The Audit Committee will waive pre-approval of Fund Services or Fund-related Adviser Services provided that the requirements under paragraph (c)(7)(i)(C) of Rule 2-01 of Regulation S-X are met.
(e)(2) The percentage of services described in paragraphs (b) through (d) of this Item approved pursuant to the “de minimis” exception under paragraph (c)(7)(i)(C) of Rule 2-01 of Regulation S-X during both fiscal years ended December 31, 2010 and December 31, 2009 was zero.
(f) Not applicable.
(g) The aggregate non-audit fees billed by the registrant’s accountant for services rendered to the registrant, and rendered to the registrant’s investment adviser (not including any sub-adviser whose role is primarily portfolio management and is subcontracted with or overseen by another investment adviser), and any entity controlling, controlled by, or under common control with the adviser that provides ongoing services to the registrant for the fiscal years ended December 31, 2010 and December 31, 2009 are approximately as follows:
2010 | | 2009 | |
$ | 168,400 | | $ | 157,700 | |
| | | | | |
(h) The registrant’s Audit Committee of the Board of Directors has considered whether the provision of non-audit services that were rendered to the registrant’s adviser (not including any sub-adviser whose role is primarily portfolio management and is subcontracted with or overseen by another investment adviser), and any entity controlling, controlled by, or under common control with the investment adviser that provides ongoing services to the registrant that were not pre-approved pursuant to paragraph (c)(7)(ii) of Rule 2-01 of Regulation S-X, is compatible with maintaining the principal accountant’s independence.
Item 5. Audit Committee of Listed Registrants.
Not applicable.
Item 6. Investments
(a) The registrant’s “Schedule I — Investments in securities of unaffiliated issuers” (as set forth in 17 CFR 210.12-12) is included in Item 1 of this Form N-CSR.
(b) Not applicable
Item 7. Disclosure of Proxy Voting Policies and Procedures for Closed-End Management Investment Companies.
Not applicable.
Item 8. Portfolio Managers of Closed-End Management Investment Companies.
Not applicable.
Item 9. Purchases of Equity Securities by Closed-End Management Investment Company and Affiliated Purchasers.
Not applicable.
Item 10. Submission of Matters to a Vote of Security Holders.
There were no material changes to the procedures by which shareholders may recommend nominees to the registrant’s board of directors.
Item 11. Controls and Procedures.
(a) The registrant’s principal executive officer and principal financial officers, based on their evaluation of the registrant’s disclosure controls and procedures as of a date within 90 days of the filing of this report, have concluded that such controls and procedures are adequately designed to ensure that material information required to be disclosed by the registrant in Form N-CSR is accumulated and communicated to the registrant’s management, including the principal executive officer and principal financial officer, or persons performing similar functions, as appropriate to allow timely decisions regarding required disclosure.
(b) There was no change in the registrant’s internal control over financial reporting that occurred during the registrant’s second fiscal quarter of the period covered by this report that has materially affected, or is reasonably likely to materially affect, the registrant’s internal control over financial reporting.
Item 12. Exhibits.
(a)(1) Code of ethics required to be disclosed under Item 2 of Form N-CSR attached hereto as Exhibit 99.CODE ETH.
(a)(2) Certifications pursuant to Rule 30a-2(a) under the Investment Company Act of 1940 (17 CFR 270.30a-2(a)) attached hereto as Exhibit 99.CERT.
(a)(3) Not applicable.
(b) Certification pursuant to Rule 30a-2(b) under the Investment Company Act of 1940 (17 CFR 270.30a-2(b)) attached hereto as Exhibit 99.906CERT.
SIGNATURES
Pursuant to the requirements of the Securities Exchange Act of 1934 and the Investment Company Act of 1940, the registrant has duly caused this report to be signed on its behalf by the undersigned, thereunto duly authorized.
(registrant) | | Wanger Advisors Trust | |
| | |
| | |
By (Signature and Title) | | /s/Robert Mohn | |
| Robert Mohn, Principal Executive Officer | |
| | |
| | |
Date | | February 18, 2011 | |
|
|
Pursuant to the requirements of the Securities Exchange Act of 1934 and the Investment Company Act of 1940, this report has been signed below by the following persons on behalf of the registrant and in the capacities and on the dates indicated. |
|
| | |
By (Signature and Title) | | /s/Robert Mohn | |
| Robert Mohn, Principal Executive Officer | |
| | |
| | |
Date | | February 18, 2011 | |
| | |
| | |
By (Signature and Title) | | /s/Bruce H. Lauer | |
| Bruce H. Lauer, Treasurer | |
| | |
| | |
Date | | February 18, 2011 | |
| | | | | |