UNITED STATES
SECURITIES AND EXCHANGE COMMISSION
Washington, D.C. 20549
FORM N-CSR
CERTIFIED SHAREHOLDER REPORT OF REGISTERED
MANAGEMENT INVESTMENT COMPANIES
Investment Company Act file number | 811-8748 |
|
Wanger Advisors Trust |
(Exact name of registrant as specified in charter) |
|
One Financial Center, Boston, Massachusetts | | 02111 |
(Address of principal executive offices) | | (Zip code) |
|
James R. Bordewick, Jr., Esq. Columbia Management Advisors, LLC One Financial Center Boston, MA 02111 |
(Name and address of agent for service) |
|
Registrant’s telephone number, including area code: | 1-617-426-3750 | |
|
Date of fiscal year end: | December 31 | |
|
Date of reporting period: | December 31, 2008 | |
| | | | | | | | |
Form N-CSR is to be used by management investment companies to file reports with the Commission not later than 10 days after the transmission to stockholders of any report that is required to be transmitted to stockholders under Rule 30e-1 under the Investment Company Act of 1940 (17 CFR 270.30e-1). The Commission may use the information provided on Form N-CSR in its regulatory, disclosure review, inspection, and policymaking roles.
A registrant is required to disclose the information specified by Form N-CSR, and the Commission will make this information public. A registrant is not required to respond to the collection of information contained in Form N-CSR unless the Form displays a currently valid Office of Management and Budget (“OMB”) control number. Please direct comments concerning the accuracy of the information collection burden estimate and any suggestions for reducing the burden to Secretary, Securities and Exchange Commission, 450 Fifth Street, NW, Washington, DC 20549-0609. The OMB has reviewed this collection of information under the clearance requirements of 44 U.S.C. § 3507.
Item 1. Reports to Stockholders.
Wanger International Select
2008 Annual Report

| NOT FDIC INSURED | | May Lose Value | |
|
| NOT BANK ISSUED | | No Bank Guarantee | |
|

Wanger International Select
2008 Annual Report
Table of Contents
| | 1 | | | Understanding Your Expenses | |
|
| | 2 | | | The Population Bust | |
|
| | 4 | | | Performance Review | |
|
| | 6 | | | Statement of Investments | |
|
| | 10 | | | Statement of Assets and Liabilities | |
|
| | 10 | | | Statement of Operations | |
|
| | 11 | | | Statement of Changes in Net Assets | |
|
| | 12 | | | Financial Highlights | |
|
| | 13 | | | Notes to Financial Statements | |
|
| | 17 | | | Report of Independent Registered Public Accounting Firm | |
|
| | 18 | | | Federal Income Tax Information | |
|
| | 19 | | | Management Fee Evaluation of the Senior Officer | |
|
| | 23 | | | Board Approval of the Advisory Agreement | |
|
| | 25 | | | Board of Trustees and Management of Wanger Advisors Trust | |
|
Columbia Wanger Asset Management, L.P. ("CWAM") is one of the leading global small- and mid-cap equity managers in the United States with more than 37 years of small- and mid-cap investment experience. As of December 31, 2008, CWAM manages $19.3 billion in assets and is the investment advisor to Wanger USA, Wanger International, Wanger Select, Wanger International Select (together, the "Wanger Advisors Trust Funds") and the Columbia Acorn Family of Funds. Columbia Management Group, LLC ("Columbia Management") is the investment management division of Bank of America Corporation. Columbia Management entities furnish investment management services and products for institutional and individual investors. The Wanger Advisors Trust Funds and the Columbia Acorn Family of Funds (together with other funds advised by Columbia Management affiliates, the "Columbia Funds") are distributed by Columbia Management Distributors, Inc., member of FINRA, SIPC, part of Columbia Management and an affiliate of Bank of America Corporation. CWAM is a registered investment advisor and an indirect, wholly owned subsidiary of Bank of America Corporation. CWAM is part of Columbia Management.
Please consider the investment objectives, risks, charges and expenses for the Fund carefully before investing. Contact 1-888-4-WANGER for a prospectus, which contains this and other important information about the Fund. You should read it carefully before you invest.
The views expressed in "The Population Bust" and in the Performance Review reflect the current views of the respective parties. These views are not guarantees of future performance and involve certain risks, uncertainties and assumptions that are difficult to predict so actual outcomes and results may differ significantly from the views expressed. These views are subject to change at any time based upon economic, market or other conditions and the respective parties disclaim any responsibility to update such views. These views may not be relied on as investment advice and, because investment decisions for a Columbia Fund are based on numerous factors, may not be relied on as an indication of trading intent on behalf of any particular Columbia Fund. References to specific company securities should not be construed as a recommendation or investment advice.
Wanger International Select 2008 Annual Report
Understanding Your Expenses
As a Fund shareholder, you incur two types of costs. There are transaction costs, which generally include sales charges on purchases and may include redemption or exchange fees. There are also ongoing costs, which generally include investment advisory fees and other Fund expenses. The information on this page is intended to help you understand your ongoing costs of investing in the Fund and to compare these costs with the ongoing costs of investing in other mutual funds.
Analyzing your Fund's expenses
To illustrate these ongoing costs, we have provided an example and calculated the expenses paid by investors in the Fund during the period. The information in the following table is based on an initial, hypothetical investment of $1,000, which is invested at the beginning of the period and held for the entire period. Expense information is calculated two ways and each method provides you with different information. The amount listed in the "Actual" column is calculated using actual operating expenses and total return for the Fund. The amount listed in the "Hypothetical" column assumes that the return each year is 5% before expenses and then applies the Fund's actual expense ratio for the period to the hypothetical return. You should not use the hypothetical account values and expenses to estimate either your actual account balance at the end of the period or the expenses you paid during the period. See the "Compare with other fu nds" information for details on using the hypothetical data.
Estimating your actual expenses
To estimate the expenses that you actually paid over the period, first you will need your account balance at the end of the period.
1. Divide your ending account balance by $1,000. For example, if an account balance was $8,600 at the end of the period, the result would be 8.6.
2. In the section of the table below titled "Expenses paid during the period," you will find a dollar amount in the column labeled "Actual." Multiply this amount by the result from step 1. Your answer is an estimate of the expenses you paid on your account during the period.
July 1, 2008 – December 31, 2008
| | | Account value at the
beginning of the period ($) | | Account value at the
end of the period ($) | | Expenses paid during
the period ($) | | Fund's annualized
expense ratio (%)* | |
| | | Actual | | Hypothetical | | Actual | | Hypothetical | | Actual | | Hypothetical | | Actual | |
| Wanger International Select | | | 1,000.00 | | | | 1,000.00 | | | | 577.10 | | | | 1,018.50 | | | | 5.23 | | | | 6.70 | | | | 1.32 | | |
*For the six months ended December 31, 2008.
Expenses paid during the period are equal to the Fund's annualized expense ratio, multiplied by the average account value over the period, then multiplied by the number of days in the Fund's most recent fiscal half-year and divided by 366.
It is important to note that the expense amounts shown in the table are meant to highlight only ongoing costs of investing in the Fund. Expenses paid during the period do not include any insurance charges imposed by your insurance company's separate account. The hypothetical example provided is useful in comparing ongoing costs only and will not help you determine the relative total costs of owning different funds whose shareholders may incur transaction costs.
Compare with other funds
Since all mutual funds are required to include the same hypothetical calculations about expenses in shareholder reports, you can use this information to compare the ongoing cost of investing in the Fund with other funds. To do so, compare the 5% hypothetical example with the 5% hypothetical examples of other funds. As you compare hypothetical examples of other funds, it is important to note that hypothetical examples are meant to highlight the ongoing cost of investing in a fund and do not reflect any transaction costs, such as sales charges, redemption fees or exchange fees that may be incurred by shareholders of other funds. Expenses paid during the period do not include any insurance charges imposed by your insurance company's separate accounts.
1
Wanger International Select 2008 Annual Report

The Population Bust
Important socio-economic predictions are based on demographics. For example, virtually all of the people who will retire in 2058 are living today and retirement age, immigration and mortality trends are utilized to create assumptions that will be used to predict the number of future retirees. The labor force of 2028 and the military age population of 2025 are similarly predictable. These factors are major drivers of government burdens, GDP growth and military potential. Demographics indicate that the world is unlikely to age gracefully.
World Demographic Trends
Richard Jackson and Neil Howe's, The Graying of the Great Powers provides an excellent summary of current demographic trends. Its authors conclude that, "The world is entering a demographic transformation of unprecedented dimensions...a fundamental demographic shift with no parallel in the history of humanity.... There is almost no chance that it will not happen—or that it will be reversed in our lifetime."1
The world's current great powers2 are aging at remarkably divergent rates. The United States is barely aging and has a fertility rate of 2.0 to 2.1 births per woman during child-bearing years, very near long-term zero population growth. This country is one of the youngest developed nations, and the age gap between the United States and other developed countries is projected to widen. "By the mid-2020's, the United States will be the only major developed country with more children under age 20 than elderly over age 65—and the only one whose working-age population will still be growing," write Jackson and Howe. The U.S. work force is projected to grow 14% between 2005 and 2030.3 & nbsp;
Russian fertility rates plunged through the 1980s and rest today at 1.2 to 1.3 births. Risky lifestyles and a poor health care system have caused mortality rates to soar. Life expectancy for a Russian male has dropped to 59 years, lower than that of Bangladeshi males! Russia's working age population (those aged 20 to 64) will plunge 17% from 2005 to 2030.4 Prime Minister Vladimir Putin termed Russia's lack of births as "the most acute problem facing our country today."5
Jackson and Howe note that Japan is ground zero for demographic aging. Like Russia, its fertility rate has fallen to an average of 1.3 children per woman. In 1980, Japan was the youngest developed country, with only 9% of its population over age 65. By 2005, its elderly (those aged 65 and over) accounted for 20% of its population, making it one of the oldest developed countries. Japan's working-age population started shrinking in 2000 and from 2005 to 2030 it is expected to drop 18%.6
China's one-child policy collapsed fertility rates, which have since rebounded to 1.7 to 1.8. But China's pre-one-child-policy population bulge is aging rapidly. China's working age population will fall after 2015 and China's ratio of workers to retirees will triple from 2005 to 2030. The Chinese have relied on family rather than the government for old age support and, with shrunken families, China by 2030 could have over 100 million indigent seniors. The Asian Tigers' fertility rates range from 0.9 to 1.4, and the Tigers also are rapidly aging.7,8
There are two demographic categories of Western European countries: those with likely slow population declines and those with likely fast population drops. Slow decliners have fertility rates of around 1.8 and include the United Kingdom, France and northern Europe, except Germany. Fast decliners have fertility rates of 1.3 and include Germany and southern Europe. The working age population of Europe is projected to shrink 6% by 2030. Public pensions already cost Europe twice the percentage of GDP as compared to the United States, and will get worse. Europe's elderly will account for over 25% of its population in 2030, up from 17% in 2005.9
The image of rapidly growing populations all over the developing world is outdated. Only a few areas of the world, including sub-Saharan Africa and some Muslim countries (Iraq, Yemen, Somalia, Sudan, Afghanistan and Pakistan) have fertility rates of 4.0 or higher. Fertility has trended down in most other developing countries. In non-Muslim South Asia, including India, fertility has fallen to about 3.0. Latin America fertility has dropped to 2.5 from 6.0 in the 1960s. Turkey and Iran have current fertility rates around 2.1. However, many developing countries have high percentages of women in childbearing ages, so despite declining fertility rates, their absolute numbers of youths and working age populations will grow rapidly for several decades.10
Immigration will impact the numbers in the United States and Europe. Migration is at or near records in many countries. Some 13% of the U.S. population consists of immigrants, as does 8% to 13% of France, the United Kingdom and Germany. Hispanics are the primary immigrants into the United States; most are employed and data indicates that second generation Hispanics have higher incomes than their parents. That in turn suggests higher productivity and some degree of assimilation. Muslims are the primary immigrants in many European countries; their unemployment rates are high and most of their second generation seems to be making little economic progress; many are not assimilating. This suggests future productivity problems in much of Europe, and possibly diverging national interests.11
Jackson and Howe cite numerous geopolitical implications from demographic changes. Within the developed world, only the United States will likely have the capacity to remain a great power. It was the third most populous country in the world in 1950 and is forecasted to remain so in 2050. Germany, the United Kingdom, Italy and France had populations among the top dozen countries in the world in 1950, but of them,
2
Wanger International Select 2008 Annual Report
Germany will be the leader at 26th in 2050. Western Europe and Japan will be aged and Western Europe especially will have huge public pension costs. While the United States and Western Europe each accounted for 37% of the developed world's economy in the 1980s, the U.S. will likely grow to 54% and Western Europe is projected to shrink to 23% by 2050.12 The United States' increasing relative strength will likely mean that it will need to provide for an even greater proportion of the developed world's security.
Though the U.S. share of the developed world's population and economy will rise, its share of the total world's population and economy will fall. Howe and Jackson note that 90% of the world's population growth to 2050 will occur in sub-Saharan Africa, Muslim countries and South Asia, in nations largely troubled by poverty, religious conflict or both.13
Due to the characteristics of population segments, security risks are likely to rise and peak in the 2020s. This will come at a time when most of the historically great powers are likely to have military recruiting challenges along with budget problems. Jackson and Howe also worry about the effects of aging on savings rates and creativity. In a book by Mark Steyn titled America Alone,14 the author writes that the United States should do a better job exporting its values of liberty, women's rights, freedom of speech, self reliance, decentralization and responsibility. He believes this is one way the U.S. influence can make a posi tive impact.
Investment Implications
Change creates investment risks and opportunities. Recognizing these powerful trends and understanding when they are likely to occur could mitigate the risks and result in profitable investments.
Studies indicate that an individual's creativity, as measured by works of art, peaks between the ages of 30 and 50 and that Nobel achievements peak when people are in their 30s.15 An aging worldwide population may make innovation more scarce and consequently more highly rewarded. Innovative companies may become less subject to competition and be more highly valued in financial markets.
Small- and mid-cap companies tend to be innovative and adaptable. Many existing companies provide goods and services to growing population segments and more will emerge in the future to do so. Our analysts will continue to pursue these opportunities around the world.
The United States has excellent prospects compared to much of the rest of the developed world. Many investment analysts have tracked the baby boomer and echo baby boomer age segments, and as a result have predicted demand for goods and services such as toys, school books, automobiles, housing, leisure items and health care. Long-term demand for leisure and health care continues to appear promising, and additional opportunities may include companies producing labor saving devices and military technology. The United States stands to benefit from woes elsewhere, as highly productive people migrate here for employment and entrepreneurial opportunities, lower taxes and, in some cases, less strife.
There will continue to be investment opportunities overseas. In developed countries, companies that provide products or services to aging populations should benefit. Once the world economy recovers, capital goods suppliers to developing countries should resume growing. Developing countries that have moderate population growth and attractive climates for capitalism are likely to increase their share of world GDP and provide investment opportunities. Companies that participate in domestic growth within these countries should especially benefit.


Charles P. McQuaid
President and Chief Investment Officer
Columbia Wanger Asset Management, L.P.
The information and data provided in this analysis are derived from sources that we deem to be reliable and accurate. These views are not guarantees of future performance and involve certain risks, uncertainties and assumptions that are difficult to predict so actual outcomes and results may differ significantly from the views expressed. The views/opinions expressed in this essay are those of the author and not of the Columbia Wanger Trust Board, are subject to change at any time based upon economic, market or other conditions, may differ from views expressed by other Columbia Management associates or other divisions of Bank of America and the respective parties disclaim any responsibility to update such views. These views may not be relied on as investment advice and, because investment decisions for a Columbia Wanger Fund are based on numerous factors, may not be relied on as an indication of trading intent on behalf of any particular Columbia Wanger Fund.
1 Jackson, Richard and Howe, Neil, The Graying of the Great Powers, (Washington, D.C., Center for Strategic & International Studies, 2008), pg. 1.
2 By popular definition, the "great powers" are the worlds most powerful countries based on wealth, military strength and population.
3 Jackson, Richard and Howe, Neil, op. cit., pgs. 39-40.
4 Ibid, pg. 179.
5 "Vladimir Putin on Raising Russia's Birth Rate," Population and Development Review 32, no. 2 (June 2006).
6 Jackson, Richard and Howe, Neil, op. cit., pg. 44.
7 The Asian Tiger countries include Hong Kong, Singapore, South Korea and Taiwan.
8 Jackson, Richard and Howe, Neil, op. cit., pgs. 155, 171, 175.
9 Ibid, pg. 42.
10 Ibid, pgs. 163-176.
11 Ibid, pgs. 122-126.
12 Ibid, pgs. 191-192.
13 Ibid, pg. 194.
14 Steyn, Mark, America Alone: The End of the World As We Know It, (Washington, D.C., Regnery Publishing, Inc., 2006), pgs. 173, 205.
15 Jackson, Richard and Howe, Neil, op. cit., pg. 111.
3
Wanger International Select 2008 Annual Report

Performance Review Wanger International Select

Christopher J. Olson
Portfolio Manager
Performance data quoted represents past performance and current performance may be lower or higher. Past performance is no guarantee of future results. The investment return and principal value will fluctuate so that shares, when redeemed, may be worth more or less than the original cost. Performance may reflect any voluntary waiver and reimbursement of fund expenses by the advisor or affiliates. Absent these fee waivers, or expense reimbursements, performance results may be lower. For daily and most recent month-end performance updates, please call 1-888-4-WANGER.
All results shown assume reinvestment of distributions and do not reflect the deduction of taxes that a shareholder would pay on fund distributions or on the redemption of fund shares.
Wanger International Select ended the year down 44.35%, outperforming the 45.57% drop of its benchmark, the S&P Developed Ex-U.S. Between $2 Billion and $10 Billion Index.* It was an abysmal investment environment as equity markets throughout the world dropped in response to the deleveraging of the global economy.
During the fourth quarter we more than doubled the Fund's exposure to Japan. At the end of the third quarter, the Fund had a roughly 12% weighting in Japan and, by year end, we had raised that weighting to 25%. Valuations in Japanese stocks have improved and, having dealt with a deleveraging economy over the past 20 years already, the country and its companies appear better able to weather this current storm. Jupiter Telecommunications is the largest cable service provider in Japan and was the Fund's top contributor for the year, up 25%. Jupiter is enjoying continued subscriber growth and is benefiting from smart acquisitions. Several of our new Japanese names also went right to work, posting gains ranging from 17% to 39%. Daito Trust Construction, an apartment builder, has a strong niche business, good cash flow and recently started buying back shares. Office building real estate investment trust Nippon Building Fund's discount to net asset value appeared overdone when we purchased the stock in the fourth quarter and the market seemed to agree. Its strong funding position should enable it to manage through this more difficult period. Kamigumi was also added in the fourth quarter. A port cargo handling and logistics company, Kamigumi rose as investors began to appreciate its more stable business model, which is focused on consumer staple imports.
Outside of Japan, QIAGEN, a Dutch life science company, gained 20% as the company continued to demonstrate solid organic revenue growth driven by diverse product offerings in genetic analysis and diagnostics. Chilean fertilizer producer Sociedad Quimica y Minera de Chile ended the year with a solid gain as the late year drop in fertilizer price expectations was not enough to offset the gains we made from purchasing the stock at a much cheaper valuation. The Fund's investment in the stock was up 35% for the year.
The Fund's greatest losses in the year came from Hexagon, Intralot, Lenovo Group and Ibiden. Declines in these stocks ranged from 49% to 78%. Sweden's Hexagon, a maker of measurement equipment and polymers, fell on fears a drop in construction projects globally would hurt its business. Greek lottery and gaming systems and services provider Intralot dropped after renegotiating its Turkish contract at much reduced rates. Chinese PC vendor Lenovo Group was adversely affected by the slowdown in global PC demand and intensifying competition. Restructuring costs also dampened earnings. Ibiden, a Japanese manufacturer of electronic parts and ceramics, fell due to production issues and a weaker demand for its semiconductor packaging.
2008 was definitely a punishing year for world equity markets and Fund shareholders. The adjustments we are facing in the global economy are likely to continue and as a result the Fund continues to shy away from those areas still most exposed to economic distress (financials, consumer stocks) and is focused on less cyclical areas (health care, business services and others). While valuations have become much more attractive, we are awaiting further signs that economic fundamentals have begun to improve before returning to more economically sensitive investments.
International investing involves special risks, including foreign taxation, currency risks, risks associated with possible differences in financial standards and other risks associated with future political and economic developments. Stocks of small- and mid-cap companies pose special risks, including possible illiquidity and greater price volatility than stocks of larger, more established companies. Investing in emerging markets may involve greater risks than investing in more developed countries.
Portfolio holdings are subject to change periodically and may not be representative of current holdings.
*Effective October 1, 2008, Standard & Poor's implemented a new naming convention for its family of indexes. Prior to the renaming, the S&P Developed Ex-U.S. Between $2 Billion and $10 Billion Index was known as the S&P/Citigroup World ex-US Cap Range $2-10B Index. This index name change was not expected to result in any alterations to the constitution or calculation of the index and does not in any way affect the manner in which the Fund is managed or the investment objective or principal investment strategy of the Fund, which remain unchanged.
4
Wanger International Select 2008 Annual Report
Growth of a $10,000 Investment in Wanger International Select
Total return for each period,
February 1, 1999 (inception date) through December 31, 2008
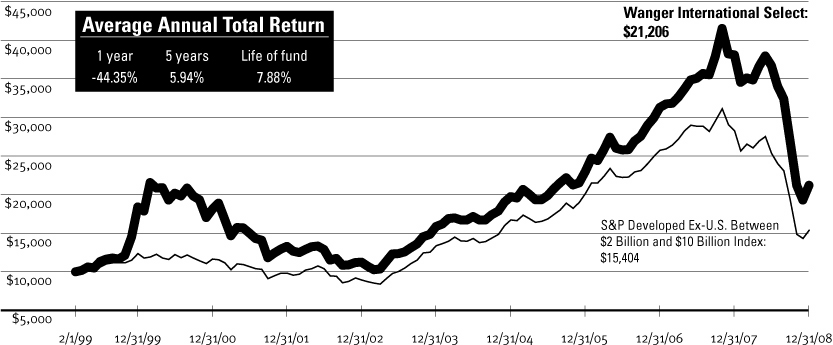
This graph compares the results of $10,000 invested in Wanger International Select on February 1, 1999 (the date the Fund began operations) through December 31, 2008, to the S&P Developed Ex-U.S. Between $2 Billion and $10 Billion Index, with dividends and capital gains reinvested. Performance results reflect any fee waivers or reimbursements of Fund expenses by CWAM or any of its affiliates. Absent these fee waivers or expense reimbursement arrangements, performance results would have been lower. Performance shown here is past performance, which cannot guarantee future results. Current performance may be higher or lower. The investment return and principal value of an investment in the Fund will fluctuate so that Fund shares, when redeemed, may be worth more or less than their original cost. Performance changes over time. Current returns for the Fund may be different than that shown. For daily and most recent month-end p erformance updates, please contact us at 1-888-4-WANGER.
Results to December 31, 2008
| | | 4th quarter | | 1 year | |
| Wanger International Select | | | -21.76 | % | | | -44.35 | % | |
S&P Developed Ex-U.S.
Between $2 Billion and
$10 Billion Index | | | -20.82 | | | | -45.57 | | |
| MSCI EAFE Index | | | -19.95 | | | | -43.38 | | |
NAV as of 12/31/08: $12.01
Performance numbers reflect all Fund expenses but do not include any insurance charge imposed by your insurance company's separate accounts. If performance included the effect of these additional charges, it would be lower.
The Fund's annual operating expense ratio is 1.18%. The annual operating expense ratio is as stated in the Fund's prospectus that is current as of the date of this report. Differences in expense ratios disclosed elsewhere in this report may result from including fee waivers and expense reimbursements as well as different time periods used in calculating the ratios.
All results shown assume reinvestment of distributions and do not reflect taxes that a shareholder would pay on Fund distributions or the sale of Fund shares.
The S&P Developed Ex-U.S. Between $2 Billion and $10 Billion Index, which is the Fund's primary benchmark, is a subset of the broad market selected by the index sponsor representing the mid-cap developed market, excluding the United States. The Morgan Stanley Capital International Europe, Australasia, Far East (MSCI EAFE) Index is a capitalization-weighted index that tracks the total return of common stocks in 21 developed market countries within Europe, Australia and the Far East. Indexes are not managed and do not incur fees or expenses. It is not possible to invest directly in an index.
Portfolio characteristics and holdings are subject to change periodically and may not be representative of current characteristics and holdings.
Top 5 Countries
As a percentage of net assets, as of 12/31/08
| Japan | | | 25.0 | % | |
| United Kingdom | | | 16.1 | | |
| United States | | | 10.2 | | |
| Germany | | | 6.2 | | |
| France | | | 6.1 | | |
Top 10 Holdings
As a percentage of net assets, as of 12/31/08
1. Jupiter Telecommunications (Japan)
Largest Cable Service Provider in Japan | | | 6.7 | % | |
2. Cephalon (United States)
Specialty Pharmaceuticals for Pain,
Central Nervous System & Oncology | | | 4.9 | | |
3. Serco (United Kingdom)
Facilities Management | | | 4.2 | | |
4. Rhoen-Klinikum (Germany)
Health Care Services | | | 4.1 | | |
5. Capita Group (United Kingdom)
White Collar, Back Office Outsourcing | | | 4.0 | | |
6. SES Global (France)
Satellite Broadcasting Services | | | 3.8 | | |
7. Intertek Testing (United Kingdom)
Testing, Inspection & Certification Services | | | 3.6 | | |
8. Red Electrica de Espana (Spain)
Spanish Power Grid | | | 3.3 | | |
9. Synthes (Switzerland)
Products for Orthopedic Surgery | | | 3.0 | | |
10. Nintendo (Japan)
Entertainment Software & Hardware | | | 3.0 | | |
5
Wanger International Select 2008 Annual Report
Wanger International Select
Statement of Investments December 31, 2008
Number of
Shares | | | | Value | |
| | | Common Stocks – 96.8% | |
| | | Europe – 50.1% | |
| | | United Kingdom – 16.1% | |
| | 190,000 | | | Serco
Facilities Management | | | $1,236,614
| | |
| | 110,000 | | | Capita Group
White Collar, Back Office Outsourcing | | | 1,172,050
| | |
| | 93,000 | | | Intertek Testing
Testing, Inspection & Certification Services | | | 1,053,431
| | |
| | 260,000 | | | RPS Group
Environmental Consulting & Planning | | | 527,686
| | |
| | 125,000 | | | Informa Group
Global Publisher & Event Organizer | | | 443,509
| | |
| | 26,594 | | | Standard Chartered
UK Bank with Main Operations in Asia | | | 339,959
| | |
| | | | | | | | 4,773,249 | | |
| | | Germany – 6.2% | |
| | 50,000 | | | Rhoen-Klinikum
Health Care Services | | | 1,201,688
| | |
| | 13,400 | | | Wincor Nixdorf
Retail POS Systems & ATM Machines | | | 638,885
| | |
| | | | | | | | 1,840,573 | | |
| | | France – 6.1% | |
| | 58,000 | | | SES Global
Satellite Broadcasting Services | | | 1,116,533
| | |
| | 7,600 | | | Neopost
Postage Meter Machines | | | 687,902
| | |
| | | | | | | | 1,804,435 | | |
| | | Switzerland – 6.0% | |
| | 7,100 | | | Synthes
Products for Orthopedic Surgery | | | 897,484
| | |
| | 9,400 | | | Kuehne & Nagel
Freight Forwarding/Logistics | | | 609,460
| | |
| | 2,000 | | | Swatch Group
Watch & Electronics Manufacturer | | | 279,371
| | |
| | | | | | | | 1,786,315 | | |
| | | Ireland – 5.0% | |
| | 260,000 | | | United Drug
Irish Pharmaceutical Wholesaler & Outsourcer | | | 805,717
| | |
| | 21,000 | | | Aryzta (a)
Baked Goods | | | 672,475
| | |
| | | | | | | | 1,478,192 | | |
Number of
Shares | | | | Value | |
| | | Netherlands – 3.5% | |
| | 50,000 | | | QIAGEN (a)
Life Science Company; DNA/RNA Purification | | $ | 873,774 |
| |
| | 21,000 | | | Aalberts Industries
Flow Control & Heat Treatment | | | 150,015 |
| |
| | | | | | | | 1,023,789 | | |
| | | Spain – 3.2% | |
| | 19,000 | | | Red Electrica de Espana
Spanish Power Grid | | | 962,587 |
| |
| | | Sweden – 1.5% | |
| | 90,000 | | | Hexagon
Measurement Equipment & Polymers | | | 440,868 |
| |
| | | Denmark – 1.3% | |
| | 4,700 | | | Novozymes
Industrial Enzymes | | | 374,443 |
| |
| | | Greece – 1.2% | |
| | 82,000 | | | Intralot
Lottery & Gaming Systems & Services | | | 342,461 |
| |
| | | | | Total Europe | | | 14,826,912 | | |
| | | Asia – 29.4% | |
| | | Japan – 25.0% | |
| | 1,900 | | | Jupiter Telecommunications
Largest Cable Service Provider in Japan | | | 1,980,121 |
| |
| | 2,300 | | | Nintendo
Entertainment Software & Hardware | | | 883,648 |
| |
| | 16,900 | | | Benesse
Education Service Provider | | | 738,624 |
| |
| | 130,000 | | | Kansai Paint
Paint Producer in Japan, India,
China & Southeast Asia | | | 664,394 |
| |
| | 39,900 | | | Rohto Pharmaceutical
Health & Beauty Products | | | 554,622 |
| |
| | 85 | | | Orix JREIT
Diversified REIT | | | 405,501 |
| |
| | 45,000 | | | Kamigumi
Port Cargo Handling & Logistics | | | 402,995 |
| |
| | 7,600 | | | Daito Trust Construction
Apartment Builder | | | 397,946 |
| |
See accompanying notes to financial statements.
6
Wanger International Select 2008 Annual Report
Wanger International Select
Statement of Investments December 31, 2008
Number of
Shares | | | | Value | |
| | | Japan – 25.0% (cont) | |
| | 35 | | | Nippon Building Fund
Office REIT | | | $384,156
| | |
| | 8,100 | | | Ryohin Keikaku
Specialty Retail | | | 384,007
| | |
| | 14,000 | | | Aeon Mall
Suburban Shopping Mall Developer,
Owner & Operator | | | 270,282
| | |
| | 23,000 | | | Suruga Bank
Regional Bank | | | 227,787
| | |
| | 5,000 | | | Ain Pharmaciez
Dispensing Pharmacy/Drugstore Operator | | | 110,668
| | |
| | | | | | | | 7,404,751 | | |
| | | South Korea – 2.2% | |
| | 30,600 | | | Woongjin Coway (a)
South Korean Household Appliance
Rental Service Provider | | | 657,435
| | |
| | | Hong Kong – 1.6% | |
| | 30,500 | | | Hong Kong Exchanges and Clearing
Hong Kong Equity & Derivatives
Market Operator | | | 292,413
| | |
| | 1,200,000 | | | NagaCorp
Monopoly Casino in Central Cambodia | | | 166,107
| | |
| | | | | | | | 458,520 | | |
| | | Singapore – 0.6% | |
| | 180,000 | | | ComfortDelGro
Taxi & Mass Transit Service | | | 182,213
| | |
| | | | | Total Asia | | | 8,702,919 | | |
| | | Other Countries – 16.3% | |
| | | United States – 10.2% | |
| | 19,000 | | | Cephalon (a)
Specialty Pharmaceuticals for Pain,
Central Nervous System & Oncology | | | 1,463,760
| | |
| | 8,100 | | | Diamond Offshore
Contract Driller | | | 477,414
| | |
| | 24,400 | | | BioMarin (a)
Biotech Focused on Orphan Diseases | | | 434,320
| | |
Number of
Shares | | | | Value | |
| | 11,100 | | | Alexion Pharmaceuticals (a)
Biotech Focused on Orphan Diseases | | | $401,709
| | |
| | 7,800 | | | Bristow (a)
Largest Provider of Helicopter
Services to Offshore
Oil & Gas Producers | | | 208,962
| | |
| | 1,100 | | | Oceaneering International (a)
Provider of Sub-sea Services &
Manufactured Products | | | 32,054
| | |
| | | | | | | | 3,018,219 | | |
| | | South Africa – 2.4% | |
| | 39,000 | | | Naspers
Media & Education in Africa &
Other Emerging Markets | | | 708,905
| | |
| | | Australia – 1.6% | |
| | 135,000 | | | Sino Gold (a)
Gold Mining in The People's Republic of China | | | 473,054
| | |
| | | Israel – 1.5% | |
| | 66,000 | | | Israel Chemicals
Producer of Potash, Phosphates,
Bromine & Specialty Chemicals | | | 461,437
| | |
| | | Canada – 0.6% | |
| | 92,050 | | | Pacific Rubiales Energy (a)(b) | | | 161,664 | | |
| | 46,025 | | | Pacific Rubiales Energy-Warrants (a)(b) | | | 12,180 | | |
| | 450 | | | Pacific Rubiales Energy (a)
Oil Production & Exploration in Colombia | | | 798
| | |
| | | | | | | | 174,642 | | |
| | | | | Total Other Countries | | | 4,836,257 | | |
| | | Latin America – 1.0% | |
| | | Chile – 1.0% | |
| | 12,000 | | | Sociedad Quimica y Minera de Chile - ADR
Producer of Specialty Fertilizers,
Lithium & Iodine | | | 292,680
| | |
| | | | | Total Latin America | | | 292,680 | | |
| Total Common Stocks (Cost: $33,074,992) – 96.8% | | | 28,658,768 | | |
See accompanying notes to financial statements.
7
Wanger International Select 2008 Annual Report
Wanger International Select
Statement of Investments December 31, 2008
Principal
Amount | | | | Value | |
| | | Short-Term Obligation – 2.5% | |
| | | >Repurchase Agreement – 2.5% | |
| $ | 731,000 | | | Repurchase Agreement with Fixed
Income Clearing Corp., dated 12/31/08,
due 1/02/09 at 0.010%, collateralized
by a U.S. Government Agency Obligation,
maturing 11/17/15, market value $750,619 (repurchase proceeds $731,000) | | $ | 731,000 | | |
| | | | 731,000 | | |
| Total Short-Term Obligation (Cost: $731,000) | | | 731,000 | | |
| Total Investments (Cost: $33,805,992) – 99.3% (c)(d) | | | 29,389,768 | | |
| Cash and Other Assets Less Liabilities – 0.7% | | | 214,666 | | |
| Total Net Assets – 100.0% | | $ | 29,604,434 | | |
Notes to Statement of Investments:
(a) Non-income producing security.
(b) Denotes a restricted security, which is subject to restrictions on resale under federal securities laws. These securities are valued at their fair value determined in good faith under consistently applied procedures established by the Board of Trustees. At December 31, 2008, these securities amounted to $173,844 which represents 0.59% of total net assets.
Additional information on these securities is as follows:
Security | | Acquisition
Date | |
Shares | |
Cost | |
Value | |
Pacific Rubiales
Energy | | 7/12/2007 | | | 92,050 | | | $ | 369,594 | | | $ | 161,664 | | |
Pacific Rubiales
Energy - Warrants | | 7/12/2007 | | | 46,025 | | | | 78,779 | | | | 12,180 | | |
| | | | | | | $ | 448,373 | | | $ | 173,844 | | |
(c) At December 31, 2008, for federal income tax purposes cost of investments was $34,191,506 and net unrealized depreciation was $4,801,738 consisting of gross unrealized appreciation of $3,696,427 and gross unrealized depreciation of $8,498,165.
(d) On December 31, 2008, the Fund's total investments were denominated in currencies as follows:
| Currency | | Value | | Percentage of
Net Assets | |
| Euro | | $ | 7,452,037 | | | | 25.2 | | |
| Japanese Yen | | | 7,404,751 | | | | 25.0 | | |
| British Pound | | | 4,773,249 | | | | 16.1 | | |
| U.S. Dollar | | | 4,041,899 | | | | 13.7 | | |
| Swiss Franc | | | 1,786,315 | | | | 6.0 | | |
Other currencies less than 5%
of total net assets | | | 3,931,517 | | | | 13.3 | | |
| Cash and other assets less liabilities | | | 214,666 | | | | 0.7 | | |
| | | $ | 29,604,434 | | | | 100.0 | | |
ADR = American Depositary Receipts
See accompanying notes to financial statements.
8
Wanger International Select 2008 Annual Report
Wanger International Select
Portfolio Diversification December 31, 2008
At December 31, 2008, the Fund's portfolio investments as a percentage of net assets was diversified as follows:
| | |
Value | | Percentage
of Net Assets | |
| Industrial Goods & Services | |
| Outsourcing Services | | $ | 2,408,664 | | | | 8.2 | | |
| Industrial Materials & Specialty Chemicals | | | 1,792,954 | | | | 6.1 | | |
| Other Industrial Services | | | 1,662,891 | | | | 5.6 | | |
| Machinery | | | 687,902 | | | | 2.3 | | |
| Construction | | | 397,946 | | | | 1.3 | | |
| Conglomerates | | | 150,015 | | | | 0.5 | | |
| | | | 7,100,372 | | | | 24.0 | | |
| Information | |
| CATV | | | 1,980,121 | | | | 6.7 | | |
| Satellite Broadcasting & Services | | | 1,116,533 | | | | 3.8 | | |
| Consumer Software | | | 883,648 | | | | 3.0 | | |
| TV Broadcasting | | | 708,905 | | | | 2.4 | | |
| Computer Hardware & Related Equipment | | | 638,885 | | | | 2.1 | | |
| Business Information & Marketing Services | | | 527,686 | | | | 1.8 | | |
| Publishing | | | 443,509 | | | | 1.5 | | |
| Instrumentation | | | 440,868 | | | | 1.5 | | |
| Financial Processors | | | 292,413 | | | | 1.0 | | |
| | | | 7,032,568 | | | | 23.8 | | |
| Health Care | |
| Pharmaceuticals | | | 2,269,477 | | | | 7.7 | | |
| Medical Equipment & Devices | | | 1,299,193 | | | | 4.4 | | |
| Health Care Services | | | 1,201,688 | | | | 4.0 | | |
| Medical Supplies | | | 873,774 | | | | 2.9 | | |
| Biotechnology & Drug Delivery | | | 434,320 | | | | 1.5 | | |
| | | | 6,078,452 | | | | 20.5 | | |
| | |
Value | | Percentage
of Net Assets | |
| Consumer Goods & Services | |
| Other Consumer Services | | $ | 1,396,059 | | | | 4.7 | | |
| Retail | | | 764,956 | | | | 2.6 | | |
| Food & Beverage | | | 672,475 | | | | 2.3 | | |
| Nondurables | | | 554,622 | | | | 1.9 | | |
| Casinos & Gaming | | | 508,568 | | | | 1.7 | | |
| Other Durable Goods | | | 279,371 | | | | 0.9 | | |
| | | | 4,176,051 | | | | 14.1 | | |
| Other Industries | |
| Regulated Utilities | | | 962,587 | | | | 3.2 | | |
| Real Estate | | | 789,657 | | | | 2.7 | | |
| Transportation | | | 585,208 | | | | 2.0 | | |
| | | | 2,337,452 | | | | 7.9 | | |
| Energy & Minerals | |
| Oil Services | | | 718,430 | | | | 2.4 | | |
| Mining | | | 473,054 | | | | 1.6 | | |
| Oil & Gas Producers | | | 174,642 | | | | 0.6 | | |
| | | | 1,366,126 | | | | 4.6 | | |
| Finance | |
| Banks | | | 567,747 | | | | 1.9 | | |
| | | | 567,747 | | | | 1.9 | | |
| Total Common Stocks | | | 28,658,768 | | | | 96.8 | | |
| Short-Term Obligation | | | 731,000 | | | | 2.5 | | |
| Total Investments | | | 29,389,768 | | | | 99.3 | | |
Cash and Other Assets
Less Liabilities | | | 214,666 | | | | 0.7 | | |
| Net Assets | | $ | 29,604,434 | | | | 100.0 | | |
See accompanying notes to financial statements.
9
Wanger International Select 2008 Annual Report
Statement of Assets and Liabilities
December 31, 2008
| Assets: | |
| Investments, at cost | | $ | 33,805,992 | | |
| Investments, at value | | $ | 29,389,768 | | |
| Cash | | | 787 | | |
| Foreign currency (cost of $21,191) | | | 20,894 | | |
| Receivable for: | |
| Investments sold | | | 50,769 | | |
| Fund shares sold | | | 165,701 | | |
| Dividends | | | 33,520 | | |
| Foreign tax reclaims | | | 20,545 | | |
| Other assets | | | 299 | | |
| Total Assets | | | 29,682,283 | | |
| Liabilities: | |
| Payable for: | |
| Investments purchased | | | 5,107 | | |
| Fund shares repurchased | | | 13,918 | | |
| Investment advisory fee | | | 22,260 | | |
| Administration fee | | | 1,184 | | |
| Transfer agent fee | | | 14 | | |
| Trustees' fees | | | 1 | | |
| Audit fee | | | 15,470 | | |
| Custody fee | | | 4,521 | | |
| Reports to shareholders | | | 7,743 | | |
| Chief compliance officer expenses | | | 89 | | |
| Trustees' deferred compensation plan | | | 6,485 | | |
| Other liabilities | | | 1,057 | | |
| Total Liabilities | | | 77,849 | | |
| Net Assets | | $ | 29,604,434 | | |
| Composition of Net Assets: | |
| Paid-in capital | | $ | 38,965,734 | | |
| Undistributed net investment income | | | 544,737 | | |
| Accumulated net realized loss | | | (5,491,695 | ) | |
| Net unrealized appreciation (depreciation) on: | |
| Investments | | | (4,416,224 | ) | |
| Foreign currency translations | | | 1,882 | | |
| Net Assets | | $ | 29,604,434 | | |
| Fund Shares Outstanding | | | 2,464,477 | | |
Net asset value, offering price and redemption
price per share | | $ | 12.01 | | |
Statement of Operations
For the Year Ended December 31, 2008
| Investment Income: | |
| Dividends (net of foreign taxes withheld of $79,213) | | $ | 1,179,560 | | |
| Interest income | | | 28,405 | | |
| Total Investment Income | | | 1,207,965 | | |
| Expenses: | |
| Investment advisory fee | | | 485,781 | | |
| Administration fee | | | 25,840 | | |
| Transfer agent fee | | | 150 | | |
| Trustees' fees | | | 3,967 | | |
| Custody fee | | | 54,682 | | |
| Chief compliance officer expenses (See Note 4) | | | 1,611 | | |
| Other expenses (See Note 5) | | | 69,863 | | |
| Total Expenses | | | 641,894 | | |
| Custody earnings credit | | | (74 | ) | |
| Net Expenses | | | 641,820 | | |
| Net Investment Income | | | 566,145 | | |
Net Realized and Unrealized Gain (Loss) on
Investments and Foreign Currency: | |
| Net realized loss on: | |
| Investments | | | (5,470,637 | ) | |
| Foreign currency transactions | | | (8,921 | ) | |
| Net realized loss | | | (5,479,558 | ) | |
Net change in unrealized appreciation
(depreciation) on: | | | | | |
| Investments | | | (22,162,132 | ) | |
| Foreign currency translations | | | 598 | | |
Net change in unrealized
appreciation (depreciation) | | | (22,161,534 | ) | |
| Net Loss | | | (27,641,092 | ) | |
| Net Decrease in Net Assets from Operations | | $ | (27,074,947 | ) | |
See accompanying notes to financial statements.
10
Wanger International Select 2008 Annual Report
Statement of Changes in Net Assets
| | | Year ended December 31, | |
| Increase (Decrease) in Net Assets | | 2008 | | 2007 | |
| Operations: | |
| Net investment income | | $ | 566,145 | | | $ | 256,588 | | |
| Net realized gain (loss) on investments and foreign currency transactions | | | (5,479,558 | ) | | | 14,866,303 | | |
Net change in unrealized appreciation (depreciation) on investments
and foreign currency translations | | | (22,161,534 | ) | | | (1,765,746 | ) | |
| Net Increase (Decrease) in Net Assets from Operations | | | (27,074,947 | ) | | | 13,357,145 | | |
| Distributions to Shareholders: | |
| From net investment income | | | (215,563 | ) | | | (491,093 | ) | |
| From net realized gains | | | (14,461,904 | ) | | | (7,887,030 | ) | |
| Total Distributions to Shareholders | | | (14,677,467 | ) | | | (8,378,123 | ) | |
| Share Transactions: | |
| Subscriptions | | | 4,503,145 | | | | 13,254,652 | | |
| Distributions reinvested | | | 14,677,467 | | | | 8,378,123 | | |
| Redemptions | | | (21,308,289 | ) | | | (15,721,645 | ) | |
| Net Increase (Decrease) from Share Transactions | | | (2,127,677 | ) | | | 5,911,130 | | |
| Total Increase (Decrease) in Net Assets | | | (43,880,091 | ) | | | 10,890,152 | | |
| Net Assets: | |
| Beginning of period | | | 73,484,525 | | | | 62,594,373 | | |
| End of period | | $ | 29,604,434 | | | $ | 73,484,525 | | |
| Undistributed net investment income at end of period | | $ | 544,737 | | | $ | 214,513 | | |
See accompanying notes to financial statements.
11
Wanger International Select 2008 Annual Report
Financial Highlights
| | | Year Ended December 31, | |
| Selected data for a share outstanding throughout each period | | 2008 | | 2007 | | 2006 | | 2005 | | 2004 | |
| Net Asset Value, Beginning of Period | | $ | 28.07 | | | $ | 26.62 | | | $ | 19.63 | | | $ | 17.19 | | | $ | 13.87 | | |
| Income from Investment Operations: | |
| Net investment income (a) | | | 0.21 | | | | 0.10 | | | | 0.11 | | | | 0.13 | | | | 0.04 | | |
Net realized and unrealized gain (loss) on investments
and foreign currency | | | (10.31 | ) | | | 4.92 | | | | 6.94 | | | | 2.66 | | | | 3.33 | | |
| Total from Investment Operations | | | (10.10 | ) | | | 5.02 | | | | 7.05 | | | | 2.79 | | | | 3.37 | | |
| Less Distributions to Shareholders: | |
| From net investment income | | | (0.09 | ) | | | (0.21 | ) | | | (0.06 | ) | | | (0.35 | ) | | | (0.05 | ) | |
| From net realized gains | | | (5.87 | ) | | | (3.36 | ) | | | — | | | | — | | | | — | | |
| Total Distributions to Shareholders | | | (5.96 | ) | | | (3.57 | ) | | | (0.06 | ) | | | (0.35 | ) | | | (0.05 | ) | |
| Net Asset Value, End of Period | | $ | 12.01 | | | $ | 28.07 | | | $ | 26.62 | | | $ | 19.63 | | | $ | 17.19 | | |
| Total Return (b) | | | (44.35 | )% | | | 21.78 | % | | | 36.00 | % | | | 16.43 | %(c) | | | 24.34 | % | |
| Ratios to Average Net Assets/Supplemental Data: | |
| Net expenses (d) | | | 1.24 | % | | | 1.18 | % | | | 1.19 | % | | | 1.32 | % | | | 1.43 | % | |
| Net investment income (d) | | | 1.10 | % | | | 0.37 | % | | | 0.47 | % | | | 0.76 | % | | | 0.29 | % | |
| Waiver | | | — | | | | — | | | | — | | | | 0.00 | %(e) | | | — | | |
| Portfolio turnover rate | | | 68 | % | | | 69 | % | | | 61 | % | | | 48 | % | | | 71 | % | |
| Net assets, end of period (000's) | | $ | 29,604 | | | $ | 73,485 | | | $ | 62,594 | | | $ | 44,026 | | | $ | 35,232 | | |
(a) Net investment income per share was based upon the average shares outstanding during the period.
(b) Total return at net asset value assuming all distributions reinvested.
(c) Had the investment advisor not waived a portion of expenses, total return would have been reduced.
(d) The benefits derived from custody fees paid indirectly had an impact of less than 0.01%.
(e) Rounds to less than 0.01%.
See accompanying notes to financial statements.
12
Wanger International Select 2008 Annual Report
Notes to Financial Statements
1. Nature of Operations
Wanger International Select (the "Fund"), is a series of Wanger Advisors Trust (the "Trust"), an open-end management investment company organized as a Massachusetts business trust. The investment objective of the Fund is to seek long-term capital appreciation. The Fund is available only for allocation to certain life insurance company separate accounts established for the purpose of funding qualified and non-qualified variable annuity contracts and variable life insurance policies and may also be offered directly to certain types of pension plans and retirement arrangements.
2. Significant Accounting Policies
Security valuation
Securities of the Fund are valued at market value or, if a market quotation for a security is not readily available or is deemed not to be reliable because of events or circumstances that have occurred between the market quotation and the time as of which the security is to be valued, the security is valued at its fair value determined in good faith under consistently applied procedures established by the Board of Trustees. A security traded on a securities exchange or in an over-the-counter market in which transaction prices are reported is valued at the last sales price at the time of valuation. A security traded principally on NASDAQ is valued at the NASDAQ official closing price. A security for which there is no reported sale on the valuation date is valued at the latest bid quotation. Short-term investments maturing in 60 days or less are valued at amortized cost, which approximates market value. A security for which a mark et quotation is not readily available and any other assets are valued at its fair value determined in good faith under consistently applied procedures established by the Board of Trustees. The Trust has retained an independent statistical fair value pricing service to assist in the fair valuation process for securities principally traded in a foreign market in order to adjust for possible changes in value that may occur between the close of the foreign market and the time as of which the securities are to be valued. If a security is valued at fair value, that value may be different from the last quoted market price for the security.
On January 1, 2008, the Fund adopted Statement of Financial Accounting Standards No. 157, Fair Value Measurements ("SFAS 157"). Under SFAS 157, various inputs are used in determining the value of the Fund's investments. These inputs are summarized in the three broad levels listed below:
• Level 1—quoted prices in active markets for identical securities
• Level 2—other significant observable inputs (including quoted prices for similar securities, interest rates, prepayment speeds, credit risk and others)
• Level 3—significant unobservable inputs (including management's own assumptions in determining the value of investments)
The inputs or methodologies used for valuing securities are not necessarily an indication of the risk associated with investing in those securities.
Examples of the types of securities in which the Fund would typically invest and how they are classified within this SFAS 157 hierarchy are as follows. Typical level 1 securities include exchange traded domestic equities, mutual funds whose NAVs are published each day and exchange traded foreign equities that are not statistically fair valued. Typical level 2 securities include exchange traded foreign equities that are statistically fair valued and short-term investments valued at amortized cost. Typical level 3 securities include any security fair valued by the Fund's Valuation Committee that relies on significant unobservable inputs.
The following table summarizes the inputs used, as of December 31, 2008, in valuing the Fund's assets:
| Valuation Inputs | | Investments in
Securities | | Other Financial
Instruments | |
| Level 1— Quoted Prices | | $ | 3,311,697 | | | $ | — | | |
| Level 2—Other Significant Observable Inputs | | | 26,078,071 | | | | — | | |
| Level 3— Significant Unobservable Inputs | | | — | | | | — | | |
| Total | | $ | 29,389,768 | | | $ | — | | |
Repurchase agreements
The Fund may engage in repurchase agreement transactions. The Fund, through its custodians, receives delivery of underlying securities collateralizing each repurchase agreement. The counterparty is required to maintain collateral that is at all times at least equal to the repurchase price including interest. In the event of default or bankruptcy by the other party to the agreement, realization and/or retention of the collateral may be subject to legal proceedings.
Foreign currency translations
Values of investments denominated in foreign currencies are converted into
U.S. dollars using the spot market rate of exchange at the time of valuation. Purchases and sales of investments and dividend and interest income are translated into U.S. dollars using the spot market rate of exchange prevailing on the respective dates of such transactions. The gain or loss resulting from changes in foreign exchange rates is included with net realized and unrealized gain or loss from investments, as appropriate.
In March 2008, Statement of Financial Accounting Standards No. 161, Disclosures about Derivative Instruments and Hedging Activities—an amendment of FASB Statement No. 133 ("SFAS 161"), was issued. SFAS 161 is effective for fiscal years beginning after November 15, 2008. SFAS 161 requires additional discussion about the reporting entity's derivative instruments and hedging activities, by providing for qualitative disclosures about the objectives and strategies for using derivatives, quantitative data about the fair value of and gains and losses on derivative contracts, and details of credit-risk-related contingent features in their hedged positions. Management is evaluating the impact the application of SFAS 161 will have on the Fund's financial statement disclosures.
Security transactions and investment income
Security transactions are accounted for on the trade date (date the order to buy or sell is executed) and dividend income is recorded on the ex-dividend date, except that certain dividends from foreign securities are recorded as soon as the information is available to the Fund. Interest income is recorded on the accrual basis and includes amortization of discounts on debt obligations when required for federal income tax purposes. Realized gains and losses from security transactions are recorded on an identified cost basis.
Awards, if any, from class action litigation related to securities owned may be recorded as a reduction of cost of those securities. If the applicable securities are no longer owned, the proceeds are recorded as realized gains.
Restricted securities
Restricted securities are securities that may only be resold upon registration under federal securities laws or in transactions exempt from registration. In some cases, the issuer of restricted securities has agreed to register such securities for resale at the issuer's expense either upon demand by the Fund or in connection with another registered offering of the securities. Many restricted securities may be resold in the secondary market in transactions exempt from registration. Such restricted securities may be determined to be liquid under criteria established by the Board of Trustees. The Fund will not incur any registration costs upon such resale.
Use of estimates
The preparation of financial statements in conformity with accounting principles generally accepted in the United States of America ("GAAP")
13
Wanger International Select 2008 Annual Report
Notes to Financial Statements
requires management to make estimates and assumptions that affect the amounts reported in the financial statements and accompanying notes. Actual results may differ from those estimates.
Fund share valuation
Fund shares are sold and redeemed on a continuing basis at net asset value. Net asset value per share is determined daily as of the close of trading on the New York Stock Exchange ("the Exchange") on each day the Exchange is open for trading by dividing the total value of the Fund's investments and other assets, less liabilities, by the number of Fund shares outstanding.
Custody fees/credits
Custody fees are reduced based on the Fund's cash balances maintained with the custodian. The amount is disclosed as a reduction of total expenses in the Statement of Operations.
Federal income taxes
The Fund has complied with the provisions of the Internal Revenue Code available to regulated investment companies and, in the manner provided therein, distributes all its taxable income, as well as any net realized gain on sales of investments and foreign currency transactions reportable for federal income tax purposes. Accordingly, the Fund paid no federal income taxes and no federal income tax provision was required.
Expenses
General expenses of the Trust are allocated to the Fund and the other series of the Trust based upon relative net assets or other expense allocation methodologies determined by the nature of the expense. Expenses directly attributable to the Fund are charged to the Fund.
Foreign capital gains taxes
Gains in certain countries may be subject to foreign taxes at the fund level, at rates ranging from 10%-15%. The Fund accrues for such foreign taxes on net realized and unrealized gains at the appropriate rate for each jurisdiction.
Distributions to shareholders
Distributions to shareholders are recorded on the ex-date.
Indemnification
In the normal course of business, the Trust on behalf of the Fund enters into contracts that contain a variety of representations and warranties and that provide general indemnities. The Fund's maximum exposure under these arrangements is unknown, as this would involve future claims against the Fund. Also under the Trust's organizational documents, the trustees and officers of the Trust are indemnified against certain liabilities that may arise out of their duties to the Trust. However based on experience, the Fund expects the risk of loss due to these warranties and indemnities to be minimal.
3. Federal Tax Information
The timing and character of income and capital gain distributions are determined in accordance with income tax regulations, which may differ from GAAP. Reclassifications are made to the Fund's capital accounts for permanent tax differences to reflect income and gains available for distribution (or available capital loss carryforwards) under income tax regulations.
For the year ended December 31, 2008, permanent book and tax basis differences resulting primarily from differing treatments for foreign currency transactions and distribution reclassifications were identified and reclassified among the components of the Fund's net assets as follows:
Undistributed
Net Investment
Income | | Accumulated
Net Realized
Loss | | Paid-In Capital | |
| $ | (20,358 | ) | | $ | 20,358 | | | $ | — | | |
Net investment income and net realized gains/(losses), as disclosed on the Statement of Operations, and net assets were not affected by this reclassification.
The tax character of distributions paid during the years ended December 31, 2008 and December 31, 2007 were as follows:
| | | December 31, 2008 | | December 31, 2007 | |
Distributions paid from:
Ordinary Income* | | $ | 3,006,152 | | | $ | 1,250,481 | | |
| Long-Term Capital Gains | | | 11,671,315 | | | | 7,127,642 | | |
* For tax purposes short-term capital gain distributions, if any, are considered ordinary income distributions.
As of December 31, 2008, the components of distributable earnings on a tax basis were as follows:
Undistributed
Ordinary
Income | | Undistributed
Long-Term
Capital Gains | | Net Unrealized
Depreciation* | |
| $ | 544,737 | | | $ | — | | | $ | (4,801,738 | ) | |
* The differences between book-basis and tax-basis net unrealized appreciation/(depreciation) are primarily due to deferral of losses from wash sales.
The following capital loss carryforwards, determined as of December 31, 2008, may be available to reduce taxable income arising from future net realized gains on investments, if any, to the extent permitted by the Internal Revenue Code:
Year of
Expiration | | Capital Loss
Carryforward | |
| | 2016 | | | $ | 2,630,085 | | |
Under current tax rules, certain currency and capital losses realized after October 31 may be deferred and treated as occurring on the first day of the following fiscal year. As of December 31, 2008, post-October capital losses of $2,476,096 attributed to security transactions were deferred to January 1, 2009.
Under Financial Accounting Standards Board ("FASB") Interpretation No. 48, Accounting for Uncertainty in Income Taxes—an Interpretation of FASB Statement No. 109 ("FIN 48") management determines whether a tax position of the Fund is more likely than not to be sustained upon examination by the applicable taxing authority, including resolution of any related appeals or litigation processes, based on the technical merits of the position. The tax benefit to be recognized is measured as the largest amount of benefit that is greater than fifty percent likely of being realized upon ultimate settlement. Management has evaluated the known implications of FIN 48 on its computation of net assets for the Fund. As a result of this evaluation, management believes that FIN 48 does not have any effect on the Fund's financial statements. However, management's conclusions regarding FIN 48 may be subject to review and adjustment at a later date based on factors including, but not limited to, further implementation guidance from the FASB, new tax laws, regulations, and
14
Wanger International Select 2008 Annual Report
Notes to Financial Statements
administrative interpretations (including relevant court decisions). The Fund's federal tax returns for the prior three fiscal years remain subject to examination by the Internal Revenue Service. The Fund is not aware of any tax positions for which it is reasonably possible that the total amounts of unrecognized tax benefits will significantly change in the next twelve months.
4. Transactions With Affiliates
Columbia Wanger Asset Management, L.P. ("CWAM") is a wholly owned subsidiary of Columbia Management Group, LLC, ("Columbia Management") which in turn is an indirect wholly owned subsidiary of Bank of America Corporation ("BOA"). CWAM furnishes continuing investment supervision to the Fund and is responsible for the overall management of the Fund's business affairs.
Under the Fund's investment advisory agreement, management fees are accrued daily based on the Fund's average daily net assets and paid monthly to CWAM at the annual rates shown in the table below:
| Average Daily Net Assets | | Annual Fee Rate | |
| Up to $500 million | | | 0.94 | % | |
| $500 million and over | | | 0.89 | % | |
For the year ended December 31, 2008, the Fund's effective investment advisory fee rate was 0.94% of average daily net assets.
Through April 30, 2009, CWAM will reimburse the Fund to the extent that ordinary operating expenses (exclusive of brokerage commissions, interest, taxes and extraordinary expenses, but inclusive of custodial charges relating to overdrafts, if any), after giving effect to any balance credits from the Fund's custodian, exceed an annual percentage of 1.45% of average daily net assets. There was no reimbursement for the year ended December 31, 2008.
CWAM provides administrative services and receives an administration fee from the Fund. Effective August 1, 2008, CWAM provides administrative services and receives an administration fee from the Fund at the following annual rates:
Wanger Advisors Trust Aggregate
Average Daily Net Assets of the Trust: | | Annual Fee Rate | |
| Up to $4 billion | | | 0.05 | % | |
| $4 billion to $6 billion | | | 0.04 | % | |
| $6 billion to $8 billion | | | 0.03 | % | |
| $8 billion and over | | | 0.02 | % | |
Prior to August 1, 2008, administration fees were accrued daily and paid monthly to CWAM at the annual rate of 0.05%.
For the year ended December 31, 2008, the Fund's effective administration fee rate was 0.05% of average daily net assets. CWAM has delegated to Columbia Management Advisors, LLC ("Columbia"), an indirect, wholly owned subsidiary of BOA, the responsibility for certain administrative services.
Certain officers and trustees of the Trust are also officers of CWAM. The Trust makes no direct payments to its officers and trustees who are affiliated with CWAM.
The Board of Trustees appointed a Chief Compliance Officer to the Trust in accordance with federal securities regulations. The Fund, along with other affiliated funds, pays its pro-rata share of the expenses associated with the Office of the Chief Compliance Officer. These expenses are disclosed separately as "Chief compliance officer expenses" in the Statement of Operations.
The Trust offers a deferred compensation plan for its independent trustees. Under that plan, a trustee may elect to defer all or a portion of his or her compensation. Amounts deferred are retained by the Trust and represent an unfunded obligation of the Trust. The value of amounts deferred is determined by reference to the change in value of Class Z shares of one or more series of Columbia Acorn Trust or a money market fund as specified by the trustee. Benefits under the deferred compensation plan are payable when the trustee ceases to be a member of the Board of Trustees.
Columbia Management Distributors, Inc. (the "Distributor"), an affiliate of Columbia and an indirect, wholly owned subsidiary of BOA, serves as the principal underwriter of the Trust and receives no compensation from the Fund for its services.
Columbia Management Services, Inc. (the "Transfer Agent"), an affiliate of Columbia and an indirect, wholly owned subsidiary of BOA, provides shareholder services to the Fund and has subcontracted with Boston Financial Data Services ("BFDS") to serve as subtransfer agent. For such services, the Transfer Agent receives a fee, paid monthly, at the annual rate of $21.00 per open account. . The Transfer Agent also receives reimbursement for certain out-of-pocket expenses.
During the year ended December 31, 2008, the Fund engaged in purchase and sales transactions with funds that have a common investment advisor (or affiliated investment advisors), common directors/trustees, and/or common officers. Those purchase and sale transactions complied with provisions of Rule 17a-7 under the Investment Company Act of 1940 and were $- and $656,591, respectively.
5. Borrowing Arrangements
The Trust participates in a $150 million credit facility, which was entered into to facilitate portfolio liquidity. Interest is charged to each participating fund based on its borrowings at a rate per annum equal to the Federal Funds rate plus 0.50%. In addition, a commitment fee of 0.08% per annum of the unutilized line of credit is accrued and apportioned among the participating funds based on their relative net assets. The commitment fee is included in "Other expenses" in the Statement of Operations. No amounts were borrowed by the Fund under this facility during the year ended December 31, 2008. The Trust enters into this line of credit for one year durations. The Trust has already secured the line of credit for the entire year of 2009.
6. Fund Share Transactions
Proceeds and payments on Fund shares as shown in the Statement of Changes in Net Assets are in respect of the following numbers of shares:
| | | Year Ended
December 31, 2008 | | Year Ended
December 31, 2007 | |
| Shares sold | | | 246,505 | | | | 497,815 | | |
Shares issued in reinvestment
of dividend distributions | | | 740,912 | | | | 363,318 | | |
| Less shares redeemed | | | (1,140,778 | ) | | | (595,024 | ) | |
| Net increase (decrease) in shares outstanding | | | (153,361 | ) | | | 266,109 | | |
7. Investment Transactions
The aggregate cost of purchases and proceeds from sales other than short-term obligations for the year ended December 31, 2008 were $34,205,762 and $46,633,759, respectively.
8. Legal Proceedings
CWAM, Columbia Acorn Trust (another mutual fund family advised by CWAM), and the trustees of Colombia Acorn Trust (collectively, the "Columbia defendants") are named as defendants in class and derivative complaints that have been consolidated in a Multi-District Action (the "MDL Action") in the federal district court of Maryland. These lawsuits contend that defendants permitted certain investors to market time their trades in certain Columbia Acorn Funds. The MDL Action is ongoing. However, all claims against the Trust and the independent trustees of Columbia Acorn Trust have been dismissed.
Columbia Acorn Trust and CWAM are also defendants in a class action lawsuit that alleges, in summary, that Columbia Acorn Trust and CWAM
15
Wanger International Select 2008 Annual Report
Notes to Financial Statements
exposed shareholders of Columbia Acorn International Fund to trading by market timers by allegedly: (a) failing to properly evaluate daily whether a significant event affecting the value of the fund's securities had occurred after foreign markets had closed but before the calculation of the funds' net asset value ("NAV"); (b) failing to implement the fund's portfolio valuation and share pricing policies and procedures; and (c) failing to know and implement applicable rules and regulations concerning the calculation of NAV (the "Fair Valuation Lawsuit"). The Seventh Circuit ruled that the plaintiffs' state law claims were preempted under federal law resulting in the dismissal of plaintiffs' complaint. Plaintiffs appealed the Seventh Circuit's ruling to the United States Supreme Court. The Supreme Court reversed the Seventh Circuit's ruling on jurisdictional grounds and the case was ultimately remanded to the state court.
On March 21, 2005, a class action complaint was filed against the Trust and CWAM seeking to rescind the CDSC assessed upon redemption of Class B shares of the Columbia Acorn Funds due to the alleged market timing of the Columbia Acorn Funds (the "CDSC Lawsuit"). In addition to the rescission of sales charges, plaintiffs seek recovery of actual damages, attorneys' fees and costs. The case has been transferred to the MDL Action in the federal district court of Maryland.
On September 14, 2007, the plaintiffs and the Columbia defendants named in the MDL Action, including the Columbia Funds, entered into a stipulation of settlement with respect to all Columbia-related claims in the MDL Action described above, including the CDSC and Fair Valuation Lawsuits. The settlement is subject to court approval.
Columbia Acorn Trust and CWAM intend to defend these suits vigorously. CWAM believes that the lawsuits are not likely to materially affect its ability to provide investment management services to the Fund.
16
Wanger International Select 2008 Annual Report
Report of Independent Registered Public Accounting Firm
To the Board of Trustees and Shareholders of Wanger International Select,
In our opinion, the accompanying statement of assets and liabilities, including the statement of investments, and the related statements of operations and of changes in net assets and the financial highlights present fairly, in all material respects, the financial position of Wanger International Select (a series of the Wanger Advisors Trust, hereinafter referred to as the "Fund") at December 31, 2008, the results of its operations for the year then ended, the changes in its net assets for each of the two years in the period then ended and the financial highlights for each of the five years in the period then ended, in conformity with accounting principles generally accepted in the United States of America. These financial statements and financial highlights (hereafter referred to as "financial statements") are the responsibility of the Fund's management; our responsibility is to express an opinion on these financial statements based on our audits. We conducted our audits of these financial statements in accordance with the standards of the Public Company Accounting Oversight Board (United States). Those standards require that we plan and perform the audit to obtain reasonable assurance about whether the financial statements are free of material misstatement. An audit includes examining, on a test basis, evidence supporting the amounts and disclosures in the financial statements, assessing the accounting principles used and significant estimates made by management, and evaluating the overall financial statement presentation. We believe that our audits, which included confirmation of securities at December 31, 2008 by correspondence with the custodian and brokers, provide a reasonable basis for our opinion.
PricewaterhouseCoopers LLP
Chicago, Illinois
February 16, 2009
17
Wanger International Select 2008 Annual Report
Federal Income Tax Information (Unaudited)
Foreign taxes paid during the fiscal year ended December 31, 2008 of $79,180 ($0.03 per share) are expected to be passed through to shareholders. This entire amount will be eligible for shareholders to claim as a foreign tax credit.
Gross income derived from sources within foreign countries was $1,174,187 ($0.48 per share) for the fiscal year ended December 31, 2008.
Gross income derived from sources within foreign countries was $981,481 ($0.37 per share) for the fiscal year ended December 31, 2007.
1.16% of the ordinary income distributed by the Fund, for the year ended December 31, 2008 qualified for the corporate dividends received deduction.
18
Wanger International Select 2008 Annual Report
Excerpt from:
Wanger Advisors Trust
Management Fee Evaluation of the Senior Officer
Prepared Pursuant to the New York Attorney General's
Assurance of Discontinuance
May 2008
19
Wanger International Select 2008 Annual Report
Introduction
The New York Attorney General's Assurance of Discontinuance ("Order") entered into by Columbia Management Advisors, Inc. ("CMAI") and Columbia Management Distributors, Inc., ("CMDI" and collectively with "CMAI," "CMG") in February 2005, allows CMAI to manage or advise a mutual fund only if the trustees of the fund appoint a "Senior Officer" to perform specified duties and responsibilities. One of these responsibilities includes "managing the process by which proposed management fees (including but not limited to, advisory fees) to be charged the [Funds] are negotiated so that they are negotiated in a manner which is at arms' length and reasonable and consistent with this Assurance of Discontinuance."
This is the second year that the Columbia Acorn Trust and Wanger Advisors Trust (collectively, the "Trusts") and each series thereof (the "Acorn funds," "WAT funds" or collectively, the "Funds") have been overseen by the same Board of Trustees ("Board"). The Order provides that this Board must determine the reasonableness of proposed "management fees" by using either an annual competitive bidding process supervised by the Senior Officer or Independent Fee Consultant, or by obtaining "an annual independent written evaluation prepared by or under the direction of the Senior Officer or the Independent Fee Consultant."
"Management fees" are only part of the costs and expenses paid by mutual fund shareholders. Fund expenses can vary depending upon the class of shares held but usually include: (1) investment management or advisory fees to compensate analysts and portfolio managers for stock research and portfolio management, as well as the cost of operating a trading desk; (2) administrative expenses incurred to prepare registration statements and tax returns, calculate the Funds' net asset values, maintain effective compliance procedures and perform recordkeeping services; (3) transfer agency costs for establishing accounts, accepting and disbursing funds, as well as overseeing trading in Fund shares; (4) custodial expenses incurred to hold the securities purchased by the Funds; and (5) distribution expenses, including commissions paid to brokers that sell the Fund shares to investors.
Columbia Wanger Asset Management, L.P. ("CWAM"), the advisor to the Funds, has proposed that the Trusts continue the existing separate agreements governing the first two categories listed above: an advisory agreement governing portfolio management, and an administration agreement governing certain administration and clerical services. Together the fees paid under these two agreements are referred to as "management fees." Other fund expenses are governed by separate agreements, in particular agreements with two CWAM affiliates: CMDI, the broker-dealer that underwrites and distributes the Funds' shares, and Columbia Management Services, Inc. ("CMSI"), the Funds' transfer agent. In conformity with the terms of the Order, this evaluation, therefore, addresses only the advisory and administrative contracts, and does not extend to the other agreements.
According to the Order, the Senior Officer's evaluation must consider at least the following:
(1) Management fees (including components thereof) charged to institutional and other clients of CWAM for like services;
(2) Management fees (including any components thereof) charged by other mutual fund companies for like services;
(3) Costs to CWAM and its affiliates of supplying services pursuant to the management fee agreements, excluding any intra-corporate profit;
(4) Profit margins of CWAM and its affiliates from supplying such services;
(5) Possible economies of scale as the Funds grow larger; and
(6) The nature and quality of CWAM's services, including the performance of each Fund.
In 2004, the Boards of the two Trusts, then separate groups, each appointed me Senior Officer under the Order. They also determined not to pursue a competitive bidding process and instead, charged me with the responsibility of evaluating the Funds' proposed advisory and administrative fee contracts with CWAM in conformity with the requirements of the Order. This Report is an annual evaluation required under the Order. In discharging their responsibilities, the independent Trustees have also consulted independent, outside counsel.
2007 Evaluation
This is the third annual evaluation prepared in connection with the Order. This evaluation follows the same structure as the earlier studies. Some areas are given more emphasis here, while others are given less. Still, the fundamental information gathered for this evaluation is largely the same as past years. Last year's evaluation is referred to here as the "2007 Study."
Process and Independence
The objectives of the Order are to insure the independent evaluation of the management fees paid by the Funds as well as to insure that all relevant factors are considered. In my view, this contract renewal process has been conducted at arms-length and with independence in gathering, considering and evaluating all relevant data. At the outset of the process, the Trustees sought and obtained from CWAM and CMG a comprehensive compilation of data regarding Fund performance and expenses, advisor profitability, and other information. The Board evaluated this information thoroughly. Performance and expense data was obtained from both Morningstar and Lipper, the leading consultants in this area. The rankings prepared by Morningstar and Lipper were independent and not influenced by the advisor.
In the course of its work, the Contract Committee gave careful consideration to the conclusions and recommendations contained in the 2007 Study. The Contract Committee gave particular emphasis to the issue of whether economies of scale were appropriately reflected in the Funds' fee schedules. The Board accepted and implemented several of the recommendations in this area contained in the 2007 Study.
20
Wanger International Select 2008 Annual Report
My evaluation of the advisory contract was shaped, as it was last year, by my experience as Chief Compliance Officer of the Trusts ("CCO"). As CCO, I report solely to the Board and have no reporting obligation to, or employment relationship with, CMG or its affiliates, except for administrative purposes. I have commented on compliance matters in evaluating the quality of service provided by CWAM.
This Report, its supporting materials and the data contained in other materials submitted to the Contract Committee of the Board, in my view, provide a thorough factual basis upon which the Board, in consultation with independent counsel as it deems appropriate, may conduct management fee negotiations that are in the best interests of the Funds' shareholders.
The Fee Reductions Mandated under the Order
Under the terms of the Order, CMG agreed to secure certain management fee reductions for the mutual funds advised by its affiliate investment advisors. In some instances, breakpoints were also established. Although neither CWAM nor the Trusts was a party to the Order, CWAM offered and the Board accepted certain advisory fee reductions during 2005. By the terms of the Order, these fees may not be increased before November 30, 2009. I have used these advisory fee levels, as modified thereafter, in this evaluation because they are the fees in the current agreements that CWAM proposes should be continued. Hence, these fee levels are the starting point of an evaluation.
Conclusions
My review of the data and other material above leads to the following conclusions with respect to the factors identified in the Order.
1. Performance. The domestic WAT Funds generally have achieved good to outstanding performance over the past five years. Wanger Select has, however, suffered a precipitous decline in ranking relative to its peers for the past year, and this trend merits the Trustees' continued attention. The international WAT Funds have relatively weaker relative long term records than do the domestic funds. All the WAT Funds, however, outperform their benchmarks, expose shareholders to less risk than competitors and achieve positive "alpha," a recognized measure of the added value of an investment manager.
2. Management Fees relative to Peers. Management fees vary by WAT Fund, but, in general, the WAT Funds impose higher fees than competing funds. Wanger Select and Wanger USA in particular were ranked by both Lipper and Morningstar at or below the median, and therefore impose higher fees than do the majority of their competitors.
3. Administrative Fees. The WAT Funds' administrative fees appear competitive in relation to their peers, and CWAM provides excellent administrative support for all the WAT Funds. There are clear advantages to retaining the advisor and its affiliates to perform these services. However, while economies of scale exist above current asset levels, the WAT Funds' administrative fee schedule provides no breakpoints.
4. Management Fees relative to Institutional and Other Mutual Fund Accounts. CWAM's focus is on its mutual funds. It does not actively seek to manage separate or institutional accounts. The few institutional accounts it does manage vary in rate structures. Some pay advisory fees commensurate with or higher than the WAT Funds. In a few instances, however, institutional accounts pay lower advisory fees than do the WAT Funds. One particular institutional account is significant in size and has been under CWAM's management for over 25 years.
5. Costs to CWAM and its Affiliates. CWAM's direct costs do not appear excessive. Overhead and indirect costs allocated to CWAM by its parent organizations, however, are significant and have increased dramatically in the past year. CWAM's affiliates report operating losses and therefore do not appear to enjoy excessive "fall out" benefits from CWAM's advisory agreement with the WAT Funds.
6. Profit Margins. CWAM's pre-marketing expense profit margins are at the top of the industry, though these comparisons are hampered by limited industry data. High profit margins are not unexpected for firms that manage large, successful funds and have provided outstanding investment performance for investors.
7. Economies of Scale. Economies of scale do exist at CWAM and will expand as the assets of the WAT Funds get larger. The Board has recently imposed additional breakpoints for some of the WAT Funds that will result in greater sharing of economies of scale.
8. Nature and Quality of Services. This category includes a variety of considerations that are difficult to quantify, yet can have a significant bearing on the performance of the Funds. Several areas merit comment.
a. Capacity. The WAT Funds have continued to grow, posing ever greater challenges in deploying assets effectively. While trends here merit continued monitoring, CWAM appears to be managing assets effectively.
b. Compliance. CWAM has a reasonably designed compliance program that protects shareholders.
9. Process. In my opinion, the process of negotiating an advisory contract for the WAT Funds has been conducted thoroughly and at arms' length. Further, the Trustees have sufficient information to evaluate management's proposal, and negotiate contract terms that are in the best interests of Fund shareholders.
21
Wanger International Select 2008 Annual Report
Recommendations
I believe the Trustees should:
1. Consider the addition of breakpoints to the WAT administrative fee contract to reflect the economies of scale present in performing these services, and, in fashioning those breakpoints, to consider the efficiencies achieved by CWAM by supporting both Trusts with the same staff performing largely identical tasks.
2. Focus their review on the WAT Funds' management fee levels in relation to their peers, in particular the fees paid by Wanger USA and Wanger Select.
3. Monitor Wanger Select to ensure that its long term performance is sustained.
Robert P. Scales
May 27, 2008
22
Wanger International Select 2008 Annual Report
Board Approval of the Advisory Agreement
Wanger Advisors Trust (the "Trust") has an investment advisory agreement (the "Advisory Agreement") with Columbia Wanger Asset Management, L.P. ("CWAM") under which CWAM manages the Columbia Wanger Family of Funds (the "Funds"). The trustees of the Trust, more than seventy five percent of whom have never been affiliated with CWAM (the "Independent Trustees"), oversee the management of each Fund and, as required by law, determine at least annually whether to continue the Advisory Agreement for each Fund.
The Contract Committee of the board of trustees (the "Committee"), which is comprised of six Independent Trustees, makes recommendations to the board regarding any proposed continuation of the Advisory Agreement. After the Committee has made its recommendations, the full board of trustees determines whether to approve continuation of the Advisory Agreement. The board also considers matters bearing on the Advisory Agreement at its various meetings throughout the year, and meets at least quarterly with CWAM's portfolio managers.
In connection with their most recent consideration of the Advisory Agreement for each Fund, the Committee and all trustees received and reviewed a substantial amount of information provided by CWAM in response to requests from the Independent Trustees and their independent legal counsel. As they considered the Advisory Agreement, the Independent Trustees were advised by independent legal counsel. At each meeting where the Committee or the Independent Trustees considered the Advisory Agreement, they met with management and also met in separate executive session with their independent legal counsel.
The materials reviewed by the Committee and the trustees included, among other items, (i) information on the investment performance of each Fund and its peer groups and performance benchmarks, (ii) information on each Fund's advisory fees and other expenses, including information comparing the Fund's fees and expenses to those of peer groups of funds and information about any applicable expense limitations and fee "breakpoints," (iii) data on sales and redemptions of Fund shares and (iv) information on the profitability to CWAM, as well as potential "fall-out" or ancillary benefits that CWAM and its affiliates may receive as a result of their relationships with the Funds. The trustees also considered other information such as (i) CWAM's financial condition, (ii) each Fund's investment objective and strategies, (iii) the size, education and experience of CWAM's investment staff and its use of technology, external research and tra ding cost measurement tools, (iv) the allocation of the Funds' brokerage, if any, including allocations to brokers affiliated with CWAM, and the use of "soft" commission dollars to pay for research products and services, (v) the resources devoted to, and the record of compliance with, the Funds' investment policies and restrictions, policies on personal securities transactions and other compliance policies and (vi) the economic outlook generally and for the mutual fund industry in particular. In addition, the trustees conferred with, and reviewed the Management Fee Evaluation (the "Fee Evaluation") prepared by the Trust's chief compliance officer, who also serves as the Trust's "Senior Officer," as contemplated by the Assurance of Discontinuance dated February 9, 2005 among affiliates of CWAM and the Office of the New York Attorney General. A summary of the Fee Evaluation is included in this report. Throughout the annual contract renewal process, the trustees had the opportunity to ask questions of and reque st additional materials from CWAM.
The Committee held meetings in May and June 2008 and reported its recommendations to the full board of trustees. On June 11, 2008, the board of trustees unanimously approved continuation through July 31, 2009 of (i) the Advisory Agreement and (ii) the Trust's administrative services agreement with CWAM (the "Administration Agreement"), as amended to reflect the recommendation of the Committee that, effective August 1, 2008, the Trust shall pay CWAM for its services under the agreement a fee accrued daily and paid monthly at the following annual rates, as a percentage of the Trust's aggregate average daily net assets: 0.05% on the first $4 billion; 0.04% on $4 - 6 billion; 0.03% on $6 - 8 billion; and 0.02% on assets over $8 billion.
In considering the continuation of the Advisory Agreement and the continuation of the amended Administration Agreement, the trustees reviewed and analyzed various factors that they determined were relevant, including the factors described below, none of which by itself was considered dispositive. However, the material factors and conclusions that formed the basis for the trustees' determination to approve the continuation of the Advisory Agreement and the amended Administration Agreement are discussed separately below.
Nature, quality and extent of services. The trustees reviewed the nature, quality and extent of the services of CWAM and its affiliates to the Funds, taking into account the investment objective and strategy of each Fund and knowledge gained from meetings with management, which were held on at least a quarterly basis. In addition, the trustees reviewed the available resources and key personnel of CWAM and its affiliates, especially those providing investment management services to the Funds. The trustees also considered other services provided to the Funds by CWAM and its affiliates, including: managing the execution of portfolio transactions and selecting broker-dealers for those transactions; monitoring adherence to the Funds' investment restrictions; producing shareholder reports; providing support services for the board of trustees and committees of the board; communicating with shareholders; serving as the Funds' administrator; and overseeing the activities of the Funds' other service providers, including monitoring for compliance with various policies and procedures as well as applicable securities laws and regulations.
The trustees concluded that the nature, quality and extent of the services provided by CWAM and its affiliates to each Fund were appropriate and consistent with the terms of the Advisory Agreement and the Administration Agreement, and that the quality of those services had been consistent with or superior to quality norms in the industry. The trustees further concluded that the Funds were likely to benefit from the continued provision of those services by CWAM to the Funds. They also concluded that CWAM currently had sufficient personnel, with appropriate education and experience, to serve the Funds effectively, and had demonstrated its continuing ability to attract and retain well qualified personnel.
Performance of the Funds. At various meetings of the board of trustees, the Committee and the investment performance committee of the board, the trustees considered the short-term and longer-term performance of each Fund. They reviewed information comparing each Fund's performance with that of its benchmark(s) and with the performance of comparable funds and peer groups as identified by Lipper Inc. ("Lipper") and Morningstar, Inc. ("Morningstar"). On the domestic side, the trustees discussed how Wanger USA had exceeded its peer category average and beat its primary benchmark for the five year period, according to Morningstar, noting that Lipper's rankings of Wanger USA was somewhat lower than Morningstar's. Wanger Select had a particularly difficult performance year during 2007, which the trustees acknowledged. The trustees also reviewed the performan ce of the international Funds, discussing how both Wanger International and Wanger International Select continued to outperform their benchmarks over the five year period, but not the majority of their peer groups established by Lipper and Morningstar. During the annual contract renewal process, the trustees concluded that, although past performance is not necessarily indicative of future results, the Funds' strong overall longer-term performance record was an important factor in the their evaluation of the quality of services provided by CWAM under the Advisory Agreement.
Costs of Services and Profits Realized by CWAM. At various Committee and board of trustees meetings and other informal meetings, the trustees examined detailed information on the fees and expenses of each Fund in comparison to information for other comparable funds provided by Lipper and Morningstar. As noted in the Fee Evaluation, the contractual rates of investment advisory fees and the actual advisory fees paid by Wanger Select and Wanger USA were higher than the median advisory fee rates of their
23
Wanger International Select 2008 Annual Report
respective peer groups. The trustees also considered the advisory fees of the Funds relative to those of the series of Columbia Acorn Trust ("Acorn"), a group of funds with similar investment strategies also overseen by the trustees and managed by CWAM. The trustees noted that the Funds' advisory fees were comparable to those of the Acorn funds.
The trustees reviewed the analysis of the profitability of CWAM in serving as each Fund's investment advisor and of CWAM and its affiliates in their relationships with each Fund, as well as an explanation of the methodology utilized in allocating various expenses among the Funds and other business units, each of which was included in the Fee Evaluation. The trustees considered the methodology used by CWAM in determining compensation payable to portfolio managers and the competitive market for investment management talent. They discussed how profitability comparisons among fund managers are not very meaningful due to the small number of publicly owned managers, and how the profitability of any investment manager is affected by numerous factors, including its particular organizational structure, the types of funds and other accounts managed, other lines of business, expense allocation methodology, capital structure and cost of cap ital.
The trustees also reviewed the advisory fees charged by CWAM for managing other investment companies, sub-advised funds and other institutional separate accounts, as detailed in the Fee Evaluation. CWAM's institutional separate account fees for various investment strategies were examined and in some cases those fees were higher than the advisory fees charged to the Funds, and in some instances the Funds' fees were higher. The trustees noted that CWAM performs significant additional services for the Funds that it does not provide to sub-advised funds or non-mutual fund clients, including administrative services, oversight of the Funds' other service providers, trustee support, regulatory compliance and numerous other services, and that, in servicing the Funds, CWAM assumes many legal risks that it does not assume in servicing many of its other clients. Finally, as part of the annual contract renewal process, the trustees consider ed CWAM's financial condition.
In connection with their consideration of the Administration Agreement, and as recommended by the Committee and the Trust's Senior Officer, the Independent Trustees negotiated breakpoints in the fee schedule for administrative services that will reduce the fee for those services if the aggregate net assets of the Funds exceed $4 billion.
The trustees concluded that the rates of advisory fees and other compensation payable by the Funds to CWAM and its affiliates were reasonable in relation to the nature and quality of the services to be provided, taking into account the fees charged by other advisors for managing comparable mutual funds with similar strategies and the fees CWAM charges to other clients. The trustees also concluded that the Funds' estimated overall expense ratios were reasonable, considering the quality of services provided by CWAM and its affiliates and the investment performance of the Funds.
Economies of Scale. At various meetings throughout the annual contract renewal process, the trustees considered information about the extent to which CWAM realizes economies of scale in connection with the increase of Fund assets. The trustees noted that the advisory fee schedule for each Fund includes breakpoints in the rate of fees at various asset levels. The trustees discussed extensively the appropriateness of the recommendation of the Committee regarding the addition of further breakpoints to the fee schedule under the Administration Agreement. They noted that the Funds also share directly in economies of scale through lower charges by third party service providers based on the combined scale of all of the Funds. The trustees concluded that the current fee structure of each Fund, with the administration fee schedule changes recommended by the Co ntract Committee, was reasonable and reflective of a sharing between CWAM and the Funds of economies of scale.
Other Benefits to CWAM. The trustees also reviewed benefits that accrue to CWAM and its affiliates from their relationships with the Funds, as outlined in the Fee Evaluation. They noted that the Funds' transfer agent and distributor were each affiliates of CWAM and that the transfer agent received compensation from the Funds for services provided. The trustees considered ways, other than the services provided by CWAM and its affiliates pursuant to various agreements and the fees to be paid by each Fund therefor, that the Funds and CWAM may potentially benefit from their relationship with each other. At various Committee meetings, the trustees considered CWAM's use of commissions paid by each Fund on its portfolio brokerage transactions to obtain research products and services benefiting the Fund and/or other clients of CWAM, and determined that CWAM's use of the Funds' "soft" commission dollars to obtain research products and services was consistent with regulatory requirements and guidance then in effect. They also concluded that CWAM benefits from the receipt of proprietary research products and services acquired through commissions paid on portfolio transactions of the Funds, and that the Funds benefit from CWAM's receipt of those products and services as well as research products and services acquired through commissions paid by other clients of CWAM. The trustees further determined that the success of any Fund could attract other business to CWAM or the Funds and that the success of CWAM could enhance its ability to serve the Funds.
After full consideration of the above factors, as well as other factors that were considered relevant in evaluating the Advisory Agreement, the trustees, including the Independent Trustees, concluded that the continuation of the Advisory Agreement and continuation of the Administration Agreement (as amended to reflect the new administration fee schedule), was in the best interest of each Fund. On June 11, 2008, the trustees approved continuation of the Advisory Agreement and the Administration Agreement, as so amended, through July 31, 2009.
24
Wanger International Select 2008 Annual Report
Board of Trustees and Management of Wanger Advisors Trust
The Board of Trustees of the Trust has overall management responsibility for the Trust and the Funds. Each trustee may serve a term of unlimited duration until the end of the calendar year in which the trustee attains the age of 75 years. The trustees appoint their own successors, provided that at least two-thirds of the trustees, after such appointment, have been elected by shareholders. Shareholders may remove a trustee, with or without cause, upon the vote of two-thirds of the Trust's outstanding shares at any meeting called for that purpose. A trustee may be removed, with or without cause, upon the vote of a majority of the trustees.
The names of the trustees and officers of the Trust, the date each was first elected or appointed to office, their principal business occupations during at least the last five years, and other directorships they hold are shown below. Each trustee serves in such capacity for each of the four series of the Trust and each of the six series of Columbia Acorn Trust.
The business address of each trustee and officer of the Trust is Columbia Wanger Asset Management, L.P., 227 West Monroe, Suite 3000, Chicago, Illinois 60606. The Fund's Statement of Additional Information includes additional information about the Fund's trustees and officers. You may obtain a free copy of the Statement of Additional Information by writing or calling toll-free:
Columbia Wanger Asset Management, L.P.
Shareholder Services Group
227 W. Monroe, Suite 3000
Chicago, IL 60606
888-4-WANGER (888-492-6437)
Name, Position(s) with
Wanger Advisors
Trust and Age at
December 31, 2008 | | Year First
Elected or
Appointed
to Office | | Principal Occupation(s) during
Past Five Years | | Number of
Portfolios in
Fund Complex
Overseen
by Trustee/Officer | | Other
Directorships
in addition
to Wanger
Advisors Trust | |
| Trustees who are not interested persons of Wanger Advisors Trust: | |
|
Laura M. Born, 43,
Trustee | | | 2007 | | | Adjunct Assistant Professor of Finance, University of Chicago Booth School of Business; formerly, Managing Director—Investment Banking, J.P. Morgan Chase & Co. (broker/ dealer) 1991-2007. | | | 10 | | | Columbia Acorn Trust. | |
|
Michelle L. Collins, 48,
Trustee | | | 2008 | | | President, Cambium LLC, since 2007; Advisory Board Member, Svoboda Capital Partners LLC, since 2007; Managing Director Svoboda Capital Partners LLC, 1998-2006. | | | 10 | | | Columbia Acorn Trust; Molex, Inc. (electronics components manufacturer). | |
|
Maureen M. Culhane, 60,
Trustee | | | 2007 | | | Retired. Formerly, Vice President, Goldman Sachs Asset Management, L.P. (investment advisor) 2005-2007; Vice President (Consultant)—Strategic Relationship Management, Goldman Sachs AG, 1999-2005. | | | 10 | | | Columbia Acorn Trust. | |
|
Margaret Eisen, 55,
Trustee | | | 2002 | | | Chief Investment Officer, EAM International LLC (corporate finance and asset management), since 2003; Managing Director, CFA Institute, 2005-2008. | | | 10 | | | Columbia Acorn Trust; Antigenics, Inc. (biotechnology and pharmaceuticals). | |
|
Jerome Kahn, Jr., 74,
Trustee | | | 1987 | | | Portfolio manager and stock analyst; formerly, President, William Harris Investors, Inc. (investment advisor). | | | 10 | | | Columbia Acorn Trust. | |
|
Steven N. Kaplan, 49,
Trustee | | | 1999 | | | Neubauer Family Professor of Entrepreneurship and Finance, University of Chicago Booth School of Business. | | | 10 | | | Columbia Acorn Trust; Morningstar, Inc. (provider of independent investment research). | |
|
David C. Kleinman, 73,
Trustee | | | 1972 | | | Adjunct Professor of Strategic Management, University of Chicago Booth School of Business; business consultant. | | | 10 | | | Columbia Acorn Trust; Sonic Foundry, Inc. (rich media systems and software). | |
|
25
Wanger International Select 2008 Annual Report
Board of Trustees and Management of Wanger Advisors Trust
Name, Position(s) with
Wanger Advisors
Trust and Age at
December 31, 2008 | | Year First
Elected or
Appointed
to Office | | Principal Occupation(s) during
Past Five Years | | Number of
Portfolios in
Fund Complex
Overseen
by Trustee/Officer | | Other
Directorships
in addition
to Wanger
Advisors Trust | |
Allan B. Muchin, 72,
Trustee and Vice Chairman
of the Board | | | 1998 | | | Chairman Emeritus, Katten Muchin Rosenman LLP (law firm). | | | 10 | | | Columbia Acorn Trust. | |
|
Robert E. Nason, 72,
Trustee and Chairman of
the Board | | | 1998 | | | Consultant and private investor, since 1998; prior thereto, Chief Executive Officer, executive partner, and member of the Executive Committee, Grant Thornton, LLP (public accounting firm). | | | 10 | | | Columbia Acorn Trust. | |
|
James A. Star, 47,
Trustee | | | 2006 | | | President, Longview Asset Management LLC (investment advisor), since 2003. | | | 10 | | | Columbia Acorn Trust; Traush Industries (privately-owned manufacturer of refrigeration parts and products). | |
|
John A. Wing, 73,
Trustee | | | 2002 | | | Partner, Dancing Lion Partners (investment firm); prior thereto, Chairman of the Board and Chief Executive Officer, ABN-AMRO Inc. (formerly named The Chicago Corporation, a financial services firm), Chief Executive Officer, Market Liquidity Network, LLC, and Frank Wakely Gunsaulus Professor of Law and Finance and Chairman of the Center for the Study of Law and Financial Markets, Illinois Institute of Technology. | | | 10 | | | Columbia Acorn Trust; First Chicago Bank and Trust; First Chicago Bancorp. | |
|
| Trustees who are interested persons of Wanger Advisors Trust: | |
|
Charles P. McQuaid, 55,
Trustee and President (1) | | | 1992 | | | President and Chief Investment Officer, CWAM or its predecessors, since October 2003; portfolio manager, CWAM or its predecessors, since 1995. | | | 10 | | | Columbia Acorn Trust. | |
|
Ralph Wanger, 74,
Trustee (2) | | | 1970 | | | Founder, CWAM. Formerly, President, Chief Investment Officer and portfolio manager, CWAM or its predecessors, July 1992-September 2003; Director, Wanger Investment Company PLC; Consultant, CWAM or its predecessors, September 2003-September 2005. | | | 10 | | | Columbia Acorn Trust. | |
|
| Officers of Wanger Advisors Trust: | |
|
Ben Andrews, 42,
Vice President | | | 2004 | | | Portfolio manager and analyst, CWAM or its predecessors, since 1998; Vice President, Columbia Acorn Trust and Wanger Advisors Trust, since 2004. | | | 10 | | | None. | |
|
Michael G. Clarke, 39,
Assistant Treasurer | | | 2004 | | | Treasurer of certain Columbia Funds since June 2008; Deputy Treasurer of certain Columbia Funds since June 2008; Chief Accounting Officer and Assistant Treasurer, the Columbia Funds, October 2004 to May 2008; Director of Fund Administration, Columbia Management Advisors, LLC, since January 2006; Managing Director, Columbia Management Advisors, LLC, September 2004-December 2005; Vice President of Fund Administration, Columbia Management Advisors, LLC, June 2002-September 2004. | | | 10 | | | None. | |
|
Jeffrey Coleman, 39,
Assistant Treasurer | | | 2006 | | | Director of Fund Administration, CWAM, since January 2006; Fund Controller, CWAM or its predecessors, October 2004-January 2006; Vice President, CDC IXIS Asset Management Services, Inc., August 2000-September 2004. | | | 10 | | | None. | |
|
26
Wanger International Select 2008 Annual Report
Board of Trustees and Management of Wanger Advisors Trust
Name, Position(s) with
Wanger Advisors
Trust and Age at
December 31, 2008 | | Year First
Elected or
Appointed
to Office | | Principal Occupation(s) during
Past Five Years | | Number of
Portfolios in
Fund Complex
Overseen
by Trustee/Officer | | Other
Directorships
in addition
to Wanger
Advisors Trust | |
J. Kevin Connaughton, 44,
Assistant Treasurer | | | 2001 | | | President of certain Columbia Funds since January 2009; Treasurer and Chief Financial Officer, the Columbia Funds, since December 2000; Managing Director, Columbia Management Advisors, LLC, since April 2003; Treasurer and Chief Financial Officer of the Liberty Funds, Stein Roe Funds and Liberty All-Star Funds, December 2000-December 2006; Treasurer, the Galaxy Funds, September 2002-November 2005; Senior Officer of various affiliated entities of Bank of America, including other registered and unregistered funds. | | | 10 | | | None. | |
|
P. Zachary Egan, 40,
Vice President | | | 2003 | | | Director of International Research, CWAM or its predecessors, since December 2004; Vice President, Columbia Acorn Trust and Wanger Advisors Trust, since 2003; portfolio manager and analyst, CWAM or its predecessors, since 1999. | | | 10 | | | None. | |
|
Peter T. Fariel, 51,
Assistant Secretary | | | 2006 | | | Associate General Counsel, Bank of America Corporation, since April 2005; prior thereto, Partner, Goodwin Procter LLP (law firm). | | | 10 | | | None. | |
|
John Kunka, 38,
Assistant Treasurer | | | 2006 | | | Director of Accounting and Operations, CWAM or its predecessors, since May 2006; Manager of Mutual Fund Operations, Calamos Advisors, Inc. (investment advisor), September 2005-May 2006; prior thereto, Manager of Mutual Fund Administration, Van Kampen Investments. | | | 10 | | | None. | |
|
Joseph LaPalm, 38,
Vice President | | | 2006 | | | Chief Compliance Officer, CWAM, since 2005; prior thereto, compliance officer, William Blair & Company (investment firm). | | | 10 | | | None. | |
|
Bruce H. Lauer, 51,
Vice President,
Secretary and Treasurer | | | 1995 | | | Chief Operating Officer, CWAM or its predecessors, since April 2000; Vice President, Secretary and Treasurer, Columbia Acorn Trust and Wanger Advisors Trust, since 1995; Director, Wanger Investment Company PLC; Director, Banc of America Capital Management (Ireland) Ltd.; Director, Bank of America Global Liquidity Funds, PLC. | | | 10 | | | None. | |
|
Louis J. Mendes, 44,
Vice President | | | 2003 | | | Portfolio manager and analyst, CWAM or its predecessors, since 2001; Vice President, Columbia Acorn Trust and Wanger Advisors Trust, since 2003. | | | 10 | | | None. | |
|
Robert A. Mohn, 47,
Vice President | | | 1997 | | | Director of Domestic Research, CWAM or its predecessors, since March 2004; Vice President, Columbia Acorn Trust and Wanger Advisors Trust, since 1997; portfolio manager and analyst, CWAM or its predecessors, since August 1992. | | | 10 | | | None. | |
|
Christopher Olson, 44,
Vice President | | | 2001 | | | Portfolio manager and analyst, CWAM or its predecessors, since January 2001; Vice President, Columbia Acorn Trust and Wanger Advisors Trust, since 2001. | | | 10 | | | None. | |
|
Robert P. Scales, 56,
Chief Compliance Officer,
Chief Legal Officer,
Senior Vice President and
General Counsel | | | 2004 | | | Chief Compliance Officer, Chief Legal Officer, Senior Vice President and General Counsel, Columbia Acorn Trust and Wanger Advisors Trust, since 2004; prior thereto, Associate General Counsel, Grant Thornton LLP (public accounting firm). | | | 10 | | | None. | |
|
Linda Roth-Wiszowaty, 39,
Assistant Secretary | | | 2006 | | | Business support analyst, CWAM, since April 2007; prior thereto executive administrator, CWAM or its predecessors, and executive assistant to the Chief Operating Officer of CWAM or its predecessors. | | | 10 | | | None. | |
|
(1) Mr. McQuaid is an "interested person" of Wanger Advisors Trust and of CWAM, as defined in the Investment Company Act of 1940 because he is an officer of the Trust and of CWAM.
(2) Mr. Wanger is an "interested person" of Wanger Advisors Trust and of CWAM, as defined in the Investment Company Act of 1940 because he owns securities issued by a controlling person of CWAM.
27
Wanger International Select 2008 Annual Report
This page intentionally left blank.
28
Wanger International Select 2008 Annual Report

Wanger Advisors Trust
Transfer Agent,
Dividend Disbursing Agent
Columbia Management Services, Inc.
P.O. Box 8081
Boston, Massachusetts
02266-8081
Distributor
Columbia Management Distributors, Inc.
One Financial Center
Boston, Massachusetts
02111-2621
Investment Advisor
Columbia Wanger Asset Management, L.P.
227 West Monroe Street, Suite 3000
Chicago, Illinois 60606
1-888-4-WANGER
(1-888-492-6437)
Legal Counsel
Bell, Boyd & Lloyd LLP
Chicago, Illinois
Independent Registered
Public Accounting Firm
PricewaterhouseCoopers LLP
Chicago, Illinois
This report, including the schedules of investments and financial statements, is submitted for the general information of the shareholders of the Wanger Advisors Trust.
A description of the Fund's proxy voting policies and procedures and a copy of the Fund's voting record for the most recent 12-month period ended June 30 are available (i) on the Securities and Exchange Commission's website at www.sec.gov, and (ii) without charge, upon request, by calling 1-888-492-6437.
The Fund files a complete schedule of portfolio holdings with the SEC for the first and third quarters of each fiscal year on Form N-Q. The Fund's Form N-Q is available on the SEC's website at www.sec.gov and may be reviewed and copied at the SEC's Public Reference Room in Washington, D.C. Information on the operation of the Pubic Reference Room may be obtained by calling 1-800-SEC-0330.
29
Columbia Wanger Funds
0L2568A
SHC-42/5027-1208 09/72711
Wanger International
(formerly Wanger International Small Cap)
2008 Annual Report

| NOT FDIC INSURED | | May Lose Value | |
|
| NOT BANK ISSUED | | No Bank Guarantee | |
|

Wanger International
2008 Annual Report
Table of Contents
| | 1 | | | Understanding Your Expenses | |
|
| | 2 | | | The Population Bust | |
|
| | 4 | | | Performance Review | |
|
| | 6 | | | Statement of Investments | |
|
| | 14 | | | Statement of Assets and Liabilities | |
|
| | 14 | | | Statement of Operations | |
|
| | 15 | | | Statement of Changes in Net Assets | |
|
| | 16 | | | Financial Highlights | |
|
| | 17 | | | Notes to Financial Statements | |
|
| | 21 | | | Report of Independent Registered Public Accounting Firm | |
|
| | 22 | | | Federal Income Tax Information | |
|
| | 23 | | | Management Fee Evaluation of the Senior Officer | |
|
| | 27 | | | Board Approval of the Advisory Agreement | |
|
| | 29 | | | Board of Trustees and Management of Wanger Advisors Trust | |
|
Columbia Wanger Asset Management, L.P. ("CWAM") is one of the leading global small- and mid-cap equity managers in the United States with more than 37 years of small- and mid-cap investment experience. As of December 31, 2008, CWAM manages $19.3 billion in assets and is the investment advisor to Wanger USA, Wanger International, Wanger Select, Wanger International Select (together, the "Wanger Advisors Trust Funds") and the Columbia Acorn Family of Funds. Columbia Management Group, LLC ("Columbia Management") is the investment management division of Bank of America Corporation. Columbia Management entities furnish investment management services and products for institutional and individual investors. The Wanger Advisors Trust Funds and the Columbia Acorn Family of Funds (together with other funds advised by Columbia Management affiliates, the "Columbia Funds") are distributed by Columbia Management Distributors, Inc., member of FINRA, SIPC, part of Columbia Management and an affiliate of Bank of America Corporation. CWAM is a registered investment advisor and an indirect, wholly owned subsidiary of Bank of America Corporation. CWAM is part of Columbia Management.
Please consider the investment objectives, risks, charges and expenses for the Fund carefully before investing. Contact 1-888-4-WANGER for a prospectus, which contains this and other important information about the Fund. You should read it carefully before you invest.
The views expressed in "The Population Bust" and in the Performance Review reflect the current views of the respective parties. These views are not guarantees of future performance and involve certain risks, uncertainties and assumptions that are difficult to predict so actual outcomes and results may differ significantly from the views expressed. These views are subject to change at any time based upon economic, market or other conditions and the respective parties disclaim any responsibility to update such views. These views may not be relied on as investment advice and, because investment decisions for a Columbia Fund are based on numerous factors, may not be relied on as an indication of trading intent on behalf of any particular Columbia Fund. References to specific company securities should not be construed as a recommendation or investment advice.
Wanger International 2008 Annual Report
Understanding Your Expenses
As a Fund shareholder, you incur two types of costs. There are transaction costs, which generally include sales charges on purchases and may include redemption or exchange fees. There are also ongoing costs, which generally include investment advisory fees and other Fund expenses. The information on this page is intended to help you understand your ongoing costs of investing in the Fund and to compare these costs with the ongoing costs of investing in other mutual funds.
Analyzing your Fund's expenses
To illustrate these ongoing costs, we have provided an example and calculated the expenses paid by investors in the Fund during the period. The information in the following table is based on an initial, hypothetical investment of $1,000, which is invested at the beginning of the period and held for the entire period. Expense information is calculated two ways and each method provides you with different information. The amount listed in the "Actual" column is calculated using actual operating expenses and total return for the Fund. The amount listed in the "Hypothetical" column assumes that the return each year is 5% before expenses and then applies the Fund's actual expense ratio for the period to the hypothetical return. You should not use the hypothetical account values and expenses to estimate either your actual account balance at the end of the period or the expenses you paid during the period. See the "Compare with other fu nds" information for details on using the hypothetical data.
Estimating your actual expenses
To estimate the expenses that you actually paid over the period, first you will need your account balance at the end of the period.
1. Divide your ending account balance by $1,000. For example, if an account balance was $8,600 at the end of the period, the result would be 8.6.
2. In the section of the table below titled "Expenses paid during the period," you will find a dollar amount in the column labeled "Actual." Multiply this amount by the result from step 1. Your answer is an estimate of the expenses you paid on your account during the period.
July 1, 2008 – December 31, 2008
| | | Account value at the
beginning of the period ($) | | Account value at the
end of the period ($) | | Expenses paid during
the period ($) | | Fund's annualized
expense ratio (%)* | |
| | | Actual | | Hypothetical | | Actual | | Hypothetical | | Actual | | Hypothetical | | Actual | |
| Wanger International | | | 1,000.00 | | | | 1,000.00 | | | | 600.08 | | | | 1,019.81 | | | | 4.26 | | | | 5.38 | | | | 1.06 | | |
*For the six months ended December 31, 2008.
Expenses paid during the period are equal to the Fund's annualized expense ratio, multiplied by the average account value over the period, then multiplied by the number of days in the Fund's most recent fiscal half-year and divided by 366.
It is important to note that the expense amounts shown in the table are meant to highlight only ongoing costs of investing in the Fund. Expenses paid during the period do not include any insurance charges imposed by your insurance company's separate account. The hypothetical example provided is useful in comparing ongoing costs only and will not help you determine the relative total costs of owning different funds whose shareholders may incur transaction costs.
Compare with other funds
Since all mutual funds are required to include the same hypothetical calculations about expenses in shareholder reports, you can use this information to compare the ongoing cost of investing in the Fund with other funds. To do so, compare the 5% hypothetical example with the 5% hypothetical examples of other funds. As you compare hypothetical examples of other funds, it is important to note that hypothetical examples are meant to highlight the ongoing cost of investing in a fund and do not reflect any transaction costs, such as sales charges, redemption fees or exchange fees that may be incurred by shareholders of other funds. Expenses paid during the period do not include any insurance charges imposed by your insurance company's separate accounts.
1
Wanger International 2008 Annual Report

The Population Bust
Important socio-economic predictions are based on demographics. For example, virtually all of the people who will retire in 2058 are living today and retirement age, immigration and mortality trends are utilized to create assumptions that will be used to predict the number of future retirees. The labor force of 2028 and the military age population of 2025 are similarly predictable. These factors are major drivers of government burdens, GDP growth and military potential. Demographics indicate that the world is unlikely to age gracefully.
World Demographic Trends
Richard Jackson and Neil Howe's, The Graying of the Great Powers provides an excellent summary of current demographic trends. Its authors conclude that, "The world is entering a demographic transformation of unprecedented dimensions...a fundamental demographic shift with no parallel in the history of humanity.... There is almost no chance that it will not happen—or that it will be reversed in our lifetime."1
The world's current great powers2 are aging at remarkably divergent rates. The United States is barely aging and has a fertility rate of 2.0 to 2.1 births per woman during child-bearing years, very near long-term zero population growth. This country is one of the youngest developed nations, and the age gap between the United States and other developed countries is projected to widen. "By the mid-2020's, the United States will be the only major developed country with more children under age 20 than elderly over age 65—and the only one whose working-age population will still be growing," write Jackson and Howe. The U.S. work force is projected to grow 14% between 2005 and 2030.3
Russian fertility rates plunged through the 1980s and rest today at 1.2 to 1.3 births. Risky lifestyles and a poor health care system have caused mortality rates to soar. Life expectancy for a Russian male has dropped to 59 years, lower than that of Bangladeshi males! Russia's working age population (those aged 20 to 64) will plunge 17% from 2005 to 2030.4 Prime Minister Vladimir Putin termed Russia's lack of births as "the most acute problem facing our country today."5
Jackson and Howe note that Japan is ground zero for demographic aging. Like Russia, its fertility rate has fallen to an average of 1.3 children per woman. In 1980, Japan was the youngest developed country, with only 9% of its population over age 65. By 2005, its elderly (those aged 65 and over) accounted for 20% of its population, making it one of the oldest developed countries. Japan's working-age population started shrinking in 2000 and from 2005 to 2030 it is expected to drop 18%.6
China's one-child policy collapsed fertility rates, which have since rebounded to 1.7 to 1.8. But China's pre-one-child-policy population bulge is aging rapidly. China's working age population will fall after 2015 and China's ratio of workers to retirees will triple from 2005 to 2030. The Chinese have relied on family rather than the government for old age support and, with shrunken families, China by 2030 could have over 100 million indigent seniors. The Asian Tigers' fertility rates range from 0.9 to 1.4, and the Tigers also are rapidly aging.7,8
There are two demographic categories of Western European countries: those with likely slow population declines and those with likely fast population drops. Slow decliners have fertility rates of around 1.8 and include the United Kingdom, France and northern Europe, except Germany. Fast decliners have fertility rates of 1.3 and include Germany and southern Europe. The working age population of Europe is projected to shrink 6% by 2030. Public pensions already cost Europe twice the percentage of GDP as compared to the United States, and will get worse. Europe's elderly will account for over 25% of its population in 2030, up from 17% in 2005.9
The image of rapidly growing populations all over the developing world is outdated. Only a few areas of the world, including sub-Saharan Africa and some Muslim countries (Iraq, Yemen, Somalia, Sudan, Afghanistan and Pakistan) have fertility rates of 4.0 or higher. Fertility has trended down in most other developing countries. In non-Muslim South Asia, including India, fertility has fallen to about 3.0. Latin America fertility has dropped to 2.5 from 6.0 in the 1960s. Turkey and Iran have current fertility rates around 2.1. However, many developing countries have high percentages of women in childbearing ages, so despite declining fertility rates, their absolute numbers of youths and working age populations will grow rapidly for several decades.10
Immigration will impact the numbers in the United States and Europe. Migration is at or near records in many countries. Some 13% of the U.S. population consists of immigrants, as does 8% to 13% of France, the United Kingdom and Germany. Hispanics are the primary immigrants into the United States; most are employed and data indicates that second generation Hispanics have higher incomes than their parents. That in turn suggests higher productivity and some degree of assimilation. Muslims are the primary immigrants in many European countries; their unemployment rates are high and most of their second generation seems to be making little economic progress; many are not assimilating. This suggests future productivity problems in much of Europe, and possibly diverging national interests.11
Jackson and Howe cite numerous geopolitical implications from demographic changes. Within the developed world, only the United States will likely have the capacity to remain a great power. It was the third most populous country in the world in 1950 and is forecasted to remain so in 2050.
2
Wanger International 2008 Annual Report
Germany, the United Kingdom, Italy and France had populations among the top dozen countries in the world in 1950, but of them, Germany will be the leader at 26th in 2050. Western Europe and Japan will be aged and Western Europe especially will have huge public pension costs. While the United States and Western Europe each accounted for 37% of the developed world's economy in the 1980s, the U.S. will likely grow to 54% and Western Europe is projected to shrink to 23% by 2050.12 The United States' increasing relative strength will likely mean that it will need to provide for an even greater proportion of the developed world's security.
Though the U.S. share of the developed world's population and economy will rise, its share of the total world's population and economy will fall. Howe and Jackson note that 90% of the world's population growth to 2050 will occur in sub-Saharan Africa, Muslim countries and South Asia, in nations largely troubled by poverty, religious conflict or both.13
Due to the characteristics of population segments, security risks are likely to rise and peak in the 2020s. This will come at a time when most of the historically great powers are likely to have military recruiting challenges along with budget problems. Jackson and Howe also worry about the effects of aging on savings rates and creativity. In a book by Mark Steyn titled America Alone,14 the author writes that the United States should do a better job exporting its values of liberty, women's rights, freedom of speech, self reliance, decentralization and responsibility. He believes this is one way the U.S. influence can make a posi tive impact.
Investment Implications
Change creates investment risks and opportunities. Recognizing these powerful trends and understanding when they are likely to occur could mitigate the risks and result in profitable investments.
Studies indicate that an individual's creativity, as measured by works of art, peaks between the ages of 30 and 50 and that Nobel achievements peak when people are in their 30s.15 An aging worldwide population may make innovation more scarce and consequently more highly rewarded. Innovative companies may become less subject to competition and be more highly valued in financial markets.
Small- and mid-cap companies tend to be innovative and adaptable. Many existing companies provide goods and services to growing population segments and more will emerge in the future to do so. Our analysts will continue to pursue these opportunities around the world.
The United States has excellent prospects compared to much of the rest of the developed world. Many investment analysts have tracked the baby boomer and echo baby boomer age segments, and as a result have predicted demand for goods and services such as toys, school books, automobiles, housing, leisure items and health care. Long-term demand for leisure and health care continues to appear promising, and additional opportunities may include companies producing labor saving devices and military technology. The United States stands to benefit from woes elsewhere, as highly productive people migrate here for employment and entrepreneurial opportunities, lower taxes and, in some cases, less strife.
There will continue to be investment opportunities overseas. In developed countries, companies that provide products or services to aging populations should benefit. Once the world economy recovers, capital goods suppliers to developing countries should resume growing. Developing countries that have moderate population growth and attractive climates for capitalism are likely to increase their share of world GDP and provide investment opportunities. Companies that participate in domestic growth within these countries should especially benefit.


Charles P. McQuaid
President and Chief Investment Officer
Columbia Wanger Asset Management, L.P.
The information and data provided in this analysis are derived from sources that we deem to be reliable and accurate. These views are not guarantees of future performance and involve certain risks, uncertainties and assumptions that are difficult to predict so actual outcomes and results may differ significantly from the views expressed. The views/opinions expressed in this essay are those of the author and not of the Columbia Wanger Trust Board, are subject to change at any time based upon economic, market or other conditions, may differ from views expressed by other Columbia Management associates or other divisions of Bank of America and the respective parties disclaim any responsibility to update such views. These views may not be relied on as investment advice and, because investment decisions for a Columbia Wanger Fund are based on numerous factors, may not be relied on as an indication of trading intent on behalf of any particular Columbia Wanger Fund.
1 Jackson, Richard and Howe, Neil, The Graying of the Great Powers, (Washington, D.C., Center for Strategic & International Studies, 2008), pg. 1.
2 By popular definition, the "great powers" are the worlds most powerful countries based on wealth, military strength and population.
3 Jackson, Richard and Howe, Neil, op. cit., pgs. 39-40.
4 Ibid, pg. 179.
5 "Vladimir Putin on Raising Russia's Birth Rate," Population and Development Review 32, no. 2 (June 2006).
6 Jackson, Richard and Howe, Neil, op. cit., pg. 44.
7 The Asian Tiger countries include Hong Kong, Singapore, South Korea and Taiwan.
8 Jackson, Richard and Howe, Neil, op. cit., pgs. 155, 171, 175.
9 Ibid, pg. 42.
10 Ibid, pgs. 163-176.
11 Ibid, pgs. 122-126.
12 Ibid, pgs. 191-192.
13 Ibid, pg. 194.
14 Steyn, Mark, America Alone: The End of the World As We Know It, (Washington, D.C., Regnery Publishing, Inc., 2006), pgs. 173, 205.
15 Jackson, Richard and Howe, Neil, op. cit., pg. 111.
3
Wanger International 2008 Annual Report

Performance Review Wanger International
 | |  | |
|
Louis J. Mendes III
Co-Portfolio Manager | | Christopher J. Olson
Co-Portfolio Manager | |
|
Performance data quoted represents past performance and current performance may be lower or higher. Past performance is no guarantee of future results. The investment return and principal value will fluctuate so that shares, when redeemed, may be worth more or less than the original cost. Performance may reflect any voluntary waiver and reimbursement of fund expenses by the advisor or affiliates. Absent these fee waivers, or expense reimbursements, performance results may be lower. For daily and most recent month-end performance updates, please call 1-888-4-WANGER.
All results shown assume reinvestment of distributions and do not reflect the deduction of taxes that a shareholder would pay on fund distributions or on the redemption of fund shares.
Wanger International fell 45.60% in 2008. This result compares to a 47.84% drop in the S&P Global Ex-U.S. Between $500 Million and $5 Billion Index* for the year. The large-cap MSCI EAFE Index fell 43.38% for the annual period, registering the first year in nine in which large-cap international stocks outperformed small caps. The Fund's absolute return reflects the rout of equities globally, which fell victim to the deepening credit crisis and resulting contraction of business activity and discretionary consumer spending. Few regions or industry sectors were spared over the course of the year. Reported in U.S. dollars, small caps in every country with a sizeable market were off 40% or more in the Index with the exception of Japan (-22%, buoyed by the strengthening yen) and Switzerland (-35%). The same is true of individual industry sectors—with the exception of classic defensive stocks like consumer staples, health care and utilities—which all fell at least 30%.
Positive contributors to the Fund's relative performance included a handful of Japanese companies serving the domestic Japanese market. Cable television broadcaster Jupiter Telecommunications, pet food producer Unicharm PetCare and Daito Trust Construction, which plans and constructs small apartment buildings on behalf of Japanese landowners, were among this list.
In excess of 0.7% of the Fund's assets was, over the course of the year, invested in potash producers. Sociedad Quimica y Minera de Chile outperformed thanks to the potash industry's strong pricing power. The Fund took advantage of the dramatic weakness in the fourth quarter to buy another potash producer, Israel Chemicals, posting a gain in the position by year end.
The biggest losers were a highly differentiated group. Large positions in Hong Kong Exchanges and Clearing as well as Singapore Exchange tanked as trading volumes and new listing activity waned. We were also disappointed by the performance of suppliers to oil and gas producers, which we (wrongly) believed would prove resilient, even in an environment of falling energy prices. Though addressing very different areas within the sector, Fugro, Atwood Oceanics and ShawCor each fell more than 55%. Finally, Greek state lottery operator Intralot collapsed when the expiration of its crucial Turkish concession resulted in renegotiation at much less favorable terms.
The losses suffered by equity investors this year were unprecedented in the postwar period. While it is small consolation, it is noteworthy that over a five-year period, which approximates our typical investment horizon, the Fund has posted a positive annualized return of 6.56%, ahead of its benchmark index's 4.20%. For longer-term investors looking to diversify a U.S.-centric portfolio, it would also have, over that five year period, provided a diversification benefit. The annualized five-year loss on the Russell 2500 Index was 0.98% and the S&P 500 Index fell 2.19%. While economic fundamentals remain highly uncertain, and further room for pain cannot be ruled out, international small-cap stocks now trade very near the bottom of their 10-year ranges on price-to-sales and price-to-book value, measures which mitigate the effects of earnings cyclicality. This, combined with the fact that well capitalized companies with good ea rnings models may eventually emerge from the current turmoil in even stronger competitive positions, gives cause for some optimism, particularly for investors with a longer time horizon. We will strive to take advantage of valuation anomalies as we find them to trade up in quality and maximize the risk-adjusted expected return of the Fund.
International investing involves special risks, including foreign taxation, currency risks, risks associated with possible differences in financial standards and other risks associated with future political and economic developments. Stocks of small- and mid-cap companies pose special risks, including possible illiquidity and greater price volatility than stocks of larger, more established companies. Investing in emerging markets may involve greater risks than investing in more developed countries. In addition, concentration of investments in a single region may result in greater volatility.
Portfolio holdings are subject to change periodically and may not be representative of current holdings.
*Effective October 1, 2008, Standard & Poor's implemented a new naming convention for its family of indexes. Prior to the renaming, the S&P Global Ex-U.S. Between $500 Million and $5 Billion Index was known as the S&P/Citigroup Global ex-US Cap Range $500M-$5B Index. This index name change was not expected to result in any alterations to the constitution or calculation of the index and does not in any way affect the manner in which the Fund is managed or the investment objective or principal investment strategy of the Fund, which remain unchanged.
4
Wanger International 2008 Annual Report
Growth of a $10,000 Investment in
Wanger International
Total return for each period,
May 3, 1995 (inception date) through December 31, 2008
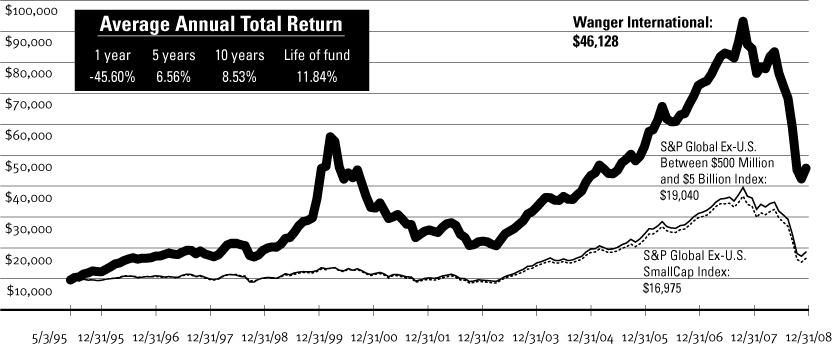
This graph compares the results of $10,000 invested in Wanger International on May 3, 1995 (the date the Fund began operations) through December 31, 2008, to the S&P Global Ex-U.S. Between $500 Million and $5 Billion Index and the S&P Global Ex-U.S. SmallCap Index, with dividends and capital gains reinvested. Performance shown here is past performance, which cannot guarantee future results. Current performance may be higher or lower. The investment return and principal value of an investment in the Fund will fluctuate so that Fund shares, when redeemed, may be worth more or less than their original cost. Performance changes over time. Current returns for the Fund may be different than that shown. For daily and most recent month-end performance updates, please contact us at 1-888-4-WANGER.
Results to December 31, 2008
| | | 4th quarter | | 1 year | |
| Wanger International | | | -21.92 | % | | | -45.60 | % | |
S&P Global Ex-U.S. Between $500 Million
and $5 Billion Index† | | | -23.02 | | | | -47.84 | | |
| S&P Global Ex-U.S. SmallCap Index | | | -24.70 | | | | -49.85 | | |
| MSCI EAFE Index | | | -19.95 | | | | -43.38 | | |
NAV as of 12/31/08: $20.69
Performance numbers reflect all Fund expenses but do not include any insurance charge imposed by your insurance company's separate accounts. If performance included the effect of these additional charges, it would be lower.
The Fund's annual operating expense ratio is 0.98%. The annual operating expense ratio is as stated in the Fund's prospectus that is current as of the date of this report. Differences in expense ratios disclosed elsewhere in this report may result from including fee waivers and expense reimbursements as well as different time periods used in calculating the ratios.
All results shown assume reinvestment of distributions and do not reflect taxes that a shareholder would pay on Fund distributions or the sale of Fund shares.
†The Fund changed its primary benchmark effective January 1, 2008, because the advisor believes the S&P Global Ex-U.S. Between $500 Million and $5 Billion Index is more consistent with the market capitalization range of the companies in which the Fund invests.
The S&P Global Ex-U.S. Between $500 Million and $5 Billion Index is a subset of the broad market selected by the index sponsor representing the mid- and small-cap developed and emerging markets, excluding the United States. The S&P Global Ex-U.S. SmallCap Index is an unmanaged index consisting of the bottom 20% of institutionally investable capital of developed and emerging countries, outside the United States. The Morgan Stanley Capital International Europe, Australasia, Far East (MSCI EAFE) Index is a capitalization-weighted index that tracks the total return of common stocks in 21 developed-market countries within Europe, Australia and the Far East. Indexes are not managed and do not incur fees or expenses. It is not possible to invest directly in an index.
Portfolio characteristics and holdings are subject to change periodically and may not be representative of current characteristics and holdings.
Top 5 Countries
As a percentage of net assets, as of 12/31/08
| Japan | | | 21.8 | % | |
| United Kingdom | | | 8.3 | | |
| Netherlands | | | 6.2 | | |
| Germany | | | 6.1 | | |
| China | | | 4.9 | | |
Top 10 Holdings
As a percentage of net assets, as of 12/31/08
1. Jupiter Telecommunications (Japan)
Largest Cable Service Provider in Japan | | | 1.9 | % | |
2. Rhoen-Klinikum (Germany)
Health Care Services | | | 1.5 | | |
3. Imtech (Netherlands)
Engineering & Technical Services | | | 1.3 | | |
4. Cephalon (United States)
Specialty Pharmaceuticals for Pain,
Central Nervous System & Oncology | | | 1.1 | | |
5. Kansai Paint (Japan)
Paint Producer in Japan, India, China & Southeast Asia | | | 1.1 | | |
6. Intertek Testing (United Kingdom)
Testing, Inspection & Certification Services | | | 1.1 | | |
7. Capita Group (United Kingdom)
White Collar, Back Office Outsourcing | | | 1.1 | | |
8. Aryzta (Ireland)
Baked Goods | | | 1.0 | | |
9. Sociedad Quimica y Minera de Chile (Chile)
Producer of Specialty Fertilizers, Lithium & Iodine | | | 1.0 | | |
10. Serco (United Kingdom)
Facilities Management | | | 1.0 | | |
5
Wanger International 2008 Annual Report
Wanger International
Statement of Investments December 31, 2008
Number of
Shares | | | | Value | |
| | | | | Common Stocks – 93.1% | | | | | |
| | | Europe – 39.1% | |
| | | United Kingdom – 8.3% | |
| | 970,000 | | | Intertek Testing
Testing, Inspection & Certification Services | | $ | 10,987,401 | | |
| | 1,000,000 | | | Capita Group
White Collar, Back Office Outsourcing | | | 10,655,003 | | |
| | 1,500,000 | | | Serco
Facilities Management | | | 9,762,738 | | |
| | 2,490,000 | | | Charles Taylor (a)
Insurance Services | | | 9,084,468 | | |
| | 950,000 | | | Smith & Nephew
Medical Equipment & Supplies | | | 6,027,455 | | |
| | 135,000 | | | Randgold Resources - ADR
Gold Mining in Western Africa | | | 5,929,200 | | |
| | 2,423,600 | | | RPS Group
Environmental Consulting & Planning | | | 4,918,842 | | |
| | 400,000 | | | Rotork
Valve Actuators for Oil & Water Pipelines | | | 4,571,272 | | |
| | 2,200,000 | | | Begbies Traynor
Financial Restructuring & Corporate
Recovery Services | | | 4,452,023 | | |
| | 352,000 | | | Keller Group
International Ground Engineering Specialist | | | 2,925,482 | | |
| | 769,100 | | | Informa Group
Global Publisher & Event Organizer | | | 2,728,822 | | |
| | 200,000 | | | Admiral
United Kingdom Auto Insurer | | | 2,641,666 | | |
| | 254,000 | | | Intermediate Capital
European Provider of Mezzanine Capital | | | 2,370,302 | | |
| | 230,000 | | | Tullow Oil
Oil & Gas Producer | | | 2,200,959 | | |
| | 40,100 | | | Chemring
Defense Manufacturer of Countermeasures &
Energetics | | | 1,129,058 | | |
| | 227,900 | | | Northgate
Light Commercial Vehicle Rental Specialist | | | 253,140 | | |
| | | | | | | | 80,637,831 | | |
| | | Netherlands – 6.2% | |
| | 745,000 | | | Imtech
Engineering & Technical Services | | | 12,606,064 | | |
| | 361,666 | | | Koninklijke TenCate
Advanced Textiles & Industrial Fabrics | | | 8,171,420 | | |
Number of
Shares | | | | Value | |
| | 435,000 | | | QIAGEN (b)
Life Science Company; DNA/RNA Purification | | $ | 7,601,833 | | |
| | 228,600 | | | Fugro
Oilfield Services | | | 6,562,967 | | |
| | 542,000 | | | Unit 4 Agresso
Business & Security Software | | | 5,989,106 | | |
| | 102,595 | | | Smit Internationale
Harbor & Offshore Towage & Marine Services | | | 5,045,053 | | |
| | 367,000 | | | Arcadis
Engineering Consultant | | | 4,838,307 | | |
| | 668,055 | | | Aalberts Industries
Flow Control & Heat Treatment | | | 4,772,298 | | |
| | 125,000 | | | Vopak
World's Largest Operator of Petroleum &
Chemical Storage Terminals | | | 4,742,918 | | |
| | 137,380 | | | Wavin
Largest European Plastic Pipe Systems
Company | | | 448,908 | | |
| | | | | | | | 60,778,874 | | |
| | | Germany – 6.1% | |
| | 587,000 | | | Rhoen-Klinikum
Health Care Services | | | 14,107,816 | | |
| | 276,000 | | | CTS Eventim
Event Ticket Sales | | | 9,313,757 | | |
| | 178,000 | | | Wincor Nixdorf
Retail POS Systems & ATM Machines | | | 8,486,688 | | |
| | 66,300 | | | Vossloh
Rail Infrastructure & Diesel Locomotives | | | 7,465,215 | | |
| | 56,300 | | | Rational
Commercial Oven Manufacturer | | | 6,679,564 | | |
| | 205,000 | | | Deutsche Beteiligungs
Private Equity Investment Management | | | 3,533,004 | | |
| | 338,800 | | | Elringklinger
Automobile Components | | | 3,283,069 | | |
| | 255,000 | | | Takkt
Mail Order Retailer of Office & Warehouse
Durables | | | 2,855,482 | | |
| | 197,000 | | | Tognum
Diesel Engines for Drive & Power
Generation Systems | | | 2,516,372 | | |
See accompanying notes to financial statements.
6
Wanger International 2008 Annual Report
Wanger International
Statement of Investments December 31, 2008
Number of
Shares | | | | Value | |
| | | Germany – 6.1% (cont) | |
| | 45,700 | | | Hamburger Hafen und Logistik
Terminal Operator at the Hamburg Port | | $ | 1,522,102 | | |
| | | | | | | | 59,763,069 | | |
| | | France – 4.4% | |
| | 481,000 | | | SES Global
Satellite Broadcasting Services | | | 9,259,525 | | |
| | 93,000 | | | Neopost
Postage Meter Machines | | | 8,417,747 | | |
| | 83,000 | | | Iliad
Alternative Internet & Telecoms Provider | | | 7,188,945 | | |
| | 70,500 | | | Rubis
Tank Storage & Liquefied Petroleum
Gas Supplier | | | 4,441,109 | | |
| | 57,200 | | | Pierre & Vacances
Vacation Apartment Lets | | | 3,038,817 | | |
| | 60,000 | | | Eurofins Scientific
Food Screening & Testing | | | 2,973,236 | | |
| | 70,300 | | | Norbert Dentressangle
Transport | | | 2,692,515 | | |
| | 99,600 | | | Carbone Lorraine
Advanced Industrial Materials | | | 2,486,001 | | |
| | 88,200 | | | Meetic (b)
Dating Services | | | 1,294,071 | | |
| | 285,000 | | | Hi-Media (b)
Leading Online Advertiser in Europe | | | 642,762 | | |
| | | | | | | | 42,434,728 | | |
| | | Switzerland – 3.1% | |
| | 141,300 | | | Kuehne & Nagel
Freight Forwarding/Logistics | | | 9,161,345 | | |
| | 80,000 | | | Geberit
Plumbing Supplies | | | 8,618,497 | | |
| | 6,900 | | | Sika
Chemicals for Construction & Industrial
Applications | | | 5,871,923 | | |
| | 27,000 | | | Burckhardt Compression
Gas Compression Pumps | | | 3,891,920 | | |
| | 3,900 | | | Givaudan
Fragrances & Flavors | | | 3,072,254 | | |
| | | | | | | | 30,615,939 | | |
Number of
Shares | | | | Value | |
| | | Sweden – 2.4% | |
| | 1,974,000 | | | SWECO
Engineering Consultants | | $ | 8,812,342 | | |
| | 1,705,000 | | | Hexagon
Measurement Equipment & Polymers | | | 8,352,000 | | |
| | 1,500,200 | | | Nobia
Kitchen Cabinet Manufacturing & Distribution | | | 3,241,769 | | |
| | 2,401,800 | | | Niscayah Group AB
Commercial Security Installation & Service | | | 2,050,828 | | |
| | 302,985 | | | Hexpol (b)
Formulation & Production of Polymers | | | 666,290 | | |
| | | | | | | | 23,123,229 | | |
| | | Ireland – 2.2% | |
| | 315,000 | | | Aryzta (b)
Baked Goods | | | 10,087,131 | | |
| | 2,650,000 | | | United Drug
Irish Pharmaceutical Wholesaler &
Outsourcer | | | 8,212,112 | | |
| | 161,000 | | | Paddy Power
Irish Betting Services | | | 3,013,766 | | |
| | | | | | | | 21,313,009 | | |
| | | Finland – 1.6% | |
| | 630,000 | | | Poyry
Engineering Consultants | | | 6,954,665 | | |
| | 427,000 | | | Stockmann
Department Stores in Finland, Baltics &
Russia | | | 5,860,538 | | |
| | 661,648 | | | Ramirent
Largest Equipment Rental Company in
Scandinavia & Central Eastern Europe | | | 3,027,465 | | |
| | | | | | | | 15,842,668 | | |
| | | Italy – 1.0% | |
| | 4,800,000 | | | CIR
Italian Holding Company | | | 4,942,926 | | |
| | 609,200 | | | GranitiFiandre
Innovative Stoneware | | | 2,809,399 | | |
| | 304,424 | | | Credito EmilIano
Italian Regional Bank | | | 1,588,580 | | |
| | 161,800 | | | Cobra Automotive (b)
Electronic Car Theft Protection | | | 522,075 | | |
| | | | | | | | 9,862,980 | | |
See accompanying notes to financial statements.
7
Wanger International 2008 Annual Report
Wanger International
Statement of Investments December 31, 2008
Number of
Shares | | | | Value | |
| | | Poland – 1.0% | |
| | 315,000 | | | Central European Distribution (b)
Vodka Production & Alcohol Distribution | | $ | 6,205,500 | | |
| | 21,800 | | | ING Bank Slaski
Polish Universal Bank | | | 3,170,668 | | |
| | | | | | | | 9,376,168 | | |
| | | Spain 0.7% | |
| | 133,000 | | | Red Electrica de Espana
Spanish Power Grid | | | 6,738,111 | | |
| | | Greece 0.7% | |
| | 1,521,000 | | | Intralot
Lottery & Gaming Systems & Services | | | 6,352,226 | | |
| | | Czech Republic 0.6% | |
| | 37,000 | | | Komercni Banka
Leading Czech Universal Bank | | | 5,751,653 | | |
| | | Denmark 0.5% | |
| | 66,000 | | | Novozymes
Industrial Enzymes | | | 5,258,132 | | |
| | | Russia 0.3% | |
| | 235,000 | | | Novolipetsk Steel - GDR
Vertically Integrated Steel Producer,
Mini Mill Operator & Scrap Collector | | | 2,397,000 | | |
| | 109,300 | | | RosBusinessConsulting - ADR (b)
Financial Information, Media & IT
Services in Russia | | | 232,099 | | |
| | | | 2,629,099 | | |
| | | | | Total Europe | | | 380,477,716 | | |
| | | Asia – 38.4% | |
| | | Japan – 21.8% | |
| | 17,500 | | | Jupiter Telecommunications
Largest Cable Service Provider in Japan | | | 18,237,960 | | |
| | 2,155,000 | | | Kansai Paint
Paint Producer in Japan, India, China &
Southeast Asia | | | 11,013,605 | | |
| | 900,000 | | | Kamigumi
Port Cargo Handling & Logistics | | | 8,059,907 | | |
| | 1,600 | | | Osaka Securities Exchange
Osaka Securities Exchange | | | 7,113,591 | | |
Number of
Shares | | | | Value | |
| | 188,000 | | | Unicharm PetCare
Pet Food & Pet Toiletries | | $ | 6,974,046 | | |
| | 235,000 | | | Aeon Delight
Facility Maintenance & Management | | | 6,822,088 | | |
| | 590 | | | Nippon Building Fund
Office REIT | | | 6,475,775 | | |
| | 120,000 | | | Daito Trust Construction
Apartment Builder | | | 6,283,353 | | |
| | 138,400 | | | Benesse
Education Service Provider | | | 6,048,847 | | |
| | 1,200 | | | Orix JREIT
Diversified REIT | | | 5,724,722 | | |
| | 281,800 | | | Glory
Currency Handling Systems & Related
Equipment | | | 5,511,645 | | |
| | 285,000 | | | Aeon Mall
Suburban Shopping Mall Developer,
Owner & Operator | | | 5,502,158 | | |
| | 26,000 | | | Keyence
Sensors & Measuring Devices for Automation | | | 5,323,659 | | |
| | 96,300 | | | Point
Apparel Specialty Retailer | | | 5,299,879 | | |
| | 255,000 | | | Ibiden
Electronic Parts & Ceramics | | | 5,256,712 | | |
| | 371,000 | | | Rohto Pharmaceutical
Health & Beauty Products | | | 5,157,013 | | |
| | 222,000 | | | Ain Pharmaciez
Dispensing Pharmacy/Drugstore Operator | | | 4,913,672 | | |
| | 1,000,000 | | | Chuo Mitsui Trust Holdings
Trust Bank | | | 4,887,129 | | |
| | 593,800 | | | Asics
Footwear & Apparel | | | 4,788,097 | | |
| | 480,000 | | | Suruga Bank
Regional Bank | | | 4,753,825 | | |
| | 238,500 | | | Kintetsu World Express
Airfreight Logistics | | | 4,701,314 | | |
| | 185,000 | | | Miura
Industrial Boiler | | | 4,578,182 | | |
| | 93,000 | | | Ryohin Keikaku
Specialty Retail | | | 4,408,963 | | |
| | 348,100 | | | Yusen Air & Sea Service
Airfreight Logistics | | | 4,404,196 | | |
See accompanying notes to financial statements.
8
Wanger International 2008 Annual Report
Wanger International
Statement of Investments December 31, 2008
Number of
Shares | | | | Value | |
| | | Japan – 21.8% (cont) | |
| | 1,000 | | | Fukuoka
Diversified REIT in Fukuoka | | $ | 4,027,637 | | |
| | 300,000 | | | Ushio
Industrial Light Sources | | | 3,955,078 | | |
| | 104,000 | | | SYSMEX
In Vitro Diagnostics (IVD) Equipment &
Reagent Manufacturer | | | 3,818,252 | | |
| | 185,000 | | | Hamamatsu Photonics
Optical Sensors for Medical & Industrial
Applications | | | 3,580,682 | | |
| | 160,000 | | | Makita
Power Tools | | | 3,568,505 | | |
| | 56,000 | | | Nakanishi
Dental Tools & Machinery | | | 3,545,057 | | |
| | 780,000 | | | Topcon
Positioning & Medical Instrument | | | 3,411,572 | | |
| | 420,000 | | | Cosel
Industrial Standard Switching Power
Supply System | | | 3,385,925 | | |
| | 300,000 | | | NGK Insulators
Ceramic, Power & Electronics Parts | | | 3,376,369 | | |
| | 142,200 | | | Union Tool
Precision Drill Bit Manufacturer | | | 3,246,618 | | |
| | 164,100 | | | As One
Scientific Supplies Distributor | | | 3,177,760 | | |
| | 3,309 | | | Wacom
Computer Graphic Illustration Devices | | | 2,927,323 | | |
| | 54,300 | | | USS
Used Car Auctioneer | | | 2,873,008 | | |
| | 201,300 | | | T. Hasegawa
Industrial Flavors & Fragrances | | | 2,711,804 | | |
| | 700 | | | Seven Bank
ATM Processing Services | | | 2,677,677 | | |
| | 207,000 | | | Zenrin
Map Content Publisher | | | 2,532,275 | | |
| | 210,000 | | | Tamron
Camera Lens Maker | | | 1,856,464 | | |
| | 1,500 | | | Nippon Residential Investment
Residential REIT | | | 1,390,552 | | |
| | 34,100 | | | Toyo Tanso
Carbon & Graphite Products for Industrial Use | | | 1,313,785 | | |
Number of
Shares | | | | Value | |
| | 34,000 | | | Tsumura
Traditional Chinese/Japanese Herbal Rx
Drugs (Kampo) | | $ | 1,261,212 | | |
| | 550 | | | Japan Pure Chemical
Precious Metal Plating Chemicals for
Electronics | | | 1,234,311 | | |
| | 41,700 | | | FCC
Auto/Motorcycle Clutches | | | 352,200 | | |
| | | | | | | | 212,464,404 | | |
| | | China – 4.9% | |
| | 11,524,000 | | | Jiangsu Expressway
Chinese Toll Road Operator | | | 8,540,241 | | |
| | 9,452,700 | | | China Green
Agricultural Grower & Processor in China | | | 7,555,859 | | |
| | 8,355,000 | | | Hopewell Highway Infrastructure
Guangdong Tollroad Leading to Hong
Kong & Macau | | | 4,659,274 | | |
| | 258,000 | | | Mindray - ADR
Medical Device Manufacturer | | | 4,644,000 | | |
| | 4,269,000 | | | China Shipping Development
China's Dominant Shipper for Oil & Coal | | | 4,296,783 | | |
| | 3,500,000 | | | China Yurun Food
Meat Processor in China | | | 4,140,948 | | |
| | 17,899,000 | | | Sinotrans
Largest Integrated Logistics Player in China | | | 3,491,462 | | |
| | 4,580,000 | | | Fu Ji Food & Catering Services
Food Catering Service Provider in China | | | 2,451,248 | | |
| | 335,000 | | | VisionChina Media - ADR (b)
Advertising on Digital Screens in China's
Mass Transit System | | | 1,829,100 | | |
| | 94,000 | | | ZhongDe Waste Technology
Solid Municipal Waste & Medical Waste
Incinerator Manufacturer | | | 1,823,597 | | |
| | 10,500,000 | | | Xinyu Hengdeli
High-end Watch Retailer in China | | | 1,638,772 | | |
| | 50,000,000 | | | RexCapital Finance (b)
Chinese Lottery | | | 1,207,169 | | |
| | 660,300 | | | Shandong Weigao
Vertical Integrated Hospital Consumable
Manufacturer | | | 1,005,326 | | |
| | | | | | | | 47,283,779 | | |
See accompanying notes to financial statements.
9
Wanger International 2008 Annual Report
Wanger International
Statement of Investments December 31, 2008
Number of
Shares | | | | Value | |
| | | Singapore – 3.2% | |
| | 2,290,000 | | | Singapore Exchange
Singapore Equity & Derivatives Market
Operator | | $ | 8,205,033 | | |
| | 6,050,000 | | | ComfortDelGro
Taxi & Mass Transit Service | | | 6,124,368 | | |
| | 7,000,000 | | | OLAM
Agriculture Supply Chain Manager | | | 5,640,404 | | |
| | 23,018,800 | | | Mapletree Logistics
Asian Logistics Landlord | | | 5,637,293 | | |
| | 10,000,000 | | | CDL Hospitality Trust
Singapore Hotel Operator | | | 5,117,113 | | |
| | | | | | | | 30,724,211 | | |
| | | South Korea – 2.7% | |
| | 389,930 | | | Woongjin Coway (b)
South Korean Household Appliance
Rental Service Provider | | | 8,377,569 | | |
| | 120,000 | | | Taewoong
Player in the Niche Customized Forging
Market | | | 7,440,749 | | |
| | 49,800 | | | MegaStudy (b)
Online Education Service Provider | | | 7,346,938 | | |
| | 305,000 | | | Sung Kwang Bend (b)
Large Customized Industrial Pipe Fitting
Manufacturer | | | 3,115,904 | | |
| | | | | | | | 26,281,160 | | |
| | | Hong Kong – 2.3% | |
| | 1,000,000 | | | Hong Kong Exchanges and Clearing
Hong Kong Equity & Derivatives Market
Operator | | | 9,587,316 | | |
| | 5,600,000 | | | Lifestyle International
Mid to High-end Department Store Operator
in Hong Kong & China | | | 5,709,473 | | |
| | 550,000 | | | Hong Kong Aircraft Engineering
Aircraft Maintenence, Repair & Overhaul
Operator | | | 4,542,277 | | |
| | 20,651,900 | | | NagaCorp
Monopoly Casino in Central Cambodia | | | 2,858,693 | | |
Number of
Shares | | | | Value | |
| | 8,507,800 | | | Global Digital Creations (b)
Digital Cinema Solution Provider/Network
Operator | | $ | 109,775 | | |
| | | | | | | | 22,807,534 | | |
| | | Taiwan – 1.5% | |
| | 614,000 | | | Formosa International Hotels
Hotel, Food & Beverage Operation &
Hospitality Management Services | | | 6,172,428 | | |
| | 2,292,000 | | | President Chain Store
Taiwan's Number One Convenience Chain
Store Operator | | | 5,503,901 | | |
| | 1,971,834 | | | Everlight Electronics
LED Packager | | | 2,632,504 | | |
| | 837,112 | | | Wah Lee Industrial
Distributor of Chemicals, Materials &
Equipment | | | 534,102 | | |
| | | | | | | | 14,842,935 | | |
| | | India – 1.4% | |
| | 300,000 | | | Housing Development Finance
Indian Mortgage Lender | | | 9,357,374 | | |
| | 230,000 | | | Asian Paints
India's Largest Paint Company | | | 4,280,766 | | |
| | | | | | | | 13,638,140 | | |
| | | Indonesia – 0.6% | |
| | 29,757,900 | | | Perusahaan Gas Negara
Gas Pipeline Operator | | | 5,380,747 | | |
| | | | | Total Asia | | | 373,422,910 | | |
| | | Other Countries – 10.9% | |
| | | United States – 3.2% | |
| | 145,000 | | | Cephalon (b)
Specialty Pharmaceuticals for Pain,
Central Nervous System & Oncology | | | 11,170,800 | | |
| | 378,000 | | | Atwood Oceanics (b)
Offshore Drilling Contractor | | | 5,775,840 | | |
| | 250,000 | | | BioMarin (b)
Biotech Focused on Orphan Diseases | | | 4,450,000 | | |
See accompanying notes to financial statements.
10
Wanger International 2008 Annual Report
Wanger International
Statement of Investments December 31, 2008
Number of
Shares | | | | Value | |
| | | United States – 3.2% (cont) | |
| | 116,000 | | | Alexion Pharmaceuticals (b)
Biotech Focused on Orphan Diseases | | $ | 4,198,040 | | |
| | 135,000 | | | FMC Technologies (b)
Oil & Gas Wellhead Manufacturer | | | 3,217,050 | | |
| | 41,900 | | | Oceaneering International (b)
Provider of Sub-sea Services &
Manufactured Products | | | 1,220,966 | | |
| | 35,000 | | | Bristow (b)
Largest Provider of Helicopter Services to
Offshore Oil & Gas Producers | | | 937,650 | | |
| | 100,000 | | | Tesco (b)
Developing New Well Drilling Technologies | | | 714,000 | | |
| | | | | | | | 31,684,346 | | |
| | | Australia – 2.4% | |
| | 1,983,333 | | | Sino Gold (b)
Gold Mining in The People's Republic of
China | | | 6,949,801 | | |
| | 238,000 | | | Perpetual Trustees
Mutual Fund Management | | | 6,205,866 | | |
| | 959,000 | | | Billabong International
Action Sports Apparel Brand Manager | | | 5,362,987 | | |
| | 216,000 | | | Australian Stock Exchange
Australian Equity & Derivatives Market
Operator | | | 5,043,794 | | |
| | | | | | | | 23,562,448 | | |
| | | South Africa – 2.4% | |
| | 518,000 | | | Naspers
Media & Education in Africa & Other
Emerging Markets | | | 9,415,712 | | |
| | 484,000 | | | Impala Platinum Holdings
Platinum Group Metals Mining & Refining | | | 7,141,305 | | |
| | 1,530,000 | | | Mr. Price
South African Retailer of Apparel,
Household Goods & Sporting Goods | | | 4,111,379 | | |
| | 1,575,000 | | | Uranium One (b)
Uranium Mines in South Africa,
Kazakhstan, Australia & the U.S. | | | 2,283,718 | | |
| | | | | | | | 22,952,114 | | |
Number of
Shares | | | | Value | |
| | | Canada – 1.5% | |
| | 580,000 | | | ShawCor
Oil & Gas Pipeline Products | | $ | 8,649,494 | | |
| | 227,000 | | | CCL
Leading Global Label Manufacturer | | | 4,597,003 | | |
| | 250,000 | | | Ivanhoe Mines (b)
Copper Mine Project in Mongolia | | | 662,211 | | |
| | 725,700 | | | Horizon North Logistics (b)
Provides Diversified Oil Service Offering in
Northern Canada | | | 511,429 | | |
| | 477,700 | | | UTS Energy (b)
Operator of Canadian Oil Sands Mines | | | 309,567 | | |
| | 91,100 | | | Xtreme Coil Drilling (b)
Land Driller with New Generation Drilling
Technology | | | 113,644 | | |
| | | | | | | | 14,843,348 | | |
| | | Israel – 0.7% | |
| | 960,000 | | | Israel Chemicals
Producer of Potash, Phosphates,
Bromine & Specialty Chemicals | | | 6,711,810 | | |
| | | New Zealand – 0.5% | |
| | 2,797,560 | | | Sky City Entertainment
Casino/Entertainment Complex | | | 5,123,765 | | |
| | | Kazakhstan – 0.2% | |
| | 490,000 | | | Halyk Savings Bank of
Kazakhstan – GDR
Largest Retail Bank in Kazakhstan | | | 1,556,886 | | |
| | | | | Total Other Countries | | | 106,434,717 | | |
| | | Latin America – 4.7% | |
| | | Brazil – 2.3% | |
| | 1,445,000 | | | Suzano (b)
Brazilian Pulp & Paper Producer | | | 7,592,392 | | |
| | 900,000 | | | Porto Seguro
Auto & Life Insurance | | | 5,085,973 | | |
| | 1,543,600 | | | Localiza Rent A Car
Car Rental | | | 4,773,053 | | |
| | 500,000 | | | Natura Cosmeticos
Direct Retailer of Cosmetics | | | 4,116,534 | | |
| | | | | | | | 21,567,952 | | |
See accompanying notes to financial statements.
11
Wanger International 2008 Annual Report
Wanger International
Statement of Investments December 31, 2008
Number of Shares
or Principal Amount | | | | Value | |
| | | Mexico – 1.4% | |
| | 230,000 | | | Grupo Aeroportuario del Surest – ADR
Cancun & Cozumel Airport Operator | | $ | 8,597,400 | | |
| | 3,500,000 | | | Urbi Desarrollos Urbanos (b)
Affordable Housing Builder | | | 4,776,690 | | |
| | 780,121 | | | Financiera Independencia
Mexican Micro-finance Lender | | | 394,328 | | |
| | | | | | | | 13,768,418 | | |
| | | Chile – 1.0% | |
| | 404,000 | | | Sociedad Quimica y Minera de
Chile – ADR
Producer of Specialty Fertilizers, Lithium &
Iodine | | | 9,853,560 | | |
| | | | | Total Latin America | | | 45,189,930 | | |
| Total Common Stocks (Cost: $1,051,125,092) – 93.1% | | | 905,525,273 | | |
| Short-Term Obligations – 6.3% | | | |
| | | Repurchase Agreement 5.8% | |
| $ | 56,662,000 | | | Repurchase Agreement with Fixed
Income Clearing Corp., dated 12/31/08,
due 1/02/09 at 0.010%, collateralized
by a U.S. Government Agency
Obligation, maturing 11/17/15,
market value $57,797,644 (repurchase
proceeds $56,662,031) | | | 56,662,000 | | |
| | | Commercial Paper – 0.5% | |
| | 4,600,000 | | | Toyota Motor Credit
0.55% due 1/23/09 | | | 4,598,454 | | |
| Total Short-Term Obligations (Cost: $61,260,454) | | | 61,260,454 | | |
| Total Investments (Cost: $1,112,385,546) – 99.4% (c)(d) | | | 966,785,727 | | |
| Cash and Other Assets Less Liabilities – 0.6% | | | 6,073,870 | | |
| Total Net Assets – 100.0% | | $ | 972,859,597 | | |
Notes to Statement of Investments:
(a) An affiliated person of the Fund may include any company in which the Fund owns five percent or more of its outstanding voting shares. Transactions in this affiliated company during the twelve months ended December 31, 2008 are as follows:
Balance of
Affiliate | | Shares Held
at 12/31/07 | | Purchases/
Additions | | Balance of
Sales/
Reductions | | Shares Held
at 12/31/08 | | Value | | Dividend | |
Charles
Taylor | | 2,300,000 | | | 190,000 | | | | — | | | | 2,490,000 | | | $ | 9,084,468 | | | $ | 591,791 | | |
The aggregate cost and value of this company at December 31, 2008, were $13,062,350 and $9,084,468, respectively. Investments in the affiliated company represented 0.9% of total net assets at December 31, 2008.
(b) Non-income producing security.
(c) At December 31, 2008, for federal income tax purposes cost of investments was $1,116,701,434 and net unrealized depreciation was $149,915,707 consisting of gross unrealized appreciation of $152,786,304 and gross unrealized depreciation of $302,702,011.
(d) On December 31, 2008, the Fund's total investments were denominated in currencies as follows:
| Currency | | Value | | Percentage
of Net Assets | |
| Euro | | $ | 224,909,262 | | | | 23.1 | | |
| Japanese Yen | | | 212,464,404 | | | | 21.8 | | |
| U.S. Dollar | | | 134,189,545 | | | | 13.8 | | |
| British Pound | | | 74,708,631 | | | | 7.7 | | |
| Hong Kong Dollar | | | 61,794,616 | | | | 6.4 | | |
Other currencies less than
5% of total net assets | | | 258,719,269 | | | | 26.6 | | |
Cash and other assets
less liabilities | | | 6,073,870 | | | | 0.6 | | |
| | | $ | 972,859,597 | | | | 100.0 | | |
At December 31, 2008, the Fund had entered into the following forward foreign currency exchange contracts:
Forward
Foreign
Currency
Contracts
to Buy | | Principal
Amount in
Foreign
Currency | | Principal
Amount in
U.S. Dollar | | Settlement
Date | | Unrealized
Appreciation | |
| AUD | | | 4,662,005 | | | $ | 3,000,000 | | | 1/09/09 | | $ | 248,889 | | |
| AUD | | | 4,666,356 | | | | 3,000,000 | | | 2/10/09 | | | 240,620 | | |
| AUD | | | 4,606,526 | | | | 3,000,000 | | | 3/10/09 | | | 191,303 | | |
| CAD | | | 3,721,800 | | | | 3,000,000 | | | 1/09/09 | | | 14,471 | | |
| CAD | | | 3,717,600 | | | | 3,000,000 | | | 2/10/09 | | | 10,244 | | |
| CAD | | | 3,785,280 | | | | 3,000,000 | | | 3/10/09 | | | 66,464 | | |
| JPY | | | 288,030,000 | | | | 3,000,000 | | | 1/09/09 | | | 177,579 | | |
| JPY | | | 287,475,000 | | | | 3,000,000 | | | 2/10/09 | | | 173,527 | | |
| JPY | | | 275,160,000 | | | | 3,000,000 | | | 3/10/09 | | | 39,389 | | |
| | | | | | | $ | 27,000,000 | | | | | $ | 1,162,486 | | |
Forward
Foreign
Currency
Contracts
to Sell | | Principal
Amount in
Foreign
Currency | | Principal
Amount in
U.S. Dollar | | Settlement
Date | | Unrealized
Depreciation | |
| EUR | | | 7,013,442 | | | $ | 9,000,000 | | | 1/09/09 | | $ | (747,272 | ) | |
| EUR | | | 7,013,169 | | | | 9,000,000 | | | 2/10/09 | | | (733,629 | ) | |
| EUR | | | 6,981,615 | | | | 9,000,000 | | | 3/10/09 | | | (682,263 | ) | |
| | | | | | | $ | 27,000,000 | | | | | $ | (2,163,164 | ) | |
The counterparty for all forward foreign currency contracts is State Street Bank and Trust Company.
ADR = American Depositary Receipts
AUD = Australian Dollar
CAD = Canadian Dollar
EUR = Euro
GDR = Global Depositary Receipts
JPY = Japanese Yen
See accompanying notes to financial statements.
12
Wanger International 2008 Annual Report
Wanger International
Portfolio Diversification December 31, 2008
At December 31, 2008, the Fund's portfolio investments as a percentage of net assets was diversified as follows:
| | | Value | | Percentage
of Net Assets | |
| Industrial Goods & Services | |
| Other Industrial Services | | $ | 76,810,524 | | | | 7.8 | | |
| Industrial Materials & Specialty Chemicals | | | 70,728,734 | | | | 7.3 | | |
| Machinery | | | 61,003,692 | | | | 6.3 | | |
| Outsourcing Services | | | 32,904,389 | | | | 3.4 | | |
| Conglomerates | | | 18,348,304 | | | | 1.9 | | |
| Construction | | | 17,827,332 | | | | 1.8 | | |
| Electrical Components | | | 15,107,506 | | | | 1.6 | | |
| Industrial Distribution | | | 3,177,760 | | | | 0.3 | | |
| Steel | | | 2,397,000 | | | | 0.2 | | |
| Waste Management | | | 1,823,597 | | | | 0.2 | | |
| | | | 300,128,838 | | | | 30.8 | | |
| Consumer Goods & Services | |
| Other Consumer Services | | | 31,815,715 | | | | 3.3 | | |
| Retail | | | 31,378,723 | | | | 3.2 | | |
| Food & Beverage | | | 24,235,186 | | | | 2.5 | | |
| Nondurables | | | 20,844,597 | | | | 2.1 | | |
| Casinos & Gaming | | | 18,555,619 | | | | 1.9 | | |
| Apparel | | | 16,011,622 | | | | 1.7 | | |
| Other Entertainment | | | 15,486,186 | | | | 1.6 | | |
| Consumer Goods Distribution | | | 9,078,508 | | | | 0.9 | | |
| Travel | | | 4,773,053 | | | | 0.5 | | |
| Furniture & Textiles | | | 3,241,769 | | | | 0.3 | | |
| Consumer Electronics | | | 1,856,464 | | | | 0.2 | | |
| Other Durable Goods | | | 874,275 | | | | 0.1 | | |
| Leisure Products | | | 109,775 | | | | 0.0 | * | |
| | | | 178,261,492 | | | | 18.3 | | |
| Information | |
| CATV | | | 18,237,960 | | | | 1.9 | | |
| Financial Processors | | | 17,792,349 | | | | 1.8 | | |
| Instrumentation | | | 15,344,254 | | | | 1.6 | | |
| Computer Hardware & Related Equipment | | | 11,414,011 | | | | 1.2 | | |
| TV Broadcasting | | | 9,415,712 | | | | 1.0 | | |
| Satellite Broadcasting & Services | | | 9,259,525 | | | | 1.0 | | |
| Internet Related | | | 7,188,945 | | | | 0.7 | | |
| Business Software | | | 5,989,106 | | | | 0.6 | | |
| Publishing | | | 5,261,098 | | | | 0.5 | | |
| Business Information & Marketing Services | | | 4,918,842 | | | | 0.5 | | |
| Semiconductors & Related Equipment | | | 2,632,504 | | | | 0.3 | | |
| Advertising | | | 2,471,861 | | | | 0.2 | | |
| Electronics Distribution | | | 534,102 | | | | 0.1 | | |
| Computer Services | | | 232,099 | | | | 0.0 | * | |
| | | | 110,692,368 | | | | 11.4 | | |
| | | Value | | Percentage
of Net Assets | |
| Other Industries | |
| Transportation | | $ | 51,507,004 | | | | 5.3 | | |
| Real Estate | | | 33,149,782 | | | | 3.4 | | |
| Regulated Utilities | | | 6,738,111 | | | | 0.7 | | |
| | | | 91,394,897 | | | | 9.4 | | |
| Finance | |
| Banks | | | 24,386,419 | | | | 2.5 | | |
| Insurance | | | 16,812,107 | | | | 1.7 | | |
| Brokerage & Money Management | | | 14,782,664 | | | | 1.5 | | |
| Finance Companies | | | 14,330,243 | | | | 1.5 | | |
| Savings & Loans | | | 9,357,374 | | | | 1.0 | | |
| | | | 79,668,807 | | | | 8.2 | | |
| Energy & Minerals | |
| Oil Services | | | 27,703,040 | | | | 2.8 | | |
| Mining | | | 22,966,236 | | | | 2.4 | | |
| Oil Refining, Marketing & Distribution | | | 14,564,774 | | | | 1.5 | | |
| Agricultural Commodities | | | 7,592,392 | | | | 0.8 | | |
| Oil & Gas Producers | | | 2,510,526 | | | | 0.3 | | |
| | | | 75,336,968 | | | | 7.8 | | |
| Health Care | |
| Medical Equipment & Devices | | | 23,238,129 | | | | 2.4 | | |
| Pharmaceuticals | | | 20,644,125 | | | | 2.1 | | |
| Health Care Services | | | 14,107,816 | | | | 1.4 | | |
| Medical Supplies | | | 7,601,833 | | | | 0.8 | | |
| Biotechnology & Drug Delivery | | | 4,450,000 | | | | 0.5 | | |
| | | | 70,041,903 | | | | 7.2 | | |
| Total Common Stocks | | | 905,525,273 | | | | 93.1 | | |
| Short-Term Obligations | | | 61,260,454 | | | | 6.3 | | |
| Total Investments | | | 966,785,727 | | | | 99.4 | | |
Cash and Other Assets
Less Liabilities | | | 6,073,870 | | | | 0.6 | | |
| Net Assets | | $ | 972,859,597 | | | | 100.0 | | |
* Represents less than 0.1% of Net Assets.
See accompanying notes to financial statements.
13
Wanger International 2008 Annual Report
Statement of Assets and Liabilities
December 31, 2008
| Assets: | |
| Unaffiliated investments, at cost | | $ | 1,099,323,196 | | |
| Affiliated investments, at cost (See Note 4) | | | 13,062,350 | | |
| Unaffiliated investments, at value | | $ | 957,701,259 | | |
| Affiliated investments, at value (See Note 4) | | | 9,084,468 | | |
| Cash | | | 513 | | |
| Foreign currency (cost of $5,249,359) | | | 5,203,259 | | |
Unrealized appreciation on forward
foreign currency exchange contracts | | | 1,162,486 | | |
| Receivable for: | |
| Investments sold | | | 3,845,714 | | |
| Fund shares sold | | | 567,750 | | |
| Interest | | | 16 | | |
| Dividends | | | 801,530 | | |
| Foreign tax reclaims | | | 432,218 | | |
| Trustees' deferred compensation plan | | | 60,783 | | |
| Other assets | | | 7,289 | | |
| Total Assets | | | 978,867,285 | | |
| Liabilities: | |
| Payable for: | |
| Investments purchased | | | 2,468,072 | | |
| Fund shares repurchased | | | 328,566 | | |
| Investment advisory fee | | | 690,382 | | |
| Administration fee | | | 38,943 | | |
| Transfer agent fee | | | 39 | | |
| Trustees' fees | | | 23 | | |
| Custody fee | | | 75,001 | | |
| Reports to shareholders | | | 142,699 | | |
| Chief compliance officer expenses | | | 2,651 | | |
Unrealized depreciation on forward
foreign currency exchange contracts | | | 2,163,164 | | |
| Trustees' deferred compensation plan | | | 60,783 | | |
| Other liabilities | | | 37,365 | | |
| Total Liabilities | | | 6,007,688 | | |
| Net Assets | | $ | 972,859,597 | | |
| Composition of Net Assets: | |
| Paid-in capital | | $ | 1,192,724,765 | | |
| Unistributed net investment income | | | 21,403,852 | | |
| Accumulated net realized loss | | | (94,657,959 | ) | |
| Net unrealized appreciation (depreciation) on: | |
| Investments | | | (145,599,819 | ) | |
| Foreign currency translations | | | (1,011,242 | ) | |
| Net Assets | | $ | 972,859,597 | | |
| Fund Shares Outstanding | | | 47,017,075 | | |
Net asset value, offering price and
redemption price per share | | $ | 20.69 | | |
Statement of Operations
For the Year Ended December 31, 2008
| Investment Income: | |
| Dividends (net of foreign taxes withheld of $2,875,154) | | $ | 34,436,453 | | |
| Dividends from affiliates | | | 591,791 | | |
| Interest income | | | 1,367,590 | | |
| Securities lending income | | | 1,366 | | |
| Total Investment Income | | | 36,397,200 | | |
| Expenses: | |
| Investment advisory fee | | | 11,319,138 | | |
| Administration fee | | | 677,584 | | |
| Transfer agent fee | | | 436 | | |
| Trustees' fees | | | 79,179 | | |
| Custody fee | | | 1,022,733 | | |
| Chief compliance officer expenses (See Note 4) | | | 41,338 | | |
| Other expenses (See Note 5) | | | 618,684 | | |
| Total Expenses | | | 13,759,092 | | |
| Custody earnings credit | | | (254 | ) | |
| Net Expenses | | | 13,758,838 | | |
| Net Investment Income | | | 22,638,362 | | |
Net Realized and Unrealized Gain (Loss) on
Investments and Foreign Currency | |
| Net realized loss on: | |
| Investments | | | (93,784,078 | ) | |
| Foreign currency transactions | | | (1,119,603 | ) | |
| Net realized loss | | | (94,903,681 | ) | |
Net change in unrealized appreciation
(depreciation) on: | |
| Unaffiliated investments | | | (683,923,973 | ) | |
| Affiliated investments (See Note 4) | | | (6,797,085 | ) | |
| Foreign currency translations | | | (1,036,204 | ) | |
Net change in unrealized appreciation
(depreciation) | | | (691,757,262 | ) | |
| Net Loss | | | (786,660,943 | ) | |
| Net Decrease in Net Assets from Operations | | $ | (764,022,581 | ) | |
See accompanying notes to financial statements.
14
Wanger International 2008 Annual Report
Statement of Changes in Net Assets
| | | Year Ended December 31, | |
| Increase (Decrease) in Net Assets | | 2008 | | 2007 | |
| Operations: | |
| Net investment income | | $ | 22,638,362 | | | $ | 14,347,527 | | |
| Net realized gain (loss) on investments and foreign currency transactions | | | (94,903,681 | ) | | | 201,504,078 | | |
Net change in unrealized appreciation (depreciation)
on investments and foreign currency translations | | | (691,757,262 | ) | | | 28,586,493 | | |
| Net Increase (Decrease) in Net Assets from Operations | | | (764,022,581 | ) | | | 244,438,098 | | |
| Distributions to Shareholders: | |
| From net investment income | | | (12,975,444 | ) | | | (13,868,748 | ) | |
| From net realized gains | | | (196,263,094 | ) | | | (124,882,759 | ) | |
| Total Distributions to Shareholders | | | (209,238,538 | ) | | | (138,751,507 | ) | |
| Share Transactions: | |
| Subscriptions | | | 220,199,859 | | | | 135,196,260 | | |
| Distributions reinvested | | | 209,238,538 | | | | 138,751,507 | | |
| Redemptions | | | (176,692,026 | ) | | | (166,382,832 | ) | |
| Net Increase from Share Transactions | | | 252,746,371 | | | | 107,564,935 | | |
| Total Increase (Decrease) in Net Assets | | | (720,514,748 | ) | | | 213,251,526 | | |
| Net Assets: | |
| Beginning of period | | | 1,693,374,345 | | | | 1,480,122,819 | | |
| End of period | | $ | 972,859,597 | | | $ | 1,693,374,345 | | |
| Undistributed net investment income at end of period | | $ | 21,403,852 | | | $ | 12,198,734 | | |
See accompanying notes to financial statements.
15
Wanger International 2008 Annual Report
Financial Highlights
| | | Year Ended December 31, | |
| Selected data for a share outstanding throughout each period | | 2008 | | 2007 | | 2006 | | 2005 | | 2004 | |
| Net Asset Value, Beginning of Period | | $ | 44.04 | | | $ | 41.77 | | | $ | 30.63 | | | $ | 25.46 | | | $ | 19.68 | | |
| Income from Investment Operations: | |
| Net investment income (a) | | | 0.52 | | | | 0.37 | | | | 0.29 | | | | 0.25 | | | | 0.13 | | |
Net realized and unrealized gain (loss) on investments
and foreign currency | | | (18.37 | ) | | | 5.80 | | | | 11.04 | | | | 5.20 | | | | 5.80 | | |
| Total from Investment Operations | | | (17.85 | ) | | | 6.17 | | | | 11.33 | | | | 5.45 | | | | 5.93 | | |
| Less Distributions to Shareholders: | |
| From net investment income | | | (0.34 | ) | | | (0.39 | ) | | | (0.19 | ) | | | (0.28 | ) | | | (0.15 | ) | |
| From net realized gains | | | (5.16 | ) | | | (3.51 | ) | | | — | | | | — | | | | — | | |
| Total Distributions to Shareholders | | | (5.50 | ) | | | (3.90 | ) | | | (0.19 | ) | | | (0.28 | ) | | | (0.15 | ) | |
| Net Asset Value, End of Period | | $ | 20.69 | | | $ | 44.04 | | | $ | 41.77 | | | $ | 30.63 | | | $ | 25.46 | | |
| Total Return (b) | | | (45.60 | )% | | | 16.31 | % | | | 37.16 | % | | | 21.53 | %(c) | | | 30.27 | % | |
| Ratios to Average Net Assets/Supplemental Data: | |
| Net expenses before interest expense (d) | | | 1.02 | % | | | 0.99 | % | | | 1.01 | % | | | 1.13 | % | | | 1.36 | % | |
| Interest expense | | | — | | | | — | | | | 0.00 | %(e) | | | — | | | | — | | |
| Net expenses (d) | | | 1.02 | % | | | 0.99 | % | | | 1.01 | % | | | 1.13 | % | | | 1.36 | % | |
| Net investment income (d) | | | 1.67 | % | | | 0.87 | % | | | 0.81 | % | | | 0.92 | % | | | 0.59 | % | |
| Waiver | | | — | | | | — | | | | — | | | | 0.02 | % | | | — | | |
| Portfolio turnover rate | | | 36 | % | | | 35 | % | | | 41 | % | | | 24 | % | | | 47 | % | |
| Net assets, end of period (000's) | | $ | 972,860 | | | $ | 1,693,374 | | | $ | 1,480,123 | | | $ | 973,257 | | | $ | 606,773 | | |
(a) Net investment income per share was based upon the average shares outstanding during the period.
(b) Total return at net asset value assuming all distributions are reinvested.
(c) Had the investment advisor not waived a portion of expenses, total return would have been reduced.
(d) The benefits derived from custody fees paid indirectly had an impact of less than 0.01%.
(e) Rounds to less than 0.01%.
See accompanying notes to financial statements.
16
Wanger International 2008 Annual Report
Notes to Financial Statements
1. Nature of Operations
Wanger International (the "Fund"), is a series of Wanger Advisors Trust (the "Trust"), an open-end management investment company organized as a Massachusetts business trust. The investment objective of the Fund is to seek long-term capital appreciation. The Fund is available only for allocation to certain life insurance company separate accounts established for the purpose of funding qualified and non-qualified variable annuity contracts and variable life insurance policies and may also be offered directly to certain types of pension plans and retirement arrangements.
Effective June 1, 2008, Wanger International Small Cap was renamed Wanger International.
2. Significant Accounting Policies
Security valuation
Securities of the Fund are valued at market value or, if a market quotation for a security is not readily available or is deemed not to be reliable because of events or circumstances that have occurred between the market quotation and the time as of which the security is to be valued, the security is valued at its fair value determined in good faith under consistently applied procedures established by the Board of Trustees. A security traded on a securities exchange or in an over-the-counter market in which transaction prices are reported is valued at the last sales price at the time of valuation. A security traded principally on NASDAQ is valued at the NASDAQ official closing price. A security for which there is no reported sale on the valuation date is valued at the latest bid quotation. Short-term investments maturing in 60 days or less are valued at amortized cost, which approximates market value. A security for which a mark et quotation is not readily available and any other assets are valued at its fair value determined in good faith under consistently applied procedures established by the Board of Trustees. The Trust has retained an independent statistical fair value pricing service to assist in the fair valuation process for securities principally traded in a foreign market in order to adjust for possible changes in value that may occur between the close of the foreign market and the time as of which the securities are to be valued. If a security is valued at fair value, that value may be different from the last quoted market price for the security.
On January 1, 2008, the Fund adopted Statement of Financial Accounting Standards No. 157, Fair Value Measurements ("SFAS 157"). Under SFAS 157, various inputs are used in determining the value of the Fund's investments. These inputs are summarized in the three broad levels listed below:
• Level 1—quoted prices in active markets for identical securities
• Level 2—other significant observable inputs (including quoted prices for similar securities, interest rates, prepayment speeds, credit risk and others)
• Level 3—significant unobservable inputs (including management's own assumptions in determining the value of investments)
The inputs or methodologies used for valuing securities are not necessarily an indication of the risk associated with investing in those securities.
Examples of the types of securities in which the Fund would typically invest and how they are classified within this SFAS 157 hierarchy are as follows. Typical level 1 securities include exchange traded domestic equities, mutual funds whose NAVs are published each day and exchange traded foreign equities that are not statistically fair valued. Typical level 2 securities include exchange traded foreign equities that are statistically fair valued and short-term investments valued at amortized cost. Typical level 3 securities include any security fair valued by the Fund's Valuation Committee that relies on significant unobservable inputs.
The following table summarizes the inputs used, as of December 31, 2008, in valuing the Fund's assets:
| Valuation Inputs | | Investments in
Securities | | Other Financial
Instruments* | |
| Level 1—Quoted Prices | | $ | 93,438,191 | | | $ | — | | |
| Level 2—Other Significant Observable Inputs | | | 873,237,761 | | | | (1,000,678 | ) | |
| Level 3—Significant Unobservable Inputs | | | 109,775 | | | | — | | |
| Total | | $ | 966,785,727 | | | $ | (1,000,678 | ) | |
* Other financial instruments consist of forward foreign currency exchange contracts, which are not included in the investment portfolio.
The following table reconciles assets balances for the year ended December 31, 2008, in which significant unobservable inputs (Level 3) were used in determining value:
| | | Investments in
Securities | | Other Financial
Instruments | |
| Balance as of December 31, 2007 | | $ | 0 | | | $ | — | | |
| Accretion of Discounts/Amortization of Premiums | | | — | | | | — | | |
| Realized Gain/(Loss) | | | — | | | | — | | |
| Change in Unrealized Appreciation | | | 1,630 | | | | — | | |
| Net Purchases (Sales) | | | — | | | | — | | |
| Transfers In or Out of Level 3 | | | 108,145 | | | | — | | |
| Balance as of December 31, 2008 | | $ | 109,775 | | | $ | — | | |
Repurchase agreements
The Fund may engage in repurchase agreement transactions. The Fund, through its custodians, receives delivery of underlying securities collateralizing each repurchase agreement. The counterparty is required to maintain collateral that is at all times at least equal to the repurchase price including interest. In the event of default or bankruptcy by the other party to the agreement, realization and/or retention of the collateral may be subject to legal proceedings.
Foreign currency translations
Values of investments denominated in foreign currencies are converted into U.S. dollars using the spot market rate of exchange at the time of valuation. Purchases and sales of investments and dividend and interest income are translated into U.S. dollars using the spot market rate of exchange prevailing on the respective dates of such transactions. The gain or loss resulting from changes in foreign exchange rates is included with net realized and unrealized gain or loss from investments, as appropriate.
Forward foreign currency exchange contracts
A forward foreign currency exchange contract is a commitment to purchase or sell a foreign currency at a future date at a negotiated forward rate. Forward foreign currency exchange contracts are valued at the interpolated forward exchange rate of the underlying currencies and any market gain or loss, arising from the difference between the original value and the current value of such contract, is included as a component of unrealized gain/(loss) on the Statement of Operations. Open forward foreign currency, if any, contracts are disclosed in the Notes to the Statement of Investments. As forward foreign currency exchange contracts are closed the resulting gain or loss, arising from the difference between the original value of the contract and the closing value of such contract, is included as a component of realized gain/loss on the Statement of Operations.
A forward foreign currency exchange contract would limit the risk of loss due to a decline in the value of a particular currency; however it also would limit any potential gain that might result should the value of the currency increase instead of decrease. These contracts may involve market risk in excess of the unrealized gain or loss reflected on the Statement of Assets and
17
Wanger International 2008 Annual Report
Notes to Financial Statements, continued
Liabilities. In addition, a Fund could be exposed to risks if counterparties to the contracts are unable to meet the terms of their contracts. The counterparty risk exposure is, therefore, closely monitored and contracts are only executed with high credit quality financial institutions.
In March 2008, Statement of Financial Accounting Standards No. 161, Disclosures about Derivative Instruments and Hedging Activities—an amendment of FASB Statement No. 133 ("SFAS 161"), was issued. SFAS 161 is effective for fiscal years beginning after November 15, 2008. SFAS 161 requires additional discussion about the reporting entity's derivative instruments and hedging activities, by providing for qualitative disclosures about the objectives and strategies for using derivatives, quantitative data about the fair value of and gains and losses on derivative contracts, and details of credit-risk-related contingent features in their hedged positions. Management is evaluating the impact the application of SFAS 161 will have on the Fund's financial statement disclosures.
Securities lending
The Fund may lend up to one-third of the value of its total assets to certain approved brokers, dealers and other financial institutions to earn additional income. The Fund retained the benefits of owning the securities, including receipt of dividends or interest generated by the security. The Fund also received a fee for the loan. The Fund had the ability to recall the loans at any time and could do so in order to vote proxies or to sell the loaned securities. Each loan was collateralized by cash that exceeded the value of the securities on loan. The market value of the loaned securities was determined at the close of business of the Fund and any additional required collateral is delivered to each Fund on the next business day. The collateral was invested in the Dreyfus Government Cash Management Fund and the income earned was paid to the Fund, net of any fees remitted to Goldman Sachs Agency Lending as the lending agent and bo rrower rebates. Generally, in the event of borrower default, the Fund had the right to use the collateral to offset any losses incurred. In the event the Fund was delayed or prevented from exercising its right to dispose of the collateral, there may be a potential loss to the Fund. Some of these losses may be indemnified by the lending agent. The Fund bore the risk of loss with respect to the investment of collateral.
The Fund began lending securities in the third quarter of 2008. Due to the turmoil in the financial markets, the Fund suspended securities lending activities on September 17, 2008. No new loans were made after that date and notice was given to the Fund's lending agent to recall the securities on loan. Resumption of securities lending may be reconsidered as market conditions improve. The net lending income earned in 2008 by the Fund is included in the Statement of Operations.
Security transactions and investment income
Security transactions are accounted for on the trade date (date the order to buy or sell is executed) and dividend income is recorded on the ex-dividend date, except that certain dividends from foreign securities are recorded as soon as the information is available to the Fund. Interest income is recorded on the accrual basis and includes amortization of discounts on debt obligations when required for federal income tax purposes. Realized gains and losses from security transactions are recorded on an identified cost basis.
Awards, if any, from class action litigation related to securities owned may be recorded as a reduction of cost of those securities. If the applicable securities are no longer owned, the proceeds are recorded as realized gains.
Restricted securities
Restricted securities are securities that may only be resold upon registration under federal securities laws or in transactions exempt from registration. In some cases, the issuer of restricted securities has agreed to register such securities for resale at the issuer's expense either upon demand by the Fund or in connection with another registered offering of the securities. Many restricted securities may be resold in the secondary market in transactions exempt from registration. Such restricted securities may be determined to be liquid under criteria established by the Board of Trustees. The Fund will not incur any registration costs upon such resale.
Use of estimates
The preparation of financial statements in conformity with accounting principles generally accepted in the United States of America ("GAAP") requires management to make estimates and assumptions that affect the amounts reported in the financial statements and accompanying notes. Actual results may differ from those estimates.
Fund share valuation
Fund shares are sold and redeemed on a continuing basis at net asset value. Net asset value per share is determined daily as of the close of trading on the New York Stock Exchange ("the Exchange") on each day the Exchange is open for trading by dividing the total value of the Fund's investments and other assets, less liabilities, by the number of Fund shares outstanding.
Custody fees/credits
Custody fees are reduced based on the Fund's cash balances maintained with the custodian. The amount is disclosed as a reduction of total expenses in the Statement of Operations.
Federal income taxes
The Fund has complied with the provisions of the Internal Revenue Code available to regulated investment companies and, in the manner provided therein, distributes all its taxable income, as well as any net realized gain on sales of investments and foreign currency transactions reportable for federal income tax purposes. Accordingly, the Fund paid no federal income taxes and no federal income tax provision was required.
Expenses
General expenses of the Trust are allocated to the Fund and the other series of the Trust based upon relative net assets or other expense allocation methodologies determined by the nature of the expense. Expenses directly attributable to the Fund are charged to the Fund.
Foreign capital gains taxes
Gains in certain countries may be subject to foreign taxes at the fund level, at rates ranging from 10%-15%. The Fund accrues for such foreign taxes on net realized and unrealized gains at the appropriate rate for each jurisdiction.
Distributions to shareholders
Distributions to shareholders are recorded on the ex-dividend date.
Indemnification
In the normal course of business, the Trust on behalf of the Fund enters into contracts that contain a variety of representations and warranties and that provide general indemnities. The Fund's maximum exposure under these arrangements is unknown, as this would involve future claims against the Fund. Also under the Trust's organizational documents, the trustees and officers of the Trust are indemnified against certain liabilities that may arise out of their duties to the Trust. However based on experience, the Fund expects the risk of loss due to these warranties and indemnities to be minimal.
18
Wanger International 2008 Annual Report
Notes to Financial Statements, continued
3. Federal Tax Information
The timing and character of income and capital gain distributions are determined in accordance with income tax regulations, which may differ from GAAP. Reclassifications are made to the Fund's capital accounts for permanent tax differences to reflect income and gains available for distribution (or available capital loss carryforwards) under income tax regulations.
For the year ended December 31, 2008, permanent book and tax basis differences resulting primarily from differing treatments for foreign currency transactions and passive foreign investment companies ("PFIC") adjustments were identified and reclassified among the components of the Fund's net assets as follows:
Undistributed
Net Investment
Income | | Accumulated
Net Realized
Loss | | Paid-In Capital | |
| $ | (457,800 | ) | | $ | 457,801 | | | $ | (1 | ) | |
Net investment income and net realized gains/(losses), as disclosed on the Statement of Operations, and net assets were not affected by this reclassification.
The tax character of distributions paid during the years ended December 31, 2008 and December 31, 2007 were as follows:
| | | December 31, 2008 | | December 31, 2007 | |
| Distributions paid from: | |
| Ordinary Income* | | $ | 35,894,096 | | | $ | 27,006,414 | | |
| Long-Term Capital Gains | | | 173,344,442 | | | | 111,745,093 | | |
* For tax purposes short-term capital gain distributions, if any, are considered ordinary income distributions.
As of December 31, 2008, the components of distributable earnings on a tax basis were as follows:
Undistributed
Ordinary
Income | | Undistributed
Long-Term
Capital Gains | | Net Unrealized
Depreciation* | |
| $ | 21,618,204 | | | $ | — | | | $ | (149,915,707 | ) | |
* The differences between book-basis and tax-basis net unrealized appreciation/(depreciation) are primarily due to deferral of losses from wash sales, foreign currency transactions and PFIC adjustments.
The following capital loss carryforwards, determined as of December 31, 2008, may be available to reduce taxable income arising from future net realized gains on investments, if any, to the extent permitted by the Internal Revenue Code:
Year of
Expiration | | Capital Loss
Carryforward | |
| | 2016 | | | $ | 28,082,656 | | |
Under current tax rules, certain currency and capital losses realized after October 31 may be deferred and treated as occurring on the first day of the following fiscal year. As of December 31, 2008, post-October capital losses of $63,472,582 attributed to security transactions were deferred to January 1, 2009.
Under Financial Accounting Standards Board ("FASB") Interpretation No. 48, Accounting for Uncertainty in Income Taxes—an Interpretation of FASB Statement No. 109 ("FIN 48") management determines whether a tax position of the Fund is more likely than not to be sustained upon examination by the applicable taxing authority, including resolution of any related appeals or litigation processes, based on the technical merits of the position. The tax benefit to be recognized is measured as the largest amount of benefit that is greater than fifty percent likely of being realized upon ultimate settlement. Management has evaluated the known implications of FIN 48 on its computation of net assets for the Fund. As a result of this evaluation, management believes that FIN 48 does not have any effect on the Fund's financial statements. However, management's conclusions regarding FIN 48 may be subject to review and adjustment at a later date based on factors including, but not limited to, further implementation guidance from the FASB, new tax laws, regulations, and administrative interpretations (including relevant court decisions). The Fund's federal tax returns for the prior three fiscal years remain subject to examination by the Internal Revenue Service. The Fund is not aware of any tax positions for which it is reasonably possible that the total amounts of unrecognized tax benefits will significantly change in the next twelve months.
4. Transactions With Affiliates
Columbia Wanger Asset Management, L.P. ("CWAM") is a wholly owned subsidiary of Columbia Management Group, LLC, ("Columbia Management") which in turn is an indirect wholly owned subsidiary of Bank of America Corporation ("BOA"). CWAM furnishes continuing investment supervision to the Fund and is responsible for the overall management of the Fund's business affairs.
Under the Fund's investment advisory agreement, management fees are accrued daily based on the Fund's average daily net assets and paid monthlyto CWAM at the annual rates shown in the table below:
| Average Daily Net Assets | | Annual Fee Rate | |
| Up to $100 million | | | 1.10 | % | |
| $100 million to $250 million | | | 0.95 | % | |
| $250 million to $500 million | | | 0.90 | % | |
| $500 million to $1 billion | | | 0.80 | % | |
| $1 billion and over | | | 0.72 | % | |
For the year ended December 31, 2008, the Fund's effective investment advisory fee rate was 0.84% of average daily net assets.
CWAM provides administrative services and receives an administration fee from the Fund. Effective August 1, 2008, CWAM provides administrative services and receives an administration fee from the Fund at the following annual rates:
Wanger Advisors Trust Aggregate
Average Daily Net Assets of the Trust: | | Annual Fee Rate | |
| Up to $4 billion | | | 0.05 | % | |
| $4 billion to $6 billion | | | 0.04 | % | |
| $6 billion to $8 billion | | | 0.03 | % | |
| $8 billion and over | | | 0.02 | % | |
Prior to August 1, 2008, administration fees were accrued daily and paid monthly to CWAM at the annual rate of 0.05%.
For the year ended December 31, 2008, the Fund's effective administration fee rate was 0.05% of average daily net assets.
CWAM has delegated to Columbia Management Advisors, LLC ("Columbia"), an indirect, wholly owned subsidiary of BOA, the responsibility for certain administrative services.
Certain officers and trustees of the Trust are also officers of CWAM. The Trust makes no direct payments to its officers and trustees who are affiliated with CWAM.
The Board of Trustees appointed a Chief Compliance Officer to the Trust in accordance with federal securities regulations. The Fund, along with other affiliated funds, pays its pro-rata share of the expenses associated with the Office of the Chief Compliance Officer. These expenses are disclosed separately as "Chief compliance officer expenses" in the Statement of Operations.
19
Wanger International 2008 Annual Report
Notes to Financial Statements, continued
The Trust offers a deferred compensation plan for its independent trustees. Under that plan, a trustee may elect to defer all or a portion of his or her compensation. Amounts deferred are retained by the Trust and represent an unfunded obligation of the Trust. The value of amounts deferred is determined by reference to the change in value of Class Z shares of one or more series of Columbia Acorn Trust or a money market fund as specified by the trustee. Benefits under the deferred compensation plan are payable when the trustee ceases to be a member of the Board of Trustees.
Columbia Management Distributors, Inc. (the "Distributor"), an affiliate of Columbia and an indirect, wholly owned subsidiary of BOA, serves as the principal underwriter of the Trust and receives no compensation from the Fund for its services.
Columbia Management Services, Inc. (the "Transfer Agent"), an affiliate of Columbia and an indirect, wholly owned subsidiary of BOA, provides shareholder services to the Fund and has subcontracted with Boston Financial Data Services ("BFDS") to serve as subtransfer agent. For such services, the Transfer Agent receives a fee, paid monthly, at the annual rate of $21.00 per open account. The Transfer Agent also receives reimbursement for certain out-of-pocket expenses.
An affiliated person of the Fund may include any company in which the Fund owns five percent or more of its outstanding voting shares. On December 31, 2008, the Fund held five percent or more of the outstanding voting securities of one or more companies. Details of investments in those affiliated companies are presented in the Notes to the Statement of Investments on page 12.
During the year ended December 31, 2008, the Fund engaged in purchase and sales transactions with funds that have a common investment advisor (or affiliated investment advisors), common directors/trustees, and/or common officers. Those purchase and sale transactions complied with provisions of Rule 17a-7 under the Investment Company Act of 1940 and were $2,877,573 and $480,001, respectively.
5. Borrowing Arrangements
The Trust participates in a $150 million credit facility, which was entered into to facilitate portfolio liquidity. Interest is charged to each participating fund based on its borrowings at a rate per annum equal to the Federal Funds rate plus 0.50%. In addition, a commitment fee of 0.08% per annum of the unutilized line of credit is accrued and apportioned among the participating funds based on their relative net assets. The commitment fee is included in "Other expenses" in the Statement of Operations. No amounts were borrowed by the Fund under this facility during the year ended December 31, 2008. The Trust enters into this line of credit for one year durations. The Trust has already secured the line of credit for the entire year of 2009.
6. Fund Share Transactions
Proceeds and payments on Fund shares as shown in the Statement of Changes in Net Assets are in respect of the following numbers of shares:
| | | Year Ended
December 31, 2008 | | Year Ended
December 31, 2007 | |
| Shares sold | | | 8,261,042 | | | | 3,172,392 | | |
Shares issued in reinvestment
of dividend distributions | | | 6,005,699 | | | | 3,669,704 | | |
| Less shares redeemed | | | (5,704,494 | ) | | | (3,823,176 | ) | |
| Net increase in shares outstanding | | | 8,562,247 | | | | 3,018,920 | | |
7. Investment Transactions
The aggregate cost of purchases and proceeds from sales other than short-term obligations for the year ended December 31, 2008 were $530,112,776 and $471,209,030, respectively.
8. Legal Proceedings
CWAM, Columbia Acorn Trust (another mutual fund family advised by CWAM), and the trustees of Colombia Acorn Trust (collectively, the "Columbia defendants") are named as defendants in class and derivative complaints that have been consolidated in a Multi-District Action (the "MDL Action") in the federal district court of Maryland. These lawsuits contend that defendants permitted certain investors to market time their trades in certain Columbia Acorn Funds. The MDL Action is ongoing. However, all claims against the Trust and the independent trustees of Columbia Acorn Trust have been dismissed.
Columbia Acorn Trust and CWAM are also defendants in a class action lawsuit that alleges, in summary, that Columbia Acorn Trust and CWAM exposed shareholders of Columbia Acorn International Fund to trading by market timers by allegedly: (a) failing to properly evaluate daily whether a significant event affecting the value of the fund's securities had occurred after foreign markets had closed but before the calculation of the funds' net asset value ("NAV"); (b) failing to implement the fund's portfolio valuation and share pricing policies and procedures; and (c) failing to know and implement applicable rules and regulations concerning the calculation of NAV (the "Fair Valuation Lawsuit"). The Seventh Circuit ruled that the plaintiffs' state law claims were preempted under federal law resulting in the dismissal of plaintiffs' complaint. Plaintiffs appealed the Seventh Circuit's ruling to the United States Supreme Court. The Suprem e Court reversed the Seventh Circuit's ruling on jurisdictional grounds and the case was ultimately remanded to the state court.
On March 21, 2005, a class action complaint was filed against the Trust and CWAM seeking to rescind the CDSC assessed upon redemption of Class B shares of the Columbia Acorn Funds due to the alleged market timing of the Columbia Acorn Funds (the "CDSC Lawsuit"). In addition to the rescission of sales charges, plaintiffs seek recovery of actual damages, attorneys' fees and costs. The case has been transferred to the MDL Action in the federal district court of Maryland.
On September 14, 2007, the plaintiffs and the Columbia defendants named in the MDL Action, including the Columbia Funds, entered into a stipulation of settlement with respect to all Columbia-related claims in the MDL Action described above, including the CDSC and Fair Valuation Lawsuits. The settlement is subject to court approval.
Columbia Acorn Trust and CWAM intend to defend these suits vigorously. CWAM believes that the lawsuits are not likely to materially affect its ability to provide investment management services to the Fund.
20
Wanger International 2008 Annual Report
Report of Independent Registered Public Accounting Firm
To the Board of Trustees and Shareholders of Wanger International,
In our opinion, the accompanying statement of assets and liabilities, including the statement of investments, and the related statements of operations and of changes in net assets and the financial highlights present fairly, in all material respects, the financial position of Wanger International (a series of the Wanger Advisors Trust, hereinafter referred to as the "Fund") at December 31, 2008, the results of its operations for the year then ended, the changes in its net assets for each of the two years in the period then ended and the financial highlights for each of the five years in the period then ended, in conformity with accounting principles generally accepted in the United States of America. These financial statements and financial highlights (hereafter referred to as "financial statements") are the responsibility of the Fund's management; our responsibility is to express an opinion on these financial statements based o n our audits. We conducted our audits of these financial statements in accordance with the standards of the Public Company Accounting Oversight Board (United States). Those standards require that we plan and perform the audit to obtain reasonable assurance about whether the financial statements are free of material misstatement. An audit includes examining, on a test basis, evidence supporting the amounts and disclosures in the financial statements, assessing the accounting principles used and significant estimates made by management, and evaluating the overall financial statement presentation. We believe that our audits, which included confirmation of securities at December 31, 2008 by correspondence with the custodian and brokers, provide a reasonable basis for our opinion.
PricewaterhouseCoopers LLP
Chicago, Illinois
February 16, 2009
21
Wanger International 2008 Annual Report
Federal Income Tax Information (Unaudited)
Foreign taxes paid during the fiscal year ended December 31, 2008 of $2,875,154 ($0.06 per share) are expected to be passed through to shareholders. This entire amount will be eligible for shareholders to claim as a foreign tax credit.
Gross income derived from sources within foreign countries was $37,886,134 ($0.81 per share) for the fiscal year ended December 31, 2008.
0.80% of the ordinary income distributed by the Fund, for the year ended December 31, 2008 qualified for the corporate dividends received deduction.
22
Wanger International 2008 Annual Report
Excerpt from:
Wanger Advisors Trust
Management Fee Evaluation of the Senior Officer
Prepared Pursuant to the New York Attorney General's
Assurance of Discontinuance
May 2008
23
Wanger International 2008 Annual Report
Introduction
The New York Attorney General's Assurance of Discontinuance ("Order") entered into by Columbia Management Advisors, Inc. ("CMAI") and Columbia Management Distributors, Inc., ("CMDI" and collectively with "CMAI," "CMG") in February 2005, allows CMAI to manage or advise a mutual fund only if the trustees of the fund appoint a "Senior Officer" to perform specified duties and responsibilities. One of these responsibilities includes "managing the process by which proposed management fees (including but not limited to, advisory fees) to be charged the [Funds] are negotiated so that they are negotiated in a manner which is at arms' length and reasonable and consistent with this Assurance of Discontinuance."
This is the second year that the Columbia Acorn Trust and Wanger Advisors Trust (collectively, the "Trusts") and each series thereof (the "Acorn funds," "WAT funds" or collectively, the "Funds") have been overseen by the same Board of Trustees ("Board"). The Order provides that this Board must determine the reasonableness of proposed "management fees" by using either an annual competitive bidding process supervised by the Senior Officer or Independent Fee Consultant, or by obtaining "an annual independent written evaluation prepared by or under the direction of the Senior Officer or the Independent Fee Consultant."
"Management fees" are only part of the costs and expenses paid by mutual fund shareholders. Fund expenses can vary depending upon the class of shares held but usually include: (1) investment management or advisory fees to compensate analysts and portfolio managers for stock research and portfolio management, as well as the cost of operating a trading desk; (2) administrative expenses incurred to prepare registration statements and tax returns, calculate the Funds' net asset values, maintain effective compliance procedures and perform recordkeeping services; (3) transfer agency costs for establishing accounts, accepting and disbursing funds, as well as overseeing trading in Fund shares; (4) custodial expenses incurred to hold the securities purchased by the Funds; and (5) distribution expenses, including commissions paid to brokers that sell the Fund shares to investors.
Columbia Wanger Asset Management, L.P. ("CWAM"), the advisor to the Funds, has proposed that the Trusts continue the existing separate agreements governing the first two categories listed above: an advisory agreement governing portfolio management, and an administration agreement governing certain administration and clerical services. Together the fees paid under these two agreements are referred to as "management fees." Other fund expenses are governed by separate agreements, in particular agreements with two CWAM affiliates: CMDI, the broker-dealer that underwrites and distributes the Funds' shares, and Columbia Management Services, Inc. ("CMSI"), the Funds' transfer agent. In conformity with the terms of the Order, this evaluation, therefore, addresses only the advisory and administrative contracts, and does not extend to the other agreements.
According to the Order, the Senior Officer's evaluation must consider at least the following:
(1) Management fees (including components thereof) charged to institutional and other clients of CWAM for like services;
(2) Management fees (including any components thereof) charged by other mutual fund companies for like services;
(3) Costs to CWAM and its affiliates of supplying services pursuant to the management fee agreements, excluding any intra-corporate profit;
(4) Profit margins of CWAM and its affiliates from supplying such services;
(5) Possible economies of scale as the Funds grow larger; and
(6) The nature and quality of CWAM's services, including the performance of each Fund.
In 2004, the Boards of the two Trusts, then separate groups, each appointed me Senior Officer under the Order. They also determined not to pursue a competitive bidding process and instead, charged me with the responsibility of evaluating the Funds' proposed advisory and administrative fee contracts with CWAM in conformity with the requirements of the Order. This Report is an annual evaluation required under the Order. In discharging their responsibilities, the independent Trustees have also consulted independent, outside counsel.
2007 Evaluation
This is the third annual evaluation prepared in connection with the Order. This evaluation follows the same structure as the earlier studies. Some areas are given more emphasis here, while others are given less. Still, the fundamental information gathered for this evaluation is largely the same as past years. Last year's evaluation is referred to here as the "2007 Study."
Process and Independence
The objectives of the Order are to insure the independent evaluation of the management fees paid by the Funds as well as to insure that all relevant factors are considered. In my view, this contract renewal process has been conducted at arms-length and with independence in gathering, considering and evaluating all relevant data. At the outset of the process, the Trustees sought and obtained from CWAM and CMG a comprehensive compilation of data regarding Fund performance and expenses, advisor profitability, and other information. The Board evaluated this information thoroughly. Performance and expense data was obtained from both Morningstar and Lipper, the leading consultants in this area. The rankings prepared by Morningstar and Lipper were independent and not influenced by the advisor.
In the course of its work, the Contract Committee gave careful consideration to the conclusions and recommendations contained in the 2007 Study. The Contract Committee gave particular emphasis to the issue of whether economies of scale were appropriately reflected in the Funds' fee schedules. The Board accepted and implemented several of the recommendations in this area contained in the 2007 Study.
24
Wanger International 2008 Annual Report
My evaluation of the advisory contract was shaped, as it was last year, by my experience as Chief Compliance Officer of the Trusts ("CCO"). As CCO, I report solely to the Board and have no reporting obligation to, or employment relationship with, CMG or its affiliates, except for administrative purposes. I have commented on compliance matters in evaluating the quality of service provided by CWAM.
This Report, its supporting materials and the data contained in other materials submitted to the Contract Committee of the Board, in my view, provide a thorough factual basis upon which the Board, in consultation with independent counsel as it deems appropriate, may conduct management fee negotiations that are in the best interests of the Funds' shareholders.
The Fee Reductions Mandated under the Order
Under the terms of the Order, CMG agreed to secure certain management fee reductions for the mutual funds advised by its affiliate investment advisors. In some instances, breakpoints were also established. Although neither CWAM nor the Trusts was a party to the Order, CWAM offered and the Board accepted certain advisory fee reductions during 2005. By the terms of the Order, these fees may not be increased before November 30, 2009. I have used these advisory fee levels, as modified thereafter, in this evaluation because they are the fees in the current agreements that CWAM proposes should be continued. Hence, these fee levels are the starting point of an evaluation.
Conclusions
My review of the data and other material above leads to the following conclusions with respect to the factors identified in the Order.
1. Performance. The domestic WAT Funds generally have achieved good to outstanding performance over the past five years. Wanger Select has, however, suffered a precipitous decline in ranking relative to its peers for the past year, and this trend merits the Trustees' continued attention. The international WAT Funds have relatively weaker relative long term records than do the domestic funds. All the WAT Funds, however, outperform their benchmarks, expose shareholders to less risk than competitors and achieve positive "alpha," a recognized measure of the added value of an investment manager.
2. Management Fees relative to Peers. Management fees vary by WAT Fund, but, in general, the WAT Funds impose higher fees than competing funds. Wanger Select and Wanger USA in particular were ranked by both Lipper and Morningstar at or below the median, and therefore impose higher fees than do the majority of their competitors.
3. Administrative Fees. The WAT Funds' administrative fees appear competitive in relation to their peers, and CWAM provides excellent administrative support for all the WAT Funds. There are clear advantages to retaining the advisor and its affiliates to perform these services. However, while economies of scale exist above current asset levels, the WAT Funds' administrative fee schedule provides no breakpoints.
4. Management Fees relative to Institutional and Other Mutual Fund Accounts. CWAM's focus is on its mutual funds. It does not actively seek to manage separate or institutional accounts. The few institutional accounts it does manage vary in rate structures. Some pay advisory fees commensurate with or higher than the WAT Funds. In a few instances, however, institutional accounts pay lower advisory fees than do the WAT Funds. One particular institutional account is significant in size and has been under CWAM's management for over 25 years.
5. Costs to CWAM and its Affiliates. CWAM's direct costs do not appear excessive. Overhead and indirect costs allocated to CWAM by its parent organizations, however, are significant and have increased dramatically in the past year. CWAM's affiliates report operating losses and therefore do not appear to enjoy excessive "fall out" benefits from CWAM's advisory agreement with the WAT Funds.
6. Profit Margins. CWAM's pre-marketing expense profit margins are at the top of the industry, though these comparisons are hampered by limited industry data. High profit margins are not unexpected for firms that manage large, successful funds and have provided outstanding investment performance for investors.
7. Economies of Scale. Economies of scale do exist at CWAM and will expand as the assets of the WAT Funds get larger. The Board has recently imposed additional breakpoints for some of the WAT Funds that will result in greater sharing of economies of scale.
8. Nature and Quality of Services. This category includes a variety of considerations that are difficult to quantify, yet can have a significant bearing on the performance of the Funds. Several areas merit comment.
a. Capacity. The WAT Funds have continued to grow, posing ever greater challenges in deploying assets effectively. While trends here merit continued monitoring, CWAM appears to be managing assets effectively.
b. Compliance. CWAM has a reasonably designed compliance program that protects shareholders.
9. Process. In my opinion, the process of negotiating an advisory contract for the WAT Funds has been conducted thoroughly and at arms' length. Further, the Trustees have sufficient information to evaluate management's proposal, and negotiate contract terms that are in the best interests of Fund shareholders.
25
Wanger International 2008 Annual Report
Recommendations
I believe the Trustees should:
1. Consider the addition of breakpoints to the WAT administrative fee contract to reflect the economies of scale present in performing these services, and, in fashioning those breakpoints, to consider the efficiencies achieved by CWAM by supporting both Trusts with the same staff performing largely identical tasks.
2. Focus their review on the WAT Funds' management fee levels in relation to their peers, in particular the fees paid by Wanger USA and Wanger Select.
3. Monitor Wanger Select to ensure that its long term performance is sustained.
Robert P. Scales
May 27, 2008
26
Wanger International 2008 Annual Report
Board Approval of the Advisory Agreement
Wanger Advisors Trust (the "Trust") has an investment advisory agreement (the "Advisory Agreement") with Columbia Wanger Asset Management, L.P. ("CWAM") under which CWAM manages the Columbia Wanger Family of Funds (the "Funds"). The trustees of the Trust, more than seventy five percent of whom have never been affiliated with CWAM (the "Independent Trustees"), oversee the management of each Fund and, as required by law, determine at least annually whether to continue the Advisory Agreement for each Fund.The Contract Committee of the board of trustees (the "Committee"), which is comprised of six Independent Trustees, makes recommendations to the board regarding any proposed continuation of the Advisory Agreement. After the Committee has made its recommendations, the full board of trustees determines whether to approve continuation of the Advisory Agreement. Th e board also considers matters bearing on the Advisory Agreement at its various meetings throughout the year, and meets at least quarterly with CWAM's portfolio managers.
In connection with their most recent consideration of the Advisory Agreement for each Fund, the Committee and all trustees received and reviewed a substantial amount of information provided by CWAM in response to requests from the Independent Trustees and their independent legal counsel. As they considered the Advisory Agreement, the Independent Trustees were advised by independent legal counsel. At each meeting where the Committee or the Independent Trustees considered the Advisory Agreement, they met with management and also met in separate executive session with their independent legal counsel.
The materials reviewed by the Committee and the trustees included, among other items, (i) information on the investment performance of each Fund and its peer groups and performance benchmarks, (ii) information on each Fund's advisory fees and other expenses, including information comparing the Fund's fees and expenses to those of peer groups of funds and information about any applicable expense limitations and fee "breakpoints," (iii) data on sales and redemptions of Fund shares and (iv) information on the profitability to CWAM, as well as potential "fall-out" or ancillary benefits that CWAM and its affiliates may receive as a result of their relationships with the Funds. The trustees also considered other information such as (i) CWAM's financial condition, (ii) each Fund's investment objective and strategies, (iii) the size, education and experience of CWAM's investment staff and its use of technology, external research and tra ding cost measurement tools, (iv) the allocation of the Funds' brokerage, if any, including allocations to brokers affiliated with CWAM, and the use of "soft" commission dollars to pay for research products and services, (v) the resources devoted to, and the record of compliance with, the Funds' investment policies and restrictions, policies on personal securities transactions and other compliance policies and (vi) the economic outlook generally and for the mutual fund industry in particular. In addition, the trustees conferred with, and reviewed the Management Fee Evaluation (the "Fee Evaluation") prepared by the Trust's chief compliance officer, who also serves as the Trust's "Senior Officer," as contemplated by the Assurance of Discontinuance dated February 9, 2005 among affiliates of CWAM and the Office of the New York Attorney General. A summary of the Fee Evaluation is included in this report. Throughout the annual contract renewal process, the trustees had the opportunity to ask questions of and reque st additional materials from CWAM.
The Committee held meetings in May and June 2008 and reported its recommendations to the full board of trustees. On June 11, 2008, the board of trustees unanimously approved continuation through July 31, 2009 of (i) the Advisory Agreement and (ii) the Trust's administrative services agreement with CWAM (the "Administration Agreement"), as amended to reflect the recommendation of the Committee that, effective August 1, 2008, the Trust shall pay CWAM for its services under the agreement a fee accrued daily and paid monthly at the following annual rates, as a percentage of the Trust's aggregate average daily net assets: 0.05% on the first $4 billion; 0.04% on $4 - 6 billion; 0.03% on $6 - 8 billion; and 0.02% on assets over $8 billion.
In considering the continuation of the Advisory Agreement and the continuation of the amended Administration Agreement, the trustees reviewed and analyzed various factors that they determined were relevant, including the factors described below, none of which by itself was considered dispositive. However, the material factors and conclusions that formed the basis for the trustees' determination to approve the continuation of the Advisory Agreement and the amended Administration Agreement are discussed separately below.
Nature, quality and extent of services. The trustees reviewed the nature, quality and extent of the services of CWAM and its affiliates to the Funds, taking into account the investment objective and strategy of each Fund and knowledge gained from meetings with management, which were held on at least a quarterly basis. In addition, the trustees reviewed the available resources and key personnel of CWAM and its affiliates, especially those providing investment management services to the Funds. The trustees also considered other services provided to the Funds by CWAM and its affiliates, including: managing the execution of portfolio transactions and selecting broker-dealers for those transactions; monitoring adherence to the Funds' investment restrictions; producing shareholder reports; providing support services for the board of trustees and committees of the board; communicating with shareholders; serving as the Funds' administrator; and overseeing the activities of the Funds' other service providers, including monitoring for compliance with various policies and procedures as well as applicable securities laws and regulations.
The trustees concluded that the nature, quality and extent of the services provided by CWAM and its affiliates to each Fund were appropriate and consistent with the terms of the Advisory Agreement and the Administration Agreement, and that the quality of those services had been consistent with or superior to quality norms in the industry. The trustees further concluded that the Funds were likely to benefit from the continued provision of those services by CWAM to the Funds. They also concluded that CWAM currently had sufficient personnel, with appropriate education and experience, to serve the Funds effectively, and had demonstrated its continuing ability to attract and retain well qualified personnel.
Performance of the Funds. At various meetings of the board of trustees, the Committee and the investment performance committee of the board, the trustees considered the short-term and longer-term performance of each Fund. They reviewed information comparing each Fund's performance with that of its benchmark(s) and with the performance of comparable funds and peer groups as identified by Lipper Inc. ("Lipper") and Morningstar, Inc. ("Morningstar"). On the domestic side, the trustees discussed how Wanger USA had exceeded its peer category average and beat its primary benchmark for the five year period, according to Morningstar, noting that Lipper's rankings of Wanger USA was somewhat lower than Morningstar's. Wanger Select had a particularly difficult performance year during 2007, which the trustees acknowledged. The trustees also reviewed the performan ce of the international Funds, discussing how both Wanger International and Wanger International Select continued to outperform their benchmarks over the five year period, but not the majority of their peer groups established by Lipper and Morningstar. During the annual contract renewal process, the trustees concluded that, although past performance is not necessarily indicative of future results, the Funds' strong overall longer-term performance record was an important factor in the their evaluation of the quality of services provided by CWAM under the Advisory Agreement.
Costs of Services and Profits Realized by CWAM. At various Committee and board of trustees meetings and other informal meetings, the trustees examined detailed information on the fees and expenses of each Fund in comparison to information for other comparable funds provided by Lipper and Morningstar. As noted in the Fee Evaluation, the contractual rates of investment advisory fees and the actual advisory fees paid by Wanger Select and Wanger USA were higher than the median advisory fee rates of their
27
Wanger International 2008 Annual Report
respective peer groups. The trustees also considered the advisory fees of the Funds relative to those of the series of Columbia Acorn Trust ("Acorn"), a group of funds with similar investment strategies also overseen by the trustees and managed by CWAM. The trustees noted that the Funds' advisory fees were comparable to those of the Acorn funds.
The trustees reviewed the analysis of the profitability of CWAM in serving as each Fund's investment advisor and of CWAM and its affiliates in their relationships with each Fund, as well as an explanation of the methodology utilized in allocating various expenses among the Funds and other business units, each of which was included in the Fee Evaluation. The trustees considered the methodology used by CWAM in determining compensation payable to portfolio managers and the competitive market for investment management talent. They discussed how profitability comparisons among fund managers are not very meaningful due to the small number of publicly owned managers, and how the profitability of any investment manager is affected by numerous factors, including its particular organizational structure, the types of funds and other accounts managed, other lines of business, expense allocation methodology, capital structure and cost of cap ital.
The trustees also reviewed the advisory fees charged by CWAM for managing other investment companies, sub-advised funds and other institutional separate accounts, as detailed in the Fee Evaluation. CWAM's institutional separate account fees for various investment strategies were examined and in some cases those fees were higher than the advisory fees charged to the Funds, and in some instances the Funds' fees were higher. The trustees noted that CWAM performs significant additional services for the Funds that it does not provide to sub-advised funds or non-mutual fund clients, including administrative services, oversight of the Funds' other service providers, trustee support, regulatory compliance and numerous other services, and that, in servicing the Funds, CWAM assumes many legal risks that it does not assume in servicing many of its other clients. Finally, as part of the annual contract renewal process, the trustees consider ed CWAM's financial condition.
In connection with their consideration of the Administration Agreement, and as recommended by the Committee and the Trust's Senior Officer, the Independent Trustees negotiated breakpoints in the fee schedule for administrative services that will reduce the fee for those services if the aggregate net assets of the Funds exceed $4 billion.
The trustees concluded that the rates of advisory fees and other compensation payable by the Funds to CWAM and its affiliates were reasonable in relation to the nature and quality of the services to be provided, taking into account the fees charged by other advisors for managing comparable mutual funds with similar strategies and the fees CWAM charges to other clients. The trustees also concluded that the Funds' estimated overall expense ratios were reasonable, considering the quality of services provided by CWAM and its affiliates and the investment performance of the Funds.
Economies of Scale. At various meetings throughout the annual contract renewal process, the trustees considered information about the extent to which CWAM realizes economies of scale in connection with the increase of Fund assets. The trustees noted that the advisory fee schedule for each Fund includes breakpoints in the rate of fees at various asset levels. The trustees discussed extensively the appropriateness of the recommendation of the Committee regarding the addition of further breakpoints to the fee schedule under the Administration Agreement. They noted that the Funds also share directly in economies of scale through lower charges by third party service providers based on the combined scale of all of the Funds. The trustees concluded that the current fee structure of each Fund, with the administration fee schedule changes recommended by the Co ntract Committee, was reasonable and reflective of a sharing between CWAM and the Funds of economies of scale.
Other Benefits to CWAM. The trustees also reviewed benefits that accrue to CWAM and its affiliates from their relationships with the Funds, as outlined in the Fee Evaluation. They noted that the Funds' transfer agent and distributor were each affiliates of CWAM and that the transfer agent received compensation from the Funds for services provided. The trustees considered ways, other than the services provided by CWAM and its affiliates pursuant to various agreements and the fees to be paid by each Fund therefor, that the Funds and CWAM may potentially benefit from their relationship with each other. At various Committee meetings, the trustees considered CWAM's use of commissions paid by each Fund on its portfolio brokerage transactions to obtain research products and services benefiting the Fund and/or other clients of CWAM, and determined that CWAM's use of the Funds' "soft" commission dollars to obtain research products and services was consistent with regulatory requirements and guidance then in effect. They also concluded that CWAM benefits from the receipt of proprietary research products and services acquired through commissions paid on portfolio transactions of the Funds, and that the Funds benefit from CWAM's receipt of those products and services as well as research products and services acquired through commissions paid by other clients of CWAM. The trustees further determined that the success of any Fund could attract other business to CWAM or the Funds and that the success of CWAM could enhance its ability to serve the Funds.
After full consideration of the above factors, as well as other factors that were considered relevant in evaluating the Advisory Agreement, the trustees, including the Independent Trustees, concluded that the continuation of the Advisory Agreement and continuation of the Administration Agreement (as amended to reflect the new administration fee schedule), was in the best interest of each Fund. On June 11, 2008, the trustees approved continuation of the Advisory Agreement and the Administration Agreement, as so amended, through July 31, 2009.
28
Wanger International 2008 Annual Report
Board of Trustees and Management of Wanger Advisors Trust
The Board of Trustees of the Trust has overall management responsibility for the Trust and the Funds. Each trustee may serve a term of unlimited duration until the end of the calendar year in which the trustee attains the age of 75 years. The trustees appoint their own successors, provided that at least two-thirds of the trustees, after such appointment, have been elected by shareholders. Shareholders may remove a trustee, with or without cause, upon the vote of two-thirds of the Trust's outstanding shares at any meeting called for that purpose. A trustee may be removed, with or without cause, upon the vote of a majority of the trustees.
The names of the trustees and officers of the Trust, the date each was first elected or appointed to office, their principal business occupations during at least the last five years, and other directorships they hold are shown below. Each trustee serves in such capacity for each of the four series of the Trust and each of the six series of Columbia Acorn Trust.
The business address of each trustee and officer of the Trust is Columbia Wanger Asset Management, L.P., 227 West Monroe, Suite 3000, Chicago, Illinois 60606. The Fund's Statement of Additional Information includes additional information about the Fund's trustees and officers. You may obtain a free copy of the Statement of Additional Information by writing or calling toll-free:
Columbia Wanger Asset Management, L.P.
Shareholder Services Group
227 W. Monroe, Suite 3000
Chicago, IL 60606
888-4-WANGER (888-492-6437)
Name, Position(s) with
Wanger Advisors
Trust and Age at
December 31, 2008 | | Year First
Elected or
Appointed
to Office | | Principal Occupation(s) during
Past Five Years | | Number of
Portfolios in
Fund Complex
Overseen
by Trustee/Officer | | Other
Directorships
in addition
to Wanger
Advisors Trust | |
| Trustees who are not interested persons of Wanger Advisors Trust: | |
|
Laura M. Born, 43,
Trustee | | | 2007 | | | Adjunct Assistant Professor of Finance, University of Chicago Booth School of Business; formerly, Managing Director—Investment Banking, J.P. Morgan Chase & Co. (broker/ dealer) 1991-2007. | | | 10 | | | Columbia Acorn Trust. | |
|
Michelle L. Collins, 48,
Trustee | | | 2008 | | | President, Cambium, since 2007; Advisory Board Member, Svoboda Capital Partners LLC, since 2007; Managing Director Svoboda Capital Partners LLC, 1998-2006. | | | 10 | | | Columbia Acorn Trust; Molex, Inc. (electronics components manufacturer). | |
|
Maureen M. Culhane, 60,
Trustee | | | 2007 | | | Retired. Formerly, Vice President, Goldman Sachs Asset Management, L.P. (investment advisor) 2005-2007; Vice President (Consultant)—Strategic Relationship Management, Goldman Sachs AG, 1999-2005. | | | 10 | | | Columbia Acorn Trust. | |
|
Margaret Eisen, 55,
Trustee | | | 2002 | | | Chief Investment Officer, EAM International LLC (corporate finance and asset management), since 2003; Managing Director, CFA Institute, 2005-2008. | | | 10 | | | Columbia Acorn Trust; Antigenics, Inc. (biotechnology and pharmaceuticals). | |
|
Jerome Kahn, Jr., 74,
Trustee | | | 1987 | | | Portfolio manager and stock analyst; formerly, President, William Harris Investors, Inc. (investment advisor). | | | 10 | | | Columbia Acorn Trust. | |
|
Steven N. Kaplan, 49,
Trustee | | | 1999 | | | Neubauer Family Professor of Entrepreneurship and Finance, University of Chicago Booth School of Business. | | | 10 | | | Columbia Acorn Trust; Morningstar, Inc. (provider of independent investment research). | |
|
David C. Kleinman, 73,
Trustee | | | 1972 | | | Adjunct Professor of Strategic Management, University of Chicago Booth School of Business; business consultant. | | | 10 | | | Columbia Acorn Trust; Sonic Foundry, Inc. (rich media systems and software). | |
|
29
Wanger International 2008 Annual Report
Board of Trustees and Management of Wanger Advisors Trust
Name, Position(s) with
Wanger Advisors
Trust and Age at
December 31, 2008 | | Year First
Elected or
Appointed
to Office | | Principal Occupation(s) during
Past Five Years | | Number of
Portfolios in
Fund Complex
Overseen
by Trustee/Officer | | Other
Directorships
in addition
to Wanger
Advisors Trust | |
Allan B. Muchin, 72,
Trustee and Vice Chairman
of the Board | | | 1998 | | | Chairman Emeritus, Katten Muchin Rosenman LLP (law firm). | | | 10 | | | Columbia Acorn Trust. | |
|
Robert E. Nason, 72,
Trustee and Chairman of
the Board | | | 1998 | | | Consultant and private investor, since 1998; prior thereto, Chief Executive Officer, executive partner, and member of the Executive Committee, Grant Thornton, LLP (public accounting firm). | | | 10 | | | Columbia Acorn Trust. | |
|
James A. Star, 47,
Trustee | | | 2006 | | | President, Longview Asset Management LLC (investment advisor), since 2003. | | | 10 | | | Columbia Acorn Trust; Traush Industries (privately-owned manufacturer of refrigeration parts and products). | |
|
John A. Wing, 73,
Trustee | | | 2002 | | | Partner, Dancing Lion Partners (investment firm); prior thereto, Chairman of the Board and Chief Executive Officer, ABN-AMRO Inc. (formerly named The Chicago Corporation, a financial services firm), Chief Executive Officer, Market Liquidity Network, LLC, and Frank Wakely Gunsaulus Professor of Law and Finance and Chairman of the Center for the Study of Law and Financial Markets, Illinois Institute of Technology. | | | 10 | | | Columbia Acorn Trust; First Chicago Bank and Trust; First Chicago Bancorp. | |
|
| Trustees who are interested persons of Wanger Advisors Trust: | |
|
Charles P. McQuaid, 55,
Trustee and President (1) | | | 1992 | | | President and Chief Investment Officer, CWAM or its predecessors, since October 2003; portfolio manager, CWAM or its predecessors, since 1995. | | | 10 | | | Columbia Acorn Trust. | |
|
Ralph Wanger, 74,
Trustee (2) | | | 1970 | | | Founder, CWAM. Formerly, President, Chief Investment Officer and portfolio manager, CWAM or its predecessors, July 1992-September 2003; Director, Wanger Investment Company PLC; Consultant, CWAM or its predecessors, September 2003-September 2005. | | | 10 | | | Columbia Acorn Trust. | |
|
| Officers of Wanger Advisors Trust: | |
|
Ben Andrews, 42,
Vice President | | | 2004 | | | Portfolio manager and analyst, CWAM or its predecessors, since 1998; Vice President, Columbia Acorn Trust and Wanger Advisors Trust, since 2004. | | | 10 | | | None. | |
|
Michael G. Clarke, 39,
Assistant Treasurer | | | 2004 | | | Treasurer of certain Columbia Funds since June 2008; Deputy Treasurer of certain Columbia Funds since June 2008; Chief Accounting Officer and Assistant Treasurer, the Columbia Funds, October 2004 to May 2008; Director of Fund Administration, Columbia Management Advisors, LLC, since January 2006; Managing Director, Columbia Management Advisors, LLC, September 2004-December 2005; Vice President of Fund Administration, Columbia Management Advisors, LLC, June 2002-September 2004. | | | 10 | | | None. | |
|
Jeffrey Coleman, 39,
Assistant Treasurer | | | 2006 | | | Director of Fund Administration, CWAM, since January 2006; Fund Controller, CWAM or its predecessors, October 2004-January 2006; Vice President, CDC IXIS Asset Management Services, Inc., August 2000-September 2004. | | | 10 | | | None. | |
|
30
Wanger International 2008 Annual Report
Board of Trustees and Management of Wanger Advisors Trust
Name, Position(s) with
Wanger Advisors
Trust and Age at
December 31, 2008 | | Year First
Elected or
Appointed
to Office | | Principal Occupation(s) during
Past Five Years | | Number of
Portfolios in
Fund Complex
Overseen
by Trustee/Officer | | Other
Directorships
in addition
to Wanger
Advisors Trust | |
J. Kevin Connaughton, 44,
Assistant Treasurer | | | 2001 | | | President of certain Columbia Funds since January 2009; Treasurer and Chief Financial Officer, the Columbia Funds, since December 2000; Managing Director, Columbia Management Advisors, LLC, since April 2003; Treasurer and Chief Financial Officer of the Liberty Funds, Stein Roe Funds and Liberty All-Star Funds, December 2000-December 2006; Treasurer, the Galaxy Funds, September 2002-November 2005; Senior Officer of various affiliated entities of Bank of America, including other registered and unregistered funds. | | | 10 | | | None. | |
|
P. Zachary Egan, 40,
Vice President | | | 2003 | | | Director of International Research, CWAM or its predecessors, since December 2004; Vice President, Columbia Acorn Trust and Wanger Advisors Trust, since 2003; portfolio manager and analyst, CWAM or its predecessors, since 1999. | | | 10 | | | None. | |
|
Peter T. Fariel, 51,
Assistant Secretary | | | 2006 | | | Associate General Counsel, Bank of America Corporation, since April 2005; prior thereto, Partner, Goodwin Procter LLP (law firm). | | | 10 | | | None. | |
|
John Kunka, 38,
Assistant Treasurer | | | 2006 | | | Director of Accounting and Operations, CWAM or its predecessors, since May 2006; Manager of Mutual Fund Operations, Calamos Advisors, Inc. (investment advisor), September 2005-May 2006; prior thereto, Manager of Mutual Fund Administration, Van Kampen Investments. | | | 10 | | | None. | |
|
Joseph LaPalm, 38,
Vice President | | | 2006 | | | Chief Compliance Officer, CWAM, since 2005; prior thereto, compliance officer, William Blair & Company (investment firm). | | | 10 | | | None. | |
|
Bruce H. Lauer, 51,
Vice President,
Secretary and Treasurer | | | 1995 | | | Chief Operating Officer, CWAM or its predecessors, since April 2000; Vice President, Secretary and Treasurer, Columbia Acorn Trust and Wanger Advisors Trust, since 1995; Director, Wanger Investment Company PLC; Director, Banc of America Capital Management (Ireland) Ltd.; Director, Bank of America Global Liquidity Funds, PLC. | | | 10 | | | None. | |
|
Louis J. Mendes, 44,
Vice President | | | 2003 | | | Portfolio manager and analyst, CWAM or its predecessors, since 2001; Vice President, Columbia Acorn Trust and Wanger Advisors Trust, since 2003. | | | 10 | | | None. | |
|
Robert A. Mohn, 47,
Vice President | | | 1997 | | | Director of Domestic Research, CWAM or its predecessors, since March 2004; Vice President, Columbia Acorn Trust and Wanger Advisors Trust, since 1997; portfolio manager and analyst, CWAM or its predecessors, since August 1992. | | | 10 | | | None. | |
|
Christopher Olson, 44,
Vice President | | | 2001 | | | Portfolio manager and analyst, CWAM or its predecessors, since January 2001; Vice President, Columbia Acorn Trust and Wanger Advisors Trust, since 2001. | | | 10 | | | None. | |
|
Robert P. Scales, 56,
Chief Compliance Officer,
Chief Legal Officer,
Senior Vice President and
General Counsel | | | 2004 | | | Chief Compliance Officer, Chief Legal Officer, Senior Vice President and General Counsel, Columbia Acorn Trust and Wanger Advisors Trust, since 2004; prior thereto, Associate General Counsel, Grant Thornton LLP (public accounting firm). | | | 10 | | | None. | |
|
Linda Roth-Wiszowaty, 39,
Assistant Secretary | | | 2006 | | | Business support analyst, CWAM, since April 2007; prior thereto executive administrator, CWAM or its predecessors, and executive assistant to the Chief Operating Officer of CWAM or its predecessors. | | | 10 | | | None. | |
|
(1) Mr. McQuaid is an "interested person" of Wanger Advisors Trust and of CWAM, as defined in the Investment Company Act of 1940 because he is an officer of the Trust and of CWAM.
(2) Mr. Wanger is an "interested person" of Wanger Advisors Trust and of CWAM, as defined in the Investment Company Act of 1940 because he owns securities issued by a controlling person of CWAM.
31
Wanger International 2008 Annual Report

Wanger Advisors Trust
Transfer Agent,
Dividend Disbursing Agent
Columbia Management Services, Inc.
P.O. Box 8081
Boston, Massachusetts
02266-8081
Distributor
Columbia Management Distributors, Inc.
One Financial Center
Boston, Massachusetts
02111-2621
Investment Advisor
Columbia Wanger Asset Management, L.P.
227 West Monroe Street, Suite 3000
Chicago, Illinois 60606
1-888-4-WANGER
(1-888-492-6437)
Legal Counsel
Bell, Boyd & Lloyd LLP
Chicago, Illinois
Independent Registered
Public Accounting Firm
PricewaterhouseCoopers LLP
Chicago, Illinois
This report, including the schedules of investments and financial statements, is submitted for the general information of the shareholders of the Wanger Advisors Trust.
A description of the Fund's proxy voting policies and procedures and a copy of the Fund's voting record for the most recent 12-month period ended June 30 are available (i) on the Securities and Exchange Commission's website at www.sec.gov, and (ii) without charge, upon request, by calling 1-888-492-6437.
The Fund files a complete schedule of portfolio holdings with the SEC for the first and third quarters of each fiscal year on Form N-Q. The Fund's Form N-Q is available on the SEC's website at www.sec.gov and may be reviewed and copied at the SEC's Public Reference Room in Washington, D.C. Information on the operation of the Pubic Reference Room may be obtained by calling 1-800-SEC-0330.
32
Columbia Wanger Funds
0L2568A
SHC-42/5119-1208 09/72708
Wanger Select
2008 Annual Report

| NOT FDIC INSURED | | May Lose Value | |
|
| NOT BANK ISSUED | | No Bank Guarantee | |
|

Wanger Select
2008 Annual Report
Table of Contents
| | 1 | | | Understanding Your Expenses | |
|
| | 2 | | | The Population Bust | |
|
| | 4 | | | Performance Review | |
|
| | 6 | | | Statement of Investments | |
|
| | 9 | | | Statement of Assets and Liabilities | |
|
| | 9 | | | Statement of Operations | |
|
| | 10 | | | Statement of Changes in Net Assets | |
|
| | 11 | | | Financial Highlights | |
|
| | 12 | | | Notes to Financial Statements | |
|
| | 16 | | | Report of Independent Registered Public Accounting Firm | |
|
| | 17 | | | Federal Income Tax Information | |
|
| | 18 | | | Management Fee Evaluation of the Senior Officer | |
|
| | 22 | | | Board Approval of the Advisory Agreement | |
|
| | 24 | | | Board of Trustees and Management of Wanger Advisors Trust | |
|
Columbia Wanger Asset Management, L.P. ("CWAM") is one of the leading global small- and mid-cap equity managers in the United States with more than 37 years of small- and mid-cap investment experience. As of December 31, 2008, CWAM manages $19.3 billion in assets and is the investment advisor to Wanger USA, Wanger International, Wanger Select, Wanger International Select (together, the "Wanger Advisors Trust Funds") and the Columbia Acorn Family of Funds. Columbia Management Group, LLC ("Columbia Management") is the investment management division of Bank of America Corporation. Columbia Management entities furnish investment management services and products for institutional and individual investors. The Wanger Advisors Trust Funds and the Columbia Acorn Family of Funds (together with other funds advised by Columbia Management affiliates, the "Columbia Funds") are distributed by Columbia Management Distributors, Inc., member of FINRA, SIPC, part of Columbia Management and an affiliate of Bank of America Corporation. CWAM is a registered investment advisor and an indirect, wholly owned subsidiary of Bank of America Corporation. CWAM is part of Columbia Management.
Please consider the investment objectives, risks, charges and expenses for the Fund carefully before investing. Contact 1-888-4-WANGER for a prospectus, which contains this and other important information about the Fund. You should read it carefully before you invest.
The views expressed in "The Population Bust" and in the Performance Review reflect the current views of the respective parties. These views are not guarantees of future performance and involve certain risks, uncertainties and assumptions that are difficult to predict so actual outcomes and results may differ significantly from the views expressed. These views are subject to change at any time based upon economic, market or other conditions and the respective parties disclaim any responsibility to update such views. These views may not be relied on as investment advice and, because investment decisions for a Columbia Fund are based on numerous factors, may not be relied on as an indication of trading intent on behalf of any particular Columbia Fund. References to specific company securities should not be construed as a recommendation or investment advice.
Wanger Select 2008 Annual Report
Understanding Your Expenses
As a Fund shareholder, you incur two types of costs. There are transaction costs, which generally include sales charges on purchases and may include redemption or exchange fees. There are also ongoing costs, which generally include investment advisory fees and other Fund expenses. The information on this page is intended to help you understand your ongoing costs of investing in the Fund and to compare these costs with the ongoing costs of investing in other mutual funds.
Analyzing your Fund's expenses
To illustrate these ongoing costs, we have provided an example and calculated the expenses paid by investors in the Fund during the period. The information in the following table is based on an initial hypothetical investment of $1,000, which is invested at the beginning of the period and held for the entire period. Expense information is calculated two ways and each method provides you with different information. The amount listed in the "Actual" column is calculated using actual operating expenses and total return for the Fund. The amount listed in the "Hypothetical" column assumes that the return each year is 5% before expenses and then applies the Fund's actual expense ratio for the period to the hypothetical return. You should not use the hypothetical account values and expenses to estimate either your actual account balance at the end of the period or the expenses you paid during the period. See the "Compare with other fun ds" information for details on using the hypothetical data.
Estimating your actual expenses
To estimate the expenses that you actually paid over the period, first you will need your account balance at the end of the period.
1. Divide your ending account balance by $1,000. For example, if an account balance was $8,600 at the end of the period, the result would be 8.6.
2. In the section of the table below titled "Expenses paid during the period," you will find a dollar amount in the column labeled "Actual." Multiply this amount by the result from step 1. Your answer is an estimate of the expenses you paid on your account during the period.
July 1, 2008 – December 31, 2008
| | | Account value at the
beginning of the period ($) | | Account value at the
end of the period ($) | | Expenses paid during
the period ($) | | Fund's annualized
expense ratio (%)* | |
| | | Actual | | Hypothetical | | Actual | | Hypothetical | | Actual | | Hypothetical | | Actual | |
| Wanger Select | | | 1,000.00 | | | | 1,000.00 | | | | 540.50 | | | | 1,020.41 | | | | 3.64 | | | | 4.77 | | | | 0.94 | | |
*For the six months ended December 31, 2008.
Expenses paid during the period are equal to the Fund's annualized expense ratio, multiplied by the average account value over the period, then multiplied by the number of days in the Fund's most recent fiscal half-year and divided by 366.
It is important to note that the expense amounts shown in the table are meant to highlight only ongoing costs of investing in the Fund. Expenses paid during the period do not include any insurance charges imposed by your insurance company's separate account. The hypothetical example provided is useful in comparing ongoing costs only and will not help you determine the relative total costs of owning different funds whose shareholders may incur transaction costs.
Compare with other funds
Since all mutual funds are required to include the same hypothetical calculations about expenses in shareholder reports, you can use this information to compare the ongoing cost of investing in the Fund with other funds. To do so, compare the 5% hypothetical example with the 5% hypothetical examples of other funds. As you compare hypothetical examples of other funds, it is important to note that hypothetical examples are meant to highlight the ongoing cost of investing in a fund and do not reflect any transaction costs, such as sales charges, redemption fees or exchange fees that may be incurred by shareholders of other funds. Expenses paid during the period do not include any insurance charges imposed by your insurance company's separate accounts.
1
Wanger Select 2008 Annual Report

The Population Bust
Important socio-economic predictions are based on demographics. For example, virtually all of the people who will retire in 2058 are living today and retirement age, immigration and mortality trends are utilized to create assumptions that will be used to predict the number of future retirees. The labor force of 2028 and the military age population of 2025 are similarly predictable. These factors are major drivers of government burdens, GDP growth and military potential. Demographics indicate that the world is unlikely to age gracefully.
World Demographic Trends
Richard Jackson and Neil Howe's, The Graying of the Great Powers provides an excellent summary of current demographic trends. Its authors conclude that, "The world is entering a demographic transformation of unprecedented dimensions... a fundamental demographic shift with no parallel in the history of humanity.... There is almost no chance that it will not happen—or that it will be reversed in our lifetime."1
The world's current great powers2 are aging at remarkably divergent rates. The United States is barely aging and has a fertility rate of 2.0 to 2.1 births per woman during child-bearing years, very near long-term zero population growth. This country is one of the youngest developed nations, and the age gap between the United States and other developed countries is projected to widen. "By the mid-2020's, the United States will be the only major developed country with more children under age 20 than elderly over age 65—and the only one whose working-age population will still be growing," write Jackson and Howe. The U.S. work force is projected to grow 14% between 2005 and 2030.3
Russian fertility rates plunged through the 1980s and rest today at 1.2 to 1.3 births. Risky lifestyles and a poor health care system have caused mortality rates to soar. Life expectancy for a Russian male has dropped to 59 years, lower than that of Bangladeshi males! Russia's working age population (those aged 20 to 64) will plunge 17% from 2005 to 2030.4 Prime Minister Vladimir Putin termed Russia's lack of births as "the most acute problem facing our country today."5
Jackson and Howe note that Japan is ground zero for demographic aging. Like Russia, its fertility rate has fallen to an average of 1.3 children per woman. In 1980, Japan was the youngest developed country, with only 9% of its population over age 65. By 2005, its elderly (those aged 65 and over) accounted for 20% of its population, making it one of the oldest developed countries. Japan's working-age population started shrinking in 2000 and from 2005 to 2030 it is expected to drop 18%.6
China's one-child policy collapsed fertility rates, which have since rebounded to 1.7 to 1.8. But China's pre-one-child-policy population bulge is aging rapidly. China's working age population will fall after 2015 and China's ratio of workers to retirees will triple from 2005 to 2030. The Chinese have relied on family rather than the government for old age support and, with shrunken families, China by 2030 could have over 100 million indigent seniors. The Asian Tigers' fertility rates range from 0.9 to 1.4, and the Tigers also are rapidly aging.7,8
There are two demographic categories of Western European countries: those with likely slow population declines and those with likely fast population drops. Slow decliners have fertility rates of around 1.8 and include the United Kingdom, France and northern Europe, except Germany. Fast decliners have fertility rates of 1.3 and include Germany and southern Europe. The working age population of Europe is projected to shrink 6% by 2030. Public pensions already cost Europe twice the percentage of GDP as compared to the United States, and will get worse. Europe's elderly will account for over 25% of its population in 2030, up from 17% in 2005.9
The image of rapidly growing populations all over the developing world is outdated. Only a few areas of the world, including sub-Saharan Africa and some Muslim countries (Iraq, Yemen, Somalia, Sudan, Afghanistan and Pakistan) have fertility rates of 4.0 or higher. Fertility has trended down in most other developing countries. In non-Muslim South Asia, including India, fertility has fallen to about 3.0. Latin America fertility has dropped to 2.5 from 6.0 in the 1960s. Turkey and Iran have current fertility rates around 2.1. However, many developing countries have high percentages of women in childbearing ages, so despite declining fertility rates, their absolute numbers of youths and working age populations will grow rapidly for several decades.10
Immigration will impact the numbers in the United States and Europe. Migration is at or near records in many countries. Some 13% of the U.S. population consists of immigrants, as does 8% to 13% of France, the United Kingdom and Germany. Hispanics are the primary immigrants into the United States; most are employed and data indicates that second generation Hispanics have higher incomes than their parents. That in turn suggests higher productivity and some degree of assimilation. Muslims are the primary immigrants in many European countries; their unemployment rates are high and most of their second generation seems to be making little economic progress; many are not assimilating. This suggests future productivity problems in much of Europe, and possibly diverging national interests.11
Jackson and Howe cite numerous geopolitical implications from demographic changes. Within the developed world, only the United States will likely have the capacity to remain a great power. It was the third most populous country in the world in 1950 and is forecasted to remain so in 2050. Germany, the United Kingdom, Italy and
2
Wanger Select 2008 Annual Report
France had populations among the top dozen countries in the world in 1950, but of them, Germany will be the leader at 26th in 2050. Western Europe and Japan will be aged and Western Europe especially will have huge public pension costs. While the United States and Western Europe each accounted for 37% of the developed world's economy in the 1980s, the U.S. will likely grow to 54% and Western Europe is projected to shrink to 23% by 2050.12 The United States' increasing relative strength will likely mean that it will need to provide for an even greater proportion of the developed world's security.
Though the U.S. share of the developed world's population and economy will rise, its share of the total world's population and economy will fall. Howe and Jackson note that 90% of the world's population growth to 2050 will occur in sub-Saharan Africa, Muslim countries and South Asia, in nations largely troubled by poverty, religious conflict or both.13
Due to the characteristics of population segments, security risks are likely to rise and peak in the 2020s. This will come at a time when most of the historically great powers are likely to have military recruiting challenges along with budget problems. Jackson and Howe also worry about the effects of aging on savings rates and creativity. In a book by Mark Steyn titled America Alone,14 the author writes that the United States should do a better job exporting its values of liberty, women's rights, freedom of speech, self reliance, decentralization and responsibility. He believes this is one way the U.S. influence can make a posi tive impact.
Investment Implications
Change creates investment risks and opportunities. Recognizing these powerful trends and understanding when they are likely to occur could mitigate the risks and result in profitable investments.
Studies indicate that an individual's creativity, as measured by works of art, peaks between the ages of 30 and 50 and that Nobel achievements peak when people are in their 30s.15 An aging worldwide population may make innovation more scarce and consequently more highly rewarded. Innovative companies may become less subject to competition and be more highly valued in financial markets.
Small- and mid-cap companies tend to be innovative and adaptable. Many existing companies provide goods and services to growing population segments and more will emerge in the future to do so. Our analysts will continue to pursue these opportunities around the world.
The United States has excellent prospects compared to much of the rest of the developed world. Many investment analysts have tracked the baby boomer and echo baby boomer age segments, and as a result have predicted demand for goods and services such as toys, school books, automobiles, housing, leisure items and health care. Long-term demand for leisure and health care continues to appear promising, and additional opportunities may include companies producing labor saving devices and military technology. The United States stands to benefit from woes elsewhere, as highly productive people migrate here for employment and entrepreneurial opportunities, lower taxes and, in some cases, less strife.
There will continue to be investment opportunities overseas. In developed countries, companies that provide products or services to aging populations should benefit. Once the world economy recovers, capital goods suppliers to developing countries should resume growing. Developing countries that have moderate population growth and attractive climates for capitalism are likely to increase their share of world GDP and provide investment opportunities. Companies that participate in domestic growth within these countries should especially benefit.


Charles P. McQuaid
President and Chief Investment Officer
Columbia Wanger Asset Management, L.P.
The information and data provided in this analysis are derived from sources that we deem to be reliable and accurate. These views are not guarantees of future performance and involve certain risks, uncertainties and assumptions that are difficult to predict so actual outcomes and results may differ significantly from the views expressed. The views/opinions expressed in this essay are those of the author and not of the Columbia Wanger Trust Board, are subject to change at any time based upon economic, market or other conditions, may differ from views expressed by other Columbia Management associates or other divisions of Bank of America and the respective parties disclaim any responsibility to update such views. These views may not be relied on as investment advice and, because investment decisions for a Columbia Wanger Fund are based on numerous factors, may not be relied on as an indication of trading intent on behalf of any particular Columbia Wanger Fund.
1 Jackson, Richard and Howe, Neil, The Graying of the Great Powers, (Washington, D.C., Center for Strategic & International Studies, 2008), pg. 1.
2 By popular definition, the "great powers" are the worlds most powerful countries based on wealth, military strength and population.
3 Jackson, Richard and Howe, Neil, op. cit., pgs. 39-40.
4 Ibid, pg. 179.
5 "Vladimir Putin on Raising Russia's Birth Rate," Population and Development Review 32, no. 2 (June 2006).
6 Jackson, Richard and Howe, Neil, op. cit., pg. 44.
7 The Asian Tiger countries include Hong Kong, Singapore, South Korea and Taiwan.
8 Jackson, Richard and Howe, Neil, op. cit., pgs. 155, 171, 175.
9 Ibid, pg. 42.
10 Ibid, pgs. 163-176.
11 Ibid, pgs. 122-126.
12 Ibid, pgs. 191-192.
13 Ibid, pg. 194.
14 Steyn, Mark, America Alone: The End of the World As We Know It, (Washington, D.C., Regnery Publishing, Inc., 2006), pgs. 173, 205.
15 Jackson, Richard and Howe, Neil, op. cit., pg. 111.
3
Wanger Select 2008 Annual Report

Performance Review Wanger Select

Ben Andrews
Portfolio Manager
Performance data quoted represents past performance and current performance may be lower or higher. Past performance is no guarantee of future results. The investment return and principal value will fluctuate so that shares, when redeemed, may be worth more or less than the original cost. Performance may reflect any voluntary waiver and reimbursement of fund expenses by the advisor or affiliates. Absent these fee waivers, or expense reimbursements, performance results may be lower. For daily and most recent month-end performance updates, please call 1-888-4-WANGER.
All results shown assume reinvestment of distributions and do not reflect the deduction of taxes that a shareholder would pay on fund distributions or on the redemption of fund shares.
Wanger Select declined 49.06% in 2008. This compares to a loss in the S&P MidCap 400 Index of 36.23% and a decline in the S&P 500 Index of 37.00%. I am quite disappointed in the Fund's performance vs. its benchmark as well as the large destruction of our capital. The select nature of this Fund can make it more volatile than its benchmark index. Wanger Select lagged the S&P MidCap 400 Index for the year by nearly 13 basis points and roughly 10% of that decline came in September, the most volatile month of the period. Looking forward, our number one goal is improved performance.
Wanger Select's structure has changed a little in the last couple of months. We have sold or cut back the size of several commodity names, including Potash Corp. of Saskatchewan and Diamond Offshore Drilling. We believe that the government stimulus packages worldwide will be inflationary in the long term, but we have clearly entered a deflationary period that will probably last for a number of months. Therefore, we believe we can find a better use for these assets than these stocks. We also sold, or are in the process of selling, some businesses in which we lost confidence in our assessment of their business models. The proceeds from all of these sales have gone into businesses that we believe are solid franchises and that have a high degree of recurring revenues, such as Nalco Holding Company, Donaldson, Ametek and Amphenol.
We believe the stock market contains a number of companies that are undervalued due to a perceived bankruptcy risk. Many companies use the corporate debt market for a piece of their capital structure. If you're a company that could possibly break a debt covenant or that has to refinance debt in the next one to two years, the market has varying degrees of risk factored into your stock price. Regardless of whether or not the market rallies in coming months, the lessening of this risk could provide a big opportunity for these stocks. Over the next few quarters, if the corporate vs. U.S. Treasury bond spread continues to narrow and corporate debt issuances (refinancings) are able to resume, we believe these stocks could rally.
With these scenarios in mind, the Fund is being positioned in a barbell fashion with a large number of historically inexpensive, solid franchises with little to no credit risk on one end. On the other end, we have a handful of businesses that have some credit risk but that are being valued at levels that we believe can make them compelling investments. Examples include Conseco, Hertz and WNS.
But there are still several big negatives looming over the investment landscape. Simultaneous economic downturns in the developed markets of the United States, Europe and Japan will make exporting goods a challenge. A continued inability of companies to refinance debt at reasonable rates could force more bankruptcies and layoffs. More deleveraging of personal and corporate balance sheets will slow worldwide spending. Declining housing prices will continue to rattle everyone's confidence. In these times of extreme uncertainty, we are seeking to structure the portfolio with solid companies that we believe can survive at least 12 to 24 months of very poor economic conditions. Although stock selection is always critically important, it becomes an even greater priority coming out of a prolonged recession. It's then that we believe you need some stocks that have the potential to rise significantly in a healthier economy, even if it me ans taking on some credit risk now. We had this very much in mind when implementing our barbell approach.
Risks include stock market fluctuations due to economic and business developments. The Fund also has potentially greater price volatility due to the Fund's concentration in a limited number of stocks of mid-size companies. The Fund is a non-diversified fund and may, therefore, have a greater risk of loss from a few issuers than a similar fund that invests more broadly. The Fund may not operate as a non-diversified fund at all times. International investments involve greater potential risks, including less regulation, currency fluctuations, economic instability and political developments.
Portfolio holdings are subject to change periodically and may not be representative of current holdings.
4
Wanger Select 2008 Annual Report
Growth of a $10,000 Investment in
Wanger Select
Total return for each period,
February 1, 1999 (inception date) through December 31, 2008
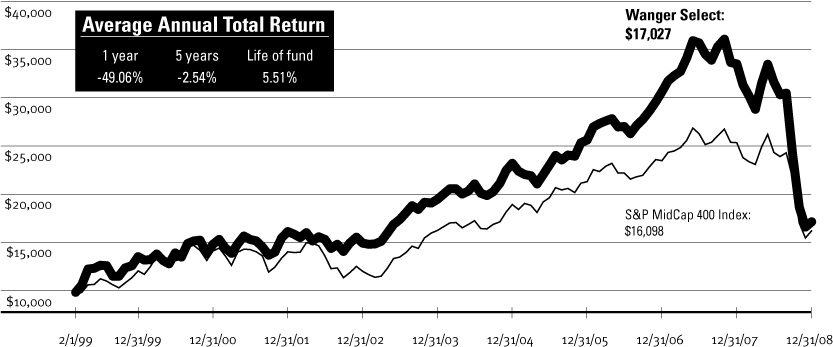
This graph compares the results of $10,000 invested in Wanger Select on February 1, 1999 (the date the Fund began operations) through December 31, 2008, to the S&P MidCap 400 Index, with dividends and capital gains reinvested. Part of the performance shown is due to the Fund's purchase of securities in IPOs. The impact of IPO purchases declines as a Fund grows large. Performance results reflect any fee waivers or reimbursements of Fund expenses by CWAM or any of its affiliates. Absent these fee waivers or expense reimbursement arrangements, performance results would have been lower. Performance shown here is past performance, which cannot guarantee future results. Current performance may be higher or lower. The investment return and principal value of an investment in the Fund will fluctuate so that Fund shares, when redeemed, may be worth more or less than their original cost. Performance changes over time. Current retur ns for the Fund may be different than that shown. For daily and most recent month-end performance updates, please contact us at 1-888-4-WANGER.
Results to December 31, 2008
| | | 4th quarter | | 1 year | |
| Wanger Select | | | -29.52 | % | | | -49.06 | % | |
| S&P MidCap 400 Index | | | -25.55 | | | | -36.23 | | |
| S&P 500 Index | | | -21.94 | | | | -37.00 | | |
NAV as of 12/31/08: $13.87
Performance numbers reflect all Fund expenses but do not include any insurance charge imposed by your insurance company's separate accounts. If performance included the effect of these additional charges, it would be lower.
The Fund's annual operating expense ratio is 0.90%. The annual operating expense ratio is as stated in the Fund's prospectus that is current as of the date of this report. Differences in expense ratios disclosed elsewhere in this report may result from including fee waivers and expense reimbursements as well as different time periods used in calculating the ratios.
All results shown assume reinvesment of distributions and do not reflect taxes that a shareholder would pay on Fund distributions or the sale of Fund shares.
The S&P MidCap 400 Index, which is the Fund's primary benchmark, is a market value-weighted index that tracks the performance of 400 mid-cap U.S. companies. The S&P 500 tracks the performance of 500 widely-held large capitalization U.S. stocks. Indexes are not managed and do not incur fees or expenses. It is not possible to invest directly in an index.
Portfolio characteristics and holdings are subject to change periodically and may not be representative of current characteristics and holdings.
Top 5 Industries
As a percentage of net assets, as of 12/31/08
| Consumer Goods & Services | | | 28.0 | % | |
| Information | | | 23.8 | | |
| Industrial Goods & Services | | | 17.0 | | |
| Finance | | | 10.6 | | |
| Energy & Minerals | | | 8.7 | | |
Top 10 Holdings
As a percentage of net assets, as of 12/31/08
1. ITT Educational Services
Post-secondary Degree Services | | | 8.7 | % | |
2. Safeway
Supermarkets | | | 6.2 | | |
3. Conseco
Life, Long-term Care & Medical Supplemental Insurance | | | 5.5 | | |
4. SkillSoft
Web-based Learning Solutions (E-Learning) | | | 4.6 | | |
5. Quanta Services
Electrical & Telecom Construction Services | | | 4.5 | | |
6. Waste Management
U.S. Garbage Collection & Disposal | | | 3.7 | | |
7. Expeditors International of Washington
International Freight Forwarder | | | 3.5 | | |
8. Cephalon
Specialty Pharmaceuticals for Pain,
Central Nervous System & Oncology | | | 3.5 | | |
9. American Tower
Communications Towers in USA & Mexico | | | 3.3 | | |
10. JB Hunt Transport Services
Truck & Intermodal Carrier | | | 2.8 | | |
5
Wanger Select 2008 Annual Report
Wanger Select
Statement of Investments, December 31, 2008
Number of
Shares | | | | Value | |
| | | Common Stocks – 94.4% | |
| | | Consumer Goods & Services – 28.0% | |
| | | Other Consumer Services – 10.6% | |
| | 144,100 | | | ITT Educational Services (a)
Post-secondary Degree Services | | $ | 13,686,618 | | |
| | 160,000 | | | Career Education (a)
Post-secondary Education | | | 2,870,400 | | |
| | | | | | | | 16,557,018 | | |
| | | Retail – 7.9% | |
| | 411,000 | | | Safeway
Supermarkets | | | 9,769,470 | | |
| | 113,000 | | | Abercrombie & Fitch
Teen Apparel Retailer | | | 2,606,910 | | |
| | | | | | | | 12,376,380 | | |
| | | Travel – 4.8% | |
| | 758,900 | | | Hertz (a)
Largest U.S. Rental Car Operator | | | 3,847,623 | | |
| | 438,000 | | | Expedia (a)
Online Travel Services Company | | | 3,609,120 | | |
| | | | | | | | 7,456,743 | | |
| | | Apparel – 2.5% | |
| | 188,000 | | | Coach (a)
Designer & Retailer of Branded
Leather Accessories | | | 3,904,760 | | |
| | | Casinos & Gaming – 0.9% | |
| | 34,291,000 | | | RexCapital Finance (China) (a)
Chinese Lottery | | | 827,901 | | |
| | 4,766,000 | | | NagaCorp (Hong Kong)
Monopoly Casino in Central Cambodia | | | 659,723 | | |
| | | | | | | | 1,487,624 | | |
| | | Food & Beverage – 0.7% | |
| | 2,054,000 | | | Fu Ji Food & Catering Services (China)
Food Catering Service Provider in China | | | 1,099,315 | | |
| | | Furniture & Textiles – 0.6% | |
| | 105,000 | | | Knoll
Office Furniture | | | 947,100 | | |
| | | | | Total Consumer Goods & Services | | | 43,828,940 | | |
Number of
Shares | | | | Value | |
| | | Information – 23.8% | |
| | | Mobile Communications – 5.1% | |
| | 175,000 | | | American Tower (a)
Communications Towers in USA & Mexico | | $ | 5,131,000 | | |
| | 152,000 | | | Crown Castle International (a)
Communications Towers | | | 2,672,160 | | |
| | 1,110,000 | | | Globalstar (a)
Satellite Mobile Voice & Data Carrier | | | 222,000 | | |
| | | | | | | | 8,025,160 | | |
| | | Internet Related – 4.6% | |
| | 1,000,000 | | | SkillSoft – ADR (a)
Web-based Learning Solutions (E-Learning) | | | 7,140,000 | | |
| | | Business Software – 3.4% | |
| | 1,057,000 | | | Novell (a)
Directory, Operating System &
Identity Management Software | | | 4,111,730 | | |
| | 115,000 | | | Avid Technology (a)
Digital Nonlinear Editing Software & Systems | | | 1,254,650 | | |
| | | | | | | | 5,366,380 | | |
| | | CATV – 2.6% | |
| | 146,500 | | | Discovery Communications (a) | | | 2,074,440 | | |
| | 146,500 | | | Discovery Communications, Series C (a)
CATV Programming | | | 1,961,635 | | |
| | | | | | | | 4,036,075 | | |
| | | Telecommunications – Equipment 2.0% | |
| | 780,000 | | | Tellabs (a)
Telecommunications Equipment | | | 3,213,600 | | |
| | | Advertising – 1.7% | |
| | 361,100 | | | VisionChina Media – ADR (China) (a)
Advertising on Digital Screens in
China's Mass Transit System | | | 1,971,606 | | |
| | 457,127 | | | China Mass Media – ADR (China) (a)
Media Planning Agency in China | | | 649,120 | | |
| | | | | | | | 2,620,726 | | |
| | | Contract Manufacturing – 1.6% | |
| | 5,255,000 | | | Sanmina – SCI (a)
Electronic Manufacturing Services | | | 2,469,850 | | |
See accompanying notes to financial statements.
6
Wanger Select 2008 Annual Report
Wanger Select
Statement of Investments, December 31, 2008
Number of
Shares | | | | Value | |
| | | Computer Services – 1.4% | |
| | 358,000 | | | WNS – ADR (a)
Offshore BPO (Business Process Outsourcing) Services | | $ | 1,879,500 | | |
| | 86,500 | | | Hackett Group (a)
IT Integration & Best Practice Research | | | 252,580 | | |
| | | | | | | | 2,132,080 | | |
| | | Computer Hardware & Related Equipment – 1.1% | |
| | 75,000 | | | Amphenol
Electronic Connectors | | | 1,798,500 | | |
| | | Financial Processors – 0.3% | |
| | 411,000 | | | CardTronics (a)
Operates the World's Largest Network of ATMs | | | 530,190 | | |
| | | | | Total Information | | | 37,332,561 | | |
| | | Industrial Goods & Services – 17.0% | |
| | | Other Industrial Services – 6.3% | |
| | 167,000 | | | Expeditors International of Washington
International Freight Forwarder | | | 5,556,090 | | |
| | 444,600 | | | American Commercial Lines (a)
Operator/Builder of Inland Barges | | | 2,178,540 | | |
| | 146,000 | | | Mobile Mini (a)
Portable Storage Units Leasing | | | 2,105,320 | | |
| | | | | | | | 9,839,950 | | |
| | | Outsourcing Services – 4.4% | |
| | 352,000 | | | Quanta Services (a)
Electrical & Telecom Construction Services | | | 6,969,600 | | |
| | | Waste Management – 3.7% | |
| | 176,000 | | | Waste Management
U.S. Garbage Collection & Disposal | | | 5,832,640 | | |
| | | Machinery – 1.7% | |
| | 61,000 | | | Ametek
Aerospace/Industrial Instruments | | | 1,842,810 | | |
| | 23,000 | | | Donaldson
Industrial Air Filtration | | | 773,950 | | |
| | | | | | | | 2,616,760 | | |
Number of
Shares | | | | Value | |
| | | Industrial Materials & Specialty Chemicals – 0.9% | |
| | 117,000 | | | Nalco Holding Company
Provider of Water Treatment &
Process Chemicals & Services | | $ | 1,350,180 | | |
| | | | | Total Industrial Goods & Services | | | 26,609,130 | | |
| | | Finance – 10.6% | |
| | | Insurance – 5.5% | |
| | 1,651,000 | | | Conseco (a)
Life, Long-term Care & Medical Supplement Insurance | | | 8,552,180 | | |
| | | Brokerage & Money Management – 5.1% | |
| | 182,000 | | | Eaton Vance
Specialty Mutual Funds | | | 3,823,820 | | |
| | 175,000 | | | SEI Investments
Mutual Fund Administration & Investment Management | | | 2,749,250 | | |
| | 717,300 | | | MF Global (a)
Futures Broker | | | 1,463,292 | | |
| | | | 8,036,362 | | |
| | | | | Total Finance | | | 16,588,542 | | |
| | | Energy & Minerals – 8.7% | |
| | | Oil Services – 4.0% | |
| | 718,500 | | | Tetra Technologies (a)
U.S.-based Service Company with
Life of Field Approach | | | 3,491,910 | | |
| | 117,000 | | | FMC Technologies (a)
Oil & Gas Wellhead Manufacturer | | | 2,788,110 | | |
| | | | | | | | 6,280,020 | | |
| | | Mining – 2.0% | |
| | 2,119,000 | | | Uranium One (South Africa) (a)
Uranium Mines in South Africa,
Kazakhstan, Australia & the U.S. | | | 3,072,507 | | |
| | | Alternative Energy – 1.4% | |
| | 214,100 | | | Canadian Solar (a)
Solar Cell & Module Manufacturer | | | 1,383,086 | | |
| | 176,000 | | | Real Goods Solar (a)
Residential Solar Energy Installer | | | 642,400 | | |
| | 303,000 | | | Synthesis Energy Systems (a)
Owner/Operator of Gasification Plants | | | 206,040 | | |
| | | | | | | | 2,231,526 | | |
See accompanying notes to financial statements.
7
Wanger Select 2008 Annual Report
Wanger Select
Statement of Investments, December 31, 2008
Number of Shares
or Principal Amount | | | | Value | |
| | | Oil & Gas Producers – 1.3% | |
| | 917,500 | | | Pacific Rubiales Energy (Canada) (a)(b) | | $ | 1,611,366 | | |
| | 215,166 | | | Pacific Rubiales Energy (Canada) (a) | | | 381,704 | | |
| | 322,159 | | | Pacific Rubiales Energy –
Warrants (Canada) (a)(b)
Oil Production & Exploration in Colombia | | | 85,257 | | |
| | | | 2,078,327 | | |
| | | | | Total Energy & Minerals | | | 13,662,380 | | |
| | | Health Care – 3.5% | |
| | | Pharmaceuticals – 3.5% | |
| | 70,500 | | | Cephalon (a)
Specialty Pharmaceuticals for Pain,
Central Nervous System & Oncology | | | 5,431,320 | | |
| | | | | Total Health Care | | | 5,431,320 | | |
| | | Other Industries – 2.8% | |
| | | Transportation – 2.8% | |
| | 164,000 | | | JB Hunt Transport Services
Truck & Intermodal Carrier | | | 4,308,280 | | |
| | | | | Total Other Industries | | | 4,308,280 | | |
| Total Common Stocks – (Cost: $225,640,304) 94.4% | | | 147,761,153 | | |
| Short-Term Obligations – 6.3% | | | |
| | | Repurchase Agreement – 5.7% | |
| $ | 8,880,000 | | | Repurchase Agreement with Fixed
Income Clearing Corp., dated 12/31/08,
due 1/02/09 at 0.010%, collateralized by
a U.S. Treasury Obligation, maturing
11/17/15, market value $9,058,219
(repurchase proceeds $8,880,005) | | | 8,880,000 | | |
| | | Commercial Paper – 0.6% | |
| | 1,000,000 | | | Toyota Motor Credit
0.55% due 1/23/09 | | | 999,664 | | |
| Total Short-Term Obligations (Cost: $9,879,664) | | | 9,879,664 | | |
| Total Investments – (Cost: $235,519,968) 100.7% (c)(d) | | | 157,640,817 | | |
| Cash and Other Assets Less Liabilities – (0.7)% | | | (1,052,686 | ) | |
| Total Net Assets – 100.0% | | $ | 156,588,131 | | |
Notes to Statement of Investments:
(a) Non-income producing security.
(b) Denotes a restricted security, which is subject to restrictions on resale under federal securities laws. These securities are valued at their fair value determined in good faith under consistently applied procedures established by the Board of Trustees. At December 31, 2008, these securities amounted to $1,696,623 which represents 1.08% of total net assets.
Additional information on those securities is as follows:
Security | | Acquisition
Dates | |
Shares | |
Cost | |
Value | |
Pacific Rubiales
Energy | | 7/12/07 – 8/22/07 | | | 917,500 | | | $ | 4,132,484 | | | $ | 1,611,366 | | |
Pacific Rubiales
Energy-Warrants | | 7/12/07 | | | 322,159 | | | | 551,426 | | | | 85,257 | | |
| | | | | | | $ | 4,683,910 | | | $ | 1,696,623 | | |
(c) On December 31, 2008, the market value of foreign securities represents 4.94% of total net assets. The Fund's foreign portfolio was diversified as follows:
| Currency | | Value | | Cost | | Percentage of
Net Assets | |
| Canadian Dollar | | $ | 5,150,834 | | | $ | 16,924,088 | | | | 3.29 | | |
| Hong Kong Dollar | | | 2,586,939 | | | | 5,630,683 | | | | 1.65 | | |
| | | $ | 7,737,773 | | | $ | 22,554,771 | | | | 4.94 | | |
(d) At December 31, 2008, for federal income tax purposes cost of investments was $237,680,790 and net unrealized depreciation was $80,039,973 consisting of gross unrealized appreciation of $21,630,514 and gross unrealized depreciation of $101,670,487.
At December 31, 2008, the Fund held investments in the following sectors:
| Sector | | Percentage of
Net Assets | |
| Consumer Goods & Services | | | 28.0 | | |
| Information | | | 23.8 | | |
| Industrial Goods & Services | | | 17.0 | | |
| Finance | | | 10.6 | | |
| Energy & Minerals | | | 8.7 | | |
| Health Care | | | 3.5 | | |
| Other Industries | | | 2.8 | | |
| Short-Term Obligations | | | 6.3 | | |
| Cash and Other Assets less Liabilities | | | (0.7 | ) | |
| | | | 100.0 | | |
ADR = American Depositary Receipts
See accompanying notes to financial statements.
8
Wanger Select 2008 Annual Report
Statement of Assets and Liabilities
December 31, 2008
| Assets: | |
| Investments, at cost | | $ | 235,519,968 | | |
| Investments, at value | | $ | 157,640,817 | | |
| Cash | | | 940 | | |
| Receivable for: | |
| Investments sold | | | 1,564,153 | | |
| Fund shares sold | | | 714,633 | | |
| Interest | | | 2 | | |
| Dividends | | | 38,265 | | |
| Other assets | | | 1,467 | | |
| Total Assets | | | 159,960,277 | | |
| Liabilities: | |
| Payable for: | |
| Investments purchased | | | 3,129,249 | | |
| Fund shares repurchased | | | 92,278 | | |
| Investment advisory fee | | | 98,981 | | |
| Administration fee | | | 6,186 | | |
| Transfer agent fee | | | 23 | | |
| Trustees' fees | | | 5 | | |
| Audit fee | | | 14,995 | | |
| Custody fee | | | 3,201 | | |
| Chief compliance officer expenses | | | 480 | | |
| Trustees' deferred compensation plan | | | 10,295 | | |
| Other liabilities | | | 16,453 | | |
| Total Liabilities | | | 3,372,146 | | |
| Net Assets | | $ | 156,588,131 | | |
| Composition of Net Assets: | |
| Paid-in capital | | $ | 258,554,673 | | |
| Accumulated net investment loss | | | (5,789 | ) | |
| Accumulated net realized loss | | | (24,081,602 | ) | |
Net unrealized appreciation (depreciation)
on investments | | | (77,879,151 | ) | |
| Net Assets | | $ | 156,588,131 | | |
| Fund Shares Outstanding | | | 11,293,281 | | |
Net asset value, offering price and redemption
price per share | | $ | 13.87 | | |
Statement of Operations
For the Year Ended December 31, 2008
| Investment Income: | |
| Dividends (net of foreign taxes withheld of $16,404) | | $ | 989,168 | | |
| Interest income | | | 194,938 | | |
| Securities lending income | | | 1,051 | | |
| Total Investment Income | | | 1,185,157 | | |
| Expenses: | |
| Investment advisory fee | | | 2,029,141 | | |
| Administration fee | | | 126,821 | | |
| Transfer agent fee | | | 277 | | |
| Trustees' fees | | | 10,319 | | |
| Custody fee | | | 35,394 | | |
| Chief compliance officer expenses (See Note 4) | | | 7,616 | | |
| Other expenses (See Note 5) | | | 110,990 | | |
| Total Expenses | | | 2,320,558 | | |
| Custody earnings credit | | | (328 | ) | |
| Net Expenses | | | 2,320,230 | | |
| Net Investment Loss | | | (1,135,073 | ) | |
Net Realized and Unrealized Gain (Loss) on
Investments and Foreign Currency: | |
| Net realized loss on: | |
| Investments | | | (23,399,095 | ) | |
| Foreign currency transactions | | | (2,142 | ) | |
| Net realized loss | | | (23,401,237 | ) | |
Net change in unrealized appreciation (depreciation)
on investments | | | (129,460,361 | ) | |
| Net Loss | | | (152,861,598 | ) | |
| Net Decrease in Net Assets from Operations | | $ | (153,996,671 | ) | |
See accompanying notes to financial statements.
9
Wanger Select 2008 Annual Report
Statement of Changes in Net Assets
| | | Year Ended December 31, | |
| Increase (Decrease) in Net Assets | | 2008 | | 2007 | |
| Operations: | |
| Net investment loss | | $ | (1,135,073 | ) | | $ | (396,026 | ) | |
| Net realized gain (loss) on investments and foreign currency transactions | | | (23,401,237 | ) | | | 8,594,537 | | |
Net change in unrealized appreciation (depreciation)
on investments and foreign currency translations | | | (129,460,361 | ) | | | 6,555,041 | | |
| Net Increase (Decrease) in Net Assets fom Operations | | | (153,996,671 | ) | | | 14,753,552 | | |
| Distributions to Shareholders: | |
| From net realized gains | | | (8,211,851 | ) | | | (3,866,407 | ) | |
| Share Transactions: | |
| Subscriptions | | | 32,833,563 | | | | 152,805,878 | | |
| Distributions reinvested | | | 8,211,851 | | | | 3,866,407 | | |
| Redemptions | | | (38,628,359 | ) | | | (26,526,225 | ) | |
| Net Increase from Share Transactions | | | 2,417,055 | | | | 130,146,060 | | |
| Total Increase (Decrease) in Net Assets | | | (159,791,467 | ) | | | 141,033,205 | | |
| Net Assets: | |
| Beginning of period | | | 316,379,598 | | | | 175,346,393 | | |
| End of period | | $ | 156,588,131 | | | $ | 316,379,598 | | |
| Accumulated net investment loss at end of period | | $ | (5,789 | ) | | $ | (646,385 | ) | |
See accompanying notes to financial statements.
10
Wanger Select 2008 Annual Report
Financial Highlights
| | | Year Ended December 31, | |
| Selected data for a share outstanding throughout each period | | 2008 | | 2007 | | 2006 | | 2005 | | 2004 | |
| Net Asset Value, Beginning of Period | | $ | 28.08 | | | $ | 26.15 | | | $ | 22.66 | | | $ | 22.11 | | | $ | 18.55 | | |
| Income from Investment Operations: | |
| Net investment loss (a) | | | (0.10 | ) | | | (0.04 | ) | | | (0.05 | ) | | | (0.04 | ) | | | (0.10 | ) | |
Net realized and unrealized gain (loss) on investments and
foreign currency | | | (13.38 | ) | | | 2.47 | | | | 4.38 | | | | 2.12 | | | | 3.68 | | |
| Total from Investment Operations | | | (13.48 | ) | | | 2.43 | | | | 4.33 | | | | 2.08 | | | | 3.58 | | |
| Less Distributions to Shareholders: | |
| From net investment income | | | — | | | | — | | | | (0.09 | ) | | | — | | | | — | | |
| From net realized gains | | | (0.73 | ) | | | (0.50 | ) | | | (0.75 | ) | | | (1.53 | ) | | | (0.02 | ) | |
| Total Distributions to Shareholders | | | (0.73 | ) | | | (0.50 | ) | | | (0.84 | ) | | | (1.53 | ) | | | (0.02 | ) | |
| Net Asset Value, End of Period | | $ | 13.87 | | | $ | 28.08 | | | $ | 26.15 | | | $ | 22.66 | | | $ | 22.11 | | |
| Total Return (b) | | | (49.06 | )% | | | 9.39 | % | | | 19.70 | % | | | 10.49 | %(c) | | | 19.31 | % | |
| Ratios to Average Net Assets/Supplemental Data: | |
| Net expenses (d) | | | 0.91 | % | | | 0.90 | % | | | 0.94 | % | | | 0.96 | % | | | 1.10 | % | |
| Net investment loss (d) | | | (0.45 | )% | | | (0.15 | )% | | | (0.20 | )% | | | (0.20 | )% | | | (0.49 | )% | |
| Waiver | | | — | | | | — | | | | — | | | | 0.02 | % | | | — | | |
| Portfolio turnover rate | | | 36 | % | | | 15 | % | | | 21 | % | | | 26 | % | | | 36 | % | |
| Net assets, end of period (000's) | | $ | 156,588 | | | $ | 316,380 | | | $ | 175,346 | | | $ | 102,674 | | | $ | 82,465 | | |
(a) Net investment loss per share was based upon the average shares outstanding during the period.
(b) Total return at net asset value assuming all distributions reinvested.
(c) Had the investment advisor not waived a portion of expenses, total return would have been reduced.
(d) The benefits derived from custody fees paid indirectly had an impact of less than 0.01%.
See accompanying notes to financial statements.
11
Wanger Select 2008 Annual Report
Notes to Financial Statements
1. Nature of Operations
Wanger Select (the "Fund"), is a series of Wanger Advisors Trust (the "Trust"), an open-end management investment company organized as a Massachusetts business trust. The investment objective of the Fund is to seek long-term capital appreciation. The Fund is available only for allocation to certain life insurance company separate accounts established for the purpose of funding qualified and non-qualified variable annuity contracts and variable life insurance policies and may also be offered directly to certain types of pension plans and retirement arrangements.
2. Significant Accounting Policies
Security valuation
Securities of the Fund are valued at market value or, if a market quotation for a security is not readily available or is deemed not to be reliable because of events or circumstances that have occurred between the market quotation and the time as of which the security is to be valued, the security is valued at its fair value determined in good faith under consistently applied procedures established by the Board of Trustees. A security traded on a securities exchange or in an over-the-counter market in which transaction prices are reported is valued at the last sales price at the time of valuation. A security traded principally on NASDAQ is valued at the NASDAQ official closing price. A security for which there is no reported sale on the valuation date is valued at the latest bid quotation. Short-term investments maturing in 60 days or less are valued at amortized cost, which approximates market value. A security for which a mark et quotation is not readily available and any other assets are valued at its fair value determined in good faith under consistently applied procedures established by the Board of Trustees. The Trust has retained an independent statistical fair value pricing service to assist in the fair valuation process for securities principally traded in a foreign market in order to adjust for possible changes in value that may occur between the close of the foreign market and the time as of which the securities are to be valued. If a security is valued at fair value, that value may be different from the last quoted market price for the security.
On January 1, 2008, the Fund adopted Statement of Financial Accounting Standards No. 157, Fair Value Measurements ("SFAS 157"). Under SFAS 157, various inputs are used in determining the value of the Fund's investments. These inputs are summarized in the three broad levels listed below:
• Level 1—quoted prices in active markets for identical securities
• Level 2—other significant observable inputs (including quoted prices for similar securities, interest rates, prepayment speeds, credit risk and others)
• Level 3—significant unobservable inputs (including management's own assumptions in determining the value of investments)
The inputs or methodologies used for valuing securities are not necessarily an indication of the risk associated with investing in those securities.
Examples of the types of securities in which the Fund would typically invest and how they are classified within this SFAS 157 hierarchy are as follows. Typical level 1 securities include exchange traded domestic equities, mutual funds whose NAVs are published each day and exchange traded foreign equities that are not statistically fair valued. Typical level 2 securities include exchange traded foreign equities that are statistically fair valued and short-term investments valued at amortized cost. Typical level 3 securities include any security fair valued by the Fund's Valuation Committee that relies on significant unobservable inputs.
The following table summarizes the inputs used, as of December 31, 2008, in valuing the Fund's assets:
| Valuation Inputs | | Investments in
Securities | | Other Financial
Instruments | |
| Level 1—Quoted Prices | | $ | 143,477,591 | | | $ | — | | |
| Level 2—Other Significant Observable Inputs | | | 14,163,226 | | | | — | | |
| Level 3—Significant Unobservable Inputs | | | — | | | | — | | |
| Total | | $ | 157,640,817 | | | $ | — | | |
Repurchase agreements
The Fund may engage in repurchase agreement transactions. The Fund, through its custodians, receives delivery of underlying securities collateralizing each repurchase agreement. The counterparty is required to maintain collateral that is at all times at least equal to the repurchase price including interest. In the event of default or bankruptcy by the other party to the agreement, realization and/or retention of the collateral may be subject to legal proceedings.
Foreign currency translations
Values of investments denominated in foreign currencies are converted into U.S. dollars using the spot market rate of exchange at the time of valuation. Purchases and sales of investments and dividend and interest income are translated into U.S. dollars using the spot market rate of exchange prevailing on the respective dates of such transactions. The gain or loss resulting from changes in foreign exchange rates is included with net realized and unrealized gain or loss from investments, as appropriate.
In March 2008, Statement of Financial Accounting Standards No. 161, Disclosures about Derivative Instruments and Hedging Activities—an amendment of FASB Statement No. 133 ("SFAS 161"), was issued. SFAS 161 is effective for fiscal years beginning after November 15, 2008. SFAS 161 requires additional discussion about the reporting entity's derivative instruments and hedging activities, by providing for qualitative disclosures about the objectives and strategies for using derivatives, quantitative data about the fair value of and gains and losses on derivative contracts, and details of credit-risk-related contingent features in their hedged positions. Management is evaluating the impact the application of SFAS 161 will have on the Fund's financial statement disclosures.
Securities lending
The Fund may lend up to one-third of the value of its total assets to certain approved brokers, dealers and other financial institutions to earn additional income. The Fund retained the benefits of owning the securities, including receipt of dividends or interest generated by the security. The Fund also received a fee for the loan. The Fund had the ability to recall the loans at any time and could do so in order to vote proxies or to sell the loaned securities. Each loan was collateralized by cash that exceeded the value of the securities on loan. The market value of the loaned securities was determined at the close of business of the Fund and any additional required collateral is delivered to each Fund on the next business day. The collateral was invested in the Dreyfus Government Cash Management Fund and the income earned was paid to the Fund, net of any fees remitted to Goldman Sachs Agency Lending as the lending agent and bo rrower rebates. Generally, in the event of borrower default, the Fund had the right to use the collateral to offset any losses incurred. In the event the Fund was delayed or prevented from exercising its right to dispose of the collateral, there may be a potential loss to the Fund. Some of these losses may be indemnified by the lending agent. The Fund bore the risk of loss with respect to the investment of collateral.
The Fund began lending securities in the third quarter of 2008. Due to the turmoil in the financial markets, the Fund suspended securities lending activities on September 17, 2008. No new loans were made after that date and
12
Wanger Select 2008 Annual Report
Notes to Financial Statements, continued
notice was given to the Fund's lending agent to recall the securities on loan. Resumption of securities lending may be reconsidered as market conditions improve. The net lending income earned in 2008 by the Fund is included in the Statement of Operations.
Security transactions and investment income
Security transactions are accounted for on the trade date (date the order to buy or sell is executed) and dividend income is recorded on the ex-dividend date, except that certain dividends from foreign securities are recorded as soon as the information is available to the Fund. Interest income is recorded on the accrual basis and includes amortization of discounts on debt obligations when required for federal income tax purposes. Realized gains and losses from security transactions are recorded on an identified cost basis.
Awards, if any, from class action litigation related to securities owned may be recorded as a reduction of cost of those securities. If the applicable securities are no longer owned, the proceeds are recorded as realized gains.
Restricted securities
Restricted securities are securities that may only be resold upon registration under federal securities laws or in transactions exempt from registration. In some cases, the issuer of restricted securities has agreed to register such securities for resale at the issuer's expense either upon demand by the Fund or in connection with another registered offering of the securities. Many restricted securities may be resold in the secondary market in transactions exempt from registration. Such restricted securities may be determined to be liquid under criteria established by the Board of Trustees. The Fund will not incur any registration costs upon such resale.
Use of estimates
The preparation of financial statements in conformity with accounting principles generally accepted in the United States of America ("GAAP") requires management to make estimates and assumptions that affect the amounts reported in the financial statements and accompanying notes. Actual results may differ from those estimates.
Fund share valuation
Fund shares are sold and redeemed on a continuing basis at net asset value. Net asset value per share is determined daily as of the close of trading on the New York Stock Exchange ("the Exchange") on each day the Exchange is open for trading by dividing the total value of the Fund's investments and other assets, less liabilities, by the number of Fund shares outstanding.
Custody fees/credits
Custody fees are reduced based on the Fund's cash balances maintained with the custodian. The amount is disclosed as a reduction of total expenses in the Statement of Operations.
Federal income taxes
The Fund has complied with the provisions of the Internal Revenue Code available to regulated investment companies and, in the manner provided therein, distributes all its taxable income, as well as any net realized gain on sales of investments and foreign currency transactions reportable for federal income tax purposes. Accordingly, the Fund paid no federal income taxes and no federal income tax provision was required.
Expenses
General expenses of the Trust are allocated to the Fund and the other series of the Trust based upon relative net assets or other expense allocation methodologies determined by the nature of the expense. Expenses directly attributable to the Fund are charged to the Fund.
Foreign capital gains taxes
Gains in certain countries may be subject to foreign taxes at the fund level, at rates ranging from 10%-15%. The Fund accrues for such foreign taxes on net realized and unrealized gains at the appropriate rate for each jurisdiction.
Distributions to shareholders
Distributions to shareholders are recorded on the ex-dividend date.
Indemnification
In the normal course of business, the Trust on behalf of the Fund enters into contracts that contain a variety of representations and warranties and that provide general indemnities. The Fund's maximum exposure under these arrangements is unknown, as this would involve future claims against the Fund. Also under the Trust's organizational documents, the trustees and officers of the Trust are indemnified against certain liabilities that may arise out of their duties to the Trust. However based on experience, the Fund expects the risk of loss due to these warranties and indemnities to be minimal.
3. Federal Tax Information
The timing and character of income and capital gain distributions are determined in accordance with income tax regulations, which may differ from GAAP. Reclassifications are made to the Fund's capital accounts for permanent tax differences to reflect income and gains available for distribution (or available capital loss carryforwards) under income tax regulations.
For the year ended December 31, 2008, permanent book and tax basis differences resulting primarily from differing treatments for net operating losses, foreign currency transactions and passive foreign investment companies ("PFIC") adjustments were identified and reclassified among the components of the Fund's net assets as follows:
Accumulated
Net Investment
Loss | | Accumulated
Net Realized Loss | | Paid-In Capital | |
| $ | 1,775,669 | | | $ | (617,264 | ) | | $ | (1,158,405 | ) | |
Net investment income and net realized gains/(losses), as disclosed on the Statement of Operations, and net assets were not affected by this reclassification.
The tax character of distributions paid during the years ended December 31, 2008 and December 31, 2007 were as follows:
| | | December 31, 2008 | | December 31, 2007 | |
| Distributions paid from: | |
| Ordinary Income* | | $ | 1,686,639 | | | $ | 1,343,353 | | |
| Long-Term Capital Gains | | | 6,525,212 | | | | 2,523,054 | | |
* For tax purposes short-term capital gain distributions, if any, are considered ordinary income distributions.
13
Wanger Select 2008 Annual Report
Notes to Financial Statements, continued
As of December 31, 2008, the components of distributable earnings on a tax basis were as follows:
Undistributed
Ordinary
Income | | Undistributed
Long-term
Capital Gains | | Net
Unrealized
Depreciation* | |
| $ | — | | | $ | — | | | $ | (80,039,973 | ) | |
* The differences between book-basis and tax-basis net unrealized appreciation/depreciation are primarily due to deferral of losses from wash sales, changes in the value of assets and liabilities resulting from changes in exchange rates, PFIC adjustments and the realization for tax-purposes of unrealized gains on certain forward foreign currency contracts
The following capital loss carryforwards, determined as of December 31, 2008, may be available to reduce taxable income arising from future net realized gains on investments, if any, to the extent permitted by the Internal Revenue Code:
Year of
Expiration | | Capital Loss
Carryforward | |
| | 2016 | | | $ | 6,605,628 | | |
Under current tax rules, certain currency and capital losses realized after October 31 may be deferred and treated as occurring on the first day of the following fiscal year. As of December 31, 2008, post-October capital losses of $15,315,153 attributed to security transactions were deferred to January 1, 2009.
Under Financial Accounting Standards Board ("FASB") Interpretation No. 48, Accounting for Uncertainty in Income Taxes—an Interpretation of FASB Statement No. 109 ("FIN 48") management determines whether a tax position of the Fund is more likely than not to be sustained upon examination by the applicable taxing authority, including resolution of any related appeals or litigation processes, based on the technical merits of the position. The tax benefit to be recognized is measured as the largest amount of benefit that is greater than fifty percent likely of being realized upon ultimate settlement. Management has evaluated the known implications of FIN 48 on its computation of net assets for the Fund. As a result of this evaluation, management believes that FIN 48 does not have any effect on the Fund's financial statements. However, management's conclusions regarding FIN 48 may be subject to review and adjustment at a later date based on factors including, but not limited to, further implementation guidance from the FASB, new tax laws, regulations, and administrative interpretations (including relevant court decisions). The Fund's federal tax returns for the prior three fiscal years remain subject to examination by the Internal Revenue Service. The Fund is not aware of any tax positions for which it is reasonably possible that the total amounts of unrecognized tax benefits will significantly change in the next twelve months.
4. Transactions With Affiliates
Columbia Wanger Asset Management, L.P. ("CWAM") is a wholly owned subsidiary of Columbia Management Group, LLC, ("Columbia Management") which in turn is an indirect wholly owned subsidiary of Bank of America Corporation ("BOA"). CWAM furnishes continuing investment supervision to the Fund and is responsible for the overall management of the Fund's business affairs.
Under the Fund's investment advisory agreement, management fees are accrued daily based on the Fund's average daily net assets and paid monthly to CWAM at the annual rates shown in the table below:
| Average Daily Net Assets | | Annual Fee Rate | |
| Up to $500 million | | | 0.80 | % | |
| $500 million and over | | | 0.78 | % | |
For the year ended December 31, 2008, the Fund's effective investment advisory fee rate was 0.80% of average daily net assets.
Through April 30, 2009, CWAM will reimburse the Fund to the extent that ordinary operating expenses (exclusive of brokerage commissions, interest, taxes and extraordinary expenses, but inclusive of custodial charges relating to overdrafts, if any), after giving effect to any balance credits from the Fund's custodian, exceed an annual percentage of 1.35% of average daily net assets. There was no reimbursement for the year ended December 31, 2008.
CWAM provides administrative services and receives an administration fee from the Fund. Effective August 1, 2008, CWAM provides administrative services and receives an administration fee from the Fund at the following annual rates:
Wanger Advisors Trust Aggregate
Average Daily Net Assets of the Trust | | Annual Fee Rate | |
| Up to $4 billion | | | 0.05 | % | |
| $4 billion to $6 billion | | | 0.04 | % | |
| $6 billion to $8 billion | | | 0.03 | % | |
| $8 billion and over | | | 0.02 | % | |
Prior to August 1, 2008, administration fees were accrued daily and paid monthly to CWAM at the annual rate of 0.05%.
For the year ended December 31, 2008, the Fund's effective administration fee rate was 0.05% of average daily net assets. CWAM has delegated to Columbia Management Advisors, LLC ("Columbia"), an indirect, wholly owned subsidiary of BOA, the responsibility for certain administrative services.
Certain officers and trustees of the Trust are also officers of CWAM. The Trust makes no direct payments to its officers and trustees who are affiliated with CWAM.
The Board of Trustees appointed a Chief Compliance Officer to the Trust in accordance with federal securities regulations. The Fund, along with other affiliated funds, pays its pro-rata share of the expenses associated with the Office of the Chief Compliance Officer. These expenses are disclosed separately as "Chief compliance officer expenses" in the Statement of Operations.
The Trust offers a deferred compensation plan for its independent trustees. Under that plan, a trustee may elect to defer all or a portion of his or her compensation. Amounts deferred are retained by the Trust and represent an unfunded obligation of the Trust. The value of amounts deferred is determined by reference to the change in value of Class Z shares of one or more series of Columbia Acorn Trust or a money market fund as specified by the trustee. Benefits under the deferred compensation plan are payable when the trustee ceases to be a member of the Board of Trustees.
Columbia Management Distributors, Inc. (the "Distributor"), an affiliate of Columbia and an indirect wholly owned subsidiary of BOA, serves as the principal underwriter of the Trust and receives no compensation from the Fund for its services.
Columbia Management Services, Inc. (the "Transfer Agent"), an affiliate of Columbia and an indirect wholly owned subsidiary of BOA, provides
14
Wanger Select 2008 Annual Report
Notes to Financial Statements, continued
shareholder services to the Fund and has subcontracted with Boston Financial Data Services ("BFDS") to serve as subtransfer agent. For such services, the Transfer Agent receives a fee, paid monthly, at the annual rate of $21.00 per open account. . The Transfer Agent also receives reimbursement for certain out-of-pocket expenses.
During the year ended December 31, 2008, the Fund engaged in purchase and sales transactions with funds that have a common investment advisor (or affiliated investment advisors), common directors/trustees, and/or common officers. Those purchase and sale transactions complied with provisions of Rule 17a-7 under the Investment Company Act of 1940 and were $1,353,719 and $0, respectively.
5. Borrowing Arrangements
The Trust participates in a $150 million credit facility, which was entered into to facilitate portfolio liquidity. Interest is charged to each participating fund based on its borrowings at a rate per annum equal to the Federal Funds rate plus 0.50%. In addition, a commitment fee of 0.08% per annum of the unutilized line of credit is accrued and apportioned among the participating funds based on their relative net assets. The commitment fee is included in "Other expenses" in the Statement of Operations. No amounts were borrowed by the Fund under this facility during the year ended December 31, 2008. The Trust enters into this line of credit for one year durations. The Trust has already secured the line of credit for the entire year of 2009.
6. Fund Share Transactions
Proceeds and payments on Fund shares as shown in the Statement of Changes in Net Assets are in respect of the following numbers of shares:
| | | Year ended
December 31, 2008 | | Year ended
December 31, 2007 | |
| Shares sold | | | 1,464,413 | | | | 5,354,321 | | |
Shares issued in reinvestment
of dividend distributions | | | 349,441 | | | | 145,354 | | |
| Less shares redeemed | | | (1,788,324 | ) | | | (937,722 | ) | |
| Net increase in shares outstanding | | | 25,530 | | | | 4,561,953 | | |
7. Investment Transactions
The aggregate cost of purchases and proceeds from sales other than short-term obligations for the year ended December 31, 2008 were $89,093,773 and $91,244,988, respectively.
8. Legal Proceedings
CWAM, Columbia Acorn Trust (another mutual fund family advised by CWAM), and the trustees of Colombia Acorn Trust (collectively, the "Columbia defendants") are named as defendants in class and derivative complaints that have been consolidated in a Multi-District Action (the "MDL Action") in the federal district court of Maryland. These lawsuits contend that defendants permitted certain investors to market time their trades in certain Columbia Acorn Funds. The MDL Action is ongoing. However, all claims against the Trust and the independent trustees of Columbia Acorn Trust have been dismissed.
Columbia Acorn Trust and CWAM are also defendants in a class action lawsuit that alleges, in summary, that Columbia Acorn Trust and CWAM exposed shareholders of Columbia Acorn International Fund to trading by market timers by allegedly: (a) failing to properly evaluate daily whether a significant event affecting the value of the fund's securities had occurred after foreign markets had closed but before the calculation of the funds' net asset value ("NAV"); (b) failing to implement the fund's portfolio valuation and share pricing policies and procedures; and (c) failing to know and implement applicable rules and regulations concerning the calculation of NAV (the "Fair Valuation Lawsuit"). The Seventh Circuit ruled that the plaintiffs' state law claims were preempted under federal law resulting in the dismissal of plaintiffs' complaint. Plaintiffs appealed the Seventh Circuit's ruling to the United States Supreme Court. The Suprem e Court reversed the Seventh Circuit's ruling on jurisdictional grounds and the case was ultimately remanded to the state court.
On March 21, 2005, a class action complaint was filed against the Trust and CWAM seeking to rescind the CDSC assessed upon redemption of Class B shares of the Columbia Acorn Funds due to the alleged market timing of the Columbia Acorn Funds (the "CDSC Lawsuit"). In addition to the rescission of sales charges, plaintiffs seek recovery of actual damages, attorneys' fees and costs. The case has been transferred to the MDL Action in the federal district court of Maryland.
On September 14, 2007, the plaintiffs and the Columbia defendants named in the MDL Action, including the Columbia Funds, entered into a stipulation of settlement with respect to all Columbia-related claims in the MDL Action described above, including the CDSC and Fair Valuation Lawsuits. The settlement is subject to court approval.
Columbia Acorn Trust and CWAM intend to defend these suits vigorously. CWAM believes that the lawsuits are not likely to materially affect its ability to provide investment management services to the Fund.
15
Wanger Select 2008 Annual Report
Report of Independent Registered Public Accounting Firm
To the Board of Trustees and Shareholders of Wanger Select,
In our opinion, the accompanying statement of assets and liabilities, including the statement of investments, and the related statements of operations and of changes in net assets and the financial highlights present fairly, in all material respects, the financial position of Wanger Select (a series of the Wanger Advisors Trust, hereinafter referred to as the "Fund") at December 31, 2008, the results of its operations for the year then ended, the changes in its net assets for each of the two years in the period then ended and the financial highlights for each of the five years in the period then ended, in conformity with accounting principles generally accepted in the United States of America. These financial statements and financial highlights (hereafter referred to as "financial statements") are the responsibility of the Fund's management; our responsibility is to express an opinion on these financial statements based on our a udits. We conducted our audits of these financial statements in accordance with the standards of the Public Company Accounting Oversight Board (United States). Those standards require that we plan and perform the audit to obtain reasonable assurance about whether the financial statements are free of material misstatement. An audit includes examining, on a test basis, evidence supporting the amounts and disclosures in the financial statements, assessing the accounting principles used and significant estimates made by management, and evaluating the overall financial statement presentation. We believe that our audits, which included confirmation of securities at December 31, 2008 by correspondence with the custodian and brokers, provide a reasonable basis for our opinion.
PricewaterhouseCoopers LLP
Chicago, Illinois
February 16, 2009
16
Wanger Select 2008 Annual Report
Federal Income Tax Information (Unaudited)
44.38% of the ordinary income distributed by the Fund, for the year ended December 31, 2008 qualified for the corporate dividends received deduction.
17
Wanger Select 2008 Annual Report
Excerpt from:
Wanger Advisors Trust
Management Fee Evaluation of the Senior Officer
Prepared Pursuant to the New York Attorney General's
Assurance of Discontinuance
May 2008
18
Wanger Select 2008 Annual Report
Introduction
The New York Attorney General's Assurance of Discontinuance ("Order") entered into by Columbia Management Advisors, Inc. ("CMAI") and Columbia Management Distributors, Inc., ("CMDI" and collectively with "CMAI," "CMG") in February 2005, allows CMAI to manage or advise a mutual fund only if the trustees of the fund appoint a "Senior Officer" to perform specified duties and responsibilities. One of these responsibilities includes "managing the process by which proposed management fees (including but not limited to, advisory fees) to be charged the [Funds] are negotiated so that they are negotiated in a manner which is at arms' length and reasonable and consistent with this Assurance of Discontinuance."
This is the second year that the Columbia Acorn Trust and Wanger Advisors Trust (collectively, the "Trusts") and each series thereof (the "Acorn funds," "WAT funds" or collectively, the "Funds") have been overseen by the same Board of Trustees ("Board"). The Order provides that this Board must determine the reasonableness of proposed "management fees" by using either an annual competitive bidding process supervised by the Senior Officer or Independent Fee Consultant, or by obtaining "an annual independent written evaluation prepared by or under the direction of the Senior Officer or the Independent Fee Consultant."
"Management fees" are only part of the costs and expenses paid by mutual fund shareholders. Fund expenses can vary depending upon the class of shares held but usually include: (1) investment management or advisory fees to compensate analysts and portfolio managers for stock research and portfolio management, as well as the cost of operating a trading desk; (2) administrative expenses incurred to prepare registration statements and tax returns, calculate the Funds' net asset values, maintain effective compliance procedures and perform recordkeeping services; (3) transfer agency costs for establishing accounts, accepting and disbursing funds, as well as overseeing trading in Fund shares; (4) custodial expenses incurred to hold the securities purchased by the Funds; and (5) distribution expenses, including commissions paid to brokers that sell the Fund shares to investors.
Columbia Wanger Asset Management, L.P. ("CWAM"), the advisor to the Funds, has proposed that the Trusts continue the existing separate agreements governing the first two categories listed above: an advisory agreement governing portfolio management, and an administration agreement governing certain administration and clerical services. Together the fees paid under these two agreements are referred to as "management fees." Other fund expenses are governed by separate agreements, in particular agreements with two CWAM affiliates: CMDI, the broker-dealer that underwrites and distributes the Funds' shares, and Columbia Management Services, Inc. ("CMSI"), the Funds' transfer agent. In conformity with the terms of the Order, this evaluation, therefore, addresses only the advisory and administrative contracts, and does not extend to the other agreements.
According to the Order, the Senior Officer's evaluation must consider at least the following:
(1) Management fees (including components thereof) charged to institutional and other clients of CWAM for like services;
(2) Management fees (including any components thereof) charged by other mutual fund companies for like services;
(3) Costs to CWAM and its affiliates of supplying services pursuant to the management fee agreements, excluding any intra-corporate profit;
(4) Profit margins of CWAM and its affiliates from supplying such services;
(5) Possible economies of scale as the Funds grow larger; and
(6) The nature and quality of CWAM's services, including the performance of each Fund.
In 2004, the Boards of the two Trusts, then separate groups, each appointed me Senior Officer under the Order. They also determined not to pursue a competitive bidding process and instead, charged me with the responsibility of evaluating the Funds' proposed advisory and administrative fee contracts with CWAM in conformity with the requirements of the Order. This Report is an annual evaluation required under the Order. In discharging their responsibilities, the independent Trustees have also consulted independent, outside counsel.
2007 Evaluation
This is the third annual evaluation prepared in connection with the Order. This evaluation follows the same structure as the earlier studies. Some areas are given more emphasis here, while others are given less. Still, the fundamental information gathered for this evaluation is largely the same as past years. Last year's evaluation is referred to here as the "2007 Study."
Process and Independence
The objectives of the Order are to insure the independent evaluation of the management fees paid by the Funds as well as to insure that all relevant factors are considered. In my view, this contract renewal process has been conducted at arms-length and with independence in gathering, considering and evaluating all relevant data. At the outset of the process, the Trustees sought and obtained from CWAM and CMG a comprehensive compilation of data regarding Fund performance and expenses, advisor profitability, and other information. The Board evaluated this information thoroughly. Performance and expense data was obtained from both Morningstar and Lipper, the leading consultants in this area. The rankings prepared by Morningstar and Lipper were independent and not influenced by the advisor.
In the course of its work, the Contract Committee gave careful consideration to the conclusions and recommendations contained in the 2007 Study. The Contract Committee gave particular emphasis to the issue of whether economies of scale were appropriately reflected in the Funds' fee schedules. The Board accepted and implemented several of the recommendations in this area contained in the 2007 Study.
19
Wanger Select 2008 Annual Report
My evaluation of the advisory contract was shaped, as it was last year, by my experience as Chief Compliance Officer of the Trusts ("CCO"). As CCO, I report solely to the Board and have no reporting obligation to, or employment relationship with, CMG or its affiliates, except for administrative purposes. I have commented on compliance matters in evaluating the quality of service provided by CWAM.
This Report, its supporting materials and the data contained in other materials submitted to the Contract Committee of the Board, in my view, provide a thorough factual basis upon which the Board, in consultation with independent counsel as it deems appropriate, may conduct management fee negotiations that are in the best interests of the Funds' shareholders.
The Fee Reductions Mandated under the Order
Under the terms of the Order, CMG agreed to secure certain management fee reductions for the mutual funds advised by its affiliate investment advisors. In some instances, breakpoints were also established. Although neither CWAM nor the Trusts was a party to the Order, CWAM offered and the Board accepted certain advisory fee reductions during 2005. By the terms of the Order, these fees may not be increased before November 30, 2009. I have used these advisory fee levels, as modified thereafter, in this evaluation because they are the fees in the current agreements that CWAM proposes should be continued. Hence, these fee levels are the starting point of an evaluation.
Conclusions
My review of the data and other material above leads to the following conclusions with respect to the factors identified in the Order.
1. Performance. The domestic WAT Funds generally have achieved good to outstanding performance over the past five years. Wanger Select has, however, suffered a precipitous decline in ranking relative to its peers for the past year, and this trend merits the Trustees' continued attention. The international WAT Funds have relatively weaker relative long term records than do the domestic funds. All the WAT Funds, however, outperform their benchmarks, expose shareholders to less risk than competitors and achieve positive "alpha," a recognized measure of the added value of an investment manager.
2. Management Fees relative to Peers. Management fees vary by WAT Fund, but, in general, the WAT Funds impose higher fees than competing funds. Wanger Select and Wanger USA in particular were ranked by both Lipper and Morningstar at or below the median, and therefore impose higher fees than do the majority of their competitors.
3. Administrative Fees. The WAT Funds' administrative fees appear competitive in relation to their peers, and CWAM provides excellent administrative support for all the WAT Funds. There are clear advantages to retaining the advisor and its affiliates to perform these services. However, while economies of scale exist above current asset levels, the WAT Funds' administrative fee schedule provides no breakpoints.
4. Management Fees relative to Institutional and Other Mutual Fund Accounts. CWAM's focus is on its mutual funds. It does not actively seek to manage separate or institutional accounts. The few institutional accounts it does manage vary in rate structures. Some pay advisory fees commensurate with or higher than the WAT Funds. In a few instances, however, institutional accounts pay lower advisory fees than do the WAT Funds. One particular institutional account is significant in size and has been under CWAM's management for over 25 years.
5. Costs to CWAM and its Affiliates. CWAM's direct costs do not appear excessive. Overhead and indirect costs allocated to CWAM by its parent organizations, however, are significant and have increased dramatically in the past year. CWAM's affiliates report operating losses and therefore do not appear to enjoy excessive "fall out" benefits from CWAM's advisory agreement with the WAT Funds.
6. Profit Margins. CWAM's pre-marketing expense profit margins are at the top of the industry, though these comparisons are hampered by limited industry data. High profit margins are not unexpected for firms that manage large, successful funds and have provided outstanding investment performance for investors.
7. Economies of Scale. Economies of scale do exist at CWAM and will expand as the assets of the WAT Funds get larger. The Board has recently imposed additional breakpoints for some of the WAT Funds that will result in greater sharing of economies of scale.
8. Nature and Quality of Services. This category includes a variety of considerations that are difficult to quantify, yet can have a significant bearing on the performance of the Funds. Several areas merit comment.
a. Capacity. The WAT Funds have continued to grow, posing ever greater challenges in deploying assets effectively. While trends here merit continued monitoring, CWAM appears to be managing assets effectively.
b. Compliance. CWAM has a reasonably designed compliance program that protects shareholders.
9. Process. In my opinion, the process of negotiating an advisory contract for the WAT Funds has been conducted thoroughly and at arms' length. Further, the Trustees have sufficient information to evaluate management's proposal, and negotiate contract terms that are in the best interests of Fund shareholders.
20
Wanger Select 2008 Annual Report
Recommendations
I believe the Trustees should:
1. Consider the addition of breakpoints to the WAT administrative fee contract to reflect the economies of scale present in performing these services, and, in fashioning those breakpoints, to consider the efficiencies achieved by CWAM by supporting both Trusts with the same staff performing largely identical tasks.
2. Focus their review on the WAT Funds' management fee levels in relation to their peers, in particular the fees paid by Wanger USA and Wanger Select.
3. Monitor Wanger Select to ensure that its long term performance is sustained.
Robert P. Scales
May 27, 2008
21
Wanger Select 2008 Annual Report
Board Approval of the Advisory Agreement
Wanger Advisors Trust (the "Trust") has an investment advisory agreement (the "Advisory Agreement") with Columbia Wanger Asset Management, L.P. ("CWAM") under which CWAM manages the Columbia Wanger Family of Funds (the "Funds"). The trustees of the Trust, more than seventy five percent of whom have never been affiliated with CWAM (the "Independent Trustees"), oversee the management of each Fund and, as required by law, determine at least annually whether to continue the Advisory Agreement for each Fund.
The Contract Committee of the board of trustees (the "Committee"), which is comprised of six Independent Trustees, makes recommendations to the board regarding any proposed continuation of the Advisory Agreement. After the Committee has made its recommendations, the full board of trustees determines whether to approve continuation of the Advisory Agreement. The board also considers matters bearing on the Advisory Agreement at its various meetings throughout the year, and meets at least quarterly with CWAM's portfolio managers.
In connection with their most recent consideration of the Advisory Agreement for each Fund, the Committee and all trustees received and reviewed a substantial amount of information provided by CWAM in response to requests from the Independent Trustees and their independent legal counsel. As they considered the Advisory Agreement, the Independent Trustees were advised by independent legal counsel. At each meeting where the Committee or the Independent Trustees considered the Advisory Agreement, they met with management and also met in separate executive session with their independent legal counsel.
The materials reviewed by the Committee and the trustees included, among other items, (i) information on the investment performance of each Fund and its peer groups and performance benchmarks, (ii) information on each Fund's advisory fees and other expenses, including information comparing the Fund's fees and expenses to those of peer groups of funds and information about any applicable expense limitations and fee "breakpoints," (iii) data on sales and redemptions of Fund shares and (iv) information on the profitability to CWAM, as well as potential "fall-out" or ancillary benefits that CWAM and its affiliates may receive as a result of their relationships with the Funds. The trustees also considered other information such as (i) CWAM's financial condition, (ii) each Fund's investment objective and strategies, (iii) the size, education and experience of CWAM's investment staff and its use of technology, external research and tra ding cost measurement tools, (iv) the allocation of the Funds' brokerage, if any, including allocations to brokers affiliated with CWAM, and the use of "soft" commission dollars to pay for research products and services, (v) the resources devoted to, and the record of compliance with, the Funds' investment policies and restrictions, policies on personal securities transactions and other compliance policies and (vi) the economic outlook generally and for the mutual fund industry in particular. In addition, the trustees conferred with, and reviewed the Management Fee Evaluation (the "Fee Evaluation") prepared by the Trust's chief compliance officer, who also serves as the Trust's "Senior Officer," as contemplated by the Assurance of Discontinuance dated February 9, 2005 among affiliates of CWAM and the Office of the New York Attorney General. A summary of the Fee Evaluation is included in this report. Throughout the annual contract renewal process, the trustees had the opportunity to ask questions of and reque st additional materials from CWAM.
The Committee held meetings in May and June 2008 and reported its recommendations to the full board of trustees. On June 11, 2008, the board of trustees unanimously approved continuation through July 31, 2009 of (i) the Advisory Agreement and (ii) the Trust's administrative services agreement with CWAM (the "Administration Agreement"), as amended to reflect the recommendation of the Committee that, effective August 1, 2008, the Trust shall pay CWAM for its services under the agreement a fee accrued daily and paid monthly at the following annual rates, as a percentage of the Trust's aggregate average daily net assets: 0.05% on the first $4 billion; 0.04% on $4 - 6 billion; 0.03% on $6 - 8 billion; and 0.02% on assets over $8 billion.
In considering the continuation of the Advisory Agreement and the continuation of the amended Administration Agreement, the trustees reviewed and analyzed various factors that they determined were relevant, including the factors described below, none of which by itself was considered dispositive. However, the material factors and conclusions that formed the basis for the trustees' determination to approve the continuation of the Advisory Agreement and the amended Administration Agreement are discussed separately below.
Nature, quality and extent of services. The trustees reviewed the nature, quality and extent of the services of CWAM and its affiliates to the Funds, taking into account the investment objective and strategy of each Fund and knowledge gained from meetings with management, which were held on at least a quarterly basis. In addition, the trustees reviewed the available resources and key personnel of CWAM and its affiliates, especially those providing investment management services to the Funds. The trustees also considered other services provided to the Funds by CWAM and its affiliates, including: managing the execution of portfolio transactions and selecting broker-dealers for those transactions; monitoring adherence to the Funds' investment restrictions; producing shareholder reports; providing support services for the board of trustees and committees of the board; communicating with shareholders; serving as the Funds' administrator; and overseeing the activities of the Funds' other service providers, including monitoring for compliance with various policies and procedures as well as applicable securities laws and regulations.
The trustees concluded that the nature, quality and extent of the services provided by CWAM and its affiliates to each Fund were appropriate and consistent with the terms of the Advisory Agreement and the Administration Agreement, and that the quality of those services had been consistent with or superior to quality norms in the industry. The trustees further concluded that the Funds were likely to benefit from the continued provision of those services by CWAM to the Funds. They also concluded that CWAM currently had sufficient personnel, with appropriate education and experience, to serve the Funds effectively, and had demonstrated its continuing ability to attract and retain well qualified personnel.
Performance of the Funds. At various meetings of the board of trustees, the Committee and the investment performance committee of the board, the trustees considered the short-term and longer-term performance of each Fund. They reviewed information comparing each Fund's performance with that of its benchmark(s) and with the performance of comparable funds and peer groups as identified by Lipper Inc. ("Lipper") and Morningstar, Inc. ("Morningstar"). On the domestic side, the trustees discussed how Wanger USA had exceeded its peer category average and beat its primary benchmark for the five year period, according to Morningstar, noting that Lipper's rankings of Wanger USA was somewhat lower than Morningstar's. Wanger Select had a particularly difficult performance year during 2007, which the trustees acknowledged. The trustees also reviewed the performan ce of the international Funds, discussing how both Wanger International and Wanger International Select continued to outperform their benchmarks over the five year period, but not the majority of their peer groups established by Lipper and Morningstar. During the annual contract renewal process, the trustees concluded that, although past performance is not necessarily indicative of future results, the Funds' strong overall longer-term performance record was an important factor in the their evaluation of the quality of services provided by CWAM under the Advisory Agreement.
Costs of Services and Profits Realized by CWAM. At various Committee and board of trustees meetings and other informal meetings, the trustees examined detailed information on the fees and expenses of each Fund in comparison to information for other comparable funds provided by Lipper and Morningstar. As noted in the Fee Evaluation, the contractual rates of investment advisory fees and the actual advisory fees paid by Wanger Select and Wanger USA were higher than the median advisory fee rates of their
22
Wanger Select 2008 Annual Report
respective peer groups. The trustees also considered the advisory fees of the Funds relative to those of the series of Columbia Acorn Trust ("Acorn"), a group of funds with similar investment strategies also overseen by the trustees and managed by CWAM. The trustees noted that the Funds' advisory fees were comparable to those of the Acorn funds.
The trustees reviewed the analysis of the profitability of CWAM in serving as each Fund's investment advisor and of CWAM and its affiliates in their relationships with each Fund, as well as an explanation of the methodology utilized in allocating various expenses among the Funds and other business units, each of which was included in the Fee Evaluation. The trustees considered the methodology used by CWAM in determining compensation payable to portfolio managers and the competitive market for investment management talent. They discussed how profitability comparisons among fund managers are not very meaningful due to the small number of publicly owned managers, and how the profitability of any investment manager is affected by numerous factors, including its particular organizational structure, the types of funds and other accounts managed, other lines of business, expense allocation methodology, capital structure and cost of cap ital.
The trustees also reviewed the advisory fees charged by CWAM for managing other investment companies, sub-advised funds and other institutional separate accounts, as detailed in the Fee Evaluation. CWAM's institutional separate account fees for various investment strategies were examined and in some cases those fees were higher than the advisory fees charged to the Funds, and in some instances the Funds' fees were higher. The trustees noted that CWAM performs significant additional services for the Funds that it does not provide to sub-advised funds or non-mutual fund clients, including administrative services, oversight of the Funds' other service providers, trustee support, regulatory compliance and numerous other services, and that, in servicing the Funds, CWAM assumes many legal risks that it does not assume in servicing many of its other clients. Finally, as part of the annual contract renewal process, the trustees consider ed CWAM's financial condition.
In connection with their consideration of the Administration Agreement, and as recommended by the Committee and the Trust's Senior Officer, the Independent Trustees negotiated breakpoints in the fee schedule for administrative services that will reduce the fee for those services if the aggregate net assets of the Funds exceed $4 billion.
The trustees concluded that the rates of advisory fees and other compensation payable by the Funds to CWAM and its affiliates were reasonable in relation to the nature and quality of the services to be provided, taking into account the fees charged by other advisors for managing comparable mutual funds with similar strategies and the fees CWAM charges to other clients. The trustees also concluded that the Funds' estimated overall expense ratios were reasonable, considering the quality of services provided by CWAM and its affiliates and the investment performance of the Funds.
Economies of Scale. At various meetings throughout the annual contract renewal process, the trustees considered information about the extent to which CWAM realizes economies of scale in connection with the increase of Fund assets. The trustees noted that the advisory fee schedule for each Fund includes breakpoints in the rate of fees at various asset levels. The trustees discussed extensively the appropriateness of the recommendation of the Committee regarding the addition of further breakpoints to the fee schedule under the Administration Agreement. They noted that the Funds also share directly in economies of scale through lower charges by third party service providers based on the combined scale of all of the Funds. The trustees concluded that the current fee structure of each Fund, with the administration fee schedule changes recommended by the Co ntract Committee, was reasonable and reflective of a sharing between CWAM and the Funds of economies of scale.
Other Benefits to CWAM. The trustees also reviewed benefits that accrue to CWAM and its affiliates from their relationships with the Funds, as outlined in the Fee Evaluation. They noted that the Funds' transfer agent and distributor were each affiliates of CWAM and that the transfer agent received compensation from the Funds for services provided. The trustees considered ways, other than the services provided by CWAM and its affiliates pursuant to various agreements and the fees to be paid by each Fund therefor, that the Funds and CWAM may potentially benefit from their relationship with each other. At various Committee meetings, the trustees considered CWAM's use of commissions paid by each Fund on its portfolio brokerage transactions to obtain research products and services benefiting the Fund and/or other clients of CWAM, and determined that CWAM's use of the Funds' "soft" commission dollars to obtain research products and services was consistent with regulatory requirements and guidance then in effect. They also concluded that CWAM benefits from the receipt of proprietary research products and services acquired through commissions paid on portfolio transactions of the Funds, and that the Funds benefit from CWAM's receipt of those products and services as well as research products and services acquired through commissions paid by other clients of CWAM. The trustees further determined that the success of any Fund could attract other business to CWAM or the Funds and that the success of CWAM could enhance its ability to serve the Funds.
After full consideration of the above factors, as well as other factors that were considered relevant in evaluating the Advisory Agreement, the trustees, including the Independent Trustees, concluded that the continuation of the Advisory Agreement and continuation of the Administration Agreement (as amended to reflect the new administration fee schedule), was in the best interest of each Fund. On June 11, 2008, the trustees approved continuation of the Advisory Agreement and the Administration Agreement, as so amended, through July 31, 2009.
23
Wanger Select 2008 Annual Report
Board of Trustees and Management of Wanger Advisors Trust
The Board of Trustees of the Trust has overall management responsibility for the Trust and the Funds. Each trustee may serve a term of unlimited duration until the end of the calendar year in which the trustee attains the age of 75 years. The trustees appoint their own successors, provided that at least two-thirds of the trustees, after such appointment, have been elected by shareholders. Shareholders may remove a trustee, with or without cause, upon the vote of two-thirds of the Trust's outstanding shares at any meeting called for that purpose. A trustee may be removed, with or without cause, upon the vote of a majority of the trustees.
The names of the trustees and officers of the Trust, the date each was first elected or appointed to office, their principal business occupations during at least the last five years, and other directorships they hold are shown below. Each trustee serves in such capacity for each of the four series of the Trust and each of the six series of Columbia Acorn Trust.
The business address of each trustee and officer of the Trust is Columbia Wanger Asset Management, L.P., 227 West Monroe, Suite 3000, Chicago, Illinois 60606. The Fund's Statement of Additional Information includes additional information about the Fund's trustees and officers. You may obtain a free copy of the Statement of Additional Information by writing or calling toll-free:
Columbia Wanger Asset Management, L.P.
Shareholder Services Group
227 W. Monroe, Suite 3000
Chicago, IL 60606
888-4-WANGER (888-492-6437)
Name, Position(s) with
Wanger Advisors
Trust and Age at
December 31, 2008 | | Year First
Elected or
Appointed
to Office | | Principal Occupation(s) during
Past Five Years | | Number of
Portfolios in
Fund Complex
Overseen
by Trustee/Officer | | Other
Directorships
in addition
to Wanger
Advisors Trust | |
| Trustees who are not interested persons of Wanger Advisors Trust: | |
|
Laura M. Born, 43,
Trustee | | | 2007 | | | Adjunct Assistant Professor of Finance, University of Chicago Booth School of Business; formerly, Managing Director—Investment Banking, J.P. Morgan Chase & Co. (broker/ dealer) 1991-2007. | | | 10 | | | Columbia Acorn Trust. | |
|
Michelle L. Collins, 48,
Trustee | | | 2008 | | | President, Cambium LLC, since 2007; Advisory Board Member, Svoboda Capital Partners LLC, since 2007; Managing Director Svoboda Capital Partners LLC, 1998-2006. | | | 10 | | | Columbia Acorn Trust; Molex, Inc. (electronics components manufacturer). | |
|
Maureen M. Culhane, 60,
Trustee | | | 2007 | | | Retired. Formerly, Vice President, Goldman Sachs Asset Management, L.P. (investment advisor) 2005-2007; Vice President (Consultant)—Strategic Relationship Management, Goldman Sachs AG, 1999-2005. | | | 10 | | | Columbia Acorn Trust. | |
|
Margaret Eisen, 55,
Trustee | | | 2002 | | | Chief Investment Officer, EAM International LLC (corporate finance and asset management), since 2003; Managing Director, CFA Institute, 2005-2008. | | | 10 | | | Columbia Acorn Trust; Antigenics, Inc. (biotechnology and pharmaceuticals). | |
|
Jerome Kahn, Jr., 74,
Trustee | | | 1987 | | | Portfolio manager and stock analyst; formerly, President, William Harris Investors, Inc. (investment advisor). | | | 10 | | | Columbia Acorn Trust. | |
|
Steven N. Kaplan, 49,
Trustee | | | 1999 | | | Neubauer Family Professor of Entrepreneurship and Finance, University of Chicago Booth School of Business. | | | 10 | | | Columbia Acorn Trust; Morningstar, Inc. (provider of independent investment research). | |
|
David C. Kleinman, 73,
Trustee | | | 1972 | | | Adjunct Professor of Strategic Management, University of Chicago Booth School of Business; business consultant. | | | 10 | | | Columbia Acorn Trust; Sonic Foundry, Inc. (rich media systems and software). | |
|
24
Wanger Select 2008 Annual Report
Board of Trustees and Management of Wanger Advisors Trust
Name, Position(s) with
Wanger Advisors
Trust and Age at
December 31, 2008 | | Year First
Elected or
Appointed
to Office | | Principal Occupation(s) during
Past Five Years | | Number of
Portfolios in
Fund Complex
Overseen
by Trustee/Officer | | Other
Directorships
in addition
to Wanger
Advisors Trust | |
Allan B. Muchin, 72,
Trustee and Vice Chairman of the Board | | | 1998 | | | Chairman Emeritus, Katten Muchin Rosenman LLP (law firm). | | | 10 | | | Columbia Acorn Trust. | |
|
Robert E. Nason, 72,
Trustee and Chairman of the Board | | | 1998 | | | Consultant and private investor, since 1998; prior thereto, Chief Executive Officer, executive partner, and member of the Executive Committee, Grant Thornton, LLP (public accounting firm). | | | 10 | | | Columbia Acorn Trust. | |
|
James A. Star, 47,
Trustee | | | 2006 | | | President, Longview Asset Management LLC (investment advisor), since 2003. | | | 10 | | | Columbia Acorn Trust; Traush Industries (privately-owned manufacturer of refrigeration parts and products). | |
|
John A. Wing, 73,
Trustee | | | 2002 | | | Partner, Dancing Lion Partners (investment firm); prior thereto, Chairman of the Board and Chief Executive Officer, ABN-AMRO Inc. (formerly named The Chicago Corporation, a financial services firm), Chief Executive Officer, Market Liquidity Network, LLC, and Frank Wakely Gunsaulus Professor of Law and Finance and Chairman of the Center for the Study of Law and Financial Markets, Illinois Institute of Technology. | | | 10 | | | Columbia Acorn Trust; First Chicago Bank and Trust; First Chicago Bancorp. | |
|
| Trustees who are interested persons of Wanger Advisors Trust: | |
|
Charles P. McQuaid, 55,
Trustee and President (1) | | | 1992 | | | President and Chief Investment Officer, CWAM or its predecessors, since October 2003; portfolio manager, CWAM or its predecessors, since 1995. | | | 10 | | | Columbia Acorn Trust. | |
|
Ralph Wanger, 74,
Trustee (2) | | | 1970 | | | Founder, CWAM. Formerly, President, Chief Investment Officer and portfolio manager, CWAM or its predecessors, July 1992-September 2003; Director, Wanger Investment Company PLC; Consultant, CWAM or its predecessors, September 2003-September 2005. | | | 10 | | | Columbia Acorn Trust. | |
|
| Officers of Wanger Advisors Trust: | |
|
Ben Andrews, 42,
Vice President | | | 2004 | | | Portfolio manager and analyst, CWAM or its predecessors, since 1998; Vice President, Columbia Acorn Trust and Wanger Advisors Trust, since 2004. | | | 10 | | | None. | |
|
Michael G. Clarke, 39,
Assistant Treasurer | | | 2004 | | | Treasurer of certain Columbia Funds since June 2008; Deputy Treasurer of certain Columbia Funds since June 2008; Chief Accounting Officer and Assistant Treasurer, the Columbia Funds, October 2004 to May 2008; Director of Fund Administration, Columbia Management Advisors, LLC, since January 2006; Managing Director, Columbia Management Advisors, LLC, September 2004-December 2005; Vice President of Fund Administration, Columbia Management Advisors, LLC, June 2002-September 2004. | | | 10 | | | None. | |
|
Jeffrey Coleman, 39,
Assistant Treasurer | | | 2006 | | | Director of Fund Administration, CWAM, since January 2006; Fund Controller, CWAM or its predecessors, October 2004-January 2006; Vice President, CDC IXIS Asset Management Services, Inc., August 2000-September 2004. | | | 10 | | | None. | |
|
25
Wanger Select 2008 Annual Report
Board of Trustees and Management of Wanger Advisors Trust
Name, Position(s) with
Wanger Advisors
Trust and Age at
December 31, 2008 | | Year First
Elected or
Appointed
to Office | | Principal Occupation(s) during
Past Five Years | | Number of
Portfolios in
Fund Complex
Overseen
by Trustee/Officer | | Other
Directorships
in addition
to Wanger
Advisors Trust | |
J. Kevin Connaughton, 44,
Assistant Treasurer | | | 2001 | | | President of certain Columbia Funds since January 2009; Treasurer and Chief Financial Officer, the Columbia Funds, since December 2000; Managing Director, Columbia Management Advisors, LLC, since April 2003; Treasurer and Chief Financial Officer of the Liberty Funds, Stein Roe Funds and Liberty All-Star Funds, December 2000-December 2006; Treasurer, the Galaxy Funds, September 2002-November 2005; Senior Officer of various affiliated entities of Bank of America, including other registered and unregistered funds. | | | 10 | | | None. | |
|
P. Zachary Egan, 40,
Vice President | | | 2003 | | | Director of International Research, CWAM or its predecessors, since December 2004; Vice President, Columbia Acorn Trust and Wanger Advisors Trust, since 2003; portfolio manager and analyst, CWAM or its predecessors, since 1999. | | | 10 | | | None. | |
|
Peter T. Fariel, 51,
Assistant Secretary | | | 2006 | | | Associate General Counsel, Bank of America Corporation, since April 2005; prior thereto, Partner, Goodwin Procter LLP (law firm). | | | 10 | | | None. | |
|
John Kunka, 38,
Assistant Treasurer | | | 2006 | | | Director of Accounting and Operations, CWAM or its predecessors, since May 2006; Manager of Mutual Fund Operations, Calamos Advisors, Inc. (investment advisor), September 2005-May 2006; prior thereto, Manager of Mutual Fund Administration, Van Kampen Investments. | | | 10 | | | None. | |
|
Joseph LaPalm, 38,
Vice President | | | 2006 | | | Chief Compliance Officer, CWAM, since 2005; prior thereto, compliance officer, William Blair & Company (investment firm). | | | 10 | | | None. | |
|
Bruce H. Lauer, 51,
Vice President,
Secretary and Treasurer | | | 1995 | | | Chief Operating Officer, CWAM or its predecessors, since April 2000; Vice President, Secretary and Treasurer, Columbia Acorn Trust and Wanger Advisors Trust, since 1995; Director, Wanger Investment Company PLC; Director, Banc of America Capital Management (Ireland) Ltd.; Director, Bank of America Global Liquidity Funds, PLC. | | | 10 | | | None. | |
|
Louis J. Mendes, 44,
Vice President | | | 2003 | | | Portfolio manager and analyst, CWAM or its predecessors, since 2001; Vice President, Columbia Acorn Trust and Wanger Advisors Trust, since 2003. | | | 10 | | | None. | |
|
Robert A. Mohn, 47,
Vice President | | | 1997 | | | Director of Domestic Research, CWAM or its predecessors, since March 2004; Vice President, Columbia Acorn Trust and Wanger Advisors Trust, since 1997; portfolio manager and analyst, CWAM or its predecessors, since August 1992. | | | 10 | | | None. | |
|
Christopher Olson, 44,
Vice President | | | 2001 | | | Portfolio manager and analyst, CWAM or its predecessors, since January 2001; Vice President, Columbia Acorn Trust and Wanger Advisors Trust, since 2001. | | | 10 | | | None. | |
|
Robert P. Scales, 56,
Chief Compliance Officer,
Chief Legal Officer,
Senior Vice President and
General Counsel | | | 2004 | | | Chief Compliance Officer, Chief Legal Officer, Senior Vice President and General Counsel, Columbia Acorn Trust and Wanger Advisors Trust, since 2004; prior thereto, Associate General Counsel, Grant Thornton LLP (public accounting firm). | | | 10 | | | None. | |
|
Linda Roth-Wiszowaty, 39,
Assistant Secretary | | | 2006 | | | Business support analyst, CWAM, since April 2007; prior thereto executive administrator, CWAM or its predecessors, and executive assistant to the Chief Operating Officer of CWAM or its predecessors. | | | 10 | | | None. | |
|
(1) Mr. McQuaid is an "interested person" of Wanger Advisors Trust and of CWAM, as defined in the Investment Company Act of 1940 because he is an officer of the Trust and of CWAM.
(2) Mr. Wanger is an "interested person" of Wanger Advisors Trust and of CWAM, as defined in the Investment Company Act of 1940 because he owns securities issued by a controlling person of CWAM.
26
Wanger Select 2008 Annual Report
This page intentionally left blank.
27
Wanger Select 2008 Annual Report

Wanger Advisors Trust
Transfer Agent,
Dividend Disbursing Agent
Columbia Management Services, Inc.
P.O. Box 8081
Boston, Massachusetts
02266-8081
Distributor
Columbia Management Distributors, Inc.
One Financial Center
Boston, Massachusetts
02111-2621
Investment Advisor
Columbia Wanger Asset Management, L.P.
227 West Monroe Street, Suite 3000
Chicago, Illinois 60606
1-888-4-WANGER
(1-888-492-6437)
Legal Counsel
Bell, Boyd & Lloyd LLP
Chicago, Illinois
Independent Registered
Public Accounting Firm
PricewaterhouseCoopers LLP
Chicago, Illinois
This report, including the schedules of investments and financial statements, is submitted for the general information of the shareholders of the Wanger Advisors Trust.
A description of the Fund's proxy voting policies and procedures and a copy of the Fund's voting record for the most recent 12-month period ended June 30 are available (i) on the Securities and Exchange Commission's website at www.sec.gov, and (ii) without charge, upon request, by calling 1-888-492-6437.
The Fund files a complete schedule of portfolio holdings with the SEC for the first and third quarters of each fiscal year on Form N-Q. The Fund's Form N-Q is available on the SEC's website at www.sec.gov and may be reviewed and copied at the SEC's Public Reference Room in Washington, D.C. Information on the operation of the Pubic Reference Room may be obtained by calling 1-800-SEC-0330.
28
Columbia Wanger Funds
OL2568A
SHC-42/4939-1208 09/72714
Wanger USA
(formerly Wanger U.S. Smaller Companies)
2008 Annual Report

| NOT FDIC INSURED | | May Lose Value | |
|
| NOT BANK ISSUED | | No Bank Guarantee | |
|

Wanger USA
2008 Annual Report
Table of Contents
| | 1 | | | Understanding Your Expenses | |
|
| | 2 | | | The Population Bust | |
|
| | 4 | | | Performance Review | |
|
| | 6 | | | Statement of Investments | |
|
| | 13 | | | Statement of Assets and Liabilities | |
|
| | 13 | | | Statement of Operations | |
|
| | 14 | | | Statement of Changes in Net Assets | |
|
| | 15 | | | Financial Highlights | |
|
| | 16 | | | Notes to Financial Statements | |
|
| | 20 | | | Report of Independent Registered Public Accounting Firm | |
|
| | 21 | | | Management Fee Evaluation of the Senior Officer | |
|
| | 25 | | | Board Approval of the Advisory Agreement | |
|
| | 27 | | | Board of Trustees and Management of Wanger Advisors Trust | |
|
Columbia Wanger Asset Management, L.P. ("CWAM") is one of the leading global small-and mid-cap equity managers in the United States with more than 37 years of small- and mid-cap investment experience. As of December 31, 2008, CWAM manages $19.3 billion in assets and is the investment advisor to Wanger USA, Wanger International, Wanger Select, Wanger International Select (together, the "Wanger Advisors Trust Funds") and the Columbia Acorn Family of Funds. Columbia Management Group, LLC ("Columbia Management") is the investment management division of Bank of America Corporation. Columbia Management entities furnish investment management services and products for institutional and individual investors.The Wanger Advisors Trust Funds and the Columbia Acorn Family of Funds (together wi th other funds advised by Columbia Management affiliates, the"Columbia Funds") are distributed by Columbia Management Distributors, Inc., member of FINRA, SIPC, part of Columbia Management and an affiliate of Bank of America Corporation. CWAM is a registered investment advisor and an indirect, wholly owned subsidiary of Bank of America Corporation. CWAM is part of Columbia Management.
Please consider the investment objectives, risks, charges and expenses for the Fund carefully before investing. Contact 1-888-4-WANGER for a prospectus, which contains this and other important information about the Fund. You should read it carefully before you invest.
The views expressed in "The Population Bust" and in the Performance Review reflect the current views of the respective parties. These views are not guarantees of future performance and involve certain risks, uncertainties and assumptions that are difficult to predict so actual outcomes and results may differ significantly from the views expressed.These views are subject to change at any time based upon economic, market or other conditions and the respective parties disclaim any responsibility to update such views. These views may not be relied on as investment advice and, because investment decisions for a Columbia Fund are based on numerous factors, may not be relied on as an indication of trading intent on behalf of any particular Columbia Fund. References to specific company securities should not be construed as a recommendation or investment advice.
Wanger USA 2008 Annual Report
Understanding Your Expenses
As a Fund shareholder, you incur two types of costs. There are transaction costs, which generally include sales charges on purchases and may include redemption or exchange fees. There are also ongoing costs, which generally include investment advisory fees and other Fund expenses. The information on this page is intended to help you understand your ongoing costs of investing in the Fund and to compare these costs with the ongoing costs of investing in other mutual funds.
Analyzing your Fund's expenses
To illustrate these ongoing costs, we have provided an example and calculated the expenses paid by investors in the Fund during the period. The information in the following table is based on an initial, hypothetical investment of $1,000, which is invested at the beginning of the period and held for the entire period. Expense information is calculated two ways and each method provides you with different information. The amount listed in the "Actual" column is calculated using actual operating expenses and total return for the Fund. The amount listed in the "Hypothetical" column assumes that the return each year is 5% before expenses and then applies the Fund's actual expense ratio for the period to the hypothetical return. You should not use the hypothetical account values and expenses to estimate either your actual account balance at the end of the period or the expenses you paid during the period. See the "Compare with other fu nds" information for details on using the hypothetical data.
Estimating your actual expenses
To estimate the expenses that you actually paid over the period, first you will need your account balance at the end of the period.
1. Divide your ending account balance by $1,000. For example, if an account balance was $8,600 at the end of the period, the result would be 8.6.
2. In the section of the table below titled "Expenses paid during the period," you will find a dollar amount in the column labeled "Actual." Multiply this amount by the result from step 1. Your answer is an estimate of the expenses you paid on your account during the period.
July 1, 2008 – December 31, 2008
| | | Account value at the
beginning of the period ($) | | Account value at the
end of the period ($) | | Expenses paid during
the period ($) | | Fund's annualized
expense ratio (%)* | |
| | | Actual | | Hypothetical | | Actual | | Hypothetical | | Actual | | Hypothetical | | Actual | |
| Wanger USA | | | 1,000.00 | | | | 1,000.00 | | | | 656.68 | | | | 1,020.16 | | | | 4.12 | | | | 5.03 | | | | 0.99 | | |
*For the six months ended December 31, 2008.
Expenses paid during the period are equal to the Fund's annualized expense ratio, multiplied by the average account value over the period, then multiplied by the number of days in the Fund's most recent fiscal half-year and divided by 366.
It is important to note that the expense amounts shown in the table are meant to highlight only ongoing costs of investing in the Fund. Expenses paid during the period do not include any insurance charges imposed by your insurance company's separate account. The hypothetical example provided is useful in comparing ongoing costs only and will not help you determine the relative total costs of owning different funds whose shareholders may incur transaction costs.
Compare with other funds
Since all mutual funds are required to include the same hypothetical calculations about expenses in shareholder reports, you can use this information to compare the ongoing cost of investing in the Fund with other funds. To do so, compare the 5% hypothetical example with the 5% hypothetical examples of other funds. As you compare hypothetical examples of other funds, it is important to note that hypothetical examples are meant to highlight the ongoing cost of investing in a fund and do not reflect any transaction costs, such as sales charges, redemption fees or exchange fees that may be incurred by shareholders of other funds. Expenses paid during the period do not include any insurance charges imposed by your insurance company's separate accounts.
1
Wanger USA 2008 Annual Report

The Population Bust
Important socio-economic predictions are based on demographics. For example, virtually all of the people who will retire in 2058 are living today and retirement age, immigration and mortality trends are utilized to create assumptions that will be used to predict the number of future retirees. The labor force of 2028 and the military age population of 2025 are similarly predictable. These factors are major drivers of government burdens, GDP growth and military potential. Demographics indicate that the world is unlikely to age gracefully.
World Demographic Trends
Richard Jackson and Neil Howe's, The Graying of the Great Powers provides an excellent summary of current demographic trends. Its authors conclude that, "The world is entering a demographic transformation of unprecedented dimensions...a fundamental demographic shift with no parallel in the history of humanity.... There is almost no chance that it will not happen—or that it will be reversed in our lifetime."1
The world's current great powers2 are aging at remarkably divergent rates. The United States is barely aging and has a fertility rate of 2.0 to 2.1 births per woman during child-bearing years, very near long-term zero population growth. This country is one of the youngest developed nations, and the age gap between the United States and other developed countries is projected to widen. "By the mid-2020's, the United States will be the only major developed country with more children under age 20 than elderly over age 65—and the only one whose working-age population will still be growing," write Jackson and Howe. The U.S. work force is projected to grow 14% between 2005 and 2030.3
Russian fertility rates plunged through the 1980s and rest today at 1.2 to 1.3 births. Risky lifestyles and a poor health care system have caused mortality rates to soar. Life expectancy for a Russian male has dropped to 59 years, lower than that of Bangladeshi males! Russia's working age population (those aged 20 to 64) will plunge 17% from 2005 to 2030.4 Prime Minister Vladimir Putin termed Russia's lack of births as "the most acute problem facing our country today."5
Jackson and Howe note that Japan is ground zero for demographic aging. Like Russia, its fertility rate has fallen to an average of 1.3 children per woman. In 1980, Japan was the youngest developed country, with only 9% of its population over age 65. By 2005, its elderly (those aged 65 and over) accounted for 20% of its population, making it one of the oldest developed countries. Japan's working-age population started shrinking in 2000 and from 2005 to 2030 it is expected to drop 18%.6
China's one-child policy collapsed fertility rates, which have since rebounded to 1.7 to 1.8. But China's pre-one-child-policy population bulge is aging rapidly. China's working age population will fall after 2015 and China's ratio of workers to retirees will triple from 2005 to 2030. The Chinese have relied on family rather than the government for old age support and, with shrunken families, China by 2030 could have over 100 million indigent seniors. The Asian Tigers' fertility rates range from 0.9 to 1.4, and the Tigers also are rapidly aging.7,8
There are two demographic categories of Western European countries: those with likely slow population declines and those with likely fast population drops. Slow decliners have fertility rates of around 1.8 and include the United Kingdom, France and northern Europe, except Germany. Fast decliners have fertility rates of 1.3 and include Germany and southern Europe. The working age population of Europe is projected to shrink 6% by 2030. Public pensions already cost Europe twice the percentage of GDP as compared to the United States, and will get worse. Europe's elderly will account for over 25% of its population in 2030, up from 17% in 2005.9
The image of rapidly growing populations all over the developing world is outdated. Only a few areas of the world, including sub-Saharan Africa and some Muslim countries (Iraq, Yemen, Somalia, Sudan, Afghanistan and Pakistan) have fertility rates of 4.0 or higher. Fertility has trended down in most other developing countries. In non-Muslim South Asia, including India, fertility has fallen to about 3.0. Latin America fertility has dropped to 2.5 from 6.0 in the 1960s. Turkey and Iran have current fertility rates around 2.1. However, many developing countries have high percentages of women in childbearing ages, so despite declining fertility rates, their absolute numbers of youths and working age populations will grow rapidly for several decades.10
Immigration will impact the numbers in the United States and Europe. Migration is at or near records in many countries. Some 13% of the U.S. population consists of immigrants, as does 8% to 13% of France, the United Kingdom and Germany. Hispanics are the primary immigrants into the United States; most are employed and data indicates that second generation Hispanics have higher incomes than their parents. That in turn suggests higher productivity and some degree of assimilation. Muslims are the primary immigrants in many European countries; their unemployment rates are high and most of their second generation seems to be making little economic progress; many are not assimilating. This suggests future productivity problems in much of Europe, and possibly diverging national interests.11
Jackson and Howe cite numerous geopolitical implications from demographic changes. Within the developed world, only the United States will likely have the capacity to remain a great power. It was the third most populous country in the world in 1950 and is forecasted to remain so in 2050. Germany, the United Kingdom, Italy and France had populations among the top dozen countries in the world in 1950, but of them, Germany will be the leader at 26th in 2050.
2
Wanger USA 2008 Annual Report
Western Europe and Japan will be aged and Western Europe especially will have huge public pension costs. While the United States and Western Europe each accounted for 37% of the developed world's economy in the 1980s, the U.S. will likely grow to 54% and Western Europe is projected to shrink to 23% by 2050.12 The United States' increasing relative strength will likely mean that it will need to provide for an even greater proportion of the developed world's security.
Though the U.S. share of the developed world's population and economy will rise, its share of the total world's population and economy will fall. Howe and Jackson note that 90% of the world's population growth to 2050 will occur in sub-Saharan Africa, Muslim countries and South Asia, in nations largely troubled by poverty, religious conflict or both.13
Due to the characteristics of population segments, security risks are likely to rise and peak in the 2020s. This will come at a time when most of the historically great powers are likely to have military recruiting challenges along with budget problems. Jackson and Howe also worry about the effects of aging on savings rates and creativity. In a book by Mark Steyn titled America Alone,14 the author writes that the United States should do a better job exporting its values of liberty, women's rights, freedom of speech, self reliance, decentralization and responsibility. He believes this is one way the U.S. influence can make a posi tive impact.
Investment Implications
Change creates investment risks and opportunities. Recognizing these powerful trends and understanding when they are likely to occur could mitigate the risks and result in profitable investments.
Studies indicate that an individual's creativity, as measured by works of art, peaks between the ages of 30 and 50 and that Nobel achievements peak when people are in their 30s.15 An aging worldwide population may make innovation more scarce and consequently more highly rewarded. Innovative companies may become less subject to competition and be more highly valued in financial markets.
Small- and mid-cap companies tend to be innovative and adaptable. Many existing companies provide goods and services to growing population segments and more will emerge in the future to do so. Our analysts will continue to pursue these opportunities around the world.
The United States has excellent prospects compared to much of the rest of the developed world. Many investment analysts have tracked the baby boomer and echo baby boomer age segments, and as a result have predicted demand for goods and services such as toys, school books, automobiles, housing, leisure items and health care. Long-term demand for leisure and health care continues to appear promising, and additional opportunities may include companies producing labor saving devices and military technology. The United States stands to benefit from woes elsewhere, as highly productive people migrate here for employment and entrepreneurial opportunities, lower taxes and, in some cases, less strife.
There will continue to be investment opportunities overseas. In developed countries, companies that provide products or services to aging populations should benefit. Once the world economy recovers, capital goods suppliers to developing countries should resume growing. Developing countries that have moderate population growth and attractive climates for capitalism are likely to increase their share of world GDP and provide investment opportunities. Companies that participate in domestic growth within these countries should especially benefit.


Charles P. McQuaid
President and Chief Investment Officer
Columbia Wanger Asset Management, L.P.
The information and data provided in this analysis are derived from sources that we deem to be reliable and accurate. These views are not guarantees of future performance and involve certain risks, uncertainties and assumptions that are difficult to predict so actual outcomes and results may differ significantly from the views expressed. The views/opinions expressed in this essay are those of the author and not of the Columbia Wanger Trust Board, are subject to change at any time based upon economic, market or other conditions, may differ from views expressed by other Columbia Management associates or other divisions of Bank of America and the respective parties disclaim any responsibility to update such views. These views may not be relied on as investment advice and, because investment decisions for a Columbia Wanger Fund are based on numerous factors, may not be relied on as an indication of trading intent on behalf of any particular Columbia Wanger Fund.
1 Jackson, Richard and Howe, Neil, The Graying of the Great Powers, (Washington, D.C., Center for Strategic & International Studies, 2008), pg. 1.
2 By popular definition, the "great powers" are the worlds most powerful countries based on wealth, military strength and population.
3 Jackson, Richard and Howe, Neil, op. cit., pgs. 39-40.
4 Ibid, pg. 179.
5 "Vladimir Putin on Raising Russia's Birth Rate," Population and Development Review 32, no. 2 (June 2006).
6 Jackson, Richard and Howe, Neil, op. cit., pg. 44.
7 The Asian Tiger countries include Hong Kong, Singapore, South Korea and Taiwan.
8 Jackson, Richard and Howe, Neil, op. cit., pgs. 155, 171, 175.
9 Ibid, pg. 42.
10 Ibid, pgs. 163-176.
11 Ibid, pgs. 122-126.
12 Ibid, pgs. 191-192.
13 Ibid, pg. 194.
14 Steyn, Mark, America Alone: The End of the World As We Know It, (Washington, D.C., Regnery Publishing, Inc., 2006), pgs. 173, 205.
15 Jackson, Richard and Howe, Neil, op. cit., pg. 111.
3
Wanger USA 2008 Annual Report

Performance Review Wanger USA

Robert A. Mohn
Portfolio Manager
Performance data quoted represents past performance and current performance may be lower or higher. Past performance is no guarantee of future results. The investment return and principal value will fluctuate so that shares, when redeemed, may be worth more or less than the original cost. Performance may reflect any voluntary waiver and reimbursement of fund expenses by the advisor or affiliates. Absent these fee waivers, or expense reimbursements, performance results may be lower. For daily and most recent month-end performance updates, please call 1-888-4-WANGER.
All results shown assume reinvestment of distributions and do not reflect the deduction of taxes that a shareholder would pay on fund distributions or on the redemption of fund shares.
In terms of investing, the best thing that can be said about 2008 is that it is over. The destruction of capital caused by the credit crisis hit all areas of the market and Wanger USA was not spared. The Fund fell 39.68% for the annual period vs. an index decline of 33.79%. In addition to the general economic crunch, Fund performance vs. the benchmark was further dampened by a spike mid-year in micro-caps. The Fund owns few of these types of stocks.
The Fund's energy and consumer stocks took the brunt of the market beating. Oil prices fell over 50% from their mid-year peak, and energy stocks followed in tow. Fund holdings in Ultra Petroleum, FMC Technologies, Atwood Oceanics and Carrizo Oil & Gas saw declines ranging from 56% to 70% in the year.
Consumers cut back their spending and retailers felt the pinch. Abercrombie & Fitch posted the Fund's biggest losses with a 70% decline. Sales fell and profits suffered from the company's decision to refrain from discounting its prices. The stock got the markdown instead. Urban Outfitters, an apparel and home specialty goods retailer, fell 45% despite having strong sales growth for the first three quarters of the year. Investors seemed to fear the fastest-growing consumer companies had the furthest to fall.
Also part of the consumer sector, Champion Enterprises, a maker of manufactured homes, collapsed with the housing market. Its business is concentrated in southwestern states like California and Arizona where home sales have fallen dramatically not only for site-built homes but also for manufactured homes. The stock was down 94% for the year.
There were some bright spots in the year. ITT Educational Services announced a 14% increase in student enrollment as the economic slowdown, and subsequent job losses, drove people back to school. The stock was the Fund's top dollar contributor for the year with an 11% gain. Fund winners included four companies that were acquired during the year: CNET, Vital Signs, Collagenex Pharmaceuticals and Philadelphia Consolidated Holding.
Smaller banks and insurance companies also bucked the downward trend. Fund holdings in Valley National Bancorp, Berkshire Hills Bancorp, Lakeland Financial and Pacific Continental benefited from a decrease in competition as their big, "sophisticated" bank rivals were forced to stop lending in order to conserve their depleted capital bases. Our bank winners also avoided the severe credit losses experienced by some of their more aggressive peers. Insurance company Tower Group was up in the year on signs of rising insurance prices.
The economy is in a freefall and the stock market is an emotional mess. There are two ways to deal with this situation. Investors can obsess over the economic tea leaves and attempt to "time" the market by adjusting their exposure to equities vs. cash and/or adjust their portfolio mix of "early-cycle" vs. "economically-stable" industry sectors. Alternatively, investors can focus on individual stock fundamentals and attempt to identify which companies will survive and thrive once the economic turbulence subsides. We believe the latter option is the more enlightened choice and could lead to the most favorable longer-term results.
Stocks of small- and mid-cap companies pose special risks, including possible illiquidity and greater price volatility than stocks of larger, more established companies.
Portfolio holdings are subject to change periodically and may not be representative of current holdings.
4
Wanger USA 2008 Annual Report
Growth of a $10,000 Investment in
Wanger USA
Total return for each period,
May 3, 1995 (inception date) through December 31, 2008
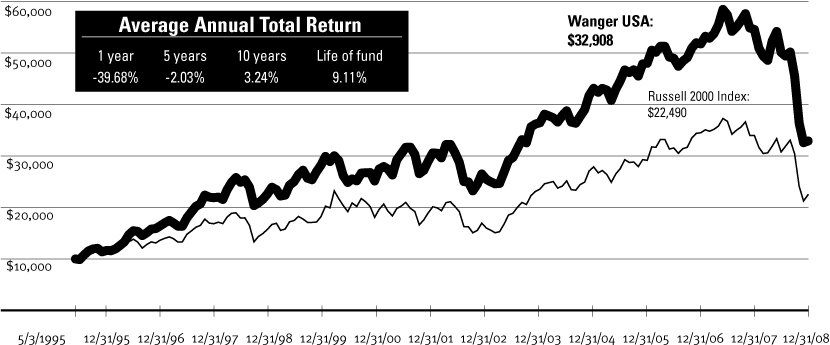
This graph compares the results of $10,000 invested in Wanger USA on May 3, 1995 (the date the Fund began operations) through December 31, 2008, to the Russell 2000 Index, with dividends and capital gains reinvested. Performance shown here is past performance, which cannot guarantee future results. Current performance may be higher or lower. The investment return and principal value of an investment in the Fund will fluctuate so that Fund shares, when redeemed, may be worth more or less than their original cost. Performance changes over time. Current returns for the Fund may be different than that shown. For daily and most recent month-end performance updates, please contact us at 1-888-4-WANGER.
Results as of December 31, 2008
| | | 4th quarter | | 1 year | |
| Wanger USA | | | -27.74 | % | | | -39.68 | % | |
| Russell 2000 Index | | | -26.12 | | | | -33.79 | | |
| S&P MidCap 400 Index | | | -25.55 | | | | -36.23 | | |
| S&P 500 Index | | | -21.94 | | | | -37.00 | | |
NAV as of 12/31/08: $19.30
Performance numbers reflect all Fund expenses but do not include any insurance charge imposed by your insurance company's separate accounts. If performance included the effect of these additional charges, it would be lower.
The Fund's annual operating expense ratio is 0.95%. The annual operating expense ratio is as stated in the Fund's prospectus that is current as of the date of this report. Differences in expense ratios disclosed elsewhere in this report may result from including fee waivers and expense reimbursements as well as different time periods used in calculating the ratios.
All results shown assume reinvestment of distributions and do not reflect taxes that a shareholder would pay on Fund distributions or the sale of Fund shares.
The Russell 2000 Index, which is the Fund's primary benchmark, measures the performance of the 2,000 smallest companies in the Russell 3000 Index, which represents approximately 7% of the total market capitalization of the Russell 3000 Index. The S&P MidCap 400 Index is a market value-weighted index that tracks the performance of 400 mid-cap U.S. companies. The S&P 500 Index tracks the performance of 500 widely held, large-capitalization U.S. stocks. Indexes are not managed and do not incur fees or expenses. It is not possible to invest directly in an index.
Portfolio characteristics and holdings are subject to change periodically and may not be representative of current characteristics and holdings.
Top 5 Industries
As a percentage of net assets, as of 12/31/08
| Information | | | 27.5 | % | |
| Finance | | | 19.4 | | |
| Industrial Goods & Services | | | 15.9 | | |
| Consumer Goods & Services | | | 13.0 | | |
| Health Care | | | 10.7 | | |
Top 10 Holdings
As a percentage of net assets, as of 12/31/08
1. ITT Educational Services
Post-secondary Degree Services | | | 4.2 | % | |
2. Ametek
Aerospace/Industrial Instruments | | | 2.5 | | |
3. ESCO Technologies
Automatic Electric Meter Readers | | | 2.3 | | |
4. HCC Insurance Holdings
Specialty Insurance | | | 2.0 | | |
5. Global Payments
Credit Card Processor | | | 2.0 | | |
6. Crown Castle International
Communications Towers | | | 1.9 | | |
7. TW Telecom
Fiber Optic Telephone/Data Services | | | 1.8 | | |
8. FMC Technologies
Oil & Gas Wellhead Manufacturer | | | 1.7 | | |
9. Valley National Bancorp
New Jersey/New York Bank | | | 1.6 | | |
10. Flir Systems
Infrared Cameras | | | 1.6 | | |
5
Wanger USA 2008 Annual Report
Wanger USA
Statement of Investments, December 31, 2008
Number of
Shares | | | | Value | |
| | | Common Stock – 96.8% | |
| | | Information – 27.5% | |
| | | Business Software – 6.6% | |
| | 364,000 | | | Concur Technologies (a)
Web Enabled Cost & Expense Management Software | | | $11,946,480
| | |
| | 682,510 | | | Micros Systems (a)
Information Systems for Restaurants & Hotels | | | 11,138,563
| | |
| | 2,280,000 | | | Novell (a)
Directory, Operating System & Identity
Management Software | | | 8,869,200
| | |
| | 305,000 | | | ANSYS (a)
Simulation Software for Engineers & Designers | | | 8,506,450
| | |
| | 575,000 | | | Blackbaud
Software & Services for Non-profits | | | 7,762,500
| | |
| | 565,000 | | | Informatica (a)
Enterprise Data Integration Software | | | 7,757,450
| | |
| | 100,000 | | | Quality Systems
IT Systems for Medical Groups &
Ambulatory Care Centers | | | 4,362,000
| | |
| | 150,000 | | | NetSuite (a)
End to End IT Systems Solution Delivered Over the Web | | | 1,266,000
| | |
| | 90,000 | | | Avid Technology (a)
Digital Nonlinear Editing Software & Systems | | | 981,900
| | |
| | | | | | | | 62,590,543 | | |
| | | Instrumentation – 4.8% | |
| | 500,000 | | | Flir Systems (a)
Infrared Cameras | | | 15,340,000
| | |
| | 185,000 | | | Mettler Toledo (a)
Laboratory Equipment | | | 12,469,000
| | |
| | 765,000 | | | IPG Photonics (a)
Fiber Lasers | | | 10,082,700
| | |
| | 268,000 | | | Trimble Navigation (a)
GPS-based Instruments | | | 5,791,480
| | |
| | 45,000 | | | Varian (a)
Analytical Instruments | | | 1,507,950
| | |
| | | | | | | | 45,191,130 | | |
| | | Mobile Communications – 2.9% | |
| | 1,040,000 | | | Crown Castle International (a)
Communications Towers | | | 18,283,200 | | |
| | 330,000 | | | American Tower (a)
Communications Towers in USA & Mexico | | | 9,675,600 | | |
| | 88,000 | | | Globalstar (a)
Satellite Mobile Voice & Data Carrier | | | 17,600 | | |
| | | | | | | | 27,976,400 | | |
Number of
Shares | | | | Value | |
| | | Semiconductors & Related Equipment – 2.8% | |
| | 743,000 | | | Microsemi (a)
Analog/Mixed-signal Semiconductors | | | $9,391,520
| | |
| | 1,180,000 | | | Integrated Device Technology (a)
Communications Semiconductors | | | 6,619,800
| | |
| | 189,300 | | | Supertex (a)
Mixed-signal Semiconductors | | | 4,545,093
| | |
| | 1,179,750 | | | ON Semiconductor (a)
Mixed-signal & Power Management Semiconductors | | | 4,011,150
| | |
| | 140,000 | | | Littelfuse (a)
Little Fuses | | | 2,324,000
| | |
| | | | | | | | 26,891,563 | | |
| | | Financial Processors – 2.0% | |
| | 586,880 | | | Global Payments
Credit Card Processor | | | 19,243,795
| | |
| | | Telephone Services – 1.9% | |
| | 1,981,000 | | | TW Telecom (a)
Fiber Optic Telephone/Data Services | | | 16,779,070
| | |
| | 800,000 | | | PAETEC Holding (a)
Telephone/Data Services for Business | | | 1,152,000
| | |
| | | | | | | | 17,931,070 | | |
| | | Computer Hardware & Related Equipment – 1.8% | |
| | 375,600 | | | Amphenol
Electronic Connectors | | | 9,006,888
| | |
| | 230,000 | | | II-VI (a)
Laser Components | | | 4,390,700
| | |
| | 80,000 | | | Nice Systems – ADR (Israel) (a)
Audio & Video Recording Solutions | | | 1,797,600
| | |
| | 85,000 | | | Zebra Technologies (a)
Bar Code Printers | | | 1,722,100
| | |
| | | | | | | | 16,917,288 | | |
| | | Telecommunications Equipment – 1.2% | |
| | 475,000 | | | Polycom (a)
Video Conferencing Equipment | | | 6,417,250
| | |
| | 1,300,000 | | | Tellabs (a)
Telecommunications Equipment | | | 5,356,000
| | |
| | | | | | | | 11,773,250 | | |
See accompanying notes to financial statements.
6
Wanger USA 2008 Annual Report
Wanger USA
Statement of Investments, December 31, 2008
Number of
Shares | | | | Value | |
| | | Business Information & Marketing Services – 0.9% | |
| | 443,200 | | | Navigant Consulting (a)
Financial Consulting Firm | | | $7,033,584
| | |
| | 76,276 | | | Viad
Trade Show Services, Travel & Tours | | | 1,887,069
| | |
| | | | | | | | 8,920,653 | | |
| | | Internet Related – 0.7% | |
| | 875,000 | | | TheStreet.com
Financial Information Website Publisher | | | 2,537,500
| | |
| | 310,000 | | | SkillSoft – ADR (a)
Web-based Learning Solutions (E-Learning) | | | 2,213,400
| | |
| | 257,000 | | | Switch & Data Facilities (a)
Network Neutral Data Centers | | | 1,899,230
| | |
| | | | | | | | 6,650,130 | | |
| | | Gaming Equipment & Services – 0.6% | |
| | 240,000 | | | Bally Technologies (a)
Slot Machines & Software | | | 5,767,200
| | |
| | | Computer Services – 0.6% | |
| | 155,000 | | | SRA International (a)
Government IT Services | | | 2,673,750
| | |
| | 705,500 | | | Hackett Group (a)
IT Integration & Best Practice Research | | | 2,060,060
| | |
| | 753,000 | | | RCM Technologies (a) (b)
Technology & Engineering Services | | | 813,240
| | |
| | | | | | | | 5,547,050 | | |
| | | Contract Manufacturing – 0.3% | |
| | 115,000 | | | Plexus (a)
Electronic Manufacturing Services | | | 1,949,250
| | |
| | 1,500,000 | | | Sanmina-SCI (a)
Electronic Manufacturing Services | | | 705,000
| | |
| | | | | | | | 2,654,250 | | |
| | | CATV – 0.2% | |
| | 335,000 | | | Mediacom Communications (a)
CATV Franchises | | | 1,440,500
| | |
| | | TV Broadcasting – 0.1% | |
| | 880,000 | | | Entravision Communications (a)
Spanish Language TV & Radio Stations | | | 1,372,800
| | |
Number of
Shares | | | | Value | |
| | | Radio – 0.1% | |
| | 260,000 | | | Cumulus Media (a)
Radio Stations in Small Cities | | | $647,400
| | |
| | 561,900 | | | Salem Communications (a)
Radio Stations for Religious Programming | | | 421,425
| | |
| | 515,000 | | | Spanish Broadcasting System (a)
Spanish Language Radio Stations | | | 49,955
| | |
| | | | | | | | 1,118,780 | | |
| | | | | Total Information | | | 261,986,402 | | |
| | | Finance – 19.4% | |
| | | Banks – 7.3% | |
| | 760,556 | | | Valley National Bancorp
New Jersey/New York Bank | | | 15,401,259
| | |
| | 455,100 | | | MB Financial
Chicago Bank | | | 12,720,045
| | |
| | 413,979 | | | Lakeland Financial
Indiana Bank | | | 9,860,980
| | |
| | 689,700 | | | TCF Financial
Great Lakes Bank | | | 9,421,302
| | |
| | 437,000 | | | Pacific Continental
Niche Pacific N.W. Bank | | | 6,541,890
| | |
| | 280,816 | | | Glacier Bancorp
Mountain States Bank | | | 5,341,120
| | |
| | 155,600 | | | Associated Banc-Corp
Midwest Bank | | | 3,256,708
| | |
| | 103,000 | | | SVB Financial Group (a)
Bank to Venture Capitalists | | | 2,701,690
| | |
| | 192,928 | | | Old Second Bancorp
Illinois Bank | | | 2,237,965
| | |
| | 100,925 | | | Green Bankshares
Tennessee Bank | | | 1,366,524
| | |
| | 500,000 | | | Guaranty Bancorp (a)
Colorado Bank | | | 1,000,000
| | |
| | | | | | | | 69,849,483 | | |
| | | Insurance – 4.1% | |
| | 720,500 | | | HCC Insurance Holdings
Specialty Insurance | | | 19,273,375
| | |
| | 276,000 | | | Leucadia National (a)
Insurance Holding Company | | | 5,464,800
| | |
See accompanying notes to financial statements.
7
Wanger USA 2008 Annual Report
Wanger USA
Statement of Investments, December 31, 2008
Number of
Shares | | | | Value | |
| | | Insurance – 4.1% (cont) | |
| | 18,000 | | | Markel (a)
Specialty Insurance | | | $5,382,000
| | |
| | 64,000 | | | Navigators Group (a)
Specialty Insurance | | | 3,514,240
| | |
| | 120,000 | | | Tower Group
Commercial & Personal Lines Insurance | | | 3,385,200
| | |
| | 75,000 | | | Endurance Specialty Holdings
Commercial Lines Insurance/Reinsurance | | | 2,289,750
| | |
| | | | | | | | 39,309,365 | | |
| | | Finance Companies – 3.8% | |
| | 335,000 | | | Aaron Rents
Rent to Own | | | 8,917,700
| | |
| | 1,142,400 | | | AmeriCredit (a)
Auto Lending | | | 8,727,936
| | |
| | 205,000 | | | GATX
Rail Car Lessor | | | 6,348,850
| | |
| | 270,000 | | | McGrath Rentcorp
Temporary Space & IT Rentals | | | 5,767,200
| | |
| | 144,800 | | | World Acceptance (a)
Personal Loans | | | 2,861,248
| | |
| | 350,000 | | | H&E Equipment Services (a)
Heavy Equipment Leasing | | | 2,698,500
| | |
| | 230,000 | | | CAI International (a)
International Container Leasing & Management | | | 729,100
| | |
| | | | | | | | 36,050,534 | | |
| | | Savings & Loans – 2.9% | |
| | 600,000 | | | ViewPoint Financial
Texas Thrift | | | 9,630,000
| | |
| | 538,650 | | | People's United
Connecticut Savings & Loan | | | 9,604,129
| | |
| | 238,079 | | | Berkshire Hills Bancorp
Northeast Thrift | | | 7,347,118
| | |
| | 60,272 | | | Provident New York Bancorp
New York State Thrift | | | 747,373
| | |
| | 42,455 | | | K-Fed Bancorp
Los Angeles Savings & Loan | | | 275,958
| | |
| | 9,800 | | | Anchor Bancorp Wisconsin
Wisconsin Thrift | | | 27,048
| | |
| | | | | | | | 27,631,626 | | |
Number of
Shares | | | | Value | |
| | | Brokerage & Money Management – 1.3% | |
| | 642,000 | | | SEI Investments
Mutual Fund Administration & Investment Management | | | $10,085,820
| | |
| | 100,000 | | | Eaton Vance
Specialty Mutual Funds | | | 2,101,000
| | |
| | | | | | | | 12,186,820 | | |
| | | | | Total Finance | | | 185,027,828 | | |
| | | Industrial Goods & Services – 15.9% | |
| | | Machinery – 11.2% | |
| | 795,000 | | | Ametek
Aerospace/Industrial Instruments | | | 24,016,950
| | |
| | 527,300 | | | ESCO Technologies (a)
Automatic Electric Meter Readers | | | 21,592,935
| | |
| | 442,000 | | | Donaldson
Industrial Air Filtration | | | 14,873,300
| | |
| | 365,100 | | | Nordson
Dispensing Systems for Adhesives & Coatings | | | 11,789,079
| | |
| | 475,600 | | | Pentair
Pumps & Water Treatment | | | 11,257,452
| | |
| | 195,000 | | | MOOG (a)
Motion Control Products for Aerospace,
Defense & Industrial Markets | | | 7,131,150
| | |
| | 196,000 | | | Clarcor
Mobile & Industrial Filters | | | 6,503,280
| | |
| | 262,200 | | | Mine Safety Appliances
Safety Equipment | | | 6,269,202
| | |
| | 50,000 | | | Kaydon
Specialized Friction & Motion Control Products | | | 1,717,500
| | |
| | 30,000 | | | Lincoln Electric
Welding Equipment & Consumables | | | 1,527,900
| | |
| | | | | | | | 106,678,748 | | |
| | | Outsourcing Services – 1.5% | |
| | 400,000 | | | Quanta Services (a)
Electrical & Telecom Construction Services | | | 7,920,000
| | |
| | 305,000 | | | Administaff
Professional Employer Organization | | | 6,612,400
| | |
| | | | | | | | 14,532,400 | | |
See accompanying notes to financial statements.
8
Wanger USA 2008 Annual Report
Wanger USA
Statement of Investments, December 31, 2008
Number of
Shares | | | | Value | |
| | | Construction – 0.9% | |
| | 195,000 | | | Simpson Manufacturing
Wall Joint Maker | | | $5,413,200
| | |
| | 50,000 | | | Texas Industries
Aggregates, Cement & Concrete | | | 1,725,000
| | |
| | 140,000 | | | M/I Homes
Home Builder | | | 1,475,600
| | |
| | | | | | | | 8,613,800 | | |
| | | Industrial Materials & Specialty Chemicals – 0.9% | |
| | 100,000 | | | Cytec Industries
Aerospace Composites & Specialty Chemicals | | | 2,122,000
| | |
| | 155,000 | | | Drew Industries (a)
RV & Manufactured Home Components | | | 1,860,000
| | |
| | 50,000 | | | Greif
Industrial Packaging | | | 1,671,500
| | |
| | 65,000 | | | Koppers Holdings
Integrated Provider of Carbon Compounds | | | 1,405,300
| | |
| | 60,000 | | | Albemarle
Refinery Catalysts & Other Specialty Chemicals | | | 1,338,000
| | |
| | | | | | | | 8,396,800 | | |
| | | Waste Management – 0.6% | |
| | 184,200 | | | Waste Connections (a)
Solid Waste Management | | | 5,815,194
| | |
| | | Electrical Components – 0.5% | |
| | 145,000 | | | Acuity Brands
Commercial Lighting Fixtures | | | 5,061,950
| | |
| | | Steel – 0.3% | |
| | 100,000 | | | Haynes International (a)
Producer of High Performance Alloys | | | 2,462,000
| | |
| | | | | Total Industrial Goods & Services | | | 151,560,892 | | |
| | | Consumer Goods & Services – 13.0% | |
| | | Other Consumer Services – 4.7% | |
| | 423,000 | | | ITT Educational Services (a)
Post-secondary Degree Services | | | 40,176,540
| | |
| | 150,000 | | | Weight Watchers International
Weight Loss Programs | | | 4,413,000
| | |
| | | | | | | | 44,589,540 | | |
Number of
Shares | | | | Value | |
| | | Apparel – 2.3% | |
| | 891,745 | | | True Religion Apparel (a)
Premium Denim | | | $11,093,308
| | |
| | 459,000 | | | Coach (a)
Designer & Retailer of Branded Leather Accessories | | | 9,533,430
| | |
| | 15,500 | | | Deckers Outdoor (a)
Fashion Footwear Wholesaler | | | 1,237,985
| | |
| | | | | | | | 21,864,723 | | |
| | | Retail – 1.7% | |
| | 575,000 | | | Urban Outfitters (a)
Apparel & Home Specialty Retailer | | | 8,613,500
| | |
| | 126,000 | | | Abercrombie & Fitch
Teen Apparel Retailer | | | 2,906,820
| | |
| | 120,000 | | | PetSmart
Pet Goods Retailer | | | 2,214,000
| | |
| | 479,000 | | | Talbots
Women's Specialty Retailer | | | 1,144,810
| | |
| | 150,000 | | | Gaiam (a)
Healthy Living Catalogs & E-Commerce | | | 693,000
| | |
| | 30,000 | | | Dick's Sporting Goods (a)
Sporting Goods Retailer | | | 423,300
| | |
| | | | | | | | 15,995,430 | | |
| | | Furniture & Textiles – 1.1% | |
| | 665,000 | | | Knoll
Office Furniture | | | 5,998,300
| | |
| | 310,000 | | | Herman Miller
Office Furniture | | | 4,039,300
| | |
| | | | | | | | 10,037,600 | | |
| | | Other Durable Goods – 0.9% | |
| | 288,400 | | | Cavco Industries (a)
Higher End Manufactured Homes | | | 7,755,076
| | |
| | 1,478,300 | | | Champion Enterprises (a)
Manufactured Homes | | | 827,848
| | |
| | | | | | | | 8,582,924 | | |
| | | Consumer Goods Distribution – 0.8% | |
| | 433,500 | | | Pool
Distributor of Swimming Pool Supplies & Equipment | | | 7,789,995 | | |
| | | Casinos & Gaming – 0.4% | |
| | 555,000 | | | Pinnacle Entertainment (a)
Regional Casino Operator | | | 4,262,400 | | |
See accompanying notes to financial statements.
9
Wanger USA 2008 Annual Report
Wanger USA
Statement of Investments, December 31, 2008
Number of
Shares | | | | Value | |
| | | Travel – 0.4% | |
| | 160,000 | | | Vail Resorts (a)
Ski Resort Operator & Developer | | | $4,256,000
| | |
| | | Nondurables – 0.4% | |
| | 312,000 | | | Jarden (a)
Branded Household Products | | | 3,588,000
| | |
| | | Leisure Products – 0.3% | |
| | 140,000 | | | Thor Industries
RV & Bus Manufacturer | | | 1,845,200
| | |
| | 150,000 | | | Winnebago
Premier Motor Home Maker | | | 904,500
| | |
| | | | | | | | 2,749,700 | | |
| | | | | Total Consumer Goods & Services | | | 123,716,312 | | |
| | | Health Care – 10.7% | |
| | | Biotechnology & Drug Delivery – 4.0% | |
| | 150,000 | | | Myriad Genetics (a)
Drugs/Diagnostics Hybrid | | | 9,939,000
| | |
| | 405,000 | | | BioMarin (a)
Biotech Focused on Orphan Diseases | | | 7,209,000
| | |
| | 561,400 | | | Seattle Genetics (a)
Antibody-based Therapies for Cancer | | | 5,018,916
| | |
| | 125,000 | | | Auxilium Pharmaceuticals (a)
Biotech Focused on Niche Disease Areas | | | 3,555,000
| | |
| | 535,000 | | | Nektar Therapeutics (a)
Drug Delivery Technologies | | | 2,974,600
| | |
| | 43,000 | | | United Therapeutics (a)
Biotech Focused on Rare Diseases | | | 2,689,650
| | |
| | 545,000 | | | Array Biopharma (a)
Drugs for Cancer & Inflammatory Diseases | | | 2,207,250
| | |
| | 320,000 | | | Medarex (a)
Humanized Antibodies | | | 1,785,600
| | |
| | 401,000 | | | Arena Pharmaceuticals (a)
Novel Drug Targeting Technology | | | 1,672,170
| | |
| | 189,000 | | | Savient Pharmaceuticals (a)
Biotech Company Focused on Niche Disease Areas | | | 1,094,310
| | |
| | 500,000 | | | IsoRay (a) | | | 100,000 | | |
| | 100,000 | | | IsoRay – Warrants (a) (c)
Radiology Cancer Company | | | 5,000
| | |
Number of
Shares | | | | Value | |
| | 400,000 | | | Neurogen (a)
Development-stage Biotech Focused on Neurology | | | $57,600
| | |
| | 738,060 | | | Medicure – Warrants (a) (c) | | | 4,059 | | |
| | | | | Cardiovascular Biotech Company | | | | | |
| | 25,000 | | | Locus Pharmaceuticals, Series A-1, Pfd. (a) (c) | | | 3,750 | | |
| | 12,886 | | | Locus Pharmaceuticals, Series B-1, Pfd. (a) (c)
High Throughput Rational Drug Design | | | 1,933
| | |
| | | | | | | | 38,317,838 | | |
| | | Medical Supplies – 2.3% | |
| | 255,000 | | | Luminex (a)
Instrument/Consumables Supplier | | | 5,446,800
| | |
| | 180,000 | | | Immucor (a)
Automated Blood Typing | | | 4,784,400
| | |
| | 70,700 | | | Techne
Cytokines, Antibodies & Other Reagents for Life Science | | | 4,561,564
| | |
| | 105,000 | | | Meridian Biosciences
Niche Diagnostics/Life Science Company | | | 2,674,350
| | |
| | 255,000 | | | Cepheid (a)
Molecular Diagnostic Company | | | 2,646,900
| | |
| | 53,000 | | | Idexx Laboratories (a)
Diagnostic Equipment & Services for Veterinarians | | | 1,912,240
| | |
| | | | | | | | 22,026,254 | | |
| | | Health Care Services – 1.6% | |
| | 435,000 | | | PSS World Medical (a)
Medical Supplies | | | 8,186,700
| | |
| | 242,000 | | | Psychiatric Solutions (a)
Behavioral Health Services | | | 6,739,700
| | |
| | | | | | | | 14,926,400 | | |
| | | Medical Equipment & Devices – 1.5% | |
| | 235,000 | | | Alexion Pharmaceuticals (a)
Biotech Focused on Orphan Diseases | | | 8,504,650
| | |
| | 169,000 | | | Illumina (a)
Leading Tools & Service Provider for Genetic Analysis | | | 4,402,450
| | |
| | 75,000 | | | Kinetic Concepts (a)
Wound Healing & Tissue Repair | | | 1,438,500
| | |
| | | | | | | | 14,345,600 | | |
| | | Pharmaceuticals – 1.3% | |
| | 145,000 | | | Cephalon (a)
Specialty Pharmaceuticals for Pain, Central
Nervous System & Oncology | | | 11,170,800
| | |
See accompanying notes to financial statements.
10
Wanger USA 2008 Annual Report
Wanger USA
Statement of Investments, December 31, 2008
Number of
Shares | | | | Value | |
| | | Pharmaceuticals – 1.3% (cont) | |
| | 309,380 | | | QLT (a)
Specialty Pharmaceuticals for
Ophthalmology & Dermatology | | | $745,606
| | |
| | | | | | | | 11,916,406 | | |
| | | | | Total Health Care | | | 101,532,498 | | |
| | | Energy & Minerals – 7.2% | |
| | | Oil & Gas Producers – 3.8% | |
| | 400,000 | | | Ultra Petroleum (a)
Oil & Gas Producer | | | 13,804,000
| | |
| | 307,200 | | | Southwestern Energy (a)
Oil & Gas Producer | | | 8,899,584
| | |
| | 420,000 | | | Carrizo Oil & Gas (a)
Explores for Natural Gas & Crude Oil | | | 6,762,000
| | |
| | 88,000 | | | Equitable Resources
Natural Gas Producer & Utility | | | 2,952,400
| | |
| | 95,000 | | | Penn Virginia
Diversified Energy Producer | | | 2,468,100
| | |
| | 265,000 | | | Quicksilver Resources (a)
Natural Gas & Coal Seam Gas Producer | | | 1,476,050
| | |
| | | | | | | | 36,362,134 | | |
| | | Oil Services – 3.4% | |
| | 686,400 | | | FMC Technologies (a)
Oil & Gas Wellhead Manufacturer | | | 16,356,912
| | |
| | 460,000 | | | Atwood Oceanics (a)
Offshore Drilling Contractor | | | 7,028,800
| | |
| | 203,125 | | | Exterran Holdings (a)
Natural Gas Compressor Rental & Fabrication | | | 4,326,562
| | |
| | 107,000 | | | Bristow (a)
Largest Provider of Helicopter Services to
Offshore Oil & Gas Producers | | | 2,866,530
| | |
| | 108,700 | | | Tesco (a)
Developing New Well Drilling Technologies | | | 776,118 | | |
| | 120,000 | | | Tetra Technologies (a)
U.S.-based Service Company with Life of Field Approach | | | 583,200 | | |
| | 11,900 | | | Oceaneering International (a)
Provider of Sub-sea Services & Manufactured Products | | | 346,766 | | |
| | | | | | | | 32,284,888 | | |
| | | | | Total Energy & Minerals | | | 68,647,022 | | |
Number of
Shares or
Principal Amount | | | | Value | |
| | | Other Industries – 3.1% | |
| | | Transportation – 1.6% | |
| | 580,800 | | | Heartland Express
Regional Trucker | | | $9,153,408
| | |
| | 160,000 | | | JB Hunt Transport Services
Truck & Intermodal Carrier | | | 4,203,200
| | |
| | 180,000 | | | Rush Enterprises, Class A (a)
Truck Distribution | | | 1,542,600
| | |
| | | | | | | | 14,899,208 | | |
| | | Real Estate – 1.5% | |
| | 100,000 | | | Digital Realty Trust
Technology-focused Office Buildings | | | 3,285,000
| | |
| | 85,000 | | | Corporate Office Properties
Office Buildings | | | 2,609,500
| | |
| | 222,500 | | | Gaylord Entertainment (a)
Convention Hotels | | | 2,411,900
| | |
| | 196,000 | | | Extra Space Storage
Self Storage Facilities | | | 2,022,720
| | |
| | 90,000 | | | American Campus Communities
Student Housing | | | 1,843,200
| | |
| | 120,000 | | | BioMed Realty Trust
Life Science-focused Office Buildings | | | 1,406,400
| | |
| | 150,000 | | | Kite Realty Group
Community Shopping Centers | | | 834,000
| | |
| | | | | | | | 14,412,720 | | |
| | | | | Total Other Industries | | | 29,311,928 | | |
| Total Common Stocks (Cost: $1,045,583,446) – 96.8% | | | 921,782,882 | | |
| Short-Term Obligations – 2.4% | | | |
| | | Repurchase Agreement – 2.0% | |
| $ | 18,874,000 | | | Repurchase Agreement with Fixed
Income Clearing Corp., dated
12/31/08, due 1/02/09 at 0.010%,
collateralized by a U.S. Treasury
Obligation, maturing 11/17/15,
market value $19,256,475
(repurchase proceeds $18,874,010) | | | 18,874,000 | | |
| | | Commercial Paper – 0.4% | |
| | 4,400,000 | | | Toyota Motor Credit
0.55% due 1/23/09 | | | 4,398,521 | | |
| Total Short-Term Obligations (Cost: $23,272,521) – 2.4% | | | 23,272,521 | | |
See accompanying notes to financial statements.
11
Wanger USA 2008 Annual Report
Wanger USA
Statement of Investments, December 31, 2008
| | Value | |
| Total Investments (Cost: $1,068,855,967) – 99.2% (d) | | $ | 945,055,403 | | |
| Cash and Other Assets Less Liabilities – 0.8% | | | 7,193,662 | | |
| Total Net Assets – 100.0% | | $ | 952,249,065 | | |
Notes to Statement of Investments:
(a) Non-income producing security.
(b) An affiliated person of the Fund may include any company in which the Fund owns five percent or more of its outstanding voting shares. Transactions in this affiliated company during the twelve months ended December 31, 2008 are as follows:
Affiliate | | Balance
of Shares
Held
12/31/2007 | |
Purchases/
Additions | |
Sales/
Reductions | | Balance
of Shares
Held
12/31/2008 | |
Value | |
Dividend | |
RCM
Technologies | | | 753,000 | | | | — | | | | — | | | | 753,000 | | | $ | 813,240 | | | $ | — | | |
The aggregate cost and value of this company at December 31, 2008, were $5,474,962 and $813,240 respectively. Investments in the affiliated company represented 0.09% of total net assets at December 31, 2008.
(c) Denotes a restricted security, which is subject to restrictions on resale under federal securities laws. These securities are valued at their fair value determined in good faith under consistently applied procedures established by the Board of Trustees. At December 31, 2008, these securities amounted to $14,742 which represents less than 0.01% of total net assets.
Additional information on these securities is as follows:
Security | | Acquisition
Dates | | Shares | | Cost | | Value | |
Locus Pharmaceuticals,
Series A-1, Pfd. | | 9/5/01 | | | 25,000 | | | $ | 1,000,000 | | | $ | 3,750 | | |
Locus Pharmaceuticals,
Series B-1, Pfd. | | 2/8/07 | | | 12,886 | | | | 37,369 | | | | 1,933 | | |
| IsoRay – Warrants | | 3/21/07 | | | 100,000 | | | | — | | | | 5,000 | | |
| Medicure – Warrants | | 12/22/06 | | | 738,060 | | | | — | | | | 4,059 | | |
| | | | | | | | | $ | 1,037,369 | | | $ | 14,742 | | |
(d) At December 31, 2008, for federal income tax purposes cost of investments was $1,069,639,883 and net unrealized depreciation was $124,584,480 consisting of gross unrealized appreciation of $208,132,856 and gross unrealized depreciation of $332,717,336.
At December 31, 2008, the Fund held investments in the following sectors:
| Sector | | Percentage of
Net Assets | |
| Information | | | 27.5 | | |
| Finance | | | 19.4 | | |
| Industrial Goods & Services | | | 15.9 | | |
| Consumer Goods & Services | | | 13.0 | | |
| Health Care | | | 10.7 | | |
| Energy & Minerals | | | 7.2 | | |
| Other Industries | | | 3.1 | | |
| Short-Term Obligations | | | 2.4 | | |
| Cash and Other Assets less Liabilities | | | 0.8 | | |
| | | | 100.0 | | |
ADR = American Depositary Receipts
See accompanying notes to financial statements.
12
Wanger USA 2008 Annual Report
Statement of Assets and Liabilities
December 31, 2008
| Assets: | |
| Unaffiliated investments, at cost | | $ | 1,063,381,005 | | |
| Affiliated investments, at cost (See Note 4) | | | 5,474,962 | | |
| Unaffiliated investments, at value | | $ | 944,242,163 | | |
| Affiliated investments, at value (See Note 4) | | | 813,240 | | |
| Cash | | | 257 | | |
| Receivable for: | |
| Investments sold | | | 407,606 | | |
| Fund shares sold | | | 7,808,944 | | |
| Interest | | | 5 | | |
| Dividends | | | 610,014 | | |
| Trustees' deferred compensation plan | | | 52,813 | | |
| Other assets | | | 7,262 | | |
| Total Assets | | | 953,942,304 | | |
| Liabilities: | |
| Payable for: | |
| Investments purchased | | | 611,809 | | |
| Fund shares repurchased | | | 131,003 | | |
| Investment advisory fee | | | 653,050 | | |
| Administration fee | | | 37,990 | | |
| Transfer agent fee | | | 58 | | |
| Trustees' fees | | | 26 | | |
| Custody fee | | | 4,175 | | |
| Reports to shareholders | | | 164,181 | | |
| Chief compliance officer expenses | | | 2,789 | | |
| Trustees' deferred compensation plan | | | 52,813 | | |
| Other liabilities | | | 35,345 | | |
| Total Liabilities | | | 1,693,239 | | |
| Net Assets | | $ | 952,249,065 | | |
| Composition of Net Assets: | |
| Paid-in capital | | $ | 1,143,892,687 | | |
| Accumulated net investment loss | | | (52,813 | ) | |
| Accumulated net realized loss | | | (67,790,245 | ) | |
| Net unrealized depreciation on investments | | | (123,800,564 | ) | |
| Net Assets | | $ | 952,249,065 | | |
| Fund Shares Outstanding | | | 49,336,590 | | |
Net asset value, offering price and redemption
price per share | | $ | 19.30 | | |
Statement of Operations
For the Year Ended December 31, 2008
| Investment Income: | |
| Dividends (net of foreign taxes withheld of $2,230) | | $ | 9,016,119 | | |
| Interest income | | | 379,380 | | |
| Securities lending income | | | 101,365 | | |
| Total Investment Income | | | 9,496,864 | | |
| Expenses: | |
| Investment advisory fee | | | 11,596,843 | | |
| Administration fee | | | 679,872 | | |
| Transfer agent fee | | | 657 | | |
| Trustees' fees | | | 71,892 | | |
| Custody fee | | | 50,120 | | |
| Chief compliance officer expenses (See Note 4) | | | 41,077 | | |
| Other expenses (See Note 5) | | | 640,693 | | |
| Total Expenses | | | 13,081,154 | | |
| Custody earnings credit | | | (2,464 | ) | |
| Net Expenses | | | 13,078,690 | | |
| Net Investment Loss | | | (3,581,826 | ) | |
Net Realized and Unrealized Gain (Loss) on
Investments: | |
| Net loss on Investments | | | (67,478,097 | ) | |
| Net realized loss | | | (67,478,097 | ) | |
Net change in unrealized appreciation
(depreciation) on: | | | | | |
| Unaffiliated Investments | | | (548,986,214 | ) | |
| Affiliated investments (See Note 4) | | | (3,614,400 | ) | |
Net change in unrealized appreciation
(depreciation) on investments | | | (552,600,614 | ) | |
| Net Loss | | | (620,078,711 | ) | |
| Net Decrease in Net Assets from Operations | | $ | (623,660,537 | ) | |
See accompanying notes to financial statements.
13
Wanger USA 2008 Annual Report
Statement of Changes in Net Assets
| | | Year Ended December 31, | |
| Increase (Decrease) in Net Assets | | 2008 | | 2007 | |
| Operations: | |
| Net investment loss | | $ | (3,581,826 | ) | | $ | (2,803,605 | ) | |
| Net realized gain (loss) on investments | | | (67,478,097 | ) | | | 170,386,161 | | |
Net change in unrealized appreciation (depreciation)
on investments | | | (552,600,614 | ) | | | (89,827,618 | ) | |
| Net Increase (Decrease) in Net Assets from Operations | | | (623,660,537 | ) | | | 77,754,938 | | |
| Distributions to Shareholders: | |
| From net realized gains | | | (170,275,092 | ) | | | (85,256,052 | ) | |
| Share Transactions: | |
| Subscriptions | | | 90,782,720 | | | | 217,123,775 | | |
| Distributions reinvested | | | 170,275,092 | | | | 85,256,052 | | |
| Redemptions | | | (202,913,271 | ) | | | (215,178,752 | ) | |
| Net Increase from Share Transactions | | | 58,144,541 | | | | 87,201,075 | | |
| Total Increase (Decrease) in Net Assets | | | (735,791,088 | ) | | | 79,699,961 | | |
| Net Assets: | |
| Beginning of period | | | 1,688,040,153 | | | | 1,608,340,192 | | |
| End of period | | $ | 952,249,065 | | | $ | 1,688,040,153 | | |
| Accumulated net investment loss at end of period | | $ | (52,813 | ) | | $ | (41,332 | ) | |
See accompanying notes to financial statements.
14
Wanger USA 2008 Annual Report
Financial Highlights
| | | Year Ended December 31, | |
| Selected data for a share outstanding throughout each period | | 2008 | | 2007 | | 2006 | | 2005 | | 2004 | |
| Net Asset Value, Beginning of Period | | $ | 36.26 | | | $ | 36.36 | | | $ | 34.90 | | | $ | 31.37 | | | $ | 26.51 | | |
| Income from Investment Operations: | |
| Net investment income (loss) (a) | | | (0.07 | ) | | | (0.05 | )(b) | | | (0.02 | ) | | | 0.09 | | | | (0.14 | ) | |
| Net realized and unrealized gain (loss) on investments | | | (13.16 | ) | | | 1.91 | | | | 2.71 | | | | 3.44 | | | | 5.00 | | |
| Total from Investment Operations | | | (13.23 | ) | | | 1.86 | | | | 2.69 | | | | 3.53 | | | | 4.86 | | |
| Less Distributions to Shareholders: | |
| From net investment income | | | — | | | | — | | | | (0.08 | ) | | | — | | | | — | | |
| From net realized gains | | | (3.73 | ) | | | (1.96 | ) | | | (1.15 | ) | | | — | | | | — | | |
| Total Distributions to Shareholders | | | (3.73 | ) | | | (1.96 | ) | | | (1.23 | ) | | | — | | | | — | | |
| Net Asset Value, End of Period | | $ | 19.30 | | | $ | 36.26 | | | $ | 36.36 | | | $ | 34.90 | | | $ | 31.37 | | |
| Total Return (c) | | | (39.68 | )% | | | 5.39 | % | | | 7.87 | % | | | 11.25 | %(d) | | | 18.33 | % | |
| Ratios to Average Net Assets/Supplemental Data: | |
| Net expenses before interest expense (e) | | | 0.96 | % | | | 0.95 | % | | | 0.95 | % | | | 0.95 | % | | | 1.00 | % | |
| Interest expense | | | — | | | | — | | | | 0.00 | %(f) | | | — | | | | — | | |
| Net expenses (e) | | | 0.96 | % | | | 0.95 | % | | | 0.95 | % | | | 0.95 | % | | | 1.00 | % | |
| Net investment income (loss) (e) | | | (0.26 | )% | | | (0.15 | )% | | | (0.07 | )% | | | 0.29 | % | | | (0.49 | )% | |
| Waiver | | | — | | | | — | | | | — | | | | 0.00 | %(f) | | | — | | |
| Portfolio turnover rate | | | 22 | % | | | 27 | % | | | 19 | % | | | 11 | % | | | 15 | % | |
| Net assets, end of period (000's) | | $ | 952,249 | | | $ | 1,688,040 | | | $ | 1,608,340 | | | $ | 1,493,695 | | | $ | 1,153,553 | | |
(a) Net investment income (loss) per share was based upon the average shares outstanding during the period.
(b) Net investment income per share reflects special dividends. The effect of these dividends amounted to $0.08 per share.
(c) Total return at net asset value assuming all distributions are reinvested.
(d) Had the investment advisor not waived a portion of expenses, total return would have been reduced.
(e) The benefits derived from custody fees paid indirectly had an impact of less than 0.01%.
(f) Rounds to less than 0.01%.
See accompanying notes to financial statements.
15
Wanger USA 2008 Annual Report
Notes to Financial Statements
1. Nature of Operations
Wanger USA (the "Fund"), is a series of Wanger Advisors Trust (the "Trust"), an open-end management investment company organized as a Massachusetts business trust. The investment objective of the Fund is to seek long-term capital appreciation. The Fund is available only for allocation to certain life insurance company separate accounts established for the purpose of funding qualified and non-qualified variable annuity contracts and variable life insurance policies and may also be offered directly to certain types of pension plans and retirement arrangements.
Effective June 1, 2008, Wanger U.S. Smaller Companies was renamed Wanger USA.
2. Significant Accounting Policies
Security valuation
Securities of the Fund are valued at market value or, if a market quotation for a security is not readily available or is deemed not to be reliable because of events or circumstances that have occurred between the market quotation and the time as of which the security is to be valued, the security is valued at its fair value determined in good faith under consistently applied procedures established by the Board of Trustees. A security traded on a securities exchange or in an over-the-counter market in which transaction prices are reported is valued at the last sales price at the time of valuation. A security traded principally on NASDAQ is valued at the NASDAQ official closing price. A security for which there is no reported sale on the valuation date is valued at the latest bid quotation. Short-term investments maturing in 60 days or less are valued at amortized cost, which approximates market value. A security for which a mark et quotation is not readily available and any other assets are valued at its fair value determined in good faith under consistently applied procedures established by the Board of Trustees. The Trust has retained an independent statistical fair value pricing service to assist in the fair valuation process for securities principally traded in a foreign market in order to adjust for possible changes in value that may occur between the close of the foreign market and the time as of which the securities are to be valued. If a security is valued at fair value, that value may be different from the last quoted market price for the security.
On January 1, 2008, the Fund adopted Statement of Financial Accounting Standards No. 157, Fair Value Measurements ("SFAS 157"). Under SFAS 157, various inputs are used in determining the value of the Fund's investments. These inputs are summarized in the three broad levels listed below:
• Level 1—quoted prices in active markets for identical securities
• Level 2—other significant observable inputs (including quoted prices for similar securities, interest rates, prepayment speeds, credit risk and others)
• Level 3—significant unobservable inputs (including management's own assumptions in determining the value of investments)
The inputs or methodologies used for valuing securities are not necessarily an indication of the risk associated with investing in those securities.
Examples of the types of securities in which the Fund would typically invest and how they are classified within this SFAS 157 hierarchy are as follows. Typical level 1 securities include exchange traded domestic equities, mutual funds whose NAVs are published each day and exchange traded foreign equities that are not statistically fair valued. Typical level 2 securities include exchange traded foreign equities that are statistically fair valued and short-term investments valued at amortized cost. Typical level 3 securities include any security fair valued by the Fund's Valuation Committee that relies on significant unobservable inputs.
The following table summarizes the inputs used, as of December 31, 2008, in valuing the Fund's assets:
| Valuation Inputs | | Investments in
Securities | | Other Financial
Instruments | |
| Level 1—Quoted Prices | | $ | 921,768,140 | | | $ | — | | |
| Level 2—Other Significant Observable Inputs | | | 23,281,580 | | | | — | | |
| Level 3—Significant Unobservable Inputs | | | 5,683 | | | | — | | |
| Total | | $ | 945,055,403 | | | $ | — | | |
The following table reconciles assets balances for the year ended December 31, 2008 in which significant unobservable inputs (Level 3) were used in determining value:
| | | Investments in
Securities | | Other Financial
Instruments | |
| Balance as of December 31, 2007 | | $ | 98,504 | | | $ | — | | |
| Accretion of Discounts/Amortization of Premiums | | | — | | | | — | | |
| Realized Gain/(Loss) | | | — | | | | — | | |
| Change in Unrealized Depreciation | | | (92,821 | ) | | | — | | |
| Net Purchases (Sales) | | | — | | | | — | | |
| Transfers In or Out of Level 3 | | | — | | | | — | | |
| Balance as of December 31, 2008 | | $ | 5,683 | | | $ | — | | |
Repurchase agreements
The Fund may engage in repurchase agreement transactions. The Fund, through its custodians, receives delivery of underlying securities collateralizing each repurchase agreement. The counterparty is required to maintain collateral that is at all times at least equal to the repurchase price including interest. In the event of default or bankruptcy by the other party to the agreement, realization and/or retention of the collateral may be subject to legal proceedings.
Foreign currency translations
Values of investments denominated in foreign currencies are converted into
U.S. dollars using the spot market rate of exchange at the time of valuation. Purchases and sales of investments and dividend and interest income are translated into U.S. dollars using the spot market rate of exchange prevailing on the respective dates of such transactions. The gain or loss resulting from changes in foreign exchange rates is included with net realized and unrealized gain or loss from investments, as appropriate.
In March 2008, Statement of Financial Accounting Standards No. 161, Disclosures about Derivative Instruments and Hedging Activities—an amendment of FASB Statement No. 133 ("SFAS 161"), was issued. SFAS 161 is effective for fiscal years beginning after November 15, 2008. SFAS 161 requires additional discussion about the reporting entity's derivative instruments and hedging activities, by providing for qualitative disclosures about the objectives and strategies for using derivatives, quantitative data about the fair value of and gains and losses on derivative contracts, and details of credit-risk-related contingent features in their hedged positions. Management is evaluating the impact the application of SFAS 161 will have on the Fund's financial statement disclosures.
Securities lending
The Fund may lend up to one-third of the value of its total assets to certain approved brokers, dealers and other financial institutions to earn additional income. The Fund retained the benefits of owning the securities, including receipt of dividends or interest generated by the security. The Fund also received a fee for the loan. The Fund had the ability to recall the loans at any time and could do so in order to vote proxies or to sell the loaned securities. Each loan was collateralized by cash that exceeded the value of the securities on loan. The market value of the loaned securities was determined at the close of business of the Fund and any additional required collateral is delivered to
16
Wanger USA 2008 Annual Report
Notes to Financial Statements, continued
each Fund on the next business day. The collateral was invested in the Dreyfus Government Cash Management Fund and the income earned was paid to the Fund, net of any fees remitted to Goldman Sachs Agency Lending as the lending agent and borrower rebates. Generally, in the event of borrower default, the Fund had the right to use the collateral to offset any losses incurred. In the event the Fund was delayed or prevented from exercising its right to dispose of the collateral, there may be a potential loss to the Fund. Some of these losses may be indemnified by the lending agent. The Fund bore the risk of loss with respect to the investment of collateral.
The Fund began lending securities in the third quarter of 2008. Due to the turmoil in the financial markets, the Fund suspended securities lending activities on September 17, 2008. No new loans were made after that date and notice was given to the Fund's lending agent to recall the securities on loan. Resumption of securities lending may be reconsidered as market conditions improve. The net lending income earned in 2008 by the Fund is included in the Statement of Operations.
Security transactions and investment income
Security transactions are accounted for on the trade date (date the order to buy or sell is executed) and dividend income is recorded on the ex-dividend date, except that certain dividends from foreign securities are recorded as soon as the information is available to the Fund. Interest income is recorded on the accrual basis and includes amortization of discounts on debt obligations when required for federal income tax purposes. Realized gains and losses from security transactions are recorded on an identified cost basis.
Awards, if any, from class action litigation related to securities owned may be recorded as a reduction of cost of those securities. If the applicable securities are no longer owned, the proceeds are recorded as realized gains.
Restricted securities
Restricted securities are securities that may only be resold upon registration under federal securities laws or in transactions exempt from registration. In some cases, the issuer of restricted securities has agreed to register such securities for resale at the issuer's expense either upon demand by the Fund or in connection with another registered offering of the securities. Many restricted securities may be resold in the secondary market in transactions exempt from registration. Such restricted securities may be determined to be liquid under criteria established by the Board of Trustees. The Fund will not incur any registration costs upon such resale.
Use of estimates
The preparation of financial statements in conformity with accounting principles generally accepted in the United States of America ("GAAP") requires management to make estimates and assumptions that affect the amounts reported in the financial statements and accompanying notes. Actual results may differ from those estimates.
Fund share valuation
Fund shares are sold and redeemed on a continuing basis at net asset value. Net asset value per share is determined daily as of the close of trading on the New York Stock Exchange ("the Exchange") on each day the Exchange is open for trading by dividing the total value of the Fund's investments and other assets, less liabilities, by the number of Fund shares outstanding.
Custody fees/credits
Custody fees are reduced based on the Fund's cash balances maintained with the custodian. The amount is disclosed as a reduction of total expenses in the Statement of Operations.
Federal income taxes
The Fund has complied with the provisions of the Internal Revenue Code available to regulated investment companies and, in the manner provided therein, distributes all its taxable income, as well as any net realized gain on sales of investments and foreign currency transactions reportable for federal income tax purposes. Accordingly, the Fund paid no federal income taxes and no federal income tax provision was required.
Expenses
General expenses of the Trust are allocated to the Fund and the other series of the Trust based upon relative net assets or other expense allocation methodologies determined by the nature of the expense. Expenses directly attributable to the Fund are charged to the Fund.
Foreign capital gains taxes
Gains in certain countries may be subject to foreign taxes at the fund level, at rates ranging from 10%-15%. The Fund accrues for such foreign taxes on net realized and unrealized gains at the appropriate rate for each jurisdiction.
Distributions to shareholders
Distributions to shareholders are recorded on the ex-dividend date.
Indemnification
In the normal course of business, the Trust on behalf of the Fund enters into contracts that contain a variety of representations and warranties and that provide general indemnities. The Fund's maximum exposure under these arrangements is unknown, as this would involve future claims against the Fund. Also under the Trust's organizational documents, the trustees and officers of the Trust are indemnified against certain liabilities that may arise out of their duties to the Trust. However based on experience, the Fund expects the risk of loss due to these warranties and indemnities to be minimal.
3. Federal Tax Information
The timing and character of income and capital gain distributions are determined in accordance with income tax regulations, which may differ from GAAP. Reclassifications are made to the Fund's capital accounts for permanent tax differences to reflect income and gains available for distribution (or available capital loss carryforwards) under income tax regulations.
For the year ended December 31, 2008, permanent book and tax basis differences resulting primarily from differing treatments for net operating losses were identified and reclassified among the components of the Fund's net assets as follows:
Accumulated
Net Investment
Loss | | Accumulated
Net Realized
Loss | | Paid-In Capital | |
| $ | 3,570,345 | | | $ | 46,364 | | | $ | (3,616,709 | ) | |
Net investment income and net realized gains/(losses), as disclosed on the Statement of Operations, and net assets were not affected by this reclassification.
The tax character of distributions paid during the years ended December 31, 2008 and December 31, 2007 were as follows:
| | | December 31, 2008 | | December 31, 2007 | |
| Distributions paid from: | |
| Ordinary Income* | | $ | — | | | $ | 1,760,549 | | |
| Long-Term Capital Gains | | | 170,275,092 | | | | 83,495,503 | | |
* For tax purposes short-term capital gain distributions, if any, are considered ordinary income distributions.
17
Wanger USA 2008 Annual Report
Notes to Financial Statements, continued
As of December 31, 2008, the components of distributable earnings on a tax basis were as follows:
Undistributed
Ordinary
Income | | Undistributed
Long-term
Capital Gains | | Net
Unrealized
Depreciation* | |
| $ | — | | | $ | — | | | $ | (124,584,480 | ) | |
* The differences between book-basis and tax-basis net unrealized appreciation/depreciation are primarily due to deferral of losses from wash sales.
The following capital loss carryforwards, determined as of December 31, 2008, may be available to reduce taxable income arising from future net realized gains on investments, if any, to the extent permitted by the Internal Revenue Code:
Year of
Expiration | | Capital Loss
Carryforward | |
| | 2016 | | | $ | 48,548,576 | | |
Under current tax rules, certain currency and capital losses realized after October 31 may be deferred and treated as occurring on the first day of the following fiscal year. As of December 31, 2008, post-October capital losses of $18,457,746 attributed to security transactions were deferred to January 1, 2009.
Under Financial Accounting Standards Board ("FASB") Interpretation No. 48, Accounting for Uncertainty in Income Taxes—an Interpretation of FASB Statement No. 109 ("FIN 48") management determines whether a tax position of the Fund is more likely than not to be sustained upon examination by the applicable taxing authority, including resolution of any related appeals or litigation processes, based on the technical merits of the position. The tax benefit to be recognized is measured as the largest amount of benefit that is greater than fifty percent likely of being realized upon ultimate settlement. Management has evaluated the known implications of FIN 48 on its computation of net assets for the Fund. As a result of this evaluation, management believes that FIN 48 does not have any effect on the Fund's financial statements. However, management's conclusions regarding FIN 48 may be subject to review and adjustment at a later date based on factors including, but not limited to, further implementation guidance from the FASB, new tax laws, regulations, and administrative interpretations (including relevant court decisions). The Fund's federal tax returns for the prior three fiscal years remain subject to examination by the Internal Revenue Service. The Fund is not aware of any tax positions for which it is reasonably possible that the total amounts of unrecognized tax benefits will significantly change in the next twelve months.
4. Transactions With Affiliates
Columbia Wanger Asset Management, L.P. ("CWAM") is a wholly owned subsidiary of Columbia Management Group, LLC, ("Columbia Management") which in turn is an indirect wholly owned subsidiary of Bank of America Corporation ("BOA"). CWAM furnishes continuing investment supervision to the Fund and is responsible for the overall management of the Fund's business affairs.
Under the Fund's investment advisory agreement, management fees are accrued daily based on the Fund's average daily net assets and paid monthly to CWAM at the annual rates shown in the table below:
| Average Daily Net Assets | | Annual Fee Rate | |
| Up to $100 million | | | 0.94 | % | |
| $100 million to $250 million | | | 0.89 | % | |
| $250 million to $2 billion | | | 0.84 | % | |
| $2 billion and over | | | 0.80 | % | |
For the year ended December 31, 2008, the Fund's effective investment advisory fee rate was 0.85% of average daily net assets.
CWAM provides administrative services and receives an administration fee from the Fund. Effective August 1, 2008, CWAM provides administrative services and receives an administration fee from the Fund at the following annual rates:
Wanger Advisors Trust
Aggregate Average Daily
Net Assets of the Trust: | | Annual Fee Rate | |
| Up to $4 billion | | | 0.05 | % | |
| $4 billion to $6 billion | | | 0.04 | % | |
| $6 billion to $8 billion | | | 0.03 | % | |
| $8 billion and over | | | 0.02 | % | |
Prior to August 1, 2008, administration fees were accrued daily and paid monthly to CWAM at the annual rate of 0.05%.
For the year ended December 31, 2008, the Fund's effective administration fee rate was 0.05% of average daily net assets. CWAM has delegated to Columbia Management Advisors, LLC ("Columbia"), an indirect, wholly owned subsidiary of BOA, the responsibility for certain administrative services.
Certain officers and trustees of the Trust are also officers of CWAM. The Trust makes no direct payments to its officers and trustees who are affiliated with CWAM.
The Board of Trustees appointed a Chief Compliance Officer to the Trust in accordance with federal securities regulations. The Fund, along with other affiliated funds, pays its pro-rata share of the expenses associated with the Office of the Chief Compliance Officer. These expenses are disclosed separately as "Chief compliance officer expenses" in the Statement of Operations.
The Trust offers a deferred compensation plan for its independent trustees. Under that plan, a trustee may elect to defer all or a portion of his or her compensation. Amounts deferred are retained by the Trust and represent an unfunded obligation of the Trust. The value of amounts deferred is determined by reference to the change in value of Class Z shares of one or more series of Columbia Acorn Trust or a money market fund as specified by the trustee. Benefits under the deferred compensation plan are payable when the trustee ceases to be a member of the Board of Trustees.
Columbia Management Distributors, Inc. (the "Distributor"), an affiliate of Columbia and an indirect, wholly owned subsidiary of BOA, serves as the principal underwriter of the Trust and receives no compensation from the Fund for its services.
Columbia Management Services, Inc. (the "Transfer Agent"), an affiliate of Columbia and an indirect, wholly owned subsidiary of BOA, provides shareholder services to the Fund and has subcontracted with Boston Financial Data Services ("BFDS") to serve as subtransfer agent. For such services, the Transfer Agent receives a fee, paid monthly, at the annual rate of $21.00 per open account. The Transfer Agent also receives reimbursement for certain out-of-pocket expenses.
An affiliated person of the Fund may include any company in which the Fund owns five percent or more of its outstanding voting shares. On December 31, 2008, the Fund held five percent or more of the outstanding voting securities of
18
Wanger USA 2008 Annual Report
Notes to Financial Statements, continued
one or more companies. Details of investments in those affiliated companies are presented in the Notes to the Statement of Investments on page 12.
During the year ended December 31, 2008, the Fund engaged in purchase and sales transactions with funds that have a common investment advisor (or affiliated investment advisors), common directors/trustees, and/or common officers. Those purchase and sale transactions complied with provisions of Rule 17a-7 under the Investment Company Act of 1940 and were $0 and $704,000, respectively.
5. Borrowing Arrangements
The Trust participates in a $150 million credit facility, which was entered into to facilitate portfolio liquidity. Interest is charged to each participating fund based on its borrowings at a rate per annum equal to the Federal Funds rate plus 0.50%. In addition, a commitment fee of 0.08% per annum of the unutilized line of credit is accrued and apportioned among the participating funds based on their relative net assets. The commitment fee is included in "Other expenses" in the Statement of Operations. No amounts were borrowed by the Fund under this facility during the year ended December 31, 2008. The Trust enters into this line of credit for one year durations. The Trust has already secured the line of credit for the entire year of 2009.
6. Fund Share Transactions
Proceeds and payments on Fund shares as shown in the Statement of Changes in Net Assets are in respect of the following numbers of shares:
| | | Year Ended
December 31, 2008 | | Year Ended
December 31, 2007 | |
| Shares sold | | | 3,920,844 | | | | 5,698,486 | | |
Shares issued in reinvestment
of dividend distributions | | | 6,081,253 | | | | 2,466,900 | | |
| Less shares redeemed | | | (7,219,133 | ) | | | (5,844,748 | ) | |
| Net increase in shares outstanding | | | 2,782,964 | | | | 2,320,638 | | |
7. Investment Transactions
The aggregate cost of purchases and proceeds from sales other than short-term obligations for the year ended December 31, 2008 were $301,596,753 and $410,825,926, respectively.
8. Legal Proceedings
CWAM, Columbia Acorn Trust (another mutual fund family advised by CWAM), and the trustees of Colombia Acorn Trust (collectively, the "Columbia defendants") are named as defendants in class and derivative complaints that have been consolidated in a Multi-District Action (the "MDL Action") in the federal district court of Maryland. These lawsuits contend that defendants permitted certain investors to market time their trades in certain Columbia Acorn Funds. The MDL Action is ongoing. However, all claims against the Trust and the independent trustees of Columbia Acorn Trust have been dismissed.
Columbia Acorn Trust and CWAM are also defendants in a class action lawsuit that alleges, in summary, that Columbia Acorn Trust and CWAM exposed shareholders of Columbia Acorn International Fund to trading by market timers by allegedly: (a) failing to properly evaluate daily whether a significant event affecting the value of the fund's securities had occurred after foreign markets had closed but before the calculation of the funds' net asset value ("NAV"); (b) failing to implement the fund's portfolio valuation and share pricing policies and procedures; and (c) failing to know and implement applicable rules and regulations concerning the calculation of NAV (the "Fair Valuation Lawsuit"). The Seventh Circuit ruled that the plaintiffs' state law claims were preempted under federal law resulting in the dismissal of plaintiffs' complaint. Plaintiffs appealed the Seventh Circuit's ruling to the United States Supreme Court. The Suprem e Court reversed the Seventh Circuit's ruling on jurisdictional grounds and the case was ultimately remanded to the state court.
On March 21, 2005, a class action complaint was filed against the Trust and CWAM seeking to rescind the CDSC assessed upon redemption of Class B shares of the Columbia Acorn Funds due to the alleged market timing of the Columbia Acorn Funds (the "CDSC Lawsuit"). In addition to the rescission of sales charges, plaintiffs seek recovery of actual damages, attorneys' fees and costs. The case has been transferred to the MDL Action in the federal district court of Maryland.
On September 14, 2007, the plaintiffs and the Columbia defendants named in the MDL Action, including the Columbia Funds, entered into a stipulation of settlement with respect to all Columbia-related claims in the MDL Action described above, including the CDSC and Fair Valuation Lawsuits. The settlement is subject to court approval.
Columbia Acorn Trust and CWAM intend to defend these suits vigorously. CWAM believes that the lawsuits are not likely to materially affect its ability to provide investment management services to the Fund.
19
Wanger USA 2008 Annual Report
Report of Independent Registered Public Accounting Firm
To the Board of Trustees and Shareholders of Wanger USA,
In our opinion, the accompanying statement of assets and liabilities, including the statement of investments, and the related statements of operations and of changes in net assets and the financial highlights present fairly, in all material respects, the financial position of Wanger USA (a series of the Wanger Advisors Trust, hereinafter referred to as the "Fund") at December 31, 2008, the results of its operations for the year then ended, the changes in its net assets for each of the two years in the period then ended and the financial highlights for each of the five years in the period then ended, in conformity with accounting principles generally accepted in the United States of America. These financial statements and financial highlights (hereafter referred to as "financial statements") are the responsibility of the Fund's management; our responsibility is to express an opinion on these financial statements based on our audi ts. We conducted our audits of these financial statements in accordance with the standards of the Public Company Accounting Oversight Board (United States). Those standards require that we plan and perform the audit to obtain reasonable assurance about whether the financial statements are free of material misstatement. An audit includes examining, on a test basis, evidence supporting the amounts and disclosures in the financial statements, assessing the accounting principles used and significant estimates made by management, and evaluating the overall financial statement presentation. We believe that our audits, which included confirmation of securities at December 31, 2008 by correspondence with the custodian and brokers, provide a reasonable basis for our opinion.
PricewaterhouseCoopers LLP
Chicago, Illinois
February 16, 2009
20
Wanger USA 2008 Annual Report
Excerpt from:
Wanger Advisors Trust
Management Fee Evaluation of the Senior Officer
Prepared Pursuant to the New York Attorney General's
Assurance of Discontinuance
May 2008
21
Wanger USA 2008 Annual Report
Introduction
The New York Attorney General's Assurance of Discontinuance ("Order") entered into by Columbia Management Advisors, Inc. ("CMAI") and Columbia Management Distributors, Inc., ("CMDI" and collectively with "CMAI," "CMG") in February 2005, allows CMAI to manage or advise a mutual fund only if the trustees of the fund appoint a "Senior Officer" to perform specified duties and responsibilities. One of these responsibilities includes "managing the process by which proposed management fees (including but not limited to, advisory fees) to be charged the [Funds] are negotiated so that they are negotiated in a manner which is at arms' length and reasonable and consistent with this Assurance of Discontinuance."
This is the second year that the Columbia Acorn Trust and Wanger Advisors Trust (collectively, the "Trusts") and each series thereof (the "Acorn funds," "WAT funds" or collectively, the "Funds") have been overseen by the same Board of Trustees ("Board"). The Order provides that this Board must determine the reasonableness of proposed "management fees" by using either an annual competitive bidding process supervised by the Senior Officer or Independent Fee Consultant, or by obtaining "an annual independent written evaluation prepared by or under the direction of the Senior Officer or the Independent Fee Consultant."
"Management fees" are only part of the costs and expenses paid by mutual fund shareholders. Fund expenses can vary depending upon the class of shares held but usually include: (1) investment management or advisory fees to compensate analysts and portfolio managers for stock research and portfolio management, as well as the cost of operating a trading desk; (2) administrative expenses incurred to prepare registration statements and tax returns, calculate the Funds' net asset values, maintain effective compliance procedures and perform recordkeeping services; (3) transfer agency costs for establishing accounts, accepting and disbursing funds, as well as overseeing trading in Fund shares; (4) custodial expenses incurred to hold the securities purchased by the Funds; and (5) distribution expenses, including commissions paid to brokers that sell the Fund shares to investors.
Columbia Wanger Asset Management, L.P. ("CWAM"), the advisor to the Funds, has proposed that the Trusts continue the existing separate agreements governing the first two categories listed above: an advisory agreement governing portfolio management, and an administration agreement governing certain administration and clerical services. Together the fees paid under these two agreements are referred to as "management fees." Other fund expenses are governed by separate agreements, in particular agreements with two CWAM affiliates: CMDI, the broker-dealer that underwrites and distributes the Funds' shares, and Columbia Management Services, Inc. ("CMSI"), the Funds' transfer agent. In conformity with the terms of the Order, this evaluation, therefore, addresses only the advisory and administrative contracts, and does not extend to the other agreements.
According to the Order, the Senior Officer's evaluation must consider at least the following:
(1) Management fees (including components thereof) charged to institutional and other clients of CWAM for like services;
(2) Management fees (including any components thereof) charged by other mutual fund companies for like services;
(3) Costs to CWAM and its affiliates of supplying services pursuant to the management fee agreements, excluding any intra-corporate profit;
(4) Profit margins of CWAM and its affiliates from supplying such services;
(5) Possible economies of scale as the Funds grow larger; and
(6) The nature and quality of CWAM's services, including the performance of each Fund.
In 2004, the Boards of the two Trusts, then separate groups, each appointed me Senior Officer under the Order. They also determined not to pursue a competitive bidding process and instead, charged me with the responsibility of evaluating the Funds' proposed advisory and administrative fee contracts with CWAM in conformity with the requirements of the Order. This Report is an annual evaluation required under the Order. In discharging their responsibilities, the independent Trustees have also consulted independent, outside counsel.
2007 Evaluation
This is the third annual evaluation prepared in connection with the Order. This evaluation follows the same structure as the earlier studies. Some areas are given more emphasis here, while others are given less. Still, the fundamental information gathered for this evaluation is largely the same as past years. Last year's evaluation is referred to here as the "2007 Study."
Process and Independence
The objectives of the Order are to insure the independent evaluation of the management fees paid by the Funds as well as to insure that all relevant factors are considered. In my view, this contract renewal process has been conducted at arms-length and with independence in gathering, considering and evaluating all relevant data. At the outset of the process, the Trustees sought and obtained from CWAM and CMG a comprehensive compilation of data regarding Fund performance and expenses, advisor profitability, and other information. The Board evaluated this information thoroughly. Performance and expense data was obtained from both Morningstar and Lipper, the leading consultants in this area. The rankings prepared by Morningstar and Lipper were independent and not influenced by the advisor.
In the course of its work, the Contract Committee gave careful consideration to the conclusions and recommendations contained in the 2007 Study. The Contract Committee gave particular emphasis to the issue of whether economies of scale were appropriately reflected in the Funds' fee schedules. The Board accepted and implemented several of the recommendations in this area contained in the 2007 Study.
22
Wanger USA 2008 Annual Report
My evaluation of the advisory contract was shaped, as it was last year, by my experience as Chief Compliance Officer of the Trusts ("CCO"). As CCO, I report solely to the Board and have no reporting obligation to, or employment relationship with, CMG or its affiliates, except for administrative purposes. I have commented on compliance matters in evaluating the quality of service provided by CWAM.
This Report, its supporting materials and the data contained in other materials submitted to the Contract Committee of the Board, in my view, provide a thorough factual basis upon which the Board, in consultation with independent counsel as it deems appropriate, may conduct management fee negotiations that are in the best interests of the Funds' shareholders.
The Fee Reductions Mandated under the Order
Under the terms of the Order, CMG agreed to secure certain management fee reductions for the mutual funds advised by its affiliate investment advisors. In some instances, breakpoints were also established. Although neither CWAM nor the Trusts was a party to the Order, CWAM offered and the Board accepted certain advisory fee reductions during 2005. By the terms of the Order, these fees may not be increased before November 30, 2009. I have used these advisory fee levels, as modified thereafter, in this evaluation because they are the fees in the current agreements that CWAM proposes should be continued. Hence, these fee levels are the starting point of an evaluation.
Conclusions
My review of the data and other material above leads to the following conclusions with respect to the factors identified in the Order.
1. Performance. The domestic WAT Funds generally have achieved good to outstanding performance over the past five years. Wanger Select has, however, suffered a precipitous decline in ranking relative to its peers for the past year, and this trend merits the Trustees' continued attention. The international WAT Funds have relatively weaker relative long term records than do the domestic funds. All the WAT Funds, however, outperform their benchmarks, expose shareholders to less risk than competitors and achieve positive "alpha," a recognized measure of the added value of an investment manager.
2. Management Fees relative to Peers. Management fees vary by WAT Fund, but, in general, the WAT Funds impose higher fees than competing funds. Wanger Select and Wanger USA in particular were ranked by both Lipper and Morningstar at or below the median, and therefore impose higher fees than do the majority of their competitors.
3. Administrative Fees. The WAT Funds' administrative fees appear competitive in relation to their peers, and CWAM provides excellent administrative support for all the WAT Funds. There are clear advantages to retaining the advisor and its affiliates to perform these services. However, while economies of scale exist above current asset levels, the WAT Funds' administrative fee schedule provides no breakpoints.
4. Management Fees relative to Institutional and Other Mutual Fund Accounts. CWAM's focus is on its mutual funds. It does not actively seek to manage separate or institutional accounts. The few institutional accounts it does manage vary in rate structures. Some pay advisory fees commensurate with or higher than the WAT Funds. In a few instances, however, institutional accounts pay lower advisory fees than do the WAT Funds. One particular institutional account is significant in size and has been under CWAM's management for over 25 years.
5. Costs to CWAM and its Affiliates. CWAM's direct costs do not appear excessive. Overhead and indirect costs allocated to CWAM by its parent organizations, however, are significant and have increased dramatically in the past year. CWAM's affiliates report operating losses and therefore do not appear to enjoy excessive "fall out" benefits from CWAM's advisory agreement with the WAT Funds.
6. Profit Margins. CWAM's pre-marketing expense profit margins are at the top of the industry, though these comparisons are hampered by limited industry data. High profit margins are not unexpected for firms that manage large, successful funds and have provided outstanding investment performance for investors.
7. Economies of Scale. Economies of scale do exist at CWAM and will expand as the assets of the WAT Funds get larger. The Board has recently imposed additional breakpoints for some of the WAT Funds that will result in greater sharing of economies of scale.
8. Nature and Quality of Services. This category includes a variety of considerations that are difficult to quantify, yet can have a significant bearing on the performance of the Funds. Several areas merit comment.
a. Capacity. The WAT Funds have continued to grow, posing ever greater challenges in deploying assets effectively. While trends here merit continued monitoring, CWAM appears to be managing assets effectively.
b. Compliance. CWAM has a reasonably designed compliance program that protects shareholders.
9. Process. In my opinion, the process of negotiating an advisory contract for the WAT Funds has been conducted thoroughly and at arms' length. Further, the Trustees have sufficient information to evaluate management's proposal, and negotiate contract terms that are in the best interests of Fund shareholders.
23
Wanger USA 2008 Annual Report
Recommendations
I believe the Trustees should:
1. Consider the addition of breakpoints to the WAT administrative fee contract to reflect the economies of scale present in performing these services, and, in fashioning those breakpoints, to consider the efficiencies achieved by CWAM by supporting both Trusts with the same staff performing largely identical tasks.
2. Focus their review on the WAT Funds' management fee levels in relation to their peers, in particular the fees paid by Wanger USA and Wanger Select.
3. Monitor Wanger Select to ensure that its long term performance is sustained.
Robert P. Scales
May 27, 2008
24
Wanger USA 2008 Annual Report
Board Approval of the Advisory Agreement
Wanger Advisors Trust (the "Trust") has an investment advisory agreement (the "Advisory Agreement") with Columbia Wanger Asset Management, L.P. ("CWAM") under which CWAM manages the Columbia Wanger Family of Funds (the "Funds"). The trustees of the Trust, more than seventy five percent of whom have never been affiliated with CWAM (the "Independent Trustees"), oversee the management of each Fund and, as required by law, determine at least annually whether to continue the Advisory Agreement for each Fund.
The Contract Committee of the board of trustees (the "Committee"), which is comprised of six Independent Trustees, makes recommendations to the board regarding any proposed continuation of the Advisory Agreement. After the Committee has made its recommendations, the full board of trustees determines whether to approve continuation of the Advisory Agreement. The board also considers matters bearing on the Advisory Agreement at its various meetings throughout the year, and meets at least quarterly with CWAM's portfolio managers.
In connection with their most recent consideration of the Advisory Agreement for each Fund, the Committee and all trustees received and reviewed a substantial amount of information provided by CWAM in response to requests from the Independent Trustees and their independent legal counsel. As they considered the Advisory Agreement, the Independent Trustees were advised by independent legal counsel. At each meeting where the Committee or the Independent Trustees considered the Advisory Agreement, they met with management and also met in separate executive session with their independent legal counsel.
The materials reviewed by the Committee and the trustees included, among other items, (i) information on the investment performance of each Fund and its peer groups and performance benchmarks, (ii) information on each Fund's advisory fees and other expenses, including information comparing the Fund's fees and expenses to those of peer groups of funds and information about any applicable expense limitations and fee "breakpoints," (iii) data on sales and redemptions of Fund shares and (iv) information on the profitability to CWAM, as well as potential "fall-out" or ancillary benefits that CWAM and its affiliates may receive as a result of their relationships with the Funds. The trustees also considered other information such as (i) CWAM's financial condition, (ii) each Fund's investment objective and strategies, (iii) the size, education and experience of CWAM's investment staff and its use of technology, external research and tra ding cost measurement tools, (iv) the allocation of the Funds' brokerage, if any, including allocations to brokers affiliated with CWAM, and the use of "soft" commission dollars to pay for research products and services, (v) the resources devoted to, and the record of compliance with, the Funds' investment policies and restrictions, policies on personal securities transactions and other compliance policies and (vi) the economic outlook generally and for the mutual fund industry in particular. In addition, the trustees conferred with, and reviewed the Management Fee Evaluation (the "Fee Evaluation") prepared by the Trust's chief compliance officer, who also serves as the Trust's "Senior Officer," as contemplated by the Assurance of Discontinuance dated February 9, 2005 among affiliates of CWAM and the Office of the New York Attorney General. A summary of the Fee Evaluation is included in this report. Throughout the annual contract renewal process, the trustees had the opportunity to ask questions of and reque st additional materials from CWAM.
The Committee held meetings in May and June 2008 and reported its recommendations to the full board of trustees. On June 11, 2008, the board of trustees unanimously approved continuation through July 31, 2009 of (i) the Advisory Agreement and (ii) the Trust's administrative services agreement with CWAM (the "Administration Agreement"), as amended to reflect the recommendation of the Committee that, effective August 1, 2008, the Trust shall pay CWAM for its services under the agreement a fee accrued daily and paid monthly at the following annual rates, as a percentage of the Trust's aggregate average daily net assets: 0.05% on the first $4 billion; 0.04% on $4 - 6 billion; 0.03% on $6 - 8 billion; and 0.02% on assets over $8 billion.
In considering the continuation of the Advisory Agreement and the continuation of the amended Administration Agreement, the trustees reviewed and analyzed various factors that they determined were relevant, including the factors described below, none of which by itself was considered dispositive. However, the material factors and conclusions that formed the basis for the trustees' determination to approve the continuation of the Advisory Agreement and the amended Administration Agreement are discussed separately below.
Nature, quality and extent of services. The trustees reviewed the nature, quality and extent of the services of CWAM and its affiliates to the Funds, taking into account the investment objective and strategy of each Fund and knowledge gained from meetings with management, which were held on at least a quarterly basis. In addition, the trustees reviewed the available resources and key personnel of CWAM and its affiliates, especially those providing investment management services to the Funds. The trustees also considered other services provided to the Funds by CWAM and its affiliates, including: managing the execution of portfolio transactions and selecting broker-dealers for those transactions; monitoring adherence to the Funds' investment restrictions; producing shareholder reports; providing support services for the board of trustees and committees of the board; communicating with shareholders; serving as the Funds' administrator; and overseeing the activities of the Funds' other service providers, including monitoring for compliance with various policies and procedures as well as applicable securities laws and regulations.
The trustees concluded that the nature, quality and extent of the services provided by CWAM and its affiliates to each Fund were appropriate and consistent with the terms of the Advisory Agreement and the Administration Agreement, and that the quality of those services had been consistent with or superior to quality norms in the industry. The trustees further concluded that the Funds were likely to benefit from the continued provision of those services by CWAM to the Funds. They also concluded that CWAM currently had sufficient personnel, with appropriate education and experience, to serve the Funds effectively, and had demonstrated its continuing ability to attract and retain well qualified personnel.
Performance of the Funds. At various meetings of the board of trustees, the Committee and the investment performance committee of the board, the trustees considered the short-term and longer-term performance of each Fund. They reviewed information comparing each Fund's performance with that of its benchmark(s) and with the performance of comparable funds and peer groups as identified by Lipper Inc. ("Lipper") and Morningstar, Inc. ("Morningstar"). On the domestic side, the trustees discussed how Wanger USA had exceeded its peer category average and beat its primary benchmark for the five year period, according to Morningstar, noting that Lipper's rankings of Wanger USA was somewhat lower than Morningstar's. Wanger Select had a particularly difficult performance year during 2007, which the trustees acknowledged. The trustees also reviewed the performan ce of the international Funds, discussing how both Wanger International and Wanger International Select continued to outperform their benchmarks over the five year period, but not the majority of their peer groups established by Lipper and Morningstar. During the annual contract renewal process, the trustees concluded that, although past performance is not necessarily indicative of future results, the Funds' strong overall longer-term performance record was an important factor in the their evaluation of the quality of services provided by CWAM under the Advisory Agreement.
Costs of Services and Profits Realized by CWAM. At various Committee and board of trustees meetings and other informal meetings, the trustees examined detailed information on the fees and expenses of each Fund in comparison to information for other comparable funds provided by Lipper and Morningstar. As noted in the Fee Evaluation, the contractual rates of investment advisory fees and the actual advisory fees paid by Wanger Select and Wanger USA were higher than the median advisory fee rates of their
25
Wanger USA 2008 Annual Report
respective peer groups. The trustees also considered the advisory fees of the Funds relative to those of the series of Columbia Acorn Trust ("Acorn"), a group of funds with similar investment strategies also overseen by the trustees and managed by CWAM. The trustees noted that the Funds' advisory fees were comparable to those of the Acorn funds.
The trustees reviewed the analysis of the profitability of CWAM in serving as each Fund's investment advisor and of CWAM and its affiliates in their relationships with each Fund, as well as an explanation of the methodology utilized in allocating various expenses among the Funds and other business units, each of which was included in the Fee Evaluation. The trustees considered the methodology used by CWAM in determining compensation payable to portfolio managers and the competitive market for investment management talent. They discussed how profitability comparisons among fund managers are not very meaningful due to the small number of publicly owned managers, and how the profitability of any investment manager is affected by numerous factors, including its particular organizational structure, the types of funds and other accounts managed, other lines of business, expense allocation methodology, capital structure and cost of cap ital.
The trustees also reviewed the advisory fees charged by CWAM for managing other investment companies, sub-advised funds and other institutional separate accounts, as detailed in the Fee Evaluation. CWAM's institutional separate account fees for various investment strategies were examined and in some cases those fees were higher than the advisory fees charged to the Funds, and in some instances the Funds' fees were higher. The trustees noted that CWAM performs significant additional services for the Funds that it does not provide to sub-advised funds or non-mutual fund clients, including administrative services, oversight of the Funds' other service providers, trustee support, regulatory compliance and numerous other services, and that, in servicing the Funds, CWAM assumes many legal risks that it does not assume in servicing many of its other clients. Finally, as part of the annual contract renewal process, the trustees consider ed CWAM's financial condition.
In connection with their consideration of the Administration Agreement, and as recommended by the Committee and the Trust's Senior Officer, the Independent Trustees negotiated breakpoints in the fee schedule for administrative services that will reduce the fee for those services if the aggregate net assets of the Funds exceed $4 billion.
The trustees concluded that the rates of advisory fees and other compensation payable by the Funds to CWAM and its affiliates were reasonable in relation to the nature and quality of the services to be provided, taking into account the fees charged by other advisors for managing comparable mutual funds with similar strategies and the fees CWAM charges to other clients. The trustees also concluded that the Funds' estimated overall expense ratios were reasonable, considering the quality of services provided by CWAM and its affiliates and the investment performance of the Funds.
Economies of Scale. At various meetings throughout the annual contract renewal process, the trustees considered information about the extent to which CWAM realizes economies of scale in connection with the increase of Fund assets. The trustees noted that the advisory fee schedule for each Fund includes breakpoints in the rate of fees at various asset levels. The trustees discussed extensively the appropriateness of the recommendation of the Committee regarding the addition of further breakpoints to the fee schedule under the Administration Agreement. They noted that the Funds also share directly in economies of scale through lower charges by third party service providers based on the combined scale of all of the Funds. The trustees concluded that the current fee structure of each Fund, with the administration fee schedule changes recommended by the Co ntract Committee, was reasonable and reflective of a sharing between CWAM and the Funds of economies of scale.
Other Benefits to CWAM. The trustees also reviewed benefits that accrue to CWAM and its affiliates from their relationships with the Funds, as outlined in the Fee Evaluation. They noted that the Funds' transfer agent and distributor were each affiliates of CWAM and that the transfer agent received compensation from the Funds for services provided. The trustees considered ways, other than the services provided by CWAM and its affiliates pursuant to various agreements and the fees to be paid by each Fund therefor, that the Funds and CWAM may potentially benefit from their relationship with each other. At various Committee meetings, the trustees considered CWAM's use of commissions paid by each Fund on its portfolio brokerage transactions to obtain research products and services benefiting the Fund and/or other clients of CWAM, and determined that CWAM's use of the Funds' "soft" commission dollars to obtain research products and services was consistent with regulatory requirements and guidance then in effect. They also concluded that CWAM benefits from the receipt of proprietary research products and services acquired through commissions paid on portfolio transactions of the Funds, and that the Funds benefit from CWAM's receipt of those products and services as well as research products and services acquired through commissions paid by other clients of CWAM. The trustees further determined that the success of any Fund could attract other business to CWAM or the Funds and that the success of CWAM could enhance its ability to serve the Funds.
After full consideration of the above factors, as well as other factors that were considered relevant in evaluating the Advisory Agreement, the trustees, including the Independent Trustees, concluded that the continuation of the Advisory Agreement and continuation of the Administration Agreement (as amended to reflect the new administration fee schedule), was in the best interest of each Fund. On June 11, 2008, the trustees approved continuation of the Advisory Agreement and the Administration Agreement, as so amended, through July 31, 2009.
26
Wanger USA 2008 Annual Report
Board of Trustees and Management of Wanger Advisors Trust
The Board of Trustees of the Trust has overall management responsibility for the Trust and the Funds. Each trustee may serve a term of unlimited duration until the end of the calendar year in which the trustee attains the age of 75 years. The trustees appoint their own successors, provided that at least two-thirds of the trustees, after such appointment, have been elected by shareholders. Shareholders may remove a trustee, with or without cause, upon the vote of two-thirds of the Trust's outstanding shares at any meeting called for that purpose. A trustee may be removed, with or without cause, upon the vote of a majority of the trustees.
The names of the trustees and officers of the Trust, the date each was first elected or appointed to office, their principal business occupations during at least the last five years, and other directorships they hold are shown below. Each trustee serves in such capacity for each of the four series of the Trust and each of the six series of Columbia Acorn Trust.
The business address of each trustee and officer of the Trust is Columbia Wanger Asset Management, L.P., 227 West Monroe, Suite 3000, Chicago, Illinois 60606. The Fund's Statement of Additional Information includes additional information about the Fund's trustees and officers. You may obtain a free copy of the Statement of Additional Information by writing or calling toll-free:
Columbia Wanger Asset Management, L.P.
Shareholder Services Group
227 W. Monroe, Suite 3000
Chicago, IL 60606
888-4-WANGER (888-492-6437)
Name, Position(s) with
Wanger Advisors
Trust and Age at
December 31, 2008 | | Year First
Elected or
Appointed
to Office | | Principal Occupation(s) during
Past Five Years | | Number of
Portfolios in
Fund Complex
Overseen
by Trustee/Officer | | Other
Directorships
in addition
to Wanger
Advisors Trust | |
| Trustees who are not interested persons of Wanger Advisors Trust: | |
|
Laura M. Born, 43,
Trustee | | | 2007 | | | Adjunct Assistant Professor of Finance, University of Chicago Booth School of Business; formerly, Managing Director—Investment Banking, J.P. Morgan Chase & Co. (broker/ dealer) 1991-2007. | | | 10 | | | Columbia Acorn Trust. | |
|
Michelle L. Collins, 48,
Trustee | | | 2008 | | | President, Cambium LLC, since 2007; Advisory Board Member, Svoboda Capital Partners LLC, since 2007; Managing Director Svoboda Capital Partners LLC, 1998-2006. | | | 10 | | | Columbia Acorn Trust; Molex, Inc. (electronics components manufacturer). | |
|
Maureen M. Culhane, 60,
Trustee | | | 2007 | | | Retired. Formerly, Vice President, Goldman Sachs Asset Management, L.P. (investment advisor) 2005-2007; Vice President (Consultant)—Strategic Relationship Management, Goldman Sachs AG, 1999-2005. | | | 10 | | | Columbia Acorn Trust. | |
|
Margaret Eisen, 55,
Trustee | | | 2002 | | | Chief Investment Officer, EAM International LLC (corporate finance and asset management), since 2003; Managing Director, CFA Institute, 2005-2008. | | | 10 | | | Columbia Acorn Trust; Antigenics, Inc. (biotechnology and pharmaceuticals). | |
|
Jerome Kahn, Jr., 74,
Trustee | | | 1987 | | | Portfolio manager and stock analyst; formerly, President, William Harris Investors, Inc. (investment advisor). | | | 10 | | | Columbia Acorn Trust. | |
|
Steven N. Kaplan, 49,
Trustee | | | 1999 | | | Neubauer Family Professor of Entrepreneurship and Finance, University of Chicago Booth School of Business. | | | 10 | | | Columbia Acorn Trust; Morningstar, Inc. (provider of independent investment research). | |
|
David C. Kleinman, 73,
Trustee | | | 1972 | | | Adjunct Professor of Strategic Management, University of Chicago Booth School of Business; business consultant. | | | 10 | | | Columbia Acorn Trust; Sonic Foundry, Inc. (rich media systems and software). | |
|
27
Wanger USA 2008 Annual Report
Board of Trustees and Management of Wanger Advisors Trust
Name, Position(s) with
Wanger Advisors
Trust and Age at
December 31, 2008 | | Year First
Elected or
Appointed
to Office | | Principal Occupation(s) during
Past Five Years | | Number of
Portfolios in
Fund Complex
Overseen
by Trustee/Officer | | Other
Directorships
in addition
to Wanger
Advisors Trust | |
Allan B. Muchin, 72,
Trustee and Vice Chairman
of the Board | | | 1998 | | | Chairman Emeritus, Katten Muchin Rosenman LLP (law firm). | | | 10 | | | Columbia Acorn Trust. | |
|
Robert E. Nason, 72,
Trustee and Chairman of
the Board | | | 1998 | | | Consultant and private investor, since 1998; prior thereto, Chief Executive Officer, executive partner, and member of the Executive Committee, Grant Thornton, LLP (public accounting firm). | | | 10 | | | Columbia Acorn Trust. | |
|
James A. Star, 47,
Trustee | | | 2006 | | | President, Longview Asset Management LLC (investment advisor), since 2003. | | | 10 | | | Columbia Acorn Trust; Traush Industries (privately-owned manufacturer of refrigeration parts and products). | |
|
John A. Wing, 73,
Trustee | | | 2002 | | | Partner, Dancing Lion Partners (investment firm); prior thereto, Chairman of the Board and Chief Executive Officer, ABN-AMRO Inc. (formerly named The Chicago Corporation, a financial services firm), Chief Executive Officer, Market Liquidity Network, LLC, and Frank Wakely Gunsaulus Professor of Law and Finance and Chairman of the Center for the Study of Law and Financial Markets, Illinois Institute of Technology. | | | 10 | | | Columbia Acorn Trust; First Chicago Bank and Trust; First Chicago Bancorp. | |
|
| Trustees who are interested persons of Wanger Advisors Trust: | |
|
Charles P. McQuaid, 55,
Trustee and President (1) | | | 1992 | | | President and Chief Investment Officer, CWAM or its predecessors, since October 2003; portfolio manager, CWAM or its predecessors, since 1995. | | | 10 | | | Columbia Acorn Trust. | |
|
Ralph Wanger, 74,
Trustee (2) | | | 1970 | | | Founder, CWAM. Formerly, President, Chief Investment Officer and portfolio manager, CWAM or its predecessors, July 1992-September 2003; Director, Wanger Investment Company PLC; Consultant, CWAM or its predecessors, September 2003-September 2005. | | | 10 | | | Columbia Acorn Trust. | |
|
| Officers of Wanger Advisors Trust: | |
|
Ben Andrews, 42,
Vice President | | | 2004 | | | Portfolio manager and analyst, CWAM or its predecessors, since 1998; Vice President, Columbia Acorn Trust and Wanger Advisors Trust, since 2004. | | | 10 | | | None. | |
|
Michael G. Clarke, 39,
Assistant Treasurer | | | 2004 | | | Treasurer of certain Columbia Funds since June 2008; Deputy Treasurer of certain Columbia Funds since June 2008; Chief Accounting Officer and Assistant Treasurer, the Columbia Funds, October 2004 to May 2008; Director of Fund Administration, Columbia Management Advisors, LLC, since January 2006; Managing Director, Columbia Management Advisors, LLC, September 2004-December 2005; Vice President of Fund Administration, Columbia Management Advisors, LLC, June 2002-September 2004. | | | 10 | | | None. | |
|
Jeffrey Coleman, 39,
Assistant Treasurer | | | 2006 | | | Director of Fund Administration, CWAM, since January 2006; Fund Controller, CWAM or its predecessors, October 2004-January 2006; Vice President, CDC IXIS Asset Management Services, Inc., August 2000-September 2004. | | | 10 | | | None. | |
|
28
Wanger USA 2008 Annual Report
Board of Trustees and Management of Wanger Advisors Trust
Name, Position(s) with
Wanger Advisors
Trust and Age at
December 31, 2008 | | Year First
Elected or
Appointed
to Office | | Principal Occupation(s) during
Past Five Years | | Number of
Portfolios in
Fund Complex
Overseen
by Trustee/Officer | | Other
Directorships
in addition
to Wanger
Advisors Trust | |
J. Kevin Connaughton, 44,
Assistant Treasurer | | | 2001 | | | President of certain Columbia Funds since January 2009; Treasurer and Chief Financial Officer, the Columbia Funds, since December 2000; Managing Director, Columbia Management Advisors, LLC, since April 2003; Treasurer and Chief Financial Officer of the Liberty Funds, Stein Roe Funds and Liberty All-Star Funds, December 2000-December 2006; Treasurer, the Galaxy Funds, September 2002-November 2005; Senior Officer of various affiliated entities of Bank of America, including other registered and unregistered funds. | | | 10 | | | None. | |
|
P. Zachary Egan, 40,
Vice President | | | 2003 | | | Director of International Research, CWAM or its predecessors, since December 2004; Vice President, Columbia Acorn Trust and Wanger Advisors Trust, since 2003; portfolio manager and analyst, CWAM or its predecessors, since 1999. | | | 10 | | | None. | |
|
Peter T. Fariel, 51,
Assistant Secretary | | | 2006 | | | Associate General Counsel, Bank of America Corporation, since April 2005; prior thereto, Partner, Goodwin Procter LLP (law firm). | | | 10 | | | None. | |
|
John Kunka, 38,
Assistant Treasurer | | | 2006 | | | Director of Accounting and Operations, CWAM or its predecessors, since May 2006; Manager of Mutual Fund Operations, Calamos Advisors, Inc. (investment advisor), September 2005-May 2006; prior thereto, Manager of Mutual Fund Administration, Van Kampen Investments. | | | 10 | | | None. | |
|
Joseph LaPalm, 38,
Vice President | | | 2006 | | | Chief Compliance Officer, CWAM, since 2005; prior thereto, compliance officer, William Blair & Company (investment firm). | | | 10 | | | None. | |
|
Bruce H. Lauer, 51,
Vice President,
Secretary and Treasurer | | | 1995 | | | Chief Operating Officer, CWAM or its predecessors, since April 2000; Vice President, Secretary and Treasurer, Columbia Acorn Trust and Wanger Advisors Trust, since 1995; Director, Wanger Investment Company PLC; Director, Banc of America Capital Management (Ireland) Ltd.; Director, Bank of America Global Liquidity Funds, PLC. | | | 10 | | | None. | |
|
Louis J. Mendes, 44,
Vice President | | | 2003 | | | Portfolio manager and analyst, CWAM or its predecessors, since 2001; Vice President, Columbia Acorn Trust and Wanger Advisors Trust, since 2003. | | | 10 | | | None. | |
|
Robert A. Mohn, 47,
Vice President | | | 1997 | | | Director of Domestic Research, CWAM or its predecessors, since March 2004; Vice President, Columbia Acorn Trust and Wanger Advisors Trust, since 1997; portfolio manager and analyst, CWAM or its predecessors, since August 1992. | | | 10 | | | None. | |
|
Christopher Olson, 44,
Vice President | | | 2001 | | | Portfolio manager and analyst, CWAM or its predecessors, since January 2001; Vice President, Columbia Acorn Trust and Wanger Advisors Trust, since 2001. | | | 10 | | | None. | |
|
Robert P. Scales, 56,
Chief Compliance Officer,
Chief Legal Officer,
Senior Vice President and
General Counsel | | | 2004 | | | Chief Compliance Officer, Chief Legal Officer, Senior Vice President and General Counsel, Columbia Acorn Trust and Wanger Advisors Trust, since 2004; prior thereto, Associate General Counsel, Grant Thornton LLP (public accounting firm). | | | 10 | | | None. | |
|
Linda Roth-Wiszowaty, 39,
Assistant Secretary | | | 2006 | | | Business support analyst, CWAM, since April 2007; prior thereto executive administrator, CWAM or its predecessors, and executive assistant to the Chief Operating Officer of CWAM or its predecessors. | | | 10 | | | None. | |
|
(1) Mr. McQuaid is an "interested person" of Wanger Advisors Trust and of CWAM, as defined in the Investment Company Act of 1940 because he is an officer of the Trust and of CWAM.
(2) Mr. Wanger is an "interested person" of Wanger Advisors Trust and of CWAM, as defined in the Investment Company Act of 1940 because he owns securities issued by a controlling person of CWAM.
29
Wanger USA 2008 Annual Report
This page intentionally left blank.
30
Wanger USA 2008 Annual Report
This page intentionally left blank.
31
Wanger USA 2008 Annual Report

Wanger Advisors Trust
Transfer Agent,
Dividend Disbursing Agent
Columbia Management Services, Inc.
P.O. Box 8081
Boston, Massachusetts
02266-8081
Distributor
Columbia Management Distributors, Inc.
One Financial Center
Boston, Massachusetts
02111-2621
Investment Advisor
Columbia Wanger Asset Management, L.P.
227 West Monroe Street, Suite 3000
Chicago, Illinois 60606
1-888-4-WANGER
(1-888-492-6437)
Legal Counsel
Bell, Boyd & Lloyd LLP
Chicago, Illinois
Independent Registered
Public Accounting Firm
PricewaterhouseCoopers LLP
Chicago, Illinois
This report, including the schedules of investments and financial statements, is submitted for the general information of the shareholders of the Wanger Advisors Trust.
A description of the Fund's proxy voting policies and procedures and a copy of the Fund's voting record for the most recent 12-month period ended June 30 are available (i) on the Securities and Exchange Commission's website at www.sec.gov, and (ii) without charge, upon request, by calling 1-888-492-6437.
The Fund files a complete schedule of portfolio holdings with the SEC for the first and third quarters of each fiscal year on Form N-Q. The Fund's Form N-Q is available on the SEC's website at www.sec.gov and may be reviewed and copied at the SEC's Public Reference Room in Washington, D.C. Information on the operation of the Pubic Reference Room may be obtained by calling 1-800-SEC-0330.
32
Columbia Wanger Funds
0L2568A
SHC-42/4937-1208 09/72703
Item 2. Code of Ethics.
(a) The registrant has, as of the end of the period covered by this report, adopted a code of ethics that applies to the registrant’s principal executive officer, principal financial officer, principal accounting officer or controller, or persons performing similar functions, regardless of whether these individuals are employed by the registrant or a third party.
(b) During the period covered by this report, there were not any amendments to a provision of the code of ethics adopted in 2(a) above.
(c) During the period covered by this report, there were no waivers, including any implicit waivers, from a provision of the code of ethics described in 2(a) above that relates to one or more of the items set forth in paragraph (b) of this item’s instructions.
Item 3. Audit Committee Financial Expert.
The registrant’s Board of Trustees has determined that David C. Kleinman, Robert E. Nason and John A. Wing, each of whom are members of the registrant’s Board of Trustees and Audit Committee, each qualify as an audit committee financial expert. Mr. Kleinman, Mr. Nason and Mr. Wing are each independent trustees, as defined in paragraph (a)(2) of this item’s instructions.
Item 4. Principal Accountant Fees and Services.
(a) Audit Fees. Aggregate Audit Fees billed by the principal accountant for professional services rendered during the fiscal years ended December 31, 2008 and December 31, 2007 are approximately as follows:
2008 | | 2007 | |
$ | 91,500 | | $ | 88,800 | |
| | | | | |
Audit Fees include amounts related to the audit of the registrant’s annual financial statements or services that are normally provided by the accountant in connection with statutory and regulatory filings or engagements for those fiscal years.
(b) Audit-Related Fees. Aggregate Audit-Related Fees billed to the registrant by the principal accountant for professional services rendered during the fiscal years ended December 31, 2008 and December 31, 2007 are approximately as follows:
Audit-Related Fees include amounts for assurance and related services by the principal accountant that are reasonably related to the performance of the audit of the registrant’s financial statements and are not reported in Audit Fees above. In both fiscal years 2008 and 2007, Audit-Related Fees consist of agreed-upon procedures performed for other audit-related additional testing.
During the fiscal years ended December 31, 2008 and December 31, 2007, there were no Audit-Related Fees billed by the registrant’s principal accountant to the registrant’s investment adviser (not including any sub-adviser whose role is primarily portfolio management and is subcontracted with or overseen by another investment adviser) and any entity controlling, controlled by, or under common control with the adviser that provides ongoing services to the registrant for an engagement that related directly to the operations and financial reporting of the registrant.
(c) Tax Fees. Aggregate Tax Fees billed by the principal accountant to the registrant for professional services rendered during the fiscal years ended December 31, 2008 and December 31, 2007 are approximately as follows:
2008 | | 2007 | |
$ | 14,600 | | $ | 15,800 | |
| | | | | |
Tax Fees incurred in both fiscal years 2008 and 2007 relate to the review of annual tax returns and include amounts for professional services by the principal accountant for tax compliance, tax advice and tax planning.
During the fiscal years ended December 31, 2008 and December 31, 2007, there were no Tax Fees billed by the registrant’s principal accountant to the registrant’s investment adviser (not including any sub-adviser whose role is primarily portfolio management and is subcontracted with or overseen by another investment adviser) and any entity controlling, controlled by, or under common control with the adviser that provides ongoing services to the registrant for an engagement that related directly to the operations and financial reporting of the registrant.
(d) All Other Fees. Aggregate All Other Fees billed by the principal accountant to the registrant for professional services rendered during the fiscal years ended December 31, 2008 and December 31, 2007 are as follows:
All Other Fees include amounts for products and services provided by the principal accountant, other than the services reported in paragraphs (a) through (c) above.
Aggregate All Other Fees billed by the registrant’s principal accountant to the registrant’s investment adviser (not including any sub-adviser whose role is primarily portfolio management and is subcontracted with or overseen by another investment adviser) and any entity controlling, controlled by, or under common control with the adviser that provides ongoing services to the registrant for an engagement that related directly to the operations and financial reporting of the registrant during the fiscal years ended December 31, 2008 and December 31, 2007 are approximately as follows:
2008 | | 2007 | |
$ | 136,100 | | $ | 130,000 | |
| | | | | |
In both fiscal years 2008 and 2007, All Other Fees consist of professional services rendered for internal control reviews of the registrant’s transfer agent.
(e)(1) Audit Committee Pre-Approval Policies and Procedures
The policy of the registrant’s Audit Committee is to specifically pre-approve (i) all audit and non-audit (including audit related, tax and all other) services provided by the registrant’s independent auditor to the registrant and individual funds (collectively “Fund Services”) and (ii) all non-audit services provided by the registrant’s independent auditor to the funds’ adviser or a control affiliate of the adviser, that relate directly to the funds’ operations and financial reporting (collectively “Fund-related Adviser Services”). A “control affiliate” is an entity controlling, controlled by, or under common control with the adviser that provides ongoing services to the funds, and the term “adviser” is deemed to exclude any unaffiliated sub-adviser whose role is primarily portfolio management and is sub-contracted or overseen by another investment adviser.
If such Fund Services or Fund-related Adviser Services are required during the period between the Audit Committee’s regularly scheduled meetings, the Chairman of the Audit Committee has the authority to pre-approve the service, with reporting to the full Audit Committee at the next regularly scheduled meeting.
The Audit Committee will waive pre-approval of Fund Services or Fund-related Adviser Services provided that the requirements under paragraph (c)(7)(i)(C) of Rule 2-01 of Regulation S-X are met.
(e)(2) The percentage of services described in paragraphs (b) through (d) of this Item approved pursuant to the “de minimis” exception under paragraph (c)(7)(i)(C) of Rule 2-01 of Regulation S-X during both fiscal years ended December 31, 2008 and December 31, 2007 was zero.
(f) Not applicable.
(g) The aggregate non-audit fees billed by the registrant’s accountant for services rendered to the registrant, and rendered to the registrant’s investment adviser (not including any sub-adviser whose role is primarily portfolio management and is subcontracted with or overseen by another investment adviser), and any entity controlling, controlled by, or under common control with the adviser that provides ongoing services to the registrant for the fiscal years ended December 31, 2008 and December 31, 2007 are approximately as follows:
2008 | | 2007 | |
$ | 157,700 | | $ | 157,800 | |
| | | | | |
(h) The registrant’s Audit Committee of the Board of Directors has considered whether the provision of non-audit services that were rendered to the registrant’s adviser (not including any sub-adviser whose role is primarily portfolio management and is subcontracted with or overseen by another investment adviser), and any entity controlling, controlled by, or under common control with the investment adviser that provides ongoing services to the registrant that were not pre-approved pursuant to paragraph (c)(7)(ii) of Rule 2-01 of Regulation S-X, is compatible with maintaining the principal accountant’s independence.
Item 5. Audit Committee of Listed Registrants.
Not applicable.
Item 6. Investments
(a) The registrant’s “Schedule I — Investments in securities of unaffiliated issuers” (as set forth in 17 CFR 210.12-12) is included in Item 1 of this Form N-CSR.
(b) Not applicable
Item 7. Disclosure of Proxy Voting Policies and Procedures for Closed-End Management Investment Companies.
Not applicable.
Item 8. Portfolio Managers of Closed-End Management Investment Companies.
Not applicable.
Item 9. Purchases of Equity Securities by Closed-End Management Investment Company and Affiliated Purchasers.
Not applicable.
Item 10. Submission of Matters to a Vote of Security Holders.
There have not been any material changes to the procedures by which shareholders may recommend nominees to the registrant’s board of directors, since those procedures were last disclosed in response to requirements of Item 407(c)(2)(iv) of Regulation S-K (as required by Item 22(b)(15) of Schedule 14A) or this Item.
Item 11. Controls and Procedures.
(a) The registrant’s principal executive officer and principal financial officers, based on their evaluation of the registrant’s disclosure controls and procedures as of a date within 90 days of the filing of this report, have concluded that such controls and procedures are adequately designed to ensure that information required to be disclosed by the registrant in Form N-CSR is accumulated and communicated to the registrant’s management, including the principal executive officer and principal financial officer, or persons performing similar functions, as appropriate to allow timely decisions regarding required disclosure.
(b) There was no change in the registrant’s internal control over financial reporting that occurred during the registrant’s second fiscal quarter of the period covered by this report that has materially affected, or is reasonably likely to materially affect, the registrant’s internal control over financial reporting.
Item 12. Exhibits.
(a)(1) Code of ethics required to be disclosed under Item 2 of Form N-CSR attached hereto as Exhibit 99.CODE ETH.
(a)(2) Certifications pursuant to Rule 30a-2(a) under the Investment Company Act of 1940 (17 CFR 270.30a-2(a)) attached hereto as Exhibit 99.CERT.
(a)(3) Not applicable.
(b) Certification pursuant to Rule 30a-2(b) under the Investment Company Act of 1940 (17 CFR 270.30a-2(b)) attached hereto as Exhibit 99.906CERT.
SIGNATURES
Pursuant to the requirements of the Securities Exchange Act of 1934 and the Investment Company Act of 1940, the registrant has duly caused this report to be signed on its behalf by the undersigned, thereunto duly authorized.
(registrant) | | Wanger Advisors Trust | |
| | | |
| | | |
By (Signature and Title) | | /s/ Charles P. McQuaid | |
| | Charles P. McQuaid, President | |
| | | |
| | | |
Date | | February 25, 2009 | |
| | | | | |
Pursuant to the requirements of the Securities Exchange Act of 1934 and the Investment Company Act of 1940, this report has been signed below by the following persons on behalf of the registrant and in the capacities and on the dates indicated.
By (Signature and Title) | | /s/ Charles P. McQuaid | |
| | Charles P. McQuaid, President | |
| | | |
| | | |
Date | | February 25, 2009 | |
| | | |
| | | |
By (Signature and Title) | | /s/ Bruce H. Lauer | |
| | Bruce H. Lauer, Treasurer | |
| | | |
| | | |
Date | | February 25, 2009 | |
| | | | | | |