UNITED STATES
SECURITIES AND EXCHANGE COMMISSION
Washington, D.C. 20549
FORM N-CSR
CERTIFIED SHAREHOLDER REPORT OF REGISTERED
MANAGEMENT INVESTMENT COMPANIES
Investment Company Act file number | 811-08748 |
|
Wanger Advisors Trust |
(Exact name of registrant as specified in charter) |
|
225 Franklin Street, Boston, Massachusetts | | 02110 |
(Address of principal executive offices) | | (Zip code) |
|
Scott R. Plummer
5228 Ameriprise Financial Center
Minneapolis, MN 55474 |
(Name and address of agent for service) |
|
Registrant’s telephone number, including area code: | 1-612-671-1947 | |
|
Date of fiscal year end: | December 31 | |
|
Date of reporting period: | December 31, 2011 | |
| | | | | | | | |
Form N-CSR is to be used by management investment companies to file reports with the Commission not later than 10 days after the transmission to stockholders of any report that is required to be transmitted to stockholders under Rule 30e-1 under the Investment Company Act of 1940 (17 CFR 270.30e-1). The Commission may use the information provided on Form N-CSR in its regulatory, disclosure review, inspection, and policymaking roles.
A registrant is required to disclose the information specified by Form N-CSR, and the Commission will make this information public. A registrant is not required to respond to the collection of information contained in Form N-CSR unless the Form displays a currently valid Office of Management and Budget (“OMB”) control number. Please direct comments concerning the accuracy of the information collection burden estimate and any suggestions for reducing the burden to Secretary, Securities and Exchange Commission, 450 Fifth Street, NW, Washington, DC 20549-0609. The OMB has reviewed this collection of information under the clearance requirements of 44 U.S.C. § 3507.
Item 1. Reports to Stockholders.
Wanger International
2011 Annual Report

Not FDIC insured • No bank guarantee • May lose value

Wanger International
2011 Annual Report
Table of Contents
| 2 | | | Understanding Your Expenses | |
|
| 3 | | | Vaccines: Medicine's Greatest Lifesaver | |
|
| 6 | | | Performance Review | |
|
| 8 | | | Statement of Investments | |
|
| 19 | | | Statement of Assets and Liabilities | |
|
| 19 | | | Statement of Operations | |
|
| 20 | | | Statement of Changes in Net Assets | |
|
| 21 | | | Financial Highlights | |
|
| 22 | | | Notes to Financial Statements | |
|
| 26 | | | Report of Independent Registered Public Accounting Firm | |
|
| 27 | | | Federal Income Tax Information | |
|
| 28 | | | Board of Trustees and Management of Wanger Advisors Trust | |
|
Columbia Wanger Asset Management, LLC (CWAM) is one of the leading global small- and mid-cap equity managers in the United States with 40 years of small- and mid-cap investment experience. As of December 31, 2011, CWAM managed $29.4 billion in assets. CWAM is the investment adviser to Wanger USA, Wanger International, Wanger Select and Wanger International Select (together, the Columbia Wanger Funds) and the Columbia Acorn Family of Funds.
Investors should consider the investment objectives, risks, charges and expenses of a mutual fund carefully before investing. For a free prospectus, which contains this and other important information about the Fund, contact your financial adviser or insurance company or contact 1-888-4-WANGER. Read the prospectus carefully before investing.
An important note: Columbia Wanger Funds are available for purchase through variable annuity contracts and variable life insurance policies offered by the separate accounts of participating insurance companies and qualified pension or retirement plans.
The views expressed in "Vaccines: Medicine's Greatest Lifesaver" and in the Performance Review reflect the current views of the respective authors. These views are not guarantees of future performance and involve certain risks, uncertainties and assumptions that are difficult to predict so actual outcomes and results may differ significantly from the views expressed. These views are subject to change at any time based upon economic, market or other conditions and the respective parties disclaim any responsibility to update such views. These views may not be relied on as investment advice and, because investment decisions for a Columbia Wanger Fund are based on numerous factors, may not be relied on as an indication of trading intent on behalf of any particular Columbia Wanger Fund. References to specific company securities should not be construed as a recommendation or investment advice.
1
Wanger International 2011 Annual Report
Understanding Your Expenses
As a shareholder, you incur three types of costs. There are transaction costs, which generally include sales charges on purchases and may include redemption fees. There are also ongoing costs, which generally include management fees and other Fund expenses. Lastly, there may be additional fees or charges imposed by the insurance company that sponsors your variable annuity and/or variable life insurance product. The following information is intended to help you understand your ongoing costs (in dollars) of investing in the Fund and to help you compare these costs with the ongoing costs of investing in other mutual funds.
Analyzing your Fund's expenses
To illustrate these ongoing costs, we have provided an example and calculated the expenses paid by investors in the Fund during the period. The actual and hypothetical information in the table below is based on an initial investment of $1,000 at the beginning of the period indicated and held for the entire period. Expense information is calculated two ways and each method provides you with different information. The amount listed in the "Actual" column is calculated using the Fund's actual operating expenses and total return for the period. You may use the Actual information, together with the amount invested, to estimate the expenses that you paid over the period. Simply divide your account value by $1,000 (for example, an $8,600 account value divided by $1,000 = 8.6), then multiply the results by the expenses paid during the period under the Actual column. The amount listed in the "Hypothetical" column assumes a 5% annual rate of return before expenses (which is not the Fund's actual return) and then applies the Fund's actual expense ratio for the period to the hypothetical return. You should not use the hypothetical account values and expenses to estimate either your actual account balance at the end of the period or the expenses you paid during the period. See "Compare with other funds" below for details on how to use the hypothetical data.
Compare with other funds
Since all mutual funds are required to include the same hypothetical calculations about expenses in shareholder reports, you can use this information to compare the ongoing cost of investing in the Fund with other funds. To do so, compare the hypothetical example with the 5% hypothetical examples that appear in the shareholder reports of other funds. As you compare hypothetical examples of other funds, it is important to note that hypothetical examples are meant to highlight the ongoing cost of investing in a fund only and do not reflect any transaction costs, such as sales charges, redemption or exchange fees. Therefore, the hypothetical calculations are useful in comparing ongoing costs only, and will not help you determine the relative total costs of owning different funds. If transaction costs were included in these calculations, your costs would be higher.
July 1, 2011 – December 31, 2011
| | | Account value at the
beginning of the period ($) | | Account value at the
end of the period ($) | | Expenses paid during
period ($) | | Fund's annualized
expense ratio (%)* | |
| | | Actual | | Hypothetical | | Actual | | Hypothetical | | Actual | | Hypothetical | | | |
| Wanger International | | | 1,000.00 | | | | 1,000.00 | | | | 829.20 | | | | 1,020.46 | | | | 4.22 | | | | 4.66 | | | | 0.92 | | |
*Expenses paid during the period are equal to the Fund's annualized expense ratio, multiplied by the average account value over the period, then multiplied by the number of days in the Fund's most recent fiscal half-year and divided by 365.
Had the investment adviser not waived fees or reimbursed a portion of expenses, account value at the end of the period would have been reduced.
It is important to note that the expense amounts shown in the table are meant to highlight only ongoing costs of investing in the Fund. Expenses paid during the period do not include any insurance charges imposed by your insurance company's separate account. The hypothetical example provided is useful in comparing ongoing costs only and will not help you determine the relative total costs of owning different funds whose shareholders may incur transaction costs.
2
Wanger International 2011 Annual Report

Vaccines: Medicine's Greatest Lifesaver
I recently read several books on the history of vaccines. As one of the authors put it, "Of all of the benefits of medical science, vaccination is at or near the summit."1
Deadly Diseases
"Bring out your dead!" cries a wretched man pulling a cart of bodies in Monty Python and the Holy Grail. Set in the middle ages, the movie makes fun of the impact of communicable disease at that time. In reality, such diseases were no laughing matter. Once mankind transitioned from isolated bands of nomadic hunter-gatherers to more densely populated groups of farmers, epidemic diseases began to ravage civilization.
Remarkable progress has been made as fatal, communicable disease has now become rare in the developed world. Clearly, improved sanitation and nutrition have helped, but much of the credit goes to the development of vaccines.
The First Vaccine
Dating back to at least the time of the Pharaohs, waves of smallpox epidemics ravaged mankind. In populations previously subject to the disease, mortality rates for those infected could be more than 30% and, for other populations, much more.2 North American Indians had little immunity to the disease. Their population decreased 99% between Columbus's voyage in 1492 and the year 1800, and smallpox was the largest killer.3
People observed that the disease was communicable and one who survived a smallpox infection became immune to the next epidemic of the disease. In ancient China and more recently in Asia and Africa, a crude form of vaccination called variolation developed whereby fluid from a smallpox pustule or parts of smallpox scabs were scraped into the skin of a healthy person. In most cases, immunity would build up before the disease reached a vital organ and the individual would survive.
In 1790, Lady Montague, the wife of the British ambassador to the Ottoman Empire, introduced variolation to Britain. The process was far riskier than vaccines today; most people suffered severe side effects and up to about 3% of those treated died as a result.4 But these were much better odds than for those infected with smallpox.
Edward Jenner, a pharmacist in England, learned that milkmaids were immune to smallpox because they often suffered blisters from cowpox, a related disease. In 1796, Jenner began experimenting with variolating using fluid from a milkmaid's cowpox blisters, rather than smallpox sores. When his subjects were later variolated with smallpox fluid, no reaction occurred, indicating that they were immune from smallpox. Immunization using cowpox fluids rose rapidly and protected millions of people.5
A cowpox-derived vaccine for smallpox continued to be used well into the 20th century, including use by six million New Yorkers who were inoculated during a smallpox scare in 1947. Smallpox was eradicated from nature; the last case occurred in India in 1975.6 Smallpox immunizations ended when health authorities judged the risk of side effects from the vaccine exceeded the risk of the disease returning.
The Golden Age of Vaccines
Beginning in the 1860s, tremendous scientific advances were made. Robert Koch's laboratory in Germany identified bacteria as the source of many diseases and proved that bacteria grown in a lab could cause disease.7 Koch's lab created some vaccines, including those for diphtheria and tetanus.
In France, Louis Pasteur stunned the world by developing the first rabies vaccine in 1885; until then rabies infections resulted in horrible deaths. His mantra was to "isolate, attenuate and vaccinate" the pathogen causing a disease.8 He attenuated a germ by having it reproduce in petri dishes or animal cells where it would evolve in order to optimize in its new environment. Once it evolved to the point it would no longer thrive in and harm humans, it was injected into humans with the hope that the subject would build immunity to full power germs. The Goldilocks trick of course was to make the attenuated germ weak enough so as not to cause harm, but strong enough to create immunity.
While scientific understanding of disease increased rapidly, it was primitive compared to modern times. Diagnostic tools were poor. Bacteria could be seen by optical microscopes, but viruses were unseen until the development of the electron microscope in the 1930s. Viruses were inferred to exist as a result of an 1898 experiment by Danish professor Martinus Beijerinck, who filtered bacteria out through unglazed porcelain containers, but observed remaining, and much smaller, disease-causing elements. Scientists learned how to grow viruses in laboratories only in the late 1940s.9
Early vaccines were dangerous and unreliable by today's standards, though far less dangerous than the underlying diseases they prevented. Vaccines did not stop the great influenza epidemic of 1918-1919. Of a worldwide population of one billion, an estimated 500 million were infected and more than 50 million people died.10 This virus was unusual in that it had high mortality among young, healthy people.
Vaccines continued to progress. During World War II, all 11 million U.S. soldiers were vaccinated for typhoid, tetanus, smallpox, cholera and plague. Vaccines, coupled with antibiotics, drastically improved their health. Disease deaths outnumbered battle deaths by 13:1 in the Spanish American War, matched them in World War I and were outnumbered by 1:85 in World War II.11
Maurice Hilleman's Mission
Maurice Hilleman had a role in creating more vaccines than anyone else in history, some three dozen. As noted by Arthur Allen, author of Vaccine, The Controversial Story of Medicine's Greatest Lifesaver, "...his products undoubtedly
3
Wanger International 2011 Annual Report
saved more lives than those of any other individual in the past half-century."12
Hilleman grew up in Montana, and earned a Ph.D. in microbiology at the University of Chicago where he discovered that chlamydia is a tiny bacteria rather than a virus. He then stunned his mentors by departing academia to work in industry. At Squibb, he developed a vaccine against Japanese B encephalitis to protect American Pacific troops during World War II. In 1948, he joined the Walter Reed Army Medical Center, then a hub of vaccine development.
In 1957, Hilleman moved to Merck, where he continued to develop vaccines well past his official retirement in 1984. He had a tremendous work ethic, often working seven days a week and expecting the same from his staff. He and his team were on a mission to rid the world of disease. They developed eight of 14 now common vaccines for measles, mumps, hepatitis A and B, chickenpox, meningitis, pneumonia and Hib (hemophilus influenza, which harms infants and young children).13 One of his accomplishments was the combination MMR (measles, mumps and rubella) vaccine.
Hilleman discovered that the influenza virus is particularly difficult to deal with due to frequent minor drifts in its surface, which each year makes the last year's vaccine obsolete. Periodically, the virus shifts its surface characteristics substantially, becoming much more virulent. Hilleman inferred that a shift occurred in Hong Kong in 1957 and, by having Merck produce 40 million doses of vaccine, saved thousands of lives in America. Potential future shifts keep virologists up at night.
Hilleman helped develop the first two anti-cancer vaccines. One vaccine prevents hepatitis B, the third most common known cause of cancer in the world (after sunlight and smoking).14 It was the first vaccine utilizing recombinant technology and the first made by a single protein. His innovations helped create a vaccine to prevent HPV (human papillomavirus), the cause of cervical cancer. Hilleman had high integrity, as he refused to risk changes in manufacturing processes in order to enhance yields and profits.15 He died in 2005 at age 85.
Vaccine Scares
Two notable scares set back progress on vaccine usage.
In 1982, a TV station in Washington D.C. aired "Vaccine Roulette," a story highlighting risks of the DTP (diphtheria, tetanus, pertussis) vaccine. It showed reactions well known to physicians, including cases of seizures, high fevers and fainting. In a case of ambush journalism, it edited doctors' comments out of context and failed to mention that none of the victims portrayed suffered permanent damage. Other media quoted the story further out of context, claiming permanent damage. The media also failed to mention the consequences of contracting the underlying diseases.16
In 1998, the British medical journal The Lancet published a paper alleging a link between the MMR vaccine and autism.17 It claimed that, in some cases, the vaccine caused the measles virus to lodge in the intestines and create leakage, allowing opioid peptides to escape and penetrate the brain, causing autism. The paper was under fire by scientists immediately. The opioid causation theory had already been widely discredited, the findings of measles in intestines could not be duplicated by other scientists and there was no comparison between autism rates of children who got the vaccine and those who did not. A review by 37 experts found that the theories were "biologically implausible," and the conclusions essentially worthless.18
Fourteen separate groups of investigators did statistical studies that also refuted the link.19 One notable study covered 530,000 children in Denmark from 1991-1998, comparing vaccinated and unvaccinated children. It showed "strong evidence against the hypothesis that MMR vaccination causes autism."20 By 2004, 10 of the original 12 authors of The Lancet article
withdrew their support of the paper.21 The Lancet formally retracted the paper in 2010 and, that same year, the primary author of the paper had his U. K. medical license revoked.
Once the MMR-autism link was largely discredited, vaccine opponents claimed a link between mercury in vaccines and autism. Minute amounts of ethyl mercury were utilized in vaccines, usually less than the more toxic methyl mercury infants get exposed to from the environment. Combined, in some cases, the dosage did exceed government guidelines, so the mercury was removed. Studies showed that reported rates of autism continued to climb once mercury was removed from vaccines.22 "In spite of all the concern...there has not been a single case of proven mercury toxicity from vaccines...," writes Kurt Link, author of The Vaccine Controversy: The History, Use, and Safety of Vaccinations.23
Unfortunately, many people appear to rely on one-sided scares and opinions expressed in talk shows and by celebrity activists, rather than on scientific evidence. Immunization rates around the world have fluctuated with publicity, funding for inoculations, public policy and legal requirements. Where immunizations have dropped, outbreaks have occurred. A diphtheria epidemic hit the former Soviet Union in 1993, causing 4,000 deaths.24 In Japan, where pertussis immunizations fell from 80% in 1974 to 10% in 1976, a 1979 epidemic of that disease resulted in 13,000 infections and 41 deaths.25 In the United States, where pockets of low immunization rates exist, outbreaks occur. Some of the Chicago suburbs are currently experiencing a whooping cough outbreak.26
Perspectives on Risks
There have been mistakes in vaccine development, production and use that have resulted in injuries and deaths. However, those numbers pale in comparison to the injuries and deaths caused by the underlying diseases that are being conquered by vaccines. While rare
4
Wanger International 2011 Annual Report
vaccine side effects continue to exist, drugs and vaccines come with disclosures of the known side effects and risks, however unlikely. Diseases don't.
Many people believe some vaccine-preventable diseases to be fairly benign and some are, in most cases. Yet measles is one of the most contagious viruses and has killed more children than any other disease in history.27 It hospitalized 48,000 Americans yearly in the 1960s and killed 400 during a 1964 epidemic.28
Chickenpox is perceived to be a mild disease and it usually is. Acquiring chickenpox creates lifetime immunity to the disease (though susceptibility to shingles) so some question the usefulness of the vaccine. However, Paul Offit, author of Vaccinated, One Man's Quest to Defeat the World's Deadliest Diseases, points out that chickenpox creates risk of encephalitis, hepatitis, pneumonia and Group A streptococci, the "flesh-eating bacteria." He notes that, before the vaccine, some 10,000 people a year were hospitalized and 100 died annually in the United States due to the disease or related illnesses.29
German measles (rubella) was considered a benign illness featuring a rash and a low fever until Australian ophthalmologist Sir Norman McAllister Gregg discovered a link to birth defects. When striking a mother in her first trimester, rubella causes fetal anomalies in 90% of pregnancies. In 1964-65, prior to the rubella vaccine, the last major epidemic in the United States caused thousands of birth defects.30 Hilleman's MMR vaccine was approved in 1971 and the number dropped to seven U.S. cases in 1983.31
Whooping cough (pertussis) is a horrible disease for babies and small children. Babies have died because of outbreaks when vaccination rates declined as a result of scares. The underlying vaccine has changed since the "Vaccine Roulette" television program, to an acellular version with fewer side effects.32 That is why the combination vaccine is now called DTaP rather than DTP.
While no vaccine is 100% effective, the fact remains that if the vast majority of people are vaccinated, a disease cannot infect enough victims to spread. Link writes, "In the prevaccine era, every family lost a child or knew of one so lost due to vaccine-preventable diseases. Today in the USA, the death of a child is an unexpected tragedy; in the past it was an expected sorrow."33 American life expectancies increased 30 years during the 20th century, largely due to vaccines.34


Charles P. McQuaid
President and Chief Investment Officer
Columbia Wanger Asset Management, LLC
The information and data provided in this analysis are derived from sources that we deem to be reliable and accurate. These views are not guarantees of future performance and involve certain risks, uncertainties and assumptions that are difficult to predict so actual outcomes and results may differ significantly from the views expressed. The views/opinions expressed in this essay are those of the author and not of the Columbia Wanger Funds Board, are subject to change at any time based upon economic, market or other conditions, may differ from views expressed by other Columbia Management associates and the respective parties disclaim any responsibility to update such views. These views may not be relied on as investment advice and, because investment decisions for a Columbia Wanger Fund are based on numerous factors, may not be relied on as an indication of trading intent on behalf of any particular Columbia Wanger Fund.
The information included on Pages 3-5 of this report is unaudited.
1 Link, M.D., Kurt, The Vaccine Controversy, The History, Use, And Safety of Vaccinations, (Westport, Connecticut, Praeger Publishers 2005) p. 38.
2 Mnookin, Seth, The Panic Virus, A True Story of Medicine, Science, and Fear, (New York, New York, Simon & Schuster 2011) p. 30.
3 Offit, M.D., Paul A., Vaccinated, One Man's Quest to Defeat the World's Deadliest Diseases, (New York, New York, HarperCollins Publishers 2007) pg. 32.
4 Link, M.D., Kurt, op. cit., p. 12.
5 Allen, Arthur, Vaccine, The Controversial Story of Medicines Greatest Lifesaver, (New York, New York, W. W. Norton & Company 2007) p. 49-50.
6 Ibid., p. 115, 303.
7 Offit, M.D., Paul A., op. cit., p. 144.
8 Allen, Arthur, op. cit., p. 65, 121.
9 Offit, M.D., Paul A., op. cit., p. 37, 41-42.
10 Ibid., p. 2-3.
11 Allen, Arthur, op. cit., p. 119, 159.
12 Ibid., p. 221.
13 Link, M.D., Kurt, op. cit., p. 101.
14 Offit, M.D., Paul A., op. cit., p. 115.
15 Ibid., p. 130, 156.
16 Allen, Arthur, op. cit., p. 251-256.
17 Wakefield, Andrew J., et al., "Ileal-lymphoid-nodular Hyperplasia, Non-Specific Colitis, and Pervasive Developmental Disorders in Children," The Lancet 351, Issue 9103 (1998), p. 637-41.
18 Mnookin, Seth, op. cit., p. 106-107, 114.
19 Offit, M.D., Paul A., op. cit., p. 167.
20 Mnookin, Seth, op. cit., p. 163.
21 Murch, Simon H., et al., "Retraction of an Interpretation," The Lancet 363, Issue 9411 (2004), p. 750.
22 Mnookin, Seth, op. cit., p. 167.
23 Link, M.D., Kurt, op. cit., p. 21.
24 Ibid., p. 57.
25 Mnookin, Seth, op. cit., p. 277.
26 Synett, Lawerence, "Whooping Cough Strikes Collar Counties," Chicago Tribune, December 6, 2011.
27 Mnookin, Seth, op. cit., p. 19.
28 Allen, Arthur, op. cit., p. 217.
29 Offit, M.D., Paul A., op. cit., p. 102.
30 Link, M.D., Kurt, op. cit., p. 82-84.
31 Allen, Arthur, op. cit., p. 240.
32 Ibid., p. 352, 286.
33 Link, M.D., Kurt, op. cit., p. 163.
34 Offit, M.D., Paul A., op. cit., p. xiv.
5
Wanger International 2011 Annual Report

Performance Review Wanger International
 | |  | |
|
Louis J. Mendes III
Co-Portfolio Manager | | Christopher J. Olson
Co-Portfolio Manager | |
|
Performance data shown represents past performance and is not a guarantee of future results. The investment return and principal value will fluctuate so that shares, when redeemed, may be worth more or less than the original cost. Current performance may be lower or higher than the performance data shown. Please visit columbiamanagement.com for performance updates for the most recent month-end.
Wanger International ended 2011 down 14.62%, outperforming the 16.94% decline of its primary benchmark, the S&P Global Ex-U.S. Between $500M and $5B Index. International small-cap stocks underperformed larger-cap stocks in a year marked by extreme volatility and high correlation among most risk assets. For comparison, the large-cap developed international market, as tracked by the MSCI EAFE Index, declined 12.14% during the year.
In 2010, the economic schism between stagnant, deflating developed economies and the high-growth inflationary emerging economies bore out in the strong performance of emerging market stocks. In 2011, fears of a renewed global recession dragged down all markets tied to economic growth, especially those of Europe and the emerging markets. Although early concerns over inflation in China, India and Brazil abated as the year progressed, they were replaced by the far greater concerns of potential sovereign debt defaults in Europe. European banks are important lenders in Asia and Latin America. Investors worried that the banks could serve as a transmission mechanism of European credit contraction.
Notwithstanding the horrific news related to the Japanese tsunami and associated nuclear catastrophe in the spring, Japanese equities proved to be among the best performers globally in 2011. The Fund's Japanese holdings, which represented on average 17% of the portfolio, fell less than 1% in U.S. dollar terms, buoyed in part by an appreciating yen. Internet-related companies Gree (a social networking game developer) and Start Today (an online apparel retailer) posted 181% and 86% gains, respectively, for the year for Wanger International. Investors became enthusiastic about their innovative business models, prospective near-term earnings growth in excess of 50% and high valuations assigned in transactions involving internet-related companies elsewhere in the world. We like these businesses and remain invested, but took some money off the table in both cases to fund more attractively valued new ideas.
As mentioned above, the European debt crisis became the overriding political and economic development affecting global risk premiums in the year and did take a toll on the Fund's equity holdings. Continental European holdings were off over 18%. Danish enzyme manufacturer Novozymes was an exception and up almost 11% for the year. On the downside, German auto supplier and defense contractor Rheinmetall was off 44% for the year despite solid improvements and respectable growth in its exhaust-system business, where fuel efficiency and tightening emission standards are creating opportunity. In the age of European austerity, however, the outlook for defense spending has soured, which explains the disappointing share price movement as earnings multiples of European defense stocks contracted.
Emerging market small-cap stocks, strong performers in 2010, were the worst performing equity class in 2011. The Fund's Brazilian holdings declined more than 30%, Chinese holdings more than 35% and Indian holdings more than 53%. At the end of the year, emerging market stocks represented about 24% of the Fund's assets, which compares with a benchmark weight of 25%. Our full weight here reflects our conviction in the long-term underlying opportunities offered by emerging market small-cap stocks as these emerging societies continue to negotiate the transition from informal to formal economies and raise the purchasing power and living standards of millions of people.
2012 has several major catalysts that we believe will affect global risk and the opportunity for continued growth in international small-cap equities. In the beginning of the year, all eyes will continue to look toward Europe for a resolution on the euro debt crisis. This is expected to be resolved before the high rhetoric associated with major elections of new governments in both China and the United States in the fall. As always, we will continue to work hard to find and invest in dynamic growth companies for you, our shareholders.
International investing involves special risks, including foreign taxation, currency risks, risks associated with possible differences in financial standards and other risks associated with future political and economic developments. Stocks of small- and mid-cap companies pose special risks, including possible illiquidity and greater price volatility than stocks of larger, more established companies. Investing in emerging markets may involve greater risks than investing in more developed countries. In addition, concentration of investments in a single region may result in greater volatility.
Portfolio holdings are subject to change periodically and may not be representative of current holdings.
Fund's Positions in Mentioned Holdings
As a percentage of net assets, as of 12/31/11
| Novozymes | | | 0.9 | % | |
| Gree | | | 0.7 | % | |
| Rheinmetall | | | 0.5 | % | |
| Start Today | | | 0.2 | % | |
6
Wanger International 2011 Annual Report

Growth of a $10,000 Investment in Wanger International
May 3, 1995 (inception date) through December 31, 2011
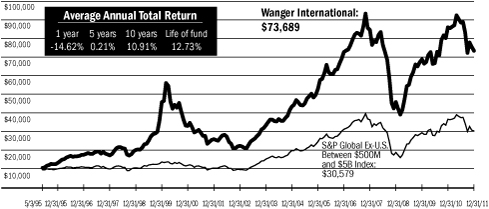
Performance data shown represents past performance and is not a guarantee of future results. The investment return and principal value will fluctuate so that shares, when redeemed, may be worth more or less than the original cost. Current performance may be lower or higher than the performance data shown. Performance results reflect any fee waivers or reimbursements of Fund expenses by the investment adviser and/or any of its affiliates. Absent these fee waivers and/or expense reimbursement arrangements, performance results would have been lower. For daily and most recent month-end performance updates, please call 1-888-4-WANGER.
This graph compares the results of $10,000 invested in Wanger International on May 3, 1995 (the date the Fund began operations) through December 31, 2011, to the S&P Global Ex-U.S. Between $500M and $5B Index with dividends and capital gains reinvested. Although the index is provided for use in assessing the Fund's performance, the Fund's holdings may differ significantly from those in the index.
Top 10 Holdings
As a percentage of net assets, as of 12/31/11
1. Far Eastone Telecom (Taiwan)
Taiwan's Third Largest Mobile Operator | | | 1.2
| % | |
2. Melco Crown Entertainment - ADR (Hong Kong)
Macau Casino Operator | | | 1.2
| % | |
3. Archipelago Resources (Indonesia)
Gold Mining Projects in Indonesia, Vietnam & the Philippines | | | 1.2
| % | |
4. Kansai Paint (Japan)
Paint Producer in Japan, India, China & Southeast Asia | | | 1.1
| % | |
5. Hexagon (Sweden)
Design, Measurement & Visualization Software & Equipment | | | 1.1
| % | |
6. Gemalto (France)
Digital Security Solutions | | | 1.1
| % | |
7. Zhaojin Mining Industry (China)
Gold Mining & Refining in China | | | 1.0
| % | |
8. Localiza Rent A Car (Brazil)
Car Rental | | | 1.0
| % | |
9. Olam International (Singapore)
Agriculture Supply Chain Manager | | | 1.0
| % | |
10. Naspers (South Africa)
Media in Africa, China, Russia & Other Emerging Markets | | | 0.9
| % | |
Top 5 Countries
As a percentage of net assets, as of 12/31/11
| Japan | | | 18.1 | % | |
| United Kingdom | | | 6.7 | | |
| Taiwan | | | 6.0 | | |
| Netherlands | | | 4.9 | | |
| United States | | | 4.7 | | |
Results as of December 31, 2011
| | | 4th quarter | | 1 year | | 5 years | | 10 years | |
| Wanger International | | | 1.63 | % | | | -14.62 | % | | | 0.21 | % | | | 10.91 | % | |
S&P Global Ex-U.S.
Between $500M and
$5B Index* | | | 0.75 | | | | -16.94 | | | | -0.58 | | | | 11.10 | | |
| MSCI EAFE Index | | | 3.33 | | | | -12.14 | | | | -4.72 | | | | 4.67 | | |
Lipper International
Growth Funds Variable
Underlying Index | | | 5.28 | | | | -13.10 | | | | -3.45 | | | | 4.18 | | |
* The Fund's primary benchmark.
NAV as of 12/31/11: $28.79
Performance numbers reflect all Fund expenses but do not include any fees and expenses imposed under your variable annuity or life insurance policy or qualified pension or retirement plan. If performance included the effect of these additional charges, it would be lower.
The Fund's annual operating expense ratio is 1.04%. The annual operating expense ratio is as stated in the Fund's prospectus that is current as of the date of this report. Differences in expense ratios disclosed elsewhere in this report may result from including fee waivers and reimbursements as well as different time periods used in calculating the ratios. Please see Note 4 to the Financial Statements on Page 24 for more information about the Fund's fees and expenses.
All results shown assume reinvestment of distributions and do not reflect taxes that a shareholder would pay on Fund distributions or the sale of Fund shares.
The S&P Global Ex-U.S. Between $500M and $5B Index is a subset of the broad market selected by the index sponsor representing the mid- and small-cap developed and emerging markets, excluding the United States. The Morgan Stanley Capital International Europe, Australasia, Far East (MSCI EAFE) Index (Net) is a capitalization-weighted index that tracks the total return of common stocks in 22 developed-market countries within Europe, Australasia and the Far East. The returns of the MSCI EAFE Index (Net) are presented net of the withholding tax rate applicable to foreign non-resident institutional investors in the foreign companies included in the index who do not benefit from double taxation treaties. The Lipper International Growth Funds Variable Underlying Index is an equally weighted representation of the 30 largest variable insurance underlying funds in the Lipper International Growth Funds Variable Underlying Classification. Indexes are not managed and do not incur fees or expenses. It is not possible to invest directly in an index.
Lipper Inc., a widely respected data provider in the industry, calculates an average total return (assuming reinvestment of distributions) for mutual funds with investment objectives similar to those of the Fund. Lipper makes no adjustment for the effect of sales loads.
Portfolio characteristics and holdings are subject to change periodically and may not be representative of current characteristics and holdings.
7
Wanger International 2011 Annual Report
Wanger International
Statement of Investments, December 31, 2011
Number of
Shares | | | | Value | |
| | | Equities – 97.1% | |
| | | Asia – 43.3% | |
| | | Japan – 18.1% | |
| | 864,789 | | | Kansai Paint
Paint Producer in Japan, India, China & Southeast Asia | | $ | 7,702,340
| | |
| | 2,843,000 | | | Seven Bank
ATM Processing Services | | | 5,563,534
| | |
| | 369,100 | | | Kuraray
Special Resin, Fine Chemical, Fibers & Textures | | | 5,238,144
| | |
| | 212,600 | | | Hoshizaki Electric
Commercial Kitchen Equipment | | | 4,987,662
| | |
| | 247,042 | | | Aeon Delight
Facility Maintenance & Management | | | 4,980,148
| | |
| | 143,400 | | | Gree
Mobile Social Networking Game Developer/Platform | | | 4,929,558
| | |
| | 2,963 | | | Wacom
Computer Graphic Illustration Devices | | | 4,493,748
| | |
| | 84,111 | | | Ain Pharmaciez
Dispensing Pharmacy/Drugstore Operator | | | 4,047,540
| | |
| | 963 | | | Orix JREIT
Diversified REIT | | | 3,960,430
| | |
| | 1,920 | | | Advance Residence Investment
Residential REIT | | | 3,704,080
| | |
| | 264,609 | | | Japan Airport Terminal
Airport Terminal Operator at Haneda | | | 3,443,458
| | |
| | 36,599 | | | Nakanishi
Dental Tools & Machinery | | | 3,377,585
| | |
| | 255,000 | | | Park24
Parking Lot Operator | | | 3,372,771
| | |
| | 116,041 | | | Kintetsu World Express
Airfreight Logistics | | | 3,370,469
| | |
| | 283,000 | | | NGK Insulators
Ceramic Products for Auto, Power & Electronics | | | 3,350,583
| | |
| | 3,190,700 | | | Shinsei Bank
Commercial Bank | | | 3,299,068
| | |
| | 3,250 | | | Jupiter Telecommunications
Largest Cable Service Provider in Japan | | | 3,289,673
| | |
| | 110,416 | | | Tsumura
Traditional Chinese/Japanese Herbal Rx Drugs (Kampo) | | | 3,255,094
| | |
| | 243,200 | | | Asahi Diamond Industrial
Consumable Diamond Tools | | | 2,926,435
| | |
| | 147,503 | | | Ibiden
Electronic Parts & Ceramics | | | 2,904,048
| | |
Number of
Shares | | | | Value | |
| | 335,000 | | | Shimadzu
Analytical Instrument, Medical & Industrial Equipment | | $ | 2,825,067
| | |
| | 130,518 | | | Glory
Currency Handling Systems & Related Equipment | | | 2,807,484
| | |
| | 181,360 | | | Ushio
Industrial Light Sources | | | 2,606,638
| | |
| | 158,847 | | | Daiseki
Waste Disposal and Recycling | | | 2,580,999
| | |
| | 110,825 | | | Aeon Mall
Suburban Shopping Mall Developer, Owner & Operator | | | 2,351,123
| | |
| | 57,500 | | | Pigeon
Baby Care Products | | | 2,343,602
| | |
| | 355 | | | Fukuoka REIT
Diversified REIT in Fukuoka | | | 2,332,444
| | |
| | 90,146 | | | Icom
Two Way Radio Communication Equipment | | | 2,305,316
| | |
| | 700 | | | Mori Hills REIT Investment
Tokyo Centric Diversified REIT | | | 2,286,029
| | |
| | 780 | | | Kenedix Realty Investment
Tokyo Mid Size Office REIT | | | 2,261,533
| | |
| | 96,700 | | | Misumi Group
Industrial Components Distributor | | | 2,213,009
| | |
| | 78,358 | | | Miura
Industrial Boiler Manufacturer | | | 2,207,014
| | |
| | 60,986 | | | Hamamatsu Photonics
Optical Sensors for Medical & Industrial Applications | | | 2,126,287
| | |
| | 238,900 | | | Sintokogio
Automated Casting Machines, Surface Treatment
System & Consumables | | | 2,094,926
| | |
| | 162,666 | | | Torishima Pump Manufacturing
Industrial Pump for Power Generation &
Water Supply Systems | | | 2,081,820
| | |
| | 32,000 | | | FP Corporation
Disposable Food Trays & Containers | | | 2,073,246
| | |
| | 39,000 | | | Disco
Semiconductor Dicing & Grinding Equipment | | | 2,030,733
| | |
| | 57,179 | | | Start Today
Online Japanese Apparel Retailer | | | 1,341,423
| | |
| | 2,900 | | | Doshisha
Wholesaler | | | 83,633
| | |
| | | | | | | | 123,148,694 | | |
See accompanying notes to financial statements.
8
Wanger International 2011 Annual Report
Wanger International
Statement of Investments, December 31, 2011
Number of
Shares | | | | Value | |
| | | Taiwan – 6.0% | |
| | 4,533,000 | | | Far Eastone Telecom
Taiwan's 3rd Largest Mobile Operator | | $ | 8,515,240
| | |
| | 833,400 | | | President Chain Store
Taiwan's Number One Convenience Chain Store Operator | | | 4,538,606
| | |
| | 705,440 | | | Simplo Technology
Battery Packs for Notebook & Tablet PCs | | | 4,105,449
| | |
| | 308,700 | | | St. Shine Optical
World's Leading Disposable Contact Lens OEM | | | 3,255,949
| | |
| | 1,261,830 | | | Tripod Technologies
Printed Circuit Boards | | | 3,039,306
| | |
| | 842,000 | | | Taiwan Mobile
Taiwan's 2nd Largest Mobile Operator | | | 2,623,302
| | |
| | 1,281,900 | | | Chroma Ate
Automatic Test Systems, Testing & Measurement Instruments | | | 2,512,092
| | |
| | 1,747,000 | | | CTCI Corp
International Engineering Firm | | | 2,380,676
| | |
| | 1,292,300 | | | Taiwan Hon Chuan
Beverage Packaging (bottles, caps, labels) Manufacturer | | | 2,379,639
| | |
| | 830,000 | | | Advantech
Industrial PC & Components | | | 2,295,011
| | |
| | 743,000 | | | Radiant Opto-Electronics
Back Light Modules for LCDs | | | 2,119,702
| | |
| | 287,300 | | | PC Home
Taiwanese Internet Retail Company | | | 1,764,591
| | |
| | 310,200 | | | Lung Yen
Funeral Services & Columbaria | | | 906,704
| | |
| | 59,350 | | | Formosa International Hotels
Hotel, Food & Beverage Operation &
Hospitality Management Services | | | 767,927
| | |
| | | | | | | | 41,204,194 | | |
| | | China – 4.1% | |
| | 4,352,000 | | | Zhaojin Mining Industry
Gold Mining & Refining in China | | | 6,902,875
| | |
| | 81,000 | | | NetEase.com - ADR (a)
Chinese Online Gaming Services | | | 3,632,850
| | |
| | 140,000 | | | New Oriental Education &
Technology - ADR (a)
China's Largest Private Education Service Provider | | | 3,367,000
| | |
| | 2,440,800 | | | Want Want
Chinese Branded Consumer Food Company | | | 2,431,235
| | |
Number of
Shares | | | | Value | |
| | 1,509,500 | | | Digital China
IT Distribution & Systems Integration Services | | $ | 2,332,882
| | |
| | 644,000 | | | ENN Energy
China's Largest Private Gas Operator | | | 2,061,793
| | |
| | 1,509,000 | | | China Yurun Food (b)
Meat Processor in China | | | 1,972,381
| | |
| | 3,567,100 | | | AMVIG Holdings
Chinese Tobacco Packaging Material Supplier | | | 1,890,177
| | |
| | 28,000,000 | | | RexLot Holdings
Lottery Equipment Supplier in China | | | 1,832,813
| | |
| | 32,500 | | | 51job - ADR (a) (b)
Integrated Human Resource Service | | | 1,363,050
| | |
| | 61,602 | | | Noah Holdings - ADR (a) (b)
Wealth Management Product Distributor in China | | | 378,853
| | |
| | | | | | | | 28,165,909 | | |
| | | Singapore – 4.1% | |
| | 4,134,000 | | | Olam International
Agriculture Supply Chain Manager | | | 6,776,327
| | |
| | 4,900,000 | | | Mapletree Industrial Trust
Singapore Industrial Property Landlord | | | 4,060,070
| | |
| | 6,190,000 | | | Mapletree Logistics Trust
Industrial Property Landlord | | | 4,028,952
| | |
| | 2,730,000 | | | Ascendas REIT
Singapore Industrial Property Landlord | | | 3,854,818
| | |
| | 2,300,000 | | | CDL Hospitality Trust
Hotel Owner/Operator | | | 2,740,526
| | |
| | 4,000,000 | | | Mapletree Commercial Trust
Retail & Office Property Landlord | | | 2,621,790
| | |
| | 430,000 | | | Singapore Exchange
Singapore Equity & Derivatives Market Operator | | | 2,032,477
| | |
| | 1,840,000 | | | Goodpack Limited
International Bulk Container Leasing | | | 1,964,329
| | |
| | | | | | | | 28,079,289 | | |
| | | Hong Kong – 3.6% | |
| | 874,400 | | | Melco Crown Entertainment - ADR (a) (b)
Macau Casino Operator | | | 8,411,728
| | |
| | 2,150,000 | | | Lifestyle International
Mid- to High-end Department Store Operator in
Hong Kong & China | | | 4,732,372
| | |
| | 1,970,000 | | | L'Occitane International
Skin Care & Cosmetics Producer | | | 3,950,592
| | |
See accompanying notes to financial statements.
9
Wanger International 2011 Annual Report
Wanger International
Statement of Investments, December 31, 2011
Number of
Shares | | | | Value | |
| | | Hong Kong – 3.6% (cont) | |
| | 4,642,000 | | | Sasa International
Cosmetics Retailer | | $ | 2,558,564
| | |
| | 1,068,000 | | | AAC Technologies
Miniature Acoustic Components | | | 2,389,465
| | |
| | 1,548,400 | | | MGM China Holdings (a)
Macau Casino Operator | | | 2,014,330
| | |
| | 935,000 | | | Melco International (a)
Macau Casino Operator | | | 689,999
| | |
| | | | | | | | 24,747,050 | | |
| | | India – 2.1% | |
| | 1,398,200 | | | Jain Irrigation Systems | | | 2,274,130 | | |
| | 59,405 | | | Jain Irrigation Systems - DVR (a)
Agricultural Micro-irrigation Systems & Food Processing | | | 39,432
| | |
| | 991,200 | | | Mundra Port & Special Economic Zone
Indian West Coast Shipping Port | | | 2,237,191
| | |
| | 44,100 | | | Asian Paints
India's Largest Paint Company | | | 2,152,612
| | |
| | 2,145,900 | | | Manappuram Finance
Short-term Lending Collateralized by Household Gold | | | 1,858,222
| | |
| | 188,000 | | | Shriram Transport Finance
Truck Financing in India | | | 1,487,210
| | |
| | 178,000 | | | United Breweries
India's Largest Brewer | | | 1,286,145
| | |
| | 4,020,100 | | | REI Agro
Basmati Rice Processing | | | 1,247,610
| | |
| | 1,250,800 | | | S. Kumars Nationwide
Textiles, Clothing & Retail | | | 555,903
| | |
| | 199,131 | | | SKIL Ports and Logistics (a)
Indian Container Port Project | | | 491,708
| | |
| | 99,500 | | | Titan Industries
Jewelry, Watches & Eyeglasses | | | 319,941
| | |
| | | | | | | | 13,950,104 | | |
| | | Indonesia – 1.4% | |
| | 7,592,066 | | | Archipelago Resources (a)
Gold Mining Projects in Indonesia, Vietnam & the Philippines | | | 8,150,168
| | |
| | 1,194,900 | | | Ace Indonesia
Home Improvement Retailer | | | 539,871
| | |
Number of
Shares | | | | Value | |
| | 1,757,800 | | | Tower Bersama Infrastructure
Communications Towers | | $ | 460,146
| | |
| | 874,600 | | | Jasa Marga
Largest Toll Road Operator in Indonesia | | | 404,636
| | |
| | | | | | | | 9,554,821 | | |
| | | Mongolia – 1.1% | |
| | 4,447,500 | | | Mongolian Mining (a)
Coking Coal Mining in Mongolia | | | 3,334,401
| | |
| | 129,245 | | | Ivanhoe Mines (a) | | | 2,295,010 | | |
| | 117,980 | | | Ivanhoe Mines (a) (c)
Copper Mine Project in Mongolia | | | 2,090,606
| | |
| | | | | | | | 7,720,017 | | |
| | | Korea – 1.1% | |
| | 155,600 | | | Woongjin Coway (a)
South Korean Household Appliance Rental Service Provider | | | 4,954,829
| | |
| | 13,000 | | | NHN (a)
Korean Online Search Services | | | 2,382,579
| | |
| | 7,600 | | | Handsome (a)
Korea's Leading High-end Apparel Company | | | 196,142
| | |
| | | | | | | | 7,533,550 | | |
| | | Thailand – 0.8% | |
| | 14,859,100 | | | Home Product Center
Home Improvement Retailer | | | 5,174,350
| | |
| | | Philippines – 0.7% | |
| | 9,023,600 | | | SM Prime Holdings
Shopping Mall Operator | | | 2,738,052
| | |
| | 1,023,030 | | | Int'l Container Terminal
Container Handling Terminals & Port Management | | | 1,238,127
| | |
| | 2,064,100 | | | Manila Water Company
Water Utility Company in the Philippines | | | 913,997
| | |
| | | | | | | | 4,890,176 | | |
| | | Cambodia – 0.2% | |
| | 5,252,200 | | | Nagacorp
Casino/Entertainment Complex in Cambodia | | | 1,322,186
| | |
| | | | | Total Asia | | | 295,490,340 | | |
See accompanying notes to financial statements.
10
Wanger International 2011 Annual Report
Wanger International
Statement of Investments, December 31, 2011
Number of
Shares | | | | Value | |
| | | Europe – 33.2% | |
| | | United Kingdom – 6.7% | |
| | 185,000 | | | Intertek Group
Testing, Inspection & Certification Services | | $ | 5,846,657
| | |
| | 2,250,000 | | | Charles Taylor (d)
Insurance Services | | | 4,442,065
| | |
| | 680,000 | | | Chemring
Defense Manufacturer of Countermeasures & Energetics | | | 4,223,104
| | |
| | 378,000 | | | JLT Group
International Business Insurance Broker | | | 4,047,600
| | |
| | 980,000 | | | Workspace Group
United Kingdom Real Estate | | | 3,435,780
| | |
| | 413,901 | | | Serco
Facilities Management | | | 3,046,816
| | |
| | 87,000 | | | Rotork
Valve Actuators for Oil & Water Pipelines | | | 2,607,642
| | |
| | 56,000 | | | Next
Clothes & Home Retailer in the United Kingdom | | | 2,380,314
| | |
| | 500,000 | | | GlobeOp Financial Services
Hedge Fund Administrator | | | 2,213,025
| | |
| | 223,973 | | | Smith and Nephew
Medical Equipment & Supplies | | | 2,175,677
| | |
| | 349,000 | | | Abcam
Online Sales of Antibodies | | | 1,978,289
| | |
| | 90,604 | | | Tullow Oil
Oil & Gas Producer | | | 1,972,726
| | |
| | 307,400 | | | Domino's Pizza United Kingdom & Ireland
Pizza Delivery in United Kingdom, Ireland & Germany | | | 1,921,504
| | |
| | 318,303 | | | Premier Oil (a)
Oil & Gas Producer in Europe, Pakistan & Asia | | | 1,794,398
| | |
| | 223,300 | | | Shaftesbury
London Prime Retail REIT | | | 1,620,179
| | |
| | 556,698 | | | PureCircle (a)
Natural Sweeteners | | | 821,324
| | |
| | 58,825 | | | Greggs
Bakery | | | 462,258
| | |
| | 238,400 | | | Sterling Resources (a) | | | 390,801 | | |
| | 161,600 | | | Sterling Resources (a) (e) (f)
Oil & Gas Exploration - Europe | | | 259,607
| | |
| | 306,096 | | | Kesa Electricals
Europe's Leading Electricals Retailers | | | 319,922
| | |
| | | | | | | | 45,959,688 | | |
Number of
Shares | | | | Value | |
| | | Netherlands – 4.9% | |
| | 242,087 | | | Imtech (b)
Electromechanical & ICT Installation & Maintenance | | $ | 6,271,124
| | |
| | 306,949 | | | Aalberts Industries
Flow Control & Heat Treatment | | | 5,156,550
| | |
| | 85,184 | | | Fugro
Sub-sea Oilfield Services | | | 4,949,648
| | |
| | 169,844 | | | Koninklijke TenCate
Advanced Textiles & Industrial Fabrics | | | 4,673,388
| | |
| | 189,614 | | | UNIT4
Business Software Development | | | 4,490,966
| | |
| | 28,860 | | | Core Laboratories (b)
Oil & Gas Reservoir Consulting | | | 3,288,597
| | |
| | 161,566 | | | Arcadis
Engineering Consultants | | | 2,530,193
| | |
| | 39,474 | | | Vopak
World's Largest Operator of Petroleum &
Chemical Storage Terminals | | | 2,085,718
| | |
| | | | | | | | 33,446,184 | | |
| | | Germany – 4.0% | |
| | 317,594 | | | Wirecard
Online Payment Processing & Risk Management | | | 5,105,193
| | |
| | 18,409 | | | Rational
Commercial Ovens | | | 4,007,509
| | |
| | 198,108 | | | Rhoen-Klinikum
Health Care Services | | | 3,774,228
| | |
| | 84,100 | | | Rheinmetall
Defense & Automotive | | | 3,726,358
| | |
| | 79,100 | | | Dürr
Automotive Plant Engineering &
Associated Capital Equipment | | | 3,480,757
| | |
| | 105,772 | | | CTS Eventim
Event Ticket Sales | | | 3,175,975
| | |
| | 68,400 | | | Elringklinger
Automobile Components | | | 1,697,943
| | |
| | 20,900 | | | Bertrandt
Outsourced Engineering | | | 1,371,697
| | |
| | 45,390 | | | Deutsche Beteiligungs
Private Equity Investment Management | | | 915,263
| | |
| | | | | | | | 27,254,923 | | |
See accompanying notes to financial statements.
11
Wanger International 2011 Annual Report
Wanger International
Statement of Investments, December 31, 2011
Number of
Shares | | | | Value | |
| | | France – 4.0% | |
| | 149,400 | | | Gemalto
Digital Security Solutions | | $ | 7,266,507
| | |
| | 67,352 | | | Eurofins Scientific
Food, Pharmaceuticals & Materials Screening & Testing | | | 4,910,306
| | |
| | 69,867 | | | Neopost
Postage Meter Machines | | | 4,707,546
| | |
| | 125,400 | | | Saft Batteries
Niche Battery Manufacturer | | | 3,546,234
| | |
| | 44,544 | | | Rubis
Tank Storage & Liquefied Petroleum Gas Distribution | | | 2,329,104
| | |
| | 28,900 | | | Norbert Dentressangle
Leading European Logistics & Transport Group | | | 2,019,807
| | |
| | 57,400 | | | Mersen
Advanced Industrial Materials | | | 1,734,671
| | |
| | 220,933 | | | Hi-Media (a)
Online Advertiser in Europe | | | 631,933
| | |
| | | | | | | | 27,146,108 | | |
| | | Switzerland – 3.7% | |
| | 32,820 | | | Partners Group
Private Markets Asset Management | | | 5,726,816
| | |
| | 27,986 | | | Geberit (a)
Plumbing Supplies | | | 5,392,809
| | |
| | 37,516 | | | Kuehne & Nagel
Freight Forwarding/Logistics | | | 4,213,710
| | |
| | 41,000 | | | Dufry Group (a)
Operates Airport Duty Free & Duty Paid Shops | | | 3,773,502
| | |
| | 1,958 | | | Sika
Chemicals for Construction & Industrial Applications | | | 3,689,620
| | |
| | 86,652 | | | Bank Sarasin & Cie
Private Banking | | | 2,532,308
| | |
| | | | | | | | 25,328,765 | | |
| | | Sweden – 2.2% | |
| | 508,007 | | | Hexagon
Design, Measurement & Visualization Software & Equipment | | | 7,595,690
| | |
| | 513,810 | | | Sweco
Engineering Consultants | | | 4,292,918
| | |
| | 84,900 | | | Unibet
European Online Gaming Operator | | | 1,955,326
| | |
Number of
Shares | | | | Value | |
| | 111,426 | | | East Capital Explorer
Sweden-based Russia/Central Eastern Europe
Investment Fund | | $ | 870,256
| | |
| | | | | | | | 14,714,190 | | |
| | | Italy – 1.7% | |
| | 338,100 | | | Ansaldo STS
Railway Systems Integrator | | | 3,206,569
| | |
| | 1,692,600 | | | CIR
Italian Holding Company | | | 2,699,242
| | |
| | 689,000 | | | Geox (b)
Apparel & Shoe Maker | | | 1,926,094
| | |
| | 221,000 | | | Pirelli
Global Tire Supplier | | | 1,852,599
| | |
| | 21,000 | | | Tod's (b)
Leather Shoes & Bags | | | 1,705,895
| | |
| | | | | | | | 11,390,399 | | |
| | | Denmark – 1.4% | |
| | 206,515 | | | Novozymes
Industrial Enzymes | | | 6,375,274
| | |
| | 21,676 | | | SimCorp
Software for Investment Managers | | | 3,309,918
| | |
| | | | | | | | 9,685,192 | | |
| | | Ireland – 0.7% | |
| | 1,112,900 | | | United Drug
Irish Pharmaceutical Wholesaler & Outsourcer | | | 2,952,761
| | |
| | 36,400 | | | Paddy Power
Irish Betting Services | | | 2,097,134
| | |
| | | | | | | | 5,049,895 | | |
| | | Russia – 0.7% | |
| | 264,200 | | | Petropavlovsk
Gold & Iron Ore Mining in Russia | | | 2,523,361
| | |
| | 77,500 | | | Mail.ru - GDR (a) (f)
Internet Social Networking & Games for Russian Speakers | | | 2,015,000
| | |
| | | | | | | | 4,538,361 | | |
| | | Iceland – 0.6% | |
| | 4,344,101 | | | Marel (a)
Largest Manufacturer of Poultry &
Fish Processing Equipment | | | 4,443,233
| | |
See accompanying notes to financial statements.
12
Wanger International 2011 Annual Report
Wanger International
Statement of Investments, December 31, 2011
Number of
Shares | | | | Value | |
| | | Norway – 0.4% | |
| | 302,648 | | | Atea
Leading Nordic IT Hardware/Software Re-seller &
Installation Company | | $ | 3,036,170
| | |
| | | Czech Republic – 0.4% | |
| | 16,891 | | | Komercni Banka
Leading Czech Republic Universal Bank | | | 2,846,999
| | |
| | | Belgium – 0.4% | |
| | 53,991 | | | EVS Broadcast Equipment
Digital Live Mobile Production Software & Systems | | | 2,759,477
| | |
| | | Portugal – 0.4% | |
| | 1,002,300 | | | Redes Energéticas Nacionais
Portuguese Power Transmission & Gas Transportation | | | 2,737,149
| | |
| | | Spain – 0.4% | |
| | 61,803 | | | Red Eléctrica de España
Spanish Power Transmission | | | 2,644,822
| | |
| | | Finland – 0.3% | |
| | 127,941 | | | Stockmann
Department Store & Fashion Retailer in
Scandinavia & Russia | | | 1,983,741
| | |
| | | Kazakhstan – 0.2% | |
| | 217,900 | | | Halyk Savings Bank of
Kazakhstan - GDR (a)
Largest Retail Bank & Insurer in Kazakhstan | | | 1,058,994
| | |
| | | Greece – 0.1% | |
| | 839,300 | | | Intralot
Lottery & Gaming Systems & Services | | | 731,056
| | |
| | | | | Total Europe | | | 226,755,346 | | |
| | | Other Countries – 15.7% | |
| | | United States – 4.7% | |
| | 78,368 | | | Alexion Pharmaceuticals (a)
Biotech Focused on Orphan Diseases | | | 5,603,312
| | |
| | 122,233 | | | World Fuel Services
Global Fuel Broker | | | 5,131,341
| | |
| | 120,500 | | | Atwood Oceanics (a)
Offshore Drilling Contractor | | | 4,794,695
| | |
Number of
Shares | | | | Value | |
| | 131,000 | | | BioMarin Pharmaceutical (a)
Biotech Focused on Orphan Diseases | | $ | 4,503,780
| | |
| | 75,660 | | | FMC Technologies (a)
Oil & Gas Wellhead Manufacturer | | | 3,951,722
| | |
| | 121,361 | | | Textainer Group Holdings (b)
Top International Container Leasor | | | 3,534,032
| | |
| | 33,000 | | | Oil States International (a)
Diversified North American Oil Service Provider | | | 2,520,210
| | |
| | 70,000 | | | Hornbeck Offshore (a)
Supply Vessel Operator in U.S. Gulf of Mexico | | | 2,171,400
| | |
| | | | | | | | 32,210,492 | | |
| | | Canada – 4.7% | |
| | 173,849 | | | CCL Industries
Leading Global Label Manufacturer | | | 5,343,030
| | |
| | 77,920 | | | Baytex (b)
Oil & Gas Producer in Canada | | | 4,357,401
| | |
| | 152,815 | | | ShawCor
Oil & Gas Pipeline Products | | | 4,332,071
| | |
| | 82,600 | | | Onex Capital
Private Equity | | | 2,690,226
| | |
| | 71,742 | | | AG Growth
Leading Manufacturer of Augers &
Grain Handling Equipment | | | 2,639,401
| | |
| | 131,430 | | | Black Diamond Group
Provides Accommodations/Equipment for
Oil Sands Development | | | 2,381,544
| | |
| | 107,600 | | | Alliance Grain Traders
Global Leader in Pulse Processing & Distribution | | | 2,193,720
| | |
| | 90,000 | | | Celtic Exploration (a)
Canadian Oil & Gas Producer | | | 2,020,417
| | |
| | 135,000 | | | Crew Energy (a)
Canadian Oil & Gas Producer | | | 1,490,798
| | |
| | 318,277 | | | Horizon North Logistics
Provides Diversified Oil Service Offering in Northern Canada | | | 1,455,873
| | |
| | 92,000 | | | Athabasca Oil Sands (a)
Oil Sands SAGD & Alberta Deep Basin Development | | | 1,127,931
| | |
| | 378,516 | | | DeeThree Exploration (a) (e) | | | 746,443 | | |
| | 133,000 | | | DeeThree Exploration (a)
Canadian Oil & Gas Producer | | | 267,632
| | |
| | 847,500 | | | Southern Arc Minerals (a) (e)
Gold and Copper Exploration in Indonesia | | | 543,066
| | |
See accompanying notes to financial statements.
13
Wanger International 2011 Annual Report
Wanger International
Statement of Investments, December 31, 2011
Number of
Shares | | | | Value | |
| | | Canada – 4.7% (cont) | |
| | 228,671 | | | Pan Orient (a)
Growth Oriented, Return-focused Asian Explorer | | $ | 437,702
| | |
| | | | | | | | 32,027,255 | | |
| | | South Africa – 4.3% | |
| | 146,600 | | | Naspers
Media in Africa, China, Russia & Other Emerging Markets | | | 6,414,040
| | |
| | 628,700 | | | Adcock Ingram Holdings
Manufacturer of Pharmaceuticals & Medical Supplies | | | 4,809,165
| | |
| | 466,185 | | | Mr. Price
South African Retailer of Apparel, Household &
Sporting Goods | | | 4,608,403
| | |
| | 2,364,500 | | | Rand Merchant Insurance
Directly Sold Property & Casualty Insurance;
Holdings in Other Insurers | | | 3,924,943
| | |
| | 1,225,533 | | | Coronation Fund Managers
South African Fund Manager | | | 3,446,197
| | |
| | 859,800 | | | Northam Platinum
Platinum Mining in South Africa | | | 3,195,273
| | |
| | 131,123 | | | Massmart Holdings
General Merchandise, Food & Home Improvement Stores;
Wal-Mart Subsidiary | | | 2,745,241
| | |
| | | | | | | | 29,143,262 | | |
| | | Australia – 1.2% | |
| | 328,525 | | | UGL
Engineering & Facilities Management | | | 3,992,365
| | |
| | 61,985 | | | Cochlear
Cochlear Implants | | | 3,936,737
| | |
| | | | | | | | 7,929,102 | | |
| | | Israel – 0.6% | |
| | 382,004 | | | Israel Chemicals
Producer of Potash, Phosphates, Bromine &
Specialty Chemicals | | | 3,959,370
| | |
| | | Senegal – 0.2% | |
| | 6,312 | | | Sonatel
Leading Telecoms Operator in Western Africa | | | 1,494,483
| | |
| | | | | Total Other Countries | | | 106,763,964 | | |
Number of
Shares | | | | Value | |
| | | Latin America – 4.9% | |
| | | Brazil – 3.0% | |
| | 500,000 | | | Localiza Rent A Car
Car Rental | | | 6,862,351
| | |
| | 818,300 | | | Suzano
Brazilian Pulp & Paper Producer | | | 2,956,892
| | |
| | 152,100 | | | Multiplus
Loyalty Program Operator in Brazil | | | 2,629,795
| | |
| | 180,000 | | | Odontoprev
Dental Insurance | | | 2,566,948
| | |
| | 447,400 | | | MRV Engenharia
Brazilan Low-income Property Developer | | | 2,566,508
| | |
| | 269,400 | | | Mills Estruturas e Servicos de Engenharia
Civil Engineering & Construction | | | 2,556,429
| | |
| | | | | | | | 20,138,923 | | |
| | | Mexico – 0.6% | |
| | 77,276 | | | Grupo Aeroportuario del Sureste - ADR
Mexican Airport Operator | | | 4,322,819
| | |
| | | Argentina – 0.4% | |
| | 220,833 | | | Union Agriculture Group (a) (e) (g)
Farmland Operator in Uruguay | | | 2,201,705
| | |
| | 845,000 | | | Madalena Ventures (a) (e)
Oil & Gas Exploration in Argentina | | | 739,702
| | |
| | | | | | | | 2,941,407 | | |
| | | Chile – 0.4% | |
| | 46,828 | | | Sociedad Quimica y Minera de
Chile - ADR (b)
Producer of Specialty Fertilizers, Lithium & Iodine | | | 2,521,688
| | |
| | | Guatemala – 0.3% | |
| | 116,400 | | | Tahoe Resources (a)
Silver Project in Guatemala | | | 2,020,076
| | |
| | | Colombia – 0.2% | |
| | 1,152,300 | | | Canacol (a)
Oil Producer in South America | | | 870,941
| | |
| | 3,074,000 | | | Gulf United (a) (e)
Prospecting for Oil Alongside Large Producers in Colombia | | | 649,229
| | |
| | | | 1,520,170 | | |
| | | | | Total Latin America | | | 33,465,083 | | |
Total Equities
(Cost: $530,074,453) – 97.1% | | | 662,474,733 | | |
See accompanying notes to financial statements.
14
Wanger International 2011 Annual Report
Wanger International
Statement of Investments, December 31, 2011
Number of
Shares | | | | Value | |
| Securities Lending Collateral – 2.7% | |
| | 18,597,914 | | | Dreyfus Government Cash
Management Fund
(7 day yield of 0.00%) (h) | | $ | 18,597,914 | | |
Total Securities Lending Collateral
(Cost: $18,597,914) | | | 18,597,914 | | |
Total Investments
(Cost: $548,672,367) (i) (j) – 99.8% | | | 681,072,647 | | |
Obligation to Return Collateral for
Securities Loaned – (2.7)% | | | (18,597,914 | ) | |
| Cash and Other Assets Less Liabilities – 2.9% | | | 19,742,517 | | |
| Total Net Assets – 100.0% | | $ | 682,217,250 | | |
ADR = American Depositary Receipts
DVR = Differential Voting Right Equity Shares
GDR = Global Depositary Receipts
AUD = Australian Dollar
CAD = Canadian Dollar
EUR = Euro
USD = US Dollar
Notes to Statement of Investments:
(a) Non-income producing security.
(b) All or a portion of this security was on loan at December 31, 2011. The total market value of securities on loan at December 31, 2011 was $18,143,573.
(c) Security is traded on a U.S. exchange.
(d) An affiliated person of the Fund may include any company in which the Fund owns five percent or more of its outstanding voting shares. Holdings and transactions in this affiliated company during the year ended December 31, 2011, are as follows:
Affiliates | | Balance
of Shares
Held
12/31/10 | | Purchases/
Additions | | Sales/
Reductions | | Balance of
Shares
Held
12/31/11 | | Value | | Dividend | |
Charles
Taylor | | | 2,250,000 | | | | — | | | | — | | | | 2,250,000 | | | $ | 4,442,065 | | | $ | 277,570 | | |
The aggregate cost and value of this company at December 31, 2011, was $9,152,033 and $4,442,065, respectively. Investments in the affiliated company represented 0.65% of the Fund's total net assets at December 31, 2011.
(e) Denotes a restricted security, which is subject to restrictions on resale under federal securities laws. These securities are valued at a fair value determined in good faith under consistently applied procedures established by the Board of Trustees. At December 31, 2011, the market value of these securities amounted to $5,139,751, which represented 0.75% of total net assets.
Additional information on these securities is as follows:
Security | | Acquisition
Dates | | Shares | | Cost | | Value | |
| Union Agriculture Group | | 12/08/10-
12/16/11 | | | 220,833 | | | $ | 2,649,999 | | | $ | 2,201,705 | | |
| DeeThree Exploration | | 09/07/10-
03/08/11 | | | 378,516 | | | | 1,283,408 | | | | 746,443 | | |
| Madalena Ventures | | 10/21/10 | | | 845,000 | | | | 535,436 | | | | 739,702 | | |
| Gulf United | | 02/11/11 | | | 3,074,000 | | | | 922,200 | | | | 649,229 | | |
| Southern Arc Minerals | | 02/16/11 | | | 847,500 | | | | 1,374,835 | | | | 543,066 | | |
| Sterling Resources | | 12/02/10 | | | 161,600 | | | | 482,244 | | | | 259,607 | | |
| | | | | $7,248,122 | | $5,139,752 | |
(f) Security exempt from registration under Section 4(2) of the Securities Act of 1933. This security may only be resold in exempt transactions to qualified buyers. Private resales of this security to qualified institutional buyers are also exempt from registration pursuant to Rule 144A under the Securities Act of 1933. At December 31, 2011, this security had an aggregate value of $2,274,607, which represented 0.33% of total net assets.
(g) Illiquid security.
(h) Investment made with cash collateral received from securities lending activity.
(i) On December 31, 2011, the Fund's total investments were denominated in currencies as follows:
| Currency | | Value | | Percentage of
Net Assets | |
| Japanese Yen | | $ | 123,148,694 | | | | 18.0 | | |
| Euro | | | 111,855,156 | | | | 16.4 | | |
| US Dollar | | | 67,512,611 | | | | 9.9 | | |
| Pound Sterling | | | 56,474,518 | | | | 8.3 | | |
| Taiwan Dollar | | | 41,204,194 | | | | 6.0 | | |
| Hong Kong Dollar | | | 40,416,065 | | | | 5.9 | | |
| Canadian Dollar | | | 38,603,391 | | | | 5.7 | | |
Other currencies less than
5% of total net assets | | | 183,260,104 | | | | 26.9 | | |
Cash and other assets
less liabilities | | | 19,742,517 | | | | 2.9 | | |
| | | $ | 682,217,250 | | | | 100.0 | | |
(j) At December 31, 2011, for federal income tax purposes, cost of investments was $570,434,330 and net unrealized appreciation was $110,638,317 consisting of gross unrealized appreciation of $160,305,306 and gross unrealized depreciation of $(49,666,989).
See accompanying notes to financial statements.
15
Wanger International 2011 Annual Report
Wanger International
Statement of Investments, December 31, 2011
At December 31, 2011, the Fund had entered into the following forward foreign currency exchange contracts:
Forward
Foreign
Currency
Exchange
Contracts
to Buy | | Forward
Foreign
Currency
Exchange
Contracts
to Sell | | Principal
Amount in
Foreign
Currency | | Principal
Amount in
U.S. Dollar | | Settlement
Date | | Unrealized
Appreciation | |
| AUD | | | | USD | | | | | 3,719,980 | | | $ | 3,750,000 | | | 01/13/12 | | $ | 50,532 | | |
| CAD | | | | USD | | | | | 2,861,880 | | | | 2,800,000 | | | 01/13/12 | | | 8,620 | | |
| USD | | | | EUR | | | | | 4,684,874 | | | | 6,452,243 | | | 01/13/12 | | | 388,478 | | |
| | | | | | | | | $ | 13,002,243 | | | | | | | $ | 447,630 | | |
The counterparty for all forward foreign currency exchange contracts is State Street Bank and Trust Company.
Fair Value Measurements
Various inputs are used in determining the value of the Fund's investments, following the input prioritization hierarchy established by GAAP. These inputs are summarized in the three broad levels listed below:
• Level 1 – quoted prices in active markets for identical securities
• Level 2 – prices determined using other significant observable inputs (including quoted prices for similar securities, interest rates, prepayment speeds, credit risk and others)
• Level 3 – prices determined using significant unobservable inputs where quoted prices or observable inputs are unavailable or less reliable (including management's own assumptions about the factors market participants would use in pricing an investment)
The inputs or methodology used for valuing securities are not necessarily an indication of the risk associated with investing in those securities.
Examples of the types of securities in which the Fund would typically invest and how they are classified within this hierarchy are as follows. Typical Level 1 securities include exchange traded domestic equities, mutual funds whose NAVs are published each day and exchange traded foreign equities that are not statistically fair valued. Typical Level 2 securities include exchange traded foreign equities that are statistically fair valued, forward foreign currency exchange contracts and short-term investments valued at amortized cost. Additionally, securities fair valued by the Valuation Committee of the Fund's Board of Trustees that rely on significant observable inputs are also included in Level 2. Typical Level 3 securities include any security fair valued by the Fund's Valuation Committee that relies on significant unobservable inputs.
The following table summarizes the inputs used, as of December 31, 2011, in valuing the Fund's assets:
| Investment Type | | Other
Quoted Prices
(Level 1) | | Significant
Observable
Inputs
(Level 2) | | Significant
Unobservable
Inputs
(Level 3) | | Total | |
| Equities | |
| Asia | | $ | 21,539,097 | | | $ | 273,951,243 | | | $ | — | | | $ | 295,490,340 | | |
| Europe | | | 3,679,398 | | | | 223,075,948 | | | | — | | | | 226,755,346 | | |
| Other Countries | | | 62,948,238 | | | | 43,815,726 | | | | — | | | | 106,763,964 | | |
| Latin America | | | 29,874,447 | | | | 1,388,931 | | | | 2,201,705 | | | | 33,465,083 | | |
| Total Equities | | | 118,041,180 | | | | 542,231,848 | | | | 2,201,705 | | | | 662,474,733 | | |
Total Securities
Lending Collateral | | | 18,597,914 | | | | — | | | | — | | | | 18,597,914 | | |
| Total Investments | | | 136,639,094 | | | | 542,231,848 | | | | 2,201,705 | | | | 681,072,647 | | |
Unrealized Appreciation
on Forward Foreign
Currency Exchange
Contracts | | | — | | | | 447,630 | | | | — | | | | 447,630 | | |
| Total | | $ | 136,639,094 | | | $ | 542,679,478 | | | $ | 2,201,705 | | | $ | 681,520,277 | | |
The Fund's assets assigned to the Level 2 input category are generally valued using a market approach, in which a security's value is determined through its correlation to prices and information from observable market transactions for similar or identical assets. Foreign equities are generally valued at the last sales price on the foreign exchange or market on which they trade. The Fund may use a systematic fair valuation model, in accordance with the policy adopted by the Board of Trustees, provided by an independent third party to value securities principally traded in foreign markets in order to adjust for possible stale pricing that may occur between the close of the foreign exchanges and the time for valuation. These models take into account available market data including intraday index, ADR, and ETF movements. Forward foreign currency exchange contracts are valued at the prevailing forward exchange rate of the underlying currencies. Securities acquired via private placement that have a holding period or an extended settlement period are valued at a discount to the same shares that are trading freely on the market. These discounts are determined by the adviser's experience with similar securities or situations. Factors may include, but are not limited to, trade volume, shares outstanding and stock price.
The Fund's assets assigned to the Level 3 input category are valued at fair value as determined in good faith under consistently applied procedures established by and under the general supervision of the Board of Trustees. To determine fair value, management will utilize the valuation technique that they deem the most appropriate in the circumstances. Securities for which no market exists are valued based upon the market approach using some unobservable inputs which may include, but are not limited to, projected earnings, available cash, line of business, multiples, and consideration of the prioritization of the equity in a company's capital structure.
The following table shows transfers between Level 1 and Level 2 of the fair value hierarchy:
| Transfers In | | Transfers Out | |
| Level 1 | | Level 2 | | Level 1 | | Level 2 | |
| $ | 33,231,276 | | | $ | 4,258,800 | | | $ | 4,258,800 | | | $ | 33,231,276 | | |
Financial assets were transferred from Level 2 to Level 1 as they resumed trading during the period and as resale restrictions expired.
Foreign exchange-traded financial assets were transferred from Level 1 to level 2 due to application of a systematic fair valuation model.
See accompanying notes to financial statements.
16
Wanger International 2011 Annual Report
Wanger International
Statement of Investments, December 31, 2011
The following table reconciles asset balances for the year ending December 31, 2011, in which significant unobservable inputs (Level 3) were used in determining value:
Investments
in Securities | | Balance as of
December 31,
2010 | | Realized
Gain/(Loss) | | Change in
Unrealized
Appreciation
(Depreciation) | | Purchases | | Sales | | Transfers
into
Level 3 | | Transfers
out of
Level 3 | | Balance as of
December 31,
2011 | |
| Equities | |
| Asia | | $ | 23,569 | | | $ | (11,020,907 | ) | | $ | 10,997,338 | | | $ | — | | | $ | — | | | $ | — | | | $ | — | | | $ | — | | |
| Latin America | | | 2,649,999 | | | | — | | | | (448,294 | ) | | | — | | | | — | | | | — | | | | — | | | | 2,201,705 | | |
| | | $ | 2,673,568 | | | $ | (11,020,907 | ) | | $ | 10,549,044 | | | $ | — | | | $ | — | | | $ | — | | | $ | — | | | $ | 2,201,705 | | |
The information in the above reconciliation table represents fiscal year to date activity for any securities identified as using Level 3 inputs at either the beginning or the end of the current fiscal period.
The change in unrealized depreciation attributed to securities owned at December 31, 2011, which were valued using significant unobservable inputs (Level 3) amounted to $(448,294).
See accompanying notes to financial statements.
17
Wanger International 2011 Annual Report
Wanger International
Portfolio Diversification December 31, 2011
At December 31, 2011, the Fund's portfolio investments as a percentage of net assets were diversified as follows:
| | | Value | | Percentage of
Net Assets | |
| Industrial Goods & Services | |
| Other Industrial Services | | $ | 55,748,264 | | | | 8.2 | | |
Industrial Materials &
Specialty Chemicals | | | 46,088,110 | | | | 6.8 | | |
| Machinery | | | 45,031,349 | | | | 6.6 | | |
| Electrical Components | | | 13,726,559 | | | | 2.0 | | |
| Conglomerates | | | 10,759,841 | | | | 1.6 | | |
| Construction | | | 10,329,915 | | | | 1.5 | | |
| Outsourcing Services | | | 4,418,513 | | | | 0.6 | | |
| Industrial Distribution | | | 1,964,329 | | | | 0.3 | | |
| | | | 188,066,880 | | | | 27.6 | | |
| Consumer Goods & Services | |
| Retail | | | 36,463,391 | | | | 5.3 | | |
| Casinos & Gaming | | | 19,054,571 | | | �� | 2.8 | | |
| Food & Beverage | | | 17,627,076 | | | | 2.6 | | |
| Nondurables | | | 13,343,119 | | | | 2.0 | | |
| Other Consumer Services | | | 11,956,955 | | | | 1.7 | | |
| Travel | | | 6,862,351 | | | | 1.0 | | |
| Apparel | | | 4,661,880 | | | | 0.7 | | |
| Entertainment | | | 3,943,902 | | | | 0.6 | | |
| Educational Services | | | 3,367,000 | | | | 0.5 | | |
| Restaurants | | | 1,921,504 | | | | 0.3 | | |
| Other Durable Goods | | | 1,852,599 | | | | 0.3 | | |
| Consumer Goods Distribution | | | 83,633 | | | | 0.0 | * | |
| | | | 121,137,981 | | | | 17.8 | | |
| Information | |
| Computer Hardware & Related Equipment | | | 28,468,666 | | | | 4.2 | | |
| Business Software | | | 15,396,575 | | | | 2.3 | | |
| Internet Related | | | 14,444,468 | | | | 2.1 | | |
| Mobile Communications | | | 13,904,003 | | | | 2.0 | | |
| Instrumentation | | | 7,463,447 | | | | 1.1 | | |
| Financial Processors | | | 7,137,670 | | | | 1.1 | | |
| Gaming Equipment & Services | | | 4,929,558 | | | | 0.7 | | |
| CATV | | | 3,289,673 | | | | 0.5 | | |
| Computer Services | | | 3,036,170 | | | | 0.4 | | |
| Electronics Distribution | | | 2,332,882 | | | | 0.3 | | |
| Semiconductors & Related Equipment | | | 2,030,732 | | | | 0.3 | | |
| Telephone & Data Services | | | 1,494,483 | | | | 0.2 | | |
| Advertising | | | 631,933 | | | | 0.1 | | |
| | | | 104,560,260 | | | | 15.3 | | |
* Rounds to less than 0.1%.
| | | Value | | Percentage of
Net Assets | |
| Energy & Minerals | |
| Mining | | $ | 34,343,433 | | | | 5.0 | | |
| Oil Services | | | 26,557,163 | | | | 3.9 | | |
| Oil & Gas Producers | | | 17,125,727 | | | | 2.5 | | |
| Agricultural Commodities | | | 7,352,316 | | | | 1.1 | | |
| Oil, Refining, Marketing & Distribution | | | 4,414,822 | | | | 0.6 | | |
| | | | 89,793,461 | | | | 13.1 | | |
| Other Industries | |
| Real Estate | | | 42,211,190 | | | | 6.2 | | |
| Transportation | | | 15,322,063 | | | | 2.3 | | |
| Regulated Utilities | | | 8,357,761 | | | | 1.2 | | |
| | | | 65,891,014 | | | | 9.7 | | |
| Finance | |
| Brokerage & Money Management | | | 15,703,866 | | | | 2.3 | | |
| Insurance | | | 14,981,556 | | | | 2.2 | | |
| Banks | | | 12,768,595 | | | | 1.9 | | |
| Finance Companies | | | 9,948,543 | | | | 1.4 | | |
| | | | 53,402,560 | | | | 7.8 | | |
| Health Care | |
| Medical Equipment & Devices | | | 15,093,311 | | | | 2.2 | | |
| Pharmaceuticals | | | 11,017,020 | | | | 1.6 | | |
| Medical Supplies | | | 5,234,238 | | | | 0.8 | | |
| Biotechnology & Drug Delivery | | | 4,503,780 | | | | 0.7 | | |
| Health Care Services | | | 3,774,228 | | | | 0.5 | | |
| | | | 39,622,577 | | | | 5.8 | | |
| Total Equities: | | | 662,474,733 | | | | 97.1 | | |
| Securities Lending Collateral | | | 18,597,914 | | | | 2.7 | | |
| Total Investments: | | | 681,072,647 | | | | 99.8 | | |
Obligation to Return Collateral for
Securities Loaned | | | (18,597,914 | ) | | | (2.7 | ) | |
Cash and Other Assets
Less Liabilities: | | | 19,742,517 | | | | 2.9 | | |
| Net Assets: | | $ | 682,217,250 | | | | 100.0 | % | |
See accompanying notes to financial statements.
18
Wanger International 2011 Annual Report
Statement of Assets and Liabilities
December 31, 2011
| Assets: | |
| Unaffiliated investments, at cost | | $ | 539,520,334 | | |
| Affiliated investments, at cost (See Note 4) | | | 9,152,033 | | |
Unaffiliated investments, at value (including
securities on loan of $18,143,573) | | $ | 676,630,582 | | |
| Affiliated investments, at value (See Note 4) | | | 4,442,065 | | |
| Cash | | | 17,768,399 | | |
| Foreign currency (cost of $707,355) | | | 707,666 | | |
Unrealized appreciation on forward foreign
currency exchange contracts | | | 447,630 | | |
| Receivable for: | |
| Investments sold | | | 840,186 | | |
| Fund shares sold | | | 118,491 | | |
| Securities lending income | | | 22,867 | | |
| Dividends | | | 759,184 | | |
| Foreign tax reclaims | | | 252,283 | | |
| Trustees' deferred compensation plan | | | 108,747 | | |
| Prepaid expenses | | | 11,015 | | |
| Total Assets | | | 702,109,115 | | |
| Liabilities: | |
| Collateral on securities loaned | | | 18,597,914 | | |
| Payable for: | |
| Investments purchased | | | 235,507 | | |
| Fund shares repurchased | | | 227,994 | | |
| Investment advisory fee | | | 15,290 | | |
| Administration fee | | | 930 | | |
| Transfer agent fee | | | 1 | | |
| Trustees' fees | | | 3,836 | | |
| Custody fee | | | 113,249 | | |
| Reports to shareholders | | | 70,357 | | |
| Chief compliance officer expenses | | | 2,297 | | |
| Deferred foreign capital gains tax | | | 299,433 | | |
| Trustees' deferred compensation plan | | | 108,747 | | |
| Other liabilities | | | 216,310 | | |
| Total Liabilities | | | 19,891,865 | | |
| Net Assets | | $ | 682,217,250 | | |
| Composition of Net Assets: | |
| Paid-in capital | | $ | 505,994,878 | | |
| Overdistributed net investment income | | | (15,989,096 | ) | |
| Accumulated net realized gain | | | 59,683,885 | | |
| Net unrealized appreciation (depreciation) on: | |
| Unaffiliated investments | | | 137,110,248 | | |
| Affiliated investments | | | (4,709,968 | ) | |
| Forward foreign currency exchange contracts | | | 447,630 | | |
| Foreign currency translations | | | (20,894 | ) | |
| Foreign capital gains tax | | | (299,433 | ) | |
| Net Assets | | $ | 682,217,250 | | |
| Fund Shares Outstanding | | | 23,695,974 | | |
Net asset value, offering price and redemption
price per share | | $ | 28.79 | | |
Statement of Operations
For the Year Ended December 31, 2011
| Investment Income: | |
| Dividends (net foreign taxes withheld of $1,777,869) | | $ | 18,345,149 | | |
| Dividends from affiliates | | | 277,570 | | |
| Interest income | | | 1,346 | | |
| Securities lending income, net | | | 118,270 | | |
| Total Investment Income | | | 18,742,335 | | |
| Expenses: | |
| Investment advisory fee | | | 7,407,698 | | |
| Administration fee | | | 416,586 | | |
| Transfer agent fee | | | 492 | | |
| Trustees' fees | | | 55,548 | | |
| Custody fee | | | 607,723 | | |
| Reports to shareholders | | | 160,981 | | |
| Professional fees | | | 109,440 | | |
| Chief compliance officer expenses (See Note 4) | | | 33,121 | | |
| Other expenses (See Note 5) | | | 45,365 | | |
| Total Expenses | | | 8,836,954 | | |
| Advisory fee waiver (See Note 4) | | | (524,406 | ) | |
| Custody earnings credit | | | (6 | ) | |
| Net Expenses | | | 8,312,542 | | |
| Net Investment Income | | | 10,429,793 | | |
Net Realized and Unrealized Gain (Loss)
on Investments: | |
| Net realized gain (loss) on: | |
| Unaffiliated investments | | | 72,735,230 | | |
| Foreign currency transactions | | | (826,730 | ) | |
| Forward foreign currency exchange contracts | | | 895,678 | | |
| Increase from payment by affiliate (Note 4) | | | 23,741 | | |
| Net realized gain | | | 72,827,919 | | |
Net change in unrealized appreciation
(depreciation) on: | |
| Unaffiliated investments | | | (201,356,235 | ) | |
| Affiliated investments (See Note 4) | | | (1,398,710 | ) | |
| Foreign currency translations | | | (240,164 | ) | |
| Forward foreign currency exchange contracts | | | (1,163,361 | ) | |
| Foreign capital gains tax | | | (248,488 | ) | |
| Net change in unrealized depreciation | | | (204,406,958 | ) | |
| Net Loss | | | (131,579,039 | ) | |
| Net Decrease in Net Assets from Operations | | $ | (121,149,246 | ) | |
See accompanying notes to financial statements.
19
Wanger International 2011 Annual Report
Statement of Changes in Net Assets
| | | Year Ended December 31, | |
| Increase (Decrease) in Net Assets | | 2011 | | 2010 | |
| Operations: | |
| Net investment income (loss) | | $ | 10,429,793 | | | $ | 12,003,320 | | |
| Net realized gain (loss) on: | |
| Unaffiliated investments | | | 72,735,230 | | | | 193,180,518 | | |
| Affiliated investments | | | — | | | | (3,212,313 | ) | |
| Foreign currency transactions | | | (826,730 | ) | | | (1,167,859 | ) | |
| Forward foreign currency exchange contracts | | | 895,678 | | | | 11,548,114 | | |
| Reimbursement from transaction costs | | | — | | | | 335,670 | | |
| Increase from payment by affiliate (Note 4) | | | 23,741 | | | | — | | |
| Net change in unrealized appreciation (depreciation) on: | |
| Unaffiliated investments | | | (201,356,235 | ) | | | (51,331,757 | ) | |
| Affiliated investments (See Note 4) | | | (1,398,710 | ) | | | 1,311,053 | | |
| Foreign currency translations | | | (240,164 | ) | | | 190,579 | | |
| Forward foreign currency exchange contracts | | | (1,163,361 | ) | | | 770,735 | | |
| Foreign capital gains tax | | | (248,488 | ) | | | 1,892,799 | | |
| Net Increase (Decrease) in Net Assets from Operations | | | (121,149,246 | ) | | | 165,520,859 | | |
| Distributions to Shareholders: | |
| From net investment income | | | (39,660,297 | ) | | | (20,131,055 | ) | |
| From net realized gains | | | (20,366,967 | ) | | | — | | |
| Total Distributions to Shareholders | | | (60,027,264 | ) | | | (20,131,055 | ) | |
| Share Transactions: | |
| Subscriptions | | | 42,767,097 | | | | 68,202,656 | | |
| Distributions reinvested | | | 60,027,264 | | | | 20,131,055 | | |
| Redemptions | | | (165,161,101 | ) | | | (750,391,189 | ) | |
| Net Decrease from Share Transactions | | | (62,366,740 | ) | | | (662,057,478 | ) | |
| Total Decrease in Net Assets | | | (243,543,250 | ) | | | (516,667,674 | ) | |
| Net Assets: | |
| Beginning of period | | | 925,760,500 | | | | 1,442,428,174 | | |
| End of period | | $ | 682,217,250 | | | $ | 925,760,500 | | |
| Undistributed/(overdistributed) net investment income at end of period | | $ | (15,989,096 | ) | | $ | 4,477,110 | | |
See accompanying notes to financial statements.
20
Wanger International 2011 Annual Report
Financial Highlights
| | | Year Ended December 31, | |
| Selected data for a share outstanding throughout each period | | 2011 | | 2010 | | 2009 | | 2008 | | 2007 | |
| Net Asset Value, Beginning of Period | | $ | 36.16 | | | $ | 29.68 | | | $ | 20.69 | | | $ | 44.04 | | | $ | 41.77 | | |
| Income from Investment Operations: | |
| Net investment income (a) | | | 0.42 | | | | 0.35 | | | | 0.30 | | | | 0.52 | | | | 0.37 | | |
Net realized and unrealized gain (loss) on investments and
foreign currency and foreign capital gains tax | | | (5.31 | ) | | | 6.93 | | | | 9.61 | | | | (18.37 | ) | | | 5.80 | | |
| Increase from payments by affiliate | | | 0.00 | (b) | | | — | | | | — | | | | — | | | | — | | |
| Total from Investment Operations | | | (4.89 | ) | | | 7.28 | | | | 9.91 | | | | (17.85 | ) | | | 6.17 | | |
| Less Distributions to Shareholders: | |
| From net investment income | | | (1.64 | ) | | | (0.80 | ) | | | (0.93 | ) | | | (0.34 | ) | | | (0.39 | ) | |
| From net realized gains | | | (0.84 | ) | | | — | | | | — | | | | (5.16 | ) | | | (3.51 | ) | |
| Total Distributions to Shareholders | | | (2.48 | ) | | | (0.80 | ) | | | (0.93 | ) | | | (5.50 | ) | | | (3.90 | ) | |
| Increase from Regulatory Settlements | | | — | | | | — | | | | 0.01 | | | | — | | | | — | | |
| Net Asset Value, End of Period | | $ | 28.79 | | | $ | 36.16 | | | $ | 29.68 | | | $ | 20.69 | | | $ | 44.04 | | |
| Total Return (c) | | | (14.62 | )%(d) | | | 24.92 | %(d) | | | 49.78 | % | | | (45.60 | )% | | | 16.31 | % | |
| Ratios to Average Net Assets/Supplemental Data: | |
| Net expenses (e) | | | 1.00 | % | | | 1.04 | % | | | 1.05 | % | | | 1.02 | % | | | 0.99 | % | |
| Net investment income (e) | | | 1.25 | % | | | 1.12 | % | | | 1.23 | % | | | 1.67 | % | | | 0.87 | % | |
| Waiver/Reimbursement | | | 0.06 | % | | | 0.03 | % | | | — | | | | — | | | | — | | |
| Portfolio turnover rate | | | 36 | % | | | 32 | % | | | 37 | % | | | 36 | % | | | 35 | % | |
| Net assets, end of period (000s) | | $ | 682,217 | | | $ | 925,761 | | | $ | 1,442,428 | | | $ | 972,860 | | | $ | 1,693,374 | | |
(a) Net investment income per share was based upon the average shares outstanding during the period.
(b) Rounds to less than $0.01 per share.
(c) Total return at net asset value assuming all distributions reinvested.
(d) Had the investment adviser and/or its affiliates not waived a portion of expenses, total return would have been reduced.
(e) The benefits derived from custody fees paid indirectly had an impact of less than 0.01%.
See accompanying notes to financial statements.
21
Wanger International 2011 Annual Report
Notes to Financial Statements
1. Nature of Operations
Wanger International (the Fund), is a series of Wanger Advisors Trust (the Trust), an open-end management investment company organized as a Massachusetts business trust. The investment objective of the Fund is to seek long-term capital appreciation. The Fund is available only for allocation to certain life insurance company separate accounts established for the purpose of funding qualified and nonqualified variable annuity contracts and variable life insurance policies and may also be offered directly to certain types of pension plans and retirement arrangements.
2. Significant Accounting Policies
The preparation of financial statements in accordance with accounting principles generally accepted in the United States of America (GAAP) requires management to make certain estimates and assumptions that affect the reported amounts of assets and liabilities, the disclosure of contingent assets and liabilities at the date of the financial statements and the reported amounts of revenue and expenses during the reporting period. Actual results could differ from those estimates.
Security valuation
Securities of the Fund are valued at market value or, if a market quotation for a security is not readily available or is deemed not to be reliable because of events or circumstances that have occurred between the market quotation and the time as of which the security is to be valued, the security is valued at its fair value determined in good faith under consistently applied procedures established by the Board of Trustees. A security traded on a securities exchange or in an over-the-counter market in which transaction prices are reported is valued at the last sales price at the time of valuation. A security traded principally on NASDAQ is valued at the NASDAQ official closing price. Mutual Funds and Exchange Traded Funds are valued at their closing net asset value as reported to NASDAQ. A security for which there is no reported sale on the valuation date is valued at the latest bid quotation.
Short-term investments maturing in 60 days or less are valued at amortized cost, which approximates market value.
Forward foreign currency exchange contracts are marked-to-market based upon foreign currency exchange rates provided by a pricing service.
A security for which a market quotation is not readily available and any other assets are valued at their fair value determined in good faith under consistently applied procedures established by the Board of Trustees. The Trust has retained an independent statistical fair value pricing service that employs a systematic methodology to assist in the fair valuation process for securities principally traded in a foreign market in order to adjust for possible changes in value that may occur between the close of the foreign market and the time as of which the securities are to be valued. If a security is valued at a fair value, that value may be different from the last quoted market price for the security. A security for which there is no reported sale on the valuation date is valued at the latest bid quotations.
Foreign currency translations
Values of investments denominated in foreign currencies are converted into U.S. dollars using the New York spot market rate of exchange at the time of valuation. Purchases and sales of investments and dividend and interest income are translated into U.S. dollars using the spot market rate of exchange prevailing on the respective dates of such transactions. The gain or loss resulting from changes in foreign exchange rates is included with net realized and unrealized gain or loss from investments, as appropriate.
Repurchase agreements
The Fund may engage in repurchase agreement transactions. The Fund, through its custodian, receives delivery of underlying securities collateralizing each repurchase agreement. The counterparty is required to maintain collateral that is at all times at least equal to the repurchase price including interest. In the event of default or bankruptcy by the other party to the agreement, realization and/or retention of the collateral may be subject to legal proceedings.
Restricted securities
Restricted securities are securities that may only be resold upon registration under federal securities laws or in transactions exempt from registration. In some cases, the issuer of restricted securities has agreed to register such securities for resale at the issuer's expense either upon demand by the Fund or in connection with another registered offering of the securities. Many restricted securities may be resold in the secondary market in transactions exempt from registration. Such restricted securities may be determined to be liquid under criteria established by the Board of Trustees.
Derivative Instruments
The Fund invests in certain derivative instruments as detailed below to meet its investment objectives. Derivatives are instruments whose values depend on, or are derived from, in whole or in part, the value of one or more other assets, such as securities, currencies, commodities or indices. Derivative instruments may be used to maintain cash reserves while maintaining exposure to certain other assets, to offset anticipated declines in values of investments, to facilitate trading, to reduce transaction costs and to pursue higher investment returns. The Fund may also use derivative instruments to mitigate certain investment risks, such as foreign currency exchange rate risk, interest rate risk and credit risk. Derivatives may involve various risks, including the potential inability of the counterparty to fulfill its obligation under the terms of the contract, the potential for an illiquid secondary market and the potential for market movements, which may expose the Fund to gains or losses in excess of the amount shown in the Statement of Assets and Liabilities.
Forward Foreign Currency Exchange Contracts
Forward foreign currency exchange contracts are agreements between two parties to buy and sell a currency at a set price on a future date. The Fund utilized forward foreign currency exchange contracts to shift investment exposure from one currency to another or to recover an underweight country exposure in its portfolio.
The values of forward foreign currency exchange contracts fluctuate with changes in foreign currency exchange rates. The Fund will record a realized gain or loss when the forward foreign currency exchange contract is closed.
The use of forward foreign currency exchange contracts does not eliminate fluctuations in the prices of the Fund's portfolio securities. The risks of forward foreign currency exchange contracts include movement in the values of the foreign currencies relative to the U.S. dollar (or other foreign currencies) and the possibility that counterparties will not complete their contractual obligations, which may be in excess of the amount reflected, if any, in the Statement of Assets and Liabilities.
Effects of Derivative Transactions in the Financial Statements
The following tables are intended to provide additional information about the effect of derivatives on the financial statements of the Fund including: the fair value of derivatives by risk category and the location of those fair values in the Statement of Assets and Liabilities; the impact of derivative transactions on the Fund's operations over the period including realized gains or losses and unrealized gains or losses. The derivative schedules following the Portfolio of Investments present additional information regarding derivative instruments outstanding at the end of the period, if any.
During the year ended December 31, 2011, the Fund entered into 97 forward foreign currency exchange contracts.
The following table is a summary of the value of the Fund's derivative Instruments as of December 31, 2011.
Fair Value of Derivative Instruments
| Asset | | Liability | |
Statement of Assets
and Liabilities | | Fair
Value | | Statement of Assets
and Liabilities | | Fair
Value | |
Unrealized appreciation
on forward foreign
currency exchange
contracts | | $ | 447,630 | | | Unrealized depreciation
on forward foreign
currency exchange
contracts | | $ | — | | |
22
Wanger International 2011 Annual Report
Notes to Financial Statements, continued
The effect of derivative instruments on the Fund's Statement of Operations for the year ended December 31, 2011 was as follows:
Amount of Realized Gain or (Loss) and Change in Unrealized Appreciation or (Depreciation) on Derivatives Recognized in Income
| | | Risk
Exposure | | Realized
Gain (Loss) | | Change in
Unrealized
Appreciation
(Depreciation) | |
Forward Foreign Currency
Exchange Contracts | | Foreign
Exchange
Rate Risk | | $ | 895,678
| | | $ | (1,163,361
| ) | |
Security transactions and investment income
Security transactions are accounted for on the trade date (date the order to buy or sell is executed) and dividend income is recorded on the ex-dividend date, except that certain dividends from foreign securities are recorded as soon as the information is available to the Fund. Interest income is recorded on the accrual basis and includes amortization of discounts on debt obligations when required for federal income tax purposes. Realized gains and losses from security transactions are recorded on an identified cost basis.
Awards, if any, from class action litigation related to securities owned may be recorded as a reduction of cost of those securities. If the applicable securities are no longer owned, the proceeds are recorded as realized gains.
Expenses
General expenses of the Trust are allocated to the Fund and the other series of the Trust based upon relative net assets or other expense allocation methodologies determined by the nature of the expense. Expenses directly attributable to the Fund are charged to the Fund.
Fund share valuation
Fund shares are sold and redeemed on a continuing basis at net asset value. Net asset value per share is determined daily as of the close of trading on the New York Stock Exchange (the Exchange) on each day the Exchange is open for trading by dividing the total value of the Fund's investments and other assets, less liabilities, by the number of Fund shares outstanding.
Securities lending
The Fund may lend securities up to one-third of the value of its total assets to certain approved brokers, dealers and other financial institutions to earn additional income. The Fund retains the benefits of owning the securities, including receipt of dividends or interest generated by the security. The Fund also receives a fee for the loan. The Fund has the ability to recall the loans at any time and could do so in order to vote proxies or to sell the loaned securities. Each loan is collateralized by cash that exceeded the value of the securities on loan. The market value of the loaned securities is determined daily at the close of business of the Fund and any additional required collateral is delivered to each Fund on the next business day. The Fund has elected to invest the cash collateral in the Dreyfus Government Cash Management Fund, and the income earned is paid to the Fund, net of any fees remitted to Goldman Sachs Agency Lending, the Fund's lending agent, and borrower rebates. The Fund's adviser, Columbia Wanger Asset Management, LLC (CWAM), does not retain any fees earned by the lending program. Generally, in the event of borrower default, the Fund has the right to use the collateral to offset any losses incurred. In the event the Fund is delayed or prevented from exercising its right to dispose of the collateral, there may be a potential loss to the Fund. Some of these losses may be indemnified by the lending agent. The Fund bears the risk of loss with respect to the investment of collateral.
The net lending income earned by the Fund as of December 31, 2011, is included in the Statement of Operations.
Custody fees/Credits
Custody fees are reduced based on the Fund's cash balances maintained with the custodian. The amount is disclosed as a reduction of total expenses in the Statement of Operations.
Federal income taxes
The Fund has complied with the provisions of the Internal Revenue Code available to regulated investment companies and, in the manner provided therein, distributes substantially all its taxable income, as well as any net realized gain on sales of investments and foreign currency transactions reportable for federal income tax purposes. Accordingly, the Fund paid no federal income taxes and no federal income tax provision was required.
Foreign capital gains taxes
Gains in certain countries may be subject to foreign taxes at the fund level. The Fund accrues for such foreign taxes on net realized and unrealized gains at the appropriate rate for each jurisdiction.
Distributions to shareholders
Distributions to shareholders are recorded on the ex-dividend date.
Indemnification
In the normal course of business, the Trust on behalf of the Fund enters into contracts that contain a variety of representations and warranties and that provide general indemnities. The Fund's maximum exposure under these arrangements is unknown, as this would involve future claims against the Fund. Also under the Trust's organizational documents, the trustees and officers of the Trust are indemnified against certain liabilities that may arise out of their duties to the Trust. However based on experience, the Fund expects the risk of loss due to these warranties and indemnities to be remote.
Recent Accounting Pronouncement
Fair Value Measurements and Disclosures
In May 2011, the Financial Accounting and Standards Board issued ASU No. 2011-04 modifying Topic 820, Fair Value Measurements and Disclosures. At the same time, the International Accounting Standards Board issued International Financial Reporting Standard 13, Fair Value Measurement. The objective of the FASB and IASB is convergence of their guidance on fair value measurements and disclosures.
Specifically, ASU No. 2011-04 requires reporting entities to disclose i) the amounts of any transfers between Level 1 and Level 2, and the reasons for the transfers, ii) for Level 3 fair value measurements, a) quantitative information about significant unobservable inputs used, b) a description of the valuation processes used by the reporting entity and c) a narrative description of the sensitivity of the fair value measurement to changes in unobservable inputs if a change in those inputs might result in a significantly higher or lower fair value measurement. The effective date of ASU No. 2011-04 is for interim and annual periods beginning after December 15, 2011. At this time, management is evaluating the implications of this guidance and the impact it will have on the financial statement amounts and footnote disclosures, if any.
3. Federal Tax Information
The timing and character of income and capital gain distributions are determined in accordance with income tax regulations, which may differ from GAAP. Reclassifications are made to the Fund's capital accounts for permanent tax differences to reflect income and gains available for distribution (or available capital loss carryforwards) under income tax regulations.
For the year ended December 31, 2011, permanent book and tax basis differences resulting primarily from passive foreign investment company (PFIC)
23
Wanger International 2011 Annual Report
Notes to Financial Statements, continued
holdings, former PFIC holdings, and foreign currency transactions were identified and reclassified among the components of the Fund's net assets as follows:
Accumulated
Net Investment
Income | | Accumulated
Net Realized
Gain (Loss) | | Paid-In Capital | |
| $ | 8,764,298 | | | $ | (8,764,298 | ) | | $ | — | | |
Net investment income and net realized gains (losses), as disclosed on the Statement of Operations, and net assets were not affected by this reclassification.
The tax character of distributions paid during the years ended December 31, 2011 and December 31, 2010 were as follows:
| | | December 31, 2011 | | December 31, 2010 | |
| Ordinary Income * | | $ | 40,414,180 | | | $ | 20,131,055 | | |
| Long-Term Capital Gains | | | 19,613,084 | | | | — | | |
* For tax purposes short-term capital gain distributions, if any, are considered ordinary income distributions.
As of December 31, 2011, the components of distributable earnings on a tax basis were as follows:
Undistributed
Ordinary Income | | Undistributed
Long-Term
Capital Gains | | Net Unrealized
Appreciation
(Depreciation) * | |
| $ | 1,305,634 | | | $ | 64,975,106 | | | $ | 110,638,317 | | |
* The differences between book-basis and tax-basis net unrealized appreciation/depreciation are primarily due to deferral of losses from wash sales and passive foreign investment company (PFIC) adjustments.
On December 22, 2010, the Regulated Investment Company Modernization Act of 2010 (the Act) was enacted, which changed various technical rules governing the tax treatment of regulated investment companies. The changes are generally effective for taxable years beginning after the date of enactment. Under the Act, the Fund will be permitted to carry forward capital losses incurred in taxable years beginning after the date of enactment for an unlimited period. However, any losses incurred during those future taxable years will be required to be utilized prior to the losses incurred in pre-enactment taxable years, which carry an expiration date. As a result of this ordering rule, pre-enactment capital loss carryforwards may be more likely to expire unused.
Under current tax rules, regulated investment companies can elect to treat certain late-year ordinary losses incurred and post-October capital losses (capital losses realized after October 31) as arising on the first day of the following taxable year. As of December 31, 2011, the Fund will elect to treat late-year ordinary losses of $269,200 as arising on January 1, 2012.
Management is required to determine whether a tax position of the Fund is more likely than not to be sustained upon examination by the applicable taxing authority, including resolution of any related appeals or litigation processes, based on the technical merits of the position. The tax benefit to be recognized by the Fund is measured as the largest amount of benefit that is greater than fifty percent likely of being realized upon ultimate settlement. Management is not aware of any tax positions for which it is reasonably possible that the total amounts of unrecognized tax benefits will significantly change in the next twelve months. However, management's conclusions may be subject to review and adjustment at a later date based on factors including, but not limited to, new tax laws, regulations, and administrative interpretations (including relevant court decisions). The Fund's federal tax returns for the prior three fiscal years remain subject to examination by the Internal Revenue Service.
4. Transactions With Affiliates
CWAM is a wholly owned subsidiary of Columbia Management Investment Advisers, LLC (Columbia Management), which in turn is a wholly owned subsidiary of Ameriprise Financial, Inc. (Ameriprise Financial). CWAM furnishes continuing investment supervision to the Fund and is responsible for the overall management of the Fund's business affairs.
CWAM receives a monthly advisory fee based on the Fund's average daily net assets at the following annual rates:
| Average Daily Net Assets | | Annual Fee Rate | |
| Up to $100 million | | | 1.10 | % | |
| $100 million to $250 million | | | 0.95 | % | |
| $250 million to $500 million | | | 0.90 | % | |
| $500 million to $1 billion | | | 0.80 | % | |
| $1 billion and over | | | 0.72 | % | |
For the year ended December 31, 2011, the effective investment advisory fee rate, net of fee waivers, was 0.83% of the Fund's average daily net assets.
CWAM has contractually agreed to reimburse the Fund to the extent that investment advisory fees exceed an annual percentage of 0.83% of average daily net assets on an annualized basis, through April 30, 2012. The reimbursement to the Fund for the year ended December 31, 2011 was $524,406.
CWAM provides administrative services and receives an administration fee from the Fund at the following annual rates:
Wanger Advisors Trust Aggregate
Average Daily Net Assets of the Trust | | Annual Fee Rate | |
| Up $4 billion to | | | 0.05 | % | |
| $4 billion to $6 billion | | | 0.04 | % | |
| $6 billion to $8 billion | | | 0.03 | % | |
| $8 billion and over | | | 0.02 | % | |
For the year ended December 31, 2011, the effective administration fee rate was 0.05% of the Fund's average daily net assets. Columbia Management provides certain sub-administrative services to the Fund.
Columbia Management Investment Distributors, Inc. (CMID), a wholly owned subsidiary of Ameriprise Financial, serves as the Fund's distributor and principal underwriter.
Columbia Management Investment Services Corp. (CMIS), a wholly owned subsidiary of Ameriprise Financial, is the transfer agent of the Funds. For its services, the Fund pays CMIS a monthly fee at the annual rate of $21.00 per open account. CMIS also receives reimbursement from the Fund for certain out-of-pocket expenses.
Certain officers and trustees of the Trust are also officers of CWAM. The Trust makes no direct payments to its officers and trustees who are affiliated with CWAM.
The Board of Trustees has appointed a Chief Compliance Officer of the Trust in accordance with federal securities regulations. The Fund, along with other affiliated funds, pays its pro-rata share of the expenses associated with the Office of the Chief Compliance Officer. These expenses are disclosed separately as "Chief compliance officer expenses" in the Statement of Operations.
The Trust offers a deferred compensation plan for its independent trustees. Under that plan, a trustee may elect to defer all or a portion of his or her compensation. Amounts deferred are retained by the Trust and may represent an unfunded obligation of the Trust. The value of amounts deferred is determined by reference to the change in value of Class Z shares of one or more series of Columbia Acorn Trust or a money market fund as specified by the trustee. Benefits under the deferred compensation plan are payable in accordance with the plan.
An affiliated person of the Fund may include any company in which the Fund owns five percent or more of its outstanding voting shares. On December 31, 2011, the Fund held five percent or more of the outstanding voting securities of one company. Details of investments in those affiliated companies are presented in the Notes to the Statement of Investments on Page 15.
For the year ended December 31, 2011, the Fund engaged in purchase and sales transactions with funds that have a common investment adviser (or affiliated investment advisers), common directors/trustees, and/or common officers. Those
24
Wanger International 2011 Annual Report
Notes to Financial Statements, continued
purchase and sale transactions complied with provisions of Rule 17a-7 under the Investment Company Act of 1940 and were $50,663 and $705,619, respectively.
During the year ended December 31, 2011, Columbia Management reimbursed the Fund $23,741 for a loss on a trading error.
5. Borrowing Arrangements
Effective July 22, 2011, the Trust participates in a $150 million credit facility with JPMorgan Chase Bank, N.A., along with another Trust managed by CWAM, which was entered into to facilitate portfolio liquidity. Under the facility, interest is charged to each participating Fund based on its borrowings at a rate per annum equal to the higher of Federal Funds Rate or Overnight LIBOR plus 1.25%. In addition, a commitment fee of 0.10% per annum of the unutilized line of credit is accrued and apportioned among the participating Funds based on their relative net assets. The commitment fee is included in "Other expenses" in the Statement of Operations. The Trust enters into this line of credit for one year durations.
Prior to July 22, 2011, the Trust participated in a $150 million credit facility with State Street Bank and Trust Company (State Street) under similar lending terms. The commitment fee under the State Street arrangement was 0.125% per annum of the unutilized line of credit.
No amounts were borrowed by the Fund under either facility during the year ended December 31, 2011.
6. Fund Share Transactions
Proceeds and payments on Fund shares as shown in the Statement of Changes in Net Assets are in respect of the following numbers of shares:
| | | Year ended
December 31, 2011 | | Year Ended
December 31, 2010 | |
| Shares sold | | | 1,268,598 | | | | 2,055,268 | | |
Shares issued in reinvestment
of dividend distributions | | | 1,741,626 | | | | 635,576 | | |
| Less shares redeemed | | | (4,915,244 | ) | | | (25,686,043 | ) | |
| Net (decrease) in shares outstanding | | | (1,905,020 | ) | | | (22,995,199 | ) | |
7. Investment Transactions
The aggregate cost of purchases and proceeds from sales other than short-term obligations for the year ended December 31, 2011, were $294,262,281 and $364,846,754, respectively.
8. Shareholder Concentration
At December 31, 2011, one unaffiliated shareholder account owned 20.5% of the outstanding shares of the Fund. The Fund has no knowledge about whether any portion of those shares was owned beneficially. Affiliated shareholder accounts owned 59.3% of the outstanding shares of the Fund. Subscription and redemption activity of these accounts may have a significant effect on the operations of the Fund.
9. Subsequent Events
Management has evaluated the events and transactions that have occurred through the date the financial statements were issued and noted no items requiring adjustment of the financial statements or additional disclosure.
10. Information Regarding Pending and Settled Legal Proceedings
In June 2004, an action captioned John E. Gallus et al. v. American Express Financial Corp. and American Express Financial Advisors Inc. was filed in the United States District Court for the District of Arizona. The plaintiffs allege that they are investors in several American Express Company mutual funds (branded as Columbia) and they purport to bring the action derivatively on behalf of those funds under the Investment Company Act of 1940. The plaintiffs allege that fees allegedly paid to the defendants by the funds for investment advisory and administrative services are excessive. The plaintiffs seek remedies including restitution and rescission of investment advisory and distribution agreements. The plaintiffs voluntarily agreed to transfer this case to the United States District Court for the District of Minnesota (the District Court). In response to defendants' motion to dismiss the complaint, the District Court dismissed one of plaintiffs' four claims and granted plaintiffs limited discovery. Defendants moved for summary judgment in April 2007. Summary judgment was granted in the defendants' favor on July 9, 2007. The plaintiffs filed a notice of appeal with the Eighth Circuit Court of Appeals (the Eighth Circuit) on August 8, 2007. On April 8, 2009, the Eighth Circuit reversed summary judgment and remanded to the District Court for further proceedings. On August 6, 2009, defendants filed a writ of certiorari with the U.S. Supreme Court (the Supreme Court), asking the Supreme Court to stay the District Court proceedings while the Supreme Court considers and rules in a case captioned Jones v. Harris Associates, which involves issues of law similar to those presented in the Gallus case. On March 30, 2010, the Supreme Court issued its ruling in Jones v. Harris Associates, and on April 5, 2010, the Supreme Court vacated the Eighth Circuit's decision in the Gallus case and remanded the case to the Eighth Circuit for further consideration in light of the Supreme Court's decision in Jones v. Harris Associates. On June 4, 2010, the Eighth Circuit remanded the Gallus case to the District Court for further consideration in light of the Supreme Court's decision in Jones v. Harris Associates. On December 9, 2010, the District Court reinstated its July 9, 2007 summary judgment order in favor of the defendants. On January 10, 2011, plaintiffs filed a notice of appeal with the Eighth Circuit. In response to the plaintiffs' opening appellate brief filed on March 18, 2011, the defendants filed a response brief on May 4, 2011 with the Eighth Circuit. The plaintiffs filed a reply brief on May 26, 2011 and oral arguments took place on November 17, 2011.
In December 2005, without admitting or denying the allegations, American Express Financial Corporation (AEFC, which is now known as Ameriprise Financial, Inc. (Ameriprise Financial)), entered into settlement agreements with the Securities and Exchange Commission (SEC) and Minnesota Department of Commerce (MDOC) related to market timing activities. As a result, AEFC was censured and ordered to cease and desist from committing or causing any violations of certain provisions of the Investment Advisers Act of 1940, the Investment Company Act of 1940, and various Minnesota laws. AEFC agreed to pay disgorgement of $10 million and civil money penalties of $7 million. AEFC also agreed to retain an independent distribution consultant to assist in developing a plan for distribution of all disgorgement and civil penalties ordered by the SEC in accordance with various undertakings detailed at www.sec.gov/litigation/admin/ia-2451.pdf. Ameriprise Financial and its affiliates have cooperated with the SEC and the MDOC in these legal proceedings, and have made regular reports to the funds' Boards of Trustees.
Ameriprise Financial and certain of its affiliates have historically been involved in a number of legal, arbitration and regulatory proceedings, including routine litigation, class actions, and governmental actions, concerning matters arising in connection with the conduct of their business activities. Ameriprise Financial believes that the Funds are not currently the subject of, and that neither Ameriprise Financial nor any of its affiliates are the subject of, any pending legal, arbitration or regulatory proceedings that are likely to have a material adverse effect on the Funds or the ability of Ameriprise Financial or its affiliates to perform under their contracts with the Funds. Ameriprise Financial is required to make 10-Q, 10-K and, as necessary, 8-K filings with the Securities and Exchange Commission on legal and regulatory matters that relate to Ameriprise Financial and its affiliates. Copies of these filings may be obtained by accessing the SEC website at www.sec.gov.
There can be no assurance that these matters, or the adverse publicity associated with them, will not result in increased fund redemptions, reduced sale of fund shares or other adverse consequences to the Funds. Further, although we believe proceedings are not likely to have a material adverse effect on the Funds or the ability of Ameriprise Financial or its affiliates to perform under their contracts with the Funds, these proceedings are subject to uncertainties and, as such, we are unable to estimate the possible loss or range of loss that may result. An adverse outcome in one or more of these proceedings could result in adverse judgments, settlements, fines, penalties or other relief that could have a material adverse effect on the consolidated financial condition or results of operations of Ameriprise Financial.
25
Wanger International 2011 Annual Report
Report of Independent Registered Public Accounting Firm
To the Board of Trustees and Shareholders of Wanger International:
In our opinion, the accompanying statement of assets and liabilities, including the statement of investments, and the related statements of operations and of changes in net assets and the financial highlights present fairly, in all material respects, the financial position of Wanger International (a series of the Wanger Advisers Trust, hereinafter referred to as the "Fund") at December 31, 2011, the results of its operations for the year then ended, the changes in its net assets for each of the two years in the period then ended and the financial highlights for each of the five years in the period then ended, in conformity with accounting principles generally accepted in the United States of America. These financial statements and financial highlights (hereafter referred to as "financial statements") are the responsibility of the Fund's management; our responsibility is to express an opinion on these financial statements based on our audits. We conducted our audits of these financial statements in accordance with the standards of the Public Company Accounting Oversight Board (United States). Those standards require that we plan and perform the audit to obtain reasonable assurance about whether the financial statements are free of material misstatement. An audit includes examining, on a test basis, evidence supporting the amounts and disclosures in the financial statements, assessing the accounting principles used and significant estimates made by management, and evaluating the overall financial statement presentation. We believe that our audits, which included confirmation of securities at December 31, 2011 by correspondence with the custodian and brokers, provide a reasonable basis for our opinion.
PricewaterhouseCoopers LLP
Chicago, Illinois
February 17, 2012
26
Wanger International 2011 Annual Report
Federal Income Tax Information (Unaudited)
The Fund hereby designates as a capital gain dividend with respect to the fiscal year ended December 31, 2011, $68,249,445, or, if subsequently determined to be different, the net capital gain of such year.
Foreign taxes paid during the fiscal year ended December 31, 2011, of $1,528,766 are being passed through to shareholders. This represents $0.06 per share. Eligible shareholders may claim this amount as a foreign tax credit.
Gross income derived from sources within foreign countries was $20,063,543 ($0.85 per share) for the fiscal year ended December 31, 2011.
0.73% of the ordinary income distributed by the Fund for the fiscal year ended December 31, 2011, qualifies for the corporate dividends received deduction.
27
Wanger International 2011 Annual Report
Board of Trustees and Management of Wanger Advisors Trust
Each trustee may serve a term of unlimited duration. The Trust's By-laws generally require that a trustee retire at the end of the calendar year in which the trustee attains the age of 75 years. The trustees appoint their own successors, provided that at least two-thirds of the trustees, after such appointment, have been elected by shareholders. Shareholders may remove a trustee, with or without cause, upon the vote of two-thirds of the Trust's outstanding shares at any meeting called for that purpose. A trustee may be removed, with or without cause, upon the vote of a majority of the trustees. The names of the trustees and officers of the Trust, the date each was first elected or appointed to office, their principal business occupations during at least the last five years, number of portfolios in the fund complex they oversee, and other directorships they hold, are shown below. Each trustee serves in such capacity for each of the four series of Wanger Advisors Trust and for each of the eight series of Columbia Acorn Trust.
The address for the trustees and officers of the Trust is Columbia Wanger Asset Management, LLC, 227 West Monroe Street, Suite 3000, Chicago, Illinois 60606. The Funds' Statement of Additional Information includes additional information about the Funds' trustees and officers. You may obtain a free copy of the Statement of Additional Information by writing or calling toll-free:
Columbia Wanger Asset Management, LLC
Shareholder Services Group
227 W. Monroe, Suite 3000
Chicago IL 60606
1-800-922-6769
Name, Position(s) with
Wanger Advisors Trust
and Age at
December 31, 2011 | | Year First
Elected or
Appointed
to Office* | | Principal Occupation(s) during
Past Five Years | | Number of
Portfolios in
Fund Complex
Overseen by
Trustee/Officer | | Other
Directorships
in addition to
Wanger Advisors Trust | |
| Trustees who are not interested persons of Wanger Advisors Trust: | | | | | | | |
|
Laura M. Born, 46,
Trustee and Chair | | | 2007 | | | Adjunct Assistant Professor of Finance, University of Chicago Booth School of Business; formerly, Managing Director – Investment Banking, JP Morgan Chase & Co. (broker/dealer) 2002-2007; prior thereto, associated with JP Morgan as an investment professional since 1991. | | | 12 | | | Columbia Acorn Trust | |
|
Michelle L. Collins, 51,
Trustee | | | 2008 | | | President, Cambium LLC (financial and business advisory firm) since 2007; Advisory Board Member, Svoboda Capital Partners LLC (private equity firm) since 2007; Managing Director Svoboda Capital Partners LLC, 1998-2006. | | | 12 | | | Columbia Acorn Trust; Bucyrus International, Inc. (mining equipment manufacturer); Molex, Inc. (electronics components manufacturer); CDW Corporation (electronics components manufacturer) until October 2007. | |
|
Maureen M. Culhane, 63,
Trustee | | | 2007 | | | Retired. Formerly, Vice President, Goldman Sachs Asset Management, L.P. (investment adviser), 2005-2007, and Vice President (Consultant) — Strategic Relationship Management, Goldman Sachs & Co., 1999-2005. | | | 12 | | | Columbia Acorn Trust | |
|
Margaret M. Eisen, 58,
Trustee | | | 2002 | | | Chief Investment Officer, EAM International LLC (corporate finance and asset management) since 2003; Managing Director, CFA Institute, 2005-2008. | | | 12 | | | Columbia Acorn Trust; Antigenics, Inc. (biotechnology and pharmaceuticals) until June 2009. | |
|
John C. Heaton, 52,
Trustee | | | 2010 | | | Joseph L. Gidwitz Professor of Finance, University of Chicago Booth School of Business; James H. Lorie Professor of Finance, University of Chicago Booth School of Business, July 2000 – July 2006; financial consultant since 2004. | | | | Columbia Acorn Trust | |
|
Steven N. Kaplan, 52,
Trustee and Vice Chair | | | 1999 | | | Neubauer Family Professor of Entrepreneurship and Finance, University of Chicago Booth School of Business; faculty member of the University of Chicago Booth School of Business since 1998. | | | 12 | | | Columbia Acorn Trust; Accretive Health, Inc. (healthcare management services provider); Morningstar, Inc. (provider of independent investment research). | |
|
Allan B. Muchin, 75,
Trustee (1) | | | 1998 | | | Chairman Emeritus, Katten Muchin Rosenman LLP (law firm). | | | 12 | | | Columbia Acorn Trust | |
|
28
Wanger International 2011 Annual Report
Board of Trustees and Management of Wanger Advisors Trust
Name, Position(s) with
Wanger Advisors Trust
and Age at
December 31, 2011 | | Year First
Elected or
Appointed
to Office* | | Principal Occupation(s) during
Past Five Years | | Number of
Portfolios in
Fund Complex
Overseen by
Trustee/Officer | | Other
Directorships
in addition to
Wanger Advisors Trust | |
| Trustees who are not interested persons of Wanger Advisors Trust: (continued) | | | | | | | |
|
David J. Rudis, 58,
Trustee (2) | | | 2010 | | | National Checking and Debit Executive, and Illinois President, Bank of America, 2007 – 2009; President, Consumer Banking Group, LaSalle National Bank, 2004 – 2007. | | | 12 | | | Columbia Acorn Trust | |
|
David B. Small, 55,
Trustee | | | 2010 | | | Managing Director, Grosvenor Capital Management, L.P. (investment adviser) since 1994; Adjunct Associate Professor of Finance, University of Chicago Booth School of Business. | | | 12 | | | Columbia Acorn Trust | |
|
| Trustees who are interested persons of Wanger Advisors Trust: | | | | | | | |
|
Charles P. McQuaid, 58,
Trustee and President (3) | | | 1992 | | | President and Chief Investment Officer, CWAM or its predecessors, since October 2003; associated with CWAM or its predecessors as an investment professional since 1978. | | | 12 | | | Columbia Acorn Trust | |
|
| Trustee Emeritus | | | | | | | |
|
Ralph Wanger, 77,
Trustee Emeritus (4) | | | 1970 | | | Founder, CWAM. Formerly, President, Chief Investment Officer and portfolio manager, CWAM or its predecessors, July 1992 – September 2003; Director, Wanger Investment Company PLC; Consultant to CWAM or its predecessors, September 2003 – September 2005. | | | 12 | | | Columbia Acorn Trust | |
|
| Officers of Wanger Advisors Trust: | | | | | | | |
|
Ben Andrews, 45,
Vice President | | | 2004 | | | Portfolio manager and analyst, CWAM or its predecessors, since 1998; Vice President, Columbia Acorn Trust and Wanger Advisors Trust since 2004. | | | 12 | | | None | |
|
Robert A. Chalupnik, 45,
Vice President | | | 2011 | | | Portfolio manager and analyst, CWAM or its predecessors since 1998. Vice President Columbia Acorn Trust and Wanger Advisors Trust since May 2011. | | | 12 | | | None | |
|
Michael G. Clarke, 42,
Assistant Treasurer | | | 2004 | | | Vice President, Columbia Management Investment Advisers, LLC since May 2010; Managing Director of Fund Administration, Columbia Management Advisors, LLC, from September 2004 to April 2010; senior officer of Columbia Funds and affiliated funds since 2002. | | | 12 | | | None | |
|
Joseph F. DiMaria, 44,
Assistant Treasurer | | | 2010 | | | Vice President, Mutual Fund Administration, Columbia Management Investment Advisers, LLC, since May 2010; Director of Fund Administration, Columbia Management Advisors, LLC from January 2006 to April 2010; Head of Tax/Compliance and Assistant Treasurer, Columbia Management Advisors, LLC, from November 2004 to December 2005. | | | 12 | | | None | |
|
P. Zachary Egan, 43,
Vice President | | | 2003 | | | Director of International Research, CWAM or its predecessors since December 2004; Vice President, Columbia Acorn Trust since 2003 and Wanger Advisors Trust since 2007; portfolio manager and analyst, CWAM or its predecessors, since 1999. | | | 12 | | | None | |
|
Fritz Kaegi, 40,
Vice President | | | 2011 | | | Portfolio manager and analyst, CWAM or its predecessors since 2004. Vice President Columbia Acorn Trust and Wanger Advisors Trust since September 2011. | | | 12 | | | None | |
|
John Kunka, 41,
Assistant Treasurer | | | 2006 | | | Director of Accounting and Operations, CWAM since May 2006; Manager of Mutual Fund Operations, Calamos Advisors, Inc. (investment adviser), September 2005 – May 2006; prior thereto, Manager of Mutual Fund Administration, Van Kampen Investments. | | | 12 | | | None | |
|
Stephen Kusmierczak, 44,
Vice President | | | 2011 | | | Portfolio manager and analyst, CWAM or its predecessors since 2001. Vice President Columbia Acorn Trust and Wanger Advisors Trust since September 2011. | | | 12 | | | None | |
|
29
Wanger International 2011 Annual Report
Board of Trustees and Management of Wanger Advisors Trust
Name, Position(s) with
Wanger Advisors Trust
and Age at
December 31, 2011 | | Year First
Elected or
Appointed
to Office* | | Principal Occupation(s) during
Past Five Years | | Number of
Portfolios in
Fund Complex
Overseen by
Trustee/Officer | | Other
Directorships
in addition to
Wanger Advisors Trust | |
| Officers of Columbia Acorn Trust: (continued) | | | | | | | |
|
Joseph C. LaPalm, 42,
Vice President | | | 2006 | | | Chief Compliance Officer, CWAM since 2005; prior thereto, compliance officer, William Blair & Company (investment firm). | | | 12 | | | None | |
|
Bruce H. Lauer, 54,
Vice President, Secretary and Treasurer | | | 1995 | | | Chief Operating Officer, CWAM or its predecessors since April 2000; Vice President, Secretary and Treasurer, Columbia Acorn Trust and Wanger Advisors Trust since 1995; Director, Wanger Investment Company PLC; formerly, Director, Banc of America Capital Management (Ireland) Ltd.; and formerly, Director, Bank of America Global Liquidity Funds, PLC. | | | 12 | | | None | |
|
Louis J. Mendes III, 47,
Vice President | | | 2003 | | | Portfolio manager and analyst, CWAM or its predecessors since 2001; Vice President, Columbia Acorn Trust since 2003 and Wanger Advisors Trust since 2005. | | | 12 | | | None | |
|
Robert A. Mohn, 50,
Vice President | | | 1997 | | | Director of Domestic Research, CWAM or its predecessors since March 2004; Vice President, Columbia Acorn Trust and Wanger Advisors Trust, since 1997; portfolio manager and analyst, CWAM or its predecessors since August 1992. | | | 12 | | | None | |
|
Christopher J. Olson, 47,
Vice President | | | 2001 | | | Portfolio manager and analyst, CWAM or its predecessors, since January 2001; Vice President, Columbia Acorn Trust and Wanger Advisors Trust since 2001. | | | 12 | | | None | |
|
Scott R. Plummer, 52,
Assistant Secretary | | | 2010 | | | Chief Legal Officer and Assistant Secretary, Columbia Management Investment Advisers, LLC (or its predecessors) since June 2005; Vice President and Lead Chief Counsel — Asset Management, Ameriprise Financial since May 2010 (previously Vice President and Chief Counsel — Asset Management, from 2005 to April 2010, and Vice President — Asset Management Compliance from 2004 to 2005); Vice President, Chief Counsel and Assistant Secretary, Columbia Management Investment Distributors, Inc. (or its predecessors) since 2008; Vice President, General Counsel and Secretary, Ameriprise Certificate Company since 2005; Chief Counsel, RiverSource Distributors, Inc. from 2006 to 2010; Vice President, General Counsel and Secretary, legacy RiverSource Funds, since December 2006; Senior Vice President, Secretary and Chief Legal Officer, Columbia Funds since May 2010. | | | 12 | | | None | |
|
Christopher O. Petersen, 42,
Assistant Secretary | | | 2010 | | | Vice President and Chief Counsel, Ameriprise Financial since January 2010 (formerly Vice President and Group Counsel or Counsel from April 2004 to January 2010); Assistant Secretary of legacy RiverSource Funds since January 2007. | | | 12 | | | None | |
|
Robert P. Scales, 59,
Chief Compliance Officer, Chief Legal Officer, Senior Vice President and General Counsel | | | 2004 | | | Chief Compliance Officer, Chief Legal Officer, Senior Vice President and General Counsel, Columbia Acorn Trust and Wanger Advisors Trust, since 2004. | | | 12 | | | None | |
|
Andreas Waldburg-Wolfegg, 45,
Vice President | | | 2011 | | | Portfolio Manager and analyst of CWAM since 2002. Vice President Columbia Acorn Trust and Wanger Advisors Trust since September 2011. | | | 12 | | | None | |
|
Linda Roth-Wiszowaty, 42,
Assistant Secretary | | | 2006 | | | Business support analyst, CWAM, since April 2007; prior thereto executive administrator, CWAM or its predecessors, and executive assistant to the Chief Operating Officer of CWAM or its predecessors. | | | 12 | | | None | |
|
* Dates prior to April 1992 correspond to the date of first election or appointment as a trustee or officers of The Acorn Fund, Inc., the predecessor trust to Columbia Acorn Trust.
(1) Mr. Muchin retired at the end of calendar year 2011.
(2) Prior to December 31, 2011, Mr. Rudis was considered an "interested person" of Wanger Advisors Trust, as defined in the New York Attorney General's Assurance of Discontinuance ("Order") entered into in February 2005 by Columbia Management Advisors, LLC (an indirect subsidiary of Bank of America Corporate ("BOA")) and Columbia Management Distributors, Inc. (an indirect subsidiary of BOA), because of his former employment as a BOA executive. The Order expired with respect to Wanger Advisors Trust on December 31, 2011.
(3) Mr. McQuaid is an "interested person" of Wanger Advisors Trust and of CWAM, as defined in the Investment Company Act of 1940 because he is an officer of the Trust and of CWAM.
(4) As permitted under the Wanger Advisors Trust's By-Laws, Mr. Wanger serves as a non-voting Trustee Emeritus of the Trust.
30
Wanger International 2011 Annual Report
This page intentionally left blank.
31
Wanger International 2011 Annual Report

Columbia Wanger Funds
Transfer Agent,
Dividend Disbursing Agent
Columbia Management Investment
Services Corp.
P.O. Box 8081
Boston, Massachusetts
02266-8081
Distributor
Columbia Management Investment
Distributors, Inc.
One Financial Center
Boston, Massachusetts
02111-2621
Investment Adviser
Columbia Wanger Asset Management, LLC
227 West Monroe Street, Suite 3000
Chicago, Illinois 60606
1-888-4-WANGER
(1-888-492-6437)
Legal Counsel to the Funds
Perkins Coie, LLP
Washington, DC
Legal Counsel to the Independent Trustees
Drinker Biddle & Reath LLP
Philadelphia, Pennsylvania
Independent Registered Public
Accounting Firm
PricewaterhouseCoopers LLP
Chicago, Illinois
This document contains Global Industry Classification Standard data. The Global Industry Classification Standard ("GICS") was developed by and is the exclusive property and a service mark of MSCI Inc. ("MSCI") and Standard & Poor's Financial Services LLC ("S&P") and is licensed for use by Columbia Wanger Asset Management, LLC ("CWAM"). Neither MSCI, S&P, nor any other party involved in making or compiling the GICS or any GICS classifications makes any express or implied warranties or representations with respect to such standard or classification (or the results to be obtained by the use thereof), and all such parties hereby expressly disclaim all warranties of originality, accuracy, completeness, merchantability and fitness for a particular purpose with respect to any of such standard or classification. Without limiting any of the foregoing, in no event shall MSCI, S&P, any of their affiliates or any third party involved in making or compiling the GICS or any GICS classifications have any liability for any direct, indirect, special, punitive, consequential or any other damages (including lost profits) even if notified of the possibility of such damages.
This report, including the schedules of investments and financial statements, is submitted for the general information of the shareholders of the Wanger Advisors Trust.
A description of the Fund's proxy voting policies and procedures and a copy of the Fund's voting record for the most recent 12-month period ended June 30 are available (i) on the Securities and Exchange Commission's website at www.sec.gov, and (ii) without charge, upon request, by calling 888-492-6437.
The Fund files a complete schedule of portfolio holdings with the SEC for the first and third quarters of each fiscal year on Form N-Q. The Fund's Form N-Q is available on the SEC's website at www.sec.gov and may be reviewed and copied at the SEC's Public Reference Room in Washington, D.C. Information on the operation of the Pubic Reference Room may be obtained by calling 800-SEC-0330. The Fund's complete portfolio holdings are disclosed at www.columbiafunds.com approximately 30 days after each month-end.
32
Columbia Wanger Funds
© 2012 Columbia Management Investment Advisers, LLC. All rights reserved.
C-1456 C (2/12) 132421
Wanger International Select
2011 Annual Report

Not FDIC insured • No bank guarantee • May lose value

Wanger International Select
2011 Annual Report
Table of Contents
| 2 | | | Understanding Your Expenses | |
|
| 3 | | | Vaccines: Medicine's Greatest Lifesaver | |
|
| 6 | | | Performance Review | |
|
| 8 | | | Statement of Investments | |
|
| 13 | | | Statement of Assets and Liabilities | |
|
| 13 | | | Statement of Operations | |
|
| 14 | | | Statement of Changes in Net Assets | |
|
| 15 | | | Financial Highlights | |
|
| 16 | | | Notes to Financial Statements | |
|
| 20 | | | Report of Independent Registered Public Accounting Firm | |
|
| 21 | | | Federal Income Tax Information | |
|
| 22 | | | Board of Trustees and Management of Wanger Advisors Trust | |
|
Columbia Wanger Asset Management, LLC (CWAM) is one of the leading global small- and mid-cap equity managers in the United States with 40 years of small- and mid-cap investment experience. As of December 31, 2011, CWAM managed $29.4 billion in assets. CWAM is the investment adviser to Wanger USA, Wanger International, Wanger Select and Wanger International Select (together, the Columbia Wanger Funds) and the Columbia Acorn Family of Funds.
Investors should consider the investment objectives, risks, charges and expenses of a mutual fund carefully before investing. For a free prospectus, which contains this and other important information about the Fund, contact your financial adviser or insurance company or contact 1-888-4-WANGER. Read the prospectus carefully before investing.
An important note: Columbia Wanger Funds are available for purchase through variable annuity contracts and variable life insurance policies offered by the separate accounts of participating insurance companies and qualified pension or retirement plans.
The views expressed in "Vaccines: Medicine's Greatest Lifesaver" and in the Performance Review reflect the current views of the respective authors. These views are not guarantees of future performance and involve certain risks, uncertainties and assumptions that are difficult to predict so actual outcomes and results may differ significantly from the views expressed. These views are subject to change at any time based upon economic, market or other conditions and the respective parties disclaim any responsibility to update such views. These views may not be relied on as investment advice and, because investment decisions for a Columbia Wanger Fund are based on numerous factors, may not be relied on as an indication of trading intent on behalf of any particular Columbia Wanger Fund. References to specific company securities should not be construed as a recommendation or investment advice.
1
Wanger International Select 2011 Annual Report
Understanding Your Expenses
As a shareholder, you incur three types of costs. There are transaction costs, which generally include sales charges on purchases and may include redemption fees. There are also ongoing costs, which generally include management fees and other Fund expenses. Lastly, there may be additional fees or charges imposed by the insurance company that sponsors your variable annuity and/or variable life insurance product. The following information is intended to help you understand your ongoing costs (in dollars) of investing in the Fund and to help you compare these costs with the ongoing costs of investing in other mutual funds.
Analyzing your Fund's expenses
To illustrate these ongoing costs, we have provided an example and calculated the expenses paid by investors in the Fund during the period. The actual and hypothetical information in the table below is based on an initial investment of $1,000 at the beginning of the period indicated and held for the entire period. Expense information is calculated two ways and each method provides you with different information. The amount listed in the "Actual" column is calculated using the Fund's actual operating expenses and total return for the period. You may use the Actual information, together with the amount invested, to estimate the expenses that you paid over the period. Simply divide your account value by $1,000 (for example, an $8,600 account value divided by $1,000 = 8.6), then multiply the results by the expenses paid during the period under the Actual column. The amount listed in the "Hypothetical" column assumes a 5% annual rate of return before expenses (which is not the Fund's actual return) and then applies the Fund's actual expense ratio for the period to the hypothetical return. You should not use the hypothetical account values and expenses to estimate either your actual account balance at the end of the period or the expenses you paid during the period. See "Compare with other funds" below for details on how to use the hypothetical data.
Compare with other funds
Since all mutual funds are required to include the same hypothetical calculations about expenses in shareholder reports, you can use this information to compare the ongoing cost of investing in the Fund with other funds. To do so, compare the hypothetical example with the 5% hypothetical examples that appear in the shareholder reports of other funds. As you compare hypothetical examples of other funds, it is important to note that hypothetical examples are meant to highlight the ongoing cost of investing in a fund only and do not reflect any transaction costs, such as sales charges, redemption or exchange fees. Therefore, the hypothetical calculations are useful in comparing ongoing costs only, and will not help you determine the relative total costs of owning different funds. If transaction costs were included in these calculations, your costs would be higher.
July 1, 2011 – December 31, 2011
| | | Account value at the
beginning of the period ($) | | Account value at the
end of the period ($) | | Expenses paid during
period ($) | | Fund's annualized
expense ratio (%)* | |
| | | Actual | | Hypothetical | | Actual | | Hypothetical | | Actual | | Hypothetical | | | |
| Wanger International Select | | | 1,000.00 | | | | 1,000.00 | | | | 869.30 | | | | 1,017.80 | | | | 6.79 | | | | 7.33 | | | | 1.45 | | |
*Expenses paid during the period are equal to the Fund's annualized expense ratio, multiplied by the average account value over the period, then multiplied by the number of days in the Fund's most recent fiscal half-year and divided by 365.
Had the investment adviser not waived fees or reimbursed a portion of expenses, account value at the end of the period would have been reduced.
It is important to note that the expense amounts shown in the table are meant to highlight only ongoing costs of investing in the Fund. Expenses paid during the period do not include any insurance charges imposed by your insurance company's separate account. The hypothetical example provided is useful in comparing ongoing costs only and will not help you determine the relative total costs of owning different funds whose shareholders may incur transaction costs.
2
Wanger International Select 2011 Annual Report

Vaccines: Medicine's Greatest Lifesaver
I recently read several books on the history of vaccines. As one of the authors put it, "Of all of the benefits of medical science, vaccination is at or near the summit."1
Deadly Diseases
"Bring out your dead!" cries a wretched man pulling a cart of bodies in Monty Python and the Holy Grail. Set in the middle ages, the movie makes fun of the impact of communicable disease at that time. In reality, such diseases were no laughing matter. Once mankind transitioned from isolated bands of nomadic hunter-gatherers to more densely populated groups of farmers, epidemic diseases began to ravage civilization.
Remarkable progress has been made as fatal, communicable disease has now become rare in the developed world. Clearly, improved sanitation and nutrition have helped, but much of the credit goes to the development of vaccines.
The First Vaccine
Dating back to at least the time of the Pharaohs, waves of smallpox epidemics ravaged mankind. In populations previously subject to the disease, mortality rates for those infected could be more than 30% and, for other populations, much more.2 North American Indians had little immunity to the disease. Their population decreased 99% between Columbus's voyage in 1492 and the year 1800, and smallpox was the largest killer.3
People observed that the disease was communicable and one who survived a smallpox infection became immune to the next epidemic of the disease. In ancient China and more recently in Asia and Africa, a crude form of vaccination called variolation developed whereby fluid from a smallpox pustule or parts of smallpox scabs were scraped into the skin of a healthy person. In most cases, immunity would build up before the disease reached a vital organ and the individual would survive.
In 1790, Lady Montague, the wife of the British ambassador to the Ottoman Empire, introduced variolation to Britain. The process was far riskier than vaccines today; most people suffered severe side effects and up to about 3% of those treated died as a result.4 But these were much better odds than for those infected with smallpox.
Edward Jenner, a pharmacist in England, learned that milkmaids were immune to smallpox because they often suffered blisters from cowpox, a related disease. In 1796, Jenner began experimenting with variolating using fluid from a milkmaid's cowpox blisters, rather than smallpox sores. When his subjects were later variolated with smallpox fluid, no reaction occurred, indicating that they were immune from smallpox. Immunization using cowpox fluids rose rapidly and protected millions of people.5
A cowpox-derived vaccine for smallpox continued to be used well into the 20th century, including use by six million New Yorkers who were inoculated during a smallpox scare in 1947. Smallpox was eradicated from nature; the last case occurred in India in 1975.6 Smallpox immunizations ended when health authorities judged the risk of side effects from the vaccine exceeded the risk of the disease returning.
The Golden Age of Vaccines
Beginning in the 1860s, tremendous scientific advances were made. Robert Koch's laboratory in Germany identified bacteria as the source of many diseases and proved that bacteria grown in a lab could cause disease.7 Koch's lab created some vaccines, including those for diphtheria and tetanus.
In France, Louis Pasteur stunned the world by developing the first rabies vaccine in 1885; until then rabies infections resulted in horrible deaths. His mantra was to "isolate, attenuate and vaccinate" the pathogen causing a disease.8 He attenuated a germ by having it reproduce in petri dishes or animal cells where it would evolve in order to optimize in its new environment. Once it evolved to the point it would no longer thrive in and harm humans, it was injected into humans with the hope that the subject would build immunity to full power germs. The Goldilocks trick of course was to make the attenuated germ weak enough so as not to cause harm, but strong enough to create immunity.
While scientific understanding of disease increased rapidly, it was primitive compared to modern times. Diagnostic tools were poor. Bacteria could be seen by optical microscopes, but viruses were unseen until the development of the electron microscope in the 1930s. Viruses were inferred to exist as a result of an 1898 experiment by Danish professor Martinus Beijerinck, who filtered bacteria out through unglazed porcelain containers, but observed remaining, and much smaller, disease-causing elements. Scientists learned how to grow viruses in laboratories only in the late 1940s.9
Early vaccines were dangerous and unreliable by today's standards, though far less dangerous than the underlying diseases they prevented. Vaccines did not stop the great influenza epidemic of 1918-1919. Of a worldwide population of one billion, an estimated 500 million were infected and more than 50 million people died.10 This virus was unusual in that it had high mortality among young, healthy people.
Vaccines continued to progress. During World War II, all 11 million U.S. soldiers were vaccinated for typhoid, tetanus, smallpox, cholera and plague. Vaccines, coupled with antibiotics, drastically improved their health. Disease deaths outnumbered battle deaths by 13:1 in the Spanish American War, matched them in World War I and were outnumbered by 1:85 in World War II.11
Maurice Hilleman's Mission
Maurice Hilleman had a role in creating more vaccines than anyone else in history, some three dozen. As noted by Arthur Allen, author of Vaccine, The Controversial Story of Medicine's Greatest Lifesaver, "...his products undoubtedly
3
Wanger International Select 2011 Annual Report
saved more lives than those of any other individual in the past half-century."12
Hilleman grew up in Montana, and earned a Ph.D. in microbiology at the University of Chicago where he discovered that chlamydia is a tiny bacteria rather than a virus. He then stunned his mentors by departing academia to work in industry. At Squibb, he developed a vaccine against Japanese B encephalitis to protect American Pacific troops during World War II. In 1948, he joined the Walter Reed Army Medical Center, then a hub of vaccine development.
In 1957, Hilleman moved to Merck, where he continued to develop vaccines well past his official retirement in 1984. He had a tremendous work ethic, often working seven days a week and expecting the same from his staff. He and his team were on a mission to rid the world of disease. They developed eight of 14 now common vaccines for measles, mumps, hepatitis A and B, chickenpox, meningitis, pneumonia and Hib (hemophilus influenza, which harms infants and young children).13 One of his accomplishments was the combination MMR (measles, mumps and rubella) vaccine.
Hilleman discovered that the influenza virus is particularly difficult to deal with due to frequent minor drifts in its surface, which each year makes the last year's vaccine obsolete. Periodically, the virus shifts its surface characteristics substantially, becoming much more virulent. Hilleman inferred that a shift occurred in Hong Kong in 1957 and, by having Merck produce 40 million doses of vaccine, saved thousands of lives in America. Potential future shifts keep virologists up at night.
Hilleman helped develop the first two anti-cancer vaccines. One vaccine prevents hepatitis B, the third most common known cause of cancer in the world (after sunlight and smoking).14 It was the first vaccine utilizing recombinant technology and the first made by a single protein. His innovations helped create a vaccine to prevent HPV (human papillomavirus), the cause of cervical cancer. Hilleman had high integrity, as he refused to risk changes in manufacturing processes in order to enhance yields and profits.15 He died in 2005 at age 85.
Vaccine Scares
Two notable scares set back progress on vaccine usage.
In 1982, a TV station in Washington D.C. aired "Vaccine Roulette," a story highlighting risks of the DTP (diphtheria, tetanus, pertussis) vaccine. It showed reactions well known to physicians, including cases of seizures, high fevers and fainting. In a case of ambush journalism, it edited doctors' comments out of context and failed to mention that none of the victims portrayed suffered permanent damage. Other media quoted the story further out of context, claiming permanent damage. The media also failed to mention the consequences of contracting the underlying diseases.16
In 1998, the British medical journal The Lancet published a paper alleging a link between the MMR vaccine and autism.17 It claimed that, in some cases, the vaccine caused the measles virus to lodge in the intestines and create leakage, allowing opioid peptides to escape and penetrate the brain, causing autism. The paper was under fire by scientists immediately. The opioid causation theory had already been widely discredited, the findings of measles in intestines could not be duplicated by other scientists and there was no comparison between autism rates of children who got the vaccine and those who did not. A review by 37 experts found that the theories were "biologically implausible," and the conclusions essentially worthless.18
Fourteen separate groups of investigators did statistical studies that also refuted the link.19 One notable study covered 530,000 children in Denmark from 1991-1998, comparing vaccinated and unvaccinated children. It showed "strong evidence against the hypothesis that MMR vaccination causes autism."20 By 2004, 10 of the original 12 authors of The Lancet article withdrew their support of the paper.21 The Lancet formally retracted the paper in 2010 and, that same year, the primary author of the paper had his U. K. medical license revoked.
Once the MMR-autism link was largely discredited, vaccine opponents claimed a link between mercury in vaccines and autism. Minute amounts of ethyl mercury were utilized in vaccines, usually less than the more toxic methyl mercury infants get exposed to from the environment. Combined, in some cases, the dosage did exceed government guidelines, so the mercury was removed. Studies showed that reported rates of autism continued to climb once mercury was removed from vaccines.22 "In spite of all the concern...there has not been a single case of proven mercury toxicity from vaccines...," writes Kurt Link, author of The Vaccine Controversy: The History, Use, and Safety of Vaccinations.23
Unfortunately, many people appear to rely on one-sided scares and opinions expressed in talk shows and by celebrity activists, rather than on scientific evidence. Immunization rates around the world have fluctuated with publicity, funding for inoculations, public policy and legal requirements. Where immunizations have dropped, outbreaks have occurred. A diphtheria epidemic hit the former Soviet Union in 1993, causing 4,000 deaths.24 In Japan, where pertussis immunizations fell from 80% in 1974 to 10% in 1976, a 1979 epidemic of that disease resulted in 13,000 infections and 41 deaths.25 In the United States, where pockets of low immunization rates exist, outbreaks occur. Some of the Chicago suburbs are currently experiencing a whooping cough outbreak.26
Perspectives on Risks
There have been mistakes in vaccine development, production and use that have resulted in injuries and deaths. However, those numbers pale in comparison to the injuries and deaths caused by the underlying diseases that are being conquered by vaccines. While rare vaccine side effects continue to exist, drugs and
4
Wanger International Select 2011 Annual Report
vaccines come with disclosures of the known side effects and risks, however unlikely. Diseases don't.
Many people believe some vaccine-preventable diseases to be fairly benign and some are, in most cases. Yet measles is one of the most contagious viruses and has killed more children than any other disease in history.27 It hospitalized 48,000 Americans yearly in the 1960s and killed 400 during a 1964 epidemic.28
Chickenpox is perceived to be a mild disease and it usually is. Acquiring chickenpox creates lifetime immunity to the disease (though susceptibility to shingles) so some question the usefulness of the vaccine. However, Paul Offit, author of Vaccinated, One Man's Quest to Defeat the World's Deadliest Diseases, points out that chickenpox creates risk of encephalitis, hepatitis, pneumonia and Group A streptococci, the "flesh-eating bacteria." He notes that, before the vaccine, some 10,000 people a year were hospitalized and 100 died annually in the United States due to the disease or related illnesses.29
German measles (rubella) was considered a benign illness featuring a rash and a low fever until Australian ophthalmologist Sir Norman McAllister Gregg discovered a link to birth defects. When striking a mother in her first trimester, rubella causes fetal anomalies in 90% of pregnancies. In 1964-65, prior to the rubella vaccine, the last major epidemic in the United States caused thousands of birth defects.30 Hilleman's MMR vaccine was approved in 1971 and the number dropped to seven U.S. cases in 1983.31
Whooping cough (pertussis) is a horrible disease for babies and small children. Babies have died because of outbreaks when vaccination rates declined as a result of scares. The underlying vaccine has changed since the "Vaccine Roulette" television program, to an acellular version with fewer side effects.32 That is why the combination vaccine is now called DTaP rather than DTP.
While no vaccine is 100% effective, the fact remains that if the vast majority of people are vaccinated, a disease cannot infect enough victims to spread. Link writes, "In the prevaccine era, every family lost a child or knew of one so lost due to vaccine-preventable diseases. Today in the USA, the death of a child is an unexpected tragedy; in the past it was an expected sorrow."33 American life expectancies increased 30 years during the 20th century, largely due to vaccines.34


Charles P. McQuaid
President and Chief Investment Officer
Columbia Wanger Asset Management, LLC
The information and data provided in this analysis are derived from sources that we deem to be reliable and accurate. These views are not guarantees of future performance and involve certain risks, uncertainties and assumptions that are difficult to predict so actual outcomes and results may differ significantly from the views expressed. The views/opinions expressed in this essay are those of the author and not of the Columbia Wanger Funds Board, are subject to change at any time based upon economic, market or other conditions, may differ from views expressed by other Columbia Management associates and the respective parties disclaim any responsibility to update such views. These views may not be relied on as investment advice and, because investment decisions for a Columbia Wanger Fund are based on numerous factors, may not be relied on as an indication of trading intent on behalf of any particular Columbia Wanger Fund.
The information included on Pages 3-5 of this report is unaudited.
1 Link, M.D., Kurt, The Vaccine Controversy, The History, Use, And Safety of Vaccinations, (Westport, Connecticut, Praeger Publishers 2005) p. 38.
2 Mnookin, Seth, The Panic Virus, A True Story of Medicine, Science, and Fear, (New York, New York, Simon & Schuster 2011) p. 30.
3 Offit, M.D., Paul A., Vaccinated, One Man's Quest to Defeat the World's Deadliest Diseases, (New York, New York, HarperCollins Publishers 2007) pg. 32.
4 Link, M.D., Kurt, op. cit., p. 12.
5 Allen, Arthur, Vaccine, The Controversial Story of Medicines Greatest Lifesaver, (New York, New York, W. W. Norton & Company 2007) p. 49-50.
6 Ibid., p. 115, 303.
7 Offit, M.D., Paul A., op. cit., p. 144.
8 Allen, Arthur, op. cit., p. 65, 121.
9 Offit, M.D., Paul A., op. cit., p. 37, 41-42.
10 Ibid., p. 2-3.
11 Allen, Arthur, op. cit., p. 119, 159.
12 Ibid., p. 221.
13 Link, M.D., Kurt, op. cit., p. 101.
14 Offit, M.D., Paul A., op. cit., p. 115.
15 Ibid., p. 130, 156.
16 Allen, Arthur, op. cit., p. 251-256.
17 Wakefield, Andrew J., et al., "Ileal-lymphoid-nodular Hyperplasia, Non-Specific Colitis, and Pervasive Developmental Disorders in Children," The Lancet 351, Issue 9103 (1998), p. 637-41.
18 Mnookin, Seth, op. cit., p. 106-107, 114.
19 Offit, M.D., Paul A., op. cit., p. 167.
20 Mnookin, Seth, op. cit., p. 163.
21 Murch, Simon H., et al., "Retraction of an Interpretation," The Lancet 363, Issue 9411 (2004), p. 750.
22 Mnookin, Seth, op. cit., p. 167.
23 Link, M.D., Kurt, op. cit., p. 21.
24 Ibid., p. 57.
25 Mnookin, Seth, op. cit., p. 277.
26 Synett, Lawerence, "Whooping Cough Strikes Collar Counties," Chicago Tribune, December 6, 2011.
27 Mnookin, Seth, op. cit., p. 19.
28 Allen, Arthur, op. cit., p. 217.
29 Offit, M.D., Paul A., op. cit., p. 102.
30 Link, M.D., Kurt, op. cit., p. 82-84.
31 Allen, Arthur, op. cit., p. 240.
32 Ibid., p. 352, 286.
33 Link, M.D., Kurt, op. cit., p. 163.
34 Offit, M.D., Paul A., op. cit., p. xiv.
5
Wanger International Select 2011 Annual Report

Performance Review Wanger International Select

Christopher J. Olson
Portfolio Manager
Performance data shown represents past performance and is not a guarantee of future results. The investment return and principal value will fluctuate so that shares, when redeemed, may be worth more or less than the original cost. Current performance may be lower or higher than the performance data shown. Please visit columbiamanagement.com for performance updates for the most recent month-end.
Wanger International Select was down 10.11% for the year ended December 31, 2011, outperforming the 14.01% decline of its primary benchmark, the S&P Developed Ex-U.S. Between $2B and $10B Index. Fears of a global recession and continuing financial crisis plagued international market performance throughout the year.
Taiwan's Far Eastone Telecom, up 26%, was a top contributor to Fund gains for the year. Far Eastone is Taiwan's third largest mobile operator and is seeing strong data growth and rising revenue due to the increasing use of smartphones. A 6% yield and strong cash position also made it an attractive investment option during a weak market. Another winner in the mobile communication industry was Japanese mobile social networking game developer Gree. The company's higher than expected growth was reflected in its annual gain of 173% in Wanger International Select. It too is benefiting from the increased use of smartphones, which has helped to drive its outperformance. Japanese drugstore operator Ain Pharmaciez had a 39% annual gain, as good acquisitions and better than expected cost cutting helped it beat earnings estimates. UK testing, inspection and certification services provider Intertek Group gained 15%. Increasing regulations and a focus on product quality has made the testing and inspection business highly resilient in tough economic times. German online payment processor and risk manager Wirecard was up 18% for the year as the company has been growing revenues due to strong growth in e-commerce as well as the popularity of a newly introduced prepaid cash card.
Laggards included UK defense contractor Chemring, down 38% for the year as fears of cuts in defense spending dampened the prospects for the company. Germany's Rheinmetall was also impacted by defense spending concerns, falling 44% for the annual period. Israel Chemicals, an Israeli chemical producer, ended the year down 34% due, in part, to fears of political risk in that country and remediation costs associated with clean-up near the company's evaporation pools. Japanese manufacturer of consumable diamond tools Asahi Diamond Industrial ended the year down 35% as its business suffered from fears of slowing global growth.
I remain cautious about the global financial markets given the magnitude and multitude of issues that need to be addressed. The Fund will continue to focus on companies with strong cash flow and dividend yield characteristics, solid balance sheets and above-average earnings visibility.
International investing involves special risks, including foreign taxation, currency risks, risks associated with possible differences in financial standards and other risks associated with future political and economic developments. Stocks of small- and mid-cap companies pose special risks, including possible illiquidity and greater price volatility than stocks of larger, more established companies. Investing in emerging markets may involve greater risks than investing in more developed countries.
Portfolio holdings are subject to change periodically and may not be representative of current holdings.
Fund's Positions in Mentioned Holdings
As a percentage of net assets, as of 12/31/11
| Far Eastone Telecom | | | 6.3 | % | |
| Wirecard | | | 3.0 | | |
| Intertek Group | | | 2.0 | | |
| Asahi Diamond Industrial | | | 1.8 | | |
| Gree | | | 1.8 | | |
| Chemring | | | 1.6 | | |
| Rheinmetall | | | 1.5 | | |
| Ain Pharmaciez | | | 1.5 | | |
| Israel Chemicals | | | 1.4 | | |
6
Wanger International Select 2011 Annual Report
Growth of a $10,000 Investment in Wanger International Select
February 1, 1999 (inception date) through December 31, 2011
Performance data shown represents past performance and is not a guarantee of future results. The investment return and principal value will fluctuate so that shares, when redeemed, may be worth more or less than the original cost. Current performance may be lower or higher than the performance data shown. Performance results reflect any fee waivers or reimbursements of Fund expenses by the investment adviser and/or any of its affiliates. Absent these fee waivers and/or expense reimbursement arrangements, performance results would have been lower. For daily and most recent month-end performance updates, please call 1-888-4-WANGER.
This graph compares the results of $10,000 invested in Wanger International Select on February 1, 1999 (the date the Fund began operations) through December 31, 2011, to the S&P Developed Ex-U.S. Between $2B and $10B Index, with dividends and capital gains reinvested. Although the index is provided for use in assessing the Fund's performance, the Fund's holdings may differ significantly from those in the index.
Top 10 Holdings
As a percentage of net assets, as of 12/31/11
1. Far Eastone Telecom (Taiwan)
Taiwan's Third Largest Mobile Operator | | | 6.3
| % | |
2. Ascendas REIT (Singapore)
Singapore Industrial Property Landlord | | | 5.2
| | |
3. Kansai Paint (Japan)
Paint Producer in Japan, India, China & Southeast Asia | | | 5.2
| | |
4. Mapletree Industrial Trust (Singapore)
Singapore Industrial Property Landlord | | | 5.0
| | |
5. Seven Bank (Japan)
ATM Processing Services | | | 3.7
| | |
6. Rand Merchant Insurance (South Africa)
Directly Sold Property & Casualty Insurance; Holdings in Other Insurers | | | 3.5
| | |
7. Wirecard (Germany)
Online Payment Processing & Risk Management | | | 3.0
| | |
8. Archipelago Resources (Indonesia)
Gold Mining Projects in Indonesia, Vietnam & the Philippines | | | 2.8
| | |
9. Hexagon (Sweden)
Design, Measurement & Visualization Software & Equipment | | | 2.7
| | |
10. Adcock Ingram Holdings (South Africa)
Manufacturer of Pharmaceuticals & Medical Supplies | | | 2.7
| | |
Top 5 Countries
As a percentage of net assets, as of 12/31/11
| Japan | | | 16.5 | % | |
| Singapore | | | 12.3 | | |
| United Kingdom | | | 9.1 | | |
| Taiwan | | | 8.5 | | |
| South Africa | | | 7.3 | | |
Results as of December 31, 2011
| | | 4th quarter | | 1 year | | 5 years | | 10 years | |
| Wanger International Select | | | 2.03 | % | | | -10.11 | % | | | -0.23 | % | | | 8.82 | % | |
S&P Developed Ex-U.S. Between
$2B and $10B Index* | | | 0.99 | | | | -14.01 | | | | -3.06 | | | | 8.41 | | |
| MSCI EAFE Index | | | 3.33 | | | | -12.14 | | | | -4.72 | | | | 4.67 | | |
Lipper International Growth Funds
Variable Underlying Index | | | 5.28 | | | | -13.10 | | | | -3.45 | | | | 4.18 | | |
*The Fund's primary benchmark.
NAV as of 12/31/11: $16.44
Performance numbers reflect all Fund expenses but do not include any fees and expenses imposed under your variable annuity or life insurance policy or qualified pension or retirement plan. If performance included the effect of these additional charges, it would be lower.
The Fund's annual operating expense ratio is 1.38%. The annual operating expense ratio is as stated in the Fund's prospectus that is current as of the date of this report. Differences in expense ratios disclosed elsewhere in this report may result from including fee waivers and reimbursements as well as different time periods used in calculating the ratios.
All results shown assume reinvestment of distributions and do not reflect taxes that a shareholder would pay on Fund distributions or the sale of Fund shares.
The S&P Developed Ex-U.S. Between $2B and $10B Index is a subset of the broad market selected by the index sponsor representing the mid-cap developed market, excluding the United States. The Morgan Stanley Capital International Europe, Australasia, Far East (MSCI EAFE) Index (Net) is a capitalization-weighted index that tracks the total return of common stocks in 22 developed-market countries within Europe, Australasia and the Far East. The returns of the MSCI EAFE Index (Net) are presented net of the withholding tax rate applicable to foreign non-resident institutional investors in the foreign companies included in the index who do not benefit from double taxation treaties. The Lipper International Growth Funds Variable Underlying Index is an equally weighted representation of the 30 largest variable insurance underlying funds in the Lipper International Growth Funds Variable Underlying Classification. Indexes are not managed and do not incur fees or expenses. It is not possible to invest directly in an index.
Lipper Inc., a widely respected data provider in the industry, calculates an average total return (assuming reinvestment of distributions) for mutual funds with investment objectives similar to those of the Fund. Lipper makes no adjustment for the effect of sales loads.
Portfolio characteristics and holdings are subject to change periodically and may not be representative of current characteristics and holdings.
7
Wanger International Select 2011 Annual Report
Wanger International Select
Statement of Investments, December 31, 2011
Number of
Shares | | | | Value | |
| | | Equities – 90.4% | |
| | | Asia – 48.0% | |
| | | Japan – 16.5% | |
| | 140,000 | | | Kansai Paint
Paint Producer in Japan, India, China & Southeast Asia | | $ | 1,246,926
| | |
| | 458,000 | | | Seven Bank
ATM Processing Services | | | 896,271
| | |
| | 600 | | | Jupiter Telecommunications
Largest Cable Service Provider in Japan | | | 607,324
| | |
| | 36,300 | | | Asahi Diamond Industrial
Consumable Diamond Tools | | | 436,799
| | |
| | 12,300 | | | Gree
Mobile Social Networking Game Developer/Platform | | | 422,828
| | |
| | 7,360 | | | Ain Pharmaciez
Dispensing Pharmacy/Drugstore Operator | | | 354,174
| | |
| | | | | | | | 3,964,322 | | |
| | | Singapore – 12.3% | |
| | 885,000 | | | Ascendas REIT
Singapore Industrial Property Landlord | | | 1,249,639
| | |
| | 1,443,000 | | | Mapletree Industrial Trust
Singapore Industrial Property Landlord | | | 1,195,649
| | |
| | 762,000 | | | Mapletree Logistics Trust
Industrial Property Landlord | | | 495,971
| | |
| | | | | | | | 2,941,259 | | |
| | | Taiwan – 8.5% | |
| | 805,000 | | | Far Eastone Telecom
Taiwan's 3rd Largest Mobile Operator | | | 1,512,192
| | |
| | 202,000 | | | CTCI Corp
International Engineering Firm | | | 275,270
| | |
| | 84,000 | | | Taiwan Mobile
Taiwan's 2nd Largest Mobile Operator | | | 261,707
| | |
| | | | | | | | 2,049,169 | | |
| | | China – 4.2% | |
| | 304,000 | | | Zhaojin Mining Industry
Gold Mining & Refining in China | | | 482,186
| | |
| | 6,000 | | | NetEase.com – ADR (a)
Chinese Online Gaming Services | | | 269,100
| | |
| | 260,000 | | | Want Want
Chinese Branded Consumer Food Company | | | 258,981
| | |
| | | | | | | | 1,010,267 | | |
Number of
Shares | | | | Value | |
| | | Korea – 3.7% | |
| | 3,500 | | | NHN (a)
Korean Online Search Services | | $ | 641,463
| | |
| | 7,600 | | | Woongjin Coway (a)
South Korean Household Appliance Rental Service Provider | | | 242,010
| | |
| | | | | | | | 883,473 | | |
| | | Indonesia – 2.8% | |
| | 625,000 | | | Archipelago Resources (a)
Gold Mining Projects in Indonesia, Vietnam & the Philippines | | | 670,944
| | |
| | | | | Total Asia | | | 11,519,434 | | |
| | | Europe – 27.7% | |
| | | United Kingdom – 9.1% | |
| | 49,000 | | | JLT Group
International Business Insurance Broker | | | 524,689
| | |
| | 15,000 | | | Intertek Group
Testing, Inspection & Certification Services | | | 474,053
| | |
| | 60,000 | | | Chemring
Defense Manufacturer of Countermeasures & Energetics | | | 372,627
| | |
| | 48,000 | | | Serco
Facilities Management | | | 353,339
| | |
| | 69,000 | | | Workspace Group
United Kingdom Real Estate | | | 241,907
| | |
| | 31,000 | | | Shaftesbury
London Prime Retail REIT | | | 224,924
| | |
| | | | | | | | 2,191,539 | | |
| | | Germany – 5.5% | |
| | 44,900 | | | Wirecard
Online Payment Processing & Risk Management | | | 721,749
| | |
| | 8,000 | | | Rheinmetall
Defense & Automotive | | | 354,469
| | |
| | 13,000 | | | Rhoen-Klinikum
Health Care Services | | | 247,668
| | |
| | | | | | | | 1,323,886 | | |
| | | Netherlands – 3.3% | |
| | 19,764 | | | Imtech (b)
Electromechanical & ICT Installation & Maintenance | | | 511,975
| | |
| | 2,500 | | | Core Laboratories
Oil & Gas Reservoir Consulting | | | 284,875
| | |
| | | | | | | | 796,850 | | |
See accompanying notes to financial statements.
8
Wanger International Select 2011 Annual Report
Wanger International Select
Statement of Investments, December 31, 2011
Number of
Shares | | | | Value | |
| | | Sweden – 2.7% | |
| | 43,733 | | | Hexagon
Design, Measurement & Visualization Software & Equipment | | $ | 653,893
| | |
| | | Switzerland – 2.2% | |
| | 1,600 | | | Partners Group
Private Markets Asset Management | | | 279,186
| | |
| | 2,200 | | | Kuehne & Nagel
Freight Forwarding/Logistics | | | 247,099
| | |
| | | | | | | | 526,285 | | |
| | | Iceland – 1.4% | |
| | 330,000 | | | Marel (a)
Largest Manufacturer of Poultry &
Fish Processing Equipment | | | 337,531
| | |
| | | Denmark – 1.3% | |
| | 10,000 | | | Novozymes
Industrial Enzymes | | | 308,708
| | |
| | | Ireland – 1.1% | |
| | 99,200 | | | United Drug
Irish Pharmaceutical Wholesaler & Outsourcer | | | 263,199
| | |
| | | Belgium – 1.1% | |
| | 5,000 | | | EVS Broadcast Equipment
Digital Live Mobile Production Software & Systems | | | 255,550
| | |
| | | | | Total Europe | | | 6,657,441 | | |
| | | Other Countries – 14.0% | |
| | | South Africa – 7.3% | |
| | 508,000 | | | Rand Merchant Insurance
Directly Sold Property & Casualty Insurance;
Holdings in Other Insurers | | | 843,253
| | |
| | 84,000 | | | Adcock Ingram Holdings
Manufacturer of Pharmaceuticals & Medical Supplies | | | 642,548
| | |
| | 6,300 | | | Naspers
Media in Africa, China, Russia & Other Emerging Markets | | | 275,637
| | |
| | | | | | | | 1,761,438 | | |
| | | Canada – 3.0% | |
| | 13,800 | | | CCL Industries
Leading Global Label Manufacturer | | | 424,126
| | |
Number of
Shares | | | | Value | |
| | 8,400 | | | AG Growth
Leading Manufacturer of Augers &
Grain Handling Equipment | | $ | 309,037
| | |
| | | | | | | | 733,163 | | |
| | | United States – 2.3% | |
| | 7,125 | | | Atwood Oceanics (a)
Offshore Drilling Contractor | | | 283,504
| | |
| | 3,600 | | | SM Energy
Oil & Gas Producer | | | 263,160
| | |
| | | | | | | | 546,664 | | |
| | | Israel – 1.4% | |
| | 32,000 | | | Israel Chemicals
Producer of Potash, Phosphates, Bromine &
Specialty Chemicals | | | 331,671
| | |
| | | | | Total Other Countries | | | 3,372,936 | | |
| | | Latin America – 0.7% | |
| | | Argentina – 0.5% | |
| | 12,500 | | | Union Agriculture Group (a) (c) (d)
Farmland Operator in Uruguay | | | 124,625
| | |
| | | Colombia – 0.2% | |
| | 1,200,000 | | | Quetzal Energy (a) (c)
Explores for Oil & Gas in Latin America | | | 45,232
| | |
| | | | | Total Latin America | | | 169,857 | | |
Total Equities
(Cost: $19,446,195) — 90.4% | | | 21,719,668 | | |
| Securities Lending Collateral – 0.5% | | | |
| | 131,327 | | | Dreyfus Government Cash
Management Fund (e)
(7 day yield of 0.00%) | | | 131,327 | | |
Total Securities Lending Collateral
(Cost: $131,327) | | | 131,327 | | |
See accompanying notes to financial statements.
9
Wanger International Select 2011 Annual Report
Wanger International Select
Statement of Investments, December 31, 2011
| | | Value | |
Total Investments
(Cost: $19,577,522) — 90.9% (f) (g) | | $ | 21,850,995 | | |
Obligation to Return Collateral for
Securities Loaned — (0.5)% | | | (131,327 | ) | |
| Cash and Other Assets Less Liabilities — 9.6% | | | 2,298,841 | | |
| Total Net Assets — 100.0% | | $ | 24,018,509 | | |
ADR = American Depositary Receipts
Notes to Statement of Investments
(a) Non-income producing security.
(b) All or a portion of this security was on loan at December 31, 2011. The total market value of securities on loan at December 31, 2011 was $129,339.
(c) Denotes a restricted security, which is subject to restrictions on resale under federal securities laws. These securities are valued at a fair value determined in good faith under consistently applied procedures established by the Board of Trustees. At December 31, 2011, the market value of these securities amounted to $169,857, which represented 0.71% of total net assets.
Additional information on these securities is as follows:
Acquisition
Security | | Dates | | Shares | | Cost | | Value | |
| Union Agriculture Group | | 12/8/10-
12/16/11 | | | 12,500 | | | $ | 150,000 | | | $ | 124,625 | | |
| Quetzal Energy | | 1/14/11 | | | 1,200,000 | | | | 151,653 | | | | 45,232 | | |
| | | | | | | | | | | | | $ | 301,653 | | | $ | 169,857 | | |
(d) Illiquid security.
(e) Investment made with cash collateral received from securities lending activity.
(f) At December 31, 2011, for federal income tax purposes cost of investments was $19,937,655 and net unrealized appreciation was $1,913,340 consisting of gross unrealized appreciation of $3,455,314 and gross unrealized depreciation of $1,541,974.
(g) On December 31, 2011, the Fund's total investments were denominated in currencies as follows:
| Currency | | Value | | Percentage of
Net Assets | |
| Japanese Yen | | $ | 3,964,322 | | | | 16.5 | | |
| Singapore Dollar | | | 2,941,259 | | | | 12.3 | | |
| British Pound | | | 2,862,483 | | | | 11.9 | | |
| Euro | | | 2,354,610 | | | | 9.8 | | |
| Taiwan Dollar | | | 2,049,169 | | | | 8.5 | | |
| South African Rand | | | 1,761,438 | | | | 7.3 | | |
| US Dollar | | | 1,225,264 | | | | 5.1 | | |
Other currencies less than
5% of total net assets | | | 4,561,123 | | | | 19.0 | | |
Cash and other assets
less liabilities | | | 2,298,841 | | | | 9.6 | | |
| | | $ | 24,018,509 | | | | 100.0 | | |
At December 31, 2011, the Fund had entered into the following forward foreign currency exchange contracts:
Forward
Foreign
Currency
Exchange
Contracts
to Buy | | Forward
Foreign
Currency
Exchange
Contracts
to Sell | | Principal
Amount in
Foreign
Currency | | Principal
Amount in
U.S. Dollar | | Settlement
Date | | Unrealized
Depreciation | |
| USD | | | | ZAR | | | | | 11,856,320 | | | $ | 1,400,000 | | | 01/13/12 | | $ | (66,362 | ) | |
The counterparty for all forward foreign currency exchange contracts is State Street Bank and Trust Company.
USD = United States Dollar
ZAR = South African Rand
Fair Value Measurements
Various inputs are used in determining the value of the Fund's investments, following the input prioritization hierarchy established by GAAP. These inputs are summarized in the three broad levels listed below:
• Level 1 – quoted prices in active markets for identical securities
• Level 2 – prices determined using other significant observable inputs (including quoted prices for similar securities, interest rates, prepayment speeds, credit risk and others)
• Level 3 – prices determined using significant unobservable inputs where quoted prices or observable inputs are unavailable or less reliable (including management's own assumptions about the factors market participants would use in pricing an investment)
The inputs or methodology used for valuing securities are not necessarily an indication of the risk associated with investing in those securities.
See accompanying notes to financial statements.
10
Wanger International Select 2011 Annual Report
Wanger International Select
Statement of Investments, December 31, 2011
Examples of the types of securities in which the Fund would typically invest and how they are classified within this hierarchy are as follows. Typical Level 1 securities include exchange traded domestic equities, mutual funds whose NAVs are published each day and exchange traded foreign equities that are not statistically fair valued. Typical Level 2 securities include exchange traded foreign equities that are statistically fair valued, forward foreign currency exchange contracts and short-term investments valued at amortized cost. Additionally, securities fair valued by the Valuation Committee of the Fund's Board of Trustees that rely on significant observable inputs are also included in Level 2. Typical Level 3 securities include any security fair valued by the Fund's Valuation Committee that relies on significant unobservable inputs.
The following table summarizes the inputs used, as of December 31, 2011, in valuing the Fund's assets:
Investment Type | |
Quoted Prices
(Level 1) | | Other
Significant
Observable
Inputs
(Level 2) | |
Significant
Unobservable
Inputs
(Level 3) | |
Total | |
| Equities | |
| Asia | | $ | 269,100 | | | $ | 11,250,334 | | | $ | — | | | $ | 11,519,434 | | |
| Europe | | | 284,875 | | | | 6,372,566 | | | | — | | | | 6,657,441 | | |
| Other Countries | | | 1,279,827 | | | | 2,093,109 | | | | — | | | | 3,372,936 | | |
| Latin America | | | — | | | | 45,232 | | | | 124,625 | | | | 169,857 | | |
| Total Equities | | | 1,833,802 | | | | 19,761,241 | | | | 124,625 | | | | 21,719,668 | | |
Total Securities
Lending Collateral | | | 131,327 | | | | — | | | | — | | | | 131,327 | | |
| Total Investments | | $ | 1,965,129 | | | $ | 19,761,241 | | | $ | 124,625 | | | $ | 21,850,995 | | |
Unrealized Depreciation
on Forward Foreign
Currency Exchange
Contracts | | | — | | | | (66,362 | ) | | | — | | | | (66,362 | ) | |
| Total | | $ | 1,965,129 | | | $ | 19,694,879 | | | $ | 124,625 | | | $ | 21,784,633 | | |
The Fund's assets assigned to the Level 2 input category are generally valued using a market approach, in which a security's value is determined through its correlation to prices and information from observable market transactions for similar or identical assets. Foreign equities are generally valued at the last sales price on the foreign exchange or market on which they trade. The Fund may use a systematic fair valuation model, in accordance with the policy adopted by the Board of Trustees, provided by an independent third party to value securities principally traded in foreign markets in order to adjust for possible stale pricing that may occur between the close of the foreign exchanges and the time for valuation. These models take into account available market data including intraday index, ADR, and ETF movements. Forward foreign currency exchange contracts are valued at the prevailing forward exchange rate of the underlying currencies. Securities acquired via private placement that have a holding period or extended settlement period are valued at a discount to the same shares that are trading freely on the market. These discounts are determined by the adviser's experience with similar securities or situations. Factors may include, but are not limited to, trade volume, shares outstanding and stock price.
The Fund's assets assigned to the Level 3 input category are valued at fair value as determined in good faith under consistently applied procedures established by and under the general supervision of the Board of Trustees. To determine fair value, management will utilize the valuation technique that they deem the most appropriate in the circumstances. Securities for which no market exists are valued based upon the market approach using some unobservable inputs which may include, but are not limited to, projected earnings, available cash, line of business, multiples, and consideration of the prioritization of the equity in a company's capital structure.
There were no significant transfers of financial assets between levels 1 and 2 during the period.
The following table reconciles asset balances for the year ending December 31, 2011, in which significant unobservable inputs (Level 3) were used in determining value:
| Investments in Securities | | Balance as of
December 31,
2010 | | Realized
Gain/(Loss) | | Change in
Unrealized
Appreciation
(Depreciation) | | Purchases | | Sales | | Transfers
into
Level 3 | | Transfers
out of
Level 3 | | Balance as of
December 31,
2011 | |
| Equities | |
| Latin America | | $ | 150,000 | | | $ | — | | | $ | (25,375 | ) | | $ | — | | | $ | — | | | $ | — | | | $ | — | | | $ | 124,625 | | |
The information in the above reconciliation table represents fiscal year to date activity for any securities identified as using Level 3 inputs at either the beginning or the end of the current fiscal period.
The change in unrealized depreciation attributed to securities owned at December 31, 2011, which were valued using significant unobservable inputs (Level 3) amounted to $(25,375).
See accompanying notes to financial statements.
11
Wanger International Select 2011 Annual Report
Wanger International Select
Portfolio Diversification December 31, 2011
At December 31, 2011, the Fund's portfolio investments as a percentage of net assets were diversified as follows:
| | | Value | | Percentage of
Net Assets | |
| Information | |
| Mobile Communications | | $ | 1,773,899 | | | | 7.4 | | |
| Internet Related | | | 1,186,201 | | | | 4.9 | | |
| Business Software | | | 653,943 | | | | 2.7 | | |
| Financial Processors | | | 721,749 | | | | 3.0 | | |
| CATV | | | 607,324 | | | | 2.5 | | |
| Gaming Equipment & Services | | | 422,828 | | | | 1.8 | | |
| Computer Hardware & Related Equipment | | | 255,500 | | | | 1.1 | | |
| | | | 5,621,444 | | | | 23.4 | | |
| Industrial Goods & Services | |
| Industrial Materials & Specialty Chemicals | | | 1,887,305 | | | | 7.9 | | |
| Machinery | | | 1,437,837 | | | | 6.0 | | |
| Other Industrial Services | | | 1,233,127 | | | | 5.1 | | |
| Electrical Components | | | 372,627 | | | | 1.5 | | |
| Outsourcing Services | | | 353,338 | | | | 1.5 | | |
| Construction | | | 275,270 | | | | 1.1 | | |
| | | | 5,559,504 | | | | 23.1 | | |
| Other Industries | |
| Real Estate | | | 3,408,090 | | | | 14.2 | | |
| Finance | |
| Insurance | | | 1,367,942 | | | | 5.7 | | |
| Banks | | | 896,271 | | | | 3.7 | | |
| Brokerage & Money Management | | | 279,187 | | | | 1.2 | | |
| | | | 2,543,400 | | | | 10.6 | | |
| | | Value | | Percentage of
Net Assets | |
| Energy & Minerals | |
| Mining | | $ | 1,438,005 | | | | 6.0 | | |
| Oil & Gas Producers | | | 308,392 | | | | 1.3 | | |
| Oil Services | | | 283,504 | | | | 1.2 | | |
| Agricultural Commodities | | | 124,625 | | | | 0.5 | | |
| | | | 2,154,526 | | | | 9.0 | | |
| Consumer Goods & Services | |
| Nondurables | | | 424,126 | | | | 1.8 | | |
| Retail | | | 354,173 | | | | 1.4 | | |
| Food & Beverage | | | 258,981 | | | | 1.1 | | |
| Other Consumer Services | | | 242,010 | | | | 1.0 | | |
| | | | 1,279,290 | | | | 5.3 | | |
| Health Care | |
| Pharmaceuticals | | | 905,746 | | | | 3.8 | | |
| Health Care Services | | | 247,668 | | | | 1.0 | | |
| | | | 1,153,414 | | | | 4.8 | | |
| Total Equities: | | | 21,719,668 | | | | 90.4 | | |
| Securities Lending Collateral: | | | 131,327 | | | | 0.5 | | |
| Total Investments: | | | 21,850,995 | | | | 90.9 | | |
Obligation to Return Collateral
for Securities Loaned: | | | (131,327 | ) | | | (0.5 | ) | |
Cash and Other Assets
Less Liabilities: | | | 2,298,841 | | | | 9.6 | | |
| Net Assets: | | $ | 24,018,509 | | | | 100.0 | % | |
See accompanying notes to financial statements.
12
Wanger International Select 2011 Annual Report
Statement of Assets and Liabilities
December 31, 2011
| Assets: | |
| Investments, at cost | | $ | 19,577,522 | | |
Investments, at value (including
securities on loan of $129,339) | | $ | 21,850,995 | | |
| Cash | | | 2,415,937 | | |
| Receivable for: | |
| Fund shares sold | | | 16,709 | | |
| Securities lending income | | | 57 | | |
| Dividends | | | 17,189 | | |
| Foreign tax reclaims | | | 11,622 | | |
| Expense reimbursement due from investment advisor | | | 599 | | |
| Prepaid expenses | | | 376 | | |
| Total Assets | | | 24,313,484 | | |
| Liabilities: | |
| Collateral on securities loaned | | | 131,327 | | |
Unrealized depreciation on forward foreign
currency exchange contracts | | | 66,362 | | |
| Payable for: | |
| Fund shares repurchased | | | 34,736 | | |
| Investment advisory fee | | | 616 | | |
| Administration fee | | | 33 | | |
| Trustees' fees | | | 7,492 | | |
| Custody fee | | | 16,482 | | |
| Reports to shareholders | | | 8,827 | | |
| Chief compliance officer expenses | | | 77 | | |
| Other liabilities | | | 29,023 | | |
| Total Liabilities | | | 294,975 | | |
| Net Assets | | $ | 24,018,509 | | |
| Composition of Net Assets: | |
| Paid-in capital | | $ | 24,118,363 | | |
| Accumulated net investment loss | | | (351,545 | ) | |
| Accumulated net realized loss | | | (1,954,589 | ) | |
| Net unrealized appreciation (depreciation) on: | |
| Investments | | | 2,273,473 | | |
| Foreign currency translations | | | (831 | ) | |
| Forward foreign currency exchange contracts | | | (66,362 | ) | |
| Net Assets | | $ | 24,018,509 | | |
| Fund Shares Outstanding | | | 1,461,217 | | |
Net asset value, offering price and redemption
price per share | | $ | 16.44 | | |
Statement of Operations
For the Year Ended December 31, 2011
| Investment Income: | |
| Dividends (net foreign taxes withheld of $55,644) | | $ | 619,900 | | |
| Interest income | | | 2,401 | | |
| Securities lending income, net | | | 1,071 | | |
| Total Investment Income | | | 623,372 | | |
| Expenses: | |
| Investment advisory fee | | | 269,600 | | |
| Administration fee | | | 14,340 | | |
| Transfer agent fee | | | 167 | | |
| Trustees' fees | | | 1,623 | | |
| Custody fee | | | 54,174 | | |
| Reports to shareholders | | | 29,669 | | |
| Professional fees | | | 35,941 | | |
| Chief compliance officer expenses (See Note 4) | | | 1,154 | | |
| Other expenses (See Note 5) | | | 11,710 | | |
| Total Expenses | | | 418,378 | | |
| Advisory fee waiver (See Note 4) | | | (15,651 | ) | |
| Custody earnings credit | | | (7 | ) | |
| Net Expenses | | | 402,720 | | |
| Net Investment Income | | | 220,652 | | |
Net Realized and Unrealized Gain (Loss)
on Investments: | |
| Net realized gain (loss) on: | |
| Investments | | | 3,494,930 | | |
| Foreign currency transactions | | | (69,494 | ) | |
| Forward foreign currency exchange contracts | | | 94,951 | | |
| Net realized gain | | | 3,520,387 | | |
Net change in unrealized appreciation
(depreciation) on: | |
| Investments | | | (6,475,520 | ) | |
| Foreign currency translations | | | (1,738 | ) | |
| Forward foreign currency exchange contracts | | | (66,362 | ) | |
| Net change in unrealized depreciation | | | (6,543,620 | ) | |
| Net Loss | | | (3,023,233 | ) | |
| Net Decrease in Net Assets from Operations | | $ | (2,802,581 | ) | |
See accompanying notes to financial statements.
13
Wanger International Select 2011 Annual Report
Statement of Changes in Net Assets
| | | Year Ended December 31, | |
| Increase (Decrease) in Net Assets | | 2011 | | 2010 | |
| Operations: | |
| Net investment income | | $ | 220,652 | | | $ | 168,390 | | |
| Net realized gain (loss) on: | |
| Investments | | | 3,494,930 | | | | 3,639,153 | | |
| Foreign currency transactions | | | (69,494 | ) | | | (1,282 | ) | |
| Forward foreign currency exchange contracts | | | 94,951 | | | | — | | |
| Net change in unrealized appreciation (depreciation) on: | |
| Investments | | | (6,475,520 | ) | | | 2,081,860 | | |
| Foreign currency translations | | | (1,738 | ) | | | 1,629 | | |
| Forward foreign currency exchange contracts | | | (66,362 | ) | | | — | | |
| Net Increase (Decrease) in Net Assets from Operations | | | (2,802,581 | ) | | | 5,889,750 | | |
| Distributions to Shareholders: | |
| From net investment income | | | (419,969 | ) | | | (385,292 | ) | |
| Share Transactions: | |
| Subscriptions | | | 1,422,889 | | | | 2,051,847 | | |
| Distributions reinvested | | | 419,969 | | | | 385,292 | | |
| Redemptions | | | (6,270,862 | ) | | | (7,726,656 | ) | |
| Net Decrease from Share Transactions | | | (4,428,004 | ) | | | (5,289,517 | ) | |
| Total Increase (Decrease) in Net Assets | | | (7,650,554 | ) | | | 214,941 | | |
| Net Assets: | |
| Beginning of period | | | 31,669,063 | | | | 31,454,122 | | |
| End of period | | $ | 24,018,509 | | | $ | 31,669,063 | | |
| Accumulated net investment loss | | $ | (351,545 | ) | | $ | (279,305 | ) | |
See accompanying notes to financial statements.
14
Wanger International Select 2011 Annual Report
Financial Highlights
| | | Year Ended December 31, | |
| Selected data for a share outstanding throughout each period | | 2011 | | 2010 | | 2009 | | 2008 | | 2007 | |
| Net Asset Value, Beginning of Period | | $ | 18.57 | | | $ | 15.42 | | | $ | 12.01 | | | $ | 28.07 | | | $ | 26.62 | | |
| Income from Investment Operations: | |
| Net investment income (a) | | | 0.14 | | | | 0.09 | | | | 0.10 | | | | 0.21 | | | | 0.10 | | |
Net realized and unrealized gain (loss) on
investments and foreign currency | | | (1.99 | ) | | | 3.28 | | | | 3.71 | | | | (10.31 | ) | | | 4.92 | | |
| Total from Investment Operations | | | (1.85 | ) | | | 3.37 | | | | 3.81 | | | | (10.10 | ) | | | 5.02 | | |
| Less Distributions to Shareholders: | |
| From net investment income | | | (0.28 | ) | | | (0.22 | ) | | | (0.40 | ) | | | (0.09 | ) | | | (0.21 | ) | |
| From net realized gains | | | — | | | | — | | | | — | | | | (5.87 | ) | | | (3.36 | ) | |
| Total Distributions to Shareholders | | | (0.28 | ) | | | (0.22 | ) | | | (0.40 | ) | | | (5.96 | ) | | | (3.57 | ) | |
| Net Asset Value, End of Period | | $ | 16.44 | | | $ | 18.57 | | | $ | 15.42 | | | $ | 12.01 | | | $ | 28.07 | | |
| Total Return (b) | | | (10.11 | )%(c) | | | 22.09 | % | | | 32.92 | %(c) | | | (44.35 | )% | | | 21.78 | % | |
| Ratios to Average Net Assets/Supplemental Data: | |
| Net expenses (d) | | | 1.40 | % | | | 1.38 | % | | | 1.45 | % | | | 1.24 | % | | | 1.18 | % | |
| Net investment income (d) | | | 0.77 | % | | | 0.57 | % | | | 0.75 | % | | | 1.10 | % | | | 0.37 | % | |
| Waiver/Reimbursement | | | 0.05 | % | | | — | | | | 0.04 | % | | | — | | | | — | | |
| Portfolio turnover rate | | | 44 | % | | | 37 | % | | | 62 | % | | | 68 | % | | | 69 | % | |
| Net assets, end of period (000s) | | $ | 24,019 | | | $ | 31,669 | | | $ | 31,454 | | | $ | 29,604 | | | $ | 73,485 | | |
(a) Net investment income per share was based upon the average shares outstanding during the period.
(b) Total return at net asset value assuming all distributions reinvested.
(c) Had the investment adviser and/or its affiliates not waived a portion of expenses, total return would have been reduced.
(d) The benefits derived from custody fees paid indirectly had an impact of less than 0.01%.
See accompanying notes to financial statements.
15
Wanger International Select 2011 Annual Report
Notes to Financial Statements
1. Nature of Operations
Wanger International Select (the Fund), is a series of Wanger Advisors Trust (the Trust), an open-end management investment company organized as a Massachusetts business trust. The investment objective of the Fund is to seek long-term capital appreciation. The Fund is available only for allocation to certain life insurance company separate accounts established for the purpose of funding qualified and nonqualified variable annuity contracts and variable life insurance policies and may also be offered directly to certain types of pension plans and retirement arrangements.
2. Significant Accounting Policies
The preparation of financial statements in accordance with accounting principles generally accepted in the United States of America (GAAP) requires management to make certain estimates and assumptions that affect the reported amounts of assets and liabilities, the disclosure of contingent assets and liabilities at the date of the financial statements and the reported amounts of revenue and expenses during the reporting period. Actual results could differ from those estimates.
Security valuation
Securities of the Fund are valued at market value or, if a market quotation for a security is not readily available or is deemed not to be reliable because of events or circumstances that have occurred between the market quotation and the time as of which the security is to be valued, the security is valued at its fair value determined in good faith under consistently applied procedures established by the Board of Trustees. A security traded on a securities exchange or in an over-the-counter market in which transaction prices are reported is valued at the last sales price at the time of valuation. A security traded principally on NASDAQ is valued at the NASDAQ official closing price. Mutual Funds and Exchange Traded Funds are valued at their closing net asset value as reported to NASDAQ. A security for which there is no reported sale on the valuation date is valued at the latest bid quotation.
Short-term investments maturing in 60 days or less are valued at amortized cost, which approximates market value.
Forward foreign currency exchange contracts are marked-to-market based upon foreign currency exchange rates provided by a pricing service.
A security for which a market quotation is not readily available and any other assets are valued at their fair value determined in good faith under consistently applied procedures established by the Board of Trustees. The Trust has retained an independent statistical fair value pricing service that employs a systematic methodology to assist in the fair valuation process for securities principally traded in a foreign market in order to adjust for possible changes in value that may occur between the close of the foreign market and the time as of which the securities are to be valued. If a security is valued at a fair value, that value may be different from the last quoted market price for the security. A security for which there is no reported sale on the valuation date is valued at the latest bid quotations.
Foreign currency translations
Values of investments denominated in foreign currencies are converted into U.S. dollars using the New York spot market rate of exchange at the time of valuation. Purchases and sales of investments and dividend and interest income are translated into U.S. dollars using the spot market rate of exchange prevailing on the respective dates of such transactions. The gain or loss resulting from changes in foreign exchange rates is included with net realized and unrealized gain or loss from investments, as appropriate.
Repurchase agreements
The Fund may engage in repurchase agreement transactions. The Fund, through its custodian, receives delivery of underlying securities collateralizing each repurchase agreement. The counterparty is required to maintain collateral that is at all times at least equal to the repurchase price including interest. In the event of default or bankruptcy by the other party to the agreement, realization and/or retention of the collateral may be subject to legal proceedings.
Restricted securities
Restricted securities are securities that may only be resold upon registration under federal securities laws or in transactions exempt from registration. In some cases, the issuer of restricted securities has agreed to register such securities for resale at the issuer's expense either upon demand by the Fund or in connection with another registered offering of the securities. Many restricted securities may be resold in the secondary market in transactions exempt from registration. Such restricted securities may be determined to be liquid under criteria established by the Board of Trustees.
Derivative instruments
The Fund invests in certain derivative instruments as detailed below to meet its investment objectives. Derivatives are instruments whose values depend on, or are derived from, in whole or in part, the value of one or more other assets, such as securities, currencies, commodities or indices. Derivative instruments may be used to maintain cash reserves while maintaining exposure to certain other assets, to offset anticipated declines in values of investments, to facilitate trading, to reduce transaction costs and to pursue higher investment returns. The Fund may also use derivative instruments to mitigate certain investment risks, such as foreign currency exchange rate risk, interest rate risk and credit risk. Derivatives may involve various risks, including the potential inability of the counterparty to fulfill its obligation under the terms of the contract, the potential for an illiquid secondary market and the potential for market movements, which may expose the Fund to gains or losses in excess of the amount shown in the Statement of Assets and Liabilities.
Forward foreign currency exchange contracts
Forward foreign currency exchange contracts are agreements between two parties to buy and sell a currency at a set price on a future date. The Fund utilized forward foreign currency exchange contracts to shift investment exposure from one currency to another or to recover an underweight country exposure in its portfolio.
The values of forward foreign currency exchange contracts fluctuate with changes in foreign currency exchange rates. The Fund will record a realized gain or loss when the forward foreign currency exchange contract is closed.
The use of forward foreign currency exchange contracts does not eliminate fluctuations in the prices of the Fund's portfolio securities. The risks of forward foreign currency exchange contracts include movement in the values of the foreign currencies relative to the U.S. dollar (or other foreign currencies) and the possibility that counterparties will not complete their contractual obligations, which may be in excess of the amount reflected, if any, in the Statement of Assets and Liabilities.
Effects of derivative transactions in the financial statements
The following tables are intended to provide additional information about the effect of derivatives on the financial statements of the Fund including: the fair value of derivatives by risk category and the location of those fair values in the Statement of Assets and Liabilities; the impact of derivative transactions on the Fund's operations over the period including realized gains or losses and unrealized gains or losses. The derivative schedules following the Portfolio of Investments present additional information regarding derivative instruments outstanding at the end of the period, if any.
During the year ended December 31, 2011, the Fund entered into four forward foreign currency exchange contracts.
16
Wanger International Select 2011 Annual Report
Notes to Financial Statements, continued
The following table is a summary of the value of the Fund's derivative Instruments as of December 31, 2011.
Fair Value of Derivative Instruments
| Asset | | Liability | |
Statement of Assets
and Liabilities | | Fair
Value | | Statement of Assets
and Liabilities | | Fair
Value | |
Unrealized appreciation
on forward foreign
currency exchange
contracts | | $ | — | | | Unrealized depreciation
on forward foreign
currency exchange
contracts | | $ | 66,362 | | |
The effect of derivative instruments on the Fund's Statement of Operations for the year ended December 31, 2011 was as follows:
Amount of Realized Gain or (Loss) and Change in Unrealized Appreciation or (Depreciation) on Derivatives Recognized in Income
| | | Risk
Exposure | | Realized
Gain (Loss) | | Change in
Unrealized
Appreciation
(Depreciation) | |
Forward Foreign Currency
Exchange Contracts | | Foreign
Exchange
Rate Risk | | $ | 94,951
| | | $ | (66,362
| ) | |
Security transactions and investment income
Security transactions are accounted for on the trade date (date the order to buy or sell is executed) and dividend income is recorded on the ex-dividend date, except that certain dividends from foreign securities are recorded as soon as the information is available to the Fund. Interest income is recorded on the accrual basis and includes amortization of discounts on debt obligations when required for federal income tax purposes. Realized gains and losses from security transactions are recorded on an identified cost basis.
Awards, if any, from class action litigation related to securities owned may be recorded as a reduction of cost of those securities. If the applicable securities are no longer owned, the proceeds are recorded as realized gains.
Expenses
General expenses of the Trust are allocated to the Fund and the other series of the Trust based upon relative net assets or other expense allocation methodologies determined by the nature of the expense. Expenses directly attributable to the Fund are charged to the Fund.
Fund share valuation
Fund shares are sold and redeemed on a continuing basis at net asset value. Net asset value per share is determined daily as of the close of trading on the New York Stock Exchange (the Exchange) on each day the Exchange is open for trading by dividing the total value of the Fund's investments and other assets, less liabilities, by the number of Fund shares outstanding.
Securities lending
The Fund may lend securities up to one-third of the value of its total assets to certain approved brokers, dealers and other financial institutions to earn additional income. The Fund retains the benefits of owning the securities, including receipt of dividends or interest generated by the security. The Fund also receives a fee for the loan. The Fund has the ability to recall the loans at any time and could do so in order to vote proxies or to sell the loaned securities. Each loan is collateralized by cash that exceeded the value of the securities on loan. The market value of the loaned securities is determined daily at the close of business of the Fund and any additional required collateral is delivered to each Fund on the next business day. The Fund has elected to invest the cash collateral in the Dreyfus Government Cash Management Fund, and the income earned is paid to the Fund, net of any fees remitted to Goldman Sachs Agency Lending, the Fund's lending agent, and borrower rebates. The Fund's adviser, Columbia Wanger Asset Management, LLC (CWAM), does not retain any fees earned by the lending program. Generally, in the event of borrower default, the Fund has the right to use the collateral to offset any losses incurred. In the event the Fund is delayed or prevented from exercising its right to dispose of the collateral, there may be a potential loss to the Fund. Some of these losses may be indemnified by the lending agent. The Fund bears the risk of loss with respect to the investment of collateral.
The net lending income earned by the Fund as of December 31, 2011, is included in the Statement of Operations.
Custody fees/Credits
Custody fees are reduced based on the Fund's cash balances maintained with the custodian. The amount is disclosed as a reduction of total expenses in the Statement of Operations.
Federal income taxes
The Fund has complied with the provisions of the Internal Revenue Code available to regulated investment companies and, in the manner provided therein, distributes substantially all its taxable income, as well as any net realized gain on sales of investments and foreign currency transactions reportable for federal income tax purposes. Accordingly, the Fund paid no federal income taxes and no federal income tax provision was required.
Foreign capital gains taxes
Gains in certain countries may be subject to foreign taxes at the fund level. The Fund accrues for such foreign taxes on net realized and unrealized gains at the appropriate rate for each jurisdiction.
Distributions to shareholders
Distributions to shareholders are recorded on the ex-dividend date.
Indemnification
In the normal course of business, the Trust on behalf of the Fund enters into contracts that contain a variety of representations and warranties and that provide general indemnities. The Fund's maximum exposure under these arrangements is unknown, as this would involve future claims against the Fund. Also under the Trust's organizational documents, the trustees and officers of the Trust are indemnified against certain liabilities that may arise out of their duties to the Trust. However based on experience, the Fund expects the risk of loss due to these warranties and indemnities to be remote.
Recent Accounting Pronouncement
Fair Value Measurements and Disclosures
In May 2011, the Financial Accounting and Standards Board issued (FASB) ASU No. 2011-04 modifying Topic 820, Fair Value Measurements and Disclosures. At the same time, the International Accounting Standards Board (IASB) issued International Financial Reporting Standard 13, Fair Value Measurement. The objective of the FASB and IASB is convergence of their guidance on fair value measurements and disclosures.
Specifically, ASU No. 2011-04 requires reporting entities to disclose i) the amounts of any transfers between Level 1 and Level 2, and the reasons for the transfers, ii) for Level 3 fair value measurements, a) quantitative information about significant unobservable inputs used, b) a description of the valuation processes used by the reporting entity and c) a narrative description of the sensitivity of the fair value measurement to changes in unobservable inputs if a change in those inputs might result in a significantly higher or lower fair value measurement. The effective date of ASU No. 2011-04 is for interim and annual periods beginning after December 15, 2011. At this time, management is evaluating the implications of this guidance and the impact it will have on the financial statement amounts and footnote disclosures, if any.
17
Wanger International Select 2011 Annual Report
Notes to Financial Statements, continued
3. Federal Tax Information
The timing and character of income and capital gain distributions are determined in accordance with income tax regulations, which may differ from GAAP. Reclassifications are made to the Fund's capital accounts for permanent tax differences to reflect income and gains available for distribution (or available capital loss carryforwards) under income tax regulations.
For the year ended December 31, 2011, permanent book and tax basis differences resulting primarily from passive foreign investment company (PFIC) holdings,and foreign currency transactions were identified and reclassified among the components of the Fund's net assets as follows:
Accumulated
Net Investment
Income | | Accumulated
Net Realized
Gain (Loss) | | Paid-In Capital | |
| $ | 127,077 | | | $ | (127,077 | ) | | $ | — | | |
Net investment income and net realized gains (losses), as disclosed on the Statement of Operations, and net assets were not affected by this reclassification.
The tax character of distributions paid during the years ended December 31, 2011 and December 31, 2010 were as follows:
| | | December 31, 2011 | | December 31, 2010 | |
| Ordinary Income* | | $ | 419,969 | | | $ | 385,292 | | |
* For tax purposes short-term capital gain distributions, if any, are considered ordinary income distributions.
As of December 31, 2011, the components of distributable earnings on a tax basis were as follows:
Undistributed
Ordinary Income | | Undistributed
Long-Term
Capital Gains | | Net Unrealized
Appreciation
(Depreciation)* | |
| $ | — | | | $ | — | | | $ | 1,913,340 | | |
* The differences between book-basis and tax-basis net unrealized appreciation/depreciation are primarily due to deferral of losses from wash sales and passive foreign investment company (PFIC) adjustments.
The following capital loss carryforward, determined as of December 31, 2011, may be available to reduce taxable income arising from future net realized gains on investments, if any, to the extent permitted by the Internal Revenue Code:
Year of
Expiration | | Amount | |
| | 2017 | | | $ | 1,870,723 | | |
Capital loss carryforwards that were utilized for the Fund during the year ended December 31, 2011, were $3,336,023.
Under current tax rules, regulated investment companies can elect to treat certain late-year ordinary losses incurred and post-October capital losses (capital losses realized after October 31) as arising on the first day of the following taxable year. As of December 31, 2011, the Fund will elect to treat late-year ordinary losses of $134,279 as arising on January 1, 2012.
On December 22, 2010, the Regulated Investment Company Modernization Act of 2010 (the Act) was enacted, which changed various technical rules governing the tax treatment of regulated investment companies. The changes are generally effective for taxable years beginning after the date of enactment. Under the Act, the Fund will be permitted to carry forward capital losses incurred in taxable years beginning after the date of enactment for an unlimited period. However, any losses incurred during those future taxable years will be required to be utilized prior to the losses incurred in pre-enactment taxable years, which carry an expiration date. As a result of this ordering rule, pre-enactment capital loss carryforwards may be more likely to expire unused.
Management is required to determine whether a tax position of the Fund is more likely than not to be sustained upon examination by the applicable taxing authority, including resolution of any related appeals or litigation processes, based on the technical merits of the position. The tax benefit to be recognized by the Fund is measured as the largest amount of benefit that is greater than fifty percent likely of being realized upon ultimate settlement. Management is not aware of any tax positions for which it is reasonably possible that the total amounts of unrecognized tax benefits will significantly change in the next twelve months. However, management's conclusions may be subject to review and adjustment at a later date based on factors including, but not limited to, new tax laws, regulations, and administrative interpretations (including relevant court decisions). The Fund's federal tax returns for the prior three fiscal years remain subject to examination by the Internal Revenue Service.
4. Transactions With Affiliates
CWAM is a wholly owned subsidiary of Columbia Management Investment Advisers, LLC (Columbia Management), which in turn is a wholly owned subsidiary of Ameriprise Financial, Inc. (Ameriprise Financial). CWAM furnishes continuing investment supervision to the Fund and is responsible for the overall management of the Fund's business affairs.
CWAM receives a monthly advisory fee based on the Fund's average daily net assets at the following annual rates:
| Average Daily Net Assets | | Annual Fee Rate | |
| Up to $500 million | | | 0.94 | % | |
| $500 million and over | | | 0.89 | % | |
For the year ended December 31, 2011, the effective investment advisory fee rate was 0.94% of the Fund's average daily net assets.
Through April 30, 2012, CWAM has contractually agreed to reimburse the Fund to the extent that ordinary operating expenses (exclusive of brokerage commissions, interest, taxes and extraordinary expenses, but inclusive of custodian charges relating to overdrafts, if any), after giving effect to any balance credits from the Fund's custodian, exceed an annual percentage of 1.45% of average daily net assets on an annualized basis. The reimbursement to the Fund for the year ended December 31, 2011, was $15,651.
CWAM provides administrative services and receives an administration fee from the Fund at the following annual rates:
Wanger Advisors Trust Aggregate
Average Daily Net Assets of the Trust | | Annual Fee Rate | |
| Up $4 billion to | | | 0.05 | % | |
| $4 billion to $6 billion | | | 0.04 | % | |
| $6 billion to $8 billion | | | 0.03 | % | |
| $8 billion and over | | | 0.02 | % | |
For the year ended December 31, 2011, the effective administration fee rate was 0.05% of the Fund's average daily net assets. Columbia Management provides certain sub-administrative services to the Fund.
Columbia Management Investment Distributors, Inc. (CMID), a wholly owned subsidiary of Ameriprise Financial, serves as the Fund's distributor and principal underwriter.
Columbia Management Investment Services Corp. (CMIS), a wholly owned subsidiary of Ameriprise Financial, is the transfer agent of the Funds. For its services, the Fund pays CMIS a monthly fee at the annual rate of $21.00 per open account. CMIS also receives reimbursement from the Fund for certain out-of-pocket expenses.
Certain officers and trustees of the Trust are also officers of CWAM. The Trust makes no direct payments to its officers and trustees who are affiliated with CWAM.
The Board of Trustees has appointed a Chief Compliance Officer of the Trust in accordance with federal securities regulations. The Fund, along with other affiliated funds, pays its pro-rata share of the expenses associated with the Office of the Chief Compliance Officer. These expenses are disclosed separately as "Chief compliance officer expenses" in the Statement of Operations.
18
Wanger International Select 2011 Annual Report
Notes to Financial Statements, continued
The Trust offers a deferred compensation plan for its independent trustees. Under that plan, a trustee may elect to defer all or a portion of his or her compensation. Amounts deferred are retained by the Trust and may represent an unfunded obligation of the Trust. The value of amounts deferred is determined by reference to the change in value of Class Z shares of one or more series of Columbia Acorn Trust or a money market fund as specified by the trustee. Benefits under the deferred compensation plan are payable in accordance with the plan.
During the year ended December 31, 2011, the Fund engaged in purchase and sales transactions with funds that have a common investment adviser (or affiliated investment advisers), common directors/trustees, and/or common officers. Those purchase and sale transactions complied with provisions of Rule 17a-7 under the Investment Company Act of 1940 and were $14,779 and $-, respectively.
5. Borrowing Arrangements
Effective July 22, 2011, the Trust participates in a $150 million credit facility with JPMorgan Chase Bank, N.A., along with another Trust managed by CWAM, which was entered into to facilitate portfolio liquidity. Under the facility, interest is charged to each participating Fund based on its borrowings at a rate per annum equal to the higher of Federal Funds Rate or Overnight LIBOR plus 1.25%. In addition, a commitment fee of 0.10% per annum of the unutilized line of credit is accrued and apportioned among the participating Funds based on their relative net assets. The commitment fee is included in "Other expenses" in the Statement of Operations. The Trust enters into this line of credit for one year durations.
Prior to July 22, 2011, the Trust participated in a $150 million credit facility with State Street Bank and Trust Company (State Street) under similar lending terms. The commitment fee under the State Street arrangement was 0.125% per annum of the unutilized line of credit.
No amounts were borrowed by the Fund under either facility during the year ended December 31, 2011.
6. Fund Share Transactions
Proceeds and payments on Fund shares as shown in the Statement of Changes in Net Assets are in respect of the following numbers of shares:
| | | Year ended
December 31, 2011 | | Year Ended
December 31, 2010 | |
| Shares sold | | | 76,620 | | | | 125,113 | | |
Shares issued in reinvestment
of dividend distributions | | | 23,263 | | | | 24,723 | | |
| Less shares redeemed | | | (344,326 | ) | | | (483,784 | ) | |
| Net decrease in shares outstanding | | | (244,443 | ) | | | (333,948 | ) | |
7. Investment Transactions
The aggregate cost of purchases and proceeds from sales other than short-term obligations for the year ended December 31, 2011, were $11,751,781 and $17,373,113, respectively.
8. Shareholder Concentration
At December 31, 2011, two unaffiliated shareholder accounts owned 92.4% of the outstanding shares of the Fund. The Fund has no knowledge about whether any portion of those shares was owned beneficially. Subscription and redemption activity of these accounts may have a significant effect on the operations of the Fund.
9. Subsequent Events
Management has evaluated the events and transactions that have occurred through the date the financial statements were issued and noted no items requiring adjustment of the financial statements or additional disclosure.
10. Information Regarding Pending and Settled Legal Proceedings
In June 2004, an action captioned John E. Gallus et al. v. American Express Financial Corp. and American Express Financial Advisors Inc. was filed in the United States District Court for the District of Arizona. The plaintiffs allege that they are investors in several American Express Company mutual funds (branded as Columbia) and they purport to bring the action derivatively on behalf of those funds under the Investment Company Act of 1940. The plaintiffs allege that fees allegedly paid to the defendants by the funds for investment advisory and administrative services are excessive. The plaintiffs seek remedies including restitution and rescission of investment advisory and distribution agreements. The plaintiffs voluntarily agreed to transfer this case to the United States District Court for the District of Minnesota (the District Court). In response to defendants' motion to dismiss the complaint, the District Court dismissed one of plaintiffs' four claims and granted plaintiffs limited discovery. Defendants moved for summary judgment in April 2007. Summary judgment was granted in the defendants' favor on July 9, 2007. The plaintiffs filed a notice of appeal with the Eighth Circuit Court of Appeals (the Eighth Circuit) on August 8, 2007. On April 8, 2009, the Eighth Circuit reversed summary judgment and remanded to the District Court for further proceedings. On August 6, 2009, defendants filed a writ of certiorari with the U.S. Supreme Court (the Supreme Court), asking the Supreme Court to stay the District Court proceedings while the Supreme Court considers and rules in a case captioned Jones v. Harris Associates, which involves issues of law similar to those presented in the Gallus case. On March 30, 2010, the Supreme Court issued its ruling in Jones v. Harris Associates, and on April 5, 2010, the Supreme Court vacated the Eighth Circuit's decision in the Gallus case and remanded the case to the Eighth Circuit for further consideration in light of the Supreme Court's decision in Jones v. Harris Associates. On June 4, 2010, the Eighth Circuit remanded the Gallus case to the District Court for further consideration in light of the Supreme Court's decision in Jones v. Harris Associates. On December 9, 2010, the District Court reinstated its July 9, 2007 summary judgment order in favor of the defendants. On January 10, 2011, plaintiffs filed a notice of appeal with the Eighth Circuit. In response to the plaintiffs' opening appellate brief filed on March 18, 2011, the defendants filed a response brief on May 4, 2011 with the Eighth Circuit. The plaintiffs filed a reply brief on May 26, 2011 and oral arguments took place on November 17, 2011.
In December 2005, without admitting or denying the allegations, American Express Financial Corporation (AEFC, which is now known as Ameriprise Financial, Inc. (Ameriprise Financial)), entered into settlement agreements with the Securities and Exchange Commission (SEC) and Minnesota Department of Commerce (MDOC) related to market timing activities. As a result, AEFC was censured and ordered to cease and desist from committing or causing any violations of certain provisions of the Investment Advisers Act of 1940, the Investment Company Act of 1940, and various Minnesota laws. AEFC agreed to pay disgorgement of $10 million and civil money penalties of $7 million. AEFC also agreed to retain an independent distribution consultant to assist in developing a plan for distribution of all disgorgement and civil penalties ordered by the SEC in accordance with various undertakings detailed at www.sec.gov/litigation/admin/ia-2451.pdf. Ameriprise Financial and its affiliates have cooperated with the SEC and the MDOC in these legal proceedings, and have made regular reports to the funds' Boards of Trustees.
Ameriprise Financial and certain of its affiliates have historically been involved in a number of legal, arbitration and regulatory proceedings, including routine litigation, class actions, and governmental actions, concerning matters arising in connection with the conduct of their business activities. Ameriprise Financial believes that the Funds are not currently the subject of, and that neither Ameriprise Financial nor any of its affiliates are the subject of, any pending legal, arbitration or regulatory proceedings that are likely to have a material adverse effect on the Funds or the ability of Ameriprise Financial or its affiliates to perform under their contracts with the Funds. Ameriprise Financial is required to make 10-Q, 10-K and, as necessary, 8-K filings with the Securities and Exchange Commission on legal and regulatory matters that relate to Ameriprise Financial and its affiliates. Copies of these filings may be obtained by accessing the SEC website at www.sec.gov.
There can be no assurance that these matters, or the adverse publicity associated with them, will not result in increased fund redemptions, reduced sale of fund shares or other adverse consequences to the Funds. Further, although we believe proceedings are not likely to have a material adverse effect on the Funds or the ability of Ameriprise Financial or its affiliates to perform under their contracts with the Funds, these proceedings are subject to uncertainties and, as such, we are unable to estimate the possible loss or range of loss that may result. An adverse outcome in one or more of these proceedings could result in adverse judgments, settlements, fines, penalties or other relief that could have a material adverse effect on the consolidated financial condition or results of operations of Ameriprise Financial.
19
Wanger International Select 2011 Annual Report
Report of Independent Registered Public Accounting Firm
To the Board of Trustees and Shareholders of Wanger International Select:
In our opinion, the accompanying statement of assets and liabilities, including the statement of investments, and the related statements of operations and of changes in net assets and the financial highlights present fairly, in all material respects, the financial position of Wanger International Select (a series of the Wanger Advisers Trust, hereinafter referred to as the "Fund") at December 31, 2011, the results of its operations for the year then ended, the changes in its net assets for each of the two years in the period then ended and the financial highlights for each of the five years in the period then ended, in conformity with accounting principles generally accepted in the United States of America. These financial statements and financial highlights (hereafter referred to as "financial statements") are the responsibility of the Fund's management; our responsibility is to express an opinion on these financial statements based on our audits. We conducted our audits of these financial statements in accordance with the standards of the Public Company Accounting Oversight Board (United States). Those standards require that we plan and perform the audit to obtain reasonable assurance about whether the financial statements are free of material misstatement. An audit includes examining, on a test basis, evidence supporting the amounts and disclosures in the financial statements, assessing the accounting principles used and significant estimates made by management, and evaluating the overall financial statement presentation. We believe that our audits, which included confirmation of securities at December 31, 2011 by correspondence with the custodian and brokers, provide a reasonable basis for our opinion.
PricewaterhouseCoopers LLP
Chicago, Illinois
February 17, 2012
20
Wanger International Select 2011 Annual Report
Federal Income Tax Information (Unaudited)
Foreign taxes paid during the fiscal year ended December 31, 2011 of $37,377 are expected to be passed through to shareholders. This represents $0.03 per share. Eligible shareholders may claim this amount as a foreign tax credit.
Gross income derived from sources within foreign countries was $656,847 ($0.45 per share) for the fiscal year ended December 31, 2011.
1.18% of the ordinary income distributed by the Fund for the fiscal year ended December 31, 2011, qualified for the corporate dividends received deduction.
21
Wanger International Select 2011 Annual Report
Board of Trustees and Management of Wanger Advisors Trust
Each trustee may serve a term of unlimited duration. The Trust's By-laws generally require that a trustee retire at the end of the calendar year in which the trustee attains the age of 75 years. The trustees appoint their own successors, provided that at least two-thirds of the trustees, after such appointment, have been elected by shareholders. Shareholders may remove a trustee, with or without cause, upon the vote of two-thirds of the Trust's outstanding shares at any meeting called for that purpose. A trustee may be removed, with or without cause, upon the vote of a majority of the trustees. The names of the trustees and officers of the Trust, the date each was first elected or appointed to office, their principal business occupations during at least the last five years, number of portfolios in the fund complex they oversee, and other directorships they hold, are shown below. Each trustee serves in such capacity for each of the four series of Wanger Advisors Trust and for each of the eight series of Columbia Acorn Trust.
The address for the trustees and officers of the Trust is Columbia Wanger Asset Management, LLC, 227 West Monroe Street, Suite 3000, Chicago, Illinois 60606. The Funds' Statement of Additional Information includes additional information about the Funds' trustees and officers. You may obtain a free copy of the Statement of Additional Information by writing or calling toll-free:
Columbia Wanger Asset Management, LLC
Shareholder Services Group
227 W. Monroe, Suite 3000
Chicago IL 60606
1-800-922-6769
Name, Position(s) with
Wanger Advisors Trust
and Age at
December 31, 2011 | | Year First
Elected or
Appointed
to Office* | | Principal Occupation(s) during
Past Five Years | | Number of
Portfolios in
Fund Complex
Overseen by
Trustee/Officer | | Other
Directorships
in addition to
Wanger Advisors Trust | |
| Trustees who are not interested persons of Wanger Advisors Trust: | | | | | | | |
|
Laura M. Born, 46,
Trustee and Chair | | | 2007 | | | Adjunct Assistant Professor of Finance, University of Chicago Booth School of Business; formerly, Managing Director – Investment Banking, JP Morgan Chase & Co. (broker/dealer) 2002-2007; prior thereto, associated with JP Morgan as an investment professional since 1991. | | | 12 | | | Columbia Acorn Trust | |
|
Michelle L. Collins, 51,
Trustee | | | 2008 | | | President, Cambium LLC (financial and business advisory firm) since 2007; Advisory Board Member, Svoboda Capital Partners LLC (private equity firm) since 2007; Managing Director Svoboda Capital Partners LLC, 1998-2006. | | | 12 | | | Columbia Acorn Trust; Bucyrus International, Inc. (mining equipment manufacturer); Molex, Inc. (electronics components manufacturer); CDW Corporation (electronics components manufacturer) until October 2007. | |
|
Maureen M. Culhane, 63,
Trustee | | | 2007 | | | Retired. Formerly, Vice President, Goldman Sachs Asset Management, L.P. (investment adviser), 2005-2007, and Vice President (Consultant) — Strategic Relationship Management, Goldman Sachs & Co., 1999-2005. | | | 12 | | | Columbia Acorn Trust | |
|
Margaret M. Eisen, 58,
Trustee | | | 2002 | | | Chief Investment Officer, EAM International LLC (corporate finance and asset management) since 2003; Managing Director, CFA Institute, 2005-2008. | | | 12 | | | Columbia Acorn Trust; Antigenics, Inc. (biotechnology and pharmaceuticals) until June 2009. | |
|
John C. Heaton, 52,
Trustee | | | 2010 | | | Joseph L. Gidwitz Professor of Finance, University of Chicago Booth School of Business; James H. Lorie Professor of Finance, University of Chicago Booth School of Business, July 2000 – July 2006; financial consultant since 2004. | | | | Columbia Acorn Trust | |
|
Steven N. Kaplan, 52,
Trustee and Vice Chair | | | 1999 | | | Neubauer Family Professor of Entrepreneurship and Finance, University of Chicago Booth School of Business; faculty member of the University of Chicago Booth School of Business since 1998. | | | 12 | | | Columbia Acorn Trust; Accretive Health, Inc. (healthcare management services provider); Morningstar, Inc. (provider of independent investment research). | |
|
22
Wanger International Select 2011 Annual Report
Board of Trustees and Management of Wanger Advisors Trust
Name, Position(s) with
Wanger Advisors Trust
and Age at
December 31, 2011 | | Year First
Elected or
Appointed
to Office* | | Principal Occupation(s) during
Past Five Years | | Number of
Portfolios in
Fund Complex
Overseen by
Trustee/Officer | | Other
Directorships
in addition to
Wanger Advisors Trust | |
| Trustees who are not interested persons of Wanger Advisors Trust: (continued) | | | | | | | |
|
Allan B. Muchin, 75,
Trustee (1) | | | 1998 | | | Chairman Emeritus, Katten Muchin Rosenman LLP (law firm). | | | 12 | | | Columbia Acorn Trust | |
|
David J. Rudis, 58,
Trustee (2) | | | 2010 | | | National Checking and Debit Executive, and Illinois President, Bank of America, 2007 – 2009; President, Consumer Banking Group, LaSalle National Bank, 2004 – 2007. | | | 12 | | | Columbia Acorn Trust | |
|
David B. Small, 55,
Trustee | | | 2010 | | | Managing Director, Grosvenor Capital Management, L.P. (investment adviser) since 1994; Adjunct Associate Professor of Finance, University of Chicago Booth School of Business. | | | 12 | | | Columbia Acorn Trust | |
|
| Trustees who are interested persons of Wanger Advisors Trust: | | | | | | | |
|
Charles P. McQuaid, 58,
Trustee and President (3) | | | 1992 | | | President and Chief Investment Officer, CWAM or its predecessors, since October 2003; associated with CWAM or its predecessors as an investment professional since 1978. | | | 12 | | | Columbia Acorn Trust | |
|
| Trustee Emeritus | | | | | | | |
|
Ralph Wanger, 77,
Trustee Emeritus (4) | | | 1970 | | | Founder, CWAM. Formerly, President, Chief Investment Officer and portfolio manager, CWAM or its predecessors, July 1992 – September 2003; Director, Wanger Investment Company PLC; Consultant to CWAM or its predecessors, September 2003 – September 2005. | | | 12 | | | Columbia Acorn Trust | |
|
| Officers of Wanger Advisors Trust: | | | | | | | |
|
Ben Andrews, 45,
Vice President | | | 2004 | | | Portfolio manager and analyst, CWAM or its predecessors, since 1998; Vice President, Columbia Acorn Trust and Wanger Advisors Trust since 2004. | | | 12 | | | None | |
|
Robert A. Chalupnik, 45,
Vice President | | | 2011 | | | Portfolio manager and analyst, CWAM or its predecessors since 1998. Vice President Columbia Acorn Trust and Wanger Advisors Trust since May 2011. | | | 12 | | | None | |
|
Michael G. Clarke, 42,
Assistant Treasurer | | | 2004 | | | Vice President, Columbia Management Investment Advisers, LLC since May 2010; Managing Director of Fund Administration, Columbia Management Advisors, LLC, from September 2004 to April 2010; senior officer of Columbia Funds and affiliated funds since 2002. | | | 12 | | | None | |
|
Joseph F. DiMaria, 44,
Assistant Treasurer | | | 2010 | | | Vice President, Mutual Fund Administration, Columbia Management Investment Advisers, LLC, since May 2010; Director of Fund Administration, Columbia Management Advisors, LLC from January 2006 to April 2010; Head of Tax/Compliance and Assistant Treasurer, Columbia Management Advisors, LLC, from November 2004 to December 2005. | | | 12 | | | None | |
|
P. Zachary Egan, 43,
Vice President | | | 2003 | | | Director of International Research, CWAM or its predecessors since December 2004; Vice President, Columbia Acorn Trust since 2003 and Wanger Advisors Trust since 2007; portfolio manager and analyst, CWAM or its predecessors, since 1999. | | | 12 | | | None | |
|
Fritz Kaegi, 40,
Vice President | | | 2011 | | | Portfolio manager and analyst, CWAM or its predecessors since 2004. Vice President Columbia Acorn Trust and Wanger Advisors Trust since September 2011. | | | 12 | | | None | |
|
John Kunka, 41,
Assistant Treasurer | | | 2006 | | | Director of Accounting and Operations, CWAM since May 2006; Manager of Mutual Fund Operations, Calamos Advisors, Inc. (investment adviser), September 2005 – May 2006; prior thereto, Manager of Mutual Fund Administration, Van Kampen Investments. | | | 12 | | | None | |
|
23
Wanger International Select 2011 Annual Report
Board of Trustees and Management of Wanger Advisors Trust
Name, Position(s) with
Wanger Advisors Trust
and Age at
December 31, 2011 | | Year First
Elected or
Appointed
to Office* | | Principal Occupation(s) during
Past Five Years | | Number of
Portfolios in
Fund Complex
Overseen by
Trustee/Officer | | Other
Directorships
in addition to
Wanger Advisors Trust | |
| Officers of Wanger Advisors Trust: (continued) | | | | | | | |
|
| Stephen Kusmierczak, 44, Vice President | | | 2011 | | | Portfolio manager and analyst, CWAM or its predecessors since 2001. Vice President Columbia Acorn Trust and Wanger Advisors Trust since September 2011. | | | 12 | | | None | |
|
Joseph C. LaPalm, 42,
Vice President | | | 2006 | | | Chief Compliance Officer, CWAM since 2005; prior thereto, compliance officer, William Blair & Company (investment firm). | | | 12 | | | None | |
|
Bruce H. Lauer, 54,
Vice President, Secretary and Treasurer | | | 1995 | | | Chief Operating Officer, CWAM or its predecessors since April 2000; Vice President, Secretary and Treasurer, Columbia Acorn Trust and Wanger Advisors Trust since 1995; Director, Wanger Investment Company PLC; formerly, Director, Banc of America Capital Management (Ireland) Ltd.; and formerly, Director, Bank of America Global Liquidity Funds, PLC. | | | 12 | | | None | |
|
Louis J. Mendes III, 47,
Vice President | | | 2003 | | | Portfolio manager and analyst, CWAM or its predecessors since 2001; Vice President, Columbia Acorn Trust since 2003 and Wanger Advisors Trust since 2005. | | | 12 | | | None | |
|
Robert A. Mohn, 50,
Vice President | | | 1997 | | | Director of Domestic Research, CWAM or its predecessors since March 2004; Vice President, Columbia Acorn Trust and Wanger Advisors Trust, since 1997; portfolio manager and analyst, CWAM or its predecessors since August 1992. | | | 12 | | | None | |
|
Christopher J. Olson, 47,
Vice President | | | 2001 | | | Portfolio manager and analyst, CWAM or its predecessors, since January 2001; Vice President, Columbia Acorn Trust and Wanger Advisors Trust since 2001. | | | 12 | | | None | |
|
Scott R. Plummer, 52,
Assistant Secretary | | | 2010 | | | Chief Legal Officer and Assistant Secretary, Columbia Management Investment Advisers, LLC (or its predecessors) since June 2005; Vice President and Lead Chief Counsel — Asset Management, Ameriprise Financial since May 2010 (previously Vice President and Chief Counsel — Asset Management, from 2005 to April 2010, and Vice President — Asset Management Compliance from 2004 to 2005); Vice President, Chief Counsel and Assistant Secretary, Columbia Management Investment Distributors, Inc. (or its predecessors) since 2008; Vice President, General Counsel and Secretary, Ameriprise Certificate Company since 2005; Chief Counsel, RiverSource Distributors, Inc. from 2006 to 2010; Vice President, General Counsel and Secretary, legacy RiverSource Funds, since December 2006; Senior Vice President, Secretary and Chief Legal Officer, Columbia Funds since May 2010. | | | 12 | | | None | |
|
Christopher O. Petersen, 42,
Assistant Secretary | | | 2010 | | | Vice President and Chief Counsel, Ameriprise Financial since January 2010 (formerly Vice President and Group Counsel or Counsel from April 2004 to January 2010); Assistant Secretary of legacy RiverSource Funds since January 2007. | | | 12 | | | None | |
|
Robert P. Scales, 59,
Chief Compliance Officer, Chief Legal Officer, Senior Vice President and General Counsel | | | 2004 | | | Chief Compliance Officer, Chief Legal Officer, Senior Vice President and General Counsel, Columbia Acorn Trust and Wanger Advisors Trust, since 2004. | | | 12 | | | None | |
|
24
Wanger International Select 2011 Annual Report
Board of Trustees and Management of Wanger Advisors Trust
Name, Position(s) with
Wanger Advisors Trust
and Age at
December 31, 2011 | | Year First
Elected or
Appointed
to Office* | | Principal Occupation(s) during
Past Five Years | | Number of
Portfolios in
Fund Complex
Overseen by
Trustee/Officer | | Other
Directorships
in addition to
Wanger Advisors Trust | |
| Officers of Wanger Advisors Trust: (continued) | | | | | | | |
|
Andreas Waldburg-Wolfegg, 45,
Vice President | | | 2011 | | | Portfolio Manager and analyst of CWAM since 2002. Vice President Columbia Acorn Trust and Wanger Advisors Trust since September 2011. | | | 12 | | | None | |
|
Linda Roth-Wiszowaty, 42,
Assistant Secretary | | | 2006 | | | Business support analyst, CWAM, since April 2007; prior thereto executive administrator, CWAM or its predecessors, and executive assistant to the Chief Operating Officer of CWAM or its predecessors. | | | 12 | | | None | |
|
* Dates prior to April 1992 correspond to the date of first election or appointment as a trustee or officers of The Acorn Fund, Inc., the predecessor trust to Columbia Acorn Trust.
(1) Mr. Muchin retired at the end of calendar year 2011.
(2) Prior to December 31, 2011, Mr. Rudis was considered an "interested person" of Wanger Advisors Trust, as defined in the New York Attorney General's Assurance of Discontinuance ("Order") entered into in February 2005 by Columbia Management Advisors, LLC (an indirect subsidiary of Bank of America Corporate ("BOA")) and Columbia Management Distributors, Inc. (an indirect subsidiary of BOA), because of his former employment as a BOA executive. The Order expired with respect to Wanger Advisors Trust on December 31, 2011.
(3) Mr. McQuaid is an "interested person" of Wanger Advisors Trust and of CWAM, as defined in the Investment Company Act of 1940 because he is an officer of the Trust and of CWAM.
(4) As permitted under the Wanger Advisors Trust's By-Laws, Mr. Wanger serves as a non-voting Trustee Emeritus of the Trust.
25
Wanger International Select 2011 Annual Report

Columbia Wanger Funds
Transfer Agent,
Dividend Disbursing Agent
Columbia Management Investment Services Corp.
P.O. Box 8081
Boston, Massachusetts
02266-8081
Distributor
Columbia Management Investment Distributors, Inc.
One Financial Center
Boston, Massachusetts
02111-2621
Investment Adviser
Columbia Wanger Asset Management, LLC
227 West Monroe Street, Suite 3000
Chicago, Illinois 60606
1-888-4-WANGER
(1-888-492-6437)
Legal Counsel to the Funds
Perkins Coie, LLP
Washington, DC
Legal Counsel to the Independent Trustees
Drinker Biddle & Reath LLP
Philadelphia, Pennsylvania
Independent Registered Public Accounting Firm
PricewaterhouseCoopers LLP
Chicago, Illinois
This document contains Global Industry Classification Standard data. The Global Industry Classification Standard ("GICS") was developed by and is the exclusive property and a service mark of MSCI Inc. ("MSCI") and Standard & Poor's Financial Services LLC ("S&P") and is licensed for use by Columbia Wanger Asset Management, LLC ("CWAM"). Neither MSCI, S&P, nor any other party involved in making or compiling the GICS or any GICS classifications makes any express or implied warranties or representations with respect to such standard or classification (or the results to be obtained by the use thereof), and all such parties hereby expressly disclaim all warranties of originality, accuracy, completeness, merchantability and fitness for a particular purpose with respect to any of such standard or classification. Without limiting any of the foregoing, in no event shall MSCI, S&P, any of their affiliates or any third party involved in making or compiling the GICS or any GICS classifications have any liability for any direct, indirect, special, punitive, consequential or any other damages (including lost profits) even if notified of the possibility of such damages.
This report, including the schedules of investments and financial statements, is submitted for the general information of the shareholders of the Wanger Advisors Trust.
A description of the Fund's proxy voting policies and procedures and a copy of the Fund's voting record for the most recent 12-month period ended June 30 are available (i) on the Securities and Exchange Commission's website at www.sec.gov, and (ii) without charge, upon request, by calling 888-492-6437.
The Fund files a complete schedule of portfolio holdings with the SEC for the first and third quarters of each fiscal year on Form N-Q. The Fund's Form N-Q is available on the SEC's website at www.sec.gov and may be reviewed and copied at the SEC's Public Reference Room in Washington, D.C. Information on the operation of the Pubic Reference Room may be obtained by calling 800-SEC-0330. The Fund's complete portfolio holdings are disclosed at www.columbiafunds.com approximately 30 days after each month end.
© 2012 Columbia Management Investment Advisers, LLC. All rights reserved.
C-1451 C (2/12) 132422
Wanger Select
2011 Annual Report

Not FDIC insured • No bank guarantee • May lose value

Wanger Select
2011 Annual Report
Table of Contents
| 2 | | | Understanding Your Expenses | |
|
| 3 | | | Vaccines: Medicine's Greatest Lifesaver | |
|
| 6 | | | Performance Review | |
|
| 8 | | | Statement of Investments | |
|
| 13 | | | Statement of Assets and Liabilities | |
|
| 13 | | | Statement of Operations | |
|
| 14 | | | Statement of Changes in Net Assets | |
|
| 15 | | | Financial Highlights | |
|
| 16 | | | Notes to Financial Statements | |
|
| 20 | | | Report of Independent Registered Public Accounting Firm | |
|
| 21 | | | Federal Income Tax Information | |
|
| 22 | | | Board of Trustees and Management of Wanger Advisors Trust | |
|
Columbia Wanger Asset Management, LLC (CWAM) is one of the leading global small- and mid-cap equity managers in the United States with 40 years of small- and mid-cap investment experience. As of December 31, 2011, CWAM managed $29.4 billion in assets. CWAM is the investment adviser to Wanger USA, Wanger International, Wanger Select and Wanger International Select (together, the Columbia Wanger Funds) and the Columbia Acorn Family of Funds.
Investors should consider the investment objectives, risks, charges and expenses of a mutual fund carefully before investing. For a free prospectus, which contains this and other important information about the Fund, contact your financial adviser or insurance company or contact 1-888-4-WANGER. Read the prospectus carefully before investing.
An important note: Columbia Wanger Funds are available for purchase through variable annuity contracts and variable life insurance policies offered by the separate accounts of participating insurance companies and qualified pension or retirement plans.
The views expressed in "Vaccines: Medicine's Greatest Lifesaver" and in the Performance Review reflect the current views of the respective authors. These views are not guarantees of future performance and involve certain risks, uncertainties and assumptions that are difficult to predict so actual outcomes and results may differ significantly from the views expressed. These views are subject to change at any time based upon economic, market or other conditions and the respective parties disclaim any responsibility to update such views. These views may not be relied on as investment advice and, because investment decisions for a Columbia Wanger Fund are based on numerous factors, may not be relied on as an indication of trading intent on behalf of any particular Columbia Wanger Fund. References to specific company securities should not be construed as a recommendation or investment advice.
1
Wanger Select 2011 Annual Report

Understanding Your Expenses
As a shareholder, you incur three types of costs. There are transaction costs, which generally include sales charges on purchases and may include redemption fees. There are also ongoing costs, which generally include management fees and other Fund expenses. Lastly, there may be additional fees or charges imposed by the insurance company that sponsors your variable annuity and/or variable life insurance product. The following information is intended to help you understand your ongoing costs (in dollars) of investing in the Fund and to help you compare these costs with the ongoing costs of investing in other mutual funds.
Analyzing your Fund's expenses
To illustrate these ongoing costs, we have provided an example and calculated the expenses paid by investors in the Fund during the period. The actual and hypothetical information in the table below is based on an initial investment of $1,000 at the beginning of the period indicated and held for the entire period. Expense information is calculated two ways and each method provides you with different information. The amount listed in the "Actual" column is calculated using the Fund's actual operating expenses and total return for the period. You may use the Actual information, together with the amount invested, to estimate the expenses that you paid over the period. Simply divide your account value by $1,000 (for example, an $8,600 account value divided by $1,000 = 8.6), then multiply the results by the expenses paid during the period under the Actual column. The amount listed in the "Hypothetical" column assumes a 5% annual rate of return before expenses (which is not the Fund's actual return) and then applies the Fund's actual expense ratio for the period to the hypothetical return. You should not use the hypothetical account values and expenses to estimate either your actual account balance at the end of the period or the expenses you paid during the period. See "Compare with other funds" below for details on how to use the hypothetical data.
Compare with other funds
Since all mutual funds are required to include the same hypothetical calculations about expenses in shareholder reports, you can use this information to compare the ongoing cost of investing in the Fund with other funds. To do so, compare the hypothetical example with the 5% hypothetical examples that appear in the shareholder reports of other funds. As you compare hypothetical examples of other funds, it is important to note that hypothetical examples are meant to highlight the ongoing cost of investing in a fund only and do not reflect any transaction costs, such as sales charges, redemption or exchange fees. Therefore, the hypothetical calculations are useful in comparing ongoing costs only, and will not help you determine the relative total costs of owning different funds. If transaction costs were included in these calculations, your costs would be higher.
July 1, 2011 – December 31, 2011
| | | Account value at the
beginning of the period ($) | | Account value at the
end of the period ($) | | Expenses paid during
period ($) | | Fund's annualized
expense ratio (%)* | |
| | | Actual | | Hypothetical | | Actual | | Hypothetical | | Actual | | Hypothetical | | | |
| Wanger Select | | | 1,000.00 | | | | 1,000.00 | | | | 829.80 | | | | 1,020.31 | | | | 4.36 | | | | 4.81 | | | | 0.95 | | |
* Expenses paid during the period are equal to the Fund's annualized expense ratio, multiplied by the average account value over the period, then multiplied by the number of days in the Fund's most recent fiscal half-year and divided by 365.
It is important to note that the expense amounts shown in the table are meant to highlight only ongoing costs of investing in the Fund. Expenses paid during the period do not include any insurance charges imposed by your insurance company's separate account. The hypothetical example provided is useful in comparing ongoing costs only and will not help you determine the relative total costs of owning different funds whose shareholders may incur transaction costs.
2
Wanger Select 2011 Annual Report

Vaccines: Medicine's Greatest Lifesaver
I recently read several books on the history of vaccines. As one of the authors put it, "Of all of the benefits of medical science, vaccination is at or near the summit."1
Deadly Diseases
"Bring out your dead!" cries a wretched man pulling a cart of bodies in Monty Python and the Holy Grail. Set in the middle ages, the movie makes fun of the impact of communicable disease at that time. In reality, such diseases were no laughing matter. Once mankind transitioned from isolated bands of nomadic hunter-gatherers to more densely populated groups of farmers, epidemic diseases began to ravage civilization.
Remarkable progress has been made as fatal, communicable disease has now become rare in the developed world. Clearly, improved sanitation and nutrition have helped, but much of the credit goes to the development of vaccines.
The First Vaccine
Dating back to at least the time of the Pharaohs, waves of smallpox epidemics ravaged mankind. In populations previously subject to the disease, mortality rates for those infected could be more than 30% and, for other populations, much more.2 North American Indians had little immunity to the disease. Their population decreased 99% between Columbus's voyage in 1492 and the year 1800, and smallpox was the largest killer.3
People observed that the disease was communicable and one who survived a smallpox infection became immune to the next epidemic of the disease. In ancient China and more recently in Asia and Africa, a crude form of vaccination called variolation developed whereby fluid from a smallpox pustule or parts of smallpox scabs were scraped into the skin of a healthy person. In most cases, immunity would build up before the disease reached a vital organ and the individual would survive.
In 1790, Lady Montague, the wife of the British ambassador to the Ottoman Empire, introduced variolation to Britain. The process was far riskier than vaccines today; most people suffered severe side effects and up to about 3% of those treated died as a result.4 But these were much better odds than for those infected with smallpox.
Edward Jenner, a pharmacist in England, learned that milkmaids were immune to smallpox because they often suffered blisters from cowpox, a related disease. In 1796, Jenner began experimenting with variolating using fluid from a milkmaid's cowpox blisters, rather than smallpox sores. When his subjects were later variolated with smallpox fluid, no reaction occurred, indicating that they were immune from smallpox. Immunization using cowpox fluids rose rapidly and protected millions of people.5
A cowpox-derived vaccine for smallpox continued to be used well into the 20th century, including use by six million New Yorkers who were inoculated during a smallpox scare in 1947. Smallpox was eradicated from nature; the last case occurred in India in 1975.6 Smallpox immunizations ended when health authorities judged the risk of side effects from the vaccine exceeded the risk of the disease returning.
The Golden Age of Vaccines
Beginning in the 1860s, tremendous scientific advances were made. Robert Koch's laboratory in Germany identified bacteria as the source of many diseases and proved that bacteria grown in a lab could cause disease.7 Koch's lab created some vaccines, including those for diphtheria and tetanus.
In France, Louis Pasteur stunned the world by developing the first rabies vaccine in 1885; until then rabies infections resulted in horrible deaths. His mantra was to "isolate, attenuate and vaccinate" the pathogen causing a disease.8 He attenuated a germ by having it reproduce in petri dishes or animal cells where it would evolve in order to optimize in its new environment. Once it evolved to the point it would no longer thrive in and harm humans, it was injected into humans with the hope that the subject would build immunity to full power germs. The Goldilocks trick of course was to make the attenuated germ weak enough so as not to cause harm, but strong enough to create immunity.
While scientific understanding of disease increased rapidly, it was primitive compared to modern times. Diagnostic tools were poor. Bacteria could be seen by optical microscopes, but viruses were unseen until the development of the electron microscope in the 1930s. Viruses were inferred to exist as a result of an 1898 experiment by Danish professor Martinus Beijerinck, who filtered bacteria out through unglazed porcelain containers, but observed remaining, and much smaller, disease-causing elements. Scientists learned how to grow viruses in laboratories only in the late 1940s.9
Early vaccines were dangerous and unreliable by today's standards, though far less dangerous than the underlying diseases they prevented. Vaccines did not stop the great influenza epidemic of 1918-1919. Of a worldwide population of one billion, an estimated 500 million were infected and more than 50 million people died.10 This virus was unusual in that it had high mortality among young, healthy people.
Vaccines continued to progress. During World War II, all 11 million U.S. soldiers were vaccinated for typhoid, tetanus, smallpox, cholera and plague. Vaccines, coupled with antibiotics, drastically improved their health. Disease deaths outnumbered battle deaths by 13:1 in the Spanish American War, matched them in World War I and were outnumbered by 1:85 in World War II.11
Maurice Hilleman's Mission
Maurice Hilleman had a role in creating more vaccines than anyone else in history, some three dozen. As noted by Arthur Allen, author of Vaccine, The Controversial Story of Medicine's Greatest Lifesaver, "...his products undoubtedly
3
Wanger Select 2011 Annual Report
saved more lives than those of any other individual in the past half-century."12
Hilleman grew up in Montana, and earned a Ph.D. in microbiology at the University of Chicago where he discovered that chlamydia is a tiny bacteria rather than a virus. He then stunned his mentors by departing academia to work in industry. At Squibb, he developed a vaccine against Japanese B encephalitis to protect American Pacific troops during World War II. In 1948, he joined the Walter Reed Army Medical Center, then a hub of vaccine development.
In 1957, Hilleman moved to Merck, where he continued to develop vaccines well past his official retirement in 1984. He had a tremendous work ethic, often working seven days a week and expecting the same from his staff. He and his team were on a mission to rid the world of disease. They developed eight of 14 now common vaccines for measles, mumps, hepatitis A and B, chickenpox, meningitis, pneumonia and Hib (hemophilus influenza, which harms infants and young children).13 One of his accomplishments was the combination MMR (measles, mumps and rubella) vaccine.
Hilleman discovered that the influenza virus is particularly difficult to deal with due to frequent minor drifts in its surface, which each year makes the last year's vaccine obsolete. Periodically, the virus shifts its surface characteristics substantially, becoming much more virulent. Hilleman inferred that a shift occurred in Hong Kong in 1957 and, by having Merck produce 40 million doses of vaccine, saved thousands of lives in America. Potential future shifts keep virologists up at night.
Hilleman helped develop the first two anti-cancer vaccines. One vaccine prevents hepatitis B, the third most common known cause of cancer in the world (after sunlight and smoking).14 It was the first vaccine utilizing recombinant technology and the first made by a single protein. His innovations helped create a vaccine to prevent HPV (human papillomavirus), the cause of cervical cancer. Hilleman had high integrity, as he refused to risk changes in manufacturing processes in order to enhance yields and profits.15 He died in 2005 at age 85.
Vaccine Scares
Two notable scares set back progress on vaccine usage.
In 1982, a TV station in Washington D.C. aired "Vaccine Roulette," a story highlighting risks of the DTP (diphtheria, tetanus, pertussis) vaccine. It showed reactions well known to physicians, including cases of seizures, high fevers and fainting. In a case of ambush journalism, it edited doctors' comments out of context and failed to mention that none of the victims portrayed suffered permanent damage. Other media quoted the story further out of context, claiming permanent damage. The media also failed to mention the consequences of contracting the underlying diseases.16
In 1998, the British medical journal The Lancet published a paper alleging a link between the MMR vaccine and autism.17 It claimed that, in some cases, the vaccine caused the measles virus to lodge in the intestines and create leakage, allowing opioid peptides to escape and penetrate the brain, causing autism. The paper was under fire by scientists immediately. The opioid causation theory had already been widely discredited, the findings of measles in intestines could not be duplicated by other scientists and there was no comparison between autism rates of children who got the vaccine and those who did not. A review by 37 experts found that the theories were "biologically implausible," and the conclusions essentially worthless.18
Fourteen separate groups of investigators did statistical studies that also refuted the link.19 One notable study covered 530,000 children in Denmark from 1991-1998, comparing vaccinated and unvaccinated children. It showed "strong evidence against the hypothesis that MMR vaccination causes autism."20 By 2004, 10 of the original 12 authors of The Lancet article withdrew their support of the paper.21 The Lancet formally retracted the paper in 2010 and, that same year, the primary author of the paper had his U. K. medical license revoked.
Once the MMR-autism link was largely discredited, vaccine opponents claimed a link between mercury in vaccines and autism. Minute amounts of ethyl mercury were utilized in vaccines, usually less than the more toxic methyl mercury infants get exposed to from the environment. Combined, in some cases, the dosage did exceed government guidelines, so the mercury was removed. Studies showed that reported rates of autism continued to climb once mercury was removed from vaccines.22 "In spite of all the concern...there has not been a single case of proven mercury toxicity from vaccines...," writes Kurt Link, author of The Vaccine Controversy: The History, Use, and Safety of Vaccinations.23
Unfortunately, many people appear to rely on one-sided scares and opinions expressed in talk shows and by celebrity activists, rather than on scientific evidence. Immunization rates around the world have fluctuated with publicity, funding for inoculations, public policy and legal requirements. Where immunizations have dropped, outbreaks have occurred. A diphtheria epidemic hit the former Soviet Union in 1993, causing 4,000 deaths.24 In Japan, where pertussis immunizations fell from 80% in 1974 to 10% in 1976, a 1979 epidemic of that disease resulted in 13,000 infections and 41 deaths.25 In the United States, where pockets of low immunization rates exist, outbreaks occur. Some of the Chicago suburbs are currently experiencing a whooping cough outbreak.26
Perspectives on Risks
There have been mistakes in vaccine development, production and use that have resulted in injuries and deaths. However, those numbers pale in comparison to the injuries and deaths caused by the underlying diseases that are being conquered by vaccines. While rare vaccine side effects continue to exist, drugs and
4
Wanger Select 2011 Annual Report
vaccines come with disclosures of the known side effects and risks, however unlikely. Diseases don't.
Many people believe some vaccine-preventable diseases to be fairly benign and some are, in most cases. Yet measles is one of the most contagious viruses and has killed more children than any other disease in history.27 It hospitalized 48,000 Americans yearly in the 1960s and killed 400 during a 1964 epidemic.28
Chickenpox is perceived to be a mild disease and it usually is. Acquiring chickenpox creates lifetime immunity to the disease (though susceptibility to shingles) so some question the usefulness of the vaccine. However, Paul Offit, author of Vaccinated, One Man's Quest to Defeat the World's Deadliest Diseases, points out that chickenpox creates risk of encephalitis, hepatitis, pneumonia and Group A streptococci, the "flesh-eating bacteria." He notes that, before the vaccine, some 10,000 people a year were hospitalized and 100 died annually in the United States due to the disease or related illnesses.29
German measles (rubella) was considered a benign illness featuring a rash and a low fever until Australian ophthalmologist Sir Norman McAllister Gregg discovered a link to birth defects. When striking a mother in her first trimester, rubella causes fetal anomalies in 90% of pregnancies. In 1964-65, prior to the rubella vaccine, the last major epidemic in the United States caused thousands of birth defects.30 Hilleman's MMR vaccine was approved in 1971 and the number dropped to seven U.S. cases in 1983.31
Whooping cough (pertussis) is a horrible disease for babies and small children. Babies have died because of outbreaks when vaccination rates declined as a result of scares. The underlying vaccine has changed since the "Vaccine Roulette" television program, to an acellular version with fewer side effects.32 That is why the combination vaccine is now called DTaP rather than DTP.
While no vaccine is 100% effective, the fact remains that if the vast majority of people are vaccinated, a disease cannot infect enough victims to spread. Link writes, "In the prevaccine era, every family lost a child or knew of one so lost due to vaccine-preventable diseases. Today in the USA, the death of a child is an unexpected tragedy; in the past it was an expected sorrow."33 American life expectancies increased 30 years during the 20th century, largely due to vaccines.34


Charles P. McQuaid
President and Chief Investment Officer
Columbia Wanger Asset Management, LLC
The information and data provided in this analysis are derived from sources that we deem to be reliable and accurate. These views are not guarantees of future performance and involve certain risks, uncertainties and assumptions that are difficult to predict so actual outcomes and results may differ significantly from the views expressed. The views/opinions expressed in this essay are those of the author and not of the Columbia Wanger Funds Board, are subject to change at any time based upon economic, market or other conditions, may differ from views expressed by other Columbia Management associates and the respective parties disclaim any responsibility to update such views. These views may not be relied on as investment advice and, because investment decisions for a Columbia Wanger Fund are based on numerous factors, may not be relied on as an indication of trading intent on behalf of any particular Columbia Wanger Fund.
The information included on Pages 3-5 of this report is unaudited.
1 Link, M.D., Kurt, The Vaccine Controversy, The History, Use, And Safety of Vaccinations, (Westport, Connecticut, Praeger Publishers 2005) p. 38.
2 Mnookin, Seth, The Panic Virus, A True Story of Medicine, Science, and Fear, (New York, New York, Simon & Schuster 2011) p. 30.
3 Offit, M.D., Paul A., Vaccinated, One Man's Quest to Defeat the World's Deadliest Diseases, (New York, New York, HarperCollins Publishers 2007) pg. 32.
4 Link, M.D., Kurt, op. cit., p. 12.
5 Allen, Arthur, Vaccine, The Controversial Story of Medicines Greatest Lifesaver, (New York, New York, W. W. Norton & Company 2007) p. 49-50.
6 Ibid., p. 115, 303.
7 Offit, M.D., Paul A., op. cit., p. 144.
8 Allen, Arthur, op. cit., p. 65, 121.
9 Offit, M.D., Paul A., op. cit., p. 37, 41-42.
10 Ibid., p. 2-3.
11 Allen, Arthur, op. cit., p. 119, 159.
12 Ibid., p. 221.
13 Link, M.D., Kurt, op. cit., p. 101.
14 Offit, M.D., Paul A., op. cit., p. 115.
15 Ibid., p. 130, 156.
16 Allen, Arthur, op. cit., p. 251-256.
17 Wakefield, Andrew J., et al., "Ileal-lymphoid-nodular Hyperplasia, Non-Specific Colitis, and Pervasive Developmental Disorders in Children," The Lancet 351, Issue 9103 (1998), p. 637-41.
18 Mnookin, Seth, op. cit., p. 106-107, 114.
19 Offit, M.D., Paul A., op. cit., p. 167.
20 Mnookin, Seth, op. cit., p. 163.
21 Murch, Simon H., et al., "Retraction of an Interpretation," The Lancet 363, Issue 9411 (2004), p. 750.
22 Mnookin, Seth, op. cit., p. 167.
23 Link, M.D., Kurt, op. cit., p. 21.
24 Ibid., p. 57.
25 Mnookin, Seth, op. cit., p. 277.
26 Synett, Lawerence, "Whooping Cough Strikes Collar Counties," Chicago Tribune, December 6, 2011.
27 Mnookin, Seth, op. cit., p. 19.
28 Allen, Arthur, op. cit., p. 217.
29 Offit, M.D., Paul A., op. cit., p. 102.
30 Link, M.D., Kurt, op. cit., p. 82-84.
31 Allen, Arthur, op. cit., p. 240.
32 Ibid., p. 352, 286.
33 Link, M.D., Kurt, op. cit., p. 163.
34 Offit, M.D., Paul A., op. cit., p. xiv.
5
Wanger Select 2011 Annual Report

Performance Review Wanger Select
 | |  | |
|
Ben Andrews
Lead Portfolio Manager | | Robert A. Chalupnik
Co-Portfolio Manager | |
|
Performance data shown represents past performance and is not a guarantee of future results. The investment return and principal value will fluctuate so that shares, when redeemed, may be worth more or less than the original cost. Current performance may be lower or higher than the performance data shown. Please visit columbiamanagement.com for performance updates for the most recent month-end.
Wanger Select fell 17.68% in 2011, underperforming the 1.73% decline of its primary benchmark, the S&P MidCap 400 Index. The large-cap S&P 500 Index ended the year up 2.11%. The loss and the performance lag were disappointments to us as Fund managers. So, what happened? What changes have we made to improve this performance?
Throughout 2011, there were big valuation disparities between different types of companies likely due to investors' beliefs that the world was going to experience another 2008-type crisis. The Fund owned, and still does own, a handful of stocks that we believe have underperformed due to this phenomenon and which contributed significantly to the Fund's underperformance in 2011. However, many of these companies have strong operational fundamentals, which is the reason that we continue to own them in the Fund. Some examples include: rental car company Hertz, down 19% in 2011 while its adjusted earnings are expected to be up 80% year over year (according to stock market analysts' earnings estimates); Colombian oil producer Pacific Rubiales Energy, down 45% for the year but with earnings up 125% year over year; insurance company CNO Financial, down 7% in 2011 but showing adjusted earnings up 80% year over year; and electronic manufacturing services provider Sanmina-SCI, down 19% in 2011 while its adjusted year-over-year earnings rose 25%.
We firmly believe that if a company continues to grow its earnings, its stock price will go up over time. We believe that the 2012 outlook for the companies mentioned above appears relatively strong and most of these stocks started to perform better late in the year. We believe that investors may be starting to realize that certain stocks are too cheap at current levels.
We classify the businesses that we hold in the Fund in two ways: (1) core holdings, or companies with sustainable competitive advantages, pricing power, dominant market share and strong cash generation, and (2) opportunistic holdings, or companies going through a turnaround or that are misunderstood by Wall Street for various reasons. Midyear the Fund began executing on its plan to structure the portfolio with fewer opportunistic holdings (like the stocks mentioned above) and more core holdings. In May 2011, we added Rob Chalupnik as co-portfolio manager to assist in this focus. However, we are deliberately making this transition slowly because we believe many of the Fund's opportunistic holdings are quite cheap and exhibit strong operational fundamentals. We anticipate opportunistic holdings will continue to be part of the portfolio, though as a smaller percentage than the Fund has owned in recent years, especially in times of global uncertainty. We expect to vary the percentage when we believe we are being paid to take risk.
Due to the 2012 elections both here and in Europe, we wouldn't be surprised to see positive market results for this country and some countries in Europe and Asia in the new year. However, we do anticipate continued stock market volatility as we see little to no improvement in the over-leveraged status of the western world governments.
Risks include stock market fluctuations due to economic and business developments. The Fund also has potentially greater price volatility due to the Fund's concentration in a limited number of stocks of mid-size companies. International investments involve greater potential risks, including less regulation, currency fluctuations, economic instability and political developments.
Portfolio holdings are subject to change periodically and may not be representative of current holdings.
Fund's Positions in Mentioned Holdings
As a percentage of net assets, as of 12/31/11
| Hertz | | | 6.1 | % | |
| CNO Financial Group | | | 5.0 | | |
| Sanmina-SCI | | | 4.0 | | |
| Pacific Rubiales Energy | | | 2.7 | | |
Diversification Status Change
Effective January 31, 2012, Wanger Select changed its classification to a diversified investment company. This is a change in classification only. The Fund's investment style remains the same. Diversified funds have greater flexibility in allocating investments than non-diversified funds. The Fund was previously registered as a non-diversified investment company, which required more concentrated holdings with a relatively large percentage of portfolio assets invested in a single issuer or a small number of issuers. The Fund will not be able to become non-diversified unless it seeks and obtains the approval of shareholders.
6
Wanger Select 2011 Annual Report
Growth of a $10,000 Investment in Wanger Select
February 1, 1999 (inception date) through December 31, 2011
Performance data shown represents past performance and is not a guarantee of future results. The investment return and principal value will fluctuate so that shares, when redeemed, may be worth more or less than the original cost. Current performance may be lower or higher than the performance data shown. Performance results reflect any fee waivers or reimbursements of Fund expenses by the investment adviser and/or any of its affiliates. Absent these fee waivers and/or expense reimbursement arrangements, performance results would have been lower. For daily and most recent month-end performance updates, please call 1-888-4-WANGER.
This graph compares the results of $10,000 invested in Wanger Select on February 1, 1999 (the date the Fund began operations) through December 31, 2011, to the S&P MidCap 400 Index, with dividends and capital gains reinvested. Although the index is provided for use in assessing the Fund's performance, the Fund's holdings may differ significantly from those in the index.
Top 10 Holdings
As a percentage of net assets, as of 12/31/11
1. Discover Financial Services
Credit Card Company | | | 7.2
| % | |
2. Hertz
Largest U.S. Rental Car Operator | | | 6.1
| | |
3. CNO Financial Group
Life, Long-term Care & Medical Supplement Insurance | | | 5.0
| | |
4. Ametek
Aerospace/Industrial Instruments | | | 4.8
| | |
5. Sanmina-SCI
Electronic Manufacturing Services | | | 4.0
| | |
6. JB Hunt Transport Services
Truck & Intermodal Carrier | | | 3.7
| | |
7. Coach
Designer & Retailer of Branded Leather Accessories | | | 3.5
| | |
8. Donaldson
Industrial Air Filtration | | | 3.5
| | |
9. SBA Communications
Communications Towers | | | 3.3
| | |
10. Crown Castle International
Communications Towers | | | 3.1
| | |
Top 5 Industries
As a percentage of net assets, as of 12/31/11
| Consumer Goods & Services | | | 22.2 | % | |
| Industrial Goods & Services | | | 21.0 | | |
| Information | | | 18.1 | | |
| Finance | | | 15.5 | | |
| Energy & Minerals | | | 11.8 | | |
Results as of December 31, 2011
| | | 4th quarter | | 1 year | | 5 years | | 10 years | |
| Wanger Select | | | 9.21 | % | | | -17.68 | % | | | -0.71 | % | | | 6.28 | % | |
| S&P MidCap 400 Index* | | | 12.98 | | | | -1.73 | | | | 3.32 | | | | 7.04 | | |
| S&P 500 Index | | | 11.82 | | | | 2.11 | | | | -0.25 | | | | 2.92 | | |
Lipper Mid-Cap Growth Funds
Variable Underlying Index | | | 8.39 | | | | -4.69 | | | | 3.00 | | | | 4.58 | | |
*The Fund's primary benchmark.
NAV as of 12/31/11: $23.35
Performance numbers reflect all Fund expenses but do not include any fees and expenses imposed under your variable annuity or life insurance policy or qualified pension or retirement plan. If performance included the effect of these additional charges, it would be lower.
The Fund's annual operating expense ratio is 0.93%. The annual operating expense ratio is as stated in the Fund's prospectus that is current as of the date of this report. Differences in expense ratios disclosed elsewhere in this report may result from including fee waivers and reimbursements as well as different time periods used in calculating the ratios.
All results shown assume reinvestment of distributions and do not reflect taxes that a shareholder would pay on Fund distributions or the sale of Fund shares.
The S&P MidCap 400 Index is a market value-weighted index that tracks the performance of 400 mid-cap U.S. companies. The S&P 500 tracks the performance of 500 widely-held large capitalization U.S. stocks and is presented to show performance against a widely recognized market index. The Lipper Mid-Cap Growth Funds Variable Underlying Index is an equally weighted representation of the 30 largest variable insurance underlying funds in the Lipper Mid-Cap Growth Funds Variable Underlying Classification. Indexes are not managed and do not incur fees or expenses. It is not possible to invest directly in an index.
Lipper Inc., a widely respected data provider in the industry, calculates an average total return (assuming reinvestment of distributions) for mutual funds with investment objectives similar to those of the Fund. Lipper makes no adjustment for the effect of sales loads.
Portfolio characteristics and holdings are subject to change periodically and may not be representative of current characteristics and holdings.
7
Wanger Select 2011 Annual Report
Wanger Select
Statement of Investments, December 31, 2011
Number of
Shares | | | | Value | |
| | | Equities – 98.3% | |
| | | Consumer Goods & Services – 22.2% | |
| | | Retail – 8.1% | |
| | 357,000 | | | Safeway
Supermarkets | | $ | 7,511,280
| | |
| | 133,000 | | | Abercrombie & Fitch
Teen Apparel Retailer | | | 6,495,720
| | |
| | 74,600 | | | lululemon athletica (a)
Premium Active Apparel Retailer | | | 3,480,836
| | |
| | 35,000 | | | Tiffany & Co.
Luxury Good Retailer | | | 2,319,100
| | |
| | | | | | | | 19,806,936 | | |
| | | Travel – 7.8% | |
| | 1,268,000 | | | Hertz (a)
Largest U.S. Rental Car Operator | | | 14,860,960
| | |
| | 166,000 | | | Gaylord Entertainment (a)
Convention Hotels | | | 4,007,240
| | |
| | | | | | | | 18,868,200 | | |
| | | Apparel – 3.5% | |
| | 138,500 | | | Coach
Designer & Retailer of Branded Leather Accessories | | | 8,454,040
| | |
| | | Casinos & Gaming – 1.4% | |
| | 50,663,000 | | | RexLot Holdings (China)
Lottery Equipment Supplier in China | | | 3,316,279
| | |
| | | Educational Services – 1.2% | |
| | 52,625 | | | ITT Educational Services (a) (b)
Post-secondary Degree Services | | | 2,993,836
| | |
| | | Food & Beverage – 0.1% | |
| | 307,000 | | | GLG Life Tech (Canada) (a) (b)
Produce an All-Natural Sweetener
Extracted from the Stevia Plant | | | 276,300
| | |
| | | Other Consumer Services – 0.1% | |
| | 536,550 | | | IFM Investments (Century 21 China RE) –
ADR (China) (a)
Provide Real Estate Services in China | | | 171,696
| | |
| | | | | Total Consumer Goods & Services | | | 53,887,287 | | |
Number of
Shares | | | | Value | |
| | | Industrial Goods & Services – 21.0% | |
| | | Machinery – 14.2% | |
| | 278,500 | | | Ametek
Aerospace/Industrial Instruments | | $ | 11,724,850
| | |
| | 123,750 | | | Donaldson
Industrial Air Filtration | | | 8,424,900
| | |
| | 126,000 | | | Pall
Filtration & Fluids Clarification | | | 7,200,900
| | |
| | 170,000 | | | Kennametal
Consumable Cutting Tools | | | 6,208,400
| | |
| | 44,000 | | | Oshkosh Corporation (a)
Specialty Truck Manufacturer | | | 940,720
| | |
| | | | | | | | 34,499,770 | | |
| | | Outsourcing Services – 2.1% | |
| | 236,000 | | | Quanta Services (a)
Electrical & Telecom Construction Services | | | 5,083,440
| | |
| | | Industrial Distribution – 2.0% | |
| | 26,000 | | | WW Grainger
Industrial Distribution | | | 4,866,940
| | |
| | | Other Industrial Services – 1.8% | |
| | 103,500 | | | Expeditors International of Washington
International Freight Forwarder | | | 4,239,360
| | |
| | | Waste Management – 0.9% | |
| | 66,500 | | | Waste Management
U.S. Garbage Collection & Disposal | | | 2,175,215
| | |
| | | | | Total Industrial Goods & Services | | | 50,864,725 | | |
| | | Information – 18.1% | |
| | | Mobile Communications – 6.9% | |
| | 184,000 | | | SBA Communications (a)
Communications Towers | | | 7,904,640
| | |
| | 169,000 | | | Crown Castle International (a)
Communications Towers | | | 7,571,200
| | |
| | 2,215,900 | | | Globalstar (a) (b)
Satellite Mobile Voice & Data Carrier | | | 1,196,586
| | |
| | | | | | | | 16,672,426 | | |
| | | Contract Manufacturing – 4.0% | |
| | 1,051,333 | | | Sanmina-SCI (a)
Electronic Manufacturing Services | | | 9,787,910
| | |
See accompanying notes to financial statements.
8
Wanger Select 2011 Annual Report
Wanger Select
Statement of Investments, December 31, 2011
Number of
Shares | | | | Value | |
| | | Computer Services – 2.5% | |
| | 673,400 | | | WNS - ADR (India) (a)
Offshore BPO (Business Process Outsourcing) Services | | $ | 6,053,866
| | |
| | | Computer Hardware & Related Equipment – 2.2% | |
| | 116,000 | | | Amphenol
Electronic Connectors | | | 5,265,240
| | |
| | | Instrumentation – 1.1% | |
| | 19,000 | | | Mettler Toledo (a)
Laboratory Equipment | | | 2,806,490
| | |
| | | Business Software – 0.6% | |
| | 27,500 | | | Concur Technologies (a)
Web Enabled Cost & Expense Management Software | | | 1,396,725
| | |
| | | Semiconductors & Related Equipment – 0.4% | |
| | 126,000 | | | Atmel (a)
Microcontrollers, Radio Frequency &
Memory Semiconductors | | | 1,020,600
| | |
| | | Advertising – 0.4% | |
| | 717,100 | | | VisionChina Media - ADR (China) (a)
Advertising on Digital Screens in China's Mass
Transit System | | | 889,204
| | |
| | | | | Total Information | | | 43,892,461 | | |
| | | Finance – 15.5% | |
| | | Credit Cards – 7.2% | |
| | 723,200 | | | Discover Financial Services
Credit Card Company | | | 17,356,800
| | |
| | | Insurance – 5.0% | |
| | 1,939,000 | | | CNO Financial Group (a)
Life, Long-term Care & Medical Supplement Insurance | | | 12,235,090
| | |
| | | Banks – 2.1% | |
| | 115,000 | | | City National
Bank & Asset Manager | | | 5,080,700
| | |
| | | Brokerage & Money Management – 1.2% | |
| | 171,000 | | | SEI Investments
Mutual Fund Administration & Investment Management | | | 2,966,850
| | |
| | | | | Total Finance | | | 37,639,440 | | |
Number of
Shares | | | | Value | |
| | | Energy & Minerals – 11.8% | |
| | | Oil & Gas Producers – 8.3% | |
| | 361,750 | | | Pacific Rubiales Energy (Colombia)
Oil Production & Exploration in Colombia | | $ | 6,650,874
| | |
| | 6,520,700 | | | Canacol (Colombia) (a)
Oil Producer in South America | | | 4,928,529
| | |
| | 5,887,900 | | �� | ShaMaran Petroleum (Iraq) (a)
Oil Exploration in Kurdistan | | | 2,051,734
| | |
| | 163,000 | | | Houston American Energy (a) (b)
Oil & Gas Exploration/Production in Colombia | | | 1,986,970
| | |
| | 8,714,000 | | | Petrodorado (Colombia) (a) | | | 1,753,492 | | |
| | 5,714,000 | | | Petrodorado – Warrants
(Colombia) (a) (c) (d)
Oil & Gas Exploration/Production in Colombia,
Peru & Paraguay | | | 213,136
| | |
| | 3,600,000 | | | Canadian Overseas Petroleum
(United Kingdom) (a) (c) | | | 1,194,758 | | |
| | 184,000 | | | Canadian Overseas Petroleum
(United Kingdom) (a) | | | 62,312 | | |
| | 1,800,000 | | | Canadian Overseas Petroleum – Warrants
(United Kingdom) (a) (c) (d)
Oil & Gas Exploration/Production in the North Sea | | | 142,233
| | |
| | 2,575,000 | | | Petromanas (Canada) (a) | | | 391,779 | | |
| | 937,500 | | | Petromanas - Warrants (Canada) (a) (c)
Exploring for Oil in Albania | | | 6,810
| | |
| | 11,000 | | | Continental Resources (a)
Oil & Gas Producer in U.S. | | | 733,810
| | |
| | | | | | | | 20,116,437 | | |
| | | Mining – 0.9% | |
| | 152,000 | | | Kirkland Lake Gold (Canada) (a)
Gold Mining | | | 2,300,702
| | |
| | | Agricultural Commodities – 1.2% | |
| | 250,000 | | | Union Agriculture Group
(Argentina) (a) (c) (d)
Farmland Operator in Uruguay | | | 2,492,500
| | |
| | 6,154,000 | | | Eacom Timber (Canada) (a)
Canadian Lumber Producer | | | 422,851
| | |
| | | | | | | | 2,915,351 | | |
| | | Alternative Energy – 1.0% | |
| | 422,600 | | | Canadian Solar (China) (a) (b)
Solar Cell & Module Manufacturer | | | 1,124,116
| | |
See accompanying notes to financial statements.
9
Wanger Select 2011 Annual Report
Wanger Select
Statement of Investments, December 31, 2011
Number of
Shares | | | | Value | |
| | 582,600 | | | Synthesis Energy Systems (China) (a)
Owner / Operator of Gasification Plants | | $ | 903,030
| | |
| | 252,000 | | | Real Goods Solar (a)
Residential Solar Energy Installer | | | 360,360
| | |
| | | | | | | | 2,387,506 | | |
| | | Oil Services – 0.4% | |
| | 1,716,400 | | | Tuscany International Drilling (a)
South America Based Drilling Rig Contractor | | | 1,010,886
| | |
| | | | | Total Energy & Minerals | | | 28,730,882 | | |
| | | Other Industries – 7.0% | |
| | | Transportation – 3.7% | |
| | 198,250 | | | JB Hunt Transport Services
Truck & Intermodal Carrier | | | 8,935,128
| | |
| | | Real Estate – 2.2% | |
| | 294,500 | | | BioMed Realty Trust
Life Science-focused Office Buildings | | | 5,324,560
| | |
| | | Regulated Utilities – 1.1% | |
| | 79,000 | | | Wisconsin Energy
Wisconsin Utility | | | 2,761,840
| | |
| | | | | Total Other Industries | | | 17,021,528 | | |
| | | Health Care – 2.7% | |
| | | Pharmaceuticals – 1.5% | |
| | 323,600 | | | Akorn (a)
Develops, Manufactures & Sells Specialty Generic Drugs | | | 3,598,432
| | |
| | | Biotechnology & Drug Delivery – 1.2% | |
| | 440,000 | | | NPS Pharmaceuticals (a)
Orphan Drugs & Healthy Royalties | | | 2,899,600
| | |
| | | | | Total Health Care | | | 6,498,032 | | |
Total Equities
(Cost: $213,391,313) — 98.3% | | | 238,534,355 | | |
Number of
Shares | | | | Value | |
| Securities Lending Collateral – 2.9% | |
| | 7,070,330 | | | Dreyfus Government Cash
Management Fund (e)
(7 day yield of 0.00%) | | $ | 7,070,330 | | |
| | | Total Securities Lending Collateral
(Cost: $7,070,330) | | | 7,070,330 | | |
Total Investments
(Cost: $220,461,643) — 101.2% (f) (g) | | | 245,604,685 | | |
Obligation to Return Collateral for
Securities Loaned — (2.9)% | | | (7,070,330 | ) | |
| Cash and Other Assets Less Liabilities — 1.7% | | | 4,009,052 | | |
| Total Net Assets — 100.0% | | $ | 242,543,407 | | |
ADR = American Depositary Receipts
Notes to Statement of Investments:
(a) Non-income producing security.
(b) All or a portion of this security was on loan at December 31, 2011. The total market value of securities on loan at December 31, 2011 is $3,306,194.
(c) Denotes a restricted security, which is subject to restrictions on resale under federal securities laws. These securities are valued in good faith by the Board of Trustees. At December 31, 2011, these securities (in thousands) amounted to $4,049,437, which represents 1.67% of total net assets.
Security | | Acquisition
Dates | | Shares | | Cost | | Value | |
| Union Agriculture Group | | 12/08/10-
12/16/11 | | | 250,000 | | | $ | 2,999,999 | | | $ | 2,492,500 | | |
Canadian Overseas
Petroleum | | 11/24/10 | | | 3,600,000 | | | | 1,539,065 | | | | 1,194,758 | | |
| Petrodorado – Warrants | | 11/20/09 | | | 5,714,000 | | | | 706,004 | | | | 213,136 | | |
Canadian Overseas
Petroleum – Warrants | | 11/24/10 | | | 1,800,000 | | | | 225,295 | | | | 142,233 | | |
| Petromanas – Warrants | | 05/20/10 | | | 937,500 | | | | 54,282 | | | | 6,810 | | |
| | | | | $5,524,645 | | $4,049,437 | |
(d) Illiquid security.
(e) Investment made with cash collateral received from securities lending activity.
See accompanying notes to financial statements.
10
Wanger Select 2011 Annual Report
Wanger Select
Statement of Investments, December 31, 2011
(f) On December 31, 2011, the market value of foreign securities represented 10.1% of total net assets. The Fund's foreign portfolio was diversified as follows:
| | | Value | | Cost | | Percent | |
| Canadian Dollar | | $ | 21,130,096 | | | $ | 19,811,239 | | | | 8.7 | | |
| Hong Kong Dollar | | | 3,316,278 | | | | 3,210,487 | | | | 1.4 | | |
| Total Foreign Portfolio | | $ | 24,446,374 | | | $ | 23,021,726 | | | | 10.1 | | |
(g) At December 31, 2011, for federal income tax purposes, cost of investments was $227,727,211 and net unrealized appreciation was $17,877,474 consisting of gross unrealized appreciation of $62,943,046 and gross unrealized depreciation of $(45,065,572).
Fair Value Measurements
Various inputs are used in determining the value of the Fund's investments, following the input prioritization hierarchy established by GAAP. These inputs are summarized in the three broad levels listed below:
• Level 1 – quoted prices in active markets for identical securities
• Level 2 – prices determined using other significant observable inputs (including quoted prices for similar securities, interest rates, prepayment speeds, credit risk and others)
• Level 3 – prices determined using significant unobservable inputs where quoted prices or observable inputs are unavailable or less reliable (including management's own assumptions about the factors market participants would use in pricing an investment)
The inputs or methodology used for valuing securities are not necessarily an indication of the risk associated with investing in those securities.
Examples of the types of securities in which the Fund would typically invest and how they are classified within this hierarchy are as follows. Typical Level 1 securities include exchange traded domestic equities, mutual funds whose NAVs are published each day and exchange traded foreign equities that are not statistically fair valued. Typical Level 2 securities include exchange traded foreign equities that are statistically fair valued, forward foreign currency exchange contracts and short-term investments valued at amortized cost. Additionally, securities fair valued by the Valuation Committee of the Fund's Board of Trustees that rely on significant observable inputs are also included in Level 2. Typical Level 3 securities include any security fair valued by the Fund's Valuation Committee that relies on significant unobservable inputs.
The following table summarizes the inputs used, as of December 31, 2011, in valuing the Fund's assets:
Investment Type | |
Quoted Prices
(Level 1) | | Other
Significant
Observable
Inputs
(Level 2) | | Significant
Unobservable
Inputs
(Level 3) | | Total | |
| Equities | |
Consumer Goods &
Services | | $ | 50,571,008 | | | $ | 3,316,279 | | | $ | — | | | $ | 53,887,287 | | |
Industrial Goods &
Services | | | 50,864,725 | | | | — | | | | — | | | | 50,864,725 | | |
| Information | | | 43,892,461 | | | | — | | | | — | | | | 43,892,461 | | |
| Finance | | | 37,639,440 | | | | — | | | | — | | | | 37,639,440 | | |
| Energy & Minerals | | | 24,681,445 | | | | 1,556,937 | | | | 2,492,500 | | | | 28,730,882 | | |
| Other Industries | | | 17,021,528 | | | | — | | | | — | | | | 17,021,528 | | |
| Health Care | | | 6,498,032 | | | | — | | | | — | | | | 6,498,032 | | |
| Total Equities | | | 231,168,639 | | | | 4,873,216 | | | | 2,492,500 | | | | 238,534,355 | | |
Total Securities
Lending Collateral | | | 7,070,330 | | | | — | | | | — | | | | 7,070,330 | | |
| Total Investments | | $ | 238,238,969 | | | $ | 4,873,216 | | | $ | 2,492,500 | | | $ | 245,604,685 | | |
The Fund's assets assigned to the Level 2 input category are generally valued using a market approach, in which a security's value is determined through its correlation to prices and information from observable market transactions for similar or identical assets. Foreign equities are generally valued at the last sales price on the foreign exchange or market on which they trade. The Fund may use a systematic fair valuation model, in accordance with the policy adopted by the Board of Trustees, provided by an independent third party to value securities principally traded in foreign markets in order to adjust for possible stale pricing that may occur between the close of the foreign exchanges and the time for valuation. These models take into account available market data including intraday index, ADR, and ETF movements. Securities acquired via private placement that have a holding period or an extended settlement period are valued at a discount to the same shares that are trading freely on the market. These discounts are determined by the adviser's experience with similar securities or situations. Factors may include, but are not limited to, trade volume, shares outstanding and stock price. Warrants which do not trade are valued as a percentage of the actively trading common stock using a model, based on Black Scholes.
The Fund's assets assigned to the Level 3 input category are valued at fair value as determined in good faith under consistently applied procedures established by and under the general supervision of the Board of Trustees. To determine fair value, management will utilize the valuation technique that they deem the most appropriate in the circumstances. Securities for which no market exists are valued based upon the market approach using some unobservable inputs which may include, but are not limited to, projected earnings, available cash, line of business, multiples, and consideration of the prioritization of the equity in a company's capital structure.
The following table shows transfers between Level 1 & Level 2 of the fair value hierarchy:
| Transfers In | | Transfers Out | |
| Level 1 | | Level 2 | | Level 1 | | Level 2 | |
| $ | 12,078,043 | | | $ | — | | | $ | — | | | $ | 12,078,043 | | |
Financial assets were transferred from Level 2 to Level 1 as resale restrictions no longer apply.
See accompanying notes to financial statements.
11
Wanger Select 2011 Annual Report
Wanger Select
Statement of Investments, December 31, 2011
The following table reconciles asset balances for the year ending December 31, 2011, in which significant unobservable inputs (Level 3) were used in determining value:
| Investments in Securities | | Balance as of
December 31,
2010 | | Realized
Gain/(Loss) | | Change in
Unrealized
Appreciation
(Depreciation) | | Purchases | | Sales | | Transfers
into
Level 3 | | Transfers
out of
Level 3 | | Balance as of
December 31,
2011 | |
| Equities | |
| Energy & Minerals | | $ | 2,999,999 | | | $ | — | | | $ | (507,499 | ) | | $ | — | | | $ | — | | | $ | — | | | $ | — | | | $ | 2,492,500 | | |
The information in the above reconciliation table represents fiscal year to date activity for any securities identified as using Level 3 inputs at either the beginning or the end of the current fiscal period.
The change in unrealized depreciation attributed to securities owned at December 31, 2011, which were valued using significant unobservable inputs (Level 3) amounted to $(507,499).
At December 31, 2011, the Fund held investments in the following sectors:
| Sector | | Percentage of
Net Assets | |
| Information | | | 18.1 | | |
| Consumer Goods & Services | | | 22.2 | | |
| Industrial Goods & Services | | | 21.0 | | |
| Finance | | | 15.5 | | |
| Energy & Minerals | | | 11.8 | | |
| Other Industries | | | 7.0 | | |
| Health Care | | | 2.7 | | |
| | | | | | 98.3 | | |
| Securities Lending Collateral | | | 2.9 | | |
| Obligation to Return Collateral for Securities Loaned | | | (2.9 | ) | |
| Cash and Other Assets less Liabilities | | | 1.7 | | |
| | | | 100.0 | | |
See accompanying notes to financial statements.
12
Wanger Select 2011 Annual Report
Statement of Assets and Liabilities
December 31, 2011
| Assets: | |
| Investments, at cost | | $ | 220,461,643 | | |
Investments, at value
(including securities on loan of $3,306,194) | | $ | 245,604,685 | | |
| Cash | | | 4,830,830 | | |
| Receivable for: | |
| Investments sold | | | 129,115 | | |
| Fund shares sold | | | 197 | | |
| Securities lending income | | | 13,162 | | |
| Dividends | | | 263,538 | | |
| Foreign tax reclaims | | | 3,364 | | |
| Prepaid expenses | | | 3,938 | | |
| Total Assets | | | 250,848,829 | | |
| Liabilities: | |
| Collateral on securities loaned | | | 7,070,330 | | |
| Payable for: | |
| Investments purchased | | | 382,500 | | |
| Fund shares repurchased | | | 743,339 | | |
| Investment advisory fee | | | 5,338 | | |
| Administration fee | | | 334 | | |
| Transfer agent fee | | | 1 | | |
| Trustees' fees | | | 23,348 | | |
| Custody fee | | | 2,573 | | |
| Reports to shareholders | | | 43,490 | | |
| Chief compliance officer expenses | | | 634 | | |
| Other liabilities | | | 33,535 | | |
| Total Liabilities | | | 8,305,422 | | |
| Net Assets | | $ | 242,543,407 | | |
| Composition of Net Assets: | |
| Paid-in capital | | $ | 228,146,334 | | |
| Accumulated net investment loss | | | (33,531 | ) | |
| Accumulated net realized loss | | | (10,712,438 | ) | |
| Net unrealized appreciation on investments | | | 25,143,042 | | |
| Net Assets | | $ | 242,543,407 | | |
| Fund Shares Outstanding | | | 10,385,285 | | |
Net asset value, offering price and redemption
price per share | | $ | 23.35 | | |
Statement of Operations
For the Year Ended December 31, 2011
| Investment Income: | |
| Dividends (net foreign taxes withheld of $23,872) | | $ | 2,017,777 | | |
| Interest income | | | 1,638 | | |
| Securities lending income, net | | | 51,877 | | |
| Total Investment Income | | | 2,071,292 | | |
| Expenses: | |
| Investment advisory fee | | | 2,385,779 | | |
| Administration fee | | | 149,111 | | |
| Transfer agent fee | | | 230 | | |
| Trustees' fees | | | 14,665 | | |
| Custody fee | | | 52,138 | | |
| Reports to shareholders | | | 71,599 | | |
| Professional fees | | | 55,117 | | |
| Chief compliance officer expenses (See Note 4) | | | 11,993 | | |
| Other expenses (See Note 5) | | | 44,101 | | |
| Total Expenses | | | 2,784,733 | | |
| Custody earnings credit | | | (30 | ) | |
| Net Expenses | | | 2,784,703 | | |
| Net Investment Loss | | | (713,411 | ) | |
Net Realized and Unrealized Gain (Loss)
on Investments: | |
| Net realized gain (loss) on: | |
| Investments | | | 21,899,595 | | |
| Foreign currency transactions | | | (12,775 | ) | |
| Net realized gain | | | 21,886,820 | | |
| Net change in unrealized appreciation (depreciation) on: | |
| Investments | | | (77,026,053 | ) | |
| Foreign currency translations | | | (254 | ) | |
| Net change in unrealized depreciation | | | (77,026,307 | ) | |
| Net Loss | | | (55,139,487 | ) | |
| Net Decrease in Net Assets from Operations | | $ | (55,852,898 | ) | |
See accompanying notes to financial statements.
13
Wanger Select 2011 Annual Report
Statement of Changes in Net Assets
| | | Year Ended December 31, | |
| Increase (Decrease) in Net Assets | | 2011 | | 2010 | |
| Operations: | |
| Net investment loss | | $ | (713,411 | ) | | $ | (1,102,852 | ) | |
| Net realized gain (loss) on: | |
| Unaffiliated investments | | | 21,899,595 | | | | 6,624,963 | | |
| Affiliated investments | | | — | | | | 5,633,250 | | |
| Foreign currency transactions | | | (12,775 | ) | | | 81,501 | | |
| Net change in unrealized appreciation (depreciation) on: | |
| Unaffiliated investments | | | (77,026,053 | ) | | | 58,926,777 | | |
| Affiliated investments | | | — | | | | 813,341 | | |
| Foreign currency translations | | | (254 | ) | | | 254 | | |
| Net Increase (Decrease) in Net Assets from Operations | | | (55,852,898 | ) | | | 70,977,234 | | |
| Distributions to Shareholders: | |
| From net investment income | | | (6,570,049 | ) | | | (1,632,499 | ) | |
| Share Transactions: | |
| Subscriptions | | | 16,603,789 | | | | 40,253,904 | | |
| Distributions reinvested | | | 6,570,049 | | | | 1,632,499 | | |
| Redemptions | | | (64,167,013 | ) | | | (35,639,991 | ) | |
| Net Increase (Decrease) from Share Transactions | | | (40,993,175 | ) | | | 6,246,412 | | |
| Total Increase (Decrease) in Net Assets | | | (103,416,122 | ) | | | 75,591,147 | | |
| Net Assets: | |
| Beginning of period | | | 345,959,529 | | | | 270,368,382 | | |
| End of period | | $ | 242,543,407 | | | $ | 345,959,529 | | |
| Accumulated net investment loss | | $ | (33,531 | ) | | $ | (2,901,264 | ) | |
See accompanying notes to financial statements.
14
Wanger Select 2011 Annual Report
Financial Highlights
| | | Year Ended December 31, | |
| Selected data for a share outstanding throughout each period | | 2011 | | 2010 | | 2009 | | 2008 | | 2007 | |
| Net Asset Value, Beginning of Period | | $ | 28.99 | | | $ | 23.05 | | | $ | 13.87 | | | $ | 28.08 | | | $ | 26.15 | | |
| Income from Investment Operations: | |
| Net investment loss (a) | | | (0.06 | ) | | | (0.09 | ) | | | (0.08 | ) | | | (0.10 | ) | | | (0.04 | ) | |
| Net realized and unrealized gain (loss) on investments and foreign currency | | | (4.99 | ) | | | 6.17 | | | | 9.26 | | | | (13.38 | ) | | | 2.47 | | |
| Total from Investment Operations | | | (5.05 | ) | | | 6.08 | | | | 9.18 | | | | (13.48 | ) | | | 2.43 | | |
| Less Distributions to Shareholders: | |
| From net investment income | | | (0.59 | ) | | | (0.14 | ) | | | — | | | | — | | | | — | | |
| From net realized gains | | | — | | | | — | | | | — | | | | (0.73 | ) | | | (0.50 | ) | |
| Total Distributions to Shareholders | | | (0.59 | ) | | | (0.14 | ) | | | — | | | | (0.73 | ) | | | (0.50 | ) | |
| Net Asset Value, End of Period | | $ | 23.35 | | | $ | 28.99 | | | $ | 23.05 | | | $ | 13.87 | | | $ | 28.08 | | |
| Total Return (b) | | | (17.68 | )% | | | 26.57 | % | | | 66.19 | % | | | (49.06 | )% | | | 9.39 | % | |
| Ratios to Average Net Assets/Supplemental Data: | |
| Net expenses (c) | | | 0.93 | % | | | 0.93 | % | | | 0.95 | % | | | 0.91 | % | | | 0.90 | % | |
| Net investment loss (c) | | | (0.24 | )% | | | (0.38 | )% | | | (0.44 | )% | | | (0.45 | )% | | | (0.15 | )% | |
| Portfolio turnover rate | | | 23 | % | | | 30 | % | | | 35 | % | | | 36 | % | | | 15 | % | |
| Net assets, end of period (000s) | | $ | 242,543 | | | $ | 345,960 | | | $ | 270,368 | | | $ | 156,588 | | | $ | 316,380 | | |
(a) Net investment income per share was based upon the average shares outstanding during the period.
(b) Total return at net asset value assuming all distributions reinvested.
(c) The benefits derived from custody fees paid indirectly had an impact of less than 0.01%.
See accompanying notes to financial statements.
15
Wanger Select 2011 Annual Report
Notes to Financial Statements
1. Nature of Operations
Wanger Select (the Fund), is a series of Wanger Advisors Trust (the Trust), an open-end management investment company organized as a Massachusetts business trust. The investment objective of the Fund is to seek long-term capital appreciation. The Fund is available only for allocation to certain life insurance company separate accounts established for the purpose of funding qualified and nonqualified variable annuity contracts and variable life insurance policies and may also be offered directly to certain types of pension plans and retirement arrangements.
2. Significant Accounting Policies
The preparation of financial statements in accordance with accounting principles generally accepted in the United States of America (GAAP) requires management to make certain estimates and assumptions that affect the reported amounts of assets and liabilities, the disclosure of contingent assets and liabilities at the date of the financial statements and the reported amounts of revenue and expenses during the reporting period. Actual results could differ from those estimates.
Security valuation
Securities of the Fund are valued at market value or, if a market quotation for a security is not readily available or is deemed not to be reliable because of events or circumstances that have occurred between the market quotation and the time as of which the security is to be valued, the security is valued at its fair value determined in good faith under consistently applied procedures established by the Board of Trustees. A security traded on a securities exchange or in an over-the-counter market in which transaction prices are reported is valued at the last sales price at the time of valuation. A security traded principally on NASDAQ is valued at the NASDAQ official closing price. Mutual Funds and Exchange Traded Funds are valued at their closing net asset value as reported to NASDAQ. A security for which there is no reported sale on the valuation date is valued at the latest bid quotation.
Short-term investments maturing in 60 days or less are valued at amortized cost, which approximates market value.
A security for which a market quotation is not readily available and any other assets are valued at their fair value determined in good faith under consistently applied procedures established by the Board of Trustees. The Trust has retained an independent statistical fair value pricing service that employs a systematic methodology to assist in the fair valuation process for securities principally traded in a foreign market in order to adjust for possible changes in value that may occur between the close of the foreign market and the time as of which the securities are to be valued. If a security is valued at a fair value, that value may be different from the last quoted market price for the security. A security for which there is no reported sale on the valuation date is valued at the latest bid quotations.
Foreign currency translations
Values of investments denominated in foreign currencies are converted into U.S. dollars using the New York spot market rate of exchange at the time of valuation. Purchases and sales of investments and dividend and interest income are translated into U.S. dollars using the spot market rate of exchange prevailing on the respective dates of such transactions. The gain or loss resulting from changes in foreign exchange rates is included with net realized and unrealized gain or loss from investments, as appropriate.
Repurchase agreements
The Fund may engage in repurchase agreement transactions. The Fund, through its custodian, receives delivery of underlying securities collateralizing each repurchase agreement. The counterparty is required to maintain collateral that is at all times at least equal to the repurchase price including interest. In the event of default or bankruptcy by the other party to the agreement, realization and/or retention of the collateral may be subject to legal proceedings.
Restricted securities
Restricted securities are securities that may only be resold upon registration under federal securities laws or in transactions exempt from registration. In some cases, the issuer of restricted securities has agreed to register such securities for resale at the issuer's expense either upon demand by the Fund or in connection with another registered offering of the securities. Many restricted securities may be resold in the secondary market in transactions exempt from registration. Such restricted securities may be determined to be liquid under criteria established by the Board of Trustees.
Security transactions and investment income
Security transactions are accounted for on the trade date (date the order to buy or sell is executed) and dividend income is recorded on the ex-dividend date, except that certain dividends from foreign securities are recorded as soon as the information is available to the Fund. Interest income is recorded on the accrual basis and includes amortization of discounts on debt obligations when required for federal income tax purposes. Realized gains and losses from security transactions are recorded on an identified cost basis.
Awards, if any, from class action litigation related to securities owned may be recorded as a reduction of cost of those securities. If the applicable securities are no longer owned, the proceeds are recorded as realized gains.
The Fund estimates the tax character of distributions from real estate investment trusts (REITs). Distributions received in excess of income are recorded as a reduction of the cost of the related investments. If the applicable securities are no longer owned, any distributions received in excess of income are recorded as realized gains.
Expenses
General expenses of the Trust are allocated to the Fund and the other series of the Trust based upon relative net assets or other expense allocation methodologies determined by the nature of the expense. Expenses directly attributable to the Fund are charged to the Fund.
Fund share valuation
Fund shares are sold and redeemed on a continuing basis at net asset value. Net asset value per share is determined daily as of the close of trading on the New York Stock Exchange (the Exchange) on each day the Exchange is open for trading by dividing the total value of the Fund's investments and other assets, less liabilities, by the number of Fund shares outstanding.
Securities lending
The Fund may lend securities up to one-third of the value of its total assets to certain approved brokers, dealers and other financial institutions to earn additional income. The Fund retains the benefits of owning the securities, including receipt of dividends or interest generated by the security. The Fund also receives a fee for the loan. The Fund has the ability to recall the loans at any time and could do so in order to vote proxies or to sell the loaned securities. Each loan is collateralized by cash that exceeded the value of the securities on loan. The market value of the loaned securities is determined daily at the close of business of the Fund and any additional required collateral is delivered to each Fund on the next business day. The Fund has elected to invest the cash collateral in the Dreyfus Government Cash Management Fund, and the income earned is paid to the Fund, net of any fees remitted to Goldman Sachs Agency Lending, the Fund's lending agent, and borrower rebates. The Fund's adviser, Columbia Wanger Asset Management, LLC (CWAM), does not retain any fees earned by the lending program. Generally, in the event of borrower default, the Fund has the right to use the collateral to offset any losses incurred. In the event the Fund is delayed or prevented from exercising its right to dispose of the collateral, there may be a potential loss to the Fund. Some of these losses may be indemnified by the lending agent. The Fund bears the risk of loss with respect to the investment of collateral.
The net lending income earned by the Fund as of December 31, 2011, is included in the Statement of Operations.
16
Wanger Select 2011 Annual Report
Notes to Financial Statements, continued
Custody fees/Credits
Custody fees are reduced based on the Fund's cash balances maintained with the custodian. The amount is disclosed as a reduction of total expenses in the Statement of Operations.
Federal income taxes
The Fund has complied with the provisions of the Internal Revenue Code available to regulated investment companies and, in the manner provided therein, distributes substantially all its taxable income, as well as any net realized gain on sales of investments and foreign currency transactions reportable for federal income tax purposes. Accordingly, the Fund paid no federal income taxes and no federal income tax provision was required.
Foreign capital gains taxes
Gains in certain countries may be subject to foreign taxes at the fund level. The Fund accrues for such foreign taxes on net realized and unrealized gains at the appropriate rate for each jurisdiction.
Distributions to shareholders
Distributions to shareholders are recorded on the ex-dividend date.
Indemnification
In the normal course of business, the Trust on behalf of the Fund enters into contracts that contain a variety of representations and warranties and that provide general indemnities. The Fund's maximum exposure under these arrangements is unknown, as this would involve future claims against the Fund. Also under the Trust's organizational documents, the trustees and officers of the Trust are indemnified against certain liabilities that may arise out of their duties to the Trust. However based on experience, the Fund expects the risk of loss due to these warranties and indemnities to be remote.
Recent Accounting Pronouncement
Fair Value Measurements and Disclosures
In May 2011, the Financial Accounting and Standards Board issued ASU No. 2011-04 modifying Topic 820, Fair Value Measurements and Disclosures. At the same time, the International Accounting Standards Board issued International Financial Reporting Standard 13, Fair Value Measurement. The objective of the FASB and IASB is convergence of their guidance on fair value measurements and disclosures.
Specifically, ASU No. 2011-04 requires reporting entities to disclose i) the amounts of any transfers between Level 1 and Level 2, and the reasons for the transfers, ii) for Level 3 fair value measurements, a) quantitative information about significant unobservable inputs used, b) a description of the valuation processes used by the reporting entity and c) a narrative description of the sensitivity of the fair value measurement to changes in unobservable inputs if a change in those inputs might result in a significantly higher or lower fair value measurement. The effective date of ASU No. 2011-04 is for interim and annual periods beginning after December 15, 2011. At this time, management is evaluating the implications of this guidance and the impact it will have on the financial statement amounts and footnote disclosures, if any.
3. Federal Tax Information
The timing and character of income and capital gain distributions are determined in accordance with income tax regulations, which may differ from GAAP. Reclassifications are made to the Fund's capital accounts for permanent tax differences to reflect income and gains available for distribution (or available capital loss carryforwards) under income tax regulations.
For the year ended December 31, 2011, permanent book and tax basis differences resulting primarily from passive foreign investment company (PFIC) holdings, former PFIC holdings, foreign currency transactions and net operating losses were identified and reclassified among the components of the Fund's net assets as follows:
Accumulated
Net Investment
Income | | Accumulated
Net Realized
Loss | | Paid-In Capital | |
| $ | 10,151,193 | | | $ | (5,229,117 | ) | | $ | (4,922,076 | ) | |
Net investment income and net realized gains (losses), as disclosed on the Statement of Operations, and net assets were not affected by this reclassification.
The tax character of distributions paid during the years ended December 31, 2011 and December 31, 2010 were as follows:
| | | December 31, 2011 | | December 31, 2010 | |
| Ordinary Income* | | $ | 6,570,049 | | | $ | 1,632,499 | | |
* For tax purposes short-term capital gain distributions, if any, are considered ordinary income distributions.
As of December 31, 2011, the components of distributable earnings on a tax basis were as follows:
Undistributed
Ordinary Income | | Undistributed
Long-Term
Capital Gains | | Net Unrealized
Appreciation* | |
| $ | — | | | $ | — | | | $ | 17,877,474 | | |
* The differences between book-basis and tax-basis net unrealized appreciation/depreciation are primarily due to deferral of losses from wash sales and passive foreign investment company (PFIC) adjustments.
The following capital loss carryforward, determined as of December 31, 2011, may be available to reduce taxable income arising from future net realized gains on investments, if any, to the extent permitted by the Internal Revenue Code:
Year of
Expiration | | Amount | |
| | 2017 | | | $ | 3,446,870 | | |
On December 22, 2010, the Regulated Investment Company Modernization Act of 2010 (the Act) was enacted, which changed various technical rules governing the tax treatment of regulated investment companies. The changes are generally effective for taxable years beginning after the date of enactment. Under the Act, the Fund will be permitted to carry forward capital losses incurred in taxable years beginning after the date of enactment for an unlimited period. However, any losses incurred during those future taxable years will be required to be utilized prior to the losses incurred in pre-enactment taxable years, which carry an expiration date. As a result of this ordering rule, pre-enactment capital loss carryforwards may be more likely to expire unused.
Capital loss carryforwards that were utilized for the Fund during the year ended December 31, 2011, were $19,993,567.
Under current tax rules, regulated investment companies can elect to treat certain late-year ordinary losses incurred and post-October capital losses (capital losses realized after October 31) as arising on the first day of the following taxable year. As of December 31, 2011, the Fund will elect to treat late-year ordinary losses of $11,470 as arising on January 1, 2012.
Management is required to determine whether a tax position of the Fund is more likely than not to be sustained upon examination by the applicable taxing authority, including resolution of any related appeals or litigation processes, based on the technical merits of the position. The tax benefit to be recognized by the Fund is measured as the largest amount of benefit that is greater than fifty percent likely of being realized upon ultimate settlement. Management is not aware of any tax positions for which it is reasonably possible that the total amounts of unrecognized
17
Wanger Select 2011 Annual Report
Notes to Financial Statements, continued
tax benefits will significantly change in the next twelve months. However, management's conclusions may be subject to review and adjustment at a later date based on factors including, but not limited to, new tax laws, regulations, and administrative interpretations (including relevant court decisions). The Fund's federal tax returns for the prior three fiscal years remain subject to examination by the Internal Revenue Service.
4. Transactions With Affiliates
CWAM is a wholly owned subsidiary of Columbia Management Investment Advisers, LLC (Columbia Management), which in turn is a wholly owned subsidiary of Ameriprise Financial, Inc. (Ameriprise Financial). CWAM furnishes continuing investment supervision to the Fund and is responsible for the overall management of the Fund's business affairs.
CWAM receives a monthly advisory fee based on the Fund's average daily net assets at the following annual rates:
| Average Daily Net Assets | | Annual Fee Rate | |
| Up to $500 million | | | 0.80 | % | |
| $500 million and over | | | 0.78 | % | |
For the year ended December 31, 2011, the effective investment advisory fee rate was 0.80% of the Fund's average daily net assets.
Through April 30, 2012, CWAM has contractually agreed to reimburse the Fund to the extent that ordinary operating expenses (exclusive of brokerage commissions, interest, taxes and extraordinary expenses, but inclusive of custodian charges relating to overdrafts, if any), after giving effect to any balance credits from the Fund's custodian, exceed an annual percentage of 1.35% of average daily net assets on an annualized basis. For the year ended December 31, 2011 the Fund was not reimbursed any expenses.
CWAM provides administrative services and receives an administration fee from the Fund at the following annual rates:
Wanger Advisors Trust Aggregate
Average Daily Net Assets of the Trust | | Annual Fee Rate | |
| Up $4 billion to | | | 0.05 | % | |
| $4 billion to $6 billion | | | 0.04 | % | |
| $6 billion to $8 billion | | | 0.03 | % | |
| $8 billion and over | | | 0.02 | % | |
For the year ended December 31, 2011, the effective administration fee rate was 0.05% of the Fund's average daily net assets. Columbia Management provides certain sub-administrative services to the Fund.
Columbia Management Investment Distributors, Inc. (CMID), a wholly owned subsidiary of Ameriprise Financial, serves as the Fund's distributor and principal underwriter.
Columbia Management Investment Services Corp. (CMIS), a wholly owned subsidiary of Ameriprise Financial, is the transfer agent of the Funds. For its services, the Fund pays CMIS a monthly fee at the annual rate of $21.00 per open account. CMIS also receives reimbursement from the Fund for certain out-of-pocket expenses.
Certain officers and trustees of the Trust are also officers of CWAM. The Trust makes no direct payments to its officers and trustees who are affiliated with CWAM.
The Board of Trustees has appointed a Chief Compliance Officer of the Trust in accordance with federal securities regulations. The Fund, along with other affiliated funds, pays its pro-rata share of the expenses associated with the Office of the Chief Compliance Officer. These expenses are disclosed separately as "Chief compliance officer expenses" in the Statement of Operations.
The Trust offers a deferred compensation plan for its independent trustees. Under that plan, a trustee may elect to defer all or a portion of his or her compensation. Amounts deferred are retained by the Trust and may represent an unfunded obligation of the Trust. The value of amounts deferred is determined by reference to the change in value of Class Z shares of one or more series of Columbia Acorn Trust or a money market fund as specified by the trustee. Benefits under the deferred compensation plan are payable in accordance with the plan.
For the year ended December 31, 2011, the Fund engaged in purchase and sales transactions with funds that have a common investment adviser (or affiliated investment advisers), common directors/trustees, and/or common officers. Those purchase and sale transactions complied with provisions of Rule 17a-7 under the Investment Company Act of 1940 and were $—and $844,060, respectively.
5. Borrowing Arrangements
Effective July 22, 2011, the Trust participates in a $150 million credit facility with JPMorgan Chase Bank, N.A., along with another Trust managed by CWAM, which was entered into to facilitate portfolio liquidity. Under the facility, interest is charged to each participating Fund based on its borrowings at a rate per annum equal to the higher of Federal Funds Rate or Overnight LIBOR plus 1.25%. In addition, a commitment fee of 0.10% per annum of the unutilized line of credit is accrued and apportioned among the participating Funds based on their relative net assets. The commitment fee is included in "Other expenses" in the Statement of Operations. The Trust enters into this line of credit for one year durations.
Prior to July 22, 2011, the Trust participated in a $150 million credit facility with State Street Bank and Trust Company (State Street) under similar lending terms. The commitment fee under the State Street arrangement was 0.125% per annum of the unutilized line of credit.
No amounts were borrowed by the Fund under either facility during the year ended December 31, 2011.
6. Fund Share Transactions
Proceeds and payments on Fund shares as shown in the Statement of Changes in Net Assets are in respect of the following numbers of shares:
| | | Year ended
December 31, 2011 | | Year Ended
December 31, 2010 | |
| Shares sold | | | 609,932 | | | | 1,613,837 | | |
Shares issued in reinvestment
of dividend distributions | | | 245,977 | | | | 74,306 | | |
| Less shares redeemed | | | (2,405,373 | ) | | | (1,485,474 | ) | |
| Net increase (decrease) in shares outstanding | | | (1,549,464 | ) | | | 202,669 | | |
7. Investment Transactions
The aggregate cost of purchases and proceeds from sales other than short-term obligations for the year ended December 31, 2011, were $69,283,782 and $113,349,340, respectively.
8. Shareholder Concentration
At December 31, 2011, one unaffiliated shareholder account owned 84.0% of the outstanding shares of the Fund. The Fund has no knowledge about whether any portion of those shares was owned beneficially. Subscription and redemption activity of these accounts may have a significant effect on the operations of the Fund.
9. Subsequent Events
Management has evaluated the events and transactions that have occurred through the date the financial statements were issued and noted no items requiring adjustment of the financial statements or additional disclosure.
10. Information Regarding Pending and Settled Legal Proceedings
In June 2004, an action captioned John E. Gallus et al. v. American Express Financial Corp. and American Express Financial Advisors Inc. was filed in the United States District Court for the District of Arizona. The plaintiffs allege that they are investors in several American Express Company mutual funds (branded as Columbia) and they purport to bring the action derivatively on behalf of those funds under the Investment Company Act of 1940. The plaintiffs allege that fees allegedly paid to the defendants by the funds for investment advisory and administrative services are excessive. The
18
Wanger Select 2011 Annual Report
Notes to Financial Statements, continued
plaintiffs seek remedies including restitution and rescission of investment advisory and distribution agreements. The plaintiffs voluntarily agreed to transfer this case to the United States District Court for the District of Minnesota (the District Court). In response to defendants' motion to dismiss the complaint, the District Court dismissed one of plaintiffs' four claims and granted plaintiffs limited discovery. Defendants moved for summary judgment in April 2007. Summary judgment was granted in the defendants' favor on July 9, 2007. The plaintiffs filed a notice of appeal with the Eighth Circuit Court of Appeals (the Eighth Circuit) on August 8, 2007. On April 8, 2009, the Eighth Circuit reversed summary judgment and remanded to the District Court for further proceedings. On August 6, 2009, defendants filed a writ of certiorari with the U.S. Supreme Court (the Supreme Court), asking the Supreme Court to stay the District Court proceedings while the Supreme Court considers and rules in a case captioned Jones v. Harris Associates, which involves issues of law similar to those presented in the Gallus case. On March 30, 2010, the Supreme Court issued its ruling in Jones v. Harris Associates, and on April 5, 2010, the Supreme Court vacated the Eighth Circuit's decision in the Gallus case and remanded the case to the Eighth Circuit for further consideration in light of the Supreme Court's decision in Jones v. Harris Associates. On June 4, 2010, the Eighth Circuit remanded the Gallus case to the District Court for further consideration in light of the Supreme Court's decision in Jones v. Harris Associates. On December 9, 2010, the District Court reinstated its July 9, 2007 summary judgment order in favor of the defendants. On January 10, 2011, plaintiffs filed a notice of appeal with the Eighth Circuit. In response to the plaintiffs' opening appellate brief filed on March 18, 2011, the defendants filed a response brief on May 4, 2011 with the Eighth Circuit. The plaintiffs filed a reply brief on May 26, 2011 and oral arguments took place on November 17, 2011.
In December 2005, without admitting or denying the allegations, American Express Financial Corporation (AEFC, which is now known as Ameriprise Financial, Inc. (Ameriprise Financial)), entered into settlement agreements with the Securities and Exchange Commission (SEC) and Minnesota Department of Commerce (MDOC) related to market timing activities. As a result, AEFC was censured and ordered to cease and desist from committing or causing any violations of certain provisions of the Investment Advisers Act of 1940, the Investment Company Act of 1940, and various Minnesota laws. AEFC agreed to pay disgorgement of $10 million and civil money penalties of $7 million. AEFC also agreed to retain an independent distribution consultant to assist in developing a plan for distribution of all disgorgement and civil penalties ordered by the SEC in accordance with various undertakings detailed at www.sec.gov/litigation/admin/ia-2451.pdf. Ameriprise Financial and its affiliates have cooperated with the SEC and the MDOC in these legal proceedings, and have made regular reports to the funds' Boards of Trustees.
Ameriprise Financial and certain of its affiliates have historically been involved in a number of legal, arbitration and regulatory proceedings, including routine litigation, class actions, and governmental actions, concerning matters arising in connection with the conduct of their business activities. Ameriprise Financial believes that the Funds are not currently the subject of, and that neither Ameriprise Financial nor any of its affiliates are the subject of, any pending legal, arbitration or regulatory proceedings that are likely to have a material adverse effect on the Funds or the ability of Ameriprise Financial or its affiliates to perform under their contracts with the Funds. Ameriprise Financial is required to make 10-Q, 10-K and, as necessary, 8-K filings with the Securities and Exchange Commission on legal and regulatory matters that relate to Ameriprise Financial and its affiliates. Copies of these filings may be obtained by accessing the SEC website at www.sec.gov.
There can be no assurance that these matters, or the adverse publicity associated with them, will not result in increased fund redemptions, reduced sale of fund shares or other adverse consequences to the Funds. Further, although we believe proceedings are not likely to have a material adverse effect on the Funds or the ability of Ameriprise Financial or its affiliates to perform under their contracts with the Funds, these proceedings are subject to uncertainties and, as such, we are unable to estimate the possible loss or range of loss that may result. An adverse outcome in one or more of these proceedings could result in adverse judgments, settlements, fines, penalties or other relief that could have a material adverse effect on the consolidated financial condition or results of operations of Ameriprise Financial.
19
Wanger Select 2011 Annual Report
Report of Independent Registered Public Accounting Firm
To the Board of Trustees and Shareholders of Wanger Select:
In our opinion, the accompanying statement of assets and liabilities, including the statement of investments, and the related statements of operations and of changes in net assets and the financial highlights present fairly, in all material respects, the financial position of Wanger Select (a series of the Wanger Advisers Trust, hereinafter referred to as the "Fund") at December 31, 2011, the results of its operations for the year then ended, the changes in its net assets for each of the two years in the period then ended and the financial highlights for each of the five years in the period then ended, in conformity with accounting principles generally accepted in the United States of America. These financial statements and financial highlights (hereafter referred to as "financial statements") are the responsibility of the Fund's management; our responsibility is to express an opinion on these financial statements based on our audits. We conducted our audits of these financial statements in accordance with the standards of the Public Company Accounting Oversight Board (United States). Those standards require that we plan and perform the audit to obtain reasonable assurance about whether the financial statements are free of material misstatement. An audit includes examining, on a test basis, evidence supporting the amounts and disclosures in the financial statements, assessing the accounting principles used and significant estimates made by management, and evaluating the overall financial statement presentation. We believe that our audits, which included confirmation of securities at December 31, 2011 by correspondence with the custodian and brokers, provide a reasonable basis for our opinion.
PricewaterhouseCoopers LLP
Chicago, Illinois
February 17, 2012
20
Wanger Select 2011 Annual Report
Federal Income Tax Information (Unaudited)
20.04% of the ordinary income distributed by the Fund, for the year ended December 31, 2011, qualified for the corporate dividends received deduction.
21
Wanger Select 2011 Annual Report
Board of Trustees and Management of Wanger Advisors Trust
Each trustee may serve a term of unlimited duration. The Trust's By-laws generally require that a trustee retire at the end of the calendar year in which the trustee attains the age of 75 years. The trustees appoint their own successors, provided that at least two-thirds of the trustees, after such appointment, have been elected by shareholders. Shareholders may remove a trustee, with or without cause, upon the vote of two-thirds of the Trust's outstanding shares at any meeting called for that purpose. A trustee may be removed, with or without cause, upon the vote of a majority of the trustees. The names of the trustees and officers of the Trust, the date each was first elected or appointed to office, their principal business occupations during at least the last five years, number of portfolios in the fund complex they oversee, and other directorships they hold, are shown below. Each trustee serves in such capacity for each of the four series of Wanger Advisors Trust and for each of the eight series of Columbia Acorn Trust.
The address for the trustees and officers of the Trust is Columbia Wanger Asset Management, LLC, 227 West Monroe Street, Suite 3000, Chicago, Illinois 60606. The Funds' Statement of Additional Information includes additional information about the Funds' trustees and officers. You may obtain a free copy of the Statement of Additional Information by writing or calling toll-free:
Columbia Wanger Asset Management, LLC
Shareholder Services Group
227 W. Monroe, Suite 3000
Chicago IL 60606
1-800-922-6769
Name, Position(s) with
Wanger Advisors Trust
and Age at
December 31, 2011 | | Year First
Elected or
Appointed
to Office* | | Principal Occupation(s) during
Past Five Years | | Number of
Portfolios in
Fund Complex
Overseen by
Trustee/Officer | | Other
Directorships
in addition to
Wanger Advisors Trust | |
| Trustees who are not interested persons of Wanger Advisors Trust: | | | | | | | |
|
Laura M. Born, 46,
Trustee and Chair | | | 2007 | | | Adjunct Assistant Professor of Finance, University of Chicago Booth School of Business; formerly, Managing Director – Investment Banking, JP Morgan Chase & Co. (broker/dealer) 2002-2007; prior thereto, associated with JP Morgan as an investment professional since 1991. | | | 12 | | | Columbia Acorn Trust | |
|
Michelle L. Collins, 51,
Trustee | | | 2008 | | | President, Cambium LLC (financial and business advisory firm) since 2007; Advisory Board Member, Svoboda Capital Partners LLC (private equity firm) since 2007; Managing Director Svoboda Capital Partners LLC, 1998-2006. | | | 12 | | | Columbia Acorn Trust; Bucyrus International, Inc. (mining equipment manufacturer); Molex, Inc. (electronics components manufacturer); CDW Corporation (electronics components manufacturer) until October 2007. | |
|
Maureen M. Culhane, 63,
Trustee | | | 2007 | | | Retired. Formerly, Vice President, Goldman Sachs Asset Management, L.P. (investment adviser), 2005-2007, and Vice President (Consultant) — Strategic Relationship Management, Goldman Sachs & Co., 1999-2005. | | | 12 | | | Columbia Acorn Trust | |
|
Margaret M. Eisen, 58,
Trustee | | | 2002 | | | Chief Investment Officer, EAM International LLC (corporate finance and asset management) since 2003; Managing Director, CFA Institute, 2005-2008. | | | 12 | | | Columbia Acorn Trust; Antigenics, Inc. (biotechnology and pharmaceuticals) until June 2009. | |
|
John C. Heaton, 52,
Trustee | | | 2010 | | | Joseph L. Gidwitz Professor of Finance, University of Chicago Booth School of Business; James H. Lorie Professor of Finance, University of Chicago Booth School of Business, July 2000 – July 2006; financial consultant since 2004. | | | | Columbia Acorn Trust | |
|
Steven N. Kaplan, 52,
Trustee and Vice Chair | | | 1999 | | | Neubauer Family Professor of Entrepreneurship and Finance, University of Chicago Booth School of Business; faculty member of the University of Chicago Booth School of Business since 1998. | | | 12 | | | Columbia Acorn Trust; Accretive Health, Inc. (healthcare management services provider); Morningstar, Inc. (provider of independent investment research). | |
|
22
Wanger Select 2011 Annual Report
Board of Trustees and Management of Wanger Advisors Trust
Name, Position(s) with
Wanger Advisors Trust
and Age at
December 31, 2011 | | Year First
Elected or
Appointed
to Office* | | Principal Occupation(s) during
Past Five Years | | Number of
Portfolios in
Fund Complex
Overseen by
Trustee/Officer | | Other
Directorships
in addition to
Wanger Advisors Trust | |
| Trustees who are not interested persons of Wanger Advisors Trust: (continued) | | | | | | | |
|
Allan B. Muchin, 75,
Trustee (1) | | | 1998 | | | Chairman Emeritus, Katten Muchin Rosenman LLP (law firm). | | | 12 | | | Columbia Acorn Trust | |
|
David J. Rudis, 58,
Trustee (2) | | | 2010 | | | National Checking and Debit Executive, and Illinois President, Bank of America, 2007 – 2009; President, Consumer Banking Group, LaSalle National Bank, 2004 – 2007. | | | 12 | | | Columbia Acorn Trust | |
|
David B. Small, 55,
Trustee | | | 2010 | | | Managing Director, Grosvenor Capital Management, L.P. (investment adviser) since 1994; Adjunct Associate Professor of Finance, University of Chicago Booth School of Business. | | | 12 | | | Columbia Acorn Trust | |
|
| Trustees who are interested persons of Wanger Advisors Trust: | | | | | | | |
|
Charles P. McQuaid, 58,
Trustee and President (3) | | | 1992 | | | President and Chief Investment Officer, CWAM or its predecessors, since October 2003; associated with CWAM or its predecessors as an investment professional since 1978. | | | 12 | | | Columbia Acorn Trust | |
|
| Trustee Emeritus | | | | | | | |
|
Ralph Wanger, 77,
Trustee Emeritus (4) | | | 1970 | | | Founder, CWAM. Formerly, President, Chief Investment Officer and portfolio manager, CWAM or its predecessors, July 1992 – September 2003; Director, Wanger Investment Company PLC; Consultant to CWAM or its predecessors, September 2003 – September 2005. | | | 12 | | | Columbia Acorn Trust | |
|
| Officers of Wanger Advisors Trust: | | | | | | | |
|
Ben Andrews, 45,
Vice President | | | 2004 | | | Portfolio manager and analyst, CWAM or its predecessors, since 1998; Vice President, Columbia Acorn Trust and Wanger Advisors Trust since 2004. | | | 12 | | | None | |
|
Robert A. Chalupnik, 45,
Vice President | | | 2011 | | | Portfolio manager and analyst, CWAM or its predecessors since 1998. Vice President Columbia Acorn Trust and Wanger Advisors Trust since May 2011. | | | 12 | | | None | |
|
Michael G. Clarke, 42,
Assistant Treasurer | | | 2004 | | | Vice President, Columbia Management Investment Advisers, LLC since May 2010; Managing Director of Fund Administration, Columbia Management Advisors, LLC, from September 2004 to April 2010; senior officer of Columbia Funds and affiliated funds since 2002. | | | 12 | | | None | |
|
Joseph F. DiMaria, 44,
Assistant Treasurer | | | 2010 | | | Vice President, Mutual Fund Administration, Columbia Management Investment Advisers, LLC, since May 2010; Director of Fund Administration, Columbia Management Advisors, LLC from January 2006 to April 2010; Head of Tax/Compliance and Assistant Treasurer, Columbia Management Advisors, LLC, from November 2004 to December 2005. | | | 12 | | | None | |
|
P. Zachary Egan, 43,
Vice President | | | 2003 | | | Director of International Research, CWAM or its predecessors since December 2004; Vice President, Columbia Acorn Trust since 2003 and Wanger Advisors Trust since 2007; portfolio manager and analyst, CWAM or its predecessors, since 1999. | | | 12 | | | None | |
|
Fritz Kaegi, 40,
Vice President | | | 2011 | | | Portfolio manager and analyst, CWAM or its predecessors since 2004. Vice President Columbia Acorn Trust and Wanger Advisors Trust since September 2011. | | | 12 | | | None | |
|
John Kunka, 41,
Assistant Treasurer | | | 2006 | | | Director of Accounting and Operations, CWAM since May 2006; Manager of Mutual Fund Operations, Calamos Advisors, Inc. (investment adviser), September 2005 – May 2006; prior thereto, Manager of Mutual Fund Administration, Van Kampen Investments. | | | 12 | | | None | |
|
23
Wanger Select 2011 Annual Report
Board of Trustees and Management of Wanger Advisors Trust
Name, Position(s) with
Wanger Advisors Trust
and Age at
December 31, 2011 | | Year First
Elected or
Appointed
to Office* | | Principal Occupation(s) during
Past Five Years | | Number of
Portfolios in
Fund Complex
Overseen by
Trustee/Officer | | Other
Directorships
in addition to
Wanger Advisors Trust | |
| Officers of Wanger Advisors Trust: (continued) | | | | | | | |
|
Stephen Kusmierczak, 44,
Vice President | | | 2011 | | | Portfolio manager and analyst, CWAM or its predecessors since 2001. Vice President Columbia Acorn Trust and Wanger Advisors Trust since September 2011. | | | 12 | | | None | |
|
Joseph C. LaPalm, 42,
Vice President | | | 2006 | | | Chief Compliance Officer, CWAM since 2005; prior thereto, compliance officer, William Blair & Company (investment firm). | | | 12 | | | None | |
|
Bruce H. Lauer, 54,
Vice President, Secretary and Treasurer | | | 1995 | | | Chief Operating Officer, CWAM or its predecessors since April 2000; Vice President, Secretary and Treasurer, Columbia Acorn Trust and Wanger Advisors Trust since 1995; Director, Wanger Investment Company PLC; formerly, Director, Banc of America Capital Management (Ireland) Ltd.; and formerly, Director, Bank of America Global Liquidity Funds, PLC. | | | 12 | | | None | |
|
Louis J. Mendes III, 47,
Vice President | | | 2003 | | | Portfolio manager and analyst, CWAM or its predecessors since 2001; Vice President, Columbia Acorn Trust since 2003 and Wanger Advisors Trust since 2005. | | | 12 | | | None | |
|
Robert A. Mohn, 50,
Vice President | | | 1997 | | | Director of Domestic Research, CWAM or its predecessors since March 2004; Vice President, Columbia Acorn Trust and Wanger Advisors Trust, since 1997; portfolio manager and analyst, CWAM or its predecessors since August 1992. | | | 12 | | | None | |
|
Christopher J. Olson, 47,
Vice President | | | 2001 | | | Portfolio manager and analyst, CWAM or its predecessors, since January 2001; Vice President, Columbia Acorn Trust and Wanger Advisors Trust since 2001. | | | 12 | | | None | |
|
Scott R. Plummer, 52,
Assistant Secretary | | | 2010 | | | Chief Legal Officer and Assistant Secretary, Columbia Management Investment Advisers, LLC (or its predecessors) since June 2005; Vice President and Lead Chief Counsel — Asset Management, Ameriprise Financial since May 2010 (previously Vice President and Chief Counsel — Asset Management, from 2005 to April 2010, and Vice President — Asset Management Compliance from 2004 to 2005); Vice President, Chief Counsel and Assistant Secretary, Columbia Management Investment Distributors, Inc. (or its predecessors) since 2008; Vice President, General Counsel and Secretary, Ameriprise Certificate Company since 2005; Chief Counsel, RiverSource Distributors, Inc. from 2006 to 2010; Vice President, General Counsel and Secretary, legacy RiverSource Funds, since December 2006; Senior Vice President, Secretary and Chief Legal Officer, Columbia Funds since May 2010. | | | 12 | | | None | |
|
Christopher O. Petersen, 42,
Assistant Secretary | | | 2010 | | | Vice President and Chief Counsel, Ameriprise Financial since January 2010 (formerly Vice President and Group Counsel or Counsel from April 2004 to January 2010); Assistant Secretary of legacy RiverSource Funds since January 2007. | | | 12 | | | None | |
|
Robert P. Scales, 59,
Chief Compliance Officer, Chief Legal Officer, Senior Vice President and General Counsel | | | 2004 | | | Chief Compliance Officer, Chief Legal Officer, Senior Vice President and General Counsel, Columbia Acorn Trust and Wanger Advisors Trust, since 2004. | | | 12 | | | None | |
|
24
Wanger Select 2011 Annual Report
Board of Trustees and Management of Wanger Advisors Trust
Name, Position(s) with
Wanger Advisors Trust
and Age at
December 31, 2011 | | Year First
Elected or
Appointed
to Office* | | Principal Occupation(s) during
Past Five Years | | Number of
Portfolios in
Fund Complex
Overseen by
Trustee/Officer | | Other
Directorships
in addition to
Wanger Advisors Trust | |
| Officers of Wanger Advisors Trust: (continued) | | | | | | | |
|
Andreas Waldburg-Wolfegg, 45,
Vice President | | | 2011 | | | Portfolio Manager and analyst of CWAM since 2002. Vice President Columbia Acorn Trust and Wanger Advisors Trust since September 2011. | | | 12 | | | | None | | |
|
Linda Roth-Wiszowaty, 42,
Assistant Secretary | | | 2006 | | | Business support analyst, CWAM, since April 2007; prior thereto executive administrator, CWAM or its predecessors, and executive assistant to the Chief Operating Officer of CWAM or its predecessors. | | | 12 | | | | None | | |
|
* Dates prior to April 1992 correspond to the date of first election or appointment as a trustee or officers of The Acorn Fund, Inc., the predecessor trust to Columbia Acorn Trust.
(1) Mr. Muchin retired at the end of calendar year 2011.
(2) Prior to December 31, 2011, Mr. Rudis was considered an "interested person" of Wanger Advisors Trust, as defined in the New York Attorney General's Assurance of Discontinuance ("Order") entered into in February 2005 by Columbia Management Advisors, LLC (an indirect subsidiary of Bank of America Corporate ("BOA")) and Columbia Management Distributors, Inc. (an indirect subsidiary of BOA), because of his former employment as a BOA executive. The Order expired with respect to Wanger Advisors Trust on December 31, 2011.
(3) Mr. McQuaid is an "interested person" of Wanger Advisors Trust and of CWAM, as defined in the Investment Company Act of 1940 because he is an officer of the Trust and of CWAM.
(4) As permitted under the Wanger Advisors Trust's By-Laws, Mr. Wanger serves as a non-voting Trustee Emeritus of the Trust.
25
Wanger Select 2011 Annual Report

Columbia Wanger Funds
Transfer Agent,
Dividend Disbursing Agent
Columbia Management Investment
Services Corp.
P.O. Box 8081
Boston, Massachusetts
02266-8081
Distributor
Columbia Management Investment
Distributors, Inc.
One Financial Center
Boston, Massachusetts
02111-2621
Investment Adviser
Columbia Wanger Asset Management, LLC
227 West Monroe Street, Suite 3000
Chicago, Illinois 60606
1-888-4-WANGER
(1-888-492-6437)
Legal Counsel to the Funds
Perkins Coie, LLP
Washington, DC
Legal Counsel to the Independent Trustees
Drinker Biddle & Reath LLP
Philadelphia, Pennsylvania
Independent Registered Public
Accounting Firm
PricewaterhouseCoopers LLP
Chicago, Illinois
This document contains Global Industry Classification Standard data. The Global Industry Classification Standard ("GICS") was developed by and is the exclusive property and a service mark of MSCI Inc. ("MSCI") and Standard & Poor's Financial Services LLC ("S&P") and is licensed for use by Columbia Wanger Asset Management, LLC ("CWAM"). Neither MSCI, S&P, nor any other party involved in making or compiling the GICS or any GICS classifications makes any express or implied warranties or representations with respect to such standard or classification (or the results to be obtained by the use thereof), and all such parties hereby expressly disclaim all warranties of originality, accuracy, completeness, merchantability and fitness for a particular purpose with respect to any of such standard or classification. Without limiting any of the foregoing, in no event shall MSCI, S&P, any of their affiliates or any third party involved in making or compiling the GICS or any GICS classifications have any liability for any direct, indirect, special, punitive, consequential or any other damages (including lost profits) even if notified of the possibility of such damages.
This report, including the schedules of investments and financial statements, is submitted for the general information of the shareholders of the Wanger Advisors Trust.
A description of the Fund's proxy voting policies and procedures and a copy of the Fund's voting record for the most recent 12-month period ended June 30 are available (i) on the Securities and Exchange Commission's website at www.sec.gov, and (ii) without charge, upon request, by calling 888-492-6437.
The Fund files a complete schedule of portfolio holdings with the SEC for the first and third quarters of each fiscal year on Form N-Q. The Fund's Form N-Q is available on the SEC's website at www.sec.gov and may be reviewed and copied at the SEC's Public Reference Room in Washington, D.C. Information on the operation of the Pubic Reference Room may be obtained by calling 800-SEC-0330. The Fund's complete portfolio holdings are disclosed at www.columbiafunds.com approximately 30 days after each month-end.
© 2012 Columbia Management Investment Advisers, LLC. All rights reserved.
C-1461 C (2/12) 132427
Wanger USA
2011 Annual Report

Not FDIC insured • No bank guarantee • May lose value

Wanger USA
2011 Annual Report
Table of Contents
| 2 | | | Understanding Your Expenses | |
|
| 3 | | | Vaccines: Medicine's Greatest Lifesaver | |
|
| 6 | | | Performance Review | |
|
| 8 | | | Statement of Investments | |
|
| 15 | | | Statement of Assets and Liabilities | |
|
| 15 | | | Statement of Operations | |
|
| 16 | | | Statement of Changes in Net Assets | |
|
| 17 | | | Financial Highlights | |
|
| 18 | | | Notes to Financial Statements | |
|
| 22 | | | Report of Independent Registered Public Accounting Firm | |
|
| 23 | | | Federal Income Tax Information | |
|
| 24 | | | Board of Trustees and Management of Wanger Advisors Trust | |
|
Columbia Wanger Asset Management, LLC (CWAM) is one of the leading global small- and mid-cap equity managers in the United States with 40 years of small- and mid-cap investment experience. As of December 31, 2011, CWAM managed $29.4 billion in assets. CWAM is the investment adviser to Wanger USA, Wanger International, Wanger Select and Wanger International Select (together, the Columbia Wanger Funds) and the Columbia Acorn Family of Funds.
Investors should consider the investment objectives, risks, charges and expenses of a mutual fund carefully before investing. For a free prospectus, which contains this and other important information about the Fund, contact your financial adviser or insurance company or contact 1-888-4-WANGER. Read the prospectus carefully before investing.
An important note: Columbia Wanger Funds are available for purchase through variable annuity contracts and variable life insurance policies offered by the separate accounts of participating insurance companies and qualified pension or retirement plans.
The views expressed in "Vaccines: Medicine's Greatest Lifesaver" and in the Performance Review reflect the current views of the respective authors. These views are not guarantees of future performance and involve certain risks, uncertainties and assumptions that are difficult to predict so actual outcomes and results may differ significantly from the views expressed. These views are subject to change at any time based upon economic, market or other conditions and the respective parties disclaim any responsibility to update such views. These views may not be relied on as investment advice and, because investment decisions for a Columbia Wanger Fund are based on numerous factors, may not be relied on as an indication of trading intent on behalf of any particular Columbia Wanger Fund. References to specific company securities should not be construed as a recommendation or investment advice.
1
Wanger USA 2011 Annual Report
Understanding Your Expenses
As a shareholder, you incur three types of costs. There are transaction costs, which generally include sales charges on purchases and may include redemption fees. There are also ongoing costs, which generally include management fees and other Fund expenses. Lastly, there may be additional fees or charges imposed by the insurance company that sponsors your variable annuity and/or variable life insurance product. The following information is intended to help you understand your ongoing costs (in dollars) of investing in the Fund and to help you compare these costs with the ongoing costs of investing in other mutual funds.
Analyzing your Fund's expenses
To illustrate these ongoing costs, we have provided an example and calculated the expenses paid by investors in the Fund during the period. The actual and hypothetical information in the table below is based on an initial investment of $1,000 at the beginning of the period indicated and held for the entire period. Expense information is calculated two ways and each method provides you with different information. The amount listed in the "Actual" column is calculated using the Fund's actual operating expenses and total return for the period. You may use the Actual information, together with the amount invested, to estimate the expenses that you paid over the period. Simply divide your account value by $1,000 (for example, an $8,600 account value divided by $1,000 = 8.6), then multiply the results by the expenses paid during the period under the Actual column. The amount listed in the "Hypothetical" column assumes a 5% annual rate of return before expenses (which is not the Fund's actual return) and then applies the Fund's actual expense ratio for the period to the hypothetical return. You should not use the hypothetical account values and expenses to estimate either your actual account balance at the end of the period or the expenses you paid during the period. See "Compare with other funds" below for details on how to use the hypothetical data.
Compare with other funds
Since all mutual funds are required to include the same hypothetical calculations about expenses in shareholder reports, you can use this information to compare the ongoing cost of investing in the Fund with other funds. To do so, compare the hypothetical example with the 5% hypothetical examples that appear in the shareholder reports of other funds. As you compare hypothetical examples of other funds, it is important to note that hypothetical examples are meant to highlight the ongoing cost of investing in a fund only and do not reflect any transaction costs, such as sales charges, redemption or exchange fees. Therefore, the hypothetical calculations are useful in comparing ongoing costs only, and will not help you determine the relative total costs of owning different funds. If transaction costs were included in these calculations, your costs would be higher.
July 1, 2011 – December 31, 2011
| | | Account value at the
beginning of the period ($) | | Account value at the
end of the period ($) | | Expenses paid during
period ($) | | Fund's annualized
expense ratio (%)* | |
| | | Actual | | Hypothetical | | Actual | | Hypothetical | | Actual | | Hypothetical | | | |
| Wanger USA | | | 1,000.00 | | | | 1,000.00 | | | | 868.60 | | | | 1,020.61 | | | | 4.17 | | | | 4.51 | | | | 0.89 | | |
*Expenses paid during the period are equal to the Fund's annualized expense ratio, multiplied by the average account value over the period, then multiplied by the number of days in the Fund's most recent fiscal half-year and divided by 365.
Had the investment adviser not waived fees or reimbursed a portion of expenses, account value at the end of the period would have been reduced.
It is important to note that the expense amounts shown in the table are meant to highlight only ongoing costs of investing in the Fund. Expenses paid during the period do not include any insurance charges imposed by your insurance company's separate account. The hypothetical example provided is useful in comparing ongoing costs only and will not help you determine the relative total costs of owning different funds whose shareholders may incur transaction costs.
2
Wanger USA 2011 Annual Report

Vaccines: Medicine's Greatest Lifesaver
I recently read several books on the history of vaccines. As one of the authors put it, "Of all of the benefits of medical science, vaccination is at or near the summit."1
Deadly Diseases
"Bring out your dead!" cries a wretched man pulling a cart of bodies in Monty Python and the Holy Grail. Set in the middle ages, the movie makes fun of the impact of communicable disease at that time. In reality, such diseases were no laughing matter. Once mankind transitioned from isolated bands of nomadic hunter-gatherers to more densely populated groups of farmers, epidemic diseases began to ravage civilization.
Remarkable progress has been made as fatal, communicable disease has now become rare in the developed world. Clearly, improved sanitation and nutrition have helped, but much of the credit goes to the development of vaccines.
The First Vaccine
Dating back to at least the time of the Pharaohs, waves of smallpox epidemics ravaged mankind. In populations previously subject to the disease, mortality rates for those infected could be more than 30% and, for other populations, much more.2 North American Indians had little immunity to the disease. Their population decreased 99% between Columbus's voyage in 1492 and the year 1800, and smallpox was the largest killer.3
People observed that the disease was communicable and one who survived a smallpox infection became immune to the next epidemic of the disease. In ancient China and more recently in Asia and Africa, a crude form of vaccination called variolation developed whereby fluid from a smallpox pustule or parts of smallpox scabs were scraped into the skin of a healthy person. In most cases, immunity would build up before the disease reached a vital organ and the individual would survive.
In 1790, Lady Montague, the wife of the British ambassador to the Ottoman Empire, introduced variolation to Britain. The process was far riskier than vaccines today; most people suffered severe side effects and up to about 3% of those treated died as a result.4 But these were much better odds than for those infected with smallpox.
Edward Jenner, a pharmacist in England, learned that milkmaids were immune to smallpox because they often suffered blisters from cowpox, a related disease. In 1796, Jenner began experimenting with variolating using fluid from a milkmaid's cowpox blisters, rather than smallpox sores. When his subjects were later variolated with smallpox fluid, no reaction occurred, indicating that they were immune from smallpox. Immunization using cowpox fluids rose rapidly and protected millions of people.5
A cowpox-derived vaccine for smallpox continued to be used well into the 20th century, including use by six million New Yorkers who were inoculated during a smallpox scare in 1947. Smallpox was eradicated from nature; the last case occurred in India in 1975.6 Smallpox immunizations ended when health authorities judged the risk of side effects from the vaccine exceeded the risk of the disease returning.
The Golden Age of Vaccines
Beginning in the 1860s, tremendous scientific advances were made. Robert Koch's laboratory in Germany identified bacteria as the source of many diseases and proved that bacteria grown in a lab could cause disease.7 Koch's lab created some vaccines, including those for diphtheria and tetanus.
In France, Louis Pasteur stunned the world by developing the first rabies vaccine in 1885; until then rabies infections resulted in horrible deaths. His mantra was to "isolate, attenuate and vaccinate" the pathogen causing a disease.8 He attenuated a germ by having it reproduce in petri dishes or animal cells where it would evolve in order to optimize in its new environment. Once it evolved to the point it would no longer thrive in and harm humans, it was injected into humans with the hope that the subject would build immunity to full power germs. The Goldilocks trick of course was to make the attenuated germ weak enough so as not to cause harm, but strong enough to create immunity.
While scientific understanding of disease increased rapidly, it was primitive compared to modern times. Diagnostic tools were poor. Bacteria could be seen by optical microscopes, but viruses were unseen until the development of the electron microscope in the 1930s. Viruses were inferred to exist as a result of an 1898 experiment by Danish professor Martinus Beijerinck, who filtered bacteria out through unglazed porcelain containers, but observed remaining, and much smaller, disease-causing elements. Scientists learned how to grow viruses in laboratories only in the late 1940s.9
Early vaccines were dangerous and unreliable by today's standards, though far less dangerous than the underlying diseases they prevented. Vaccines did not stop the great influenza epidemic of 1918-1919. Of a worldwide population of one billion, an estimated 500 million were infected and more than 50 million people died.10 This virus was unusual in that it had high mortality among young, healthy people.
Vaccines continued to progress. During World War II, all 11 million U.S. soldiers were vaccinated for typhoid, tetanus, smallpox, cholera and plague. Vaccines, coupled with antibiotics, drastically improved their health. Disease deaths outnumbered battle deaths by 13:1 in the Spanish American War, matched them in World War I and were outnumbered by 1:85 in World War II.11
Maurice Hilleman's Mission
Maurice Hilleman had a role in creating more vaccines than anyone else in history, some three dozen. As noted by Arthur Allen, author of Vaccine, The Controversial Story of Medicine's Greatest Lifesaver, "...his products undoubtedly
3
Wanger USA 2011 Annual Report
saved more lives than those of any other individual in the past half-century."12
Hilleman grew up in Montana, and earned a Ph.D. in microbiology at the University of Chicago where he discovered that chlamydia is a tiny bacteria rather than a virus. He then stunned his mentors by departing academia to work in industry. At Squibb, he developed a vaccine against Japanese B encephalitis to protect American Pacific troops during World War II. In 1948, he joined the Walter Reed Army Medical Center, then a hub of vaccine development.
In 1957, Hilleman moved to Merck, where he continued to develop vaccines well past his official retirement in 1984. He had a tremendous work ethic, often working seven days a week and expecting the same from his staff. He and his team were on a mission to rid the world of disease. They developed eight of 14 now common vaccines for measles, mumps, hepatitis A and B, chickenpox, meningitis, pneumonia and Hib (hemophilus influenza, which harms infants and young children).13 One of his accomplishments was the combination MMR (measles, mumps and rubella) vaccine.
Hilleman discovered that the influenza virus is particularly difficult to deal with due to frequent minor drifts in its surface, which each year makes the last year's vaccine obsolete. Periodically, the virus shifts its surface characteristics substantially, becoming much more virulent. Hilleman inferred that a shift occurred in Hong Kong in 1957 and, by having Merck produce 40 million doses of vaccine, saved thousands of lives in America. Potential future shifts keep virologists up at night.
Hilleman helped develop the first two anti-cancer vaccines. One vaccine prevents hepatitis B, the third most common known cause of cancer in the world (after sunlight and smoking).14 It was the first vaccine utilizing recombinant technology and the first made by a single protein. His innovations helped create a vaccine to prevent HPV (human papillomavirus), the cause of cervical cancer. Hilleman had high integrity, as he refused to risk changes in manufacturing processes in order to enhance yields and profits.15 He died in 2005 at age 85.
Vaccine Scares
Two notable scares set back progress on vaccine usage.
In 1982, a TV station in Washington D.C. aired "Vaccine Roulette," a story highlighting risks of the DTP (diphtheria, tetanus, pertussis) vaccine. It showed reactions well known to physicians, including cases of seizures, high fevers and fainting. In a case of ambush journalism, it edited doctors' comments out of context and failed to mention that none of the victims portrayed suffered permanent damage. Other media quoted the story further out of context, claiming permanent damage. The media also failed to mention the consequences of contracting the underlying diseases.16
In 1998, the British medical journal The Lancet published a paper alleging a link between the MMR vaccine and autism.17 It claimed that, in some cases, the vaccine caused the measles virus to lodge in the intestines and create leakage, allowing opioid peptides to escape and penetrate the brain, causing autism. The paper was under fire by scientists immediately. The opioid causation theory had already been widely discredited, the findings of measles in intestines could not be duplicated by other scientists and there was no comparison between autism rates of children who got the vaccine and those who did not. A review by 37 experts found that the theories were "biologically implausible," and the conclusions essentially worthless.18
Fourteen separate groups of investigators did statistical studies that also refuted the link.19 One notable study covered 530,000 children in Denmark from 1991-1998, comparing vaccinated and unvaccinated children. It showed "strong evidence against the hypothesis that MMR vaccination causes autism."20 By 2004, 10 of the original 12 authors of The Lancet article withdrew their support of the paper.21 The Lancet formally retracted the paper in 2010 and, that same year, the primary author of the paper had his U. K. medical license revoked.
Once the MMR-autism link was largely discredited, vaccine opponents claimed a link between mercury in vaccines and autism. Minute amounts of ethyl mercury were utilized in vaccines, usually less than the more toxic methyl mercury infants get exposed to from the environment. Combined, in some cases, the dosage did exceed government guidelines, so the mercury was removed. Studies showed that reported rates of autism continued to climb once mercury was removed from vaccines.22 "In spite of all the concern...there has not been a single case of proven mercury toxicity from vaccines...," writes Kurt Link, author of The Vaccine Controversy: The History, Use, and Safety of Vaccinations.23
Unfortunately, many people appear to rely on one-sided scares and opinions expressed in talk shows and by celebrity activists, rather than on scientific evidence. Immunization rates around the world have fluctuated with publicity, funding for inoculations, public policy and legal requirements. Where immunizations have dropped, outbreaks have occurred. A diphtheria epidemic hit the former Soviet Union in 1993, causing 4,000 deaths.24 In Japan, where pertussis immunizations fell from 80% in 1974 to 10% in 1976, a 1979 epidemic of that disease resulted in 13,000 infections and 41 deaths.25 In the United States, where pockets of low immunization rates exist, outbreaks occur. Some of the Chicago suburbs are currently experiencing a whooping cough outbreak.26
Perspectives on Risks
There have been mistakes in vaccine development, production and use that have resulted in injuries and deaths. However, those numbers pale in comparison to the injuries and deaths caused by the underlying diseases that are being conquered by vaccines. While rare vaccine side effects continue to exist, drugs and
4
Wanger USA 2011 Annual Report
vaccines come with disclosures of the known side effects and risks, however unlikely. Diseases don't.
Many people believe some vaccine-preventable diseases to be fairly benign and some are, in most cases. Yet measles is one of the most contagious viruses and has killed more children than any other disease in history.27 It hospitalized 48,000 Americans yearly in the 1960s and killed 400 during a 1964 epidemic.28
Chickenpox is perceived to be a mild disease and it usually is. Acquiring chickenpox creates lifetime immunity to the disease (though susceptibility to shingles) so some question the usefulness of the vaccine. However, Paul Offit, author of Vaccinated, One Man's Quest to Defeat the World's Deadliest Diseases, points out that chickenpox creates risk of encephalitis, hepatitis, pneumonia and Group A streptococci, the "flesh-eating bacteria." He notes that, before the vaccine, some 10,000 people a year were hospitalized and 100 died annually in the United States due to the disease or related illnesses.29
German measles (rubella) was considered a benign illness featuring a rash and a low fever until Australian ophthalmologist Sir Norman McAllister Gregg discovered a link to birth defects. When striking a mother in her first trimester, rubella causes fetal anomalies in 90% of pregnancies. In 1964-65, prior to the rubella vaccine, the last major epidemic in the United States caused thousands of birth defects.30 Hilleman's MMR vaccine was approved in 1971 and the number dropped to seven U.S. cases in 1983.31
Whooping cough (pertussis) is a horrible disease for babies and small children. Babies have died because of outbreaks when vaccination rates declined as a result of scares. The underlying vaccine has changed since the "Vaccine Roulette" television program, to an acellular version with fewer side effects.32 That is why the combination vaccine is now called DTaP rather than DTP.
While no vaccine is 100% effective, the fact remains that if the vast majority of people are vaccinated, a disease cannot infect enough victims to spread. Link writes, "In the prevaccine era, every family lost a child or knew of one so lost due to vaccine-preventable diseases. Today in the USA, the death of a child is an unexpected tragedy; in the past it was an expected sorrow."33 American life expectancies increased 30 years during the 20th century, largely due to vaccines.34


Charles P. McQuaid
President and Chief Investment Officer
Columbia Wanger Asset Management, LLC
The information and data provided in this analysis are derived from sources that we deem to be reliable and accurate. These views are not guarantees of future performance and involve certain risks, uncertainties and assumptions that are difficult to predict so actual outcomes and results may differ significantly from the views expressed. The views/opinions expressed in this essay are those of the author and not of the Columbia Wanger Funds Board, are subject to change at any time based upon economic, market or other conditions, may differ from views expressed by other Columbia Management associates and the respective parties disclaim any responsibility to update such views. These views may not be relied on as investment advice and, because investment decisions for a Columbia Wanger Fund are based on numerous factors, may not be relied on as an indication of trading intent on behalf of any particular Columbia Wanger Fund.
The information included on Pages 3-5 of this report is unaudited.
1 Link, M.D., Kurt, The Vaccine Controversy, The History, Use, And Safety of Vaccinations, (Westport, Connecticut, Praeger Publishers 2005) p. 38.
2 Mnookin, Seth, The Panic Virus, A True Story of Medicine, Science, and Fear, (New York, New York, Simon & Schuster 2011) p. 30.
3 Offit, M.D., Paul A., Vaccinated, One Man's Quest to Defeat the World's Deadliest Diseases, (New York, New York, HarperCollins Publishers 2007) pg. 32.
4 Link, M.D., Kurt, op. cit., p. 12.
5 Allen, Arthur, Vaccine, The Controversial Story of Medicines Greatest Lifesaver, (New York, New York, W. W. Norton & Company 2007) p. 49-50.
6 Ibid., p. 115, 303.
7 Offit, M.D., Paul A., op. cit., p. 144.
8 Allen, Arthur, op. cit., p. 65, 121.
9 Offit, M.D., Paul A., op. cit., p. 37, 41-42.
10 Ibid., p. 2-3.
11 Allen, Arthur, op. cit., p. 119, 159.
12 Ibid., p. 221.
13 Link, M.D., Kurt, op. cit., p. 101.
14 Offit, M.D., Paul A., op. cit., p. 115.
15 Ibid., p. 130, 156.
16 Allen, Arthur, op. cit., p. 251-256.
17 Wakefield, Andrew J., et al., "Ileal-lymphoid-nodular Hyperplasia, Non-Specific Colitis, and Pervasive Developmental Disorders in Children," The Lancet 351, Issue 9103 (1998), p. 637-41.
18 Mnookin, Seth, op. cit., p. 106-107, 114.
19 Offit, M.D., Paul A., op. cit., p. 167.
20 Mnookin, Seth, op. cit., p. 163.
21 Murch, Simon H., et al., "Retraction of an Interpretation," The Lancet 363, Issue 9411 (2004), p. 750.
22 Mnookin, Seth, op. cit., p. 167.
23 Link, M.D., Kurt, op. cit., p. 21.
24 Ibid., p. 57.
25 Mnookin, Seth, op. cit., p. 277.
26 Synett, Lawerence, "Whooping Cough Strikes Collar Counties," Chicago Tribune, December 6, 2011.
27 Mnookin, Seth, op. cit., p. 19.
28 Allen, Arthur, op. cit., p. 217.
29 Offit, M.D., Paul A., op. cit., p. 102.
30 Link, M.D., Kurt, op. cit., p. 82-84.
31 Allen, Arthur, op. cit., p. 240.
32 Ibid., p. 352, 286.
33 Link, M.D., Kurt, op. cit., p. 163.
34 Offit, M.D., Paul A., op. cit., p. xiv.
5
Wanger USA 2011 Annual Report

Performance Review Wanger USA

Robert A. Mohn
Portfolio Manager
Performance data shown represents past performance and is not a guarantee of future results. The investment return and principal value will fluctuate so that shares, when redeemed, may be worth more or less than the original cost. Current performance may be lower or higher than the performance data shown. Please visit columbiamanagement.com for performance updates for the most recent month-end.
Wanger USA ended 2011 down 3.49%, outperforming the 4.18% decline of its primary benchmark, the Russell 2000 Index. Relative Fund performance was strong through the end of October, but poor performance of the Fund's consumer stocks during the final two months of the year dampened gains.
Winners for the year included Alexion Pharmaceuticals, a biotech company focused on orphan diseases. Its stock rose 77% as its primary drug, Soliris, was approved for treating a severe neurological condition. lululemon athletica suffered from a perceived surplus of inventory during the fourth quarter but still ended the year up 37% on strong sales growth driven by increased awareness of its yoga-inspired athletic apparel. FMC Technologies, up 17% for the year, benefited from higher oil prices and strong demand for its sub-sea wellhead systems. Extra Space Storage, a self-storage facility company, gained 43% on increasing occupancy and rent hikes. Industrial air filtration system manufacturer Donaldson rose 18% in 2011 on market share gains and rapid earnings growth.
Laggards for the annual period included Gaylord Entertainment, an operator of convention hotels. Its stock fell 33% on poor results at its D.C. and Orlando properties. Quicksilver Resources, a natural gas and coal seam gas producer, sank 54% as plans to take the company private fell through and natural gas prices declined. Technology companies Finisar, a manufacturer of telecom equipment, and two semiconductor and related equipment manufacturers, TriQuint Semiconductor and Atmel, saw losses ranging from 34% to 60%. The three stocks soared in 2010, but as sales plateaued in early 2011, the stocks retraced much (and in the case of TriQuint, all) of their prior gains.
As mentioned, the year ended with a downturn in Fund consumer stocks. Teen apparel retailer Abercrombie & Fitch dropped 14% for the year, as profits fell short of expectations due to weak margins in the United States and disappointing European sales. Internet photo-centric retailer Shutterfly fell victim to a fierce price war waged by all the internet photo book and photo card companies this holiday season, resulting in a steep stock drop of 35% for the annual period. Down 39% for the year, snack food distributor Diamond Foods was crushed on news of an accounting controversy regarding the timing of payments made to its walnut suppliers. Women's specialty retailer Talbots ended the year down 76%, suffering from declining sales. We no longer hold the stock in the Fund.
Investors spent much of 2011 focused on what could go wrong at home and abroad. Concern is certainly warranted, but we believe that consideration should also be given to the many things that could go right. U.S. economic indicators could keep improving, the unemployment rate could keep dropping, European sovereign debt yields could retreat, and low stock market valuation multiples could jump higher. Last year, it paid to be a pessimist. We believe that sometime soon, the optimists will reign.
Stocks of small- and mid-cap companies pose special risks, including possible illiquidity and greater price volatility than stocks of larger, more established companies.
Portfolio holdings are subject to change periodically and may not be representative of current holdings.
Fund's Positions in Mentioned Holdings
As a percentage of net assets, as of 12/31/11
| FMC Technologies | | | 3.7 | % | |
| lululemon athletica | | | 2.8 | | |
| Donaldson | | | 2.6 | | |
| Abercrombie & Fitch | | | 1.7 | | |
| Alexion Pharmaceuticals | | | 1.6 | | |
| Extra Space Storage | | | 1.6 | | |
| Gaylord Entertainment | | | 1.4 | | |
| Atmel | | | 1.2 | | |
| Finisar | | | 0.6 | | |
| Shutterfly | | | 0.4 | | |
| Diamond Foods | | | 0.3 | | |
| TriQuint Semiconductor | | | 0.1 | | |
| Quicksilver Resources | | | 0.1 | | |
6
Wanger USA 2011 Annual Report
Growth of a $10,000 Investment in Wanger USA
May 3, 1995 (inception date) through December 31, 2011
Performance data shown represents past performance and is not a guarantee of future results. The investment return and principal value will fluctuate so that shares, when redeemed, may be worth more or less than the original cost. Current performance may be lower or higher than the performance data shown. Performance results reflect any fee waivers or reimbursements of Fund expenses by the investment adviser and/or any of its affiliates. Absent these fee waivers and/or expense reimbursement arrangements, performance results would have been lower. For daily and most recent month-end performance updates, please call 1-888-4-WANGER.
This graph compares the results of $10,000 invested in Wanger USA on May 3, 1995 (the date the Fund began operations) through December 31, 2011, to the Russell 2000 Index, with dividends and capital gains reinvested. Although the index is provided for use in assessing the Fund's performance, the Fund's holdings may differ significantly from those in the index.
Top 10 Holdings
As a percentage of net assets, as of 12/31/11
1. FMC Technologies
Oil & Gas Wellhead Manufacturer | | | 3.7
| % | |
2. Ametek
Aerospace/Industrial Instruments | | | 3.5
| | |
3. lululemon athletica
Premium Active Apparel Retailer | | | 2.8
| | |
4. Nordson
Dispensing Systems for Adhesives & Coatings | | | 2.6
| | |
5. Donaldson
Industrial Air Filtration | | | 2.6
| | |
6. Micros Systems
Information Systems for Hotels, Restaurants & Retailers | | | 2.5
| | |
7. Informatica
Enterprise Data Integration Software | | | 2.4
| | |
8. Atwood Oceanics
Offshore Drilling Contractor | | | 2.3
| | |
9. Mettler Toledo
Laboratory Equipment | | | 2.1
| | |
10. tw telecom
Fiber Optic Telephone/Data Services | | | 2.1
| | |
Top 5 Industries
As a percentage of net assets, as of 12/31/11
| Information | | | 29.8 | % | |
| Industrial Goods & Services | | | 16.4 | | |
| Consumer Goods & Services | | | 15.3 | | |
| Finance | | | 12.2 | | |
| Energy & Minerals | | | 10.0 | | |
Results as of December 31, 2011
| | | 4th quarter | | 1 year | | 5 years | | 10 years | |
| Wanger USA | | | 11.57 | % | | | -3.49 | % | | | 1.48 | % | | | 6.18 | % | |
| Russell 2000 Index* | | | 15.47 | | | | -4.18 | | | | 0.15 | | | | 5.62 | | |
Lipper Small-Cap
Growth Funds
Variable
Underlying Index | | | 13.13 | | | | -3.55 | | | | 1.70 | | | | 4.95 | | |
NAV as of 12/31/11: $29.80
* The Fund's primary benchmark.
Performance numbers reflect all Fund expenses but do not include any fees and expenses imposed under your variable annuity or life insurance policy or qualified pension or retirement plan. If performance included the effect of these additional charges, it would be lower.
The Fund's annual operating expense ratio is 0.97%. The annual operating expense ratio is as stated in the Fund's prospectus that is current as of the date of this report. Differences in expense ratios disclosed elsewhere in this report may result from including fee waivers and reimbursements as well as different time periods used in calculating the ratios.
All results shown assume reinvestment of distributions and do not reflect taxes that a shareholder would pay on Fund distributions or the sale of Fund shares.
The Russell 2000 Index measures the performance of the 2,000 smallest companies in the Russell 3000 Index, which represents approximately 8% of the total market capitalization of the Russell 3000 Index. The Lipper Small-Cap Growth Funds Variable Underlying Index is an equally weighted representation of the 30 largest variable insurance underlying funds in the Lipper Small-Cap Growth Funds Variable Underlying Classification. Indexes are not managed and do not incur fees or expenses. It is not possible to invest directly in an index.
Lipper Inc., a widely respected data provider in the industry, calculates an average total return (assuming reinvestment of distributions) for mutual funds with investment objectives similar to those of the Fund. Lipper makes no adjustment for the effect of sales loads.
Portfolio characteristics and holdings are subject to change periodically and may not be representative of current characteristics and holdings.
7
Wanger USA 2011 Annual Report
Wanger USA
Statement of Investments, December 31, 2011
Number of
Shares | | | | Value | |
| | | Equities – 99.5% | |
| | | Information – 29.8% | |
| | | Business Software – 10.1% | |
| | 413,000 | | | Micros Systems (a)
Information Systems for Hotels, Restaurants & Retailers | | $ | 19,237,540
| | |
| | 498,000 | | | Informatica (a)
Enterprise Data Integration Software | | | 18,391,140
| | |
| | 221,000 | | | Ansys (a)
Simulation Software for Engineers and Designers | | | 12,658,880
| | |
| | 140,000 | | | NetSuite (a)
End to End IT Systems Solution Delivered Over the Web | | | 5,677,000
| | |
| | 106,000 | | | Concur Technologies (a)
Web Enabled Cost & Expense Management Software | | | 5,383,740
| | |
| | 153,000 | | | Blackbaud
Software & Services for Non-Profits | | | 4,238,100
| | |
| | 163,000 | | | SPS Commerce (a)
Supply Chain Management Software Delivered via the Web | | | 4,229,850
| | |
| | 132,000 | | | Ariba (a)
Cost Management Software | | | 3,706,560
| | |
| | 58,000 | | | Advent Software (a)
Asset Management & Trading Systems | | | 1,412,880
| | |
| | 195,000 | | | Velti (a) (b)
Mobile Marketing Software Platform | | | 1,326,000
| | |
| | | | | | | | 76,261,690 | | |
| | | Semiconductors & Related Equipment – 4.0% | |
| | 1,111,000 | | | Atmel (a)
Microcontrollers, Radio Frequency, and
Memory Semiconductors | | | 8,999,100
| | |
| | 438,000 | | | Microsemi (a)
Analog/Mixed-signal Semiconductors | | | 7,336,500
| | |
| | 281,000 | | | Monolithic Power Systems (a)
High Performance Analog & Mixed-signal
Integrated Circuits (ICs) | | | 4,234,670
| | |
| | 520,000 | | | ON Semiconductor (a)
Mixed-signal & Power Management Semiconductors | | | 4,014,400
| | |
| | 243,000 | | | Entegris (a)
Semiconductor Materials Management Products | | | 2,120,175
| | |
| | 205,000 | | | Pericom Semiconductor (a)
Interface Integrated Circuits (ICs) &
Frequency Control Products | | | 1,560,050
| | |
| | 25,000 | | | Hittite Microwave (a)
Radio Frequency, Microwave &
Millimeterwave Semiconductors | | | 1,234,500
| | |
| | 203,000 | | | TriQuint Semiconductor (a)
Radio Frequency Semiconductors | | | 988,610
| | |
| | | | | | | | 30,488,005 | | |
Number of
Shares | | | | Value | |
| | | Instrumentation – 3.6% | |
| | 109,750 | | | Mettler Toledo (a)
Laboratory Equipment | | $ | 16,211,173
| | |
| | 318,000 | | | IPG Photonics (a)
Fiber Lasers | | | 10,770,660
| | |
| | | | | | | | 26,981,833 | | |
| | | Telephone and Data Services – 3.2% | |
| | 830,000 | | | tw telecom (a)
Fiber Optic Telephone/Data Services | | | 16,085,400
| | |
| | 101,200 | | | AboveNet (a)
Metropolitan Fiber Communications Services | | | 6,579,012
| | |
| | 197,000 | | | Boingo Wireless (a)
Wholesale and Retail WiFi Networks | | | 1,694,200
| | |
| | | | | | | | 24,358,612 | | |
| | | Computer Hardware & Related Equipment – 2.5% | |
| | 397,000 | | | II-VI (a)
Laser Optics and Specialty Materials | | | 7,288,920
| | |
| | 110,000 | | | Netgear (a)
Networking Products for Small Business & Home | | | 3,692,700
| | |
| | 90,000 | | | Zebra Technologies (a)
Bar Code Printers | | | 3,220,200
| | |
| | 69,000 | | | Amphenol
Electronic Connectors | | | 3,131,910
| | |
| | 38,000 | | | Nice Systems – ADR (Israel) (a)
Audio & Video Recording Solutions | | | 1,309,100
| | |
| | | | | | | | 18,642,830 | | |
| | | Computer Services – 1.6% | |
| | 333,000 | | | ExlService Holdings (a)
Business Process Outsourcing | | | 7,449,210
| | |
| | 405,000 | | | RCM Technologies (a)
Technology & Engineering Services | | | 2,097,900
| | |
| | 33,000 | | | Syntel
Offshore IT Services | | | 1,543,410
| | |
| | 345,500 | | | Hackett Group (a)
IT Integration & Best Practice Research | | | 1,292,170
| | |
| | | | | | | | 12,382,690 | | |
See accompanying notes to financial statements.
8
Wanger USA 2011 Annual Report
Wanger USA
Statement of Investments, December 31, 2011
Number of
Shares | | | | Value | |
| | | Gaming Equipment & Services – 1.5% | |
| | 264,000 | | | Bally Technologies (a)
Slot Machines & Software | | $ | 10,443,840
| | |
| | 42,000 | | | WMS Industries (a)
Slot Machine Provider | | | 861,840
| | |
| | | | | | | | 11,305,680 | | |
| | | Telecommunications Equipment – 1.3% | |
| | 275,800 | | | Finisar (a)
Optical Sub-systems and Components | | | 4,618,271
| | |
| | 189,000 | | | Polycom (a)
Video Conferencing Equipment | | | 3,080,700
| | |
| | 133,000 | | | Ixia (a)
Telecom Network Test Equipment | | | 1,397,830
| | |
| | 135,000 | | | Infinera (a)
Optical Networking Equipment | | | 847,800
| | |
| | | | | | | | 9,944,601 | | |
| | | Contract Manufacturing – 0.6% | |
| | 122,000 | | | Plexus (a)
Electronic Manufacturing Services | | | 3,340,360
| | |
| | 165,000 | | | Sanmina-SCI (a)
Electronic Manufacturing Services | | | 1,536,150
| | |
| | | | | | | | 4,876,510 | | |
| | | Financial Processors – 0.6% | |
| | 91,000 | | | Global Payments
Credit Card Processor | | | 4,311,580
| | |
| | | Business Information & Marketing Services – 0.4% | |
| | 291,200 | | | Navigant Consulting (a)
Financial Consulting Firm | | | 3,322,592
| | |
| | | Internet Related – 0.2% | |
| | 265,000 | | | US Auto Parts Network (a)
Auto Part Online Retailer | | | 1,158,050
| | |
| | 33,400 | | | TheStreet.com
Financial Information Websites | | | 56,112
| | |
| | | | | | | | 1,214,162 | | |
| | | Radio – 0.1% | |
| | 300,000 | | | Salem Communications (a)
Radio Stations for Religious Programming | | | 771,000
| | |
Number of
Shares | | | | Value | |
| | | TV Broadcasting – 0.1% | |
| | 472,000 | | | Entravision Communications
Spanish Language TV & Radio Stations | | $ | 736,320
| | |
| | | | | Total Information | | | 225,598,105 | | |
| | | Industrial Goods & Services – 16.4% | |
| | | Machinery – 13.2% | |
| | 631,500 | | | Ametek
Aerospace/Industrial Instruments | | | 26,586,150
| | |
| | 480,200 | | | Nordson
Dispensing Systems for Adhesives & Coatings | | | 19,774,636
| | |
| | 290,000 | | | Donaldson
Industrial Air Filtration | | | 19,743,200
| | |
| | 319,000 | | | Pentair
Pumps & Water Treatment | | | 10,619,510
| | |
| | 297,300 | | | ESCO Technologies
Automatic Electric Meter Readers | | | 8,556,294
| | |
| | 128,000 | | | MOOG (a)
Motion Control Products for Aerospace, Defense &
Industrial Markets | | | 5,623,040
| | |
| | 82,000 | | | Kennametal
Consumable Cutting Tools | | | 2,994,640
| | |
| | 44,368 | | | Toro
Turf Maintenance Equipment | | | 2,691,363
| | |
| | 100,000 | | | Oshkosh Corporation (a)
Specialty Truck Manufacturer | | | 2,138,000
| | |
| | 9,500 | | | Middleby Corp (a)
Manufacturer of Cooking Equipment | | | 893,380
| | |
| | 13,078 | | | HEICO
FAA Approved Aircraft Replacement Parts | | | 514,619
| | |
| | | | | | | | 100,134,832 | | |
| | | Industrial Materials & Specialty Chemicals – 1.4% | |
| | 187,000 | | | Drew Industries (a)
RV & Manufactured Home Components | | | 4,587,110
| | |
| | 176,000 | | | Albany International
Paper Machine Clothing and Advanced Textiles | | | 4,069,120
| | |
| | 33,000 | | | Albemarle
Refinery Catalysts and Other Specialty Chemicals | | | 1,699,830
| | |
| | | | | | | | 10,356,060 | | |
See accompanying notes to financial statements.
9
Wanger USA 2011 Annual Report
Wanger USA
Statement of Investments, December 31, 2011
Number of
Shares | | | | Value | |
| | | Electrical Components – 0.7% | |
| | 104,000 | | | Acuity Brands
Commercial Lighting Fixtures | | $ | 5,512,000
| | |
| | | Steel – 0.6% | |
| | 320,400 | | | GrafTech International (a)
Industrial Graphite Materials Producer | | | 4,373,460
| | |
| | | Waste Management – 0.3% | |
| | 33,000 | | | Clean Harbors (a)
Hazardous Waste Services & Disposal | | | 2,103,090
| | |
| | | Construction – 0.2% | |
| | 100,000 | | | Fortune Brands Home & Security (a)
Home Building Supplies & Small Locks | | | 1,703,000
| | |
| | | | | Total Industrial Goods & Services | | | 124,182,442 | | |
| | | Consumer Goods & Services – 15.3% | |
| | | Retail – 6.5% | |
| | 462,000 | | | lululemon athletica (a)
Premium Active Apparel Retailer | | | 21,556,920
| | |
| | 256,000 | | | Abercrombie & Fitch
Teen Apparel Retailer | | | 12,503,040
| | |
| | 382,000 | | | Pier 1 Imports (a)
Home Furnishing Retailer | | | 5,321,260
| | |
| | 476,000 | | | Saks (a) (b)
Luxury Department Store Retailer | | | 4,641,000
| | |
| | 147,000 | | | Shutterfly (a)
Internet Photo-centric Retailer | | | 3,345,720
| | |
| | 69,500 | | | Teavana (a) (b)
Specialty Tea Retailer | | | 1,305,210
| | |
| | 116,229 | | | Gaiam (a)
Healthy Living Catalogs & E-Commerce | | | 376,582
| | |
| | 6,000 | | | The Fresh Market (a)
Specialty Food Retailer | | | 239,400
| | |
| | | | | | | | 49,289,132 | | |
| | | Travel – 3.0% | |
| | 449,700 | | | Gaylord Entertainment (a)
Convention Hotels | | | 10,855,758
| | |
| | 659,500 | | | Avis Budget Group (a)
Second Largest Car Rental Company | | | 7,069,840
| | |
Number of
Shares | | | | Value | |
| | 400,000 | | | Hertz (a) | | $ | 4,688,000 | | |
| | | | | Largest U.S. Rental Car Operator | | | | | |
| | 12,000 | | | HomeAway (a) (b)
Vacation Rental Online Marketplace | | | 279,000
| | |
| | | | | | | | 22,892,598 | | |
| | | Furniture & Textiles – 1.5% | |
| | 590,000 | | | Knoll
Office Furniture | | | 8,761,500
| | |
| | 125,000 | | | Herman Miller
Office Furniture | | | 2,306,250
| | |
| | | | | | | | 11,067,750 | | |
| | | Apparel – 1.2% | |
| | 108,500 | | | Warnaco Group (a)
Global Branded Apparel Manufacturer | | | 5,429,340
| | |
| | 100,000 | | | True Religion Apparel (a)
Premium Denim | | | 3,458,000
| | |
| | | | | | | | 8,887,340 | | |
| | | Other Consumer Services – 1.0% | |
| | 163,000 | | | Lifetime Fitness (a)
Sport & Fitness Club Operator | | | 7,620,250
| | |
| | | Consumer Goods Distribution – 0.9% | |
| | 232,000 | | | Pool
Distributor of Swimming Pool Supplies & Equipment | | | 6,983,200
| | |
| | | Casinos & Gaming – 0.5% | |
| | 392,000 | | | Pinnacle Entertainment (a)
Regional Casino Operator | | | 3,982,720
| | |
| | | Other Durable Goods – 0.3% | |
| | 85,000 | | | Jarden
Branded Household Products | | | 2,539,800
| | |
| | | Food & Beverage – 0.3% | |
| | 76,000 | | | Diamond Foods
Snack Foods and Culinary Ingredients | | | 2,452,520
| | |
| | | Leisure Products – 0.1% | |
| | 45,000 | | | Skullcandy (a) (b)
Lifestyle Branded Headphones | | | 563,400
| | |
| | | | | Total Consumer Goods & Services | | | 116,278,710 | | |
See accompanying notes to financial statements.
10
Wanger USA 2011 Annual Report
Wanger USA
Statement of Investments, December 31, 2011
Number of
Shares | | | | Value | |
| | | Finance – 12.2% | |
| | | Banks – 6.3% | |
| | 253,000 | | | Lakeland Financial
Indiana Bank | | $ | 6,545,110
| | |
| | 480,000 | | | Valley National Bancorp (b)
New Jersey/New York Bank | | | 5,937,600
| | |
| | 161,194 | | | Hancock Holding
Gulf Coast Bank | | | 5,153,372
| | |
| | 107,000 | | | SVB Financial Group (a)
Bank to Venture Capitalists | | | 5,102,830
| | |
| | 284,000 | | | MB Financial
Chicago Bank | | | 4,856,400
| | |
| | 421,000 | | | Associated Banc-Corp
Midwest Bank | | | 4,702,570
| | |
| | 368,000 | | | TCF Financial
Great Lakes Bank | | | 3,797,760
| | |
| | 666,200 | | | First Busey
Illinois Bank | | | 3,331,000
| | |
| | 70,000 | | | City National
Bank & Asset Manager | | | 3,092,600
| | |
| | 292,460 | | | Pacific Continental Bank
Pacific Northwest Bank | | | 2,588,271
| | |
| | 97,700 | | | Sandy Spring Bancorp
Baltimore, D.C. Bank | | | 1,714,635
| | |
| | 504,451 | | | Guaranty Bancorp (a)
Colorado Bank | | | 741,543
| | |
| | 32,482 | | | Green Bankshares (a)
Tennessee Bank | | | 40,927
| | |
| | | | | | | | 47,604,618 | | |
| | | Finance Companies – 3.1% | |
| | 138,000 | | | World Acceptance (a)
Personal Loans | | | 10,143,000
| | |
| | 146,900 | | | McGrath Rentcorp
Temporary Space & IT Rentals | | | 4,258,631
| | |
| | 258,600 | | | H&E Equipment Services (a)
Heavy Equipment Leasing | | | 3,470,412
| | |
| | 201,000 | | | CAI International (a)
International Container Leasing | | | 3,107,460
| | |
| | 60,000 | | | Textainer Group Holdings
Top International Container Leasor | | | 1,747,200
| | |
| | 27,500 | | | Aaron's
Rent to Own | | | 733,700
| | |
| | | | | | | | 23,460,403 | | |
Number of
Shares | | | | Value | |
| | | Savings & Loans – 1.2% | |
| | 408,600 | | | ViewPoint Financial
Texas Thrift | | $ | 5,315,886
| | |
| | 142,000 | | | Berkshire Hills Bancorp
Northeast Thrift | | | 3,150,980
| | |
| | 52,011 | | | Kaiser Federal
Los Angeles Savings & Loan | | | 666,781
| | |
| | | | | | | | 9,133,647 | | |
| | | Insurance – 0.9% | |
| | 146,500 | | | Leucadia National
Insurance Holding Company | | | 3,331,410
| | |
| | 19,000 | | | Enstar Group (a)
Insurance/Reinsurance & Related Services | | | 1,865,800
| | |
| | 27,000 | | | Allied World Holdings
Commercial Lines Insurance/Reinsurance | | | 1,699,110
| | |
| | | | | | | | 6,896,320 | | |
| | | Brokerage & Money Management – 0.7% | |
| | 206,000 | | | SEI Investments
Mutual Fund Administration & Investment Management | | | 3,574,100
| | |
| | 85,000 | | | Eaton Vance (b)
Specialty Mutual Funds | | | 2,009,400
| | |
| | | | 5,583,500 | | |
| | | | | Total Finance | | | 92,678,488 | | |
| | | Energy & Minerals – 10.0% | |
| | | Oil Services – 6.5% | |
| | 542,800 | | | FMC Technologies (a)
Oil & Gas Wellhead Manufacturer | | | 28,350,444
| | |
| | 436,100 | | | Atwood Oceanics (a)
Offshore Drilling Contractor | | | 17,352,419
| | |
| | 117,000 | | | Hornbeck Offshore (a)
Supply Vessel Operator in U.S. Gulf of Mexico | | | 3,629,340
| | |
| | | | | | | | 49,332,203 | | |
| | | Oil & Gas Producers – 2.6% | |
| | 92,000 | | | SM Energy
Oil and Gas Producer | | | 6,725,200
| | |
| | 81,000 | | | Rosetta Resources (a)
Oil and Gas Producer Exploring in South Texas and Montana | | | 3,523,500
| | |
See accompanying notes to financial statements.
11
Wanger USA 2011 Annual Report
Wanger USA
Statement of Investments, December 31, 2011
Number of
Shares | | | | Value | |
| | | Oil & Gas Producers – 2.6% (cont) | |
| | 83,000 | | | Swift Energy (a)
Oil and Gas Exploration and Production | | $ | 2,466,760
| | |
| | 74,800 | | | Oasis Petroleum (a)
Oil Producer in North Dakota | | | 2,175,932
| | |
| | 166,000 | | | Houston American Energy (a) (b)
Oil and Gas Exploration/Production in Colombia | | | 2,023,540
| | |
| | 63,000 | | | Northern Oil & Gas (b)
Small E&P Company in North Dakota Bakken | | | 1,510,740
| | |
| | 16,600 | | | Petroleum Development Corporation (a)
Oil & Gas Producer in U.S. | | | 582,826
| | |
| | 63,200 | | | Quicksilver Resources (a)
Natural Gas and Coal Steam Gas Producer | | | 424,072
| | |
| | | | | | | | 19,432,570 | | |
| | | Mining – 0.9% | |
| | 56,000 | | | Core Laboratories (Netherlands)
Oil & Gas Reservoir Consulting | | | 6,381,200
| | |
| | 100,000 | | | Augusta Resource (b)
U.S. Copper/Molybdenum Mine | | | 310,000
| | |
| | | | 6,691,200 | | |
| | | | | Total Energy & Minerals | | | 75,455,973 | | |
| | | Health Care – 9.9% | |
| | | Biotechnology & Drug Delivery – 5.0% | |
| | 254,000 | | | BioMarin Pharmaceutical (a)
Biotech Focused on Orphan Diseases | | | 8,732,520
| | |
| | 368,000 | | | Seattle Genetics (a) (b)
Antibody-based Therapies for Cancer | | | 6,151,120
| | |
| | 100,000 | | | Onyx Pharmaceuticals (a)
Commercial-stage Biotech Focused on Cancer | | | 4,395,000
| | |
| | 191,800 | | | Auxilium Pharmaceuticals (a)
Biotech Focused on Niche Disease Areas | | | 3,822,574
| | |
| | 506,900 | | | Micromet (a) (b)
Next-generation Antibody Technology | | | 3,644,611
| | |
| | 495,000 | | | NPS Pharmaceuticals (a)
Orphan Drugs & Healthy Royalties | | | 3,262,050
| | |
| | 411,000 | | | Isis Pharmaceuticals (a)
Biotech Pioneer in Anti-sense Drugs | | | 2,963,310
| | |
| | 455,000 | | | Chelsea Therapeutics International (a)
Biotech Focused on Rare Diseases | | | 2,334,150
| | |
| | 161,000 | | | InterMune (a)
Drugs for Pulmonary Fibrosis & Hepatitis C | | | 2,028,600
| | |
Number of
Shares | | | | Value | |
| | 128,000 | | | Anthera Pharmaceuticals (a) | | $ | 785,920 | | |
| | | | | Biotech Focused on Cardiovascular, Cancer & Immunology | | | | | |
| | | | | | | | 38,119,855 | | |
| | | Medical Equipment & Devices – 3.3% | |
| | 171,000 | | | Alexion Pharmaceuticals (a)
Biotech Focused on Orphan Diseases | | | 12,226,500
| | |
| | 143,000 | | | Sirona Dental Systems (a)
Manufacturer of Dental Equipment | | | 6,297,720
| | |
| | 68,000 | | | Gen-Probe (a)
Molecular In-vitro Diagnostics | | | 4,020,160
| | |
| | 83,000 | | | Hill-Rom Holdings
Hospital Beds/Patient Handling | | | 2,796,270
| | |
| | | | | | | | 25,340,650 | | |
| | | Medical Supplies – 0.8% | |
| | 164,600 | | | Cepheid (a)
Molecular Diagnostics | | | 5,663,886
| | |
| | | Pharmaceuticals – 0.7% | |
| | 432,600 | | | Akorn (a)
Develops, Manufactures & Sells Specialty Generic Drugs | | | 4,810,512
| | |
| | 45,000 | | | Horizon Pharma (a) (b)
Specialty Pharma Company | | | 180,000
| | |
| | 116,100 | | | Alimera Sciences (b)
Ophthalmology-focused Pharmaceutical Company | | | 145,125
| | |
| | | | | | | | 5,135,637 | | |
| | | Health Care Services – 0.1% | |
| | 100,000 | | | Health Management Associates (a)
Non-urban Hospitals | | | 737,000
| | |
| | | | | Total Health Care | | | 74,997,028 | | |
| | | Other Industries – 5.9% | |
| | | Real Estate – 5.0% | |
| | 503,000 | | | Extra Space Storage
Self Storage Facilities | | | 12,187,690
| | |
| | 459,600 | | | BioMed Realty Trust
Life Science-focused Office Buildings | | | 8,309,568
| | |
| | 935,000 | | | Kite Realty Group
Community Shopping Centers | | | 4,216,850
| | |
| | 90,000 | | | Kilroy Realty
West Coast Office and Industrial Properties | | | 3,426,300
| | |
See accompanying notes to financial statements.
12
Wanger USA 2011 Annual Report
Wanger USA
Statement of Investments, December 31, 2011
Number of
Shares | | | | Value | |
| | | Real Estate – 5.0% (cont) | |
| | 122,200 | | | Dupont Fabros Technology (b)
Technology-focused Office Buildings | �� | $ | 2,959,684
| | |
| | 264,000 | | | Education Realty Trust
Student Housing | | | 2,700,720
| | |
| | 119,000 | | | Associated Estates Realty
Multi-family Properties | | | 1,898,050
| | |
| | 341,000 | | | DCT Industrial Trust
Industrial Properties | | | 1,745,920
| | |
| | | | | | | | 37,444,782 | | |
| | | Transportation – 0.9% | |
| | 100,500 | | | World Fuel Services
Global Fuel Broker | | | 4,218,990
| | |
| | 134,487 | | | Rush Enterprises Class A (a)
Truck Sales and Service | | | 2,813,468
| | |
| | | | 7,032,458 | | |
| | | | | Total Other Industries | | | 44,477,240 | | |
Total Equities
(Cost: $491,842,040) – 99.5% | | | 753,667,986 | | |
| Securities Lending Collateral – 2.6% | |
| | 19,497,407 | | | Dreyfus Government Cash
Management Fund (c)
(7 day yield of 0.00%) | | | 19,497,407 | | |
Total Securities Lending Collateral
(Cost: $19,497,407) | | | 19,497,407 | | |
Total Investments
(Cost: $511,339,447) – 102.1% (d) | | | 773,165,393 | | |
Obligation to Return Collateral for Securities
Loaned – (2.6)% | | | (19,497,407 | ) | |
| Cash and Other Assets Less Liabilities – 0.5% | | | 3,893,641 | | |
| Total Net Assets – 100.0% | | $ | 757,561,627 | | |
ADR = American Depositary Receipts
Notes to Statement of Investments
(a) Non-income producing security.
(b) All or a portion of this security was on loan at December 31, 2011. The total market value of securities on loan at December 31, 2011 was $18,900,469.
(c) Investment made with cash collateral received from securities lending activity.
(d) At December 31, 2011, for federal income tax purposes, the cost of investments was $514,622,991 and net unrealized appreciation was $258,542,402 consisting of gross unrealized appreciation of $304,085,857 and gross unrealized depreciation of $45,543,455.
At December 31, 2011, the Fund held investments in the following sectors:
| Sector | | Percentage
of
Net Assets | |
| Information | | | 29.8 | | |
| Industrial Goods & Services | | | 16.4 | | |
| Consumer Goods & Services | | | 15.3 | | |
| Finance | | | 12.2 | | |
| Energy & Minerals | | | 10.0 | | |
| Health Care | | | 9.9 | | |
| Other Industries | | | 5.9 | | |
| | | | 99.5 | | |
| Securities Lending Collateral | | | 2.6 | | |
| Obligation to Return Collateral for Securities Loaned | | | (2.6 | ) | |
| Cash and Other Assets less Liabilities | | | 0.5 | | |
| | | | 100.0 | | |
See accompanying notes to financial statements.
13
Wanger USA 2011 Annual Report
Wanger USA
Statement of Investments, December 31, 2011
Fair Value Measurements
Various inputs are used in determining the value of the Fund's investments, following the input prioritization hierarchy established by GAAP. These inputs are summarized in the three broad levels listed below:
• Level 1—quoted prices in active markets for identical securities
• Level 2—prices determined using other significant observable inputs (including quoted prices for similar securities, interest rates, prepayment speeds, credit risk and others)
• Level 3—prices determined using significant unobservable inputs where quoted prices or observable inputs are unavailable or less reliable (including management's own assumptions about the factors market participants would use in pricing an investment)
The inputs or methodology used for valuing securities are not necessarily an indication of the risk associated with investing in those securities.
Examples of the types of securities in which the Fund would typically invest and how they are classified within this hierarchy are as follows. Typical Level 1 securities include exchange traded domestic equities, mutual funds whose NAVs are published each day and exchange traded foreign equities that are not statistically fair valued. Typical Level 2 securities include exchange traded foreign equities that are statistically fair valued, forward foreign currency exchange contracts and short-term investments valued at amortized cost. Additionally, securities fair valued by the Valuation Committee of the Fund's Board of Trustees that rely on significant observable inputs are also included in Level 2. Typical Level 3 securities include any security fair valued by the Fund's Valuation Committee that relies on significant unobservable inputs.
The following table summarizes the inputs used, as of December 31, 2011, in valuing the Fund's assets:
| Investment Type | | Quoted Prices
(Level 1) | | Other
Significant
Observable
Inputs
(Level 2) | | Significant
Unobservable
Inputs
(Level 3) | | Total | |
| Equities | |
| Information | | $ | 225,598,105 | | | $ | — | | | $ | — | | | $ | 225,598,105 | | |
Industrial Goods &
Services | | | 124,182,442 | | | | — | | | | — | | | | 124,182,442 | | |
Consumer Goods &
Services | | | 116,278,710 | | | | — | | | | — | | | | 116,278,710 | | |
| Finance | | | 92,678,488 | | | | — | | | | — | | | | 92,678,488 | | |
| Energy & Minerals | | | 75,455,973 | | | | — | | | | — | | | | 75,455,973 | | |
| Health Care | | | 74,997,028 | | | | — | | | | — | | | | 74,997,028 | | |
| Other Industries | | | 44,477,240 | | | | — | | | | — | | | | 44,477,240 | | |
| Total Equities | | | 753,667,986 | | | | — | | | | — | | | | 753,667,986 | | |
Total Securities Lending
Collateral | | | 19,497,407 | | | | — | | | | — | | | | 19,497,407 | | |
| Total Investments | | $ | 773,165,393 | | | $ | — | | | $ | — | | | $ | 773,165,393 | | |
There were no significant transfers of financial assets between levels 1 and 2 during the period.
The following table reconciles asset balances for the year ending December 31, 2011, in which significant unobservable inputs (Level 3) were used in determining value:
Investments
in Securities | | Balance
as of
December 31,
2010 | | Realized
Gain/(Loss) | | Change in
Unrealized
Appreciation
(Depreciation) | | Purchases | | Sales | | Transfers
into
Level 3 | | Transfers
out of
Level 3 | | Balance
as of
December 31,
2011 | |
Equities
Health Care | | $ | 1,137 | | | $ | (1,037,369 | ) | | $ | 1,036,232 | | | $ | — | | | $ | — | | | $ | — | | | $ | — | | | $ | — | | |
The information in the above reconciliation table represents fiscal year to date activity for any securities identified as using Level 3 inputs at either the beginning or the end of the current fiscal period.
The change in unrealized appreciation attributed to securities owned at December 31, 2011, which were valued using significant unobservable inputs (Level 3) amounted to $0.
See accompanying notes to financial statements.
14
Wanger USA 2011 Annual Report
Statement of Assets and Liabilities
December 31, 2011
| Assets: | |
| Investments, at cost | | $ | 511,339,447 | | |
Investments, at value (including securities on
loan of $18,900,469) | | $ | 773,165,393 | | |
| Cash | | | 3,262,581 | | |
| Receivable for: | |
| Investments sold | | | 1,795,707 | | |
| Fund shares sold | | | 325,252 | | |
| Securities lending income | | | 9,148 | | |
| Dividends | | | 402,150 | | |
| Trustees' deferred compensation plan | | | 92,539 | | |
| Prepaid expenses | | | 11,579 | | |
| Total Assets | | | 779,064,349 | | |
| Liabilities: | |
| Collateral on securities loaned | | | 19,497,407 | | |
| Payable for: | |
| Investments purchased | | | 1,006,258 | | |
| Fund shares repurchased | | | 744,073 | | |
| Investment advisory fee | | | 17,584 | | |
| Administration fee | | | 1,042 | | |
| Transfer agent fee | | | 2 | | |
| Trustees' fees | | | 3,788 | | |
| Custody fee | | | 4,750 | | |
| Reports to shareholders | | | 74,692 | | |
| Chief compliance officer expenses | | | 2,172 | | |
| Trustees' deferred compensation plan | | | 92,539 | | |
| Other liabilities | | | 58,415 | | |
| Total Liabilities | | | 21,502,722 | | |
| Net Assets | | $ | 757,561,627 | | |
| Composition of Net Assets: | |
| Paid-in capital | | $ | 460,092,400 | | |
| Accumulated net investment loss | | | (87,823 | ) | |
| Accumulated net realized gain | | | 35,731,117 | | |
| Net unrealized appreciation on investments | | | 261,825,933 | | |
| Net Assets | | $ | 757,561,627 | | |
| Fund Shares Outstanding | | | 25,421,349 | | |
Net asset value, offering price and redemption
price per share | | $ | 29.80 | | |
Statement of Operations
For the Year Ended December 31, 2011
| Investment Income: | |
| Dividends (net foreign taxes withheld of $9,525) | | $ | 4,454,649 | | |
| Interest income | | | 746 | | |
| Securities lending income, net | | | 185,142 | | |
| Total Investment Income | | | 4,640,537 | | |
| Expenses: | |
| Investment advisory fee | | | 7,388,489 | | |
| Administration fee | | | 430,769 | | |
| Transfer agent fee | | | 704 | | |
| Trustees' fees | | | 49,071 | | |
| Custody fee | | | 30,527 | | |
| Reports to shareholders | | | 60,787 | | |
| Professional fees | | | 109,398 | | |
| Chief compliance officer expenses (See Note 4) | | | 33,936 | | |
| Other expenses (See Note 5) | | | 32,111 | | |
| Total Expenses | | | 8,135,792 | | |
| Advisory fee waiver (See Note 4) | | | (88,626 | ) | |
| Custody earnings credit | | | (2 | ) | |
| Net Expenses | | | 8,047,164 | | |
| Net Investment Loss | | | (3,406,627 | ) | |
Net Realized and Unrealized Gain (Loss) on
Investments: | |
| Net realized gain (loss) on: | |
| Investments | | | 40,209,704 | | |
| Net realized gain | | | 40,209,704 | | |
Net change in unrealized appreciation
(depreciation) on: | |
| Investments | | | (61,499,216 | ) | |
Net change in unrealized
depreciation | | | (61,499,216 | ) | |
| Net Loss | | | (21,289,512 | ) | |
| Net Decrease in Net Assets from Operations | | $ | (24,696,139 | ) | |
See accompanying notes to financial statements.
15
Wanger USA 2011 Annual Report
Statement of Changes in Net Assets
| | | Year Ended December 31, | |
| Increase (Decrease) in Net Assets | | 2011 | | 2010 | |
| Operations: | |
| Net investment loss | | $ | (3,406,627 | ) | | $ | (3,576,723 | ) | |
| Net realized gain (loss) on: | |
| Unaffiliated investments | | | 40,209,704 | | | | 146,415,741 | | |
| Affiliated investments | | | — | | | | (1,462,746 | ) | |
| Reimbursement from transaction costs | | | — | | | | 19,197 | | |
| Net change in unrealized appreciation (depreciation) on: | |
| Unaffiliated investments | | | (61,499,216 | ) | | | 50,758,257 | | |
| Affiliated investments | | | — | | | | (2,077,908 | ) | |
| Net Increase (Decrease) in Net Assets from Operations | | | (24,696,139 | ) | | | 190,075,818 | | |
| Distributions to Shareholders: | |
| From net realized gains | | | (78,451,985 | ) | | | — | | |
| Total Distributions to Shareholders | | | (78,451,985 | ) | | | — | | |
| Share Transactions: | |
| Subscriptions | | | 40,742,221 | | | | 40,189,516 | | |
| Distributions reinvested | | | 78,451,985 | | | | — | | |
| Redemptions | | | (169,908,230 | ) | | | (595,995,083 | ) | |
| Net Decrease from Share Transactions | | | (50,714,024 | ) | | | (555,805,567 | ) | |
| Total Decrease in Net Assets | | | (153,862,148 | ) | | | (365,729,749 | ) | |
| Net Assets: | |
| Beginning of period | | | 911,423,775 | | | | 1,277,153,524 | | |
| End of period | | $ | 757,561,627 | | | $ | 911,423,775 | | |
| Accumulated net investment loss at end of period | | $ | (87,823 | ) | | $ | (121,588 | ) | |
See accompanying notes to financial statements.
16
Wanger USA 2011 Annual Report
Financial Highlights
| | | Year Ended December 31, | |
| Selected data for a share outstanding throughout each period | | 2011 | | 2010 | | 2009 | | 2008 | | 2007 | |
| Net Asset Value, Beginning of Period | | $ | 33.86 | | | $ | 27.45 | | | $ | 19.30 | | | $ | 36.26 | | | $ | 36.36 | | |
| Income from Investment Operations: | |
| Net investment loss (a) | | | (0.13 | ) | | | (0.10 | ) | | | (0.06 | ) | | | (0.07 | ) | | | (0.05 | )(b) | |
| Net realized and unrealized gain (loss) on investments | | | (0.82 | ) | | | 6.51 | | | | 8.21 | | | | (13.16 | ) | | | 1.91 | | |
| Total from Investment Operations | | | (0.95 | ) | | | 6.41 | | | | 8.15 | | | | (13.23 | ) | | | 1.86 | | |
| Less Distributions to Shareholders: | |
| From net realized gains | | | (3.11 | ) | | | — | | | | — | | | | (3.73 | ) | | | (1.96 | ) | |
| Total Distributions to Shareholders | | | (3.11 | ) | | | — | | | | — | | | | (3.73 | ) | | | (1.96 | ) | |
| Net Asset Value, End of Period | | $ | 29.80 | | | $ | 33.86 | | | $ | 27.45 | | | $ | 19.30 | | | $ | 36.26 | | |
| Total Return (c) | | | (3.49 | )%(d) | | | 23.35 | %(d) | | | 42.23 | % | | | (39.68 | )% | | | 5.39 | % | |
| Ratios to Average Net Assets/Supplemental Data: | |
| Net expenses before interest expense (e) | | | 0.93 | % | | | 0.97 | % | | | 0.98 | % | | | 0.96 | % | | | 0.95 | % | |
| Interest expense | | | — | | | | 0.00 | %(f) | | | — | | | | — | | | | — | | |
| Interest expense waiver | | | — | | | | 0.00 | %(f) | | | — | | | | — | | | | — | | |
| Net expenses (e) | | | 0.93 | % | | | 0.97 | % | | | 0.98 | % | | | 0.96 | % | | | 0.95 | % | |
| Net investment loss (e) | | | (0.40 | )% | | | (0.35 | )% | | | (0.29 | )% | | | (0.26 | )% | | | (0.15 | )% | |
| Waiver/Reimbursement | | | 0.01 | % | | | 0.01 | % | | | — | | | | — | | | | — | | |
| Portfolio turnover rate | | | 10 | % | | | 27 | % | | | 30 | % | | | 22 | % | | | 27 | % | |
| Net assets, end of period (000s) | | $ | 757,562 | | | $ | 911,424 | | | $ | 1,277,154 | | | $ | 952,249 | | | $ | 1,688,040 | | |
(a) Net investment income per share was based upon the average shares outstanding during the period.
(b) Net investment income per share reflects special dividends. The effect of these dividends amounted to $0.08 per share.
(c) Total return at net asset value assuming all distributions reinvested.
(d) Had the investment adviser and/or any of its affiliates not waived a portion of expenses, total return would have been reduced.
(e) The benefits derived from custody fees paid indirectly had an impact of less than 0.01%.
(f) Rounds to less than 0.01%.
See accompanying notes to financial statements.
17
Wanger USA 2011 Annual Report
Notes to Financial Statements
1. Nature of Operations
Wanger USA (the Fund), is a series of Wanger Advisors Trust (the Trust), an open-end management investment company organized as a Massachusetts business trust. The investment objective of the Fund is to seek long-term capital appreciation. The Fund is available only for allocation to certain life insurance company separate accounts established for the purpose of funding qualified and nonqualified variable annuity contracts and variable life insurance policies and may also be offered directly to certain types of pension plans and retirement arrangements.
2. Significant Accounting Policies
The preparation of financial statements in accordance with accounting principles generally accepted in the United States of America (GAAP) requires management to make certain estimates and assumptions that affect the reported amounts of assets and liabilities, the disclosure of contingent assets and liabilities at the date of the financial statements and the reported amounts of revenue and expenses during the reporting period. Actual results could differ from those estimates.
Security valuation
Securities of the Fund are valued at market value or, if a market quotation for a security is not readily available or is deemed not to be reliable because of events or circumstances that have occurred between the market quotation and the time as of which the security is to be valued, the security is valued at its fair value determined in good faith under consistently applied procedures established by the Board of Trustees. A security traded on a securities exchange or in an over-the-counter market in which transaction prices are reported is valued at the last sales price at the time of valuation. A security traded principally on NASDAQ is valued at the NASDAQ official closing price. Mutual Funds and Exchange Traded Funds are valued at their closing net asset value as reported to NASDAQ. A security for which there is no reported sale on the valuation date is valued at the latest bid quotation.
Short-term investments maturing in 60 days or less are valued at amortized cost, which approximates market value.
A security for which a market quotation is not readily available and any other assets are valued at their fair value determined in good faith under consistently applied procedures established by the Board of Trustees. The Trust has retained an independent statistical fair value pricing service that employs a systematic methodology to assist in the fair valuation process for securities principally traded in a foreign market in order to adjust for possible changes in value that may occur between the close of the foreign market and the time as of which the securities are to be valued. If a security is valued at a fair value, that value may be different from the last quoted market price for the security. A security for which there is no reported sale on the valuation date is valued at the latest bid quotations.
Repurchase agreements
The Fund may engage in repurchase agreement transactions. The Fund, through its custodian, receives delivery of underlying securities collateralizing each repurchase agreement. The counterparty is required to maintain collateral that is at all times at least equal to the repurchase price including interest. In the event of default or bankruptcy by the other party to the agreement, realization and/or retention of the collateral may be subject to legal proceedings.
Restricted securities
Restricted securities are securities that may only be resold upon registration under federal securities laws or in transactions exempt from registration. In some cases, the issuer of restricted securities has agreed to register such securities for resale at the issuer's expense either upon demand by the Fund or in connection with another registered offering of the securities. Many restricted securities may be resold in the secondary market in transactions exempt from registration. Such restricted securities may be determined to be liquid under criteria established by the Board of Trustees.
Security transactions and investment income
Security transactions are accounted for on the trade date (date the order to buy or sell is executed) and dividend income is recorded on the ex-dividend date, except that certain dividends from foreign securities are recorded as soon as the information is available to the Fund. Interest income is recorded on the accrual basis and includes amortization of discounts on debt obligations when required for federal income tax purposes. Realized gains and losses from security transactions are recorded on an identified cost basis.
Awards, if any, from class action litigation related to securities owned may be recorded as a reduction of cost of those securities. If the applicable securities are no longer owned, the proceeds are recorded as realized gains.
The Fund estimates the tax character of distributions from real estate investment trusts (REITs). Distributions received in excess of income are recorded as a reduction of the cost of the related investments. If the applicable securities are no longer owned, any distributions received in excess of income are recorded as realized gains.
Expenses
General expenses of the Trust are allocated to the Fund and the other series of the Trust based upon relative net assets or other expense allocation methodologies determined by the nature of the expense. Expenses directly attributable to the Fund are charged to the Fund.
Fund share valuation
Fund shares are sold and redeemed on a continuing basis at net asset value. Net asset value per share is determined daily as of the close of trading on the New York Stock Exchange (the Exchange) on each day the Exchange is open for trading by dividing the total value of the Fund's investments and other assets, less liabilities, by the number of Fund shares outstanding.
Securities lending
The Fund may lend securities up to one-third of the value of its total assets to certain approved brokers, dealers and other financial institutions to earn additional income. The Fund retains the benefits of owning the securities, including receipt of dividends or interest generated by the security. The Fund also receives a fee for the loan. The Fund has the ability to recall the loans at any time and could do so in order to vote proxies or to sell the loaned securities. Each loan is collateralized by cash that exceeded the value of the securities on loan. The market value of the loaned securities is determined daily at the close of business of the Fund and any additional required collateral is delivered to each Fund on the next business day. The Fund has elected to invest the cash collateral in the Dreyfus Government Cash Management Fund, and the income earned is paid to the Fund, net of any fees remitted to Goldman Sachs Agency Lending, the Fund's lending agent, and borrower rebates. The Fund's adviser, Columbia Wanger Asset Management, LLC (CWAM), does not retain any fees earned by the lending program. Generally, in the event of borrower default, the Fund has the right to use the collateral to offset any losses incurred. In the event the Fund is delayed or prevented from exercising its right to dispose of the collateral, there may be a potential loss to the Fund. Some of these losses may be indemnified by the lending agent. The Fund bears the risk of loss with respect to the investment of collateral.
The net lending income earned by the Fund as of December 31, 2011, is included in the Statement of Operations.
Custody fees/Credits
Custody fees are reduced based on the Fund's cash balances maintained with the custodian. The amount is disclosed as a reduction of total expenses in the Statement of Operations.
Federal income taxes
The Fund has complied with the provisions of the Internal Revenue Code available to regulated investment companies and, in the manner provided therein, distributes
18
Wanger USA 2011 Annual Report
Notes to Financial Statements, continued
substantially all its taxable income, as well as any net realized gain on sales of investments and foreign currency transactions reportable for federal income tax purposes. Accordingly, the Fund paid no federal income taxes and no federal income tax provision was required.
Distributions to shareholders
Distributions to shareholders are recorded on the ex-dividend date.
Indemnification
In the normal course of business, the Trust on behalf of the Fund enters into contracts that contain a variety of representations and warranties and that provide general indemnities. The Fund's maximum exposure under these arrangements is unknown, as this would involve future claims against the Fund. Also under the Trust's organizational documents, the trustees and officers of the Trust are indemnified against certain liabilities that may arise out of their duties to the Trust. However based on experience, the Fund expects the risk of loss due to these warranties and indemnities to be remote.
Recent Accounting Pronouncement
Fair Value Measurements and Disclosures
In May 2011, the Financial Accounting and Standards Board issued ASU No. 2011-04 modifying Topic 820, Fair Value Measurements and Disclosures. At the same time, the International Accounting Standards Board issued International Financial Reporting Standard 13, Fair Value Measurement. The objective of the FASB and IASB is convergence of their guidance on fair value measurements and disclosures.
Specifically, ASU No. 2011-04 requires reporting entities to disclose i) the amounts of any transfers between Level 1 and Level 2, and the reasons for the transfers, ii) for Level 3 fair value measurements, a) quantitative information about significant unobservable inputs used, b) a description of the valuation processes used by the reporting entity and c) a narrative description of the sensitivity of the fair value measurement to changes in unobservable inputs if a change in those inputs might result in a significantly higher or lower fair value measurement. The effective date of ASU No. 2011-04 is for interim and annual periods beginning after December 15, 2011. At this time, management is evaluating the implications of this guidance and the impact it will have on the financial statement amounts and footnote disclosures, if any.
3. Federal Tax Information
The timing and character of income and capital gain distributions are determined in accordance with income tax regulations, which may differ from GAAP. Reclassifications are made to the Fund's capital accounts for permanent tax differences to reflect income and gains available for distribution (or available capital loss carryforwards) under income tax regulations.
For the year ended December 31, 2011, permanent book and tax basis differences resulting primarily from differing treatment of net operating losses were identified and reclassified among the components of the Fund's net assets as follows:
Accumulated
Net Investment
Income | | Accumulated
Net Realized
Gain (Loss) | | Paid-In Capital | |
| $ | 3,440,392 | | | $ | (369,603 | ) | | $ | (3,070,789 | ) | |
Net investment income and net realized gains (losses), as disclosed on the Statement of Operations, and net assets were not affected by this reclassification.
The tax character of distributions paid during the years ended December 31, 2011 and December 31, 2010 were as follows:
| | | December 31, 2011 | | December 31, 2010 | |
| Ordinary Income* | | $ | — | | | $ | — | | |
| Long-Term Capital Gains | | | 78,451,985 | | | | — | | |
* For tax purposes short-term capital gain distributions, if any, are considered ordinary income distributions.
As of December 31, 2011, the components of distributable earnings on a tax basis were as follows:
Undistributed
Ordinary
Income | | Undistributed
Long-Term
Capital Gains | | Net Unrealized
Appreciation
(Depreciation)* | |
| $ | — | | | $ | 39,014,662 | | | $ | 258,542,402 | | |
* The differences between book-basis and tax-basis net unrealized appreciation/depreciation are primarily due to deferral of losses from wash sales.
On December 22, 2010, the Regulated Investment Company Modernization Act of 2010 (the Act) was enacted, which changed various technical rules governing the tax treatment of regulated investment companies. The changes are generally effective for taxable years beginning after the date of enactment. Under the Act, the Fund will be permitted to carry forward capital losses incurred in taxable years beginning after the date of enactment for an unlimited period. However, any losses incurred during those future taxable years will be required to be utilized prior to the losses incurred in pre-enactment taxable years, which carry an expiration date. As a result of this ordering rule, pre-enactment capital loss carryforwards may be more likely to expire unused.
Management is required to determine whether a tax position of the Fund is more likely than not to be sustained upon examination by the applicable taxing authority, including resolution of any related appeals or litigation processes, based on the technical merits of the position. The tax benefit to be recognized by the Fund is measured as the largest amount of benefit that is greater than fifty percent likely of being realized upon ultimate settlement. Management is not aware of any tax positions for which it is reasonably possible that the total amounts of unrecognized tax benefits will significantly change in the next twelve months. However, management's conclusions may be subject to review and adjustment at a later date based on factors including, but not limited to, new tax laws, regulations, and administrative interpretations (including relevant court decisions). The Fund's federal tax returns for the prior three fiscal years remain subject to examination by the Internal Revenue Service.
4. Transactions With Affiliates
CWAM is a wholly owned subsidiary of Columbia Management Investment Advisers, LLC (Columbia Management), which in turn is a wholly owned subsidiary of Ameriprise Financial, Inc. (Ameriprise Financial). CWAM furnishes continuing investment supervision to the Fund and is responsible for the overall management of the Fund's business affairs.
CWAM receives a monthly advisory fee based on the Fund's average daily net assets at the following annual rates:
| Average Daily Net Assets | | Annual Fee Rate | |
| Up to $100 million | | | 0.94 | % | |
| $100 million to $250 million | | | 0.89 | % | |
| $250 million to $2 billion | | | 0.84 | % | |
| $2 billion and over | | | 0.80 | % | |
19
Wanger USA 2011 Annual Report
Notes to Financial Statements, continued
For the year ended December 31, 2011, the effective investment advisory fee rate, net of fee waivers, was 0.85% of the Fund's average daily net assets.
Effective April 30, 2010, CWAM has contractually agreed to reimburse the Fund to the extent that investment advisory fees exceed an annual percentage of 0.85% of average daily net assets on an annualized basis, through April 30, 2012. The reimbursement to the Fund for the year ended December 31, 2011 was $88,626.
CWAM provides administrative services and receives an administration fee from the Fund at the following annual rates:
Wanger Advisors Trust Aggregate
Average Daily Net Assets of the Trust | | Annual Fee Rate | |
| Up $4 billion to | | | 0.05 | % | |
| $4 billion to $6 billion | | | 0.04 | % | |
| $6 billion to $8 billion | | | 0.03 | % | |
| $8 billion and over | | | 0.02 | % | |
For the year ended December 31, 2011, the effective administration fee rate was 0.05% of the Fund's average daily net assets. Columbia Management provides certain sub-administrative services to the Fund.
Columbia Management Investment Distributors, Inc. (CMID), a wholly owned subsidiary of Ameriprise Financial, serves as the Fund's distributor and principal underwriter.
Columbia Management Investment Services Corp. (CMIS), a wholly owned subsidiary of Ameriprise Financial, is the transfer agent of the Funds. For its services, the Fund pays CMIS a monthly fee at the annual rate of $21.00 per open account. CMIS also receives reimbursement from the Fund for certain out-of-pocket expenses.
Certain officers and trustees of the Trust are also officers of CWAM. The Trust makes no direct payments to its officers and trustees who are affiliated with CWAM.
The Board of Trustees has appointed a Chief Compliance Officer of the Trust in accordance with federal securities regulations. The Fund, along with other affiliated funds, pays its pro-rata share of the expenses associated with the Office of the Chief Compliance Officer. These expenses are disclosed separately as "Chief compliance officer expenses" in the Statement of Operations.
The Trust offers a deferred compensation plan for its independent trustees. Under that plan, a trustee may elect to defer all or a portion of his or her compensation. Amounts deferred are retained by the Trust and may represent an unfunded obligation of the Trust. The value of amounts deferred is determined by reference to the change in value of Class Z shares of one or more series of Columbia Acorn Trust or a money market fund as specified by the trustee. Benefits under the deferred compensation plan are payable in accordance with the plan.
5. Borrowing Arrangements
Effective July 22, 2011, the Trust participates in a $150 million credit facility with JPMorgan Chase Bank, N.A., along with another Trust managed by CWAM, which was entered into to facilitate portfolio liquidity. Under the facility, interest is charged to each participating Fund based on its borrowings at a rate per annum equal to the higher of Federal Funds Rate or Overnight LIBOR plus 1.25%. In addition, a commitment fee of 0.10% per annum of the unutilized line of credit is accrued and apportioned among the participating Funds based on their relative net assets. The commitment fee is included in "Other expenses" in the Statement of Operations. The Trust enters into this line of credit for one year durations.
Prior to July 22, 2011, the Trust participated in a $150 million credit facility with State Street Bank and Trust Company (State Street) under similar lending terms. The commitment fee under the State Street arrangement was 0.125% per annum of the unutilized line of credit.
No amounts were borrowed by the Fund under either facility during the year ended December 31, 2011.
6. Fund Share Transactions
Proceeds and payments on Fund shares as shown in the Statement of Changes in Net Assets are in respect of the following numbers of shares:
| | | Year Ended
December 31, 2011 | | Year Ended
December 31, 2010 | |
| Shares sold | | | 1,244,190 | | | | 1,377,861 | | |
Shares issued in reinvestment
of dividend distributions | | | 2,434,129 | | | | — | | |
| Less shares redeemed | | | (5,174,081 | ) | | | (20,982,637 | ) | |
| Net decrease in shares outstanding | | | (1,495,762 | ) | | | (19,604,776 | ) | |
7. Investment Transactions
The aggregate cost of purchases and proceeds from sales other than short-term obligations for the year ended December 31, 2011, were $85,431,303 and $218,818,159, respectively.
8. Shareholder Concentration
At December 31, 2011, two unaffiliated shareholder accounts owned 29.5% of the outstanding shares of the Fund. The Fund has no knowledge about whether any portion of those shares was owned beneficially. Affiliated shareholder accounts owned 57.0% of the outstanding shares of the Fund. Subscription and redemption activity of these accounts may have a significant effect on the operations of the Fund.
9. Subsequent Events
Management has evaluated the events and transactions that have occurred through the date the financial statements were issued and noted no items requiring adjustment of the financial statements or additional disclosure.
10. Information Regarding Pending and Settled Legal Proceedings
In June 2004, an action captioned John E. Gallus et al. v. American Express Financial Corp. and American Express Financial Advisors Inc. was filed in the United States District Court for the District of Arizona. The plaintiffs allege that they are investors in several American Express Company mutual funds (branded as Columbia) and they purport to bring the action derivatively on behalf of those funds under the Investment Company Act of 1940. The plaintiffs allege that fees allegedly paid to the defendants by the funds for investment advisory and administrative services are excessive. The plaintiffs seek remedies including restitution and rescission of investment advisory and distribution agreements. The plaintiffs voluntarily agreed to transfer this case to the United States District Court for the District of Minnesota (the District Court). In response to defendants' motion to dismiss the complaint, the District Court dismissed one of plaintiffs' four claims and granted plaintiffs limited discovery. Defendants moved for summary judgment in April 2007. Summary judgment was granted in the defendants' favor on July 9, 2007. The plaintiffs filed a notice of appeal with the Eighth Circuit Court of Appeals (the Eighth Circuit) on August 8, 2007. On April 8, 2009, the Eighth Circuit reversed summary judgment and remanded to the District Court for further proceedings. On August 6, 2009, defendants filed a writ of certiorari with the U.S. Supreme Court (the Supreme Court), asking the Supreme Court to stay the District Court proceedings while the Supreme Court considers and rules in a case captioned Jones v. Harris Associates, which involves issues of law similar to those presented in the Gallus case. On March 30, 2010, the Supreme Court issued its ruling in Jones v. Harris Associates, and on April 5, 2010, the Supreme Court vacated the Eighth Circuit's decision in the Gallus case and remanded the case to the Eighth Circuit for further consideration in light of the Supreme Court's decision in Jones v. Harris Associates. On June 4, 2010, the Eighth Circuit remanded the Gallus case to the District Court for further consideration in light of the Supreme Court's decision in Jones v. Harris Associates. On December 9, 2010, the District Court reinstated its July 9, 2007 summary judgment order in favor of the defendants. On January 10, 2011, plaintiffs filed a notice of appeal with the Eighth Circuit. In response to the plaintiffs' opening appellate brief filed on March 18, 2011, the defendants filed a
20
Wanger USA 2011 Annual Report
Notes to Financial Statements, continued
response brief on May 4, 2011 with the Eighth Circuit. The plaintiffs filed a reply brief on May 26, 2011 and oral arguments took place on November 17, 2011.
In December 2005, without admitting or denying the allegations, American Express Financial Corporation (AEFC, which is now known as Ameriprise Financial, Inc. (Ameriprise Financial)), entered into settlement agreements with the Securities and Exchange Commission (SEC) and Minnesota Department of Commerce (MDOC) related to market timing activities. As a result, AEFC was censured and ordered to cease and desist from committing or causing any violations of certain provisions of the Investment Advisers Act of 1940, the Investment Company Act of 1940, and various Minnesota laws. AEFC agreed to pay disgorgement of $10 million and civil money penalties of $7 million. AEFC also agreed to retain an independent distribution consultant to assist in developing a plan for distribution of all disgorgement and civil penalties ordered by the SEC in accordance with various undertakings detailed at www.sec.gov/litigation/admin/ia-2451.pdf. Ameriprise Financial and its affiliates have cooperated with the SEC and the MDOC in these legal proceedings, and have made regular reports to the funds' Boards of Trustees.
Ameriprise Financial and certain of its affiliates have historically been involved in a number of legal, arbitration and regulatory proceedings, including routine litigation, class actions, and governmental actions, concerning matters arising in connection with the conduct of their business activities. Ameriprise Financial believes that the Funds are not currently the subject of, and that neither Ameriprise Financial nor any of its affiliates are the subject of, any pending legal, arbitration or regulatory proceedings that are likely to have a material adverse effect on the Funds or the ability of Ameriprise Financial or its affiliates to perform under their contracts with the Funds. Ameriprise Financial is required to make 10-Q, 10-K and, as necessary, 8-K filings with the Securities and Exchange Commission on legal and regulatory matters that relate to Ameriprise Financial and its affiliates. Copies of these filings may be obtained by accessing the SEC website at www.sec.gov.
There can be no assurance that these matters, or the adverse publicity associated with them, will not result in increased fund redemptions, reduced sale of fund shares or other adverse consequences to the Funds. Further, although we believe proceedings are not likely to have a material adverse effect on the Funds or the ability of Ameriprise Financial or its affiliates to perform under their contracts with the Funds, these proceedings are subject to uncertainties and, as such, we are unable to estimate the possible loss or range of loss that may result. An adverse outcome in one or more of these proceedings could result in adverse judgments, settlements, fines, penalties or other relief that could have a material adverse effect on the consolidated financial condition or results of operations of Ameriprise Financial.
21
Wanger USA 2011 Annual Report
Report of Independent Registered Public Accounting Firm
To the Board of Trustees and Shareholders of Wanger USA:
In our opinion, the accompanying statement of assets and liabilities, including the statement of investments, and the related statements of operations and of changes in net assets and the financial highlights present fairly, in all material respects, the financial position of Wanger USA (a series of the Wanger Advisers Trust, hereinafter referred to as the "Fund") at December 31, 2011, the results of its operations for the year then ended, the changes in its net assets for each of the two years in the period then ended and the financial highlights for each of the five years in the period then ended, in conformity with accounting principles generally accepted in the United States of America. These financial statements and financial highlights (hereafter referred to as "financial statements") are the responsibility of the Fund's management; our responsibility is to express an opinion on these financial statements based on our audits. We conducted our audits of these financial statements in accordance with the standards of the Public Company Accounting Oversight Board (United States). Those standards require that we plan and perform the audit to obtain reasonable assurance about whether the financial statements are free of material misstatement. An audit includes examining, on a test basis, evidence supporting the amounts and disclosures in the financial statements, assessing the accounting principles used and significant estimates made by management, and evaluating the overall financial statement presentation. We believe that our audits, which included confirmation of securities at December 31, 2011 by correspondence with the custodian and brokers, provide a reasonable basis for our opinion.
PricewaterhouseCoopers LLP
Chicago, Illinois
February 17, 2012
22
Wanger USA 2011 Annual Report
Federal Income Tax Information (Unaudited)
The Fund hereby designates as a capital gain dividend with respect to the fiscal year ended December 31, 2011, $41,043,006, or, if subsequently determined to be different, the net capital gain of such year.
23
Wanger USA 2011 Annual Report
Board of Trustees and Management of Wanger Advisors Trust
Each trustee may serve a term of unlimited duration. The Trust's By-laws generally require that a trustee retire at the end of the calendar year in which the trustee attains the age of 75 years. The trustees appoint their own successors, provided that at least two-thirds of the trustees, after such appointment, have been elected by shareholders. Shareholders may remove a trustee, with or without cause, upon the vote of two-thirds of the Trust's outstanding shares at any meeting called for that purpose. A trustee may be removed, with or without cause, upon the vote of a majority of the trustees. The names of the trustees and officers of the Trust, the date each was first elected or appointed to office, their principal business occupations during at least the last five years, number of portfolios in the fund complex they oversee, and other directorships they hold, are shown below. Each trustee serves in such capacity for each of the four series of Wanger Advisors Trust and for each of the eight series of Columbia Acorn Trust.
The address for the trustees and officers of the Trust is Columbia Wanger Asset Management, LLC, 227 West Monroe Street, Suite 3000, Chicago, Illinois 60606. The Funds' Statement of Additional Information includes additional information about the Funds' trustees and officers. You may obtain a free copy of the Statement of Additional Information by writing or calling toll-free:
Columbia Wanger Asset Management, LLC
Shareholder Services Group
227 W. Monroe, Suite 3000
Chicago IL 60606
1-800-922-6769
Name, Position(s) with
Wanger Advisors Trust
and Age at
December 31, 2011 | | Year First
Elected or
Appointed
to Office* | | Principal Occupation(s) during
Past Five Years | | Number of
Portfolios in
Fund Complex
Overseen by
Trustee/Officer | | Other
Directorships
in addition to
Wanger Advisors Trust | |
| Trustees who are not interested persons of Wanger Advisors Trust: | | | | | | | |
|
Laura M. Born, 46,
Trustee and Chair | | | 2007 | | | Adjunct Assistant Professor of Finance, University of Chicago Booth School of Business; formerly, Managing Director – Investment Banking, JP Morgan Chase & Co. (broker/dealer) 2002-2007; prior thereto, associated with JP Morgan as an investment professional since 1991. | | | 12 | | | Columbia Acorn Trust | |
|
Michelle L. Collins, 51,
Trustee | | | 2008 | | | President, Cambium LLC (financial and business advisory firm) since 2007; Advisory Board Member, Svoboda Capital Partners LLC (private equity firm) since 2007; Managing Director Svoboda Capital Partners LLC, 1998-2006. | | | 12 | | | Columbia Acorn Trust; Bucyrus International, Inc. (mining equipment manufacturer); Molex, Inc. (electronics components manufacturer); CDW Corporation (electronics components manufacturer) until October 2007. | |
|
Maureen M. Culhane, 63,
Trustee | | | 2007 | | | Retired. Formerly, Vice President, Goldman Sachs Asset Management, L.P. (investment adviser), 2005-2007, and Vice President (Consultant) — Strategic Relationship Management, Goldman Sachs & Co., 1999-2005. | | | 12 | | | Columbia Acorn Trust | |
|
Margaret M. Eisen, 58,
Trustee | | | 2002 | | | Chief Investment Officer, EAM International LLC (corporate finance and asset management) since 2003; Managing Director, CFA Institute, 2005-2008. | | | 12 | | | Columbia Acorn Trust; Antigenics, Inc. (biotechnology and pharmaceuticals) until June 2009. | |
|
John C. Heaton, 52,
Trustee | | | 2010 | | | Joseph L. Gidwitz Professor of Finance, University of Chicago Booth School of Business; James H. Lorie Professor of Finance, University of Chicago Booth School of Business, July 2000 – July 2006; financial consultant since 2004. | | | | Columbia Acorn Trust | |
|
Steven N. Kaplan, 52,
Trustee and Vice Chair | | | 1999 | | | Neubauer Family Professor of Entrepreneurship and Finance, University of Chicago Booth School of Business; faculty member of the University of Chicago Booth School of Business since 1998. | | | 12 | | | Columbia Acorn Trust; Accretive Health, Inc. (healthcare management services provider); Morningstar, Inc. (provider of independent investment research). | |
|
24
Wanger USA 2011 Annual Report
Board of Trustees and Management of Wanger Advisors Trust
Name, Position(s) with
Wanger Advisors Trust
and Age at
December 31, 2011 | | Year First
Elected or
Appointed
to Office* | | Principal Occupation(s) during
Past Five Years | | Number of
Portfolios in
Fund Complex
Overseen by
Trustee/Officer | | Other
Directorships
in addition to
Wanger Advisors Trust | |
| Trustees who are not interested persons of Wanger Advisors Trust: (continued) | | | | | | | |
|
Allan B. Muchin, 75,
Trustee (1) | | | 1998 | | | Chairman Emeritus, Katten Muchin Rosenman LLP (law firm). | | | 12 | | | Columbia Acorn Trust | |
|
David J. Rudis, 58,
Trustee (2) | | | 2010 | | | National Checking and Debit Executive, and Illinois President, Bank of America, 2007 – 2009; President, Consumer Banking Group, LaSalle National Bank, 2004 – 2007. | | | 12 | | | Columbia Acorn Trust | |
|
David B. Small, 55,
Trustee | | | 2010 | | | Managing Director, Grosvenor Capital Management, L.P. (investment adviser) since 1994; Adjunct Associate Professor of Finance, University of Chicago Booth School of Business. | | | 12 | | | Columbia Acorn Trust | |
|
| Trustees who are interested persons of Wanger Advisors Trust: | | | | | | | |
|
Charles P. McQuaid, 58,
Trustee and President (3) | | | 1992 | | | President and Chief Investment Officer, CWAM or its predecessors, since October 2003; associated with CWAM or its predecessors as an investment professional since 1978. | | | 12 | | | Columbia Acorn Trust | |
|
| Trustee Emeritus | | | | | | | |
|
Ralph Wanger, 77,
Trustee Emeritus (4) | | | 1970 | | | Founder, CWAM. Formerly, President, Chief Investment Officer and portfolio manager, CWAM or its predecessors, July 1992 – September 2003; Director, Wanger Investment Company PLC; Consultant to CWAM or its predecessors, September 2003 – September 2005. | | | 12 | | | Columbia Acorn Trust | |
|
| Officers of Wanger Advisors Trust: | | | | | | | |
|
Ben Andrews, 45,
Vice President | | | 2004 | | | Portfolio manager and analyst, CWAM or its predecessors, since 1998; Vice President, Columbia Acorn Trust and Wanger Advisors Trust since 2004. | | | 12 | | | None | |
|
Robert A. Chalupnik, 45,
Vice President | | | 2011 | | | Portfolio manager and analyst, CWAM or its predecessors since 1998. Vice President Columbia Acorn Trust and Wanger Advisors Trust since May 2011. | | | 12 | | | None | |
|
Michael G. Clarke, 42,
Assistant Treasurer | | | 2004 | | | Vice President, Columbia Management Investment Advisers, LLC since May 2010; Managing Director of Fund Administration, Columbia Management Advisors, LLC, from September 2004 to April 2010; senior officer of Columbia Funds and affiliated funds since 2002. | | | 12 | | | None | |
|
Joseph F. DiMaria, 44,
Assistant Treasurer | | | 2010 | | | Vice President, Mutual Fund Administration, Columbia Management Investment Advisers, LLC, since May 2010; Director of Fund Administration, Columbia Management Advisors, LLC from January 2006 to April 2010; Head of Tax/Compliance and Assistant Treasurer, Columbia Management Advisors, LLC, from November 2004 to December 2005. | | | 12 | | | None | |
|
P. Zachary Egan, 43,
Vice President | | | 2003 | | | Director of International Research, CWAM or its predecessors since December 2004; Vice President, Columbia Acorn Trust since 2003 and Wanger Advisors Trust since 2007; portfolio manager and analyst, CWAM or its predecessors, since 1999. | | | 12 | | | None | |
|
Fritz Kaegi, 40,
Vice President | | | 2011 | | | Portfolio manager and analyst, CWAM or its predecessors since 2004. Vice President Columbia Acorn Trust and Wanger Advisors Trust since September 2011. | | | 12 | | | None | |
|
John Kunka, 41,
Assistant Treasurer | | | 2006 | | | Director of Accounting and Operations, CWAM since May 2006; Manager of Mutual Fund Operations, Calamos Advisors, Inc. (investment adviser), September 2005 – May 2006; prior thereto, Manager of Mutual Fund Administration, Van Kampen Investments. | | | 12 | | | None | |
|
25
Wanger USA 2011 Annual Report
Board of Trustees and Management of Wanger Advisors Trust
Name, Position(s) with
Wanger Advisors Trust
and Age at
December 31, 2011 | | Year First
Elected or
Appointed
to Office* | | Principal Occupation(s) during
Past Five Years | | Number of
Portfolios in
Fund Complex
Overseen by
Trustee/Officer | | Other
Directorships
in addition to
Wanger Advisors Trust | |
| Officers of Wanger Advisors Trust: (continued) | | | | | | | |
|
Stephen Kusmierczak, 44,
Vice President | | | 2011 | | | Portfolio manager and analyst, CWAM or its predecessors since 2001. Vice President Columbia Acorn Trust and Wanger Advisors Trust since September 2011. | | | 12 | | | None | |
|
Joseph C. LaPalm, 42,
Vice President | | | 2006 | | | Chief Compliance Officer, CWAM since 2005; prior thereto, compliance officer, William Blair & Company (investment firm). | | | 12 | | | None | |
|
Bruce H. Lauer, 54,
Vice President, Secretary and Treasurer | | | 1995 | | | Chief Operating Officer, CWAM or its predecessors since April 2000; Vice President, Secretary and Treasurer, Columbia Acorn Trust and Wanger Advisors Trust since 1995; Director, Wanger Investment Company PLC; formerly, Director, Banc of America Capital Management (Ireland) Ltd.; and formerly, Director, Bank of America Global Liquidity Funds, PLC. | | | 12 | | | None | |
|
Louis J. Mendes III, 47,
Vice President | | | 2003 | | | Portfolio manager and analyst, CWAM or its predecessors since 2001; Vice President, Columbia Acorn Trust since 2003 and Wanger Advisors Trust since 2005. | | | 12 | | | None | |
|
Robert A. Mohn, 50,
Vice President | | | 1997 | | | Director of Domestic Research, CWAM or its predecessors since March 2004; Vice President, Columbia Acorn Trust and Wanger Advisors Trust, since 1997; portfolio manager and analyst, CWAM or its predecessors since August 1992. | | | 12 | | | None | |
|
Christopher J. Olson, 47,
Vice President | | | 2001 | | | Portfolio manager and analyst, CWAM or its predecessors, since January 2001; Vice President, Columbia Acorn Trust and Wanger Advisors Trust since 2001. | | | 12 | | | None | |
|
Scott R. Plummer, 52,
Assistant Secretary | | | 2010 | | | Chief Legal Officer and Assistant Secretary, Columbia Management Investment Advisers, LLC (or its predecessors) since June 2005; Vice President and Lead Chief Counsel — Asset Management, Ameriprise Financial since May 2010 (previously Vice President and Chief Counsel — Asset Management, from 2005 to April 2010, and Vice President — Asset Management Compliance from 2004 to 2005); Vice President, Chief Counsel and Assistant Secretary, Columbia Management Investment Distributors, Inc. (or its predecessors) since 2008; Vice President, General Counsel and Secretary, Ameriprise Certificate Company since 2005; Chief Counsel, RiverSource Distributors, Inc. from 2006 to 2010; Vice President, General Counsel and Secretary, legacy RiverSource Funds, since December 2006; Senior Vice President, Secretary and Chief Legal Officer, Columbia Funds since May 2010. | | | 12 | | | None | |
|
Christopher O. Petersen, 42,
Assistant Secretary | | | 2010 | | | Vice President and Chief Counsel, Ameriprise Financial since January 2010 (formerly Vice President and Group Counsel or Counsel from April 2004 to January 2010); Assistant Secretary of legacy RiverSource Funds since January 2007. | | | 12 | | | None | |
|
Robert P. Scales, 59,
Chief Compliance Officer, Chief Legal Officer, Senior Vice President and General Counsel | | | 2004 | | | Chief Compliance Officer, Chief Legal Officer, Senior Vice President and General Counsel, Columbia Acorn Trust and Wanger Advisors Trust, since 2004. | | | 12 | | | None | |
|
Andreas Waldburg-Wolfegg, 45,
Vice President | | | 2011 | | | Portfolio Manager and analyst of CWAM since 2002. Vice President Columbia Acorn Trust and Wanger Advisors Trust since September 2011. | | | 12 | | | None | |
|
26
Wanger USA 2011 Annual Report
Board of Trustees and Management of Wanger Advisors Trust
Name, Position(s) with
Wanger Advisors Trust
and Age at
December 31, 2011 | | Year First
Elected or
Appointed
to Office* | | Principal Occupation(s) during
Past Five Years | | Number of
Portfolios in
Fund Complex
Overseen by
Trustee/Officer | | Other
Directorships
in addition to
Wanger Advisors Trust | |
| Officers of Wanger Advisors Trust: (continued) | | | | | | | |
|
Linda Roth-Wiszowaty, 42,
Assistant Secretary | | | 2006 | | | Business support analyst, CWAM, since April 2007; prior thereto executive administrator, CWAM or its predecessors, and executive assistant to the Chief Operating Officer of CWAM or its predecessors. | | | 12 | | | None | |
|
* Dates prior to April 1992 correspond to the date of first election or appointment as a trustee or officers of The Acorn Fund, Inc., the predecessor trust to Columbia Acorn Trust.
(1) Mr. Muchin retired at the end of calendar year 2011.
(2) Prior to December 31, 2011, Mr. Rudis was considered an "interested person" of Wanger Advisors Trust, as defined in the New York Attorney General's Assurance of Discontinuance ("Order") entered into in February 2005 by Columbia Management Advisors, LLC (an indirect subsidiary of Bank of America Corporate ("BOA")) and Columbia Management Distributors, Inc. (an indirect subsidiary of BOA), because of his former employment as a BOA executive. The Order expired with respect to Wanger Advisors Trust on December 31, 2011.
(3) Mr. McQuaid is an "interested person" of Wanger Advisors Trust and of CWAM, as defined in the Investment Company Act of 1940 because he is an officer of the Trust and of CWAM.
(4) As permitted under the Wanger Advisors Trust's By-Laws, Mr. Wanger serves as a non-voting Trustee Emeritus of the Trust.
27
Wanger USA 2011 Annual Report

Columbia Wanger Funds
Transfer Agent,
Dividend Disbursing Agent
Columbia Management Investment
Services Corp.
P.O. Box 8081
Boston, Massachusetts
02266-8081
Distributor
Columbia Management Investment
Distributors, Inc.
One Financial Center
Boston, Massachusetts
02111-2621
Investment Adviser
Columbia Wanger Asset Management, LLC
227 West Monroe Street, Suite 3000
Chicago, Illinois 60606
1-888-4-WANGER
(1-888-492-6437)
Legal Counsel to the Funds
Perkins Coie, LLP
Washington, DC
Legal Counsel to the Independent Trustees
Drinker Biddle & Reath LLP
Philadelphia, Pennsylvania
Independent Registered Public
Accounting Firm
PricewaterhouseCoopers LLP
Chicago, Illinois
This document contains Global Industry Classification Standard data. The Global Industry Classification Standard ("GICS") was developed by and is the exclusive property and a service mark of MSCI Inc. ("MSCI") and Standard & Poor's Financial Services LLC ("S&P") and is licensed for use by Columbia Wanger Asset Management, LLC ("CWAM"). Neither MSCI, S&P, nor any other party involved in making or compiling the GICS or any GICS classifications makes any express or implied warranties or representations with respect to such standard or classification (or the results to be obtained by the use thereof), and all such parties hereby expressly disclaim all warranties of originality, accuracy, completeness, merchantability and fitness for a particular purpose with respect to any of such standard or classification. Without limiting any of the foregoing, in no event shall MSCI, S&P, any of their affiliates or any third party involved in making or compiling the GICS or any GICS classifications have any liability for any direct, indirect, special, punitive, consequential or any other damages (including lost profits) even if notified of the possibility of such damages.
This report, including the schedules of investments and financial statements, is submitted for the general information of the shareholders of the Wanger Advisors Trust.
A description of the Fund's proxy voting policies and procedures and a copy of the Fund's voting record for the most recent 12-month period ended June 30 are available (i) on the Securities and Exchange Commission's website at www.sec.gov, and (ii) without charge, upon request, by calling 888-492-6437.
The Fund files a complete schedule of portfolio holdings with the SEC for the first and third quarters of each fiscal year on Form N-Q. The Fund's Form N-Q is available on the SEC's website at www.sec.gov and may be reviewed and copied at the SEC's Public Reference Room in Washington, D.C. Information on the operation of the Pubic Reference Room may be obtained by calling 800-SEC-0330. The Fund's complete portfolio holdings are disclosed at www.columbiafunds.com approximately 30 days after each month-end.
28
Columbia Wanger Funds
© 2012 Columbia Management Investments Advisers, LLC. All rights reserved.
C-1456 C (2/12) 132421
Item 2. Code of Ethics.
(a) The registrant has adopted a code of ethics that applies to the registrant’s principal executive officer, principal financial officer, principal accounting officer or controller, or persons performing similar functions, regardless of whether these individuals are employed by the registrant or a third party.
(b) During the period covered by this report, there were not any amendments to a provision of the code of ethics adopted in 2(a) above.
(c) During the period covered by this report, there were no waivers, including any implicit waivers, from a provision of the code of ethics described in 2(a) above that relates to one or more of the items set forth in paragraph (b) of this item’s instructions.
Item 3. Audit Committee Financial Expert.
The registrant’s Board of Trustees has determined that Michelle L. Collins, Maureen M. Culhane and John C. Heaton, each of whom are members of the registrant’s Board of Trustees and Audit Committee, each qualify as an audit committee financial expert. Ms. Collins, Ms. Culhane and Mr. Heaton are each independent trustees, as defined in paragraph (a)(2) of this item’s instructions.
Item 4. Principal Accountant Fees and Services.
(a) Audit Fees. Aggregate Audit Fees billed by the principal accountant for professional services rendered during the fiscal years ended December 31, 2011 and December 31, 2010 are approximately as follows:
2011 | | 2010 | |
$ | 96,700 | | $ | 93,300 | |
| | | | | |
Audit Fees include amounts related to the audit of the registrant’s annual financial statements or services that are normally provided by the accountant in connection with statutory and regulatory filings or engagements for those fiscal years.
(b) Audit-Related Fees. Aggregate Audit-Related Fees billed to the registrant by the principal accountant for professional services rendered during the fiscal years ended December 31, 2011 and December 31, 2010 are approximately as follows:
Audit-Related Fees include amounts for assurance and related services by the principal accountant that are reasonably related to the performance of the audit of the registrant’s financial statements and are not reported in Audit Fees above. In both fiscal years 2011 and 2010, Audit-Related Fees consist of agreed-upon procedures performed for other audit-related additional testing. Fiscal year 2011, also includes agreed-upon procedures for fund accounting and custody conversions.
During the fiscal years ended December 31, 2011 and December 31, 2010, there were no Audit-Related Fees billed by the registrant’s principal accountant to the registrant’s investment adviser (not including any sub-adviser whose role is primarily portfolio management and is subcontracted with or overseen by another investment adviser) and any entity controlling, controlled by, or under common control with the adviser that provides ongoing services to the registrant for an engagement that related directly to the operations and financial reporting of the registrant.
(c) Tax Fees. Aggregate Tax Fees billed by the principal accountant to the registrant for professional services rendered during the fiscal years ended December 31, 2011 and December 31, 2010 are approximately as follows:
2011 | | 2010 | |
$ | 25,000 | | $ | 26,200 | |
| | | | | |
Tax Fees incurred in both fiscal years 2011 and 2010 relate to the review of annual tax returns, the review of required shareholder distribution calculations and include amounts for professional services by the principal accountant for tax compliance, tax advice and tax planning.
During the fiscal years ended December 31, 2011 and December 31, 2010, there were no Tax Fees billed by the registrant’s principal accountant to the registrant’s investment adviser (not including any sub-adviser whose role is primarily portfolio management and is subcontracted with or overseen by another investment adviser) and any entity controlling, controlled by, or under common control with the adviser that provides ongoing services to the registrant for an engagement that related directly to the operations and financial reporting of the registrant.
(d) All Other Fees. Aggregate All Other Fees billed by the principal accountant to the registrant for professional services rendered during the fiscal years ended December 31, 2011 and December 31, 2010 are as follows:
All Other Fees include amounts for products and services provided by the principal accountant, other than the services reported in paragraphs (a) through (c) above.
Aggregate All Other Fees billed by the registrant’s principal accountant to the registrant’s investment adviser (not including any sub-adviser whose role is primarily portfolio management and is subcontracted with or overseen by another investment adviser) and any entity controlling, controlled by, or under common control with the adviser that provides ongoing services to the registrant for an engagement that related directly to the operations and financial reporting of the registrant during the fiscal years ended December 31, 2011 and December 31, 2010 are approximately as follows:
2011 | | 2010 | |
$ | 65,000 | | $ | 135,000 | |
| | | | | |
In both fiscal years 2011 and 2010, All Other Fees consist of professional services rendered for internal control reviews of the registrant’s transfer agent.
(e)(1) Audit Committee Pre-Approval Policies and Procedures
The policy of the registrant’s Audit Committee is to specifically pre-approve (i) all audit and non-audit (including audit related, tax and all other) services provided by the registrant’s independent auditor to the registrant and individual funds (collectively “Fund Services”) and (ii) all non-audit services provided by the registrant’s independent auditor to the funds’ adviser or a control affiliate of the adviser, that relate directly to the funds’ operations and financial reporting (collectively “Fund-related Adviser Services”). A “control affiliate” is an entity controlling, controlled by, or under common control with the adviser that provides ongoing services to the funds, and the term “adviser” is deemed to exclude any unaffiliated sub-adviser whose role is primarily portfolio management and is sub-contracted or overseen by another investment adviser.
If such Fund Services or Fund-related Adviser Services are required during the period between the Audit Committee’s regularly scheduled meetings, the Chairman of the Audit Committee has the authority to pre-approve the service, with reporting to the full Audit Committee at the next regularly scheduled meeting.
The Audit Committee will waive pre-approval of Fund Services or Fund-related Adviser Services provided that the requirements under paragraph (c)(7)(i)(C) of Rule 2-01 of Regulation S-X are met.
(e)(2) The percentage of services described in paragraphs (b) through (d) of this Item approved pursuant to the “de minimis” exception under paragraph (c)(7)(i)(C) of Rule 2-01 of Regulation S-X during both fiscal years ended December 31, 2011 and December 31, 2010 was zero.
(f) Not applicable.
(g) The aggregate non-audit fees billed by the registrant’s accountant for services rendered to the registrant, and rendered to the registrant’s investment adviser (not including any sub-adviser whose role is primarily portfolio management and is subcontracted with or overseen by another investment adviser), and any entity controlling, controlled by, or under common control with the adviser that provides ongoing services to the registrant for the fiscal years ended December 31, 2011 and December 31, 2010 are approximately as follows:
2011 | | 2010 | |
$ | 129,900 | | $ | 168,400 | |
| | | | | |
(h) The registrant’s Audit Committee of the Board of Directors has considered whether the provision of non-audit services that were rendered to the registrant’s adviser (not including any sub-adviser whose role is primarily portfolio management and is subcontracted with or overseen by another investment adviser), and any entity controlling, controlled by, or under common control with the investment adviser that provides ongoing services to the registrant that were not pre-approved pursuant to paragraph (c)(7)(ii) of Rule 2-01 of Regulation S-X, is compatible with maintaining the principal accountant’s independence.
Item 5. Audit Committee of Listed Registrants.
Not applicable.
Item 6. Investments
(a) The registrant’s “Schedule I — Investments in securities of unaffiliated issuers” (as set forth in 17 CFR 210.12-12) is included in Item 1 of this Form N-CSR.
(b) Not applicable
Item 7. Disclosure of Proxy Voting Policies and Procedures for Closed-End Management Investment Companies.
Not applicable.
Item 8. Portfolio Managers of Closed-End Management Investment Companies.
Not applicable.
Item 9. Purchases of Equity Securities by Closed-End Management Investment Company and Affiliated Purchasers.
Not applicable.
Item 10. Submission of Matters to a Vote of Security Holders.
There were no material changes to the procedures by which shareholders may recommend nominees to the registrant’s board of directors.
Item 11. Controls and Procedures.
(a) The registrant’s principal executive officer and principal financial officers, based on their evaluation of the registrant’s disclosure controls and procedures as of a date within 90 days of the filing of this report, have concluded that such controls and procedures are adequately designed to ensure that material information required to be disclosed by the registrant in Form N-CSR is accumulated and communicated to the registrant’s management, including the principal executive officer and principal financial officer, or persons performing similar functions, as appropriate to allow timely decisions regarding required disclosure.
(b) There was no change in the registrant’s internal control over financial reporting that occurred during the registrant’s second fiscal quarter of the period covered by this report that has materially affected, or is reasonably likely to materially affect, the registrant’s internal control over financial reporting.
Item 12. Exhibits.
(a)(1) Code of ethics required to be disclosed under Item 2 of Form N-CSR attached hereto as Exhibit 99.CODE ETH.
(a)(2) Certifications pursuant to Rule 30a-2(a) under the Investment Company Act of 1940 (17 CFR 270.30a-2(a)) attached hereto as Exhibit 99.CERT.
(a)(3) Not applicable.
(b) Certification pursuant to Rule 30a-2(b) under the Investment Company Act of 1940 (17 CFR 270.30a-2(b)) attached hereto as Exhibit 99.906CERT.
SIGNATURES
Pursuant to the requirements of the Securities Exchange Act of 1934 and the Investment Company Act of 1940, the registrant has duly caused this report to be signed on its behalf by the undersigned, thereunto duly authorized.
(registrant) | | Wanger Advisors Trust | |
| | |
| | |
By (Signature and Title) | /s/ Charles P. McQuaid | |
| Charles P. McQuaid, President | |
| | |
| | |
Date | | February 21, 2012 | |
| | | | |
Pursuant to the requirements of the Securities Exchange Act of 1934 and the Investment Company Act of 1940, this report has been signed below by the following persons on behalf of the registrant and in the capacities and on the dates indicated.
By (Signature and Title) | /s/ Charles P. McQuaid | |
| Charles P. McQuaid, President | |
| | |
| | |
Date | | February 21, 2012 | |
| | |
| | |
By (Signature and Title) | /s/ Bruce H. Lauer | |
| Bruce H. Lauer, Treasurer | |
| | |
| | |
Date | | February 21, 2012 | |