UNITED STATES
SECURITIES AND EXCHANGE COMMISSION
Washington, D.C. 20549
FORM N-CSR
CERTIFIED SHAREHOLDER REPORT OF REGISTERED
MANAGEMENT INVESTMENT COMPANIES
Investment Company Act file number | 811-8748 |
|
Wanger Advisors Trust |
(Exact name of registrant as specified in charter) |
|
One Financial Center, Boston, Massachusetts | | 02111 |
(Address of principal executive offices) | | (Zip code) |
|
James R. Bordewick, Jr., Esq.
Columbia Management Advisors, LLC
One Financial Center
Boston, MA 02111 |
(Name and address of agent for service) |
|
Registrant’s telephone number, including area code: | 1-617-426-3750 | |
|
Date of fiscal year end: | December 31, 2007 | |
|
Date of reporting period: | December 31, 2007 | |
| | | | | | | | |
Form N-CSR is to be used by management investment companies to file reports with the Commission not later than 10 days after the transmission to stockholders of any report that is required to be transmitted to stockholders under Rule 30e-1 under the Investment Company Act of 1940 (17 CFR 270.30e-1). The Commission may use the information provided on Form N-CSR in its regulatory, disclosure review, inspection, and policymaking roles.
A registrant is required to disclose the information specified by Form N-CSR, and the Commission will make this information public. A registrant is not required to respond to the collection of information contained in Form N-CSR unless the Form displays a currently valid Office of Management and Budget ("OMB") control number. Please direct comments concerning the accuracy of the information collection burden estimate and any suggestions for reducing the burden to Secretary, Securities and Exchange Commission, 450 Fifth Street, NW, Washington, DC 20549-0609. The OMB has reviewed this collection of information under the clearance requirements of 44 U.S.C. § 3507.
Item 1. Reports to Stockholders.
Wanger International Select
2007 Annual Report

| NOT FDIC INSURED | | May Lose Value | |
|
| NOT BANK ISSUED | | No Bank Guarantee | |
|

Wanger International Select
2007 Annual Report
| | | Table of Contents | |
| | 1 | | | Understanding Your Expenses | |
|
| | 2 | | | Ponzi Schemes and Politicians' Dreams | |
|
| | 4 | | | Performance Review | |
|
| | 6 | | | Statement of Investments | |
|
| | 10 | | | Statement of Assets and Liabilities | |
|
| | 10 | | | Statement of Operations | |
|
| | 11 | | | Statement of Changes in Net Assets | |
|
| | 12 | | | Financial Highlights | |
|
| | 13 | | | Notes to Financial Statements | |
|
| | 16 | | | Report of Independent Registered Public Accounting Firm | |
|
| | 17 | | | Federal Income Tax Information | |
|
| | 18 | | | Management Fee Evaluation of the Senior Officer | |
|
| | 22 | | | Board Approval of the Advisory Agreement | |
|
| | 24 | | | Board of Trustees & Management of Wanger Advisors Trust | |
|
Columbia Wanger Asset Management, L.P. ("CWAM") is one of the leading global small- and mid-cap equity managers in the United States with more than 37 years of small- and mid-cap investment experience. As of December 31, 2007, CWAM manages $36.8 billion in assets and is the investment adviser to Wanger U.S. Smaller Companies, Wanger International Small Cap, Wanger Select, Wanger International Select (together, the "Wanger Advisors Trust Funds") and the Columbia Acorn Family of Funds. Columbia Management Group, LLC ("Columbia Management") is the investment management division of Bank of America Corporation. Columbia Management entities furnish investment management services and products for institutional and individual investors. The Wanger Advisor Trust Funds and the Columbia Acor n Family of Funds (together with other funds advised by Columbia Management Affiliates, the "Columbia Funds") are distributed by Columbia Management Distributors, Inc., member of FINRA, SIPC, part of Columbia Management and an affiliate of Bank of America Corporation. CWAM is an SEC-registered investment adviser and indirect, wholly owned subsidiary of Bank of America Corporation. CWAM is part of Columbia Management.
Please consider the investment objectives, risks, charges and expenses for the Fund carefully before investing. Contact 1-888-4-WANGER for a prospectus, which contains this and other important information about the Fund. You should read it carefully before you invest.
The views expressed in "Ponzi Schemes and Politicians' Dreams" and in the Performance Review reflect the current views of the respective parties. These views are not guarantees of future performance and involve certain risks, uncertainties and assumptions that are difficult to predict so actual outcomes and results may differ significantly from the views expressed. These views are subject to change at any time based upon economic, market or other conditions and the respective parties disclaim any responsibility to update such views. These views may not be relied on as investment advice and, because investment decisions for a Columbia Fund are based on numerous factors, may not be relied on as an indication of trading intent on behalf of any particular Columbia Fund. References to specific company securities should not be construed as a recommendation or investment advice.
Wanger International Select 2007 Annual Report
Understanding Your Expenses
As a Fund shareholder, you incur two types of costs. There are transaction costs, which generally include sales charges on purchases and may include redemption or exchange fees. There are also ongoing costs, which generally include investment advisory fees and other Fund expenses. The information on this page is intended to help you understand your ongoing costs of investing in the Fund and to compare these costs with the ongoing costs of investing in other mutual funds.
Analyzing your Fund's expenses
To illustrate these ongoing costs, we have provided an example and calculated the expenses paid by investors in the Fund during the period. The information in the following table is based on an initial, hypothetical investment of $1,000, which is invested at the beginning of the period and held for the entire period. Expense information is calculated two ways and each method provides you with different information. The amount listed in the "Actual" column is calculated using actual operating expenses and total return for the Fund. The amount listed in the "Hypothetical" column assumes that the return each year is 5% before expenses and then applies the Fund's actual expense ratio for the period to the hypothetical return. You should not use the hypothetical account values and expenses to estimate either your actual account balance at the end of the period or the expenses you paid during the period. See the "Compare with other fu nds" information for details on using the hypothetical data.
Estimating your actual expenses
To estimate the expenses that you actually paid over the period, first you will need your account balance at the end of the period.
1. Divide your ending account balance by $1,000. For example, if an account balance was $8,600 at the end of the period, the result would be 8.6.
2. In the section of the table below titled "Expenses paid during the period," you will find a dollar amount in the column labeled "Actual." Multiply this amount by the result from step 1. Your answer is an estimate of the expenses you paid on your account during the period.
July 1, 2007 – December 31, 2007
| | | Account value at the
beginning of the period ($) | | Account value at the
end of the period ($) | | Expenses paid during
period ($) | | Fund's annualized
expense ratio (%)* | |
| | | Actual | | Hypothetical | | Actual | | Hypothetical | | Actual | | Hypothetical | | Actual | |
| Wanger International Select | | | 1,000.00 | | | | 1,000.00 | | | | 1,085.90 | | | | 1,019.26 | | | | 6.20 | | | | 6.01 | | | | 1.18 | | |
*For the six months ended December 31, 2007.
Expenses paid during the period are equal to the Fund's annualized expense ratio, multiplied by the average account value over the period, then multiplied by the number of days in the Fund's most recent fiscal half-year and divided by 365.
It is important to note that the expense amounts shown in the table are meant to highlight only ongoing costs of investing in the Fund. Expenses paid during the period do not include any insurance charges imposed by your insurance company's separate account. The hypothetical example provided is useful in comparing ongoing costs only and will not help you determine the relative total costs of owning different funds whose shareholders may incur transaction costs.
Compare with other funds
Since all mutual funds are required to include the same hypothetical calculations about expenses in shareholder reports, you can use this information to compare the ongoing cost of investing in the Fund with other funds. To do so, compare the 5% hypothetical example with the 5% hypothetical examples of other funds. As you compare hypothetical examples of other funds, it is important to note that hypothetical examples are meant to highlight the ongoing cost of investing in a fund and do not reflect any transaction costs, such as sales charges, redemption fees or exchange fees that may be incurred by shareholders of other funds. Expenses paid during the period do not include any insurance charges imposed by your insurance company's separate accounts.
1
Wanger International Select 2007 Annual Report

Ponzi Schemes and Politicians' Dreams
Each December I attend The University of Chicago Business Forecast luncheon. Typically the event features economic forecasts by two economists, plus a summary of world political and economic issues provided by Professor Marvin Zonis.1 At this year's luncheon Professor Zonis stated that the U.S. Government had $50 trillion of unfunded liabilities. That's a staggering figure! Could it really be correct?
"Trust Me" Trust Funds
I've found that there is no precise U.S. Government unfunded liability number, though there are estimates. The U.S. Government Accountability Office (GAO) notes material weaknesses in federal government accounting in general, but has expressed an unqualified opinion on its 2007 Statement of Social Insurance. Any calculation of unfunded liabilities requires numerous actuarial assumptions plus a time horizon. The calculations by various government agencies cover liabilities for 75 years into the future.
However, it does appear that Professor Zonis' $50 trillion estimate was wrong. That number is now too low. On December 17, 2007, the GAO estimated that the U.S. Government's total reported liabilities, net social insurance commitments, and other fiscal exposures were approximately $53 trillion.2 With apologies to the late Senator Everett Dirksen (Republican: Illinois), it seems that a trillion here and a trillion there adds up.3
Despite well-publicized concerns about Social Security, Medicare is in worse shape. Created in the 1930s, Social Security seems to have been a warm-up for bigger unfunded liabilities later on. Social Security is better funded, as Social Security tax rates are higher than Medicare tax rates. Medicare was signed into law in 1965 and spending for the program quickly ran out of control. The original cost estimate for Medicare hospital insurance in 1990, for example, was $9 billion; the actual cost that year hit $67 billion!4 According to the GAO, Medicare alone has over $36 trillion of unfunded liabilities.
But what of the Social Security and Medicare Trust Funds, the Funds that politicians promised to put in a "lock box?" It turns out the politicians spent the money elsewhere and the Trust Funds loaned their money to the U.S. Treasury by buying government bonds. The Trust Funds have no true third-party assets, but simply have promises from the U.S. Treasury to pay in the future. In order for the payments to be made the Treasury will have to raise taxes, cut other spending, borrow or print money.
What was the latest change that politicians made concerning unfunded liabilities? They increased them, by adding prescription drugs to Medicare's benefits. This addition is noteworthy for three reasons. First, little new funding was created; enrollee premiums cover only about 25% of costs. Second, the program's costs and benefits are highly skewed. Baby boomers will have a net benefit of about $20,000 each while younger workers and future generations will have net costs of between $2,500 and $4,200 each.5 Third, when the new benefits were fully implemented in 2006, they drove a 19% increase in Medicare costs, the largest increase in decades. Over $10 trillion of Medicare's unfunded liability is from the drug program.
What are this year's presidential candidates saying about the unfunded liability problem? Virtually nothing and, even though taxpayers cannot afford Social Security, Medicare and other existing programs, some candidates are touting new proposals that substantially broaden federal health care spending. These plans include additional entitlements and mandatory, subsidized, health insurance participation. Cost estimates are dubious but range from $50 to $120 billion yearly.
Given the huge existing liabilities and proposals for additional benefits it appears that the U.S. Government is operating an enormous Ponzi Scheme.6 Initial participants benefit but most taxpayers are likely to lose.
Large Liabilities and Possible Solutions
$53 trillion is a huge number, nearly four times all the goods and services produced in the United States in 2007. Currently Social Security is running a yearly surplus while Medicare is running a deficit. But the aging of baby boomers is driving yearly Medicare and Social Security spending higher, so the programs' cash needs will become very large in the next decade. Medicare deficits are projected to consume 25% of all federal income taxes by 2020. By 2050, Social Security, Medicare, and Medicaid will grow from 9% to 18% of GDP. This contrasts to total federal spending averaging about 20% of GDP over the last 50 years.7
Some of the richest people in America say their taxes are too low. What if they were taxed at 100%? Not 100% of income but 100% of their net worth! This "Che Guevara lite" (confiscation without murder) solution, if applied to the 2007 Forbes list of the richest 400 Americans, would yield a one-time receipt of $1.54 trillion. That would cover 2.9% of the problem, but is of course not a real solution as it would destroy capitalism.
How about raising tax rates on all of us? The Laffer Curve8 exists—there is an income tax rate that will yield the highest dollar amount of taxes, and that rate appears to be well under 100%. Even famed British economist John Maynard Keynes said that reducing too-high tax rates results in higher tax revenues. Very high tax rates choke economic activity and spur
2
Wanger International Select 2007 Annual Report
taxpayers to take legal and illegal measures to reduce payments.
Since federal income taxes began in 1913, there have been three rounds of major income tax rate cuts in the United States, and each resulted in faster economic growth and, ultimately, higher taxes collected. Paradoxically, though the rate cuts provided those with higher incomes the largest benefits, higher income people ended up paying greater percentages of total tax collections. A number of countries, including former Soviet republics, have adopted low, flat income tax rates and have seen economic growth surge and tax receipts increase.
No one knows what income tax rates create the highest tax revenues over the long run. In the last 50 years, the highest marginal tax rates in the United States have varied from a pre-Kennedy rate cut peak of 91% to a post-Reagan rate cut trough of 28%. Surprisingly, total federal government revenues as a percentage of GDP during that period have varied modestly, from 16.1% to 20.9%. Fiscal 2007 revenues were a bit above the midpoint, at 18.8% of GDP.9
While somewhat higher tax rates would probably increase near-term tax revenues, it is unlikely that substantially higher income tax rates alone can boost government receipts to the 30% or so of GDP eventually needed to fully fund the promised benefits. Massive value added taxes or sales taxes would likely be needed to provide tax revenue percentages that high. But huge tax hikes of any sort are likely to hurt economic growth, and additional solutions are needed.
As substantial liabilities become due in the next decade, there is an increased likelihood that voters will elect more courageous politicians that will strive to control spending and enact needed reforms. Perhaps the best single reform would be to restore more free market elements to our health care system. There needs to be more price transparency plus incentives for individuals and health care providers to control spending. Streamlined drug approval processes and additional tort reform would also help.
Incentives for innovation, rather than arbitrary price controls, are crucial. Improved technology has enabled over a 99.99% reduction in the cost of genome mapping in the last seven years. As costs continue to drop and advances continue to be made in biotechnology and pharmaceuticals, new ways to diagnose, treat and cure diseases are likely. Treatments customized to genetic factors promise to be much more effective and result in fewer side effects than many current drugs. The Wanger Funds have begun to own stocks in companies that are pursuing genetic tests, novel drugs and devices, plus information technology for better managing health care administration.
Outside the health care sector, Professor Jeremy Siegel has suggested that a solution for America's savings and retirement crisis will be sales of American assets to foreigners, especially those from countries with higher savings rates and younger populations. Innovative small- and mid-cap companies appear particularly attractive to foreigners, especially now that the dollar has weakened.


Charles P. McQuaid
President and Chief Investment Officer
Columbia Wanger Asset Management, L.P.
Opinions expressed in this essay are those of the author and are not necessarily those of Columbia Wanger Asset Management, its parent organizations or the Board.
1 Marvin Zonis is a professor emeritus at the Graduate School of Business at The University of Chicago, where he teaches courses on International Political Economy, Leadership and Business Strategy in the Era of E-Commerce.
2 Estimates by the Congressional Budget Office, Medicare trustees, and some private sources are higher.
3 Dirksen has been quoted as saying, "A billion here and a billion there, and pretty soon you're talking real money," but the Dirksen Congressional Center has been unable to verify the statement.
4 Source: American Enterprise Institute for Public Policy Research website, www.aei.org, "Medicare Prescription Drugs: Medical Necessity Meets Fiscal Insanity," by Joseph Antos and Jagadeesh Gokhale. Posted February 17, 2005.
5 Ibid.
6 In the 1920's, Charles Ponzi enticed investors with a bogus investment opportunity that promised a 40% return on their investment in just 90 days. Early investors were paid with dollars from later investors but most lost their money. Ponzi served four years in prison for this fraud, and then proceeded to promote other dubious ventures. He died in a charity ward of a Rio de Janeiro hospital in 1949.
7 Included in testimony on the future of Social Security presented by the Concord Coalition (www.concordcoalition.org) to a Senate special committee on aging, February 3, 2005.
8 The Laffer Curve is used to illustrate the concept of taxable income elasticity, the idea that government can maximize tax revenue by setting tax rates at an optimum point and that neither a 0% tax rate nor a 100% tax rate will generate government revenue. The curve was popularized by U.S. economics professor Arthur Laffer (b. 1940).
9 Congressional Budget Office testimony, "The Long-term Budget Outlook," December 13, 2007.
3
Wanger International Select 2007 Annual Report

Performance Review Wanger International Select

Christopher J. Olson
Portfolio Manager
Performance data quoted represents past performance and current performance may be lower or higher. Past performance is no guarantee of future results. The investment return and principal value of an investment in the Fund will fluctuate so that shares, when redeemed, may be worth more or less than the original cost. For daily and most recent month-end performance updates, please call 1-888-4-WANGER.
Wanger International Select ended the year up 21.78%. This return more than doubled the Fund's benchmark index, the S&P/Citigroup World ex-US Cap Range $2-10B Index, which posted a 9.84% annual gain. The Fund's strong outperformance can be largely attributed to its lack of exposure to financial stocks during a volatile period for the sector. Early in the year, we became concerned about the fundamentals of the banks and their operating environment. Higher interest rates, funding concerns, all-time low bad debt levels and overvalued housing markets in a number of countries around the world painted a worsening picture of the financial companies that we owned. Due to our concerns, we sold completely out of all of the Fund's bank holdings.
Big winners in the year included Japan's Nintendo. The stock gained 147% from our initial purchase price early in the year. The company is enjoying very strong demand for its Wii gaming console and associated video games. Potash Corp. of Saskatchewan was another big winner, gaining 201%. The company is the world's largest producer of potash and is benefiting from the positive impact that higher agricultural prices are having on fertilizer prices. Contract drilling companies Atwood Oceanics and Diamond Offshore also posted nice gains in the year on strong demand for their services. Atwood was up over 104% while Diamond Offshore gained 43%. Exchange operators Hong Kong Exchanges and Clearing, up more than 160%, and Singapore Exchange, up 152%, rose as investor dollars from overseas, as well as growing local investment, pushed trading to record levels for these exchanges.
On the downside, new position Uranium One was off more than 29% for the annual period due to a setback in the startup of one of its uranium mines in Kazakhstan. Japanese real estate investment manager Kenedix had the largest 12-month dollar loss, also falling 30% due to rising interest rates in Japan and concerns that real estate will suffer. Irish beverage company C&C Group fell 19% in the Fund before we sold it. Company earnings and sales declined due to increased competition and poor summer weather.
Global equity markets are entering an interesting and potentially volatile period as the United States works through its significant financial problems and enters what appears to be a much slower period of economic growth. We believe that this will impact economies and companies around the world. While this may mean additional risks for investors, we believe it may also give us additional opportunities to pick up some very good companies at compelling prices.
International investments involve greater potential risks, including less or different regulation, currency fluctuations, economic instability and political developments. Investments in small- and mid-cap companies may be subject to greater volatility and price fluctuations because they may be thinly traded and less liquid. Investing in emerging markets may involve greater risks than investing in more developed countries.
Fund's Positions in Mentioned Holdings
As a % of net assets, as of 12/31/07
| Nintendo | | | 3.7 | % | |
| Potash Corp. of Saskatchewan | | | 3.2 | | |
| Diamond Offshore | | | 3.2 | | |
| Hong Kong Exchanges and Clearing | | | 2.2 | | |
| Atwood Oceanics | | | 1.5 | | |
| Singapore Exchange | | | 1.4 | | |
| Uranium One | | | 1.3 | | |
| Kenedix | | | 1.1 | | |
| C&C Group | | | 0.0 | | |
Portfolio holdings are subject to change periodically and may not be representative of current characteristics and holdings.
4
Wanger International Select 2007 Annual Report
Growth of a $10,000 Investment in Wanger International Select
Total return for each period,
February 1, 1999 (inception date) through December 31, 2007
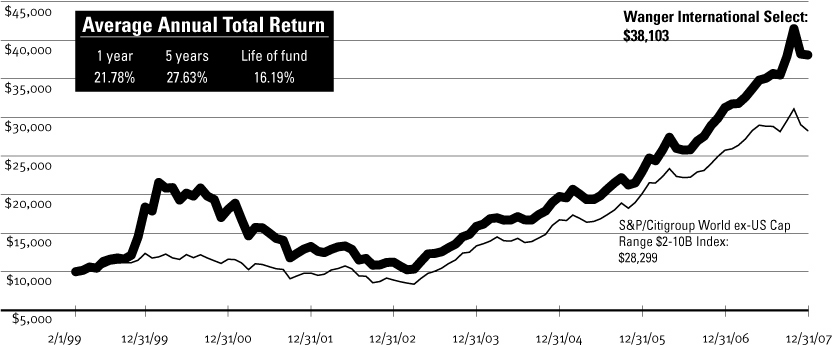
This graph compares the results of $10,000 invested in Wanger International Select on February 1, 1999 (the date the Fund began operations) through December 31, 2007, to the S&P/Citigroup World ex-US Cap Range $2-10B Index, with dividends and capital gains reinvested. Performance results reflect any fee waivers or reimbursements of Fund expenses by CWAM or any of its affiliates. Absent these fee waivers or reimbursement arrangements, performance results would have been lower. Performance shown here is past performance, which cannot guarantee future results. Current performance may be higher or lower. The investment return and principal value of an investment in the Fund will fluctuate so that Fund shares, when redeemed, may be worth more or less than their original cost. Performance changes over time. Current returns for the Fund may be different than that shown. For daily and most recent month-end performance updates, pl ease contact us at 1-888-4-WANGER.
Results to December 31, 2007
| | | 4th quarter | | 1 year | |
| Wanger International Select | | | 0.54 | % | | | 21.78 | % | |
S&P/Citigroup World ex-US
Cap Range $2-10B Index | | | -4.33 | | | | 9.84 | | |
| MSCI EAFE Index | | | -1.75 | | | | 11.17 | | |
NAV as of 12/31/07: $28.07
Performance numbers reflect all Fund expenses but do not include any insurance charge imposed by your insurance company's separate accounts. If performance included the effect of these additional charges, it would be lower.
The Fund's annual operating expense ratio is 1.19%. The annual operating expense ratio is as stated in the Fund's prospectus that is current as of the date of this report. Differences in expense ratios disclosed elsewhere in this report may result from including fee waivers and reimbursements as well as different time periods used in calculating the ratios.
All results shown assume reinvestment of distributions and do not reflect taxes that a shareholder would pay on Fund distributions or the sale of Fund shares.
The S&P/Citigroup World ex-U.S. Cap Range $2-10B Index is a subset of the broad market selected by the index sponsor representing the mid-cap developed market excluding the United States. The Morgan Stanley Capital International Europe, Australia, Far East (MSCI EAFE) Index is a capitalization-weighted index that tracks the total return of common stocks in 21 developed-market countries within Europe, Australia and the Far East. Indexes are not managed and do not incur fees or expenses. It is not possible to invest directly in an index.
Portfolio characteristics and holdings are subject to change periodically and may not be representative of current characteristics and holdings.
Top 5 Countries
As a % of net assets, as of 12/31/07
| Japan | | | 13.7 | % | |
| Netherlands | | | 10.3 | | |
| Switzerland | | | 7.5 | | |
| China | | | 7.1 | | |
| United Kingdom | | | 6.5 | | |
Top 10 Holdings
As a % of net assets, as of 12/31/07
1. Fugro (Netherlands)
Oilfield Services | | | 4.8 | % | |
2. Nintendo (Japan)
Entertainment Software & Hardware | | | 3.7 | | |
3. SES Global (France)
Satellite Broadcasting Services | | | 3.6 | | |
4. Diamond Offshore (United States)
Contract Driller | | | 3.2 | | |
5. Potash Corp. of Saskatchewan (Canada)
World's Largest Producer of Potash | | | 3.2 | | |
6. Hexagon (Sweden)
Measurement Equipment & Polymers | | | 2.9 | | |
7. Impala Platinum Holdings (South Africa)
Platinum Group Metals Mining & Refining | | | 2.8 | | |
8. Sino Gold (Australia)
Gold Mining in The People's Republic of China | | | 2.8 | | |
9. Lenovo Group (China)
Third Largest PC Vendor Globally | | | 2.8 | | |
10. Smith & Nephew (United Kingdom)
Medical Equipment & Supplies | | | 2.7 | | |
5
Wanger International Select 2007 Annual Report
Wanger International Select
Statement of Investments December 31, 2007
Number of
Shares | | | | Value | |
| | | | | Common Stocks – 94.7% | | | | | |
| | | Europe – 49.5% | |
| | | Netherlands – 10.3% | |
| | 46,000 | | | Fugro
Oilfield Services | | | $3,525,954
| | |
| | 48,000 | | | QIAGEN (a)
Life Science Company; DNA/RNA Purification | | | 1,030,871
| | |
| | 26,000 | | | SBM Offshore
Builds & Leases Offshore Vessels to
Process & Store Crude Oil | | | 815,540
| | |
| | 38,619 | | | Aalberts Industries
Flow Control & Heat Treatment | | | 761,191
| | |
| | 21,700 | | | OPG Groep
Health Care Supplies & Pharmacies | | | 599,549
| | |
| | 8,400 | | | Boskalis Westminster
Dredging & Maritime Contractor | | | 510,289
| | |
| | 21,500 | | | Wavin
Largest European Plastic Pipe Systems Company | | | 284,392
| | |
| | | | | | | | 7,527,786 | | |
| | | Switzerland – 7.5% | |
| | 21,000 | | | Kuehne & Nagel
Freight Forwarding/Logistics | | | 2,002,111
| | |
| | 12,000 | | | Synthes
Products for Orthopedic Surgery | | | 1,483,264
| | |
| | 2,800 | | | Nobel Biocare Holding
Dental Implants & Ceramic Crowns | | | 740,705
| | |
| | 2,265 | | | Swatch Group
Watch & Electronics Manufacturer | | | 679,069
| | |
| | 9,000 | | | Schindler
Elevator Manufacturer & Service Provider | | | 575,312
| | |
| | | | | | | | 5,480,461 | | |
| | | United Kingdom – 6.5% | |
| | 175,000 | | | Smith & Nephew
Medical Equipment & Supplies | | | 2,011,969
| | |
| | 83,000 | | | Intertek Testing
Testing, Inspection, Certification Services | | | 1,627,292
| | |
| | 125,000 | | | Informa Group
Global Publisher & Event Organizer | | | 1,143,381
| | |
| | | | | | | | 4,782,642 | | |
Number of
Shares | | | | Value | |
| | | Ireland – 5.1% | |
| | 300,000 | | | United Drug
Irish Pharmaceutical Wholesaler & Outsourcer | | | $1,729,940
| | |
| | 60,000 | | | IAWS Group
Baked Goods | | | 1,328,125
| | |
| | 20,000 | | | CRH
Global Building Materials | | | 694,413
| | |
| | | | | | | | 3,752,478 | | |
| | | Sweden – 4.3% | |
| | 105,000 | | | Hexagon
Measurement Equipment & Polymers | | | 2,165,261
| | |
| | 290,000 | | | Securitas Systems
Commercial Security Installation & Service | | | 1,023,119
| | |
| | | | | | | | 3,188,380 | | |
| | | France – 3.6% | |
| | 100,000 | | | SES Global
Satellite Broadcasting Services | | | 2,622,195
| | |
| | | Germany – 3.5% | |
| | 12,700 | | | Wincor Nixdorf
Retail POS Systems & ATM Machines | | | 1,196,829
| | |
| | 3,900 | | | Deutsche Boerse
Trading, Clearing, Settlement Services for
Financial Markets | | | 769,785
| | |
| | 305 | | | Porsche
Specialty Automobile Manufacturer | | | 614,635
| | |
| | | | | | | | 2,581,249 | | |
| | | Austria – 2.6% | |
| | 53,000 | | | Zumtobel
Lighting Systems | | | 1,902,421
| | |
| | | Greece – 2.5% | |
| | 94,000 | | | Intralot
Lottery & Gaming Systems & Services | | | 1,852,251
| | |
See accompanying notes to financial statements.
6
Wanger International Select 2007 Annual Report
Wanger International Select
Statement of Investments December 31, 2007
Number of
Shares | | | | Value | |
| | | Spain – 2.1% | |
| | 15,000 | | | Red Electrica de Espana
Spanish Power Grid | | | $942,689
| | |
| | 33,000 | | | Prisa
Leading Spanish-speaking Publisher | | | 613,579
| | |
| | | | | | | | 1,556,268 | | |
| | | Denmark – 1.5% | |
| | 10,000 | | | Novozymes
Industrial Enzymes | | | 1,128,647
| | |
| | | | | Total Europe | | | 36,374,778 | | |
| | | Asia – 24.4% | |
| | | Japan – 13.7% | |
| | 4,500 | | | Nintendo
Entertainment Software & Hardware | | | 2,732,165
| | |
| | 2,350 | | | Jupiter Telecommunications (a)
Largest Cable Service Provider in Japan | | | 1,987,975
| | |
| | 58,000 | | | Hoya
Opto-electrical Components & Eyeglass Lenses | | | 1,851,077
| | |
| | 20,000 | | | Ibiden
Electronic Parts & Ceramics | | | 1,381,432
| | |
| | 173,000 | | | Kansai Paint
Paint Producer in Japan, India, China
& Southeast Asia | | | 1,254,861
| | |
| | 500 | | | Kenedix
Real Estate Investment Management | | | 804,533
| | |
| | | | | | | | 10,012,043 | | |
| | | China – 7.1% | |
| | 2,340,000 | | | Lenovo Group
Third Largest PC Vendor Globally | | | 2,068,971
| | |
| | 1,484,000 | | | Jiangsu Expressway
Chinese Toll Road Operator | | | 1,601,440
| | |
| | 507,000 | | | China Shipping Development
China's Dominant Shipper for Oil & Coal | | | 1,322,178
| | |
| | 26,500 | | | VisionChina Media (a)
Advertising on Digital Screens in China's
Mass Transit System | | | 225,250
| | |
| | | | | | | | 5,217,839 | | |
Number of
Shares | | | | Value | |
| | | Hong Kong – 2.2% | |
| | 58,000 | | | Hong Kong Exchanges and Clearing
Hong Kong Equity & Derivatives Market Operator | | | $1,628,233
| | |
| | | Singapore – 1.4% | |
| | 112,000 | | | Singapore Exchange
Singapore Equity & Derivatives Market Operator | | | 1,023,792
| | |
| | | | | Total Asia | | | 17,881,907 | | |
| | | Other Countries – 19.0% | |
| | | South Africa – 6.0% | |
| | 60,000 | | | Impala Platinum Holdings
Platinum Group Metals Mining & Refining | | | 2,069,910
| | |
| | 58,000 | | | Naspers
Media & Education in Africa & other
Emerging Markets | | | 1,365,265
| | |
| | 109,000 | | | Uranium One (a)
Uranium Mines in South Africa, Kazakhstan,
Australia & the U.S. | | | 975,196
| | |
| | | | | | | | 4,410,371 | | |
| | | Canada – 5.5% | |
| | 16,200 | | | Potash Corp. of Saskatchewan
World's Largest Producer of Potash | | | 2,332,152
| | |
| | 552,300 | | | Petro Rubiales Energy (a)(b) | | | 803,310 | | |
| | 276,150 | | | Petro Rubiales Energy – Warrants (a)(b) | | | 152,352 | | |
| | 2,700 | | | Petro Rubiales Energy (a)
Oil Production & Exploration in Colombia | | | 3,967
| | |
| | 42,000 | | | RONA (a)
Leading Canadian Do-it-yourself Retailer | | | 725,568
| | |
| | | | | | | | 4,017,349 | | |
| | | United States – 4.7% | |
| | 16,500 | | | Diamond Offshore
Contract Driller | | | 2,343,000
| | |
| | 11,300 | | | Atwood Oceanics (a)
Offshore Drilling Contractor | | | 1,132,712
| | |
| | | | | | | | 3,475,712 | | |
See accompanying notes to financial statements.
7
Wanger International Select 2007 Annual Report
Wanger International Select
Statement of Investments December 31, 2007
Number of Shares
or Principal Amount | | | | Value | |
| | | Australia – 2.8% | |
| | 342,000 | | | Sino Gold (a)
Gold Mining in The People's Republic of China | | | $2,069,678
| | |
| | | | | Total Other Countries | | | 13,973,110 | | |
| | | Latin America – 1.8% | |
| | | Brazil – 1.8% | |
| | 50,100 | | | Bovespa (a)
Brazil Equity & Derivative Exchange | | | 965,410
| | |
| | 25,300 | | | BM&F (a)
Brazilian Derivatives Exchange | | | 355,337
| | |
| | | | | Total Latin America | | | 1,320,747 | | |
| Total Common Stocks (Cost: $51,804,634) – 94.7% | | | 69,550,542 | | |
| Short-Term Obligation – 6.1% | | | |
| $ | 4,502,000 | | | Repurchase Agreement with Fixed
Income Clearing Corp., dated 12/31/07,
due 01/02/08 at 3.00%, collateralized
by a U.S. Government Agency Obligation
maturing 03/05/12, market value $4,593,038 (repurchase proceeds $4,502,750) | | | 4,502,000 | | |
| Total Short-Term Obligation (Cost: $4,502,000) | | | 4,502,000 | | |
| Total Investments (Cost: $56,306,634) – 100.8% (c)(d) | | | 74,052,542 | | |
| Cash and Other Assets Less Liabilities – (0.8)% | | | (568,017 | ) | |
| Total Net Assets – 100.0% | | | 73,484,525 | | |
Notes to Statement of Investments:
(a) Non-income producing security.
(b) Denotes a restricted security, which is subject to restrictions on resale under federal securities laws. These securities, are valued in good faith by the Board of Trustees. At December 31, 2007, these securities amounted to $955,662 which represents 1.30% of total net assets. Additional information on these securities is as follows:
Security | | Acquisition
Dates | | Shares/
Par | | Cost | |
Value | |
| Petro Rubiales Energy | | 7/12/2007 | | | 552,300 | | | $ | 369,594 | | | $ | 803,310 | | |
Petro Rubiales Energy –
Warrants | | 7/12/2007 | | | 276,150 | | | | 78,779 | | | | 152,352 | | |
| | | | | | | $ | 448,373 | | | $ | 955,662 | | |
(c) At December 31, 2007, for federal income tax purposes cost of investments was $56,327,694 and net unrealized appreciation was $17,724,848 consisting of gross unrealized appreciation of $20,682,842 and gross unrealized depreciation of $2,957,994.
(d) On December 31, 2007, the Fund's total investments were denominated in currencies as follows:
| Currency | | Value | | % of Net
Assets | |
| Euro Dollars | | $ | 21,794,649 | | | | 29.7 | | |
| U.S. Dollars | | | 10,535,114 | | | | 14.3 | | |
| Japanese Yen | | | 10,012,043 | | | | 13.6 | | |
| Swiss Francs | | | 5,480,461 | | | | 7.5 | | |
| British Pounds | | | 4,782,642 | | | | 6.5 | | |
Other currencies less than
5% of total net assets | | | 21,447,633 | | | | 29.2 | | |
Cash and other assets less
liabilities | | | (568,017 | ) | | | (0.8 | ) | |
| | | $ | 73,484,525 | | | | 100.0 | | |
See accompanying notes to financial statements.
8
Wanger International Select 2007 Annual Report
Wanger International Select
Portfolio Diversification December 31, 2007
At December 31, 2007, the Fund's portfolio investments as a percent of net assets was diversified as follows:
| | | Value | | Percent | |
| Information | |
| Financial Processors | | $ | 3,421,811 | | | | 4.7 | % | |
| Computer Hardware & Related Equipment | | | 3,265,800 | | | | 4.4 | | |
| Comnsumer Software | | | 2,732,165 | | | | 3.7 | | |
| Satellite Broadcasting & Services | | | 2,622,195 | | | | 3.6 | | |
| CATV | | | 1,987,975 | | | | 2.7 | | |
| Semiconductors & Related Equipment | | | 1,851,077 | | | | 2.5 | | |
| Publishing | | | 1,756,960 | | | | 2.4 | | |
| TV Broadcasting | | | 1,365,265 | | | | 1.9 | | |
| Advertising | | | 225,250 | | | | 0.3 | | |
| | | | 19,228,498 | | | | 26.2 | | |
| Energy & Minerals | |
| Oil Services | | | 8,327,495 | | | | 11.3 | | |
| Mining | | | 7,446,936 | | | | 10.1 | | |
| Oil & Gas Producers | | | 959,628 | | | | 1.3 | | |
| | | | 16,734,059 | | | | 22.7 | | |
| Industrial Goods & Services | |
| Conglomerates | | | 4,307,884 | | | | 5.9 | | |
| Other Industrial Services | | | 4,204,715 | | | | 5.7 | | |
| Industrial Materials & Specialty Chemicals | | | 2,667,900 | | | | 3.6 | | |
| Electrical Components | | | 1,902,421 | | | | 2.6 | | |
| Outsourcing Services | | | 1,023,119 | | | | 1.4 | | |
| Construction | | | 694,413 | | | | 0.9 | | |
| | | | 14,800,452 | | | | 20.1 | | |
| | | Value | | Percent | |
| Health Care | |
| Medical Equipment & Devices | | $ | 4,235,938 | | | | 5.8 | % | |
| Pharmaceuticals | | | 1,729,940 | | | | 2.4 | | |
| Medical Supplies | | | 1,030,871 | | | | 1.4 | | |
| Health Care Services | | | 599,549 | | | | 0.8 | | |
| | | | 7,596,298 | | | | 10.4 | | |
| Consumer Goods & Services | |
| Casinos & Gaming | | | 1,852,251 | | | | 2.5 | | |
| Food & Beverage | | | 1,328,125 | | | | 1.8 | | |
| Other Durable Goods | | | 1,293,703 | | | | 1.8 | | |
| Retail | | | 725,569 | | | | 1.0 | | |
| | | | 5,199,648 | | | | 7.1 | | |
| Other Industries | |
| Transportation | | | 2,923,618 | | | | 4.0 | | |
| Regulated Utilities | | | 942,689 | | | | 1.3 | | |
| Real Estate | | | 804,533 | | | | 1.1 | | |
| | | | 4,670,840 | | | | 6.4 | | |
| Finance | |
| Brokerage & Money Management | | | 1,320,747 | | | | 1.8 | | |
| | | | 1,320,747 | | | | 1.8 | | |
| Total Common Stocks | | | 69,550,542 | | | | 94.7 | | |
| Short-Term Obligation | | | 4,502,000 | | | | 6.1 | | |
| Total Investments | | | 74,052,542 | | | | 100.8 | | |
Cash and Other Assets
Less Liabilities | | | (568,017 | ) | | | (0.8 | ) | |
| Net Assets | | | 73,484,525 | | | | 100.0 | | |
See accompanying notes to financial statements.
9
Wanger International Select 2007 Annual Report
Statement of Assets and Liabilities
December 31, 2007
| Assets: | |
| Investments, at cost | | $ | 56,306,634 | | |
| Investments, at value | | $ | 74,052,542 | | |
| Cash | | | 717 | | |
| Foreign currency (cost of $41) | | | 41 | | |
| Receivable for: | |
| Fund shares sold | | | 1,014 | | |
| Interest | | | 375 | | |
| Dividends | | | 58,134 | | |
| Foreign tax reclaims | | | 6,959 | | |
| Other assets | | | 8 | | |
| Total Assets | | | 74,119,790 | | |
| Liabilities: | |
| Payable for: | |
| Investments purchased | | | 227,385 | | |
| Fund shares repurchased | | | 304,313 | | |
| Investment advisory fee | | | 58,729 | | |
| Administration fee | | | 3,124 | | |
| Transfer agent fee | | | 12 | | |
| Trustees' fees | | | 94 | | |
| Audit fee | | | 12,950 | | |
| Custody fee | | | 7,933 | | |
| Reports to shareholders | | | 14,639 | | |
| Chief compliance officer expenses | | | 104 | | |
| Trustees' deferred compensation plan | | | 4,244 | | |
| Other liabilities | | | 1,738 | | |
| Total Liabilities | | | 635,265 | | |
| Net Assets | | $ | 73,484,525 | | |
| Composition of Net Assets: | |
| Paid-in capital | | $ | 41,093,411 | | |
| Undistributed net investment income | | | 214,513 | | |
| Accumulated net realized gain | | | 14,429,409 | | |
| Net unrealized appreciation on: | |
| Investments | | | 17,745,908 | | |
| Foreign currency translations | | | 1,284 | | |
| Net Assets | | $ | 73,484,525 | | |
| Fund Shares Outstanding | | | 2,617,838 | | |
Net asset value, offering price and
redemption price per share | | $ | 28.07 | | |
Statement of Operations
For the Year Ended December 31, 2007
| Investment Income: | |
| Dividends (net of foreign taxes withheld of $58,485) | | $ | 945,683 | | |
| Interest | | | 125,052 | | |
| Total Investment Income | | | 1,070,735 | | |
| Expenses: | |
| Investment advisory fee | | | 670,269 | | |
| Administration fee | | | 15,232 | | |
| Transfer agent fee | | | 147 | | |
| Reports to shareholders | | | 26,210 | | |
| Trustees' fees | | | 5,797 | | |
| Custody fee | | | 50,348 | | |
| Chief compliance officer expenses (See Note 4) | | | 8,958 | | |
| Other expenses (See Note 5) | | | 37,216 | | |
| Total Expenses | | | 814,177 | | |
| Custody earnings credit | | | (30 | ) | |
| Net Expenses | | | 814,147 | | |
| Net Investment Income | | | 256,588 | | |
Net Realized and Unrealized Gain (Loss) on
Investments and Foreign Currency: | |
| Net realized gain (loss) on: | |
| Investments | | | 14,886,293 | | |
| Foreign currency transactions | | | (19,990 | ) | |
| Net realized gain | | | 14,866,303 | | |
| Net change in unrealized depreciation on: | |
| Investments | | | (1,765,722 | ) | |
| Foreign currency translations | | | (24 | ) | |
| Net change in unrealized depreciation | | | (1,765,746 | ) | |
| Net Gain | | | 13,100,557 | | |
| Net Increase in Net Assets from Operations | | $ | 13,357,145 | | |
See accompanying notes to financial statements.
10
Wanger International Select 2007 Annual Report
Statement of Changes in Net Assets
| | | Year Ended December 31, | |
| Increase (Decrease) in Net Assets | | 2007 | | 2006 | |
| Operations: | |
| Net investment income | | $ | 256,588 | | | $ | 259,835 | | |
| Net realized gain on investments and foreign currency transactions | | | 14,866,303 | | | | 9,092,683 | | |
Net change in unrealized appreciation (depreciation)
on investments and foreign currency translations | | | (1,765,746 | ) | | | 7,550,578 | | |
| Net Increase in Net Assets from Operations | | | 13,357,145 | | | | 16,903,096 | | |
| Distributions to Shareholders: | |
| From net investment income | | | (491,093 | ) | | | (154,737 | ) | |
| From net realized gains | | | (7,887,030 | ) | | | — | | |
| Total Distributions to Shareholders | | | (8,378,123 | ) | | | (154,737 | ) | |
| Share Transactions: | |
| Subscriptions | | | 13,254,652 | | | | 20,098,821 | | |
| Distributions reinvested | | | 8,378,123 | | | | 154,737 | | |
| Redemptions | | | (15,721,645 | ) | | | (18,433,819 | ) | |
| Net Increase from Share Transactions | | | 5,911,130 | | | | 1,819,739 | | |
| Total Increase in Net Assets | | | 10,890,152 | | | | 18,568,098 | | |
| Net Assets: | |
| Beginning of period | | | 62,594,373 | | | | 44,026,275 | | |
| End of period | | | 73,484,525 | | | | 62,594,373 | | |
| Undistributed net investment income at end of period | | | 214,513 | | | | 56,352 | | |
See accompanying notes to financial statements.
11
Wanger International Select 2007 Annual Report
Financial Highlights
| | | Year Ended December 31, | |
| Selected data for a share outstanding throughout each period | | 2007 | | 2006 | | 2005 | | 2004 | | 2003 | |
| Net Asset Value, Beginning of Period | | $ | 26.62 | | | $ | 19.63 | | | $ | 17.19 | | | $ | 13.87 | | | $ | 9.86 | | |
| Income from Investment Operations: | |
| Net investment income (a) | | | 0.10 | | | | 0.11 | | | | 0.13 | | | | 0.04 | | | | 0.04 | | |
Net realized and unrealized gain on investments
and foreign currency transactions | | | 4.92 | | | | 6.94 | | | | 2.66 | | | | 3.33 | | | | 4.01 | | |
| Total from Investment Operations | | | 5.02 | | | | 7.05 | | | | 2.79 | | | | 3.37 | | | | 4.05 | | |
| Less Distributions to Shareholders: | |
| From net investment income | | | (0.21 | ) | | | (0.06 | ) | | | (0.35 | ) | | | (0.05 | ) | | | (0.04 | ) | |
| From net realized gains | | | (3.36 | ) | | | — | | | | — | | | | — | | | | — | | |
| Total Distributions to Shareholders | | | (3.57 | ) | | | (0.06 | ) | | | (0.35 | ) | | | (0.05 | ) | | | (0.04 | ) | |
| Net Asset Value, End of Period | | $ | 28.07 | | | $ | 26.62 | | | $ | 19.63 | | | $ | 17.19 | | | $ | 13.87 | | |
| Total Return (b) | | | 21.78 | % | | | 36.00 | % | | | 16.43 | % (c) | | | 24.34 | % | | | 41.24 | % (c) | |
| Ratios to Average Net Assets: | |
| Net expenses (d) | | | 1.18 | % | | | 1.19 | % | | | 1.32 | % | | | 1.43 | % | | | 1.45 | % | |
| Net investment income (d) | | | 0.37 | % | | | 0.47 | % | | | 0.76 | % | | | 0.29 | % | | | 0.39 | % | |
| Waiver | | | — | | | | — | | | | 0.00 | % (e) | | | — | | | | 0.09 | % | |
| Portfolio turnover rate | | | 69 | % | | | 61 | % | | | 48 | % | | | 71 | % | | | 59 | % | |
| Net assets, end of period (000's) | | $ | 73,485 | | | $ | 62,594 | | | $ | 44,026 | | | $ | 35,232 | | | $ | 26,928 | | |
(a) Net investment income per share was based upon the average shares outstanding during the period.
(b) Total return at net asset value assuming all distributions reinvested.
(c) Had the investment adviser not waived a portion of expenses, total return would have been reduced.
(d) The benefits derived from custody fees paid indirectly had an impact of less than 0.01%.
(e) Rounds to less than 0.01%.
See accompanying notes to financial statements.
12
Wanger International Select 2007 Annual Report
Notes to Financial Statements
1. Nature of Operations
Wanger International Select (the "Fund") is a series of Wanger Advisors Trust (the "Trust"), an open-end management investment company organized as a Massachusetts business trust. The investment objective of the Fund is to seek long-term growth of capital. The Fund is available only for allocation to certain life insurance company separate accounts established for the purpose of funding qualified and non-qualified variable annuity contracts and variable life insurance policies and may also be offered directly to certain types of pension plans and retirement arrangements.
2. Significant Accounting Policies
Security valuation
Securities of the Fund are valued at market value or, if a market quotation for a security is not readily available or is deemed not to be reliable because of events or circumstances that have occurred between the market quotation and the time as of which the security is to be valued, the security is valued at a fair value determined in accordance with procedures established by the Board of Trustees. A security traded on a securities exchange or in an over-the-counter market in which transaction prices are reported is valued at the last sales price at the time of valuation. A security traded principally on NASDAQ is valued at the NASDAQ official closing price. A security for which there is no reported sale on the valuation date is valued at the latest bid quotation. A short term debt obligation having a maturity of 60 days or less from the valuation date is valued at amortized cost, which approximates fair value. A security for which a market quotation is not readily available and any other assets are valued in accordance with procedures established by the Board of Trustees. The Trust has retained an independent statistical fair value pricing service to assist in the fair valuation process for securities principally traded in a foreign market in order to adjust for possible changes in value that may occur between the close of the foreign exchange and the time as of which the securities are to be valued. If a security is valued at fair value, that value may be different from the last quoted market price for the security.
In September 2006, Statement of Financial Accounting Standards No. 157, Fair Value Measurements ("SFAS 157"), was issued. SFAS 157 is effective for fiscal years beginning after November 15, 2007. SFAS 157 defines fair value, establishes a framework for measuring fair value and expands disclosures about fair value measurements. Management is evaluating the impact the application of SFAS 157 will have on the Fund's financial statement disclosures.
Repurchase agreements
The Fund may engage in repurchase agreement transactions. The Fund, through its custodians, receives delivery of underlying securities collateralizing each repurchase agreement. The Fund's custodian determines that the value of the underlying securities is at all times at least equal to the resale price. In the event of default or bankruptcy by the other party to the agreement, realization and/or retention of the collateral may be subject to legal proceedings.
Foreign currency translations
Values of investments denominated in foreign currencies are converted into U.S. dollars using the spot market rate of exchange at the time of valuation. Purchases and sales of investments and dividend and interest income are translated into U.S. dollars using the spot market rate of exchange prevailing on the respective dates of such transactions. The gain or loss resulting from changes in foreign exchange rates is included with net realized and unrealized gain or loss from investments, as appropriate.
Security transactions and investment income
Security transactions are accounted for on the trade date (date the order to buy or sell is executed) and dividend income is recorded on the ex-dividend date, except that certain dividends from foreign securities are recorded as soon as the information is available to the Fund. Interest income is recorded on the accrual basis and includes amortization of discounts on debt obligations when required for federal income tax purposes. Realized gains and losses from security transactions are recorded on an identified cost basis.
Awards, if any, from class action litigation related to securities owned may be recorded as a reduction of cost of those securities. If the applicable securities are no longer owned, the proceeds are recorded as realized gains.
Use of estimates
The preparation of financial statements in conformity with accounting principles generally accepted in the United States of America ("GAAP") requires management to make estimates and assumptions that affect the amounts reported in the financial statements and accompanying notes. Actual results may differ from those estimates.
Fund share valuation
Fund shares are sold and redeemed on a continuing basis at net asset value. Net asset value per share is determined daily as of the close of trading on the New York Stock Exchange ("the Exchange") on each day the Exchange is open for trading by dividing the total value of the Fund's investments and other assets, less liabilities, by the number of Fund shares outstanding.
Custody fees/Credits
Custody fees are reduced based on the Fund's cash balances maintained with the custodian. The amount is disclosed as a reduction of total expenses in the Statement of Operations.
Federal income taxes
The Fund has complied with the provisions of the Internal Revenue Code available to regulated investment companies and, in the manner provided therein, distributes all its taxable income, as well as any net realized gain on sales of investments and foreign currency transactions reportable for federal income tax purposes. Accordingly, the Fund paid no federal income taxes and no federal income tax provision was required.
Foreign capital gains taxes
Realized gains on certain countries may be subject to foreign taxes at the fund level, at rates ranging from 10%-15%. The Fund accrues for such foreign taxes on net realized and unrealized gains at the appropriate rate for each jurisdiction.
Distributions to shareholders
Distributions to shareholders are recorded on the ex-date.
Indemnification
In the normal course of business, the Fund enters into contracts that contain a variety of representations and warranties which provide general indemnities. The Fund's maximum exposure under these arrangements is unknown, as this would involve future claims against the Fund. Also under the Trust's organizational documents, the Trustees and Officers of the Trust are indemnified against certain liabilities that may arise out of their duties to the Trust. However based on experience, the Fund expects the risk of loss due to these warranties and indemnities to be minimal.
3. Federal Tax Information
The timing and character of income and capital gain distributions are determined in accordance with income tax regulations, which may differ from
13
Wanger International Select 2007 Annual Report
Notes to Financial Statements, continued
GAAP. Reclassifications are made to the Fund's capital accounts for permanent tax differences to reflect income and gains available for distribution (or available capital loss carryforwards) under income tax regulations.
For the year ended December 31, 2007, permanent book and tax basis differences resulting primarily from differing treatments for foreign currency transactions and passive foreign investment companies ("PFIC") adjustments were identified and reclassified among the components of the Fund's net assets as follows:
Undistributed
Net Investment
Income | | Accumulated
Net Realized
Gain/(Loss) | | Paid-In Capital | |
| $ | 392,666 | | | $ | (392,666 | ) | | | — | | |
Net investment income and net realized gains (losses), as disclosed on the Statement of Operations, and net assets were not affected by this reclassification.
The tax character of distributions paid during the years ended December 31, 2007 and December 31, 2006 were as follows:
| | | December 31, 2007 | | December 31, 2006 | |
| Distributions paid from: | |
| Ordinary Income* | | $ | 1,250,481 | | | $ | 154,737 | | |
| Long Term Capital Gains | | | 7,127,642 | | | | — | | |
* For tax purposes short-term capital gains distributions, if any, are considered ordinary income distributions.
As of December 31, 2007, the components of distributable earnings on a tax basis were as follows:
Undistributed
Ordinary
Income | | Undistributed
Long-Term
Capital Gains | | Net Unrealized
Appreciation* | |
| $ | 2,993,666 | | | $ | 11,671,315 | | | $ | 17,724,848 | | |
* The differences between book-basis and tax-basis net unrealized appreciation/depreciation are primarily due to deferral of losses from wash sales and PFIC adjustments.
The Funds adopted Financial Accounting Standards Board ("FASB") Interpretation No. 48, Accounting for Uncertainty in Income Taxes—an Interpretation of FASB Statement No. 109 ("FIN 48") effective June 29, 2007. FIN 48 requires management to determine whether a tax position of the Fund is more likely than not to be sustained upon examination by the applicable taxing authority, including resolution of any related appeals or litigation processes, based on the technical merits of the position. The tax benefit to be recognized is measured as the largest amount of benefit that is greater than fifty percent likely of being realized upon ultimate settlement. FIN 48 must be applied to all existing tax positions upon initial adoption and the cumulative effect, if any, is to be reported as an adjustment to net assets. Management has evaluated the known implications of FIN 48 on its computation of net assets for the Fund. As a result of this evaluation, management believes that FIN 48 does not have any effect on the Fund's financial statements. However, management's conclusions regarding FIN 48 may be subject to review and adjustment at a later date based on factors including, but not limited to, further implementation guidance from the FASB, new tax laws, regulations, and administrative interpretations (including relevant court decisions). The Fund's federal tax returns for the prior three fiscal years remain subject to examination by the Internal Revenue Service. The Funds are not aware of any tax positions for which it is reasonably possible that the total amounts of unrecognized tax benefits will significantly change in the next twelve months.
4. Transactions With Affiliates
Columbia Wanger Asset Management, L.P., ("CWAM") is a wholly owned subsidiary of Columbia Management Group, LLC, which in turn is an indirect wholly owned subsidiary of Bank of America Corporation ("BOA"). CWAM furnishes continuing investment supervision to the Fund and is responsible for the overall management of the Fund's business affairs.
Effective August 1, 2007, under the Fund's investment advisory agreement, fees are accrued daily based on the Fund's average daily net assets and paid monthly to CWAM at the annual rates shown in the table below:
| Average Daily Net Assets | | Annual Fee Rate | |
| Up to $500 million | | | 0.94 | % | |
| $500 million and over | | | 0.89 | % | |
Prior to August 1, 2007, as provided under the Fund's investment advisory agreement, fees were accrued daily based on the Fund's average daily net assets and paid monthly to CWAM as the annual rate of 0.99%.
For the year ended December 31, 2007, the Fund's effective investment advisory fee rate was 0.97%.
Through April 30, 2008, CWAM will reimburse the Fund to the extent that ordinary operating expenses (including custodial charges relating to overdrafts, if any), after giving effect to any balance credits from the Fund's custodian, exceed an annual percentage of 1.45% of average daily net assets. There was no reimbursement for the year ended December 31, 2007.
CWAM provides administrative services and receives an administration fee from the Fund. Prior to August 1, 2007, administrative services were covered under the Fund's investment advisory agreement in place between the Fund and CWAM. Effective August 1, 2007, under the Fund's new administration agreement, which provides the same types of administrative services that were provided under the investment advisory agreement, fees are accrued daily and paid monthly to CWAM at the annual rate of 0.05%. Accordingly, the investment advisory fees were decreased by 0.05% across all asset levels effective August 1, 2007 as well.
For the year ended December 31, 2007, the Fund's effective administration fee rate was 0.02%.
Certain officers and trustees of the Trust are also officers of CWAM. The Trust makes no direct payments to its officers and trustees who are affiliated with CWAM.
The Board of Trustees appointed a Chief Compliance Officer to the Fund in accordance with federal securities regulations. The Fund will pay its pro-rata share of the expenses associated with the Office of the Chief Compliance Officer. These expenses are disclosed separately as "Chief compliance officer expenses" in the Statement of Operations.
The Trust offers a deferred compensation plan for its independent trustees. Under that plan, a trustee may elect to defer all or a portion of his or her compensation. Amounts deferred are retained by the Trust and represent an unfunded obligation of the Trust. The value of amounts deferred is determined by reference to the change in value of Class Z shares of one or more series of the Columbia Acorn Trust or a money market fund as specified by the trustee. Benefits under the deferred compensation plan are payable when the trustee ceases to be a member of the Board of Trustees.
Columbia Management Distributors, Inc. (the "Distributor"), a wholly owned subsidiary of BOA, serves as the principal underwriter of the Trust and receives no compensation for its services.
Columbia Management Services, Inc. (the "Transfer Agent"), a wholly owned subsidiary of BOA, provides shareholder services to the Fund and has contracted with Boston Financial Data Services ("BFDS") to serve as subtransfer agent. For such services, the Transfer Agent receives a fee, paid
14
Wanger International Select 2007 Annual Report
Notes to Financial Statements, continued
monthly, at the annual rate of $21.00 per open account. The Transfer Agent also receives reimbursement for certain out-of-pocket expenses.
During the year ended December 31, 2007, the Fund had no purchases or sales transactions with Funds that have a common investment adviser.
5. Borrowing Arrangements
The Trust participates in a $150 million credit facility, which was entered into to facilitate portfolio liquidity. Interest is charged to each participating fund based on its borrowings at a rate per annum equal to the Federal Funds rate plus 0.50%. In addition, a commitment fee of 0.08% per annum of the unutilized line of credit is accrued and apportioned among the participating funds based on their relative net assets. The commitment fee is included in "Other expenses" in the Statement of Operations. No amounts were borrowed by the Fund under this facility during the year ended December 31, 2007.
6. Fund Share Transactions
Proceeds and payments on Fund shares as shown in the Statement of Changes in Net Assets are in respect of the following numbers of shares:
| | | Year ended
December 31, 2007 | | Year ended
December 31, 2006 | |
| Shares sold | | | 497,815 | | | | 919,957 | | |
Shares issued in reinvestment
of dividend distributions | | | 363,318 | | | | 7,482 | | |
| Less shares redeemed | | | (595,024 | ) | | | (818,880 | ) | |
| Net increase in shares outstanding | | | 266,109 | | | | 108,559 | | |
7. Investment Transactions
The aggregate cost of purchases and proceeds from sales other than short-term obligations for the year ended December 31, 2007 were $45,805,967 and $50,368,475, respectively.
8. Legal Proceedings
CWAM, Columbia Acorn Trust (another mutual fund family advised by CWAM), and the trustees of Columbia Acorn Trust (collectively, the "Columbia defendants") are named as defendants in class and derivative complaints that have been consolidated in a Multi-District Action (the "MDL Action") in the federal district court of Maryland. These lawsuits contend that defendants permitted certain investors to market time their trades in certain Columbia Acorn Funds. The MDL Action is ongoing. However, all claims against Columbia Acorn Trust and the independent trustees of Columbia Acorn Trust have been dismissed.
Columbia Acorn Trust and CWAM are also defendants in a class action lawsuit that alleges, in summary, that Columbia Acorn Trust and CWAM exposed shareholders of Columbia Acorn International Fund to trading by market timers by allegedly: (a) failing to properly evaluate daily whether a significant event affecting the value of the fund's securities had occurred after foreign markets had closed but before the calculation of the fund's net asset value ("NAV"); (b) failing to implement the fund's portfolio valuation and share pricing policies and procedures; and (c) failing to know and implement applicable rules and regulations concerning the calculation of NAV (the "Fair Valuation Lawsuit"). The Seventh Circuit ruled that the plaintiffs' state law claims were preempted under federal law resulting in the dismissal of plaintiffs' complaint. Plaintiffs appealed the Seventh Circuit's ruling to the United States Supreme Court. The Suprem e Court reversed the Seventh Circuit's ruling on jurisdictional grounds and the case was ultimately remanded to the state court.
On March 21, 2005, a class action complaint was filed against the Columbia Acorn Trust and CWAM seeking to rescind the CDSC assessed upon redemption of Class B shares of Columbia Acorn Funds due to the alleged market timing of the Columbia Acorn Funds (the "CDSC Lawsuit"). In addition to the rescission of sales charges, plaintiffs seek recovery of actual damages, attorneys' fees and costs. The case had been transferred to the MDL Action in the federal district court of Maryland.
On September 14, 2007, the plaintiffs and the Columbia defendants named in the MDL Action, including the Columbia Funds, entered into a stipulation of settlement with respect to all Columbia-related claims in the MDL Action described above, including the CDSC and Fair Valuation Lawsuits. The settlement is subject to court approval.
CWAM, the Columbia Acorn Funds and the Trustees of the Trust are also defendants in a consolidated lawsuit filed in the federal district court of Massachusetts alleging that CWAM used Fund assets to make undisclosed payments to brokers as an incentive for the brokers to market the Funds over other mutual funds to investors. The complaint alleges CWAM and the Trustees of Columbia Acorn Trust, along with certain affiliated entities and individuals, breached certain common law duties and federal laws.
On November 30, 2005, the judge dismissed all claims by plaintiffs and entered final judgment in favor of the defendants. The plaintiffs appealed to the United States Court of Appeals for the First Circuit on December 30, 2005. A stipulation and settlement agreement dated January 19, 2007 was filed in the First Circuit on February 14, 2007, with a joint stipulation of dismissal and motion for remand to obtain district court approval of the settlement. That joint motion was granted and the appeal was dismissed. On March 6, 2007, the case was remanded to the federal district court. The settlement, approved by the federal district court on September 18, 2007, became effective October 19, 2007. Pursuant to the settlement, the funds' adviser and/or its affiliates made certain payments, including plaintiffs' attorneys' fees and costs of notice to class members.
The Trust and CWAM intend to defend these suits vigorously.
As a result of these matters, or any adverse publicity or other developments resulting from them, there may be increased redemptions or reduced sales of Columbia Acorn fund shares, which could increase transaction costs or operating expenses, or have other adverse consequences for the Columbia Acorn funds. However, based on currently available information, the Columbia Acorn Trust believes that the likelihood that these lawsuits will have a material adverse impact on any fund is remote, and CWAM believes that the lawsuits are not likely to materially affect its ability to provide investment management services to the funds.
15
Wanger International Select 2007 Annual Report
Report of Independent Registered Public Accounting Firm
To the Board of Trustees and Shareholders of Wanger International Select,
In our opinion, the accompanying statement of assets and liabilities, including the statement of investments, and the related statements of operations and of changes in net assets and the financial highlights present fairly, in all material respects, the financial position of Wanger International Select (a series of the Wanger Advisors Trust, hereinafter referred to as the "Fund") at December 31, 2007, the results of its operations for the year then ended, the changes in its net assets for each of the two years in the period then ended and the financial highlights for each of the four years in the period then ended, in conformity with accounting principles generally accepted in the United States of America. These financial statements and financial highlights (hereafter referred to as "financial statements") are the responsibility of the Fund's management; our responsibility is to express an opinion on these financial statements based on our audits. We conducted our audits of these financial statements in accordance with the standards of the Public Company Accounting Oversight Board (United States). Those standards require that we plan and perform the audit to obtain reasonable assurance about whether the financial statements are free of material misstatement. An audit includes examining, on a test basis, evidence supporting the amounts and disclosures in the financial statements, assessing the accounting principles used and significant estimates made by management, and evaluating the overall financial statement presentation. We believe that our audits, which included confirmation of securities at December 31, 2007 by correspondence with the custodian and brokers, provide a reasonable basis for our opinion. The December financial highlights of the Fund for the period ended December 31, 2003 were audited by other independent auditors whose report dated February 6, 2004 expressed an unqualified opinion on those financial statements.
PricewaterhouseCoopers LLP
Chicago, Illinois
February 20, 2008
16
Wanger International Select 2007 Annual Report
Federal Income Tax Information (Unaudited)
For the fiscal year ended December 31, 2007, the Fund designated long-term capital gains of $11,680,663.
Foreign taxes paid during the fiscal year ended December 31, 2007, amounting to $58,485 ($0.02 per share) are expected to be passed through to shareholders as 100% allowable foreign tax credits for the year ending December 31, 2007.
17
Wanger International Select 2007 Annual Report
[Excerpt from:]
Wanger Advisors Trust
Management Fee Evaluation of the Senior Officer
Prepared Pursuant to the New York Attorney General's
Assurance of Discontinuance
June 2007
18
Wanger International Select 2007 Annual Report
Introduction
The New York Attorney General's Assurance of Discontinuance ("Order") entered into by Columbia Management Advisors, Inc. ("CMAI") and Columbia Management Distributors, Inc., ("CMDI" and collectively with "CMAI," "CMG") in February 2005, allows CMAI to manage or advise a mutual fund only if the trustees of the fund appoint a "Senior Officer" to perform specified duties and responsibilities. One of these responsibilities includes "managing the process by which proposed management fees (including but not limited to, advisory fees) to be charged the [Funds] are negotiated so that they are negotiated in a manner which is at arms' length and reasonable and consistent with this Assurance of Discontinuance."
This is the first year that the Columbia Acorn Trust and Wanger Advisors Trust (collectively, the "Trusts") and each series thereof (the "Acorn Funds," "WAT Funds" or collectively, the "Funds") have been overseen by the same Board of Trustees ("Board"). The Order provides that this Board must determine the reasonableness of proposed "management fees" by using either an annual competitive bidding process supervised by the Senior Officer or Independent Fee Consultant, or by obtaining "an annual independent written evaluation prepared by or under the direction of the Senior Officer or the Independent Fee Consultant."
"Management fees" are only part of the costs and expenses paid by mutual fund shareholders. The expenses can vary depending upon the class of shares held but usually include: (1) investment management or advisory fees to compensate analysts and portfolio managers for stock research and portfolio management, as well as the cost of operating a trading desk; (2) administrative expenses incurred to prepare registration statements and tax returns, calculate the Funds' net asset values, maintain effective compliance procedures and perform recordkeeping services; (3) transfer agency costs for establishing accounts, accepting and disbursing funds, as well as overseeing trading in Fund shares; (4) custodial expenses incurred to hold the securities purchased by the Funds; and (5) distribution expenses, including commissions paid to brokers that sell the Fund shares to investors.
Columbia Wanger Asset Management, L.P. ("CWAM"), the adviser to the Funds, has proposed that with respect to the Acorn Funds, the Columbia Acorn Trust continue the existing separate agreements governing the first two categories listed above: an advisory agreement governing portfolio management, and an administration agreement governing certain administration and clerical services. Together the fees paid under these two agreements are referred to as "management fees." CWAM proposes that the WAT Funds continue the existing single agreement governing both investment advisory and administrative services. A single management fee would cover both services. Other fund expenses are governed by separate agreements, in particular agreements with two CWAM affiliates: CMDI, the broker-dealer that underwrites and distributes the Funds' shares, and Columbia Management Services, Inc. ("CMSI"), the Funds' transfer agent. In conformity with the terms of the Order, this evaluation, therefore, addresses only the advisory and administrative contracts, and does not extend to the other agreements.
According to the Order, the Senior Officer's evaluation must consider at least the following:
(1) Management fees (including components thereof) charged to institutional and other clients of CWAM for like services;
(2) Management fees (including any components thereof) charged by other mutual fund companies for like services;
(3) Costs to CWAM and its affiliates of supplying services pursuant to the management fee agreements, excluding any intra-corporate profit;
(4) Profit margins of CWAM and its affiliates from supplying such services;
(5) Possible economies of scale as the Funds grow larger; and
(6) The nature and quality of CWAM's services, including the performance of each Fund.
In 2004, the Boards of the two Trusts, then separate groups, each appointed me Senior Officer under the Order. They also determined not to pursue a competitive bidding process and instead, charged me with the responsibility of evaluating the Funds' proposed advisory and administrative fee contracts with CWAM in conformity with the requirements of the Order. This Report is an annual evaluation required under the Order. In discharging their responsibilities, the independent Trustees have also consulted independent, outside counsel.
2007 Evaluation
This is the third annual evaluation prepared in connection with the Order. This evaluation follows the same structure as the earlier studies. Some areas are given more emphasis here, while others are given less. Still, the fundamental information gathered for this evaluation is largely the same as past years.
Process and Independence
The objectives of the Order are to insure the independent evaluation of the advisory fees paid by the Funds as well as to insure that all relevant factors are considered. In my view, this contract renewal process has been conducted at arms-length and with independence in gathering, considering and evaluating all relevant data. At the outset of the process, the Trustees sought and obtained from CWAM and CMG a comprehensive compilation of data regarding Fund performance and expenses, adviser profitability, and other information. The Board evaluated this information thoroughly and also explored CWAM's potential capacity restraints. Performance and expense data was obtained from both Morningstar and Lipper, the leading consultants in this area. The rankings prepared by Morningstar and Lipper were independent and not influenced by the adviser. CWAM itself identified what it considers competing funds, and the Trustees considered that data as well.
In the course of its work, the Contract Committee gave careful consideration to the conclusions and recommendations contained in last year's evaluation. The Contract Committee gave particular emphasis to the issue of whether economies of scale were appropriately reflected in the Funds' fee schedules. Last year, the
19
Wanger International Select 2007 Annual Report
Board sought and CWAM agreed to additional breakpoints for two Funds, Acorn USA and Acorn Select. These breakpoints are above current asset levels, but clearly operate to share economies of scale with Fund shareholders. This year, at the Board's request, CWAM has proposed additional breakpoints for the WAT Funds, and Acorn International Select. This proposal is under consideration by the Board.
My evaluation of the advisory contract was shaped, as it was last year, by my experience as Chief Compliance Officer of the Trusts ("CCO"). As CCO, I report solely to the Board and have no reporting obligation to or employment relationship with CMG or its affiliates, except for administrative purposes. I have commented on compliance matters in evaluating the quality of service provided by CWAM.
This Report, its supporting materials and the data contained in other materials submitted to the Contract Committee of the Board, in my view, provide a thorough factual basis upon which the Board, in consultation with independent counsel as it deems appropriate, may conduct management fee negotiations that are in the best interests of the Funds' shareholders.
The Fee Reductions Mandated under the Order
Under the terms of the Order, CMG agreed to secure certain management fee reductions for the mutual funds advised by its affiliate investment advisers. In some instances, breakpoints were also established. Although neither CWAM nor the Trusts was a party to the Order, CWAM offered and the Board accepted certain advisory fee reductions during 2005. By the terms of the Order, these fees may not be increased before November 30, 2009. I have used these advisory fee levels — as modified last year to add certain breakpoints for Acorn USA and Acorn Select — in this evaluation because they are the fees in the current agreements that CWAM proposes should be continued. Hence, these fee levels are the starting point of an evaluation.
Conclusions
My review of the data and other material above leads to the following conclusions with respect to the factors identified in the Order.
1. Performance. The domestic Funds generally have achieved outstanding performance. The Acorn Fund, Acorn USA, Acorn Select, Wanger Select and Wanger US Smaller Companies all rank very favorably against their peers over the past five years. Although Acorn USA and Wanger US Smaller Companies had a difficult year in 2006, these returns are not characteristic of these funds, both of which have shown improved performance during the first quarter of 2007. The international Funds have relatively weaker long term records than the domestic funds, but recently have improved significantly and their one year rankings are excellent. Overall then, performance of the Funds is excellent.
2. Management Fees relative to Peers. The management fee rankings for several of the Acorn Funds are generally more favorable to shareholders than those of their peer group funds. Management fees do, however, vary by Fund. Acorn Fund is the least expensive and the Acorn USA the most expensive. Acorn Fund is very competitive, while Acorn USA and Acorn Select were ranked by both Lipper and Morningstar at or below the median, and therefore impose higher fees than do the majority of their competitors. The WAT Funds also lag their competitors and impose higher fees than their peers.
3. Administrative Fees. The Acorn Funds' administrative fee, which is uniform across all Funds, is at a level comparable to or less expensive than the fees imposed by their peers, provides for appropriate services to Funds, and affords breakpoints that lower the fee as assets increase. The WAT Funds pay a single fee for advisory and administrative services and hence do not benefit from administrative fee breakpoints, nor is it possible to assess their administrative costs relative to competitors.
4. Management Fees relative to Institutional and Other Mutual Fund Accounts. CWAM's focus is on its mutual funds. It does not actively seek to manage separate or institutional accounts. The few institutional accounts it does manage vary in rate structures. Some pay advisory fees commensurate with or higher than the Acorn and WAT Funds. In a few instances, however, institutional accounts pay lower advisory fees than do the Acorn Funds. One particular institutional account is significant in size and has been under CWAM's management for over 25 years.
5. Costs to CWAM and its Affiliates. CWAM's direct costs do not appear excessive. Overhead and indirect costs allocated to CWAM by its parent organizations, however, are significant and increasing. CWAM's affiliates report operating losses and therefore do not appear to profit from CWAM's advisory agreement with the Funds.
6. Profit Margins. CWAM's firm-wide, pre-marketing expense profit margins are at the top of the industry, though these comparisons are hampered by limited industry data. High profit margins are not unexpected for firms that manage large, successful funds and have provided outstanding investment performance for investors.
7. Economies of Scale. Economies of scale do exist at CWAM and will expand as the assets of the Funds get larger. They are, however, only partially reflected in the management fee schedule for the Acorn Funds and not reflected at all in two of the four WAT Funds. Breakpoints above current asset levels have, however, been added to the more expensive funds, Acorn Select and Acorn USA. Nonetheless, if Fund assets continue to grow, under the Funds' current fee schedules, all Fund shareholders might not benefit in a manner generally commensurate with CWAM's increased profits. Management has proposed additional breakpoints for some of the Funds that, if implement, would result in greater sharing of economies of scale.
20
Wanger International Select 2007 Annual Report
8. Nature and Quality of Services. This category includes a variety of considerations that are difficult to quantify, yet can have a significant bearing on the performance of the Acorn Funds. Several areas merit comment.
a. Capacity. The Funds have continued to grow, posing ever greater challenges in deploying assets effectively. While trends here merit continued monitoring, CWAM appears to be managing assets effectively.
b. Compliance. CWAM has a reasonably designed compliance program that protects shareholders.
c. Administrative Services. The Funds benefit from a variety of administrative services that are performed by CWAM and CMAI.
9. Process. In my opinion, the process of negotiating an advisory contract for the Funds has been conducted thoroughly and at arms' length. Further, the Trustees have sufficient information to evaluate management's proposal, and negotiate contract terms that are in the best interests of fund shareholders.
Recommendations
(with respect to the Wanger Funds)
I believe the Trustees should:
1. Continue to consider additional ways to restructure the advisory fee beyond the current breakpoint schedule to reflect more fully economies of scale.
2. Consider unbundling of the advisory and administrative fees paid by the WAT Funds.
3. Review the disparity in management fee levels between the Acorn International Fund and its related annuity-based fund, WAT International Small Cap Fund.
4. Continue to monitor CWAM's capacity limitations to insure that the Funds' expanding assets do not impair investment performance.
Robert P. Scales
Senior Vice President,
Chief Legal Officer
and General Counsel
June 18, 2007
21
Wanger International Select 2007 Annual Report
Board Approval of the Advisory Agreement
Wanger Advisors Trust (the "Trust") has an investment advisory agreement (the "Advisory Agreement") with Columbia Wanger Asset Management, L.P. ("CWAM") under which CWAM manages the Wanger Advisors Funds (the "Funds"). The trustees of the Trust, more than seventy five percent of whom have never been affiliated with CWAM ("Independent Trustees"), oversee the management of each Fund and, as required by law, determine at least annually whether to continue the Advisory Agreement for each Fund.
The Contract Committee of the board of trustees (the "Committee"), which is comprised of six Independent Trustees, makes recommendations to the board regarding any proposed continuation of the Advisory Agreement. After the Committee has made its recommendation, the full board determines whether to approve the continuation of the Advisory Agreement. In addition, the board considers matters bearing on the Advisory Agreement at most of its other meetings throughout the year and meets at least quarterly with the portfolio managers employed by CWAM.
In connection with their most recent consideration of the Advisory Agreement for each Fund, the Committee and all trustees received and reviewed a substantial amount of information provided by CWAM in response to requests of the Independent Trustees and their counsel. Throughout their consideration of the Advisory Agreement, the Independent Trustees were advised by their independent legal counsel. At each of the meetings at which the Committee or the Independent Trustees considered the Advisory Agreement, they met with management and also met separately in executive session with their counsel.
The materials reviewed by the Committee and the trustees included, among other items, (i) information on the investment performance of each Fund and the performance of peer groups of funds and of the Fund's performance benchmarks, (ii) information on each Fund's advisory fees and other expenses, including information comparing the Fund's fees and expenses to those of peer groups of funds and information about any applicable expense limitations and fee "breakpoints," (iii) data on sales and redemptions of Fund shares and (iv) information on the profitability to CWAM and its affiliates of their relationships with the Funds and potential "fall-out" or ancillary benefits that CWAM and its affiliates may receive as a result of their relationships with the Funds. They also considered other information such as (i) CWAM's financial results and financial condition, (ii) each Fund's investment objective and strategies; (iii) the size, edu cation and experience of CWAM's investment staff and its use of technology, external research and trading cost measurement tools, (iv) the allocation of the Funds' brokerage, if any, including allocations to brokers affiliated with CWAM, and the use of "soft" commission dollars to pay for research products and services, (v) the resources devoted to, and the record of compliance with, the Funds' investment policies and restrictions, policies on personal securities transactions and other compliance policies and (vi) the economic outlook generally and for the mutual fund industry in particular. In addition, the trustees conferred with, and reviewed the Management Fee Evaluation (the "Fee Evaluation") prepared by, the Trust's chief compliance officer, who also serves as the Trust's "Senior Officer" as contemplated by the Assurance of Discontinuance dated February 9, 2005 among affiliates of CWAM and the Office of the New York Attorney General. [A summary of the Fee Evaluation is included in this report.] Through out the process, the trustees had the opportunity to ask questions of and request additional materials from CWAM.
On July 17, 2007, the board of trustees unanimously approved (a) a new administration agreement between the Trust and CWAM, pursuant to which CWAM, for a fee at the annual rate of 0.05% of average daily net assets of the Trust, provides to the Trust the types of administrative services that were currently being provided to the Trust under the Advisory Agreement and(b) the continuation of the Advisory Agreement through July 31, 2008, with amendments to the fee schedule to provide (i) a corresponding 0.05% reduction in the annual rate of fee as a result of entering into the administration agreement and (ii) additional breakpoints, as described below. The approval followed Committee meetings held in February, May, June and July 2007.
In considering the continuation of the Advisory Agreement (and entering into the new administration agreement), the trustees reviewed and analyzed various factors that they determined were relevant, including the factors described below, none of which by itself was considered dispositive. However, the material factors and conclusions that formed the basis for the trustees' determination to approve the continuation of the Advisory Agreement (and entering into the new administration agreement) are discussed separately below.
Nature, quality and extent of services. The trustees reviewed the nature, quality and extent of the services of CWAM and its affiliates to the Funds, taking into account the investment objective and strategy of each Fund and the knowledge the trustees gained from their regular meetings with management on at least a quarterly basis. In addition, the trustees reviewed the available resources and key personnel of CWAM and its affiliates, especially those who provide investment management services to the Funds. The trustees also considered other services provided to the Funds by CWAM and its affiliates, such as managing the execution of portfolio transactions and the selection of broker-dealers for those transactions, serving as the Funds' administrator, monitoring adherence to the Funds' investment restrictions, producing shareholder reports, providing s upport services for the board and board committees, communicating with shareholders and overseeing the activities of other service providers, including monitoring compliance with various policies and procedures of the Funds and with applicable securities laws and regulations. With respect to the provision of administrative services, the trustees believed it was more appropriate for those same services to be provided to the Trust pursuant to a separate administration agreement.
The trustees concluded that: the nature, quality and extent of the services provided by CWAM and its affiliates to each Fund were appropriate and consistent with the terms of the Advisory Agreement; that the quality of those services had been consistent with or superior to quality norms in the industry; and that the Funds were likely to benefit from the continued provision of those services. They also concluded that each of CWAM and its affiliates currently had sufficient personnel, with appropriate education and experience, to serve the Funds effectively and had demonstrated their continuing ability to attract and retain well qualified personnel.
Performance of the Funds. At various meetings of the board, of the Committee and of the board's investment performance analysis committee, the trustees considered the short-term and longer-term performance of each Fund. They reviewed information comparing each Fund's performance with the performance of the Fund's benchmark and with the performance of comparable funds and peer groups as identified by Lipper Inc. ("Lipper") and Morningstar Associates, LLC ("Morningstar"). They noted that, among the domestic Funds, Wanger Select had outperformed its respective benchmark and Lipper and Morningstar peers for the relevant periods. Wanger U.S. Smaller Companies suffered weak performance compared to its benchmark in 2006 and ranked toward the bottom of its peer group for that period. Notwithstanding that performance, that Fund's performance approximated, or w as ahead of, its benchmark for the most recent three, five and ten year periods. The trustees also discussed the performance of the international Funds, noting that both of the international Funds had shown improvement over recent years. During the contract renewal process, the trustees concluded that, although past performance is not necessarily indicative of future results, the Funds' strong overall performance record was an important factor in their evaluation of the quality of services provided by CWAM under the Advisory Agreement.
Costs of Services and Profits Realized by CWAM. At various Committee meetings and other informal meetings, the trustees examined detailed information on fees and expenses of each Fund in comparison to information
22
Wanger International Select 2007 Annual Report
Board Approval of the Advisory Agreement
for other comparable funds provided by Lipper and Morningstar. As noted in the Fee Evaluation, the contractual rates of investment advisory fees and the actual advisory fees for some of the Funds were higher than the median advisory fees of their respective peer groups (particularly with respect to Wanger U.S. Smaller Companies and Wanger Select). The trustees also considered the management fees of the Wanger Advisors Funds relative to those of the Columbia Acorn Trust funds, a group of funds with similar investment strategies overseen by the same trustees and also managed by CWAM. In addition, the Committee and the Board had extensive discussions about the appropriateness of the 0.05% fee for administrative services.
The Board and CWAM approved amendments to the Advisory Agreement to (a) provide a 0.05% reduction in the fee schedule for each Fund in response to entering into the new administration agreement and (b) to establish additional breakpoints for (i) Wanger U.S. Smaller Companies at 0.80% on net asset levels over $2 billion, (ii) Wanger Select at 0.78% on net asset levels over $500 million, (iii) Wanger International Select at 0.89% on nets asset levels over $500 million and (iv) Wanger International Small Cap at 0.72% on net asset levels over $1 billion.
The trustees reviewed the Fee Evaluation's analysis of the profitability of CWAM in serving as each Fund's investment adviser and of CWAM and its affiliates in all of their relationships with each Fund, as well as an explanation of the methodology utilized in allocating various expenses among the Funds and other business units. The trustees took into account the methodology used by CWAM in determining compensation payable to portfolio managers and the competitive environment for investment management talent. The trustees recognized that profitability comparisons among fund managers are difficult because very little comparative information is publicly available and the profitability of any manager is affected by numerous factors, including the organizational structure of the particular manager, the types of funds and other accounts it manages, possible other lines of business, the methodology for allocating expenses and the manag er's capital structure and cost of capital.
The trustees also reviewed CWAM's advisory fees for other investment companies, sub-advised funds and other institutional separate accounts, as detailed in the Fee Evaluation. In most instances its institutional separate account fees for various investment strategies were higher than the advisory fees charged to the Funds with corresponding strategies, although for a few accounts, the fees were lower. The trustees noted that CWAM performs significant additional services for the Funds that it does not provide to sub-advised funds or non-mutual fund clients, including administrative services, oversight of the Funds' other service providers, trustee support, regulatory compliance and numerous other services, and that, in servicing the Funds, CWAM assumes many legal risks that it does not assume in servicing many of its other clients. Finally, the trustees considered the financial condition of CWAM as part of the contract renewal pr ocess.
The trustees concluded that the rates of advisory fees (as amended) and other compensation payable by the Funds to CWAM and its affiliates were reasonable in relation to the nature and quality of the services to be provided, taking into account the fees charged by other advisers for managing comparable mutual funds with similar strategies and the fees CWAM charges to other clients. The trustees also concluded that the Funds' estimated overall expense ratios were reasonable, taking into account quality of services provided by CWAM and its affiliates and the investment performance of the Funds.
Economies of Scale. The trustees considered information about the potential for CWAM to realize economies of scale as a Fund's assets increase. They noted that the fee schedule for each Fund includes reductions in the rate of fees at various asset levels, including each Fund's newly established breakpoint. The trustees also noted that the Funds share directly in economies of scale through lower charges on third party service providers based on the combined scale of all of the Funds. Based on the information they reviewed, the trustees concluded that the current fee structure of each Fund was reasonable and that the current rates of fees do reflect a sharing between CWAM and the Funds of economies of scale.
Other Benefits to CWAM. The trustees also reviewed benefits that accrue to CWAM and its affiliates from their relationships with the Funds, as outlined in the Fee Evaluation. They recognized that two affiliates of CWAM separately serve the Funds as transfer agent and distributor, respectively, and that the transfer agent receives compensation from the Funds for services provided. The trustees noted that, other than the services provided by CWAM and its affiliates pursuant to various agreements and the fees to be paid by each Fund therefor, the Funds and CWAM may potentially benefit from their relationship with each other in other ways. The trustees considered CWAM's use of commissions paid by each Fund on its portfolio brokerage transactions to obtain research products and services benefiting the Fund and/or other clients of CWAM. The trustees determi ned that CWAM's use of the Funds' "soft" commission dollars to obtain research products and services was consistent with regulatory requirements and guidance then in effect. They also concluded that CWAM benefits from the receipt of proprietary research products and services acquired through commissions paid on portfolio transactions of the Funds and that the Funds benefit from CWAM's receipt of those products and services as well as research products and services acquired through commissions paid by other clients of CWAM. They further concluded that the success of any Fund could attract other business to CWAM or other Funds and that the success of CWAM could enhance its ability to serve the Funds.
After full consideration of the above factors as well as other factors that were instructive in evaluating the Advisory Agreement, the trustees, including the Independent Trustees, unanimously concluded that the continuation of the Advisory Agreement, as amended to revise the fee schedule for each Fund to reflect both the 0.05% fee reduction and the additional breakpoints, was in the best interest of each Fund. On July 17, 2007, the trustees continued the Advisory Agreement as so amended through July 31, 2008.
23
Wanger International Select 2007 Annual Report
Board of Trustees and Management of Wanger Advisors Trust
The Board of Trustees of the Trust has overall management responsibility for the Trust and the Funds. Each trustee may serve a term of unlimited duration until the end of the calendar year in which the trustee attains the age of 75 years. The trustees appoint their own successors, provided that at least two-thirds of the trustees, after such appointment, have been elected by shareholders. Shareholders may remove a trustee, with or without cause, upon the vote of two-thirds of the Trust's outstanding shares at any meeting called for that purpose. A trustee may be removed, with or without cause, upon the vote of a majority of the trustees.
The names of the trustees and officers of the Trust, the date each was first elected or appointed to office, their principal business occupations during at least the last five years, and other directorships they hold are shown below. Each trustee serves in such capacity for each of the four series of the Trust and each of the six series of Columbia Acorn Trust.
The business address of each trustee and officer of the Trust is Columbia Wanger Asset Management, L.P., 227 West Monroe, Suite 3000, Chicago, Illinois 60606. The Fund's Statement of Additional Information includes additional information about the Fund's trustees and officers. You may obtain a free copy of the Statement of Additional Information by writing or calling toll-free:
Columbia Wanger Asset Management, L.P.
Shareholder Services Group
227 W. Monroe, Suite 3000
Chicago, IL 60606
888-4-WANGER (888-492-6437)
Name, Position(s) with
Wanger Advisors
Trust and Age at
December 31, 2007 | | Year First
Elected or
Appointed
to Office | | Principal Occupation(s) during
Past Five Years | | Number of
Portfolios in
Fund Complex
Overseen
by Trustee/Officer | | Other
Directorships | |
| Trustees who are not interested persons of Wanger Advisors Trust: | |
|
Laura M. Born, 42,
Trustee (1) | | | 2007 | | | Adjunct Assistant Professor of Finance, University of Chicago Graduate School of Business; Managing Director—Investment Banking, J.P. Morgan Chase & Co. Incorporated (broker-dealer) 1991-2007. | | | 10 | | | Columbia Acorn Trust. | |
|
Maureen M. Culhane, 59,
Trustee | | | 2007 | | | Retired; Vice President, Goldman, Sachs Asset Management L.P. (investment adviser) 2005; Vice President (Consultant)—Strategic Relationship Management, Goldman, Sachs & Co. 1999-2005; prior thereto, Vice President of Finance and Treasurer, Sara Lee Corporation. | | | 10 | | | Columbia Acorn Trust. | |
|
Margaret Eisen, 54,
Trustee | | | 2006 | | | Managing Director, CFA Institute since 2005; Chief Investment Officer, EAM International LLC (corporate finance and asset management) since 2003; prior thereto, Managing Director, DeGuardiola Advisors (investment bank); formerly Managing Director, North American Equities at General Motors Asset Management, and Director, Worldwide Pension Investments for DuPont Asset Management. | | | 10 | | | Antigenics, Inc. (biotechnology and pharmaceuticals); Columbia Acorn Trust | |
|
Jerome Kahn, Jr., 73,
Trustee | | | 2006 | | | Portfolio manager and stock analyst and former President, William Harris Investors, Inc. (investment adviser). | | | 10 | | | Columbia Acorn Trust. | |
|
Steven N. Kaplan, 48,
Trustee | | | 2006 | | | Neubauer Family Professor of Entrepreneurship and Finance, Graduate School of Business, University of Chicago. | | | 10 | | | Morningstar, Inc. (provider of independent investment research); Columbia Acorn Trust | |
|
David C. Kleinman, 72,
Trustee | | | 2006 | | | Adjunct Professor of Strategic Management, University of Chicago Graduate School of Business; business consultant. | | | 10 | | | Sonic Foundry, Inc. (rich media systems and software); Columbia Acorn Trust | |
|
Allan B. Muchin, 71,
Trustee and Vice Chairman of the Board | | | 2006 | | | Chairman Emeritus, Katten Muchin Rosenman LLP (law firm). | | | 10 | | | Columbia Acorn Trust | |
|
24
Wanger International Select 2007 Annual Report
Board of Trustees and Management of Wanger Advisors Trust
Name, Position(s) with
Wanger Advisors
Trust and Age at
December 31, 2007 | | Year First
Elected or
Appointed
to Office | | Principal Occupation(s) during
Past Five Years | | Number of
Portfolios in
Fund Complex
Overseen
by Trustee/Officer | | Other
Directorships | |
Robert E. Nason, 71,
Trustee and Chairman of the Board | | | 2006 | | | Consultant and private investor since 1998; formerly Executive Partner, Chief Executive Officer and member of the executive committee of Grant Thornton, LLP (public accounting firm) and member of the policy board of Grant Thornton International. | | | 10 | | | Columbia Acorn Trust | |
|
James A. Star, 46,
Trustee | | | 2006 | | | President, Longview Asset Management LLC (investment adviser) since 2003, prior thereto, portfolio manager; Vice President, Henry Crown and Company (investment firm); President and Chief Investment Officer, Star Partners (hedge fund) from 1998 to 2003. | | | 10 | | | Columbia Acorn Trust | |
|
John A. Wing, 72,
Trustee | | | 2006 | | | Partner, Dancing Lion Partners (investment partnership); prior thereto, Frank Wakely Gunsaulus Professor of Law and Finance, and Chairman of the Center for the Study of Law and Financial Markets, Illinois Institute of Technology; formerly Chairman of the Board and Chief Executive Officer of ABN-AMRO Incorporated (formerly named The Chicago Corporation, a financial services firm) and Chief Executive Officer of Market Liquidity Network, LLC. | | | 10 | | | First Chicago Bank and Trust; First Chicago Bancorp; Columbia Acorn Trust | |
|
| Trustees who are interested persons of Wanger Advisors Trust: | |
|
Charles P. McQuaid, 53,
Trustee and President (2) | | | 2003 | | | President and Chief Investment Officer, CWAM since October 2003; portfolio manager since 1995 and Director of Research, CWAM and its predecessor from July 1992 through December 2003; Interim Director of International Research, CWAM from October 2003 to December 2004; President of Columbia Acorn Trust since 2003. | | | 10 | | | Columbia Acorn Trust | |
|
Ralph Wanger, 72,
Trustee (3) | | | 1994 | | | Founder, former President, Chief Investment Officer and portfolio manager, CWAM from July 1992 to September 2003; former President, Columbia Acorn Trust from April 1992 through September 2003; former President, Wanger Advisors Trust 1994 through September 2003; Director, Wanger Investment Company PLC; advisor to CWAM from September 2003 to September 2005. | | | 10 | | | Columbia Acorn Trust | |
|
| Officers of Wanger Advisors Trust: | |
|
Ben Andrews, 41,
Vice President | | | 2004 | | | Analyst and portfolio manager, CWAM since 1998; Vice President, Columbia Acorn Trust. | | | 10 | | | None | |
|
Michael G. Clarke, 38,
Assistant Treasurer | | | 2004 | | | Assistant Treasurer, Columbia Acorn Trust; Chief Accounting Officer and Assistant Treasurer of the Columbia Funds since October 2004; Director of Fund Administration of Columbia Management Advisors, LLC since January 2006; Managing Director of Columbia Management Advisors, LLC from September 2004 to December 2005; Vice President, Fund Administration of Columbia Management Advisors, LLC from June 2002 to September 2004. | | | 10 | | | None | |
|
Jeffrey Coleman, 38,
Assistant Treasurer | | | 2006 | | | Assistant Treasurer, Columbia Acorn Trust since March 2006; Director of Fund Administration, CWAM since January 2006; Fund Controller, CWAM from October 2004 to January 2006; Vice President of CDC IXIS Asset Management Services, Inc. (investment management) from August 2000 to September 2004. | | | 10 | | | None | |
|
25
Wanger International Select 2007 Annual Report
Board of Trustees and Management of Wanger Advisors Trust
Name, Position(s) with
Wanger Advisors
Trust and Age at
December 31, 2007 | | Year First
Elected or
Appointed
to Office | | Principal Occupation(s) during
Past Five Years | | Number of
Portfolios in
Fund Complex
Overseen
by Trustee/Officer | | Other
Directorships | |
J. Kevin Connaughton, 43,
Assistant Treasurer | | | 2001 | | | Treasurer and Chief Financial Officer of the Columbia Funds since December 2000; Vice President of Columbia Management Advisors, LLC since April 2003; Assistant Treasurer of Columbia Acorn Trust since 2001; Treasurer and Chief Financial Officer of the Liberty Funds, Stein Roe Funds and Liberty All-Star Funds from December 2000 to December 2006; Treasurer of the Galaxy Funds from September 2002 through November 2005; Treasurer of Columbia Management Multi-Strategy Hedge Fund, LLC from December 2002 through December 2004; and a senior officer of various affiliated entities of the Bank of America Corporation, including other registered and unregistered funds. | | | 10 | | | None | |
|
P. Zachary Egan, 39,
Vice President | | | 2007 | | | Director of International Research, CWAM, since December 2004; portfolio manager, CWAM since 2003; analyst, CWAM since 1999. | | | 10 | | | None | |
|
Peter T. Fariel, 50,
Assistant Secretary | | | 2006 | | | Associate General Counsel, Bank of America since April 2005; prior thereto, Partner, Goodwin Procter LLP (law firm). | | | 10 | | | None | |
|
John Kunka, 37,
Assistant Treasurer | | | 2006 | | | Director of Accounting and Operations, CWAM, since 2006; Assistant Treasurer, Columbia Acorn Trust, since 2006; Manager of Mutual Fund Operations, Calamos Advisors, Inc. from 2005 to 2006; prior thereto, Manager of Mutual Fund Administration, Van Kampen Investments. | | | 10 | | | None | |
|
Joseph LaPalm, 37,
Vice President | | | 2006 | | | Chief Compliance Officer, CWAM since 2005; Vice President, Columbia Acorn Trust since 2006; prior thereto, Compliance Officer, William Blair & Company (investment firm). | | | 10 | | | None | |
|
Bruce H. Lauer, 50,
Vice President,
Secretary and Treasurer | | | 1995 | | | Chief Operating Officer, CWAM since April 2000; Vice President, Treasurer and Secretary, Columbia Acorn Trust; Director, Wanger Investment Company PLC; Director, Banc of America Capital Management (Ireland) Ltd.; Director, Bank of America Global Liquidity Fund, PLC. | | | 10 | | | None | |
|
Louis J. Mendes, 43,
Vice President | | | 2005 | | | Analyst and portfolio manager, CWAM since 2001; Vice President, Columbia Acorn Trust. | | | 10 | | | None | |
|
Robert A. Mohn, 46,
Vice President | | | 1997 | | | Analyst and portfolio manager, CWAM since August 1992; Director of Domestic Research, CWAM since March 2004; Vice President, Columbia Acorn Trust. | | | 10 | | | None | |
|
Christopher Olson, 43,
Vice President | | | 2001 | | | Analyst and portfolio manager, CWAM since January 2001; Vice President, Columbia Acorn Trust. | | | 10 | | | None | |
|
Robert Scales, 55,
Chief Compliance Officer,
Chief Legal Officer,
Senior Vice President and General Counsel | | | 2004 | | | Chief Compliance Officer, Senior Vice President, Chief Legal Officer and General Counsel, Columbia Acorn Trust since 2004; prior thereto, Associate General Counsel, Grant Thornton LLP. | | | 10 | | | None | |
|
Linda Roth-Wiszowaty, 38,
Assistant Secretary | | | 2006 | | | Business support analyst, CWAM, since April 2007; Assistant Secretary, Columbia Acorn Trust; executive administrator, CWAM since April 2004; prior thereto, executive assistant to the Chief Operating Officer, CWAM. | | | 10 | | | None | |
|
(1) Effective January 1, 2008, Trustee is no longer treated as an "interested person," as defined in the Investment Company Act of 1940, as amended (the "1940 Act"). Prior to January 1, 2008, Trustee was considered an "interested person" of the Trust and of CWAM, as defined in the 1940 Act, as a result of her previous affiliation with J.P. Morgan Chase & Co. Incorporated, a registered broker-dealer that may execute portfolio transactions for or engage in principal transactions with the Funds or other clients or funds advised by CWAM or its affiliates.
(2) Trustee who is an "interested person" of the Trust and of CWAM, as defined in the 1940 Act, because he is an officer of the Trust and of CWAM.
(3) Trustee who is treated as an "interested person" of the Trust and of CWAM, as defined in the 1940 Act, because he is a former officer of the Trust and former employee of and consultant to CWAM.
26
Wanger International Select 2007 Annual Report

Wanger Advisors Trust
Transfer Agent,
Dividend Disbursing Agent
Columbia Management Services, Inc.
P.O. Box 8081
Boston, Massachusetts
02266-8081
Distributor
Columbia Management Distributors, Inc.
One Financial Center
Boston, Massachusetts
02111-2621
Investment Adviser
Columbia Wanger Asset Management, L.P.
227 West Monroe Street, Suite 3000
Chicago, Illinois 60606
1-888-4-WANGER
(1-888-492-6437)
Legal Counsel
Bell, Boyd & Lloyd LLP
Chicago, Illinois
Independent Registered
Public Accounting Firm
PricewaterhouseCoopers LLP
Chicago, Illinois
This report, including the schedules of investments and financial statements, is submitted for the general information of the shareholders of the Wanger Advisors Trust.
A description of the Fund's proxy voting policies and procedures and a copy of the Fund's voting record for the most recent 12-month period ended June 30 are available (i) on the Securities and Exchange Commission's website at www.sec.gov, and (ii) without charge, upon request, by calling 1-888-492-6437.
The Fund files a complete schedule of portfolio holdings with the SEC for the first and third quarters of each fiscal year on Form N-Q. The Fund's Form N-Q is available on the SEC's website at www.sec.gov and may be reviewed and copied at the SEC's Public Reference Room in Washington, D.C. Information on the operation of the Pubic Reference Room may be obtained by calling 1-800-SEC-0330.
27
Wanger Advisors Trust
SHC-43/149206-1207 08/51331
Wanger International Small Cap
2007 Annual Report

| NOT FDIC INSURED | | May Lose Value | |
|
| NOT BANK ISSUED | | No Bank Guarantee | |
|

Wanger International Small Cap
2007 Annual Report
| | | Table of Contents | |
| | 1 | | | Understanding Your Expenses | |
|
| | 2 | | | Ponzi Schemes and Politicians' Dreams | |
|
| | 4 | | | Performance Review | |
|
| | 6 | | | Statement of Investments | |
|
| | 14 | | | Statement of Assets and Liabilities | |
|
| | 14 | | | Statement of Operations | |
|
| | 15 | | | Statement of Changes in Net Assets | |
|
| | 16 | | | Financial Highlights | |
|
| | 17 | | | Notes to Financial Statements | |
|
| | 20 | | | Report of Independent Registered Public Accounting Firm | |
|
| | 21 | | | Federal Income Tax Information | |
|
| | 22 | | | Management Fee Evaluation of the Senior Officer | |
|
| | 26 | | | Board Approval of the Advisory Agreement | |
|
| | 28 | | | Board of Trustees & Management of Wanger Advisors Trust | |
|
Columbia Wanger Asset Management, L.P. ("CWAM") is one of the leading global small- and mid-cap equity managers in the United States with more than 37 years of small- and mid-cap investment experience. As of December 31, 2007, CWAM manages $36.8 billion in assets and is the investment adviser to Wanger U.S. Smaller Companies, Wanger International Small Cap, Wanger Select, Wanger International Select (together, the Wanger Advisors Trust Funds") and the Columbia Acorn Family of Funds. Columbia Management Group, LLC ("Columbia Management") is the investment management division of Bank of America Corporation. Columbia Management entities furnish investment management services and products for institutional and individual investors. The Wanger Advisor Trust Funds and the Columbia Acorn Family of Funds (together with other funds advised by Columbia Management Affiliates, the "Columbia Funds") are distributed by Columbia Management Distributors, Inc., member of FINRA, SIPC, part of Columbia Management and an affiliate of Bank of America Corporation. CWAM is an SEC-registered investment adviser and indirect, wholly owned subsidiary of Bank of America Corporation. CWAM is part of Columbia Management.
Please consider the investment objectives, risks, charges and expenses for the Fund carefully before investing. Contact 1-888-4-WANGER for a prospectus, which contains this and other important information about the Fund. You should read it carefully before you invest.
The views expressed in "Ponzi Schemes & Politicians' Dreams" and in the Performance Review reflect the current views of the respective parties. These views are not guarantees of future performance and involve certain risks, uncertainties and assumptions that are difficult to predict so actual outcomes and results may differ significantly from the views expressed. These views are subject to change at any time based upon economic, market or other conditions and the respective parties disclaim any responsibility to update such views. These views may not be relied on as investment advice and, because investment decisions for a Columbia Fund are based on numerous factors, may not be relied on as an indication of trading intent on behalf of any particular Columbia Fund. References to specific company securities should not be construed as a recommendation or investment advice.
Wanger International Small Cap 2007 Annual Report
Understanding Your Expenses
As a Fund shareholder, you incur two types of costs. There are transaction costs, which generally include sales charges on purchases and may include redemption or exchange fees. There are also ongoing costs, which generally include investment advisory fees and other Fund expenses. The information on this page is intended to help you understand your ongoing costs of investing in the Fund and to compare these costs with the ongoing costs of investing in other mutual funds.
Analyzing your Fund's expenses
To illustrate these ongoing costs, we have provided an example and calculated the expenses paid by investors in the Fund during the period. The information in the following table is based on an initial, hypothetical investment of $1,000, which is invested at the beginning of the period and held for the entire period. Expense information is calculated two ways and each method provides you with different information. The amount listed in the "Actual" column is calculated using actual operating expenses and total return for the Fund. The amount listed in the "Hypothetical" column assumes that the return each year is 5% before expenses and then applies the Fund's actual expense ratio for the period to the hypothetical return. You should not use the hypothetical account values and expenses to estimate either your actual account balance at the end of the period or the expenses you paid during the period. See the "Compare with other fu nds" information for details on using the hypothetical data.
Estimating your actual expenses
To estimate the expenses that you actually paid over the period, first you will need your account balance at the end of the period.
1. Divide your ending account balance by $1,000. For example, if an account balance was $8,600 at the end of the period, the result would be 8.6.
2. In the section of the table below titled "Expenses paid during the period," you will find a dollar amount in the column labeled "Actual." Multiply this amount by the result from step 1. Your answer is an estimate of the expenses you paid on your account during the period.
July 1, 2007 – December 31, 2007
| | | Account value at the
beginning of the period ($) | | Account value at the
end of the period ($) | | Expenses paid during
period ($) | | Fund's annualized
expense ratio (%)* | |
| | | Actual | | Hypothetical | | Actual | | Hypothetical | | Actual | | Hypothetical | | Actual | |
| Wanger International Small Cap | | | 1,000.00 | | | | 1,000.00 | | | | 1,017.09 | | | | 1,020.21 | | | | 5.03 | | | | 5.04 | | | | 0.99 | | |
*For the six months ended December 31, 2007.
Expenses paid during the period are equal to the Fund's annualized expense ratio, multiplied by the average account value over the period, then multiplied by the number of days in the Fund's most recent fiscal half-year and divided by 365.
It is important to note that the expense amounts shown in the table are meant to highlight only ongoing costs of investing in the Fund. Expenses paid during the period do not include any insurance charges imposed by your insurance company's separate account. The hypothetical example provided is useful in comparing ongoing costs only and will not help you determine the relative total costs of owning different funds whose shareholders may incur transaction costs.
Compare with other funds
Since all mutual funds are required to include the same hypothetical calculations about expenses in shareholder reports, you can use this information to compare the ongoing cost of investing in the Fund with other funds. To do so, compare the 5% hypothetical example with the 5% hypothetical examples of other funds. As you compare hypothetical examples of other funds, it is important to note that hypothetical examples are meant to highlight the ongoing cost of investing in a fund and do not reflect any transaction costs, such as sales charges, redemption fees or exchange fees that may be incurred by shareholders of other funds. Expenses paid during the period do not include any insurance charges imposed by your insurance company's separate accounts.
1
Wanger International Small Cap 2007 Annual Report

Ponzi Schemes and Politicians' Dreams
Each December I attend The University of Chicago Business Forecast luncheon. Typically the event features economic forecasts by two economists, plus a summary of world political and economic issues provided by Professor Marvin Zonis.1 At this year's luncheon Professor Zonis stated that the U.S. Government had $50 trillion of unfunded liabilities. That's a staggering figure! Could it really be correct?
"Trust Me" Trust Funds
I've found that there is no precise U.S. Government unfunded liability number, though there are estimates. The U.S. Government Accountability Office (GAO) notes material weaknesses in federal government accounting in general, but has expressed an unqualified opinion on its 2007 Statement of Social Insurance. Any calculation of unfunded liabilities requires numerous actuarial assumptions plus a time horizon. The calculations by various government agencies cover liabilities for 75 years into the future.
However, it does appear that Professor Zonis' $50 trillion estimate was wrong. That number is now too low. On December 17, 2007, the GAO estimated that the U.S. Government's total reported liabilities, net social insurance commitments, and other fiscal exposures were approximately $53 trillion.2 With apologies to the late Senator Everett Dirksen (Republican: Illinois), it seems that a trillion here and a trillion there adds up.3
Despite well-publicized concerns about Social Security, Medicare is in worse shape. Created in the 1930s, Social Security seems to have been a warm-up for bigger unfunded liabilities later on. Social Security is better funded, as Social Security tax rates are higher than Medicare tax rates. Medicare was signed into law in 1965 and spending for the program quickly ran out of control. The original cost estimate for Medicare hospital insurance in 1990, for example, was $9 billion; the actual cost that year hit $67 billion!4 According to the GAO, Medicare alone has over $36 trillion of unfunded liabilities.
But what of the Social Security and Medicare Trust Funds, the Funds that politicians promised to put in a "lock box?" It turns out the politicians spent the money elsewhere and the Trust Funds loaned their money to the U.S. Treasury by buying government bonds. The Trust Funds have no true third-party assets, but simply have promises from the U.S. Treasury to pay in the future. In order for the payments to be made the Treasury will have to raise taxes, cut other spending, borrow or print money.
What was the latest change that politicians made concerning unfunded liabilities? They increased them, by adding prescription drugs to Medicare's benefits. This addition is noteworthy for three reasons. First, little new funding was created; enrollee premiums cover only about 25% of costs. Second, the program's costs and benefits are highly skewed. Baby boomers will have a net benefit of about $20,000 each while younger workers and future generations will have net costs of between $2,500 and $4,200 each.5 Third, when the new benefits were fully implemented in 2006, they drove a 19% increase in Medicare costs, the largest increase in decades. Over $10 trillion of Medicare's unfunded liability is from the drug program.
What are this year's presidential candidates saying about the unfunded liability problem? Virtually nothing and, even though taxpayers cannot afford Social Security, Medicare and other existing programs, some candidates are touting new proposals that substantially broaden federal health care spending. These plans include additional entitlements and mandatory, subsidized, health insurance participation. Cost estimates are dubious but range from $50 to $120 billion yearly.
Given the huge existing liabilities and proposals for additional benefits it appears that the U.S. Government is operating an enormous Ponzi Scheme.6 Initial participants benefit but most taxpayers are likely to lose.
Large Liabilities and Possible Solutions
$53 trillion is a huge number, nearly four times all the goods and services produced in the United States in 2007. Currently Social Security is running a yearly surplus while Medicare is running a deficit. But the aging of baby boomers is driving yearly Medicare and Social Security spending higher, so the programs' cash needs will become very large in the next decade. Medicare deficits are projected to consume 25% of all federal income taxes by 2020. By 2050, Social Security, Medicare, and Medicaid will grow from 9% to 18% of GDP. This contrasts to total federal spending averaging about 20% of GDP over the last 50 years.7
Some of the richest people in America say their taxes are too low. What if they were taxed at 100%? Not 100% of income but 100% of their net worth! This "Che Guevara lite" (confiscation without murder) solution, if applied to the 2007 Forbes list of the richest 400 Americans, would yield a one-time receipt of $1.54 trillion. That would cover 2.9% of the problem, but is of course not a real solution as it would destroy capitalism.
How about raising tax rates on all of us? The Laffer Curve8 exists—there is an income tax rate that will yield the highest dollar amount of taxes, and that rate appears to be well under 100%. Even famed British economist John Maynard Keynes said that reducing too-high tax rates results in higher tax revenues. Very high tax rates choke economic activity and spur taxpayers to take legal and illegal measures to reduce payments.
2
Wanger International Small Cap 2007 Annual Report
Since federal income taxes began in 1913, there have been three rounds of major income tax rate cuts in the United States, and each resulted in faster economic growth and, ultimately, higher taxes collected. Paradoxically, though the rate cuts provided those with higher incomes the largest benefits, higher income people ended up paying greater percentages of total tax collections. A number of countries, including former Soviet republics, have adopted low, flat income tax rates and have seen economic growth surge and tax receipts increase.
No one knows what income tax rates create the highest tax revenues over the long run. In the last 50 years, the highest marginal tax rates in the United States have varied from a pre-Kennedy rate cut peak of 91% to a post-Reagan rate cut trough of 28%. Surprisingly, total federal government revenues as a percentage of GDP during that period have varied modestly, from 16.1% to 20.9%. Fiscal 2007 revenues were a bit above the midpoint, at 18.8% of GDP.9
While somewhat higher tax rates would probably increase near-term tax revenues, it is unlikely that substantially higher income tax rates alone can boost government receipts to the 30% or so of GDP eventually needed to fully fund the promised benefits. Massive value added taxes or sales taxes would likely be needed to provide tax revenue percentages that high. But huge tax hikes of any sort are likely to hurt economic growth, and additional solutions are needed.
As substantial liabilities become due in the next decade, there is an increased likelihood that voters will elect more courageous politicians that will strive to control spending and enact needed reforms. Perhaps the best single reform would be to restore more free market elements to our health care system. There needs to be more price transparency plus incentives for individuals and health care providers to control spending. Streamlined drug approval processes and additional tort reform would also help.
Incentives for innovation, rather than arbitrary price controls, are crucial. Improved technology has enabled over a 99.99% reduction in the cost of genome mapping in the last seven years. As costs continue to drop and advances continue to be made in biotechnology and pharmaceuticals, new ways to diagnose, treat and cure diseases are likely. Treatments customized to genetic factors promise to be much more effective and result in fewer side effects than many current drugs. The Wanger Funds have begun to own stocks in companies that are pursuing genetic tests, novel drugs and devices, plus information technology for better managing health care administration.
Outside the health care sector, Professor Jeremy Siegel has suggested that a solution for America's savings and retirement crisis will be sales of American assets to foreigners, especially those from countries with higher savings rates and younger populations. Innovative small- and mid-cap companies appear particularly attractive to foreigners, especially now that the dollar has weakened.


Charles P. McQuaid
President and Chief Investment Officer
Columbia Wanger Asset Management, L.P.
Opinions expressed in this essay are those of the author and are not necessarily those of Columbia Wanger Asset Management, its parent organizations or the Board.
1 Marvin Zonis is a professor emeritus at the Graduate School of Business at The University of Chicago, where he teaches courses on International Political Economy, Leadership and Business Strategy in the Era of E-Commerce.
2 Estimates by the Congressional Budget Office, Medicare trustees, and some private sources are higher.
3 Dirksen has been quoted as saying, "A billion here and a billion there, and pretty soon you're talking real money," but the Dirksen Congressional Center has been unable to verify the statement.
4 Source: American Enterprise Institute for Public Policy Research website, www.aei.org, "Medicare Prescription Drugs: Medical Necessity Meets Fiscal Insanity," by Joseph Antos and Jagadeesh Gokhale. Posted February 17, 2005.
5 Ibid.
6 In the 1920's, Charles Ponzi enticed investors with a bogus investment opportunity that promised a 40% return on their investment in just 90 days. Early investors were paid with dollars from later investors but most lost their money. Ponzi served four years in prison for this fraud, and then proceeded to promote other dubious ventures. He died in a charity ward of a Rio de Janeiro hospital in 1949.
7 Included in testimony on the future of Social Security presented by the Concord Coalition (www.concordcoalition.org) to a Senate special committee on aging, February 3, 2005.
8 The Laffer Curve is used to illustrate the concept of taxable income elasticity, the idea that government can maximize tax revenue by setting tax rates at an optimum point and that neither a 0% tax rate nor a 100% tax rate will generate government revenue. The curve was popularized by U.S. economics professor Arthur Laffer (b. 1940).
9 Congressional Budget Office testimony, "The Long-term Budget Outlook," December 13, 2007.
3
Wanger International Small Cap 2007 Annual Report

Performance Review Wanger International Small Cap
 | |  | |
|
Louis J. Mendes III
Co-Portfolio Manager | | Christopher J. Olson
Co-Portfolio Manager | |
|
Performance data quoted represents past performance and current performance may be lower or higher. Past performance is no guarantee of future results. The investment return and principal value of an investment in the Fund will fluctuate so that shares, when redeemed, may be worth more or less than the original cost. For daily and most recent month-end performance updates, please call 1-888-4-WANGER.
Wanger International Small Cap gained 16.31% in 2007, 3.94% ahead of the S&P Citigroup EMI Global ex-US Index ("EMI") and 5.14% ahead of the large-cap MSCI EAFE Index ("EAFE"). The Fund's results for the year were driven most notably by strong underlying performance in continental Europe and in the emerging markets, which more than offset declining markets in Japan and the United Kingdom. On a sector basis, energy and financial stocks all posted strong absolute and relative performance in the Fund. Finally, the weak performance of the U.S. dollar translated into a net gain of 6.7% for our shareholders.
For the eighth consecutive year, international small-cap stocks, as measured by the EMI Index, have outperformed international large-cap stocks, as measured by the EAFE Index. Strong underlying growth in China, India and several other large emerging economies drove global demand for energy, raw materials and industrial goods for yet another year. Many of the Fund's industrial exporters reported record profitability as pricing power and capacity utilization remained high. For example, Sung Kwang Bend and Taewoong, two Korean industrial companies involved in global energy infrastructure projects, rose 273% and 172%, respectively. Export activity kept Asian and European ports busy: Smit Internationale, a Dutch operator of tugboats and salvage vessels, rose 98% on strong demand for its services as seaborne trade continues to grow at a considerably higher rate than global GDP.
During the year, the only significant change in average regional exposure within the portfolio was an increase in Asia ex-Japan investments from 7% to 13% of the Fund's equity, funded primarily by a reduction in the United Kingdom and Ireland from 20% to 13%. This reallocation of assets had a favorable impact on the Fund: Our UK/Ireland positions averaged a mid-single digit negative return while those in Asia ex-Japan returned over 60%, representing both the best and worst performing regional returns. This can be explained in large part by the subprime crisis in the United Kingdom, which had broad repercussions across the market. While in Asia ex-Japan, robust economic development drove high volumes on the companies that operate the regional equity and derivative exchanges, in which the Fund held sizable positions. Hong Kong Exchanges and Clearing and Singapore Exchange appreciated more than 160% and 152%, respectively, in the y ear.
At the sector level, the Fund's ongoing overweight in energy services companies was helpful. Energy prices remained near record levels, underpinning solid earnings growth in oil services companies, as they expand to meet growing demand from the large oil conglomerates. The Fund's energy stocks, representing 7.8% of equity, generated over a 48% return to shareholders. Outstanding stocks included Atwood Oceanics, a provider of offshore drilling rigs, which increased more than 104% in 2007.
As we look ahead to 2008, the impact of the continuing crisis in subprime mortgages in the United States and United Kingdom on global markets remains a looming concern. While many portfolio companies continue to report excellent business fundamentals, as we write this in mid-January the markets appear to be taking into consideration the distinct possibility of a U.S. and European recession. We expect volatility to remain high. As long-term, fundamental investors, we will work to take advantage of the pricing anomalies this will likely create.
International investments involve greater potential risks, including less or different regulation, currency fluctuations, economic instability and political developments. Investments in small- and mid-cap companies may be subject to greater volatility and price fluctuations because they may be thinly traded and less liquid. Investing in emerging markets may involve great risks than investing in more developed countries.
Fund's Positions in Mentioned Holdings
As a % of net assets, as of 12/31/07
| Smit Internationale | | | 1.3 | % | |
| Atwood Oceanics | | | 1.2 | | |
| Singapore Exchange | | | 1.2 | | |
| Hong Kong Exchanges and Clearing | | | 1.0 | | |
| Sung Kwang Bend | | | 0.6 | | |
| Taewoong | | | 0.5 | | |
Portfolio holdings are subject to change periodically and may not be representative of current characteristics and holdings.
4
Wanger International Small Cap 2007 Annual Report
Growth of a $10,000 Investment in
Wanger International Small Cap
Total return for each period,
May 3, 1995 (inception date) through December 31, 2007
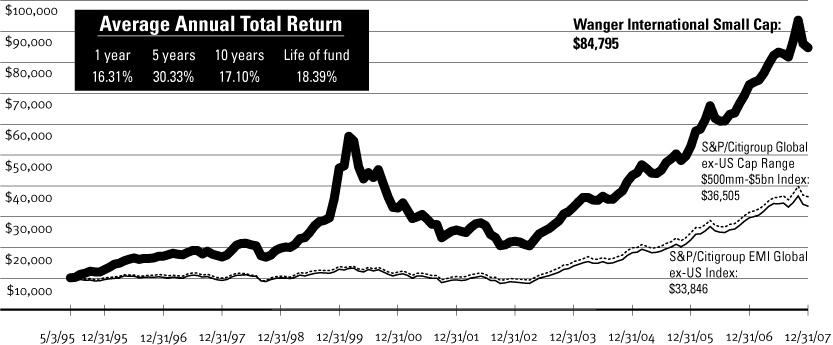
This graph compares the results of $10,000 invested in Wanger International Small Cap on May 3, 1995 (the date the Fund began operations) through December 31, 2007, to the S&P/Citigroup EMI Global ex-US Index and the S&P/Citigroup Global ex-US Cap Range $500mm-$5bn Index, with dividends and capital gains reinvested. Performance shown here is past performance, which cannot guarantee future results. Current performance may be higher or lower. The investment return and principal value of an investment in the Fund will fluctuate so that Fund shares, when redeemed, may be worth more or less than their original cost. Performance changes over time. Current returns for the Fund may be different than that shown. For daily and most recent month-end performance updates, please contact us at 1-888-4-WANGER.
Results to December 31, 2007
| | | 4th quarter | | 1 year | |
Wanger International
Small Cap | | | -2.44 | % | | | 16.31 | % | |
| S&P/Citigroup EMI Global ex-US Index | | | -3.36 | | | | 12.37 | | |
S&P/Citigroup Global ex-US Cap Range
$500mm-$5bn Index | | | -2.73 | | | | 15.98 | | |
| MSCI EAFE Index | | | -1.75 | | | | 11.17 | | |
NAV as of 12/31/07: $44.04
Performance numbers reflect all Fund expenses but do not include any insurance charge imposed by your insurance company's separate accounts. If performance included the effect of these additional charges, it would be lower.
The Fund's annual operating expense ratio is 1.00%. The annual operating expense ratio is as stated in the Fund's prospectus that is current as of the date of this report. Differences in expense ratios disclosed elsewhere in this report may result from including fee waivers and reimbursements as well as different time periods used in calculating the ratios.
All results shown assume reinvestment of distributions and do not reflect taxes that a shareholder would pay on Fund distributions or the sale of Fund shares.
The S&P/Citigroup EMI Global ex-US Index is an unmanaged index consisting of the bottom 20% of institutionally investable capital of developed and emerging countries, outside the United States. The S&P/Citigroup Global ex-US Cap Range $500mm-$5bn Index is a subset of the broad market selected by the index sponsor representing the mid- and small-cap developed and emerging markets, excluding the United States. The Morgan Stanley Capital International Europe, Australia, Far East (MSCI EAFE) Index is a capitalization-weighted index that tracks the total return of common stocks in 21 developed-market countries within Europe, Australia and the Far East. Indexes are not managed and do not incur fees or expenses. It is not possible to invest directly in an index.
Portfolio characteristics and holdings are subject to change periodically and may not be representative of current characteristics and holdings.
Top 5 Countries
As a % of net assets, as of 12/31/07
| Japan | | | 14.1 | % | |
| France | | | 8.6 | | |
| Netherlands | | | 8.1 | | |
| United Kingdom | | | 6.7 | | |
| Germany | | | 5.9 | | |
Top 10 Holdings
As a % of net assets, as of 12/31/07
1. Fugro (Netherlands)
Oilfield Services | | 2.0%
| |
2. Suzano (Brazil)
Brazilian Pulp & Paper Producer | | 1.7
| |
3. SES Global (France)
Satellite Broadcasting Services | | 1.4
| |
4. Hexagon (Sweden)
Measurement Equipment & Polymers | | 1.4
| |
5. ShawCor (Canada)
Oil & Gas Pipeline Products | | 1.3
| |
6. Smit Internationale (Netherlands)
Harbor & Offshore Towage & Marine Services | | 1.3
| |
7. Housing Development Finance (India)
Indian Mortgage Lender | | 1.3
| |
8. Singapore Exchange (Singapore)
Singapore Equity & Derivatives Market Operator | | 1.2
| |
9. Atwood Oceanics (United States)
Offshore Drilling Contractor | | 1.2
| |
10. SWECO (Sweden)
Engineering Consultants | | 1.2
| |
5
Wanger International Small Cap 2007 Annual Report
Wanger International Small Cap
Statement of Investments December 31, 2007
Number of
Shares | | | | Value | |
| | | | | Common Stocks – 96.0% | | | | | |
| | | Europe – 49.5% | |
| | | France – 8.6% | |
| | 900,000 | | | SES Global
Satellite Broadcasting Services | | $ | 23,599,759 | | |
| | 150,000 | | | Iliad
Alternative Internet & Telecoms Provider | | | 16,025,207
| | |
| | 169,000 | | | Carbone Lorraine
Advanced Industrial Materials | | | 11,645,164
| | |
| | 113,000 | | | Rubis
Tank Storage & LPG Supplier | | | 11,025,614
| | |
| | 90,000 | | | Norbert Dentressangle
Transport | | | 9,397,775
| | |
| | 80,000 | | | Eurofins Scientific
Food Screening & Testing | | | 9,270,763
| | |
| | 196,002 | | | Trigano
Leisure Vehicles & Camping Equipment | | | 8,465,005
| | |
| | 80,000 | | | Neopost
Postage Meter Machines | | | 8,214,733
| | |
| | 66,000 | | | Sperian Protection
Safety Equipment | | | 7,506,388
| | |
| | 211,000 | | | Legrand
Electrical Components | | | 7,166,882
| | |
| | 106,000 | | | April Group
Insurance Policy Construction | | | 7,115,749
| | |
| | 46,000 | | | Pierre & Vacances
Vacation Apartment Lets | | | 6,355,211
| | |
| | 72,000 | | | Imerys
Industrial Minerals Producer | | | 5,895,943
| | |
| | 120,000 | | | Meetic (a)
Dating Services | | | 5,240,354
| | |
| | 30,000 | | | Ciments Francais
Leading French & Emerging Markets Cement Producer | | | 5,136,210
| | |
| | 330,000 | | | Hi-Media
Leading Online Advertiser in Europe | | | 2,904,813
| | |
| | | | | | | | 144,965,570 | | |
| | | Netherlands – 8.4% | |
| | 447,692 | | | Fugro
Oilfield Services | | | 34,316,117
| | |
| | 215,600 | | | Smit Internationale
Harbor & Offshore Towage & Marine Services | | | 21,953,216
| | |
| | 608,450 | | | Aalberts Industries
Flow Control & Heat Treatment | | | 11,992,718
| | |
Number of
Shares | | | | Value | |
| | 410,000 | | | Unit 4 Agresso | | $ | 11,647,198 | | |
| | | | | Business & Security Software | | | | | |
| | 456,000 | | | Imtech
Engineering & Technical Services | | | 11,207,211
| | |
| | 350,000 | | | Koninklijke TenCate
Advanced Textiles & Industrial Fabrics | | | 10,818,775
| | |
| | 127,661 | | | Boskalis Westminster
Dredging & Maritime Contractor | | | 7,755,240
| | |
| | 125,000 | | | Vopak
World's Largest Operator of Petroleum &
Chemical Storage Terminals | | | 7,070,572
| | |
| | 248,000 | | | OPG Groep
Health Care Supplies & Pharmacies | | | 6,851,986
| | |
| | 443,500 | | | Wavin
Largest European Plastic Pipe Systems Company | | | 5,866,406
| | |
| | 250,000 | | | QIAGEN (a)
Life Science Company; DNA/RNA Purification | | | 5,369,119
| | |
| | 150,000 | | | SBM Offshore
Builds & Leases Offshore Vessels to
Process & Store Crude Oil | | | 4,705,039
| | |
| | 126,886 | | | USG People
Temporary Staffing Services | | | 3,401,311
| | |
| | | | | | | | 142,954,908 | | |
| | | United Kingdom – 6.7% | |
| | 2,300,000 | | | Charles Taylor (b)
Insurance Services | | | 15,402,758
| | |
| | 618,214 | | | Expro International Group
Offshore Oilfield Services | | | 12,609,698
| | |
| | 750,000 | | | Northgate
Light Commercial Vehicle Rental Specialist | | | 11,402,638
| | |
| | 910,000 | | | Smith & Nephew
Medical Equipment & Supplies | | | 10,462,240
| | |
| | 450,000 | | | Intertek Testing
Testing, Inspection, Certification Services | | | 8,822,667
| | |
| | 2,000,000 | | | Taylor Nelson Sofres
Market Research | | | 8,195,489
| | |
| | 1,260,000 | | | RPS Group
Environmental Consulting & Planning | | | 7,984,726
| | |
| | 215,000 | | | Randgold Resources
Gold Mining in Western Africa | | | 7,982,950
| | |
| | 850,000 | | | Informa Group
Global Publisher & Event Organizer | | | 7,774,989
| | |
See accompanying notes to financial statements.
6
Wanger International Small Cap 2007 Annual Report
Wanger International Small Cap
Statement of Investments December 31, 2007
Number of
Shares | | | | Value | |
| | | United Kingdom – 6.7% (cont) | |
| | 518,182 | | | Tullow Oil
Oil & Gas Producer | | $ | 6,685,926 | | |
| | 300,600 | | | Rotork
Valve Actuators for Oil & Water Pipelines | | | 5,753,137
| | |
| | 2,000,000 | | | Begbies Traynor
Financial Restructuring & Corporate Recovery Services | | | 4,010,837
| | |
| | 800,000 | | | Detica
UK IT Services Company | | | 3,488,561
| | |
| | 205,000 | | | Keller Group
International Ground Engineering Specialist | | | 2,682,154
| | |
| | | | | | | | 113,258,770 | | |
| | | Germany – 5.9% | |
| | 142,000 | | | Wincor Nixdorf
Retail POS Systems & ATM Machines | | | 13,381,868
| | |
| | 91,000 | | | Elringklinger
Automobile Components | | | 11,308,857
| | |
| | 114,000 | | | MPC Muechmeyer Petersen Capital
Alternative Asset Manager | | | 10,119,586
| | |
| | 85,000 | | | Vossloh
Rail Infrastructure & Diesel Locomotives | | | 9,939,159
| | |
| | 300,000 | | | Rhoen-Klinikum
Health Care Services | | | 9,382,653
| | |
| | 235,000 | | | CTS Eventim
Event Ticket Sales | | | 9,032,352
| | |
| | 42,000 | | | Rational
Commercial Oven Manufacturer | | | 8,592,575
| | |
| | 80,000 | | | Hamburger Hafen und Logistik (a)
Terminal Operator at the Hamburg Port | | | 7,134,805
| | |
| | 205,000 | | | Deutsche Beteiligungs
Private Equity Investment Management | | | 6,412,135
| | |
| | 154,000 | | | GFK
Market Research Services | | | 6,167,660
| | |
| | 255,000 | | | Takkt
Mail Order Retailer of Office & Warehouse Durables | | | 4,431,995
| | |
| | 2,100 | | | Porsche
Specialty Automobile Manufacturer | | | 4,231,911
| | |
| | | | | | | | 100,135,556 | | |
| | | Switzerland – 5.0% | |
| | 180,000 | | | Kuehne & Nagel
Freight Forwarding/Logistics | | | 17,160,956
| | |
Number of
Shares | | | | Value | |
| | 7,000 | | | Sika | | $ | 13,158,288 | | |
| | | | | Chemicals for Construction & Industrial Applications | | | | | |
| | 40,500 | | | Burckhardt Compression
Gas Compression Pumps | | | 13,088,179
| | |
| | 85,000 | | | Synthes
Products for Orthopedic Surgery | | | 10,506,451
| | |
| | 74,000 | | | Geberit
Plumbing Supplies | | | 10,088,727
| | |
| | 32,000 | | | Nobel Biocare Holding
Dental Implants & Ceramic Crowns | | | 8,465,199
| | |
| | 8,000 | | | Givaudan
Fragrances & Flavors | | | 7,686,383
| | |
| | 130,000 | | | Logitech International (a)
Branded Peripheral Computer Devices | | | 4,720,053
| | |
| | | | | | | | 84,874,236 | | |
| | | Sweden – 3.2% | |
| | 1,125,000 | | | Hexagon
Measurement Equipment & Polymers | | | 23,199,218
| | |
| | 1,974,000 | | | SWECO
Engineering Consultants | | | 19,745,827
| | |
| | 3,030,000 | | | Securitas Systems
Commercial Security Installation & Service | | | 10,689,833
| | |
| | | | | | | | 53,634,878 | | |
| | | Ireland – 2.5% | |
| | 2,685,000 | | | United Drug
Irish Pharmaceutical Wholesaler & Outsourcer | | | 15,482,959
| | |
| | 600,000 | | | IAWS Group
Baked Goods | | | 13,281,251
| | |
| | 200,000 | | | Paddy Power
Irish Betting Services | | | 6,579,531
| | |
| | 240,000 | | | Kingspan Group
Building Insulation & Environmental Containers | | | 3,617,057
| | |
| | 349,900 | | | Grafton Group (a)
Builders Materials Wholesaling & Do-it-yourself Retailing | | | 2,749,806
| | |
| | | | | | | | 41,710,604 | | |
| | | Italy – 1.4% | |
| | 2,742,000 | | | CIR
Italian Holding Company | | | 10,072,972
| | |
| | 573,000 | | | GranitiFiandre
Innovative Stoneware | | | 7,287,872
| | |
See accompanying notes to financial statements.
7
Wanger International Small Cap 2007 Annual Report
Wanger International Small Cap
Statement of Investments December 31, 2007
Number of
Shares | | | | Value | |
| | | Italy – 1.4% (cont) | |
| | 1,100,000 | | | Amplifon
Hearing Aid Retailer | | | $5,550,962
| | |
| | 170,000 | | | Cobra Automotive (a)
Electronic Car Theft Protection | | | 1,576,547
| | |
| | | | | | | | 24,488,353 | | |
| | | Austria – 1.2% | |
| | 332,000 | | | Zumtobel | | | 11,917,054 | | |
| | | | | Lighting Systems | | | | | |
| | 158,732 | | | Wienerberger | | | 8,768,358 | | |
| | | | | Bricks & Clay Roofing Tiles | | | | | |
| | | | | | | | 20,685,412 | | |
| | | Finland – 1.1% | |
| | 488,000 | | | Poyry | | | 12,257,572 | | |
| | | | | Engineering Consultants | | | | | |
| | 170,000 | | | Stockmann | | | 7,322,116 | | |
| | | | | Department Stores in Finland, Baltics & Russia | | | | | |
| | | | | | | | 19,579,688 | | |
| | | Spain – 1.1% | |
| | 120,000 | | | Red Electrica de Espana | | | 7,541,512 | | |
| | | | | Spanish Power Grid | | | | | |
| | 300,000 | | | Prisa | | | 5,577,994 | | |
| | | | | Leading Spanish-speaking Publisher | | | | | |
| | 130,000 | | | Sogecable (a) | | | 5,179,597 | | |
| | | | | Spain's Main Pay-TV | | | | | |
| | | | | | | | 18,299,103 | | |
| | | Greece – 1.1% | |
| | 910,000 | | | Intralot | | | 17,931,370 | | |
| | | | | Lottery & Gaming Systems & Services | | | | | |
| | | Denmark – 1.0% | |
| | 87,000 | | | Novozymes | | | 9,819,226 | | |
| | | | | Industrial Enzymes | | | | | |
| | 125,000 | | | Thrane & Thrane | | | 7,459,652 | | |
| | | | | Mobile Transceivers for Satellite Communications | | | | | |
| | | | | | | | 17,278,878 | | |
Number of
Shares | | | | Value | |
| | | Czech Republic – 0.8% | |
| | 56,000 | | | Komercni Banka | | $ | 13,474,853 | | |
| | | | | Leading Czech Universal Bank | | | | | |
| | | Poland – 0.7% | |
| | 205,000 | | | Central European Distribution (a) | | | 11,906,400 | | |
| | | | | Vodka Production & Alcohol Distribution | | | | | |
| | | Norway – 0.4% | |
| | 865,000 | | | Kongsberg Automotive | | | 6,355,471 | | |
| | | | | Automotive Seating & Component Supplier | | | | | |
| | | Russia – 0.4% | |
| | 150,000 | | | RosBusinessConsulting
Financial Information, Media & IT Services in Russia | | | 6,210,000
| | |
| | | | | Total Europe | | | 837,744,050 | | |
| | | Asia – 29.8% | |
| | | Japan – 14.1% | |
| | 215,000 | | | Ibiden
Electronic Parts & Ceramics | | | 14,850,394
| | |
| | 17,500 | | | Jupiter Telecommunications (a)
Largest Cable Service Provider in Japan | | | 14,804,069
| | |
| | 1,900,000 | | | Kansai Paint
Paint Producer in Japan, India, China & Southeast Asia | | | 13,781,712
| | |
| | 320,000 | | | Hoya
Opto-electrical Components & Eyeglass Lenses | | | 10,212,836
| | |
| | 450,000 | | | Ushio
Industrial Light Sources | | | 9,876,602
| | |
| | 430,000 | | | Yusen Air & Sea Service
Airfreight Logistics | | | 9,738,365
| | |
| | 1,250,000 | | | Park24
Parking Lot Operator | | | 9,626,133
| | |
| | 400,000 | | | As One
Scientific Supplies Distributor | | | 9,398,419
| | |
| | 250,000 | | | Kintetsu World Express
Airfreight Logistics | | | 8,650,929
| | |
| | 3,920 | | | Risa Partners
NPL & Real Estate Related Investment | | | 8,576,505
| | |
| | 5,200 | | | Kenedix
Real Estate Investment Management | | | 8,367,147
| | |
| | 265,000 | | | Aeon Mall
Suburban Shopping Mall Developer, Owner & Operator | | | 6,955,997
| | |
See accompanying notes to financial statements.
8
Wanger International Small Cap 2007 Annual Report
Wanger International Small Cap
Statement of Investments December 31, 2007
Number of
Shares | | | | Value | |
| | | Japan – 14.1% (cont) | |
| | 157,000 | | | SYSMEX
In Vitro Diagnostics (IVD) Equipment &
Reagent Manufacturer | | $ | 6,659,982 | | |
| | 125,000 | | | Unicharm PetCare
Pet Food & Pet Toiletries | | | 6,477,176
| | |
| | 540,000 | | | Casio Computer
Micro-consumer Electronic Goods | | | 6,284,790
| | |
| | 500,000 | | | Cosel
Industrial Standard Switching Power Supply System | | | 6,206,942
| | |
| | 182,000 | | | Union Tool
Precision Drill Bit Manufacturer | | | 6,019,878
| | |
| | 1,900,000 | | | Kansai Urban Banking
Regional Bank | | | 5,978,983
| | |
| | 540,000 | | | OSG
Consumable Cutting Tools | | | 5,907,050
| | |
| | 45,000 | | | Nakanishi
Dental Tools & Machinery | | | 5,816,407
| | |
| | 320,000 | | | FCC
Auto/Motorcycle Clutches | | | 5,693,707
| | |
| | 48,000 | | | Hirose Electric
Electrical Connectors | | | 5,561,089
| | |
| | 88,000 | | | USS
Used Car Auctioneer | | | 5,459,705
| | |
| | 325,000 | | | T. Hasegawa
Industrial Flavors & Fragrances | | | 5,099,373
| | |
| | 480,000 | | | Topcon
Positioning & Medical Instrument | | | 4,517,028
| | |
| | 750,000 | | | Bank of Fukuoka
Regional Bank | | | 4,473,282
| | |
| | 79,000 | | | Point
Apparel Specialty Retailer | | | 4,013,577
| | |
| | 130,000 | | | Takata
Safety Related Auto Parts | | | 3,775,157
| | |
| | 720 | | | Osaka Securities Exchange
Osaka Securities Exchange | | | 3,352,913
| | |
| | 222,000 | | | Ain Pharmaciez
Dispensing Pharmacy/Drugstore Operator | | | 3,221,036
| | |
| | 440,000 | | | Kamigumi
Port Cargo Handling & Logistics | | | 3,179,545
| | |
| | 151,000 | | | Ito En | | | 2,874,970 | | |
| | 64,800 | | | Ito En, Pfd.
Bottled Tea & Other Beverages | | | 924,088 | | |
Number of
Shares | | | | Value | |
| | 151,000 | | | Aeon Delight | | $ | 2,759,353 | | |
| | | | | Facility Maintenance & Management | | | | | |
| | 4,400 | | | FullCast
Employment Outsourcing | | | 2,574,754
| | |
| | 1,200 | | | Wacom
Computer Graphic Illustration Devices | | | 2,501,368
| | |
| | 550 | | | Japan Pure Chemical
Precious Metal Plating Chemicals for Electronics | | | 2,055,345
| | |
| | 900 | | | Message
Nursing Care Facility Operator | | | 1,752,047
| | |
| | 11,000 | | | Nagaileben
Medical/Health Care Related Clothes | | | 191,466
| | |
| | | | | | | | 238,170,119 | | |
| | | China – 5.2% | |
| | 6,129,000 | | | China Shipping Development
China's Dominant Shipper for Oil & Coal | | | 15,983,493
| | |
| | 16,141,000 | | | Lenovo Group
Third Largest PC Vendor Globally | | | 14,271,481
| | |
| | 9,334,000 | | | China Green
Agricultural Grower & Processor in China | | | 9,927,642
| | |
| | 8,278,000 | | | Jiangsu Expressway
Chinese Toll Road Operator | | | 8,933,098
| | |
| | 6,330,000 | | | Travelsky Technology
Online Air Travel Bookings in China | | | 6,670,284
| | |
| | 115,000 | | | Sohu.com (a)
Advertising on Chinese Internet Portal | | | 6,269,800
| | |
| | 2,710,000 | | | Fu Ji Food & Catering Services
Food Catering Service Provider in China | | | 6,215,487
| | |
| | 10,500,000 | | | Xinyu Hengdeli
A High-end Watch Retailer in China | | | 5,889,294
| | |
| | 6,512,000 | | | TPV Technology
Original Design Manufacturer for LCD Monitor & Flat TV | | | 4,705,187
| | |
| | 5,000,000 | | | Hopewell Highway Infrastructure
Guangdong Tollroad Leading to Hong Kong & Macau | | | 4,285,022
| | |
| | 8,900,000 | | | Sinotrans
Largest Integrated Logistics Player in China | | | 3,888,347
| | |
| | 185,500 | | | VisionChina Media (a)
Advertising on Digital Screens in China's Mass
Transit System | | | 1,576,750
| | |
| | | | | | | | 88,615,885 | | |
See accompanying notes to financial statements.
9
Wanger International Small Cap 2007 Annual Report
Wanger International Small Cap
Statement of Investments December 31, 2007
Number of
Shares | | | | Value | |
| | | South Korea – 3.1% | |
| | 51,909 | | | MegaStudy
Online Education Service Provider | | | $14,696,179
| | |
| | 342,000 | | | Woongjin Coway
South Korean Household Appliance Rental
Service Provider | | | 11,018,281
| | |
| | 332,800 | | | Sung Kwang Bend
A Large Customized Industrial Pipe Fitting Manufacturer | | | 9,551,459
| | |
| | 96,000 | | | Taewoong
A Player in the Niche Customized Forging Market | | | 9,010,682
| | |
| | 26,000 | | | Mirae Asset Securities
Korean Largest Diversified Financial Company | | | 4,687,409
| | |
| | 32,500 | | | JVM (a)
Automatic Tablet Dispensing & Packaging Systems | | | 1,954,999
| | |
| | 87,000 | | | YBM Sisa.com
Online Language Educator & Tester | | | 1,380,912
| | |
| | | | | | | | 52,299,921 | | |
| | | Hong Kong – 2.1% | |
| | 600,000 | | | Hong Kong Exchanges and Clearing
Hong Kong Equity & Derivatives Market Operator | | | 16,843,788
| | |
| | 3,770,000 | | | Lifestyle International
Mid to High-end Department Store Operator
in Hong Kong & China | | | 10,145,461
| | |
| | 200,000 | | | Hong Kong Aircraft Engineering
Aircraft Maintenence, Repair, Overhaul Operator | | | 5,395,199
| | |
| | 14,500,000 | | | Global Digital Creations (a)
Digital Cinema Solution Provider/Network Operator | | | 3,142,947
| | |
| | | | | | | | 35,527,395 | | |
| | | Singapore – 2.0% | |
| | 2,300,000 | | | Singapore Exchange
Singapore Equity & Derivatives Market Operator | | | 21,024,304
| | |
| | 6,000,000 | | | ComfortDelGro
Taxi & Mass Transit Service | | | 7,549,171
| | |
| | 3,000,000 | | | OLAM
Agriculture Supply Chain Manager | | | 5,897,523
| | |
| | | | | | | | 34,470,998 | | |
Number of
Shares | | | | Value | |
| | | India – 1.6% | |
| | 300,000 | | | Housing Development Finance
Indian Mortgage Lender | | | $21,525,285
| | |
| | 230,000 | | | Asian Paints
India's Largest Paint Company | | | 6,386,795
| | |
| | | | | | | | 27,912,080 | | |
| | | Taiwan – 1.2% | |
| | 1,933,177 | | | Everlight Electronics
Led Packager | | | 7,033,820
| | |
| | 582,695 | | | Formosa International Hotels
Hotel, Food & Beverage Operation & Hospitality
Management Services | | | 5,227,765
| | |
| | 2,199,138 | | | Wah Lee Industrial
Distributor of Chemicals, Materials & Equipment | | | 4,184,149
| | |
| | 430,000 | | | GeoVision
Taiwan PC-based Video Surveillance Player | | | 3,935,634
| | |
| | | | | | | | 20,381,368 | | |
| | | Indonesia – 0.5% | |
| | 5,000,000 | | | Perusahaan Gas Negara
Gas Pipeline Operator | | | 8,095,967
| | |
| | | | | Total Asia | | | 505,473,733 | | |
| | | Other Countries – 11.2% | |
| | | Australia – 3.1% | |
| | 250,000 | | | Australian Stock Exchange
Australian Equity & Derivatives Market Operator | | | 13,218,822
| | |
| | 900,000 | | | Billabong International
Action Sports Apparel Brand Manager | | | 11,694,675
| | |
| | 550,000 | | | Jubilee Mines
Nickel Mining in Australia | | | 10,931,047
| | |
| | 1,610,900 | | | Sino Gold (a)
Gold Mining in The People's Republic of China | | | 9,748,666
| | |
| | 125,000 | | | Perpetual Trustees
Mutual Fund Management | | | 7,279,235
| | |
| | | | | | | | 52,872,445 | | |
See accompanying notes to financial statements.
10
Wanger International Small Cap 2007 Annual Report
Wanger International Small Cap
Statement of Investments December 31, 2007
Number of
Shares | | | | Value | |
| | | South Africa – 3.0% | |
| | 484,000 | | | Impala Platinum Holdings
Platinum Group Metals Mining & Refining | | | $16,697,271
| | |
| | 1,575,000 | | | Uranium One (a)
Uranium Mines in South Africa, Kazakhstan,
Australia & the U.S. | | | 14,091,139
| | |
| | 518,000 | | | Naspers
Media & Education in Africa & other Emerging Markets | | | 12,193,227
| | |
| | 2,250,000 | | | Mr. Price
South African Retailer of Apparel, Household
Goods & Sporting Goods | | | 7,236,763
| | |
| | | | | | | | 50,218,400 | | |
| | | United States – 2.7% | |
| | 200,000 | | | Atwood Oceanics (a)
Offshore Drilling Contractor | | | 20,048,000
| | |
| | 125,800 | | | FMC Technologies (a)
Oil & Gas Wellhead Manufacturer | | | 7,132,860
| | |
| | 165,000 | | | Dresser-Rand Group (a)
Largest Manufacturer of Compressors | | | 6,443,250
| | |
| | 180,000 | | | BioMarin (a)
Biotech Focused on Orphan Diseases | | | 6,372,000
| | |
| | 122,900 | | | Tesco (a)
Developing New Well Drilling Technologies | | | 3,523,543
| | |
| | 303,000 | | | Decode Genetics (a)
Drugs for Heart Attack, Asthma & Vascular Disease | | | 1,115,040
| | |
| | | | | | | | 44,634,693 | | |
| | | Canada – 2.0% | |
| | 630,000 | | | ShawCor
Oil & Gas Pipeline Products | | | 22,558,590
| | |
| | 437,000 | | | RONA (a)
Leading Canadian Do-it-yourself Retailer | | | 7,549,369
| | |
| | 250,000 | | | Ivanhoe Mines (a)
Copper Mine Project in Mongolia | | | 2,735,701
| | |
| | 39,800 | | | CCL
Leading Global Label Manufacturer | | | 1,556,997
| | |
| | | | | | | | 34,400,657 | | |
Number of
Shares | | | | Value | |
| | | New Zealand – 0.4% | |
| | 2,157,385 | | | Sky City Entertainment
Casino/Entertainment Complex | | | $7,636,967
| | |
| | | | | Total Other Countries | | | 189,763,162 | | |
| | | Latin America – 5.5% | |
| | | Brazil – 4.1% | |
| | 1,780,000 | | | Suzano
Brazilian Pulp & Paper Producer | | | 28,831,945
| | |
| | 600,000 | | | Bovespa (a)
Brazil Equity & Derivative Exchange | | | 11,561,798
| | |
| | 800,000 | | | Localiza Rent A Car
Car Rental | | | 8,411,883
| | |
| | 217,000 | | | Porto Seguro
Auto & Life Insurance | | | 7,965,212
| | |
| | 500,000 | | | Natura Cosmeticos
Direct Retailer of Cosmetics | | | 4,731,558
| | |
| | 328,300 | | | BM&F (a)
Brazilian Derivatives Exchange | | | 4,610,955
| | |
| | 177,100 | | | Redecard
Credit/Debit Card Acquirer/Processor | | | 2,835,480
| | |
| | | | | | | | 68,948,831 | | |
| | | Mexico – 1.4% | |
| | 160,000 | | | Grupo Aeroportuario del Surest
Cancun & Cozumel Airport Operator | | | 9,795,200
| | |
| | 2,000,000 | | | Urbi Desarrollos Urbanos (a)
Affordable Housing Builder | | | 6,908,368
| | |
| | 1,200,000 | | | Megacable (a)
Mexican Cable & Internet Operator | | | 4,074,654
| | |
| | 2,000,000 | | | Financiera Independencia (a)
Mexican Micro-finance Lender | | | 3,434,027
| | |
| | | | | | | | 24,212,249 | | |
| | | | | Total Latin America | | | 93,161,080 | | |
| Total Common Stocks (Cost: $1,081,020,786) – 96.0% | | | 1,626,142,025 | | |
See accompanying notes to financial statements.
11
Wanger International Small Cap 2007 Annual Report
Wanger International Small Cap
Statement of Investments December 31, 2007
Principal
Amount | | | | Value | |
| Short-Term Obligations – 3.9% | | | |
| $ | 8,500,000 | | | United Parcel Service (c)
3.98% due 1/16/08 | | $ | 8,485,904 | | |
| | 8,400,000 | | | General Electric Capital Corp.
4.15% due 1/08/08 | | | 8,393,222 | | |
| | 8,400,000 | | | Emerson Electric (c)
4.20% due 1/11/08 | | | 8,390,200 | | |
| | 8,300,000 | | | Toyota Motor Credit
4.18% due 1/02/08 | | | 8,299,036 | | |
| | 8,300,000 | | | EI Dupont (c)
4.20% due 1/03/08 | | | 8,298,064 | | |
| | 8,300,000 | | | Chevron Funding
4.11% due 1/04/08 | | | 8,297,157 | | |
| | 8,157,000 | | | IBM (c)
4.22% due 1/07/08 | | | 8,151,263 | | |
| | 7,198,000 | | | Repurchase Agreement with Fixed
Income Clearing Corp., dated 12/31/07,
due 01/02/08 at 3.00%, collateralized
by a U.S. Government Agency
Obligation, maturing 07/18/16, market
value $7,345,144 (repurchase
proceeds $7,199,200) | | | 7,198,000 | | |
| | | Total Short-Term Obligations
(Cost: $65,512,846) | | | 65,512,846 | | |
Total Investments
(Cost: $1,146,533,632) – 99.9% (d)(e) | | | 1,691,654,871 | | |
| Cash and Other Assets Less Liabilities – 0.1% | | | 1,719,474 | | |
| Total Net Assets – 100% | | | 1,693,374,345 | | |
Notes to Statement of Investments:
(a) Non-income producing security.
(b) An affiliate may include any company in which the Fund owns five percent or more of its outstanding voting shares. Transactions in affiliated companies during the twelve months ended December 31, 2007, are as follows:
Balance of
Affiliates | | Shares
Held
12/31/2006 | | Purchases/
Additions | | Balance of
Sales/
Reductions | | Shares
Held
12/31/2007 | | Value | | Dividend | |
Charles
Taylor | | | 1,700,000 | | | | 600,000 | | | | — | | | | 2,300,000 | | | $ | 15,402,758 | | | $ | 544,493 | | |
The aggregate cost and value of this company at December 31, 2007, was $12,583,555 and $15,402,758, respectively. Investments in affiliate companies represent 0.9% of total net assets at December 31, 2007.
(c) Security exempt from registration under Section 4(2) of the Securities Act of 1933. These securities may only be resold in exempt transactions to qualified buyers. Private resales of these securities to qualified institutional buyers are also exempt from registration pursuant to Rule 144A under the Securities Act of 1933. At December 31, 2007, these securities amounted to $33,325,431, which represents 2.0% of net assets.
(d) At December 31, 2007, for federal income tax purposes cost of investments was $1,147,407,514 and net unrealized appreciation was $544,247,357 consisting of gross unrealized appreciation of $615,044,798 and gross unrealized depreciation of $70,797,441.
(e) On December 31, 2007, the Fund's total investments were denominated in currencies as follows:
| Currency | | Value | | % of Net
Assets | |
| Euro Dollars | | $ | 530,750,564 | | | | 31.3 | | |
| Japanese Yen | | | 238,170,119 | | | | 14.1 | | |
| Hong Kong Dollars | | | 116,296,730 | | | | 6.9 | | |
| British Pounds | | | 105,275,820 | | | | 6.2 | | |
| Swiss Francs | | | 84,874,236 | | | | 5.0 | | |
| U.S. Dollars | | | 153,888,639 | | | | 9.1 | | |
Other currencies less than
5% of total net assets | | | 462,398,763 | | | | 27.3 | | |
Cash and other assets
less liabilities | | | 1,719,474 | | | | 0.1 | | |
| | | $ | 1,693,374,345 | | | | 100.0 | | |
See accompanying notes to financial statements.
12
Wanger International Small Cap 2007 Annual Report
Wanger International Small Cap
Portfolio Diversification December 31, 2007
At December 31, 2007, the Fund's portfolio investments as a percent of net assets was diversified as follows:
| | | Value | | Percent | |
| Industrial Goods & Services | |
| Other Industrial Services | | $ | 124,545,942 | | | | 7.3 | % | |
| Industrial Materials & Specialty Chemicals | | | 115,242,136 | | | | 6.8 | | |
| Machinery | | | 81,893,259 | | | | 4.9 | | |
| Conglomerates | | | 60,115,302 | | | | 3.6 | | |
| Electrical Components | | | 40,728,570 | | | | 2.4 | | |
| Outsourcing Services | | | 39,361,257 | | | | 2.3 | | |
| Construction | | | 30,292,505 | | | | 1.8 | | |
| Industrial Distribution | | | 12,148,225 | | | | 0.7 | | |
| | | | 504,327,196 | | | | 29.8 | | |
| Consumer Goods & Services | |
| Other Consumer Services | | | 58,462,531 | | | | 3.5 | | |
| Retail | | | 40,416,999 | | | | 2.4 | | |
| Food & Beverage | | | 33,223,437 | | | | 2.0 | | |
| Casinos & Gaming | | | 32,147,867 | | | | 1.9 | | |
| Apparel | | | 19,016,791 | | | | 1.1 | | |
| Consumer Goods Distribution | | | 17,366,105 | | | | 1.0 | | |
| Other Durable Goods | | | 15,277,323 | | | | 0.9 | | |
| Travel | | | 15,082,166 | | | | 0.9 | | |
| Other Entertainment | | | 14,260,117 | | | | 0.8 | | |
| Nondurables | | | 12,765,731 | | | | 0.8 | | |
| Leisure Products | | | 11,607,952 | | | | 0.7 | | |
| Consumer Electronics | | | 10,989,977 | | | | 0.6 | | |
| | | | 280,616,996 | | | | 16.6 | | |
| Information | |
| Financial Processors | | | 37,868,093 | | | | 2.2 | | |
| Computer Hardware & Related Equipment | | | 34,874,770 | | | | 2.1 | | |
| CATV | | | 24,058,320 | | | | 1.4 | | |
| Satellite Broadcasting & Services | | | 23,599,758 | | | | 1.4 | | |
| Business Information & Marketing Services | | | 22,347,875 | | | | 1.3 | | |
| Internet Related | | | 22,295,007 | | | | 1.3 | | |
| Semiconductors & Related Equipment | | | 17,246,656 | | | | 1.0 | | |
| Publishing | | | 13,352,983 | | | | 0.8 | | |
| TV Broadcasting | | | 12,193,227 | | | | 0.7 | | |
| Business Software | | | 11,647,198 | | | | 0.7 | | |
| Computer Services | | | 9,698,561 | | | | 0.6 | | |
| Telecommunications Equipment | | | 7,459,652 | | | | 0.4 | | |
| Instrumentation | | | 4,517,028 | | | | 0.3 | | |
| Advertising | | | 4,481,563 | | | | 0.3 | | |
| Electronics Distribution | | | 4,184,149 | | | | 0.3 | | |
| | | | 249,824,840 | | | | 14.8 | | |
| | | Value | | Percent | |
| Energy & Minerals | |
| Oil Services | | $ | 119,092,337 | | | | 7.0 | % | |
| Mining | | | 62,186,774 | | | | 3.7 | | |
| Agricultural Commodities | | | 28,831,945 | | | | 1.7 | | |
| Oil Refining, Marketing & Distribution | | | 26,192,153 | | | | 1.5 | | |
| Oil & Gas Producers | | | 6,685,926 | | | | 0.4 | | |
| | | | 242,989,135 | | | | 14.3 | | |
| Finance | |
| Brokerage & Money Management | | | 47,770,353 | | | | 2.8 | | |
| Insurance | | | 30,483,720 | | | | 1.8 | | |
| Banks | | | 23,927,118 | | | | 1.4 | | |
| Savings & Loans | | | 21,525,285 | | | | 1.3 | | |
| Finance Companies | | | 10,797,776 | | | | 0.6 | | |
| Closed End Funds | | | 10,119,586 | | | | 0.6 | | |
| Credit Cards | | | 2,835,480 | | | | 0.2 | | |
| | | | 147,459,318 | | | | 8.7 | | |
| Other Industries | |
| Transportation | | | 84,964,867 | | | | 5.0 | | |
| Real Estate | | | 23,852,020 | | | | 1.4 | | |
| Regulated Utilities | | | 7,541,512 | | | | 0.4 | | |
| | | | 116,358,399 | | | | 6.8 | | |
| Health Care | |
| Medical Equipment & Devices | | | 38,048,871 | | | | 2.3 | | |
| Health Care Services | | | 17,986,686 | | | | 1.1 | | |
| Pharmaceuticals | | | 15,482,959 | | | | 0.9 | | |
| Biotechnology & Drug Delivery | | | 7,487,040 | | | | 0.4 | | |
| Medical Supplies | | | 5,560,585 | | | | 0.3 | | |
| | | | 84,566,141 | | | | 5.0 | | |
| Total Common Stocks | | | 1,626,142,025 | | | | 96.0 | | |
| Short-Term Obligations | | | 65,512,846 | | | | 3.9 | | |
| Total Investments | | | 1,691,654,871 | | | | 99.9 | | |
Cash and Other Assets
Less Liabilities | | | 1,719,474 | | | | 0.1 | | |
| Net Assets | | | 1,693,374,345 | | | | 100.0 | | |
See accompanying notes to financial statements.
13
Wanger International Small Cap 2007 Annual Report
Statement of Assets and Liabilities
December 31, 2007
| Assets: | |
| Unaffiliated investments, at cost | | $ | 1,133,950,077 | | |
| Affiliated investments, at cost (See Note 4) | | | 12,583,555 | | |
| Unaffiliated investments, at value | | $ | 1,676,252,113 | | |
| Affiliated investments, at value (See Note 4) | | | 15,402,758 | | |
| Cash | | | 446 | | |
| Foreign currency (cost of $1,562,060) | | | 1,566,773 | | |
| Receivable for: | |
| Investments sold | | | 3,225,693 | | |
| Fund shares sold | | | 408,036 | | |
| Interest | | | 600 | | |
| Dividends | | | 2,060,179 | | |
| Foreign tax reclaims | | | 121,247 | | |
| Trustees' deferred compensation plan | | | 45,765 | | |
| Total Assets | | | 1,699,083,610 | | |
| Liabilities: | |
| Payable for: | |
| Investments purchased | | | 2,574,301 | | |
| Fund shares repurchased | | | 1,517,071 | | |
| Investment advisory fee | | | 1,169,399 | | |
| Administration fee | | | 71,919 | | |
| Transfer agent fee | | | 35 | | |
| Trustees' fees | | | 65 | | |
| Reports to shareholders | | | 128,046 | | |
| Custody fee | | | 157,840 | | |
| Chief compliance officer expenses | | | 2,130 | | |
| Trustees' deferred compensation plan | | | 45,765 | | |
| Other liabilities | | | 42,694 | | |
| Total Liabilities | | | 5,709,265 | | |
| Net Assets | | $ | 1,693,374,345 | | |
| Composition of Net Assets: | |
| Paid-in capital | | $ | 939,978,395 | | |
| Undistributed net investment income | | | 12,198,734 | | |
| Accumulated net realized gain | | | 196,051,015 | | |
| Net unrealized appreciation on: | | | | | |
| Investments | | | 545,121,239 | | |
| Foreign currency translations | | | 24,962 | | |
| Net Assets | | $ | 1,693,374,345 | | |
| Fund Shares Outstanding | | | 38,454,828 | | |
Net asset value, offering price and redemption
price per share | | $ | 44.04 | | |
Statement of Operations
For the Year Ended December 31, 2007
| Investment Income: | |
| Dividends (net of foreign taxes withheld of $2,012,465) | | $ | 27,030,004 | | |
| Dividends from affiliates | | | 544,493 | | |
| Interest income | | | 3,051,385 | | |
| Total Investment Income | | | 30,625,882 | | |
| Expenses: | |
| Investment advisory fee | | | 14,159,975 | | |
| Administration fee | | | 354,805 | | |
| Transfer agent fee | | | 385 | | |
| Trustees' fees | | | 84,602 | | |
| Reports to shareholders | | | 471,091 | | |
| Legal fees | | | 111,260 | | |
| Custody fee | | | 972,138 | | |
| Chief compliance officer expenses (See Note 4) | | | 44,053 | | |
| Other expenses (See Note 5) | | | 80,447 | | |
| Total Expenses | | | 16,278,756 | | |
| Custody earnings credit | | | (401 | ) | |
| Net Expenses | | | 16,278,355 | | |
| Net Investment Income | | | 14,347,527 | | |
Net Realized and Unrealized Gain (Loss) on
Investments and Foreign Currency: | |
| Net realized gain (loss) on: | |
| Investments | | | 201,804,899 | | |
| Foreign currency transactions | | | (300,821 | ) | |
| Net realized gain | | | 201,504,078 | | |
| Net change in unrealized appreciation on: | |
| Unaffiliated investments | | | 25,745,483 | | |
| Affiliated investments | | | 2,819,203 | | |
| Foreign currency translations | | | 21,807 | | |
| Net change in unrealized appreciation | | | 28,586,493 | | |
| Net Gain | | | 230,090,571 | | |
| Net Increase in Net Assets from Operations | | $ | 244,438,098 | | |
See accompanying notes to financial statements.
14
Wanger International Small Cap 2007 Annual Report
Statement of Changes in Net Assets
| | | Year Ended December 31, | |
| Increase (Decrease) in Net Assets | | 2007 | | 2006 | |
| From Operations: | |
| Net investment income | | $ | 14,347,527 | | | $ | 9,968,290 | | |
| Net realized gain on investments and foreign currency transactions | | | 201,504,078 | | | | 133,033,796 | | |
| Net change in unrealized appreciation | |
| on investments and foreign currency translations | | | 28,586,493 | | | | 239,496,939 | | |
| Net Increase in Net Assets from Operations | | | 244,438,098 | | | | 382,499,025 | | |
| Distributions to Shareholders: | |
| From net investment income | | | (13,868,748 | ) | | | (6,400,167 | ) | |
| From net realized gains | | | (124,882,759 | ) | | | — | | |
| Total Distributions to Shareholders | | | (138,751,507 | ) | | | (6,400,167 | ) | |
| Share Transactions: | |
| Subscriptions | | | 135,196,260 | | | | 235,925,977 | | |
| Distributions reinvested | | | 138,751,507 | | | | 6,400,167 | | |
| Redemptions | | | (166,382,832 | ) | | | (111,559,587 | ) | |
| Net Increase from Share Transactions | | | 107,564,935 | | | | 130,766,557 | | |
| Total Increase in Net Assets | | | 213,251,526 | | | | 506,865,415 | | |
| Net Assets: | |
| Beginning of period | | | 1,480,122,819 | | | | 973,257,404 | | |
| End of period | | | 1,693,374,345 | | | | 1,480,122,819 | | |
| Undistributed net investment income at end of period | | | 12,198,734 | | | | 6,742,938 | | |
See accompanying notes to financial statements.
15
Wanger International Small Cap 2007 Annual Report
Financial Highlights
| | | Year Ended December 31, | |
| Selected data for a share outstanding throughout each period | | 2007 | | 2006 | | 2005 | | 2004 | | 2003 | |
| Net Asset Value, Beginning of Period | | $ | 41.77 | | | $ | 30.63 | | | $ | 25.46 | | | $ | 19.68 | | | $ | 13.27 | | |
| Income from Investment Operations: | |
| Net investment income (a) | | | 0.37 | | | | 0.29 | | | | 0.25 | | | | 0.13 | | | | 0.13 | | |
Net realized and unrealized gain on investments and
foreign currency transactions | | | 5.80 | | | | 11.04 | | | | 5.20 | | | | 5.80 | | | | 6.33 | | |
| Total from Investment Operations | | | 6.17 | | | | 11.33 | | | | 5.45 | | | | 5.93 | | | | 6.46 | | |
| Less Distributions to Shareholders: | |
| From net investment income | | | (0.39 | ) | | | (0.19 | ) | | | (0.28 | ) | | | (0.15 | ) | | | (0.05 | ) | |
| From net realized gain | | | (3.51 | ) | | | — | | | | — | | | | — | | | | — | | |
| Total Distributions to Shareholders | | | (3.90 | ) | | | (0.19 | ) | | | (0.28 | ) | | | (0.15 | ) | | | (0.05 | ) | |
| Net Asset Value, End of Period | | $ | 44.04 | | | $ | 41.77 | | | $ | 30.63 | | | $ | 25.46 | | | $ | 19.68 | | |
| Total Return (b) | | | 16.31 | % | | | 37.16 | % | | | 21.53 | %(c) | | | 30.27 | % | | | 48.86 | % | |
| Ratios to Average Net Assets/Supplemental Data: | |
| Net expenses before interest expense (d) | | | 0.99 | % | | | 1.01 | % | | | 1.13 | % | | | 1.36 | % | | | 1.41 | % | |
| Interest expense | | | — | | | | 0.00 | %(e) | | | — | | | | — | | | | — | | |
| Net expenses (d) | | | 0.99 | % | | | 1.01 | % | | | 1.13 | % | | | 1.36 | % | | | 1.41 | % | |
| Net investment income (d) | | | 0.87 | % | | | 0.81 | % | | | 0.92 | % | | | 0.59 | % | | | 0.85 | % | |
| Waiver | | | — | | | | — | | | | 0.02 | % | | | — | | | | — | | |
| Portfolio turnover rate | | | 35 | % | | | 41 | % | | | 24 | % | | | 47 | % | | | 45 | % | |
| Net assets, end of period (000's) | | $ | 1,693,374 | | | $ | 1,480,123 | | | $ | 973,257 | | | $ | 606,773 | | | $ | 380,726 | | |
(a) Net investment income per share was based upon the average shares outstanding during the period.
(b) Total return at net asset value assuming all distributions are reinvested.
(c) Had the investment adviser not waived a portion of expenses, total return would have been reduced.
(d) The benefits derived from custody fees paid indirectly had an impact of less than 0.01%.
(e) Rounds to less than 0.01%.
See accompanying notes to financial statements.
16
Wanger International Small Cap 2007 Annual Report
Notes to Financial Statements
1. Nature of Operations
Wanger International Small Cap (the "Fund") is a series of Wanger Advisors Trust (the "Trust"), an open-end management investment company organized as a Massachusetts business trust. The investment objective of the Fund is to seek long-term growth of capital. The Fund is available only for allocation to certain life insurance company separate accounts established for the purpose of funding qualified and non-qualified variable annuity contracts and variable life insurance policies and may also be offered directly to certain types of pension plans and retirement arrangements.
2. Significant Accounting Policies
Security valuation
Securities of the Fund are valued at market value or, if a market quotation for a security is not readily available or is deemed not to be reliable because of events or circumstances that have occurred between the market quotation and the time as of which the security is to be valued, the security is valued at a fair value determined in accordance with procedures established by the Board of Trustees. A security traded on a securities exchange or in an over-the-counter market in which transaction prices are reported is valued at the last sales price at the time of valuation. A security traded principally on NASDAQ is valued at the NASDAQ official closing price. A security for which there is no reported sale on the valuation date is valued at the latest bid quotation. A short term debt obligation having a maturity of 60 days or less from the valuation date is valued in accordance with procedures established by the Board of Trustee s. The Trust has retained an independent statistical fair value pricing service to assist in the fair valuation process for securities principally traded in a foreign market in order to adjust for possible changes in value that may occur between the close of the foreign exchange and the time as of which the securities are to be valued. If a security is valued at fair value, that value may be different from the last quoted market price for the security.
In September 2006, Statement of Financial Accounting Standards No. 157, Fair Value Measurements ("SFAS 157"), was issued. SFAS 157 is effective for fiscal years beginning after November 15, 2007. SFAS 157 defines fair value, establishes a framework for measuring fair value and expands disclosures about fair value measurements. Management is evaluating the impact the application of SFAS 157 will have on the Fund's financial statement disclosures.
Repurchase agreements
The Fund may engage in repurchase agreement transactions. The Fund, through its custodians, receives delivery of underlying securities collateralizing each repurchase agreement. The Fund's custodian determines that the value of the underlying securities is at all times at least equal to the resale price. In the event of default or bankruptcy by the other party to the agreement, realization and/or retention of the collateral may be subject to legal proceedings.
Foreign currency translations
Values of investments denominated in foreign currencies are converted into U.S. dollars using the spot market rate of exchange at the time of valuation. Purchases and sales of investments and dividend and interest income are translated into U.S. dollars using the spot market rate of exchange prevailing on the respective dates of such transactions. The gain or loss resulting from changes in foreign exchange rates is included with net realized and unrealized gain or loss from investments, as appropriate.
Security transactions and investment income
Security transactions are accounted for on the trade date (date the order to buy or sell is executed) and dividend income is recorded on the ex-dividend date, except that certain dividends from foreign securities are recorded as soon as the information is available to the Fund. Interest income is recorded on the accrual basis and includes amortization of discounts on debt obligations when required for federal income tax purposes. Realized gains and losses from security transactions are recorded on an identified cost basis.
Awards, if any, from class action litigation related to securities owned may be recorded as a reduction of cost of those securities. If the applicable securities are no longer owned, the proceeds are recorded as realized gains.
Restricted Securities
Restricted securities are securities that may only be resold upon registration under federal securities laws or in transactions exempt from registration. In some cases, the issuer of restricted securities has agreed to register such securities for resale at the issuer's expense either upon demand by the Fund or in connection with another registered offering of the securities. Many restricted securities may be resold in the secondary market in transactions exempt from registration. Such restricted securities may be determined to be liquid under criteria established by the Board of Trustees. The Fund will not incur any registration costs upon such resale.
Use of estimates
The preparation of financial statements in conformity with accounting principles generally accepted in the United States of America ("GAAP") requires management to make estimates and assumptions that affect the amounts reported in the financial statements and accompanying notes. Actual results may differ from those estimates.
Fund share valuation
Fund shares are sold and redeemed on a continuing basis at net asset value. Net asset value per share is determined daily as of the close of trading on the New York Stock Exchange ("the Exchange") on each day the Exchange is open for trading by dividing the total value of the Fund's investments and other assets, less liabilities, by the number of Fund shares outstanding.
Custody fees/Credits
Custody fees are reduced based on the Fund's cash balances maintained with the custodian. The amount is disclosed as a reduction of total expenses in the Statement of Operations.
Federal income taxes
The Fund has complied with the provisions of the Internal Revenue Code available to regulated investment companies and, in the manner provided therein, distributes all its taxable income, as well as any net realized gain on sales of investments and foreign currency transactions reportable for federal income tax purposes. Accordingly, the Fund paid no federal income taxes and no federal income tax provision was required.
Foreign capital gains taxes
Realized gains in certain countries may be subject to foreign taxes at the fund level, at rates ranging from 10%-15%. The Fund accrues for such foreign taxes on net realized and unrealized gains at the appropriate rate for each jurisdiction.
Distributions to shareholders
Distributions to shareholders are recorded on the ex-date.
Indemnification
In the normal course of business, the Fund enters into contracts that contain a variety of representations and warranties which provide general indemnities. The Fund's maximum exposure under these arrangements is unknown, as this would involve future claims against the Fund. Also under the Trust's organizational documents, the Trustees and Officers of the Trust are indemnified against certain liabilities that may arise out of their duties to the
17
Wanger International Small Cap 2007 Annual Report
Notes to Financial Statements, continued
Trust. However based on experience, the Fund expects the risk of loss due to these warranties and indemnities to be minimal.
3. Federal Tax Information
The timing and character of income and capital gain distributions are determined in accordance with income tax regulations, which may differ from GAAP. Reclassifications are made to the Fund's capital accounts for permanent tax differences to reflect income and gains available for distribution (or available capital loss carryforwards) under income tax regulations.
For the year ended December 31, 2007, permanent book and tax basis differences resulting primarily from differing treatments for foreign currency transactions and passive foreign investment companies ("PFIC") adjustments were identified and reclassified among the components of the Fund's net assets as follows:
Undistributed
Net Investment
Income | | Accumulated
Net Realized
Gain/(Loss) | | Paid-In Capital | |
| $ | 4,977,017 | | | $ | (4,977,017 | ) | | $ | — | | |
Net investment income and net realized gains (losses), as disclosed on the Statement of Operations, and net assets were not affected by this reclassification.
The tax character of distributions paid during the years ended December 31, 2007 and December 31, 2006 were as follows:
| | | December 31, 2007 | | December 31, 2006 | |
Distributions paid from
Ordinary Income | | $ | 27,006,414 | | | $ | 6,400,167 | | |
| Long-Term Capital Gains | | | 111,745,093 | | | | — | | |
* For tax purposes short-term capital gains distributions, if any, are considered ordinary income distributions.
As of December 31, 2007, the components of distributable earnings on a tax basis were as follows:
Undistributed
Ordinary
Income | | Undistributed
Long-Term
Capital Gains | | Net Unrealized
Appreciation* | |
| $ | 35,787,098 | | | $ | 173,344,442 | | | $ | 544,239,448 | | |
* The differences between book-basis and tax-basis net unrealized appreciation/depreciation are primarily due to deferral of losses from wash sales, foreign currency transactions and passive foreign investment company ("PFIC") adjustments.
The Funds adopted Financial Accounting Standards Board ("FASB") Interpretation No. 48, Accounting for Uncertainty in Income Taxes—an Interpretation of FASB Statement No. 109 ("FIN 48") effective June 29, 2007. FIN 48 requires management to determine whether a tax position of the Fund is more likely than not to be sustained upon examination by the applicable taxing authority, including resolution of any related appeals or litigation processes, based on the technical merits of the position. The tax benefit to be recognized is measured as the largest amount of benefit that is greater than fifty percent likely of being realized upon ultimate settlement. FIN 48 must be applied to all existing tax positions upon initial adoption and the cumulative effect, if any, is to be reported as an adjustment to net assets. Management has evaluated the known implications of FIN 48 on its computation of net assets for the Fund. As a result of this evaluation, management believes that FIN 48 does not have any effect on the Fund's financial statements. However, management's conclusions regarding FIN 48 may be subject to review and adjustment at a later date based on factors including, but not limited to, further implementation guidance from the FASB, new tax laws, regulations, and administrative interpretations (including relevant court decisions). The Fund's federal tax returns for the prior three fiscal years remain subject to examination by the Internal Revenue Service. The Funds are not aware of any tax positions for which it is reasonably possible that the total amounts of unrecognized tax benefits will significantly change in the next twelve months.
4. Transactions With Affiliates
Columbia Wanger Asset Management, L.P., ("CWAM") is a wholly owned subsidiary of Columbia Management Group, LLC., which in turn is an indirect wholly owned subsidiary of Bank of America Corporation ("BOA"). CWAM furnishes continuing investment supervision to the Fund and is responsible for the overall management of the Fund's business affairs.
Effective August 1, 2007, under the Fund's investment advisory agreement, fees are accrued daily based on the Fund's average daily net assets and paid monthly to CWAM at the annual rates shown in the table below:
| Average Daily Net Assets | | Annual Fee Rate | |
| Up to $100 million | | | 1.10 | % | |
| $100 million to $250 million | | | 0.95 | % | |
| $250 million to $500 million | | | 0.90 | % | |
| $500 million to $1 billion | | | 0.80 | % | |
| $1 billion and over | | | 0.72 | % | |
Prior to August 1, 2007, as provided under the Fund's investment advisory agreement, fees were accrued daily based on the Fund's average daily net assets and paid monthly to CWAM at the annual rates shown in the table below:
| Average Daily Net Assets | | Annual Fee Rate | |
| Up to $100 million | | | 1.15 | % | |
| $100 million to $250 million | | | 1.00 | % | |
| $250 million to $500 million | | | 0.95 | % | |
| $500 million and over | | | 0.85 | % | |
For the year ended December 31, 2007, the Fund's effective investment advisory fee rate was 0.86%.
CWAM provides administrative services and receives an administration fee from the Fund. Prior to August 1, 2007, administrative services were covered under the Fund's investment advisory agreement in place between the Fund and CWAM. Effective August 1, 2007, under the Fund's new administration agreement, which provides the same types of administrative services that were provided under the investment advisory agreement, fees are accrued daily and paid monthly to CWAM at the annual rate of 0.05%. Accordingly, the investment advisory fees were decreased by 0.05% across all asset levels effective August 1, 2007 as well.
For the year ended December 31, 2007, the Fund's effective administration fee rate was 0.02%.
Certain officers and trustees of the Trust are also officers of CWAM. The Trust makes no direct payments to its officers and trustees who are affiliated with CWAM.
The Board of Trustees appointed a Chief Compliance Officer to the Fund in accordance with federal securities regulations. The Fund will pay its pro-rata share of the expenses associated with the Office of the Chief Compliance Officer. These expenses are disclosed separately as "Chief compliance officer expenses" in the Statement of Operations.
The Trust offers a deferred compensation plan for its independent trustees. Under that plan, a trustee may elect to defer all or a portion of his or her compensation. Amounts deferred are retained by the Trust and represent an unfunded obligation of the Trust. The value of amounts deferred is determined by reference to the change in value of Class Z shares of one or more series of
18
Wanger International Small Cap 2007 Annual Report
Notes to Financial Statements, continued
the Columbia Acorn Trust or a money market fund as specified by the trustee. Benefits under the deferred compensation plan are payable when the trustee ceases to be a member of the Board of Trustees.
Columbia Management Distributors, Inc. (the "Distributor"), a wholly owned subsidiary of BOA, serves as the principal underwriter of the Trust and receives no compensation for its services.
Columbia Management Services, Inc. (the "Transfer Agent"), a wholly owned subsidiary of BOA, provides shareholder services to the Fund and has subcontracted with Boston Financial Data Services ("BFDS") to serve as subtransfer agent. For such services, the Transfer Agent receives a fee, paid monthly, at the annual rate of $21.00 per open account. . The Transfer Agent also receives reimbursement for certain out-of-pocket expenses.
An affiliate may include any company in which a fund owns five percent or more of its outstanding voting shares. On December 31, 2007, the Fund held five percent or more of the outstanding voting securities of one or more companies. Details of investments in those affiliated companies are presented on page 12.
During the year ended December 31, 2007, the Fund engaged in purchases and sale transactions with funds that have a common investment adviser (or affiliated investment advisers), common directors/trustees, and/or common officers. Those purchase and sale transactions complied with provisions of Rule 17a-7 under the Investment Company Act of 1940 and were $0 and $5,066,703, respectively.
5. Borrowing Arrangements
The Trust participates in a $150 million credit facility, which was entered into to facilitate portfolio liquidity. Interest is charged to each participating fund based on its borrowings at a rate per annum equal to the Federal Funds rate plus 0.50%. In addition, a commitment fee of 0.08% per annum of the unutilized line of credit is accrued and apportioned among the participating funds based on their relative net assets. The commitment fee is included in "Other expenses" in the Statement of Operations. No amounts were borrowed by the Fund under this facility during the year ended December 31, 2007.
6. Fund Share Transactions
Proceeds and payments on Fund shares as shown in the Statement of Changes in Net Assets are in respect of the following numbers of shares:
| | | Year ended
December 31, 2007 | | Year ended
December 31, 2006 | |
| Shares sold | | | 3,172,392 | | | | 6,658,470 | | |
Shares issued in reinvestment
of dividend distributions | | | 3,669,704 | | | | 192,371 | | |
| Less shares redeemed | | | (3,823,176 | ) | | | (3,192,246 | ) | |
| Net increase in shares outstanding | | | 3,018,920 | | | | 3,658,595 | | |
7. Investment Transactions
The aggregate cost of purchases and proceeds from sales other than short-term obligations for the year ended December 31, 2007 were $550,753,247 and $565,029,361, respectively.
8. Legal Proceedings
CWAM, Columbia Acorn Trust (another mutual fund family advised by CWAM), and the trustees of Columbia Acorn Trust (collectively, the "Columbia defendants") are named as defendants in class and derivative complaints that have been consolidated in a Multi-District Action (the "MDL Action") in the federal district court of Maryland. These lawsuits contend that defendants permitted certain investors to market time their trades in certain Columbia Acorn Funds. The MDL Action is ongoing. However, all claims against Columbia Acorn Trust and the independent trustees of Columbia Acorn Trust have been dismissed.
Columbia Acorn Trust and CWAM are also defendants in a class action lawsuit that alleges, in summary, that Columbia Acorn Trust and CWAM exposed shareholders of Columbia Acorn International Fund to trading by market timers by allegedly: (a) failing to properly evaluate daily whether a significant event affecting the value of the fund's securities had occurred after foreign markets had closed but before the calculation of the fund's net asset value ("NAV"); (b) failing to implement the fund's portfolio valuation and share pricing policies and procedures; and (c) failing to know and implement applicable rules and regulations concerning the calculation of NAV (the "Fair Valuation Lawsuit"). The Seventh Circuit ruled that the plaintiffs' state law claims were preempted under federal law resulting in the dismissal of plaintiffs' complaint. Plaintiffs appealed the Seventh Circuit's ruling to the United States Supreme Court. The Suprem e Court reversed the Seventh Circuit's ruling on jurisdictional grounds and the case was ultimately remanded to the state court.
On March 21, 2005, a class action complaint was filed against the Columbia Acorn Trust and CWAM seeking to rescind the CDSC assessed upon redemption of Class B shares of Columbia Acorn Funds due to the alleged market timing of the Columbia Acorn Funds (the "CDSC Lawsuit"). In addition to the rescission of sales charges, plaintiffs seek recovery of actual damages, attorneys' fees and costs. The case had been transferred to the MDL Action in the federal district court of Maryland.
On September 14, 2007, the plaintiffs and the Columbia defendants named in the MDL Action, including the Columbia Funds, entered into a stipulation of settlement with respect to all Columbia-related claims in the MDL Action described above, including the CDSC and Fair Valuation Lawsuits. The settlement is subject to court approval.
CWAM, the Columbia Acorn Funds and the Trustees of the Trust are also defendants in a consolidated lawsuit filed in the federal district court of Massachusetts alleging that CWAM used Fund assets to make undisclosed payments to brokers as an incentive for the brokers to market the Funds over other mutual funds to investors. The complaint alleges CWAM and the Trustees of Columbia Acorn Trust, along with certain affiliated entities and individuals, breached certain common law duties and federal laws.
On November 30, 2005, the judge dismissed all claims by plaintiffs and entered final judgment in favor of the defendants. The plaintiffs appealed to the United States Court of Appeals for the First Circuit on December 30, 2005. A stipulation and settlement agreement dated January 19, 2007 was filed in the First Circuit on February 14, 2007, with a joint stipulation of dismissal and motion for remand to obtain district court approval of the settlement. That joint motion was granted and the appeal was dismissed. On March 6, 2007, the case was remanded to the federal district court. The settlement, approved by the federal district court on September 18, 2007, became effective October 19, 2007. Pursuant to the settlement, the funds' adviser and/or its affiliates made certain payments, including plaintiffs' attorneys' fees and costs of notice to class members.
The Trust and CWAM intend to defend these suits vigorously.
As a result of these matters, or any adverse publicity or other developments resulting from them, there may be increased redemptions or reduced sales of Columbia Acorn fund shares, which could increase transaction costs or operating expenses, or have other adverse consequences for the Columbia Acorn funds. However, based on currently available information, the Columbia Acorn Trust believes that the likelihood that these lawsuits will have a material adverse impact on any fund is remote, and CWAM believes that the lawsuits are not likely to materially affect its ability to provide investment management services to the funds.
19
Wanger International Small Cap 2007 Annual Report
Report of Independent Registered Public Accounting Firm
To the Board of Trustees and Shareholders of Wanger International Small Cap,
In our opinion, the accompanying statement of assets and liabilities, including the statement of investments, and the related statements of operations and of changes in net assets and the financial highlights present fairly, in all material respects, the financial position of Wanger International Small Cap (a series of the Wanger Advisors Trust, hereinafter referred to as the "Fund") at December 31, 2007, the results of its operations for the year then ended, the changes in its net assets for each of the two years in the period then ended and the financial highlights for each of the four years in the period then ended, in conformity with accounting principles generally accepted in the United States of America. These financial statements and financial highlights (hereafter referred to as "financial statements") are the responsibility of the Fund's management; our responsibility is to express an opinion on these financial statemen ts based on our audits. We conducted our audits of these financial statements in accordance with the standards of the Public Company Accounting Oversight Board (United States). Those standards require that we plan and perform the audit to obtain reasonable assurance about whether the financial statements are free of material misstatement. An audit includes examining, on a test basis, evidence supporting the amounts and disclosures in the financial statements, assessing the accounting principles used and significant estimates made by management, and evaluating the overall financial statement presentation. We believe that our audits, which included confirmation of securities at December 31, 2007 by correspondence with the custodian and brokers, provide a reasonable basis for our opinion. The December financial highlights of the Fund for the period ended December 31, 2003 were audited by other independent auditors whose report dated February 6, 2004 expressed an unqualified opinion on those financial statements .
PricewaterhouseCoopers LLP
Chicago, Illinois
February 20, 2008
20
Wanger International Small Cap 2007 Annual Report
Federal Income Tax Information (Unaudited)
For the fiscal year ended December 31, 2007, the Fund designated long-term capital gains of $173,411,020.
Foreign taxes paid during the fiscal year ended December 31, 2007, amounting to $2,012,465 ($0.05 per share) are expected to be passed though to shareholders as 100% allowable foreign tax credits for the year ending December 31, 2007.
Gross income derived from sources within foreign countries amounted to $29,586,961 ($0.77 per share) for the fiscal year ended December 31, 2007.
21
Wanger International Small Cap 2007 Annual Report
[Excerpt from:]
Wanger Advisors Trust
Management Fee Evaluation of the Senior Officer
Prepared Pursuant to the New York Attorney General's
Assurance of Discontinuance
June 2007
22
Wanger International Small Cap 2007 Annual Report
Introduction
The New York Attorney General's Assurance of Discontinuance ("Order") entered into by Columbia Management Advisors, Inc. ("CMAI") and Columbia Management Distributors, Inc., ("CMDI" and collectively with "CMAI," "CMG") in February 2005, allows CMAI to manage or advise a mutual fund only if the trustees of the fund appoint a "Senior Officer" to perform specified duties and responsibilities. One of these responsibilities includes "managing the process by which proposed management fees (including but not limited to, advisory fees) to be charged the [Funds] are negotiated so that they are negotiated in a manner which is at arms' length and reasonable and consistent with this Assurance of Discontinuance."
This is the first year that the Columbia Acorn Trust and Wanger Advisors Trust (collectively, the "Trusts") and each series thereof (the "Acorn Funds," "WAT Funds" or collectively, the "Funds") have been overseen by the same Board of Trustees ("Board"). The Order provides that this Board must determine the reasonableness of proposed "management fees" by using either an annual competitive bidding process supervised by the Senior Officer or Independent Fee Consultant, or by obtaining "an annual independent written evaluation prepared by or under the direction of the Senior Officer or the Independent Fee Consultant."
"Management fees" are only part of the costs and expenses paid by mutual fund shareholders. The expenses can vary depending upon the class of shares held but usually include: (1) investment management or advisory fees to compensate analysts and portfolio managers for stock research and portfolio management, as well as the cost of operating a trading desk; (2) administrative expenses incurred to prepare registration statements and tax returns, calculate the Funds' net asset values, maintain effective compliance procedures and perform recordkeeping services; (3) transfer agency costs for establishing accounts, accepting and disbursing funds, as well as overseeing trading in Fund shares; (4) custodial expenses incurred to hold the securities purchased by the Funds; and (5) distribution expenses, including commissions paid to brokers that sell the Fund shares to investors.
Columbia Wanger Asset Management, L.P. ("CWAM"), the adviser to the Funds, has proposed that with respect to the Acorn Funds, the Columbia Acorn Trust continue the existing separate agreements governing the first two categories listed above: an advisory agreement governing portfolio management, and an administration agreement governing certain administration and clerical services. Together the fees paid under these two agreements are referred to as "management fees." CWAM proposes that the WAT Funds continue the existing single agreement governing both investment advisory and administrative services. A single management fee would cover both services. Other fund expenses are governed by separate agreements, in particular agreements with two CWAM affiliates: CMDI, the broker-dealer that underwrites and distributes the Funds' shares, and Columbia Management Services, Inc. ("CMSI"), the Funds' transfer agent. In conformity with the terms of the Order, this evaluation, therefore, addresses only the advisory and administrative contracts, and does not extend to the other agreements.
According to the Order, the Senior Officer's evaluation must consider at least the following:
(1) Management fees (including components thereof) charged to institutional and other clients of CWAM for like services;
(2) Management fees (including any components thereof) charged by other mutual fund companies for like services;
(3) Costs to CWAM and its affiliates of supplying services pursuant to the management fee agreements, excluding any intra-corporate profit;
(4) Profit margins of CWAM and its affiliates from supplying such services;
(5) Possible economies of scale as the Funds grow larger; and
(6) The nature and quality of CWAM's services, including the performance of each Fund.
In 2004, the Boards of the two Trusts, then separate groups, each appointed me Senior Officer under the Order. They also determined not to pursue a competitive bidding process and instead, charged me with the responsibility of evaluating the Funds' proposed advisory and administrative fee contracts with CWAM in conformity with the requirements of the Order. This Report is an annual evaluation required under the Order. In discharging their responsibilities, the independent Trustees have also consulted independent, outside counsel.
2007 Evaluation
This is the third annual evaluation prepared in connection with the Order. This evaluation follows the same structure as the earlier studies. Some areas are given more emphasis here, while others are given less. Still, the fundamental information gathered for this evaluation is largely the same as past years.
Process and Independence
The objectives of the Order are to insure the independent evaluation of the advisory fees paid by the Funds as well as to insure that all relevant factors are considered. In my view, this contract renewal process has been conducted at arms-length and with independence in gathering, considering and evaluating all relevant data. At the outset of the process, the Trustees sought and obtained from CWAM and CMG a comprehensive compilation of data regarding Fund performance and expenses, adviser profitability, and other information. The Board evaluated this information thoroughly and also explored CWAM's potential capacity restraints. Performance and expense data was obtained from both Morningstar and Lipper, the leading consultants in this area. The rankings prepared by Morningstar and Lipper were independent and not influenced by the adviser. CWAM itself identified what it considers competing funds, and the Trustees considered that data as well.
23
Wanger International Small Cap 2007 Annual Report
In the course of its work, the Contract Committee gave careful consideration to the conclusions and recommendations contained in last year's evaluation. The Contract Committee gave particular emphasis to the issue of whether economies of scale were appropriately reflected in the Funds' fee schedules. Last year, the Board sought and CWAM agreed to additional breakpoints for two Funds, Acorn USA and Acorn Select. These breakpoints are above current asset levels, but clearly operate to share economies of scale with Fund shareholders. This year, at the Board's request, CWAM has proposed additional breakpoints for the WAT Funds, and Acorn International Select. This proposal is under consideration by the Board.
My evaluation of the advisory contract was shaped, as it was last year, by my experience as Chief Compliance Officer of the Trusts ("CCO"). As CCO, I report solely to the Board and have no reporting obligation to or employment relationship with CMG or its affiliates, except for administrative purposes. I have commented on compliance matters in evaluating the quality of service provided by CWAM.
This Report, its supporting materials and the data contained in other materials submitted to the Contract Committee of the Board, in my view, provide a thorough factual basis upon which the Board, in consultation with independent counsel as it deems appropriate, may conduct management fee negotiations that are in the best interests of the Funds' shareholders.
The Fee Reductions Mandated under the Order
Under the terms of the Order, CMG agreed to secure certain management fee reductions for the mutual funds advised by its affiliate investment advisers. In some instances, breakpoints were also established. Although neither CWAM nor the Trusts was a party to the Order, CWAM offered and the Board accepted certain advisory fee reductions during 2005. By the terms of the Order, these fees may not be increased before November 30, 2009. I have used these advisory fee levels—as modified last year to add certain breakpoints for Acorn USA and Acorn Select—in this evaluation because they are the fees in the current agreements that CWAM proposes should be continued. Hence, these fee levels are the starting point of an evaluation.
Conclusions
My review of the data and other material above leads to the following conclusions with respect to the factors identified in the Order.
1. Performance. The domestic Funds generally have achieved outstanding performance. The Acorn Fund, Acorn USA, Acorn Select, Wanger Select and Wanger US Smaller Companies all rank very favorably against their peers over the past five years. Although Acorn USA and Wanger US Smaller Companies had a difficult year in 2006, these returns are not characteristic of these funds, both of which have shown improved performance during the first quarter of 2007. The international Funds have relatively weaker long term records than the domestic funds, but recently have improved significantly and their one year rankings are excellent. Overall then, performance of the Funds is excellent.
2. Management Fees relative to Peers. The management fee rankings for several of the Acorn Funds are generally more favorable to shareholders than those of their peer group funds. Management fees do, however, vary by Fund. Acorn Fund is the least expensive and the Acorn USA the most expensive. Acorn Fund is very competitive, while Acorn USA and Acorn Select were ranked by both Lipper and Morningstar at or below the median, and therefore impose higher fees than do the majority of their competitors. The WAT Funds also lag their competitors and impose higher fees than their peers.
3. Administrative Fees. The Acorn Funds' administrative fee, which is uniform across all Funds, is at a level comparable to or less expensive than the fees imposed by their peers, provides for appropriate services to Funds, and affords breakpoints that lower the fee as assets increase. The WAT Funds pay a single fee for advisory and administrative services and hence do not benefit from administrative fee breakpoints, nor is it possible to assess their administrative costs relative to competitors.
4. Management Fees relative to Institutional and Other Mutual Fund Accounts. CWAM's focus is on its mutual funds. It does not actively seek to manage separate or institutional accounts. The few institutional accounts it does manage vary in rate structures. Some pay advisory fees commensurate with or higher than the Acorn and WAT Funds. In a few instances, however, institutional accounts pay lower advisory fees than do the Acorn Funds. One particular institutional account is significant in size and has been under CWAM's management for over 25 years.
5. Costs to CWAM and its Affiliates. CWAM's direct costs do not appear excessive. Overhead and indirect costs allocated to CWAM by its parent organizations, however, are significant and increasing. CWAM's affiliates report operating losses and therefore do not appear to profit from CWAM's advisory agreement with the Funds.
6. Profit Margins. CWAM's firm-wide, pre-marketing expense profit margins are at the top of the industry, though these comparisons are hampered by limited industry data. High profit margins are not unexpected for firms that manage large, successful funds and have provided outstanding investment performance for investors.
7. Economies of Scale. Economies of scale do exist at CWAM and will expand as the assets of the Funds get larger. They are, however, only partially reflected in the management fee schedule for the Acorn Funds and not reflected at all in two of the four WAT Funds. Breakpoints above current asset levels have, however, been added to the more expensive funds, Acorn Select and Acorn USA. Nonetheless, if Fund assets continue to grow, under the Funds' current fee schedules, all Fund shareholders might not benefit in a manner generally commensurate with CWAM's increased profits. Management has proposed additional breakpoints for some of the Funds that, if implement, would result in greater sharing of economies of scale.
24
Wanger International Small Cap 2007 Annual Report
8. Nature and Quality of Services. This category includes a variety of considerations that are difficult to quantify, yet can have a significant bearing on the performance of the Acorn Funds. Several areas merit comment.
a. Capacity. The Funds have continued to grow, posing ever greater challenges in deploying assets effectively. While trends here merit continued monitoring, CWAM appears to be managing assets effectively.
b. Compliance. CWAM has a reasonably designed compliance program that protects shareholders.
c. Administrative Services. The Funds benefit from a variety of administrative services that are performed by CWAM and CMAI.
9. Process. In my opinion, the process of negotiating an advisory contract for the Funds has been conducted thoroughly and at arms' length. Further, the Trustees have sufficient information to evaluate management's proposal, and negotiate contract terms that are in the best interests of fund shareholders.
Recommendations
(with respect to the Wanger Funds)
I believe the Trustees should:
1. Continue to consider additional ways to restructure the advisory fee beyond the current breakpoint schedule to reflect more fully economies of scale.
2. Consider unbundling of the advisory and administrative fees paid by the WAT Funds.
3. Review the disparity in management fee levels between the Acorn International Fund and its related annuity-based fund, WAT International Small Cap Fund.
4. Continue to monitor CWAM's capacity limitations to insure that the Funds' expanding assets do not impair investment performance.
Robert P. Scales
Senior Vice President,
Chief Legal Officer
and General Counsel
June 18, 2007
25
Wanger International Small Cap 2007 Annual Report
Board Approval of the Advisory Agreement
Wanger Advisors Trust (the "Trust") has an investment advisory agreement (the "Advisory Agreement") with Columbia Wanger Asset Management, L.P. ("CWAM") under which CWAM manages the Wanger Advisors Funds (the "Funds"). The trustees of the Trust, more than seventy five percent of whom have never been affiliated with CWAM ("Independent Trustees"), oversee the management of each Fund and, as required by law, determine at least annually whether to continue the Advisory Agreement for each Fund.
The Contract Committee of the board of trustees (the "Committee"), which is comprised of six Independent Trustees, makes recommendations to the board regarding any proposed continuation of the Advisory Agreement. After the Committee has made its recommendation, the full board determines whether to approve the continuation of the Advisory Agreement. In addition, the board considers matters bearing on the Advisory Agreement at most of its other meetings throughout the year and meets at least quarterly with the portfolio managers employed by CWAM.
In connection with their most recent consideration of the Advisory Agreement for each Fund, the Committee and all trustees received and reviewed a substantial amount of information provided by CWAM in response to requests of the Independent Trustees and their counsel. Throughout their consideration of the Advisory Agreement, the Independent Trustees were advised by their independent legal counsel. At each of the meetings at which the Committee or the Independent Trustees considered the Advisory Agreement, they met with management and also met separately in executive session with their counsel.
The materials reviewed by the Committee and the trustees included, among other items, (i) information on the investment performance of each Fund and the performance of peer groups of funds and of the Fund's performance benchmarks, (ii) information on each Fund's advisory fees and other expenses, including information comparing the Fund's fees and expenses to those of peer groups of funds and information about any applicable expense limitations and fee "breakpoints," (iii) data on sales and redemptions of Fund shares and (iv) information on the profitability to CWAM and its affiliates of their relationships with the Funds and potential "fall-out" or ancillary benefits that CWAM and its affiliates may receive as a result of their relationships with the Funds. They also considered other information such as (i) CWAM's financial results and financial condition, (ii) each Fund's investment objective and strategies; (iii) the size, edu cation and experience of CWAM's investment staff and its use of technology, external research and trading cost measurement tools, (iv) the allocation of the Funds' brokerage, if any, including allocations to brokers affiliated with CWAM, and the use of "soft" commission dollars to pay for research products and services, (v) the resources devoted to, and the record of compliance with, the Funds' investment policies and restrictions, policies on personal securities transactions and other compliance policies and (vi) the economic outlook generally and for the mutual fund industry in particular. In addition, the trustees conferred with, and reviewed the Management Fee Evaluation (the "Fee Evaluation") prepared by, the Trust's chief compliance officer, who also serves as the Trust's "Senior Officer" as contemplated by the Assurance of Discontinuance dated February 9, 2005 among affiliates of CWAM and the Office of the New York Attorney General. [A summary of the Fee Evaluation is included in this report.] Through out the process, the trustees had the opportunity to ask questions of and request additional materials from CWAM.
On July 17, 2007, the board of trustees unanimously approved (a) a new administration agreement between the Trust and CWAM, pursuant to which CWAM, for a fee at the annual rate of 0.05% of average daily net assets of the Trust, provides to the Trust the types of administrative services that were currently being provided to the Trust under the Advisory Agreement and(b) the continuation of the Advisory Agreement through July 31, 2008, with amendments to the fee schedule to provide (i) a corresponding 0.05% reduction in the annual rate of fee as a result of entering into the administration agreement and (ii) additional breakpoints, as described below. The approval followed Committee meetings held in February, May, June and July 2007.
In considering the continuation of the Advisory Agreement (and entering into the new administration agreement), the trustees reviewed and analyzed various factors that they determined were relevant, including the factors described below, none of which by itself was considered dispositive. However, the material factors and conclusions that formed the basis for the trustees' determination to approve the continuation of the Advisory Agreement (and entering into the new administration agreement) are discussed separately below.
Nature, quality and extent of services. The trustees reviewed the nature, quality and extent of the services of CWAM and its affiliates to the Funds, taking into account the investment objective and strategy of each Fund and the knowledge the trustees gained from their regular meetings with management on at least a quarterly basis. In addition, the trustees reviewed the available resources and key personnel of CWAM and its affiliates, especially those who provide investment management services to the Funds. The trustees also considered other services provided to the Funds by CWAM and its affiliates, such as managing the execution of portfolio transactions and the selection of broker-dealers for those transactions, serving as the Funds' administrator, monitoring adherence to the Funds' investment restrictions, producing shareholder reports, providing s upport services for the board and board committees, communicating with shareholders and overseeing the activities of other service providers, including monitoring compliance with various policies and procedures of the Funds and with applicable securities laws and regulations. With respect to the provision of administrative services, the trustees believed it was more appropriate for those same services to be provided to the Trust pursuant to a separate administration agreement.
The trustees concluded that: the nature, quality and extent of the services provided by CWAM and its affiliates to each Fund were appropriate and consistent with the terms of the Advisory Agreement; that the quality of those services had been consistent with or superior to quality norms in the industry; and that the Funds were likely to benefit from the continued provision of those services. They also concluded that each of CWAM and its affiliates currently had sufficient personnel, with appropriate education and experience, to serve the Funds effectively and had demonstrated their continuing ability to attract and retain well qualified personnel.
Performance of the Funds. At various meetings of the board, of the Committee and of the board's investment performance analysis committee, the trustees considered the short-term and longer-term performance of each Fund. They reviewed information comparing each Fund's performance with the performance of the Fund's benchmark and with the performance of comparable funds and peer groups as identified by Lipper Inc. ("Lipper") and Morningstar Associates, LLC ("Morningstar"). They noted that, among the domestic Funds, Wanger Select had outperformed its respective benchmark and Lipper and Morningstar peers for the relevant periods. Wanger U.S. Smaller Companies suffered weak performance compared to its benchmark in 2006 and ranked toward the bottom of its peer group for that period. Notwithstanding that performance, that Fund's performance approximated, or w as ahead of, its benchmark for the most recent three, five and ten year periods. The trustees also discussed the performance of the international Funds, noting that both of the international Funds had shown improvement over recent years. During the contract renewal process, the trustees concluded that, although past performance is not necessarily indicative of future results, the Funds' strong overall performance record was an important factor in their evaluation of the quality of services provided by CWAM under the Advisory Agreement.
Costs of Services and Profits Realized by CWAM. At various Committee meetings and other informal meetings, the trustees examined detailed information on fees and expenses of each Fund in comparison to information
26
Wanger International Small Cap 2007 Annual Report
Board Approval of the Advisory Agreement
for other comparable funds provided by Lipper and Morningstar. As noted in the Fee Evaluation, the contractual rates of investment advisory fees and the actual advisory fees for some of the Funds were higher than the median advisory fees of their respective peer groups (particularly with respect to Wanger U.S. Smaller Companies and Wanger Select). The trustees also considered the management fees of the Wanger Advisors Funds relative to those of the Columbia Acorn Trust funds, a group of funds with similar investment strategies overseen by the same trustees and also managed by CWAM. In addition, the Committee and the Board had extensive discussions about the appropriateness of the 0.05% fee for administrative services.
The Board and CWAM approved amendments to the Advisory Agreement to (a) provide a 0.05% reduction in the fee schedule for each Fund in response to entering into the new administration agreement and (b) to establish additional breakpoints for (i) Wanger U.S. Smaller Companies at 0.80% on net asset levels over $2 billion, (ii) Wanger Select at 0.78% on net asset levels over $500 million, (iii) Wanger International Select at 0.89% on nets asset levels over $500 million and (iv) Wanger International Small Cap at 0.72% on net asset levels over $1 billion.
The trustees reviewed the Fee Evaluation's analysis of the profitability of CWAM in serving as each Fund's investment adviser and of CWAM and its affiliates in all of their relationships with each Fund, as well as an explanation of the methodology utilized in allocating various expenses among the Funds and other business units. The trustees took into account the methodology used by CWAM in determining compensation payable to portfolio managers and the competitive environment for investment management talent. The trustees recognized that profitability comparisons among fund managers are difficult because very little comparative information is publicly available and the profitability of any manager is affected by numerous factors, including the organizational structure of the particular manager, the types of funds and other accounts it manages, possible other lines of business, the methodology for allocating expenses and the manag er's capital structure and cost of capital.
The trustees also reviewed CWAM's advisory fees for other investment companies, sub-advised funds and other institutional separate accounts, as detailed in the Fee Evaluation. In most instances its institutional separate account fees for various investment strategies were higher than the advisory fees charged to the Funds with corresponding strategies, although for a few accounts, the fees were lower. The trustees noted that CWAM performs significant additional services for the Funds that it does not provide to sub-advised funds or non-mutual fund clients, including administrative services, oversight of the Funds' other service providers, trustee support, regulatory compliance and numerous other services, and that, in servicing the Funds, CWAM assumes many legal risks that it does not assume in servicing many of its other clients. Finally, the trustees considered the financial condition of CWAM as part of the contract renewal pr ocess.
The trustees concluded that the rates of advisory fees (as amended) and other compensation payable by the Funds to CWAM and its affiliates were reasonable in relation to the nature and quality of the services to be provided, taking into account the fees charged by other advisers for managing comparable mutual funds with similar strategies and the fees CWAM charges to other clients. The trustees also concluded that the Funds' estimated overall expense ratios were reasonable, taking into account quality of services provided by CWAM and its affiliates and the investment performance of the Funds.
Economies of Scale. The trustees considered information about the potential for CWAM to realize economies of scale as a Fund's assets increase. They noted that the fee schedule for each Fund includes reductions in the rate of fees at various asset levels, including each Fund's newly established breakpoint. The trustees also noted that the Funds share directly in economies of scale through lower charges on third party service providers based on the combined scale of all of the Funds. Based on the information they reviewed, the trustees concluded that the current fee structure of each Fund was reasonable and that the current rates of fees do reflect a sharing between CWAM and the Funds of economies of scale.
Other Benefits to CWAM. The trustees also reviewed benefits that accrue to CWAM and its affiliates from their relationships with the Funds, as outlined in the Fee Evaluation. They recognized that two affiliates of CWAM separately serve the Funds as transfer agent and distributor, respectively, and that the transfer agent receives compensation from the Funds for services provided. The trustees noted that, other than the services provided by CWAM and its affiliates pursuant to various agreements and the fees to be paid by each Fund therefor, the Funds and CWAM may potentially benefit from their relationship with each other in other ways. The trustees considered CWAM's use of commissions paid by each Fund on its portfolio brokerage transactions to obtain research products and services benefiting the Fund and/or other clients of CWAM. The trustees determi ned that CWAM's use of the Funds' "soft" commission dollars to obtain research products and services was consistent with regulatory requirements and guidance then in effect. They also concluded that CWAM benefits from the receipt of proprietary research products and services acquired through commissions paid on portfolio transactions of the Funds and that the Funds benefit from CWAM's receipt of those products and services as well as research products and services acquired through commissions paid by other clients of CWAM. They further concluded that the success of any Fund could attract other business to CWAM or other Funds and that the success of CWAM could enhance its ability to serve the Funds.
After full consideration of the above factors as well as other factors that were instructive in evaluating the Advisory Agreement, the trustees, including the Independent Trustees, unanimously concluded that the continuation of the Advisory Agreement, as amended to revise the fee schedule for each Fund to reflect both the 0.05% fee reduction and the additional breakpoints, was in the best interest of each Fund. On July 17, 2007, the trustees continued the Advisory Agreement as so amended through July 31, 2008.
27
Wanger International Small Cap 2007 Annual Report
Board of Trustees and Management of Wanger Advisors Trust
The Board of Trustees of the Trust has overall management responsibility for the Trust and the Funds. Each trustee may serve a term of unlimited duration until the end of the calendar year in which the trustee attains the age of 75 years. The trustees appoint their own successors, provided that at least two-thirds of the trustees, after such appointment, have been elected by shareholders. Shareholders may remove a trustee, with or without cause, upon the vote of two-thirds of the Trust's outstanding shares at any meeting called for that purpose. A trustee may be removed, with or without cause, upon the vote of a majority of the trustees.
The names of the trustees and officers of the Trust, the date each was first elected or appointed to office, their principal business occupations during at least the last five years, and other directorships they hold are shown below. Each trustee serves in such capacity for each of the four series of the Trust and each of the six series of Columbia Acorn Trust.
The business address of each trustee and officer of the Trust is Columbia Wanger Asset Management, L.P., 227 West Monroe, Suite 3000, Chicago, Illinois 60606. The Fund's Statement of Additional Information includes additional information about the Fund's trustees and officers. You may obtain a free copy of the Statement of Additional Information by writing or calling toll-free:
Columbia Wanger Asset Management, L.P.
Shareholder Services Group
227 W. Monroe, Suite 3000
Chicago, IL 60606
888-4-WANGER (888-492-6437)
Name, Position(s) with
Wanger Advisors
Trust and Age at
December 31, 2007 | | Year First
Elected or
Appointed
to Office | | Principal Occupation(s) during
Past Five Years | | Number of
Portfolios in
Fund Complex
Overseen
by Trustee/Officer | | Other
Directorships | |
| Trustees who are not interested persons of Wanger Advisors Trust: | |
|
Laura M. Born, 42,
Trustee (1) | | | 2007 | | | Adjunct Assistant Professor of Finance, University of Chicago Graduate School of Business; Managing Director—Investment Banking, J.P. Morgan Chase & Co. Incorporated (broker-dealer) 1991-2007. | | | 10 | | | Columbia Acorn Trust. | |
|
Maureen M. Culhane, 59,
Trustee | | | 2007 | | | Retired; Vice President, Goldman, Sachs Asset Management L.P. (investment adviser) 2005; Vice President (Consultant)—Strategic Relationship Management, Goldman, Sachs & Co. 1999-2005; prior thereto, Vice President of Finance and Treasurer, Sara Lee Corporation. | | | 10 | | | Columbia Acorn Trust. | |
|
Margaret Eisen, 54,
Trustee | | | 2006 | | | Managing Director, CFA Institute since 2005; Chief Investment Officer, EAM International LLC (corporate finance and asset management) since 2003; prior thereto, Managing Director, DeGuardiola Advisors (investment bank); formerly Managing Director, North American Equities at General Motors Asset Management, and Director, Worldwide Pension Investments for DuPont Asset Management. | | | 10 | | | Antigenics, Inc. (biotechnology and pharmaceuticals); Columbia Acorn Trust | |
|
Jerome Kahn, Jr., 73,
Trustee | | | 2006 | | | Portfolio manager and stock analyst and former President, William Harris Investors, Inc. (investment adviser). | | | 10 | | | Columbia Acorn Trust. | |
|
Steven N. Kaplan, 48,
Trustee | | | 2006 | | | Neubauer Family Professor of Entrepreneurship and Finance, Graduate School of Business, University of Chicago. | | | 10 | | | Morningstar, Inc. (provider of independent investment research); Columbia Acorn Trust | |
|
David C. Kleinman, 72,
Trustee | | | 2006 | | | Adjunct Professor of Strategic Management, University of Chicago Graduate School of Business; business consultant. | | | 10 | | | Sonic Foundry, Inc. (rich media systems and software); Columbia Acorn Trust | |
|
Allan B. Muchin, 71,
Trustee and Vice Chairman of the Board | | | 2006 | | | Chairman Emeritus, Katten Muchin Rosenman LLP (law firm). | | | 10 | | | Columbia Acorn Trust | |
|
28
Wanger International Small Cap 2007 Annual Report
Board of Trustees and Management of Wanger Advisors Trust
Name, Position(s) with
Wanger Advisors
Trust and Age at
December 31, 2007 | | Year First
Elected or
Appointed
to Office | | Principal Occupation(s) during
Past Five Years | | Number of
Portfolios in
Fund Complex
Overseen
by Trustee/Officer | | Other
Directorships | |
Robert E. Nason, 71,
Trustee and Chairman of the Board | | | 2006 | | | Consultant and private investor since 1998; formerly Executive Partner, Chief Executive Officer and member of the executive committee of Grant Thornton, LLP (public accounting firm) and member of the policy board of Grant Thornton International. | | | 10 | | | Columbia Acorn Trust | |
|
James A. Star, 46,
Trustee | | | 2006 | | | President, Longview Asset Management LLC (investment adviser) since 2003, prior thereto, portfolio manager; Vice President, Henry Crown and Company (investment firm); President and Chief Investment Officer, Star Partners (hedge fund) from 1998 to 2003. | | | 10 | | | Columbia Acorn Trust | |
|
John A. Wing, 72,
Trustee | | | 2006 | | | Partner, Dancing Lion Partners (investment partnership); prior thereto, Frank Wakely Gunsaulus Professor of Law and Finance, and Chairman of the Center for the Study of Law and Financial Markets, Illinois Institute of Technology; formerly Chairman of the Board and Chief Executive Officer of ABN-AMRO Incorporated (formerly named The Chicago Corporation, a financial services firm) and Chief Executive Officer of Market Liquidity Network, LLC. | | | 10 | | | First Chicago Bank and Trust; First Chicago Bancorp; Columbia Acorn Trust | |
|
| Trustees who are interested persons of Wanger Advisors Trust: | |
|
Charles P. McQuaid, 53,
Trustee and President (2) | | | 2003 | | | President and Chief Investment Officer, CWAM since October 2003; portfolio manager since 1995 and Director of Research, CWAM and its predecessor from July 1992 through December 2003; Interim Director of International Research, CWAM from October 2003 to December 2004; President of Columbia Acorn Trust since 2003. | | | 10 | | | Columbia Acorn Trust | |
|
Ralph Wanger, 72,
Trustee (3) | | | 1994 | | | Founder, former President, Chief Investment Officer and portfolio manager, CWAM from July 1992 to September 2003; former President, Columbia Acorn Trust from April 1992 through September 2003; former President, Wanger Advisors Trust 1994 through September 2003; Director, Wanger Investment Company PLC; advisor to CWAM from September 2003 to September 2005. | | | 10 | | | Columbia Acorn Trust | |
|
| Officers of Wanger Advisors Trust: | |
|
Ben Andrews, 41,
Vice President | | | 2004 | | | Analyst and portfolio manager, CWAM since 1998; Vice President, Columbia Acorn Trust. | | | 10 | | | None | |
|
Michael G. Clarke, 38,
Assistant Treasurer | | | 2004 | | | Assistant Treasurer, Columbia Acorn Trust; Chief Accounting Officer and Assistant Treasurer of the Columbia Funds since October 2004; Director of Fund Administration of Columbia Management Advisors, LLC since January 2006; Managing Director of Columbia Management Advisors, LLC from September 2004 to December 2005; Vice President, Fund Administration of Columbia Management Advisors, LLC from June 2002 to September 2004. | | | 10 | | | None | |
|
Jeffrey Coleman, 38,
Assistant Treasurer | | | 2006 | | | Assistant Treasurer, Columbia Acorn Trust since March 2006; Director of Fund Administration, CWAM since January 2006; Fund Controller, CWAM from October 2004 to January 2006; Vice President of CDC IXIS Asset Management Services, Inc. (investment management) from August 2000 to September 2004. | | | 10 | | | None | |
|
29
Wanger International Small Cap 2007 Annual Report
Board of Trustees and Management of Wanger Advisors Trust
Name, Position(s) with
Wanger Advisors
Trust and Age at
December 31, 2007 | | Year First
Elected or
Appointed
to Office | | Principal Occupation(s) during
Past Five Years | | Number of
Portfolios in
Fund Complex
Overseen
by Trustee/Officer | | Other
Directorships | |
J. Kevin Connaughton, 43,
Assistant Treasurer | | | 2001 | | | Treasurer and Chief Financial Officer of the Columbia Funds since December 2000; Vice President of Columbia Management Advisors, LLC since April 2003; Assistant Treasurer of Columbia Acorn Trust since 2001; Treasurer and Chief Financial Officer of the Liberty Funds, Stein Roe Funds and Liberty All-Star Funds from December 2000 to December 2006; Treasurer of the Galaxy Funds from September 2002 through November 2005; Treasurer of Columbia Management Multi-Strategy Hedge Fund, LLC from December 2002 through December 2004; and a senior officer of various affiliated entities of the Bank of America Corporation, including other registered and unregistered funds. | | | 10 | | | None | |
|
P. Zachary Egan, 39,
Vice President | | | 2007 | | | Director of International Research, CWAM, since December 2004; portfolio manager, CWAM since 2003; analyst, CWAM since 1999. | | | 10 | | | None | |
|
Peter T. Fariel, 50,
Assistant Secretary | | | 2006 | | | Associate General Counsel, Bank of America since April 2005; prior thereto, Partner, Goodwin Procter LLP (law firm). | | | 10 | | | None | |
|
John Kunka, 37,
Assistant Treasurer | | | 2006 | | | Director of Accounting and Operations, CWAM, since 2006; Assistant Treasurer, Columbia Acorn Trust, since 2006; Manager of Mutual Fund Operations, Calamos Advisors, Inc. from 2005 to 2006; prior thereto, Manager of Mutual Fund Administration, Van Kampen Investments. | | | 10 | | | None | |
|
Joseph LaPalm, 37,
Vice President | | | 2006 | | | Chief Compliance Officer, CWAM since 2005; Vice President, Columbia Acorn Trust since 2006; prior thereto, Compliance Officer, William Blair & Company (investment firm). | | | 10 | | | None | |
|
Bruce H. Lauer, 50,
Vice President,
Secretary and Treasurer | | | 1995 | | | Chief Operating Officer, CWAM since April 2000; Vice President, Treasurer and Secretary, Columbia Acorn Trust; Director, Wanger Investment Company PLC; Director, Banc of America Capital Management (Ireland) Ltd.; Director, Bank of America Global Liquidity Fund, PLC. | | | 10 | | | None | |
|
Louis J. Mendes, 43,
Vice President | | | 2005 | | | Analyst and portfolio manager, CWAM since 2001; Vice President, Columbia Acorn Trust. | | | 10 | | | None | |
|
Robert A. Mohn, 46,
Vice President | | | 1997 | | | Analyst and portfolio manager, CWAM since August 1992; Director of Domestic Research, CWAM since March 2004; Vice President, Columbia Acorn Trust. | | | 10 | | | None | |
|
Christopher Olson, 43,
Vice President | | | 2001 | | | Analyst and portfolio manager, CWAM since January 2001; Vice President, Columbia Acorn Trust. | | | 10 | | | None | |
|
Robert Scales, 55,
Chief Compliance Officer,
Chief Legal Officer,
Senior Vice President and General Counsel | | | 2004 | | | Chief Compliance Officer, Senior Vice President, Chief Legal Officer and General Counsel, Columbia Acorn Trust since 2004; prior thereto, Associate General Counsel, Grant Thornton LLP. | | | 10 | | | None | |
|
Linda Roth-Wiszowaty, 38,
Assistant Secretary | | | 2006 | | | Business support analyst, CWAM, since April 2007; Assistant Secretary, Columbia Acorn Trust; executive administrator, CWAM since April 2004; prior thereto, executive assistant to the Chief Operating Officer, CWAM. | | | 10 | | | None | |
|
(1) Effective January 1, 2008, Trustee is no longer treated as an "interested person," as defined in the Investment Company Act of 1940, as amended (the "1940 Act"). Prior to January 1, 2008, Trustee was considered an "interested person" of the Trust and of CWAM, as defined in the 1940 Act, as a result of her previous affiliation with J.P. Morgan Chase & Co. Incorporated, a registered broker-dealer that may execute portfolio transactions for or engage in principal transactions with the Funds or other clients or funds advised by CWAM or its affiliates.
(2) Trustee who is an "interested person" of the Trust and of CWAM, as defined in the 1940 Act, because he is an officer of the Trust and of CWAM.
(3) Trustee who is treated as an "interested person" of the Trust and of CWAM, as defined in the 1940 Act, because he is a former officer of the Trust and former employee of and consultant to CWAM.
30
Wanger International Small Cap 2007 Annual Report

Wanger Advisors Trust
Transfer Agent,
Dividend Disbursing Agent
Columbia Management Services, Inc.
P.O. Box 8081
Boston, Massachusetts
02266-8081
Distributor
Columbia Management Distributors, Inc.
One Financial Center
Boston, Massachusetts
02111-2621
Investment Adviser
Columbia Wanger Asset Management, L.P.
227 West Monroe Street, Suite 3000
Chicago, Illinois 60606
1-888-4-WANGER
(1-888-492-6437)
Legal Counsel
Bell, Boyd & Lloyd LLP
Chicago, Illinois
Independent Registered
Public Accounting Firm
PricewaterhouseCoopers LLP
Chicago, Illinois
This report, including the schedules of investments and financial statements, is submitted for the general information of the shareholders of the Wanger Advisors Trust.
A description of the Fund's proxy voting policies and procedures and a copy of the Fund's voting record for the most recent 12-month period ended June 30 are available (i) on the Securities and Exchange Commission's website at www.sec.gov, and (ii) without charge, upon request, by calling 1-888-492-6437.
The Fund files a complete schedule of portfolio holdings with the SEC for the first and third quarters of each fiscal year on Form N-Q. The Fund's Form N-Q is available on the SEC's website at www.sec.gov and may be reviewed and copied at the SEC's Public Reference Room in Washington, D.C. Information on the operation of the Pubic Reference Room may be obtained by calling 1-800-SEC-0330.
31
Wanger Advisors Trust
SHC-43/149302-1207 08/51334
Wanger Select
2007 Annual Report

| NOT FDIC INSURED | | May Lose Value | |
|
| NOT BANK ISSUED | | No Bank Guarantee | |
|

Wanger Select
2007 Annual Report
Table of Contents
| | 1 | | | Understanding Your Expenses | |
|
| | 2 | | | Ponzi Schemes and Politicians' Dreams | |
|
| | 4 | | | Performance Review | |
|
| | 6 | | | Statement of Investments | |
|
| | 9 | | | Statement of Assets and Liabilities | |
|
| | 9 | | | Statement of Operations | |
|
| | 10 | | | Statement of Changes in Net Assets | |
|
| | 11 | | | Financial Highlights | |
|
| | 12 | | | Notes to Financial Statements | |
|
| | 15 | | | Report of Independent Registered Public Accounting Firm | |
|
| | 16 | | | Federal Income Tax Information | |
|
| | 17 | | | Management Fee Evaluation of the Senior Officer | |
|
| | 21 | | | Board Approval of the Advisory Agreement | |
|
| | 23 | | | Board of Trustees and Management of Wanger Advisors Trust | |
|
Columbia Wanger Asset Management, L.P. ("CWAM") is one of the leading global small- and mid-cap equity managers in the United States with more than 37 years of small- and mid-cap investment experience. As of December 31, 2007, CWAM manages $36.8 billion in assets and is the investment adviser to Wanger U.S. Smaller Companies, Wanger International Small Cap, Wanger Select, Wanger International Select (together, the "Wanger Advisors Trust Funds") and the Columbia Acorn Family of Funds. Columbia Management Group, LLC ("Columbia Management") is the investment management division of Bank of America Corporation. Columbia Management entities furnish investment management services and products for institutional and individual investors. The Wanger Advisor Trust Funds and the Columbia Acor n Family of Funds (together with other funds advised by Columbia Management Affiliates, the "Columbia Funds") are distributed by Columbia Management Distributors, Inc., member of FINRA, SIPC, part of Columbia Management and an affiliate of Bank of America Corporation. CWAM is an SEC-registered investment adviser and indirect, wholly owned subsidiary of Bank of America Corporation. CWAM is part of Columbia Management.
Please consider the investment objectives, risks, charges and expenses for the Fund carefully before investing. Contact 1-888-4-WANGER for a prospectus, which contains this and other important information about the Fund. You should read it carefully before you invest.
The views expressed in "Ponzi Schemes and Politicians' Dreams" and in the Performance Review reflect the current views of the respective parties. These views are not guarantees of future performance and involve certain risks, uncertainties and assumptions that are difficult to predict so actual outcomes and results may differ significantly from the views expressed. These views are subject to change at any time based upon economic, market or other conditions and the respective parties disclaim any responsibility to update such views. These views may not be relied on as investment advice and, because investment decisions for a Columbia Fund are based on numerous factors, may not be relied on as an indication of trading intent on behalf of any particular Columbia Fund. References to specific company securities should not be construed as a recommendation or investment advice.
Wanger Select 2007 Annual Report
Understanding Your Expenses
As a Fund shareholder, you incur two types of costs. There are transaction costs, which generally include sales charges on purchases and may include redemption or exchange fees. There are also ongoing costs, which generally include investment advisory fees and other Fund expenses. The information on this page is intended to help you understand your ongoing costs of investing in the Fund and to compare these costs with the ongoing costs of investing in other mutual funds.
Analyzing your Fund's expenses
To illustrate these ongoing costs, we have provided an example and calculated the expenses paid by investors in the Fund during the period. The information in the following table is based on an initial hypothetical investment of $1,000, which is invested at the beginning of the period and held for the entire period. Expense information is calculated two ways and each method provides you with different information. The amount listed in the "Actual" column is calculated using actual operating expenses and total return for the Fund. The amount listed in the "Hypothetical" column assumes that the return each year is 5% before expenses and then applies the Fund's actual expense ratio for the period to the hypothetical return. You should not use the hypothetical account values and expenses to estimate either your actual account balance at the end of the period or the expenses you paid during the period. See the "Compare with other fun ds" information for details on using the hypothetical data.
Estimating your actual expenses
To estimate the expenses that you actually paid over the period, first you will need your account balance at the end of the period.
1. Divide your ending account balance by $1,000. For example, if an account balance was $8,600 at the end of the period, the result would be 8.6.
2. In the section of the table below titled "Expenses paid during the period," you will find a dollar amount in the column labeled "Actual." Multiply this amount by the result from step 1. Your answer is an estimate of the expenses you paid on your account during the period.
July 1, 2007 – December 31, 2007
| | | Account value at the
beginning of the period ($) | | Account value at the
end of the period ($) | | Expenses paid during
period ($) | | Fund's annualized
expense ratio (%)* | |
| | | Actual | | Hypothetical | | Actual | | Hypothetical | | Actual | | Hypothetical | | Actual | |
| Wanger Select | | | 1,000.00 | | | | 1,000.00 | | | | 939.41 | | | | 1,020.72 | | | | 4.35 | | | | 4.53 | | | | 0.89 | | |
*For the six months ended December 31, 2007.
Expenses paid during the period are equal to the Fund's annualized expense ratio, multiplied by the average account value over the period, then multiplied by the number of days in the Fund's most recent fiscal half-year and divided by 365.
It is important to note that the expense amounts shown in the table are meant to highlight only ongoing costs of investing in the Fund. Expenses paid during the period do not include any insurance charges imposed by your insurance company's separate account. The hypothetical example provided is useful in comparing ongoing costs only and will not help you determine the relative total costs of owning different funds whose shareholders may incur transaction costs.
Compare with other funds
Since all mutual funds are required to include the same hypothetical calculations about expenses in shareholder reports, you can use this information to compare the ongoing cost of investing in the Fund with other funds. To do so, compare the 5% hypothetical example with the 5% hypothetical examples of other funds. As you compare hypothetical examples of other funds, it is important to note that hypothetical examples are meant to highlight the ongoing cost of investing in a fund and do not reflect any transaction costs, such as sales charges, redemption fees or exchange fees that may be incurred by shareholders of other funds. Expenses paid during the period do not include any insurance charges imposed by your insurance company's separate accounts.
1
Wanger Select 2007 Annual Report

Ponzi Schemes and Politicians' Dreams
Each December I attend The University of Chicago Business Forecast luncheon. Typically the event features economic forecasts by two economists, plus a summary of world political and economic issues provided by Professor Marvin Zonis.1 At this year's luncheon Professor Zonis stated that the U.S. Government had $50 trillion of unfunded liabilities. That's a staggering figure! Could it really be correct?
"Trust Me" Trust Funds
I've found that there is no precise U.S. Government unfunded liability number, though there are estimates. The U.S. Government Accountability Office (GAO) notes material weaknesses in federal government accounting in general, but has expressed an unqualified opinion on its 2007 Statement of Social Insurance. Any calculation of unfunded liabilities requires numerous actuarial assumptions plus a time horizon. The calculations by various government agencies cover liabilities for 75 years into the future.
However, it does appear that Professor Zonis' $50 trillion estimate was wrong. That number is now too low. On December 17, 2007, the GAO estimated that the U.S. Government's total reported liabilities, net social insurance commitments, and other fiscal exposures were approximately $53 trillion.2 With apologies to the late Senator Everett Dirksen (Republican: Illinois), it seems that a trillion here and a trillion there adds up.3
Despite well-publicized concerns about Social Security, Medicare is in worse shape. Created in the 1930s, Social Security seems to have been a warm-up for bigger unfunded liabilities later on. Social Security is better funded, as Social Security tax rates are higher than Medicare tax rates. Medicare was signed into law in 1965 and spending for the program quickly ran out of control. The original cost estimate for Medicare hospital insurance in 1990, for example, was $9 billion; the actual cost that year hit $67 billion!4 According to the GAO, Medicare alone has over $36 trillion of unfunded liabilities.
But what of the Social Security and Medicare Trust Funds, the Funds that politicians promised to put in a "lock box?" It turns out the politicians spent the money elsewhere and the Trust Funds loaned their money to the U.S. Treasury by buying government bonds. The Trust Funds have no true third-party assets, but simply have promises from the U.S. Treasury to pay in the future. In order for the payments to be made the Treasury will have to raise taxes, cut other spending, borrow or print money.
What was the latest change that politicians made concerning unfunded liabilities? They increased them, by adding prescription drugs to Medicare's benefits. This addition is noteworthy for three reasons. First, little new funding was created; enrollee premiums cover only about 25% of costs. Second, the program's costs and benefits are highly skewed. Baby boomers will have a net benefit of about $20,000 each while younger workers and future generations will have net costs of between $2,500 and $4,200 each.5 Third, when the new benefits were fully implemented in 2006, they drove a 19% increase in Medicare costs, the largest increase in decades. Over $10 trillion of Medicare's unfunded liability is from the drug program.
What are this year's presidential candidates saying about the unfunded liability problem? Virtually nothing and, even though taxpayers cannot afford Social Security, Medicare and other existing programs, some candidates are touting new proposals that substantially broaden federal health care spending. These plans include additional entitlements and mandatory, subsidized, health insurance participation. Cost estimates are dubious but range from $50 to $120 billion yearly.
Given the huge existing liabilities and proposals for additional benefits it appears that the U.S. Government is operating an enormous Ponzi Scheme.6 Initial participants benefit but most taxpayers are likely to lose.
Large Liabilities and Possible Solutions
$53 trillion is a huge number, nearly four times all the goods and services produced in the United States in 2007. Currently Social Security is running a yearly surplus while Medicare is running a deficit. But the aging of baby boomers is driving yearly Medicare and Social Security spending higher, so the programs' cash needs will become very large in the next decade. Medicare deficits are projected to consume 25% of all federal income taxes by 2020. By 2050, Social Security, Medicare, and Medicaid will grow from 9% to 18% of GDP. This contrasts to total federal spending averaging about 20% of GDP over the last 50 years.7
Some of the richest people in America say their taxes are too low. What if they were taxed at 100%? Not 100% of income but 100% of their net worth! This "Che Guevara lite" (confiscation without murder) solution, if applied to the 2007 Forbes list of the richest 400 Americans, would yield a one-time receipt of $1.54 trillion. That would cover 2.9% of the problem, but is of course not a real solution as it would destroy capitalism.
How about raising tax rates on all of us? The Laffer Curve8 exists—there is an income tax rate that will yield the highest dollar amount of taxes, and that rate appears to be well under 100%. Even famed British economist John Maynard Keynes said that reducing too-high tax rates results in higher tax revenues. Very high tax rates choke economic activity and spur taxpayers to take
2
Wanger Select 2007 Annual Report
legal and illegal measures to reduce payments.
Since federal income taxes began in 1913, there have been three rounds of major income tax rate cuts in the United States, and each resulted in faster economic growth and, ultimately, higher taxes collected. Paradoxically, though the rate cuts provided those with higher incomes the largest benefits, higher income people ended up paying greater percentages of total tax collections. A number of countries, including former Soviet republics, have adopted low, flat income tax rates and have seen economic growth surge and tax receipts increase.
No one knows what income tax rates create the highest tax revenues over the long run. In the last 50 years, the highest marginal tax rates in the United States have varied from a pre-Kennedy rate cut peak of 91% to a post-Reagan rate cut trough of 28%. Surprisingly, total federal government revenues as a percentage of GDP during that period have varied modestly, from 16.1% to 20.9%. Fiscal 2007 revenues were a bit above the midpoint, at 18.8% of GDP.9
While somewhat higher tax rates would probably increase near-term tax revenues, it is unlikely that substantially higher income tax rates alone can boost government receipts to the 30% or so of GDP eventually needed to fully fund the promised benefits. Massive value added taxes or sales taxes would likely be needed to provide tax revenue percentages that high. But huge tax hikes of any sort are likely to hurt economic growth, and additional solutions are needed.
As substantial liabilities become due in the next decade, there is an increased likelihood that voters will elect more courageous politicians that will strive to control spending and enact needed reforms. Perhaps the best single reform would be to restore more free market elements to our health care system. There needs to be more price transparency plus incentives for individuals and health care providers to control spending. Streamlined drug approval processes and additional tort reform would also help.
Incentives for innovation, rather than arbitrary price controls, are crucial. Improved technology has enabled over a 99.99% reduction in the cost of genome mapping in the last seven years. As costs continue to drop and advances continue to be made in biotechnology and pharmaceuticals, new ways to diagnose, treat and cure diseases are likely. Treatments customized to genetic factors promise to be much more effective and result in fewer side effects than many current drugs. The Wanger Funds have begun to own stocks in companies that are pursuing genetic tests, novel drugs and devices, plus information technology for better managing health care administration.
Outside the health care sector, Professor Jeremy Siegel has suggested that a solution for America's savings and retirement crisis will be sales of American assets to foreigners, especially those from countries with higher savings rates and younger populations. Innovative small- and mid-cap companies appear particularly attractive to foreigners, especially now that the dollar has weakened.


Charles P. McQuaid
President and Chief Investment Officer
Columbia Wanger Asset Management, L.P.
Opinions expressed in this essay are those of the author and are not necessarily those of Columbia Wanger Asset Management, its parent organizations or the Board.
1 Marvin Zonis is a professor emeritus at the Graduate School of Business at The University of Chicago, where he teaches courses on International Political Economy, Leadership and Business Strategy in the Era of E-Commerce.
2 Estimates by the Congressional Budget Office, Medicare trustees, and some private sources are higher.
3 Dirksen has been quoted as saying, "A billion here and a billion there, and pretty soon you're talking real money," but the Dirksen Congressional Center has been unable to verify the statement.
4 Source: American Enterprise Institute for Public Policy Research website, www.aei.org, "Medicare Prescription Drugs: Medical Necessity Meets Fiscal Insanity," by Joseph Antos and Jagadeesh Gokhale. Posted February 17, 2005.
5 Ibid.
6 In the 1920's, Charles Ponzi enticed investors with a bogus investment opportunity that promised a 40% return on their investment in just 90 days. Early investors were paid with dollars from later investors but most lost their money. Ponzi served four years in prison for this fraud, and then proceeded to promote other dubious ventures. He died in a charity ward of a Rio de Janeiro hospital in 1949.
7 Included in testimony on the future of Social Security presented by the Concord Coalition (www.concordcoalition.org) to a Senate special committee on aging, February 3, 2005.
8 The Laffer Curve is used to illustrate the concept of taxable income elasticity, the idea that government can maximize tax revenue by setting tax rates at an optimum point and that neither a 0% tax rate nor a 100% tax rate will generate government revenue. The curve was popularized by U.S. economics professor Arthur Laffer (b. 1940).
9 Congressional Budget Office testimony, "The Long-term Budget Outlook," December 13, 2007.
3
Wanger Select 2007 Annual Report

Performance Review Wanger Select

Ben Andrews
Portfolio Manager
Performance data quoted represents past performance and current performance may be lower or higher. Past performance is no guarantee of future results. The investment return and principal value of an investment in the Fund will fluctuate so that shares, when redeemed, may be worth more or less than the original cost. For daily and most recent month-end performance updates, please call 1-888-4-WANGER.
Wanger Select ended the year up 9.39%. This compares to a 7.98% increase for the Fund's benchmark, the S&P MidCap 400 Index, and a 5.49% gain for the large-cap oriented S&P 500 Index. I am pleased that the Fund beat its benchmark for the year.
At the writing of this commentary, we have entered the first quarter of 2008 and many believe the United States has already slipped into a recession. As we look back on the carnage that concluded by the end of the second week in January, a lot of small- and mid-cap stocks have already lost 40% of their value in the last six months. We may be early on in the recession (time wise) but the destruction of capital has already been significant. Therefore, I believe the market may already reflect a large amount of the capital losses that we'll see with this current recession. I put a handful of what I believe to be turnaround candidates in the portfolio in the first half of 2007. These stocks were fairly washed out upon purchase and were taking steps that I believed would improve their fundamentals. In theory, the return to growth for these companies should be counter cyclical to the U.S. economy's woes. So far their improvements have not been meaningful and their shares have continued to decline. This was not the idea but in reviewing these positions, I am more excited by the changes taking place at these companies now than I was when I bought them. If this pattern of improvement can continue, then these stocks could give us the desired effect in a sluggish economic environment. If not, the holdings may be replaced.
During the second half of the year, we added seven new names while removing one. We exited the Fund's position in Liberty Global late in the year due to its increased valuation and our concern that its European franchise will experience greater competition than we previously believed. The seven added companies were VisionChina Media, CardTronics, Diamond Offshore, Petro Rubiales Energy, Knoll, American Reprographics and Bovespa.
We took advantage of market chaos at the end of the year to purchase VisionChina Media and CardTronics in IPOs at lower than the initial offering price. The price for VisionChina was set at $11 but that didn't generate enough interest from nervous investors so we were able to reset the price with a bid of $8. CardTronics was initially offered at $10 and instantly collapsed below the offering. The underwriter then spent all morning buying back stock in an attempt to defend the deal. Our traders went to them in the afternoon and bid $85/8 for 25% of the deal, thus eliminating the over supply of accounts that just wanted to fli p the stock. We believe a purchase at this level may reward our shareholders over the coming quarters. VisionChina Media uses real-time mobile digital television broadcast to deliver content and advertising on mass transportation systems in China. CardTronics owns and manages the largest fleet of ATM machines worldwide.
Diamond Offshore and Petro Rubiales Energy add to the Fund's energy sector exposure. Diamond rents offshore drilling rigs to oil exploration companies. Wanger Select holds another company in this business as well, Atwood Oceanics. Together these two positions account for 1.5% of the portfolio. Petro Rubiales Energy, an oil exploration company with assets in Colombia, shows promise as Colombia focuses on becoming an international oil supplier.
The remaining new names were purchased because we believe they won't be significantly damaged by the current market turmoil. They include office interiors and office furniture systems manufacturer Knoll and American Reprographics. American Reprographics is the largest provider of document management services to the architectural, engineering and construction industries. Its stock fell 50% in the last six months of 2007, allowing us to purchase it at what we believe to be a bargain price. Finally, we added Bovespa, the owner of the Sao Paulo stock exchange.
Risks include stock market fluctuations due to economic and business developments. The Fund also has potentially greater price volatility due to the Fund's concentration in a limited number of stocks of mid-size companies. The Fund is a non-diversified fund and may, therefore, have a greater risk of loss from a few issuers than a similar fund that invests more broadly. The Fund may not operate as a nondiversified fund at all times. International investments involve greater potential risks, including less regulation, currency fluctuations, economic instability and political developments.
Fund's Positions in Mentioned Holdings
As a % of net assets, as of 12/31/07
| Petro Rubiales Energy | | | 2.9 | % | |
| Atwood Oceanics | | | 1.0 | | |
| CardTronics | | | 0.8 | | |
| Knoll | | | 0.7 | | |
| Diamond Offshore | | | 0.6 | | |
| American Reprographics | | | 0.5 | | |
| VisionChina Media | | | 0.5 | | |
| Bovespa | | | 0.4 | | |
| Liberty Global | | | 0.0 | | |
Portfolio holdings are subject to change periodically and may not be representative of current characteristics and holdings.
4
Wanger Select 2007 Annual Report
Growth of a $10,000 Investment in
Wanger Select
Total return for each period,
February 1, 1999 (inception date) through December 31, 2007

This graph compares the results of $10,000 invested in Wanger Select on February 1, 1999 (the date the Fund began operations) through December 31, 2007, to the S&P MidCap 400 Index, with dividends and capital gains reinvested. Part of the performance shown is due to the Fund's purchase of securities in IPOs. The impact of IPO purchases declines as a Fund grows large. Performance results reflect any fee waivers or reimbursements of Fund expenses by CWAM or any of its affiliates. Absent these fee waivers or reimbursement arrangements, performance results would have been lower. Performance shown here is past performance, which cannot guarantee future results. Current performance may be higher or lower. The investment return and principal value of an investment in the Fund will fluctuate so that Fund shares, when redeemed, may be worth more or less than their original cost. Performance changes over time. Current returns for t he Fund may be different than that shown. For daily and most recent month-end performance updates, please contact us at 1-888-4-WANGER.
Results to December 31, 2007
| | | 4th quarter | | 1 year | |
| Wanger Select | | | -5.04 | % | | | 9.39 | % | |
| S&P MidCap 400 Index | | | -2.73 | | | | 7.98 | | |
| S&P 500 Index | | | -3.33 | | | | 5.49 | | |
NAV as of 12/31/07: $28.08
Performance numbers reflect all Fund expenses but do not include any insurance charge imposed by your insurance company's separate accounts. If performance included the effect of these additional charges, it would be lower.
The Fund's annual operating expense ratio is 0.94%. The annual operating expense ratio is as stated in the Fund's prospectus that is current as of the date of this report. Differences in expense ratios disclosed elsewhere in this report may result from including fee waivers and reimbursements as well as different time periods used in calculating the ratios.
All results shown assume reinvesment of distributions and do not reflect taxes that a shareholder would pay on Fund distributions or the sale of Fund shares.
The S&P MidCap 400 Index is a market value-weighted index that tracks the performance of 400 mid-cap U.S. companies. The S&P 500 tracks the performance of 500 widely-held large capitalization U.S. stocks. Indexes are not managed and do not incur fees or expenses. It is not possible to invest directly in an index.
Portfolio characteristics and holdings are subject to change periodically and may not be representative of current characteristics and holdings.
Top 5 Industries
As a % of net assets, as of 12/31/07
| Consumer Goods & Services | | | 25.7 | % | |
| Information | | | 21.9 | | |
| Energy & Minerals | | | 21.2 | | |
| Finance | | | 13.6 | | |
| Industrial Goods & Services | | | 9.4 | | |
Top 10 Holdings
As a % of net assets, as of 12/31/07
1. Potash Corp. of Saskatchewan (Canada)
World's Largest Producer of Potash | | 6.5%
| |
2. Uranium One (South Africa)
Uranium Mines in South Africa, Kazakhstan, Australia & the U.S. | | 5.3
| |
3. Janus Capital Group
Manages Mutual Funds | | 4.5
| |
4. Abercrombie & Fitch
Teen Apparel Retailer | | 4.3
| |
5. Conseco
Life, Long-term Care & Medical Supplemental Insurance | | 4.0
| |
6. Safeway
Supermarkets | | 4.0
| |
7. Expedia
Online Travel Services Company | | 3.7
| |
8. Tellabs
Telecommunications Equipment | | 3.6
| |
9. ITT Educational Services
Post-secondary Degree Services | | 3.6
| |
10. American Tower
Communications Towers in USA & Mexico | | 3.2
| |
5
Wanger Select 2007 Annual Report
Wanger Select
Statement of Investments December 31, 2007
Number of
Shares | | | | Value | |
| | | Common Stocks – 94.0% | |
| | | Consumer Goods & Services – 25.7% | |
| | | Retail – 11.2% | |
| | 169,000 | | | Abercrombie & Fitch
Teen Apparel Retailer | | | $13,514,930
| | |
| | 367,000 | | | Safeway
Supermarkets | | | 12,555,070
| | |
| | 87,000 | | | Costco Wholesale
Warehouse Superstores | | | 6,069,120
| | |
| | 357,000 | | | Chico's FAS (a)
Women's Specialty Retailer | | | 3,223,710
| | |
| | | | | | | | 35,362,830 | | |
| | | Travel – 4.7% | |
| | 367,000 | | | Expedia (a)
Online Travel Services Company | | | 11,604,540
| | |
| | 204,000 | | | Hertz (a)
Largest U.S. Rental Car Operator | | | 3,241,560
| | |
| | | | | | | | 14,846,100 | | |
| | | Other Consumer Services – 4.4% | |
| | 134,000 | | | ITT Educational Services (a)
Post-secondary Degree Services | | | 11,426,180
| | |
| | 153,100 | | | Universal Technical Institute (a)
Vocational Training | | | 2,602,700
| | |
| | | | | | | | 14,028,880 | | |
| | | Leisure Products – 2.2% | |
| | 82,000 | | | Harley-Davidson
Motorcycles & Related Merchandise | | | 3,830,220
| | |
| | 77,000 | | | International Speedway
Largest Motorsports Racetrack
Owner & Operator | | | 3,170,860
| | |
| | | | | | | | 7,001,080 | | |
| | | Furniture & Textiles – 1.6% | |
| | 86,300 | | | Herman Miller
Office Furniture | | | 2,795,257
| | |
| | 140,000 | | | Knoll
Office Furniture | | | 2,300,200
| | |
| | | | | | | | 5,095,457 | | |
| | | Apparel – 1.6% | |
| | 160,000 | | | Coach (a)
Designer & Retailer of Branded Leather
Accessories | | | 4,892,800
| | |
| | | | | Consumer Goods & Services – Total | | | 81,227,147 | | |
Number of
Shares | | | | Value | |
| | | Information 21.9% | |
| | | Mobile Communications – 5.0% | |
| | 238,000 | | | American Tower (a)
Communications Towers in USA & Mexico | | | $10,138,800
| | |
| | 700,600 | | | Globalstar (a)
Satellite Mobile Voice & Data Carrier | | | 5,604,800
| | |
| | | | | | | | 15,743,600 | | |
| | | Business Software – 3.7% | |
| | 239,000 | | | Avid Technology (a)
Digital Nonlinear Editing
Software & Systems | | | 6,773,260
| | |
| | 740,000 | | | Novell (a)
Directory, Operating System & Identity
Management Software | | | 5,083,800
| | |
| | | | | | | | 11,857,060 | | |
| | | Telecommunications Equipment – 3.6% | |
| | 1,756,000 | | | Tellabs (a)
Telecommunications Equipment | | | 11,484,240
| | |
| | | Contract Manufacturing – 2.2% | |
| | 3,791,000 | | | Sanmina-SCI (a)
Electronic Manufacturing Services | | | 6,899,620
| | |
| | | Semiconductors & Related Equipment – 2.2% | |
| | 245,000 | | | Canadian Solar (a)
Solar Cell & Module Manufacturer | | | 6,896,750
| | |
| | | CATV – 2.0% | |
| | 258,000 | | | Discovery Holding (a)
CATV Programming | | | 6,486,120
| | |
| | | Internet Related – 1.8% | |
| | 600,000 | | | SkillSoft (a)
Web-based Learning Solutions (E-Learning) | | | 5,736,000
| | |
| | | Financial Processors – 0.8% | |
| | 236,000 | | | CardTronics (a)
Operates the World's Largest Network
of ATMs | | | 2,385,960
| | |
| | | Advertising – 0.5% | |
| | 168,000 | | | VisionChina Media (China) (a)
Advertising on Digital Screens in China's
Mass Transit System | | | 1,428,000
| | |
| | | Computer Services – 0.1% | |
| | 86,500 | | | AnswerThink
IT Integration & Best Practice Research | | | 418,660
| | |
| | | | | Information – Total | | | 69,336,010 | | |
See accompanying notes to financial statements.
6
Wanger Select 2007 Annual Report
Wanger Select
Statement of Investments December 31, 2007
Number of
Shares | | | | Value | |
| | | Energy & Minerals – 21.2% | |
| | | Mining – 11.7% | |
| | 141,800 | | | Potash Corp. of Saskatchewan (Canada)
World's Largest Producer of Potash | | | $20,413,528
| | |
| | 1,859,000 | | | Uranium One (South Africa) (a)
Uranium Mines in South Africa,
Kazakhstan, Australia & the U.S. | | | 16,632,018
| | |
| | | | | | | | 37,045,546 | | |
| | | Oil Services – 6.6% | |
| | 573,500 | | | Tetra Technologies (a)
U.S.-based Services Company with
Life of Field Approach | | | 8,929,395
| | |
| | 124,000 | | | FMC Technologies (a)
Oil & Gas Wellhead Manufacturer | | | 7,030,800
| | |
| | 30,500 | | | Atwood Oceanics (a)
Offshore Drilling Contractor | | | 3,057,320
| | |
| | 13,000 | | | Diamond Offshore
Contract Driller | | | 1,846,000
| | |
| | | | | | | | 20,863,515 | | |
| | | Oil & Gas Producers – 2.9% | |
| | 5,505,000 | | | Petro Rubiales Energy (Canada) (a)(b) | | | 8,006,918 | | |
| | 1,932,950 | | | Petro Rubiales Energy - Warrants
(Canada) (a)(b) | | | 1,066,408 | | |
| | 10,000 | | | Petro Rubiales Energy (Canada) (a)
Oil Production & Exploration in Colombia | | | 14,691
| | |
| | | | 9,088,017 | | |
| | | | | Energy & Minerals – Total | | | 66,997,078 | | |
| | | Finance – 13.6% | |
| | | Insurance – 7.1% | |
| | 1,001,000 | | | Conseco (a)
Life, Long-term Care & Medical
Supplement Insurance | | | 12,572,560
| | |
| | 11,500 | | | Markel (a)
Specialty Insurance | | | 5,647,650
| | |
| | 245,000 | | | Montpelier Re
Commercial Lines Insurance/Reinsurance | | | 4,167,450
| | |
| | | | | | | | 22,387,660 | | |
Number of
Shares | | | | Value | |
| | | | Brokerage & Money Management – 6.5% | | |
| | 429,000 | | | Janus Capital Group
Manages Mutual Funds | | | $14,092,650
| | |
| | 165,000 | | | SEI Investments
Mutual Fund Administration & Investment
Management | | | 5,308,050
| | |
| | 65,200 | | | Bovespa (Brazil) (a)
Brazil Equity & Derivative Exchange | | | 1,256,382
| | |
| | | | 20,657,082 | | |
| | | | | Finance – Total | | | 43,044,742 | | |
| | | Industrial Goods & Services – 9.4% | |
| | | Other Industrial Services – 4.2% | |
| | 147,000 | | | Expeditors International of Washington
International Freight Forwarder | | | 6,567,960
| | |
| | 310,000 | | | American Commercial Lines (a)
Operator/Builder of Inland Barges | | | 5,034,400
| | |
| | 102,000 | | | American Reprographics (a)
Document Management & Logistics | | | 1,680,960
| | |
| | | | | | | | 13,283,320 | | |
| | | Outsourcing Services – 2.4% | |
| | 289,000 | | | Quanta Services (a)
Electrical & Telecom Construction Services | | | 7,583,360
| | |
| | | Waste Management – 1.5% | |
| | 143,000 | | | Waste Management
U.S. Garbage Collection & Disposal | | | 4,671,810
| | |
| | | Steel – 1.3% | |
| | 226,000 | | | Worthington Industries
Steel Processing & Manufactured Metal Products | | | 4,040,880
| | |
| | | | | Industrial Goods & Services – Total | | | 29,579,370 | | |
| | | Health Care – 1.1% | |
| | | Health Care Services – 1.1% | |
| | 102,000 | | | Lincare Holdings (a)
Home Health Care Services | | | 3,586,320
| | |
| | | | | Health Care – Total | | | 3,586,320 | | |
| | | Other Industries – 1.1% | |
| | | Transportation – 1.1% | |
| | 128,000 | | | JB Hunt Transport Services
Truck & Intermodal Carrier | | | 3,526,400
| | |
| | | | | Other Industries – Total | | | 3,526,400 | | |
| Total Common Stocks (Cost: $245,715,857) – 94.0% | | | 297,297,067 | | |
See accompanying notes to financial statements.
7
Wanger Select 2007 Annual Report
Wanger Select
Statement of Investments December 31, 2007
| Principal Amount | | | | Value | |
| Short-Term Obligation – 7.1% | |
| $ | 22,618,000 | | | Repurchase Agreement with
Fixed Income Clearing Corp.,
dated 12/31/07, due 01/02/08
at 3.00%, collateralized by a U.S.
Government Agency Obligation,
maturing 03/02/22, market value
$23,073,300 (repurchase
proceeds $22,621,770) | | $ | 22,618,000 | | |
| Total Short-Term Obligation (Cost: $22,618,000) | | | 22,618,000 | | |
| Total Investments (Cost: $268,333,857) – 101.1% (c)(d) | | | 319,915,067 | | |
| Cash and Other Assets Less Liabilities – (1.1)% | | | (3,535,469 | ) | |
| Total Net Assets – 100% | | | 316,379,598 | | |
Notes to Statement of Investments:
(a) Non-income producing security.
(b) Denotes a restricted security, which is subject to restrictions on resale under federal securities laws. These securities are valued in good faith by the Board of Trustees. At December 31, 2007, these securities amounted to $9,073,326 which represents 2.87% of total net assets.
Security | | Acquisition
Dates | | Shares/
Par | |
Cost | |
Value | |
Petro Rubiales
Energy | | 7/12/2007 | | | 5,505,000 | | | $ | 4,132,484 | | | $ | 8,006,918 | | |
Petro Rubiales
Energy - Warrants | | 7/12/2007 | | | 1,932,950 | | | | 551,426 | | | | 1,066,408 | | |
| | | | | | | $ | 4,683,910 | | | $ | 9,073,326 | | |
(c) On December 31, 2007, the market value of foreign securities represents 8.53% of total net assets. The Fund's foreign portfolio was diversified as follows:
| Currency | | Value | | Cost | | % of Net
Assets | |
| Canadian Dollar | | $ | 25,720,035 | | | $ | 17,571,524 | | | | 8.13 | | |
| Brazilian Real | | | 1,256,382 | | | | 1,075,645 | | | | 0.40 | | |
| | | $ | 26,976,417 | | | $ | 18,647,169 | | | | 8.53 | | |
(d) At December 31, 2007, for federal income tax purposes cost of investments was $269,016,365 and net unrealized appreciation was $50,898,702 consisting of gross unrealized appreciation of $83,214,445 and gross unrealized depreciation of $32,315,743.
At December 31, 2007, the Fund held investments in the following sectors:
| Sector | | % of
Net Assets | |
| Consumer Goods & Services | | | 25.7 | | |
| Information | | | 21.9 | | |
| Energy & Minerals | | | 21.2 | | |
| Finance | | | 13.6 | | |
| Industrial Goods & Services | | | 9.4 | | |
| Health Care | | | 1.1 | | |
| Other Industries | | | 1.1 | | |
| Short-Term Obligation | | | 7.1 | | |
| Cash and Other Assets Less Liabilities | | | (1.1 | ) | |
| | | | 100.0 | | |
See accompanying notes to financial statements.
8
Wanger Select 2007 Annual Report
Statement of Assets and Liabilities
December 31, 2007
| Assets: | | | | | |
| Investments, at cost | | $ | 268,333,857 | | |
| Investments, at value | | $ | 319,915,067 | | |
| Cash | | | 252,340 | | |
| Receivable for: | |
| Investments sold | | | 50,994 | | |
| Fund shares sold | | | 108,482 | | |
| Interest | | | 1,885 | | |
| Dividends | | | 50,684 | | |
| Total Assets | | | 320,379,452 | | |
| Liabilities: | |
| Payable for: | |
| Investments purchased | | | 3,197,747 | | |
| Fund shares repurchased | | | 532,790 | | |
| Investment advisory fee | | | 212,850 | | |
| Administration fee | | | 13,303 | | |
| Transfer agent fee | | | 21 | | |
| Trustees' fees | | | 162 | | |
| Custody fee | | | 3,076 | | |
| Chief compliance officer expenses | | | 370 | | |
| Trustees' deferred compensation plan | | | 6,810 | | |
| Other liabilities | | | 32,725 | | |
| Total Liabilities | | | 3,999,854 | | |
| Net Assets | | $ | 316,379,598 | | |
| Composition of Net Assets: | |
| Paid-in capital | | $ | 257,296,023 | | |
| Overdistributed net investment income | | | (646,385 | ) | |
| Accumulated net realized gain | | | 8,148,750 | | |
| Net unrealized appreciation on investments | | | 51,581,210 | | |
| Net Assets | | $ | 316,379,598 | | |
| Fund Shares Outstanding | | | 11,267,751 | | |
Net asset value, offering price and redemption
price per share | | $ | 28.08 | | |
Statement of Operations
For the Year Ended December 31, 2007
| Investment Income: | |
| Dividends (net of foreign taxes withheld of $5,708) | | $ | 830,868 | | |
| Interest | | | 1,160,571 | | |
| Total Investment Income | | | 1,991,439 | | |
| Expenses: | |
| Investment advisory fee | | | 2,196,829 | | |
| Administration fee | | | 63,558 | | |
| Transfer agent fee | | | 252 | | |
| Trustees' fees | | | 12,883 | | |
| Custody fee | | | 22,115 | | |
| Chief compliance officer expenses (See Note 4) | | | 12,968 | | |
| Other expenses (See Note 5) | | | 81,216 | | |
| Total Expenses | | | 2,389,821 | | |
| Custody earnings credit | | | (2,356 | ) | |
| Net Expenses | | | 2,387,465 | | |
| Net Investment Loss | | | (396,026 | ) | |
Net Realized and Unrealized Gain (Loss) on
Investments and Foreign Currency: | |
| Net realized gain (loss) on: | |
| Investments | | | 8,612,772 | | |
| Foreign currency transactions | | | (18,235 | ) | |
| Net realized gain | | | 8,594,537 | | |
| Net change in unrealized appreciation on: | |
| Investments | | | 6,550,022 | | |
| Foreign currency translations | | | 5,019 | | |
| Net change in unrealized appreciation | | | 6,555,041 | | |
| Net Gain | | | 15,149,578 | | |
| Net Increase in Net Assets from Operations | | $ | 14,753,552 | | |
See accompanying notes to financial statements.
9
Wanger Select 2007 Annual Report
Statement of Changes in Net Assets
| | | Year ended December 31, | |
| Increase (Decrease) in Net Assets | | 2007 | | 2006 | |
| Operations: | |
| Net investment loss | | $ | (396,026 | ) | | $ | (280,699 | ) | |
| Net realized gain on investments and foreign currency transactions | | | 8,594,537 | | | | 4,109,684 | | |
| Net change in unrealized appreciation on investments and foreign currency translations | | | 6,555,041 | | | | 21,452,932 | | |
| Net Increase in Net Assets from Operations | | | 14,753,552 | | | | 25,281,917 | | |
| Distributions to Shareholders: | |
| From net investment income | | | — | | | | (466,512 | ) | |
| From net realized gain | | | (3,866,407 | ) | | | (3,873,384 | ) | |
| Total Distributions to Shareholders | | | (3,866,407 | ) | | | (4,339,896 | ) | |
| Share Transactions: | |
| Subscriptions | | | 152,805,878 | | | | 67,137,702 | | |
| Distributions reinvested | | | 3,866,407 | | | | 4,339,896 | | |
| Redemptions | | | (26,526,225 | ) | | | (19,746,917 | ) | |
| Net Increase from Share Transactions | | | 130,146,060 | | | | 51,730,681 | | |
| Total Increase in Net Assets | | | 141,033,205 | | | | 72,672,702 | | |
| Net Assets: | |
| Beginning of period | | | 175,346,393 | | | | 102,673,691 | | |
| End of period | | | 316,379,598 | | | | 175,346,393 | | |
| Overdistributed net investment income at end of period | | | (646,385 | ) | | | (638,940 | ) | |
See accompanying notes to financial statements.
10
Wanger Select 2007 Annual Report
Financial Highlights
| | | Year Ended December 31, | |
| Selected data for a share outstanding throughout each period | | 2007 | | 2006 | | 2005 | | 2004 | | 2003 | |
| Net Asset Value, Beginning of Period | | $ | 26.15 | | | $ | 22.66 | | | $ | 22.11 | | | $ | 18.55 | | | $ | 14.19 | | |
| Income from Investment Operations: | |
| Net investment loss (a) | | | (0.04 | ) | | | (0.05 | ) | | | (0.04 | ) | | | (0.10 | ) | | | (0.11 | ) | |
Net realized and unrealized gain on investments
and foreign currency transactions | | | 2.47 | | | | 4.38 | | | | 2.12 | | | | 3.68 | | | | 4.47 | | |
| Total from Investment Operations | | | 2.43 | | | | 4.33 | | | | 2.08 | | | | 3.58 | | | | 4.36 | | |
| Less Distributions to Shareholders: | |
| From net investment income | | | — | | | | (0.09 | ) | | | — | | | | — | | | | — | | |
| From net realized gains | | | (0.50 | ) | | | (0.75 | ) | | | (1.53 | ) | | | (0.02 | ) | | | — | | |
| Total Distributions to Shareholders | | | (0.50 | ) | | | (0.84 | ) | | | (1.53 | ) | | | (0.02 | ) | | | — | | |
| Net Asset Value, End of Period | | $ | 28.08 | | | $ | 26.15 | | | $ | 22.66 | | | $ | 22.11 | | | $ | 18.55 | | |
| Total Return (b) | | | 9.39 | % | | | 19.70 | % | | | 10.49 | %(c) | | | 19.31 | % | | | 30.73 | % | |
| Ratios to Average Net Assets: | |
| Net expenses (d) | | | 0.90 | % | | | 0.94 | % | | | 0.96 | % | | | 1.10 | % | | | 1.15 | % | |
| Net investment loss (d) | | | (0.15 | )% | | | (0.20 | )% | | | (0.20 | )% | | | (0.49 | )% | | | (0.65 | )% | |
| Waiver | | | — | | | | — | | | | 0.02 | % | | | — | | | | ��� | | |
| Portfolio turnover rate | | | 15 | % | | | 21 | % | | | 26 | % | | | 36 | % | | | 21 | % | |
| Net assets, end of period (000's) | | $ | 316,380 | | | $ | 175,346 | | | $ | 102,674 | | | $ | 82,465 | | | $ | 52,112 | | |
(a) Net investment loss per share was based upon the average shares outstanding during the period.
(b) Total return at net asset value assuming all distributions reinvested.
(c) Had the investment adviser not waived a portion of expenses, total return would have been reduced.
(d) The benefits derived from custody fees paid indirectly had an impact of less than 0.01%.
See accompanying notes to financial statements.
11
Wanger Select 2007 Annual Report
Notes to Financial Statements
1. Nature of Operations
Wanger Select (the "Fund"), is a series of Wanger Advisors Trust (the "Trust"), an open-end management investment company organized as a Massachusetts business trust. The investment objective of the Fund is to seek long-term growth of capital. The Fund is available only for allocation to certain life insurance company separate accounts established for the purpose of funding qualified and non-qualified variable annuity contracts and variable life insurance policies and may also be offered directly to certain types of pension plans and retirement arrangements.
2. Significant Accounting Policies
Security valuation
Securities of the Fund are valued at market value or, if a market quotation for a security is not readily available or is deemed not to be reliable because of events or circumstances that have occurred between the market quotation and the time as of which the security is to be valued, the security is valued at a fair value determined in accordance with procedures established by the Board of Trustees. A security traded on a securities exchange or in an over-the-counter market in which transaction prices are reported is valued at the last sales price at the time of valuation. A security traded principally on NASDAQ is valued at the NASDAQ official closing price. A security for which there is no reported sale on the valuation date is valued at the latest bid quotation. A short term debt obligation having a maturity of 60 days or less from the valuation date is valued at amortized cost, which approximates fair value. A security for which a market quotation is not readily available and any other assets are valued in accordance with procedures established by the Board of Trustees. The Trust has retained an independent statistical fair value pricing service to assist in the fair valuation process for securities principally traded in a foreign market in order to adjust for possible changes in value that may occur between the close of the foreign exchange and the time as of which the securities are to be valued. If a security is valued at fair value, that value may be different from the last quoted market price for the security.
In September 2006, Statement of Financial Accounting Standards No. 157, Fair Value Measurements ("SFAS 157"), was issued. SFAS 157 is effective for fiscal years beginning after November 15, 2007. SFAS 157 defines fair value, establishes a framework for measuring fair value and expands disclosures about fair value measurements. Management is evaluating the impact the application of SFAS 157 will have on the Fund's financial statement disclosures.
Repurchase agreements
The Fund may engage in repurchase agreement transactions. The Fund, through its custodians, receives delivery of underlying securities collateralizing each repurchase agreement. The Fund's custodian determines that the value of the underlying securities is at all times at least equal to the resale price. In the event of default or bankruptcy by the other party to the agreement, realization and/or retention of the collateral may be subject to legal proceedings.
Foreign currency translations
Values of investments denominated in foreign currencies are converted into U.S. dollars using the spot market rate of exchange at the time of valuation. Purchases and sales of investments and dividend and interest income are translated into U.S. dollars using the spot market rate of exchange prevailing on the respective dates of such transactions. The gain or loss resulting from changes in foreign exchange rates is included with net realized and unrealized gain or loss from investments, as appropriate.
Security transactions and investment income
Security transactions are accounted for on the trade date (date the order to buy or sell is executed) and dividend income is recorded on the ex-dividend date, except that certain dividends from foreign securities are recorded as soon as the information is available to the Fund. Interest income is recorded on the accrual basis and includes amortization of discounts on debt obligations when required for federal income tax purposes. Realized gains and losses from security transactions are recorded on an identified cost basis.
Awards, if any, from class action litigation related to securities owned may be recorded as a reduction of cost of those securities. If the applicable securities are no longer owned, the proceeds are recorded as realized gains.
Use of estimates
The preparation of financial statements in conformity with accounting principles generally accepted in the United States of America ("GAAP") requires management to make estimates and assumptions that affect the amounts reported in the financial statements and accompanying notes. Actual results may differ from those estimates.
Fund share valuation
Fund shares are sold and redeemed on a continuing basis at net asset value. Net asset value per share is determined daily as of the close of trading on the New York Stock Exchange ("the Exchange") on each day the Exchange is open for trading by dividing the total value of the Fund's investments and other assets, less liabilities, by the number of Fund shares outstanding.
Custody fees/Credits
Custody fees are reduced based on the Fund's cash balances maintained with the custodian. The amount is disclosed as a reduction of total expenses in the Statement of Operations.
Federal income taxes
The Fund has complied with the provisions of the Internal Revenue Code available to regulated investment companies and, in the manner provided therein, distributes all its taxable income, as well as any net realized gain on sales of investments and foreign currency transactions reportable for federal income tax purposes. Accordingly, the Fund paid no federal income taxes and no federal income tax provision was required.
Distributions to shareholders
Distributions to shareholders are recorded on the ex-date.
Indemnification
In the normal course of business, the Fund enters into contracts that contain a variety of representations and warranties which provide general indemnities. The Fund's maximum exposure under these arrangements is unknown, as this would involve future claims against the Fund. Also under the Trust's organizational documents, the Trustees and Officers of the Trust are indemnified against certain liabilities that may arise out of their duties to the Trust. However based on experience, the Fund expects the risk of loss due to these warranties and indemnities to be minimal.
3. Federal Tax Information
The timing and character of income and capital gain distributions are determined in accordance with income tax regulations, which may differ from GAAP. Reclassifications are made to the Fund's capital accounts for permanent tax differences to reflect income and gains available for distribution (or available capital loss carryforwards) under income tax regulations.
For the year ended December 31, 2007, permanent book and tax basis differences resulting primarily from differing treatments for foreign currency
12
Wanger Select 2007 Annual Report
Notes to Financial Statements, continued
transactions, net operating losses and were identified and reclassified among the components of the Fund's net assets as follows:
Overdistributed
Net Investment Income | | Accumulated
Net Realized
Gain/(Loss) | | Paid-In Capital | |
| $ | 388,581 | | | $ | (388,581 | ) | | $ | — | | |
Net investment income and net realized gains (losses), as disclosed on the Statement of Operations, and net assets were not affected by this reclassification.
The tax character of distributions paid during the years ended December 31, 2007 and December 31, 2006 were as follows:
| | | December 31, 2007 | | December 31, 2006 | |
| Distributions paid from: | |
| Ordinary Income* | | $ | 1,343,353 | | | $ | 970,016 | | |
| Long-Term Capital Gains | | $ | 2,523,054 | | | $ | 3,369,880 | | |
* For tax purposes short-term capital gains distributions, if any, are considered ordinary income distributions.
As of December 31, 2007, the components of distributable earnings on a tax basis were as follows:
Undistributed
Ordinary Income | | Undistributed
Long-Term
Capital Gains | | Net Unrealized
Appreciation* | |
| $ | 1,667,918 | | | $ | 6,525,212 | | | $ | 50,898,702 | | |
* The differences between book-basis and tax-basis net unrealized appreciation/depreciation are primarily due to deferral of losses from wash sales.
The Funds adopted Financial Accounting Standards Board ("FASB") Interpretation No. 48, Accounting for Uncertainty in Income Taxes—an Interpretation of FASB Statement No. 109 ("FIN 48") effective June 29, 2007. FIN 48 requires management to determine whether a tax position of the Fund is more likely than not to be sustained upon examination by the applicable taxing authority, including resolution of any related appeals or litigation processes, based on the technical merits of the position. The tax benefit to be recognized is measured as the largest amount of benefit that is greater than fifty percent likely of being realized upon ultimate settlement. FIN 48 must be applied to all existing tax positions upon initial adoption and the cumulative effect, if any, is to be reported as an adjustment to net assets. Management has evaluated the known implications of FIN 48 on its computation of net assets for the Fund. As a result of this evaluation, management believes that FIN 48 does not have any effect on the Fund's financial statements. However, management's conclusions regarding FIN 48 may be subject to review and adjustment at a later date based on factors including, but not limited to, further implementation guidance from the FASB, new tax laws, regulations, and administrative interpretations (including relevant court decisions). The Fund's federal tax returns for the prior three fiscal years remain subject to examination by the Internal Revenue Service. The Funds are not aware of any tax positions for which it is reasonably possible that the total amounts of unrecognized tax benefits will significantly change in the next twelve months.
4. Transactions With Affiliates
Columbia Wanger Asset Management, L.P., ("CWAM") is a wholly owned subsidiary of Columbia Management Group, LLC, which in turn is an indirect wholly owned subsidiary of Bank of America Corporation ("BOA"). CWAM furnishes continuing investment supervision to the Fund and is responsible for the overall management of the Fund's business affairs.
Effective August 1, 2007, under the Fund's investment advisory agreement, fees are accrued daily based on the Fund's average daily net assets and paid monthly to CWAM at the annual rates shown in the table below:
| Average Daily Net Assets | | Annual Fee Rate | |
| Up to $500 million | | | 0.80 | % | |
| $500 million and over | | | 0.78 | % | |
Prior to August 1, 2007, as provided under the Fund's investment advisory agreement, fees were accrued daily based on the Fund's average daily net assets and paid monthly to CWAM at the annual rate of 0.85%.
For the year ended December 31, 2007, the Fund's effective investment advisory fee rate was 0.83%.
Through April 30, 2008, CWAM will reimburse the Fund to the extent that ordinary operating expenses (including custodial charges relating to overdrafts, if any), after giving effect to any balance credits from the Fund's custodian, exceed an annual percentage of 1.35% of average daily net assets. There was no reimbursement for the year ended December 31, 2007.
CWAM provides administrative services and receives an administration fee from the Fund. Prior to August 1, 2007, administrative services were covered under the Fund's investment advisory agreement in place between the Fund and CWAM. Effective August 1, 2007, under the Fund's new administration agreement, which provides the same types of administrative services that were provided under the investment advisory agreement, fees are accrued daily and paid monthly to CWAM at the annual rate of 0.05%. Accordingly, the investment advisory fees were decreased by 0.05% across all asset levels effective August 1, 2007 as well.
For the year ended December 31, 2007, the Fund's effective administration fee rate was 0.02%.
Certain officers and trustees of the Trust are also officers of CWAM. The Trust makes no direct payments to its officers and trustees who are affiliated with CWAM.
The Board of Trustees appointed a Chief Compliance Officer to the Fund in accordance with federal securities regulations. The Fund will pay its pro-rata share of the expenses associated with the Office of the Chief Compliance Officer. These expenses are disclosed separately as "Chief compliance officer expenses" in the Statement of Operations.
The Trust offers a deferred compensation plan for its independent trustees. Under that plan, a trustee may elect to defer all or a portion of his or her compensation. Amounts deferred are retained by the Trust and represent an unfunded obligation of the Trust. The value of amounts deferred is determined by reference to the change in value of Class Z shares of one or more series of the Columbia Acorn Trust or a money market fund as specified by the trustee. Benefits under the deferred compensation plan are payable when the trustee ceases to be a member of the Board of Trustees.
Columbia Management Distributors, Inc. (the "Distributor"), a wholly owned subsidiary of BOA, serves as the principal underwriter of the Trust and receives no compensation for its services.
Columbia Management Services, Inc. (the "Transfer Agent"), a wholly owned subsidiary of BOA, provides shareholder services to the Fund and has subcontracted with Boston Financial Data Services ("BFDS") to serve as subtransfer agent. For such services, the Transfer Agent receives a fee, paid monthly, at the annual rate of $21.00 per open account. The Transfer Agent also receives reimbursement for certain out-of-pocket expenses.
During the year ended December 31, 2007, the Fund engaged in purchase and sale transactions with funds that have a common investment adviser (or affiliated investment advisers), common directors/trustees, and/or common officers. Those purchase and sale transactions complied with provisions of Rule 17a-7 under the Investment Company Act of 1940 and were $93,600 and $2,089,504, respectively.
13
Wanger Select 2007 Annual Report
Notes to Financial Statements, continued
5. Borrowing Arrangements
The Trust participates in a $150 million credit facility, which was entered into to facilitate portfolio liquidity. Interest is charged to each participating fund based on its borrowings at a rate per annum equal to the Federal Funds rate plus 0.50%. In addition, a commitment fee of 0.08% per annum of the unutilized line of credit is accrued and apportioned among the participating funds based on their relative net assets. The commitment fee is included in "Other expenses" in the Statement of Operations. No amounts were borrowed by the Fund under this facility during the year ended December 31, 2007.
6. Fund Share Transactions
Proceeds and payments on Fund shares as shown in the Statement of Changes in Net Assets are in respect of the following numbers of shares:
| | | Year ended
December 31, 2007 | | Year ended
December 31, 2006 | |
| Shares sold | | | 5,354,321 | | | | 2,825,971 | | |
Shares issued in reinvestment
of dividend distributions | | | 145,354 | | | | 191,438 | | |
| Less shares redeemed | | | (937,722 | ) | | | (841,953 | ) | |
| Net increase in shares outstanding | | | 4,561,953 | | | | 2,175,456 | | |
7. Investment Transactions
The aggregate cost of purchases and proceeds from sales other than short-term obligations for the year ended December 31, 2007 were $154,103,119 and $35,575,208, respectively.
8. Legal Proceedings
CWAM, Columbia Acorn Trust (another mutual fund family advised by CWAM), and the trustees of Columbia Acorn Trust (collectively, the "Columbia defendants") are named as defendants in class and derivative complaints that have been consolidated in a Multi-District Action (the "MDL Action") in the federal district court of Maryland. These lawsuits contend that defendants permitted certain investors to market time their trades in certain Columbia Acorn Funds. The MDL Action is ongoing. However, all claims against Columbia Acorn Trust and the independent trustees of Columbia Acorn Trust have been dismissed.
Columbia Acorn Trust and CWAM are also defendants in a class action lawsuit that alleges, in summary, that Columbia Acorn Trust and CWAM exposed shareholders of Columbia Acorn International Fund to trading by market timers by allegedly: (a) failing to properly evaluate daily whether a significant event affecting the value of the fund's securities had occurred after foreign markets had closed but before the calculation of the fund's net asset value ("NAV"); (b) failing to implement the fund's portfolio valuation and share pricing policies and procedures; and (c) failing to know and implement applicable rules and regulations concerning the calculation of NAV (the "Fair Valuation Lawsuit"). The Seventh Circuit ruled that the plaintiffs' state law claims were preempted under federal law resulting in the dismissal of plaintiffs' complaint. Plaintiffs appealed the Seventh Circuit's ruling to the United States Supreme Court. The Suprem e Court reversed the Seventh Circuit's ruling on jurisdictional grounds and the case was ultimately remanded to the state court.
On March 21, 2005, a class action complaint was filed against the Columbia Acorn Trust and CWAM seeking to rescind the CDSC assessed upon redemption of Class B shares of Columbia Acorn Funds due to the alleged market timing of the Columbia Acorn Funds (the "CDSC Lawsuit"). In addition to the rescission of sales charges, plaintiffs seek recovery of actual damages, attorneys' fees and costs. The case had been transferred to the MDL Action in the federal district court of Maryland.
On September 14, 2007, the plaintiffs and the Columbia defendants named in the MDL Action, including the Columbia Funds, entered into a stipulation of settlement with respect to all Columbia-related claims in the MDL Action described above, including the CDSC and Fair Valuation Lawsuits. The settlement is subject to court approval.
CWAM, the Columbia Acorn Funds and the Trustees of the Trust are also defendants in a consolidated lawsuit filed in the federal district court of Massachusetts alleging that CWAM used Fund assets to make undisclosed payments to brokers as an incentive for the brokers to market the Funds over other mutual funds to investors. The complaint alleges CWAM and the Trustees of Columbia Acorn Trust, along with certain affiliated entities and individuals, breached certain common law duties and federal laws.
On November 30, 2005, the judge dismissed all claims by plaintiffs and entered final judgment in favor of the defendants. The plaintiffs appealed to the United States Court of Appeals for the First Circuit on December 30, 2005. A stipulation and settlement agreement dated January 19, 2007 was filed in the First Circuit on February 14, 2007, with a joint stipulation of dismissal and motion for remand to obtain district court approval of the settlement. That joint motion was granted and the appeal was dismissed. On March 6, 2007, the case was remanded to the federal district court. The settlement, approved by the federal district court on September 18, 2007, became effective October 19, 2007. Pursuant to the settlement, the funds' adviser and/or its affiliates made certain payments, including plaintiffs' attorneys' fees and costs of notice to class members.
The Trust and CWAM intend to defend these suits vigorously.
As a result of these matters, or any adverse publicity or other developments resulting from them, there may be increased redemptions or reduced sales of Columbia Acorn fund shares, which could increase transaction costs or operating expenses, or have other adverse consequences for the Columbia Acorn funds. However, based on currently available information, the Columbia Acorn Trust believes that the likelihood that these lawsuits will have a material adverse impact on any fund is remote, and CWAM believes that the lawsuits are not likely to materially affect its ability to provide investment management services to the funds.
14
Wanger Select 2007 Annual Report
Report of Independent Registered Public Accounting Firm
To the Board of Trustees and Shareholders of Wanger Select,
In our opinion, the accompanying statement of assets and liabilities, including the statement of investments, and the related statements of operations and of changes in net assets and the financial highlights present fairly, in all material respects, the financial position of Wanger Select (a series of the Wanger Advisors Trust, hereinafter referred to as the "Fund") at December 31, 2007, the results of its operations for the year then ended, the changes in its net assets for each of the two years in the period then ended and the financial highlights for each of the four years in the period then ended, in conformity with accounting principles generally accepted in the United States of America. These financial statements and financial highlights (hereafter referred to as "financial statements") are the responsibility of the Fund's management; our responsibility is to express an opinion on these financial statements based on our a udits. We conducted our audits of these financial statements in accordance with the standards of the Public Company Accounting Oversight Board (United States). Those standards require that we plan and perform the audit to obtain reasonable assurance about whether the financial statements are free of material misstatement. An audit includes examining, on a test basis, evidence supporting the amounts and disclosures in the financial statements, assessing the accounting principles used and significant estimates made by management, and evaluating the overall financial statement presentation. We believe that our audits, which included confirmation of securities at December 31, 2007 by correspondence with the custodian and brokers, provide a reasonable basis for our opinion. The financial highlights of the Fund for the period ended December 31, 2003 were audited by other independent auditors whose report dated February 6, 2004 expressed an unqualified opinion on those financial statements.
PricewaterhouseCoopers LLP
Chicago, Illinois
February 20, 2008
15
Wanger Select 2007 Annual Report
Federal Income Tax Information (Unaudited)
For the fiscal year ended December 31, 2007, the Fund designated long-term capital gains of $6,540,445, and 65.02% of the ordinary income distributed by the Fund, for the year ended December 31, 2007, qualifies for the corporate dividends received deduction.
16
Wanger Select 2007 Annual Report
[Excerpt from:]
Wanger Advisors Trust
Management Fee Evaluation of the Senior Officer
Prepared Pursuant to the New York Attorney General's
Assurance of Discontinuance
June 2007
17
Wanger Select 2007 Annual Report
Introduction
The New York Attorney General's Assurance of Discontinuance ("Order") entered into by Columbia Management Advisors, Inc. ("CMAI") and Columbia Management Distributors, Inc., ("CMDI" and collectively with "CMAI," "CMG") in February 2005, allows CMAI to manage or advise a mutual fund only if the trustees of the fund appoint a "Senior Officer" to perform specified duties and responsibilities. One of these responsibilities includes "managing the process by which proposed management fees (including but not limited to, advisory fees) to be charged the [Funds] are negotiated so that they are negotiated in a manner which is at arms' length and reasonable and consistent with this Assurance of Discontinuance."
This is the first year that the Columbia Acorn Trust and Wanger Advisors Trust (collectively, the "Trusts") and each series thereof (the "Acorn Funds," "WAT Funds" or collectively, the "Funds") have been overseen by the same Board of Trustees ("Board"). The Order provides that this Board must determine the reasonableness of proposed "management fees" by using either an annual competitive bidding process supervised by the Senior Officer or Independent Fee Consultant, or by obtaining "an annual independent written evaluation prepared by or under the direction of the Senior Officer or the Independent Fee Consultant."
"Management fees" are only part of the costs and expenses paid by mutual fund shareholders. The expenses can vary depending upon the class of shares held but usually include: (1) investment management or advisory fees to compensate analysts and portfolio managers for stock research and portfolio management, as well as the cost of operating a trading desk; (2) administrative expenses incurred to prepare registration statements and tax returns, calculate the Funds' net asset values, maintain effective compliance procedures and perform recordkeeping services; (3) transfer agency costs for establishing accounts, accepting and disbursing funds, as well as overseeing trading in Fund shares; (4) custodial expenses incurred to hold the securities purchased by the Funds; and (5) distribution expenses, including commissions paid to brokers that sell the Fund shares to investors.
Columbia Wanger Asset Management, L.P. ("CWAM"), the adviser to the Funds, has proposed that with respect to the Acorn Funds, the Columbia Acorn Trust continue the existing separate agreements governing the first two categories listed above: an advisory agreement governing portfolio management, and an administration agreement governing certain administration and clerical services. Together the fees paid under these two agreements are referred to as "management fees." CWAM proposes that the WAT Funds continue the existing single agreement governing both investment advisory and administrative services. A single management fee would cover both services. Other fund expenses are governed by separate agreements, in particular agreements with two CWAM affiliates: CMDI, the broker-dealer that underwrites and distributes the Funds' shares, and Columbia Management Services, Inc. ("CMSI"), the Funds' transfer agent. In conformity with the terms of the Order, this evaluation, therefore, addresses only the advisory and administrative contracts, and does not extend to the other agreements.
According to the Order, the Senior Officer's evaluation must consider at least the following:
(1) Management fees (including components thereof) charged to institutional and other clients of CWAM for like services;
(2) Management fees (including any components thereof) charged by other mutual fund companies for like services;
(3) Costs to CWAM and its affiliates of supplying services pursuant to the management fee agreements, excluding any intra-corporate profit;
(4) Profit margins of CWAM and its affiliates from supplying such services;
(5) Possible economies of scale as the Funds grow larger; and
(6) The nature and quality of CWAM's services, including the performance of each Fund.
In 2004, the Boards of the two Trusts, then separate groups, each appointed me Senior Officer under the Order. They also determined not to pursue a competitive bidding process and instead, charged me with the responsibility of evaluating the Funds' proposed advisory and administrative fee contracts with CWAM in conformity with the requirements of the Order. This Report is an annual evaluation required under the Order. In discharging their responsibilities, the independent Trustees have also consulted independent, outside counsel.
2007 Evaluation
This is the third annual evaluation prepared in connection with the Order. This evaluation follows the same structure as the earlier studies. Some areas are given more emphasis here, while others are given less. Still, the fundamental information gathered for this evaluation is largely the same as past years.
Process and Independence
The objectives of the Order are to insure the independent evaluation of the advisory fees paid by the Funds as well as to insure that all relevant factors are considered. In my view, this contract renewal process has been conducted at arms-length and with independence in gathering, considering and evaluating all relevant data. At the outset of the process, the Trustees sought and obtained from CWAM and CMG a comprehensive compilation of data regarding Fund performance and expenses, adviser profitability, and other information. The Board evaluated this information thoroughly and also explored CWAM's potential capacity restraints. Performance and expense data was obtained from both Morningstar and Lipper, the leading consultants in this area. The rankings prepared by Morningstar and Lipper were independent and not influenced by the adviser. CWAM itself identified what it considers competing funds, and the Trustees considered that data as well.
In the course of its work, the Contract Committee gave careful consideration to the conclusions and recommendations contained in last year's evaluation. The Contract Committee gave particular emphasis to the issue of whether economies of scale were appropriately reflected in the Funds' fee schedules. Last year, the Board sought and CWAM agreed to additional breakpoints for two Funds, Acorn USA and Acorn Select. These breakpoints are above current asset levels, but
18
Wanger Select 2007 Annual Report
clearly operate to share economies of scale with Fund shareholders. This year, at the Board's request, CWAM has proposed additional breakpoints for the WAT Funds, and Acorn International Select. This proposal is under consideration by the Board.
My evaluation of the advisory contract was shaped, as it was last year, by my experience as Chief Compliance Officer of the Trusts ("CCO"). As CCO, I report solely to the Board and have no reporting obligation to or employment relationship with CMG or its affiliates, except for administrative purposes. I have commented on compliance matters in evaluating the quality of service provided by CWAM.
This Report, its supporting materials and the data contained in other materials submitted to the Contract Committee of the Board, in my view, provide a thorough factual basis upon which the Board, in consultation with independent counsel as it deems appropriate, may conduct management fee negotiations that are in the best interests of the Funds' shareholders.
The Fee Reductions Mandated under the Order
Under the terms of the Order, CMG agreed to secure certain management fee reductions for the mutual funds advised by its affiliate investment advisers. In some instances, breakpoints were also established. Although neither CWAM nor the Trusts was a party to the Order, CWAM offered and the Board accepted certain advisory fee reductions during 2005. By the terms of the Order, these fees may not be increased before November 30, 2009. I have used these advisory fee levels—as modified last year to add certain breakpoints for Acorn USA and Acorn Select—in this evaluation because they are the fees in the current agreements that CWAM proposes should be continued. Hence, these fee levels are the starting point of an evaluation.
Conclusions
My review of the data and other material above leads to the following conclusions with respect to the factors identified in the Order.
1. Performance. The domestic Funds generally have achieved outstanding performance. The Acorn Fund, Acorn USA, Acorn Select, Wanger Select and Wanger US Smaller Companies all rank very favorably against their peers over the past five years. Although Acorn USA and Wanger US Smaller Companies had a difficult year in 2006, these returns are not characteristic of these funds, both of which have shown improved performance during the first quarter of 2007. The international Funds have relatively weaker long term records than the domestic funds, but recently have improved significantly and their one year rankings are excellent. Overall then, performance of the Funds is excellent.
2. Management Fees relative to Peers. The management fee rankings for several of the Acorn Funds are generally more favorable to shareholders than those of their peer group funds. Management fees do, however, vary by Fund. Acorn Fund is the least expensive and the Acorn USA the most expensive. Acorn Fund is very competitive, while Acorn USA and Acorn Select were ranked by both Lipper and Morningstar at or below the median, and therefore impose higher fees than do the majority of their competitors. The WAT Funds also lag their competitors and impose higher fees than their peers.
3. Administrative Fees. The Acorn Funds' administrative fee, which is uniform across all Funds, is at a level comparable to or less expensive than the fees imposed by their peers, provides for appropriate services to Funds, and affords breakpoints that lower the fee as assets increase. The WAT Funds pay a single fee for advisory and administrative services and hence do not benefit from administrative fee breakpoints, nor is it possible to assess their administrative costs relative to competitors.
4. Management Fees relative to Institutional and Other Mutual Fund Accounts. CWAM's focus is on its mutual funds. It does not actively seek to manage separate or institutional accounts. The few institutional accounts it does manage vary in rate structures. Some pay advisory fees commensurate with or higher than the Acorn and WAT Funds. In a few instances, however, institutional accounts pay lower advisory fees than do the Acorn Funds. One particular institutional account is significant in size and has been under CWAM's management for over 25 years.
5. Costs to CWAM and its Affiliates. CWAM's direct costs do not appear excessive. Overhead and indirect costs allocated to CWAM by its parent organizations, however, are significant and increasing. CWAM's affiliates report operating losses and therefore do not appear to profit from CWAM's advisory agreement with the Funds.
6. Profit Margins. CWAM's firm-wide, pre-marketing expense profit margins are at the top of the industry, though these comparisons are hampered by limited industry data. High profit margins are not unexpected for firms that manage large, successful funds and have provided outstanding investment performance for investors.
7. Economies of Scale. Economies of scale do exist at CWAM and will expand as the assets of the Funds get larger. They are, however, only partially reflected in the management fee schedule for the Acorn Funds and not reflected at all in two of the four WAT Funds. Breakpoints above current asset levels have, however, been added to the more expensive funds, Acorn Select and Acorn USA. Nonetheless, if Fund assets continue to grow, under the Funds' current fee schedules, all Fund shareholders might not benefit in a manner generally commensurate with CWAM's increased profits. Management has proposed additional breakpoints for some of the Funds that, if implement, would result in greater sharing of economies of scale.
19
Wanger Select 2007 Annual Report
8. Nature and Quality of Services. This category includes a variety of considerations that are difficult to quantify, yet can have a significant bearing on the performance of the Acorn Funds. Several areas merit comment.
a. Capacity. The Funds have continued to grow, posing ever greater challenges in deploying assets effectively. While trends here merit continued monitoring, CWAM appears to be managing assets effectively.
b. Compliance. CWAM has a reasonably designed compliance program that protects shareholders.
c. Administrative Services. The Funds benefit from a variety of administrative services that are performed by CWAM and CMAI.
9. Process. In my opinion, the process of negotiating an advisory contract for the Funds has been conducted thoroughly and at arms' length. Further, the Trustees have sufficient information to evaluate management's proposal, and negotiate contract terms that are in the best interests of fund shareholders.
Recommendations
(with respect to the Wanger Funds)
I believe the Trustees should:
1. Continue to consider additional ways to restructure the advisory fee beyond the current breakpoint schedule to reflect more fully economies of scale.
2. Consider unbundling of the advisory and administrative fees paid by the WAT Funds.
3. Review the disparity in management fee levels between the Acorn International Fund and its related annuity-based fund, WAT International Small Cap Fund.
4. Continue to monitor CWAM's capacity limitations to insure that the Funds' expanding assets do not impair investment performance.
Robert P. Scales
Senior Vice President,
Chief Legal Officer
and General Counsel
June 18, 2007
20
Wanger Select 2007 Annual Report
Board Approval of the Advisory Agreement
Wanger Advisors Trust (the "Trust") has an investment advisory agreement (the "Advisory Agreement") with Columbia Wanger Asset Management, L.P. ("CWAM") under which CWAM manages the Wanger Advisors Funds (the "Funds"). The trustees of the Trust, more than seventy five percent of whom have never been affiliated with CWAM ("Independent Trustees"), oversee the management of each Fund and, as required by law, determine at least annually whether to continue the Advisory Agreement for each Fund.
The Contract Committee of the board of trustees (the "Committee"), which is comprised of six Independent Trustees, makes recommendations to the board regarding any proposed continuation of the Advisory Agreement. After the Committee has made its recommendation, the full board determines whether to approve the continuation of the Advisory Agreement. In addition, the board considers matters bearing on the Advisory Agreement at most of its other meetings throughout the year and meets at least quarterly with the portfolio managers employed by CWAM.
In connection with their most recent consideration of the Advisory Agreement for each Fund, the Committee and all trustees received and reviewed a substantial amount of information provided by CWAM in response to requests of the Independent Trustees and their counsel. Throughout their consideration of the Advisory Agreement, the Independent Trustees were advised by their independent legal counsel. At each of the meetings at which the Committee or the Independent Trustees considered the Advisory Agreement, they met with management and also met separately in executive session with their counsel.
The materials reviewed by the Committee and the trustees included, among other items, (i) information on the investment performance of each Fund and the performance of peer groups of funds and of the Fund's performance benchmarks, (ii) information on each Fund's advisory fees and other expenses, including information comparing the Fund's fees and expenses to those of peer groups of funds and information about any applicable expense limitations and fee "breakpoints," (iii) data on sales and redemptions of Fund shares and (iv) information on the profitability to CWAM and its affiliates of their relationships with the Funds and potential "fall-out" or ancillary benefits that CWAM and its affiliates may receive as a result of their relationships with the Funds. They also considered other information such as (i) CWAM's financial results and financial condition, (ii) each Fund's investment objective and strategies; (iii) the size, edu cation and experience of CWAM's investment staff and its use of technology, external research and trading cost measurement tools, (iv) the allocation of the Funds' brokerage, if any, including allocations to brokers affiliated with CWAM, and the use of "soft" commission dollars to pay for research products and services, (v) the resources devoted to, and the record of compliance with, the Funds' investment policies and restrictions, policies on personal securities transactions and other compliance policies and (vi) the economic outlook generally and for the mutual fund industry in particular. In addition, the trustees conferred with, and reviewed the Management Fee Evaluation (the "Fee Evaluation") prepared by, the Trust's chief compliance officer, who also serves as the Trust's "Senior Officer" as contemplated by the Assurance of Discontinuance dated February 9, 2005 among affiliates of CWAM and the Office of the New York Attorney General. [A summary of the Fee Evaluation is included in this report.] Through out the process, the trustees had the opportunity to ask questions of and request additional materials from CWAM.
On July 17, 2007, the board of trustees unanimously approved (a) a new administration agreement between the Trust and CWAM, pursuant to which CWAM, for a fee at the annual rate of 0.05% of average daily net assets of the Trust, provides to the Trust the types of administrative services that were currently being provided to the Trust under the Advisory Agreement and(b) the continuation of the Advisory Agreement through July 31, 2008, with amendments to the fee schedule to provide (i) a corresponding 0.05% reduction in the annual rate of fee as a result of entering into the administration agreement and (ii) additional breakpoints, as described below. The approval followed Committee meetings held in February, May, June and July 2007.
In considering the continuation of the Advisory Agreement (and entering into the new administration agreement), the trustees reviewed and analyzed various factors that they determined were relevant, including the factors described below, none of which by itself was considered dispositive. However, the material factors and conclusions that formed the basis for the trustees' determination to approve the continuation of the Advisory Agreement (and entering into the new administration agreement) are discussed separately below.
Nature, quality and extent of services. The trustees reviewed the nature, quality and extent of the services of CWAM and its affiliates to the Funds, taking into account the investment objective and strategy of each Fund and the knowledge the trustees gained from their regular meetings with management on at least a quarterly basis. In addition, the trustees reviewed the available resources and key personnel of CWAM and its affiliates, especially those who provide investment management services to the Funds. The trustees also considered other services provided to the Funds by CWAM and its affiliates, such as managing the execution of portfolio transactions and the selection of broker-dealers for those transactions, serving as the Funds' administrator, monitoring adherence to the Funds' investment restrictions, producing shareholder reports, providing s upport services for the board and board committees, communicating with shareholders and overseeing the activities of other service providers, including monitoring compliance with various policies and procedures of the Funds and with applicable securities laws and regulations. With respect to the provision of administrative services, the trustees believed it was more appropriate for those same services to be provided to the Trust pursuant to a separate administration agreement.
The trustees concluded that: the nature, quality and extent of the services provided by CWAM and its affiliates to each Fund were appropriate and consistent with the terms of the Advisory Agreement; that the quality of those services had been consistent with or superior to quality norms in the industry; and that the Funds were likely to benefit from the continued provision of those services. They also concluded that each of CWAM and its affiliates currently had sufficient personnel, with appropriate education and experience, to serve the Funds effectively and had demonstrated their continuing ability to attract and retain well qualified personnel.
Performance of the Funds. At various meetings of the board, of the Committee and of the board's investment performance analysis committee, the trustees considered the short-term and longer-term performance of each Fund. They reviewed information comparing each Fund's performance with the performance of the Fund's benchmark and with the performance of comparable funds and peer groups as identified by Lipper Inc. ("Lipper") and Morningstar Associates, LLC ("Morningstar"). They noted that, among the domestic Funds, Wanger Select had outperformed its respective benchmark and Lipper and Morningstar peers for the relevant periods. Wanger U.S. Smaller Companies suffered weak performance compared to its benchmark in 2006 and ranked toward the bottom of its peer group for that period. Notwithstanding that performance, that Fund's performance approximated, or w as ahead of, its benchmark for the most recent three, five and ten year periods. The trustees also discussed the performance of the international Funds, noting that both of the international Funds had shown improvement over recent years. During the contract renewal process, the trustees concluded that, although past performance is not necessarily indicative of future results, the Funds' strong overall performance record was an important factor in their evaluation of the quality of services provided by CWAM under the Advisory Agreement.
Costs of Services and Profits Realized by CWAM. At various Committee meetings and other informal meetings, the trustees examined detailed information on fees and expenses of each Fund in comparison to information
21
Wanger Select 2007 Annual Report
Board Approval of the Advisory Agreement
for other comparable funds provided by Lipper and Morningstar. As noted in the Fee Evaluation, the contractual rates of investment advisory fees and the actual advisory fees for some of the Funds were higher than the median advisory fees of their respective peer groups (particularly with respect to Wanger U.S. Smaller Companies and Wanger Select). The trustees also considered the management fees of the Wanger Advisors Funds relative to those of the Columbia Acorn Trust funds, a group of funds with similar investment strategies overseen by the same trustees and also managed by CWAM. In addition, the Committee and the Board had extensive discussions about the appropriateness of the 0.05% fee for administrative services.
The Board and CWAM approved amendments to the Advisory Agreement to (a) provide a 0.05% reduction in the fee schedule for each Fund in response to entering into the new administration agreement and (b) to establish additional breakpoints for (i) Wanger U.S. Smaller Companies at 0.80% on net asset levels over $2 billion, (ii) Wanger Select at 0.78% on net asset levels over $500 million, (iii) Wanger International Select at 0.89% on nets asset levels over $500 million and (iv) Wanger International Small Cap at 0.72% on net asset levels over $1 billion.
The trustees reviewed the Fee Evaluation's analysis of the profitability of CWAM in serving as each Fund's investment adviser and of CWAM and its affiliates in all of their relationships with each Fund, as well as an explanation of the methodology utilized in allocating various expenses among the Funds and other business units. The trustees took into account the methodology used by CWAM in determining compensation payable to portfolio managers and the competitive environment for investment management talent. The trustees recognized that profitability comparisons among fund managers are difficult because very little comparative information is publicly available and the profitability of any manager is affected by numerous factors, including the organizational structure of the particular manager, the types of funds and other accounts it manages, possible other lines of business, the methodology for allocating expenses and the manag er's capital structure and cost of capital.
The trustees also reviewed CWAM's advisory fees for other investment companies, sub-advised funds and other institutional separate accounts, as detailed in the Fee Evaluation. In most instances its institutional separate account fees for various investment strategies were higher than the advisory fees charged to the Funds with corresponding strategies, although for a few accounts, the fees were lower. The trustees noted that CWAM performs significant additional services for the Funds that it does not provide to sub-advised funds or non-mutual fund clients, including administrative services, oversight of the Funds' other service providers, trustee support, regulatory compliance and numerous other services, and that, in servicing the Funds, CWAM assumes many legal risks that it does not assume in servicing many of its other clients. Finally, the trustees considered the financial condition of CWAM as part of the contract renewal pr ocess.
The trustees concluded that the rates of advisory fees (as amended) and other compensation payable by the Funds to CWAM and its affiliates were reasonable in relation to the nature and quality of the services to be provided, taking into account the fees charged by other advisers for managing comparable mutual funds with similar strategies and the fees CWAM charges to other clients. The trustees also concluded that the Funds' estimated overall expense ratios were reasonable, taking into account quality of services provided by CWAM and its affiliates and the investment performance of the Funds.
Economies of Scale. The trustees considered information about the potential for CWAM to realize economies of scale as a Fund's assets increase. They noted that the fee schedule for each Fund includes reductions in the rate of fees at various asset levels, including each Fund's newly established breakpoint. The trustees also noted that the Funds share directly in economies of scale through lower charges on third party service providers based on the combined scale of all of the Funds. Based on the information they reviewed, the trustees concluded that the current fee structure of each Fund was reasonable and that the current rates of fees do reflect a sharing between CWAM and the Funds of economies of scale.
Other Benefits to CWAM. The trustees also reviewed benefits that accrue to CWAM and its affiliates from their relationships with the Funds, as outlined in the Fee Evaluation. They recognized that two affiliates of CWAM separately serve the Funds as transfer agent and distributor, respectively, and that the transfer agent receives compensation from the Funds for services provided. The trustees noted that, other than the services provided by CWAM and its affiliates pursuant to various agreements and the fees to be paid by each Fund therefor, the Funds and CWAM may potentially benefit from their relationship with each other in other ways. The trustees considered CWAM's use of commissions paid by each Fund on its portfolio brokerage transactions to obtain research products and services benefiting the Fund and/or other clients of CWAM. The trustees determi ned that CWAM's use of the Funds' "soft" commission dollars to obtain research products and services was consistent with regulatory requirements and guidance then in effect. They also concluded that CWAM benefits from the receipt of proprietary research products and services acquired through commissions paid on portfolio transactions of the Funds and that the Funds benefit from CWAM's receipt of those products and services as well as research products and services acquired through commissions paid by other clients of CWAM. They further concluded that the success of any Fund could attract other business to CWAM or other Funds and that the success of CWAM could enhance its ability to serve the Funds.
After full consideration of the above factors as well as other factors that were instructive in evaluating the Advisory Agreement, the trustees, including the Independent Trustees, unanimously concluded that the continuation of the Advisory Agreement, as amended to revise the fee schedule for each Fund to reflect both the 0.05% fee reduction and the additional breakpoints, was in the best interest of each Fund. On July 17, 2007, the trustees continued the Advisory Agreement as so amended through July 31, 2008.
22
Wanger Select 2007 Annual Report
Board of Trustees and Management of Wanger Advisors Trust
The Board of Trustees of the Trust has overall management responsibility for the Trust and the Funds. Each trustee may serve a term of unlimited duration until the end of the calendar year in which the trustee attains the age of 75 years. The trustees appoint their own successors, provided that at least two-thirds of the trustees, after such appointment, have been elected by shareholders. Shareholders may remove a trustee, with or without cause, upon the vote of two-thirds of the Trust's outstanding shares at any meeting called for that purpose. A trustee may be removed, with or without cause, upon the vote of a majority of the trustees.
The names of the trustees and officers of the Trust, the date each was first elected or appointed to office, their principal business occupations during at least the last five years, and other directorships they hold are shown below. Each trustee serves in such capacity for each of the four series of the Trust and each of the six series of Columbia Acorn Trust.
The business address of each trustee and officer of the Trust is Columbia Wanger Asset Management, L.P., 227 West Monroe, Suite 3000, Chicago, Illinois 60606. The Fund's Statement of Additional Information includes additional information about the Fund's trustees and officers. You may obtain a free copy of the Statement of Additional Information by writing or calling toll-free:
Columbia Wanger Asset Management, L.P.
Shareholder Services Group
227 W. Monroe, Suite 3000
Chicago, IL 60606
888-4-WANGER (888-492-6437)
Name, Position(s) with
Wanger Advisors
Trust and Age at
December 31, 2007 | | Year First
Elected or
Appointed
to Office | | Principal Occupation(s) during
Past Five Years | | Number of
Portfolios in
Fund Complex
Overseen
by Trustee/Officer | | Other
Directorships | |
| Trustees who are not interested persons of Wanger Advisors Trust: | |
|
Laura M. Born, 42,
Trustee (1) | | | 2007 | | | Adjunct Assistant Professor of Finance, University of Chicago Graduate School of Business; Managing Director—Investment Banking, J.P. Morgan Chase & Co. Incorporated (broker-dealer) 1991-2007. | | | 10 | | | Columbia Acorn Trust. | |
|
Maureen M. Culhane, 59,
Trustee | | | 2007 | | | Retired; Vice President, Goldman, Sachs Asset Management L.P. (investment adviser) 2005; Vice President (Consultant)—Strategic Relationship Management, Goldman, Sachs & Co. 1999-2005; prior thereto, Vice President of Finance and Treasurer, Sara Lee Corporation. | | | 10 | | | Columbia Acorn Trust. | |
|
Margaret Eisen, 54,
Trustee | | | 2006 | | | Managing Director, CFA Institute since 2005; Chief Investment Officer, EAM International LLC (corporate finance and asset management) since 2003; prior thereto, Managing Director, DeGuardiola Advisors (investment bank); formerly Managing Director, North American Equities at General Motors Asset Management, and Director, Worldwide Pension Investments for DuPont Asset Management. | | | 10 | | | Antigenics, Inc. (biotechnology and pharmaceuticals); Columbia Acorn Trust | |
|
Jerome Kahn, Jr., 73,
Trustee | | | 2006 | | | Portfolio manager and stock analyst and former President, William Harris Investors, Inc. (investment adviser). | | | 10 | | | Columbia Acorn Trust. | |
|
Steven N. Kaplan, 48,
Trustee | | | 2006 | | | Neubauer Family Professor of Entrepreneurship and Finance, Graduate School of Business, University of Chicago. | | | 10 | | | Morningstar, Inc. (provider of independent investment research); Columbia Acorn Trust | |
|
David C. Kleinman, 72,
Trustee | | | 2006 | | | Adjunct Professor of Strategic Management, University of Chicago Graduate School of Business; business consultant. | | | 10 | | | Sonic Foundry, Inc. (rich media systems and software); Columbia Acorn Trust | |
|
Allan B. Muchin, 71,
Trustee and Vice Chairman of the Board | | | 2006 | | | Chairman Emeritus, Katten Muchin Rosenman LLP (law firm). | | | 10 | | | Columbia Acorn Trust | |
|
23
Wanger Select 2007 Annual Report
Board of Trustees and Management of Wanger Advisors Trust
Name, Position(s) with
Wanger Advisors
Trust and Age at
December 31, 2007 | | Year First
Elected or
Appointed
to Office | | Principal Occupation(s) during
Past Five Years | | Number of
Portfolios in
Fund Complex
Overseen
by Trustee/Officer | | Other
Directorships | |
Robert E. Nason, 71,
Trustee and Chairman of the Board | | | 2006 | | | Consultant and private investor since 1998; formerly Executive Partner, Chief Executive Officer and member of the executive committee of Grant Thornton, LLP (public accounting firm) and member of the policy board of Grant Thornton International. | | | 10 | | | Columbia Acorn Trust | |
|
James A. Star, 46,
Trustee | | | 2006 | | | President, Longview Asset Management LLC (investment adviser) since 2003, prior thereto, portfolio manager; Vice President, Henry Crown and Company (investment firm); President and Chief Investment Officer, Star Partners (hedge fund) from 1998 to 2003. | | | 10 | | | Columbia Acorn Trust | |
|
John A. Wing, 72,
Trustee | | | 2006 | | | Partner, Dancing Lion Partners (investment partnership); prior thereto, Frank Wakely Gunsaulus Professor of Law and Finance, and Chairman of the Center for the Study of Law and Financial Markets, Illinois Institute of Technology; formerly Chairman of the Board and Chief Executive Officer of ABN-AMRO Incorporated (formerly named The Chicago Corporation, a financial services firm) and Chief Executive Officer of Market Liquidity Network, LLC. | | | 10 | | | First Chicago Bank and Trust; First Chicago Bancorp; Columbia Acorn Trust | |
|
| Trustees who are interested persons of Wanger Advisors Trust: | |
|
Charles P. McQuaid, 53,
Trustee and President (2) | | | 2003 | | | President and Chief Investment Officer, CWAM since October 2003; portfolio manager since 1995 and Director of Research, CWAM and its predecessor from July 1992 through December 2003; Interim Director of International Research, CWAM from October 2003 to December 2004; President of Columbia Acorn Trust since 2003. | | | 10 | | | Columbia Acorn Trust | |
|
Ralph Wanger, 72,
Trustee (3) | | | 1994 | | | Founder, former President, Chief Investment Officer and portfolio manager, CWAM from July 1992 to September 2003; former President, Columbia Acorn Trust from April 1992 through September 2003; former President, Wanger Advisors Trust 1994 through September 2003; Director, Wanger Investment Company PLC; advisor to CWAM from September 2003 to September 2005. | | | 10 | | | Columbia Acorn Trust | |
|
| Officers of Wanger Advisors Trust: | |
|
Ben Andrews, 41,
Vice President | | | 2004 | | | Analyst and portfolio manager, CWAM since 1998; Vice President, Columbia Acorn Trust. | | | 10 | | | None | |
|
Michael G. Clarke, 38,
Assistant Treasurer | | | 2004 | | | Assistant Treasurer, Columbia Acorn Trust; Chief Accounting Officer and Assistant Treasurer of the Columbia Funds since October 2004; Director of Fund Administration of Columbia Management Advisors, LLC since January 2006; Managing Director of Columbia Management Advisors, LLC from September 2004 to December 2005; Vice President, Fund Administration of Columbia Management Advisors, LLC from June 2002 to September 2004. | | | 10 | | | None | |
|
Jeffrey Coleman, 38,
Assistant Treasurer | | | 2006 | | | Assistant Treasurer, Columbia Acorn Trust since March 2006; Director of Fund Administration, CWAM since January 2006; Fund Controller, CWAM from October 2004 to January 2006; Vice President of CDC IXIS Asset Management Services, Inc. (investment management) from August 2000 to September 2004. | | | 10 | | | None | |
|
24
Wanger Select 2007 Annual Report
Board of Trustees and Management of Wanger Advisors Trust
Name, Position(s) with
Wanger Advisors
Trust and Age at
December 31, 2007 | | Year First
Elected or
Appointed
to Office | | Principal Occupation(s) during
Past Five Years | | Number of
Portfolios in
Fund Complex
Overseen
by Trustee/Officer | | Other
Directorships | |
J. Kevin Connaughton, 43,
Assistant Treasurer | | | 2001 | | | Treasurer and Chief Financial Officer of the Columbia Funds since December 2000; Vice President of Columbia Management Advisors, LLC since April 2003; Assistant Treasurer of Columbia Acorn Trust since 2001; Treasurer and Chief Financial Officer of the Liberty Funds, Stein Roe Funds and Liberty All-Star Funds from December 2000 to December 2006; Treasurer of the Galaxy Funds from September 2002 through November 2005; Treasurer of Columbia Management Multi-Strategy Hedge Fund, LLC from December 2002 through December 2004; and a senior officer of various affiliated entities of the Bank of America Corporation, including other registered and unregistered funds. | | | 10 | | | None | |
|
P. Zachary Egan, 39,
Vice President | | | 2007 | | | Director of International Research, CWAM, since December 2004; portfolio manager, CWAM since 2003; analyst, CWAM since 1999. | | | 10 | | | None | |
|
Peter T. Fariel, 50,
Assistant Secretary | | | 2006 | | | Associate General Counsel, Bank of America since April 2005; prior thereto, Partner, Goodwin Procter LLP (law firm). | | | 10 | | | None | |
|
John Kunka, 37,
Assistant Treasurer | | | 2006 | | | Director of Accounting and Operations, CWAM, since 2006; Assistant Treasurer, Columbia Acorn Trust, since 2006; Manager of Mutual Fund Operations, Calamos Advisors, Inc. from 2005 to 2006; prior thereto, Manager of Mutual Fund Administration, Van Kampen Investments. | | | 10 | | | None | |
|
Joseph LaPalm, 37,
Vice President | | | 2006 | | | Chief Compliance Officer, CWAM since 2005; Vice President, Columbia Acorn Trust since 2006; prior thereto, Compliance Officer, William Blair & Company (investment firm). | | | 10 | | | None | |
|
Bruce H. Lauer, 50,
Vice President,
Secretary and Treasurer | | | 1995 | | | Chief Operating Officer, CWAM since April 2000; Vice President, Treasurer and Secretary, Columbia Acorn Trust; Director, Wanger Investment Company PLC; Director, Banc of America Capital Management (Ireland) Ltd.; Director, Bank of America Global Liquidity Fund, PLC. | | | 10 | | | None | |
|
Louis J. Mendes, 43,
Vice President | | | 2005 | | | Analyst and portfolio manager, CWAM since 2001; Vice President, Columbia Acorn Trust. | | | 10 | | | None | |
|
Robert A. Mohn, 46,
Vice President | | | 1997 | | | Analyst and portfolio manager, CWAM since August 1992; Director of Domestic Research, CWAM since March 2004; Vice President, Columbia Acorn Trust. | | | 10 | | | None | |
|
Christopher Olson, 43,
Vice President | | | 2001 | | | Analyst and portfolio manager, CWAM since January 2001; Vice President, Columbia Acorn Trust. | | | 10 | | | None | |
|
Robert Scales, 55,
Chief Compliance Officer,
Chief Legal Officer,
Senior Vice President and General Counsel | | | 2004 | | | Chief Compliance Officer, Senior Vice President, Chief Legal Officer and General Counsel, Columbia Acorn Trust since 2004; prior thereto, Associate General Counsel, Grant Thornton LLP. | | | 10 | | | None | |
|
Linda Roth-Wiszowaty, 38,
Assistant Secretary | | | 2006 | | | Business support analyst, CWAM, since April 2007; Assistant Secretary, Columbia Acorn Trust; executive administrator, CWAM since April 2004; prior thereto, executive assistant to the Chief Operating Officer, CWAM. | | | 10 | | | None | |
|
(1) Effective January 1, 2008, Trustee is no longer treated as an "interested person," as defined in the Investment Company Act of 1940, as amended (the "1940 Act"). Prior to January 1, 2008, Trustee was considered an "interested person" of the Trust and of CWAM, as defined in the 1940 Act, as a result of her previous affiliation with J.P. Morgan Chase & Co. Incorporated, a registered broker-dealer that may execute portfolio transactions for or engage in principal transactions with the Funds or other clients or funds advised by CWAM or its affiliates.
(2) Trustee who is an "interested person" of the Trust and of CWAM, as defined in the 1940 Act, because he is an officer of the Trust and of CWAM.
(3) Trustee who is treated as an "interested person" of the Trust and of CWAM, as defined in the 1940 Act, because he is a former officer of the Trust and former employee of and consultant to CWAM.
25
Wanger Select 2007 Annual Report
This page intentionally left blank.
26
Wanger Select 2007 Annual Report

Wanger Advisors Trust
Transfer Agent,
Dividend Disbursing Agent
Columbia Management Services, Inc.
P.O. Box 8081
Boston, Massachusetts
02266-8081
Distributor
Columbia Management Distributors, Inc.
One Financial Center
Boston, Massachusetts
02111-2621
Investment Adviser
Columbia Wanger Asset Management, L.P.
227 West Monroe Street, Suite 3000
Chicago, Illinois 60606
1-888-4-WANGER
(1-888-492-6437)
Legal Counsel
Bell, Boyd & Lloyd LLP
Chicago, Illinois
Independent Registered
Public Accounting Firm
PricewaterhouseCoopers LLP
Chicago, Illinois
This report, including the schedules of investments and financial statements, is submitted for the general information of the shareholders of the Wanger Advisors Trust.
A description of the Fund's proxy voting policies and procedures and a copy of the Fund's voting record for the most recent 12-month period ended June 30 are available (i) on the Securities and Exchange Commission's website at www.sec.gov, and (ii) without charge, upon request, by calling 1-888-492-6437.
The Fund files a complete schedule of portfolio holdings with the SEC for the first and third quarters of each fiscal year on Form N-Q. The Fund's Form N-Q is available on the SEC's website at www.sec.gov and may be reviewed and copied at the SEC's Public Reference Room in Washington, D.C. Information on the operation of the Pubic Reference Room may be obtained by calling 1-800-SEC-0330.
27
Wanger Advisors Trust
SHC-43/149304-1207 08/51433
Wanger U.S. Smaller Companies
2007 Annual Report

| NOT FDIC INSURED | | May Lose Value | |
|
| NOT BANK ISSUED | | No Bank Guarantee | |
|

Wanger U.S. Smaller Companies
2007 Annual Report
Table of Contents
| | 1 | | | Understanding Your Expenses | |
|
| | 2 | | | Ponzi Schemes and Politicians' Dreams | |
|
| | 4 | | | Performance Review | |
|
| | 6 | | | Statement of Investments | |
|
| | 14 | | | Statement of Assets and Liabilities | |
|
| | 14 | | | Statement of Operations | |
|
| | 15 | | | Statement of Changes in Net Assets | |
|
| | 16 | | | Financial Highlights | |
|
| | 17 | | | Notes to Financial Statements | |
|
| | 20 | | | Report of Independent Registered Public Accounting Firm | |
|
| | 21 | | | Federal Income Tax Information | |
|
| | 22 | | | Management Fee Evaluation of the Senior Officer | |
|
| | 26 | | | Board Approval of the Advisory Agreement | |
|
| | 28 | | | Board of Trustees and Management of Wanger Advisors Trust | |
|
Columbia Wanger Asset Management, L.P. ("CWAM") is one of the leading global small- and mid-cap equity managers in the United States with more than 37 years of small- and mid-cap investment experience. As of December 31, 2007, CWAM manages $36.8 billion in assets and is the investment adviser to Wanger U.S. Smaller Companies, Wanger International Small Cap, Wanger Select, Wanger International Select (together, the "Wanger Advisors Trust Funds") and the Columbia Acorn Family of Funds. Columbia Management Group, LLC ("Columbia Management") is the investment management division of Bank of America Corporation. Columbia Management entities furnish investment management services and products for institutional and individual investors. The Wanger Advisor Trust Funds and the Columbia Acor n Family of Funds (together with other funds advised by Columbia Management affiliates, the "Columbia Funds") are distributed by Columbia Management Distributors, Inc., member of FINRA, SIPC, part of Columbia Management and an affiliate of Bank of America Corporation. CWAM is an SEC-registered investment adviser and indirect, wholly owned subsidiary of Bank of America Corporation. CWAM is part of Columbia Management.
Please consider the investment objectives, risks, charges and expenses for the Fund carefully before investing. Contact 1-888-4-WANGER for a prospectus, which contains this and other important information about the Fund. You should read it carefully before you invest.
The views expressed in "Ponzi Schemes and Politicians' Dreams" and in the Performance Review reflect the current views of the respective parties. These views are not guarantees of future performance and involve certain risks, uncertainties and assumptions that are difficult to predict so actual outcomes and results may differ significantly from the views expressed. These views are subject to change at any time based upon economic, market or other conditions and the respective parties disclaim any responsibility to update such views. These views may not be relied on as investment advice and, because investment decisions for a Columbia Fund are based on numerous factors, may not be relied on as an indication of trading intent on behalf of any particular Columbia Fund. References to specific company securities should not be construed as a recommendation or investment advice.
Wanger U.S. Smaller Companies 2007 Annual Report
Understanding Your Expenses
As a Fund shareholder, you incur two types of costs. There are transaction costs, which generally include sales charges on purchases and may include redemption or exchange fees. There are also ongoing costs, which generally include investment advisory fees and other Fund expenses. The information on this page is intended to help you understand your ongoing costs of investing in the Fund and to compare these costs with the ongoing costs of investing in other mutual funds.
Analyzing your Fund's expenses
To illustrate these ongoing costs, we have provided an example and calculated the expenses paid by investors in the Fund during the period. The information in the following table is based on an initial, hypothetical investment of $1,000, which is invested at the beginning of the period and held for the entire period. Expense information is calculated two ways and each method provides you with different information. The amount listed in the "Actual" column is calculated using actual operating expenses and total return for the Fund. The amount listed in the "Hypothetical" column assumes that the return each year is 5% before expenses and then applies the Fund's actual expense ratio for the period to the hypothetical return. You should not use the hypothetical account values and expenses to estimate either your actual account balance at the end of the period or the expenses you paid during the period. See the "Compare with other fu nds" information for details on using the hypothetical data.
Estimating your actual expenses
To estimate the expenses that you actually paid over the period, first you will need your account balance at the end of the period.
1. Divide your ending account balance by $1,000. For example, if an account balance was $8,600 at the end of the period, the result would be 8.6.
2. In the section of the table below titled "Expenses paid during the period," you will find a dollar amount in the column labeled "Actual." Multiply this amount by the result from step 1. Your answer is an estimate of the expenses you paid on your account during the period.
July 1, 2007 – December 31, 2007
| | | Account value at the
beginning of the period ($) | | Account value at the
end of the period ($) | | Expenses paid during
period ($) | | Fund's annualized
expense ratio (%)* | |
| | | Actual | | Hypothetical | | Actual | | Hypothetical | | Actual | | Hypothetical | | Actual | |
Wanger U.S. Smaller
Companies | | | 1,000.00 | | | | 1,000.00 | | | | 951.00 | | | | 1,020.42 | | | | 4.67 | | | | 4.84 | | | | 0.95 | | |
*For the six months ended December 31, 2007.
Expenses paid during the period are equal to the Fund's annualized expense ratio, multiplied by the average account value over the period, then multiplied by the number of days in the Fund's most recent fiscal half-year and divided by 365.
It is important to note that the expense amounts shown in the table are meant to highlight only ongoing costs of investing in the Fund. Expenses paid during the period do not include any insurance charges imposed by your insurance company's separate account. The hypothetical example provided is useful in comparing ongoing costs only and will not help you determine the relative total costs of owning different funds whose shareholders may incur transaction costs.
Compare with other funds
Since all mutual funds are required to include the same hypothetical calculations about expenses in shareholder reports, you can use this information to compare the ongoing cost of investing in the Fund with other funds. To do so, compare the 5% hypothetical example with the 5% hypothetical examples of other funds. As you compare hypothetical examples of other funds, it is important to note that hypothetical examples are meant to highlight the ongoing cost of investing in a fund and do not reflect any transaction costs, such as sales charges, redemption fees or exchange fees that may be incurred by shareholders of other funds. Expenses paid during the period do not include any insurance charges imposed by your insurance company's separate accounts.
1
Wanger U.S. Smaller Companies 2007 Annual Report

Ponzi Schemes and Politicians' Dreams
Each December I attend The University of Chicago Business Forecast luncheon. Typically the event features economic forecasts by two economists, plus a summary of world political and economic issues provided by Professor Marvin Zonis.1 At this year's luncheon Professor Zonis stated that the U.S. Government had $50 trillion of unfunded liabilities. That's a staggering figure! Could it really be correct?
"Trust Me" Trust Funds
I've found that there is no precise U.S. Government unfunded liability number, though there are estimates. The U.S. Government Accountability Office (GAO) notes material weaknesses in federal government accounting in general, but has expressed an unqualified opinion on its 2007 Statement of Social Insurance. Any calculation of unfunded liabilities requires numerous actuarial assumptions plus a time horizon. The calculations by various government agencies cover liabilities for 75 years into the future.
However, it does appear that Professor Zonis' $50 trillion estimate was wrong. That number is now too low. On December 17, 2007, the GAO estimated that the U.S. Government's total reported liabilities, net social insurance commitments, and other fiscal exposures were approximately $53 trillion.2 With apologies to the late Senator Everett Dirksen (Republican: Illinois), it seems that a trillion here and a trillion there adds up.3
Despite well-publicized concerns about Social Security, Medicare is in worse shape. Created in the 1930s, Social Security seems to have been a warm-up for bigger unfunded liabilities later on. Social Security is better funded, as Social Security tax rates are higher than Medicare tax rates. Medicare was signed into law in 1965 and spending for the program quickly ran out of control. The original cost estimate for Medicare hospital insurance in 1990, for example, was $9 billion; the actual cost that year hit $67 billion!4 According to the GAO, Medicare alone has over $36 trillion of unfunded liabilities.
But what of the Social Security and Medicare Trust Funds, the Funds that politicians promised to put in a "lock box?" It turns out the politicians spent the money elsewhere and the Trust Funds loaned their money to the U.S. Treasury by buying government bonds. The Trust Funds have no true third-party assets, but simply have promises from the U.S. Treasury to pay in the future. In order for the payments to be made the Treasury will have to raise taxes, cut other spending, borrow or print money.
What was the latest change that politicians made concerning unfunded liabilities? They increased them, by adding prescription drugs to Medicare's benefits. This addition is noteworthy for three reasons. First, little new funding was created; enrollee premiums cover only about 25% of costs. Second, the program's costs and benefits are highly skewed. Baby boomers will have a net benefit of about $20,000 each while younger workers and future generations will have net costs of between $2,500 and $4,200 each.5 Third, when the new benefits were fully implemented in 2006, they drove a 19% increase in Medicare costs, the largest increase in decades. Over $10 trillion of Medicare's unfunded liability is from the drug program.
What are this year's presidential candidates saying about the unfunded liability problem? Virtually nothing and, even though taxpayers cannot afford Social Security, Medicare and other existing programs, some candidates are touting new proposals that substantially broaden federal health care spending. These plans include additional entitlements and mandatory, subsidized, health insurance participation. Cost estimates are dubious but range from $50 to $120 billion yearly.
Given the huge existing liabilities and proposals for additional benefits it appears that the U.S. Government is operating an enormous Ponzi Scheme.6 Initial participants benefit but most taxpayers are likely to lose.
Large Liabilities and Possible Solutions
$53 trillion is a huge number, nearly four times all the goods and services produced in the United States in 2007. Currently Social Security is running a yearly surplus while Medicare is running a deficit. But the aging of baby boomers is driving yearly Medicare and Social Security spending higher, so the programs' cash needs will become very large in the next decade. Medicare deficits are projected to consume 25% of all federal income taxes by 2020. By 2050, Social Security, Medicare, and Medicaid will grow from 9% to 18% of GDP. This contrasts to total federal spending averaging about 20% of GDP over the last 50 years.7
Some of the richest people in America say their taxes are too low. What if they were taxed at 100%? Not 100% of income but 100% of their net worth! This "Che Guevara lite" (confiscation without murder) solution, if applied to the 2007 Forbes list of the richest 400 Americans, would yield a one-time receipt of $1.54 trillion. That would cover 2.9% of the problem, but is of course not a real solution as it would destroy capitalism.
How about raising tax rates on all of us? The Laffer Curve8 exists—there is an income tax rate that will yield the highest dollar amount of taxes, and that rate appears to be well under 100%. Even famed British economist John Maynard Keynes said that reducing too-high tax rates results in higher tax revenues. Very high tax rates choke economic activity and spur taxpayers to take legal and illegal measures to reduce payments.
2
Wanger U.S. Smaller Companies 2007 Annual Report
Since federal income taxes began in 1913, there have been three rounds of major income tax rate cuts in the United States, and each resulted in faster economic growth and, ultimately, higher taxes collected. Paradoxically, though the rate cuts provided those with higher incomes the largest benefits, higher income people ended up paying greater percentages of total tax collections. A number of countries, including former Soviet republics, have adopted low, flat income tax rates and have seen economic growth surge and tax receipts increase.
No one knows what income tax rates create the highest tax revenues over the long run. In the last 50 years, the highest marginal tax rates in the United States have varied from a pre-Kennedy rate cut peak of 91% to a post-Reagan rate cut trough of 28%. Surprisingly, total federal government revenues as a percentage of GDP during that period have varied modestly, from 16.1% to 20.9%. Fiscal 2007 revenues were a bit above the midpoint, at 18.8% of GDP.9
While somewhat higher tax rates would probably increase near-term tax revenues, it is unlikely that substantially higher income tax rates alone can boost government receipts to the 30% or so of GDP eventually needed to fully fund the promised benefits. Massive value added taxes or sales taxes would likely be needed to provide tax revenue percentages that high. But huge tax hikes of any sort are likely to hurt economic growth, and additional solutions are needed.
As substantial liabilities become due in the next decade, there is an increased likelihood that voters will elect more courageous politicians that will strive to control spending and enact needed reforms. Perhaps the best single reform would be to restore more free market elements to our health care system. There needs to be more price transparency plus incentives for individuals and health care providers to control spending. Streamlined drug approval processes and additional tort reform would also help.
Incentives for innovation, rather than arbitrary price controls, are crucial. Improved technology has enabled over a 99.99% reduction in the cost of genome mapping in the last seven years. As costs continue to drop and advances continue to be made in biotechnology and pharmaceuticals, new ways to diagnose, treat and cure diseases are likely. Treatments customized to genetic factors promise to be much more effective and result in fewer side effects than many current drugs. The Wanger Funds have begun to own stocks in companies that are pursuing genetic tests, novel drugs and devices, plus information technology for better managing health care administration.
Outside the health care sector, Professor Jeremy Siegel has suggested that a solution for America's savings and retirement crisis will be sales of American assets to foreigners, especially those from countries with higher savings rates and younger populations. Innovative small- and mid-cap companies appear particularly attractive to foreigners, especially now that the dollar has weakened.


Charles P. McQuaid
President and Chief Investment Officer
Columbia Wanger Asset Management, L.P.
Opinions expressed in this essay are those of the author and are not necessarily those of Columbia Wanger Asset Management, its parent organizations or the Board.
1 Marvin Zonis is a professor emeritus at the Graduate School of Business at The University of Chicago, where he teaches courses on International Political Economy, Leadership and Business Strategy in the Era of E-Commerce.
2 Estimates by the Congressional Budget Office, Medicare trustees, and some private sources are higher.
3 Dirksen has been quoted as saying, "A billion here and a billion there, and pretty soon you're talking real money," but the Dirksen Congressional Center has been unable to verify the statement.
4 Source: American Enterprise Institute for Public Policy Research website, www.aei.org, "Medicare Prescription Drugs: Medical Necessity Meets Fiscal Insanity," by Joseph Antos and Jagadeesh Gokhale. Posted February 17, 2005.
5 Ibid.
6 In the 1920's, Charles Ponzi enticed investors with a bogus investment opportunity that promised a 40% return on their investment in just 90 days. Early investors were paid with dollars from later investors but most lost their money. Ponzi served four years in prison for this fraud, and then proceeded to promote other dubious ventures. He died in a charity ward of a Rio de Janeiro hospital in 1949.
7 Included in testimony on the future of Social Security presented by the Concord Coalition (www.concordcoalition.org) to a Senate special committee on aging, February 3, 2005.
8 The Laffer Curve is used to illustrate the concept of taxable income elasticity, the idea that government can maximize tax revenue by setting tax rates at an optimum point and that neither a 0% tax rate nor a 100% tax rate will generate government revenue. The curve was popularized by U.S. economics professor Arthur Laffer (b. 1940).
9 Congressional Budget Office testimony, "The Long-term Budget Outlook," December 13, 2007.
3
Wanger U.S. Smaller Companies 2007 Annual Report

Performance Review Wanger U.S. Smaller Companies

Robert A. Mohn
Portfolio Manager
Performance data quoted represents past performance and current performance may be lower or higher. Past performance is no guarantee of future results. The investment return and principal value of an investment in the Fund will fluctuate so that shares, when redeemed, may be worth more or less than the original cost. For daily and most recent month-end performance updates, please call 1-888-4-WANGER.
Wanger U.S. Smaller Companies ended the year up 5.39%. Its benchmark, the Russell 2000 Index, fell 1.57% for the year, declining with the housing and credit markets.
Energy stocks were the Fund's biggest winners for the year. Oil service company Atwood Oceanics, an owner of offshore drilling rigs, gained over 104% in 2007. Atwood reported a 100% utilization rate for its rigs in the third quarter and has been able to demand very high day rates all year long. Oil and gas producer Ultra Petroleum was up 50% for the year on strong oil production growth. FMC Technologies was another annual winner with an 84% gain on gushing sales of its subsea wellhead and oil production systems.
Two take-outs in the fourth quarter, and one from the first, brought in strong gains. Genlyte Group, a manufacturer of commercial lighting fixtures, gained 21% in 2007 on news it would sell to Philips Electronics. Pharmaceutical company MGI Pharma gained 117% when it announced it would sell to Japan's Eisai. In the first quarter, labor management software developer Kronos announced it was being sold. The stock was eliminated from the portfolio with a 50% annualized gain.
Other winners included Flir Systems, a manufacturer of infrared cameras. The company won several new defense department contracts during the year, driving a 97% gain. BioMarin rose 99% in 2007 after announcing that the FDA had approved its drug for treating a genetic disorder that affects approximately 20,000 people in the United States. By targeting rare disorders, BioMarin is able to charge higher prices and enjoy longer patent protection periods for its drugs.
While a couple of the Fund's retail holdings outperformed during 2007—True Religion Apparel gained 39% and Gaiam increased 117%—others did not. Oxford Industries fell along with the sales of its Tommy Bahama line and ended the year down 47%. Accessories retailer Coach succumbed to the general retail slump, falling 29%. Chico's FAS fell 57% due to the poor retail environment and some merchandising missteps.
Other laggards included telecom equipment provider Tellabs, which fell 36% on declining revenues. The company has been hurt by the consolidation of major telecommunication providers that, combined, need less equipment. The credit market crisis drove down returns of auto lender AmeriCredit. Its stock fell 49%.
After a rocky end to 2007, investors were hoping for better in 2008. But as of the writing of this report, the New Year is off to a poor start as fears of a U.S. recession grow. When tales of economic woe dominate the headlines, long-term investment opportunities tend to sprout. We continue our relentless search for small-cap, niche companies with the ability to exhibit strong business growth over the next three to five years (even while the sky appears to be falling).
Risks include stock market fluctuations due to economic and business developments. Investments in small- and mid-cap companies may be subject to greater volatility and price fluctuations because they may be thinly traded and less liquid.
Fund's Positions in Mentioned Holdings
As a % of net assets, as of 12/31/07
| FMC Technologies | | | 3.3 | % | |
| Ultra Petroleum | | | 1.7 | | |
| Atwood Oceanics | | | 1.6 | | |
| BioMarin | | | 1.5 | | |
| True Religion Apparel | | | 1.2 | | |
| Tellabs | | | 1.1 | | |
| Flir Systems | | | 0.9 | | |
| Genlyte Group | | | 0.9 | | |
| AmeriCredit | | | 0.9 | | |
| Coach | | | 0.8 | | |
| Oxford Industries | | | 0.6 | | |
| Chico's FAS | | | 0.4 | | |
| Gaiam | | | 0.3 | | |
| Kronos | | | 0.0 | | |
| MGI Pharma | | | 0.0 | | |
Portfolio holdings are subject to change periodically and may not be representative of current characteristics and holdings.
4
Wanger U.S. Smaller Companies 2007 Annual Report
Growth of a $10,000 Investment in
Wanger U.S. Smaller Companies
Total return for each period,
May 3, 1995 (inception date) through December 31, 2007
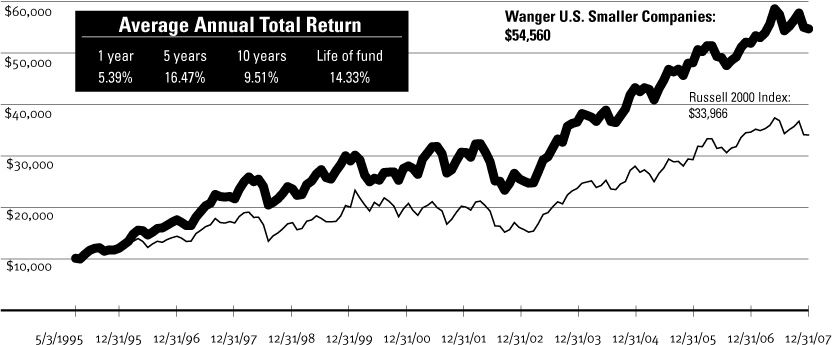
This graph compares the results of $10,000 invested in Wanger U.S. Smaller Companies on May 3, 1995 (the date the Fund began operations) through December 31, 2007, to the Russell 2000 Index, with dividends and capital gains reinvested. Performance shown here is past performance, which cannot guarantee future results. Current performance may be higher or lower. The investment return and principal value of an investment in the Fund will fluctuate so that Fund shares, when redeemed, may be worth more or less than their original cost. Performance changes over time. Current returns for the Fund may be different than that shown. For daily and most recent month-end performance updates, please contact us at 1-888-4-WANGER.
Results as of December 31, 2007
| | | 4th quarter | | 1 year | |
| Wanger U.S. Smaller Companies | | | -2.94 | % | | | 5.39 | % | |
| Russell 2000 Index | | | -4.58 | | | | -1.57 | | |
| S&P MidCap 400 Index | | | -2.73 | | | | 7.98 | | |
| S&P 500 Index | | | -3.33 | | | | 5.49 | | |
NAV as of 12/31/07: $36.26
Performance numbers reflect all Fund expenses but do not include any insurance charge imposed by your insurance company's separate accounts. If performance included the effect of these additional charges, it would be lower.
The Fund's annual operating expense ratio is 0.95%. The annual operating expense ratio is as stated in the Fund's prospectus that is current as of the date of this report. Differences in expense ratios disclosed elsewhere in this report may result from including fee waivers and reimbursements as well as different time periods used in calculating the ratios.
All results shown assume reinvestment of distributions and do not reflect taxes that a shareholder would pay on Fund distributions or the sale of Fund shares.
The Russell 2000 Index measures the performance of the 2,000 smallest companies in the Russell 3000 Index, which represents approximately 8% of the total market capitalization of the Russell 3000 Index. The S&P MidCap 400 Index is a market value-weighted index that tracks the performance of 400 mid-cap U.S. companies. The S&P 500 Index tracks the performance of 500 widely held, large-capitalization U.S. stocks. Indexes are not managed and do not incur fees or expenses. It is not possible to invest directly in an index.
Portfolio characteristics and holdings are subject to change periodically and may not be representative of current characteristics and holdings.
Top 5 Industries
As a % of net assets, as of 12/31/07
| Information | | | 30.6 | % | |
| Consumer Goods & Services | | | 18.3 | | |
| Industrial Goods & Services | | | 13.6 | | |
| Energy & Minerals | | | 12.2 | | |
| Finance | | | 10.4 | | |
Top 10 Holdings
As a % of net assets, as of 12/31/07
1. FMC Technologies
Oil & Gas Wellhead Manufacturer | | | 3.3 | % | |
2. ITT Educational Services
Post-secondary Degree Services | | | 3.0 | | |
3. Ametek
Aerospace/Industrial Instruments | | | 2.2 | | |
4. Time Warner Telecom
Fiber Optic Telephone/Data Services | | | 2.1 | | |
5. Abercrombie & Fitch
Teen Apparel Retailer | | | 2.0 | | |
6. Ultra Petroleum
Oil & Gas Producer | | | 1.7 | | |
7. Atwood Oceanics
Offshore Drilling Contractor | | | 1.6 | | |
8. American Tower
Communications Towers in USA & Mexico | | | 1.6 | | |
9. Micros Systems
Information Systems for Restaurants & Hotels | | | 1.6 | | |
10. Avid Technology
Digital Nonlinear Editing Software & Systems | | | 1.5 | | |
5
Wanger U.S. Smaller Companies 2007 Annual Report
Wanger U.S. Smaller Companies
Statement of Investments December 31, 2007
Number of
Shares | | | | Value | |
| | | | | Common Stocks – 97.9% | | | | | |
| | | Information – 30.6% | |
| | | Business Software – 7.1% | |
| | 378,655 | | | Micros Systems (a)
Information Systems for
Restaurants & Hotels | | | $26,566,435
| | |
| | 874,900 | | | Avid Technology (a)
Digital Nonlinear Editing Software & Systems | | | 24,794,666
| | |
| | 575,000 | | | Blackbaud
Software & Services for Non-profits | | | 16,123,000
| | |
| | 2,280,000 | | | Novell (a)
Directory, Operating System &
Identity Management Software | | | 15,663,600
| | |
| | 745,000 | | | Informatica (a)
Enterprise Data Integration Software | | | 13,424,900
| | |
| | 304,000 | | | Concur Technologies (a)
Web Enabled Cost & Expense
Management Software | | | 11,007,840
| | |
| | 215,100 | | | ANSYS (a)
Simulation Software for Engineers & Designers | | | 8,918,046
| | |
| | 340,000 | | | Epicor (a)
Software Systems to Run Small Businesses | | | 4,005,200
| | |
| | | | | | | | 120,503,687 | | |
| | | Instrumentation – 3.3% | |
| | 145,000 | | | Mettler Toledo (a)
Laboratory Equipment | | | 16,501,000
| | |
| | 500,000 | | | Flir Systems (a)
Infrared Cameras | | | 15,650,000
| | |
| | 368,000 | | | Trimble Navigation (a)
GPS-based Instruments | | | 11,128,320
| | |
| | 485,000 | | | IPG Photonics (a)
Fiber Lasers | | | 9,695,150
| | |
| | 45,000 | | | Varian (a)
Analytical Instruments | | | 2,938,500
| | |
| | | | | | | | 55,912,970 | | |
| | | Semiconductors & Related Equipment – 3.0% | |
| | 743,000 | | | Microsemi (a)
Analog/Mixed-signal Semiconductors | | | 16,450,020
| | |
| | 1,310,500 | | | Integrated Device Technology (a)
Communications Semiconductors | | | 14,821,755
| | |
| | 900,000 | | | AMIS Holdings (a)
Mixed-signal Semiconductors | | | 9,018,000
| | |
Number of
Shares | | | | Value | |
| | 189,300 | | | Supertex (a)
Mixed-signal Semiconductors | | | $5,923,197
| | |
| | 140,000 | | | Littelfuse (a)
Little Fuses | | | 4,614,400
| | |
| | | | | | | | 50,827,372 | | |
| | | Mobile Communications – 2.9% | |
| | 640,000 | | | American Tower (a)
Communications Towers in USA & Mexico | | | 27,264,000
| | |
| | 495,000 | | | Crown Castle International (a)
Communications Towers | | | 20,592,000
| | |
| | 88,000 | | | Globalstar (a)
Satellite Mobile Voice & Data Carrier | | | 704,000
| | |
| | | | | | | | 48,560,000 | | |
| | | Internet Related – 2.5% | |
| | 875,000 | | | TheStreet.com
Financial Information Website Publisher | | | 13,930,000
| | |
| | 1,420,000 | | | CNET Networks (a)
Internet Advertising on Niche Websites | | | 12,978,800
| | |
| | 530,000 | | | ValueClick (a)
Internet Advertising | | | 11,607,000
| | |
| | 310,000 | | | SkillSoft (a)
Web-based Learning Solutions (E-Learning) | | | 2,963,600
| | |
| | | | | | | | 41,479,400 | | |
| | | Telephone Services – 2.4% | |
| | 1,731,000 | | | Time Warner Telecom (a)
Fiber Optic Telephone/Data Services | | | 35,121,990
| | |
| | 223,100 | | | Cogent Communications (a)
Internet Data Pipelines | | | 5,289,701
| | |
| | | | | | | | 40,411,691 | | |
| | | Computer Hardware & Related Equipment – 2.3% | |
| | 375,600 | | | Amphenol
Electronic Connectors | | | 17,416,572
| | |
| | 190,000 | | | Netgear (a)
Networking Products for Small Business & Home | | | 6,777,300
| | |
| | 158,100 | | | Nice Systems (Israel) (a)
Audio & Video Recording Solutions | | | 5,425,992
| | |
| | 120,000 | | | Belden CDT
Specialty Cable | | | 5,340,000
| | |
See accompanying notes to financial statements.
6
Wanger U.S. Smaller Companies 2007 Annual Report
Wanger U.S. Smaller Companies
Statement of Investments December 31, 2007
Number of
Shares | | | | Value | |
| | | Computer Hardware & Related
Equipment – 2.3% (cont) | |
| | 100,000 | | | II-VI (a)
Laser Components | | | $3,055,000
| | |
| | 50,000 | | | Avocent (a)
Computer Control Switches | | | 1,165,500
| | |
| | | | | | | | 39,180,364 | | |
| | | Telecommunications Equipment – 2.2% | |
| | 2,933,100 | | | Tellabs (a)
Telecommunications Equipment | | | 19,182,474
| | |
| | 475,000 | | | Polycom (a)
Video Conferencing Equipment | | | 13,195,500
| | |
| | 125,000 | | | Ciena (a)
Optical Transport & Broadband
Access Equipment | | | 4,263,750
| | |
| | | | | | | | 36,641,724 | | |
| | | Financial Processors – 1.4% | |
| | 516,880 | | | Global Payments
Credit Card Processor | | | 24,045,257
| | |
| | | Computer Services – 0.7% | |
| | 155,000 | | | SRA International (a)
Government IT Services | | | 4,564,750
| | |
| | 753,000 | | | RCM Technologies (a) (b)
Technology & Engineering Services | | | 4,427,640
| | |
| | 705,500 | | | AnswerThink
IT Integration & Best Practice Research | | | 3,414,620
| | |
| | | | | | | | 12,407,010 | | |
| | | Business Information & Marketing
Services – 0.6% | |
| | 443,200 | | | Navigant Consulting (a)
Financial Consulting Firm | | | 6,058,544
| | |
| | 100,000 | | | Viad
Trade Show Services, Travel & Tours | | | 3,158,000
| | |
| | | | | | | | 9,216,544 | | |
| | | TV Broadcasting – 0.5% | |
| | 1,030,000 | | | Entravision Communications (a)
Spanish Language TV, Radio & Outdoor | | | 8,064,900
| | |
Number of
Shares | | | | Value | |
| | | Radio – 0.4% | |
| | 561,900 | | | Salem Communications
Radio Stations for Religious Programming | | | $3,702,921
| | |
| | 260,000 | | | Cumulus Media (a)
Radio Stations in Small Cities | | | 2,090,400
| | |
| | 515,000 | | | Spanish Broadcasting System (a)
Spanish Language Radio Stations | | | 952,750
| | |
| | | | | | | | 6,746,071 | | |
| | | CATV – 0.4% | |
| | 240,000 | | | Discovery Holding (a)
CATV Programming | | | 6,033,600
| | |
| | | Contract Manufacturing – 0.3% | |
| | 115,000 | | | Plexus (a)
Electronic Manufacturing Services | | | 3,019,900
| | |
| | 1,500,000 | | | Sanmina-SCI (a)
Electronic Manufacturing Services | | | 2,730,000
| | |
| | | | | | | | 5,749,900 | | |
| | | Television Programming – 0.3% | |
| | 600,000 | | | Lions Gate Entertainment (a)
Film & TV Studio | | | 5,652,000
| | |
| | | Gaming Equipment & Services – 0.3% | |
| | 100,000 | | | Scientific Games (a)
Lottery Services Provider | | | 3,325,000
| | |
| | 98,500 | | | Shuffle Master (a)
Card Shufflers & Casino Games | | | 1,181,015
| | |
| | | | 4,506,015 | | |
| | | | | Total Information | | | 515,938,505 | | |
| | | Consumer Goods & Services – 18.3% | |
| | | Retail – 5.3% | |
| | 431,000 | | | Abercrombie & Fitch
Teen Apparel Retailer | | | 34,467,070
| | |
| | 885,000 | | | Urban Outfitters (a)
Apparel & Home Specialty Retailer | | | 24,125,100
| | |
| | 175,000 | | | J Crew Group (a)
Multi-channel Branded Retailer | | | 8,436,750
| | |
| | 265,000 | | | AnnTaylor Stores (a)
Women's Apparel Retailer | | | 6,773,400
| | |
| | 745,000 | | | Chico's FAS (a)
Women's Specialty Retailer | | | 6,727,350
| | |
See accompanying notes to financial statements.
7
Wanger U.S. Smaller Companies 2007 Annual Report
Wanger U.S. Smaller Companies
Statement of Investments December 31, 2007
Number of
Shares | | | | Value | |
| | | Retail – 5.3% (cont) | |
| | 409,150 | | | Christopher & Banks
Women's Apparel Retailer | | | $4,684,768
| | |
| | 150,000 | | | Gaiam (a)
Healthy Living Catalogs & E-Commerce | | | 4,452,000
| | |
| | 3,800 | | | Lululemon Athletica (a)
Premium Active Apparel Retailer | | | 180,006
| | |
| | | | | | | | 89,846,444 | | |
| | | Other Consumer Services – 3.7% | |
| | 585,000 | | | ITT Educational Services (a)
Post-secondary Degree Services | | | 49,882,950
| | |
| | 150,000 | | | Weight Watchers International
Weight Loss Programs | | | 6,777,000
| | |
| | 200,000 | | | Universal Technical Institute (a)
Vocational Training | | | 3,400,000
| | |
| | 99,000 | | | NutriSystem (a)
Weight Loss Programs | | | 2,671,020
| | |
| | | | | | | | 62,730,970 | | |
| | | Apparel – 2.6% | |
| | 925,000 | | | True Religion Apparel (a)
Premium Denim | | | 19,748,750
| | |
| | 459,000 | | | Coach (a)
Designer & Retailer of Branded Leather Accessories | | | 14,036,220
| | |
| | 394,200 | | | Oxford Industries
Branded & Private Label Apparel | | | 10,158,534
| | |
| | | | | | | | 43,943,504 | | |
| | | Leisure Products – 1.8% | |
| | 324,300 | | | International Speedway
Largest Motorsports Racetrack Owner & Operator | | | 13,354,674
| | |
| | 248,200 | | | Speedway Motorsports
Motorsports Racetrack Owner & Operator | | | 7,714,056
| | |
| | 140,000 | | | Thor Industries
RV & Bus Manufacturer | | | 5,321,400
| | |
| | 150,000 | | | Winnebago
Premier Motorhome Maker | | | 3,153,000
| | |
| | | | | | | | 29,543,130 | | |
| | | Other Durable Goods – 1.4% | |
| | 1,478,300 | | | Champion Enterprises (a)
Manufactured Homes | | | 13,925,586
| | |
Number of
Shares | | | | Value | |
| | 288,400 | | | Cavco Industries (a)
Higher End Manufactured Homes | | | $9,759,456
| | |
| | | | | | | | 23,685,042 | | |
| | | Casinos & Gaming – 0.8% | |
| | 555,000 | | | Pinnacle Entertainment (a)
Regional Casino Operator | | | 13,075,800
| | |
| | | Furniture & Textiles – 0.7% | |
| | 200,000 | | | Herman Miller
Office Furniture | | | 6,478,000
| | |
| | 335,000 | | | Knoll
Office Furniture | | | 5,504,050
| | |
| | | | | | | | 11,982,050 | | |
| | | Nondurables – 0.7% | |
| | 230,000 | | | Scotts Miracle-Gro
Consumer Lawn & Garden Products | | | 8,606,600
| | |
| | 122,000 | | | Jarden (a)
Branded Household Products | | | 2,880,420
| | |
| | | | | | | | 11,487,020 | | |
| | | Consumer Goods Distribution – 0.5% | |
| | 433,500 | | | Pool
Distributor of Swimming Pool
Supplies & Equipment | | | 8,596,305
| | |
| | | Restaurants – 0.4% | |
| | 337,500 | | | Sonic (a)
Quick Service Restaurant | | | 7,391,250
| | |
| | | Food & Beverage – 0.2% | |
| | 90,000 | | | Hansen Natural (a)
Alternative Beverages | | | 3,986,100
| | |
| | | Travel – 0.2% | |
| | 45,000 | | | Vail Resorts (a)
Ski Resort Operator & Developer | | | 2,421,450
| | |
| | | | | Total Consumer Goods & Services | | | 308,689,065 | | |
See accompanying notes to financial statements.
8
Wanger U.S. Smaller Companies 2007 Annual Report
Wanger U.S. Smaller Companies
Statement of Investments December 31, 2007
Number of
Shares | | | | Value | |
| | | Industrial Goods & Services – 13.6% | |
| | | Machinery – 8.7% | |
| | 795,000 | | | Ametek
Aerospace/Industrial Instruments | | | $37,237,800
| | |
| | 690,600 | | | Pentair
Pumps & Water Treatment | | | 24,039,786
| | |
| | 365,100 | | | Nordson
Dispensing Systems for Adhesives & Coatings | | | 21,161,196
| | |
| | 527,300 | | | ESCO Technologies (a)
Automatic Electric Meter Readers | | | 21,060,362
| | |
| | 392,300 | | | Donaldson
Industrial Air Filtration | | | 18,194,874
| | |
| | 182,200 | | | Mine Safety Appliances
Safety Equipment | | | 9,450,714
| | |
| | 196,000 | | | Clarcor
Mobile & Industrial Filters | | | 7,442,120
| | |
| | 71,800 | | | Toro
Turf Maintenance Equipment | | | 3,908,792
| | |
| | 50,000 | | | Kaydon
Specialized Friction & Motion Control Products | | | 2,727,000
| | |
| | 21,860 | | | MOOG (a)
Motion Control Products for Aerospace,
Defense & Industrial Markets | | | 1,001,407
| | |
| | | | | | | | 146,224,051 | | |
| | | Outsourcing Services – 1.1% | |
| | 400,000 | | | Quanta Services (a)
Electrical & Telecom Construction Services | | | 10,496,000
| | |
| | 305,000 | | | Administaff
Professional Employer Organization | | | 8,625,400
| | |
| | | | | | | | 19,121,400 | | |
| | | Other Industrial Services – 1.1% | |
| | 415,000 | | | American Commercial Lines (a)
Operator/Builder of Inland Barges | | | 6,739,600
| | |
| | 365,000 | | | American Reprographics (a)
Document Management & Logistics | | | 6,015,200
| | |
| | 89,000 | | | G&K Services
Uniform Rental | | | 3,339,280
| | |
| | 180,000 | | | TrueBlue (a)
Temporary Manual Labor | | | 2,606,400
| | |
| | | | | | | | 18,700,480 | | |
Number of
Shares | | | | Value | |
| | | Electrical Components – 0.9% | |
| | 158,000 | | | Genlyte Group (a)
Commercial Lighting Fixtures | | | $15,041,600
| | |
| | | Construction – 0.7% | |
| | 35,000 | | | Martin Marietta Materials
Aggregates | | | 4,641,000
| | |
| | 50,000 | | | Texas Industries
Aggregates, Cement & Concrete | | | 3,505,000
| | |
| | 22,126 | | | Vulcan Materials
Aggregates, Concrete & Asphalt | | | 1,749,945
| | |
| | 140,000 | | | M/I Homes
Home Builder | | | 1,470,000
| | |
| | | | | | | | 11,365,945 | | |
| | | Industrial Materials & Specialty
Chemicals – 0.4% | |
| | 155,000 | | | Drew Industries (a)
RV & Manufactured Home Components | | | 4,247,000
| | |
| | 90,000 | | | Albany International
Paper Machine Clothing & Advanced Textiles | | | 3,339,000
| | |
| | | | | | | | 7,586,000 | | |
| | | Industrial Distribution – 0.4% | |
| | 50,000 | | | Airgas
Industrial Gas Distributor | | | 2,605,500
| | |
| | 70,000 | | | Watsco
HVAC Distribution | | | 2,573,200
| | |
| | 75,000 | | | Interline Brands (a)
Industrial Distribution | | | 1,643,250
| | |
| | | | | | | | 6,821,950 | | |
| | | Waste Management – 0.3% | |
| | 184,200 | | | Waste Connections (a)
Solid Waste Management | | | 5,691,780
| | |
| | | | | Total Industrial Goods & Services | | | 230,553,206 | | |
| | | Energy & Minerals – 12.2% | |
| | | Oil Services – 6.7% | |
| | 981,400 | | | FMC Technologies (a)
Oil & Gas Wellhead Manufacturer | | | 55,645,380
| | |
| | 275,800 | | | Atwood Oceanics (a)
Offshore Drilling Contractor | | | 27,646,192
| | |
See accompanying notes to financial statements.
9
Wanger U.S. Smaller Companies 2007 Annual Report
Wanger U.S. Smaller Companies
Statement of Investments December 31, 2007
Number of
Shares | | | | Value | |
| | | Oil Services – 6.7% (cont) | |
| | 203,125 | | | Exterran Holdings (a)
Natural Gas Compressor
Rental & Fabrication | | | $16,615,625
| | |
| | 132,700 | | | Tesco (a)
Developing New Well Drilling Technologies | | | 3,804,509
| | |
| | 241,500 | | | Tetra Technologies (a)
U.S.-based Services Company with Life of
Field Approach | | | 3,760,155
| | |
| | 69,800 | | | Dresser-Rand Group (a)
Largest Manufacturer of Compressors | | | 2,725,690
| | |
| | 61,400 | | | CARBO Ceramics
Natural Gas Well Stimulants | | | 2,284,080
| | |
| | | | | | | | 112,481,631 | | |
| | | Oil & Gas Producers – 5.4% | |
| | 400,000 | | | Ultra Petroleum (a)
Oil & Gas Producer | | | 28,600,000
| | |
| | 416,000 | | | Equitable Resources
Natural Gas Producer & Utility | | | 22,164,480
| | |
| | 325,000 | | | Carrizo Oil & Gas (a)
Explores for Natural Gas & Crude Oil | | | 17,793,750
| | |
| | 195,000 | | | Quicksilver Resources (a)
Natural Gas & Coal Seam Gas Producer | | | 11,620,050
| | |
| | 153,600 | | | Southwestern Energy (a)
Oil & Gas Producer | | | 8,558,592
| | |
| | 450,000 | | | Vaalco Energy (a)
Oil & Gas Producer | | | 2,092,500
| | |
| | | | | | | | 90,829,372 | | |
| | | Oil Refining, Marketing & Distribution – 0.1% | |
| | 50,000 | | | Oneok
Natural Gas Distribution, Pipeline Processing & Trading | | | 2,238,500
| | |
| | | | | Total Energy & Minerals | | | 205,549,503 | | |
| | | Finance – 10.4% | |
| | | Insurance – 3.8% | |
| | 720,500 | | | HCC Insurance Holdings
Specialty Insurance | | | 20,663,940
| | |
| | 26,500 | | | Markel (a)
Specialty Insurance | | | 13,014,150
| | |
| | 276,000 | | | Leucadia National
Insurance Holding Company | | | 12,999,600
| | |
Number of
Shares | | | | Value | |
| | 105,000 | | | Philadelphia Consolidated Holding (a)
Specialty Insurance | | $ | 4,131,750 | | |
| | 250,000 | | | Conseco (a)
Life, Long-term Care & Medical
Supplement Insurance | | | 3,140,000 | | |
| | 75,000 | | | Endurance Specialty Holdings
Commercial Lines Insurance/Reinsurance | | | 3,129,750 | | |
| | 87,000 | | | Delphi Financial Group
Group Employee Benefit Products & Services | | | 3,069,360 | | |
| | 166,234 | | | Eastern Insurance Holdings
Workers Comp. & Specialty Insurance | | | 2,736,212 | | |
| | 200,000 | | | Meadowbrook Insurance Group (a)
Specialty Insurance Products & Services | | | 1,882,000 | | |
| | | | | | | | 64,766,762 | | |
| | | Banks – 2.9% | |
| | 205,000 | | | MB Financial
Chicago Bank | | | 6,320,150
| | |
| | 289,675 | | | Lakeland Financial
Indiana Bank | | | 6,054,207
| | |
| | 220,000 | | | Old Second Bancorp
Illinois Bank | | | 5,893,800
| | |
| | 280,816 | | | Glacier Bancorp
Mountain States Bank | | | 5,262,492
| | |
| | 146,975 | | | Chittenden
New England Bank | | | 5,235,250
| | |
| | 215,000 | | | First Busey
Illinois Bank | | | 4,269,900
| | |
| | 155,600 | | | Associated Banc-Corp
Midwest Bank | | | 4,215,204
| | |
| | 337,000 | | | Pacific Continental
Niche Pacific N.W. Bank | | | 4,199,020
| | |
| | 179,700 | | | TCF Financial
Great Lakes Bank | | | 3,222,021
| | |
| | 108,200 | | | Valley National Bancorp
New Jersey/New York Bank | | | 2,062,292
| | |
| | 86,000 | | | Greene County Bancshares
Tennessee Bank | | | 1,651,200
| | |
| | 14,982 | | | West Bancorporation
Des Moines Commercial Bank | | | 195,365
| | |
| | | | | | | | 48,580,901 | | |
See accompanying notes to financial statements.
10
Wanger U.S. Smaller Companies 2007 Annual Report
Wanger U.S. Smaller Companies
Statement of Investments December 31, 2007
Number of
Shares | | | | Value | |
| | | Finance Companies – 1.9% | |
| | 1,142,400 | | | AmeriCredit (a)
Auto Lending | | | $14,611,296
| | |
| | 270,000 | | | McGrath Rentcorp
Temporary Space & IT Rentals | | | 6,952,500
| | |
| | 144,800 | | | World Acceptance (a)
Personal Loans | | | 3,906,704
| | |
| | 175,000 | | | H & E Equipment Services (a)
Heavy Equipment Leasing | | | 3,304,000
| | |
| | 140,000 | | | Aaron Rents
Rent-to-own | | | 2,693,600
| | |
| | 66,897 | | | Electro Rent
Test & Measurement Rentals | | | 993,420
| | |
| | | | | | | | 32,461,520 | | |
| | | Brokerage & Money Management – 1.3% | |
| | 642,000 | | | SEI Investments
Mutual Fund Administration & Investment Management | | | 20,653,140
| | |
| | 110,919 | | | Thomas Weisel Partners Group (a)
Boutique Bay Area Investment Bank | | | 1,522,918
| | |
| | | | | | | | 22,176,058 | | |
| | | Savings & Loans – 0.5% | |
| | 448,000 | | | People's United
Connecticut Savings & Loan | | | 7,974,400
| | |
| | 20,100 | | | Anchor Bancorp Wisconsin
Wisconsin Thrift | | | 472,752
| | |
| | | | | | | | 8,447,152 | | |
| | | | | Total Finance | | | 176,432,393 | | |
| | | Health Care – 10.4% | |
| | | Biotechnology & Drug Delivery – 4.8% | |
| | 700,000 | | | BioMarin (a)
Biotech Focused on Orphan Diseases | | | 24,780,000
| | |
| | 955,000 | | | PDL BioPharma (a)
Proprietary Monoclonal Antibodies | | | 16,731,600
| | |
| | 501,400 | | | Seattle Genetics (a)
Antibody-based Therapies for Cancer | | | 5,715,960
| | |
| | 100,000 | | | Myriad Genetics (a)
Drugs/Diagnostics Hybrid | | | 4,642,000
| | |
| | 545,000 | | | Array Biopharma (a)
Drugs for Cancer & Inflammatory Diseases | | | 4,588,900
| | |
Number of
Shares | | | | Value | |
| | 1,215,000 | | | Decode Genetics (a)
Drugs for Heart Attack, Asthma &
Vascular Disease | | | $4,471,200
| | |
| | 535,000 | | | Nektar Therapeutics (a)
Drug Delivery Technologies | | | 3,589,850
| | |
| | 320,000 | | | Medarex (a)
Humanized Antibodies | | | 3,334,400
| | |
| | 401,000 | | | Arena Pharmaceuticals (a)
Novel Drug Targeting Technology | | | 3,139,830
| | |
| | 40,000 | | | Alexion Pharmaceuticals (a)
Biotech Focused on Orphan Diseases | | | 3,001,200
| | |
| | 2,824,725 | | | Medicure (a) | | | 2,824,725 | | |
| | 738,060 | | | Medicure – Warrants (a) (c)
Cardiovascular Biotech Company | | | 295,224
| | |
| | 400,000 | | | Neurogen (a)
Development-stage Biotech Focused
on Neurology | | | 1,380,000
| | |
| | 220,000 | | | Pharmacopeia (a)
Biotech Company with Broad
Early-stage Pipeline | | | 1,049,400
| | |
| | 500,000 | | | IsoRay (a) | | | 990,000 | | |
| | 100,000 | | | IsoRay – Warrants (a) (c)
Radiology Cancer Company | | | 5,000
| | |
| | 273,500 | | | Nuvelo (a)
Development-stage Biotech Focused on
Cardiovascular/Cancer | | | 500,505 | | |
| | 57,630 | | | La Jolla Pharmaceutical (a)
Lupus Treatment | | | 225,909
| | |
| | 25,000 | | | Locus Pharmaceuticals,
Series A-1, Pfd. (a) (c) | | | 65,000 | | |
| | 12,886 | | | Locus Pharmaceuticals,
Series B-1, Pfd. (a) (c)
High Throughput Rational Drug Design | | | 33,504
| | |
| | | | | | | | 81,364,207 | | |
| | | Medical Equipment & Devices – 1.7% | |
| | 155,300 | | | Orthofix International (a)
Bone Fixation & Stimulation Devices | | | 9,002,741
| | |
| | 105,000 | | | Vital Signs
Anesthesia, Respiratory & Sleep Products | | | 5,367,600
| | |
| | 85,000 | | | Illumina (a)
Leading Tools & Service Provider for
Genetic Analysis | | | 5,037,100
| | |
See accompanying notes to financial statements.
11
Wanger U.S. Smaller Companies 2007 Annual Report
Wanger U.S. Smaller Companies
Statement of Investments December 31, 2007
Number of
Shares | | | | Value | |
| | | Medical Equipment & Devices – 1.7% (cont) | |
| | 106,400 | | | Edwards Lifesciences (a)
Heart Valves | | | $4,893,336
| | |
| | 137,227 | | | Advanced Medical Optics (a)
Medical Devices for Eye Care | | | 3,366,179
| | |
| | | | | | | | 27,666,956 | | |
| | | Pharmaceuticals – 1.5% | |
| | 145,000 | | | Cephalon (a)
Specialty Pharmaceuticals for Pain,
Central Nervous System & Oncology | | | 10,405,200
| | |
| | 1,140,000 | | | QLT (a)
Specialty Pharmaceuticals for
Ophthalmology & Dermatology | | | 5,038,800
| | |
| | 180,000 | | | Medicis Pharmaceutical
Specialty Pharmaceuticals for Dermatology | | | 4,674,600
| | |
| | 300,000 | | | Collagenex Pharmaceuticals (a)
Specialty Pharmaceuticals for Dermatology | | | 2,865,000
| | |
| | 505,000 | | | Barrier Therapeutics (a)
Specialty Pharmaceuticals for Dermatology | | | 1,989,700
| | |
| | | | | | | | 24,973,300 | | |
| | | Health Care Services – 1.3% | |
| | 400,000 | | | Lincare Holdings (a)
Home Health Care Services | | | 14,064,000 | | |
| | 435,000 | | | PSS World Medical (a)
Medical Supplies | | | 8,512,950
| | |
| | | | | | | | 22,576,950 | | |
| | | Medical Supplies – 1.1% | |
| | 235,700 | | | ICU Medical (a)
Intravenous Therapy Products | | | 8,487,557
| | |
| | 280,000 | | | QIAGEN (Netherlands) (a)
Life Science Company; DNA/RNA Purification | | | 5,894,000
| | |
| | 70,700 | | | Techne (a)
Cytokines, Antibodies & other Reagents for
Life Science | | | 4,669,735
| | |
| | | | | | | | 19,051,292 | | |
| | | | | Total Health Care | | | 175,632,705 | | |
Number of
Shares or
Principal Amount | | | | Value | |
| | | Other Industries – 2.4% | |
| | | Real Estate – 1.1% | |
| | 440,000 | | | DiamondRock Hospitality
Hotel Owner | | | $6,591,200
| | |
| | 100,000 | | | Digital Realty Trust
Technology-focused Office Buildings | | | 3,837,000
| | |
| | 77,500 | | | Gaylord Entertainment (a)
Convention Hotels | | | 3,136,425
| | |
| | 90,000 | | | American Campus Communities
Student Housing | | | 2,416,500
| | |
| | 150,000 | | | Kite Realty Group
Community Shopping Centers | | | 2,290,500
| | |
| | | | | | | | 18,271,625 | | |
| | | Transportation – 0.9% | |
| | 580,800 | | | Heartland Express
Regional Trucker | | | 8,235,744
| | |
| | 160,000 | | | JB Hunt Transport Services
Truck & Intermodal Carrier | | | 4,408,000
| | |
| | 177,397 | | | Rush Enterprises (a)
Truck Distribution | | | 3,225,077
| | |
| | | | | | | | 15,868,821 | | |
| | | Regulated Utilities – 0.4% | |
| | 185,000 | | | Northeast Utilities
Regulated Electric Utility | | | 5,792,350
| | |
| | | | | Total Other Industries | | | 39,932,796 | | |
| Total Common Stocks (Cost: $1,223,928,123) – 97.9% | | | 1,652,728,173 | | |
| Short-Term Obligations – 2.4% | |
| $ | 8,700,000 | | | IBM (d)
4.23% due 01/03/08 | | | 8,697,956 | | |
| | 8,600,000 | | | Toyota Motor Credit
4.18% due 01/02/08 | | | 8,599,001 | | |
| | 22,946,000 | | | Repurchase Agreement with Fixed
Income Clearing Corp., dated 12/31/07,
due 01/02/08 at 3.00%, collateralized
by a U.S. Government Agency
Obligation, maturing 02/06/17, market
value $23,411,000 (repurchase
proceeds $22,949,824) | | | 22,946,000 | | |
| Total Short-Term Obligations (Cost: $40,242,957) | | | 40,242,957 | | |
See accompanying notes to financial statements.
12
Wanger U.S. Smaller Companies 2007 Annual Report
Wanger U.S. Smaller Companies
Statement of Investments December 31, 2007
| | | Value | |
| Total Investments (Cost: $1,264,171,080 – 100.3% (e) | | $ | 1,692,971,130 | | |
| Cash and Other Assets Less Liabilities – (0.3)% | | | (4,930,977 | ) | |
| Total Net Assets – 100.0% | | | 1,688,040,153 | | |
Notes to Statement of Investments:
(a) Non-income producing security.
(b) An affiliate may include any company in which the Fund owns five percent or more of its outstanding voting shares. Transactions in affiliated companies during the twelve months ended December 31, 2007, are as follows:
| Affiliates | | Balance
of Shares
Held
12/31/2006 | | Purchases/
Additions | | Sales/
Reductions | | Balance
of Shares
Held
12/31/2007 | | Value | | Dividend | |
RCM
Technologies | | | 753,000 | | | | — | | | | — | | | | 753,000 | | | $ | 4,427,640 | | | | — | | |
The aggregate cost and value of this company at December 31, 2007, was $5,474,962 and $4,427,640 respectively. Investments in affiliate companies represent 0.26% of total net assets at December 31, 2007.
(c) Denotes a restricted security, which is subject to restrictions on resale under federal securities laws. These securities are valued in good faith by the Board of Trustees. At December 31, 2007, these securities amounted to $398,728 which represents 0.02% of total net assets.
Additional information on these securities is as follows:
Security | | Acquisition
Dates | |
Shares | |
Cost | |
Value | |
Locus Pharmaceuticals,
Series A-1, Pfd. | | 9/5/01 | | | 25,000 | | | $ | 1,000,000 | | | $ | 65,000 | | |
Locus Pharmaceuticals,
Series B-1, Pfd. | | 2/8/07 | | | 12,866 | | | | 37,369 | | | | 33,504 | | |
| IsoRay – Warrants | | 3/21/07 | | | 100,000 | | | | 0 | | | | 5,000 | | |
| Medicure – Warrants | | 12/22/06 | | | 738,060 | | | | 0 | | | | 295,224 | | |
| | | | | | | | $ | 1,037,369 | | | $ | 398,728 | | |
(d) Security exempt from registration under Section 4(2) of the Securities Act of 1933. This security may only be resold in exempt transactions to qualified buyers. Private resales of these securities to qualified institutional buyers are also exempt from registration pursuant to Rule 144A under the Securities Act of 1933. At December 31, 2007, this security amounted to $8,697,956, which represents 0.52% of net assets.
(e) At December 31, 2007, for federal income tax purposes cost of investments was $1,264,483,228 and net unrealized appreciation was $428,487,902 consisting of gross unrealized appreciation of $583,313,578 and gross unrealized depreciation of $154,825,676.
At December 31, 2007, the Fund held investments in the following sectors:
| Sector | | % of
Net Assets | |
| Information | | | 30.6 | | |
| Consumer Goods & Services | | | 18.3 | | |
| Industrial Goods & Services | | | 13.6 | | |
| Energy & Minerals | | | 12.2 | | |
| Finance | | | 10.4 | | |
| Health Care | | | 10.4 | | |
| Other Industries | | | 2.4 | | |
| Short-Term Obligations | | | 2.4 | | |
| Cash and Other Assets less Liabilities | | | (0.3 | ) | |
| | | | 100.0 | | |
See accompanying notes to financial statements.
13
Wanger U.S. Smaller Companies 2007 Annual Report
Statement of Assets and Liabilities
December 31, 2007
| Assets: | |
| Unaffiliated investments, at cost | | $ | 1,258,696,118 | | |
| Affiliated investments, at cost (See Note 4) | | | 5,474,962 | | |
| Unaffiliated investments, at value | | $ | 1,688,543,490 | | |
| Affiliated investments, at value (See Note 4) | | | 4,427,640 | | |
| Cash | | | 991 | | |
| Receivable for: | |
| Investments sold | | | 14,365,355 | | |
| Fund shares sold | | | 333,472 | | |
| Interest | | | 1,912 | | |
| Dividends | | | 472,946 | | |
| Trustees' deferred compensation plan | | | 41,333 | | |
| Total Assets | | | 1,708,187,139 | | |
| Liabilities: | |
| Payable for: | |
| Investments purchased | | | 3,603,952 | | |
| Fund shares repurchased | | | 14,987,132 | | |
| Investment advisory fee | | | 1,240,713 | | |
| Administration fee | | | 72,967 | | |
| Transfer agent fee | | | 54 | | |
| Trustees' fees | | | 99 | | |
| Custody fee | | | 7,032 | | |
| Chief compliance officer expenses | | | 2,088 | | |
| Trustees' deferred compensation plan | | | 41,333 | | |
| Other liabilities | | | 191,616 | | |
| Total Liabilities | | | 20,146,986 | | |
| Net Assets | | $ | 1,688,040,153 | | |
| Composition of Net Assets: | |
| Paid-in capital | | $ | 1,089,364,855 | | |
| Overdistributed net investment income | | | (41,332 | ) | |
| Accumulated net realized gain | | | 169,916,580 | | |
| Net unrealized appreciation on investments | | | 428,800,050 | | |
| Net Assets | | $ | 1,688,040,153 | | |
| Fund Shares Outstanding | | | 46,553,626 | | |
Net asset value, offering price and redemption
price per share | | $ | 36.26 | | |
Statement of Operations
For the Year Ended December 31, 2007
| Investment Income: | |
| Dividends (net of foreign taxes withheld of $190) | | $ | 11,081,758 | | |
| Interest income | | | 2,224,016 | | |
| Total Investment Income | | | 13,305,774 | | |
| Expenses: | |
| Investment advisory fee | | | 14,860,608 | | |
| Administration fee | | | 363,402 | | |
| Transfer agent fee | | | 599 | | |
| Trustees' fees | | | 81,256 | | |
| Custody fee | | | 55,826 | | |
| Reports to shareholders | | | 542,759 | | |
| Legal fees | | | 114,921 | | |
| Chief compliance officer expenses (See Note 4) | | | 45,549 | | |
| Other expenses (See Note 5) | | | 54,503 | | |
| Total Expenses | | | 16,119,423 | | |
| Custody earnings credit | | | (10,044 | ) | |
| Net Expenses | | | 16,109,379 | | |
| Net Investment Loss | | | (2,803,605 | ) | |
Net Realized and Unrealized Gain (Loss) on
Investments: | |
| Net realized gain (loss) on: | |
| Investments | | | 170,386,161 | | |
| Net realized gain | | | 170,386,161 | | |
| Net change in unrealized depreciation on: | |
| Unaffiliated investments | | | (89,744,788 | ) | |
| Affiliated investments (See Note 4) | | | (82,830 | ) | |
| Net unrealized loss due to a trading error | | | (5,260 | ) | |
| Reimbursement of trading loss by investment adviser | | | 5,260 | | |
Net change in unrealized depreciation
on investments | | | (89,827,618 | ) | |
| Net Gain | | | 80,558,543 | | |
| Net Increase in Net Assets from Operations | | $ | 77,754,938 | | |
See accompanying notes to financial statements.
14
Wanger U.S. Smaller Companies 2007 Annual Report
Statement of Changes in Net Assets
| | | Year Ended December 31, | |
| Increase (Decrease) in Net Assets | | 2007 | | 2006 | |
| From Operations: | |
| Net investment loss | | $ | (2,803,605 | ) | | $ | (1,119,633 | ) | |
| Net realized gain on investments | | | 170,386,161 | | | | 86,495,092 | | |
Net change in unrealized appreciation (depreciation)
on investments | | | (89,827,618 | ) | | | 27,720,176 | | |
| Net Increase in Net Assets from Operations | | | 77,754,938 | | | | 113,095,635 | | |
| Distributions to Shareholders: | |
| From net investment income | | | — | | | | (3,589,922 | ) | |
| From net realized gains | | | (85,256,052 | ) | | | (50,639,120 | ) | |
| Total Distributions to Shareholders | | | (85,256,052 | ) | | | (54,229,042 | ) | |
| Share Transactions: | |
| Subscriptions | | | 217,123,775 | | | | 193,269,036 | | |
| Distributions reinvested | | | 85,256,052 | | | | 54,229,042 | | |
| Redemptions | | | (215,178,752 | ) | | | (191,719,601 | ) | |
| Net Increase from Share Transactions | | | 87,201,075 | | | | 55,778,477 | | |
| Total Increase in Net Assets | | | 79,699,961 | | | | 114,645,070 | | |
| Net Assets: | |
| Beginning of period | | | 1,608,340,192 | | | | 1,493,695,122 | | |
| End of period | | | 1,688,040,153 | | | | 1,608,340,192 | | |
| Overdistributed net investment income at end of period | | | (41,332 | ) | | | (9,413 | ) | |
See accompanying notes to financial statements.
15
Wanger U.S. Smaller Companies 2007 Annual Report
Financial Highlights
| | | Year Ended December 31, | |
| Selected data for a share outstanding throughout each period | | 2007 | | 2006 | | 2005 | | 2004 | | 2003 | |
| Net Asset Value, Beginning of Period | | $ | 36.36 | | | $ | 34.90 | | | $ | 31.37 | | | $ | 26.51 | | | $ | 18.51 | | |
| Income from Investment Operations: | |
| Net investment income (loss) (a) | | | (0.05 | )(b) | | | (0.02 | ) | | | 0.09 | | | | (0.14 | ) | | | (0.11 | ) | |
| Net realized and unrealized gain on investments | | | 1.91 | | | | 2.71 | | | | 3.44 | | | | 5.00 | | | | 8.11 | | |
| Total from Investment Operations | | | 1.86 | | | | 2.69 | | | | 3.53 | | | | 4.86 | | | | 8.00 | | |
| Less Distributions to Shareholders: | |
| From net investment income | | | — | | | | (0.08 | ) | | | — | | | | — | | | | — | | |
| From net realized capital gains | | | (1.96 | ) | | | (1.15 | ) | | | — | | | | — | | | | — | | |
| Total Distributions to Shareholders | | | (1.96 | ) | | | (1.23 | ) | | | — | | | | — | | | | — | | |
| Net Asset Value, End of Period | | $ | 36.26 | | | $ | 36.36 | | | $ | 34.90 | | | $ | 31.37 | | | $ | 26.51 | | |
| Total Return (c) | | | 5.39 | % | | | 7.87 | % | | | 11.25 | %(d) | | | 18.33 | % | | | 43.22 | % | |
| Ratios to Average Net Assets/Supplemental Data: | |
| Net expenses before interest expense (e) | | | 0.95 | % | | | 0.95 | % | | | 0.95 | % | | | 1.00 | % | | | 0.99 | % | |
| Interest expense | | | — | | | | 0.00 | %(f) | | | — | | | | — | | | | — | | |
| Net expenses (e) | | | 0.95 | % | | | 0.95 | % | | | 0.95 | % | | | 1.00 | % | | | 0.99 | % | |
| Net investment income (loss) (e) | | | (0.15 | )% | | | (0.07 | )% | | | 0.29 | % | | | (0.49 | )% | | | (0.48 | )% | |
| Waiver | | | — | | | | — | | | | 0.00 | %(f) | | | — | | | | — | | |
| Portfolio turnover rate | | | 27 | % | | | 19 | % | | | 11 | % | | | 15 | % | | | 10 | % | |
| Net assets, end of period (000's) | | $ | 1,688,040 | | | $ | 1,608,340 | | | $ | 1,493,695 | | | $ | 1,153,553 | | | $ | 822,658 | | |
(a) Net investment income (loss) per share was based upon the average shares outstanding during the period.
(b) Net investment income per share reflects special dividends. The effect of these dividends amounted to $0.08 per share.
(c) Total return at net asset value assuming all distributions are reinvested.
(d) Had the investment adviser not waived a portion of expenses, total return would have been reduced.
(e) The benefits derived from custody fees paid indirectly had an impact of less than 0.01%.
(f) Rounds to less than 0.01%.
See accompanying notes to financial statements.
16
Wanger U.S. Smaller Companies 2007 Annual Report
Notes to Financial Statements
1. Nature of Operations
Wanger U.S. Smaller Companies (the "Fund"), is a series of Wanger Advisors Trust (the "Trust"), an open-end management investment company organized as a Massachusetts business trust. The investment objective of the Fund is to seek long-term growth of capital. The Fund is available only for allocation to certain life insurance company separate accounts established for the purpose of funding qualified and non-qualified variable annuity contracts and variable life insurance policies and may also be offered directly to certain types of pension plans and retirement arrangements.
2. Significant Accounting Policies
Security valuation
Securities of the Fund are valued at market value or, if a market quotation for a security is not readily available or is deemed not to be reliable because of events or circumstances that have occurred between the market quotation and the time as of which the security is to be valued, the security is valued at a fair value determined in accordance with procedures established by the Board of Trustees. A security traded on a securities exchange or in an over-the-counter market in which transaction prices are reported is valued at the last sales price at the time of valuation. A security traded principally on NASDAQ is valued at the NASDAQ official closing price. A security for which there is no reported sale on the valuation date is valued at the latest bid quotation. A short term debt obligation having a maturity of 60 days or less from the valuation date is valued at amortized cost, which approximates fair value. A security for which a market quotation is not readily available and any other assets are valued in accordance with procedures established by the Board of Trustees. The Trust has retained an independent statistical fair value pricing service to assist in the fair valuation process for securities principally traded in a foreign market in order to adjust for possible changes in value that may occur between the close of the foreign exchange and the time as of which the securities are to be valued. If a security is valued at fair value, that value may be different from the last quoted market price for the security.
In September 2006, Statement of Financial Accounting Standards No. 157, Fair Value Measurements ("SFAS 157"), was issued. SFAS 157 is effective for fiscal years beginning after November 15, 2007. SFAS 157 defines fair value, establishes a framework for measuring fair value and expands disclosures about fair value measurements. Management is evaluating the impact the application of SFAS 157 will have on the Fund's financial statement disclosures.
Repurchase agreements
The Fund may engage in repurchase agreement transactions. The Fund, through its custodians, receives delivery of underlying securities collateralizing each repurchase agreement. The Fund's custodian determines that the value of the underlying securities is at all times at least equal to the resale price. In the event of default or bankruptcy by the other party to the agreement, realization and/or retention of the collateral may be subject to legal proceedings.
Foreign currency translations
Values of investments denominated in foreign currencies are converted into U.S. dollars using the spot market rate of exchange at the time of valuation. Purchases and sales of investments and dividend and interest income are translated into U.S. dollars using the spot market rate of exchange prevailing on the respective dates of such transactions. The gain or loss resulting from changes in foreign exchange rates is included with net realized and unrealized gain or loss from investments, as appropriate.
Security transactions and investment income
Security transactions are accounted for on the trade date (date the order to buy or sell is executed) and dividend income is recorded on the ex-dividend date, except that certain dividends from foreign securities are recorded as soon as the information is available to the Fund. Interest income is recorded on the accrual basis and includes amortization of discounts on debt obligations when required for federal income tax purposes. Realized gains and losses from security transactions are recorded on an identified cost basis.
Awards, if any, from class action litigation related to securities owned may be recorded as a reduction of cost of those securities. If the applicable securities are no longer owned, the proceeds are recorded as realized gains.
The Fund estimates the tax character of distributions from real estate investment trusts ("REITS"). Distributions received in excess of income are recorded as a reduction of the cost of the related investments. If the applicable securities are no longer owned, any distributions received in excess of income are recorded as realized gains.
Restricted securities
Restricted securities are securities that may only be resold upon registration under federal securities laws or in transactions exempt from registration. In some cases, the issuer of restricted securities has agreed to register such securities for resale at the issuer's expense either upon demand by the Fund or in connection with another registered offering of the securities. Many restricted securities may be resold in the secondary market in transactions exempt from registration. Such restricted securities may be determined to be liquid under criteria established by the Board of Trustees. The Fund will not incur any registration costs upon such resale.
Use of estimates
The preparation of financial statements in conformity with accounting principles generally accepted in the United States of America ("GAAP") requires management to make estimates and assumptions that affect the amounts reported in the financial statements and accompanying notes. Actual results may differ from those estimates.
Fund share valuation
Fund shares are sold and redeemed on a continuing basis at net asset value. Net asset value per share is determined daily as of the close of trading on the New York Stock Exchange ("the Exchange") on each day the Exchange is open for trading by dividing the total value of the Fund's investments and other assets, less liabilities, by the number of Fund shares outstanding.
Custody fees/Credits
Custody fees are reduced based on the Fund's cash balances maintained with the custodian. The amount is disclosed as a reduction of total expenses in the Statement of Operations.
Federal income taxes
The Fund has complied with the provisions of the Internal Revenue Code available to regulated investment companies and, in the manner provided therein, distributes all its taxable income, as well as any net realized gain on sales of investments and foreign currency transactions reportable for federal income tax purposes. Accordingly, the Fund paid no federal income taxes and no federal income tax provision was required.
Foreign capital gains taxes
Realized gains on certain countries may be subject to foreign taxes at the fund level, at rates ranging from 10%-15%. The Fund accrues for such foreign taxes on net realized and unrealized gains at the appropriate rate for each jurisdiction.
Distributions to shareholders
Distributions to shareholders are recorded on the ex-date.
Indemnification
In the normal course of business, the Fund enters into contracts that contain a variety of representations and warranties which provide general indemnities.
17
Wanger U.S. Smaller Companies 2007 Annual Report
Notes to Financial Statements, continued
The Fund's maximum exposure under these arrangements is unknown, as this would involve future claims against the Fund. Also under the Trust's organizational documents, the Trustees and Officers of the Trust are indemnified against certain liabilities that may arise out of their duties to the Trust. However based on experience, the Fund expects the risk of loss due to these warranties and indemnities to be minimal.
3. Federal Tax Information
The timing and character of income and capital gain distributions are determined in accordance with income tax regulations, which may differ from GAAP. Reclassifications are made to the Fund's capital accounts for permanent tax differences to reflect income and gains available for distribution (or available capital loss carryforwards) under income tax regulations.
For the year ended December 31, 2007, permanent book and tax basis differences resulting primarily from differing treatments for net operating losses were identified and reclassified among the components of the Fund's net assets as follows:
Overdistributed
Net Investment
Income | | Accumulated
Net Realized
Gain/(Loss) | | Paid-In Capital | |
| $ | 2,771,686 | | | $ | (91,561 | ) | | $ | (2,680,125 | ) | |
Net investment income and net realized gains (losses), as disclosed on the Statement of Operations, and net assets were not affected by this reclassification.
The tax character of distributions paid during the years ended December 31, 2007 and December 31, 2006 were as follows:
| | | December 31, 2007 | | December 31, 2006 | |
| Distributions paid from: | |
| Ordinary Income* | | $ | 1,760,549 | | | $ | 3,784,450 | | |
| Long-Term Capital Gains | | | 83,495,503 | | | | 50,444,592 | | |
* For tax purposes short-term capital gains distributions, if any, are considered ordinary income distributions.
As of December 31, 2007, the components of distributable earnings on a tax basis were as follows:
Undistributed
Ordinary
Income | | Undistributed
Long-term
Capital Gains | | Net Unrealized
Appreciation* | |
| $ | — | | | $ | 170,228,727 | | | $ | 428,487,902 | | |
* The differences between book-basis and tax-basis net unrealized appreciation/depreciation are primarily due to non-deductible deferred trustees fees and deferral of losses from wash sales.
The Funds adopted Financial Accounting Standards Board ("FASB") Interpretation No. 48, Accounting for Uncertainty in Income Taxes—an Interpretation of FASB Statement No. 109 ("FIN 48") effective June 29, 2007. FIN 48 requires management to determine whether a tax position of the Fund is more likely than not to be sustained upon examination by the applicable taxing authority, including resolution of any related appeals or litigation processes, based on the technical merits of the position. The tax benefit to be recognized is measured as the largest amount of benefit that is greater than fifty percent likely of being realized upon ultimate settlement. FIN 48 must be applied to all existing tax positions upon initial adoption and the cumulative effect, if any, is to be reported as an adjustment to net assets. Management has evaluated the known implications of FIN 48 on its computation of net assets for the Fund. As a result of this evaluation, management believes that FIN 48 does not have any effect on the Fund's financial statements. However, management's conclusions regarding FIN 48 may be subject to review and adjustment at a later date based on factors including, but not limited to, further implementation guidance from the FASB, new tax laws, regulations, and administrative interpretations (including relevant court decisions). The Fund's federal tax returns for the prior three fiscal years remain subject to examination by the Internal Revenue Service. The Funds are not aware of any tax positions for which it is reasonably possible that the total amounts of unrecognized tax benefits will significantly change in the next twelve months.
4. Transactions With Affiliates
Columbia Wanger Asset Management, L.P., ("CWAM") is a wholly owned subsidiary of Columbia Management Group, LLC, which in turn is an indirect wholly owned subsidiary of Bank of America Corporation ("BOA"). CWAM furnishes continuing investment supervision to the Fund and is responsible for the overall management of the Fund's business affairs.
Effective August 1, 2007, under the Fund's investment advisory agreement, fees are accrued daily based on the Fund's average daily net assets and paid monthly to CWAM at the annual rates shown in the table below:
| Average Daily Net Assets | | Annual Fee Rate | |
| Up to $100 million | | | 0.94 | % | |
| $100 million to $250 million | | | 0.89 | % | |
| $250 million to $2 billion | | | 0.84 | % | |
| $2 billion and over | | | 0.80 | % | |
Prior to August 1, 2007, as provided under the Fund's investment advisory agreement, fees were accrued daily based on the Fund's average daily net assets and paid monthly to CWAM at the annual rates shown in the table below:
| Average Daily Net Assets | | Annual Fee Rate | |
| Up to $100 million | | | 0.99 | % | |
| $100 million to $250 million | | | 0.94 | % | |
| $250 million and over | | | 0.89 | % | |
For the year ended December 31, 2007, the Fund's effective investment advisory fee rate was 0.88%.
CWAM provides administrative services and receives an administration fee from the Fund. Prior to August 1, 2007, administrative services were covered under the Fund's investment advisory agreement in place between the Fund and CWAM. Effective August 1, 2007, under the Fund's new administration agreement, which provides the same types of administrative services that were provided under the Fund's investment advisory agreement, fees are accrued daily and paid monthly to CWAM at the annual rate of 0.05%. Accordingly, the investment advisory fees were decreased by 0.05% across all asset levels effective August 1, 2007 as well.
For the year ended December 31, 2007, the Fund's effective administration fee rate was 0.02%.
Certain officers and trustees of the Trust are also officers of CWAM. The Trust makes no direct payments to its officers and trustees who are affiliated with CWAM.
The Board of Trustees appointed a Chief Compliance Officer to the Fund in accordance with federal securities regulations. The Fund will pay its pro-rata share of the expenses associated with the Office of the Chief Compliance Officer. These expenses are disclosed separately as "Chief compliance officer expenses" in the Statement of Operations.
The Trust offers a deferred compensation plan for its independent trustees. Under that plan, a trustee may elect to defer all or a portion of his or her compensation. Amounts deferred are retained by the Trust and represent an unfunded obligation of the Trust. The value of amounts deferred is determined by reference to the change in value of Class Z shares of one or more series of the Columbia Acorn Trust or a money market fund as specified by the trustee. Benefits under the deferred compensation plan are payable when the trustee ceases to be a member of the Board of Trustees.
18
Wanger U.S. Smaller Companies 2007 Annual Report
Notes to Financial Statements, continued
Columbia Management Distributors, Inc. (the "Distributor"), a wholly owned subsidiary of BOA, serves as the principal underwriter of the Trust and receives no compensation for its services.
Columbia Management Services, Inc. (the "Transfer Agent"), a wholly owned subsidiary of BOA, provides shareholder services to the Fund and has subcontracted with Boston Financial Data Services ("BFDS") to serve as subtransfer agent. For such services, the Transfer Agent receives a fee, paid monthly, at the annual rate of $21.00 per open account. The Transfer Agent also receives reimbursement for certain out-of-pocket expenses.
An affiliate may include any company in which a fund owns five percent or more of its outstanding voting shares. On December 31, 2007, the Fund held five percent or more of the outstanding voting securities of one or more companies. Details of investments in those affiliated companies are presented on page 13.
During the year ended December 31, 2007, the Fund engaged in purchase and sale transactions with funds that have a common investment adviser (or affiliated investment advisers), common directors/trustees, and/or common officers. Those purchase and sale transactions complied with provisions of Rule 17a-7 under the Investment Company Act of 1940 and were $114,800 and $528,000, respectively.
5. Borrowing Arrangements
The Trust participates in a $150 million credit facility, which was entered into to facilitate portfolio liquidity. Interest is charged to each participating fund based on its borrowings at a rate per annum equal to the Federal Funds rate plus 0.50%. In addition, a commitment fee of 0.08% per annum of the unutilized line of credit is accrued and apportioned among the participating funds based on their relative net assets. The commitment fee is included in "Other expenses" in the Statement of Operations. No amounts were borrowed by the Fund under this facility during the year ended December 31, 2007.
6. Fund Share Transactions
Proceeds and payments on Fund shares as shown in the Statement of Changes in Net Assets are in respect of the following numbers of shares:
| | | Year ended
December 31, 2007 | | Year ended
December 31, 2006 | |
| Shares sold | | | 5,698,486 | | | | 5,444,074 | | |
Shares issued in reinvestment
of dividend distributions | | | 2,466,900 | | | | 1,565,956 | | |
| Less shares redeemed | | | (5,844,748 | ) | | | (5,577,186 | ) | |
| Net increase in shares outstanding | | | 2,320,638 | | | | 1,432,844 | | |
7. Investment Transactions
The aggregate cost of purchases and proceeds from sales other than short-term obligations for the year ended December 31, 2007 were $507,715,125 and $441,493,369, respectively.
8. Other
During the year ended December 31, 2007, the Fund had a unrealized loss due to a trading error. The loss of $5,260 was reimbursed by CWAM.
9. Legal Proceedings
CWAM, Columbia Acorn Trust (another mutual fund family advised by CWAM), and the trustees of Columbia Acorn Trust (collectively, the "Columbia defendants") are named as defendants in class and derivative complaints that have been consolidated in a Multi-District Action (the "MDL Action") in the federal district court of Maryland. These lawsuits contend that defendants permitted certain investors to market time their trades in certain Columbia Acorn Funds. The MDL Action is ongoing. However, all claims against Columbia Acorn Trust and the independent trustees of Columbia Acorn Trust have been dismissed.
Columbia Acorn Trust and CWAM are also defendants in a class action lawsuit that alleges, in summary, that Columbia Acorn Trust and CWAM exposed shareholders of Columbia Acorn International Fund to trading by market timers by allegedly: (a) failing to properly evaluate daily whether a significant event affecting the value of the fund's securities had occurred after foreign markets had closed but before the calculation of the fund's net asset value ("NAV"); (b) failing to implement the fund's portfolio valuation and share pricing policies and procedures; and (c) failing to know and implement applicable rules and regulations concerning the calculation of NAV (the "Fair Valuation Lawsuit"). The Seventh Circuit ruled that the plaintiffs' state law claims were preempted under federal law resulting in the dismissal of plaintiffs' complaint. Plaintiffs appealed the Seventh Circuit's ruling to the United States Supreme Court. The Suprem e Court reversed the Seventh Circuit's ruling on jurisdictional grounds and the case was ultimately remanded to the state court.
On March 21, 2005, a class action complaint was filed against the Columbia Acorn Trust and CWAM seeking to rescind the CDSC assessed upon redemption of Class B shares of Columbia Acorn Funds due to the alleged market timing of the Columbia Acorn Funds (the "CDSC Lawsuit"). In addition to the rescission of sales charges, plaintiffs seek recovery of actual damages, attorneys' fees and costs. The case had been transferred to the MDL Action in the federal district court of Maryland.
On September 14, 2007, the plaintiffs and the Columbia defendants named in the MDL Action, including the Columbia Funds, entered into a stipulation of settlement with respect to all Columbia-related claims in the MDL Action described above, including the CDSC and Fair Valuation Lawsuits. The settlement is subject to court approval.
CWAM, the Columbia Acorn Funds and the Trustees of the Trust are also defendants in a consolidated lawsuit filed in the federal district court of Massachusetts alleging that CWAM used Fund assets to make undisclosed payments to brokers as an incentive for the brokers to market the Funds over other mutual funds to investors. The complaint alleges CWAM and the Trustees of Columbia Acorn Trust, along with certain affiliated entities and individuals, breached certain common law duties and federal laws.
On November 30, 2005, the judge dismissed all claims by plaintiffs and entered final judgment in favor of the defendants. The plaintiffs appealed to the United States Court of Appeals for the First Circuit on December 30, 2005. A stipulation and settlement agreement dated January 19, 2007 was filed in the First Circuit on February 14, 2007, with a joint stipulation of dismissal and motion for remand to obtain district court approval of the settlement. That joint motion was granted and the appeal was dismissed. On March 6, 2007, the case was remanded to the federal district court. The settlement, approved by the federal district court on September 18, 2007, became effective October 19, 2007. Pursuant to the settlement, the funds' adviser and/or its affiliates made certain payments, including plaintiffs' attorneys' fees and costs of notice to class members.
The Trust and CWAM intend to defend these suits vigorously.
As a result of these matters, or any adverse publicity or other developments resulting from them, there may be increased redemptions or reduced sales of Columbia Acorn fund shares, which could increase transaction costs or operating expenses, or have other adverse consequences for the Columbia Acorn funds. However, based on currently available information, the Columbia Acorn Trust believes that the likelihood that these lawsuits will have a material adverse impact on any fund is remote, and CWAM believes that the lawsuits are not likely to materially affect its ability to provide investment management services to the funds.
19
Wanger U.S. Smaller Companies 2007 Annual Report
Report of Independent Registered Public Accounting Firm
To the Board of Trustees and Shareholders of Wanger U.S. Smaller Companies,
In our opinion, the accompanying statement of assets and liabilities, including the statement of investments, and the related statements of operations and of changes in net assets and the financial highlights present fairly, in all material respects, the financial position of Wanger U.S. Smaller Companies (a series of the Wanger Advisors Trust, hereinafter referred to as the "Fund") at December 31, 2007, the results of its operations for the year then ended, the changes in its net assets for each of the two years in the period then ended and the financial highlights for each of the four years in the period then ended, in conformity with accounting principles generally accepted in the United States of America. These financial statements and financial highlights (hereafter referred to as "financial statements") are the responsibility of the Fund's management; our responsibility is to express an opinion on these financial statement s based on our audits. We conducted our audits of these financial statements in accordance with the standards of the Public Company Accounting Oversight Board (United States). Those standards require that we plan and perform the audit to obtain reasonable assurance about whether the financial statements are free of material misstatement. An audit includes examining, on a test basis, evidence supporting the amounts and disclosures in the financial statements, assessing the accounting principles used and significant estimates made by management, and evaluating the overall financial statement presentation. We believe that our audits, which included confirmation of securities at December 31, 2007 by correspondence with the custodian and brokers, provide a reasonable basis for our opinion. The financial highlights of the Fund for the period ended December 31, 2003 were audited by other independent auditors whose report dated February 6, 2004 expressed an unqualified opinion on those financial statements.
PricewaterhouseCoopers LLP
Chicago, Illinois
February 20, 2008
20
Wanger U.S. Smaller Companies 2007 Annual Report
Federal Income Tax Information (Unaudited)
For the fiscal year ended December 31, 2007, the Fund designated long-term capital gains of $170,294,598, and 100.00% of the ordinary income distributed by the Fund, for the year ended December 31, 2007, qualifies for the corporate dividends received deduction.
21
Wanger U.S. Smaller Companies 2007 Annual Report
[Excerpt from:]
Wanger Advisors Trust
Management Fee Evaluation of the Senior Officer
Prepared Pursuant to the New York Attorney General's
Assurance of Discontinuance
June 2007
22
Wanger U.S. Smaller Companies 2007 Annual Report
Introduction
The New York Attorney General's Assurance of Discontinuance ("Order") entered into by Columbia Management Advisors, Inc. ("CMAI") and Columbia Management Distributors, Inc., ("CMDI" and collectively with "CMAI," "CMG") in February 2005, allows CMAI to manage or advise a mutual fund only if the trustees of the fund appoint a "Senior Officer" to perform specified duties and responsibilities. One of these responsibilities includes "managing the process by which proposed management fees (including but not limited to, advisory fees) to be charged the [Funds] are negotiated so that they are negotiated in a manner which is at arms' length and reasonable and consistent with this Assurance of Discontinuance."
This is the first year that the Columbia Acorn Trust and Wanger Advisors Trust (collectively, the "Trusts") and each series thereof (the "Acorn Funds," "WAT Funds" or collectively, the "Funds") have been overseen by the same Board of Trustees ("Board"). The Order provides that this Board must determine the reasonableness of proposed "management fees" by using either an annual competitive bidding process supervised by the Senior Officer or Independent Fee Consultant, or by obtaining "an annual independent written evaluation prepared by or under the direction of the Senior Officer or the Independent Fee Consultant."
"Management fees" are only part of the costs and expenses paid by mutual fund shareholders. The expenses can vary depending upon the class of shares held but usually include: (1) investment management or advisory fees to compensate analysts and portfolio managers for stock research and portfolio management, as well as the cost of operating a trading desk; (2) administrative expenses incurred to prepare registration statements and tax returns, calculate the Funds' net asset values, maintain effective compliance procedures and perform recordkeeping services; (3) transfer agency costs for establishing accounts, accepting and disbursing funds, as well as overseeing trading in Fund shares; (4) custodial expenses incurred to hold the securities purchased by the Funds; and (5) distribution expenses, including commissions paid to brokers that sell the Fund shares to investors.
Columbia Wanger Asset Management, L.P. ("CWAM"), the adviser to the Funds, has proposed that with respect to the Acorn Funds, the Columbia Acorn Trust continue the existing separate agreements governing the first two categories listed above: an advisory agreement governing portfolio management, and an administration agreement governing certain administration and clerical services. Together the fees paid under these two agreements are referred to as "management fees." CWAM proposes that the WAT Funds continue the existing single agreement governing both investment advisory and administrative services. A single management fee would cover both services. Other fund expenses are governed by separate agreements, in particular agreements with two CWAM affiliates: CMDI, the broker-dealer that underwrites and distributes the Funds' shares, and Columbia Management Services, Inc. ("CMSI"), the Funds' transfer agent. In conformity with the terms of the Order, this evaluation, therefore, addresses only the advisory and administrative contracts, and does not extend to the other agreements.
According to the Order, the Senior Officer's evaluation must consider at least the following:
(1) Management fees (including components thereof) charged to institutional and other clients of CWAM for like services;
(2) Management fees (including any components thereof) charged by other mutual fund companies for like services;
(3) Costs to CWAM and its affiliates of supplying services pursuant to the management fee agreements, excluding any intra-corporate profit;
(4) Profit margins of CWAM and its affiliates from supplying such services;
(5) Possible economies of scale as the Funds grow larger; and
(6) The nature and quality of CWAM's services, including the performance of each Fund.
In 2004, the Boards of the two Trusts, then separate groups, each appointed me Senior Officer under the Order. They also determined not to pursue a competitive bidding process and instead, charged me with the responsibility of evaluating the Funds' proposed advisory and administrative fee contracts with CWAM in conformity with the requirements of the Order. This Report is an annual evaluation required under the Order. In discharging their responsibilities, the independent Trustees have also consulted independent, outside counsel.
2007 Evaluation
This is the third annual evaluation prepared in connection with the Order. This evaluation follows the same structure as the earlier studies. Some areas are given more emphasis here, while others are given less. Still, the fundamental information gathered for this evaluation is largely the same as past years.
Process and Independence
The objectives of the Order are to insure the independent evaluation of the advisory fees paid by the Funds as well as to insure that all relevant factors are considered. In my view, this contract renewal process has been conducted at arms-length and with independence in gathering, considering and evaluating all relevant data. At the outset of the process, the Trustees sought and obtained from CWAM and CMG a comprehensive compilation of data regarding Fund performance and expenses, adviser profitability, and other information. The Board evaluated this information thoroughly and also explored CWAM's potential capacity restraints. Performance and expense data was obtained from both Morningstar and Lipper, the leading consultants in this area. The rankings prepared by Morningstar and Lipper were independent and not influenced by the adviser. CWAM itself identified what it considers competing funds, and the Trustees considered that data as well.
In the course of its work, the Contract Committee gave careful consideration to the conclusions and recommendations contained in last year's evaluation. The Contract Committee gave particular emphasis to the issue of whether economies of scale were appropriately reflected in the Funds' fee schedules. Last year, the
23
Wanger U.S. Smaller Companies 2007 Annual Report
Board sought and CWAM agreed to additional breakpoints for two Funds, Acorn USA and Acorn Select. These breakpoints are above current asset levels, but clearly operate to share economies of scale with Fund shareholders. This year, at the Board's request, CWAM has proposed additional breakpoints for the WAT Funds, and Acorn International Select. This proposal is under consideration by the Board.
My evaluation of the advisory contract was shaped, as it was last year, by my experience as Chief Compliance Officer of the Trusts ("CCO"). As CCO, I report solely to the Board and have no reporting obligation to or employment relationship with CMG or its affiliates, except for administrative purposes. I have commented on compliance matters in evaluating the quality of service provided by CWAM.
This Report, its supporting materials and the data contained in other materials submitted to the Contract Committee of the Board, in my view, provide a thorough factual basis upon which the Board, in consultation with independent counsel as it deems appropriate, may conduct management fee negotiations that are in the best interests of the Funds' shareholders.
The Fee Reductions Mandated under the Order
Under the terms of the Order, CMG agreed to secure certain management fee reductions for the mutual funds advised by its affiliate investment advisers. In some instances, breakpoints were also established. Although neither CWAM nor the Trusts was a party to the Order, CWAM offered and the Board accepted certain advisory fee reductions during 2005. By the terms of the Order, these fees may not be increased before November 30, 2009. I have used these advisory fee levels—as modified last year to add certain breakpoints for Acorn USA and Acorn Select—in this evaluation because they are the fees in the current agreements that CWAM proposes should be continued. Hence, these fee levels are the starting point of an evaluation.
Conclusions
My review of the data and other material above leads to the following conclusions with respect to the factors identified in the Order.
1. Performance. The domestic Funds generally have achieved outstanding performance. The Acorn Fund, Acorn USA, Acorn Select, Wanger Select and Wanger US Smaller Companies all rank very favorably against their peers over the past five years. Although Acorn USA and Wanger US Smaller Companies had a difficult year in 2006, these returns are not characteristic of these funds, both of which have shown improved performance during the first quarter of 2007. The international Funds have relatively weaker long term records than the domestic funds, but recently have improved significantly and their one year rankings are excellent. Overall then, performance of the Funds is excellent.
2. Management Fees relative to Peers. The management fee rankings for several of the Acorn Funds are generally more favorable to shareholders than those of their peer group funds. Management fees do, however, vary by Fund. Acorn Fund is the least expensive and the Acorn USA the most expensive. Acorn Fund is very competitive, while Acorn USA and Acorn Select were ranked by both Lipper and Morningstar at or below the median, and therefore impose higher fees than do the majority of their competitors. The WAT Funds also lag their competitors and impose higher fees than their peers.
3. Administrative Fees. The Acorn Funds' administrative fee, which is uniform across all Funds, is at a level comparable to or less expensive than the fees imposed by their peers, provides for appropriate services to Funds, and affords breakpoints that lower the fee as assets increase. The WAT Funds pay a single fee for advisory and administrative services and hence do not benefit from administrative fee breakpoints, nor is it possible to assess their administrative costs relative to competitors.
4. Management Fees relative to Institutional and Other Mutual Fund Accounts. CWAM's focus is on its mutual funds. It does not actively seek to manage separate or institutional accounts. The few institutional accounts it does manage vary in rate structures. Some pay advisory fees commensurate with or higher than the Acorn and WAT Funds. In a few instances, however, institutional accounts pay lower advisory fees than do the Acorn Funds. One particular institutional account is significant in size and has been under CWAM's management for over 25 years.
5. Costs to CWAM and its Affiliates. CWAM's direct costs do not appear excessive. Overhead and indirect costs allocated to CWAM by its parent organizations, however, are significant and increasing. CWAM's affiliates report operating losses and therefore do not appear to profit from CWAM's advisory agreement with the Funds.
6. Profit Margins. CWAM's firm-wide, pre-marketing expense profit margins are at the top of the industry, though these comparisons are hampered by limited industry data. High profit margins are not unexpected for firms that manage large, successful funds and have provided outstanding investment performance for investors.
7. Economies of Scale. Economies of scale do exist at CWAM and will expand as the assets of the Funds get larger. They are, however, only partially reflected in the management fee schedule for the Acorn Funds and not reflected at all in two of the four WAT Funds. Breakpoints above current asset levels have, however, been added to the more expensive funds, Acorn Select and Acorn USA. Nonetheless, if Fund assets continue to grow, under the Funds' current fee schedules, all Fund shareholders might not benefit in a manner generally commensurate with CWAM's increased profits. Management has proposed additional breakpoints for some of the Funds that, if implement, would result in greater sharing of economies of scale.
24
Wanger U.S. Smaller Companies 2007 Annual Report
8. Nature and Quality of Services. This category includes a variety of considerations that are difficult to quantify, yet can have a significant bearing on the performance of the Acorn Funds. Several areas merit comment.
a. Capacity. The Funds have continued to grow, posing ever greater challenges in deploying assets effectively. While trends here merit continued monitoring, CWAM appears to be managing assets effectively.
b. Compliance. CWAM has a reasonably designed compliance program that protects shareholders.
c. Administrative Services. The Funds benefit from a variety of administrative services that are performed by CWAM and CMAI.
9. Process. In my opinion, the process of negotiating an advisory contract for the Funds has been conducted thoroughly and at arms' length. Further, the Trustees have sufficient information to evaluate management's proposal, and negotiate contract terms that are in the best interests of fund shareholders.
Recommendations
(with respect to the Wanger Funds)
I believe the Trustees should:
1. Continue to consider additional ways to restructure the advisory fee beyond the current breakpoint schedule to reflect more fully economies of scale.
2. Consider unbundling of the advisory and administrative fees paid by the WAT Funds.
3. Review the disparity in management fee levels between the Acorn International Fund and its related annuity-based fund, WAT International Small Cap Fund.
4. Continue to monitor CWAM's capacity limitations to insure that the Funds' expanding assets do not impair investment performance.
Robert P. Scales
Senior Vice President,
Chief Legal Officer
and General Counsel
June 18, 2007
25
Wanger U.S. Smaller Companies 2007 Annual Report
Board Approval of the Existing Advisory Agreement
Wanger Advisors Trust (the "Trust") has an investment advisory agreement (the "Advisory Agreement") with Columbia Wanger Asset Management, L.P. ("CWAM") under which CWAM manages the Wanger Advisors Funds (the "Funds"). The trustees of the Trust, more than seventy five percent of whom have never been affiliated with CWAM ("Independent Trustees"), oversee the management of each Fund and, as required by law, determine at least annually whether to continue the Advisory Agreement for each Fund.
The Contract Committee of the board of trustees (the "Committee"), which is comprised of six Independent Trustees, makes recommendations to the board regarding any proposed continuation of the Advisory Agreement. After the Committee has made its recommendation, the full board determines whether to approve the continuation of the Advisory Agreement. In addition, the board considers matters bearing on the Advisory Agreement at most of its other meetings throughout the year and meets at least quarterly with the portfolio managers employed by CWAM.
In connection with their most recent consideration of the Advisory Agreement for each Fund, the Committee and all trustees received and reviewed a substantial amount of information provided by CWAM in response to requests of the Independent Trustees and their counsel. Throughout their consideration of the Advisory Agreement, the Independent Trustees were advised by their independent legal counsel. At each of the meetings at which the Committee or the Independent Trustees considered the Advisory Agreement, they met with management and also met separately in executive session with their counsel.
The materials reviewed by the Committee and the trustees included, among other items, (i) information on the investment performance of each Fund and the performance of peer groups of funds and of the Fund's performance benchmarks, (ii) information on each Fund's advisory fees and other expenses, including information comparing the Fund's fees and expenses to those of peer groups of funds and information about any applicable expense limitations and fee "breakpoints," (iii) data on sales and redemptions of Fund shares and (iv) information on the profitability to CWAM and its affiliates of their relationships with the Funds and potential "fall-out" or ancillary benefits that CWAM and its affiliates may receive as a result of their relationships with the Funds. They also considered other information such as (i) CWAM's financial results and financial condition, (ii) each Fund's investment objective and strategies; (iii) the size, edu cation and experience of CWAM's investment staff and its use of technology, external research and trading cost measurement tools, (iv) the allocation of the Funds' brokerage, if any, including allocations to brokers affiliated with CWAM, and the use of "soft" commission dollars to pay for research products and services, (v) the resources devoted to, and the record of compliance with, the Funds' investment policies and restrictions, policies on personal securities transactions and other compliance policies and (vi) the economic outlook generally and for the mutual fund industry in particular. In addition, the trustees conferred with, and reviewed the Management Fee Evaluation (the "Fee Evaluation") prepared by, the Trust's chief compliance officer, who also serves as the Trust's "Senior Officer" as contemplated by the Assurance of Discontinuance dated February 9, 2005 among affiliates of CWAM and the Office of the New York Attorney General. [A summary of the Fee Evaluation is included in this report.] Through out the process, the trustees had the opportunity to ask questions of and request additional materials from CWAM.
On July 17, 2007, the board of trustees unanimously approved (a) a new administration agreement between the Trust and CWAM, pursuant to which CWAM, for a fee at the annual rate of 0.05% of average daily net assets of the Trust, provides to the Trust the types of administrative services that were currently being provided to the Trust under the Advisory Agreement and(b) the continuation of the Advisory Agreement through July 31, 2008, with amendments to the fee schedule to provide (i) a corresponding 0.05% reduction in the annual rate of fee as a result of entering into the administration agreement and (ii) additional breakpoints, as described below. The approval followed Committee meetings held in February, May, June and July 2007.
In considering the continuation of the Advisory Agreement (and entering into the new administration agreement), the trustees reviewed and analyzed various factors that they determined were relevant, including the factors described below, none of which by itself was considered dispositive. However, the material factors and conclusions that formed the basis for the trustees' determination to approve the continuation of the Advisory Agreement (and entering into the new administration agreement) are discussed separately below.
Nature, quality and extent of services. The trustees reviewed the nature, quality and extent of the services of CWAM and its affiliates to the Funds, taking into account the investment objective and strategy of each Fund and the knowledge the trustees gained from their regular meetings with management on at least a quarterly basis. In addition, the trustees reviewed the available resources and key personnel of CWAM and its affiliates, especially those who provide investment management services to the Funds. The trustees also considered other services provided to the Funds by CWAM and its affiliates, such as managing the execution of portfolio transactions and the selection of broker-dealers for those transactions, serving as the Funds' administrator, monitoring adherence to the Funds' investment restrictions, producing shareholder reports, providing s upport services for the board and board committees, communicating with shareholders and overseeing the activities of other service providers, including monitoring compliance with various policies and procedures of the Funds and with applicable securities laws and regulations. With respect to the provision of administrative services, the trustees believed it was more appropriate for those same services to be provided to the Trust pursuant to a separate administration agreement.
The trustees concluded that: the nature, quality and extent of the services provided by CWAM and its affiliates to each Fund were appropriate and consistent with the terms of the Advisory Agreement; that the quality of those services had been consistent with or superior to quality norms in the industry; and that the Funds were likely to benefit from the continued provision of those services. They also concluded that each of CWAM and its affiliates currently had sufficient personnel, with appropriate education and experience, to serve the Funds effectively and had demonstrated their continuing ability to attract and retain well qualified personnel.
Performance of the Funds. At various meetings of the board, of the Committee and of the board's investment performance analysis committee, the trustees considered the short-term and longer-term performance of each Fund. They reviewed information comparing each Fund's performance with the performance of the Fund's benchmark and with the performance of comparable funds and peer groups as identified by Lipper Inc. ("Lipper") and Morningstar Associates, LLC ("Morningstar"). They noted that, among the domestic Funds, Wanger Select had outperformed its respective benchmark and Lipper and Morningstar peers for the relevant periods. Wanger U.S. Smaller Companies suffered weak performance compared to its benchmark in 2006 and ranked toward the bottom of its peer group for that period. Notwithstanding that performance, that Fund's performance approximated, or w as ahead of, its benchmark for the most recent three, five and ten year periods. The trustees also discussed the performance of the international Funds, noting that both of the international Funds had shown improvement over recent years. During the contract renewal process, the trustees concluded that, although past performance is not necessarily indicative of future results, the Funds' strong overall performance record was an important factor in their evaluation of the quality of services provided by CWAM under the Advisory Agreement.
Costs of Services and Profits Realized by CWAM. At various Committee meetings and other informal meetings, the trustees examined detailed information on fees and expenses of each Fund in comparison to information
26
Wanger U.S. Smaller Companies 2007 Annual Report
Board Approval of the Existing Advisory Agreement
for other comparable funds provided by Lipper and Morningstar. As noted in the Fee Evaluation, the contractual rates of investment advisory fees and the actual advisory fees for some of the Funds were higher than the median advisory fees of their respective peer groups (particularly with respect to Wanger U.S. Smaller Companies and Wanger Select). The trustees also considered the management fees of the Wanger Advisors Funds relative to those of the Columbia Acorn Trust funds, a group of funds with similar investment strategies overseen by the same trustees and also managed by CWAM. In addition, the Committee and the Board had extensive discussions about the appropriateness of the 0.05% fee for administrative services.
The Board and CWAM approved amendments to the Advisory Agreement to (a) provide a 0.05% reduction in the fee schedule for each Fund in response to entering into the new administration agreement and (b) to establish additional breakpoints for (i) Wanger U.S. Smaller Companies at 0.80% on net asset levels over $2 billion, (ii) Wanger Select at 0.78% on net asset levels over $500 million, (iii) Wanger International Select at 0.89% on nets asset levels over $500 million and (iv) Wanger International Small Cap at 0.72% on net asset levels over $1 billion.
The trustees reviewed the Fee Evaluation's analysis of the profitability of CWAM in serving as each Fund's investment adviser and of CWAM and its affiliates in all of their relationships with each Fund, as well as an explanation of the methodology utilized in allocating various expenses among the Funds and other business units. The trustees took into account the methodology used by CWAM in determining compensation payable to portfolio managers and the competitive environment for investment management talent. The trustees recognized that profitability comparisons among fund managers are difficult because very little comparative information is publicly available and the profitability of any manager is affected by numerous factors, including the organizational structure of the particular manager, the types of funds and other accounts it manages, possible other lines of business, the methodology for allocating expenses and the manag er's capital structure and cost of capital.
The trustees also reviewed CWAM's advisory fees for other investment companies, sub-advised funds and other institutional separate accounts, as detailed in the Fee Evaluation. In most instances its institutional separate account fees for various investment strategies were higher than the advisory fees charged to the Funds with corresponding strategies, although for a few accounts, the fees were lower. The trustees noted that CWAM performs significant additional services for the Funds that it does not provide to sub-advised funds or non-mutual fund clients, including administrative services, oversight of the Funds' other service providers, trustee support, regulatory compliance and numerous other services, and that, in servicing the Funds, CWAM assumes many legal risks that it does not assume in servicing many of its other clients. Finally, the trustees considered the financial condition of CWAM as part of the contract renewal pr ocess.
The trustees concluded that the rates of advisory fees (as amended) and other compensation payable by the Funds to CWAM and its affiliates were reasonable in relation to the nature and quality of the services to be provided, taking into account the fees charged by other advisers for managing comparable mutual funds with similar strategies and the fees CWAM charges to other clients. The trustees also concluded that the Funds' estimated overall expense ratios were reasonable, taking into account quality of services provided by CWAM and its affiliates and the investment performance of the Funds.
Economies of Scale. The trustees considered information about the potential for CWAM to realize economies of scale as a Fund's assets increase. They noted that the fee schedule for each Fund includes reductions in the rate of fees at various asset levels, including each Fund's newly established breakpoint. The trustees also noted that the Funds share directly in economies of scale through lower charges on third party service providers based on the combined scale of all of the Funds. Based on the information they reviewed, the trustees concluded that the current fee structure of each Fund was reasonable and that the current rates of fees do reflect a sharing between CWAM and the Funds of economies of scale.
Other Benefits to CWAM. The trustees also reviewed benefits that accrue to CWAM and its affiliates from their relationships with the Funds, as outlined in the Fee Evaluation. They recognized that two affiliates of CWAM separately serve the Funds as transfer agent and distributor, respectively, and that the transfer agent receives compensation from the Funds for services provided. The trustees noted that, other than the services provided by CWAM and its affiliates pursuant to various agreements and the fees to be paid by each Fund therefor, the Funds and CWAM may potentially benefit from their relationship with each other in other ways. The trustees considered CWAM's use of commissions paid by each Fund on its portfolio brokerage transactions to obtain research products and services benefiting the Fund and/or other clients of CWAM. The trustees determi ned that CWAM's use of the Funds' "soft" commission dollars to obtain research products and services was consistent with regulatory requirements and guidance then in effect. They also concluded that CWAM benefits from the receipt of proprietary research products and services acquired through commissions paid on portfolio transactions of the Funds and that the Funds benefit from CWAM's receipt of those products and services as well as research products and services acquired through commissions paid by other clients of CWAM. They further concluded that the success of any Fund could attract other business to CWAM or other Funds and that the success of CWAM could enhance its ability to serve the Funds.
After full consideration of the above factors as well as other factors that were instructive in evaluating the Advisory Agreement, the trustees, including the Independent Trustees, unanimously concluded that the continuation of the Advisory Agreement, as amended to revise the fee schedule for each Fund to reflect both the 0.05% fee reduction and the additional breakpoints, was in the best interest of each Fund. On July 17, 2007, the trustees continued the Advisory Agreement as so amended through July 31, 2008.
27
Wanger U.S. Smaller Companies Select 2007 Annual Report
Board of Trustees and Management of Wanger Advisors Trust
The Board of Trustees of the Trust has overall management responsibility for the Trust and the Funds. Each trustee may serve a term of unlimited duration until the end of the calendar year in which the trustee attains the age of 75 years. The trustees appoint their own successors, provided that at least two-thirds of the trustees, after such appointment, have been elected by shareholders. Shareholders may remove a trustee, with or without cause, upon the vote of two-thirds of the Trust's outstanding shares at any meeting called for that purpose. A trustee may be removed, with or without cause, upon the vote of a majority of the trustees.
The names of the trustees and officers of the Trust, the date each was first elected or appointed to office, their principal business occupations during at least the last five years, and other directorships they hold are shown below. Each trustee serves in such capacity for each of the four series of the Trust and each of the six series of Columbia Acorn Trust.
The business address of each trustee and officer of the Trust is Columbia Wanger Asset Management, L.P., 227 West Monroe, Suite 3000, Chicago, Illinois 60606. The Fund's Statement of Additional Information includes additional information about the Fund's trustees and officers. You may obtain a free copy of the Statement of Additional Information by writing or calling toll-free:
Columbia Wanger Asset Management, L.P.
Shareholder Services Group
227 W. Monroe, Suite 3000
Chicago, IL 60606
888-4-WANGER (888-492-6437)
Name, Position(s) with
Wanger Advisors
Trust and Age at
December 31, 2007 | | Year First
Elected or
Appointed
to Office | | Principal Occupation(s) during
Past Five Years | | Number of
Portfolios in
Fund Complex
Overseen
by Trustee/Officer | | Other
Directorships | |
| Trustees who are not interested persons of Wanger Advisors Trust: | | | | | | | |
|
Laura M. Born, 42,
Trustee (1) | | | 2007 | | | Adjunct Assistant Professor of Finance, University of Chicago Graduate School of Business; Managing Director—Investment Banking, J.P. Morgan Chase & Co. Incorporated (broker-dealer) 1991-2007. | | | 10 | | | Columbia Acorn Trust. | |
|
Maureen M. Culhane, 59,
Trustee | | | 2007 | | | Retired; Vice President, Goldman, Sachs Asset Management L.P. (investment adviser) 2005; Vice President (Consultant)—Strategic Relationship Management, Goldman, Sachs & Co. 1999-2005; prior thereto, Vice President of Finance and Treasurer, Sara Lee Corporation. | | | 10 | | | Columbia Acorn Trust. | |
|
Margaret Eisen, 54,
Trustee | | | 2006 | | | Managing Director, CFA Institute since 2005; Chief Investment Officer, EAM International LLC (corporate finance and asset management) since 2003; prior thereto, Managing Director, DeGuardiola Advisors (investment bank); formerly Managing Director, North American Equities at General Motors Asset Management, and Director, Worldwide Pension Investments for DuPont Asset Management. | | | 10 | | | Antigenics, Inc. (biotechnology and pharmaceuticals); Columbia Acorn Trust | |
|
Jerome Kahn, Jr., 73,
Trustee | | | 2006 | | | Portfolio manager and stock analyst and former President, William Harris Investors, Inc. (investment adviser). | | | 10 | | | Columbia Acorn Trust. | |
|
Steven N. Kaplan, 48,
Trustee | | | 2006 | | | Neubauer Family Professor of Entrepreneurship and Finance, Graduate School of Business, University of Chicago. | | | 10 | | | Morningstar, Inc. (provider of independent investment research); Columbia Acorn Trust | |
|
David C. Kleinman, 72,
Trustee | | | 2006 | | | Adjunct Professor of Strategic Management, University of Chicago Graduate School of Business; business consultant. | | | 10 | | | Sonic Foundry, Inc. (rich media systems and software); Columbia Acorn Trust | |
|
Allan B. Muchin, 71,
Trustee and Vice Chairman of the Board | | | 2006 | | | Chairman Emeritus, Katten Muchin Rosenman LLP (law firm). | | | 10 | | | Columbia Acorn Trust | |
|
28
Wanger U.S. Smaller Companies Select 2007 Annual Report
Board of Trustees and Management of Wanger Advisors Trust
Name, Position(s) with
Wanger Advisors
Trust and Age at
December 31, 2007 | | Year First
Elected or
Appointed
to Office | | Principal Occupation(s) during
Past Five Years | | Number of
Portfolios in
Fund Complex
Overseen
by Trustee/Officer | | Other
Directorships | |
Robert E. Nason, 71,
Trustee and Chairman of the Board | | | 2006 | | | Consultant and private investor since 1998; formerly Executive Partner, Chief Executive Officer and member of the executive committee of Grant Thornton, LLP (public accounting firm) and member of the policy board of Grant Thornton International. | | | 10 | | | Columbia Acorn Trust | |
|
James A. Star, 46,
Trustee | | | 2006 | | | President, Longview Asset Management LLC (investment adviser) since 2003, prior thereto, portfolio manager; Vice President, Henry Crown and Company (investment firm); President and Chief Investment Officer, Star Partners (hedge fund) from 1998 to 2003. | | | 10 | | | Columbia Acorn Trust | |
|
John A. Wing, 72,
Trustee | | | 2006 | | | Partner, Dancing Lion Partners (investment partnership); prior thereto, Frank Wakely Gunsaulus Professor of Law and Finance, and Chairman of the Center for the Study of Law and Financial Markets, Illinois Institute of Technology; formerly Chairman of the Board and Chief Executive Officer of ABN-AMRO Incorporated (formerly named The Chicago Corporation, a financial services firm) and Chief Executive Officer of Market Liquidity Network, LLC. | | | 10 | | | First Chicago Bank and Trust; First Chicago Bancorp; Columbia Acorn Trust | |
|
| Trustees who are interested persons of Wanger Advisors Trust: | | | | | | | |
|
Charles P. McQuaid, 53,
Trustee and President (2) | | | 2003 | | | President and Chief Investment Officer, CWAM since October 2003; portfolio manager since 1995 and Director of Research, CWAM and its predecessor from July 1992 through December 2003; Interim Director of International Research, CWAM from October 2003 to December 2004; President of Columbia Acorn Trust since 2003. | | | 10 | | | Columbia Acorn Trust | |
|
Ralph Wanger, 72,
Trustee (3) | | | 1994 | | | Founder, former President, Chief Investment Officer and portfolio manager, CWAM from July 1992 to September 2003; former President, Columbia Acorn Trust from April 1992 through September 2003; former President, Wanger Advisors Trust 1994 through September 2003; Director, Wanger Investment Company PLC; advisor to CWAM from September 2003 to September 2005. | | | 10 | | | Columbia Acorn Trust | |
|
| Officers of Wanger Advisors Trust: | | | | | | | |
|
Ben Andrews, 41,
Vice President | | | 2004 | | | Analyst and portfolio manager, CWAM since 1998; Vice President, Columbia Acorn Trust. | | | 10 | | | None | |
|
Michael G. Clarke, 38,
Assistant Treasurer | | | 2004 | | | Assistant Treasurer, Columbia Acorn Trust; Chief Accounting Officer and Assistant Treasurer of the Columbia Funds since October 2004; Director of Fund Administration of Columbia Management Advisors, LLC since January 2006; Managing Director of Columbia Management Advisors, LLC from September 2004 to December 2005; Vice President, Fund Administration of Columbia Management Advisors, LLC from June 2002 to September 2004. | | | 10 | | | None | |
|
Jeffrey Coleman, 38,
Assistant Treasurer | | | 2006 | | | Assistant Treasurer, Columbia Acorn Trust since March 2006; Director of Fund Administration, CWAM since January 2006; Fund Controller, CWAM from October 2004 to January 2006; Vice President of CDC IXIS Asset Management Services, Inc. (investment management) from August 2000 to September 2004. | | | 10 | | | None | |
|
29
Wanger U.S. Smaller Companies Select 2007 Annual Report
Board of Trustees and Management of Wanger Advisors Trust
Name, Position(s) with
Wanger Advisors
Trust and Age at
December 31, 2007 | | Year First
Elected or
Appointed
to Office | | Principal Occupation(s) during
Past Five Years | | Number of
Portfolios in
Fund Complex
Overseen
by Trustee/Officer | | Other
Directorships | |
J. Kevin Connaughton, 43,
Assistant Treasurer | | | 2001 | | | Treasurer and Chief Financial Officer of the Columbia Funds since December 2000; Vice President of Columbia Management Advisors, LLC since April 2003; Assistant Treasurer of Columbia Acorn Trust since 2001; Treasurer and Chief Financial Officer of the Liberty Funds, Stein Roe Funds and Liberty All-Star Funds from December 2000 to December 2006; Treasurer of the Galaxy Funds from September 2002 through November 2005; Treasurer of Columbia Management Multi-Strategy Hedge Fund, LLC from December 2002 through December 2004; and a senior officer of various affiliated entities of the Bank of America Corporation, including other registered and unregistered funds. | | | 10 | | | None | |
|
P. Zachary Egan, 39,
Vice President | | | 2007 | | | Director of International Research, CWAM, since December 2004; portfolio manager, CWAM since 2003; analyst, CWAM since 1999. | | | 10 | | | None | |
|
Peter T. Fariel, 50,
Assistant Secretary | | | 2006 | | | Associate General Counsel, Bank of America since April 2005; prior thereto, Partner, Goodwin Procter LLP (law firm). | | | 10 | | | None | |
|
John Kunka, 37,
Assistant Treasurer | | | 2006 | | | Director of Accounting and Operations, CWAM, since 2006; Assistant Treasurer, Columbia Acorn Trust, since 2006; Manager of Mutual Fund Operations, Calamos Advisors, Inc. from 2005 to 2006; prior thereto, Manager of Mutual Fund Administration, Van Kampen Investments. | | | 10 | | | None | |
|
Joseph LaPalm, 37,
Vice President | | | 2006 | | | Chief Compliance Officer, CWAM since 2005; Vice President, Columbia Acorn Trust since 2006; prior thereto, Compliance Officer, William Blair & Company (investment firm). | | | 10 | | | None | |
|
Bruce H. Lauer, 50,
Vice President,
Secretary and Treasurer | | | 1995 | | | Chief Operating Officer, CWAM since April 2000; Vice President, Treasurer and Secretary, Columbia Acorn Trust; Director, Wanger Investment Company PLC; Director, Banc of America Capital Management (Ireland) Ltd.; Director, Bank of America Global Liquidity Fund, PLC. | | | 10 | | | None | |
|
Louis J. Mendes, 43,
Vice President | | | 2005 | | | Analyst and portfolio manager, CWAM since 2001; Vice President, Columbia Acorn Trust. | | | 10 | | | None | |
|
Robert A. Mohn, 46,
Vice President | | | 1997 | | | Analyst and portfolio manager, CWAM since August 1992; Director of Domestic Research, CWAM since March 2004; Vice President, Columbia Acorn Trust. | | | 10 | | | None | |
|
Christopher Olson, 43,
Vice President | | | 2001 | | | Analyst and portfolio manager, CWAM since January 2001; Vice President, Columbia Acorn Trust. | | | 10 | | | None | |
|
Robert Scales, 55,
Chief Compliance Officer,
Chief Legal Officer,
Senior Vice President and General Counsel | | | 2004 | | | Chief Compliance Officer, Senior Vice President, Chief Legal Officer and General Counsel, Columbia Acorn Trust since 2004; prior thereto, Associate General Counsel, Grant Thornton LLP. | | | 10 | | | None | |
|
Linda Roth-Wiszowaty, 38,
Assistant Secretary | | | 2006 | | | Business support analyst, CWAM, since April 2007; Assistant Secretary, Columbia Acorn Trust; executive administrator, CWAM since April 2004; prior thereto, executive assistant to the Chief Operating Officer, CWAM. | | | 10 | | | None | |
|
(1) Effective January 1, 2008, Trustee is no longer treated as an "interested person," as defined in the Investment Company Act of 1940, as amended (the "1940 Act"). Prior to January 1, 2008, Trustee was considered an "interested person" of the Trust and of CWAM, as defined in the 1940 Act, as a result of her previous affiliation with J.P. Morgan Chase & Co. Incorporated, a registered broker-dealer that may execute portfolio transactions for or engage in principal transactions with the Funds or other clients or funds advised by CWAM or its affiliates.
(2) Trustee who is an "interested person" of the Trust and of CWAM, as defined in the 1940 Act, because he is an officer of the Trust and of CWAM.
(3) Trustee who is treated as an "interested person" of the Trust and of CWAM, as defined in the 1940 Act, because he is a former officer of the Trust and former employee of and consultant to CWAM.
30
Wanger U.S. Smaller Companies 2007 Annual Report

Wanger Advisors Trust
Transfer Agent,
Dividend Disbursing Agent
Columbia Management Services, Inc.
P.O. Box 8081
Boston, Massachusetts
02266-8081
Distributor
Columbia Management Distributors, Inc.
One Financial Center
Boston, Massachusetts
02111-2621
Investment Adviser
Columbia Wanger Asset Management, L.P.
227 West Monroe Street, Suite 3000
Chicago, Illinois 60606
1-888-4-WANGER
(1-888-492-6437)
Legal Counsel
Bell, Boyd & Lloyd LLP
Chicago, Illinois
Independent Registered
Public Accounting Firm
PricewaterhouseCoopers LLP
Chicago, Illinois
This report, including the schedules of investments and financial statements, is submitted for the general information of the shareholders of the Wanger Advisors Trust.
A description of the Fund's proxy voting policies and procedures and a copy of the Fund's voting record for the most recent 12-month period ended June 30 are available (i) on the Securities and Exchange Commission's website at www.sec.gov, and (ii) without charge, upon request, by calling 1-888-492-6437.
The Fund files a complete schedule of portfolio holdings with the SEC for the first and third quarters of each fiscal year on Form N-Q. The Fund's Form N-Q is available on the SEC's website at www.sec.gov and may be reviewed and copied at the SEC's Public Reference Room in Washington, D.C. Information on the operation of the Pubic Reference Room may be obtained by calling 1-800-SEC-0330.
31
Wanger Advisors Trust
SHC-43/138993-1207 08/51431
Item 2. Code of Ethics.
(a) The registrant has, as of the end of the period covered by this report, adopted a code of ethics that applies to the registrant’s principal executive officer, principal financial officer, principal accounting officer or controller, or persons performing similar functions, regardless of whether these individuals are employed by the registrant or a third party.
(b) During the period covered by this report, there were not any amendments to a provision of the code of ethics adopted in 2(a) above.
(c) During the period covered by this report, there were no waivers, including any implicit waivers, from a provision of the code of ethics described in 2(a) above that relates to one or more of the items set forth in paragraph (b) of this item’s instructions.
Item 3. Audit Committee Financial Expert.
The registrant’s Board of Trustees has determined that David C. Kleinman, Robert E. Nason and John A. Wing, each of whom are members of the registrant’s Board of Trustees and Audit Committee, each qualify as an audit committee financial expert. Mr. Kleinman, Mr. Nason and Mr. Wing are each independent trustees, as defined in paragraph (a)(2) of this item’s instructions.
Item 4. Principal Accountant Fees and Services.
(a) Audit Fees. Aggregate Audit Fees billed by the principal accountant for professional services rendered during the fiscal years ended December 31, 2007 and December 31, 2006 are approximately as follows:
2007 | | 2006 | |
$ | 88,800 | | $ | 87,800 | |
| | | | | |
Audit Fees include amounts related to the audit of the registrant’s annual financial statements or services that are normally provided by the accountant in connection with statutory and regulatory filings or engagements for those fiscal years.
(b) Audit-Related Fees. Aggregate Audit-Related Fees billed to the registrant by the principal accountant for professional services rendered during the fiscal years ended December 31, 2007 and December 31, 2006 are approximately as follows:
2007 | | 2006 | |
$ | 12,000 | | $ | 12,600 | |
| | | | | |
Audit-Related Fees include amounts for assurance and related services by the principal accountant that are reasonably related to the performance of the audit of the registrant’s financial statements and are not reported in Audit Fees above. In both fiscal years 2007 and 2006, Audit-Related Fees consist of agreed-upon procedures performed for semi-annual shareholder reports or other audit-related additional testing.
During the fiscal years ended December 31, 2007 and December 31, 2006, there were no Audit-Related Fees billed by the registrant’s principal accountant to the registrant’s investment adviser (not including any sub-adviser whose role is primarily portfolio management and is subcontracted with or overseen by another investment adviser) and any entity controlling, controlled by, or under common control with the adviser that provides ongoing services to the registrant for an engagement that related directly to the operations and financial reporting of the registrant.
(c) Tax Fees. Aggregate Tax Fees billed by the principal accountant to the registrant for professional services rendered during the fiscal years ended December 31, 2007 and December 31, 2006 are approximately as follows:
2007 | | 2006 | |
$ | 15,800 | | $ | 13,000 | |
| | | | | |
Tax Fees incurred in both fiscal years 2007 and 2006 relate to the review of annual tax returns and include amounts for professional services by the principal accountant for tax compliance, tax advice and tax planning.
During the fiscal years ended December 31, 2007 and December 31, 2006, there were no Tax Fees billed by the registrant’s principal accountant to the registrant’s investment adviser (not including any sub-adviser whose role is primarily portfolio management and is subcontracted with or overseen by another investment adviser) and any entity controlling, controlled by, or under common control with the adviser that provides ongoing services to the registrant for an engagement that related directly to the operations and financial reporting of the registrant.
(d) All Other Fees. Aggregate All Other Fees billed by the principal accountant to the registrant for professional services rendered during the fiscal years ended December 31, 2007 and December 31, 2006 are as follows:
All Other Fees include amounts for products and services provided by the principal accountant, other than the services reported in paragraphs (a) through (c) above. In fiscal year 2006, All Other Fees consist of agreed-upon procedures related to the review of the registrant’s anti-money laundering program.
Aggregate All Other Fees billed by the registrant’s principal accountant to the registrant’s investment adviser (not including any sub-adviser whose role is primarily portfolio management and is subcontracted with or overseen by another investment adviser) and any entity controlling, controlled by, or under common control with the adviser that provides ongoing services to the registrant for an engagement that related directly to the operations and financial reporting of the registrant during the fiscal years ended December 31, 2007 and December 31, 2006 are approximately as follows:
2007 | | 2006 | |
$ | 130,000 | | $ | 135,600 | |
| | | | | |
In both fiscal years 2007 and 2006, All Other Fees consist of professional services rendered for internal control reviews of the registrant’s transfer agent.
(e)(1) Audit Committee Pre-Approval Policies and Procedures
The policy of the registrant’s Audit Committee is to specifically pre-approve (i) all audit and non-audit (including audit related, tax and all other) services provided by the registrant’s independent auditor to the registrant and individual funds (collectively “Fund Services”) and (ii) all non-audit services provided by the registrant’s independent auditor to the funds’ adviser or a control affiliate of the adviser, that relate directly to the funds’ operations and financial reporting (collectively “Fund-related Adviser Services”). A “control affiliate” is an entity controlling, controlled by, or under common control with the adviser that provides ongoing services to the funds, and the term “adviser” is deemed to exclude any unaffiliated sub-adviser whose role is primarily portfolio management and is sub-contracted or overseen by another investment adviser.
If such Fund Services or Fund-related Adviser Services are required during the period between the Audit Committee’s regularly scheduled meetings, the Chairman of the Audit Committee has the authority to pre-approve the service, with reporting to the full Audit Committee at the next regularly scheduled meeting.
The Audit Committee will waive pre-approval of Fund Services or Fund-related Adviser Services provided that the requirements under paragraph (c)(7)(i)(C) of Rule 2-01 of Regulation S-X are met.
(e)(2) The percentage of services described in paragraphs (b) through (d) of this Item approved pursuant to the “de minimis” exception under paragraph (c)(7)(i)(C) of Rule 2-01
of Regulation S-X during both fiscal years ended December 31, 2007 and December 31, 2006 was zero.
(f) Not applicable.
(g) The aggregate non-audit fees billed by the registrant’s accountant for services rendered to the registrant, and rendered to the registrant’s investment adviser (not including any sub-adviser whose role is primarily portfolio management and is subcontracted with or overseen by another investment adviser), and any entity controlling, controlled by, or under common control with the adviser that provides ongoing services to the registrant for the fiscal years ended December 31, 2007 and December 31, 2006 are approximately as follows:
2007 | | 2006 | |
$ | 157,800 | | $ | 162,200 | |
| | | | | |
(h) The registrant’s Audit Committee of the Board of Directors has considered whether the provision of non-audit services that were rendered to the registrant’s adviser (not including any sub-adviser whose role is primarily portfolio management and is subcontracted with or overseen by another investment adviser), and any entity controlling, controlled by, or under common control with the investment adviser that provides ongoing services to the registrant that were not pre-approved pursuant to paragraph (c)(7)(ii) of Rule 2-01 of Regulation S-X, is compatible with maintaining the principal accountant’s independence.
Item 5. Audit Committee of Listed Registrants.
Not applicable.
Item 6. Schedule of Investments
The registrant’s “Schedule I – Investments in securities of unaffiliated issuers” (as set forth in 17 CFR 210.12-12) is included in Item 1 of this Form N-CSR.
Item 7. Disclosure of Proxy Voting Policies and Procedures for Closed-End Management Investment Companies.
Not applicable.
Item 8. Portfolio Managers of Closed-End Management Investment Companies.
Not applicable.
Item 9. Purchases of Equity Securities by Closed-End Management Investment Company and Affiliated Purchasers.
Not applicable.
Item 10. Submission of Matters to a Vote of Security Holders.
There have not been any material changes to the procedures by which shareholders may recommend nominees to the registrant’s board of directors, since those procedures were last disclosed in response to requirements of Item 407(c)(2)(iv) of Regulation S-K (as required by Item 22(b)(15) of Schedule 14A) or this Item.
Item 11. Controls and Procedures.
(a) The registrant’s principal executive officer and principal financial officers, based on their evaluation of the registrant’s disclosure controls and procedures as of a date within 90 days of the filing of this report, have concluded that such controls and procedures are adequately designed to ensure that information required to be disclosed by the registrant in Form N-CSR is accumulated and communicated to the registrant’s management, including the principal executive officer and principal financial officer, or persons performing similar functions, as appropriate to allow timely decisions regarding required disclosure.
(b) There was no change in the registrant’s internal control over financial reporting that occurred during the registrant’s second fiscal quarter of the period covered by this report that has materially affected, or is reasonably likely to materially affect, the registrant’s internal control over financial reporting.
Item 12. Exhibits.
(a)(1) Code of ethics required to be disclosed under Item 2 of Form N-CSR attached hereto as Exhibit 99.CODE ETH.
(a)(2) Certifications pursuant to Rule 30a-2(a) under the Investment Company Act of 1940 (17 CFR 270.30a-2(a)) attached hereto as Exhibit 99.CERT.
(a)(3) Not applicable.
(b) Certification pursuant to Rule 30a-2(b) under the Investment Company Act of 1940 (17 CFR 270.30a-2(b)) attached hereto as Exhibit 99.906CERT.
SIGNATURES
Pursuant to the requirements of the Securities Exchange Act of 1934 and the Investment Company Act of 1940, the registrant has duly caused this report to be signed on its behalf by the undersigned, thereunto duly authorized.
(registrant) | | Wanger Advisors Trust | |
| | |
| | |
By (Signature and Title) | | /s/ Charles P. McQuaid | |
| Charles P. McQuaid, President | |
| | |
| | |
Date | | February 22, 2008 | |
| | | | | |
Pursuant to the requirements of the Securities Exchange Act of 1934 and the Investment Company Act of 1940, this report has been signed below by the following persons on behalf of the registrant and in the capacities and on the dates indicated.
By (Signature and Title) | | /s/ Charles P. McQuaid | |
| Charles P. McQuaid, President | |
| |
| |
Date | | February 22, 2008 | |
| |
| |
By (Signature and Title) | | /s/ Bruce H. Lauer | |
| Bruce H. Lauer, Treasurer | |
| |
| |
Date | | February 22, 2008 | |
| | | | | |