UNITED STATES
SECURITIES AND EXCHANGE COMMISSION
Washington, D.C. 20549
FORM N-CSR
CERTIFIED SHAREHOLDER REPORT OF REGISTERED
MANAGEMENT INVESTMENT COMPANIES
Investment Company Act file number: | 811-08764 |
|
PACE® Select Advisors Trust |
(Exact name of registrant as specified in charter) |
|
1285 Avenue of the Americas, New York, New York | | 10019-6028 |
(Address of principal executive offices) | | (Zip code) |
|
Mark F. Kemper, Esq.
UBS Global Asset Management
1285 Avenue of the Americas
New York, NY 10019-6028 |
(Name and address of agent for service) |
|
Copy to: |
Jack W. Murphy, Esq.
Dechert LLP
1900 K Street, N.W.
Washington, DC 20006 |
|
Registrant’s telephone number, including area code: | 212-821 3000 | |
|
Date of fiscal year end: | July 31 | |
|
Date of reporting period: | July 31, 2013 | |
| | | | | | | | |
Item 1. Reports to Stockholders.

PACE® Select Advisors Trust
Annual Report
July 31, 2013
PACE® Select Advisors Trust
Table of contents | |
Introduction | | | 2 | | |
Portfolio Advisor's and Sub-Advisors' commentaries and Portfolios of investments | |
| PACE® Money Market Investments | | | 5 | | |
| PACE® Government Securities Fixed Income Investments | | | 11 | | |
| PACE® Intermediate Fixed Income Investments | | | 25 | | |
| PACE® Strategic Fixed Income Investments | | | 40 | | |
| PACE® Municipal Fixed Income Investments | | | 60 | | |
| PACE® International Fixed Income Investments | | | 72 | | |
| PACE® High Yield Investments | | | 85 | | |
| PACE® Large Co Value Equity Investments | | | 100 | | |
| PACE® Large Co Growth Equity Investments | | | 111 | | |
| PACE® Small/Medium Co Value Equity Investments | | | 122 | | |
| PACE® Small/Medium Co Growth Equity Investments | | | 134 | | |
| PACE® International Equity Investments | | | 145 | | |
| PACE® International Emerging Markets Equity Investments | | | 160 | | |
| PACE® Global Real Estate Securities Investments | | | 174 | | |
| PACE® Alternative Strategies Investments | | | 185 | | |
Understanding your Portfolio's expenses | | | 220 | | |
Statement of assets and liabilities | | | 226 | | |
Statement of operations | | | 234 | | |
Statement of changes in net assets | | | 238 | | |
Financial highlights | | | 244 | | |
Notes to financial statements | | | 274 | | |
Report of independent registered public accounting firm | | | 315 | | |
Tax information | | | 316 | | |
General information | | | 317 | | |
Board approvals of sub-advisory agreements | | | 318 | | |
Supplemental information, trustees and officers | | | 340 | | |
PACE Select Advisors Trust offers multiple share classes representing interests in 15 separate Portfolios. (PACE Money Market Investments offers only one share class.) Different classes of shares and/or Portfolios are offered by separate prospectuses.
For more information on a portfolio or class of shares, contact your financial advisor. He or she can send you a current prospectus relating to a portfolio or class of shares. Investors should carefully read and consider a mutual fund's investment objectives, risks, charges, and expenses before investing. The prospectus contains this and other information about a mutual fund. For a current prospectus, contact UBS Global Asset Management (Americas) Inc. at 888-793 8637, or visit us on the Web at www.ubs.com/globalam-us.
Derivatives vary in complexity, involve risks which are different from, and may be greater than, the risks associated with investing in securities or other instruments. Please see the funds' prospectuses for more complete discussion of the risks associated with investing in derivatives.
1
PACE Select Advisors Trust
Introduction
September 16, 2013
Dear PACE Shareholder,
We are pleased to provide you with the annual report for the PACE portfolios (the "Portfolios"), comprising the PACE Select Advisors Trust. This report includes summaries of the performance of each Portfolio, as well as commentaries from the investment advisor and Sub-advisors regarding the events that affected Portfolio performance during the 12 months ended July 31, 2013. Please note that the opinions of the Sub-advisors do not necessarily represent those of UBS Global Asset Management (Americas) Inc.
Global growth is mixed
While the overall US economy continued to grow during the reporting period, the pace of the expansion was far from robust. The Commerce Department reported that gross domestic product ("GDP") growth was 2.8% during the third quarter of 2012 and decelerated to 0.1% in the fourth quarter. However, the economy then regained some traction, as GDP grew 1.1% during the first three months of 2013. The Commerce Department's second estimate for second quarter 2013 GDP growth was 2.5%.1
The Federal Reserve Board (the "Fed") took a number of actions during the reporting period, as it looked to meet its dual mandate of price stability and maximum employment. Throughout the reporting period, the Fed kept the federal funds rate at an extremely low level between 0% and 0.25%. Looking back, at its December 2012 meeting, the Fed said it would continue buying $40 billion a month of agency mortgage-backed securities ("MBS") and purchase $45 billion a month of longer-term Treasuries. The Fed also said that it would keep the federal funds rate on hold "...as long as the unemployment rate remains above 6.5%," provided inflation remains well-contained. The Fed has not materially changed its official policy stance thus far in 2013. However, in his press conference following the Fed's meeting in June, Fed Chairman Bernanke said "...the Committee currently anticipates that it would be appropriate to moderate the monthly pace of purchases later this year; and if the subsequent data remain broadly aligned with our current expectations for the economy, we would continue to reduce the pace of purchases in measured steps through the first half of next year, ending purchases around midyear." This triggered increased volatility throughout the global financial markets.
Economic growth outside the US often decelerated or remained in recession during the reporting period. In its July 2013 World Economic Outlook Update, the International Monetary Fund (the "IMF") projected that global growth would be 3.1% in 2013, lower than its previous forecast of a 3.3% expansion. From a regional perspective, the IMF anticipated 2013 growth in the eurozone would contract 0.6%. While growth in emerging market countries is expected to remain higher than in their developed country counterparts, the IMF also trimmed its forecast for most emerging market countries.
1 Based on the Commerce Department's most recent estimate announced on August 29, 2013, after the Portfolios' reporting period had ended.
2
PACE Select Advisors Trust
Developed equity markets post strong results
Despite periods of heightened volatility and a late setback, developed market equities produced very strong results during the reporting period. In the US, continued positive economic growth, overall solid corporate profits and largely robust demand supported the market. While equities initially sold off after the Fed's comments about tapering its asset purchase program, it quickly regained its footing. All told, the US stock market, as measured by the S&P 500 Index,2 gained 25.0% for the 12 months ended July 31, 2013. International equity markets were also impacted by the Fed's policy shift, as well as the ongoing European sovereign debt crisis and geopolitical issues. While international developed equities fell sharply in May and June, they returned 23.48% during the 12-month period, as measured by the MSCI EAFE Index (net).3 Emerging market equities, as measured by the MSCI Emerging Markets Index (net),4 returned a modest 1.95% during the same time period. This relatively weak performance was due to a variety of factors, including fears of a "hard landing" for China's economy, falling commodity prices and rising US interest rates.
Rising rates negatively impact the fixed income market
US Treasury yields moved higher during the reporting period and negatively impacted the overall bond market (yields and bond prices move in the opposite direction). Increasing investor concerns about the commitment of the Fed to its quantitative easing program caused yields to move sharply higher during the last three month of the reporting period. Against this backdrop, a number of US taxable spread sectors (non-US Treasury fixed income securities) produced either negative returns or only modest gains during the reporting period. The overall US bond market, as measured by the Barclays US Aggregate Index,5 declined 1.91% over the 12 months ended July 31, 2013. Looking more closely at lower-rated fixed income securities, high yield bonds generated strong results given largely robust demand from investors looking for incremental yield in the low interest rate environment. All told, the BofA Merrill Lynch US High Yield Cash Pay Constrained Index6 rose 9.38% during the reporting period. In
2 The S&P 500 Index is an unmanaged, weighted index composed of 500 widely held common stocks varying in composition, and is not available for direct investment. Investors should note that indices do not reflect the deduction of fees and expenses.
3 The MSCI EAFE Index (net) is an index of stocks from different countries designed to measure the investment returns of developed economies outside of North America. Net total return indices reinvest dividends after the deduction of withholding taxes, using a tax rate applicable to non-resident institutional investors who do not benefit from double taxation treaties. The Index is constructed and managed with a view to being fully investable from the perspective of international institutional investors. Investors should note that indices do not reflect the deduction of fees and expenses.
4 The MSCI Emerging Markets Index (net) is a market capitalization-weighted index composed of different emerging market countries in Europe, Latin America, and the Pacific Basin. The index is constructed and managed with a view to being fully investable from the perspective of international institutional investors. Net total return indices reinvest dividends after the deduction of withholding taxes, using a tax rate applicable to non-resident institutional investors who do not benefit from double taxation treaties. Investors should note that indices do not reflect the deduction of fees and expenses.
5 The Barclays US Aggregate Index is an unmanaged broad based index designed to measure the US-dollar-denominated, investment-grade, taxable bond market. The index includes bonds from the Treasury, government-related, corporate, mortgage-backed, asset-backed and commercial mortgage-backed sectors. Investors should note that indices do not reflect the deduction of fees and expenses.
6 The BofA Merrill Lynch US High Yield Cash Pay Constrained Index is an unmanaged index of publicly placed non-convertible, coupon-bearing US dollar denominated below investment grade corporate debt with a term to maturity of at least one year. The index is market weighted, so that larger bond issuers have a greater effect on the index's return. However, the representation of any single bond issue is restricted to a maximum of 2% of the total index. Investors should note that indices do not reflect the deduction of fees and expenses.
3
PACE Select Advisors Trust
contrast, emerging markets debt, as measured by the J.P. Morgan Emerging Markets Bond Index Global (EMBI Global),7 returned declined 1.73%.
Sincerely,

Mark E. Carver
President, PACE Select Advisors Trust
Managing Director, UBS Global Asset Management (Americas) Inc.
This report is intended to assist investors in understanding how the Portfolios performed during the 12-month period ended July 31, 2013. The views expressed in the Advisor's and Sub-Advisors' comments sections are as of the end of the reporting period, reflect performance results gross of fees and expenses, and are those of the investment advisor (with respect to PACE Money Market Investments only) and Sub-advisors. Sub-advisors' comments on Portfolios that have more than one Sub-advisor are reflective of their portion of the Portfolio only. The views and opinions in this report were current as of September 16, 2013. They are not guarantees of future performance or investment results and should not be taken as investment advice. Investment decisions reflect a variety of factors, and the investment advisor and Sub-advisors reserve the right to change their views about individual securities, sectors and markets at any time. As a result, the views expressed should not be relied upon as a forecast of a Portfolio's future investment intent.
7 The J.P. Morgan Emerging Markets Bond Index Global (EMBI Global) is an unmanaged index which is designed to track total returns for US dollar denominated debt instruments issued by emerging market sovereign and quasi-sovereign entities: Brady bonds, loans and Eurobonds. Investors should note that indices do not reflect the deduction of fees and expenses.
4
PACE Select Advisors Trust
PACE Money Market Investments
Performance
For the 12 months ended July 31, 2013, the Portfolio returned 0.01% before the deduction of the maximum PACE program fee. (The Portfolio declined 1.97% after the deduction of the maximum PACE program fee for the same 12-month period.) Please remember that the PACE program fee is assessed outside the Portfolio at the PACE program account level. The program fee does not impact the determination of the Portfolio's net asset value per share. For comparison purposes, the median return of the Lipper Money Market Funds category was 0.01%. (Returns over various time periods are shown in the "Performance at a glance" table on page 6. Please note that the returns shown do not reflect the deduction of taxes that a shareholder would pay on Portfolio distributions.) For a detailed commentary on the market environment in general during the period, please refer to page 2.
Advisor's comments
The Portfolio's yield remained low during the reporting period, reflecting the Federal Reserve Board's (the "Fed") decision to maintain the federal funds rate at an extremely low level between 0% and 0.25%, which continued to depress yields on a wide range of short-term investments. (The federal funds rate, or "fed funds" rate is the rate that banks charge one another for funds they borrow on an overnight basis) As a result, the yields of the securities in which the Portfolio invests remained extremely low. In turn, this kept the Portfolio's yield low.
We tactically adjusted the Portfolio's weighted average maturity (WAM)—which is the average duration of the securities in the Portfolio—throughout the 12-month review period. When the reporting period began, the Portfolio had a WAM of 31 days. While there were concerns regarding the ongoing challenges in Europe, they were overshadowed by the Fed's third round of quantitative easing ("QE3"). Thus, in anticipation of further downward pressure on short-term interest rates with QE3, we significantly increased the Portfolio's WAM in September 2012, and ended the first six months of the reporting period with a WAM of 50 days. During the second half of the period, we pared the Portfolio's WAM and ended the fiscal year at 29 days.
At the issuer level, we maintained a high level of diversification, investing in smaller positions with the goal of reducing risk and keeping the Portfolio highly liquid. To that end, we typically purchased up to 3% in single nongovernment issuers throughout the reporting period. (The Portfolio is generally able to hold up to 5% in any one issuer, subject to certain exceptions.)
Several adjustments were made to the Portfolio's sector positioning during the 12-month period. We increased the Portfolio's exposure to certificates of deposit. Conversely, we reduced our allocations to repurchase agreements and short-term corporate obligations and, to lesser extents, commercial paper and US government and agency obligations. (Repurchase agreements are transactions in which the seller of a security agrees to buy it back at a predetermined time and price or upon demand.)
PACE Select Advisors Trust – PACE Money Market Investments
Investment Advisor:
UBS Global Asset Management (Americas) Inc.
Portfolio Manager:
Robert Sabatino
Objective:
Current income consistent with preservation of capital and liquidity
Investment process:
The Portfolio is a money market mutual fund and seeks to maintain a stable price of $1.00 per share, although it may be possible to lose money by investing in this Portfolio. The Portfolio invests in a diversified portfolio of high-quality money market instruments of governmental and private issuers. Security selection is based on the assessment of relative values and changes in market and economic conditions.
5
PACE Select Advisors Trust
PACE Money Market Investments
Performance at a glance (unaudited)
Average annual total returns for periods ended 07/31/13 | | 1 year | | 5 years | | 10 years | |
PACE Money Market Investments before deducting maximum PACE program fee1 | | | 0.01 | % | | | 0.17 | % | | | 1.52 | % | |
PACE Money Market Investments after deducting maximum PACE program fee1 | | | (1.97 | )% | | | (1.82 | )% | | | (0.50 | )% | |
Lipper Money Market Funds median | | | 0.01 | % | | | 0.18 | % | | | 1.47 | % | |
For PACE Money Market Investments, average annual total returns for periods ended June 30, 2013, after deduction of the maximum PACE program fee, were as follows: 1-year period, (1.97)%; 5-year period, (1.78)%; 10-year period, (0.49)%.
For PACE Money Market Investments, the 7-day current yield for the period ended July 31, 2013 was 0.01% (without maximum PACE program fee and after fee waivers and/or expense reimbursements; the yield was 0.01% before fee waivers and/or expense reimbursements). With the maximum PACE program fee, the 7-day current yield was (1.99)% after fee waivers and/or expense reimbursements; the yield was (1.99%) before fee waivers and/or expense reimbursements. The Portfolio's yield quotation more closely reflects the current earnings of the Portfolio than the total return quotation. Yields will fluctuate and reflect fee waivers and/or expense reimbursements.
1 The maximum annual PACE program fee is 2% of the value of PACE assets. Prior to June 14, 2010, the maximum annual PACE program fee was 1.5% of the value of PACE assets; however, the current maximum annual PACE program fee of 2% is reflected in the performance returns throughout all periods in the average annual total returns shown above.
Past performance does not predict future performance and the performance information provided does not reflect the deduction of taxes that a shareholder would pay on Portfolio distributions. The return of an investment will fluctuate. Performance results assume reinvestment of all dividends and capital gain distributions at net asset value on the payable dates. Current performance may be higher or lower than the performance data quoted.
Lipper peer group data calculated by Lipper Inc.; used with permission. The Lipper median is the return of the fund that places in the middle of a Lipper peer group.
An investment in PACE Money Market Investments is not insured or guaranteed by the Federal Deposit Insurance Corporation or any other government agency. Although the Portfolio seeks to preserve the value of your investment at $1.00 per share, it is possible to lose money by investing in the Portfolio.
Not FDIC Insured. May lose value. No bank guarantee.
6
PACE Select Advisors Trust
PACE Money Market Investments
Portfolio statistics (unaudited)
Characteristics | | 07/31/13 | |
Net assets (mm) | | $ | 309.8 | | |
Number of holdings | | | 82 | | |
Weighted average maturity | | | 29 days | | |
Portfolio composition1 | | 07/31/13 | |
Commercial paper | | | 56.0 | % | |
Repurchase agreements | | | 16.4 | | |
Certificates of deposit | | | 14.8 | | |
US government and agency obligations | | | 12.8 | | |
Other assets less liabilities | | | (0.0 | )2 | |
Total | | | 100.0 | % | |
Top 10 holdings1 | | 07/31/13 | |
Repurchase agreement with Deutsche Bank Securities, Inc., 0.090% due 08/01/13 | | | 9.8 | % | |
Repurchase agreement with Barclays Capital, Inc., 0.070% due 08/01/13 | | | 6.5 | | |
BNP Paribas Finance, Inc., 0.250% due 10/09/13 | | | 2.6 | | |
Sumitomo Mitsui Banking Corp., 0.170% due 08/08/13 | | | 2.3 | | |
US Treasury Notes, 0.750% due 12/15/13 | | | 1.9 | | |
US Treasury Notes, 0.500% due 11/15/13 | | | 1.9 | | |
Norinchukin Bank, 0.160% due 08/08/13 | | | 1.9 | | |
Federal Home Loan Mortgage Corp., 0.070% due 08/26/13 | | | 1.9 | | |
Federal National Mortgage Association, 0.150% due 09/03/13 | | | 1.9 | | |
Erste Finance LLC, 0.200% due 08/01/13 | | | 1.6 | | |
Total | | | 32.3 | % | |
1 Weightings represent percentages of the Portfolio's net assets as of July 31, 2013. The Portfolio is actively managed and its composition will vary over time.
2 Amount is less than (0.05)%.
7
PACE Select Advisors Trust
PACE Money Market Investments
Portfolio of investments—July 31, 2013
| | | Face
amount | | Value | |
US government and agency obligations—12.76% | |
Federal Home Loan Bank
0.050%, due 08/15/131 | | $ | 4,000,000 | | | $ | 3,999,922 | | |
0.125%, due 03/27/14 | | | 1,500,000 | | | | 1,499,540 | | |
Federal Home Loan Mortgage Corp.
0.070%, due 08/26/13*1 | | | 6,000,000 | | | | 5,999,709 | | |
Federal National Mortgage
Association
0.150%, due 09/03/13*1 | | | 6,000,000 | | | | 5,999,175 | | |
US Treasury Bill
0.106%, due 08/01/131 | | | 3,000,000 | | | | 3,000,000 | | |
US Treasury Notes
3.125%, due 08/31/13 | | | 3,000,000 | | | | 3,007,184 | | |
0.125%, due 09/30/13 | | | 3,000,000 | | | | 2,999,625 | | |
0.500%, due 11/15/13 | | | 6,000,000 | | | | 6,005,422 | | |
0.750%, due 12/15/13 | | | 6,000,000 | | | | 6,012,543 | | |
1.000%, due 01/15/14 | | | 1,000,000 | | | | 1,003,739 | | |
Total US government and agency
obligations
(cost—$39,526,859) | | | | | 39,526,859 | | |
Certificates of deposit—14.85% | |
Banking-non-US—12.59% | |
Bank of Montreal
0.180%, due 09/04/13 | | | 3,000,000 | | | | 3,000,000 | | |
Bank of Tokyo-Mitsubishi UFJ Ltd.
0.200%, due 10/07/13 | | | 3,000,000 | | | | 3,000,000 | | |
Credit Agricole Corporate &
Investment Bank
0.170%, due 08/13/13 | | | 5,000,000 | | | | 5,000,000 | | |
Credit Industriel et Commercial
0.160%, due 08/23/13 | | | 2,000,000 | | | | 2,000,000 | | |
0.240%, due 09/05/13 | | | 3,000,000 | | | | 3,000,000 | | |
Mizuho Corporate Bank Ltd.
0.160%, due 08/08/13 | | | 4,000,000 | | | | 4,000,000 | | |
Norinchukin Bank
0.160%, due 08/08/13 | | | 6,000,000 | | | | 6,000,000 | | |
0.160%, due 08/16/13 | | | 3,000,000 | | | | 3,000,000 | | |
Sumitomo Mitsui Banking Corp.
0.170%, due 08/08/13 | | | 7,000,000 | | | | 7,000,000 | | |
0.170%, due 08/09/13 | | | 3,000,000 | | | | 2,999,993 | | |
| | | | 38,999,993 | | |
Banking-US—2.26% | |
Bank of America N.A.
0.190%, due 08/06/13 | | | 2,000,000 | | | | 2,000,000 | | |
Branch Banking & Trust Co.
0.190%, due 08/15/13 | | | 5,000,000 | | | | 5,000,000 | | |
| | | | 7,000,000 | | |
Total certificates of deposit
(cost—$45,999,993) | | | | | 45,999,993 | | |
Commercial paper1—56.04% | |
Asset backed-miscellaneous—21.32% | |
Barton Capital LLC
0.180%, due 08/02/13 | | | 3,065,000 | | | | 3,064,985 | | |
| | | Face
amount | | Value | |
Commercial paper1—(continued) | |
Asset backed-miscellaneous—(concluded) | |
Cancara Asset Securitisation LLC
0.170%, due 08/14/13 | | $ | 2,000,000 | | | $ | 1,999,877 | | |
0.190%, due 08/16/13 | | | 1,000,000 | | | | 999,921 | | |
0.150%, due 08/21/13 | | | 5,000,000 | | | | 4,999,583 | | |
0.190%, due 09/20/13 | | | 1,000,000 | | | | 999,736 | | |
Ciesco LLC
0.220%, due 09/20/13 | | | 2,000,000 | | | | 2,000,000 | | |
Gotham Funding Corp.
0.150%, due 08/16/13 | | | 5,000,000 | | | | 4,999,688 | | |
0.180%, due 08/20/13 | | | 1,000,000 | | | | 999,905 | | |
Jupiter Securitization Co. LLC
0.260%, due 09/10/13 | | | 3,000,000 | | | | 2,999,133 | | |
Liberty Street Funding LLC
0.080%, due 08/01/13 | | | 5,000,000 | | | | 5,000,000 | | |
0.180%, due 09/09/13 | | | 4,000,000 | | | | 3,999,220 | | |
LMA Americas LLC
0.180%, due 08/12/13 | | | 2,500,000 | | | | 2,499,863 | | |
0.170%, due 08/21/13 | | | 2,000,000 | | | | 1,999,811 | | |
Market Street Funding LLC
0.130%, due 08/23/13 | | | 3,500,000 | | | | 3,499,722 | | |
0.160%, due 09/10/13 | | | 3,000,000 | | | | 2,999,467 | | |
Nieuw Amsterdam Receivables Corp.
0.150%, due 08/13/13 | | | 5,000,000 | | | | 4,999,750 | | |
Regency Markets No. 1 LLC
0.150%, due 08/19/13 | | | 3,000,000 | | | | 2,999,775 | | |
0.150%, due 08/20/13 | | | 5,000,000 | | | | 4,999,604 | | |
Sheffield Receivables Corp.
0.200%, due 09/05/13 | | | 2,000,000 | | | | 1,999,611 | | |
Victory Receivables Corp.
0.150%, due 08/08/13 | | | 5,000,000 | | | | 4,999,854 | | |
0.170%, due 09/10/13 | | | 3,000,000 | | | | 2,999,433 | | |
| | | | 66,058,938 | | |
Banking-non-US—6.00% | |
Lloyds TSB Bank PLC
0.100%, due 08/05/13 | | | 3,000,000 | | | | 2,999,967 | | |
0.100%, due 08/07/13 | | | 5,000,000 | | | | 4,999,917 | | |
Mizuho Funding LLC
0.220%, due 10/01/13 | | | 5,000,000 | | | | 4,998,136 | | |
Nordea Bank AB
0.220%, due 11/15/13 | | | 1,000,000 | | | | 999,352 | | |
Oversea-Chinese Banking Corp., Ltd.
0.150%, due 08/15/13 | | | 3,615,000 | | | | 3,614,789 | | |
Westpac Securities NZ Ltd.
0.353%, due 01/02/142,3 | | | 1,000,000 | | | | 1,000,000 | | |
| | | 18,612,161 | | |
Banking-US—18.07% | |
Bedford Row Funding Corp.
0.420%, due 12/16/13 | | | 1,500,000 | | | | 1,497,603 | | |
BNP Paribas Finance, Inc.
0.250%, due 10/09/13 | | | 8,000,000 | | | | 7,996,167 | | |
Erste Finance LLC
0.200%, due 08/01/13 | | | 5,000,000 | | | | 5,000,000 | | |
8
PACE Select Advisors Trust
PACE Money Market Investments
Portfolio of investments—July 31, 2013
| | | Face
amount | | Value | |
Commercial paper1—(continued) | |
Banking-US—(concluded) | |
ING (US) Funding LLC
0.210%, due 10/22/13 | | $ | 1,500,000 | | | $ | 1,499,283 | | |
National Australia Funding
Delaware, Inc.
0.225%, due 12/09/13 | | | 5,000,000 | | | | 4,995,937 | | |
Natixis US Finance Co. LLC
0.110%, due 08/06/13 | | | 1,000,000 | | | | 999,985 | | |
0.170%, due 08/06/13 | | | 3,000,000 | | | | 2,999,929 | | |
Northern Pines Funding LLC
0.160%, due 08/19/13 | | | 2,500,000 | | | | 2,499,800 | | |
0.210%, due 09/27/13 | | | 5,000,000 | | | | 4,998,337 | | |
0.240%, due 10/01/13 | | | 2,500,000 | | | | 2,498,983 | | |
Rabobank USA Finance Corp.
0.245%, due 08/12/13 | | | 2,000,000 | | | | 1,999,850 | | |
Societe Generale N.A., Inc.
0.070%, due 08/01/13 | | | 3,000,000 | | | | 3,000,000 | | |
0.200%, due 08/01/13 | | | 5,000,000 | | | | 5,000,000 | | |
State Street Corp.
0.170%, due 09/03/13 | | | 3,000,000 | | | | 2,999,532 | | |
Toronto-Dominion Holdings USA, Inc.
0.130%, due 08/26/13 | | | 5,000,000 | | | | 4,999,549 | | |
0.170%, due 10/15/13 | | | 1,000,000 | | | | 999,646 | | |
Wells Fargo
0.180%, due 08/15/13 | | | 2,000,000 | | | | 1,999,860 | | |
| | | 55,984,461 | | |
Brokerage—1.29% | |
Prudential Funding LLC
0.140%, due 08/22/13 | | | 4,000,000 | | | | 3,999,673 | | |
Energy-integrated—2.90% | |
CNPC Finance HK Ltd.
0.250%, due 08/01/13 | | | 2,000,000 | | | | 2,000,000 | | |
0.270%, due 08/05/13 | | | 2,000,000 | | | | 1,999,940 | | |
0.250%, due 08/16/13 | | | 5,000,000 | | | | 4,999,479 | | |
| | | | 8,999,419 | | |
Finance-captive automotive—2.26% | |
Toyota Motor Credit Corp.
0.240%, due 08/30/13 | | | 3,000,000 | | | | 2,999,420 | | |
0.170%, due 10/10/13 | | | 2,000,000 | | | | 1,999,339 | | |
0.231%, due 02/18/142 | | | 2,000,000 | | | | 2,000,000 | | |
| | | | 6,998,759 | | |
Finance-non-captive diversified—0.65% | |
General Electric Capital Corp.
0.240%, due 10/02/13 | | | 1,000,000 | | | | 999,587 | | |
0.200%, due 12/19/13 | | | 1,000,000 | | | | 999,222 | | |
| | | | 1,998,809 | | |
Insurance-life—2.90% | |
MetLife Short Term Funding LLC
0.120%, due 08/19/13 | | | 4,000,000 | | | | 3,999,760 | | |
0.120%, due 08/20/13 | | | 3,000,000 | | | | 2,999,810 | | |
0.130%, due 09/26/13 | | | 2,000,000 | | | | 1,999,596 | | |
| | | | 8,999,166 | | |
| | | Face
amount | | Value | |
Commercial paper1—(concluded) | |
Pharmaceuticals—0.65% | |
Roche Holdings, Inc.
0.060%, due 08/20/13 | | $ | 2,000,000 | | | $ | 1,999,937 | | |
Total commercial paper
(cost—$173,651,323) | | | | | 173,651,323 | | |
Repurchase agreements—16.36% | |
Repurchase agreement dated
07/31/13 with Barclays Capital,
Inc., 0.070% due 08/01/13,
collateralized by $20,425,600
US Treasury Notes, 0.250% due
07/31/15; (value—$20,400,068);
proceeds: $20,000,039 | | | 20,000,000 | | | | 20,000,000 | | |
Repurchase agreement dated
07/31/13 with Deutsche Bank
Securities, Inc., 0.090% due
08/01/13, collateralized by
$18,963,000 Federal Home Loan
Mortgage Corp. obligations,
0.850% due 07/29/16 and
$10,317,000 Federal National
Mortgage Association obligations,
5.355% due 11/24/17;
(value—$31,110,163);
proceeds: $30,500,076 | | | 30,500,000 | | | | 30,500,000 | | |
Repurchase agreement dated
07/31/13 with State Street
Bank and Trust Co., 0.010% due
08/01/13, collateralized by $211,772
Federal Home Loan Mortgage Corp.
obligations, 2.100% due 10/17/22;
(value—$196,211);
proceeds: $192,000 | | | 192,000 | | | | 192,000 | | |
Total repurchase agreements
(cost—$50,692,000) | | | | | 50,692,000 | | |
Total investments
(cost—$309,870,175 which
approximates cost for federal
income tax purposes)—100.01% | | | | | 309,870,175 | | |
Liabilities in excess of
other assets—(0.01)% | | | | | (28,231 | ) | |
Net assets (applicable to 309,843,709
shares of beneficial interest
outstanding equivalent to $1.00
per share)—100.00% | | | | $ | 309,841,944 | | |
9
PACE Select Advisors Trust
PACE Money Market Investments
Portfolio of investments—July 31, 2013
For a listing of defined portfolio acronyms that are used throughout the Portfolio of investments as well as the tables that follow, please refer to page 218.
Affiliated issuer activity
The table below details the Portfolio's transaction activity in an affiliated issuer during the year ended July 31, 2013. The investment manager earns a management fee from UBS Private Money Market Fund LLC. Please see the Notes to financial statements for further information.
Security description | | Value at
07/31/12 | | Purchases
during the
year ended
07/31/13 | | Sales
during the
year ended
07/31/13 | | Value at
07/31/13 | | Net income
earned from
affiliate for the
year ended
07/31/13 | |
UBS Private Money Market Fund LLC | | $ | — | | | $ | 15,300,000 | | | $ | 15,300,000 | | | $ | — | | | $ | 36 | | |
Fair valuation summary
The following is a summary of the fair valuations according to the inputs used as of July 31, 2013 in valuing the Portfolio's investments:
| | | Unadjusted
quoted prices in
active markets for
identical investments
(Level 1) | | Other significant
observable inputs
(Level 2) | | Unobservable
inputs
(Level 3) | | Total | |
US government and agency obligations | | $ | — | | | $ | 39,526,859 | | | $ | — | | | $ | 39,526,859 | | |
Certificates of deposit | | | — | | | | 45,999,993 | | | | — | | | | 45,999,993 | | |
Commercial paper | | | — | | | | 173,651,323 | | | | — | | | | 173,651,323 | | |
Repurchase agreements | | | — | | | | 50,692,000 | | | | — | | | | 50,692,000 | | |
Total | | $ | — | | | $ | 309,870,175 | | | $ | — | | | $ | 309,870,175 | | |
At July 31, 2013, there were no transfers between Level 1 and Level 2.
Issuer breakdown by country or territory of origin (unaudited)
| | | Percentage of
total investments | |
United States | | | 76.6 | % | |
Japan | | | 12.2 | | |
France | | | 3.2 | | |
China | | | 2.9 | | |
United Kingdom | | | 2.6 | | |
Singapore | | | 1.2 | | |
Canada | | | 1.0 | | |
Australia | | | 0.3 | | |
Total | | | 100.0 | % | |
Portfolio footnotes
* On September 7, 2008, the Federal Housing Finance Agency placed the Federal National Mortgage Association and the Federal Home Loan Mortgage Corporation into conservatorship, and the US Treasury guaranteed the debt issued by those organizations.
1 Rates shown are the discount rates at date of purchase.
2 Variable or floating rate security. The interest rate shown is the current rate as of July 31, 2013 and changes periodically. The maturity date reflects earlier of reset date or stated maturity date.
3 Security exempt from registration pursuant to Rule 144A under the Securities Act of 1933. This security, which represents 0.32% of net assets as of July 31, 2013, is considered liquid and may be resold in transactions exempt from registration, normally to qualified institutional buyers.
See accompanying notes to financial statements.
10
PACE Select Advisors Trust
PACE Government Securities Fixed Income Investments
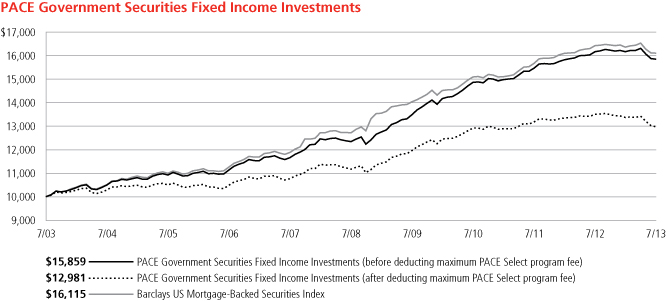
Performance
For the 12 months ended July 31, 2013, the Portfolio's Class P shares declined 1.97% before the deduction of the maximum PACE Select program fee. (Class P shares declined 3.91% after the deduction of the maximum PACE Select program fee for the same 12-month period.) In comparison, the Barclays US Mortgage-Backed Securities Index (the "benchmark") declined 1.98%, and the Lipper US Mortgage Funds category posted a median declined of 1.62%. (Returns for all share classes over various time periods are shown in the "Performance at a glance" table on page 14. Please note that the returns shown do not reflect the deduction of taxes that a shareholder would pay on Portfolio distributions or the redemption of Portfolio shares.) For a detailed commentary on the market environment in general during the reporting period, please refer to page 2.
Sub-Advisor's comments1
The Portfolio slightly outperformed its benchmark during the reporting period. An overall duration position that was slightly shorter than that of the benchmark for most of the 12-month period contributed to returns, as US interest rates increased. (Duration measures a portfolio's sensitivity to interest rate changes.) However, a modest emphasis on the intermediate portion of the yield curve detracted from performance, as rates on longer maturities rose less than rates on intermediate maturities.
Tactical positioning within agency mortgage-backed securities ("MBS") benefited performance. An overall underweight to lower coupon conventional (Fannie Mae and Freddie Mac) agency MBS contributed to performance, as these coupons underperformed the broader agency MBS market. Positioning within Ginnie Mae agency MBS contributed to relative performance, with an underweight to lower-coupon securities that underperformed the broader agency MBS market and an overweight to higher coupons that outperformed the broader market.
1 All Sub-Advisors discuss performance on a gross of fees basis—meaning that no fees or expenses are reflected in their sleeves'/sleeve's performance. Alternately, Portfolio performance is shown net of fees, which does factor in fees and expenses associated with the Portfolio.
PACE Select Advisors Trust – PACE Government Securities Fixed Income Investments
Investment Sub-Advisor:
Pacific Investment Management Company LLC ("PIMCO")
Portfolio Manager:
Daniel Hyman and Michael Cudzil
Objective:
Current income
Investment process:
The Portfolio invests primarily in government fixed income securities which include US bonds, including those backed by mortgages, and related repurchase agreements. Mortgage-backed securities include "to be announced" or "TBA" securities which usually are traded on a forward commitment basis with an approximate principal amount and no defined maturity date; issued or guaranteed by US government agencies and instrumentalities. The Portfolio also invests, to a lesser extent, in investment grade bonds of private issuers, including those backed by mortgages or other assets. The Portfolio may invest in bonds of varying maturities, but normally limits its duration to within two years (plus or minus) of the effective duration of the Portfolio's benchmark index. (Duration is a measure of a portfolio's sensitivity to interest rate changes.) The Portfolio may engage in short selling with respect to securities issued by the US Treasury and certain TBA securities coupon trades. PIMCO establishes duration targets based on its expectations for changes in interest rates, and then positions the Portfolio to take advantage of yield curve shifts. PIMCO decides to buy and sell specific bonds based on an analysis of their values relative to other similar securities.
11
PACE Select Advisors Trust
PACE Government Securities Fixed Income Investments
Sub-Advisor's comments – concluded
Exposure to senior non-agency MBS contributed to performance, as these securities continued to be aided by both limited supply and signs of improvement in the housing market. A modest allocation to commercial mortgage-backed securities ("CMBS") also added to returns, as the sector benefited from continued demand for higher-yielding assets.
No derivatives were used during the reporting period.
Special considerations
The Portfolio may be appropriate for long-term investors seeking current income who are able to withstand short-term fluctuations in the fixed income markets in return for potentially higher returns over the long term. The yield and value of the Portfolio change every day and can be affected by changes in interest rates, general market conditions and other political, social and economic developments, as well as specific matters relating to the issuers in which the Portfolio invests. It is important to note that an investment in the Portfolio is only one component of a balanced investment plan.
12
PACE Select Advisors Trust
PACE Government Securities Fixed Income Investments
Illustration of an assumed investment of $10,000 in Class P shares of the Portfolio (unaudited)
The following graph depicts the performance of PACE Government Securities Fixed Income Investments Class P shares versus the Barclays US Mortgage-Backed Securities Index over the 10 years ended July 31, 2013. The performance of the other classes will vary based upon the different class specific expenses and sales charges. The performance provided does not reflect the deduction of taxes that a shareholder would pay on Portfolio distributions or the redemption of Portfolio shares. Past performance is no guarantee of future results. Share price and returns will vary with market conditions; investors may realize a gain or loss upon redemption. It is important to note that PACE Government Securities Fixed Income Investments is a professionally managed portfolio while the Index is not available for investment and is unmanaged. The comparison is shown for illustration purposes only.
13
PACE Select Advisors Trust
PACE Government Securities Fixed Income Investments
Performance at a glance (unaudited)
Average annual total returns for periods ended 07/31/13 | | 1 year | | 5 years | | 10 years | |
Before deducting maximum sales charge or PACE Select program fee | |
Class A1 | | | (2.29 | )% | | | 4.87 | % | | | 4.47 | % | |
Class C2 | | | (2.78 | )% | | | 4.32 | % | | | 3.93 | % | |
Class Y3 | | | (2.05 | )% | | | 5.12 | % | | | 4.76 | % | |
Class P4 | | | (1.97 | )% | | | 5.13 | % | | | 4.72 | % | |
After deducting maximum sales charge or PACE Select program fee | |
Class A1 | | | (6.65 | )% | | | 3.90 | % | | | 3.99 | % | |
Class C2 | | | (3.48 | )% | | | 4.32 | % | | | 3.93 | % | |
Class P4 | | | (3.91 | )% | | | 3.05 | % | | | 2.64 | % | |
Barclays US Mortgage-Backed Securities Index5 | | | (1.98 | )% | | | 4.85 | % | | | 4.89 | % | |
Lipper US Mortgage Funds median | | | (1.62 | )% | | | 5.05 | % | | | 4.18 | % | |
Average annual total returns for periods ended June 30, 2013, after deduction of the maximum sales charge or PACE Select program fee, were as follows: Class A—1-year period, (5.66)%; 5-year period, 3.87%; 10-year period, 3.81%; Class C—1-year period, (2.35)%; 5-year period, 4.32%; 10-year period, 3.76%; Class Y—1-year period, (0.97)%; 5-year period, 5.08%; 10-year period, 4.58%; Class P—1-year period, (2.93)%; 5-year period, 3.02%; 10-year period, 2.47%.
The annualized gross and net expense ratios, respectively, for each class of shares as in the November 28, 2012 prospectuses, were as follows: Class A—1.05% and 0.97%; Class C—1.56% and 1.47%; Class Y—0.86% and 0.72%; and Class P—0.85% and 0.72%. Net expenses reflect fee waivers and/or expense reimbursements, if any, pursuant to an agreement that is in effect to cap the expenses. The Portfolio and UBS Global Asset Management (Americas) Inc. ("UBS Global AM") have entered into a written fee waiver/expense reimbursement agreement pursuant to which UBS Global AM is contractually obligated to (1) waive its management fees through November 30, 2013 to the extent necessary to reflect the lower sub-advisory fee paid by UBS Global AM to Pacific Investment Management Company LLC, the Portfolio's investment advisor; and (2) waive its management fees and/or reimburse expenses so that the Portfolio's ordinary total operating expenses of each class through November 30, 2013 (excluding dividend expense, borrowing costs, and interest expense relating to short sales, and expenses attributable to investment in other investment companies, interest, taxes, brokerage commissions and extraordinary expenses) would not exceed Class A—0.97%; Class C—1.47%; Class Y—0.72%; and Class P—0.72%. The Portfolio has agreed to repay UBS Global AM for any waived fees/reimbursed expenses (pursuant to item (2)) to the extent that it can do so over the following three fiscal years without causing the Portfolio's expenses in any of those three years to exceed these expense caps. The fee waiver/expense reimbursement agreement may be terminated by the Portfolio's board at any time and also will terminate automatically upon the expiration or termination of the Portfolio's advisory contract with UBS Global AM. Upon termination of the agreement, however, UBS Global AM's three year recoupment rights will survive.
1 Maximum sales charge for Class A shares is 4.5%. Class A shares bear ongoing 12b-1 service fees.
2 Maximum contingent deferred sales charge for Class C shares is 0.75% imposed on redemptions and is reduced to 0% after one year. Class C shares bear ongoing 12b-1 service and distribution fees. Prior to September 30, 2003, Class C shares were subject to a maximum front-end sales charge of 1%; this front-end sales charge is not reflected in the average annual total returns presented for the Class C shares shown above.
3 The Portfolio offers Class Y shares to a limited group of eligible investors, including certain qualifying retirement plans. Class Y shares do not bear initial or contingent deferred sales charges or ongoing 12b-1 service and distribution fees.
4 Class P shares do not bear initial or contingent deferred sales charges or ongoing 12b-1 service and distribution fees, but are subject to a maximum annual PACE Select program fee of 2% of the value of Class P shares. Prior to June 14, 2010, the maximum annual PACE Select program fee was 1.5% of the value of Class P shares; however, the current maximum annual PACE Select program fee of 2% is reflected in the performance returns throughout all periods in the average annual total returns presented for the Class P shares shown above.
5 The Barclays US Mortgage-Backed Securities Index is an unmanaged index which primarily covers the agency mortgage-backed pass-through securities issued by Ginnie Mae (formally known as Government National Mortgage Association or GNMA), Freddie Mac (formally known as Federal Home Loan Mortgage Corporation or FHLMC), and Fannie Mae (formally known as Federal National Mortgage Association or FNMA). Investors should note that indices do not reflect the deduction of fees and expenses.
If an investor sells or exchanges shares less than 90 days after purchase, a redemption fee of 1.00% of the amount sold or exchanged will be deducted at the time of the transaction, except as noted otherwise in the prospectuses.
Past performance does not predict future performance, and the performance information provided does not reflect the deduction of taxes that a shareholder would pay on Portfolio distributions or the redemption of Portfolio shares. The return and principal value of an investment will fluctuate, so that an investor's shares, when redeemed, may be worth more or less than their original cost. Performance results assume reinvestment of all dividends and capital gain distributions at net asset value on the ex-dividend dates. Current performance may be higher or lower than the performance data quoted. For month-end performance figures, please visit http://globalam-us.ubs.com/corpweb/performance.do.
Lipper peer group data calculated by Lipper Inc.; used with permission. The Lipper median is the return of the fund that places in the middle of a Lipper peer group.
14
PACE Select Advisors Trust
PACE Government Securities Fixed Income Investments
Portfolio statistics (unaudited)
Characteristics | | 07/31/13 | |
Weighted average duration | | | 4.5 yrs. | | |
Weighted average maturity | | | 6.1 yrs. | | |
Average coupon | | | 2.33 | % | |
Average quality1 | | | AA+ | | |
Net assets (mm) | | $ | 588.4 | | |
Number of holdings | | | 521 | | |
Portfolio composition2 | | 07/31/13 | |
Bonds | | | 151.9 | % | |
Repurchase agreements | | | 0.1 | | |
Investments sold short | | | (18.2 | ) | |
Cash equivalents and other assets less liabilities | | | (33.8 | ) | |
Total | | | 100.0 | % | |
Asset allocation2 | | 07/31/13 | |
US government agency mortgage pass-through certificates | | | 134.9 | % | |
Collateralized mortgage obligations | | | 12.6 | | |
Stripped mortgage-backed securities | | | 2.2 | | |
Asset-backed securities | | | 2.0 | | |
Repurchase agreement | | | 0.1 | | |
US government obligations | | | 0.2 | | |
Investments sold short | | | (18.2 | ) | |
Cash equivalents and other assets less liabilities | | | (33.8 | ) | |
Total | | | 100.0 | % | |
1 Credit quality ratings shown are based on the ratings assigned to portfolio holdings by Standard & Poor's Ratings Group, an independent rating agency.
2 Weightings represent percentages of the Portfolio's net assets as of July 31, 2013. The Portfolio is actively managed and its composition will vary over time.
15
PACE Select Advisors Trust
PACE Government Securities Fixed Income Investments
Portfolio of investments—July 31, 2013
| | Face
amount | | Value | |
US government obligations—0.16% | |
US Treasury Notes
0.250%, due 02/28/14 | | $ | 300,000 | | | $ | 300,269 | | |
2.000%, due 02/15/23 | | | 700,000 | | | | 667,297 | | |
Total US government obligations
(cost—$1,013,157) | | | 967,566 | | |
Government national mortgage association
certificates—30.48% | |
GNMA
3.000%, due 06/15/43 | | | 498,945 | | | | 489,607 | | |
3.500%, due 12/15/40 | | | 205,518 | | | | 209,669 | | |
3.500%, due 02/15/42 | | | 424,259 | | | | 432,757 | | |
4.000%, due 10/15/40 | | | 3,926,878 | | | | 4,104,442 | | |
4.500%, due 06/15/39 | | | 632,805 | | | | 673,380 | | |
4.500%, due 07/15/39 | | | 138,464 | | | | 147,338 | | |
4.500%, due 08/15/39 | | | 1,160,529 | | | | 1,231,983 | | |
4.500%, due 09/15/39 | | | 1,991,735 | | | | 2,140,941 | | |
4.500%, due 11/15/39 | | | 448,473 | | | | 477,214 | | |
4.500%, due 01/15/40 | | | 556,368 | | | | 592,430 | | |
4.500%, due 05/15/40 | | | 244,290 | | | | 260,304 | | |
4.500%, due 06/15/40 | | | 1,576,163 | | | | 1,680,237 | | |
5.000%, due 12/15/34 | | | 412,154 | | | | 447,970 | | |
5.000%, due 04/15/35 | | | 383,514 | | | | 415,690 | | |
5.000%, due 05/15/36 | | | 132,425 | | | | 143,135 | | |
5.000%, due 01/15/38 | | | 401,894 | | | | 433,575 | | |
5.000%, due 04/15/38 | | | 879,844 | | | | 949,200 | | |
5.000%, due 05/15/38 | | | 44,460 | | | | 47,965 | | |
5.000%, due 10/15/381 | | | 1,818,179 | | | | 1,961,540 | | |
5.000%, due 11/15/38 | | | 845,173 | | | | 911,796 | | |
5.000%, due 01/15/39 | | | 432,681 | | | | 468,423 | | |
5.000%, due 03/15/391 | | | 1,688,635 | | | | 1,828,126 | | |
5.000%, due 08/15/391 | | | 1,023,691 | | | | 1,108,253 | | |
5.000%, due 09/15/391 | | | 1,208,557 | | | | 1,308,391 | | |
5.000%, due 10/15/39 | | | 14,278 | | | | 15,458 | | |
5.000%, due 11/15/39 | | | 590,027 | | | | 636,855 | | |
5.000%, due 12/15/39 | | | 33,724 | | | | 36,510 | | |
5.000%, due 02/15/40 | | | 405,615 | | | | 442,126 | | |
5.000%, due 05/15/40 | | | 916,880 | | | | 993,679 | | |
5.000%, due 06/15/401 | | | 1,265,616 | | | | 1,379,539 | | |
5.000%, due 09/15/40 | | | 16,904 | | | | 18,426 | | |
5.000%, due 02/15/41 | | | 456,307 | | | | 493,522 | | |
5.000%, due 05/15/41 | | | 256,327 | | | | 279,794 | | |
5.500%, due 06/15/37 | | | 8,429 | | | | 9,182 | | |
5.500%, due 07/15/37 | | | 29,770 | | | | 32,428 | | |
5.500%, due 02/15/38 | | | 11,761 | | | | 12,811 | | |
5.500%, due 08/15/38 | | | 254,492 | | | | 277,206 | | |
5.500%, due 09/15/38 | | | 341,033 | | | | 371,472 | | |
5.500%, due 10/15/38 | | | 2,123,913 | | | | 2,316,533 | | |
5.500%, due 12/15/38 | | | 32,631 | | | | 35,541 | | |
5.500%, due 03/15/39 | | | 413,038 | | | | 455,168 | | |
5.500%, due 05/15/39 | | | 287,187 | | | | 312,820 | | |
5.500%, due 09/15/39 | | | 1,405,986 | | | | 1,531,484 | | |
5.500%, due 01/15/40 | | | 14,132 | | | | 15,394 | | |
5.500%, due 03/15/40 | | | 314,579 | | | | 342,667 | | |
5.500%, due 05/15/40 | | | 77,526 | | | | 84,448 | | |
| | Face
amount | | Value | |
Government national mortgage association
certificates—(continued) | |
6.000%, due 10/15/31 | | $ | 2,017 | | | $ | 2,247 | | |
6.000%, due 03/15/34 | | | 3,577 | | | | 3,978 | | |
6.000%, due 07/15/36 | | | 85,942 | | | | 95,772 | | |
6.500%, due 02/15/29 | | | 1,674 | | | | 1,927 | | |
6.500%, due 11/15/34 | | | 5,017 | | | | 5,167 | | |
6.500%, due 01/15/36 | | | 12,957 | | | | 13,360 | | |
6.500%, due 03/15/36 | | | 2,014 | | | | 2,194 | | |
6.500%, due 09/15/36 | | | 454,783 | | | | 522,648 | | |
6.500%, due 02/15/37 | | | 25,916 | | | | 29,391 | | |
6.500%, due 04/15/37 | | | 19,557 | | | | 22,144 | | |
6.500%, due 01/15/38 | | | 12,571 | | | | 14,161 | | |
6.500%, due 06/15/38 | | | 57,806 | | | | 65,355 | | |
6.500%, due 07/15/38 | | | 46,988 | | | | 53,032 | | |
6.500%, due 10/15/38 | | | 91,006 | | | | 102,712 | | |
6.500%, due 11/15/38 | | | 18,103 | | | | 20,431 | | |
7.500%, due 08/15/21 | | | 4,602 | | | | 5,055 | | |
8.000%, due 02/15/23 | | | 928 | | | | 1,055 | | |
8.250%, due 04/15/19 | | | 225,497 | | | | 253,932 | | |
10.500%, due 02/15/19 | | | 22,114 | | | | 22,242 | | |
10.500%, due 06/15/19 | | | 27,320 | | | | 27,478 | | |
10.500%, due 07/15/19 | | | 35,977 | | | | 36,187 | | |
10.500%, due 07/15/20 | | | 2,791 | | | | 2,808 | | |
10.500%, due 08/15/20 | | | 25,256 | | | | 26,221 | | |
10.500%, due 09/15/20 | | | 2,836 | | | | 2,853 | | |
11.500%, due 05/15/19 | | | 2,488 | | | | 2,560 | | |
GNMA II
2.500%, due 03/20/431 | | | 7,985,135 | | | | 7,401,592 | | |
2.500%, due 06/20/43 | | | 997,034 | | | | 924,172 | | |
2.500%, due 07/20/43 | | | 2,000,000 | | | | 1,853,843 | | |
4.000%, due 03/20/41 | | | 36,727 | | | | 38,535 | | |
4.500%, due 06/20/40 | | | 7,991,299 | | | | 8,534,807 | | |
4.500%, due 08/20/40 | | | 295,863 | | | | 316,430 | | |
5.000%, due 12/20/33 | | | 712,128 | | | | 775,483 | | |
5.000%, due 01/20/34 | | | 386,712 | | | | 421,172 | | |
5.000%, due 02/20/38 | | | 658,783 | | | | 712,883 | | |
5.000%, due 04/20/38 | | | 715,736 | | | | 774,840 | | |
5.000%, due 08/20/41 | | | 89,294 | | | | 96,474 | | |
9.000%, due 04/20/25 | | | 15,020 | | | | 17,614 | | |
9.000%, due 12/20/26 | | | 3,878 | | | | 4,180 | | |
9.000%, due 01/20/27 | | | 11,796 | | | | 12,244 | | |
9.000%, due 09/20/30 | | | 1,238 | | | | 1,259 | | |
9.000%, due 10/20/30 | | | 4,066 | | | | 4,289 | | |
9.000%, due 11/20/30 | | | 5,530 | | | | 5,675 | | |
GNMA II ARM
1.625%, due 01/20/23 | | | 77,461 | | | | 80,598 | | |
1.625%, due 03/20/23 | | | 37,912 | | | | 39,447 | | |
1.625%, due 01/20/24 | | | 94,004 | | | | 97,815 | | |
1.625%, due 02/20/25 | | | 24,401 | | | | 25,391 | | |
1.625%, due 03/20/26 | | | 19,798 | | | | 20,602 | | |
1.625%, due 01/20/27 | | | 143,008 | | | | 147,840 | | |
1.625%, due 01/20/28 | | | 16,423 | | | | 17,090 | | |
1.625%, due 02/20/28 | | | 13,182 | | | | 13,717 | | |
1.750%, due 07/20/17 | | | 3,108 | | | | 3,223 | | |
1.750%, due 09/20/21 | | | 112,076 | | | | 116,296 | | |
16
PACE Select Advisors Trust
PACE Government Securities Fixed Income Investments
Portfolio of investments—July 31, 2013
| | Face
amount | | Value | |
Government national mortgage association
certificates—(concluded) | | | |
1.750%, due 06/20/22 | | $ | 100,439 | | | $ | 104,068 | | |
1.750%, due 04/20/24 | | | 130,762 | | | | 135,866 | | |
1.750%, due 08/20/25 | | | 26,730 | | | | 27,739 | | |
1.750%, due 09/20/25 | | | 34,139 | | | | 35,430 | | |
1.750%, due 04/20/26 | | | 192,753 | | | | 200,288 | | |
1.750%, due 06/20/26 | | | 79,889 | | | | 83,007 | | |
1.750%, due 08/20/26 | | | 38,207 | | | | 39,649 | | |
1.750%, due 04/20/27 | | | 44,652 | | | | 46,398 | | |
1.750%, due 07/20/27 | | | 14,462 | | | | 15,010 | | |
1.750%, due 04/20/30 | | | 14,865 | | | | 15,447 | | |
1.750%, due 05/20/30 | | | 171,768 | | | | 178,494 | | |
1.750%, due 07/20/30 | | | 88,575 | | | | 91,930 | | |
2.000%, due 01/20/25 | | | 9,447 | | | | 9,801 | | |
2.000%, due 05/20/25 | | | 9,860 | | | | 10,209 | | |
2.000%, due 09/20/26 | | | 5,730 | | | | 5,943 | | |
2.000%, due 01/20/27 | | | 9,071 | | | | 9,410 | | |
2.000%, due 02/20/27 | | | 13,427 | | | | 13,930 | | |
2.000%, due 04/20/27 | | | 5,076 | | | | 5,255 | | |
2.000%, due 08/20/27 | | | 38,708 | | | | 40,150 | | |
2.000%, due 04/20/30 | | | 17,065 | | | | 17,668 | | |
2.000%, due 05/20/30 | | | 497,857 | | | | 515,470 | | |
2.000%, due 07/20/30 | | | 28,034 | | | | 29,081 | | |
2.000%, due 08/20/30 | | | 137,103 | | | | 142,215 | | |
2.500%, due 04/20/18 | | | 3,421 | | | | 3,556 | | |
2.500%, due 11/20/21 | | | 23,317 | | | | 24,076 | | |
2.500%, due 03/20/25 | | | 33,313 | | | | 34,662 | | |
2.500%, due 07/20/30 | | | 62,068 | | | | 64,598 | | |
2.500%, due 08/20/30 | | | 4,610 | | | | 4,798 | | |
2.500%, due 10/20/30 | | | 27,605 | | | | 28,806 | | |
3.000%, due 04/20/18 | | | 4,362 | | | | 4,516 | | |
3.000%, due 05/20/25 | | | 74,529 | | | | 78,334 | | |
3.000%, due 06/20/25 | | | 22,997 | | | | 23,825 | | |
3.500%, due 03/20/25 | | | 15,565 | | | | 16,181 | | |
4.000%, due 01/20/18 | | | 81,198 | | | | 85,439 | | |
4.000%, due 05/20/18 | | | 4,638 | | | | 4,902 | | |
4.000%, due 06/20/19 | | | 31,464 | | | | 33,274 | | |
GNMA TBA
2.500% | | | 2,000,000 | | | | 1,849,375 | | |
| 3.500% | | | 12,000,000 | | | | 12,217,500 | | |
| 4.000% | | | 12,000,000 | | | | 12,523,126 | | |
| 4.500% | | | 8,000,000 | | | | 8,486,250 | | |
| 5.500% | | | 4,000,000 | | | | 4,357,500 | | |
| 6.000% | | | 2,000,000 | | | | 2,201,875 | | |
| 6.500% | | | 1,000,000 | | | | 1,120,313 | | |
GNMA II TBA
3.000% | | | 7,000,000 | | | | 6,847,969 | | |
| 3.500% | | | 25,000,000 | | | | 25,437,500 | | |
| 4.000% | | | 16,000,000 | | | | 16,727,501 | | |
| 4.500% | | | 10,000,000 | | | | 10,651,562 | | |
| 5.000% | | | 17,000,000 | | | | 18,391,210 | | |
Total government national mortgage
association certificates
(cost—$179,633,068) | | | 179,340,956 | | |
| | | Face
amount | | Value | |
Federal home loan mortgage corporation
certificates*—25.49% | |
FHLMC
2.000%, due 07/01/281 | | $ | 2,000,000 | | | $ | 1,941,776 | | |
2.500%, due 07/01/281 | | | 11,000,000 | | | | 10,986,239 | | |
3.000%, due 04/01/43 | | | 1,000,000 | | | | 952,766 | | |
3.000%, due 07/01/431 | | | 18,000,000 | | | | 17,416,903 | | |
3.500%, due 09/01/32 | | | 1,071,781 | | | | 1,098,344 | | |
3.500%, due 07/01/431 | | | 33,000,000 | | | | 33,218,208 | | |
4.000%, due 01/01/37 | | | 1,080,980 | | | | 1,125,383 | | |
4.000%, due 07/01/43 | | | 389,318 | | | | 401,079 | | |
4.500%, due 09/01/40 | | | 19,258,340 | | | | 20,311,824 | | |
4.500%, due 04/01/411 | | | 2,780,167 | | | | 2,935,735 | | |
4.500%, due 04/01/41 | | | 322,992 | | | | 341,065 | | |
4.500%, due 05/01/41 | | | 570,626 | | | | 602,556 | | |
5.000%, due 11/01/27 | | | 22,727 | | | | 24,558 | | |
5.000%, due 10/01/29 | | | 672,626 | | | | 728,637 | | |
5.000%, due 09/01/33 | | | 589,159 | | | | 648,106 | | |
5.000%, due 01/01/34 | | | 121,147 | | | | 130,529 | | |
5.000%, due 06/01/34 | | | 36,741 | | | | 39,506 | | |
5.000%, due 04/01/35 | | | 62,916 | | | | 67,800 | | |
5.000%, due 05/01/35 | | | 460,931 | | | | 493,503 | | |
5.000%, due 07/01/35 | | | 2,717,681 | | | | 2,912,491 | | |
5.000%, due 08/01/35 | | | 131,295 | | | | 140,830 | | |
5.000%, due 10/01/35 | | | 106,744 | | | | 114,580 | | |
5.000%, due 12/01/35 | | | 31,047 | | | | 33,323 | | |
5.000%, due 06/01/37 | | | 200,622 | | | | 214,777 | | |
5.000%, due 09/01/38 | | | 2,663,468 | | | | 2,851,946 | | |
5.000%, due 06/01/39 | | | 206,097 | | | | 220,792 | | |
5.000%, due 08/01/39 | | | 92,207 | | | | 98,766 | | |
5.000%, due 03/01/40 | | | 22,400 | | | | 24,441 | | |
5.000%, due 07/01/40 | | | 495,836 | | | | 533,981 | | |
5.000%, due 08/01/40 | | | 187,019 | | | | 201,370 | | |
5.000%, due 09/01/40 | | | 188,736 | | | | 203,941 | | |
5.000%, due 11/01/40 | | | 652,365 | | | | 702,426 | | |
5.000%, due 02/01/41 | | | 1,316,076 | | | | 1,417,195 | | |
5.000%, due 03/01/41 | | | 91,817 | | | | 98,964 | | |
5.000%, due 04/01/41 | | | 3,483,776 | | | | 3,761,058 | | |
5.000%, due 05/01/41 | | | 706,639 | | | | 762,401 | | |
5.000%, due 06/01/41 | | | 161,339 | | | | 174,105 | | |
5.000%, due 07/01/41 | | | 142,246 | | | | 153,500 | | |
5.500%, due 06/01/28 | | | 7,164 | | | | 7,762 | | |
5.500%, due 02/01/32 | | | 5,969 | | | | 6,505 | | |
5.500%, due 12/01/32 | | | 7,125 | | | | 7,760 | | |
5.500%, due 02/01/33 | | | 153,475 | | | | 167,166 | | |
5.500%, due 05/01/33 | | | 5,593 | | | | 6,087 | | |
5.500%, due 06/01/33 | | | 563,055 | | | | 613,921 | | |
5.500%, due 12/01/33 | | | 184,681 | | | | 201,157 | | |
5.500%, due 12/01/34 | | | 160,690 | | | | 174,890 | | |
5.500%, due 06/01/35 | | | 2,895,525 | | | | 3,148,317 | | |
5.500%, due 07/01/35 | | | 19,012 | | | | 20,693 | | |
5.500%, due 10/01/35 | | | 843,618 | | | | 916,843 | | |
5.500%, due 12/01/35 | | | 400,601 | | | | 433,568 | | |
5.500%, due 06/01/36 | | | 1,678,041 | | | | 1,822,999 | | |
5.500%, due 12/01/36 | | | 3,457,743 | | | | 3,732,711 | | |
5.500%, due 03/01/37 | | | 383,696 | | | | 415,189 | | |
17
PACE Select Advisors Trust
PACE Government Securities Fixed Income Investments
Portfolio of investments—July 31, 2013
| | | Face
amount | | Value | |
Federal home loan mortgage corporation
certificates*—(concluded) | |
5.500%, due 07/01/37 | | $ | 159,947 | | | $ | 172,999 | | |
5.500%, due 10/01/37 | | | 22,184 | | | | 23,950 | | |
5.500%, due 04/01/38 | | | 622,180 | | | | 673,382 | | |
5.500%, due 05/01/38 | | | 89,460 | | | | 96,605 | | |
5.500%, due 12/01/38 | | | 14,744 | | | | 16,024 | | |
5.500%, due 01/01/39 | | | 263,642 | | | | 284,630 | | |
5.500%, due 09/01/39 | | | 746,703 | | | | 809,765 | | |
5.500%, due 02/01/40 | | | 41,556 | | | | 44,875 | | |
5.500%, due 03/01/40 | | | 24,184 | | | | 26,110 | | |
5.500%, due 05/01/40 | | | 541,799 | | | | 584,930 | | |
5.500%, due 02/01/41 | | | 126,761 | | | | 139,039 | | |
5.500%, due 03/01/41 | | | 571,416 | | | | 616,905 | | |
6.000%, due 11/01/37 | | | 5,692,766 | | | | 6,203,445 | | |
7.000%, due 08/01/25 | | | 641 | | | | 742 | | |
9.000%, due 04/01/25 | | | 34,027 | | | | 34,517 | | |
11.000%, due 09/01/15 | | | 351 | | | | 358 | | |
11.000%, due 10/01/15 | | | 107 | | | | 112 | | |
11.000%, due 12/01/15 | | | 1,794 | | | | 1,918 | | |
11.000%, due 06/01/19 | | | 320 | | | | 321 | | |
11.000%, due 09/01/20 | | | 450 | | | | 476 | | |
11.500%, due 01/01/16 | | | 1,364 | | | | 1,387 | | |
11.500%, due 01/01/18 | | | 4,559 | | | | 4,582 | | |
11.500%, due 06/01/19 | | | 15,275 | | | | 15,717 | | |
FHLMC ARM
2.262%, due 01/01/28 | | | 28,705 | | | | 30,412 | | |
2.267%, due 11/01/27 | | | 99,748 | | | | 106,069 | | |
2.342%, due 04/01/29 | | | 162,965 | | | | 172,863 | | |
2.349%, due 07/01/24 | | | 196,023 | | | | 199,074 | | |
2.357%, due 10/01/23 | | | 89,647 | | | | 95,235 | | |
2.407%, due 11/01/29 | | | 419,049 | | | | 446,353 | | |
2.408%, due 07/01/28 | | | 157,968 | | | | 167,808 | | |
2.416%, due 06/01/28 | | | 361,229 | | | | 384,361 | | |
2.449%, due 12/01/29 | | | 99,782 | | | | 106,316 | | |
2.572%, due 10/01/27 | | | 298,122 | | | | 318,027 | | |
2.576%, due 11/01/25 | | | 237,718 | | | | 253,831 | | |
2.583%, due 01/01/29 | | | 211,894 | | | | 226,286 | | |
2.591%, due 10/01/27 | | | 256,588 | | | | 274,166 | | |
2.750%, due 01/01/30 | | | 33,612 | | | | 33,766 | | |
2.965%, due 10/01/29 | | | 2,544 | | | | 2,628 | | |
FHLMC TBA
4.000% | | | 17,000,000 | | | | 17,634,845 | | |
Total federal home loan mortgage
corporation certificates
(cost—$149,431,489) | | | 149,965,801 | | |
Federal housing administration
certificates—0.13% | |
FHA GMAC
7.400%, due 02/01/212 | | | 279,245 | | | | 271,535 | | |
FHA Reilly
6.896%, due 07/01/20 | | | 490,233 | | | | 490,233 | | |
Total federal housing administration
certificates
(cost—$769,916) | | | 761,768 | | |
| | | Face
amount | | Value | |
Federal national mortgage association
certificates*—55.65% | |
FNMA
2.355%, due 03/01/23 | | $ | 4,889,643 | | | $ | 4,600,130 | | |
2.500%, due 05/01/28 | | | 1,400,000 | | | | 1,400,212 | | |
2.500%, due 06/01/28 | | | 2,000,001 | | | | 2,000,304 | | |
2.500%, due 07/01/28 | | | 9,000,398 | | | | 9,001,953 | | |
2.563%, due 02/01/23 | | | 1,690,935 | | | | 1,610,898 | | |
2.763%, due 06/01/232 | | | 4,164,333 | | | | 3,995,464 | | |
3.000%, due 12/01/42 | | | 1,000,000 | | | | 953,636 | | |
3.000%, due 07/01/43 | | | 6,000,000 | | | | 5,719,305 | | |
3.330%, due 07/01/22 | | | 3,886,000 | | | | 3,972,956 | | |
3.500%, due 11/01/25 | | | 1,480,770 | | | | 1,559,708 | | |
3.500%, due 03/01/42 | | | 966,121 | | | | 975,309 | | |
3.500%, due 12/01/42 | | | 3,841,008 | | | | 3,878,657 | | |
3.500%, due 03/01/43 | | | 1,978,646 | | | | 1,998,171 | | |
3.500%, due 05/01/43 | | | 6,962,719 | | | | 7,037,467 | | |
3.510%, due 08/01/232,3 | | | 12,346,258 | | | | 12,250,706 | | |
3.600%, due 08/01/23 | | | 817,000 | | | | 829,766 | | |
4.000%, due 06/01/19 | | | 82,652 | | | | 87,451 | | |
4.000%, due 03/01/19 | | | 109,659 | | | | 116,062 | | |
4.000%, due 07/01/25 | | | 71,685 | | | | 75,847 | | |
4.000%, due 08/01/25 | | | 182,882 | | | | 193,695 | | |
4.000%, due 09/01/25 | | | 183,688 | | | | 194,583 | | |
4.000%, due 10/01/25 | | | 42,047 | | | | 44,993 | | |
4.000%, due 11/01/25 | | | 479,744 | | | | 508,160 | | |
4.000%, due 01/01/26 | | | 865,238 | | �� | | 916,326 | | |
4.000%, due 02/01/26 | | | 3,250,871 | | | | 3,443,256 | | |
4.000%, due 03/01/26 | | | 2,766,182 | | | | 2,929,726 | | |
4.000%, due 04/01/26 | | | 6,192,413 | | | | 6,558,552 | | |
4.000%, due 05/01/39 | | | 305,443 | | | | 318,482 | | |
4.000%, due 09/01/39 | | | 709,172 | | | | 740,568 | | |
4.000%, due 11/01/40 | | | 811,598 | | | | 845,573 | | |
4.000%, due 03/01/41 | | | 1,634,546 | | | | 1,701,358 | | |
4.000%, due 12/01/41 | | | 2,005,886 | | | | 2,094,682 | | |
4.000%, due 07/01/42 | | | 3,116,734 | | | | 3,260,229 | | |
4.000%, due 07/01/421 | | | 8,058,060 | | | | 8,430,152 | | |
4.000%, due 09/01/42 | | | 12,000,000 | | | | 12,532,261 | | |
4.000%, due 10/01/42 | | | 9,000,000 | | | | 9,399,187 | | |
4.000%, due 07/01/43 | | | 317,034 | | | | 326,610 | | |
4.000%, due 08/01/43 | | | 2,301,740 | | | | 2,371,267 | | |
4.500%, due 03/01/23 | | | 24,184 | | | | 26,074 | | |
4.500%, due 04/01/391 | | | 10,972,889 | | | | 11,657,561 | | |
4.500%, due 09/01/39 | | | 121,182 | | | | 129,444 | | |
4.500%, due 07/01/40 | | | 477,723 | | | | 506,752 | | |
4.500%, due 07/01/41 | | | 112,467 | | | | 119,343 | | |
4.500%, due 08/01/41 | | | 2,000,000 | | | | 2,157,130 | | |
5.000%, due 03/01/23 | | | 14,803 | | | | 15,896 | | |
5.000%, due 05/01/23 | | | 269,178 | | | | 289,090 | | |
5.000%, due 09/01/23 | | | 1,163,967 | | | | 1,252,999 | | |
5.000%, due 07/01/24 | | | 1,635,578 | | | | 1,774,538 | | |
5.000%, due 03/01/25 | | | 73,056 | | | | 79,131 | | |
5.000%, due 09/01/25 | | | 1,267,558 | | | | 1,362,592 | | |
5.000%, due 07/01/33 | | | 632,331 | | | | 682,252 | | |
5.000%, due 03/01/34 | | | 4,391,165 | | | | 4,743,476 | | |
5.000%, due 10/01/34 | | | 628,387 | | | | 678,097 | | |
5.000%, due 12/01/34 | | | 513,330 | | | | 553,665 | | |
18
PACE Select Advisors Trust
PACE Government Securities Fixed Income Investments
Portfolio of investments—July 31, 2013
| | | Face
amount | | Value | |
Federal national mortgage association
certificates*—(continued) | |
5.000%, due 07/01/35 | | $ | 215,258 | | | $ | 231,986 | | |
5.000%, due 10/01/35 | | | 751,053 | | | | 811,158 | | |
5.000%, due 01/01/36 | | | 428,120 | | | | 461,902 | | |
5.000%, due 02/01/36 | | | 857,683 | | | | 924,525 | | |
5.000%, due 03/01/36 | | | 227,429 | | | | 245,649 | | |
5.000%, due 11/01/36 | | | 328,501 | | | | 353,806 | | |
5.000%, due 12/01/36 | | | 3,000,000 | | | | 3,233,139 | | |
5.000%, due 02/01/38 | | | 152,411 | | | | 164,387 | | |
5.000%, due 04/01/39 | | | 66,011 | | | | 71,154 | | |
5.000%, due 08/01/40 | | | 754,816 | | | | 813,561 | | |
5.000%, due 08/01/41 | | | 59,985 | | | | 65,037 | | |
5.000%, due 10/01/41 | | | 316,579 | | | | 343,239 | | |
5.500%, due 06/01/17 | | | 4,360 | | | | 4,457 | | |
5.500%, due 07/01/27 | | | 478,240 | | | | 525,730 | | |
5.500%, due 02/01/32 | | | 20,902 | | | | 22,816 | | |
5.500%, due 11/01/32 | | | 235,010 | | | | 257,540 | | |
5.500%, due 03/01/33 | | | 175,256 | | | | 191,804 | | |
5.500%, due 12/01/33 | | | 3,163 | | | | 3,504 | | |
5.500%, due 04/01/34 | | | 180,710 | | | | 198,729 | | |
5.500%, due 01/01/35 | | | 143,322 | | | | 155,993 | | |
5.500%, due 09/01/35 | | | 147,613 | | | | 160,809 | | |
5.500%, due 11/01/35 | | | 518,831 | | | | 565,212 | | |
5.500%, due 04/01/36 | | | 97,217 | | | | 106,210 | | |
5.500%, due 05/01/37 | | | 919,369 | | | | 1,016,759 | | |
5.500%, due 07/01/37 | | | 477,643 | | | | 528,280 | | |
5.500%, due 11/01/38 | | | 4,870 | | | | 5,300 | | |
5.500%, due 06/01/39 | | | 4,299,532 | | | | 4,755,313 | | |
5.500%, due 11/01/391 | | | 1,588,936 | | | | 1,756,369 | | |
6.000%, due 11/01/21 | | | 175,893 | | | | 195,723 | | |
6.000%, due 06/01/22 | | | 19,695 | | | | 20,651 | | |
6.000%, due 01/01/23 | | | 418,706 | | | | 458,719 | | |
6.000%, due 03/01/23 | | | 814,626 | | | | 897,201 | | |
6.000%, due 11/01/26 | | | 91,574 | | | | 100,236 | | |
6.000%, due 02/01/32 | | | 193,174 | | | | 210,914 | | |
6.000%, due 04/01/32 | | | 11,628 | | | | 12,849 | | |
6.000%, due 09/01/32 | | | 13,282 | | | | 14,676 | | |
6.000%, due 10/01/32 | | | 35,107 | | | | 38,393 | | |
6.000%, due 12/01/32 | | | 49,752 | | | | 54,976 | | |
6.000%, due 01/01/33 | | | 175,997 | | | | 194,475 | | |
6.000%, due 02/01/33 | | | 70,264 | | | | 77,626 | | |
6.000%, due 09/01/34 | | | 510,868 | | | | 570,624 | | |
6.000%, due 04/01/35 | | | 1,146 | | | | 1,259 | | |
6.000%, due 05/01/35 | | | 224,268 | | | | 245,925 | | |
6.000%, due 06/01/35 | | | 53,014 | | | | 58,225 | | |
6.000%, due 07/01/35 | | | 218,721 | | | | 240,291 | | |
6.000%, due 08/01/35 | | | 185,567 | | | | 203,828 | | |
6.000%, due 09/01/35 | | | 4,069 | | | | 4,470 | | |
6.000%, due 01/01/36 | | | 122,929 | | | | 137,321 | | |
6.000%, due 06/01/36 | | | 5,279 | | | | 5,781 | | |
6.000%, due 09/01/36 | | | 156,203 | | | | 172,745 | | |
6.000%, due 10/01/36 | | | 149,286 | | | | 163,480 | | |
6.000%, due 11/01/36 | | | 2,332 | | | | 2,578 | | |
6.000%, due 12/01/36 | | | 670,010 | | | | 746,801 | | |
6.000%, due 01/01/37 | | | 58,503 | | | | 64,173 | | |
6.000%, due 03/01/37 | | | 119,666 | | | | 132,386 | | |
| | | Face
amount | | Value | |
Federal national mortgage association
certificates*—(concluded) | | | |
6.000%, due 10/01/37 | | $ | 570,294 | | | $ | 623,406 | | |
6.000%, due 12/01/37 | | | 405,729 | | | | 443,515 | | |
6.000%, due 01/01/38 | | | 1,634,062 | | | | 1,786,241 | | |
6.000%, due 05/01/38 | | | 126,037 | | | | 137,920 | | |
6.000%, due 08/01/38 | | | 197,229 | | | | 215,627 | | |
6.000%, due 09/01/38 | | | 27,007 | | | | 29,526 | | |
6.000%, due 10/01/38 | | | 975,363 | | | | 1,067,955 | | |
6.000%, due 11/01/38 | | | 2,827,952 | | | | 3,111,102 | | |
6.000%, due 01/01/39 | | | 1,108,816 | | | | 1,212,234 | | |
6.000%, due 05/01/39 | | | 209,500 | | | | 229,082 | | |
6.000%, due 04/01/40 | | | 756,593 | | | | 827,054 | | |
6.000%, due 05/01/41 | | | 2,211,492 | | | | 2,417,830 | | |
6.500%, due 09/01/13 | | | 195 | | | | 196 | | |
6.500%, due 10/01/13 | | | 88 | | | | 88 | | |
6.500%, due 11/01/13 | | | 607 | | | | 609 | | |
6.500%, due 07/01/19 | | | 24,258 | | | | 26,007 | | |
6.500%, due 10/01/36 | | | 925,803 | | | | 1,009,899 | | |
6.500%, due 02/01/37 | | | 14,363 | | | | 16,562 | | |
6.500%, due 07/01/37 | | | 137,901 | | | | 153,304 | | |
6.500%, due 08/01/37 | | | 392,716 | | | | 438,179 | | |
6.500%, due 09/01/37 | | | 504,683 | | | | 581,951 | | |
6.500%, due 12/01/37 | | | 734,707 | | | | 816,741 | | |
6.500%, due 08/01/38 | | | 12,380 | | | | 14,280 | | |
6.500%, due 05/01/40 | | | 4,354,352 | | | | 4,909,678 | | |
7.500%, due 11/01/26 | | | 23,568 | | | | 24,001 | | |
8.000%, due 11/01/26 | | | 33,724 | | | | 37,932 | | |
9.000%, due 02/01/26 | | | 23,825 | | | | 27,494 | | |
10.500%, due 09/01/15 | | | 445 | | | | 446 | | |
10.500%, due 08/01/20 | | | 597 | | | | 611 | | |
10.500%, due 04/01/22 | | | 70 | | | | 71 | | |
11.000%, due 10/01/15 | | | 248 | | | | 250 | | |
11.000%, due 02/01/16 | | | 209 | | | | 209 | | |
FNMA ARM
1.369%, due 03/01/44 | | | 469,272 | | | | 485,301 | | |
1.750%, due 09/01/15 | | | 11,902 | | | | 11,928 | | |
1.770%, due 10/01/26 | | | 456,015 | | | | 467,673 | | |
1.770%, due 07/01/30 | | | 23,803 | | | | 24,518 | | |
2.049%, due 05/01/30 | | | 63,687 | | | | 66,890 | | |
2.239%, due 02/01/26 | | | 43,790 | | | | 45,948 | | |
2.337%, due 09/01/26 | | | 25,714 | | | | 26,857 | | |
2.414%, due 02/01/30 | | | 6,699 | | | | 6,709 | | |
2.417%, due 03/01/25 | | | 150,656 | | | | 159,669 | | |
2.649%, due 12/01/27 | | | 35,194 | | | | 37,555 | | |
FNMA TBA
2.000% | | | 7,000,000 | | | | 6,791,093 | | |
| 2.500% | | | 7,000,000 | | | | 6,994,532 | | |
| 3.000% | | | 51,500,000 | | | | 50,667,697 | | |
| 3.500% | | | 40,500,000 | | | | 40,823,438 | | |
| 4.000% | | | 2,500,000 | | | | 2,612,734 | | |
| 4.500%1 | | | 10,000,000 | | | | 10,640,625 | | |
| 5.000% | | | 11,000,000 | | | | 11,839,375 | | |
| 6.000% | | | 7,000,000 | | | | 7,656,797 | | |
Total federal national mortgage
association certificates
(cost—$327,162,571) | | | 327,421,735 | | |
19
PACE Select Advisors Trust
PACE Government Securities Fixed Income Investments
Portfolio of investments—July 31, 2013
| | | Face
amount | | Value | |
Collateralized mortgage obligations—12.57% | |
ARM Trust,
Series 2005-8, Class 3A21
2.776%, due 11/25/354 | | $ | 1,860,068 | | | $ | 1,459,793 | | |
Bear Stearns Asset Backed
Securities Trust,
Series 2003-AC5, Class A1
5.750%, due 10/25/335 | | | 1,784,267 | | | | 1,879,231 | | |
Series 2004-AC3, Class A2
6.000%, due 06/25/344 | | | 1,997,918 | | | | 2,105,608 | | |
Chevy Chase Mortgage
Funding Corp.,
Series 2004-1, Class A1
0.470%, due 01/25/354,6 | | | 195,403 | | | | 173,496 | | |
Countrywide Alternative Loan Trust,
Series 2006-0A2, Class A1
0.402%, due 05/20/464 | | | 3,534,839 | | | | 2,286,670 | | |
CSMC Trust,
Series 2013-5R, Class 1A1
0.440%, due 02/27/364,7 | | | 934,009 | | | | 873,068 | | |
FHLMC REMIC,*
Series 0023, Class KZ
6.500%, due 11/25/23 | | | 46,478 | | | | 52,622 | | |
Series 0159, Class H
4.500%, due 09/15/21 | | | 12,665 | | | | 13,193 | | |
Series 1003, Class H
0.941%, due 10/15/204 | | | 41,608 | | | | 41,967 | | |
Series 1349, Class PS
7.500%, due 08/15/22 | | | 2,442 | | | | 2,787 | | |
Series 1502, Class PX
7.000%, due 04/15/23 | | | 316,480 | | | | 353,693 | | |
Series 1534, Class Z
5.000%, due 06/15/23 | | | 154,409 | | | | 167,981 | | |
Series 1573, Class PZ
7.000%, due 09/15/23 | | | 48,735 | | | | 55,141 | | |
Series 1658, Class GZ
7.000%, due 01/15/24 | | | 24,876 | | | | 28,667 | | |
Series 1694, Class Z
6.500%, due 03/15/24 | | | 207,684 | | | | 235,559 | | |
Series 1775, Class Z
8.500%, due 03/15/25 | | | 5,894 | | | | 6,960 | | |
Series 2400, Class FQ
0.691%, due 01/15/324 | | | 445,899 | | | | 449,132 | | |
Series 2411, Class FJ
0.541%, due 12/15/294 | | | 40,408 | | | | 40,378 | | |
Series 3096, Class FL
0.591%, due 01/15/364 | | | 414,267 | | | | 416,772 | | |
Series 3153, Class UF
0.621%, due 05/15/364 | | | 395,943 | | | | 398,787 | | |
Series 3339, Class LI
6.289%, due 07/15/374,7,8 | | | 3,414,201 | | | | 433,465 | | |
Series 3442, Class MT
0.191%, due 07/15/344,7 | | | 306,276 | | | | 290,472 | | |
Series 3667, Class FW
0.741%, due 02/15/384 | | | 562,920 | | | | 568,149 | | |
Series 3671, Class FQ
1.041%, due 12/15/364 | | | 3,834,299 | | | | 3,878,950 | | |
| | | Face
amount | | Value | |
Collateralized mortgage
obligations—(continued) | |
Series 4037, Class PI
3.000%, due 04/15/277,8 | | $ | 8,191,470 | | | $ | 956,099 | | |
Series 4182, Class YI
2.500%, due 03/15/287,8 | | | 10,724,401 | | | | 1,232,905 | | |
FNMA REMIC,*
Trust 1987-002, Class Z
11.000%, due 11/25/17 | | | 84,767 | | | | 91,592 | | |
Trust 1988-007, Class Z
9.250%, due 04/25/18 | | | 106,862 | | | | 118,820 | | |
Trust 1992-129, Class L
6.000%, due 07/25/22 | | | 7,039 | | | | 7,796 | | |
Trust 1992-158, Class ZZ
7.750%, due 08/25/22 | | | 24,001 | | | | 27,304 | | |
Trust 1993-037, Class PX
7.000%, due 03/25/23 | | | 264,910 | | | | 299,433 | | |
Trust 1993-240, Class Z
6.250%, due 12/25/13 | | | 107 | | | | 108 | | |
Trust 1993-250, Class Z
7.000%, due 12/25/23 | | | 6,292 | | | | 6,527 | | |
Trust 1997-022, Class F
0.638%, due 03/25/274 | | | 282,425 | | | | 278,212 | | |
Trust 2002-060, Class F1
0.590%, due 06/25/324 | | | 180,645 | | | | 180,643 | | |
Trust 2005-088, Class A
0.340%, due 10/25/354 | | | 2,009,030 | | | | 1,955,626 | | |
Trust 2006-112, Class LF
0.740%, due 11/25/364 | | | 5,899,770 | | | | 5,942,933 | | |
Trust 2007-067, Class FB
0.510%, due 07/25/374 | | | 2,604,927 | | | | 2,610,272 | | |
Trust 2009-033, Class FB
1.010%, due 03/25/374 | | | 908,756 | | | | 922,573 | | |
Trust 2010-035, Class EF
0.740%, due 04/25/404 | | | 908,964 | | | | 917,569 | | |
Trust 2010-141, Class FA
0.690%, due 12/25/404 | | | 1,479,777 | | | | 1,485,934 | | |
Trust 2012-090, Class FB
0.630%, due 08/25/424 | | | 684,686 | | | | 689,647 | | |
Trust 2012-111, Class HS
3.508%, due 10/25/424,7 | | | 329,585 | | | | 288,079 | | |
Trust 2012-128, Class FK
0.540%, due 11/25/424 | | | 1,022,105 | | | | 1,022,418 | | |
Trust 2012-151, Class SB
5.707%, due 01/25/434,7 | | | 1,653,819 | | | | 1,487,097 | | |
Trust 2013-010, Class US
7.542%, due 02/25/434,7 | | | 881,846 | | | | 827,082 | | |
Trust 2013-014, Class MI
3.500%, due 07/25/427,8 | | | 1,669,577 | | | | 283,699 | | |
Trust 2013-028, Class YS
5.960%, due 07/25/424,7,8 | | | 2,069,946 | | | | 435,080 | | |
Trust 2013-030, Class GI
3.000%, due 01/25/437,8 | | | 6,702,369 | | | | 1,021,871 | | |
Trust 2013-044, Class ZG
3.500%, due 03/25/42 | | | 1,719,094 | | | | 1,632,076 | | |
Trust 2013-045, Class IK
3.000%, due 02/25/436,7 | | | 4,099,748 | | | | 599,905 | | |
20
PACE Select Advisors Trust
PACE Government Securities Fixed Income Investments
Portfolio of investments—July 31, 2013
| | | Face
amount | | Value | |
Collateralized mortgage
obligations—(continued) | |
Trust G92-040, Class ZC
7.000%, due 07/25/22 | | $ | 29,508 | | | $ | 32,854 | | |
Trust G94-006, Class PJ
8.000%, due 05/17/24 | | | 37,822 | | | | 43,970 | | |
GNMA REMIC,
Trust 2000-009, Class FH
0.692%, due 02/16/304 | | | 31,568 | | | | 31,886 | | |
Trust 2000-035, Class F
0.742%, due 12/16/254 | | | 191,706 | | | | 193,895 | | |
Trust 2007-002, Class BO
0.000%, due 06/20/357 | | | 330,161 | | | | 290,687 | | |
Trust 2007-018, Class CO
0.000%, due 03/20/357 | | | 29,169 | | | | 22,739 | | |
Trust 2010-H01, Class FA
1.014%, due 01/20/604 | | | 5,429,460 | | | | 5,465,930 | | |
Indymac Index Mortgage Loan Trust,
Series 2005-AR2, Class 2A1A
0.510%, due 02/25/354 | | | 936,201 | | | | 786,978 | | |
JPMorgan Alternative Loan Trust,
Series 2008-R4, Class 2A1
0.686%, due 06/27/374,6 | | | 3,071,201 | | | | 2,573,203 | | |
JPMorgan Chase Commercial
Mortgage Securities Corp.,
Series 2007-FL1A, Class A1
0.566%, due 07/15/194,6 | | | 639,749 | | | | 622,810 | | |
LB Commercial Conduit
Mortgage Trust,
Series 2007-C3, Class A4
5.884%, due 07/15/444 | | | 2,500,000 | | | | 2,832,090 | | |
MLCC Mortgage Investors, Inc.,
Series 2004-1, Class 2A2
2.237%, due 12/25/344 | | | 738,886 | | | | 747,873 | | |
Mortgage Equity Conversion
Asset Trust,
Series 2006-SFG3, Class A
0.650%, due 10/25/414,6 | | | 1,336,122 | | | | 1,090,609 | | |
Series 2007-FF3, Class A
0.630%, due 05/25/424,6 | | | 5,723,404 | | | | 4,686,037 | | |
NCUA Guaranteed Notes,
Series 2011-R4, Class 1A
0.575%, due 03/06/204 | | | 2,505,745 | | | | 2,499,481 | | |
RBSSP, Resecuritization
Trust Certificate,
Series 2009-6, Class 18A1
0.690%, due 12/26/364,6 | | | 2,323,232 | | | | 2,248,898 | | |
Sequoia Mortgage Trust,
Series 5, Class A
0.892%, due 10/19/264 | | | 274,313 | | | | 270,146 | | |
Structured ARM Loan,
Series 2007-4, Class 1A2
0.410%, due 05/25/374 | | | 449,149 | | | | 314,079 | | |
| | | Face
amount | | Value | |
Collateralized mortgage
obligations—(concluded) | |
Structured Asset Mortgage
Investments, Inc.,
Series 2006-AR3, Class 11A1
0.400%, due 04/25/364 | | $ | 1,340,225 | | | $ | 927,242 | | |
Series 2007-AR5, Class A2
0.740%, due 09/25/474 | | | 7,514,032 | | | | 1,902,575 | | |
Washington Mutual Commercial
Mortgage Securities Trust,
Series 2007-SL3, Class A1A
5.799%, due 03/23/454,7 | | | 1,653,679 | | | | 1,707,424 | | |
Washington Mutual Mortgage
Pass-Through Certificates,
Series 2003-AR9, Class 1A6
2.429%, due 09/25/334 | | | 2,443,997 | | | | 2,444,935 | | |
Series 2003-AR9, Class 2A
2.455%, due 09/25/334 | | | 670,808 | | | | 666,984 | | |
Total collateralized mortgage
obligations
(cost—$77,320,688) | | | 73,937,166 | | |
Asset-backed securities—1.97% | |
Countrywide Asset-Backed
Certificates,
Series 2005-13, Class 3AV3
0.440%, due 04/25/364 | | | 669,992 | | | | 650,649 | | |
EMC Mortgage Loan Trust,
Series 2003-A, Class A2
0.940%, due 08/25/404,6 | | | 206,202 | | | | 185,882 | | |
Green Tree Financial Corp.,
Series 1998-2, Class A5
6.240%, due 12/01/284 | | | 33,654 | | | | 34,688 | | |
Renaissance Home Equity Loan Trust,
Series 2003-2, Class A
0.630%, due 08/25/334 | | | 347,571 | | | | 318,831 | | |
SLM Student Loan Trust,
Series 2008-9, Class A
1.766%, due 04/25/234 | | | 4,690,456 | | | | 4,824,842 | | |
Series 2009-D, Class A
3.500%, due 08/17/434,6 | | | 3,461,329 | | | | 3,259,966 | | |
Series 2010-A, Class 2A
3.441%, due 05/16/444,6 | | | 1,615,872 | | | | 1,671,337 | | |
Specialty Underwriting &
Residential Financing,
Series 2003-BC1, Class A
0.870%, due 01/25/344 | | | 57,784 | | | | 51,405 | | |
Stone Tower CLO Ltd.,
Series 2007-6A, Class A1
0.498%, due 04/17/214,6 | | | 600,000 | | | | 577,422 | | |
Total asset-backed securities
(cost—$11,927,615) | | | 11,575,022 | | |
21
PACE Select Advisors Trust
PACE Government Securities Fixed Income Investments
Portfolio of investments—July 31, 2013
| | | Face
amount | | Value | |
Stripped mortgage-backed securities—2.21% | |
FHLMC Multifamily Structured
Pass-Through Certificates,*
Series K005, Class AX
1.382%, due 11/25/194,6,8 | | $ | 24,284,103 | | | $ | 1,774,804 | | |
Series K006, Class AX1
1.044%, due 01/25/204,7,8 | | | 13,963,127 | | | | 753,939 | | |
Series K014, Class X1
1.264%, due 04/25/214,7,8 | | | 8,126,802 | | | | 626,316 | | |
Series K027, Class X1
0.843%, due 01/25/234,7,8 | | | 7,096,619 | | | | 427,472 | | |
Series K712, Class X1
1.395%, due 11/25/194,7,8 | | | 4,693,016 | | | | 328,117 | | |
Series KAIV, Class X1
1.386%, due 06/25/214,7,8 | | | 4,924,224 | | | | 384,424 | | |
FHLMC REMIC,*
Series 0013, Class B
7.000%, due 06/25/237,8 | | | 114,058 | | | | 18,787 | | |
Series 2136, Class GD
7.000%, due 03/15/297,8 | | | 8,065 | | | | 1,001 | | |
Series 2178, Class PI
7.500%, due 08/15/296,8 | | | 44,830 | | | | 6,799 | | |
FNMA Aces,
Trust 2013-M5, Class X2*
2.402%, due 01/25/224,7,8 | | | 2,290,297 | | | | 317,371 | | |
GNMA REMIC,
Trust 2011-92, Class IX
1.382%, due 11/16/444,7,8 | | | 32,021,447 | | | | 2,515,829 | | |
KGS Alpha SBA,
Series 2012
0.967%, due 04/25/384,7,8 | | | 92,140,849 | | | | 4,943,954 | | |
WF-RBS Commercial Mortgage Trust,
Series 2011-C4, Class XA
0.827%, due 06/15/444,7,8 | | | 28,180,169 | | | | 925,211 | | |
Total stripped mortgage-backed
securities
(cost—$11,979,554) | | | 13,024,024 | | |
Short-term US government and agency
obligations—23.18% | |
Federal Home Loan Bank
0.060%, due 08/30/139 | | | 47,300,000 | | | | 47,297,714 | | |
0.062%, due 08/30/139 | | | 13,000,000 | | | | 12,999,351 | | |
0.063%, due 08/30/139 | | | 400,000 | | | | 399,980 | | |
0.070%, due 09/04/139 | | | 5,000,000 | | | | 4,999,669 | | |
0.070%, due 09/06/139 | | | 900,000 | | | | 899,937 | | |
0.070%, due 10/02/139 | | | 4,500,000 | | | | 4,499,457 | | |
0.081%, due 10/04/139 | | | 2,900,000 | | | | 2,899,582 | | |
0.085%, due 09/13/139 | | | 2,700,000 | | | | 2,699,726 | | |
Federal Home Loan Mortgage Corp.
0.080%, due 09/16/139 | | | 7,900,000 | | | | 7,899,192 | | |
0.160%, due 01/14/149 | | | 5,800,000 | | | | 5,798,127 | | |
| | | Face
amount | | Value | |
Short-term US government and agency
obligations—(concluded) | | | |
US Treasury Bills
0.035%, due 10/24/139 | | $ | 15,200,000 | | | $ | 15,198,759 | | |
0.067%, due 10/10/139 | | | 30,800,000 | | | | 30,797,355 | | |
Total short-term US government
and agency obligations
(cost—$136,386,471) | | | 136,388,849 | | |
Repurchase agreement—0.13% | | | |
Repurchase agreement dated
07/31/13 with State Street Bank and
Trust Co., 0.010% due 08/01/13,
collateralized by $34,057 Federal
Home Loan Mortgage Corp.
obligations, 1.960% due 11/07/22,
$785,077 Federal National Mortgage
Association obligations,
2.140% to 2.170% due 11/07/22
and $25,815 US Treasury Notes,
0.250% to 0.750%
due 10/31/13 to 12/15/13;
(value—$794,589);
proceeds: $779,000
(cost—$779,000) | | | 779,000 | | | | 779,000 | | |
Total investments before
investments sold short
(cost—$896,403,529)—151.97% | | | 894,161,887 | | |
Investments sold short—(18.18)% | | | |
FHLMC TBA*
2.000% | | | (2,000,000 | ) | | | (1,938,750 | ) | |
| 2.500% | | | (11,000,000 | ) | | | (10,975,938 | ) | |
| 3.000% | | | (13,000,000 | ) | | | (12,557,188 | ) | |
| 3.500% | | | (33,000,000 | ) | | | (33,180,470 | ) | |
| 4.500% | | | (1,000,000 | ) | | | (1,054,219 | ) | |
FNMA TBA*
4.000% | | | (8,000,000 | ) | | | (8,313,750 | ) | |
| 4.500% | | | (18,000,000 | ) | | | (19,071,562 | ) | |
| 5.500% | | | (1,000,000 | ) | | | (1,089,062 | ) | |
GNMA TBA
3.000% | | | (5,000,000 | ) | | | (4,892,969 | ) | |
| 5.000% | | | (6,000,000 | ) | | | (6,474,140 | ) | |
GNMA II TBA
2.500% | | | (8,000,000 | ) | | | (7,397,500 | ) | |
Total investments sold short
(proceeds—$106,647,305)—(18.18)% | | | (106,945,548 | ) | |
Liabilities in excess of
other assets—(33.79)% | | | | | (198,826,294 | ) | |
Net assets—100.00% | | | | $ | 588,390,045 | | |
22
PACE Select Advisors Trust
PACE Government Securities Fixed Income Investments
Portfolio of investments—July 31, 2013
For a listing of defined portfolio acronyms that are used throughout the Portfolio of investments as well as the tables that follow, please refer to page 218.
Aggregate cost for federal income tax purposes before investments sold short was $896,800,496; and net unrealized depreciation consisted of:
Gross unrealized appreciation | | $ | 5,614,366 | | |
Gross unrealized depreciation | | | (8,252,975 | ) | |
Net unrealized depreciation | | $ | (2,638,609 | ) | |
Fair valuation summary
The following is a summary of the fair valuations according to the inputs used as of July 31, 2013 in valuing the Portfolio's investments:
| | Unadjusted
quoted prices in
active markets for
identical investments
(Level 1) | | Other significant
observable inputs
(Level 2) | | Unobservable
inputs
(Level 3) | | Total | |
US government obligations | | $ | — | | | $ | 967,566 | | | $ | — | | | $ | 967,566 | | |
Government national mortgage association certificates | | | — | | | | 179,340,956 | | | | — | | | | 179,340,956 | | |
Federal home loan mortgage corporation certificates | | | — | | | | 149,965,801 | | | | — | | | | 149,965,801 | | |
Federal housing administration certificates | | | — | | | | — | | | | 761,768 | | | | 761,768 | | |
Federal national mortgage association certificates | | | — | | | | 315,171,029 | | | | 12,250,706 | | | | 327,421,735 | | |
Collateralized mortgage obligations | | | — | | | | 62,694,590 | | | | 11,242,576 | | | | 73,937,166 | | |
Asset-backed securities | | | — | | | | 11,575,022 | | | | — | | | | 11,575,022 | | |
Stripped mortgage-backed securities | | | — | | | | 8,080,070 | | | | 4,943,954 | | | | 13,024,024 | | |
Short-term US government and agency obligations | | | — | | | | 136,388,849 | | | | — | | | | 136,388,849 | | |
Repurchase agreement | | | — | | | | 779,000 | | | | — | | | | 779,000 | | |
US government agency securities sold short | | | — | | | | (106,945,548 | ) | | | — | | | | (106,945,548 | ) | |
Total | | $ | — | | | $ | 758,017,335 | | | $ | 29,199,004 | | | $ | 787,216,339 | | |
At July 31, 2013, there were no transfers between Level 1 and Level 2.
23
PACE Select Advisors Trust
PACE Government Securities Fixed Income Investments
Portfolio of investments—July 31, 2013
The following is a rollforward of the Portfolio's investments that were valued using unobservable inputs (Level 3) for the year ended July 31, 2013:
| | Federal
housing
administration
certificates | | Federal
national
mortgage
association
certificates | | Collateralized
mortgage
obligations | | Stripped
mortgage-
backed
securities | | Total | |
Beginning balance | | $ | 875,919 | | | $ | — | | | $ | 17,604,764 | | | $ | 4,132,835 | | | $ | 22,613,518 | | |
Purchases | | | — | | | | 12,353,974 | | | | 4,382 | | | | 10,508,856 | | | | 22,867,212 | | |
Sales | | | (111,308 | ) | | | — | | | | (6,485,996 | ) | | | (5,254,428 | ) | | | (11,851,732 | ) | |
Accrued discounts/(premiums) | | | (251 | ) | | | — | | | | 100,553 | | | | (1,463,430 | ) | | | (1,363,128 | ) | |
Total realized gain/(loss) | | | — | | | | — | | | | (1,510,940 | ) | | | — | | | | (1,510,940 | ) | |
Net change in unrealized appreciation/depreciation | | | (2,592 | ) | | | (103,268 | ) | | | 1,529,813 | | | | 461,161 | | | | 1,885,114 | | |
Transfers into Level 3 | | | — | | | | — | | | | — | | | | — | | | | — | | |
Transfers out of Level 3 | | | — | | | | — | | | | — | | | | (3,441,040 | ) | | | (3,441,040 | ) | |
Ending balance | | $ | 761,768 | | | $ | 12,250,706 | | | $ | 11,242,576 | | | $ | 4,943,954 | | | $ | 29,199,004 | | |
The change in net unrealized appreciation/depreciation relating to the Level 3 investments held at July 31, 2013 was $86,814. Transfers out of Level 3 represent the value at the end of the period. At July 31, 2013, securities were transferred from Level 3 to Level 2 as the valuation is based on observable inputs from an established pricing source.
Portfolio footnotes
* On September 7, 2008, the Federal Housing Finance Agency placed the Federal National Mortgage Association and the Federal Home Loan Mortgage Corporation into conservatorship, and the US Treasury guaranteed the debt issued by those organizations.
1 Entire amount designated as collateral for investments sold short.
2 Security is being fair valued by a valuation committee under the direction of the board of trustees.
3 Security purchased on a when-issued basis. When issued refers to a transaction made conditionally because a security, although authorized, has not yet been issued.
4 Variable or floating rate security. The interest rate shown is the current rate as of July 31, 2013 and changes periodically.
5 Step bond that converts to the noted fixed rate at a designated future date.
6 Security exempt from registration pursuant to Rule 144A under the Securities Act of 1933. These securities, which represent 2.81% of net assets as of July 31, 2013, are considered liquid and may be resold in transactions exempt from registration, normally to qualified institutional buyers.
7 Illiquid investment representing 4.13% of net assets as of July 31, 2013.
8 Interest Only Security. This security entitles the holder to receive interest payments from an underlying pool of mortgages. The risk associated with this security is related to the speed of the principal paydowns. High prepayments would result in a smaller amount of interest being received and cause the yield to decrease. Low prepayments would result in a greater amount of interest being received and cause the yield to increase.
9 Rate shown is the discount rate at date of purchase.
See accompanying notes to financial statements.
24
PACE Select Advisors Trust
PACE Intermediate Fixed Income Investments
Performance
For the 12 months ended July 31, 2013, the Portfolio's Class P shares declined 0.68% before the deduction of the maximum PACE Select program fee. (Class P shares declined 2.65% after the deduction of the maximum PACE Select program fee for the same 12-month period.) In comparison, the Barclays US Intermediate Government/Credit Index (the "benchmark") declined 0.37%, and the Lipper Intermediate Investment Grade Debt Funds2 category posted a median decline of 0.96%. (Returns for all share classes over various time periods are shown in the "Performance at a glance" table on page 28. Please note that the returns shown do not reflect the deduction of taxes that a shareholder would pay on Portfolio distributions or the redemption of Portfolio shares.) For a detailed commentary on the market environment in general during the reporting period, please refer to page 2.
Sub-Advisor's comments1
(Please note that while the Sub-Advisor outperformed the benchmark on a gross of fees basis, the Portfolio underperformed net of fees, as reported under "Performance." As stated in footnote one, the comments that follow address performance on a gross of fees basis.)
The Portfolio outperformed its benchmark during the reporting period. The largest contributor to performance was the Portfolio's security selection in the corporate bond market. A preference for higher-beta securities and financials over industrials proved to be beneficial, as investor risk appetite was generally solid. (Beta is a measure of volatility or risk relative to the market as a whole.) Also contributing to performance was the Portfolio's overweight to asset-backed securities ("ABS") and its allocation to high yield bonds, both of which benefited from investor demand for higher-yielding assets. Lastly, duration positioning contributed to performance, particularly during the last three months of the reporting period. In particular, the Portfolio's short duration position proved beneficial, given rising interest rates that were triggered by statements from the Federal Reserve Board following its policy meetings in May and June. The Portfolio's underweight to investment grade corporate bonds detracted from performance, as they largely outperformed government securities during the 12 months.
As volatility has been declining for several years, many investors seem convinced that the market could again experience the extremely low levels seen during 2006 and 2007. We believe that not only is this now unlikely, but that the reversal of this trend has significant implications for investors. Higher volatility is not beneficial for risk
PACE Select Advisors Trust – PACE Intermediate Fixed Income Investments
Investment Sub-Advisor:
BlackRock Financial Management, Inc. ("BlackRock")
Portfolio Managers:
David Antonelli and Brian Weinstein
Objective:
Current income, consistent with reasonable stability of principal
Investment process:
The Portfolio invests primarily in fixed income securities. BlackRock decides to buy specific bonds based on its credit analysis and review. BlackRock strives to add value by controlling the Portfolio's duration within a narrow band relative to the Barclays Capital US Intermediate Government/Credit Index. To accomplish this, BlackRock employs an analytical process that involves evaluating macroeconomic trends, technical market factors, yield-curve exposure and market volatility. Once BlackRock establishes the investment themes on duration, yield curve exposure, convexity, sector weighting, credit quality and liquidity, the Portfolio's investments are diversified by sector, subsector and security.
1 All Sub-Advisors discuss performance on a gross of fees basis—meaning that no fees or expenses are reflected in their sleeves'/sleeve's performance. Alternately, Portfolio performance is shown net of fees, which does factor in fees and expenses associated with the Portfolio.
2 During the reporting period, as per Lipper, PACE Intermediate Fixed Income Fund was reclassified from Short-Intermediate Investment Grade Debt Funds to Intermediate Investment Grade Debt Funds.
25
PACE Select Advisors Trust
PACE Intermediate Fixed Income Investments
Sub-Advisor's comments – concluded
assets (non-Treasuries), as bid-ask spreads widen and the likelihood of a breakout of higher interest rates increases. From a portfolio construction standpoint, we continue to anticipate higher US Treasury rates and wider credit spreads. With volatility continuing to move higher, the re-pricing of most risk assets has not moved prices from rich to fair, but rather, from rich to just slightly less rich. We believe that shorter-maturity debt and 30-year debt are cheap relative to assets in the middle of the yield curve. The front end of the curve is self-liquidating, as it matures before there is any real danger of rate hikes. In contrast, 30-year debt will be bought by pension funds as rates rise and they look to match their cash flows through liability-driven investing. In this context, the Portfolio has active allocations to predominantly short-dated securitized sectors and high yield bonds, coupled with an underweight to investment grade corporate bonds.
We used a number of derivatives instruments during the reporting period. Futures were used to manage duration and yield curve exposures of the Portfolio, while interest rate swaps were utilized to manage the Portfolio's overall duration and spread duration. Foreign exchange forward contracts were used to hedge foreign currency risk when buying non-US dollar-denominated bonds. Furthermore, the Portfolio used these forward contracts to opportunistically express views on certain currencies. Finally, credit default swaps were used to manage the credit risk of corporate bonds held in the Portfolio. Overall, the use of these derivatives positively contributed to performance during the reporting period.
Special considerations
The Portfolio may be appropriate for long-term investors seeking current income and a reasonable stability of principal. Investors should be able to withstand short-term fluctuations in the fixed income markets. The value of the Portfolio changes every day and can be affected by changes in interest rates, general market conditions and other political, social and economic developments, as well as specific matters relating to the companies in whose securities the Portfolio invests. It is important to note that an investment in the Portfolio is only one component of a balanced investment plan.
26
PACE Select Advisors Trust
PACE Intermediate Fixed Income Investments
Illustration of an assumed investment of $10,000 in Class P shares of the Portfolio (unaudited)
The following graph depicts the performance of PACE Intermediate Fixed Income Investments Class P shares versus the Barclays US Intermediate Government/Credit Index over the 10 years ended July 31, 2013. The performance of the other classes will vary based upon the different class specific expenses and sales charges. The performance provided does not reflect the deduction of taxes that a shareholder would pay on Portfolio distributions or the redemption of Portfolio shares. Past performance is no guarantee of future results. Share price and returns will vary with market conditions; investors may realize a gain or loss upon redemption. It is important to note that PACE Intermediate Fixed Income Investments is a professionally managed portfolio while the Index is not available for investment and is unmanaged. The comparison is shown for illustration purposes only.
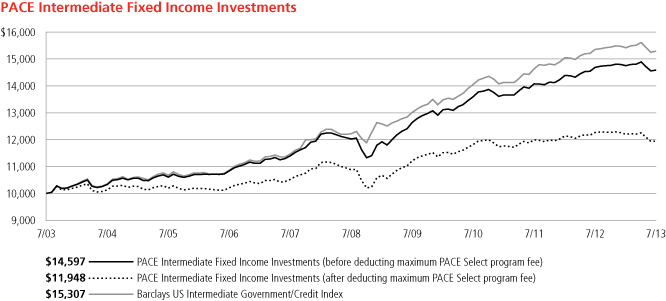
27
PACE Select Advisors Trust
PACE Intermediate Fixed Income Investments
Performance at a glance (unaudited)
Average annual total returns for periods ended 07/31/13 | | 1 year | | 5 years | | 10 years | |
Before deducting maximum sales charge or PACE Select program fee | |
Class A1 | | | (0.93 | )% | | | 3.68 | % | | | 3.60 | % | |
Class C2 | | | (1.34 | )% | | | 3.18 | % | | | 3.07 | % | |
Class Y3 | | | (0.68 | )% | | | 3.95 | % | | | 3.86 | % | |
Class P4 | | | (0.68 | )% | | | 3.94 | % | | | 3.85 | % | |
After deducting maximum sales charge or PACE Select program fee | |
Class A1 | | | (5.41 | )% | | | 2.74 | % | | | 3.12 | % | |
Class C2 | | | (2.08 | )% | | | 3.18 | % | | | 3.07 | % | |
Class P4 | | | (2.65 | )% | | | 1.88 | % | | | 1.80 | % | |
Barclays US Intermediate Government/Credit Index5 | | | (0.37 | )% | | | 4.60 | % | | | 4.35 | % | |
Lipper Intermediate Investment Grade Debt Funds median6 | | | (0.96 | )% | | | 5.78 | % | | | 4.67 | % | |
Lipper Short-Intermediate Investment Grade Debt Funds median6 | | | 0.03 | % | | | 4.46 | % | | | 3.66 | % | |
Average annual total returns for periods ended June 30, 2013, after deduction of the maximum sales charge or PACE Select program fee, were as follows: Class A—1-year period, (4.72)%; 5-year period, 2.58%; 10-year period, 2.78%; Class C—1-year period, (1.40)%; 5-year period, 3.03%; 10-year period, 2.74%; Class Y—1-year period, 0.10%; 5-year period, 3.81%; 10-year period, 3.53%; Class P—1-year period, (1.89)%; 5-year period, 1.75%; 10-year period, 1.48%.
The annualized gross and net expense ratios, respectively, for each class of shares as in the November 28, 2012 prospectuses, were as follows: Class A—1.00% and 0.93%; Class C—1.51% and 1.43%; Class Y—0.88% and 0.68%; and Class P—0.74% and 0.68%. Net expenses reflect fee waivers and/or expense reimbursements, if any, pursuant to an agreement that is in effect to cap the expenses. The Portfolio and UBS Global Asset Management (Americas) Inc. ("UBS Global AM") have entered into a written fee waiver/expense reimbursement agreement pursuant to which UBS Global AM is contractually obligated to waive its management fees and/or reimburse expenses so that the Portfolio's ordinary total operating expenses of each class through November 30, 2013 (excluding dividend expense, borrowing costs, and interest expense relating to short sales, and expenses attributable to investment in other investment companies, interest, taxes, brokerage commissions and extraordinary expenses) would not exceed Class A—0.93%; Class C—1.43%; Class Y—0.68%; and Class P—0.68%. The Portfolio has agreed to repay UBS Global AM for any waived fees/reimbursed expenses to the extent that it can do so over the following three fiscal years without causing the Portfolio's expenses in any of those three years to exceed these expense caps. The fee waiver/expense reimbursement agreement may be terminated by the Portfolio's board at any time and also will terminate automatically upon the expiration or termination of the Portfolio's advisory contract with UBS Global AM. Upon termination of the agreement, however, UBS Global AM's three year recoupment rights will survive.
1 Maximum sales charge for Class A shares is 4.5%. Class A shares bear ongoing 12b-1 service fees.
2 Maximum contingent deferred sales charge for Class C shares is 0.75% imposed on redemptions and is reduced to 0% after one year. Class C shares bear ongoing 12b-1 service and distribution fees. Prior to September 30, 2003, Class C shares were subject to a maximum front-end sales charge of 1%; this front-end sales charge is not reflected in the average annual total returns presented for the Class C shares shown above.
3 The Portfolio offers Class Y shares to a limited group of eligible investors, including certain qualifying retirement plans. Class Y shares do not bear initial or contingent deferred sales charges or ongoing 12b-1 service and distribution fees.
4 Class P shares do not bear initial or contingent deferred sales charges or ongoing 12b-1 service and distribution fees, but are subject to a maximum annual PACE Select program fee of 2% of the value of Class P shares. Prior to June 14, 2010, the maximum annual PACE Select program fee was 1.5% of the value of Class P shares; however, the current maximum annual PACE Select program fee of 2% is reflected in the performance returns throughout all periods in the average annual total returns presented for the Class P shares shown above.
5 The Barclays US Intermediate Government/Credit Index is an unmanaged subset of the Barclays US Government/Credit Index covering all investment grade issues with maturities from one up to (but not including) 10 years. The average-weighted maturity is typically between four and five years. Investors should note that indices do not reflect the deduction of fees and expenses.
6 On June 19, 2013, Lipper changed the peer group classification for PACE Intermediate Fixed Income Investments from the Lipper Short-Intermediate Investment Grade Debt Funds category to the Lipper Intermediate Investment Grade Debt Funds category.
If an investor sells or exchanges shares less than 90 days after purchase, a redemption fee of 1.00% of the amount sold or exchanged will be deducted at the time of the transaction, except as noted otherwise in the prospectuses.
Past performance does not predict future performance, and the performance information provided does not reflect the deduction of taxes that a shareholder would pay on Portfolio distributions or the redemption of Portfolio shares. The return and principal value of an investment will fluctuate, so that an investor's shares, when redeemed, may be worth more or less than their original cost. Performance results assume reinvestment of all dividends and capital gain distributions at net asset value on the ex-dividend dates. Current performance may be higher or lower than the performance data quoted. For month-end performance figures, please visit http://globalam-us.ubs.com/corpweb/performance.do.
Lipper peer group data calculated by Lipper Inc.; used with permission. The Lipper median is the return of the fund that places in the middle of a Lipper peer group.
28
PACE Select Advisors Trust
PACE Intermediate Fixed Income Investments
Portfolio statistics (unaudited)
Characteristics | | 07/31/13 | |
Weighted average duration | | | 3.8 yrs. | | |
Weighted average maturity | | | 4.4 yrs. | | |
Average coupon | | | 1.89 | % | |
Net assets (mm) | | $ | 450.6 | | |
Number of holdings | | | 225 | | |
Portfolio composition1 | | 07/31/13 | |
Bonds and notes | | | 101.1 | % | |
Preferred stock | | | 0.1 | | |
Options, futures, swaps and forward foreign currency contracts | | | 0.4 | | |
Cash equivalents and other assets less liabilities | | | (1.6 | ) | |
Total | | | 100.0 | % | |
Quality diversification1 | | 07/31/13 | |
US government and agency securities | | | 64.9 | % | |
AAA | | | 6.1 | | |
AA | | | 3.5 | | |
A | | | 8.7 | | |
BBB and below/non-rated | | | 17.9 | | |
Preferred stock | | | 0.1 | | |
Options, futures, swaps and forward foreign currency contracts | | | 0.4 | | |
Cash equivalents and other assets less liabilities | | | (1.6 | ) | |
Total | | | 100.0 | % | |
Asset allocation1 | | 07/31/13 | |
US government obligations | | | 59.0 | % | |
Corporate notes | | | 24.5 | | |
Asset-backed securities | | | 6.3 | | |
US government agency mortgage pass-through certificates | | | 5.6 | | |
Collateralized mortgage obligations | | | 5.3 | | |
Non-US government obligations | | | 0.4 | | |
Options, futures, swaps and forward foreign currency contracts | | | 0.4 | | |
Preferred stock | | | 0.1 | | |
Cash equivalents and other assets less liabilities | | | (1.6 | ) | |
Total | | | 100.0 | % | |
1 Weightings represent percentages of the Portfolio's net assets as of July 31, 2013. The Portfolio is actively managed and its composition will vary over time. Credit quality ratings shown are based on the ratings assigned to portfolio holdings by Standard & Poor's Ratings Group, an independent rating agency.
29
PACE Select Advisors Trust
PACE Intermediate Fixed Income Investments
Portfolio of investments—July 31, 2013
| | | Face
amount1 | | Value | |
US government obligations—59.04% | | | |
| US Treasury Inflation Index Bonds (TIPS)
0.625%, due 02/15/43 | | | | 1,504,513 | | | $ | 1,248,040 | | |
| US Treasury Notes
0.250%, due 07/31/15 | | | | 60,555,000 | | | | 60,484,030 | | |
| | 0.625%, due 07/15/16 | | | | 104,575,000 | | | | 104,664,830 | | |
| | 1.000%, due 05/31/18 | | | | 9,600 | | | | 9,447 | | |
| | 1.250%, due 07/31/18 | | | | 43,990,000 | | | | 43,955,644 | | |
| | 1.250%, due 02/29/20 | | | | 35,595,000 | | | | 34,140,624 | | |
| | 1.375%, due 06/30/18 | | | | 4,995,000 | | | | 4,996,169 | | |
| | 1.750%, due 05/15/23 | | | | 11,012,800 | | | | 10,214,372 | | |
| | 1.875%, due 07/31/20 | | | | 3,625,000 | | | | 3,620,751 | | |
| US Treasury Principal STRIPS
2.198%, due 11/15/41 | | | | 2,275,000 | | | | 771,277 | | |
| | 2.287%, due 02/15/41 | | | | 1,105,000 | | | | 388,657 | | |
| | 3.125%, due 02/15/43 | | | | 4,810,000 | | | | 1,542,702 | | |
| Total US government obligations
(cost—$267,421,480) | | | | | | 266,036,543 | | |
Federal home loan bank certificate—0.39% | | | |
| FHLB
0.750%, due 06/17/16
(cost—$1,745,000) | | | | 1,745,000 | | | | 1,740,887 | | |
Federal home loan mortgage corporation certificates*—1.82% | | | |
| FHLMC
0.600%, due 03/28/16 | | | | 1,760,000 | | | | 1,753,951 | | |
| | 2.020%, due 07/16/18 | | | | 3,740,000 | | | | 3,779,554 | | |
| | 5.000%, due 11/13/14 | | | | 2,500,000 | | | | 2,652,803 | | |
| Total federal home loan mortgage
corporation certificates
(cost—$8,096,071) | | | | | | 8,186,308 | | |
Federal national mortgage association certificates*—3.39% | | | |
| FNMA
0.500%, due 03/30/16 | | | | 700,000 | | | | 698,600 | | |
| FNMA TBA
2.500% | | | | 900,000 | | | | 829,688 | | |
| | 3.000 | % | | | 4,800,000 | | | | 4,652,250 | | |
| | 3.500 | % | | | 4,500,000 | | | | 4,523,906 | | |
| | 4.000 | % | | | 4,400,000 | | | | 4,565,063 | | |
| Total federal national mortgage
association certificates
(cost—$15,309,595) | | | | | | 15,269,507 | | |
Collateralized mortgage obligations—5.29% | | | |
| Arkle Master Issuer PLC,
Series 2010-2A, Class 1A1
1.674%, due 05/17/602,3 | | | | 2,015,000 | | | | 2,015,828 | | |
| Commercial Mortgage
Pass-Through Certificates,
Series 2006-C5, Class AM
5.343%, due 12/15/39 | | | | 840,000 | | | | 903,265 | | |
| Series 2006-C8, Class AM
5.347%, due 12/10/46 | | | | 655,000 | | | | 711,232 | | |
| Series 2010-C1, Class A1
3.156%, due 07/10/463 | | | | 1,169,203 | | | | 1,213,874 | | |
| | | Face
amount1 | | Value | |
Collateralized mortgage obligations—(concluded) | |
Series 2013-CR8, Class A4
3.334%, due 06/10/46 | | | 960,000 | | | $ | 926,227 | | |
Series 2013-GAM, Class A2
3.367%, due 02/10/283 | | | 1,090,000 | | | | 1,055,446 | | |
DBRR Trust, Series 2012-EZ1, Class A
0.946%, due 09/25/453 | | | 2,288,801 | | | | 2,292,658 | | |
FNMA REMIC,
Trust 2005-109, Class PV*
6.000%, due 10/25/32 | | | 636,419 | | | | 698,878 | | |
FREMF Mortgage Trust,
Series 2013-K712, Class B
3.367%, due 05/25/452,3 | | | 445,437 | | | | 416,216 | | |
GNMA REMIC,
Trust Series 2006-3, Class B
5.091%, due 01/16/372 | | | 440,064 | | | | 455,352 | | |
Holmes Master Issuer PLC,
Series 2010-1A, Class A2
1.668%, due 10/15/542,3 | | | 1,195,000 | | | | 1,201,345 | | |
JPMorgan Chase Commercial
Mortgage Securities,
Series 2004-CB8, Class A1A
4.158%, due 01/12/393 | | | 1,707,600 | | | | 1,726,557 | | |
Series 2006-LDP8, Class AJ
5.480%, due 05/15/452 | | | 500,000 | | | | 509,085 | | |
Series 2007-CB18, Class A3
5.447%, due 06/12/47 | | | 221,511 | | | | 226,467 | | |
Series 2011-PLSD, Class A2
3.364%, due 11/13/443 | | | 800,000 | | | | 838,733 | | |
JPMorgan Mortgage Trust,
Series 2013-1, Class 2A2
2.500%, due 03/25/432,3 | | | 920,726 | | | | 891,757 | | |
ML-CFC Commercial Mortgage Trust,
Series 2006-4, Class A1A
5.166%, due 12/12/492 | | | 1,250,295 | | | | 1,372,921 | | |
Morgan Stanley Bank of America
Merrill Lynch Trust,
Series 2012-CKSV, Class A2
3.277%, due 10/15/303 | | | 675,000 | | | | 616,824 | | |
Series 2013-C10, Class A3
4.105%, due 07/15/462 | | | 1,000,000 | | | | 1,022,552 | | |
Morgan Stanley Capital I,
Series 2005-HQ6, Class A4A
4.989%, due 08/13/42 | | | 2,075,000 | | | | 2,201,417 | | |
Morgan Stanley Re-REMIC Trust
1.000%, due 03/27/513 | | | 702,212 | | | | 700,878 | | |
Motel 6 Trust, Series 2012-MTL6, Class B
2.743%, due 10/05/253 | | | 945,000 | | | | 926,994 | | |
Small Business Administration,
Series 2004-P10B, Class 1
4.754%, due 08/10/14 | | | 171,571 | | | | 175,187 | | |
STRPS 2012-1 Ltd.,
Series 2012-1A, Class A
1.500%, due 12/25/443 | | | 747,669 | | | | 728,978 | | |
Total collateralized mortgage
obligations
(cost—$23,848,176) | | | | | 23,828,671 | | |
30
PACE Select Advisors Trust
PACE Intermediate Fixed Income Investments
Portfolio of investments—July 31, 2013
| | | Face
amount1 | | Value | |
Asset-backed securities—6.29% | |
AmeriCredit Automobile
Receivables Trust,
Series 2012-2, Class B
1.780%, due 03/08/17 | | | 1,430,000 | | | $ | 1,444,853 | | |
Auto ABS Compartiment,
Series 2012-2, Class A
2.800%, due 04/27/254 | | | 715,163 | | | | 960,147 | | |
BMW Vehicle Lease Trust,
Series 2012-1, Class A2
0.590%, due 06/20/14 | | | 550,470 | | | | 550,549 | | |
Bumper, Series 2011-2, Class A
1.373%, due 02/23/232,4 | | | 686,690 | | | | 919,277 | | |
CarMax Auto Owner Trust,
Series 2012-3, Class A2
0.430%, due 09/15/15 | | | 1,287,275 | | | | 1,286,579 | | |
Credit Acceptance Auto Loan Trust,
Series 2011-1, Class A
2.610%, due 03/15/193 | | | 1,105,000 | | | | 1,115,751 | | |
Series 2013-1A, Class A
1.210%, due 10/15/203 | | | 1,495,000 | | | | 1,492,497 | | |
DT Auto Owner Trust,
Series 2012-2A, Class A
0.910%, due 11/16/153 | | | 590,712 | | | | 590,703 | | |
Ford Credit Floorplan Master
Owner Trust,
Series 2012-1, Class C
1.691%, due 01/15/162 | | | 1,415,000 | | | | 1,421,908 | | |
Series 2012-2, Class A
1.920%, due 01/15/19 | | | 2,535,000 | | | | 2,570,662 | | |
HLSS Servicer Advance Receivables
Backed Notes,
Series 2013-T3, Class A3
1.793%, due 05/15/463 | | | 1,390,000 | | | | 1,361,783 | | |
Lehman XS Trust,
Series 2005-6, Class 1A1
0.450%, due 11/25/352 | | | 384,723 | | | | 224,622 | | |
Mercedes-Benz Auto Lease Trust,
Series 2012-A, Class A2
0.660%, due 04/15/14 | | | 98,485 | | | | 98,489 | | |
Nationstar Mortgage Advance
Receivable Trust,
Series 2013-T1A, Class A1
1.080%, due 06/20/443 | | | 1,675,000 | | | | 1,672,916 | | |
Sallie Mae Student Loan Trust,
Series 2010-C, Class A1
1.841%, due 12/15/172,3 | | | 144,676 | | | | 145,020 | | |
Santander Consumer Acquired
Receivables Trust,
Series 2011-51A, Class B
1.660%, due 08/15/163 | | | 737,666 | | | | 740,159 | | |
Santander Drive Auto Receivables Trust,
Series 2011-3, Class C
3.090%, due 05/15/17 | | | 1,290,000 | | | | 1,304,231 | | |
Series 2011-S1A, Class B | |
1.480%, due 05/15/173 | | | 394,013 | | | | 395,206 | | |
| | | Face
amount1 | | Value | |
Asset-backed securities—(concluded) | |
Series 2011-S2A, Class B
2.060%, due 06/15/173 | | | 283,185 | | | $ | 283,869 | | |
Series 2012-1, Class C
3.780%, due 11/15/17 | | | 1,240,000 | | | | 1,268,656 | | |
Series 2012-4, Class A2
0.790%, due 08/17/15 | | | 947,438 | | | | 947,654 | | |
Series 2012-5, Class C
2.700%, due 08/15/18 | | | 1,200,000 | | | | 1,205,206 | | |
Series 2012-AA, Class A2
0.550%, due 02/16/163 | | | 1,283,051 | | | | 1,282,572 | | |
Series 2013-4, Class A2
0.890%, due 09/15/16 | | | 1,100,000 | | | | 1,101,618 | | |
Series 2013-4, Class B
2.160%, due 01/15/20 | | | 1,200,000 | | | | 1,203,241 | | |
SLM Student Loan Trust,
Series 2012-A, Class A1
1.591%, due 08/15/252,3 | | | 1,215,867 | | | | 1,228,505 | | |
Series 2012-D, Class A1 | |
1.241%, due 06/15/232,3 | | | 1,131,600 | | | | 1,134,772 | | |
Structured Receivables Finance LLC,
Series 2010-B, Class A
3.730%, due 08/15/363 | | | 395,520 | | | | 406,558 | | |
Total asset-backed securities
(cost—$28,248,621) | | | | | 28,358,003 | | |
Corporate notes—24.50% | |
Banking-non-US—0.85% | |
Caixa Economica Federal
2.375%, due 11/06/173 | | | 440,000 | | | | 408,892 | | |
HSBC Bank PLC
2.000%, due 01/19/143 | | | 1,605,000 | | | | 1,617,113 | | |
Westpac Banking Corp.
1.375%, due 07/17/153 | | | 1,775,000 | | | | 1,796,122 | | |
| | | | 3,822,127 | | |
Banking-US—3.51% | |
Bank of America Corp.
1.343%, due 03/22/182 | | | 1,025,000 | | | | 1,022,724 | | |
4.100%, due 07/24/23 | | | 460,000 | | | | 460,244 | | |
5.625%, due 10/14/16 | | | 1,325,000 | | | | 1,476,426 | | |
6.500%, due 08/01/16 | | | 1,370,000 | | | | 1,552,455 | | |
Bank of America Corp., Series 1
3.750%, due 07/12/16 | | | 650,000 | | | | 687,126 | | |
Capital One Bank USA N.A.
3.375%, due 02/15/23 | | | 365,000 | | | | 344,760 | | |
Capital One Financial Corp.
3.500%, due 06/15/233 | | | 330,000 | | | | 312,685 | | |
CIT Group, Inc.
4.750%, due 02/15/153 | | | 690,000 | | | | 712,425 | | |
5.250%, due 03/15/18 | | | 400,000 | | | | 425,000 | | |
Goldman Sachs Group, Inc.
1.465%, due 04/30/182 | | | 710,000 | | | | 710,019 | | |
3.700%, due 08/01/15 | | | 1,110,000 | | | | 1,158,812 | | |
JPMorgan Chase & Co.
0.893%, due 02/26/162 | | | 1,135,000 | | | | 1,135,590 | | |
1.166%, due 01/25/182 | | | 700,000 | | | | 701,273 | | |
31
PACE Select Advisors Trust
PACE Intermediate Fixed Income Investments
Portfolio of investments—July 31, 2013
| | | Face
amount1 | | Value | |
Corporate notes—(continued) | |
Banking-US—(concluded) | |
3.200%, due 01/25/23 | | | 1,800,000 | | | $ | 1,703,282 | | |
3.250%, due 09/23/22 | | | 105,000 | | | | 99,925 | | |
6.000%, due 08/01/232.5 | | | 465,000 | | | | 457,444 | | |
State Street Capital Trust IV
1.273%, due 06/15/372 | | | 760,000 | | | | 623,200 | | |
Wells Fargo & Co.
0.895%, due 04/23/182 | | | 915,000 | | | | 915,029 | | |
Wells Fargo & Co. MTN
3.500%, due 03/08/22 | | | 525,000 | | | | 530,306 | | |
Wells Fargo & Co., Series K
7.980%, due 03/15/152,5 | | | 700,000 | | | | 785,750 | | |
| | | | 15,814,475 | | |
Beverages—0.16% | |
Anheuser-Busch InBev Finance, Inc.
2.625%, due 01/17/23 | | | 775,000 | | | | 731,411 | | |
Building products—0.10% | |
Building Materials Corp. of America
6.750%, due 05/01/213 | | | 256,000 | | | | 273,920 | | |
Cemex SAB de CV
5.875%, due 03/25/193,6 | | | 200,000 | | | | 200,750 | | |
| | | | 474,670 | | |
Communications equipment—0.23% | |
Apple, Inc.
2.400%, due 05/03/23 | | | 1,130,000 | | | | 1,036,616 | | |
Diversified financial services—0.31% | |
General Electric Capital Corp.
5.500%, due 01/08/20 | | | 620,000 | | | | 702,850 | | |
General Electric Capital Corp. MTN
4.375%, due 09/16/20 | | | 640,000 | | | | 680,644 | | |
| | | | 1,383,494 | | |
Electric-integrated—1.77% | |
Delphi Corp.
5.000%, due 02/15/23 | | | 665,000 | | | | 691,600 | | |
Duke Energy Corp.
3.950%, due 09/15/14 | | | 1,845,000 | | | | 1,910,009 | | |
Eaton Corp.
2.750%, due 11/02/223 | | | 850,000 | | | | 792,754 | | |
Jabil Circuit, Inc.
8.250%, due 03/15/18 | | | 620,000 | | | | 733,150 | | |
Jersey Central Power & Light Co.
5.625%, due 05/01/16 | | | 550,000 | | | | 608,364 | | |
Oncor Electric Delivery Co. LLC
4.100%, due 06/01/22 | | | 570,000 | | | | 596,480 | | |
Pacificorp
5.500%, due 01/15/19 | | | 651,000 | | | | 759,155 | | |
5.750%, due 04/01/37 | | | 365,000 | | | | 423,087 | | |
Progress Energy, Inc.
5.625%, due 01/15/16 | | | 1,325,000 | | | | 1,465,622 | | |
| | | | 7,980,221 | | |
| | | Face
amount1 | | Value | |
Corporate notes—(continued) | |
Finance-captive automotive—0.98% | |
CDP Financial, Inc.
4.400%, due 11/25/193 | | | 1,545,000 | | | $ | 1,701,830 | | |
Ford Motor Credit Co. LLC
1.525%, due 05/09/162 | | | 910,000 | | | | 911,968 | | |
4.250%, due 09/20/22 | | | 975,000 | | | | 973,258 | | |
6.625%, due 08/15/17 | | | 220,000 | | | | 250,838 | | |
8.125%, due 01/15/20 | | | 475,000 | | | | 584,013 | | |
| | | | 4,421,907 | | |
Financial services—4.14% | |
Ally Financial, Inc.
4.500%, due 02/11/14 | | | 1,547,000 | | | | 1,565,564 | | |
5.500%, due 02/15/17 | | | 650,000 | | | | 687,196 | | |
8.000%, due 11/01/31 | | | 665,000 | | | | 804,650 | | |
American Express Credit Corp.
2.375%, due 03/24/17 | | | 1,100,000 | | | | 1,134,274 | | |
Citigroup, Inc.
1.250%, due 01/15/16 | | | 1,060,000 | | | | 1,052,762 | | |
4.587%, due 12/15/15 | | | 2,290,000 | | | | 2,453,412 | | |
Credit Suisse AG Guernsey
1.625%, due 03/06/153 | | | 3,285,000 | | | | 3,332,961 | | |
2.600%, due 05/27/163 | | | 2,215,000 | | | | 2,307,607 | | |
Doric Nimrod Air Alpha Ltd 2013-1
Pass Through Trust
5.250%, due 05/30/233 | | | 395,000 | | | | 393,025 | | |
Icahn Enterprises LP/Icahn
Enterprises Finance Corp.
8.000%, due 01/15/18 | | | 1,195,000 | | | | 1,262,219 | | |
Lehman Brothers Holdings, Inc.
0.000%, due 12/31/49**,7 | | | 34,573 | | | | 15,385 | | |
LYB International Finance BV
4.000%, due 07/15/23 | | | 400,000 | | | | 396,969 | | |
Morgan Stanley
2.125%, due 04/25/18 | | | 860,000 | | | | 832,572 | | |
6.625%, due 04/01/18 | | | 400,000 | | | | 461,208 | | |
Novus USA Trust, Series 2013-1
1.573%, due 02/28/142,3 | | | 1,215,000 | | | | 1,213,177 | | |
SteelRiver Transmission Co. LLC
4.710%, due 06/30/173 | | | 740,468 | | | | 764,855 | | |
| | | | 18,677,836 | | |
Gaming—0.11% | |
Caesars Entertainment
Operating Co., Inc.
11.250%, due 06/01/17 | | | 462,000 | | | | 480,191 | | |
Health care—0.30% | |
Biomet, Inc.
6.500%, due 08/01/20 | | | 1,300,000 | | | | 1,365,000 | | |
Insurance—1.60% | |
MetLife Institutional Funding II
1.625%, due 04/02/153 | | | 1,920,000 | | | | 1,944,161 | | |
Metropolitan Life Global Funding I
2.000%, due 01/09/153 | | | 2,200,000 | | | | 2,240,275 | | |
5.125%, due 06/10/143 | | | 245,000 | | | | 254,587 | | |
32
PACE Select Advisors Trust
PACE Intermediate Fixed Income Investments
Portfolio of investments—July 31, 2013
| | | Face
amount1 | | Value | |
Corporate notes—(continued) | |
Insurance—(concluded) | |
New York Life Global Funding
0.750%, due 07/24/153 | | | 1,545,000 | | | $ | 1,546,239 | | |
Pacific LifeCorp.
5.125%, due 01/30/433 | | | 480,000 | | | | 451,559 | | |
Prudential Financial, Inc. MTN
3.000%, due 05/12/16 | | | 350,000 | | | | 365,393 | | |
4.750%, due 09/17/15 | | | 360,000 | | | | 388,921 | | |
| | | | 7,191,135 | | |
Media—0.77% | |
Comcast Corp.
4.250%, due 01/15/33 | | | 480,000 | | | | 462,446 | | |
DIRECTV Holdings LLC/DIRECTV
Financing Co., Inc.
3.800%, due 03/15/22 | | | 880,000 | | | | 845,925 | | |
Interpublic Group of Cos., Inc.
6.250%, due 11/15/14 | | | 561,000 | | | | 592,556 | | |
NBCUniversal Enterprise, Inc.
5.250%, due 03/19/213,5 | | | 500,000 | | | | 495,000 | | |
NBCUniversal Media LLC
4.450%, due 01/15/43 | | | 375,000 | | | | 350,779 | | |
WMG Acquisition Corp.
6.000%, due 01/15/213 | | | 675,000 | | | | 705,375 | | |
| | | | 3,452,081 | | |
Medical providers—0.72% | |
Gilead Sciences, Inc.
4.400%, due 12/01/21 | | | 510,000 | | | | 545,985 | | |
St. Jude Medical, Inc.
3.250%, due 04/15/23 | | | 904,000 | | | | 863,013 | | |
UnitedHealth Group, Inc.
2.875%, due 03/15/22 | | | 755,000 | | | | 724,336 | | |
3.375%, due 11/15/21 | | | 220,000 | | | | 219,704 | | |
WellPoint, Inc.
7.000%, due 02/15/19 | | | 750,000 | | | | 900,437 | | |
| | | | 3,253,475 | | |
Metals & mining—0.42% | |
Codelco, Inc.
3.750%, due 11/04/203 | | | 370,000 | | | | 365,550 | | |
Freeport-McMoRan Copper & Gold, Inc.
3.875%, due 03/15/233 | | | 585,000 | | | | 529,261 | | |
Novelis, Inc.
8.750%, due 12/15/20 | | | 890,000 | | | | 981,225 | | |
| | | | 1,876,036 | | |
Multi-line insurance—0.76% | |
American International Group, Inc.
3.000%, due 03/20/15 | | | 1,565,000 | | | | 1,614,905 | | |
3.800%, due 03/22/17 | | | 725,000 | | | | 768,865 | | |
4.875%, due 06/01/22 | | | 325,000 | | | | 353,421 | | |
5.450%, due 05/18/17 | | | 600,000 | | | | 667,183 | | |
| | | | 3,404,374 | | |
| | | Face
amount1 | | Value | |
Corporate notes—(continued) | |
Oil & gas—2.21% | |
Anadarko Petroleum Corp.
5.750%, due 06/15/14 | | | 600,000 | | | $ | 624,539 | | |
6.375%, due 09/15/17 | | | 945,000 | | | | 1,101,622 | | |
7.625%, due 03/15/14 | | | 300,000 | | | | 312,398 | | |
Cenovus Energy, Inc.
4.500%, due 09/15/14 | | | 940,000 | | | | 978,508 | | |
Chevron Corp.
3.191%, due 06/24/23 | | | 275,000 | | | | 271,037 | | |
Continental Resources, Inc.
8.250%, due 10/01/19 | | | 1,420,000 | | | | 1,554,900 | | |
PBF Holding Co. LLC/PBF Finance Corp.
8.250%, due 02/15/20 | | | 565,000 | | | | 579,125 | | |
Petroleos Mexicanos
3.500%, due 01/30/233 | | | 580,000 | | | | 527,800 | | |
4.875%, due 01/24/22 | | | 200,000 | | | | 206,000 | | |
5.500%, due 01/21/21 | | | 363,000 | | | | 394,763 | | |
6.000%, due 03/05/20 | | | 132,000 | | | | 147,510 | | |
8.000%, due 05/03/19 | | | 100,000 | | | | 122,000 | | |
Pioneer Natural Resources Co.
6.875%, due 05/01/18 | | | 865,000 | | | | 1,017,372 | | |
Plains Exploration & Production Co.
6.500%, due 11/15/20 | | | 776,000 | | | | 835,170 | | |
8.625%, due 10/15/19 | | | 310,000 | | | | 343,325 | | |
Statoil ASA
2.650%, due 01/15/24 | | | 580,000 | | | | 539,877 | | |
Transocean, Inc.
5.050%, due 12/15/16 | | | 386,000 | | | | 423,079 | | |
| | | | 9,979,025 | | |
Oil services—0.63% | |
BP Capital Markets PLC
2.500%, due 11/06/22 | | | 1,070,000 | | | | 976,987 | | |
2.750%, due 05/10/23 | | | 345,000 | | | | 320,668 | | |
Petrobras International Finance Co.
3.875%, due 01/27/16 | | | 1,505,000 | | | | 1,542,986 | | |
| | | | 2,840,641 | | |
Pharmaceuticals—0.79% | |
AbbVie, Inc.
1.200%, due 11/06/153 | | | 705,000 | | | | 707,677 | | |
Mylan, Inc.
6.000%, due 11/15/183 | | | 1,390,000 | | | | 1,503,360 | | |
Thermo Fisher Scientific, Inc.
3.200%, due 03/01/16 | | | 553,000 | | | | 576,693 | | |
VPI Escrow Corp.
6.375%, due 10/15/203 | | | 748,000 | | | | 772,310 | | |
| | | | 3,560,040 | | |
Pipelines—1.32% | |
El Paso Pipeline Partners
Operating Co. LLC
4.100%, due 11/15/15 | | | 2,725,000 | | | | 2,901,433 | | |
6.500%, due 04/01/20 | | | 235,000 | | | | 273,591 | | |
Enterprise Products Operating LLC
3.200%, due 02/01/16 | | | 1,525,000 | | | | 1,604,738 | | |
33
PACE Select Advisors Trust
PACE Intermediate Fixed Income Investments
Portfolio of investments—July 31, 2013
| | | Face
amount1 | | Value | |
Corporate notes—(continued) | |
Pipelines—(concluded) | |
Florida Gas Transmission Co. LLC
5.450%, due 07/15/203 | | | 494,000 | | | $ | 543,626 | | |
Williams Cos., Inc.
7.875%, due 09/01/21 | | | 520,000 | | | | 628,137 | | |
| | | | 5,951,525 | | |
Real estate investment trusts—0.26% | |
Boston Properties LP
3.125%, due 09/01/23 | | | 570,000 | | | | 529,280 | | |
UDR, Inc. MTN
4.250%, due 06/01/18 | | | 600,000 | | | | 639,214 | | |
| | | | 1,168,494 | | |
Rental auto/equipment—0.12% | |
United Rentals North America, Inc.
7.625%, due 04/15/22 | | | 500,000 | | | | 557,500 | | |
Retail—0.25% | |
QVC, Inc.
5.950%, due 03/15/433 | | | 620,000 | | | | 565,217 | | |
TJX Cos., Inc.
2.500%, due 05/15/23 | | | 595,000 | | | | 548,718 | | |
| | | | 1,113,935 | | |
Special purpose entity—0.29% | |
Capital One Multi-Asset,
Series 4-3C
6.625%, due 06/17/14 | | GBP | 350,000 | | | | 550,190 | | |
Crown Castle Towers LLC
6.113%, due 01/15/203 | | | 660,000 | | | | 749,432 | | |
| | | | 1,299,622 | | |
Telecommunications—0.79% | |
Qwest Corp.
7.500%, due 10/01/14 | | | 194,000 | | | | 207,632 | | |
SBA Tower Trust
4.254%, due 04/15/153 | | | 1,200,000 | | | | 1,240,732 | | |
Sprint Nextel Corp.
7.000%, due 03/01/203 | | | 498,000 | | | | 542,820 | | |
Telefonica Emisiones SAU
4.570%, due 04/27/23 | | | 470,000 | | | | 454,434 | | |
Verizon Communications, Inc.
2.450%, due 11/01/226 | | | 750,000 | | | | 677,548 | | |
Virgin Media Secured Finance PLC
6.500%, due 01/15/18 | | | 405,000 | | | | 422,212 | | |
| | | | 3,545,378 | | |
Telephone-integrated—0.40% | |
Level 3 Financing, Inc.
8.125%, due 07/01/19 | | | 535,000 | | | | 580,475 | | |
Qwest Communications
International, Inc.
7.125%, due 04/01/18 | | | 1,197,000 | | | | 1,241,888 | | |
| | | | 1,822,363 | | |
| | | Face
amount1 | | Value | |
Corporate notes—(concluded) | |
Tobacco—0.07% | |
Philip Morris International, Inc.
4.125%, due 03/04/43 | | | 330,000 | | | $ | 297,164 | | |
Utilities—0.51% | |
CMS Energy Corp.
2.750%, due 05/15/14 | | | 815,000 | | | | 825,556 | | |
5.050%, due 03/15/22 | | | 495,000 | | | | 539,177 | | |
HD Supply, Inc.
7.500%, due 07/15/203 | | | 900,000 | | | | 954,000 | | |
| | | | 2,318,733 | | |
Wireless telecommunications—0.13% | |
Softbank Corp.
4.500%, due 04/15/203 | | | 605,000 | | | | 585,338 | | |
Total corporate notes
(cost—$109,928,321) | | | | | 110,404,807 | | |
| | | Number of
shares | | | |
Preferred stock—0.05% | |
Banking-US—0.05% | |
The Goldman Sachs Group, Inc.2,8
(cost—$229,250) | | | 9,170 | | | | 217,512 | | |
| | | Face
amount1 | | | |
Non-US government obligations—0.37% | |
Republic of Brazil
4.875%, due 01/22/21 | | | 820,000 | | | | 875,760 | | |
Republic of Colombia
2.625%, due 03/15/236 | | | 530,000 | | | | 467,725 | | |
Republic of Turkey
6.000%, due 01/14/41 | | | 340,000 | | | | 328,100 | | |
Total non-US government
obligations
(cost—$1,868,598) | | | | | 1,671,585 | | |
Repurchase agreement—3.38% | |
Repurchase agreement dated
07/31/13 with State Street
Bank and Trust Co., 0.010%
due 08/01/13, collateralized by
$667,058 Federal Home Loan
Mortgage Corp. obligations,
1.960% due 11/07/22,
$15,377,029 Federal National
Mortgage Association obligations,
2.140% to 2.170% due 11/07/22
and $505,636 US Treasury Notes,
0.250% to 0.750% due 10/31/13
to 12/15/13; (value—$15,563,335);
proceeds: $15,258,004
(cost—$15,258,000) | | | 15,258,000 | | | | 15,258,000 | | |
34
PACE Select Advisors Trust
PACE Intermediate Fixed Income Investments
Portfolio of investments—July 31, 2013
| | | Number of
contracts/
Notional
amount | | Value | |
Options purchased—0.20% | |
Call options & swaptions purchased—0.03% | |
3 Month USD LIBOR 10 Year
Swap, strike @ 1.750%, expires
09/16/13 (Counterparty:
JPMorgan Chase Bank; receive
fixed rate); underlying swap
terminates 09/18/239 | | USD | 6,700,000 | | | $ | 6 | | |
3 Month USD LIBOR 30 Year
Swap, strike @ 3.250%, expires
07/11/14 (Counterparty:
Goldman Sachs Bank USA;
receive fixed rate); underlying
swap terminates 07/15/449 | | USD | 2,700,000 | | | | 68,019 | | |
EUR Call/USD Put, Strike @ USD
1.38, expiring 01/02/14 | | EUR | 3,450,000 | | | | 37,943 | | |
| | | 105,968 | | |
Put options & swaptions purchased—0.17% | |
3 Month USD LIBOR 5 Year Swap,
strike @ 3.000%, expires
07/24/15 (Counterparty:
Goldman Sachs Bank USA;
receive fixed rate); underlying
swap terminates 07/28/209 | | USD | 7,700,000 | | | | 197,140 | | |
3 Month USD LIBOR 5 Year Swap,
strike @ 4.500%, expires
07/18/18 (Counterparty:
Credit Suisse International;
receive fixed rate); underlying
swap terminates 07/20/239 | | USD | 11,200,000 | | | | 372,853 | | |
3 Month USD LIBOR 10 Year
Swap, strike @ 4.000%, expires
06/06/16 (Counterparty:
Goldman Sachs Bank USA;
receive fixed rate); underlying
swap terminates 06/08/269 | | USD | 3,300,000 | | | | 182,399 | | |
| | | Number of
contracts/
Notional
amount | | Value | |
Options purchased—(concluded) | |
Put options & swaptions purchased—(concluded) | |
6 Month EURIBOR Interest Rate
Swap, strike @ 4.500%, expires
09/16/13 (Counterparty: Credit
Suisse International; receive
fixed rate); underlying swap
terminates 09/18/439 | | EUR | 2,700,000 | | | $ | 0 | | |
6 Month EURIBOR Interest Rate
Swap, strike @ 4.500%, expires
10/21/13 (Counterparty:
Goldman Sachs Bank USA;
receive fixed rate); underlying
swap terminates 10/23/439 | | EUR | 2,500,000 | | | | 0 | | |
6 Month EURIBOR 30 Year Swap,
strike @ 4.500%, expires
11/11/13 (Counterparty: Credit
Suisse International; receive
fixed rate); underlying swap
terminates 11/13/439 | | EUR | 2,200,000 | | | | 0 | | |
GBP Put/USD Call, Strike @ GBP
1.48, expiring 09/03/13 | | USD | 1,875,000 | | | | 7,622 | | |
| | | | 760,014 | | |
Total options purchased
(cost—$1,076,476) | | | | | 865,982 | | |
| | | Number of
shares | | | |
Investment of cash collateral from securities loaned—0.15% | |
Money market fund—0.15% | |
UBS Private Money Market Fund LLC10
(cost—$702,620) | | | 702,620 | | | | 702,620 | | |
Total investments
(cost—$473,668,959)—104.87% | | | | | 472,540,425 | | |
Liabilities in excess of
other assets—(4.87)% | | | | | (21,932,179 | ) | |
Net assets—100.00% | | | | $ | 450,608,246 | | |
For a listing of defined portfolio acronyms, counterparty acronyms and currency abbreviations that are used throughout the Portfolio of investments as well as the tables that follow, please refer to page 218.
Aggregate cost for federal income tax purposes was $474,342,176; and net unrealized depreciation consisted of:
Gross unrealized appreciation | | $ | 3,212,199 | | |
Gross unrealized depreciation | | | (5,013,950 | ) | |
Net unrealized depreciation | | $ | (1,801,751 | ) | |
35
PACE Select Advisors Trust
PACE Intermediate Fixed Income Investments
Portfolio of investments—July 31, 2013
Written options activity for the year ended July 31, 2013 was as follows:
| | | Number of
contracts | | Premiums
received | |
Options outstanding at July 31, 2012 | | | 65 | | | $ | 43,134 | | |
Options written | | | 1,027 | | | | 342,059 | | |
Options terminated in closing purchase transactions | | | (1,092 | ) | | | (385,193 | ) | |
Options expired prior to exercise | | | — | | | | — | | |
| Options outstanding at July 31, 2013 | | | 0 | | | $ | 0 | | |
Written swaptions9
Notional
amount
(000) | | Put swaptions written | | Counterparty | | Pay/
receive
floating
rate | | Expiration
date | | Premiums
received | | Current
value | | Unrealized
depreciation | |
USD | 22,400 | | | 3 Month USD LIBOR Interest
Rate Swap strike @ 6.00%,
terminating 07/20/23 | | CSI | | Pay | | 07/18/18 | | $ | 344,921 | | | $ | (359,005 | ) | | $ | (14,084 | ) | |
Swaptions and foreign exchange written options activity for the year ended July 31, 2013 was as follows:
| | | Premiums
received | |
Swaptions and foreign exchange written options outstanding at July 31, 2012 | | $ | 793,645 | | |
Swaptions and foreign exchange options written | | | 1,374,829 | | |
Swaptions and foreign exchange written options terminated in closing purchase transactions | | | (1,823,553 | ) | |
Swaptions and foreign exchange written options expired prior to exercise | | | — | | |
Swaptions and foreign exchange written options outstanding at July 31, 2013 | | $ | 344,921 | | |
Futures contracts
Number of
contracts | | Currency | |
| | Expiration
date | | Cost | | Current
value | | Unrealized
appreciation
(depreciation) | |
US Treasury futures buy contracts: | | | |
| | 29 | | | USD | | | | US Long Bond Futures | | September 2013 | | $ | 3,941,673 | | | $ | 3,887,813 | | | $ | (53,860 | ) | |
| | 191 | | | USD | | | | US Treasury Note 5 Year Futures | | September 2013 | | | 23,094,292 | | | | 23,181,133 | | | | 86,841 | | |
| | 374 | | | USD | | | | US Treasury Note 10 Year Futures | | September 2013 | | | 47,358,766 | | | | 47,287,625 | | | | (71,141 | ) | |
Interest rate futures buy contracts: | | | |
| | 86 | | | USD | | | | Eurodollar 90 Day Futures | | September 2015 | | | 21,261,147 | | | | 21,262,425 | | | | 1,278 | | |
| | | | | | | | | | | $ | 95,655,878 | | | $ | 95,618,996 | | | $ | (36,882 | ) | |
| | | | | | | | | Proceeds | | | | | |
US Treasury futures sell contracts: | | | |
| | 47 | | | USD | | | | Ultra Long US Treasury
Bond Futures | | September 2013 | | $ | 7,029,266 | | | $ | 6,779,750 | | | $ | 249,516 | | |
Interest rate futures sell contracts: | | | |
| | 29 | | | EUR | | | | German Euro Bund Futures | | September 2013 | | | 5,508,925 | | | | 5,482,335 | | | | 26,590 | | |
| | | | | | | | | | | $ | 12,538,191 | | | $ | 12,262,085 | | | $ | 276,106 | | |
| | | | | | | | | | | | | | | $ | 239,224 | | |
36
PACE Select Advisors Trust
PACE Intermediate Fixed Income Investments
Portfolio of investments—July 31, 2013
Forward foreign currency contracts
Counterparty | | Contracts to
deliver | | In
exchange for | | Maturity
date | | Unrealized
appreciation
(depreciation) | |
BB | | USD | 2,450,000 | | | CAD | 2,518,708 | | | 08/13/13 | | $ | 1,549 | | |
BB | | USD | 5,082,779 | | | GBP | 3,265,000 | | | 08/13/13 | | | (116,290 | ) | |
BNP | | GBP | 1,255,000 | | | USD | 1,961,530 | | | 08/13/13 | | | 52,512 | | |
BOA | | EUR | 1,646,000 | | | USD | 2,163,448 | | | 08/05/13 | | | (26,329 | ) | |
BOA | | JPY | 473,864,000 | | | USD | 4,798,164 | | | 08/05/13 | | | (41,702 | ) | |
BOA | | USD | 4,666,358 | | | EUR | 3,575,000 | | | 08/05/13 | | | 89,689 | | |
CITI | | EUR | 1,767,000 | | | USD | 2,347,320 | | | 08/05/13 | | | (3,431 | ) | |
CITI | | EUR | 1,508,000 | | | USD | 1,976,439 | | | 08/22/13 | | | (29,860 | ) | |
CITI | | GBP | 2,010,000 | | | USD | 3,129,086 | | | 08/13/13 | | | 71,614 | | |
CITI | | GBP | 1,525,000 | | | EUR | 1,770,185 | | | 09/09/13 | | | 35,973 | | |
DB | | GBP | 145,000 | | | USD | 218,661 | | | 10/22/13 | | | (1,807 | ) | |
DB | | USD | 2,672,619 | | | GBP | 1,755,000 | | | 09/30/13 | | | (3,864 | ) | |
GSCM | | GBP | 1,755,000 | | | USD | 2,626,849 | | | 09/30/13 | | | (41,906 | ) | |
RBC | | CAD | 2,496,033 | | | USD | 2,450,000 | | | 08/13/13 | | | 20,521 | | |
RBS | | USD | 4,715,000 | | | JPY | 474,469,978 | | | 08/05/13 | | | 131,055 | | |
| | | | | | | | | $ | 137,724 | | |
Interest rate swaps
| | | | | | | Rate type | | | | | | | |
Counterparty | | Notional
amount
(000) | | Termination
date | | Payments
made by
the Portfolio11 | | Payments
received by
the Portfolio11 | | Upfront
payments
received
(made) | | Value | | Unrealized
appreciation | |
CSI | | USD | 2,800 | | | 05/21/43 | | | 3.084 | % | | 3 Month USD LIBOR | | $ | — | | | $ | 293,538 | | | $ | 293,538 | | |
CSI | | USD | 1,500 | | | 07/05/42 | | | 2.481 | | | 3 Month USD LIBOR | | | — | | | | 325,747 | | | | 325,747 | | |
GSB | | USD | 1,600 | | | 05/13/23 | | | 1.944 | | | 3 Month USD LIBOR | | | — | | | | 115,651 | | | | 115,651 | | |
| | | | | | | | | | | $ | — | | | $ | 734,936 | | | $ | 734,936 | | |
Centrally cleared interest rate swap agreements
| | | | | Rate type | | | | | |
Notional
amount
(000) | | Termination
date | | Payments made by
the Portfolio11 | | Payments received by
the Portfolio11 | | Value | | Unrealized
appreciation
(depreciation) | |
USD | 14,400 | | | 07/05/18 | | | 3 Month USD LIBOR | | | | 0.274 | % | | $ | (19,675 | ) | | $ | (19,943 | ) | |
USD | 2,000 | | | 07/22/18 | | | 1.477 | % | | | 3 Month USD LIBOR | | | | 5,303 | | | | 5,266 | | |
USD | 3,600 | | | 07/22/20 | | | 2.129 | | | | 3 Month USD LIBOR | | | | 7,233 | | | | 7,162 | | |
USD | 7,300 | | | 07/22/20 | | | 2.094 | | | | 3 Month USD LIBOR | | | | 31,832 | | | | 31,689 | | |
USD | 2,500 | | | 07/11/23 | | | 2.855 | | | | 3 Month USD LIBOR | | | | (18,494 | ) | | | (18,547 | ) | |
USD | 8,300 | | | 06/21/20 | | | 1.784 | | | | 3 Month USD LIBOR | | | | 210,401 | | | | 210,237 | | |
USD | 900 | | | 07/01/23 | | | 2.710 | | | | 3 Month USD LIBOR | | | | 4,956 | | | | 4,936 | | |
USD | 3,400 | | | 07/26/20 | | | 3 Month USD LIBOR | | | | 2.900 | | | | (3,269 | ) | | | (3,333 | ) | |
| | | | | | | | | | | | | | | | | $ | 218,287 | | | $ | 217,467 | | |
37
PACE Select Advisors Trust
PACE Intermediate Fixed Income Investments
Portfolio of investments—July 31, 2013
Fair valuation summary
The following is a summary of the fair valuations according to the inputs used as of July 31, 2013 in valuing the Portfolio's investments:
| | | Unadjusted
quoted prices in
active markets for
identical investments
(Level 1) | | Other significant
observable inputs
(Level 2) | | Unobservable
inputs
(Level 3) | | Total | |
US government obligations | | $ | — | | | $ | 266,036,543 | | | $ | — | | | $ | 266,036,543 | | |
Federal home loan bank certificate | | | — | | | | 1,740,887 | | | | — | | | | 1,740,887 | | |
Federal home loan mortgage corporation certificates | | | — | | | | 8,186,308 | | | | — | | | | 8,186,308 | | |
Federal national mortgage association certificates | | | — | | | | 15,269,507 | | | | — | | | | 15,269,507 | | |
Collateralized mortgage obligations | | | — | | | | 22,398,815 | | | | 1,429,856 | | | | 23,828,671 | | |
Asset-backed securities | | | — | | | | 27,951,445 | | | | 406,558 | | | | 28,358,003 | | |
Corporate notes | | | — | | | | 109,176,245 | | | | 1,228,562 | | | | 110,404,807 | | |
Preferred stock | | | 217,512 | | | | — | | | | — | | | | 217,512 | | |
Non-US government obligations | | | — | | | | 1,671,585 | | | | — | | | | 1,671,585 | | |
Repurchase agreement | | | — | | | | 15,258,000 | | | | — | | | | 15,258,000 | | |
Options and swaptions purchased | | | — | | | | 865,982 | | | | — | | | | 865,982 | | |
Investment of cash collateral from securities loaned | | | — | | | | 702,620 | | | | — | | | | 702,620 | | |
Swaptions written | | | — | | | | (359,005 | ) | | | — | | | | (359,005 | ) | |
Futures contracts, net | | | 239,224 | | | | — | | | | — | | | | 239,224 | | |
Forward foreign currency contracts, net | | | — | | | | 137,724 | | | | — | | | | 137,724 | | |
Swap agreements, net12 | | | — | | | | 952,403 | | | | — | | | | 952,403 | | |
Total | | $ | 456,736 | | | $ | 469,989,059 | | | $ | 3,064,976 | | | $ | 473,510,771 | | |
At July 31, 2013, there were no transfers between Level 1 and Level 2.
The following is a rollforward of the Portfolio's investments that were valued using unobservable inputs (Level 3) for the year ended July 31, 2013:
| | | Collateralized
mortgage
obligations | | Asset-backed
securities | | Corporate
notes | | Total | |
Beginning balance | | $ | — | | | $ | 2,224,846 | | | $ | — | | | $ | 2,224,846 | | |
Purchases | | | 1,883,215 | | | | — | | | | 1,215,000 | | | | 3,098,215 | | |
Sales | | | (444,945 | ) | | | (1,810,878 | ) | | | — | | | | (2,255,823 | ) | |
Accrued discounts/(premiums) | | | 2,376 | | | | (200 | ) | | | — | | | | 2,176 | | |
Total realized gain/(loss) | | | — | | | | (264 | ) | | | — | | | | (264 | ) | |
Net change in unrealized appreciation/depreciation | | | (10,790 | ) | | | (6,946 | ) | | | 13,562 | | | | (4,174 | ) | |
Transfers into Level 3 | | | — | | | | — | | | | — | | | | — | | |
Transfers out of Level 3 | | | — | | | | — | | | | — | | | | — | | |
Ending balance | | $ | 1,429,856 | | | $ | 406,558 | | | $ | 1,228,562 | | | $ | 3,064,976 | | |
The change in net unrealized appreciation/depreciation relating to the Level 3 investments held at July 31, 2013 was $(1,998).
38
PACE Select Advisors Trust
PACE Intermediate Fixed Income Investments
Portfolio of investments—July 31, 2013
Issuer breakdown by country or territory of origin (unaudited)
| | | Percentage of
total investments | |
United States | | | 94.9 | % | |
Switzerland | | | 1.2 | | |
Canada | | | 0.8 | | |
United Kingdom | | | 0.7 | | |
Cayman Islands | | | 0.4 | | |
Australia | | | 0.4 | | |
Mexico | | | 0.3 | | |
Brazil | | | 0.3 | | |
Italy | | | 0.2 | | |
Japan | | | 0.1 | | |
Norway | | | 0.1 | | |
Colombia | | | 0.1 | | |
Spain | | | 0.1 | | |
Netherlands | | | 0.1 | | |
Guernsey | | | 0.1 | | |
Chile | | | 0.1 | | |
Turkey | | | 0.1 | | |
Germany | | | 0.0 | † | |
Total | | | 100.0 | % | |
† Amount is less than 0.05%.
Portfolio footnotes
* On September 7, 2008, the Federal Housing Finance Agency placed the Federal National Mortgage Association and the Federal Home Loan Mortgage Corporation into conservatorship, and the US Treasury guaranteed the debt issued by those organizations.
** Non-income producing security.
1 In US Dollars unless otherwise indicated.
2 Variable or floating rate security. The interest rate shown is the current rate as of July 31, 2013 and changes periodically.
3 Security exempt from registration pursuant to Rule 144A under the Securities Act of 1933. These securities, which represent 13.21% of net assets as of July 31, 2013, are considered liquid and may be resold in transactions exempt from registration, normally to qualified institutional buyers.
4 Security exempt from registration pursuant to Regulation S under the Securities Act of 1933. Regulation S applies to securities offerings that are made outside of the United States and do not involve direct selling efforts in the United States. At July 31, 2013, the value of these securities amounted to 0.42% of net assets.
5 Perpetual bond security. The maturity date reflects the next call date.
6 Security, or portion thereof, was on loan at July 31, 2013.
7 Issuer filed for bankruptcy and/or is in default of principal and/or interest payments.
8 Non cumulative preferred stock. The next call date is 05/10/23.
9 Illiquid investments representing 0.26% of net assets as of July 31, 2013.
10 The table below details the Portfolio's transaction activity in an affiliated issuer during the year ended July 31, 2013. The investment manager earns a management fee from UBS Private Money Market Fund LLC. Please see the Notes to financial statements for further information.
Security description | | Value at
07/31/12 | | Purchases
during the
year ended
07/31/13 | | Sales
during the
year ended
07/31/13 | | Value at
07/31/13 | | Net income
earned from
affiliate for the
year ended
07/31/13 | |
UBS Private Money Market Fund LLC | | $ | 2,964,113 | | | $ | 669,980,353 | | | $ | 672,241,846 | | | $ | 702,620 | | | $ | 2,051 | | |
11 Payments made/received are based on the notional amount.
12 Swap agreements are included in the table at value, with the exception of centrally cleared swap agreements which are included in the table at unrealized appreciation (depreciation).
See accompanying notes to financial statements.
39
PACE Select Advisors Trust
PACE Strategic Fixed Income Investments
Performance
For the 12 months ended July 31, 2013, the Portfolio's Class P shares declined 2.37% before the deduction of the maximum PACE Select program fee. (Class P shares declined 4.30% after the deduction of the maximum PACE Select program fee for the same 12-month period.) In comparison, the Barclays US Government/Credit Index (the "benchmark") declined 2.00%, and the Lipper Intermediate Investment Grade Debt Funds category posted a median decline of 0.96%. (Returns for all share classes over various time periods are shown in the "Performance at a glance" table on page 43. Please note that the returns shown do not reflect the deduction of taxes that a shareholder would pay on Portfolio distributions or the redemption of Portfolio shares.) For a detailed commentary on the market environment in general during the reporting period, please refer to page 2.
Sub-Advisor's comments1
(Please note that while the Sub-Advisor outperformed the benchmark on a gross of fees basis, the Portfolio underperformed net of fees, as reported under "Performance." As stated in footnote one, the comments that follow address performance on a gross of fees basis.)
The Portfolio outperformed its benchmark during the 12-month reporting period. A short duration in the US contributed to results, as US interest rates rose during the period. (Duration measures a portfolio's sensitivity to interest rate changes.) However, an emphasis on the intermediate portion of the yield curve detracted from results, as intermediate rates rose the most during the reporting period. Duration exposure outside of the US, particularly in the UK, was negative for performance as rates rose across the globe.
An underweight to corporate bonds, especially in the second half of 2012, detracted from relative performance as the sector outperformed like-duration Treasuries during the 12-months. This negative impact, however, was mitigated by an allocation to high yield corporate bonds, which posted strong returns as investors searched for incremental yield.
Exposures to agency mortgage-backed securities ("MBS") and senior non-agency MBS contributed to returns, as these securities benefited from investor demand for higher yielding assets and the Federal Reserve Board's
PACE Select Advisors Trust – PACE Strategic Fixed Income Investments
Investment Sub-Advisor:
Pacific Investment Management Company LLC ("PIMCO")
Portfolio Manager:
Saumil H. Parikh
Objective:
Total return consisting of income and capital appreciation
Investment process:
The Portfolio invests primarily in investment grade fixed income securities of governmental and private issuers in the United States and foreign countries. Its duration (a measure of a portfolio's sensitivity to interest rate changes) is normally limited to within two years (plus or minus) of the effective duration of the Portfolio's benchmark index. PIMCO seeks to invest in the areas of the bond market it considers undervalued, based on such factors as quality, sector, coupon and maturity. PIMCO decides to buy or sell specific bonds based on an analysis of their values relative to other similar bonds. PIMCO monitors the prepayment experience of the Portfolio's mortgage-backed bonds, and will also buy and sell securities to adjust the average portfolio duration, credit quality, yield curve, sector and prepayment exposure, as appropriate.
1 All Sub-Advisors discuss performance on a gross of fees basis—meaning that no fees or expenses are reflected in their sleeves'/sleeve's performance. Alternately, Portfolio performance is shown net of fees, which does factor in fees and expenses associated with the Portfolio.
40
PACE Select Advisors Trust
PACE Strategic Fixed Income Investments
Sub-Advisor's comments – concluded
quantitative easing program. A small allocation to commercial mortgage-backed securities ("CMBS") was also beneficial for returns.
An allocation to local rates in Brazil was negative for performance as interest rates in the country rose following US rates moving higher. However, exposure to US dollar-denominated emerging markets debt was positive for returns.
The use of generated positive results during the reporting period. Interest rate swaps were used to adjust interest rate and yield curve exposures, as well as to substitute for physical securities. Credit default swaps were utilized to manage credit exposure in lieu of the direct buying or selling of securities. While options and options on swaps were primarily used to manage interest rate and volatility exposures, they were also used to generate income in expected interest rate scenarios. Government futures were utilized to adjust interest rate exposures and replicate government bond positions.
Special considerations
The Portfolio may be appropriate for long-term investors seeking total return consisting of income and capital appreciation and who are able to withstand short-term fluctuations in the fixed income markets in return for potentially higher returns over the long term. The value of the Portfolio changes every day and can be affected by changes in interest rates, general market conditions and other political, social and economic developments, as well as specific matters relating to the companies in whose securities the Portfolio invests. In addition, investments in foreign bonds involve special risks. It is important to note that an investment in the Portfolio is only one component of a balanced investment plan.
41
PACE Select Advisors Trust
PACE Strategic Fixed Income Investments
Illustration of an assumed investment of $10,000 in Class P shares of the Portfolio (unaudited)
The following graph depicts the performance of PACE Strategic Fixed Income Investments Class P shares versus the Barclays US Government/Credit Index over the 10 years ended July 31, 2013. The performance of the other classes will vary based upon the different class specific expenses and sales charges. The performance provided does not reflect the deduction of taxes that a shareholder would pay on Portfolio distributions or the redemption of Portfolio shares. Past performance is no guarantee of future results. Share price and returns will vary with market conditions; investors may realize a gain or loss upon redemption. It is important to note that PACE Strategic Fixed Income Investments is a professionally managed portfolio while the Index is not available for investment and is unmanaged. The comparison is shown for illustration purposes only.
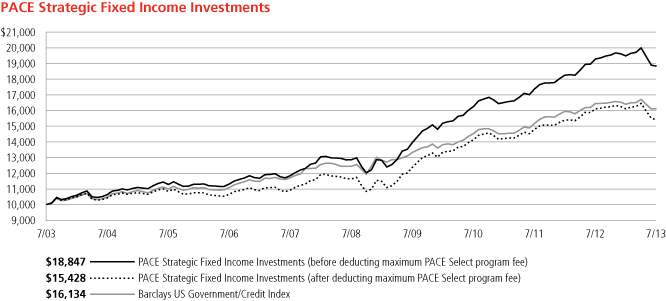
42
PACE Select Advisors Trust
PACE Strategic Fixed Income Investments
Performance at a glance (unaudited)
Average annual total returns for periods ended 07/31/13 | | 1 year | | 5 years | | 10 years | |
Before deducting maximum sales charge or PACE Select program fee | |
Class A1 | | | (2.60 | )% | | | 7.66 | % | | | 6.27 | % | |
Class C2 | | | (2.99 | )% | | | 7.16 | % | | | 5.76 | % | |
Class Y3 | | | (2.38 | )% | | | 7.95 | % | | | 6.59 | % | |
Class P4 | | | (2.37 | )% | | | 7.93 | % | | | 6.54 | % | |
After deducting maximum sales charge or PACE Select program fee | |
Class A1 | | | (6.98 | )% | | | 6.67 | % | | | 5.79 | % | |
Class C2 | | | (3.69 | )% | | | 7.16 | % | | | 5.76 | % | |
Class P4 | | | (4.30 | )% | | | 5.80 | % | | | 4.43 | % | |
Barclays US Government/Credit Index5 | | | (2.00 | )% | | | 5.33 | % | | | 4.90 | % | |
Lipper Intermediate Investment Grade Debt Funds median | | | (0.96 | )% | | | 5.78 | % | | | 4.67 | % | |
Average annual total returns for periods ended June 30, 2013, after deduction of the maximum sales charge or PACE Select program fee, were as follows: Class A—1-year period, (5.00)%; 5-year period, 6.78%; 10-year period, 5.32%; Class C—1-year period, (1.69)%; 5-year period, 7.25%; 10-year period, 5.30%; Class Y—1-year period, (0.29)%; 5-year period, 8.06%; 10-year period, 6.12%; Class P—1-year period, (2.32)%; 5-year period, 5.89%; 10-year period, 3.98%.
The annualized gross and net expense ratios, respectively, for each class of shares as in the November 28, 2012 prospectuses, were as follows: Class A—1.04% and 1.04%; Class C—1.52% and 1.52%; Class Y—0.89% and 0.81%; and Class P—0.82% and 0.81%. Net expenses reflect fee waivers and/or expense reimbursements, if any, pursuant to an agreement that is in effect to cap the expenses. The Portfolio and UBS Global Asset Management (Americas) Inc. ("UBS Global AM") have entered into a written fee waiver/expense reimbursement agreement pursuant to which UBS Global AM is contractually obligated to waive its management fees and/or reimburse expenses so that the Portfolio's ordinary total operating expenses of each class through November 30, 2013 (excluding dividend expense, borrowing costs, and interest expense relating to short sales, and expenses attributable to investment in other investment companies, interest, taxes, brokerage commissions and extraordinary expenses) would not exceed Class A—1.06%; Class C—1.56%; Class Y—0.81%; and Class P—0.81%. The Portfolio has agreed to repay UBS Global AM for any waived fees/reimbursed expenses to the extent that it can do so over the following three fiscal years without causing the Portfolio's expenses in any of those three years to exceed these expense caps. The fee waiver/expense reimbursement agreement may be terminated by the Portfolio's board at any time and also will terminate automatically upon the expiration or termination of the Portfolio's advisory contract with UBS Global AM. Upon termination of the agreement, however, UBS Global AM's three year recoupment rights will survive.
1 Maximum sales charge for Class A shares is 4.5%. Class A shares bear ongoing 12b-1 service fees.
2 Maximum contingent deferred sales charge for Class C shares is 0.75% imposed on redemptions and is reduced to 0% after one year. Class C shares bear ongoing 12b-1 service and distribution fees. Prior to September 30, 2003, Class C shares were subject to a maximum front-end sales charge of 1%; this front-end sales charge is not reflected in the average annual total returns presented for the Class C shares shown above.
3 The Portfolio offers Class Y shares to a limited group of eligible investors, including certain qualifying retirement plans. Class Y shares do not bear initial or contingent deferred sales charges or ongoing 12b-1 service and distribution fees.
4 Class P shares do not bear initial or contingent deferred sales charges or ongoing 12b-1 service and distribution fees, but are subject to a maximum annual PACE Select program fee of 2% of the value of Class P shares. Prior to June 14, 2010, the maximum annual PACE Select program fee was 1.5% of the value of Class P shares; however, the current maximum annual PACE Select program fee of 2% is reflected in the performance returns throughout all periods in the average annual total returns presented for the Class P shares shown above.
5 The Barclays US Government/Credit Index is an unmanaged index which is composed of all investment-grade bonds that have at least one year to maturity. The Index's total return comprises price appreciation/depreciation and income as a percentage of the original investment. The Index is rebalanced monthly by market capitalization. Investors should note that indices do not reflect the deduction of fees and expenses.
If an investor sells or exchanges shares less than 90 days after purchase, a redemption fee of 1.00% of the amount sold or exchanged will be deducted at the time of the transaction, except as noted otherwise in the prospectuses.
Past performance does not predict future performance, and the performance information provided does not reflect the deduction of taxes that a shareholder would pay on Portfolio distributions or the redemption of Portfolio shares. The return and principal value of an investment will fluctuate, so that an investor's shares, when redeemed, may be worth more or less than their original cost. Performance results assume reinvestment of all dividends and capital gain distributions at net asset value on the ex-dividend dates. Current performance may be higher or lower than the performance data quoted. For month-end performance figures, please visit http://globalam-us.ubs.com/corpweb/performance.do.
Lipper peer group data calculated by Lipper Inc.; used with permission. The Lipper median is the return of the fund that places in the middle of a Lipper peer group.
43
PACE Select Advisors Trust
PACE Strategic Fixed Income Investments
Portfolio statistics (unaudited)
Characteristics | | 07/31/13 | |
Weighted average duration | | | 6.0 yrs. | | |
Weighted average maturity | | | 7.3 yrs. | | |
Average coupon | | | 3.21 | % | |
Net assets (mm) | | $ | 925.4 | | |
Number of holdings | | | 334 | | |
Portfolio composition1 | | 07/31/13 | |
Bonds, notes and loan assignments | | | 96.2 | % | |
Preferred stock | | | 0.8 | | |
Investments sold short | | | (0.2 | ) | |
Swaptions, swaps, futures and forward foreign currency contracts | | | (1.4 | ) | |
Cash equivalents and other assets less liabilities | | | 4.6 | | |
Total | | | 100.0 | % | |
Quality diversification1 | | 07/31/13 | |
US government and agency securities | | | 51.2 | % | |
AAA | | | 2.8 | | |
AA | | | 5.8 | | |
A | | | 14.6 | | |
BBB | | | 7.8 | | |
BB | | | 5.0 | | |
B | | | 1.5 | | |
Below B/non-rated | | | 7.5 | | |
Preferred stock | | | 0.8 | | |
Investments sold short | | | (0.2 | ) | |
Swaptions, swaps, futures and forward foreign currency contracts | | | (1.4 | ) | |
Cash equivalents and other assets less liabilities | | | 4.6 | | |
Total | | | 100.0 | % | |
Asset allocation1 | | 07/31/13 | |
US government obligations | | | 35.3 | % | |
Corporate notes | | | 23.6 | | |
Collateralized mortgage obligations | | | 21.4 | | |
Asset-backed securities | | | 5.5 | | |
Non-US government obligations | | | 4.3 | | |
US government agency mortgage pass-through certificates | | | 3.4 | | |
Municipal bonds and notes | | | 2.3 | | |
Preferred stock | | | 0.8 | | |
Loan assignments | | | 0.4 | | |
Investments sold short | | | (0.2 | ) | |
Swaptions, swaps, futures, and forward foreign currency contracts | | | (1.4 | ) | |
Cash equivalents and other assets less liabilities | | | 4.6 | | |
Total | | | 100.0 | % | |
1 Weightings represent percentages of the Portfolio's net assets as of July 31, 2013. The Portfolio is actively managed and its composition will vary over time. Credit quality ratings shown are based on the ratings assigned to portfolio holdings by Standard & Poor's Ratings Group, an independent rating agency.
44
PACE Select Advisors Trust
PACE Strategic Fixed Income Investments
Portfolio of investments—July 31, 2013
| | | Face
amount1 | | Value | |
US government obligations1—35.24% | |
US Treasury Inflation Index
Bonds (TIPS)
0.625%, due 02/15/432 | | | 16,139,320 | | | $ | 13,388,067 | | |
2.000%, due 01/15/26 | | | 2,699,257 | | | | 3,123,124 | | |
2.375%, due 01/15/272 | | | 3,696,160 | | | | 4,452,428 | | |
2.500%, due 01/15/29 | | | 2,061,348 | | | | 2,537,552 | | |
US Treasury Notes
1.375%, due 06/30/18 | | | 287,000,000 | | | | 287,067,158 | | |
2.000%, due 02/15/23 | | | 16,300,000 | | | | 15,538,480 | | |
Total US government obligations
(cost—$363,456,529) | | | | | 326,106,809 | | |
Government national mortgage association
certificates—0.01% | |
GNMA II ARM
1.625%, due 11/20/23 | | | 5,180 | | | | 5,383 | | |
1.625%, due 01/20/26 | | | 12,473 | | | | 12,979 | | |
1.750%, due 07/20/25 | | | 6,801 | | | | 7,059 | | |
1.750%, due 05/20/26 | | | 21,098 | | | | 21,921 | | |
Total government national mortgage
association certificates
(cost—$45,997) | | | | | 47,342 | | |
Federal home loan mortgage corporation
certificates*—0.16% | |
FHLMC
7.645%, due 05/01/25 | | | 1,204,818 | | | | 1,407,434 | | |
FHLMC ARM
5.628%, due 03/01/36 | | | 104,794 | | | | 110,322 | | |
Total federal home loan mortgage
corporation certificates
(cost—$1,312,231) | | | | | 1,517,756 | | |
Federal housing administration
certificates—0.00%†† | |
FHA GMAC
7.430%, due 06/01/21 | | | 16,994 | | | | 16,994 | | |
FHA Reilly
7.430%, due 10/01/20 | | | 4,009 | | | | 4,009 | | |
Total federal housing
administration certificates
(cost—$22,213) | | | | | 21,003 | | |
Federal national mortgage association
certificates*—3.23% | |
FNMA
3.500%, due 11/01/212 | | | 4,086,079 | | | | 4,311,281 | | |
3.500%, due 12/01/25 | | | 1,088,436 | | | | 1,141,763 | | |
4.500%, due 04/01/292 | | | 690,774 | | | | 735,264 | | |
5.399%, due 11/01/34 | | | 9,291,032 | | | | 10,185,050 | | |
FNMA ARM
1.569%, due 08/01/40 | | | 52,862 | | | | 54,175 | | |
2.049%, due 05/01/30 | | | 63,687 | | | | 66,890 | | |
2.338%, due 04/01/27 | | | 20,295 | | | | 21,508 | | |
2.400%, due 05/01/27 | | | 17,412 | | | | 18,571 | | |
2.475%, due 10/01/35 | | | 118,837 | | | | 126,415 | | |
2.585%, due 01/01/36 | | | 109,004 | | | | 115,889 | | |
| | | Face
amount1 | | Value | |
Federal national mortgage association
certificates*—(concluded) | |
2.628%, due 03/01/36 | | | 90,997 | | | $ | 96,470 | | |
3.063%, due 09/01/35 | | | 130,120 | | | | 138,036 | | |
5.339%, due 01/01/36 | | | 192,381 | | | | 206,451 | | |
5.367%, due 11/01/35 | | | 158,882 | | | | 170,747 | | |
5.437%, due 03/01/36 | | | 118,892 | | | | 127,491 | | |
5.518%, due 12/01/35 | | | 143,712 | | | | 154,110 | | |
5.645%, due 02/01/36 | | | 223,427 | | | | 240,263 | | |
5.682%, due 06/01/36 | | | 30,273 | | | | 30,796 | | |
5.692%, due 03/01/36 | | | 129,058 | | | | 138,953 | | |
5.784%, due 03/01/36 | | | 128,534 | | | | 138,777 | | |
FNMA ARM COFI
3.250%, due 11/01/263 | | | 58,637 | | | | 53,945 | | |
FNMA
3.000%, VRD | | | 12,000,000 | | | | 11,627,813 | | |
Total federal national mortgage
association certificates
(cost—$28,608,538) | | | | | 29,900,658 | | |
Collateralized mortgage
obligations—21.41% | |
ARM Trust, Series 2005-5,
Class 2A1
2.871%, due 09/25/35 | | | 344,174 | | | | 305,878 | | |
Banc of America Funding Corp.,
Series 2005-D, Class A1
2.639%, due 05/25/35 | | | 2,328,477 | | | | 2,332,473 | | |
Series 2007-3, Class 2A1
5.500%, due 09/25/34 | | | 368,843 | | | | 366,682 | | |
Banc of America Large Loan,
Series 2010-HLTN, Class HLTN
2.491%, due 11/15/154 | | | 9,170,361 | | | | 9,214,691 | | |
Series 2010-UB5, Class A4A
5.634%, due 02/17/514 | | | 2,500,000 | | | | 2,845,175 | | |
Banc of America Merrill Lynch
Commercial Mortgage, Inc.,
Series 2003-2, Class BWG
8.155%, due 10/11/374 | | | 2,707,388 | | | | 2,739,075 | | |
Series 2003-2, Class BWK
10.676%, due 10/11/374 | | | 1,839,575 | | | | 1,868,930 | | |
Banc of America Merrill Lynch
Large Loan, Series 2012-PARK,
Class A
2.959%, due 12/10/304 | | | 1,000,000 | | | | 942,085 | | |
Banc of America Mortgage
Securities, Inc., Series 2004-H,
Class 2A2
3.104%, due 09/25/34 | | | 1,963,097 | | | | 1,924,371 | | |
Bank of America Mortgage
Securities, Inc., Series 2002-G,
Class 1A3
3.437%, due 07/20/32 | | | 5,645 | | | | 5,617 | | |
Bear Stearns Alternative Loan
Trust-A Trust,
Series 2003-3, Class 1A
2.417%, due 10/25/33 | | | 36,203 | | | | 33,020 | | |
45
PACE Select Advisors Trust
PACE Strategic Fixed Income Investments
Portfolio of investments—July 31, 2013
| | | Face
amount1 | | Value | |
Collateralized mortgage
obligations—(continued) | |
Series 2004-9, Class 2A1
2.941%, due 09/25/34 | | | 846,188 | | | $ | 724,577 | | |
Series 2005-7, Class 22A1
2.810%, due 09/25/35 | | | 1,334,083 | | | | 1,087,726 | | |
Series 2006-1, Class 21A2
2.564%, due 02/25/36 | | | 1,254,398 | | | | 748,570 | | |
Bear Stearns ARM Trust,
Series 2003-1, Class 5A1
2.423%, due 04/25/33 | | | 16,511 | | | | 16,224 | | |
Series 2003-1, Class 6A1
2.573%, due 04/25/33 | | | 69,409 | | | | 70,049 | | |
Series 2003-5, Class 2A1
2.600%, due 08/25/33 | | | 445,655 | | | | 445,287 | | |
Series 2004-3, Class 1A2
2.917%, due 07/25/34 | | | 333,519 | | | | 323,906 | | |
Series 2004-6, Class 2A1
3.013%, due 09/25/34 | | | 1,704,612 | | | | 1,566,075 | | |
Series 2004-7, Class 1A1
3.115%, due 10/25/34 | | | 456,847 | | | | 377,599 | | |
Series 2004-9, Class 22A1
3.454%, due 11/25/34 | | | 45,674 | | | | 46,001 | | |
Series 2005-2, Class A1
2.600%, due 03/25/35 | | | 1,369,566 | | | | 1,367,837 | | |
Series 2005-5, Class A2
2.320%, due 08/25/35 | | | 2,401,871 | | | | 2,383,769 | | |
Series 2005-9, Class A1
2.470%, due 10/25/35 | | | 1,755,106 | | | | 1,656,988 | | |
Chase Mortgage Finance Corp.,
Series 2005-S3, Class A10
5.500%, due 11/25/35 | | | 3,227,000 | | | | 3,177,811 | | |
Series 2007-S6, Class 2A1
5.500%, due 12/25/22 | | | 1,641,599 | | | | 1,672,279 | | |
Citigroup Mortgage Loan
Trust, Inc.,
Series 2005-11, Class A1A
2.540%, due 05/25/35 | | | 724,347 | | | | 701,134 | | |
Series 2005-4, Class A
5.306%, due 08/25/35 | | | 2,496,157 | | | | 2,405,215 | | |
Series 2005-6, Class A2
2.290%, due 09/25/35 | | | 164,087 | | | | 159,291 | | |
Series 2005-6, Class A3
1.940%, due 09/25/35 | | | 27,460 | | | | 26,983 | | |
Series 2006-AR1, Class 1A1
2.550%, due 10/25/35 | | | 4,119,246 | | | | 3,851,289 | | |
Countrywide Alternative
Loan Trust,
Series 2003-J3, Class 2A1
6.250%, due 12/25/33 | | | 200,713 | | | | 212,320 | | |
Series 2005-62, Class 2A1
1.168%, due 12/25/35 | | | 543,056 | | | | 375,508 | | |
Series 2006-41CB, Class 1A9
6.000%, due 01/25/37 | | | 1,129,121 | | | | 889,615 | | |
Countrywide Home Loan
Mortgage Pass Through Trust,
Series 2003-R4, Class 2A
6.500%, due 01/25/344 | | | 1,094,044 | | | | 1,132,576 | | |
| | | Face
amount1 | | Value | |
Collateralized mortgage
obligations—(continued) | |
Series 2004-12, Class 11A1
2.833%, due 08/25/34 | | | 591,191 | | | $ | 509,013 | | |
Series 2004-12, Class 11A2
2.833%, due 08/25/34 | | | 380,051 | | | | 337,549 | | |
Series 2004-12, Class 12A1
2.658%, due 08/25/34 | | | 121,634 | | | | 110,705 | | |
Series 2005-HYB9, Class 5A1
2.438%, due 02/20/36 | | | 410,581 | | | | 307,596 | | |
DLJ Commercial Mortgage Corp.,
Series 1999-CG2, Class B4
6.100%, due 06/10/324 | | | 767,127 | | | | 772,270 | | |
FHLMC REMIC,*
Series 1278, Class K
7.000%, due 05/15/22 | | | 61,227 | | | | 67,989 | | |
Series 1367, Class KA
6.500%, due 09/15/22 | | | 1,303 | | | | 1,439 | | |
Series 1502, Class PX
7.000%, due 04/15/23 | | | 352,066 | | | | 393,463 | | |
Series 1503, Class PZ
7.000%, due 05/15/23 | | | 114,530 | | | | 129,405 | | |
Series 1534, Class Z
5.000%, due 06/15/23 | | | 123,527 | | | | 134,384 | | |
Series 1548, Class Z
7.000%, due 07/15/23 | | | 83,760 | | | | 94,205 | | |
Series 1562, Class Z
7.000%, due 07/15/23 | | | 142,768 | | | | 162,413 | | |
Series 1694, Class Z
6.500%, due 03/15/24 | | | 63,276 | | | | 71,769 | | |
Series 2061, Class Z
6.500%, due 06/15/28 | | | 230,039 | | | | 257,260 | | |
Series 2400, Class FQ
0.691%, due 01/15/32 | | | 148,468 | | | | 149,545 | | |
Series 2579, Class DZ
5.000%, due 03/15/34 | | | 7,965,622 | | | | 8,716,079 | | |
Series 2764, Class LZ
4.500%, due 03/15/34 | | | 3,041,533 | | | | 3,264,645 | | |
Series 2764, Class ZG
5.500%, due 03/15/34 | | | 4,826,963 | | | | 5,314,448 | | |
Series 2835, Class JZ
5.000%, due 08/15/34 | | | 1,168,283 | | | | 1,261,853 | | |
Series 2921, Class PG
5.000%, due 01/15/35 | | | 6,200,000 | | | | 6,783,699 | | |
Series 2983, Class TZ
6.000%, due 05/15/35 | | | 6,155,404 | | | | 6,870,951 | | |
Series 3149, Class CZ
6.000%, due 05/15/36 | | | 7,720,011 | | | | 8,655,622 | | |
Series G23, Class KZ
6.500%, due 11/25/23 | | | 105,633 | | | | 119,596 | | |
Series T-054, Class 2A
6.500%, due 02/25/43 | | | 817,648 | | | | 976,121 | | |
Series T-058, Class 2A
6.500%, due 09/25/43 | | | 3,057,799 | | | | 3,420,570 | | |
Series T-075, Class A1
0.230%, due 12/25/36 | | | 1,494,875 | | | | 1,486,052 | | |
46
PACE Select Advisors Trust
PACE Strategic Fixed Income Investments
Portfolio of investments—July 31, 2013
| | | Face
amount1 | | Value | |
Collateralized mortgage
obligations—(continued) | |
First Horizon Mortgage Pass-Through
Trust, Series 2005-AR3, Class 2A1
2.615%, due 08/25/35 | | | 93,125 | | | $ | 88,740 | | |
FNMA REMIC,*
Series 1991-065, Class Z
6.500%, due 06/25/21 | | | 5,076 | | | | 5,491 | | |
Series 1992-040, Class ZC
7.000%, due 07/25/22 | | | 14,797 | | | | 16,475 | | |
Series 1992-129, Class L
6.000%, due 07/25/22 | | | 6,826 | | | | 7,559 | | |
Series 1993-037, Class PX
7.000%, due 03/25/23 | | | 18,367 | | | | 20,761 | | |
Series 1993-060, Class Z
7.000%, due 05/25/23 | | | 104,872 | | | | 117,070 | | |
Series 1993-070, Class Z
6.900%, due 05/25/23 | | | 15,844 | | | | 17,905 | | |
Series 1993-096, Class PZ
7.000%, due 06/25/23 | | | 90,615 | | | | 101,227 | | |
Series 1993-160, Class ZB
6.500%, due 09/25/23 | | | 32,710 | | | | 36,576 | | |
Series 1993-163, Class ZB
7.000%, due 09/25/23 | | | 8,878 | | | | 10,109 | | |
Series 1994-023, Class PX
6.000%, due 08/25/23 | | | 23,272 | | | | 23,432 | | |
Series 1998-066, Class FG
0.490%, due 12/25/28 | | | 69,785 | | | | 69,847 | | |
Series 1999-W4, Class A9
6.250%, due 02/25/29 | | | 498,538 | | | | 562,563 | | |
Series 2000-034, Class F
0.640%, due 10/25/30 | | | 10,141 | | | | 10,155 | | |
Series 2002-080, Class A1
6.500%, due 11/25/42 | | | 1,479,054 | | | | 1,646,795 | | |
Series 2003-064, Class AH
6.000%, due 07/25/33 | | | 5,974,922 | | | | 6,664,099 | | |
Series 2003-W8, Class 2A
7.000%, due 10/25/42 | | | 71,609 | | | | 82,333 | | |
Series 2004-T1, Class 1A1
6.000%, due 01/25/44 | | | 1,123,426 | | | | 1,190,619 | | |
Series 2004-W8, Class 2A
6.500%, due 06/25/44 | | | 1,556,677 | | | | 1,805,553 | | |
Series 2005-024, Class ZE
5.000%, due 04/25/35 | | | 1,724,735 | | | | 1,876,463 | | |
Series 2005-116, Class TZ
5.500%, due 01/25/36 | | | 8,338,460 | | | | 9,222,545 | | |
Series 2005-120, Class ZU
5.500%, due 01/25/36 | | | 8,410,043 | | | | 9,220,048 | | |
Series 2006-065, Class GD
6.000%, due 07/25/26 | | | 2,706,044 | | | | 3,021,556 | | |
GNMA REMIC,
Trust Series 2000-009, Class FG
0.792%, due 02/16/30 | | | 94,175 | | | | 95,556 | | |
Trust Series 2002-031, Class FW
0.592%, due 06/16/31 | | | 97,835 | | | | 98,818 | | |
Trust Series 2003-98, Class Z
6.000%, due 11/20/33 | | | 12,640,538 | | | | 14,294,389 | | |
Trust Series 2005-26, Class ZA
5.500%, due 01/20/35 | | | 7,582,948 | | | | 8,647,435 | | |
| | | Face
amount1 | | Value | |
Collateralized mortgage
obligations—(continued) | |
GS Residential Mortgage Loan
Trust, Series 2005-AR6,
Class 2A1
2.664%, due 09/25/35 | | | 1,424,712 | | | $ | 1,400,679 | | |
Harborview Mortgage
Loan Trust,
Series 2004-11, Class 3A1A
0.542%, due 01/19/35 | | | 103,279 | | | | 69,953 | | |
Series 2005-4, Class 3A1
2.758%, due 07/19/35 | | | 562,895 | | | | 478,273 | | |
Housing Security, Inc.,
Series 1992-8, Class B
2.730%, due 06/25/24 | | | 157,324 | | | | 156,926 | | |
JP Morgan Mortgage Trust
2006-A4, Series 2006-A4,
Class 2A2
2.505%, due 06/25/36 | | | 1,022,326 | | | | 880,951 | | |
JP Morgan Mortgage Trust,
Series 2005-A8, Class 1A1
5.153%, due 11/25/35 | | | 3,460,288 | | | | 3,260,166 | | |
Lehman Brothers Mortgage
Trust, Series 1991-2,
Class A3
8.520%, due 01/20/17 | | | 112,810 | | | | 115,797 | | |
NAAC Reperforming Loan
REMIC Trust 2004-R3,
Series 2004-R3, Class A1
6.500%, due 02/25/354 | | | 1,321,630 | | | | 1,380,465 | | |
RBSSP Resecuritization Trust
2009-3, Series 2009-3,
Class 1A3
5.500%, due 11/26/355 | | | 106,213 | | | | 105,901 | | |
Residential Accredit Loans, Inc.,
Series 2006-Q03, Class A1
0.400%, due 04/25/46 | | | 1,663,495 | | | | 748,173 | | |
Residential Asset Securitization
Trust, Series 2006-A14C,
Class 2A6
0.640%, due 12/25/36 | | | 1,421,068 | | | | 506,412 | | |
Residential Funding Mortgage
Security I, Series 2004-S9,
Class 1A23
5.500%, due 12/25/34 | | | 2,300,000 | | | | 2,358,011 | | |
Sequoia Mortgage Trust,
Series 2005-4, Class 2A1
2.650%, due 04/20/35 | | | 1,996,059 | | | | 1,955,988 | | |
Series 2007-3, Class 1A1
0.392%, due 07/20/36 | | | 510,569 | | | | 451,061 | | |
Small Business Administration,
Series 1999-20K, Class 1
7.060%, due 11/01/19 | | | 142,958 | | | | 156,587 | | |
Series 2000-20K, Class 1
7.220%, due 11/01/20 | | | 209,278 | | | | 232,935 | | |
Series 2002-20K, Class 1
5.080%, due 11/01/22 | | | 1,200,873 | | | | 1,310,030 | | |
47
PACE Select Advisors Trust
PACE Strategic Fixed Income Investments
Portfolio of investments—July 31, 2013
| | | Face
amount1 | | Value | |
Collateralized mortgage
obligations—(concluded) | |
Series 2003-20I, Class 1
5.130%, due 09/01/23 | | | 292,110 | | | $ | 316,583 | | |
Series 2003-20L, Class 1
4.890%, due 12/01/23 | | | 784,093 | | | | 856,375 | | |
Series 2004-P10A, Class 1
4.504%, due 02/10/14 | | | 526,565 | | | | 531,397 | | |
Series 2005-20H, Class 1
5.110%, due 08/01/25 | | | 1,211,478 | | | | 1,325,393 | | |
Series 2007-20D, Class 1
5.320%, due 04/01/27 | | | 3,524,400 | | | | 3,886,592 | | |
Structured ARM Loan Trust,
Series 2004-8, Class 3A
2.510%, due 07/25/34 | | | 1,100,189 | | | | 1,078,682 | | |
Structured Asset Mortgage
Investments, Inc.,
Series 2002-AR3, Class A1
0.852%, due 09/19/32 | | | 286,710 | | | | 274,566 | | |
Series 2006-AR3, Class 11A1
0.400%, due 04/25/36 | | | 3,725,826 | | | | 2,577,732 | | |
Structured Asset Securities
Corp., Series 2001-SB1,
Class A2
3.375%, due 08/25/31 | | | 1,297,134 | | | | 1,274,246 | | |
WaMu Mortgage Pass Through
Certificates,
Series 2002-AR6, Class A
1.562%, due 06/25/42 | | | 46,085 | | | | 41,057 | | |
Series 2005-AR1, Class A1A
0.510%, due 01/25/45 | | | 126,422 | | | | 114,191 | | |
Series 2005-AR13, Class A1A1
0.480%, due 10/25/45 | | | 1,466,204 | | | | 1,317,002 | | |
Series 2005-AR2, Class 2A1A
0.500%, due 01/25/45 | | | 145,822 | | | | 132,467 | | |
Series 2006-AR2, Class 2A1
4.557%, due 03/25/36 | | | 1,471,570 | | | | 1,359,952 | | |
Series 2006-AR7, Class 3A
2.451%, due 07/25/46 | | | 2,216,244 | | | | 1,985,149 | | |
Series 2006-AR9, Class 1A
1.163%, due 08/25/46 | | | 1,603,051 | | | | 1,274,486 | | |
Series 2006-AR9, Class 2A
2.451%, due 08/25/46 | | | 1,211,346 | | | | 1,038,830 | | |
Wells Fargo Mortgage Backed
Securities Trust,
Series 2003-M, Class A1
4.694%, due 12/25/33 | | | 367,294 | | | | 368,226 | | |
Series 2004-CC, Class A1
2.619%, due 01/25/35 | | | 232,937 | | | | 229,542 | | |
Series 2004-DD, Class 2A6
2.618%, due 01/25/35 | | | 2,751,726 | | | | 2,696,218 | | |
Series 2006-AR2, Class 2A1
2.640%, due 03/25/36 | | | 1,827,176 | | | | 1,804,009 | | |
Series 2006-AR8, Class 1A1
2.680%, due 04/25/36 | | | 757,406 | | | | 748,430 | | |
Total collateralized mortgage
obligations
(cost—$186,556,306) | | | | | 198,118,819 | | |
| | | Face
amount1 | | Value | |
Asset-backed securities—5.51% | |
Black Diamond CLO 2005-1
Delaware Corp. Series 2005-1A,
Class A1A
0.522%, due 06/20/174 | | | 23,729 | | | $ | 23,669 | | |
BlueMountain CLO Ltd.
Series 2005-1A, Class A1F
0.513%, due 11/15/174 | | | 330,794 | | | | 329,544 | | |
Countrywide Asset-Backed
Certificates,
Series 2005-13, Class 3AV3
0.440%, due 04/25/36 | | | 934,873 | | | | 907,882 | | |
Series 2006-4, Class 2A2
0.370%, due 07/25/36 | | | 888,369 | | | | 861,883 | | |
Credit Suisse Mortgage Capital
Certificate 2010-UD1
5.759%, due 12/18/494 | | | 1,126,746 | | | | 1,271,229 | | |
CSAB Mortgage Backed Trust,
Series 2006-1, Class A6A
6.172%, due 06/25/366 | | | 673,209 | | | | 447,769 | | |
Delta Funding Home Equity
Loan Trust, Series 1999-003,
Class A1A
1.011%, due 09/15/29 | | | 60,720 | | | | 53,296 | | |
Duane Street CLO III Ltd.
Series 2006-3A, Class A1
0.519%, due 01/11/214 | | | 4,179,295 | | | | 4,127,793 | | |
EFS Volunteer LLC,
Series 2010-1, Class A1
1.116%, due 10/26/264 | | | 515,568 | | | | 510,153 | | |
Euro-Galaxy CLO BV,
Series 2006-1X, Class A2
0.460%, due 10/23/215,7 | | | 4,588,116 | | | | 5,882,012 | | |
First Frankin Mortgage
Loan Trust 2005-FFH3,
Series 2005-FFH3, Class M2
0.720%, due 09/25/35 | | | 1,000,000 | | | | 902,699 | | |
Franklin CLO Ltd.
Series 5A, Class A2
0.533%, due 06/15/184 | | | 5,714,000 | | | | 5,584,693 | | |
Galaxy CLO Ltd.
Series 2005-5A, Class A1
0.526%, due 10/20/174 | | | 75,803 | | | | 75,647 | | |
Goldentree Loan
Opportunities V Ltd.
Series 2007-5A, Class A
0.961%, due 10/18/214 | | | 2,500,000 | | | | 2,461,785 | | |
Home Equity Asset Trust 2005-2,
Series 2005-2, Class M5
1.285%, due 07/25/35 | | | 1,000,000 | | | | 849,945 | | |
Inwood Park CDO Ltd.
Series 2006-1A, Class A1A
0.491%, due 01/20/214 | | | 4,779,109 | | | | 4,735,978 | | |
Kingsland I Ltd.
Series 2005-1A, Class A1A
0.522%, due 06/13/194 | | | 1,016,165 | | | | 1,011,663 | | |
48
PACE Select Advisors Trust
PACE Strategic Fixed Income Investments
Portfolio of investments—July 31, 2013
| | | Face
amount1 | | Value | |
Asset-backed securities—(concluded) | |
Landmark V CDO Ltd.
Series 2005-1A, Class A1L
0.575%, due 06/01/174 | | | 280,405 | | | $ | 280,250 | | |
Landmark VII CDO Ltd.
Series 2006-7A, Class A1L
0.543%, due 07/15/184 | | | 4,968,066 | | | | 4,913,959 | | |
LightPoint Pan-European
CLO 2006-1 PLC,
Series 2006-1X, Class A
0.476%, due 01/31/225,7 | | | 984,489 | | | | 1,282,560 | | |
Madison Park Funding I Ltd.
Series 2005-1A, Class AT
0.545%, due 05/10/194 | | | 889,894 | | | | 885,394 | | |
Mid-State Trust Series 4, Class A
8.330%, due 04/01/30 | | | 181,373 | | | | 191,749 | | |
Morgan Stanley ABS
Capital I, Inc.
Trust 2005-HE1,
Series 2005-HE1, Class M2
0.895%, due 12/25/34 | | | 2,100,261 | | | | 2,006,732 | | |
New Century Home Equity
Loan Trust, Series 2005-D,
Series 2005-D, Class A2D
0.520%, due 02/25/36 | | | 2,000,000 | | | | 1,639,290 | | |
Saxon Asset Securities
Trust 2004-1,
Series 2004-1, Class M1
0.985%, due 03/25/35 | | | 1,360,088 | | | | 1,156,447 | | |
SLC Student Loan Trust,
Series 2008-2, Class A2
0.723%, due 06/15/17 | | | 2,192,200 | | | | 2,193,271 | | |
SLM Student Loan Trust,
Series 2008-9, Class A
1.766%, due 04/25/23 | | | 4,573,195 | | | | 4,704,221 | | |
Stone Tower CLO III Ltd.
Series 2005-3X, Class A1
0.533%, due 05/26/175,7 | | | 1,422,601 | | | | 1,417,603 | | |
Structured Asset Securities
Corp. 2005-WF1,
Series 2005-WF1, Class M1
0.630%, due 02/25/35 | | | 282,309 | | | | 257,635 | | |
Total asset-backed securities
(cost—$50,977,689) | | | | | 50,966,751 | | |
Corporate notes—23.55% | |
Airlines—0.65% | |
American Airlines Pass
Through Trust 2009-1A
10.375%, due 07/02/19 | | | 2,353,428 | | | | 2,506,401 | | |
Continental Airlines Pass
Through Trust 2009-2,
Series A
7.250%, due 11/10/19 | | | 170,272 | | | | 189,214 | | |
Northwest Airlines,
Series 2000-1, Class G
7.150%, due 10/01/19 | | | 3,158,868 | | | | 3,325,025 | | |
| | | | 6,020,640 | | |
| | | Face
amount1 | | Value | |
Corporate notes—(continued) | |
Banking-non-US—4.53% | |
Banco Bradesco SA
2.374%, due 05/16/144,8 | | | 4,100,000 | | | $ | 4,100,000 | | |
Banco do Brasil SA
3.875%, due 10/10/22 | | | 2,200,000 | | | | 1,941,500 | | |
Banco Mercantil del Norte SA
4.375%, due 07/19/154 | | | 1,800,000 | | | | 1,869,750 | | |
Banco Santander Brasil SA
2.373%, due 03/18/144,8 | | | 4,200,000 | | | | 4,186,602 | | |
4.250%, due 01/14/164 | | | 3,500,000 | | | | 3,570,000 | | |
DNB Bank ASA
3.200%, due 04/03/174 | | | 4,900,000 | | | | 5,103,938 | | |
Eksportfinans ASA
0.471%, due 10/07/138 | | | 100,000 | | | | 99,656 | | |
0.890%, due 06/16/15 | | JPY | 100,000,000 | | | | 955,061 | | |
1.600%, due 03/20/14 | | JPY | 2,000,000 | | | | 20,204 | | |
2.000%, due 09/15/15 | | | 1,100,000 | | | | 1,061,500 | | |
2.375%, due 05/25/16 | | | 900,000 | | | | 859,500 | | |
2.875%, due 11/16/16 | | CHF | 100,000 | | | | 106,164 | | |
3.000%, due 11/17/14 | | | 300,000 | | | | 299,400 | | |
5.500%, due 05/25/169 | | | 800,000 | | | | 828,000 | | |
5.500%, due 06/26/17 | | | 400,000 | | | | 414,500 | | |
Export-Import Bank of Korea
1.250%, due 11/20/15 | | | 600,000 | | | | 598,662 | | |
4.375%, due 09/15/21 | | | 1,300,000 | | | | 1,352,000 | | |
5.000%, due 04/11/22 | | | 4,200,000 | | | | 4,547,634 | | |
5.125%, due 06/29/20 | | | 400,000 | | | | 433,960 | | |
5.875%, due 01/14/15 | | | 2,600,000 | | | | 2,764,814 | | |
ICICI Bank Ltd.
5.000%, due 01/15/167 | | | 2,500,000 | | | | 2,606,950 | | |
5.500%, due 03/25/154 | | | 3,000,000 | | | | 3,130,380 | | |
LBG Capital No.1 PLC
8.500%, due 12/17/214,8,10 | | | 400,000 | | | | 406,374 | | |
Royal Bank of Scotland PLC MTN
9.500%, due 03/16/227 | | | 600,000 | | | | 663,900 | | |
| | | | 41,920,449 | | |
Banking-US—2.81% | |
Aviation Capital Group Corp.
6.750%, due 04/06/215 | | | 1,200,000 | | | | 1,283,459 | | |
Bank of America Corp.
5.650%, due 05/01/18 | | | 1,100,000 | | | | 1,236,550 | | |
5.750%, due 12/01/17 | | | 1,000,000 | | | | 1,127,462 | | |
6.000%, due 09/01/17 | | | 1,000,000 | | | | 1,130,913 | | |
7.625%, due 06/01/19 | | | 3,800,000 | | | | 4,638,800 | | |
Bank of America Corp. MTN
1.685%, due 01/30/148 | | | 2,900,000 | | | | 2,916,037 | | |
CIT Group, Inc.
4.750%, due 02/15/154 | | | 200,000 | | | | 206,500 | | |
5.250%, due 04/01/144 | | | 1,500,000 | | | | 1,530,000 | | |
JPMorgan Chase Bank N.A.
0.602%, due 06/13/168 | | | 400,000 | | | | 393,167 | | |
0.890%, due 05/31/178 | | EUR | 4,400,000 | | | | 5,707,511 | | |
4.375%, due 11/30/217,8 | | EUR | 500,000 | | | | 688,416 | | |
5.875%, due 06/13/16 | | | 1,100,000 | | | | 1,229,886 | | |
6.000%, due 10/01/17 | | | 3,400,000 | | | | 3,889,739 | | |
| | | | 25,978,440 | | |
49
PACE Select Advisors Trust
PACE Strategic Fixed Income Investments
Portfolio of investments—July 31, 2013
| | | Face
amount1 | | Value | |
Corporate notes—(continued) | |
Diversified financials—2.90% | |
American Express Co.
6.800%, due 09/01/668 | | | 3,800,000 | | | $ | 4,056,500 | | |
Doric Nimrod Air Finance
Alpha Ltd. 2012-1,
Class A Pass Through Trust
5.125%, due 11/30/224 | | | 581,806 | | | | 578,897 | | |
Goldman Sachs Group, Inc.
0.666%, due 07/22/158 | | | 300,000 | | | | 297,967 | | |
0.723%, due 03/22/168 | | | 1,200,000 | | | | 1,186,368 | | |
0.769%, due 01/12/158 | | | 1,100,000 | | | | 1,096,187 | | |
3.700%, due 08/01/15 | | | 1,700,000 | | | | 1,774,758 | | |
5.150%, due 01/15/14 | | | 4,500,000 | | | | 4,590,504 | | |
5.950%, due 01/18/18 | | | 3,200,000 | | | | 3,611,856 | | |
Lehman Brothers Holdings,
Inc. MTN
0.000%, due 12/30/4911 | | | 1,900,000 | | | | 467,875 | | |
1.000%, due 01/24/1311 | | | 900,000 | | | | 221,625 | | |
1.000%, due 12/30/1611 | | | 4,500,000 | | | | 1,119,375 | | |
Merrill Lynch & Co. MTN
6.875%, due 04/25/18 | | | 6,700,000 | | | | 7,863,415 | | |
| | | | 26,865,327 | | |
Electric-generation—0.72% | |
Korea Hydro & Nuclear Power Co. Ltd.
6.250%, due 06/17/144 | | | 6,278,000 | | | | 6,532,743 | | |
6.250%, due 06/17/147 | | | 100,000 | | | | 104,058 | | |
| | | | 6,636,801 | | |
Electric-integrated—0.96% | |
Centrais Eletricas Brasileiras SA
6.875%, due 07/30/194 | | | 200,000 | | | | 212,250 | | |
Puget Energy, Inc.
6.500%, due 12/15/20 | | | 7,600,000 | | | | 8,663,848 | | |
| | | | 8,876,098 | | |
Finance-non-captive diversified—1.25% | |
Ford Motor Credit Co. LLC
2.750%, due 05/15/15 | | | 1,025,000 | | | | 1,043,231 | | |
4.250%, due 02/03/17 | | | 4,100,000 | | | | 4,328,624 | | |
8.000%, due 06/01/14 | | | 1,100,000 | | | | 1,157,147 | | |
8.000%, due 12/15/16 | | | 600,000 | | | | 703,908 | | |
8.700%, due 10/01/14 | | | 4,000,000 | | | | 4,330,564 | | |
| | | | 11,563,474 | | |
Financial services—4.45% | |
Ally Financial, Inc.
3.475%, due 02/11/148 | | | 1,100,000 | | | | 1,109,482 | | |
3.672%, due 06/20/148 | | | 2,900,000 | | | | 2,936,018 | | |
4.500%, due 02/11/14 | | | 2,300,000 | | | | 2,327,600 | | |
4.625%, due 06/26/15 | | | 2,700,000 | | | | 2,788,142 | | |
8.300%, due 02/12/15 | | | 500,000 | | | | 539,375 | | |
Citicorp Lease Pass-Through
Trust 1999-1
8.040%, due 12/15/194 | | | 1,000,000 | | | | 1,206,679 | | |
Citigroup, Inc.
1.975%, due 05/15/188 | | | 900,000 | | | | 931,291 | | |
| | | Face
amount1 | | Value | |
Corporate notes—(continued) | |
Financial services—(concluded) | |
4.587%, due 12/15/15 | | | 400,000 | | | $ | 428,544 | | |
5.500%, due 10/15/14 | | | 250,000 | | | | 263,047 | | |
8.500%, due 05/22/19 | | | 3,000,000 | | | | 3,827,472 | | |
HSBC Finance Corp.
6.676%, due 01/15/21 | | | 1,400,000 | | | | 1,582,987 | | |
JPMorgan Chase & Co.
4.250%, due 10/15/20 | | | 3,500,000 | | | | 3,685,272 | | |
4.400%, due 07/22/20 | | | 600,000 | | | | 638,709 | | |
6.300%, due 04/23/19 | | | 400,000 | | | | 470,429 | | |
Morgan Stanley
1.865%, due 01/24/148 | | | 1,000,000 | | | | 1,005,124 | | |
7.300%, due 05/13/19 | | | 3,270,000 | | | | 3,876,323 | | |
Morgan Stanley MTN
6.000%, due 04/28/15 | | | 3,100,000 | | | | 3,334,078 | | |
SLM Corp.
5.000%, due 10/01/13 | | | 700,000 | | | | 703,500 | | |
SLM Corp. MTN
6.250%, due 01/25/16 | | | 8,400,000 | | | | 8,946,000 | | |
8.450%, due 06/15/18 | | | 500,000 | | | | 575,060 | | |
| | | | 41,175,132 | | |
Insurance—2.02% | |
American International Group, Inc.
6.765%, due 11/15/17 | | GBP | 773,000 | | | | 1,380,385 | | |
8.175%, due 05/15/588 | | | 6,400,000 | | | | 7,824,000 | | |
8.250%, due 08/15/18 | | | 4,100,000 | | | | 5,129,932 | | |
8.625%, due 05/22/387,8 | | GBP | 750,000 | | | | 1,334,897 | | |
Progressive Corp.
6.700%, due 06/15/378 | | | 2,800,000 | | | | 3,052,000 | | |
| | | | 18,721,214 | | |
Medical providers—0.99% | |
HCA, Inc.
6.500%, due 02/15/20 | | | 8,314,000 | | | | 9,155,793 | | |
Oil & gas—0.45% | |
Southwestern Energy Co.
7.500%, due 02/01/18 | | | 3,506,000 | | | | 4,189,807 | | |
Oil refining—0.04% | |
Valero Energy Corp.
6.625%, due 06/15/37 | | | 300,000 | | | | 335,718 | | |
Oil services—1.27% | |
BP Capital Markets PLC
3.625%, due 05/08/14 | | | 200,000 | | | | 204,881 | | |
El Paso Corp.
7.000%, due 06/15/17 | | | 1,241,000 | | | | 1,382,704 | | |
Petrobras Global Finance BV
1.894%, due 05/20/168 | | | 3,500,000 | | | | 3,447,500 | | |
2.000%, due 05/20/16 | | | 6,500,000 | | | | 6,443,970 | | |
TNK-BP Finance SA
7.875%, due 03/13/187 | | | 200,000 | | | | 232,000 | | |
| | | | 11,711,055 | | |
50
PACE Select Advisors Trust
PACE Strategic Fixed Income Investments
Portfolio of investments—July 31, 2013
| | | Face
amount1 | | Value | |
Corporate notes—(concluded) | |
Retail—0.18% | |
Macy's Retail Holdings, Inc.
7.875%, due 07/15/15 | | | 1,457,000 | | | $ | 1,644,892 | | |
Special purpose entity—0.22% | |
IPIC GMTN Ltd.
3.125%, due 11/15/154 | | | 2,000,000 | | | | 2,055,000 | | |
Steel producers/products—0.11% | |
CSN Resources SA
6.500%, due 07/21/204,9 | | | 1,000,000 | | | | 937,500 | | |
GTL Trade Finance, Inc.
7.250%, due 10/20/174 | | | 100,000 | | | | 110,970 | | |
| | | | 1,048,470 | | |
Total corporate notes
(cost—$209,793,408) | | | | | 217,898,310 | | |
Loan assignments—0.43% | |
Diversified financial services—0.15% | |
Springleaf Financial Funding Co.
Term Loan
5.500%, due 05/10/17 | | | 1,440,000 | | | | 1,440,907 | | |
Health care—0.28% | |
Biomet, Inc. Term Loan B1
3.190%, due 03/25/15 | | | 467,865 | | | | 470,673 | | |
Davita, Inc. Term Loan B2
4.000%, due 11/01/19 | | | 2,089,500 | | | | 2,099,195 | | |
| | | | 2,569,868 | | |
Total loan assignments
(cost—$3,968,539) | | | | | 4,010,775 | | |
Non-US government obligations—4.33% | |
Brazil Letras do Tesouro Nacional
0.000%, due 01/01/1712 | | BRL | 34,300,000 | | | | 10,526,698 | | |
Emirate of Abu Dhabi
6.750%, due 04/08/194 | | | 2,300,000 | | | | 2,788,750 | | |
Mexican Bonos, Series M
10.000%, due 12/05/24 | | MXN | 12,500,000 | | | | 1,304,050 | | |
Mexico Government
International Bond
6.050%, due 01/11/409 | | | 1,600,000 | | | | 1,764,000 | | |
Notas do Tesouro Nacional
10.000%, due 01/01/14 | | BRL | 3,880,000 | | | | 1,703,709 | | |
10.000%, due 01/01/17 | | BRL | 30,975,000 | | | | 13,208,556 | | |
10.000%, due 01/01/21 | | BRL | 580,000 | | | | 240,312 | | |
10.000%, due 01/01/23 | | BRL | 581,000 | | | | 240,537 | | |
Republic of Korea
7.125%, due 04/16/19 | | | 400,000 | | | | 490,432 | | |
State of Qatar
4.000%, due 01/20/155 | | | 4,300,000 | | | | 4,472,000 | | |
5.250%, due 01/20/204 | | | 2,100,000 | | | | 2,346,750 | | |
6.400%, due 01/20/404 | | | 200,000 | | | | 228,500 | | |
United Kingdom Gilt
1.750%, due 09/07/22 | | GBP | 500,000 | | | | 722,784 | | |
Total non-US government
obligations
(cost—$44,246,855) | | | | | 40,037,078 | | |
| | | Face
amount1 | | Value | |
Municipal bonds and notes—2.29% | |
Education—0.98% | |
Clark County School District,
Limited Tax (Building), Series A
5.000%, due 06/15/19 | | | 300,000 | | | $ | 339,279 | | |
Los Angeles Unified School
District Refunding,
4.500%, due 07/01/25 | | | 3,200,000 | | | | 3,432,064 | | |
4.500%, due 01/01/28 | | | 3,800,000 | | | | 3,872,694 | | |
New York City Transitional
Finance Authority Building Aid
Revenue Fiscal 2008,
Series S-1
5.000%, due 01/15/25 | | | 100,000 | | | | 108,718 | | |
Will County Community High
School District No. 210
Lincoln-Way (Capital
Appreciation) (AGM Insured)
0.000%, due 01/01/2112 | | | 1,600,000 | | | | 1,278,849 | | |
| | | | 9,031,604 | | |
General obligation—0.36% | |
California State (Build
America Bonds)
7.500%, due 04/01/34 | | | 1,400,000 | | | | 1,845,424 | | |
Cook County Build America Bonds
(Recovery Zone Economic
Development)
6.360%, due 11/15/33 | | | 1,200,000 | | | | 1,277,880 | | |
Denver Arena Trust Revenue Note
6.940%, due 11/15/195 | | | 212,429 | | | | 216,002 | | |
| | | | 3,339,306 | | |
Tobacco—0.06% | |
Buckeye Tobacco Settlement
Financing Authority
(Asset Backed Series Turbo),
Series A-2
5.875%, due 06/01/47 | | | 500,000 | | | | 371,945 | | |
Tobacco Settlement
Funding Corp., Rhode Island,
Series A
6.250%, due 06/01/42 | | | 200,000 | | | | 200,176 | | |
| | | | 572,121 | | |
Transportation—0.67% | |
Bay Area Toll Authority Toll
Bridge Revenue (Build
America Bonds)
6.263%, due 04/01/49 | | | 1,500,000 | | | | 1,844,520 | | |
Harris County Metropolitan
Transportation Authority
(Build America Bonds), Series C
6.875%, due 11/01/38 | | | 3,100,000 | | | | 3,584,592 | | |
Port Authority of New York &
New Jersey Consolidated
(One Hundred Fifty-Eight)
5.859%, due 12/01/24 | | | 700,000 | | | | 805,189 | | |
| | | | 6,234,301 | | |
51
PACE Select Advisors Trust
PACE Strategic Fixed Income Investments
Portfolio of investments—July 31, 2013
| | | Face
amount1 | | Value | |
Municipal bonds and notes—(concluded) | |
Utilities—0.22% | |
Cincinnati Water System Revenue
(Build America Bonds), Series B
6.458%, due 12/01/34 | | | 100,000 | | | $ | 109,297 | | |
Metropolitan Water District
Southern California
(Build America Bonds)
5.906%, due 07/01/25 | | | 1,700,000 | | | | 1,905,258 | | |
| | | | 2,014,555 | | |
Total municipal bonds and notes
(cost—$18,343,968) | | | | | 21,191,887 | | |
| | | Number of
shares | | | |
Preferred stock13—0.80% | |
Commercial banks—0.80% | |
Wells Fargo & Co.
(cost—$3,810,820) | | | 6,400 | | | | 7,443,200 | | |
| | | Face
amount1 | | | |
Certificates of deposit—1.77% | |
Banking-non-US—1.77% | |
Banco Do Brasil SA
0.010%, due 03/27/14 | | | 15,800,000 | | | | 15,665,974 | | |
1.000%, due 11/01/13 | | | 100,000 | | | | 99,660 | | |
Itau Unibanco SA New York
0.010%, due 10/31/13 | | | 600,000 | | | | 597,759 | | |
Total certificates of deposit
(cost—$16,363,393) | | | | | 16,363,393 | | |
Commercial paper14—0.59% | |
Banking-US—0.59% | |
Daimler Finance North America LLC
1.070%, due 10/15/135
(cost—$5,487,740) | | | 5,500,000 | | | | 5,487,740 | | |
Short-term US government obligations14—0.61% | |
US Treasury Bills
0.093%, due 08/15/132 | | | 332,000 | | | | 331,995 | | |
0.171%, due 09/19/132 | | | 272,000 | | | | 271,983 | | |
0.023%, due 10/24/13 | | | 5,000,000 | | | | 4,999,738 | | |
Total short-term US government
obligations
(cost—$5,603,716) | | | | | 5,603,716 | | |
| | | Face
amount1 | | Value | |
Repurchase agreements—1.47% | |
Repurchase agreement dated
07/31/13 with State Street Bank
and Trust Co., 0.010%
due 08/01/13, collateralized
by $23,302 Federal Home Loan
Mortgage Corp. obligations,
1.960% due 11/07/22, $537,158
Federal National Mortgage
Association obligations, 2.140% to
2.170% due 11/07/22 and
$17,663 US Treasury Notes,
0.250% to 0.750% due 10/31/13
to 12/15/13; (value—$543,666);
proceeds: $533,000 | | | 533,000 | | | $ | 533,000 | | |
Repurchase agreement dated
07/31/13 with Citigroup Global
Markets, Inc., 0.110%
due 08/01/13, collateralized
by $14,185,000 Federal National
Mortgage Association obligations,
1.630% due 10/30/20;
(value—$13,363,334);
proceeds: $13,100,040 | | | 13,100,000 | | | | 13,100,000 | | |
Total repurchase agreements
(cost—$13,633,000) | | | | | 13,633,000 | | |
| | | Number of
shares | | | |
Investment of cash collateral from securities loaned—0.34% | |
Money market fund—0.34% | |
UBS Private Money Market Fund LLC15
(cost—$3,121,965) | | | 3,121,965 | | | | 3,121,965 | | |
Total investments before
investments sold short
(cost—$955,352,907)—101.74% | | | | | 941,470,202 | | |
| | | Face
amount1 | | | |
Investments sold short—(0.17)% | |
FNMA TBA*
3.500% | | | (1,000,000 | ) | | | (1,048,555 | ) | |
| | 4.500 | % | | | (500,000 | ) | | | (529,765 | ) | |
Total investments sold short
(proceeds—$1,569,375)—(0.17)% | | | | | (1,578,320 | ) | |
Liabilities in excess of
other assets—(1.57)% | | | | | (14,492,274 | ) | |
Net assets—100.00% | | | | $ | 925,399,608 | | |
52
PACE Select Advisors Trust
PACE Strategic Fixed Income Investments
Portfolio of investments—July 31, 2013
For a listing of defined portfolio acronyms, counterparty acronyms, and currency abbreviations that are used throughout the Portfolio of investments as well as the tables that follow, please refer to page 218.
Aggregate cost for federal income tax purposes before investments sold short, was $947,872,018; and net unrealized appreciation consisted of:
Gross unrealized appreciation | | $ | 44,859,962 | | |
Gross unrealized depreciation | | | (51,261,778 | ) | |
Net unrealized depreciation | | $ | (6,401,816 | ) | |
Written options
Written options activity for the year ended July 31, 2013 was as follows:
| | | Number of
contracts | | Premiums
received | |
Options outstanding at July 31, 2012 | | | — | | | $ | — | | |
Options written | | | 48 | | | | 2,945 | | |
Options terminated in closing purchase transactions | | | — | | | | — | | |
Options expired prior to exercise | | | (48 | ) | | | (2,945 | ) | |
Options outstanding at July 31, 2013 | | | — | | | $ | — | | |
Swaptions and foreign exchange written options
Swaptions and foreign exchange written options activity for the year ended July 31, 2013 was as follows:
| | | Premiums
received | |
Swaptions and foreign exchange options outstanding at July 31, 2012 | | $ | 1,757,915 | | |
Swaptions and foreign exchange options written | | | 100,140 | | |
Swaptions and foreign exchange options terminated in closing purchase transactions | | | — | | |
Swaptions and foreign exchange options expired prior to exercise | | | (1,858,055 | ) | |
Swaptions and foreign exchange options outstanding at July 31, 2013 | | $ | — | | |
Futures contracts
Number of
contracts | | Currency | |
| | Expiration
date | | Cost | | Current
value | | Unrealized
appreciation
(depreciation) | |
Interest rate futures buy contracts: | |
| | 930 | | | USD | | | | 90-Day Eurodollar Futures | | December 2015 | | $ | 229,358,307 | | | $ | 229,349,625 | | | $ | (8,682 | ) | |
| | | | | | | | | Proceeds | | | | | |
Interest rate futures sell contracts: | |
| | 2 | | | USD | | | | 30-Year Interest Rate Swap Futures | | September 2013 | | | 190,098 | | | | 174,750 | | | | 15,348 | | |
| | | | | | | | | | | | | $ | 6,666 | | |
Forward foreign currency contracts
Counterparty | | Contracts to
deliver | | In
exchange for | | Maturity
date | | Unrealized
appreciation
(depreciation) | |
BB | | AUD | 339,000 | | | USD | 309,389 | | | 08/23/13 | | $ | 5,115 | | |
BB | | BRL | 1,052,194 | | | USD | 459,413 | | | 08/02/13 | | | (1,802 | ) | |
BB | | BRL | 736,688 | | | USD | 326,100 | | | 08/02/13 | | | 3,182 | | |
BB | | BRL | 594,728 | | | USD | 262,434 | | | 09/04/13 | | | 3,579 | | |
BB | | GBP | 214,000 | | | USD | 328,771 | | | 09/12/13 | | | 3,316 | | |
BB | | USD | 812,920 | | | BRL | 1,788,883 | | | 08/02/13 | | | (28,787 | ) | |
BB | | USD | 10,600,253 | | | CNY | 66,768,498 | | | 08/05/13 | | | 291,282 | | |
53
PACE Select Advisors Trust
PACE Strategic Fixed Income Investments
Portfolio of investments—July 31, 2013
Forward foreign currency contracts—(concluded)
Counterparty | | Contracts to
deliver | | In
exchange for | | Maturity
date | | Unrealized
appreciation
(depreciation) | |
BNP | | GBP | 2,812,000 | | | USD | 4,368,732 | | | 09/12/13 | | $ | 92,187 | | |
BOA | | BRL | 87,185 | | | USD | 39,000 | | | 08/02/13 | | | 784 | | |
BOA | | CNY | 66,768,498 | | | USD | 10,371,000 | | | 08/05/13 | | | (520,535 | ) | |
BOA | | JPY | 536,800,000 | | | USD | 5,429,132 | | | 10/17/13 | | | (55,640 | ) | |
BOA | | USD | 38,067 | | | BRL | 87,185 | | | 08/02/13 | | | 149 | | |
CITI | | BRL | 412,605 | | | USD | 180,153 | | | 08/02/13 | | | (707 | ) | |
CITI | | BRL | 1,308,848 | | | USD | 601,495 | | | 08/02/13 | | | 27,778 | | |
CITI | | GBP | 331,000 | | | USD | 508,403 | | | 09/12/13 | | | 5,011 | | |
CITI | | USD | 791,000 | | | BRL | 1,721,453 | | | 08/02/13 | | | (36,423 | ) | |
CITI | | USD | 1,055,567 | | | EUR | 798,000 | | | 09/03/13 | | | 6,164 | | |
CITI | | USD | 24,725,750 | | | EUR | 18,437,000 | | | 09/17/13 | | | (194,264 | ) | |
CITI | | USD | 1,654,895 | | | GBP | 1,095,000 | | | 09/12/13 | | | 10,403 | | |
CSI | | BRL | 23,739,721 | | | USD | 10,365,332 | | | 08/02/13 | | | (40,664 | ) | |
CSI | | BRL | 28,886,759 | | | USD | 14,182,279 | | | 08/02/13 | | | 1,520,145 | | |
CSI | | BRL | 1,437,737 | | | USD | 637,719 | | | 09/04/13 | | | 11,945 | | |
CSI | | BRL | 51,188,743 | | | USD | 22,047,008 | | | 11/04/13 | | | 50,685 | | |
CSI | | USD | 23,102,901 | | | BRL | 52,626,480 | | | 08/02/13 | | | (34,771 | ) | |
DB | | BRL | 535,440 | | | USD | 240,000 | | | 08/02/13 | | | 5,297 | | |
DB | | BRL | 402,238 | | | USD | 175,000 | | | 09/04/13 | | | (73 | ) | |
DB | | BRL | 437,195 | | | USD | 193,900 | | | 09/04/13 | | | 3,611 | | |
DB | | USD | 233,786 | | | BRL | 535,440 | | | 08/02/13 | | | 917 | | |
DB | | USD | 10,400,000 | | | CNY | 62,712,000 | | | 01/28/15 | | | (425,522 | ) | |
DB | | USD | 1,100,000 | | | CNY | 6,523,000 | | | 04/07/16 | | | (74,656 | ) | |
GSCM | | BRL | 1,004,351 | | | USD | 446,000 | | | 08/02/13 | | | 5,756 | | |
GSCM | | CNY | 62,712,000 | | | USD | 9,847,990 | | | 01/28/15 | | | (126,488 | ) | |
GSCM | | EUR | 29,884,000 | | | USD | 39,409,555 | | | 09/03/13 | | | (350,802 | ) | |
GSCM | | USD | 438,524 | | | BRL | 1,004,351 | | | 08/02/13 | | | 1,720 | | |
GSCM | | USD | 39,405,042 | | | EUR | 29,884,000 | | | 08/02/13 | | | 351,131 | | |
HSBC | | BRL | 285,440 | | | USD | 128,000 | | | 08/02/13 | | | 2,881 | | |
HSBC | | CNY | 74,529,863 | | | USD | 11,799,234 | | | 11/25/13 | | | (266,178 | ) | |
HSBC | | EUR | 11,000 | | | USD | 14,125 | | | 08/02/13 | | | (509 | ) | |
HSBC | | GBP | 207,000 | | | USD | 319,138 | | | 09/12/13 | | | 4,329 | | |
HSBC | | USD | 124,630 | | | BRL | 285,440 | | | 08/02/13 | | | 489 | | |
JPMCB | | BRL | 24,678,898 | | | USD | 11,548,385 | | | 08/02/13 | | | 730,712 | | |
JPMCB | | CNY | 41,302,100 | | | USD | 6,423,344 | | | 04/07/16 | | | (68,892 | ) | |
JPMCB | | GBP | 164,000 | | | USD | 257,210 | | | 09/12/13 | | | 7,796 | | |
JPMCB | | MXN | 15,452,885 | | | USD | 1,251,550 | | | 09/18/13 | | | 47,109 | | |
JPMCB | | USD | 10,775,400 | | | BRL | 24,678,898 | | | 08/02/13 | | | 42,273 | | |
JPMCB | | USD | 11,775,000 | | | CNY | 74,529,863 | | | 11/25/13 | | | 290,412 | | |
JPMCB | | USD | 5,860,000 | | | CNY | 34,779,100 | | | 04/07/16 | | | (393,108 | ) | |
MSC | | BRL | 1,386,794 | | | USD | 605,507 | | | 08/02/13 | | | (2,375 | ) | |
MSC | | BRL | 552,058 | | | USD | 245,000 | | | 08/02/13 | | | 3,013 | | |
MSC | | BRL | 1,938,852 | | | USD | 867,398 | | | 09/04/13 | | | 23,515 | | |
MSC | | USD | 872,963 | | | BRL | 1,938,852 | | | 08/02/13 | | | (23,093 | ) | |
RBS | | EUR | 29,873,000 | | | USD | 39,098,111 | | | 08/02/13 | | | (643,429 | ) | |
RBS | | USD | 4,454,954 | | | JPY | 442,300,000 | | | 10/17/13 | | | 64,261 | | |
| | | $ | 328,229 | | |
54
PACE Select Advisors Trust
PACE Strategic Fixed Income Investments
Portfolio of investments—July 31, 2013
Interest rate swaps
| | | | | | | Rate type | | | | | | | |
Counterparty | |
Notional
amount
(000) | |
Termination
date | |
Payments made by the
Portfolio16 | |
Payments
received by
the Portfolio16 | | Upfront
payments
received
(made) | |
Value | |
Unrealized
appreciation
(depreciation) | |
BB | | AUD | 200 | | | 06/15/22 | | 6 Month AUD LIBOR | | | 4.750 | % | | $ | 1,080 | | | $ | 9,727 | | | $ | 10,807 | | |
BOA | | BRL | 14,200 | | | 01/02/17 | | Brazil CETIP Interbank Deposit Rate | | | 8.860 | | | | (131,834 | ) | | | (187,186 | ) | | | (319,020 | ) | |
BOA | | BRL | 24,100 | | | 01/02/17 | | Brazil CETIP Interbank Deposit Rate | | | 8.600 | | | | — | | | | (448,058 | ) | | | (448,058 | ) | |
CITI | | AUD | 1,700 | | | 06/15/22 | | 6 Month AUD LIBOR | | | 4.750 | | | | 9,548 | | | | 82,676 | | | | 92,224 | | |
DB | | AUD | 13,900 | | | 03/15/23 | | 6 Month AUD LIBOR | | | 4.000 | | | | 69,587 | | | | (131,862 | ) | | | (62,275 | ) | |
GS | | AUD | 2,100 | | | 03/15/23 | | 6 Month AUD LIBOR | | | 4.000 | | | | 7,521 | | | | (19,921 | ) | | | (12,400 | ) | |
HSBC | | BRL | 10,200 | | | 01/02/17 | | Brazil CETIP Interbank Deposit Rate | | | 8.645 | | | | (8,125 | ) | | | (183,983 | ) | | | (192,108 | ) | |
| | | | | | | | | | | $ | (52,223 | ) | | $ | (878,607 | ) | | $ | (930,830 | ) | |
Credit default swaps on corporate issues—buy protection17
| | | | | | | Rate type | | | | | | | |
Counterparty | | Referenced obligations18 | | Notional
amount
(000) | | Termination
date | | Payments
made by
the Portfolio16 | | Upfront
payments
received
(made) | | Value | | Unrealized
appreciation
(depreciation) | |
BB | | Macy's Retail Holdings, Inc. bond,
7.875%, due 07/15/15 | | USD | 3,100 | | | 09/20/15 | | | 7.150 | % | | $ | — | | | $ | (462,743 | ) | | $ | (462,743 | ) | |
CITI | | Credit Agricole bond, 5.065%,
due 08/10/22 | | EUR | 2,200 | | | 12/20/16 | | | 1.000 | | | | (216,530 | ) | | | 18,842 | | | | (197,688 | ) | |
CITI | | Valero Energy Corp. bond, 8.750%,
due 06/15/30 | | USD | 300 | | | 12/20/13 | | | 3.400 | | | | — | | | | (3,785 | ) | | | (3,785 | ) | |
DB | | Bank of America Corp. bond,
5.750%, due 12/01/17 | | USD | 3,200 | | | 12/20/17 | | | 1.020 | | | | — | | | | 4,640 | | | | 4,640 | | |
GSI | | Credit Agricole bond, 5.065%,
due 08/10/22 | | EUR | 1,400 | | | 12/20/16 | | | 1.000 | | | | (141,292 | ) | | | 11,991 | | | | (129,301 | ) | |
| | | | | | | | | | | $ | (357,822 | ) | | $ | (431,055 | ) | | $ | (788,877 | ) | |
Credit default swaps on corporate and sovereign issues—sell protection19
| | | | | | | Rate type | | | | | | | | | |
Counterparty | | Referenced obligations18 | | Notional
amount
(000) | | Termination
date | | Payments
received by
the Portfolio16 | | Upfront
payments
received
(made) | | Value | | Unrealized
appreciation
(depreciation) | | Credit
spread20 | |
BB
| | BP Capital Markets
America bond, 4.200%,
due 6/15/18 | | EUR | 500 | | | 06/20/15 | | | 1.000 | % | | $ | 75,252 | | | $ | 9,219 | | | $ | 84,471 | | | | 0.27 | % | |
BB
| | Federal Republic of
Brazil bond, 12.250%,
due 03/06/30 | | USD | 5,500 | | | 06/20/16 | | | 1.000 | | | | 15,937 | | | | (63,558 | ) | | | (47,621 | ) | | | 1.41 | | |
55
PACE Select Advisors Trust
PACE Strategic Fixed Income Investments
Portfolio of investments—July 31, 2013
Credit default swaps on corporate and sovereign issues—sell protection19—(concluded)
| | | | | | | Rate type | | | | | | | | | |
Counterparty | | Referenced obligations18 | | Notional
amount
(000) | | Termination
date | | Payments
received by
the Portfolio16 | | Upfront
payments
received
(made) | | Value | | Unrealized
appreciation
(depreciation) | | Credit
spread20 | |
BB | | Italy Republic bond,
1.000% due 6/20/17 | | EUR | 1,400 | | | 06/20/17 | | | 1.000 | % | | $ | 203,650 | | | $ | (60,311 | ) | | $ | 143,339 | | | | 1.87 | % | |
BOA | | Italy Republic bond,
1.000%, due 06/20/17 | | EUR | 1,000 | | | 06/20/17 | | | 1.000 | | | | 147,139 | | | | (43,079 | ) | | | 104,060 | | | | 1.87 | | |
BOA | | Lloyds TSB Bank PLC,
3.375%, due 04/15/20 | | EUR | 3,600 | | | 09/20/17 | | | 3.000 | | | | (23,542 | ) | | | 375,933 | | | | 352,391 | | | | 1.05 | | |
CITI
| | BP Capital Markets
America bond, 4.200%,
due 06/15/18 | | USD | 200 | | | 06/20/15 | | | 5.000 | | | | (3,642 | ) | | | 17,976 | | | | 14,334 | | | | 0.27 | | |
CITI | | El Paso Corp. bond,
6.875%, due 06/15/14 | | USD | 1,800 | | | 03/20/14 | | | 5.000 | | | | 88,920 | | | | 55,062 | | | | 143,982 | | | | 0.24 | | |
CSI
| | BP Capital Markets
America bond, 4.200%,
due 06/15/18 | | USD | 1,200 | | | 06/20/15 | | | 5.000 | | | | (18,409 | ) | | | 107,857 | | | | 89,448 | | | | 0.27 | | |
CSI | | Citigroup Inc. bond,
1.000%, due 09/20/17 | | USD | 8,100 | | | 09/20/14 | | | 1.000 | | | | 54,242 | | | | 58,652 | | | | 112,894 | | | | 0.37 | | |
DB
| | BP Capital Markets
America bond, 4.200%,
due 06/15/18 | | USD | 700 | | | 06/20/15 | | | 5.000 | | | | (24,474 | ) | | | 62,917 | | | | 38,443 | | | | 0.27 | | |
DB
| | Lloyds TSB Bank
PLC bond, 3.375%,
due 04/15/20 | | EUR | 2,900 | | | 09/20/17 | | | 3.000 | | | | (24,061 | ) | | | 302,835 | | | | 278,774 | | | | 1.05 | | |
GSI | | Dell Inc. bond,
7.100%, due 04/15/28 | | USD | 1,800 | | | 12/20/17 | | | 1.000 | | | | 118,129 | | | | (122,946 | ) | | | (4,817 | ) | | | 2.65 | | |
MSCI | | China International
Government bond,
4.750%, due 10/29/13 | | USD | 4,100 | | | 09/20/16 | | | 1.000 | | | | 17,807 | | | | 36,777 | | | | 54,584 | | | | 0.71 | | |
| | | | | | | | | | | $ | 626,948 | | | $ | 737,334 | | | $ | 1,364,282 | | | | | | |
Centrally cleared credit default swap agreement—buy protection17
| | Rate type | | | | | | | |
| Referenced obligation18 | | Notional
amount
(000) | | Termination
date | | Payments
made by
the Portfolio16 | | Upfront
payments
received | | Value | | Unrealized
(depreciation) | |
iTraxx Europe Crossover Series 17 | | EUR | 1,900 | | | 06/20/17 | | | 5.000 | % | | $ | 137,487 | | | $ | (187,970 | ) | | $ | (50,483 | ) | |
Centrally cleared interest rate swap agreements
| | | | | Rate type | | | | | |
| Notional amount (000) | | Termination
date | | Payments made by
the Portfolio16 | | Payments received by
the Portfolio16 | | Value | | Unrealized
appreciation
(depreciation) | |
AUD | 8,600 | | | 03/15/23 | | 6 Month AUD LIBOR | | | 3.750 | % | | $ | (250,896 | ) | | $ | (227,076 | ) | |
GBP | 28,100 | | | 03/21/23 | | 6 Month GBP LIBOR | | | 3.000 | | | | (1,185,471 | ) | | | (1,569,199 | ) | |
USD | 291,500 | | | 03/21/23 | | 3 Months USD LIBOR | | | 3.000 | | | | (13,860,697 | ) | | | (11,316,390 | ) | |
USD | 2,500 | | | 06/19/43 | | 3 Months USD LIBOR | | | 2.750 | | | | 426,327 | | | | 278,751 | | |
| | | | | | | | | $ | (14,870,737 | ) | | $ | (12,833,914 | ) | |
56
PACE Select Advisors Trust
PACE Strategic Fixed Income Investments
Portfolio of investments—July 31, 2013
Fair valuation summary
The following is a summary of the fair valuations according to the inputs used as of July 31, 2013 in valuing the Portfolio's investments:
| | Unadjusted
quoted prices in
active markets for
identical investments
(Level 1) | | Other significant
observable inputs
(Level 2) | | Unobservable
inputs
(Level 3) | | Total | |
US government obligations | | $ | — | | | $ | 326,106,809 | | | $ | — | | | $ | 326,106,809 | | |
Government national mortgage association certificates | | | — | | | | 47,342 | | | | — | | | | 47,342 | | |
Federal home loan mortgage corporation certificates | | | — | | | | 110,322 | | | | 1,407,434 | | | | 1,517,756 | | |
Federal housing administration certificates | | | — | | | | — | | | | 21,003 | | | | 21,003 | | |
Federal national mortgage association certificates | | | — | | | | 29,846,713 | | | | 53,945 | | | | 29,900,658 | | |
Collateralized mortgage obligations | | | — | | | | 198,003,022 | | | | 115,797 | | | | 198,118,819 | | |
Asset-backed securities | | | — | | | | 50,966,751 | | | | — | | | | 50,966,751 | | |
Corporate notes | | | — | | | | 217,898,310 | | | | — | | | | 217,898,310 | | |
Loan assignments | | | — | | | | 4,010,775 | | | | — | | | | 4,010,775 | | |
Non-US government obligations | | | — | | | | 40,037,078 | | | | — | | | | 40,037,078 | | |
Municipal bonds and notes | | | — | | | | 21,191,887 | | | | — | | | | 21,191,887 | | |
Preferred stock | | | 7,443,200 | | | | — | | | | — | | | | 7,443,200 | | |
Certificates of deposit | | | — | | | | 16,363,393 | | | | — | | | | 16,363,393 | | |
Commercial paper | | | — | | | | 5,487,740 | | | | — | | | | 5,487,740 | | |
Short-term US government obligations | | | — | | | | 5,603,716 | | | | — | | | | 5,603,716 | | |
Repurchase agreements | | | — | | | | 13,633,000 | | | | — | | | | 13,633,000 | | |
Investment of cash collateral from securities loaned | | | — | | | | 3,121,965 | | | | — | | | | 3,121,965 | | |
US government agency securities sold short | | | — | | | | (1,578,320 | ) | | | — | | | | (1,578,320 | ) | |
Futures contracts, net | | | 6,666 | | | | — | | | | — | | | | 6,666 | | |
Forward foreign currency contracts, net | | | — | | | | 328,229 | | | | — | | | | 328,229 | | |
Swap agreements, net21 | | | — | | | | (13,456,725 | ) | | | — | | | | (13,456,725 | ) | |
Total | | $ | 7,449,866 | | | $ | 917,722,007 | | | $ | 1,598,179 | | | $ | 926,770,052 | | |
At July 31, 2013, there were no transfers between Level 1 and Level 2.
The following is a rollforward of the Portfolio's investments that were valued using unobservable inputs (Level 3) for the year ended July 31, 2013:
| | Federal home
loan mortgage
corporation
certificates | | Federal
housing
administration
certificates | | Federal
national
mortgage
association
certificates | | Collateralized
mortgage
obligations | | Total | |
Beginning balance | | $ | 1,520,805 | | | $ | 44,889 | | | $ | 68,630 | | | $ | 198,420 | | | $ | 1,832,744 | | |
Purchases | | | — | | | | — | | | | — | | | | — | | | | — | | |
Sales | | | (58,571 | ) | | | (23,886 | ) | | | (15,975 | ) | | | (84,904 | ) | | | (183,336 | ) | |
Accrued discounts/(premiums) | | | (37 | ) | | | (1,417 | ) | | | — | | | | — | | | | (1,454 | ) | |
Total realized gain/(loss) | | | — | | | | — | | | | — | | | | — | | | | — | | |
Net change in unrealized appreciation/depreciation | | | (54,763 | ) | | | 1,417 | | | | 1,290 | | | | 2,281 | | | | (49,775 | ) | |
Transfers into Level 3 | | | — | | | | — | | | | — | | | | — | | | | — | | |
Transfers out of Level 3 | | | — | | | | — | | | | — | | | | — | | | | — | | |
Ending balance | | $ | 1,407,434 | | | $ | 21,003 | | | $ | 53,945 | | | $ | 115,797 | | | $ | 1,598,179 | | |
The change in net unrealized appreciation/depreciation relating to the Level 3 investments held at July 31, 2013 was $(40,155).
57
PACE Select Advisors Trust
PACE Strategic Fixed Income Investments
Portfolio of investments—July 31, 2013
Issuer breakdown by country or territory of origin (unaudited)
| | | Percentage of
total investments | |
United States | | | 85.3 | % | |
Brazil | | | 5.9 | | |
Cayman Islands | | | 2.3 | | |
South Korea | | | 1.8 | | |
Netherlands | | | 1.1 | | |
Norway | | | 1.0 | | |
Qatar | | | 0.8 | | |
India | | | 0.6 | | |
Mexico | | | 0.5 | | |
United Arab Emirates | | | 0.3 | | |
United Kingdom | | | 0.2 | | |
Guernsey | | | 0.1 | | |
Luxembourg | | | 0.1 | | |
British Virgin Islands | | | 0.0 | † | |
Total | | | 100.0 | % | |
† Amount represents less than 0.05%
Portfolio footnotes
†† Amounts represents less than 0.005%.
* On September 7, 2008, the Federal Housing Finance Agency placed the Federal National Mortgage Association and the Federal Home Loan Mortgage Corporation into conservatorship, and the US Treasury guaranteed the debt issued by those organizations.
1 In US Dollars unless otherwise indicated.
2 Security, or portion thereof, pledged as collateral for investments sold short.
3 Security is being fair valued by a valuation committee under the direction of the board of trustees.
4 Security exempt from registration pursuant to Rule 144A under the Securities Act of 1933. These securities, which represent 9.53% of net assets as of July 31, 2013, are considered liquid and may be resold in transactions exempt from registration, normally to qualified institutional buyers.
5 Illiquid investments representing 2.18% of net assets as of July 31, 2013.
6 Step bond that converts to the noted fixed rate at a designated future date.
7 Security exempt from registration pursuant to Regulation S under the Securities Act of 1933. Regulation S applies to securities offerings that are made outside of the United States and do not involve direct selling efforts in the United States. At July 31, 2013, the value of these securities amounted to 1.54% of net assets.
8 Variable or floating rate security. The interest rate shown is the current rate as of July 31, 2013 and changes periodically.
9 Security, or portion thereof, was on loan at July 31, 2013.
10 Perpetual bond security. The maturity date reflects the next call date.
11 Bond interest in default.
12 Zero coupon bond. The interest rate represents annualized yield at the date of purchase.
13 Non cumulative preferred stock. Convertible until 12/31/49.
14 Rates shown are the discount rates at date of purchase.
15 The table below details the Portfolio's transaction activity in an affiliated issuer during the year ended July 31, 2013. The investment manager earns a management fee from UBS Private Money Market Fund LLC. Please see the Notes to financial statements for further information.
Security description | | Value at
07/31/12 | | Purchases
during the
year ended
07/31/13 | | Sales
during the
year ended
07/31/13 | | Value at
07/31/13 | | Net income
earned from
affiliate for the
year ended
07/31/13 | |
UBS Private Money Market Fund LLC | | $ | 1,841,523 | | | $ | 162,623,205 | | | $ | 161,342,763 | | | $ | 3,121,965 | | | $ | 1,763 | | |
58
PACE Select Advisors Trust
PACE Strategic Fixed Income Investments
Portfolio of investments—July 31, 2013
16 Payments made/received are based on the notional amount.
17 If the Portfolio is a buyer of protection and a credit event occurs, as defined under the terms of that particular swap agreement, the Portfolio will either (i) receive from the seller of protection an amount equal to the notional amount of the swap and deliver the referenced obligation or underlying securities comprising the referenced index or (ii) receive a net settlement amount in the form of cash or securities equal to the notional amount of the swap less the recovery value of the referenced obligation or underlying securities comprising the referenced index.
18 Payments from/to the counterparty will be received/made upon the occurrence of a failure to pay, obligation acceleration, repudiation or restructuring of the referenced obligation.
19 If the Portfolio is a seller of protection and a credit event occurs, as defined under the terms of that particular swap agreement, the Portfolio will either (i) pay to the buyer of protection an amount equal to the notional amount of the swap and take delivery of the referenced obligation or (ii) pay a net settlement amount in the form of cash or securities equal to the notional amount of the swap less the recovery value of the referenced obligation.
20 Credit spreads, where applicable, represented in absolute terms, utilized in determining the market value as of period end serve as an indicator of the current status of the payment/performance risk and represent the likelihood or risk of default for the credit derivative. The credit spread of a particular referenced entity reflects the cost of buying/selling protection and may include upfront payments required to be made to enter into the agreement. Wider credit spreads represent a deterioration of the referenced entity's credit soundness and a greater likelihood or risk of default or other credit event occurring as defined under the terms of the agreement. A credit spread identified as "Defaulted" indicates a credit event has occurred for the referenced entity. Credit spreads are unaudited.
21 Swap agreements are included in the table at value, with the exception of centrally cleared swap agreements which are included in the table at unrealized appreciation/(depreciation).
See accompanying notes to financial statements.
59
PACE Select Advisors Trust
PACE Municipal Fixed Income Investments
Performance
For the 12 months ended July 31, 2013, the Portfolio's Class P shares declined 1.82% before the deduction of the maximum PACE Select program fee. (Class P shares declined 3.77% after the deduction of the maximum PACE Select program fee for the same 12-month period.) In comparison, the Barclays US Municipal 3-15 Year Blend Index (the "benchmark") declined 1.32%, and the Lipper Intermediate Municipal Debt Funds category posted a median decline of 1.90%. (Returns for all share classes over various time periods are shown in the "Performance at a glance" table on page 63. Please note that the returns shown do not reflect the deduction of taxes that a shareholder could pay on Portfolio distributions or the redemption of Portfolio shares.) For a detailed commentary on the market environment in general during the reporting period, please refer to page 2.
Sub-Advisor's comments1
(Please note that while the Sub-Advisor outperformed the benchmark on a gross of fees basis, the Portfolio underperformed net of fees, as reported under "Performance." As stated in footnote one, the comments that follow address performance on a gross of fees basis.)
The Portfolio outperformed its benchmark during the reporting period. Contributors to performance included our broad sector allocation, particularly favoring revenue versus general obligation and pre-refunded bonds. A relatively short duration heading into a rising rate environment late in the reporting period was beneficial, as was our tactical yield curve positioning. (Duration measures a portfolio's sensitivity to interest rate changes.) The Portfolio's high quality bias detracted from performance, particularly among essential service revenue bonds.
The favorable technical environment and heavy investor appetite for additional yield, which drove lower-rated and longer maturity bonds to perform best over the past few years, reversed course late in the reporting period, as the market took on a weaker tone in sympathy with a broad based sell-off among Treasury securities. Investor fears of rising interest rates were heightened amidst growing speculation that the Federal Reserve Board would accelerate the tapering of its current accommodative monetary policy. Municipal mutual fund flows turned markedly negative, after having delivered steady inflows over the past year and a half, leading to heavy secondary market selling and diminished liquidity.
PACE Select Advisors Trust – PACE Municipal Fixed Income Investments
Investment Sub-Advisor:
Standish Mellon Asset Management Company LLC ("Standish")
Portfolio Manager:
Christine L. Todd
Objective:
High current income exempt from federal income tax
Investment process:
In deciding which securities to buy for the Portfolio, Standish seeks to identify undervalued sectors or geographical regions of the municipal market, or undervalued individual securities. To do this, Standish uses credit research and valuation analysis, and monitors the relationship of the municipal yield curve to the Treasury yield curve. Standish may also make modest duration adjustments based on economic analyses and interest rate forecasts. Standish generally sells securities if it identifies more attractive investment opportunities within its investment criteria that may improve the Portfolio's return. Standish also may sell securities with weakening credit profiles or to adjust the average duration of the Portfolio.
1 All Sub-Advisors discuss performance on a gross of fees basis—meaning that no fees or expenses are reflected in their sleeves'/sleeve's performance. Alternately, Portfolio performance is shown net of fees, which does factor in fees and expenses associated with the Portfolio.
60
PACE Select Advisors Trust
PACE Municipal Fixed Income Investments
Sub-Advisor's comments – concluded
The Portfolio's strategic overweight toward the higher income producing revenue sectors benefited returns, as these bonds were heavily sought among investors seeking excess yield in this low interest rate environment. In particular, an emphasis on higher yielding hospital, airport and tobacco revenue sectors was beneficial for results, as these sectors performed strongly. However, the Portfolio's bias toward some of the more liquid and higher quality essential service revenue sectors, such as water/sewer, utilities and special tax sector, were negative for performance, as these bonds were generally laggards throughout the reporting period. The Portfolio's underweight to tax-backed general obligation and US Treasury-backed pre-refunded bonds contributed to results, as these retail investor-favored sectors generally underperformed the broader municipal market. Relatively weak performance among lower investment grade bonds, particularly A and BBB-rated securities, during the sell-off in the final three months of the reporting period, was not enough to offset their strong performance during the first half of the reporting period. The Portfolio's overweight to A-rated bonds, particularly among revenue sectors, was beneficial, while a modest underweight to BBB-rated bonds detracted from results.
While technical factors such as negative flows from mutual funds and supply pressures added to market volatility, fundamental credit conditions remained solid among the broader universe of state and local governments. The Portfolio's overweight exposure to strong performing Illinois state general obligation bonds was additive to returns as their higher yield profile enticed steady investor demand. Our underweight to Puerto Rico general obligation bonds, which lagged amid continued economic and pension funding challenges, benefited the Portfolio's relative returns. In contrast, our overweight to Texas Permanent School Fund bonds detracted as this high-grade issuer generally lagged the broader national market. We began to trim our exposure to the Texas Permanent School Fund bonds during the first half of the fiscal year and eliminated our exposure to these bonds by the end of the reporting period. As noted, these higher grade bonds with good liquidity characteristics did not perform as strongly, particularly early in the reporting period when higher-yielding and more credit-oriented securities delivered the strongest returns. As such, we sold out of these bonds by the end of the reporting period to opportunistically fund purchases of more attractively yielding bonds.
The City of Detroit's bankruptcy filing heightened the market's attention on severely distressed credits and weakened pricing on Michigan bonds overall, particularly local general obligation issuers. The Portfolio's exposure to dedicated revenue Detroit water and sewer bonds, which we view as well-secured and solidly investment grade, detracted from results as their prices softened in sympathy with other Detroit-related securities.
Yield curve positioning positively contributed to the Portfolio's return, fueled by modest "bullet" exposure with overweights among shorter duration and stronger performing five- to 10-year bonds versus longer, weaker-performing 15-year maturity bonds.
No derivatives were used during the reporting period.
Special considerations
The Portfolio may be appropriate for long-term investors seeking high current income exempt from federal income taxes. Investors should be able to withstand short-term fluctuations in the fixed income markets in return for potentially higher returns over the long term. The yield and value of the Portfolio change every day and can be affected by changes in interest rates, general market conditions and other political, social and economic developments, as well as specific matters relating to the issuers in which the Portfolio invests. It is important to note that an investment in the Portfolio is only one component of a balanced investment plan.
61
PACE Select Advisors Trust
PACE Municipal Fixed Income Investments
Illustration of an assumed investment of $10,000 in Class P shares of the Portfolio (unaudited)
The following graph depicts the performance of PACE Municipal Fixed Income Investments Class P shares versus the Barclays US Municipal 3-15 Year Blend Index over the 10 years ended July 31, 2013. The performance of the other classes will vary based upon the different class specific expenses and sales charges. The performance provided does not reflect the deduction of taxes that a shareholder could pay on Portfolio distributions or the redemption of Portfolio shares. Past performance is no guarantee of future results. Share price and returns will vary with market conditions; investors may realize a gain or loss upon redemption. It is important to note that PACE Municipal Fixed Income Investments is a professionally managed portfolio while the Index is not available for investment and is unmanaged. The comparison is shown for illustration purposes only.
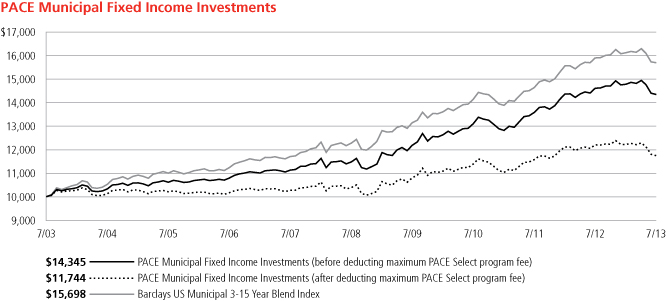
62
PACE Select Advisors Trust
PACE Municipal Fixed Income Investments
Performance at a glance (unaudited)
Average annual total returns for periods ended 07/31/13 | | 1 year | | 5 years | | 10 years | |
Before deducting maximum sales charge or PACE Select program fee | |
Class A1 | | | (1.99 | )% | | | 4.31 | % | | | 3.43 | % | |
Class C2 | | | (2.56 | )% | | | 3.78 | % | | | 2.91 | % | |
Class Y3 | | | (1.74 | )% | | | 4.57 | % | | | 3.68 | % | |
Class P4 | | | (1.82 | )% | | | 4.56 | % | | | 3.67 | % | |
After deducting maximum sales charge or PACE Select program fee | |
Class A1 | | | (6.41 | )% | | | 3.36 | % | | | 2.96 | % | |
Class C2 | | | (3.28 | )% | | | 3.78 | % | | | 2.91 | % | |
Class P4 | | | (3.77 | )% | | | 2.49 | % | | | 1.62 | % | |
Barclays US Municipal 3-15 Year Blend Index5 | | | (1.32 | )% | | | 5.04 | % | | | 4.61 | % | |
Lipper Intermediate Municipal Debt Funds median | | | (1.90 | )% | | | 4.21 | % | | | 3.70 | % | |
Average annual total returns for periods ended June 30, 2013, after deduction of the maximum sales charge or PACE Select program fee, were as follows: Class A—1-year period, (4.83)%; 5-year period, 3.57%; 10-year period, 2.73%; Class C—1-year period, (1.58)%; 5-year period, 4.00%; 10-year period, 2.69%; Class Y—1-year period, (0.18)%; 5-year period, 4.77%; 10-year period, 3.45%; Class P—1-year period, (2.08)%; 5-year period, 2.71%; 10-year period, 1.40%.
The annualized gross and net expense ratios, respectively, for each class of shares as in the November 28, 2012 prospectuses, were as follows: Class A—0.95% and 0.90%; Class C—1.45% and 1.40%; Class Y—0.73% and 0.65%; and Class P—0.72% and 0.65% Net expenses reflect fee waivers and/or expense reimbursements, if any, pursuant to an agreement that is in effect to cap the expenses. The Portfolio and UBS Global Asset Management (Americas) Inc. ("UBS Global AM") have entered into a written fee waiver/expense reimbursement agreement pursuant to which UBS Global AM is contractually obligated to waive its management fees and/or reimburse expenses so that the Portfolio's ordinary total operating expenses of each class through November 30, 2013 (excluding dividend expense, borrowing costs, and interest expense relating to short sales, and expenses attributable to investment in other investment companies, interest, taxes, brokerage commissions and extraordinary expenses) would not exceed Class A—0.90%; Class C—1.40%; Class Y—0.65% and Class P—0.65%. The Portfolio has agreed to repay UBS Global AM for any waived fees/reimbursed expenses to the extent that it can do so over the following three fiscal years without causing the Portfolio's expenses in any of those three years to exceed these expense caps. The fee waiver/expense reimbursement agreement may be terminated by the Portfolio's board at any time and also will terminate automatically upon the expiration or termination of the Portfolio's advisory contract with UBS Global AM. Upon termination of the agreement, however, UBS Global AM's three year recoupment rights will survive.
1 Maximum sales charge for Class A shares is 4.5%. Class A shares bear ongoing 12b-1 service fees.
2 Maximum contingent deferred sales charge for Class C shares is 0.75% imposed on redemptions and is reduced to 0% after one year. Class C shares bear ongoing 12b-1 service and distribution fees. Prior to September 30, 2003, Class C shares were subject to a maximum front-end sales charge of 1%; this front-end sales charge is not reflected in the average annual total returns presented for the Class C shares shown above.
3 The Portfolio offers Class Y shares to a limited group of eligible investors, including certain qualifying retirement plans. Class Y shares do not bear initial or contingent deferred sales charges or ongoing 12b-1 service and distribution fees.
4 Class P shares do not bear initial or contingent deferred sales charges or ongoing 12b-1 service and distribution fees, but are subject to a maximum annual PACE Select program fee of 2% of the value of Class P shares. Prior to June 14, 2010, the maximum annual PACE Select program fee was 1.5% of the value of Class P shares; however, the current maximum annual PACE Select program fee of 2% is reflected in the performance returns throughout all periods in the average annual total returns presented for the Class P shares shown above.
5 The Barclays US Municipal 3-15 Year Blend Index is an unmanaged total return performance benchmark for the tax-exempt bond market. The Index includes municipal bonds with an effective maturity between 2 and 17 years that have at least one year to maturity and are investment grade. Investors should note that indices do not reflect the deduction of fees and expenses.
If an investor sells or exchanges shares less than 90 days after purchase, a redemption fee of 1.00% of the amount sold or exchanged will be deducted at the time of the transaction, except as noted otherwise in the prospectuses.
Past performance does not predict future performance, and the performance information provided does not reflect the deduction of taxes that a shareholder could pay on Portfolio distributions or the redemption of Portfolio shares. The return and principal value of an investment will fluctuate, so that an investor's shares, when redeemed, may be worth more or less than their original cost. Performance results assume reinvestment of all dividends and capital gain distributions at net asset value on the ex-dividend dates. Current performance may be higher or lower than the performance data quoted. For month-end performance figures, please visit http://globalam-us.ubs.com/corpweb/performance.do.
Lipper peer group data calculated by Lipper Inc.; used with permission. The Lipper median is the return of the fund that places in the middle of a Lipper peer group.
63
PACE Select Advisors Trust
PACE Municipal Fixed Income Investments
Portfolio statistics (unaudited)
Characteristics | | 07/31/13 | |
Weighted average duration | | | 5.0 yrs. | | |
Weighted average maturity | | | 8.1 yrs. | | |
Average coupon | | | 5.14 | % | |
Net assets (mm) | | $ | 376.8 | | |
Number of holdings | | | 160 | | |
Portfolio composition1 | | 07/31/13 | |
Municipal bonds and notes | | | 99.5 | % | |
Tax-free money market fund | | | 0.8 | | |
Cash equivalents and other assets less liabilities | | | (0.3 | ) | |
Total | | | 100.0 | % | |
Top five sectors1 | | 07/31/13 | |
Revenue | | | 63.4 | % | |
General obligations | | | 19.2 | | |
Lease revenue/special revenue | | | 17.1 | | |
Pre-refunded | | | 0.2 | | |
Other municipals | | | 0.1 | | |
Total | | | 100.0 | % | |
Top five states1 | | 07/31/13 | |
California | | | 13.8 | % | |
Illinois | | | 13.0 | | |
Florida | | | 8.5 | | |
New York | | | 7.1 | | |
Washington | | | 6.4 | | |
Total | | | 48.8 | % | |
Quality diversification1 | | 07/31/13 | |
AAA and agency backed securities | | | 7.2 | % | |
AA | | | 50.8 | | |
A | | | 33.6 | | |
BBB | | | 3.4 | | |
Non-rated | | | 4.5 | | |
Tax-free money market fund | | | 0.8 | | |
Cash equivalents and other assets less liabilities | | | (0.3 | ) | |
Total | | | 100.0 | % | |
1 Weightings represent percentages of the Portfolio's net assets as of July 31, 2013. The Portfolio is actively managed and its composition will vary over time. Credit quality ratings shown are based on the ratings assigned to portfolio holdings by Standard & Poor's Ratings Group, an independent rating agency.
64
PACE Select Advisors Trust
PACE Municipal Fixed Income Investments
Portfolio of investments—July 31, 2013
| | | Face
amount | | Value | |
Municipal bonds and notes—99.50% | |
Alabama—1.18% | |
Birmingham Waterworks Board
Water Revenue Series A
(Assured Guaranty Insured)
5.000%, due 01/01/24 | | $ | 2,005,000 | | | $ | 2,146,032 | | |
University of Alabama
General Revenue, Series A
5.000%, due 07/01/23 | | | 2,000,000 | | | | 2,315,980 | | |
| | | | 4,462,012 | | |
Alaska—1.53% | |
Alaska International Airports Revenue
Refunding Series A (NATL-RE Insured)
5.500%, due 10/01/151 | | | 3,500,000 | | | | 3,529,750 | | |
North Slope Boro Series A
(NATL-RE Insured)
5.000%, due 06/30/16 | | | 2,000,000 | | | | 2,233,720 | | |
| | | | 5,763,470 | | |
Arizona—1.41% | |
Arizona State Transportation Board
Excise Tax Revenue Maricopa County
Regional Area Road Fund
5.000%, due 07/01/15 | | | 2,000,000 | | | | 2,173,460 | | |
Pima County Sewer Revenue System
(AGM Insured)
5.000%, due 07/01/23 | | | 1,500,000 | | | | 1,678,170 | | |
San Manuel Entertainment Series 04-C
4.500%, due 12/01/162 | | | 1,500,000 | | | | 1,466,805 | | |
| | | | 5,318,435 | | |
California—13.83% | |
California State
5.000%, due 03/01/17 | | | 2,000,000 | | | | 2,199,800 | | |
5.000%, due 08/01/19 | | | 3,000,000 | | | | 3,404,430 | | |
5.000%, due 09/01/25 | | | 1,725,000 | | | | 1,867,882 | | |
5.250%, due 10/01/20 | | | 1,000,000 | | | | 1,169,290 | | |
5.500%, due 04/01/21 | | | 3,000,000 | | | | 3,469,410 | | |
California State Department of
Water Resources Power
Supply Revenue
Series H (AGM Insured)
5.000%, due 05/01/22 | | | 1,400,000 | | | | 1,595,440 | | |
Series L
5.000%, due 05/01/17 | | | 1,000,000 | | | | 1,144,090 | | |
California State Economic Recovery
Refunding Series A
5.000%, due 07/01/20 | | | 3,000,000 | | | | 3,513,330 | | |
California State Public Works Board
Lease Revenue (Judicial
Council Project), Series A
5.000%, due 03/01/24 | | | 1,750,000 | | | | 1,945,825 | | |
California Statewide Communities
Development Authority Revenue
Kaiser Permanente Series A
5.000%, due 04/01/19 | | | 3,000,000 | | | | 3,474,630 | | |
| | | Face
amount | | Value | |
Municipal bonds and notes—(continued) | |
California—(concluded) | |
California Statewide Communities
Development Authority Revenue
St. Joseph Series F (AGM Insured)
5.250%, due 07/01/18 | | $ | 1,500,000 | | | $ | 1,738,650 | | |
Los Angeles Department of
Water & Power Revenue Power
Systems—Series B
5.000%, due 07/01/25 | | | 5,000,000 | | | | 5,626,850 | | |
North Natomas Community Facilities
District No. 4 Special Tax Series E
5.000%, due 09/01/19 | | | 1,385,000 | | | | 1,523,375 | | |
Northern California Power Agency
Refunding (Hydroelectric Project 1),
Series A,
5.000%, due 07/01/28 | | | 1,845,000 | | | | 1,953,763 | | |
Orange County Transportation
Authority Toll Road Revenue
Refunding (Senior Lien 91
Express Lanes)
5.000%, due 08/15/29 | | | 1,000,000 | | | | 1,035,870 | | |
San Diego Public Facilities Financing
Authority Sewer Revenue Senior
Series A
5.000%, due 05/15/25 | | | 2,500,000 | | | | 2,756,600 | | |
San Francisco City and County
Airports Community International
Airport Revenue San Francisco
International Airport
5.000%, due 05/01/171 | | | 3,715,000 | | | | 4,188,886 | | |
Stockton Unified School District
5.000%, due 07/01/23 | | | 1,270,000 | | | | 1,390,383 | | |
University of California Revenue
Series AF
5.000%, due 05/15/18 | | | 2,000,000 | | | | 2,347,160 | | |
5.000%, due 05/15/24 | | | 2,500,000 | | | | 2,897,800 | | |
Series Q
5.250%, due 05/15/23 | | | 2,500,000 | | | | 2,859,800 | | |
| | | | 52,103,264 | | |
Colorado—3.20% | |
Colorado Health Facilities Authority
Revenue Boulder Community
Hospital Project Series A
4.000%, due 10/01/18 | | | 1,500,000 | | | | 1,610,835 | | |
Denver City & County
Airport Revenue
Series A
5.500%, due 11/15/191 | | | 2,500,000 | | | | 2,929,350 | | |
Subseries A
5.500%, due 11/15/261 | | | 7,000,000 | | | | 7,505,400 | | |
| | | | 12,045,585 | | |
65
PACE Select Advisors Trust
PACE Municipal Fixed Income Investments
Portfolio of investments—July 31, 2013
| | | Face
amount | | Value | |
Municipal bonds and notes—(continued) | |
District of Columbia—0.59% | |
Metropolitan Washington, Airport
Authority Airport System Revenue,
Series A
5.000%, due 10/01/221 | | $ | 2,000,000 | | | $ | 2,240,080 | | |
Florida—8.46% | |
Broward Port Facilities Revenue
Refunding Series B
5.000%, due 09/01/211 | | | 2,000,000 | | | | 2,215,000 | | |
Citizens Property Insurance Corp.
Senior Secured Coastal Series A-1
5.000%, due 06/01/19 | | | 2,000,000 | | | | 2,267,780 | | |
Citizens Property Insurance Corp.
Senior Secured High Risk Account
5.500%, due 06/01/14 | | | 1,000,000 | | | | 1,041,160 | | |
5.500%, due 06/01/17 | | | 2,835,000 | | | | 3,224,557 | | |
Florida Hurricane Catastrophe Fund
Finance Corp. Revenue Series A
5.000%, due 07/01/16 | | | 1,500,000 | | | | 1,663,575 | | |
Florida State Board of Education
Lottery Revenue Refunding
Series C
5.000%, due 07/01/16 | | | 1,000,000 | | | | 1,118,080 | | |
Series E
5.000%, due 07/01/19 | | | 1,000,000 | | | | 1,171,200 | | |
Florida State Municipal Power Agency
Revenue All Requirements Power
5.250%, due 10/01/20 | | | 1,555,000 | | | | 1,790,240 | | |
5.250%, due 10/01/21 | | | 2,000,000 | | | | 2,230,800 | | |
Florida Turnpike Authority Revenue
Series A
5.000%, due 07/01/25 | | | 3,000,000 | | | | 3,391,710 | | |
Lakeland Energy System Revenue
Refunding Series B (AGM Insured)
5.000%, due 10/01/17 | | | 2,000,000 | | | | 2,275,600 | | |
Miami-Dade County Water & Sewer
Revenue Refunding Series C
5.250%, due 10/01/18 | | | 2,000,000 | | | | 2,344,580 | | |
Miami-Dade County Water & Sewer
Revenue Refunding Systems
Series B (AGM Insured)
5.250%, due 10/01/18 | | | 2,500,000 | | | | 2,932,075 | | |
Orlando & Orange County Expressway
Authority Expressway Revenue Junior
Lien (NATL-RE-IBC/FGIC Insured)
8.250%, due 07/01/16 | | | 2,595,000 | | | | 3,122,590 | | |
Tampa Solid Waste System Revenue
Refunding (AGM Insured)
5.000%, due 10/01/151 | | | 1,000,000 | | | | 1,083,200 | | |
| | | | 31,872,147 | | |
Georgia—1.61% | |
De Kalb County Water & Sewer
Revenue Refunding Series B
5.250%, due 10/01/24 | | | 2,000,000 | | | | 2,300,120 | | |
Municipal Electric Authority of Georgia
Project One Subseries D
5.750%, due 01/01/19 | | | 1,750,000 | | | | 2,061,202 | | |
| | | Face
amount | | Value | |
Municipal bonds and notes—(continued) | |
Georgia—(concluded) | |
Private Colleges & Universities
Authority of Georgia Emory
University Series A
5.000%, due 09/01/16 | | $ | 1,500,000 | | | $ | 1,691,130 | | |
| | | | 6,052,452 | | |
Idaho—0.07% | |
Idaho Housing & Finance Association
Single-Family Mortgage
Series G-2, Class III
5.950%, due 07/01/191 | | | 270,000 | | | | 270,446 | | |
Illinois—12.97% | |
Chicago O'Hare International Airport
Revenue Refunding General
Third Lien Series B (NATL-RE Insured)
5.250%, due 01/01/18 | | | 1,000,000 | | | | 1,151,340 | | |
Chicago O'Hare International
Airport Revenue, Series A
5.000%, due 01/01/231 | | | 1,150,000 | | | | 1,237,423 | | |
Chicago Refunding
Series A (AGM Insured)
5.000%, due 01/01/17 | | | 2,500,000 | | | | 2,620,350 | | |
Series B (AGM Insured)
5.000%, due 01/01/26 | | | 3,500,000 | | | | 3,545,150 | | |
Cook County Forest Preservation
District (AMBAC Insured)
5.000%, due 11/15/19 | | | 5,180,000 | | | | 6,007,246 | | |
Illinois Development Finance Authority
Revenue School District Program
School District No. U-46
(AGM Insured)
5.150%, due 01/01/19 | | | 2,000,000 | | | | 2,273,400 | | |
Illinois Finance Authority Revenue
University of Chicago Series A
5.000%, due 10/01/29 | | | 2,440,000 | | | | 2,604,944 | | |
Illinois Health Facilities Authority
Revenue Evangelical Hospital
Series A (Escrowed to Maturity)
6.750%, due 04/15/17 | | | 545,000 | | | | 614,259 | | |
Illinois Municipal Electric Agency
Power Supply Refunding Series C
(NATL-RE-FGIC Insured)
5.000%, due 02/01/16 | | | 1,200,000 | | | | 1,320,036 | | |
Illinois Toll Highway Authority Toll
Highway Revenue Refunding Senior
Series A-1
5.000%, due 01/01/25 | | | 1,250,000 | | | | 1,345,725 | | |
Railsplitter Tobacco Settlement Authority
5.500%, due 06/01/23 | | | 6,115,000 | | | | 6,797,678 | | |
6.000%, due 06/01/28 | | | 2,500,000 | | | | 2,727,850 | | |
Regional Transportation Authority
Series A (AGM Insured)
5.750%, due 06/01/18 | | | 3,000,000 | | | | 3,545,550 | | |
66
PACE Select Advisors Trust
PACE Municipal Fixed Income Investments
Portfolio of investments—July 31, 2013
| | | Face
amount | | Value | |
Municipal bonds and notes—(continued) | |
Illinois—(concluded) | |
Springfield Electric Revenue
Senior Lien Electric
5.000%, due 03/01/16 | | $ | 2,000,000 | | | $ | 2,162,340 | | |
State of Illinois Series A
5.000%, due 04/01/22 | | | 2,500,000 | | | | 2,683,900 | | |
5.500%, due 07/01/26 | | | 3,740,000 | | | | 3,956,621 | | |
University of Illinois,
(Auxiliary Facilities System), Series A
5.000%, due 04/01/27 | | | 4,000,000 | | | | 4,269,920 | | |
| | | | 48,863,732 | | |
Indiana—2.66% | |
Indiana State Finance Authority
Environmental Facilities Revenue
Refunding Industrial Power &
Light Co. Series C
4.900%, due 01/01/16 | | | 3,500,000 | | | | 3,768,345 | | |
Indiana University Revenues Student
Fees Series S
5.000%, due 08/01/19 | | | 1,185,000 | | | | 1,366,980 | | |
Indianapolis Local Public
Improvement Bond Bank
Airport Authority Series F
(AMBAC Insured)
5.000%, due 01/01/221 | | | 2,450,000 | | | | 2,636,249 | | |
Indianapolis Thermal Energy System
Refunding (AGM Insured)
5.000%, due 10/01/16 | | | 2,000,000 | | | | 2,232,760 | | |
| | | | 10,004,334 | | |
Kentucky—0.62% | |
Pikeville Hospital Revenue Refunding &
Improvement (Pikeville Medical Center)
6.000%, due 03/01/22 | | | 2,055,000 | | | | 2,321,287 | | |
Louisiana—1.92% | |
Louisiana Public Facilities Authority
Revenue Hurricane Recovery Project
(AMBAC Insured)
5.000%, due 06/01/15 | | | 2,880,000 | | | | 3,063,830 | | |
Tobacco Settlement Funding Corp.,
(Asset-Backed Refunding Bonds),
Series A
5.000%, due 05/15/27 | | | 4,000,000 | | | | 4,159,080 | | |
| | | | 7,222,910 | | |
Massachusetts—5.32% | |
Massachusetts Bay Transportation
Authority Massachusetts Sales Tax
Revenue Series B
5.250%, due 07/01/21 | | | 1,000,000 | | | | 1,195,240 | | |
Massachusetts Educational Financing
Authority, (AMT), Series K
5.000%, due 07/01/221 | | | 2,500,000 | | | | 2,647,425 | | |
| | | Face
amount | | Value | |
Municipal bonds and notes—(continued) | |
Massachusetts—(concluded) | |
Massachusetts Health & Educational
Facilities Authority Revenue
Massachusetts Institute of Technology
Series M
5.250%, due 07/01/29 | | $ | 1,000,000 | | | $ | 1,174,580 | | |
Massachusetts Health & Educational
Facilities Authority Revenue Partners
Healthcare Systems Series G-5
5.000%, due 07/01/19 | | | 1,000,000 | | | | 1,120,390 | | |
Massachusetts State College Building
Authority Revenue Refunding Series B
5.000%, due 05/01/29 | | | 2,500,000 | | | | 2,671,475 | | |
Massachusetts State Development
Finance Agency Solid Waste Disposal
Revenue Waste Management
Income Project
5.450%, due 06/01/141 | | | 2,000,000 | | | | 2,055,160 | | |
Massachusetts State School Building
Authority Dedicated Sales Tax Revenue
Series B
5.000%, due 08/15/28 | | | 3,000,000 | | | | 3,273,180 | | |
Massachusetts State Series B
5.000%, due 08/01/22 | | | 5,000,000 | | | | 5,905,400 | | |
| | | | 20,042,850 | | |
Michigan—3.07% | |
Detroit Sewer Disposal Revenue
Refunding Senior Lien Series C-1
6.500%, due 07/01/24 | | | 2,250,000 | | | | 2,281,185 | | |
Detroit Sewer Disposal Revenue
Senior Lien Series A (AGM Insured)
5.250%, due 07/01/19 | | | 2,500,000 | | | | 2,506,300 | | |
Michigan State Finance Authority
Revenue Refunding (Unemployment
Obligation Assessment), Series B
5.000%, due 07/01/21 | | | 4,000,000 | | | | 4,554,760 | | |
Wayne County Airport Authority
Revenue Refunding Detroit
Metropolitan Airport
Series A
5.000%, due 12/01/161 | | | 1,500,000 | | | | 1,658,715 | | |
Series D
5.000%, due 12/01/17 | | | 510,000 | | | | 578,768 | | |
| | | | 11,579,728 | | |
Missouri—3.38% | |
City of Kansas City, Missouri Airport
Revenue Series A
5.000%, due 09/01/231 | | | 5,000,000 | | | | 5,416,450 | | |
Missouri State Health & Educational
Facilities Authority Health Facilities
Revenue St. Lukes Health Systems
5.000%, due 11/15/16 | | | 2,000,000 | | | | 2,245,200 | | |
5.000%, due 11/15/17 | | | 2,500,000 | | | | 2,849,125 | | |
67
PACE Select Advisors Trust
PACE Municipal Fixed Income Investments
Portfolio of investments—July 31, 2013
| | | Face
amount | | Value | |
Municipal bonds and notes—(continued) | |
Missouri—(concluded) | |
Missouri State Highways & Transit
Commission State Road Revenue
Second Lien
5.000%, due 05/01/16 | | $ | 2,000,000 | | | $ | 2,235,380 | | |
| | | | 12,746,155 | | |
Nebraska—1.18% | |
City of Lincoln, Nebraska Electric
System Revenue
5.000%, due 09/01/22 | | | 3,790,000 | | | | 4,431,344 | | |
Nevada—1.24% | |
Las Vegas Valley Water District
Refunding & Improvement, Series A
5.000%, due 02/01/17 | | | 1,500,000 | | | | 1,692,750 | | |
Las Vegas Valley Water District, Series B
5.000%, due 06/01/25 | | | 2,700,000 | | | | 2,982,150 | | |
| | | | 4,674,900 | | |
New Jersey—1.63% | |
New Jersey Economic Development
Authority Water Facilities Revenue
Refunding American Water Co.
Series C
5.100%, due 06/01/231 | | | 1,000,000 | | | | 1,069,740 | | |
New Jersey State Higher Education
Assistance Authority Revenue,
Series 1A
5.000%, due 12/01/181 | | | 1,000,000 | | | | 1,112,390 | | |
New Jersey Transportation Trust Fund
Authority Transportation System
Series B (AGC-ICC/FGIC Insured)
5.500%, due 12/15/20 | | | 1,500,000 | | | | 1,793,265 | | |
Rutgers State University Revenue,
Series J
5.000%, due 05/01/19 | | | 1,860,000 | | | | 2,148,932 | | |
| | | | 6,124,327 | | |
New York—7.13% | |
Metropolitan Transportation Authority
Revenue Transportation
Series D
5.000%, due 11/15/23 | | | 1,400,000 | | | | 1,570,744 | | |
Series G
5.000%, due 11/15/18 | | | 2,500,000 | | | | 2,891,100 | | |
New York City Health & Hospital Corp.
Revenue Health System Series A
5.000%, due 02/15/22 | | | 3,500,000 | | | | 3,825,850 | | |
New York City Municipal Water
Finance Authority Water & Sewer
Systems Revenue (Second General
Resolution), Series HH
5.000%, due 06/15/29 | | | 2,500,000 | | | | 2,676,000 | | |
New York City
Series B
5.000%, due 08/01/17 | | | 1,750,000 | | | | 2,001,527 | | |
| | | Face
amount | | Value | |
Municipal bonds and notes—(continued) | |
New York—(concluded) | |
Subseries B-3
0.050%, due 08/15/183 | | $ | 400,000 | | | $ | 400,000 | | |
New York City Transitional Finance
Authority Future Tax Secured Revenue,
Series A-1
5.000%, due 11/15/18 | | | 3,000,000 | | | | 3,517,980 | | |
Series B
5.000%, due 02/01/23 | | | 2,500,000 | | | | 2,841,050 | | |
Subseries I
5.000%, due 05/01/23 | | | 2,435,000 | | | | 2,829,860 | | |
New York State Dorm Authority State
Personal Income Tax Revenue
General Purpose Series C
5.000%, due 03/15/25 | | | 2,320,000 | | | | 2,584,109 | | |
New York State Thruway Authority
General Revenue—Series I,
5.000%, due 01/01/20 | | | 1,500,000 | | | | 1,738,365 | | |
| | | | 26,876,585 | | |
North Carolina—1.49% | |
North Carolina Capital Improvement
Obligations Series C
5.000%, due 05/01/30 | | | 1,000,000 | | | | 1,064,640 | | |
University of North Carolina Chapel Hill
Revenue, Series A
5.000%, due 12/01/27 | | | 2,160,000 | | | | 2,386,325 | | |
Wake County Industrial Facilities &
Pollution Control Financing Authority
Series E
0.105%, due 10/01/223 | | | 2,375,000 | | | | 2,161,250 | | |
| | | | 5,612,215 | | |
Ohio—1.49% | |
American Municipal Power, Inc.
5.250%, due 02/15/25 | | | 2,000,000 | | | | 2,162,860 | | |
Kent State University Revenue General
Receipts Series B (Assured
Guaranty Insured)
5.000%, due 05/01/21 | | | 3,000,000 | | | | 3,443,430 | | |
| | | | 5,606,290 | | |
Pennsylvania—4.19% | |
Allegheny County Port Authority
Special Revenue Refunding
Transportation
5.000%, due 03/01/25 | | | 1,000,000 | | | | 1,075,350 | | |
Pennsylvania Economic Development
Financing Authority Unemployment
Compensation Revenue,
Series A
5.000%, due 07/01/18 | | | 3,400,000 | | | | 3,983,168 | | |
Series B
5.000%, due 01/01/22 | | | 1,750,000 | | | | 1,974,840 | | |
68
PACE Select Advisors Trust
PACE Municipal Fixed Income Investments
Portfolio of investments—July 31, 2013
| | | Face
amount | | Value | |
Municipal bonds and notes—(continued) | |
Pennsylvania—(concluded) | |
Pennsylvania Intergovernmental
Cooperative Authority Special Tax
Revenue Refunding Philadelphia
Funding Program
5.000%, due 06/15/17 | | $ | 2,000,000 | | | $ | 2,280,920 | | |
Pennsylvania State Higher Educational
Facilities Authority Revenue
University of Pennsylvania Series A
5.000%, due 09/01/17 | | | 1,150,000 | | | | 1,327,261 | | |
Philadelphia School District Refunding
Series E
5.000%, due 09/01/18 | | | 1,000,000 | | | | 1,137,900 | | |
Philadelphia Water & Wastewater
Revenue Refunding Series A
5.000%, due 06/15/15 | | | 1,500,000 | | | | 1,623,045 | | |
University of Pittsburgh of the
Commonwealth System of Higher
Education Capital Project Series B
5.500%, due 09/15/21 | | | 2,000,000 | | | | 2,396,260 | | |
| | | | 15,798,744 | | |
Puerto Rico—1.94% | |
Puerto Rico Commonwealth
Highway &Transportation Authority
Transportation Revenue (AGM Insured)
5.500%, due 07/01/25 | | | 2,000,000 | | | | 2,055,440 | | |
Puerto Rico Electric Power Authority
Power Revenue,
Series DDD
5.000%, due 07/01/20 | | | 1,000,000 | | | | 999,400 | | |
Series TT
5.000%, due 07/01/17 | | | 3,000,000 | | | | 3,129,840 | | |
5.000%, due 07/01/25 | | | 1,250,000 | | | | 1,138,162 | | |
| | | | 7,322,842 | | |
Rhode Island—1.09% | |
Rhode Island Health & Educational
Building Corp. Higher Educational
Facilities Revenue (Brown University)
5.000%, due 09/01/22 | | | 3,500,000 | | | | 4,113,690 | | |
South Carolina—1.32% | |
Columbia Waterworks & Sewer
Systems Refunding
5.000%, due 02/01/28 | | | 2,500,000 | | | | 2,716,175 | | |
Richland County School District No. 002
Series A (SCSDE Insured)
5.000%, due 02/01/21 | | | 2,000,000 | | | | 2,268,140 | | |
| | | | 4,984,315 | | |
Tennessee—1.52% | |
Metropolitan Government of Nashville &
Davidson County, Series D
5.000%, due 07/01/23 | | | 5,000,000 | | | | 5,709,300 | | |
| | | Face
amount | | Value | |
Municipal bonds and notes—(continued) | |
Texas—5.67% | |
City of Brownsville, Texas Utilities
System Revenue Series A
5.000%, due 09/01/28 | | $ | 2,225,000 | | | $ | 2,349,645 | | |
Cypress-Fairbanks Independent
School District (PSF-GTD)
5.000%, due 02/15/25 | | | 2,500,000 | | | | 2,859,375 | | |
EL Paso County Hospital District
5.000%, due 08/15/29 | | | 2,000,000 | | | | 2,101,480 | | |
Harris County Hospital District
Revenue Refunding Senior Lien
Series A (NATL-RE Insured)
5.000%, due 02/15/18 | | | 1,675,000 | | | | 1,844,962 | | |
Harris County Metropolitan
Transportation Authority Sales &
Use Tax Revenue Series A
5.000%, due 11/01/29 | | | 2,000,000 | | | | 2,126,240 | | |
Houston Utility System Revenue
First Lien Series D
5.000%, due 11/15/29 | | | 2,000,000 | | | | 2,148,560 | | |
Lower Colorado River Authority
Refunding LCRA Transmission
Services (BHAC Insured)
5.000%, due 05/15/20 | | | 1,765,000 | | | | 2,011,835 | | |
North Texas Health Facilities
Development Corp. Hospital
Revenue United Regional
Health Care Systems (AGM Insured)
5.000%, due 09/01/21 | | | 1,450,000 | | | | 1,585,894 | | |
5.000%, due 09/01/22 | | | 1,400,000 | | | | 1,515,668 | | |
San Antonio Electric & Gas
Refunding Series A
5.000%, due 02/01/17 | | | 1,295,000 | | | | 1,471,949 | | |
Texas Municipal Power Agency
Revenue (Escrowed to Maturity)
(NATL-RE Insured)
6.100%, due 09/01/134 | | | 25,000 | | | | 24,994 | | |
University of Texas University Revenues
Refunding Financing System
Series D Unrefunded Balance
5.000%, due 08/15/17 | | | 195,000 | | | | 221,339 | | |
West Travis County Public Utility
Agency Revenue
5.500%, due 08/15/245 | | | 1,000,000 | | | | 1,117,470 | | |
| | | | 21,379,411 | | |
Utah—0.84% | |
Intermountain Power Agency Power
Supply Revenue Refunding,
Subseries A
5.000%, due 07/01/17 | | | 1,500,000 | | | | 1,716,840 | | |
Riverton Hospital Revenue IHC
Health Services, Inc.
5.000%, due 08/15/15 | | | 1,200,000 | | | | 1,300,968 | | |
69
PACE Select Advisors Trust
PACE Municipal Fixed Income Investments
Portfolio of investments—July 31, 2013
| | | Face
amount | | Value | |
Municipal bonds and notes—(continued) | |
Utah—(concluded) | |
Utah State Housing Finance Agency
Single-Family Mortgage Series G-3,
Class III
5.700%, due 07/01/151 | | $ | 130,000 | | | $ | 130,377 | | |
| | | | 3,148,185 | | |
Washington—6.43% | |
Energy Northwest Electric Revenue
Columbia Station Series A
5.000%, due 07/01/23 | | | 2,500,000 | | | | 2,743,725 | | |
Energy Northwest Electric Revenue
Refunding (Columbia Generating),
Series A
5.000%, due 07/01/19 | | | 2,500,000 | | | | 2,951,750 | | |
Energy Northwest Electric Revenue
Refunding Columbia Station Series A
5.000%, due 07/01/21 | | | 2,000,000 | | | | 2,207,040 | | |
Energy Northwest Electric Revenue
Refunding Project 1 Series A
5.000%, due 07/01/16 | | | 1,515,000 | | | | 1,698,997 | | |
Port of Seattle Refunding
5.500%, due 12/01/221 | | | 500,000 | | | | 576,850 | | |
Port of Seattle Revenue Refunding
Intermediate Lien Series C
5.000%, due 02/01/161 | | | 1,000,000 | | | | 1,098,870 | | |
Seattle Municipal Lighting & Power
Revenue Refunding & Improvement
Series A
5.000%, due 02/01/22 | | | 2,500,000 | | | | 2,866,075 | | |
Washington Health Care Facilities
Authority Overlake Hospital Medical
Center Series A (Assured Guaranty
Insured)
5.000%, due 07/01/16 | | | 1,000,000 | | | | 1,067,440 | | |
| | | Face
amount | | Value | |
Municipal bonds and notes—(concluded) | |
Washington—(concluded) | |
Washington State Public Power Supply
Systems Nuclear Project No. 1
Revenue Refunding Series B
7.125%, due 07/01/16 | | $ | 3,000,000 | | | $ | 3,538,290 | | |
Washington State Series A-Various
Purpose
5.000%, due 07/01/17 | | | 2,130,000 | | | | 2,445,410 | | |
5.000%, due 07/01/20 | | | 2,625,000 | | | | 3,038,333 | | |
| | | | 24,232,780 | | |
Wisconsin—0.52% | |
Wisconsin Health & Educational
Facilities Authority Revenue
(Aurora Health Care, Inc.),
Series A
5.125%, due 04/15/31 | | | 2,000,000 | | | | 1,978,100 | | |
Total municipal bonds and notes
(cost—$368,092,710) | | | | | 374,901,915 | | |
Tax-free money market fund—0.76% | |
State Street Global Advisors Tax Free
Money Market Fund
(cost—$2,887,620) | | | 2,887,620 | | | | 2,887,620 | | |
Total investments
(cost—$370,980,330)—100.26% | | | | | 377,789,535 | | |
Liabilities in excess of
other assets—(0.26)% | | | | | (993,483 | ) | |
Net assets—100.00% | | | | $ | 376,796,052 | | |
For a listing of defined portfolio acronyms that are used throughout the Portfolio of investments as well as the tables that follow, please refer to page 218.
Aggregate cost for federal income tax purposes was $370,980,330; and net unrealized appreciation consisted of:
Gross unrealized appreciation | | $ | 14,156,733 | | |
Gross unrealized depreciation | | | (7,347,528 | ) | |
Net unrealized appreciation | | $ | 6,809,205 | | |
70
PACE Select Advisors Trust
PACE Municipal Fixed Income Investments
Portfolio of investments—July 31, 2013
Fair valuation summary
The following is a summary of the fair valuations according to the inputs used as of July 31, 2013 in valuing the Portfolio's investments:
| | | Unadjusted
quoted prices in
active markets for
identical investments
(Level 1) | | Other significant
observable inputs
(Level 2) | | Unobservable
inputs
(Level 3) | | Total | |
Municipal bonds and notes | | $ | — | | | $ | 372,740,665 | | | $ | 2,161,250 | | | $ | 374,901,915 | | |
Tax-free money market fund | | | — | | | | 2,887,620 | | | | — | | | | 2,887,620 | | |
Total | | $ | — | | | $ | 375,628,285 | | | $ | 2,161,250 | | | $ | 377,789,535 | | |
At July 31, 2013, there were no transfers between Level 1 and Level 2.
The following is a rollforward of the Portfolio's investment that was fair valued using unobservable inputs (Level 3) for the year ended July 31, 2013:
| | | Municipal bonds
and notes | |
Beginning balance | | $ | — | | |
Purchases | | | 2,182,031 | | |
Sales | | | — | | |
Accrued discounts/(premiums) | | | 9,816 | | |
Total realized gain/(loss) | | | — | | |
Net change in unrealized appreciation/depreciation | | | (30,597 | ) | |
Transfers into Level 3 | | | — | | |
Transfers out of Level 3 | | | — | | |
Ending balance | | $ | 2,161,250 | | |
The change in net unrealized appreciation/depreciation relating to the Level 3 investment held at July 31, 2013 was $(30,597).
Portfolio footnotes
1 Security subject to Alternative Minimum Tax.
2 Security exempt from registration pursuant to Rule 144A under the Securities Act of 1933. This security, which represents 0.39% of net assets as of July 31, 2013, is considered liquid and may be resold in transactions exempt from registration, normally to qualified institutional buyers.
3 Variable or floating rate security. The interest rate shown is the current rate as of July 31, 2013 and changes periodically.
4 Zero coupon bond. The rate shown represents annualized yield at the date of purchase.
5 Security purchased on a when-issued basis. When issued refers to a transaction made conditionally because a security, although authorized, has not yet been issued.
See accompanying notes to financial statements.
71
PACE Select Advisors Trust
PACE International Fixed Income Investments
Performance
For the 12 months ended July 31, 2013, the Portfolio's Class P shares declined 4.59% before the deduction of the maximum PACE Select program fee. (Class P shares declined 6.48% after the deduction of the maximum PACE Select program fee for the same 12-month period.) In comparison, the Barclays Global Aggregate ex US Index (the "benchmark") declined 2.38% and the Lipper International Income Funds category posted a median decline of 2.25%. (Returns for all share classes over various time periods are shown in the "Performance at a glance" table on page 75. Please note that the returns shown do not reflect the deduction of taxes that a shareholder would pay on Portfolio distributions or the redemption of Portfolio shares.) For a detailed commentary on the market environment in general during the reporting period, please refer to page 2.
Sub-Advisor's comments1
The Portfolio underperformed its benchmark during the reporting period. In keeping with our core philosophy of investing in relatively healthy countries and companies, the themes in the Portfolio over the reporting period have been biased toward owning bonds in countries with positive economic growth, combined with low inflation and/or declining debt burdens. This theme was across both developed and emerging market countries. Overall, we viewed the global economic environment as operating below historic capacity, as the sharp contraction in activity following the deleveraging period post the 2008-2009 credit crunch continued to weigh on households, held back by anemic employment growth—this was the prevalent theme across the developed markets. Conversely, there was better relative growth momentum in the emerging markets, during the reporting period. Within the credit portion of the Portfolio, we had a preference for holding senior debt of nationally important financial institutions and strong global industrial companies operating in less cyclical industries.
During the reporting period, the Portfolio held overweight positions in Norway, Canada, Sweden and selected emerging markets, particularly Mexico and Malaysia. In contrast, we held underweight positions in the US, UK, Japan and peripheral Europe. In the case of peripheral Europe, the main driver behind our view was a fundamental concern that the sharp contraction in the economies of Greece, Spain, Portugal and Italy would render these countries unable to reduce the size of their respective debt burdens. Against this backdrop, we preferred to hold overweight positions in emerging markets with better debt profiles and healthy
PACE Select Advisors Trust – PACE International Fixed Income Investments
Investment Sub-Advisor:
Rogge Global Partners plc ("Rogge Global Partners")
Portfolio Managers:
Olaf Rogge, John Graham, Richard Bell, Adrian James and Malie Conway
Objective:
High total return
Investment process:
Rogge Global Partners seeks to invest the Portfolio's assets in fixed income securities of financially healthy issuers, because it believes that these investments produce the highest bond and currency returns over time. In deciding which fixed income securities to buy for the Portfolio, Rogge Global Partners uses a top-down analysis to find value across countries and to forecast interest and currency-exchange rates over a one-year horizon in those countries. Rogge Global Partners also uses an optimization model to help determine country, currency and duration positions for the Portfolio. Rogge Global Partners generally sells securities that no longer meet these selection criteria or when it identifies more attractive investment opportunities, and may also sell securities to adjust the average duration of the Portfolio.
1 All Sub-Advisors discuss performance on a gross of fees basis—meaning that no fees or expenses are reflected in their sleeves'/sleeve's performance. Alternately, Portfolio performance is shown net of fees, which does factor in fees and expenses associated with the Portfolio.
72
PACE Select Advisors Trust
PACE International Fixed Income Investments
Sub-Advisor's comments – concluded
growth prospects. During the reporting period, our country allocations detracted from returns, mainly due to the relative outperformance of peripheral European markets compared to emerging markets.
We saw a large change in market sentiment in May and June 2013, as worries over the timing of the Federal Reserve Board's cessation of bond buying under its quantitative easing program ("tapering"), coupled with signs of stronger economic growth in the US and Europe, caused a flurry of selling of US Treasuries and a reversal of flows into emerging markets debt. This negative sentiment and general rise in market volatility was a drag on performance given our preference for overweighting emerging markets bonds and currencies in the Portfolio. Our preference to underweight the Japanese yen was positive for returns, as the currency sharply depreciated against the US dollar.
During most of the reporting period, we maintained a neutral overall duration position and did not have any significant yield curve positions. (Duration measures a portfolio's sensitivity to interest rate changes.)
Within the corporate bond portion of the Portfolio, sector selection added value, as financials outperformed both industrials and utilities. Also adding value was our overweight to high yield securities, which performed very well compared to investment grade corporate bonds.
During the reporting period, interest rate futures were used to take positions in various government bond markets, hedge our interest rate exposure and take yield curve positions, while foreign currency forwards were used to hedge the portfolio back into dollars, take active currency positions and hedge/cross hedge active currency positions. Overall, the use of these derivative instruments contributed to performance.
Special considerations
The Portfolio may be appropriate for long-term investors seeking high total return and who are able to withstand short-term fluctuations in the fixed income markets in return for potentially higher returns over the long term. The yield and value of the Portfolio change every day and can be affected by changes in interest rates, general market conditions and other political, social and economic developments, as well as specific matters relating to the issuers in which the Portfolio invests. It is important to note that an investment in the Portfolio is only one component of a balanced investment plan. The value of the Portfolio's investments in foreign securities may fall due to adverse political, social and economic developments abroad and due to decreases in foreign currency values relative to the US dollar. These risks are greater for investments in emerging markets than in more developed countries.
73
PACE Select Advisors Trust
PACE International Fixed Income Investments
Illustration of an assumed investment of $10,000 in Class P shares of the Portfolio (unaudited)
The following graph depicts the performance of PACE International Fixed Income Investments Class P shares versus the Barclays Global Aggregate ex US Index over the 10 years ended July 31, 2013. The performance of the other classes will vary based upon the different class specific expenses and sales charges. The performance provided does not reflect the deduction of taxes that a shareholder would pay on Portfolio distributions or the redemption of Portfolio shares. Past performance is no guarantee of future results. Share price and returns will vary with market conditions; investors may realize a gain or loss upon redemption. It is important to note that PACE International Fixed Income Investments is a professionally managed portfolio while the Index is not available for investment and is unmanaged. The comparison is shown for illustration purposes only.
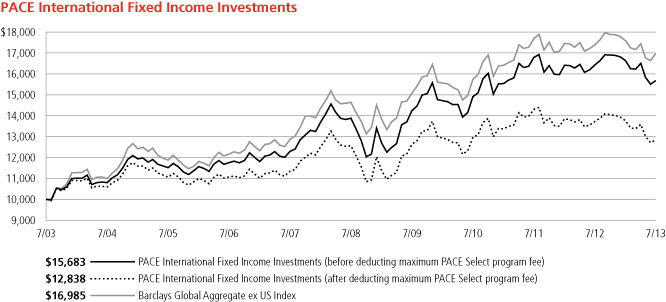
74
PACE Select Advisors Trust
PACE International Fixed Income Investments
Performance at a glance (unaudited)
Average annual total returns for periods ended 07/31/13 | | 1 year | | 5 years | | 10 years | |
Before deducting maximum sales charge or PACE Select program fee | |
Class A1 | | | (4.80 | )% | | | 2.21 | % | | | 4.36 | % | |
Class C2 | | | (5.26 | )% | | | 1.73 | % | | | 3.86 | % | |
Class Y3 | | | (4.60 | )% | | | 2.49 | % | | | 4.66 | % | |
Class P4 | | | (4.59 | )% | | | 2.46 | % | | | 4.60 | % | |
After deducting maximum sales charge or PACE Select program fee | |
Class A1 | | | (9.11 | )% | | | 1.27 | % | | | 3.88 | % | |
Class C2 | | | (5.96 | )% | | | 1.73 | % | | | 3.86 | % | |
Class P4 | | | (6.48 | )% | | | 0.43 | % | | | 2.53 | % | |
Barclays Global Aggregate ex US Index5 | | | (2.38 | )% | | | 3.01 | % | | | 5.44 | % | |
Lipper International Income Funds median | | | (2.25 | )% | | | 3.83 | % | | | 4.93 | % | |
Average annual total returns for periods ended June 30, 2013, after deduction of the maximum sales charge or PACE Select program fee, were as follows: Class A—1-year period, (8.77)%; 5-year period, 1.15%; 10-year period, 3.39%; Class C—1-year period, (5.72)%; 5-year period, 1.60%; 10-year period, 3.36%; Class Y—1-year period, (4.36)%; 5-year period, 2.34%; 10-year period, 4.17%; Class P—1-year period, (6.16)%; 5-year period, 0.30%; 10-year period, 2.05%.
The annualized gross and net expense ratios, respectively, for each class of shares as in the November 28, 2012 prospectuses, were as follows: Class A—1.27% and 1.21%; Class C—1.75% and 1.69%; Class Y—1.11% and 1.00%; and Class P—1.11% and 1.00%. Net expenses reflect fee waivers and/or expense reimbursements, if any, pursuant to an agreement that is in effect to cap the expenses. The Portfolio and UBS Global Asset Management (Americas) Inc. ("UBS Global AM") have entered into a written fee waiver/expense reimbursement agreement pursuant to which UBS Global AM is contractually obligated to (1) waive its management fees through November 30, 2013 to the extent necessary to reflect the lower sub-advisory fee paid by UBS Global AM to Rogge Global Partners plc, the Portfolio's investment advisor; and (2) waive its management fees and/or reimburse expenses so that the Portfolio's ordinary total operating expenses of each class through November 30, 2013 (excluding dividend expense, borrowing costs, and interest expense relating to short sales, and expenses attributable to investment in other investment companies, interest, taxes, brokerage commissions and extraordinary expenses) would not exceed Class A—1.25%; Class C—1.75%; Class Y—1.00% and Class P—1.00%. The Portfolio has agreed to repay UBS Global AM for any waived fees/reimbursed expenses (pursuant to item (2)) to the extent that it can do so over the following three fiscal years without causing the Portfolio's expenses in any of those three years to exceed these expense caps. The fee waiver/expense reimbursement agreement may be terminated by the Portfolio's board at any time and also will terminate automatically upon the expiration or termination of the Portfolio's advisory contract with UBS Global AM. Upon termination of the agreement, however, UBS Global AM's three year recoupment rights will survive.
1 Maximum sales charge for Class A shares is 4.5%. Class A shares bear ongoing 12b-1 service fees.
2 Maximum contingent deferred sales charge for Class C shares is 0.75% imposed on redemptions and is reduced to 0% after one year. Class C shares bear ongoing 12b-1 service and distribution fees. Prior to September 30, 2003, Class C shares were subject to a maximum front-end sales charge of 1%; this front-end sales charge is not reflected in the average annual total returns presented for the Class C shares shown above.
3 The Portfolio offers Class Y shares to a limited group of eligible investors, including certain qualifying retirement plans. Class Y shares do not bear initial or contingent deferred sales charges or ongoing 12b-1 service and distribution fees.
4 Class P shares do not bear initial or contingent deferred sales charges or ongoing 12b-1 service and distribution fees, but are subject to a maximum annual PACE Select program fee of 2% of the value of Class P shares. Prior to June 14, 2010, the maximum annual PACE Select program fee was 1.5% of the value of Class P shares; however, the current maximum annual PACE Select program fee of 2% is reflected in the performance returns throughout all periods in the average annual total returns presented for the Class P shares shown above.
5 The Barclays Global Aggregate ex US Index is an unmanaged index which provides a broad-based measure of the global investment grade fixed income markets excluding the US dollar denominated debt market. The two major components of this Index are the Pan-European Aggregate and the Asian-Pacific Aggregate Indices. The Index also includes Global Treasury, Eurodollar, Euro-Yen, Canadian, and investment grade 144A index-eligible securities not already in the three regional aggregate indices. Investors should note that indices do not reflect the deduction of fees and expenses.
If an investor sells or exchanges shares less than 90 days after purchase, a redemption fee of 1.00% of the amount sold or exchanged will be deducted at the time of the transaction, except as noted otherwise in the prospectuses.
Past performance does not predict future performance, and the performance information provided does not reflect the deduction of taxes that a shareholder would pay on Portfolio distributions or the redemption of Portfolio shares. The return and principal value of an investment will fluctuate, so that an investor's shares, when redeemed, may be worth more or less than their original cost. Performance results assume reinvestment of all dividends and capital gain distributions at net asset value on the ex-dividend dates. Current performance may be higher or lower than the performance data quoted. For month-end performance figures, please visit http://globalam-us.ubs.com/corpweb/performance.do.
Lipper peer group data calculated by Lipper Inc.; used with permission. The Lipper median is the return of the fund that places in the middle of a Lipper peer group.
75
PACE Select Advisors Trust
PACE International Fixed Income Investments
Portfolio statistics (unaudited)
Characteristics | | 07/31/13 | |
Weighted average duration | | | 6.8 yrs. | | |
Weighted average maturity | | | 7.8 yrs. | | |
Average coupon | | | 3.91 | % | |
Net assets (mm) | | $ | 548.2 | | |
Number of holdings | | | 176 | | |
Portfolio composition1 | | 07/31/13 | |
Long-term global debt securities | | | 96.7 | % | |
US government obligation | | | 1.1 | | |
Futures and forward foreign currency contracts | | | (0.6 | ) | |
Cash equivalents and other assets less liabilities | | | 2.8 | | |
Total | | | 100.0 | % | |
Quality diversification1 | | 07/31/13 | |
AAA | | | 19.4 | % | |
AA | | | 11.0 | | |
A | | | 26.1 | | |
BBB | | | 8.1 | | |
BB | | | 2.9 | | |
B | | | 2.4 | | |
CCC | | | 0.3 | | |
Non-rated | | | 27.6 | | |
Futures and forward foreign currency contracts | | | (0.6 | ) | |
Cash equivalents and other assets less liabilities | | | 2.8 | | |
Total | | | 100.0 | % | |
Top five countries of incorporation1 | | 07/31/13 | |
United States | | | 13.6 | % | |
United Kingdom | | | 12.7 | | |
Japan | | | 9.6 | | |
Sweden | | | 8.7 | | |
Norway | | | 6.2 | | |
Total | | | 50.8 | % | |
1 Weightings represent percentages of the Portfolio's net assets as of July 31, 2013. The Portfolio is actively managed and its composition will vary over time. Credit quality ratings shown are based on the ratings assigned to portfolio holdings by Standard & Poor's Ratings Group, an independent rating agency.
76
PACE Select Advisors Trust
PACE International Fixed Income Investments
Portfolio of investments—July 31, 2013
| | | Face
amount | | Value | |
Long-term global debt securities—96.65% | |
Australia—2.88% | |
Australia & New Zealand
Banking Group Ltd.
4.875%, due 01/12/211 | | USD | 2,350,000 | | | $ | 2,558,210 | | |
5.100%, due 01/13/201 | | USD | 1,100,000 | | | | 1,218,580 | | |
Commonwealth Bank of
Australia
3.000%, due 05/03/222 | | EUR | 2,900,000 | | | | 4,108,700 | | |
National Australia Bank Ltd.
3.000%, due 01/20/23 | | USD | 4,350,000 | | | | 4,051,499 | | |
Westpac Banking Corp.
4.875%, due 11/19/19 | | USD | 1,650,000 | | | | 1,846,988 | | |
5.000%, due 10/21/192 | | GBP | 1,150,000 | | | | 1,997,932 | | |
| | | | 15,781,909 | | |
Belgium—1.92% | |
Anheuser-Busch InBev SA
6.500%, due 06/23/17 | | GBP | 2,100,000 | | | | 3,766,361 | | |
Belgium Government Bond
4.250%, due 09/28/22 | | EUR | 4,400,000 | | | | 6,762,067 | | |
| | | | 10,528,428 | | |
Brazil—1.60% | |
Banco do Brasil SA
3.875%, due 10/10/22 | | USD | 1,000,000 | | | | 882,500 | | |
Brazil Notas do Tesouro
Nacional Serie F
10.000%, due 01/01/23 | | BRL | 19,050,000 | | | | 7,886,803 | | |
| | | | 8,769,303 | | |
British Virgin Islands—1.04% | |
CNOOC Finance 2011 Ltd.
4.250%, due 01/26/211 | | USD | 3,100,000 | | | | 3,136,022 | | |
Sinopec Group Overseas
Development 2012 Ltd.
3.900%, due 05/17/222 | | USD | 2,650,000 | | | | 2,580,305 | | |
| | | | 5,716,327 | | |
Canada—2.36% | |
Canadian Government Bond
5.750%, due 06/01/33 | | CAD | 3,760,000 | | | | 5,191,773 | | |
Cards II Trust
3.333%, due 05/15/16 | | CAD | 2,300,000 | | | | 2,320,243 | | |
Precision Drilling Corp.
6.625%, due 11/15/20 | | USD | 704,000 | | | | 739,200 | | |
Rogers Communications, Inc.
4.000%, due 06/06/22 | | CAD | 1,300,000 | | | | 1,252,473 | | |
Royal Bank of Canada
0.850%, due 03/08/16 | | USD | 1,850,000 | | | | 1,839,455 | | |
Toronto-Dominion Bank
5.375%, due 05/14/152 | | EUR | 1,100,000 | | | | 1,588,188 | | |
| | | | 12,931,332 | | |
Chile—0.28% | |
Banco Santander Chile
3.875%, due 09/20/221 | | USD | 1,650,000 | | | | 1,534,500 | | |
| | | Face
amount | | Value | |
Long-term global debt securities—(continued) | |
Denmark—1.44% | |
Denmark Government Bond
1.500%, due 11/15/23 | | DKK | 45,700,000 | | | $ | 7,905,910 | | |
Dominican Republic—0.23% | |
Dominican Republic
International Bond
5.875%, due 04/18/241 | | USD | 1,300,000 | | | | 1,267,500 | | |
Finland—0.54% | |
Finland Government Bond
3.500%, due 04/15/211 | | EUR | 1,950,000 | | | | 2,955,521 | | |
France—6.08% | |
BNP Paribas Home Loan
Covered Bonds SA
2.200%, due 11/02/151 | | USD | 3,900,000 | | | | 3,997,500 | | |
BNP Paribas SA
2.375%, due 09/14/17 | | USD | 2,550,000 | | | | 2,571,293 | | |
BPCE SA
4.625%, due 07/30/153,4 | | EUR | 1,100,000 | | | | 1,424,971 | | |
Caisse d'Amortissement de la
Dette Sociale
3.625%, due 04/25/15 | | EUR | 8,125,000 | | | | 11,410,045 | | |
GDF Suez
2.750%, due 10/18/17 | | EUR | 1,800,000 | | | | 2,544,586 | | |
Pernod-Ricard SA
4.875%, due 03/18/16 | | EUR | 950,000 | | | | 1,379,064 | | |
Picard Groupe SA
4.477%, due 08/01/191,4 | | EUR | 200,000 | | | | 270,061 | | |
Republic of France
4.000%, due 04/25/55 | | EUR | 450,000 | | | | 672,698 | | |
Sanofi
2.625%, due 03/29/16 | | USD | 4,100,000 | | | | 4,281,954 | | |
Societe Generale SA
2.750%, due 10/12/17 | | USD | 2,800,000 | | | | 2,836,383 | | |
5.200%, due 04/15/212 | | USD | 800,000 | | | | 852,449 | | |
Tereos Europe SA
6.375%, due 04/15/142 | | EUR | 800,000 | | | | 1,096,208 | | |
| | | | 33,337,212 | | |
Germany—0.92% | |
Deutsche Bank AG
0.960%, due 03/09/174 | | EUR | 2,250,000 | | | | 2,888,522 | | |
Trionista Holdco GmbH
5.000%, due 04/30/202 | | EUR | 800,000 | | | | 1,082,905 | | |
Unitymedia Hessen GmbH &
Co. KG/Unitymedia NRW
GmbH
7.500%, due 03/15/192 | | EUR | 750,000 | | | | 1,078,371 | | |
| | | | 5,049,798 | | |
Indonesia—0.59% | |
Indonesia Government
International Bond
3.375%, due 04/15/231 | | USD | 1,400,000 | | | | 1,235,500 | | |
77
PACE Select Advisors Trust
PACE International Fixed Income Investments
Portfolio of investments—July 31, 2013
| | | Face
amount | | Value | |
Long-term global debt securities—(continued) | |
Indonesia—(concluded) | |
Pertamina Persero PT
6.000%, due 05/03/422 | | USD | 1,000,000 | | | $ | 865,000 | | |
Perusahaan Listrik Negara PT
5.500%, due 11/22/212 | | USD | 1,150,000 | | | | 1,135,625 | | |
| | | | 3,236,125 | | |
Ireland—0.77% | |
Ardagh Packaging Finance
PLC/Ardagh MP Holdings
USA, Inc.
7.375%, due 10/15/172 | | EUR | 750,000 | | | | 1,062,617 | | |
Rosneft Oil Co. via Rosneft
International Finance Ltd.
3.149%, due 03/06/171 | | USD | 400,000 | | | | 395,000 | | |
Smurfit Kappa Acquisitions
4.875%, due 09/15/181 | | USD | 870,000 | | | | 867,825 | | |
Willow No.2 Ireland PLC for
Zurich Insurance Co. Ltd.
3.375%, due 06/27/222 | | EUR | 1,350,000 | | | | 1,889,517 | | |
| | | | 4,214,959 | | |
Italy—5.96% | |
Buoni Poliennali Del Tesoro
4.500%, due 02/01/20 | | EUR | 7,200,000 | | | | 10,010,510 | | |
4.750%, due 09/01/21 | | EUR | 9,050,000 | | | | 12,662,261 | | |
Italy Buoni Poliennali
Del Tesoro
4.750%, due 09/15/16 | | EUR | 7,050,000 | | | | 9,992,950 | | |
| | | | 32,665,721 | | |
Japan—9.63% | |
Bank of Tokyo-Mitsubishi
UFJ Ltd.
3.850%, due 01/22/151 | | USD | 1,900,000 | | | | 1,980,560 | | |
Development Bank of Japan
1.750%, due 03/17/17 | | JPY | 130,000,000 | | | | 1,400,703 | | |
2.300%, due 03/19/26 | | JPY | 500,000,000 | | | | 5,888,413 | | |
Government of Japan
2.000%, due 03/20/16 | | JPY | 988,000,000 | | | | 10,583,417 | | |
2.200%, due 09/20/26 | | JPY | 1,016,100,000 | | | | 11,782,256 | | |
2.300%, due 06/20/35 | | JPY | 1,177,000,000 | | | | 13,254,155 | | |
2.300%, due 12/20/36 | | JPY | 480,000,000 | | | | 5,414,852 | | |
Sumitomo Mitsui Banking
Corp.
3.200%, due 07/18/22 | | USD | 2,600,000 | | | | 2,485,701 | | |
| | | | 52,790,057 | | |
Liberia—0.06% | |
Royal Caribbean Cruises Ltd.
5.250%, due 11/15/22 | | USD | 350,000 | | | | 352,625 | | |
Luxembourg—0.87% | |
HeidelbergCement Finance
Luxembourg SA
7.500%, due 04/03/20 | | EUR | 700,000 | | | | 1,123,547 | | |
| | | Face
amount | | Value | |
Long-term global debt securities—(continued) | |
Luxembourg—(concluded) | |
Prologis International
Funding SA
5.875%, due 10/23/145 | | EUR | 450,000 | | | $ | 627,094 | | |
Schlumberger Investment SA
1.950%, due 09/14/161 | | USD | 1,950,000 | | | | 1,993,543 | | |
Trinseo Materials Operating
SCA/Trinseo Materials
Finance, Inc.
8.750%, due 02/01/191,6 | | USD | 1,050,000 | | | | 1,042,125 | | |
| | | | 4,786,309 | | |
Malaysia—1.90% | |
Malaysia Government Bond,
Series 0111
4.160%, due 07/15/21 | | MYR | 9,950,000 | | | | 3,083,304 | | |
Series 0112
3.418%, due 08/15/22 | | MYR | 17,150,000 | | | | 5,021,027 | | |
Series 0902
4.378%, due 11/29/19 | | MYR | 2,500,000 | | | | 785,296 | | |
Petronas Capital Ltd.
5.250%, due 08/12/192 | | USD | 1,400,000 | | | | 1,551,746 | | |
| | | | 10,441,373 | | |
Mexico—4.25% | |
Mexican Bonos
6.500%, due 06/10/21 | | MXN | 48,430,000 | | | | 3,949,833 | | |
6.500%, due 06/09/22 | | MXN | 157,500,000 | | | | 12,820,250 | | |
8.500%, due 12/13/18 | | MXN | 52,800,000 | | | | 4,784,424 | | |
8.500%, due 05/31/29 | | MXN | 19,200,000 | | | | 1,767,910 | | |
| | | | 23,322,417 | | |
Netherlands—5.69% | |
ABN AMRO Bank N.V.
4.250%, due 02/02/172 | | USD | 4,000,000 | | | | 4,272,960 | | |
Bank Nederlandse Gemeenten
2.250%, due 08/24/162 | | EUR | 1,400,000 | | | | 1,947,835 | | |
2.250%, due 01/12/172 | | EUR | 1,350,000 | | | | 1,883,526 | | |
BMW Finance N.V.
4.000%, due 09/17/14 | | EUR | 600,000 | | | | 829,230 | | |
Deutsche Telekom
International Finance BV
2.250%, due 03/06/171 | | USD | 2,650,000 | | | | 2,682,794 | | |
Heineken N.V.
2.125%, due 08/04/202 | | EUR | 800,000 | | | | 1,057,611 | | |
ING Bank N.V.
3.750%, due 03/07/171 | | USD | 3,150,000 | | | | 3,305,182 | | |
6.125%, due 05/29/234 | | EUR | 800,000 | | | | 1,165,494 | | |
Linde Finance BV
3.125%, due 12/12/18 | | EUR | 1,050,000 | | | | 1,517,126 | | |
Lukoil International
Finance BV
6.125%, due 11/09/202 | | USD | 2,550,000 | | | | 2,728,500 | | |
Netherlands Government
Bond
4.000%, due 01/15/372 | | EUR | 1,900,000 | | | | 3,137,893 | | |
78
PACE Select Advisors Trust
PACE International Fixed Income Investments
Portfolio of investments—July 31, 2013
| | | Face
amount | | Value | |
Long-term global debt securities—(continued) | |
Netherlands—(concluded) | |
Rabobank
3.875%, due 02/08/22 | | USD | 3,700,000 | | | $ | 3,724,479 | | |
Schlumberger Finance BV
2.750%, due 12/01/152 | | EUR | 1,400,000 | | | | 1,949,062 | | |
UPC Holding BV
6.750%, due 03/15/231 | | EUR | 750,000 | | | | 1,003,809 | | |
| | | | 31,205,501 | | |
New Zealand—1.18% | |
New Zealand Government
Bond
5.500%, due 04/15/23 | | NZD | 7,350,000 | | | | 6,448,740 | | |
Norway—6.24% | |
DnB Bank ASA
4.375%, due 02/24/212 | | EUR | 1,750,000 | | | | 2,653,363 | | |
DnB NOR Boligkreditt
3.375%, due 01/20/17 | | EUR | 4,000,000 | | | | 5,765,789 | | |
Norway Government Bond
2.000%, due 05/24/23 | | NOK | 86,500,000 | | | | 13,800,191 | | |
3.750%, due 05/25/21 | | NOK | 64,850,000 | | | | 11,980,919 | | |
| | | | 34,200,262 | | |
Philippines—0.17% | |
Republic of Philippines
3.900%, due 11/26/22 | | PHP | 40,000,000 | | | | 922,137 | | |
Poland—0.13% | |
Poland Government Bond,
Series 1019
5.500%, due 10/25/19 | | PLN | 2,025,000 | | | | 697,729 | | |
Singapore—1.31% | |
DBS Bank Ltd.
2.375%, due 09/14/15 | | USD | 950,000 | | | | 976,847 | | |
5.000%, due 11/15/191,4 | | USD | 2,400,000 | | | | 2,492,904 | | |
Oversea-Chinese Banking
Corp., Ltd.
4.250%, due 11/18/194 | | USD | 2,300,000 | | | | 2,367,804 | | |
United Overseas Bank Ltd.
5.375%, due 09/03/191,4 | | USD | 1,300,000 | | | | 1,346,995 | | |
| | | | 7,184,550 | | |
Slovenia—0.14% | |
Slovenia Government
International Bond
5.850%, due 05/10/231 | | USD | 800,000 | | | | 761,440 | | |
South Korea—1.44% | |
Korea Treasury Bond
5.750%, due 09/10/18 | | KRW | 7,924,710,000 | | | | 7,873,871 | | |
Spain—2.50% | |
Spain Government Bond
4.250%, due 10/31/16 | | EUR | 3,200,000 | | | | 4,438,898 | | |
5.850%, due 01/31/22 | | EUR | 6,350,000 | | | | 9,261,237 | | |
| | | | 13,700,135 | | |
| | | Face
amount | | Value | |
Long-term global debt securities—(continued) | |
Sweden—8.67% | |
Government of Sweden
3.500%, due 06/01/22 | | SEK | 173,725,000 | | | $ | 29,710,769 | | |
4.250%, due 03/12/19 | | SEK | 14,830,000 | | | | 2,586,572 | | |
Nordea Bank AB
3.125%, due 03/20/171 | | USD | 2,500,000 | | | | 2,600,400 | | |
Nordea Hypotek AB
3.500%, due 01/18/17 | | EUR | 2,100,000 | | | | 3,044,193 | | |
Swedbank AB
2.125%, due 09/29/171 | | USD | 2,700,000 | | | | 2,683,665 | | |
3.375%, due 02/09/17 | | EUR | 750,000 | | | | 1,069,188 | | |
Swedbank Hypotek AB
1.125%, due 05/07/20 | | EUR | 1,300,000 | | | | 1,671,864 | | |
Vattenfall AB
6.250%, due 03/17/21 | | EUR | 2,450,000 | | | | 4,162,877 | | |
| | | | 47,529,528 | | |
Switzerland—0.43% | |
Credit Suisse AG
1.625%, due 03/06/152 | | USD | 2,300,000 | | | | 2,333,580 | | |
Thailand—0.28% | |
PTT PCL
3.375%, due 10/25/221 | | USD | 1,650,000 | | | | 1,532,586 | | |
United Kingdom—12.66% | |
Abbey National Treasury
Services PLC
3.625%, due 10/14/16 | | EUR | 2,000,000 | | | | 2,883,400 | | |
5.750%, due 03/02/262 | | GBP | 1,500,000 | | | | 2,779,169 | | |
Anglian Water Services
Finance PLC
6.250%, due 06/27/16 | | EUR | 900,000 | | | | 1,376,807 | | |
Barclays Bank PLC
2.250%, due 05/10/172 | | USD | 1,500,000 | | | | 1,539,600 | | |
4.500%, due 03/04/194 | | EUR | 950,000 | | | | 1,265,728 | | |
5.125%, due 01/08/20 | | USD | 1,250,000 | | | | 1,387,696 | | |
5.140%, due 10/14/20 | | USD | 1,100,000 | | | | 1,139,811 | | |
BAT International Finance PLC
3.250%, due 06/07/221 | | USD | 1,350,000 | | | | 1,330,218 | | |
Coventry Building Society
2.250%, due 12/04/172 | | EUR | 2,100,000 | | | | 2,813,319 | | |
HSBC Holdings PLC
4.000%, due 03/30/22 | | USD | 2,000,000 | | | | 2,042,026 | | |
6.250%, due 03/19/18 | | EUR | 2,100,000 | | | | 3,236,402 | | |
Lloyds TSB Bank PLC
4.875%, due 03/30/272 | | GBP | 500,000 | | | | 837,324 | | |
5.125%, due 03/07/25 | | GBP | 650,000 | | | | 1,131,740 | | |
Nationwide Building Society
4.375%, due 02/28/22 | | EUR | 3,750,000 | | | | 5,931,957 | | |
Phones4u Finance PLC
9.500%, due 04/01/182 | | GBP | 850,000 | | | | 1,351,251 | | |
Rio Tinto Finance USA PLC
2.000%, due 03/22/17 | | USD | 1,550,000 | | | | 1,554,247 | | |
79
PACE Select Advisors Trust
PACE International Fixed Income Investments
Portfolio of investments—July 31, 2013
| | | Face
amount | | Value | |
Long-term global debt securities—(continued) | |
United Kingdom—(concluded) | |
Royal Bank of Scotland
Group PLC
2.550%, due 09/18/15 | | USD | 1,800,000 | | | $ | 1,837,413 | | |
Royal Bank of Scotland PLC
4.875%, due 08/25/141 | | USD | 3,000,000 | | | | 3,104,217 | | |
Standard Chartered PLC
3.625%, due 12/15/15 | | EUR | 4,500,000 | | | | 6,340,033 | | |
United Kingdom Gilt Inflation
Linked
0.750%, due 03/22/342 | | GBP | 2,701,890 | | | | 4,674,177 | | |
1.875%, due 11/22/22 | | GBP | 9,736,395 | | | | 18,363,439 | | |
United Kingdom Treasury
Bonds
4.250%, due 12/07/55 | | GBP | 1,420,000 | | | | 2,501,526 | | |
| | | | 69,421,500 | | |
United States—12.49% | |
ABB Treasury Center USA, Inc.
2.500%, due 06/15/161 | | USD | 2,350,000 | | | | 2,432,572 | | |
AES Corp.
8.000%, due 06/01/20 | | USD | 750,000 | | | | 868,125 | | |
American Express Credit Corp.
2.375%, due 03/24/17 | | USD | 2,600,000 | | | | 2,681,011 | | |
American International Group,
Inc.
4.875%, due 06/01/22 | | USD | 1,150,000 | | | | 1,250,566 | | |
Ball Corp.
6.750%, due 09/15/20 | | USD | 1,050,000 | | | | 1,136,625 | | |
Bank of America Corp. MTN
3.625%, due 03/17/16 | | USD | 3,850,000 | | | | 4,045,357 | | |
BMW US Capital LLC
5.000%, due 05/28/15 | | EUR | 600,000 | | | | 860,103 | | |
CCO Holdings LLC/CCO
Holdings Capital Corp.
6.625%, due 01/31/22 | | USD | 950,000 | | | | 971,375 | | |
CenturyLink, Inc.
5.800%, due 03/15/22 | | USD | 1,000,000 | | | | 995,000 | | |
Chrysler Group LLC/CG
Co-Issuer, Inc.
8.000%, due 06/15/19 | | USD | 950,000 | | | | 1,036,688 | | |
Citigroup, Inc.
4.500%, due 01/14/22 | | USD | 2,850,000 | | | | 3,002,694 | | |
6.125%, due 05/15/18 | | USD | 700,000 | | | | 805,361 | | |
Constellation Brands, Inc.
7.250%, due 05/15/17 | | USD | 450,000 | | | | 513,000 | | |
Continental Resources Inc.
5.000%, due 09/15/22 | | USD | 750,000 | | | | 753,750 | | |
Eagle Rock Energy Partners
LP/Eagle Rock Energy
Finance Corp.
8.375%, due 06/01/19 | | USD | 1,050,000 | | | | 1,081,500 | | |
| | | Face
amount | | Value | |
Long-term global debt securities—(continued) | |
United States—(continued) | |
Eastman Chemical Co.
3.600%, due 08/15/22 | | USD | 1,550,000 | | | $ | 1,521,449 | | |
First Data Corp.
7.375%, due 06/15/191 | | USD | 950,000 | | | | 997,500 | | |
Florida Power & Light Co.
2.750%, due 06/01/23 | | USD | 1,150,000 | | | | 1,102,583 | | |
Fresenius Medical Care US
Finance, Inc.
6.875%, due 07/15/17 | | USD | 1,000,000 | | | | 1,105,000 | | |
General Electric Capital Corp.
6.000%, due 08/07/19 | | USD | 2,250,000 | | | | 2,622,301 | | |
Hawk Acquisition Sub, Inc.
4.250%, due 10/15/201 | | USD | 1,000,000 | | | | 960,000 | | |
HD Supply, Inc.
10.500%, due 01/15/21 | | USD | 650,000 | | | | 669,500 | | |
International Lease Finance
Corp.
8.875%, due 09/01/17 | | USD | 1,100,000 | | | | 1,276,000 | | |
JBS USA LLC/JBS USA Finance,
Inc.
7.250%, due 06/01/212 | | USD | 750,000 | | | | 764,438 | | |
JPMorgan Chase & Co.
4.250%, due 10/15/20 | | USD | 3,600,000 | | | | 3,790,566 | | |
Lamar Media Corp.
5.875%, due 02/01/22 | | USD | 1,000,000 | | | | 1,030,000 | | |
Momentive Performance
Materials, Inc.
8.875%, due 10/15/20 | | USD | 600,000 | | | | 639,000 | | |
Morgan Stanley
5.500%, due 07/28/21 | | USD | 2,400,000 | | | | 2,627,858 | | |
New York Life Global Funding
2.450%, due 07/14/161 | | USD | 2,800,000 | | | | 2,905,344 | | |
OBP Depositor LLC Trust,
Series 2010-OBP, Class A
4.646%, due 07/15/451 | | USD | 700,000 | | | | 760,154 | | |
Philip Morris International, Inc.
1.750%, due 03/19/20 | | EUR | 1,400,000 | | | | 1,836,229 | | |
PNC Funding Corp.
5.125%, due 02/08/20 | | USD | 2,550,000 | | | | 2,850,107 | | |
Reynolds Group Issuer, Inc.
7.875%, due 08/15/19 | | USD | 1,000,000 | | | | 1,100,000 | | |
Roche Holdings, Inc.
6.500%, due 03/04/212 | | EUR | 2,000,000 | | | | 3,505,360 | | |
SESI LLC
7.125%, due 12/15/21 | | USD | 1,000,000 | | | | 1,090,000 | | |
SLM Corp., Series MTN
7.250%, due 01/25/22 | | USD | 1,150,000 | | | | 1,219,000 | | |
The Goldman Sachs Group,
Inc.
5.750%, due 01/24/22 | | USD | 2,350,000 | | | | 2,615,585 | | |
80
PACE Select Advisors Trust
PACE International Fixed Income Investments
Portfolio of investments—July 31, 2013
| | | Face
amount | | Value | |
Long-term global debt securities—(concluded) | |
United States—(concluded) | |
United Rentals N.A., Inc.
7.625%, due 04/15/22 | | USD | 1,000,000 | | | $ | 1,115,000 | | |
UnitedHealth Group, Inc.
2.750%, due 02/15/23 | | USD | 1,500,000 | | | | 1,406,800 | | |
2.875%, due 03/15/22 | | USD | 900,000 | | | | 863,447 | | |
2.875%, due 03/15/23 | | USD | 217,000 | | | | 204,590 | | |
Wells Fargo & Co.
2.625%, due 12/15/16 | | USD | 3,050,000 | | | | 3,175,742 | | |
3.500%, due 03/08/22 | | USD | 1,250,000 | | | | 1,262,633 | | |
Wynn Las Vegas LLC/Wynn
Las Vegas Capital Corp.
7.750%, due 08/15/20 | | USD | 900,000 | | | | 1,012,500 | | |
| | | | 68,462,413 | | |
Total long-term global
debt securities
(cost—$527,970,714) | | | | | 529,861,298 | | |
US government obligation—1.10% | |
United States—1.10% | |
US Treasury Inflation Indexed
Bond
0.125%, due 01/15/23
(cost—$6,618,529) | | USD | 6,155,754 | | | | 6,000,900 | | |
| | | Face
amount | | Value | |
Repurchase agreement—0.61% | |
Repurchase agreement dated
07/31/13 with State Street
Bank and Trust Co., 0.010%
due 08/01/13, collateralized
by $146,370 Federal Home
Loan Mortgage Corp.
obligations, 1.960% due
11/07/22, $3,374,118
Federal National Mortgage
Association obligations,
2.140% to 2.170% due
11/07/22 and $110,950 US
Treasury Notes, 0.250% to
0.750% due 10/31/13 to
12/15/13; (value—$3,414,998);
proceeds: $3,348,001
(cost—$3,348,000) | | $ | 3,348,000 | | | $ | 3,348,000 | | |
Investment of cash collateral from securities loaned—0.20% | |
Money market fund—0.20% | |
UBS Private Money Market
Fund LLC7
(cost—$1,096,145) | | | 1,096,145 | | | | 1,096,145 | | |
Total investments
(cost—$539,033,388)—98.56% | | | | | 540,306,343 | | |
Other assets in excess
of liabilities—1.44% | | | | | 7,899,321 | | |
Net assets—100.00% | | | | $ | 548,205,664 | | |
For a listing of defined portfolio acronyms, counterparty acronyms and currency abbreviations that are used throughout the Portfolio of investments as well as the tables that follow, please refer to page 218.
Aggregate cost for federal income tax purposes was $542,976,950; and net unrealized depreciation consisted of:
Gross unrealized appreciation | | $ | 18,410,344 | | |
Gross unrealized depreciation | | | (21,080,951 | ) | |
Net unrealized depreciation | | $ | (2,670,607 | ) | |
Futures contracts
Number of
contracts | | Currency | |
| | Expiration
date | | Cost | | Current
value | | Unrealized
appreciation
(depreciation) | |
Interest rate futures buy contracts: | | | |
52 | | AUD | | | | Australian Bond 10 Year Futures | | September 2013 | | $ | 5,655,118 | | | $ | 5,544,225 | | | $ | (110,893 | ) | |
502 | | CAD | | | | Canada Government Bond 10 Year Futures | | September 2013 | | | 66,756,715 | | | | 64,236,272 | | | | (2,520,443 | ) | |
96 | | EUR | | | | German Euro BOBL Futures | | September 2013 | | | 16,073,308 | | | | 16,038,731 | | | | (34,577 | ) | |
97 | | EUR | | | | German Euro Buxl 30 Year Futures | | September 2013 | | | 16,813,905 | | | | 16,612,814 | | | | (201,091 | ) | |
609 | | EUR | | | | German Euro Schatz Futures | | September 2013 | | | 89,410,898 | | | | 89,328,712 | | | | (82,186 | ) | |
36 | | JPY | | | | Japan Government Bond 10 Year Futures | | September 2013 | | | 52,301,313 | | | | 52,567,959 | | | | 266,646 | | |
| | | | | | | | | | | $ | 247,011,257 | | | $ | 244,328,713 | | | $ | (2,682,544 | ) | |
81
PACE Select Advisors Trust
PACE International Fixed Income Investments
Portfolio of investments—July 31, 2013
Futures contracts—(concluded)
Number of
contracts | | Currency | |
| | Expiration
date | | Proceeds | | Current
value | | Unrealized
appreciation
(depreciation) | |
Interest rate futures sell contracts: | | | |
52 | | EUR | | | | German Euro Bund Futures | | September 2013 | | $ | 9,798,687 | | | $ | 9,830,394 | | | $ | (31,707 | ) | |
69 | | GBP | | | | United Kingdom Long Gilt Bond Futures | | September 2013 | | | 12,207,574 | | | | 11,787,165 | | | | 420,409 | | |
US Treasury futures sell contracts: | | | |
12 | | USD | | | | US Long Bond Futures | | September 2013 | | | 1,709,320 | | | | 1,608,750 | | | | 100,570 | | |
60 | | USD | | | | US Treasury Note 2 Year Futures | | September 2013 | | | 13,222,393 | | | | 13,218,750 | | | | 3,643 | | |
364 | | USD | | | | US Treasury Note 5 Year Futures | | September 2013 | | | 44,833,957 | | | | 44,177,656 | | | | 656,301 | | |
1133 | | USD | | | | US Treasury Note 10 Year Futures | | September 2013 | | | 147,669,576 | | | | 143,253,688 | | | | 4,415,888 | | |
| | | | | | | | | | | | | | | | | $ | 229,441,507 | | | $ | 223,876,403 | | | $ | 5,565,104 | | |
| | | | | | | | | | | | | | | $ | 2,882,560 | | |
Forward foreign currency contracts
Counterparty | | Contracts to
deliver | | In
exchange for | | Maturity
date | | Unrealized
appreciation
(depreciation) | |
CITI | | CAD | 333,000 | | | USD | 326,339 | | | 08/13/13 | | $ | 2,218 | | |
CITI | | USD | 55,148 | | | EUR | 41,500 | | | 08/13/13 | | | 63 | | |
CITI | | USD | 195,249 | | | JPY | 19,055,500 | | | 08/13/13 | | | (615 | ) | |
CSI | | AUD | 83,000 | | | USD | 76,376 | | | 08/13/13 | | | 1,827 | | |
CSI | | DKK | 26,507,361 | | | EUR | 3,554,767 | | | 08/13/13 | | | (1,226 | ) | |
CSI | | EUR | 890,770 | | | CZK | 22,900,000 | | | 10/09/13 | | | (10,903 | ) | |
CSI | | EUR | 1,330,275 | | | PLN | 5,716,190 | | | 10/09/13 | | | 10,903 | | |
CSI | | EUR | 82,248 | | | USD | 109,299 | | | 08/13/13 | | | (123 | ) | |
CSI | | GBP | 8,513,411 | | | EUR | 10,031,652 | | | 08/13/13 | | | 396,083 | | |
CSI | | NOK | 55,554,539 | | | EUR | 7,226,419 | | | 08/13/13 | | | 190,305 | | |
CSI | | NZD | 400,614 | | | USD | 317,302 | | | 08/13/13 | | | (2,424 | ) | |
CSI | | SEK | 172,775,546 | | | EUR | 19,825,191 | | | 08/13/13 | | | (124,947 | ) | |
CSI | | USD | 1,613,425 | | | CAD | 1,690,000 | | | 08/13/13 | | | 31,512 | | |
CSI | | USD | 8,438,748 | | | CHF | 7,820,188 | | | 08/13/13 | | | 11,940 | | |
CSI | | USD | 73,111,882 | | | JPY | 7,071,500,169 | | | 08/13/13 | | | (883,306 | ) | |
CSI | | USD | 733,762 | | | MXN | 9,861,089 | | | 10/09/13 | | | 33,399 | | |
DB | | AUD | 5,984,000 | | | USD | 5,421,086 | | | 08/13/13 | | | 46,406 | | |
DB | | EUR | 2,147,772 | | | USD | 2,854,196 | | | 08/13/13 | | | (3,196 | ) | |
DB | | MXN | 69,557,433 | | | USD | 5,424,850 | | | 10/09/13 | | | 13,503 | | |
DB | | RUB | 269,830,000 | | | USD | 8,181,997 | | | 10/09/13 | | | 86,492 | | |
DB | | USD | 3,030,782 | | | EUR | 2,296,992 | | | 08/13/13 | | | 25,131 | | |
DB | | USD | 2,831,437 | | | GBP | 1,833,552 | | | 08/13/13 | | | (42,367 | ) | |
DB | | USD | 1,818,988 | | | KRW | 2,050,000,000 | | | 10/08/13 | | | (818 | ) | |
GSI | | AUD | 6,925,800 | | | USD | 6,320,000 | | | 08/13/13 | | | 99,420 | | |
GSI | | CAD | 394,000 | | | EUR | 288,108 | | | 08/13/13 | | | (197 | ) | |
GSI | | CAD | 14,500,000 | | | USD | 13,730,931 | | | 08/13/13 | | | (382,440 | ) | |
GSI | | CHF | 4,180,000 | | | USD | 4,419,539 | | | 08/13/13 | | | (97,472 | ) | |
GSI | | CZK | 329,100,000 | | | EUR | 12,839,920 | | | 10/09/13 | | | 207,926 | | |
GSI | | EUR | 109,619,392 | | | USD | 142,657,022 | | | 08/13/13 | | | (3,180,390 | ) | |
82
PACE Select Advisors Trust
PACE International Fixed Income Investments
Portfolio of investments—July 31, 2013
Forward foreign currency contracts—(concluded)
Counterparty | | Contracts to
deliver | | In
exchange for | | Maturity
date | | Unrealized
appreciation
(depreciation) | |
GSI | | GBP | 18,888,581 | | | USD | 28,640,000 | | | 08/13/13 | | $ | (91,988 | ) | |
GSI | | GBP | 4,219,112 | | | USD | 6,606,497 | | | 08/13/13 | | | 188,679 | | |
GSI | | KRW | 5,700,000,000 | | | USD | 4,947,917 | | | 10/08/13 | | | (107,485 | ) | |
GSI | | MYR | 3,470,000 | | | USD | 1,084,036 | | | 10/09/13 | | | 18,502 | | |
GSI | | SGD | 930,000 | | | USD | 733,329 | | | 10/09/13 | | | 1,502 | | |
GSI | | USD | 24,120,580 | | | AUD | 25,434,930 | | | 08/13/13 | | | (1,275,561 | ) | |
GSI | | USD | 17,785,611 | | | CAD | 18,122,293 | | | 08/13/13 | | | (146,533 | ) | |
GSI | | USD | 18,580,004 | | | EUR | 13,985,488 | | | 08/13/13 | | | 26,261 | | |
GSI | | USD | 1,185,444 | | | MYR | 3,730,000 | | | 10/09/13 | | | (40,071 | ) | |
GSI | | USD | 679,694 | | | NOK | 3,944,875 | | | 08/13/13 | | | (10,525 | ) | |
GSI | | USD | 630,824 | | | PEN | 1,760,000 | | | 10/09/13 | | | (5,266 | ) | |
JPMCB | | BRL | 19,800,000 | | | USD | 9,030,787 | | | 10/09/13 | | | 476,186 | | |
JPMCB | | CAD | 1,725,000 | | | USD | 1,646,400 | | | 08/13/13 | | | (32,605 | ) | |
JPMCB | | CAD | 193,900 | | | USD | 190,065 | | | 08/13/13 | | | 1,335 | | |
JPMCB | | CZK | 12,800,000 | | | EUR | 492,683 | | | 10/09/13 | | | (844 | ) | |
JPMCB | | DKK | 5,590,000 | | | USD | 974,551 | | | 08/13/13 | | | (23,035 | ) | |
JPMCB | | EUR | 170,431 | | | GBP | 146,854 | | | 08/13/13 | | | (3,356 | ) | |
JPMCB | | EUR | 890,563 | | | USD | 1,178,961 | | | 08/13/13 | | | (5,841 | ) | |
JPMCB | | EUR | 1,764,430 | | | USD | 2,350,000 | | | 08/13/13 | | | 2,606 | | |
JPMCB | | JPY | 8,164,400,000 | | | USD | 82,203,311 | | | 08/13/13 | | | (1,188,186 | ) | |
JPMCB | | MXN | 14,100,000 | | | USD | 1,108,814 | | | 10/09/13 | | | 11,878 | | |
JPMCB | | PHP | 40,000,000 | | | USD | 922,637 | | | 10/09/13 | | | 1,608 | | |
JPMCB | | PLN | 3,940,000 | | | USD | 1,175,372 | | | 10/09/13 | | | (52,255 | ) | |
JPMCB | | SEK | 19,880,000 | | | USD | 2,942,526 | | | 08/13/13 | | | (106,671 | ) | |
JPMCB | | THB | 21,260,000 | | | USD | 678,964 | | | 10/09/13 | | | 2,326 | | |
JPMCB | | USD | 5,049,902 | | | CLP | 2,582,520,000 | | | 10/09/13 | | | (73,048 | ) | |
JPMCB | | USD | 3,523,757 | | | EUR | 2,700,839 | | | 08/13/13 | | | 69,434 | | |
JPMCB | | USD | 210,902 | | | EUR | 158,625 | | | 10/16/13 | | | 180 | | |
JPMCB | | USD | 610,445 | | | GBP | 394,375 | | | 08/13/13 | | | (10,549 | ) | |
JPMCB | | USD | 5,678,205 | | | GBP | 3,830,000 | | | 08/13/13 | | | 147,723 | | |
JPMCB | | USD | 176,037 | | | JPY | 17,020,265 | | | 08/13/13 | | | (2,192 | ) | |
JPMCB | | USD | 525,312 | | | JPY | 51,459,016 | | | 08/13/13 | | | 293 | | |
JPMCB | | USD | 2,331,409 | | | MYR | 7,350,000 | | | 10/09/13 | | | (74,441 | ) | |
JPMCB | | USD | 4,916,987 | | | PEN | 13,564,000 | | | 10/09/13 | | | (95,919 | ) | |
JPMCB | | USD | 1,530,965 | | | SGD | 1,906,779 | | | 10/09/13 | | | (30,502 | ) | |
JPMCB | | USD | 1,918,692 | | | THB | 59,183,000 | | | 10/09/13 | | | (35,086 | ) | |
| | | $ | (6,036,742 | ) | |
83
PACE Select Advisors Trust
PACE International Fixed Income Investments
Portfolio of investments—July 31, 2013
Fair valuation summary
The following is a summary of the fair valuations according to the inputs used as of July 31, 2013 in valuing the Portfolio's investments:
| | | Unadjusted
quoted prices in
active markets for
identical investments
(Level 1) | | Other significant
observable inputs
(Level 2) | | Unobservable
inputs
(Level 3) | | Total | |
Long-term global debt securities | | $ | — | | | $ | 529,861,298 | | | $ | — | | | $ | 529,861,298 | | |
US government obligation | | | — | | | | 6,000,900 | | | | — | | | | 6,000,900 | | |
Repurchase agreement | | | — | | | | 3,348,000 | | | | — | | | | 3,348,000 | | |
Investment of cash collateral from securities loaned | | | — | | | | 1,096,145 | | | | — | | | | 1,096,145 | | |
Futures contracts, net | | | 2,882,560 | | | | — | | | | — | | | | 2,882,560 | | |
Forward foreign currency contracts, net | | | — | | | | (6,036,742 | ) | | | — | | | | (6,036,742 | ) | |
Total | | $ | 2,882,560 | | | $ | 534,269,601 | | | $ | — | | | $ | 537,152,161 | | |
At July 31, 2013, there were no transfers between Level 1 and Level 2.
Investments by type of issuer (unaudited)
| | | Percentage of total investments | |
| | | Long-term | | Short-term | |
Government and other public issuers | | | 52.14 | % | | | — | | |
Repurchase agreement | | | — | | | | 0.62 | % | |
Banks and other financial institutions | | | 27.94 | | | | — | | |
Industrial | | | 19.10 | | | | — | | |
Investment of cash collateral from securities loaned | | | — | | | | 0.20 | | |
| | | | 99.18 | % | | | 0.82 | % | |
Portfolio footnotes
1 Security exempt from registration pursuant to Rule 144A under the Securities Act of 1933. These securities, which represent 10.10% of net assets as of July 31, 2013, are considered liquid and may be resold in transactions exempt from registration, normally to qualified institutional buyers.
2 Security exempt from registration pursuant to Regulation S under the Securities Act of 1933. Regulation S applies to securities offerings that are made outside of the United States and do not involve direct selling efforts in the United States. At July 31, 2013, the value of these securities amounted to 11.15% of net assets.
3 Perpetual bond security. The next call date is 07/30/15.
4 Variable or floating rate security. The interest rate shown is the current rate as of July 31, 2013 and changes periodically.
5 Step bond that converts to the noted fixed rate at a designated future date.
6 Security, or portion thereof, was on loan at July 31, 2013.
7 The table below details the Portfolio's transaction activity in an affiliated issuer during the year ended July 31, 2013. The investment manager earns a management fee from UBS Private Money Market Fund LLC. Please see the Notes to financial statements for further information.
Security description | | Value at
07/31/12 | | Purchases
during the
year ended
07/31/13 | | Sales
during the
year ended
07/31/13 | | Value at
07/31/13 | | Net income
earned from
affiliate for the
year ended
07/31/13 | |
UBS Private Money Market Fund LLC | | $ | 2,283,075 | | | $ | 16,014,520 | | | $ | 17,201,450 | | | $ | 1,096,145 | | | $ | 947 | | |
See accompanying notes to financial statements.
84
PACE Select Advisors Trust
PACE High Yield Investments
Performance
For the 12 months ended July 31, 2013, the Portfolio's Class P shares returned 10.70% before the deduction of the maximum PACE Select program fee. (Class P shares returned 8.51% after the deduction of the maximum PACE Select program fee for the same 12-month period.) In comparison, the BofA Merrill Lynch Global High Yield Index (hedged in USD) (the "benchmark") returned 10.73%, and the Lipper High Current Yield Funds category posted a median return of 8.88%. (Returns for all share classes over various time periods are shown in the "Performance at a glance" table on page 88. Please note that the returns shown do not reflect the deduction of taxes that a shareholder would pay on Portfolio distributions or the redemption of Portfolio shares.) For a detailed commentary on the market environment in general during the reporting period, please refer to page 2.
Sub-Advisor's comments1
(Please note that while the Sub-Advisor outperformed the benchmark on a gross of fees basis, the Portfolio slightly underperformed net of fees, as reported under "Performance." As stated in footnote one, the comments that follow address performance on a gross of fees basis).
The Portfolio outperformed its benchmark during the reporting period. The primary driver of performance was the Portfolio's beta positioning, which was close to that of the market. (Beta is a measure of volatility or risk relative to the market as a whole.)
In terms of sectors, our exposure to insurance was helpful during the reporting period. In particular, our position in American International Group, one of the largest issuers in the high yield market, contributed to performance. Within the auto sector, the Portfolio's exposure to General Motors was beneficial for results. Finally, emerging markets holding Petroleos de Venezuela performed well, as did the sovereign debt of Portugal.
In contrast, Mexican homebuilders, including Urbi and Desarrolladora Homex, suffered from an unexpected move by the government to modify housing subsidies. This action led to an increase in working capital needs and decrease in funding from local banks. We sold out of our positions in both Urbi and Desarrolladora Homex based on this news, as we believed that the risk-reward profile no longer favored holding either company. OGX, a
PACE Select Advisors Trust – PACE High Yield Investments
Investment Sub-Advisor:
MacKay Shields LLC ("MacKay Shields")
Portfolio Managers:
Dan Roberts, Taylor Wagenseil, Michael Kimble and Lou Cohen
Objective:
Total return
Investment process:
MacKay Shields attempts to deliver attractive risk-adjusted returns by avoiding most of the unusually large losses in the high yield market, even if it means giving up much of the large potential gains. MacKay Shields believes that there is a very small subset of bonds that delivers outsized gains in the market. Due to the limited upside inherent in most bonds, over time, outsized gains are expected to be smaller than unusually large losses. By attempting to limit the Portfolio's participation in the extremes of the market, MacKay Shields strives to add value over a market cycle with lower volatility. MacKay Shields seeks to do this through a rigorous process that attempts to screen out what it believes to be the riskiest issuers in the market.
1 All Sub-Advisors discuss performance on a gross of fees basis—meaning that no fees or expenses are reflected in their sleeves'/sleeve's performance. Alternately, Portfolio performance is shown net of fees, which does factor in fees and expenses associated with the Portfolio.
85
PACE Select Advisors Trust
PACE High Yield Investments
Sub-Advisor's comments – concluded
Brazilian oil company, faced difficulties in raising production to previously estimated levels. Aluminum manufacturer, Aleris also performed poorly during the reporting period.
The Portfolio is underweight emerging markets. We also remain underweight European credits, as we do not believe that spreads offer attractive compensation relative to other alternatives, such as US industrials. However, we do own select European financials that we view more favorably, given attractive relative valuations, coupled with increased regulatory controls and capital requirements that are being put in place.
Our use of Treasury futures, which were employed to reduce the duration of the Portfolio, had a negligible impact on performance during the reporting period. Currency forwards were used during the reporting period to hedge the currency exposure of the Portfolio into US dollars.
Special considerations
The Portfolio may be appropriate for long-term investors seeking total return and who are able to withstand short-term fluctuations in the fixed income markets in return for potentially higher returns over the long term. The Portfolio seeks to achieve its objective by investing primarily in a professionally managed, diversified portfolio of fixed income securities rated below investment grade or considered to be of comparable quality (commonly referred to as "junk bonds"). These securities are subject to higher risks than investment grade securities, including greater price volatility and a greater risk of loss of principal and nonpayment of interest. Issuers of such securities are typically in poor financial health, and their ability to pay interest and principal is uncertain. The prices of such securities may be more vulnerable to bad economic news, or even the expectation of bad news, than higher rated or investment grade bonds and other fixed income securities. The value of the Portfolio changes every day and can be affected by changes in interest rates, general market conditions and other political, social and economic developments, as well as specific matters relating to the issuers in which the Portfolio invests. In addition, investments in foreign bonds involve special risks. It is important to note that an investment in the Portfolio is only one component of a balanced investment plan.
86
PACE Select Advisors Trust
PACE High Yield Investments
Illustration of an assumed investment of $10,000 in Class P shares of the Portfolio (unaudited)
The following graph depicts the performance of PACE High Yield Investments Class P shares versus the BofA Merrill Lynch Global High Yield Index (hedged in USD) from April 30, 2006, which is the month-end after the inception date of the Class P shares, through July 31, 2013. The performance of the other classes will vary based upon the different class specific expenses and sales charges. The performance provided does not reflect the deduction of taxes that a shareholder would pay on Portfolio distributions or the redemption of Portfolio shares. Past performance is no guarantee of future results. Share price and returns will vary with market conditions; investors may realize a gain or loss upon redemption. It is important to note that PACE High Yield Investments is a professionally managed portfolio while the Index is not available for investment and is unmanaged. The comparison is shown for illustration purposes only.
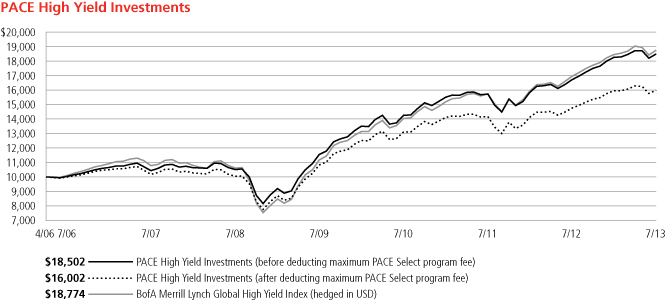
87
PACE Select Advisors Trust
PACE High Yield Investments
Performance at a glance (unaudited)
Average annual total returns for periods ended 07/31/13 | | 1 year | | 5 years | | Since inception1 | |
Before deducting maximum sales charge or PACE Select program fee | |
Class A2 | | | 10.48 | % | | | 11.70 | % | | | 8.58 | % | |
Class C3 | | | 9.98 | % | | | N/A | | | | 15.99 | % | |
Class Y4 | | | 10.74 | % | | | N/A | | | | 18.94 | % | |
Class P5 | | | 10.70 | % | | | 11.98 | % | | | 8.82 | % | |
After deducting maximum sales charge or PACE Select program fee | |
Class A2 | | | 5.49 | % | | | 10.67 | % | | | 7.89 | % | |
Class C3 | | | 9.23 | % | | | N/A | | | | 15.99 | % | |
Class P5 | | | 8.51 | % | | | 9.76 | % | | | 6.66 | % | |
BofA Merrill Lynch Global High Yield Index (hedged in USD)6 | | | 10.73 | % | | | 12.09 | % | | | 9.08 | % | |
Lipper High Current Yield Funds median | | | 8.88 | % | | | 9.45 | % | | | 7.22 | % | |
Average annual total returns for periods ended June 30, 2013, after deduction of the maximum sales charge or PACE Select program fee, were as follows: Class A—1-year period, 5.94%; 5-year period, 10.09%; since inception, 7.76%; Class C—1-year period, 9.66%; since inception, 15.93%; Class Y—1 year period, 11.17%; since inception, 18.92%; Class P—1-year period, 8.93%; 5-year period, 9.14%; since inception, 6.54%.
The annualized gross and net expense ratios, respectively, for each class of shares as in the November 28, 2012 prospectuses, were as follows: Class A—1.32% and 1.28% Class C—1.77% and 1.77% Class Y—1.03% and 1.03% Class P—1.15% and 1.03%. Net expenses reflect fee waivers and/or expense reimbursements, if any, pursuant to an agreement that is in effect to cap the expenses. The Portfolio and UBS Global Asset Management (Americas) Inc. ("UBS Global AM") have entered into a written fee waiver/expense reimbursement agreement pursuant to which UBS Global AM is contractually obligated to waive its management fees and/or reimburse expenses so that the Portfolio's ordinary total operating expenses of each class through November 30, 2013 (excluding dividend expense, borrowing costs, and interest expense relating to short sales, and expenses attributable to investment in other investment companies, interest, taxes, brokerage commissions and extraordinary expenses) would not exceed Class A—1.28%; Class C—1.78%; Class Y—1.03%; and Class P—1.03%. The Portfolio has agreed to repay UBS Global AM for any waived fees/reimbursed expenses to the extent that it can do so over the following three fiscal years without causing the Portfolio's expenses in any of those three years to exceed these expense caps. The fee waiver/expense reimbursement agreement may be terminated by the Portfolio's board at any time and also will terminate automatically upon the expiration or termination of the Portfolio's advisory contract with UBS Global AM. Upon termination of the agreement, however, UBS Global AM's three year recoupment rights will survive.
1 Since inception returns are calculated as of commencement of issuance on April 10, 2006 for Class P shares, May 1, 2006 for Class A shares and January 21, 2009 for Class C shares. Class Y shares commenced issuance on April 3, 2006 and had fully redeemed by July 24, 2006 remaining inactive through December 25, 2008. The inception return of Class Y shares is calculated from December 26, 2008, which is the date the Class Y shares recommenced investment operations. Since inception returns for the Index and Lipper median are shown as of April 30, 2006, which is the month-end after the inception date of the oldest share class (Class P).
2 Maximum sales charge for Class A shares is 4.5%. Class A shares bear ongoing 12b-1 service fees.
3 Maximum contingent deferred sales charge for Class C shares is 0.75% imposed on redemptions and is reduced to 0% after one year. Class C shares bear ongoing 12b-1 service and distribution fees.
4 The Portfolio offers Class Y shares to a limited group of eligible investors, including certain qualifying retirement plans. Class Y shares do not bear initial or contingent deferred sales charges or ongoing 12b-1 service and distribution fees.
5 Class P shares do not bear initial or contingent deferred sales charges or ongoing 12b-1 service and distribution fees, but are subject to a maximum annual PACE Select program fee of 2% of the value of Class P shares. Prior to June 14, 2010, the maximum annual PACE Select program fee was 1.5% of the value of Class P shares; however, the current maximum annual PACE Select program fee of 2% is reflected in the performance returns throughout all periods in the average annual total returns presented for the Class P shares shown above.
6 The BofA Merrill Lynch Global High Yield Index (hedged in USD) is an unmanaged index which covers US dollar, Canadian dollar, sterling and euro-denominated fixed rate debt of corporate issuers domiciled in an investment grade rated country (i.e., BBB or higher foreign currency long-term debt rating). Individual bonds must be rated below investment grade (i.e., BB or lower based on a composite of Moody's and S&P) but not in default; and must have at least one year remaining term to maturity; a minimum face value outstanding of $100 million, C$50 million, 50 million pounds sterling or 50 million euros; and have available price quotations. New issues qualify for inclusion after they settle. Investors should note that indices do not reflect the deduction of fees and expenses.
If an investor sells or exchanges shares less than 90 days after purchase, a redemption fee of 1.00% of the amount sold or exchanged will be deducted at the time of the transaction, except as noted otherwise in the prospectuses.
Past performance does not predict future performance, and the performance information provided does not reflect the deduction of taxes that a shareholder would pay on Portfolio distributions or the redemption of Portfolio shares. The return and principal value of an investment will fluctuate, so that an investor's shares, when redeemed, may be worth more or less than their original cost. Performance results assume reinvestment of all dividends and capital gain distributions at net asset value on the ex-dividend dates. Current performance may be higher or lower than the performance data quoted. For month-end performance figures, please visit http://globalam-us.ubs.com/corpweb/performance.do.
Lipper peer group data calculated by Lipper Inc.; used with permission. The Lipper median is the return of the fund that places in the middle of a Lipper peer group.
88
PACE Select Advisors Trust
PACE High Yield Investments
Portfolio statistics (unaudited)
Characteristics | | 07/31/13 | |
Weighted average duration | | | 3.1 yrs. | | |
Weighted average maturity | | | 4.7 yrs. | | |
Average coupon | | | 7.15 | % | |
Net assets (mm) | | $ | 388.3 | | |
Number of holdings | | | 305 | | |
Portfolio composition1 | | 07/31/13 | |
Bonds and loan assignments | | | 95.4 | % | |
Common stocks and warrants | | | 1.6 | | |
Futures and forward foreign currency contracts | | | 0.5 | | |
Cash equivalents and other assets less liabilities | | | 2.5 | | |
Total | | | 100.0 | % | |
Quality diversification1 | | 07/31/13 | |
BB & higher | | | 44.2 | % | |
B | | | 33.6 | | |
CCC & lower | | | 11.6 | | |
Not rated | | | 7.6 | | |
Futures and forward foreign currency contracts | | | 0.5 | | |
Cash equivalents and other assets less liabilities | | | 2.5 | | |
Total | | | 100.0 | % | |
Asset allocation1 | | 07/31/13 | |
Corporate bonds | | | 90.8 | % | |
Loan assignments | | | 1.8 | | |
Non-US government obligation | | | 1.5 | | |
Common stocks and warrants | | | 1.6 | | |
Asset-backed securities | | | 1.0 | | |
Collateralized mortgage obligations | | | 0.3 | | |
Futures and forward foreign currency contracts | | | 0.5 | | |
Cash equivalents and other assets less liabilities | | | 2.5 | | |
Total | | | 100.0 | % | |
1 Weightings represent percentages of the Portfolio's net assets as of July 31, 2013. The Portfolio is actively managed and its composition will vary over time. Credit quality ratings shown are based on the ratings assigned to portfolio holdings by Standard & Poor's Ratings Group, an independent rating agency.
89
PACE Select Advisors Trust
PACE High Yield Investments
Portfolio of investments—July 31, 2013
| | | Face
amount1 | | Value | |
Corporate bonds—90.84% | |
Aerospace & defense—1.22% | |
Alliant Techsystems, Inc.
6.875%, due 09/15/20 | | | 1,650,000 | | | $ | 1,771,688 | | |
BE Aerospace, Inc.
6.875%, due 10/01/20 | | | 500,000 | | | | 543,750 | | |
Ducommun, Inc.
9.750%, due 07/15/18 | | | 635,000 | | | | 704,850 | | |
TransDigm, Inc.
7.750%, due 12/15/18 | | | 1,600,000 | | | | 1,706,000 | | |
| | | | 4,726,288 | | |
Agriculture—0.33% | |
Virgolino de Oliveira Finance Ltd.
11.750%, due 02/09/222 | | | 1,610,000 | | | | 1,271,900 | | |
Airlines—1.59% | |
American Airlines Pass
Through Trust 2001-01,
6.977%, due 05/23/21 | | | 274,364 | | | | 271,620 | | |
Continental Airlines Pass
Through Trust 2003-ERJ1,
Series RJ03
7.875%, due 07/02/18 | | | 674,167 | | | | 721,359 | | |
Continental Airlines Pass
Through Trust 2004-ERJ1,
Series RJ04
9.558%, due 09/01/19 | | | 640,493 | | | | 702,941 | | |
Continental Airlines Pass
Through Trust 2005-ERJ1,
Series ERJ1
9.798%, due 04/01/21 | | | 1,788,991 | | | | 1,999,197 | | |
Delta Air Lines Pass
Through Trust 2010-1,
Class B
6.375%, due 01/02/16 | | | 1,200,000 | | | | 1,236,000 | | |
United Air Lines Pass
Through Trust 2009-2A
9.750%, due 01/15/17 | | | 504,039 | | | | 575,865 | | |
US Airways Pass Through
Trust 2012-1, Class B
8.000%, due 10/01/19 | | | 599,567 | | | | 658,025 | | |
| | | | 6,165,007 | | |
Auto & truck—2.79% | |
Chrysler Group LLC/CG
Co-Issuer, Inc.
8.000%, due 06/15/19 | | | 200,000 | | | | 218,250 | | |
8.250%, due 06/15/21 | | | 2,150,000 | | | | 2,391,875 | | |
Ford Holdings, Inc.
9.300%, due 03/01/30 | | | 1,145,000 | | | | 1,585,459 | | |
9.375%, due 03/01/20 | | | 644,000 | | | | 800,409 | | |
Ford Motor Co.
6.625%, due 10/01/28 | | | 1,595,000 | | | | 1,787,679 | | |
8.875%, due 01/15/22 | | | 1,000,000 | | | | 1,252,966 | | |
9.215%, due 09/15/21 | | | 282,000 | | | | 357,342 | | |
Navistar International Corp.
8.250%, due 11/01/213 | | | 2,392,000 | | | | 2,445,820 | | |
| | | | 10,839,800 | | |
| | | Face
amount1 | | Value | |
Corporate bonds—(continued) | |
Automotive parts—0.99% | |
Commercial Vehicle Group, Inc.
7.875%, due 04/15/19 | | | 1,125,000 | | | $ | 1,125,000 | | |
Goodyear Tire & Rubber Co.
6.500%, due 03/01/21 | | | 400,000 | | | | 418,500 | | |
7.000%, due 05/15/223 | | | 1,710,000 | | | | 1,816,875 | | |
8.250%, due 08/15/203 | | | 420,000 | | | | 468,300 | | |
| | | | 3,828,675 | | |
Banking-non-US—7.46% | |
Banco Continental SAECA
8.875%, due 10/15/172 | | | 1,500,000 | | | | 1,642,500 | | |
Banco do Brasil SA
5.875%, due 01/19/232,3 | | | 1,900,000 | | | | 1,824,000 | | |
Barclays Bank PLC
10.000%, due 05/21/214 | | GBP | 1,350,000 | | | | 2,698,193 | | |
BBVA International Preferred SAU
5.919%, due 04/18/175,6 | | | 1,500,000 | | | | 1,365,000 | | |
Belfius Funding NV
1.206%, due 02/09/175 | | GBP | 2,350,000 | | | | 2,900,272 | | |
Canada Square Operations PLC
7.500%, due 12/31/495,6 | | GBP | 2,355,000 | | | | 3,546,719 | | |
Deutsche Postbank
Funding Trust IV
5.983%, due 12/31/494,5,6 | | EUR | 1,900,000 | | | | 2,464,473 | | |
HBOS Capital Funding LP
6.461%, due 11/30/185,6 | | GBP | 2,800,000 | | | | 4,089,121 | | |
HBOS PLC
5.125%, due 10/14/155,6 | | EUR | 1,250,000 | | | | 1,344,982 | | |
National Capital Trust I
5.620%, due 12/31/494,5,6 | | GBP | 1,500,000 | | | | 2,270,466 | | |
Royal Bank of Scotland PLC
9.500%, due 03/16/224,5 | | | 2,750,000 | | | | 3,042,875 | | |
UT2 Funding PLC
5.321%, due 06/30/167 | | EUR | 1,400,000 | | | | 1,774,022 | | |
| | | | 28,962,623 | | |
Banking-US—2.10% | |
ABN Amro Bank NV
4.310%, due 03/10/165,6 | | EUR | 2,905,000 | | | | 3,623,125 | | |
Dresdner Funding Trust I
8.151%, due 06/30/312 | | | 1,600,000 | | | | 1,596,000 | | |
Fifth Third Capital Trust IV
6.500%, due 04/15/375 | | | 1,600,000 | | | | 1,600,000 | | |
Wachovia Capital Trust III
5.570%, due 03/29/495,6 | | | 750,000 | | | | 733,125 | | |
Wells Fargo & Co., Series K
7.980%, due 03/29/495,6 | | | 525,000 | | | | 589,312 | | |
| | | | 8,141,562 | | |
Beverages—0.07% | |
Constellation Brands, Inc.
7.250%, due 05/15/17 | | | 225,000 | | | | 256,500 | | |
90
PACE Select Advisors Trust
PACE High Yield Investments
Portfolio of investments—July 31, 2013
| | | Face
amount1 | | Value | |
Corporate bonds—(continued) | |
Broadcast—0.77% | |
Clear Channel Communications, Inc.
5.500%, due 12/15/163 | | | 645,000 | | | $ | 516,000 | | |
6.875%, due 06/15/18 | | | 780,000 | | | | 608,400 | | |
Clear Channel Worldwide
Holdings, Inc.
7.625%, due 03/15/20 | | | 127,000 | | | | 132,715 | | |
7.625%, due 03/15/20 | | | 1,631,000 | | | | 1,720,705 | | |
| | | | 2,977,820 | | |
Building & construction—2.45% | |
Beazer Homes USA, Inc.
8.125%, due 06/15/16 | | | 1,630,000 | | | | 1,793,000 | | |
K. Hovnanian Enterprises, Inc.
6.500%, due 01/15/14 | | | 580,000 | | | | 588,700 | | |
7.250%, due 10/15/202 | | | 1,240,000 | | | | 1,336,100 | | |
KB Home
7.500%, due 09/15/223 | | | 1,485,000 | | | | 1,592,662 | | |
Pulte Group, Inc.
6.375%, due 05/15/33 | | | 567,000 | | | | 523,058 | | |
7.875%, due 06/15/32 | | | 870,000 | | | | 948,300 | | |
Shea Homes LP/Shea Homes
Funding Corp.
8.625%, due 05/15/19 | | | 1,045,000 | | | | 1,149,500 | | |
Standard Pacific Corp.
8.375%, due 05/15/18 | | | 1,365,000 | | | | 1,579,987 | | |
| | | | 9,511,307 | | |
Building materials—0.65% | |
Cemex Espana Luxembourg
9.250%, due 05/12/202 | | | 1,200,000 | | | | 1,315,140 | | |
Interface, Inc.
7.625%, due 12/01/18 | | | 1,130,000 | | | | 1,209,100 | | |
| | | | 2,524,240 | | |
Building products—0.90% | |
Associated Materials LLC
9.125%, due 11/01/173 | | | 1,110,000 | | | | 1,197,412 | | |
USG Corp.
6.300%, due 11/15/16 | | | 1,235,000 | | | | 1,278,225 | | |
8.375%, due 10/15/182 | | | 210,000 | | | | 229,425 | | |
9.750%, due 01/15/187 | | | 690,000 | | | | 797,813 | | |
| | | | 3,502,875 | | |
Building products-cement—0.75% | |
Hanson Ltd.
6.125%, due 08/15/16 | | | 600,000 | | | | 654,000 | | |
HeidelbergCement Finance BV
7.500%, due 04/03/20 | | EUR | 395,000 | | | | 634,001 | | |
Texas Industries, Inc.
9.250%, due 08/15/20 | | | 1,505,000 | | | | 1,638,569 | | |
| | | | 2,926,570 | | |
Cable—0.74% | |
CCO Holdings LLC/CCO Holdings
Capital Corp.
5.750%, due 01/15/24 | | | 1,250,000 | | | | 1,168,750 | | |
| | | Face
amount1 | | Value | |
Corporate bonds—(continued) | |
Cable—(concluded) | |
Dish DBS Corp.
6.750%, due 06/01/21 | | | 835,000 | | | $ | 885,100 | | |
7.125%, due 02/01/16 | | | 750,000 | | | | 821,250 | | |
| | | | 2,875,100 | | |
Car rental—1.34% | |
Avis Budget Car Rental LLC/
Avis Budget Finance, Inc.
2.775%, due 05/15/145 | | | 120,000 | | | | 120,001 | | |
5.500%, due 04/01/232 | | | 170,000 | | | | 167,450 | | |
8.250%, due 01/15/19 | | | 1,425,000 | | | | 1,556,813 | | |
Hertz Corp.
5.875%, due 10/15/20 | | | 450,000 | | | | 474,750 | | |
6.250%, due 10/15/223 | | | 1,500,000 | | | | 1,590,000 | | |
6.750%, due 04/15/19 | | | 300,000 | | | | 323,250 | | |
7.375%, due 01/15/21 | | | 885,000 | | | | 973,500 | | |
| | | | 5,205,764 | | |
Chemicals—1.24% | |
Hexion US Finance Corp./Hexion
Nova Scotia Finance ULC
8.875%, due 02/01/18 | | | 2,780,000 | | | | 2,891,200 | | |
Huntsman International LLC
8.625%, due 03/15/203 | | | 1,115,000 | | | | 1,248,800 | | |
Momentive Performance
Materials, Inc.
10.000%, due 10/15/203 | | | 620,000 | | | | 663,400 | | |
| | | | 4,803,400 | | |
Coal—1.03% | |
Alpha Natural Resources, Inc.
6.000%, due 06/01/193 | | | 1,190,000 | | | | 1,020,425 | | |
6.250%, due 06/01/213 | | | 245,000 | | | | 204,575 | | |
Arch Coal, Inc.
7.000%, due 06/15/193 | | | 825,000 | | | | 674,438 | | |
7.250%, due 10/01/203 | | | 275,000 | | | | 222,750 | | |
7.250%, due 06/15/213 | | | 460,000 | | | | 371,450 | | |
Cloud Peak Energy Resources LLC/
Cloud Peak Energy Finance Corp.
8.250%, due 12/15/17 | | | 1,020,000 | | | | 1,076,100 | | |
8.500%, due 12/15/19 | | | 385,000 | | | | 415,800 | | |
| | | | 3,985,538 | | |
Commercial services—0.28% | |
Iron Mountain, Inc.
8.375%, due 08/15/21 | | | 1,000,000 | | | | 1,083,750 | | |
Computer software & services—1.01% | |
NCR Corp.
4.625%, due 02/15/21 | | | 1,870,000 | | | | 1,818,575 | | |
Sungard Data Systems, Inc.
6.625%, due 11/01/19 | | | 2,025,000 | | | | 2,100,938 | | |
| | | | 3,919,513 | | |
Consumer products—0.86% | |
Albea Beauty Holdings SA
8.375%, due 11/01/192,3 | | | 1,800,000 | | | | 1,831,500 | | |
91
PACE Select Advisors Trust
PACE High Yield Investments
Portfolio of investments—July 31, 2013
| | | Face
amount1 | | Value | |
Corporate bonds—(continued) | |
Consumer products—(concluded) | |
Jarden Corp.
7.500%, due 01/15/20 | | | 670,000 | | | $ | 719,412 | | |
7.500%, due 01/15/20 | | EUR | 550,000 | | | | 777,116 | | |
| | | | 3,328,028 | | |
Containers & packaging—2.00% | |
Ardagh Packaging Finance PLC/
Ardagh MP Holdings USA, Inc.
7.000%, due 11/15/202 | | | 1,645,000 | | | | 1,620,325 | | |
Beverage Packaging Holdings
Luxembourg II SA
8.000%, due 12/15/164 | | EUR | 205,000 | | | | 272,722 | | |
Owens-Brockway Glass
Container, Inc.
7.375%, due 05/15/16 | | | 750,000 | | | | 847,500 | | |
Packaging Dynamics Corp.
8.750%, due 02/01/162 | | | 1,445,000 | | | | 1,473,900 | | |
Rexam PLC
6.750%, due 06/29/674,5 | | EUR | 1,406,000 | | | | 1,954,643 | | |
Sealed Air Corp.
5.250%, due 04/01/232 | | | 425,000 | | | | 413,312 | | |
8.125%, due 09/15/192 | | | 1,075,000 | | | | 1,198,625 | | |
| | | | 7,781,027 | | |
Diversified capital goods—0.29% | |
Mueller Water Products, Inc.
7.375%, due 06/01/17 | | | 445,000 | | | | 456,681 | | �� |
8.750%, due 09/01/20 | | | 604,000 | | | | 662,135 | | |
| | | | 1,118,816 | | |
Diversified financial services—2.68% | |
Ally Financial, Inc.
8.000%, due 11/01/31 | | | 1,300,000 | | | | 1,566,925 | | |
Bank of America Corp.
8.000%, due 12/31/495,6 | | | 345,000 | | | | 382,087 | | |
First Data Corp.
8.875%, due 08/15/202 | | | 2,465,000 | | | | 2,699,175 | | |
10.625%, due 06/15/212 | | | 1,945,000 | | | | 1,974,175 | | |
GE Capital Trust III
6.500%, due 09/15/674,5 | | GBP | 1,750,000 | | | | 2,669,597 | | |
Mizuho Capital Investment
USD 2 Ltd.
14.950%, due 06/30/142,5,6 | | | 1,000,000 | | | | 1,105,000 | | |
| | | | 10,396,959 | | |
Diversified manufacturing—0.60% | |
Bombardier, Inc.
7.500%, due 03/15/182 | | | 270,000 | | | | 305,100 | | |
7.750%, due 03/15/202 | | | 1,770,000 | | | | 2,022,225 | | |
| | | | 2,327,325 | | |
Diversified operations—0.61% | |
Icahn Enterprises LP
8.000%, due 01/15/18 | | | 1,825,000 | | | | 1,927,656 | | |
| | | Face
amount1 | | Value | |
Corporate bonds—(continued) | |
Diversified operations—(concluded) | |
Tomkins LLC/Tomkins, Inc.
9.000%, due 10/01/18 | | | 406,000 | | | $ | 442,540 | | |
| | | | 2,370,196 | | |
Electric utilities—1.10% | |
Energy Future Intermediate
Holding Co. LLC/EFIH
Finance, Inc.
10.000%, due 12/01/20 | | | 1,528,000 | | | | 1,654,060 | | |
NRG Energy, Inc.
7.625%, due 01/15/18 | | | 250,000 | | | | 278,750 | | |
8.250%, due 09/01/20 | | | 1,835,000 | | | | 2,036,850 | | |
8.500%, due 06/15/19 | | | 295,000 | | | | 318,600 | | |
| | | | 4,288,260 | | |
Electric-generation—0.53% | |
Calpine Corp.
7.250%, due 10/15/172 | | | 473,000 | | | | 494,285 | | |
7.875%, due 07/31/202 | | | 1,273,000 | | | | 1,381,205 | | |
Tenaska Alabama Partners LP
7.000%, due 06/30/212 | | | 181,568 | | | | 191,554 | | |
| | | | 2,067,044 | | |
Electric-integrated—0.15% | |
Texas Competitive Electric
Holdings Co. LLC/TCEH
Finance, Inc.
11.500%, due 10/01/202 | | | 800,000 | | | | 600,000 | | |
Electronics—0.91% | |
Freescale Semiconductor, Inc.
5.000%, due 05/15/212,3 | | | 1,875,000 | | | | 1,809,375 | | |
9.250%, due 04/15/182 | | | 1,180,000 | | | | 1,278,825 | | |
10.125%, due 03/15/182 | | | 421,000 | | | | 460,995 | | |
| | | | 3,549,195 | | |
Finance-captive automotive—1.40% | |
Ausdrill Finance Pty Ltd.
6.875%, due 11/01/192 | | | 1,925,000 | | | | 1,785,437 | | |
Ford Motor Credit Co. LLC
5.875%, due 08/02/21 | | | 750,000 | | | | 831,674 | | |
8.125%, due 01/15/20 | | | 480,000 | | | | 590,160 | | |
General Motors Financial Co., Inc.
3.250%, due 05/15/182 | | | 285,000 | | | | 278,588 | | |
Schaeffler Finance BV
4.750%, due 05/15/212 | | | 2,020,000 | | | | 1,959,400 | | |
| | | | 5,445,259 | | |
Finance-noncaptive consumer—0.44% | |
CIT Group, Inc.
5.000%, due 08/15/22 | | | 1,740,000 | | | | 1,724,775 | | |
Finance-other—1.64% | |
SLM Corp. MTN
8.000%, due 03/25/20 | | | 2,000,000 | | | | 2,230,000 | | |
8.450%, due 06/15/18 | | | 600,000 | | | | 690,072 | | |
92
PACE Select Advisors Trust
PACE High Yield Investments
Portfolio of investments—July 31, 2013
| | | Face
amount1 | | Value | |
Corporate bonds—(continued) | |
Finance-other—(concluded) | |
Springleaf Finance Corp.
6.000%, due 06/01/202,3 | | | 3,165,000 | | | $ | 2,919,713 | | |
Springleaf Finance Corp. MTN
6.500%, due 09/15/17 | | | 545,000 | | | | 545,000 | | |
| | | | 6,384,785 | | |
Financial services—1.92% | |
Ageas Hybrid Financing SA
5.125%, due 12/31/494,5,6 | | EUR | 2,125,000 | | | | 2,756,318 | | |
Cemex Finance LLC
9.375%, due 10/12/222 | | | 1,800,000 | | | | 2,025,000 | | |
HSBC Finance Capital Trust IX
5.911%, due 11/30/355 | | | 1,450,000 | | | | 1,479,000 | | |
Milacron LLC/Mcron Finance Corp.
7.750%, due 02/15/212 | | | 1,165,000 | | | | 1,188,300 | | |
| | | | 7,448,618 | | |
Food products—1.77% | |
ESAL GmbH
6.250%, due 02/05/232 | | | 245,000 | | | | 224,934 | | |
JBS USA LLC/JBS USA Finance, Inc.
8.250%, due 02/01/202 | | | 1,685,000 | | | | 1,775,103 | | |
Minerva Luxembourg SA
7.750%, due 01/31/232,3 | | | 2,100,000 | | | | 2,040,528 | | |
Smithfield Foods, Inc.
6.625%, due 08/15/22 | | | 1,030,000 | | | | 1,089,225 | | |
USJ Acucar e Alcool SA
9.875%, due 11/09/192,3 | | | 1,800,000 | | | | 1,746,000 | | |
| | | | 6,875,790 | | |
Food-wholesale—1.20% | |
Barry Callebaut Services N.V.
5.500%, due 06/15/232 | | | 2,100,000 | | | | 2,163,000 | | |
6.000%, due 07/13/17 | | EUR | 140,000 | | | | 208,517 | | |
Post Holdings, Inc.
7.375%, due 02/15/22 | | | 2,125,000 | | | | 2,279,062 | | |
| | | | 4,650,579 | | |
Gaming—4.19% | |
Caesars Entertainment
Operating Co., Inc.
9.000%, due 02/15/202 | | | 1,055,000 | | | | 986,425 | | |
12.750%, due 04/15/18 | | | 370,000 | | | | 230,325 | | |
Caesars Operating Escrow LLC/
Caesars Escrow Corp.
9.000%, due 02/15/202 | | | 5,385,000 | | | | 5,070,150 | | |
Isle of Capri Casinos, Inc.
7.750%, due 03/15/19 | | | 575,000 | | | | 601,594 | | |
8.875%, due 06/15/20 | | | 2,495,000 | | | | 2,619,750 | | |
MGM Resorts International
6.750%, due 10/01/203 | | | 2,683,000 | | | | 2,854,041 | | |
7.750%, due 03/15/22 | | | 740,000 | | | | 819,550 | | |
Mohegan Tribal Gaming Authority
10.500%, due 12/15/162,3 | | | 1,475,000 | | | | 1,475,000 | | |
11.500%, due 11/01/172 | | | 285,000 | | | | 320,981 | | |
| | | Face
amount1 | | Value | |
Corporate bonds—(continued) | |
Gaming—(concluded) | |
Wynn Las Vegas LLC/Wynn Las
Vegas Capital Corp.
7.750%, due 08/15/20 | | | 1,140,000 | | | $ | 1,282,500 | | |
| | | | 16,260,316 | | |
Health care providers & services—3.25% | |
Alere, Inc.
8.625%, due 10/01/18 | | | 2,000,000 | | | | 2,170,000 | | |
CHS/Community Health
Systems, Inc.
5.125%, due 08/15/18 | | | 1,805,000 | | | | 1,841,100 | | |
DaVita HealthCare Partners, Inc.
5.750%, due 08/15/22 | | | 1,685,000 | | | | 1,708,169 | | |
Fresenius Medical Care US
Finance, Inc.
6.875%, due 07/15/17 | | | 365,000 | | | | 403,325 | | |
HCA, Inc.
7.500%, due 02/15/22 | | | 2,750,000 | | | | 3,100,625 | | |
Kinetic Concepts, Inc./
KCI USA, Inc.
10.500%, due 11/01/18 | | | 1,520,000 | | | | 1,672,000 | | |
VPII Escrow Corp.
7.500%, due 07/15/212 | | | 1,595,000 | | | | 1,710,637 | | |
| | | | 12,605,856 | | |
Insurance—4.64% | |
American International Group, Inc.
4.875%, due 03/15/675 | | EUR | 1,400,000 | | | | 1,743,305 | | |
5.000%, due 04/26/23 | | GBP | 750,000 | | | | 1,242,331 | | |
Series A2
4.875%, due 03/15/675 | | EUR | 4,500,000 | | | | 5,603,481 | | |
Series A3
5.750%, due 03/15/675 | | GBP | 600,000 | | | | 860,724 | | |
Aviva PLC
6.875%, due 05/22/385 | | EUR | 1,200,000 | | | | 1,764,044 | | |
Hartford Life, Inc.
7.650%, due 06/15/27 | | | 885,000 | | | | 1,087,941 | | |
Liberty Mutual Group, Inc.
7.800%, due 03/15/372 | | | 2,000,000 | | | | 2,325,000 | | |
Lincoln National Corp.
7.000%, due 05/17/665 | | | 1,555,000 | | | | 1,601,650 | | |
Scottish Widows PLC
5.500%, due 06/16/234 | | GBP | 1,185,000 | | | | 1,784,206 | | |
| | | | 18,012,682 | | |
Machinery—1.20% | |
Boart Longyear
Management Pty Ltd.
7.000%, due 04/01/212 | | | 1,085,000 | | | | 981,925 | | |
Mcron Finance Sub LLC/
Mcron Finance Corp.
8.375%, due 05/15/192 | | | 1,150,000 | | | | 1,250,625 | | |
Sensata Technologies BV
4.875%, due 10/15/232 | | | 1,835,000 | | | | 1,770,775 | | |
93
PACE Select Advisors Trust
PACE High Yield Investments
Portfolio of investments—July 31, 2013
| | | Face
amount1 | | Value | |
Corporate bonds—(continued) | |
Machinery—(concluded) | |
Terex Corp.
6.000%, due 05/15/21 | | | 650,000 | | | $ | 666,250 | | |
| | | | 4,669,575 | | |
Machinery-agriculture & construction—0.18% | |
CNH America LLC
7.250%, due 01/15/16 | | | 625,000 | | | | 684,375 | | |
Manufacturing-diversified—1.03% | |
Amsted Industries, Inc.
8.125%, due 03/15/182 | | | 1,110,000 | | | | 1,179,375 | | |
Kloeckner Pentaplast
GmbH & Co. KG
11.625%, due 07/15/174 | | EUR | 1,050,000 | | | | 1,575,890 | | |
Polypore International, Inc.
7.500%, due 11/15/173 | | | 760,000 | | | | 801,800 | | |
SPX Corp.
6.875%, due 09/01/17 | | | 390,000 | | | | 433,875 | | |
| | | | 3,990,940 | | |
Media—0.82% | |
Clear Channel Communications, Inc.
9.000%, due 03/01/21 | | | 775,000 | | | | 763,375 | | |
EN Germany Holdings BV
10.750%, due 11/15/154 | | EUR | 816,000 | | | | 1,020,432 | | |
Lamar Media Corp.
5.875%, due 02/01/22 | | | 1,350,000 | | | | 1,390,500 | | |
| | | | 3,174,307 | | |
Metals—2.24% | |
Aleris International, Inc.
6.000%, due 06/01/208,9 | | | 13,347 | | | | 13,347 | | |
7.625%, due 02/15/18 | | | 1,415,000 | | | | 1,485,750 | | |
7.875%, due 11/01/20 | | | 350,000 | | | | 365,750 | | |
Novelis, Inc. | |
8.375%, due 12/15/17 | | | 2,500,000 | | | | 2,693,750 | | |
8.750%, due 12/15/20 | | | 200,000 | | | | 220,500 | | |
Vedanta Resources PLC
7.125%, due 05/31/232,3 | | | 2,200,000 | | | | 2,150,500 | | |
8.250%, due 06/07/212,3 | | | 1,700,000 | | | | 1,780,750 | | |
| | | | 8,710,347 | | |
Metals & mining—1.43% | |
ArcelorMittal
7.250%, due 03/01/417 | | | 750,000 | | | | 694,688 | | |
7.500%, due 10/15/397 | | | 2,790,000 | | | | 2,629,575 | | |
FMG Resources August 2006 Pty Ltd.
6.875%, due 02/01/182,3 | | | 525,000 | | | | 535,500 | | |
7.000%, due 11/01/152,3 | | | 795,000 | | | | 812,887 | | |
Glencore Finance Europe SA
6.500%, due 02/27/19 | | GBP | 500,000 | | | | 864,122 | | |
| | | | 5,536,772 | | |
Oil & gas—9.19% | |
AmeriGas Partners LP/AmeriGas
Finance Corp.
6.500%, due 05/20/21 | | | 678,000 | | | | 705,120 | | |
| | | Face
amount1 | | Value | |
Corporate bonds—(continued) | |
Oil & gas—(concluded) | |
Berry Petroleum Co.
6.750%, due 11/01/20 | | | 1,120,000 | | | $ | 1,159,200 | | |
Chesapeake Energy Corp.
5.375%, due 06/15/213 | | | 1,000,000 | | | | 997,500 | | |
6.250%, due 01/15/17 | | EUR | 515,000 | | | | 726,238 | | |
6.625%, due 08/15/203 | | | 3,040,000 | | | | 3,298,400 | | |
Concho Resources, Inc.
5.500%, due 10/01/22 | | | 270,000 | | | | 271,688 | | |
5.500%, due 04/01/23 | | | 290,000 | | | | 289,275 | | |
6.500%, due 01/15/22 | | | 300,000 | | | | 321,000 | | |
7.000%, due 01/15/21 | | | 1,635,000 | | | | 1,798,500 | | |
Denbury Resources, Inc.
4.625%, due 07/15/23 | | | 1,500,000 | | | | 1,372,500 | | |
Energy Transfer Equity LP
7.500%, due 10/15/20 | | | 1,650,000 | | | | 1,858,313 | | |
EP Energy LLC/EP Energy
Finance, Inc.
9.375%, due 05/01/20 | | | 2,105,000 | | | | 2,389,175 | | |
Ferrellgas LP/Ferrellgas Finance Corp.
6.500%, due 05/01/21 | | | 430,000 | | | | 434,300 | | |
Forest Oil Corp.
7.250%, due 06/15/193 | | | 870,000 | | | | 859,125 | | |
Hilcorp Energy I LP/Hilcorp
Finance Co.
7.625%, due 04/15/212 | | | 525,000 | | | | 569,625 | | |
8.000%, due 02/15/202 | | | 355,000 | | | | 384,731 | | |
Linn Energy LLC/Linn Energy
Finance Corp.
6.500%, due 05/15/19 | | | 800,000 | | | | 778,000 | | |
7.750%, due 02/01/21 | | | 500,000 | | | | 505,000 | | |
8.625%, due 04/15/20 | | | 1,790,000 | | | | 1,861,600 | | |
MarkWest Energy Partners LP/
MarkWest Energy Finance Corp.
5.500%, due 02/15/23 | | | 645,000 | | | | 651,450 | | |
6.500%, due 08/15/21 | | | 601,000 | | | | 643,070 | | |
OGX Petroleo e Gas
Participacoes SA
8.500%, due 06/01/182,3 | | | 1,395,000 | | | | 279,000 | | |
Petroleos de Venezuela SA
12.750%, due 02/17/224 | | | 4,475,000 | | | | 4,463,812 | | |
Precision Drilling Corp.
6.500%, due 12/15/21 | | | 615,000 | | | | 648,825 | | |
6.625%, due 11/15/20 | | | 855,000 | | | | 897,750 | | |
Regency Energy Partners LP/
Regency Energy Finance Corp.
5.500%, due 04/15/23 | | | 1,230,000 | | | | 1,242,300 | | |
Samson Investment Co.
10.000%, due 02/15/202 | | | 1,835,000 | | | | 1,945,100 | | |
Swift Energy Co.
7.125%, due 06/01/17 | | | 500,000 | | | | 507,500 | | |
8.875%, due 01/15/20 | | | 1,520,000 | | | | 1,592,200 | | |
Targa Resources Partners LP/Targa
Resources Partners Finance Corp.
5.250%, due 05/01/232 | | | 1,465,000 | | | | 1,443,025 | | |
7.875%, due 10/15/18 | | | 730,000 | | | | 788,400 | | |
| | | | 35,681,722 | | |
94
PACE Select Advisors Trust
PACE High Yield Investments
Portfolio of investments—July 31, 2013
| | | Face
amount1 | | Value | |
Corporate bonds—(continued) | |
Oil services—1.32% | |
Basic Energy Services, Inc.
7.750%, due 02/15/19 | | | 420,000 | | | $ | 424,200 | | |
7.750%, due 10/15/22 | | | 1,475,000 | | | | 1,463,938 | | |
Cie Generale de
Geophysique-Veritas
6.500%, due 06/01/21 | | | 1,350,000 | | | | 1,383,750 | | |
Hornbeck Offshore Services, Inc.
5.000%, due 03/01/212 | | | 1,235,000 | | | | 1,185,600 | | |
5.875%, due 04/01/20 | | | 650,000 | | | | 661,375 | | |
| | | | 5,118,863 | | |
Packaging—1.34% | |
Reynolds Group Issuer
8.500%, due 05/15/18 | | | 1,765,000 | | | | 1,835,600 | | |
9.875%, due 08/15/19 | | | 3,115,000 | | | | 3,364,200 | | |
| | | | 5,199,800 | | |
Paper & forest products—0.86% | |
ACCO Brands Corp.
6.750%, due 04/30/203 | | | 570,000 | | | | 584,962 | | |
Boise Paper Holdings LLC/
Boise Co-Issuer Co.
8.000%, due 04/01/20 | | | 155,000 | | | | 166,625 | | |
Domtar Corp.
9.500%, due 08/01/16 | | | 250,000 | | | | 294,666 | | |
Norske Skogindustrier ASA
7.000%, due 06/26/174 | | EUR | 505,000 | | | | 391,339 | | |
7.125%, due 10/15/332 | | | 1,850,000 | | | | 952,750 | | |
Stora Enso Oyj
7.250%, due 04/15/362 | | | 1,000,000 | | | | 940,000 | | |
| | | | 3,330,342 | | |
Pipelines—0.82% | |
Atlas Pipeline Partners LP/Atlas
Pipeline Finance Corp.
4.750%, due 11/15/212 | | | 350,000 | | | | 321,125 | | |
5.875%, due 08/01/232 | | | 1,195,000 | | | | 1,141,225 | | |
Georgian Oil and Gas Corp.
6.875%, due 05/16/172 | | | 1,700,000 | | | | 1,734,000 | | |
| | | | 3,196,350 | | |
Rental auto/equipment—0.87% | |
United Rentals North America, Inc.
7.375%, due 05/15/20 | | | 275,000 | | | | 303,188 | | |
7.625%, due 04/15/22 | | | 270,000 | | | | 301,050 | | |
8.375%, due 09/15/203 | | | 2,525,000 | | | | 2,783,812 | | |
| | | | 3,388,050 | | |
Retail—0.16% | |
Suburban Propane Partners LP/
Suburban Energy Finance Corp.
7.375%, due 08/01/21 | | | 593,000 | | | | 637,475 | | |
Steel—1.63% | |
AK Steel Corp.
7.625%, due 05/15/203 | | | 1,350,000 | | | | 1,147,500 | | |
8.375%, due 04/01/223 | | | 400,000 | | | | 340,000 | | |
| | | Face
amount1 | | Value | |
Corporate bonds—(continued) | |
Steel—(concluded) | |
APERAM
7.375%, due 04/01/162 | | | 1,000,000 | | | $ | 962,500 | | |
Severstal OAO Via Steel Capital SA
5.900%, due 10/17/222,3 | | | 2,100,000 | | | | 1,942,500 | | |
US Steel Corp.
7.000%, due 02/01/183 | | | 1,170,000 | | | | 1,240,200 | | |
7.500%, due 03/15/223 | | | 700,000 | | | | 708,750 | | |
| | | | 6,341,450 | | |
Telecom-integrated/services—1.29% | |
Hughes Satellite Systems Corp.
7.625%, due 06/15/21 | | | 1,088,000 | | | | 1,177,760 | | |
Intelsat Luxembourg SA
7.750%, due 06/01/212 | | | 1,730,000 | | | | 1,820,825 | | |
8.125%, due 06/01/232 | | | 1,860,000 | | | | 1,999,500 | | |
| | | | 4,998,085 | | |
Telecommunication services—1.64% | |
Alcatel-Lucent USA, Inc.
6.450%, due 03/15/29 | | | 1,020,000 | | | | 805,800 | | |
Colombia Telecomunicaciones SA ESP
5.375%, due 09/27/222 | | | 1,800,000 | | | | 1,692,000 | | |
CommScope, Inc.
8.250%, due 01/15/192 | | | 2,135,000 | | | | 2,343,163 | | |
Satmex Escrow SA de C.V.
9.500%, due 05/15/17 | | | 1,400,000 | | | | 1,540,000 | | |
| | | | 6,380,963 | | |
Telephone-integrated—1.99% | |
Frontier Communications Corp.
7.000%, due 11/01/25 | | | 500,000 | | | | 470,000 | | |
7.125%, due 01/15/23 | | | 700,000 | | | | 693,000 | | |
Sprint Capital Corp.
6.900%, due 05/01/19 | | | 4,625,000 | | | | 4,890,937 | | |
8.750%, due 03/15/32 | | | 1,570,000 | | | | 1,656,350 | | |
| | | | 7,710,287 | | |
Transportation—1.30% | |
Stena AB
5.875%, due 02/01/194 | | EUR | 650,000 | | | | 895,425 | | |
6.125%, due 02/01/174 | | EUR | 1,500,000 | | | | 2,095,301 | | |
Ukraine Railways via Shortline PLC
9.500%, due 05/21/182 | | | 2,180,000 | | | | 2,043,750 | | |
| | | | 5,034,476 | | |
Transportation services—1.73% | |
CEVA Group PLC
8.375%, due 12/01/172 | | | 1,492,000 | | | | 1,499,460 | | |
CHC Helicopter SA
9.250%, due 10/15/20 | | | 2,495,000 | | | | 2,601,037 | | |
Hapag-Lloyd AG
9.750%, due 10/15/172,3 | | | 1,280,000 | | | | 1,344,000 | | |
PHI, Inc.
8.625%, due 10/15/18 | | | 1,000,000 | | | | 1,045,000 | | |
Teekay Corp.
8.500%, due 01/15/203 | | | 195,000 | | | | 212,063 | | |
| | | | 6,701,560 | | |
95
PACE Select Advisors Trust
PACE High Yield Investments
Portfolio of investments—July 31, 2013
| | | Face
amount1 | | Value | |
Corporate bonds—(concluded) | |
Wireless telecommunication services—1.93% | |
Crown Castle International Corp.
7.125%, due 11/01/193 | | | 1,000,000 | | | $ | 1,077,500 | | |
MetroPCS Wireless, Inc.
6.625%, due 11/15/20 | | | 490,000 | | | | 514,500 | | |
7.875%, due 09/01/18 | | | 500,000 | | | | 542,500 | | |
Sprint Nextel Corp.
6.000%, due 11/15/22 | | | 1,250,000 | | | | 1,203,125 | | |
8.375%, due 08/15/17 | | | 325,000 | | | | 367,250 | | |
9.125%, due 03/01/17 | | | 825,000 | | | | 950,812 | | |
ViaSat, Inc.
6.875%, due 06/15/20 | | | 1,984,000 | | | | 2,108,000 | | |
Windstream Corp.
6.375%, due 08/01/23 | | | 750,000 | | | | 712,500 | | |
| | | | 7,476,187 | | |
Total corporate bonds
(cost—$336,121,142) | | | | | 352,705,668 | | |
Loan assignments5—1.83% | |
Airlines—0.51% | |
US Airways Group, Inc.
Term Loan B1
4.250%, due 05/23/19 | | | 2,000,000 | | | | 1,998,920 | | |
Broadcast—0.27% | |
Clear Channel Communications, Inc.
Term Loan B
3.836%, due 01/29/16 | | | 283,487 | | | | 264,618 | | |
Clear Channel Communications, Inc.
Term Loan D
6.936%, due 01/30/19 | | | 836,165 | | | | 771,989 | | |
| | | | 1,036,607 | | |
Computer software & services—0.34% | |
Sungard Data Systems, Inc.
Term Loan E
4.000%, due 03/08/20 | | | 1,289,920 | | | | 1,302,819 | | |
Gaming—0.46% | |
Scientific Games International
Term Loan B
due 05/22/2010 | | | 1,800,000 | | | | 1,794,384 | | |
Support-services—0.25% | |
KAR Auction Services, Inc.
Term Loan B
3.750%, due 05/19/17 | | | 958,439 | | | | 965,387 | | |
Total loan assignments
(cost—$7,027,600) | | | | | 7,098,117 | | |
Non-US government obligation—1.54% | |
Sovereign—1.54% | |
Portugal Obrigacoes do Tesouro OT
4.950%, due 10/25/234
(cost—$5,187,863) | | EUR | 5,000,000 | | | | 5,983,248 | | |
| | | Face
amount1 | | Value | |
Asset-backed securities—1.03% | |
Citigroup Mortgage Loan Trust, Inc.,
Series 2007-AHL2, Class A3A
0.260%, due 05/25/375 | | | 405,156 | | | $ | 327,773 | | |
Home Equity Loan Trust,
Series 2007-FRE1,
Class 2AV1
0.320%, due 04/25/375 | | | 453,222 | | | | 419,859 | | |
HSI Asset Securitization Corp.
Trust, Series 2007-NC1,
Class A1
0.290%, due 04/25/375 | | | 603,925 | | | | 509,787 | | |
Merrill Lynch Mortgage Investors
Trust, Series 2007-MLN1,
Class A2A
0.300%, due 03/25/375 | | | 1,217,041 | | | | 807,240 | | |
Morgan Stanley Capital, Inc.,
Series 2006-HE6, Class A2B
0.290%, due 09/25/365 | | | 326,790 | | | | 213,541 | | |
Series 2006-HE8, Class A2B
0.290%, due 10/25/365 | | | 187,524 | | | | 97,847 | | |
Renaissance Home Equity Loan Trust,
Series 2007-2, Class AF1
5.893%, due 06/25/377 | | | 1,444,559 | | | | 816,124 | | |
Soundview Home Equity Loan Trust,
Series 2006-EQ2, Class A2
0.300%, due 01/25/375 | | | 915,714 | | | | 529,185 | | |
Series 2007-OPT1, Class 2A1
0.270%, due 06/25/375 | | | 353,042 | | | | 298,032 | | |
Total asset-backed securities
(cost—$5,957,052) | | | | | 4,019,388 | | |
Collateralized mortgage obligations—0.29% | |
Banc of America Mortgage Securities,
Series 2005-J, Class 1A1
3.000%, due 11/25/355 | | | 582,134 | | | | 489,138 | | |
GSAA Home Equity Trust,
Series 2006-14, Class A1
0.240%, due 09/25/365 | | | 739,149 | | | | 352,329 | | |
WaMu Mortgage Pass-Through
Certificates,
Series 2006-AR14, Class 1A1
2.377%, due 11/25/365 | | | 352,254 | | | | 288,522 | | |
Total collateralized
mortgage obligations
(cost—$1,673,537) | | | | | 1,129,989 | | |
| | | Shares | | | |
Common stocks—0.94% | |
Automobiles—0.61% | |
General Motors Co.* | | | 53,428 | | | | 1,916,462 | | |
Motors Liquidation Co. GUC Trust*,11 | | | 13,413 | | | | 437,935 | | |
| | | | 2,354,397 | | |
96
PACE Select Advisors Trust
PACE High Yield Investments
Portfolio of investments—July 31, 2013
| | | Shares | | Value | |
Common stocks—(concluded) | |
Construction materials—0.26% | |
US Concrete, Inc.*,8 | | | 59,953 | | | $ | 1,028,793 | | |
Metals—0.07% | |
Aleris International, Inc.*,8,9 | | | 15,446 | | | | 274,167 | | |
Total common stocks
(cost—$3,529,728) | | | | | 3,657,357 | | |
| | | Number of
warrants | | | |
Warrants*—0.60% | |
Automobiles—0.56% | |
General Motors Co.,
strike price $10.00,
expires 07/10/16 | | | 48,571 | | | | 1,276,446 | | |
General Motors Co.,
strike price $18.33,
expires 07/10/19 | | | 48,571 | | | | 904,878 | | |
| | | | 2,181,324 | | |
Cable—0.04% | |
Charter Communications, Inc.,
strike price $46.86,
expires 11/30/14 | | | 1,818 | | | | 150,330 | | |
Total warrants
(cost—$2,020,844) | | | | | 2,331,654 | | |
| | | Face
amount | | Value | |
Repurchase agreement—0.62% | |
Repurchase agreement dated
07/31/13 with State Street Bank and
Trust Co., 0.010% due 08/01/13,
collateralized by $105,274
Federal Home Loan Mortgage Corp.
obligations, 1.960% due 11/07/22,
$2,426,785 Federal National
Mortgage Association obligations,
2.140% to 2.170% due 11/07/22
and $79,799 US Treasury Notes,
0.250% to 0.750% due 10/31/13 to
12/15/13; (value—$2,456,188);
proceeds: $2,408,001
(cost—$2,408,000) | | $ | 2,408,000 | | | $ | 2,408,000 | | |
| | | Number of
shares | | | |
Investment of cash collateral from securities loaned—11.34% | |
Money market fund—11.34% | |
UBS Private Money Market Fund LLC12
(cost—$44,014,743) | | | 44,014,743 | | | | 44,014,743 | | |
Total investments
(cost—$407,940,509)—109.03% | | | | | 423,348,164 | | |
Liabilities in excess of
other assets—(9.03)% | | | | | (35,062,635 | ) | |
Net assets—100.00% | | | | $ | 388,285,529 | | |
For a listing of defined portfolio acronyms, counterparty acronyms and currency abbreviations that are used throughout the Portfolio of investments as well as the tables that follow, please refer to page 218.
Aggregate cost for federal income tax purposes was $407,940,509; and net unrealized appreciation consisted of:
Gross unrealized appreciation | | $ | 25,138,094 | | |
Gross unrealized depreciation | | | (9,730,439 | ) | |
Net unrealized appreciation | | $ | 15,407,655 | | |
Futures contracts
Number of
contracts | | Currency | | | | Expiration
date | | Proceeds | | Current
value | | Unrealized
appreciation | |
US Treasury futures sell contracts: | |
928 | | USD | | | | US Treasury Note 2 Year Futures | | September 2013 | | $ | 204,501,180 | | | $ | 204,450,000 | | | $ | 51,180 | | |
428 | | USD | | | | US Treasury Note 5 Year Futures | | September 2013 | | | 52,784,133 | | | | 51,945,156 | | | | 838,977 | | |
| | | | | | | | | $ | 257,285,313 | | | $ | 256,395,156 | | | $ | 890,157 | | |
97
PACE Select Advisors Trust
PACE High Yield Investments
Portfolio of investments—July 31, 2013
Forward foreign currency contracts
Counterparty | | Contracts to
deliver | | In
exchange for | | Maturity
date | | Unrealized
appreciation
(depreciation) | |
JPMCB | | EUR | 30,869,000 | | | USD | 41,392,705 | | | 09/19/13 | | $ | 319,431 | | |
JPMCB | | GBP | 14,812,000 | | | USD | 23,173,744 | | | 09/19/13 | | | 648,293 | | |
JPMCB | | USD | 1,400,017 | | | EUR | 1,065,000 | | | 09/19/13 | | | 17,037 | | |
JPMSI | | GBP | 220,000 | | | USD | 333,608 | | | 09/19/13 | | | (958 | ) | |
| | | | | | | | | $ | 983,803 | | |
Fair valuation summary
The following is a summary of the fair valuations according to the inputs used as of July 31, 2013 in valuing the Portfolio's investments:
| | Unadjusted
quoted prices in
active markets for
identical investments
(Level 1) | | Other significant
observable inputs
(Level 2) | | Unobservable
inputs
(Level 3) | | Total | |
Corporate bonds | | $ | — | | | $ | 352,692,321 | | | $ | 13,347 | | | $ | 352,705,668 | | |
Loan assignments | | | — | | | | 7,098,117 | | | | — | | | | 7,098,117 | | |
Non-US government obligation | | | — | | | | 5,983,248 | | | | — | | | | 5,983,248 | | |
Asset-backed securities | | | — | | | | 4,019,388 | | | | — | | | | 4,019,388 | | |
Collateralized mortgage obligations | | | — | | | | 1,129,989 | | | | — | | | | 1,129,989 | | |
Common stocks | | | 3,383,190 | | | | — | | | | 274,167 | | | | 3,657,357 | | |
Warrants | | | 2,181,324 | | | | 150,330 | | | | — | | | | 2,331,654 | | |
Repurchase agreement | | | — | | | | 2,408,000 | | | | — | | | | 2,408,000 | | |
Investment of cash collateral from securities loaned | | | — | | | | 44,014,743 | | | | — | | | | 44,014,743 | | |
Futures contracts, net | | | 890,157 | | | | — | | | | — | | | | 890,157 | | |
Forward foreign currency contracts, net | | | — | | | | 983,803 | | | | — | | | | 983,803 | | |
Total | | $ | 6,454,671 | | | $ | 418,479,939 | | | $ | 287,514 | | | $ | 425,222,124 | | |
At July 31, 2013, there was a transfer between Level 1 and Level 2 of $150,330 due to the valuation being based upon over-the-counter pricing rather than an unadjusted quoted price from a US exchange.
The following is a rollforward of the Portfolio's investments that were valued using unobservable inputs (Level 3) for the year ended July 31, 2013:
| | Corporate
bonds | | Common
stocks | | Total | |
Beginning balance | | $ | 13,357 | | | $ | 641,936 | | | $ | 655,293 | | |
Purchases | | | — | | | | — | | | | — | | |
Sales | | | (0 | ) | | | — | | | | (0 | ) | |
Accrued discounts/(premiums) | | | (92 | ) | | | — | | | | (92 | ) | |
Total realized gain/(loss) | | | (0 | ) | | | — | | | | (0 | ) | |
Net change in unrealized appreciation/depreciation | | | 82 | | | | (367,769 | ) | | | (367,687 | ) | |
Transfers into Level 3 | | | — | | | | — | | | | — | | |
Transfers out of Level 3 | | | — | | | | — | | | | — | | |
Ending balance | | $ | 13,347 | | | $ | 274,167 | | | $ | 287,514 | | |
The change in net unrealized appreciation/depreciation relating to the Level 3 investments held at July 31, 2013 was $(367,677).
98
PACE Select Advisors Trust
PACE High Yield Investments
Portfolio of investments—July 31, 2013
Issuer breakdown by country or territory of origin (unaudited)
| | | Percentage of
total investments | |
United States | | | 72.8 | % | |
United Kingdom | | | 5.7 | | |
Luxembourg | | | 5.3 | | |
Netherlands | | | 2.7 | | |
Canada | | | 2.0 | | |
Portugal | | | 1.4 | | |
Venezuela | | | 1.0 | | |
Australia | | | 1.0 | | |
Jersey | | | 1.0 | | |
Brazil | | | 0.8 | | |
Ireland | | | 0.8 | | |
Sweden | | | 0.7 | | |
Germany | | | 0.7 | | |
Spain | | | 0.6 | | |
Belgium | | | 0.6 | | |
Georgia | | | 0.4 | | |
Colombia | | | 0.4 | | |
Paraguay | | | 0.4 | | |
Mexico | | | 0.4 | | |
France | | | 0.3 | | |
Norway | | | 0.3 | | |
Cayman Islands | | | 0.3 | | |
Finland | | | 0.2 | | |
Austria | | | 0.1 | | |
Marshall Islands | | | 0.1 | | |
Total | | | 100.0 | % | |
Portfolio footnotes
* Non-income producing security.
1 In US Dollars unless otherwise indicated.
2 Security exempt from registration pursuant to Rule 144A under the Securities Act of 1933. These securities, which represent 25.04% of net assets as of July 31, 2013, are considered liquid and may be resold in transactions exempt from registration, normally to qualified institutional buyers.
3 Security, or portion thereof, was on loan at July 31, 2013.
4 Security exempt from registration pursuant to Regulation S under the Securities Act of 1933. Regulation S applies to securities offerings that are made outside of the United States and do not involve direct selling efforts in the United States. At July 31, 2013, the value of these securities amounted to 7.82% of net assets.
5 Variable or floating rate security. The interest rate shown is the current rate as of July 31, 2013 and changes periodically.
6 Perpetual bond security. The maturity date reflects the next call date.
7 Step bond that converts to the noted fixed rate at a designated future date.
8 Illiquid investments representing 0.34% of net assets as of July 31, 2013.
9 Security is being fair valued by a valuation committee under the direction of the board of trustees.
10 Position is unsettled and therefore the coupon rate is not known at this time and will take effect upon settlement date.
11 Security exchanged on 04/21/11; position represents remaining escrow balance expected to be received upon finalization of debt restructuring.
12 The table below details the Portfolio's transaction activity in an affiliated issuer during the year ended July 31, 2013. The investment manager earns a management fee from UBS Private Money Market Fund LLC. Please see the Notes to financial statements for further information.
Security description | | Value at
07/31/12 | | Purchases
during the
year ended
07/31/13 | | Sales
during the
year ended
07/31/13 | | Value at
07/31/13 | | Net income
earned from
affiliate for the
year ended
07/31/13 | |
UBS Private Money Market Fund LLC | | $ | 54,823,665 | | | $ | 190,468,773 | | | $ | 201,277,695 | | | $ | 44,014,743 | | | $ | 17,945 | | |
See accompanying notes to financial statements.
99
PACE Select Advisors Trust
PACE Large Co Value Equity Investments
Performance
For the 12 months ended July 31, 2013, the Portfolio's Class P shares returned 32.47% before the deduction of the maximum PACE Select program fee. (Class P shares returned 29.84% after the deduction of the maximum PACE Select program fee for the same 12-month period.) In comparison, the Russell 1000 Value Index (the "benchmark") returned 30.73%, and the Lipper Large-Cap Value Funds category posted a median return of 29.87%. Returns for all share classes over various time periods are shown in the "Performance at a glance" table on page 105. Please note that the returns shown do not reflect the deduction of taxes that a shareholder would pay on Portfolio distributions or the redemption of Portfolio shares.) For a detailed commentary on the market environment in general during the reporting period, please refer to page 2.
Sub-Advisors' comments1
Please note: On May 29, 2013, Robeco Investment Management, Inc. began serving as a third Sub-advisor for this Fund, replacing Westwood Management Corp., which was terminated as a Sub-Advisor for the portfolio effective May 28, 2013.
ICAP
Our portion of the Portfolio performed in line with the benchmark during the reporting period. Overall, the portfolio is built on a stock-by-stock basis and reflects the individual names that we believe have a combination of attractive valuations and catalysts likely to trigger appreciation over a 12- to 18-month timeframe. In a period characterized by strong, positive returns and lower volatility than in recent prior periods, performance for the reporting period was primarily driven by several key factors.
Stock selection in the consumer services sector added to performance, as media companies Time Warner and Viacom both benefited from stronger ratings and increased revenue from affiliate fees. In the information technology sector, Texas Instruments outperformed due to improved operating margins and increased return of cash to shareholders. Other individual stocks that added value included diversified financial firm Citigroup and auto parts manufacturer Johnson Controls. We believe that Citigroup's efforts to restructure and become more efficient have begun to pay off, in terms of increased operating margins. Johnson Controls' initiatives to restructure its
1 All Sub-Advisors discuss performance on a gross of fees basis—meaning that no fees or expenses are reflected in their sleeves'/sleeve's performance. Alternately, Portfolio performance is shown net of fees, which does factor in fees and expenses associated with the Portfolio.
PACE Select Advisors Trust – PACE Large Co Value Equity Investments
Investment Sub-Advisors:
Institutional Capital LLC ("ICAP"), Westwood Management Corp. ("Westwood") until May 28, 2013, Pzena Investment Management, LLC ("Pzena"); Robeco Investment Management, Inc. ("Robeco") and Los Angeles Capital Management and Equity Research, Inc. ("Los Angeles Capital"), commenced after the close of the reporting period.
Portfolio Managers:
ICAP: Jerrold Senser, Thomas M. Cole and Thomas Wenzel;
Westwood: Mark R. Freeman, Jay K. Singhania, Lisa Dong, Todd L. Williams and Scott D. Lawson;
Pzena: Antonio DeSpirito, III, Richard S. Pzena, John P. Goetz and Benjamin Silver
Robeco: Mark Donovan and David Pyle
Objective:
Capital appreciation and dividend income
Investment process:
ICAP uses its proprietary valuation model to identify large capitalization companies that it believes offer the best relative values and seeks to avoid companies that exhibit excessive deterioration in earnings trends. ICAP looks for companies where there is a catalyst for positive change with potential to produce stock appreciation of 15% or more relative to the market over a 12- to 18-month period.
ICAP also uses internally and externally generated research to evaluate the financial condition and business prospects of every company it considers. ICAP monitors each stock purchased and sells the stock when
100
PACE Select Advisors Trust
PACE Large Co Value Equity Investments
Sub-Advisors' comments – continued
automotive and building efficiency businesses have also begun to deliver higher operating margins. In addition, the firm has benefited from the pickup in global car sales. Our underweight to utilities and property stocks also added value during the reporting period.
Stock selection in the basic industries sector detracted from performance, as mining company Barrick Gold and fertilizer maker Mosaic both lagged the benchmark. Barrick Gold's results were hindered by higher-than-expected costs associated with mine development and production. We sold out of our position in Barrick due to the risk that this would be ongoing. Mosaic's potential future profitability was impacted when a competitor announced its intent to lower prices on a fertilizer commodity in order to increase market share. We continue to hold our position in Mosaic as we believe that the stock's valuation, potential for significant share buyback and potential for better than anticipated realized prices make the stock attractive. Individual positions that detracted from performance included global wireless communications provider Vodafone, natural gas producer Encana and software giant Microsoft. While weakness in Vodafone's Southern European businesses weighed on results, the company continued to have strength in the US and emerging markets. We continued to find the stock attractively valued, with good potential to return cash to shareholders via the prospect of continued receipt of dividends from Verizon Wireless (Vodafone owns 45% of Verizon Wireless). Although Encana was hindered by continued low natural gas prices, we continued to hold the position in our portion of the Portfolio as we believed that the stock's valuation and catalysts were attractive. While Microsoft's Windows 7 continued to have strong adoption at enterprises, Windows 8 will take longer than expected for the marketplace to assess due to limited availability of hardware. As such, we sold the position from our portion of the Portfolio. Our underweight to the financials sector also detracted from performance.
Derivatives were not used during the reporting period.
Pzena
Our portion of the Portfolio significantly outperformed the benchmark during the reporting period. We benefited on both an absolute and relative basis from being positioned mainly in economically sensitive sectors. We also avoided sectors, such as utilities, that had been bid up to historically high valuations as investors sought safety and yield.
Investment process (concluded)
its target price is achieved, the catalyst becomes inoperative, or ICAP identifies another stock with greater opportunity for appreciation.
Westwood utilizes a value style of investing in which it chooses common stocks it believes are currently undervalued. Other key metrics it considers are return on equity, debt/equity ratio and, in the case of common equities, positive earnings surprises without a corresponding increase in Wall Street estimates.
Westwood has disciplines in place that serve as sell signals, such as a security reaching a pre-determined price target or a change to a company's fundamentals that negatively impacts the original investment thesis.
Pzena follows a disciplined investment process to implement its value philosophy, focusing exclusively on companies that are underperforming their historically demonstrated earnings power. Pzena applies intensive fundamental research to these companies in an effort to determine whether the problems that caused the earnings shortfall are temporary or permanent. The research process incorporates perspectives on valuation, earnings, management strategy, and downside protection.
Robeco invests primarily in a diversified portfolio of common stocks of issuers identified as having attractive value characteristics with strong fundamentals. Robeco establishes a sell discipline for each security in the portfolio based on its target price, and may also sell a security if business fundamentals weaken or if an expected catalyst fails to materialize. Robeco seeks to outperform the fund's benchmark in falling markets and to keep pace with the benchmark in rising markets, while protecting capital.
101
PACE Select Advisors Trust
PACE Large Co Value Equity Investments
Sub-Advisors' comments – continued
Results for our portion of the Portfolio were mainly driven by our positioning in the financial services, information technology and consumer discretionary sectors, with additional contributions from defense contractors and homebuilding supply companies. We had no exposure to basic material companies, which were weak during the reporting period. Hewlett-Packard, which was our largest holding during the reporting period, Citigroup and Delphi Automotive were the largest contributors to performance. In contrast, Apollo Group, a for-profit education company, significantly detracted from performance. Due to increasing uncertainties in the competitive environment, we sold out of our position in Apollo Group toward the end of the reporting period.
We believe that, despite its length, we are still early in the recovery phase of the value cycle, and value investors have good reason for optimism. Investor risk aversion and the fear of revisiting the difficult days of 2007-2008 led to a flight to safety, which has just started to unwind. As a result, we see a bifurcated equity market—safety and yield trading close to historic highs relative to the market, with financials, mature technology, integrated oils and other economically sensitive stocks trading at or near 40-year lows. Many of the companies that hit our research screens are on solid financial footing, generating significant amounts of free cash flow and are positioned to fare well, even in a low-growth environment. The valuation of many high-quality franchises are compelling across a range of sectors, most notably in financials, information technology and a broad array of other cyclical businesses, which make up the bulk of our holdings.
Derivatives were not used during the reporting period.
Robeco
Our portion of the Portfolio slightly outperformed the benchmark during the reporting period from our inception as a Sub-Advisor on May 29, 2013 through July 31, 2013, due to both stock selection and, to a lesser extent, sector allocation.
During the reporting period, we took advantage of a significant amount of opportunities in the strong-performing healthcare sector. Specifically, our large overweight positions in the healthcare service companies Cigna Corp. and Omnicare, Inc. produced high returns for the reporting period, as both companies beat earnings estimates during the second quarter of 2013. In addition, our out-of-benchmark holding in McKesson Corp. was beneficial for results.
Other areas of strength came from stock selection in the consumer services and communications sectors. Our overweight position in Liberty Media Corp. was the largest contributor to performance in the consumer services sector. Strong performance in the communications sector was led by our cable company holdings. Finally, our minimal exposure to real estate investment trusts (REITs) benefited the portfolio, on a relative basis, as the sector produced a negative absolute return during the reporting period.
The Technology sector was the worst performing sector. Specifically, Microsoft Corp. did not meet earnings expectations for the quarter, as its shift in strategy from a packaged software company to a devices and services company is causing greater than expected pressure on earnings per share in the near term. Despite the short term headwinds, we believe that the shift should be beneficial to the long term earnings potential of the company. We also believe that positively viewed changes to the company's corporate governance and management structure, as well as a recent dividend increase, could create momentum for the stock price going forward.
Derivatives were not used during the reporting period.
Westwood (Note: Westwood Management Corp. was terminated as a Sub-Advisor for the Portfolio effective at the close of business on May 28, 2013, and its portion of the Portfolio was transitioned to Robeco Investment
102
PACE Select Advisors Trust
PACE Large Co Value Equity Investments
Sub-Advisors' comments – concluded
Management, Inc. on May 29, 2013. The following commentary only covers the period of time during which Westwood sub-advised a portion of the Portfolio, from August 1, 2012 to May 28, 2013.
Our portion of the Portfolio underperformed the benchmark during the reporting period. Relative performance was hindered by security selection in the information technology ("IT") and healthcare sectors. However, our overweight in the more economically-sensitive IT sector was beneficial for results. Intel was our weakest performer in the IT sector, due to concerns about slowing global personal computer sales. In its fourth quarter 2012 earnings release, Intel reported a large, unexpected increase in capital outlays in a year when revenue growth is slower and margins are falling. Aggressive spending combined with the possibility of overly optimistic forward guidance increased the risk in this company. We sold out of our position in Intel in May 2013. Our holdings in QUALCOMM and EMC also detracted from results, as they both reported disappointing earnings that were below analyst expectations. Additionally, fears of a slowdown in the global handset market negatively impacted QUALCOMM, whereas EMC's shares declined due to concerns of a slowdown in online storage demand and VMware's lower-than-expected guidance. We continued to hold our position in EMC, as it was fairly out of favor with investors on overly pessimistic concerns for near term enterprise spending. QUALCOMM provides exposure to growth through its cell phone chip set business, as well as a steady royalty stream tied to the company's 3G and 4G patent portfolio. We continued to hold our position in QUALCOMM as it remains in great financial condition with zero debt, healthy cash levels on its balance sheet and strong return on capital trends. Other detractors include Vodafone, which saw its shares begin to fall as investors recognized its weakening competitive positioning and grew concerned about management's intent to invest in slower growing parts of the industry. Vodafone's European assets are struggling due to economic pressure and from a deteriorating competitive position in the region. Management is signaling its intent to direct further capital towards this less attractive market in the form of wire-line and/or cable acquisitions. We viewed the increased capital deployment as an added risk to cash flow, earnings and to the dividend stream. We sold out of our position in Vodafone in May 2013. Teva Pharmaceutical Industries reported results that did not provide the thesis-confirming results within their generic division we had hoped for and was sold.
Our performance relative to the benchmark was aided by an underweight in the utilities sector, as well as security selection in the energy and producer durables sectors. Top contributors included insurance holding American International Group and IT holding Cisco Systems. Both companies performed well due to better than expected results, as well as outlining attractive dividend policies. Additionally, financial services holding Wells Fargo was aided by an improving US housing market and, along with JPMorgan Chase and Bank of America, benefited from the increase in the 10-year Treasury yield and a steepening of the overall yield curve. These were positive developments for net interest margins in the sector. In addition, Bank of America benefited from an increase in mortgage banking activity and an improving capital level. Elsewhere, shares of consumer discretionary holding General Motors rallied due to continued strong North American operating results, as well as rising US auto sales.
Derivatives were not used during the reporting period.
(Please note: After the close of the fiscal reporting period, Los Angeles Capital was appointed to serve as an additional Sub-Advisor to the Portfolio).
Special considerations
The Portfolio may be appropriate for long-term investors seeking capital appreciation and dividend income and who are able to withstand short-term fluctuations in the equity markets in return for potentially higher returns over the long term. The value of the Portfolio changes every day and can be affected by changes in interest rates, general market conditions and other political, social and economic developments, as well as specific matters relating to the companies in whose securities the Portfolio invests. It is important to note that an investment in the Portfolio is only one component of a balanced investment plan.
103
PACE Select Advisors Trust
PACE Large Co Value Equity Investments
Illustration of an assumed investment of $10,000 in Class P shares of the Portfolio (unaudited)
The following graph depicts the performance of PACE Large Co Value Equity Investments Class P shares versus the Russell 1000 Value Index over the 10 years ended July 31, 2013. The performance of the other classes will vary based upon the different class specific expenses and sales charges. The performance provided does not reflect the deduction of taxes that a shareholder would pay on Portfolio distributions or the redemption of Portfolio shares. Past performance is no guarantee of future results. Share price and returns will vary with market conditions; investors may realize a gain or loss upon redemption. It is important to note that PACE Large Co Value Equity Investments is a professionally managed portfolio while the Index is not available for investment and is unmanaged. The comparison is shown for illustration purposes only.
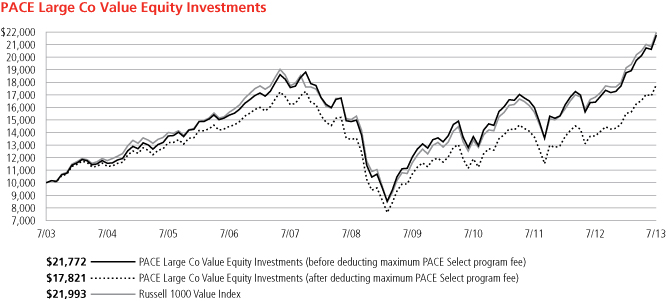
104
PACE Select Advisors Trust
PACE Large Co Value Equity Investments
Performance at a glance (unaudited)
Average annual total returns for periods ended 07/31/13 | | 1 year | | 5 years | | 10 years | |
Before deducting maximum sales charge or PACE Select program fee | |
Class A1 | | | 32.12 | % | | | 7.63 | % | | | 7.82 | % | |
Class C2 | | | 31.13 | % | | | 6.77 | % | | | 6.96 | % | |
Class Y3 | | | 32.46 | % | | | 7.93 | % | | | 8.16 | % | |
Class P4 | | | 32.47 | % | | | 7.90 | % | | | 8.09 | % | |
After deducting maximum sales charge or PACE Select program fee | |
Class A1 | | | 24.82 | % | | | 6.42 | % | | | 7.20 | % | |
Class C2 | | | 30.13 | % | | | 6.77 | % | | | 6.96 | % | |
Class P4 | | | 29.84 | % | | | 5.77 | % | | | 5.95 | % | |
Russell 1000 Value Index5 | | | 30.73 | % | | | 7.88 | % | | | 8.20 | % | |
Lipper Large-Cap Value Funds median | | | 29.87 | % | | | 7.30 | % | | | 7.38 | % | |
Average annual total returns for periods ended June 30, 2013, after deduction of the maximum sales charge or PACE Select program fee, were as follows: Class A—1-year period, 18.84%; 5-year period, 5.22%; 10-year period, 6.72%; Class C—1-year period, 23.66%; 5-year period, 5.55%; 10-year period, 6.47%; Class Y—1-year period, 25.97%; 5-year period, 6.72%; 10-year period, 7.66%; Class P—1-year period, 23.51%; 5-year period, 4.57%; 10-year period, 5.46%.
The annualized gross and net expense ratios, respectively, for each class of shares as in the November 28, 2012 prospectuses, were as follows: Class A—1.18% and 1.18%; Class C—1.98% and 1.98%; Class Y—0.94% and 0.94%; and Class P—0.93% and 0.93%. Net expenses reflect fee waivers and/or expense reimbursements, if any, pursuant to an agreement that is in effect to cap the expenses. The Portfolio and UBS Global Asset Management (Americas) Inc. ("UBS Global AM") have entered into a written fee waiver/expense reimbursement agreement pursuant to which UBS Global AM is contractually obligated to waive its management fees and/or reimburse expenses so that the Portfolio's ordinary total operating expenses of each class through November 30, 2013 (excluding dividend expense, borrowing costs, and interest expense relating to short sales, and expenses attributable to investment in other investment companies, interest, taxes, brokerage commissions and extraordinary expenses) would not exceed Class A—1.27%; Class C—2.02%; Class Y—1.02% and Class P—1.02%. The Portfolio has agreed to repay UBS Global AM for any waived fees/reimbursed expenses to the extent that it can do so over the following three fiscal years without causing the Portfolio's expenses in any of those three years to exceed these expense caps. The fee waiver/expense reimbursement agreement may be terminated by the Portfolio's board at any time and also will terminate automatically upon the expiration or termination of the Portfolio's advisory contract with UBS Global AM. Upon termination of the agreement, however, UBS Global AM's three year recoupment rights will survive.
1 Maximum sales charge for Class A shares is 5.5%. Class A shares bear ongoing 12b-1 service fees.
2 Maximum contingent deferred sales charge for Class C shares is 1% imposed on redemptions and is reduced to 0% after one year. Class C shares bear ongoing 12b-1 service and distribution fees. Prior to September 30, 2003, Class C shares were subject to a maximum front-end sales charge of 1%; this front-end sales charge is not reflected in the average annual total returns presented for the Class C shares shown above.
3 The Portfolio offers Class Y shares to a limited group of eligible investors, including certain qualifying retirement plans. Class Y shares do not bear initial or contingent deferred sales charges or ongoing 12b-1 service and distribution fees.
4 Class P shares do not bear initial or contingent deferred sales charges or ongoing 12b-1 service and distribution fees, but are subject to a maximum annual PACE Select program fee of 2% of the value of Class P shares. Prior to June 14, 2010, the maximum annual PACE Select program fee was 1.5% of the value of Class P shares; however, the current maximum annual PACE Select program fee of 2% is reflected in the performance returns throughout all periods in the average annual total returns presented for the Class P shares shown above.
5 The Russell 1000 Value Index measures the performance of the large-cap value segment of the US equity universe. It includes those Russell 1000 Index companies with lower price-to-book ratios and lower expected growth values. The Russell 1000 Value Index is constructed to provide a comprehensive and unbiased barometer for the large-cap value segment. The Index is completely reconstituted annually to ensure new and growing equities are included and that the represented companies continue to reflect value characteristics. Investors should note that indices do not reflect the deduction of fees and expenses.
If an investor sells or exchanges shares less than 90 days after purchase, a redemption fee of 1.00% of the amount sold or exchanged will be deducted at the time of the transaction, except as noted otherwise in the prospectuses.
Past performance does not predict future performance, and the performance information provided does not reflect the deduction of taxes that a shareholder would pay on Portfolio distributions or the redemption of Portfolio shares. The return and principal value of an investment will fluctuate, so that an investor's shares, when redeemed, may be worth more or less than their original cost. Performance results assume reinvestment of all dividends and capital gain distributions at net asset value on the ex-dividend dates. Current performance may be higher or lower than the performance data quoted. For month-end performance figures, please visit http://globalam-us.ubs.com/corpweb/performance.do.
Lipper peer group data calculated by Lipper Inc.; used with permission. The Lipper median is the return of the fund that places in the middle of a Lipper peer group.
105
PACE Select Advisors Trust
PACE Large Co Value Equity Investments
Portfolio statistics (unaudited)
Characteristics | | 07/31/13 | |
Net assets (mm) | | $ | 1,319.6 | | |
Number of holdings | | | 122 | | |
Portfolio composition1 | | 07/31/13 | |
Common stocks | | | 92.4 | % | |
ADRs | | | 4.9 | | |
Cash equivalents and other assets less liabilities | | | 2.7 | | |
Total | | | 100.0 | % | |
Top five sectors1 | | 07/31/13 | |
Financials | | | 26.2 | % | |
Health care | | | 16.3 | | |
Consumer discretionary | | | 14.0 | | |
Energy | | | 13.0 | | |
Information technology | | | 12.2 | | |
Total | | | 81.7 | % | |
Top ten equity holdings1 | | 07/31/13 | |
Exxon Mobil Corp. | | | 3.7 | % | |
Pfizer, Inc. | | | 3.5 | | |
Citigroup, Inc. | | | 3.2 | | |
JPMorgan Chase & Co. | | | 3.1 | | |
Johnson & Johnson | | | 2.8 | | |
Time Warner, Inc. | | | 2.4 | | |
Capital One Financial Corp. | | | 2.2 | | |
General Electric Co. | | | 2.1 | | |
Cisco Systems, Inc. | | | 1.9 | | |
PNC Financial Services Group, Inc. | | | 1.8 | | |
Total | | | 26.7 | % | |
For a listing of defined portfolio acronyms that are used throughout the Portfolio statistics, please refer to page 218.
1 Weightings represent percentages of the Portfolio's net assets as of July 31, 2013. The Portfolio is actively managed and its composition will vary over time.
106
PACE Select Advisors Trust
PACE Large Co Value Equity Investments
Portfolio of investments—July 31, 2013
| | | Number of
shares | | Value | |
Common stocks—97.30% | |
Aerospace & defense—3.14% | |
Honeywell International, Inc. | | | 236,300 | | | $ | 19,608,174 | | |
Lockheed Martin Corp. | | | 25,464 | | | | 3,058,736 | | |
Northrop Grumman Corp. | | | 150,100 | | | | 13,818,206 | | |
Raytheon Co. | | | 68,900 | | | | 4,949,776 | | |
| | | | | | 41,434,892 | | |
Air freight & logistics—0.15% | |
United Parcel Service, Inc., Class B | | | 22,500 | | | | 1,953,000 | | |
Auto components—2.43% | |
Delphi Automotive PLC | | | 174,700 | | | | 9,384,884 | | |
Johnson Controls, Inc. | | | 418,050 | | | | 16,809,790 | | |
Lear Corp. | | | 84,800 | | | | 5,874,096 | | |
| | | | | | 32,068,770 | | |
Automobiles—0.90% | |
Ford Motor Co. | | | 702,350 | | | | 11,855,668 | | |
Biotechnology—0.51% | |
Amgen, Inc. | | | 62,200 | | | | 6,735,638 | | |
Building products—0.48% | |
Masco Corp. | | | 309,700 | | | | 6,355,044 | | |
Capital markets—4.02% | |
Franklin Resources, Inc. | | | 128,925 | | | | 6,301,854 | | |
Invesco Ltd. | | | 265,300 | | | | 8,540,007 | | |
Morgan Stanley | | | 307,300 | | | | 8,361,633 | | |
State Street Corp. | | | 183,585 | | | | 12,790,367 | | |
The Charles Schwab Corp. | | | 140,495 | | | | 3,103,535 | | |
The Goldman Sachs Group, Inc. | | | 84,650 | | | | 13,885,139 | | |
| | | | | | 52,982,535 | | |
Chemicals—1.32% | |
Monsanto Co. | | | 123,600 | | | | 12,209,208 | | |
The Mosaic Co. | | | 127,250 | | | | 5,228,703 | | |
| | | | | | 17,437,911 | | |
Commercial banks—5.11% | |
BB&T Corp. | | | 412,500 | | | | 14,722,125 | | |
Fifth Third Bancorp | | | 334,800 | | | | 6,438,204 | | |
PNC Financial Services Group, Inc. | | | 320,650 | | | | 24,385,432 | | |
SunTrust Banks, Inc. | | | 80,000 | | | | 2,783,200 | | |
Wells Fargo & Co. | | | 440,000 | | | | 19,140,000 | | |
| | | | | | 67,468,961 | | |
Commercial services & supplies—0.19% | |
Tyco International Ltd. | | | 72,200 | | | | 2,513,282 | | |
Communications equipment—2.35% | |
Brocade Communications Systems, Inc.* | | | 267,150 | | | | 1,779,219 | | |
Cisco Systems, Inc. | | | 998,100 | | | | 25,501,455 | | |
QUALCOMM, Inc. | | | 58,300 | | | | 3,763,265 | | |
| | | | | | 31,043,939 | | |
Computers & peripherals—2.54% | |
Dell, Inc. | | | 492,525 | | | | 6,240,292 | | |
Hewlett-Packard Co. | | | 791,125 | | | | 20,316,090 | | |
| | | Number of
shares | | Value | |
Common stocks—(continued) | |
Computers & peripherals—(concluded) | |
NetApp, Inc. | | | 102,407 | | | $ | 4,210,976 | | |
Seagate Technology PLC | | | 68,723 | | | | 2,811,458 | | |
| | | | | | 33,578,816 | | |
Consumer finance—2.51% | |
Capital One Financial Corp. | | | 412,500 | | | | 28,470,750 | | |
Discover Financial Services | | | 94,700 | | | | 4,688,597 | | |
| | | | | | 33,159,347 | | |
Containers & packaging—0.57% | |
Crown Holdings, Inc.* | | | 68,685 | | | | 3,010,464 | | |
Rock-Tenn Co., Class A | | | 39,800 | | | | 4,551,130 | | |
| | | | | | 7,561,594 | | |
Diversified financial services—8.29% | |
Bank of America Corp. | | | 1,327,100 | | | | 19,375,660 | | |
Citigroup, Inc. | | | 816,256 | | | | 42,559,588 | | |
ING US, Inc.* | | | 202,625 | | | | 6,305,690 | | |
JPMorgan Chase & Co. | | | 738,175 | | | | 41,138,493 | | |
| | | | | | 109,379,431 | | |
Electric utilities—1.69% | |
Entergy Corp. | | | 122,900 | | | | 8,295,750 | | |
Exelon Corp. | | | 374,150 | | | | 11,445,248 | | |
FirstEnergy Corp. | | | 66,357 | | | | 2,526,211 | | |
| | | | | | 22,267,209 | | |
Electronic equipment, instruments & components—0.93% | |
TE Connectivity Ltd. | | | 239,300 | | | | 12,213,872 | | |
Energy equipment & services—2.38% | |
Baker Hughes, Inc. | | | 222,600 | | | | 10,557,918 | | |
Halliburton Co. | | | 321,726 | | | | 14,538,798 | | |
Schlumberger Ltd. | | | 64,900 | | | | 5,278,317 | | |
Weatherford International Ltd.* | | | 70,911 | | | | 989,917 | | |
| | | | | | 31,364,950 | | |
Food & staples retailing—1.68% | |
CVS Caremark Corp. | | | 360,071 | | | | 22,140,766 | | |
Food products—0.24% | |
Tyson Foods, Inc., Class A | | | 116,118 | | | | 3,207,179 | | |
Health care equipment & supplies—3.44% | |
Baxter International, Inc. | | | 259,850 | | | | 18,979,444 | | |
Becton, Dickinson and Co. | | | 86,500 | | | | 8,971,780 | | |
Covidien PLC | | | 282,100 | | | | 17,385,823 | | |
| | | | | | 45,337,047 | | |
Health care providers & services—5.02% | |
Aetna, Inc. | | | 20,000 | | | | 1,283,400 | | |
AmerisourceBergen Corp. | | | 38,951 | | | | 2,269,675 | | |
Cigna Corp. | | | 138,050 | | | | 10,744,431 | | |
Express Scripts Holding Co.* | | | 98,600 | | | | 6,463,230 | | |
Humana, Inc. | | | 34,155 | | | | 3,116,985 | | |
Laboratory Corp. of America Holdings* | | | 61,725 | | | | 5,971,277 | | |
McKesson Corp. | | | 173,900 | | | | 21,330,574 | | |
107
PACE Select Advisors Trust
PACE Large Co Value Equity Investments
Portfolio of investments—July 31, 2013
| | | Number of
shares | | Value | |
Common stocks—(continued) | |
Health care providers & services—(concluded) | |
Omnicare, Inc. | | | 107,100 | | | $ | 5,653,809 | | |
UnitedHealth Group, Inc. | | | 128,300 | | | | 9,346,655 | | |
| | | | | | 66,180,036 | | |
Hotels, restaurants & leisure—1.15% | |
McDonald's Corp. | | | 155,350 | | | | 15,236,728 | | |
Independent power producers & energy traders—0.32% | |
AES Corp. | | | 337,000 | | | | 4,192,280 | | |
Industrial conglomerates—2.25% | |
General Electric Co. | | | 1,133,150 | | | | 27,614,865 | | |
Siemens AG, ADR1 | | | 18,667 | | | | 2,061,957 | | |
| | | | | | 29,676,822 | | |
Insurance—5.96% | |
ACE Ltd. | | | 68,005 | | | | 6,214,297 | | |
American International Group, Inc.* | | | 244,650 | | | | 11,134,022 | | |
Axis Capital Holdings Ltd. | | | 254,675 | | | | 11,093,643 | | |
Berkshire Hathaway, Inc., Class B* | | | 173,200 | | | | 20,068,684 | | |
Marsh & McLennan Cos., Inc. | | | 55,800 | | | | 2,336,346 | | |
MetLife, Inc. | | | 275,075 | | | | 13,319,131 | | |
Reinsurance Group of America, Inc. | | | 31,700 | | | | 2,158,453 | | |
The Travelers Cos., Inc. | | | 28,300 | | | | 2,364,465 | | |
Validus Holdings Ltd. | | | 73,030 | | | | 2,587,453 | | |
Willis Group Holdings PLC | | | 171,175 | | | | 7,326,290 | | |
| | | | | | 78,602,784 | | |
Internet software & services—1.20% | |
eBay, Inc.* | | | 44,068 | | | | 2,277,875 | | |
Google, Inc., Class A* | | | 8,025 | | | | 7,122,990 | | |
IAC/InterActiveCorp. | | | 128,200 | | | | 6,488,202 | | |
| | | | | | 15,889,067 | | |
Machinery—1.43% | |
AGCO Corp. | | | 69,200 | | | | 3,892,500 | | |
Dover Corp. | | | 55,200 | | | | 4,727,328 | | |
Parker Hannifin Corp. | | | 99,500 | | | | 10,276,360 | | |
| | | | | | 18,896,188 | | |
Media—7.86% | |
CBS Corp., Class B | | | 78,200 | | | | 4,132,088 | | |
Comcast Corp., Class A | | | 225,000 | | | | 10,143,000 | | |
Gannett Co., Inc. | | | 129,300 | | | | 3,330,768 | | |
Liberty Global PLC, Series C* | | | 62,830 | | | | 4,847,963 | | |
Liberty Media Corp., Class A* | | | 51,500 | | | | 7,402,095 | | |
News Corp., Class A* | | | 145,938 | | | | 2,324,792 | | |
Omnicom Group, Inc. | | | 263,133 | | | | 16,911,558 | | |
Time Warner Cable, Inc. | | | 32,900 | | | | 3,752,903 | | |
Time Warner, Inc. | | | 501,438 | | | | 31,219,530 | | |
Viacom, Inc., Class B | | | 269,900 | | | | 19,640,623 | | |
| | | | | | 103,705,320 | | |
Multiline retail—0.30% | |
Macy's, Inc. | | | 82,519 | | | | 3,988,968 | | |
| | | Number of
shares | | Value | |
Common stocks—(concluded) | |
Oil, gas & consumable fuels—10.60% | |
BP PLC, ADR | | | 354,960 | | | $ | 14,709,542 | | |
Encana Corp. | | | 357,350 | | | | 6,260,772 | | |
EOG Resources, Inc. | | | 29,629 | | | | 4,310,723 | | |
Exxon Mobil Corp. | | | 521,661 | | | | 48,905,719 | | |
Marathon Oil Corp. | | | 458,900 | | | | 16,685,604 | | |
Occidental Petroleum Corp. | | | 141,190 | | | | 12,572,970 | | |
Phillips 66 | | | 103,700 | | | | 6,377,550 | | |
Royal Dutch Shell PLC, ADR | | | 306,775 | | | | 20,968,071 | | |
Southwestern Energy Co.* | | | 232,850 | | | | 9,032,252 | | |
| | | | | | 139,823,203 | | |
Paper & forest products—0.25% | |
International Paper Co. | | | 66,900 | | | | 3,231,939 | | |
Pharmaceuticals—7.37% | |
Abbott Laboratories | | | 128,650 | | | | 4,712,450 | | |
AbbVie, Inc. | | | 66,100 | | | | 3,006,228 | | |
Johnson & Johnson | | | 391,950 | | | | 36,647,325 | | |
Pfizer, Inc. | | | 1,595,702 | | | | 46,642,369 | | |
Sanofi, ADR | | | 122,061 | | | | 6,283,700 | | |
| | | | | | 97,292,072 | | |
Real estate investment trusts—0.30% | |
Equity Residential | | | 70,900 | | | | 3,970,400 | | |
Road & rail—0.36% | |
Norfolk Southern Corp. | | | 65,014 | | | | 4,756,424 | | |
Semiconductors & semiconductor equipment—1.99% | |
LSI Corp.* | | | 239,302 | | | | 1,861,770 | | |
NVIDIA Corp. | | | 164,645 | | | | 2,375,827 | | |
ON Semiconductor Corp.* | | | 431,260 | | | | 3,553,582 | | |
Texas Instruments, Inc. | | | 471,850 | | | | 18,496,520 | | |
| | | | | | 26,287,699 | | |
Software—3.14% | |
Microsoft Corp. | | | 511,852 | | | | 16,292,249 | | |
Oracle Corp. | | | 361,425 | | | | 11,692,099 | | |
Symantec Corp. | | | 506,300 | | | | 13,508,084 | | |
| | | | | | 41,492,432 | | |
Specialty retail—1.34% | |
Bed, Bath & Beyond, Inc.* | | | 52,700 | | | | 4,029,969 | | |
Staples, Inc.1 | | | 798,175 | | | | 13,584,939 | | |
| | | | | | 17,614,908 | | |
Wireless telecommunication services—1.59% | |
Vodafone Group PLC, ADR | | | 699,750 | | | | 20,957,513 | | |
Total common stocks
(cost—$1,047,965,427) | | | | | 1,283,854,634 | | |
108
PACE Select Advisors Trust
PACE Large Co Value Equity Investments
Portfolio of investments—July 31, 2013
| | | Face
amount | | Value | |
Repurchase agreement—2.63% | |
Repurchase agreement dated
07/31/13 with State Street
Bank and Trust Co., 0.010%
due 08/01/13, collateralized by
$1,518,258 Federal Home
Loan Mortgage Corp. obligations,
1.960% due 11/07/22,
$34,998,917 Federal National
Mortgage Association obligations,
2.140% to 2.170% due 11/07/22
and $1,150,855 US Treasury Notes,
0.250% to 0.750% due
10/31/13 to 12/15/13;
(value—$35,422,957);
proceeds: $34,728,010
(cost—$34,728,000) | | $ | 34,728,000 | | | $ | 34,728,000 | | |
| | | Number of
shares | | Value | |
Investment of cash collateral from securities loaned—0.15% | |
Money market fund—0.15% | |
UBS Private Money Market Fund LLC2
(cost—$2,009,700) | | | 2,009,700 | | | $ | 2,009,700 | | |
Total investments
(cost—$1,084,703,127)—100.08% | | | | | 1,320,592,334 | | |
Liabilities in excess of
other assets—(0.08)% | | | | | (1,023,355 | ) | |
Net assets—100.00% | | | | $ | 1,319,568,979 | | |
For a listing of defined portfolio acronyms that are used throughout the Portfolio of investments as well as the tables that follow, please refer to page 218.
Aggregate cost for federal income tax purposes was $1,110,025,961; and net unrealized appreciation consisted of:
Gross unrealized appreciation | | $ | 246,538,133 | | |
Gross unrealized depreciation | | | (35,971,760 | ) | |
Net unrealized appreciation | | $ | 210,566,373 | | |
Fair valuation summary
The following is a summary of the fair valuations according to the inputs used as of July 31, 2013 in valuing the Portfolio's investments:
| | | Unadjusted
quoted prices in
active markets for
identical investments
(Level 1) | | Other significant
observable inputs
(Level 2) | | Unobservable
inputs
(Level 3) | | Total | |
Common stocks | | $ | 1,283,854,634 | | | $ | — | | | $ | — | | | $ | 1,283,854,634 | | |
Repurchase agreement | | | — | | | | 34,728,000 | | | | — | | | | 34,728,000 | | |
Investment of cash collateral from securities loaned | | | — | | | | 2,009,700 | | | | — | | | | 2,009,700 | | |
Total | | $ | 1,283,854,634 | | | $ | 36,737,700 | | | $ | — | | | $ | 1,320,592,334 | | |
At July 31, 2013, there were no transfers between Level 1 and Level 2.
109
PACE Select Advisors Trust
PACE Large Co Value Equity Investments
Portfolio of investments—July 31, 2013
Issuer breakdown by country or territory of origin (unaudited)
| | | Percentage of
total investments | |
United States | | | 87.7 | % | |
United Kingdom | | | 4.6 | | |
Ireland | | | 2.1 | | |
Bermuda | | | 1.7 | | |
Switzerland | | | 1.7 | | |
Jersey | | | 0.7 | | |
France | | | 0.5 | | |
Canada | | | 0.5 | | |
Curacao | | | 0.4 | | |
Germany | | | 0.1 | | |
Total | | | 100.0 | % | |
Portfolio footnotes
* Non-income producing security.
1 Security, or portion thereof, was on loan at July 31, 2013.
2 The table below details the Portfolio's transaction activity in an affiliated issuer during the year ended July 31, 2013. The investment manager earns a management fee from UBS Private Money Market Fund LLC. Please see the Notes to financial statements for further information.
Security description | | Value at
07/31/12 | | Purchases
during the
year ended
07/31/13 | | Sales
during the
year ended
07/31/13 | | Value at
07/31/13 | | Net income
earned from
affiliate for the
year ended
07/31/13 | |
UBS Private Money Market Fund LLC | | $ | — | | | $ | 127,702,418 | | | $ | 125,692,718 | | | $ | 2,009,700 | | | $ | 2,698 | | |
See accompanying notes to financial statements.
110
PACE Select Advisors Trust
PACE Large Co Growth Equity Investments
Performance
For the 12 months ended July 31, 2013, the Portfolio's Class P shares returned 21.79% before the deduction of the maximum PACE Select program fee. (Class P shares returned 19.38% after the deduction of the maximum PACE Select program fee for the same 12-month period.) In comparison, the Russell 1000 Growth Index (the "benchmark") returned 21.64%, and the Lipper Large-Cap Growth Funds category posted a median return of 21.57%. (Returns for all share classes over various time periods are shown in the "Performance at a glance" table on page 117. Please note that the returns shown do not reflect the deduction of taxes that a shareholder would pay on Portfolio distributions or the redemption of Portfolio shares.) For a detailed commentary on the market environment in general during the reporting period, please refer to page 2.
Sub-Advisors' comments1
Please note: On October 5, 2012, J.P. Morgan Investment Management Inc. began serving as a third Sub-Advisor for this fund, replacing Wellington Management and Marsico, which were both terminated as Sub-Advisors for the Portfolio effective October 4, 2012.
Delaware
Our portion of the Portfolio slightly outperformed its benchmark during the reporting period. Stock selection in the information technology sector, stock selection and an overweight in the financial services sector and stock selection and an underweight in the consumer staples sector all helped drive our portion of the Portfolio's outperformance. These positives were partially offset by weak stock selection and an underweight in the producer durables sector, along with our overweight in the information technology sector.
In terms of individual holdings, top contributors to performance included Celgene and EOG Resources. Celgene, which was added to our portion of the Portfolio during the reporting period, is a leading player in the treatment of blood cancers and has a growing product pipeline in breast and pancreatic cancer. Celgene possesses solid cash flow and return on capital characteristics for a biotechnology company with franchise products. We believe that it also has large growth prospects driven by additional indications of its drugs, increased use of its drugs per patient and international growth. EOG Resources is engaged in crude oil and natural gas
1 All Sub-Advisors discuss performance on a gross of fees basis—meaning that no fees or expenses are reflected in their sleeves'/sleeve's performance. Alternately, Portfolio performance is shown net of fees, which does factor in fees and expenses associated with the Portfolio.
PACE Select Advisors Trust – PACE Large Co Growth Equity Investments
Investment Sub-Advisors:
Wellington Management Company, LLP ("Wellington Management") until October 4, 2012, Marsico Capital Management, LLC ("Marsico") until October 4, 2012, Delaware Investment Fund Advisers ("Delaware"); Roxbury Capital Management, LLC ("Roxbury") and J.P. Morgan Investment Management Inc. ("J.P. Morgan")
Portfolio Managers:
Wellington Management: Andrew Shilling;
Marsico: Thomas Marsico and Coralie Witter
Delaware: Jeffrey Van Harte, Christopher Bonavico, Daniel Prislin and Christopher Ericksen
Roxbury: Brian L. Massey and Silas A. Myers
J.P. Morgan: Gregory B. Luttrell
Objective:
Capital appreciation
Investment process:
Wellington Management applies in-depth fundamental research in its effort to identify corporate change early, differentiate sustainable growth opportunities from short-lived events, identify superior business models, and develop strict valuation parameters for the companies it evaluates. Wellington's strategy is focused on investing in companies that appear well-positioned to benefit from long-lasting trends and that have structural advantages to maintaining their position.
Marsico uses an approach that combines top-down macro-economic analysis with bottom-up stock selection. It considers macro-economic factors such as interest rates, inflation, demographics, the regulatory environment and the global
111
PACE Select Advisors Trust
PACE Large Co Growth Equity Investments
Sub-Advisors' comments – continued
exploration, development and production in major basins in the US, Canada, Trinidad, the UK, Argentina and China. The stock provides exposure to the North American shale oil opportunity, which we believe is an attractive secular growth area in energy. It's important to note that, while the stock can, at times, be impacted by fluctuations in the price of oil and natural gas, we don't believe that the company's long-term intrinsic business value is dependent solely on commodity prices. We believe that EOG Resources' management team has a capital allocation discipline that increases the company's potential to perform and add value through a variety of commodity prices and economic environments.
Individual holdings that detracted from performance included our positions in both Teradata and VeriFone. Shares of Teradata declined as concerns grew about a difficult information technology spending environment, and recently reported earnings that missed expectations. Despite these concerns, Teradata continues to attract new clients and grow its existing client business. Additionally, the company continues to benefit from the market's overall favorable view of the cloud computing and business analytics industry and, as such, we continue to hold our position in Teradata. VeriFone continued to struggle during the reporting period, as it announced earnings that missed analyst expectations. We believe that underlying company issues have been addressed. Additionally, we believe that VeriFone's core business and competitive position in the electronic payment processing industry is more attractive than perceived. While we continue to own a position in the stock, it is weighted appropriately at a relatively low weight to help mitigate the management transition and stock volatility risks.
Derivatives were not used during the reporting period.
Roxbury
Our portion of the Portfolio underperformed the benchmark during the reporting period. Stock selection in energy and information technology and an underweight in healthcare detracted from results. On the upside, stock selection in industrials, consumer discretionary and consumer staples contributed to performance.
In the information technology sector, both Apple and Microsoft detracted from performance during the reporting period. Apple came under pressure as high-end smart phone demand slowed and there was a dearth of new product releases from Apple, resulting in slower than expected unit
Investment process (continued)
competitive environment. It then seeks to identify companies with earnings growth potential that may not be recognized by the market at large. Marsico's stock selection process may focus on factors such as market expertise or dominance, franchise durability and pricing power, solid company fundamentals, as well as strong management and reasonable valuations.
Delaware invests primarily in common stocks of large capitalization growth-oriented companies that Delaware believes have long-term capital appreciation potential and are expected to grow faster than the US economy. Using a bottom-up approach, Delaware seeks to select securities of companies that it believes have attractive large end-market potential, dominant business models and strong free cash flow generation that are attractively priced compared to the intrinsic value of the securities. Delaware also considers a company's operational efficiencies, management's plans for capital allocation and the company's shareholder orientation.
Roxbury employs a bottom-up approach to stock selection, seeking high quality growth companies whose stocks are trading at discounts to fair value. Roxbury looks for companies with sustainable competitive advantages and opportunities to grow and reinvest capital at higher rates than their cost of capital. Roxbury also seeks to invest in companies with management teams with a proven ability to allocate capital in ways that maximize shareholder value. Roxbury's investment approach seeks to balance both the protection of capital as well as the appreciation potential of a stock.
J.P. Morgan invests primarily in a focused portfolio of equity securities of large capitalization companies. J.P. Morgan
112
PACE Select Advisors Trust
PACE Large Co Growth Equity Investments
Sub-Advisors' comments – continued
growth in iPhones during the first half of calendar year 2013. We believe that Apple will refresh its product line in the second half of 2013 and potentially add new wireless carriers to its distribution channel, which will reinvigorate demand for iPhones. Microsoft underperformed on soft personal computer unit demand, due to macro-related concerns as well as the slow uptake of Windows 8 on the consumer front. We sold out of our position in Microsoft due to concerns surrounding its competitive position in the personal computing space and redeployed the assets into companies that we believe have better risk-reward scenarios.
Within the industrial sector, stock selection and a slight overweight position versus the benchmark both contributed to returns. In particular, our positions in Honeywell, United Technologies and Canadian Pacific Railway were rewarded. We sold out of our position in Canadian Pacific Railway at the end of May as it reached our estimate of fair value and used the proceeds to purchase TransDigm Group. Consumer discretionary and consumer staples benefited from favorable stock selection, with our holdings in Starbucks, Home Depot, Procter & Gamble and Nike being top contributors during the reporting period. We sold out of our position in Home Depot following strong positive stock performance, which resulted in a lower margin of safety. The proceeds from the sale of Home Depot were redeployed for new purchases.
The philosophy and process employed by our team has led to certain sector allocation differentials versus the benchmark. Particularly, the consumer staples and energy sectors are meaningfully overweight, as we believe that the strong fundamentals of these businesses, attractive valuations and the secular demand story should provide investors with attractive absolute and relative returns going forward. Elsewhere, the financials sector remains a significant overweight, with our positions in American Tower and Berkshire Hathaway.
Derivatives were not a part of our investment strategy during the reporting period.
J.P. Morgan
Our portion of the Portfolio outperformed the benchmark during the reporting period from our inception as a Sub-Advisor on October 5, 2012, through July 31, 2013. Despite a market environment that broadly challenged companies with high growth expectations, a persistent bias of our approach, our portion of the Portfolio outperformed due to stock selection. The greatest contributors were our holdings in the healthcare and consumer discretionary sectors. Conversely, stock selection in materials and processing and an underweight to the producer durables sector detractor from results.
At the individual stock level, our portion of the Portfolio's overweight positions in two biotechnology companies, Biogen Idec and Regeneron Pharmaceuticals, were the top contributors to performance. On the negative side, overweight positions in the data analytics company Teradata Corp. and pharmacy benefit management company Express Scripts Inc. were the largest detractors from performance during the reporting period. We continue to hold our position in Teradata as the company is poised to benefit from an improved enterprise spending environment in North America. Company management has been making positive comments regarding its deal pipeline, which it had indicated would pick up in 2013, and we have observed multiple confirmatory data points that this has indeed been happening. We also continue to hold our position in Express Scripts for the synergies associated with its
Investment process (concluded)
considers large capitalization companies to be companies with market capitalizations equal to those within the universe of the Russell 1000 Growth Index at the time of purchase. Although J.P. Morgan will invest primarily in equity securities of U.S. companies, it may invest in foreign securities, including depositary receipts. J.P. Morgan utilizes a combination of qualitative analysis and quantitative metrics in order to seek to achieve target returns which are higher than those of the fund's benchmark while attempting to maintain a moderate risk profile.
113
PACE Select Advisors Trust
PACE Large Co Growth Equity Investments
Sub-Advisors' comments – continued
Medco acquisition, combined with the opportunity to drive up prescription-by-mail and generic prescription drug penetration, all of which should be accretive to margins.
We continue to focus on identifying companies that possess three key characteristics: a large addressable market undergoing meaningful change, a sustainable competitive advantage with strong execution and positive earnings revisions. We are currently finding attractive opportunities in financial services, which continues to be our largest overweight. We are also overweight in the healthcare sector, where we are finding investment opportunities, particularly in biotechnology. Our largest underweights are in consumer staples and producer durables, where we are more challenged to find stocks that meet our investment criteria.
Derivatives were not a part of our investment strategy during the reporting period.
Wellington Management (Note: Wellington Management was terminated as a Sub-Advisor for the Portfolio effective October 4, 2012, and its portion of the Portfolio was transitioned to J.P. Morgan. The following commentary only covers the period of time during which Wellington Management sub-advised a portion of the Portfolio, from August 1, 2012 to October 4, 2012.)
Our portion of the Portfolio outperformed its benchmark during the reporting period, largely driven by stock selection. Sector allocation, a residual of the bottom-up stock selection process, also added to relative results.
Stock selection within the information technology, consumer staples and healthcare sectors contributed the most to results in our portion of the Portfolio during the reporting period. Top performing holdings included Green Mountain Coffee, Gilead Sciences and Lowe's Companies. Green Mountain Coffee, a leading provider of single cup brewers and portion packs for coffee and other beverages, was a main contributor in the consumer staples sector, as its shares outperformed after reporting solid quarterly revenue and earnings. Additionally, investors were encouraged by management's announcement of a $500 million stock buyback and expectations of being free cash flow positive in 2013 and beyond. In the health care sector, our position in Gilead Sciences, a US-based biopharmaceutical company, aided results after it exceeded expectations due to strong antiviral product sales. Furthermore, investors positively reacted to the company's plan for developing its hepatitis C franchise. Lowe's Companies, a home improvement retailer, contributed to results, as investors gained confidence that the company will benefit from a recovery in the housing market.
Stock selection in the industrials and energy sectors detracted from results in our portion of the Portfolio during the reporting period. Our position in Norfolk Southern, a railroad company, was negative for performance. The company's shares fell after it announced that weaker shipments of coal and merchandise, as well as lower fuel surcharge revenue, would reduce its third quarter 2012 earnings compared to a year earlier. However, we continued to hold Norfolk Southern, as we believed that the stock was attractive. Elsewhere, our position in industrial company IHS, a research and consulting services firm, detracted from performance, as its shares declined after missing earnings estimates and lowering its estimate for organic growth. Altera, a programmable logic semiconductor device manufacturer, also detracted from results, as investors feared that the company may lose market share to competitor Xilinx. We continued to hold our positions in both IHS and Altera as we believed that the stocks were still attractive.
From a sector allocation perspective, our underweights to consumer staples and financials contributed to relative results. However, this was partially offset by weak relative results due to a modest cash position in an upward trending market.
Derivatives were not used during the reporting period.
114
PACE Select Advisors Trust
PACE Large Co Growth Equity Investments
Sub-Advisors' comments – concluded
Marsico
Marsico (Note: Marsico was terminated as a Sub-Advisor for the Portfolio effective October 4, 2012, and its portion of the Portfolio was transitioned to J.P. Morgan. The following commentary only covers the period of time during which Marsico sub-advised a portion of the Portfolio, from August 1, 2012 to October 4, 2012.)
Our portion of the Portfolio underperformed the benchmark during the reporting period, primarily due to stock selection. Positions in the energy sector detracted from results, as exploration and production company Occidental Petroleum Corp. and energy pipeline company Kinder Morgan Inc. disappointed. As Occidental is leveraged to energy prices, we became concerned that a slow global economy would keep energy prices lower for a longer period and sold out of our position in the exploration and production company. However, we maintained our position in Kinder Morgan, as we believed its pipeline business should benefit from an increase in oil and gas production in the US. While our holdings in the software and services and pharmaceuticals, biotechnology and life sciences industries generated positive absolute returns, they significantly lagged their respective industry groups in the benchmark, thereby hindering relative results. In particular, positions in Chinese Internet search company Baidu Inc. and pharmaceutical company Bristol-Myers Squibb Co. were material detractors from performance. Despite their underperformance, we elected to hold both of our positions in Baidu and Bristol Myers Squibb. As China's dominant Internet search engine, we view Baidu as a long term growth opportunity. Bristol Myers, a leader in immunotherapy, has a pipeline of cancer treatment compounds that could provide significant upside to the stock. In addition, maintaining an average cash balance of approximately 9% was negative for results.
On the upside, an underweight to the weak-performing consumer staples sector was advantageous for results relative to the benchmark. Stock selection in consumer services was an area of strength, as positions in hotel/casino operator Wynn Resorts Ltd. and coffee purveyor Starbucks Corp. helped returns.
At of the end of the period when we managed a portion of the Portfolio, we had overweight allocations to the consumer discretionary, financials and health care sectors and underweight allocations to the information technology, consumer staples and industrials sectors. At the end of the period in which we managed our portion of the Portfolio, we had no exposure to the telecommunication services or utilities sectors.
Derivatives were not used during the reporting period.
Special considerations
The Portfolio may be appropriate for long-term investors seeking capital appreciation who are able to withstand short-term fluctuations in the equity markets in return for potentially higher returns over the long term. The value of the Portfolio changes every day and can be affected by changes in interest rates, general market conditions and other political, social and economic developments, as well as specific matters relating to the companies in whose securities the Portfolio invests. Also, to the extent the Portfolio invests a large portion of its assets in a particular sector, the Portfolio may experience greater volatility and risk of loss due to unfavorable developments in that sector. It is important to note that an investment in the Portfolio is only one component of a balanced investment plan.
115
PACE Select Advisors Trust
PACE Large Co Growth Equity Investments
Illustration of an assumed investment of $10,000 in Class P shares of the Portfolio (unaudited)
The following graph depicts the performance of PACE Large Co Growth Equity Investments Class P shares versus the Russell 1000 Growth Index over the 10 years ended July 31, 2013. The performance of the other classes will vary based upon the different class specific expenses and sales charges. The performance provided does not reflect the deduction of taxes that a shareholder would pay on Portfolio distributions or the redemption of Portfolio shares. Past performance is no guarantee of future results. Share price and returns will vary with market conditions; investors may realize a gain or loss upon redemption. It is important to note that PACE Large Co Growth Equity Investments is a professionally managed portfolio while the Index is not available for investment and is unmanaged. The comparison is shown for illustration purposes only.
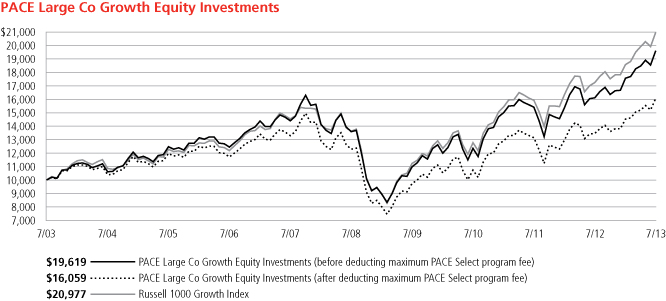
116
PACE Select Advisors Trust
PACE Large Co Growth Equity Investments
Performance at a glance (unaudited)
Average annual total returns for periods ended 07/31/13 | | 1 year | | 5 years | | 10 years | |
Before deducting maximum sales charge or PACE Select program fee | |
Class A1 | | | 21.45 | % | | | 7.33 | % | | | 6.66 | % | |
Class C2 | | | 20.49 | % | | | 6.47 | % | | | 5.79 | % | |
Class Y3 | | | 21.77 | % | | | 7.66 | % | | | 7.04 | % | |
Class P4 | | | 21.79 | % | | | 7.63 | % | | | 6.97 | % | |
After deducting maximum sales charge or PACE Select program fee | |
Class A1 | | | 14.76 | % | | | 6.12 | % | | | 6.06 | % | |
Class C2 | | | 19.49 | % | | | 6.47 | % | | | 5.79 | % | |
Class P4 | | | 19.38 | % | | | 5.50 | % | | | 4.85 | % | |
Russell 1000 Growth Index5 | | | 21.64 | % | | | 9.01 | % | | | 7.69 | % | |
Lipper Large-Cap Growth Funds median | | | 21.57 | % | | | 6.81 | % | | | 6.81 | % | |
Average annual total returns for periods ended June 30, 2013, after deduction of the maximum sales charge or PACE Select program fee, were as follows: Class A—1-year period, 8.99%; 5-year period, 4.40%; 10-year period, 5.81%; Class C—1-year period, 13.42%; 5-year period, 4.73%; 10-year period, 5.53%; Class Y—1-year period, 15.66%; 5-year period, 5.91%; 10-year period, 6.77%; Class P—1-year period, 13.35%; 5-year period, 3.77%; 10-year period, 4.59%.
The annualized gross and net expense ratios, respectively, for each class of shares as in the November 28, 2012 prospectuses, were as follows: Class A—1.23% and 1.23%; Class C—2.07% and 2.05%; Class Y—0.97% and 0.97%; and Class P—0.96% and 0.96%. Net expenses reflect fee waivers and/or expense reimbursements, if any, pursuant to an agreement that is in effect to cap the expenses. The Portfolio and UBS Global Asset Management (Americas) Inc. ("UBS Global AM") have entered into a written fee waiver/expense reimbursement agreement pursuant to which UBS Global AM is contractually obligated to waive its management fees and/or reimburse expenses so that the Portfolio's ordinary total operating expenses of each class through November 30, 2013 (excluding dividend expense, borrowing costs, and interest expense relating to short sales, and expenses attributable to investment in other investment companies, interest, taxes, brokerage commissions and extraordinary expenses) would not exceed Class A—1.30%; Class C—2.05%; Class Y—1.05% and Class P—1.05%. The Portfolio has agreed to repay UBS Global AM for any waived fees/reimbursed expenses to the extent that it can do so over the following three fiscal years without causing the Portfolio's expenses in any of those three years to exceed these expense caps. The fee waiver/expense reimbursement agreement may be terminated by the Portfolio's board at any time and also will terminate automatically upon the expiration or termination of the Portfolio's advisory contract with UBS Global AM. Upon termination of the agreement, however, UBS Global AM's three year recoupment rights will survive.
1 Maximum sales charge for Class A shares is 5.5%. Class A shares bear ongoing 12b-1 service fees.
2 Maximum contingent deferred sales charge for Class C shares is 1% imposed on redemptions and is reduced to 0% after one year. Class C shares bear ongoing 12b-1 service and distribution fees. Prior to September 30, 2003, Class C shares were subject to a maximum front-end sales charge of 1%; this front-end sales charge is not reflected in the average annual total returns presented for the Class C shares shown above.
3 The Portfolio offers Class Y shares to a limited group of eligible investors, including certain qualifying retirement plans. Class Y shares do not bear initial or contingent deferred sales charges or ongoing 12b-1 service and distribution fees.
4 Class P shares do not bear initial or contingent deferred sales charges or ongoing 12b-1 service and distribution fees, but are subject to a maximum annual PACE Select program fee of 2% of the value of Class P shares. Prior to June 14, 2010, the maximum annual PACE Select program fee was 1.5% of the value of Class P shares; however, the current maximum annual PACE Select program fee of 2% is reflected in the performance returns throughout all periods in the average annual total returns presented for the Class P shares shown above.
5 The Russell 1000 Growth Index measures the performance of the large-cap growth segment of the US equity universe. It includes those Russell 1000 Index companies with higher price-to-book ratios and higher forecasted growth values. The Russell 1000 Growth Index is constructed to provide a comprehensive and unbiased barometer for the large-cap growth segment. The Index is completely reconstituted annually to ensure new and growing equities are included and that the represented companies continue to reflect growth characteristics. Investors should note that indices do not reflect the deduction of fees and expenses.
If an investor sells or exchanges shares less than 90 days after purchase, a redemption fee of 1.00% of the amount sold or exchanged will be deducted at the time of the transaction, except as noted otherwise in the prospectuses.
Past performance does not predict future performance, and the performance information provided does not reflect the deduction of taxes that a shareholder would pay on Portfolio distributions or the redemption of Portfolio shares. The return and principal value of an investment will fluctuate, so that an investor's shares, when redeemed, may be worth more or less than their original cost. Performance results assume reinvestment of all dividends and capital gain distributions at net asset value on the ex-dividend dates. Current performance may be higher or lower than the performance data quoted. For month-end performance figures, please visit http://globalam-us.ubs.com/corpweb/performance.do.
Lipper peer group data calculated by Lipper Inc.; used with permission. The Lipper median is the return of the fund that places in the middle of a Lipper peer group.
117
PACE Select Advisors Trust
PACE Large Co Growth Equity Investments
Portfolio statistics (unaudited)
Characteristics | | 07/31/13 | |
Net assets (mm) | | $ | 1,195.5 | | |
Number of holdings | | | 69 | | |
Portfolio composition1 | | 07/31/13 | |
Common stocks and warrants | | | 93.4 | % | |
ADRs | | | 3.7 | | |
Cash equivalents and other assets less liabilities | | | 2.9 | | |
Total | | | 100.0 | % | |
Top five sectors1 | | 07/31/13 | |
Information technology | | | 33.0 | % | |
Consumer discretionary | | | 13.8 | | |
Financials | | | 11.8 | | |
Health care | | | 10.9 | | |
Consumer staples | | | 8.8 | | |
Total | | | 78.3 | % | |
Top ten equity holdings1 | | 07/31/13 | |
Google, Inc., Class A | | | 4.3 | % | |
QUALCOMM, Inc. | | | 3.7 | | |
MasterCard, Inc., Class A | | | 3.4 | | |
Berkshire Hathaway, Inc., Class B | | | 3.0 | | |
priceline.com, Inc. | | | 2.6 | | |
Apple, Inc. | | | 2.5 | | |
Honeywell International, Inc. | | | 2.4 | | |
Allergan, Inc. | | | 2.4 | | |
Occidental Petroleum Corp. | | | 2.2 | | |
Starbucks Corp. | | | 2.1 | | |
Total | | | 28.6 | % | |
For a listing of defined portfolio acronyms that are used throughout the Portfolio statistics, please refer to page 218.
1 Weightings represent percentages of the Portfolio's net assets as of July 31, 2013. The Portfolio is actively managed and its composition will vary over time.
118
PACE Select Advisors Trust
PACE Large Co Growth Equity Investments
Portfolio of investments—July 31, 2013
| | | Number of
shares | | Value | |
Common stocks—97.02% | |
Aerospace & defense—6.34% | |
Honeywell International, Inc. | | | 348,794 | | | $ | 28,942,926 | | |
TransDigm Group, Inc. | | | 156,672 | | | | 22,653,204 | | |
United Technologies Corp. | | | 228,903 | | | | 24,165,290 | | |
| | | | | | 75,761,420 | | |
Beverages—2.78% | |
Anheuser-Busch InBev N.V., ADR | | | 137,484 | | | | 13,158,594 | | |
PepsiCo, Inc. | | | 240,313 | | | | 20,075,748 | | |
| | | | | | 33,234,342 | | |
Biotechnology—6.23% | |
Biogen Idec, Inc.* | | | 96,752 | | | | 21,104,514 | | |
Celgene Corp.* | | | 144,875 | | | | 21,276,343 | | |
Gilead Sciences, Inc.* | | | 283,234 | | | | 17,404,729 | | |
Regeneron Pharmaceuticals, Inc.* | | | 54,305 | | | | 14,665,608 | | |
| | | | | | 74,451,194 | | |
Capital markets—1.99% | |
TD Ameritrade Holding Corp. | | | 473,876 | | | | 12,808,869 | | |
The Goldman Sachs Group, Inc. | | | 67,042 | | | | 10,996,899 | | |
| | | | | | 23,805,768 | | |
Chemicals—1.74% | |
Monsanto Co. | | | 117,974 | | | | 11,653,472 | | |
Syngenta AG, ADR | | | 115,225 | | | | 9,107,384 | | |
| | | | | | 20,760,856 | | |
Communications equipment—3.67% | |
QUALCOMM, Inc. | | | 680,276 | | | | 43,911,816 | | |
Computers & peripherals—4.34% | |
Apple, Inc. | | | 66,417 | | | | 30,053,693 | | |
EMC Corp. | | | 836,715 | | | | 21,880,097 | | |
| | | | | | 51,933,790 | | |
Consumer finance—0.75% | |
Capital One Financial Corp. | | | 130,370 | | | | 8,998,137 | | |
Diversified financial services—2.02% | |
CME Group, Inc. | | | 134,850 | | | | 9,976,203 | | |
IntercontinentalExchange, Inc.*,1 | | | 77,500 | | | | 14,139,875 | | |
| | | | | | 24,116,078 | | |
Energy equipment & services—0.78% | |
Cameron International Corp.* | | | 157,293 | | | | 9,327,475 | | |
Food & staples retailing—2.80% | |
Walgreen Co. | | | 378,200 | | | | 19,004,550 | | |
Whole Foods Market, Inc. | | | 259,918 | | | | 14,446,242 | | |
| | | | | | 33,450,792 | | |
Food products—1.85% | |
Mondelez International, Inc., Class A | | | 708,566 | | | | 22,156,859 | | |
Health care providers & services—0.63% | |
Express Scripts Holding Co.* | | | 114,904 | | | | 7,531,957 | | |
| | | Number of
shares | | Value | |
Common stocks—(continued) | |
Hotels, restaurants & leisure—3.07% | |
Las Vegas Sands Corp. | | | 198,129 | | | $ | 11,010,029 | | |
Starbucks Corp. | | | 360,133 | | | | 25,655,875 | | |
| | | | | | 36,665,904 | | |
Household products—1.36% | |
The Procter & Gamble Co. | | | 203,148 | | | | 16,312,784 | | |
Insurance—5.28% | |
Berkshire Hathaway, Inc., Class B* | | | 307,676 | | | | 35,650,418 | | |
Markel Corp.* | | | 27,512 | | | | 14,581,360 | | |
The Progressive Corp. | | | 494,425 | | | | 12,859,994 | | |
| | | | | | 63,091,772 | | |
Internet & catalog retail—5.29% | |
Amazon.com, Inc.* | | | 43,282 | | | | 13,037,404 | | |
Liberty Interactive Corp., Class A* | | | 769,625 | | | | 18,825,028 | | |
priceline.com, Inc.* | | | 35,805 | | | | 31,353,364 | | |
| | | | | | 63,215,796 | | |
Internet software & services—8.11% | |
eBay, Inc.* | | | 483,198 | | | | 24,976,505 | | |
Facebook, Inc., Class A* | | | 104,300 | | | | 3,841,369 | | |
Google, Inc., Class A* | | | 57,529 | | | | 51,062,740 | | |
LinkedIn Corp., Class A* | | | 39,260 | | | | 8,000,795 | | |
VeriSign, Inc.* | | | 190,875 | | | | 9,131,460 | | |
| | | | | | 97,012,869 | | |
IT services—8.34% | |
Alliance Data Systems Corp.*,1 | | | 64,683 | | | | 12,793,004 | | |
MasterCard, Inc., Class A | | | 66,084 | | | | 40,351,551 | | |
Teradata Corp.* | | | 328,185 | | | | 19,402,297 | | |
VeriFone Systems, Inc.* | | | 148,550 | | | | 2,832,849 | | |
Visa, Inc., Class A | | | 137,525 | | | | 24,343,300 | | |
| | | | | | 99,723,001 | | |
Oil, gas & consumable fuels—6.73% | |
Cabot Oil & Gas Corp. | | | 142,010 | | | | 10,767,198 | | |
EOG Resources, Inc. | | | 164,975 | | | | 24,002,213 | | |
Kinder Morgan, Inc. | | | 506,315 | | | | 19,118,454 | | |
Occidental Petroleum Corp. | | | 298,914 | | | | 26,618,292 | | |
| | | | | | 80,506,157 | | |
Pharmaceuticals—4.00% | |
Allergan, Inc. | | | 316,620 | | | | 28,850,414 | | |
Novo Nordisk A/S, ADR | | | 63,950 | | | | 10,802,434 | | |
Perrigo Co. | | | 65,400 | | | | 8,135,106 | | |
| | | | | | 47,787,954 | | |
Real estate investment trusts—1.77% | |
American Tower Corp. | | | 298,460 | | | | 21,127,983 | | |
Road & rail—1.50% | |
Kansas City Southern | | | 165,874 | | | | 17,872,924 | | |
Semiconductors & semiconductor equipment—1.68% | |
ARM Holdings PLC, ADR1 | | | 277,347 | | | | 11,135,482 | | |
ASML Holding N.V. | | | 99,540 | | | | 8,948,646 | | |
| | | | | | 20,084,128 | | |
119
PACE Select Advisors Trust
PACE Large Co Growth Equity Investments
Portfolio of investments—July 31, 2013
| | | Number of
shares | | Value | |
Common stocks—(concluded) | |
Software—6.85% | |
Adobe Systems, Inc.* | | | 397,125 | | | $ | 18,776,070 | | |
Citrix Systems, Inc.* | | | 92,236 | | | | 6,642,837 | | |
Intuit, Inc. | | | 233,775 | | | | 14,942,898 | | |
Microsoft Corp. | | | 237,425 | | | | 7,557,238 | | |
Oracle Corp. | | | 720,410 | | | | 23,305,263 | | |
Salesforce.com, Inc.* | | | 244,600 | | | | 10,701,250 | | |
| | | | | | 81,925,556 | | |
Specialty retail—2.52% | |
L Brands, Inc. | | | 206,775 | | | | 11,531,842 | | |
Sally Beauty Holdings, Inc.* | | | 194,625 | | | | 5,938,009 | | |
The Home Depot, Inc. | | | 159,922 | | | | 12,638,635 | | |
| | | | | | 30,108,486 | | |
Textiles, apparel & luxury goods—2.94% | |
Michael Kors Holdings Ltd.* | | | 150,726 | | | | 10,149,889 | | |
Nike, Inc., Class B | | | 396,773 | | | | 24,964,957 | | |
| | | | | | 35,114,846 | | |
Wireless telecommunication services—1.66% | |
Crown Castle International Corp.* | | | 282,975 | | | | 19,878,994 | | |
Total common stocks
(cost—$897,718,988) | | | | | 1,159,869,638 | | |
| | | Number of
warrants | | | |
Warrants—0.07% | |
Oil, gas & consumable fuel—0.07% | |
Kinder Morgan, Inc., strike
price $40.00, expires 05/25/17*
(cost—$294,616) | | | 154,654 | | | | 847,504 | | |
| | | Face
amount | | Value | |
Repurchase agreement—3.50% | |
Repurchase agreement dated
07/31/13 with State Street
Bank and Trust Co., 0.010%
due 08/01/13, collateralized by
$1,826,693 Federal Home Loan
Mortgage Corp. obligations,
1.960% due 11/07/22,
$42,108,954 Federal National
Mortgage Association obligations,
2.140% to 2.170% due 11/07/22
and $1,384,651 US Treasury Notes,
0.250% to 0.750% due 10/31/13
to 12/15/13; (value—$42,619,138);
proceeds: $41,783,012
(cost—$41,783,000) | | $ | 41,783,000 | | | $ | 41,783,000 | | |
| | | Number of
shares | | | |
Investment of cash collateral from securities loaned—1.89% | |
Money market fund—1.89% | |
UBS Private Money Market Fund LLC2
(cost—$22,558,968) | | | 22,558,968 | | | | 22,558,968 | | |
Total investments
(cost—$962,355,572)—102.48% | | | | | 1,225,059,110 | | |
Liabilities in excess of
other assets—(2.48)% | | | | | (29,590,152 | ) | |
Net assets—100.00% | | | | $ | 1,195,468,958 | | |
For a listing of defined portfolio acronyms that are used throughout the Portfolio of investments as well as the tables that follow, please refer to page 218.
Aggregate cost for federal income tax purposes was $972,371,871; and net unrealized appreciation consisted of:
Gross unrealized appreciation | | $ | 267,456,493 | | |
Gross unrealized depreciation | | | (14,769,254 | ) | |
Net unrealized appreciation | | $ | 252,687,239 | | |
120
PACE Select Advisors Trust
PACE Large Co Growth Equity Investments
Portfolio of investments—July 31, 2013
Fair valuation summary
The following is a summary of the fair valuations according to the inputs used as of July 31, 2013 in valuing the Portfolio's investments:
| | | Unadjusted
quoted prices in
active markets for
identical investments
(Level 1) | | Other significant
observable inputs
(Level 2) | | Unobservable
inputs
(Level 3) | | Total | |
Common stocks | | $ | 1,159,869,638 | | | $ | — | | | $ | — | | | $ | 1,159,869,638 | | |
Warrants | | | 847,504 | | | | — | | | | — | | | | 847,504 | | |
Repurchase agreement | | | — | | | | 41,783,000 | | | | — | | | | 41,783,000 | | |
Investment of cash collateral from securities loaned | | | — | | | | 22,558,968 | | | | — | | | | 22,558,968 | | |
Total | | $ | 1,160,717,142 | | | $ | 64,341,968 | | | $ | — | | | $ | 1,225,059,110 | | |
At July 31, 2013, there were no transfers between Level 1 and Level 2.
Issuer breakdown by country or territory of origin (unaudited)
| | | Percentage of total
investments | |
United States | | | 94.8 | % | |
Belgium | | | 1.1 | | |
United Kingdom | | | 0.9 | | |
Denmark | | | 0.9 | | |
British Virgin Islands | | | 0.8 | | |
Switzerland | | | 0.8 | | |
Netherlands | | | 0.7 | | |
Total | | | 100.0 | % | |
Portfolio footnotes
* Non-income producing security.
1 Security, or portion thereof, was on loan at July 31, 2013.
2 The table below details the Portfolio's transaction activity in an affiliated issuer during the year ended July 31, 2013. The investment manager earns a management fee from UBS Private Money Market Fund LLC. Please see the Notes to financial statements for further information.
Security description | | Value at
07/31/12 | | Purchases
during the
year ended
07/31/13 | | Sales
during the
year ended
07/31/13 | | Value at
07/31/13 | | Net income
earned from
affiliate for the
year ended
07/31/13 | |
UBS Private Money Market Fund LLC | | $ | 18,572,924 | | | $ | 228,005,037 | | | $ | 224,018,993 | | | $ | 22,558,968 | | | $ | 3,585 | | |
See accompanying notes to financial statements.
121
PACE Select Advisors Trust
PACE Small/Medium Co Value Equity Investments
Performance
For the 12 months ended July 31, 2013, the Portfolio's Class P shares returned 34.51% before the deduction of the maximum PACE Select program fee. (Class P shares returned 31.84% after the deduction of the maximum PACE Select program fee for the same 12-month period.) In comparison, the Russell 2500 Value Index (the "benchmark") returned 34.73% and the Lipper Small-Cap Core Funds category posted a median return of 33.30%. (Returns for all share classes over various time periods are shown in the "Performance at a glance" table on page 127. Please note that the returns shown do not reflect the deduction of taxes that a shareholder would pay on Portfolio distributions or the redemption of Portfolio shares.) For a detailed commentary on the market environment in general during the reporting period, please refer to page 2.
Sub-Advisors' comments1
MetWest Capital
Our portion of the Portfolio significantly outperformed the benchmark during the reporting period, primarily due to strong stock selection. Our holdings in the financials, healthcare and energy sectors added the most value. In financials, insurance and asset management holding company StanCorp Financial Group, Inc. contributed to returns, as the company recently benefited from the increase in interest rates. The nation's largest healthcare staffing firm, AMN Healthcare Services, Inc., was the top performer in the healthcare sector, as its shares rallied as the company continued to execute well and gain market share. In energy, Oasis Petroleum, Inc., an exploration and production company, contributed to returns. Oasis' management's solid execution continued to propel shares higher.
Stock selection in the materials sector detracted from performance, with Walter Energy, Inc. as the principal detractor. Shares of this metallurgical coal provider have declined since our initial purchase, which was admittedly early. Metallurgical coal commodity prices declined, as demand from Asia weakened and excess supply flowed into the market from Australian-based BHP Billiton. Walter Energy's management team has incorporated measures to counteract the declining met coal prices by shutting down high-cost mines, cutting certain expenses and decreasing capital expenditures. While the future of Walter Energy does ultimately rest on a macro recovery, we believe the company is in a good position from a
1 All Sub-Advisors discuss performance on a gross of fees basis—meaning that no fees or expenses are reflected in their sleeves'/sleeve's performance. Alternately, Portfolio performance is shown net of fees, which does factor in fees and expenses associated with the Portfolio.
PACE Select Advisors Trust – PACE Small/Medium Co Value Equity Investments
Investment Sub-Advisors:
Metropolitan West Capital Management, LLC ("MetWest Capital"), Buckhead Capital Management, LLC ("Buckhead") until October 2, 2012, Systematic Financial Management, L.P. ("Systematic") and Kayne Anderson Rudnick, LLC ("Kayne Anderson Rudnick")
Portfolio Managers:
MetWest Capital: Samir Sikka;
Buckhead: Matthew D. Reams and David S. Griffin;
Systematic: Ronald M. Mushock and D. Kevin McCreesh
Kayne Anderson Rudnick: Julie Kutasov and Craig Stone
Objective:
Capital appreciation
Investment process:
MetWest Capital utilizes a bottom-up, fundamental, research-driven style that it believes is well suited to the small cap market segment. MetWest Capital seeks to identify high-quality companies selling below intrinsic value with clear catalysts to realize full value within its investment time horizon and constructs a portfolio of its highest conviction ideas.
Buckhead utilizes a fundamental, bottom-up, research-driven investment style and a disciplined investment process that is designed to identify companies that it believes are attractively valued, have strong underlying fundamental characteristics and are likely to have one or more catalysts that are expected to drive their share prices higher. Buckhead seeks to build concentrated portfolios with the largest
122
PACE Select Advisors Trust
PACE Small/Medium Co Value Equity Investments
Sub-Advisors' comments – continued
liquidity standpoint and we are comfortable with its current cash burn rate. However, we will remain vigilant in monitoring this company.
Over the long term, we believe that our focus on exceptional companies in good businesses will continue to add value for shareholders, while also providing downside protection over a complete market cycle.
Derivatives were not used during the reporting period.
Systematic
Our portion of the Portfolio underperformed the benchmark during the reporting period. From an attribution standpoint, our underperformance was primarily due to stock selection. Sector allocation also slightly detracted from our results. From a stock selection perspective, the consumer staples, energy and information technology sectors were the largest detractors from our portion of the Portfolio's performance. Conversely, our stock selection in the industrials and financials sectors was positive for performance. In terms of sector allocation, our underweight to the materials sector was our biggest detractor from relative performance, while our overweight to the consumer discretionary sector helped offset some of those losses.
Despite generating a strong absolute return, active managers like us continued to have difficulty beating the benchmark. In particular, we still faced headwinds, as investors move in and out of stocks en masse, driven by broader market sentiment. However, we believe that a move to the next phase of the economic cycle could be beneficial for our fundamental investment approach. With companies awash in liquidity from both the debt and equity markets, we have generally seen those with falling earnings estimates being put on equal footing with companies showing improving earnings estimates. As such, investors have not consistently separated the wheat from the chaff on the basis of earnings and underlying company performance when selecting stocks for investment over the past few years—this has been a headwind for our strategy. Heightened expectations regarding the withdrawal of monetary stimulus may mark a long-awaited move to the middle and latter innings of the economic cycle, when our strategy has historically worked quite well. We have already begun to see the improved efficiency of a number of company-focused fundamental metrics predicting stock price outperformance in the realm of small-cap stocks. While many of these same metrics have been ineffective throughout the rest of the market cap spectrum, historically, their return to efficiency among small-caps has become a precursor to their more widespread effectiveness. We confidently look for this headwind to abate and become a tailwind for our relative investment performance for the other market cap arenas.
Investment process (concluded)
positions in those companies that it believes have the highest likelihood of outperforming the market and/or the Portfolio's benchmark.
Systematic employs a two-pronged investment approach that utilizes both quantitative screening and fundamental research. Systematic's investment philosophy is predicated on its belief that stock prices reflect the market's estimates of earnings, and as revisions to those estimates are made by the market, stock prices will follow suit.
Systematic conducts a quantitative screening of all companies within the small/mid capitalization universe, and then uses fundamental research analysis to gauge investor expectations by focusing on key revenue and margin assumptions underlying earnings estimates.
Kayne Anderson Rudnick employs a fundamental, bottom-up, research-driven investment style and utilizes a disciplined investment process to identify high-quality companies that possess solid investment-grade balance sheets, generate positive cash flow and whose securities can be acquired at attractive valuations. Kayne Anderson Rudnick's first-hand fundamental research process involves carefully evaluating a company from a three-tiered perspective involving qualitative, financial and valuation analyses.
123
PACE Select Advisors Trust
PACE Small/Medium Co Value Equity Investments
Sub-Advisors' comments – continued
Derivatives were not used during the reporting period.
Kayne Anderson Rudnick
Despite a strong absolute return, our portion of the Portfolio underperformed the benchmark for the reporting period, due to the headwind of our high-quality investment approach, as well as some stock selection issues.
Stock selection in the consumer discretionary, healthcare and materials and processing sectors detracted from performance during the reporting period. Conversely, stock selection in the energy and financial services sectors contributed to performance. While there were no meaningful overweights or underweights in any particular sector, our underweight in utilities contributed to performance.
In terms of individual stocks, the largest detractors from performance in our portion of the Portfolio during the reporting period were John Wiley & Sons and Ross Stores. A number of John Wiley & Sons' business segments are suffering from the broader transition to a digital media environment. In addition, management is directing significant capital into acquisitions of businesses outside of the company's core publishing market. With these considerations in mind, we exited our position in the company in late June 2013. Ross Stores' 2013 guidance of 1% to 2% store comparable growth was slightly below expectations, mainly stemming from difficult previous year comparisons. We remain confident that Ross Stores' business model remains intact and there are no fundamental issues with the company.
The stocks that were the largest contributors to performance during the reporting period were Eaton Vance and Jack Henry & Associates. Eaton Vance has benefited from strong equity market performance and solid asset gathering results. Jack Henry & Associates has generated strong performance, with solid top-line growth translating into positive operating leverage. The company's business model requires low capital investment, resulting in a low debt balance sheet and a strong free cash flow stream that is used for timely acquisitions and opportunistic share repurchases.
Derivatives were not used during the reporting period.
Buckhead (Note: Buckhead was terminated as a Sub-Advisor for the Portfolio effective October 2, 2012. The following commentary only covers the period of time during which Buckhead sub-advised a portion of the Portfolio, from August 1, 2012 to October 2, 2012. Buckhead's portion of the Portfolio was reallocated to the remaining three Sub-Advisors.)
Our portion of the Portfolio underperformed its benchmark during the reporting period. While stock selection detracted from results during the period we sub-advised a portion of the Portfolio, sector allocation added value.
Investments in certain technology stocks were among our weaker holdings during the period under review. For example, shares of Jabil Circuit and On Semiconductor declined, following disappointing earnings releases. However, we continued to hold our positions in Jabil Circuit and On Semiconductor because despite short term earnings issues, they continued to offer good long term total return potential. Knight Capital performed poorly, as well, due to significant losses from the implementation of faulty trading software and we sold out of our position in Knight Capital in August 2012. Coinstar sold off, as fears of slowing growth negatively impacted investor sentiment. Despite its short term earnings issues, we still hold our position in Coinstar, as it continued to offer good long term total return potential. Although there were the weak-performing areas, there were also sectors
124
PACE Select Advisors Trust
PACE Small/Medium Co Value Equity Investments
Sub-Advisors' comments – concluded
that contributed to performance. Among financial service companies, First Horizon and Raymond James were significant contributors to our performance during the reporting period. Rock Tenn, a packaging company, posted strong results and positively added to results.
At the end of the period when we managed a portion of the Portfolio, our portion of the Portfolio was overweight relative to the benchmark in consumer, producer durable and technology stocks, neutral in basic materials and underweight healthcare, energy, financial services and utilities.
Derivatives were not used during the reporting period.
Special considerations
The Portfolio may be appropriate for long-term investors seeking capital appreciation who are able to withstand short-term fluctuations in the equity markets in return for potentially higher returns over the long term. The value of the Portfolio changes every day and can be affected by changes in interest rates, general market conditions and other political, social and economic developments, as well as specific matters relating to the companies in whose securities the Portfolio invests. It is important to note that an investment in the Portfolio is only one component of a balanced investment plan. In addition, small- and mid-cap companies are typically subject to a greater degree of change in earnings and business prospects than are larger, more established companies. Therefore, they are considered to have a higher level of volatility and risk.
125
PACE Select Advisors Trust
PACE Small/Medium Co Value Equity Investments
Illustration of an assumed investment of $10,000 in Class P shares of the Portfolio (unaudited)
The following graph depicts the performance of PACE Small/Medium Co Value Equity Investments Class P shares versus the Russell 2500 Value Index over the 10 years ended July 31, 2013. The performance of the other classes will vary based upon the different class specific expenses and sales charges. The performance provided does not reflect the deduction of taxes that a shareholder would pay on Portfolio distributions or the redemption of Portfolio shares. Past performance is no guarantee of future results. Share price and returns will vary with market conditions; investors may realize a gain or loss upon redemption. It is important to note that PACE Small/Medium Co Value Equity Investments is a professionally managed portfolio while the Index is not available for investment and is unmanaged. The comparison is shown for illustration purposes only.
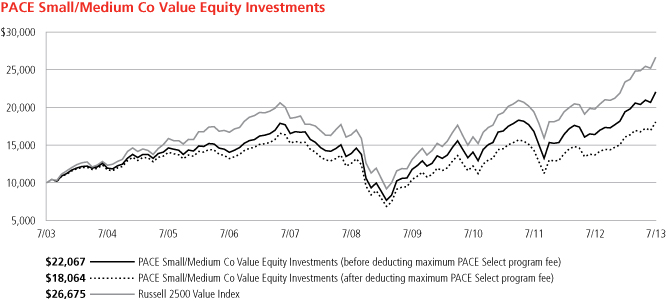
126
PACE Select Advisors Trust
PACE Small/Medium Co Value Equity Investments
Performance at a glance (unaudited)
Average annual total returns for periods ended 07/31/13 | | 1 year | | 5 years | | 10 years | |
Before deducting maximum sales charge or PACE Select program fee | |
Class A1 | | | 34.23 | % | | | 9.53 | % | | | 8.06 | % | |
Class C2 | | | 33.24 | % | | | 8.71 | % | | | 7.24 | % | |
Class Y3 | | | 34.41 | % | | | 9.81 | % | | | 8.38 | % | |
Class P4 | | | 34.51 | % | | | 9.71 | % | | | 8.24 | % | |
After deducting maximum sales charge or PACE Select program fee | |
Class A1 | | | 26.82 | % | | | 8.30 | % | | | 7.45 | % | |
Class C2 | | | 32.24 | % | | | 8.71 | % | | | 7.24 | % | |
Class P4 | | | 31.84 | % | | | 7.54 | % | | | 6.09 | % | |
Russell 2500 Value Index5 | | | 34.73 | % | | | 10.26 | % | | | 10.31 | % | |
Lipper Small-Cap Core Funds median | | | 33.30 | % | | | 9.17 | % | | | 9.52 | % | |
Average annual total returns for periods ended June 30, 2013, after deduction of the maximum sales charge or PACE Select program fee, were as follows: Class A—1-year period, 18.32%; 5-year period, 7.52%; 10-year period, 7.12%; Class C—1-year period, 23.30%; 5-year period, 7.93%; 10-year period, 6.92%; Class Y—1-year period, 25.38%; 5-year period, 9.02%; 10-year period, 8.05%; Class P—1-year period, 22.97%; 5-year period, 6.77%; 10-year period, 5.77%.
The annualized gross and net expense ratios, respectively, for each class of shares as in the November 28, 2012 prospectuses, were as follows: Class A—1.32% and 1.32%; Class C—2.07% and 2.07%; Class Y—1.16% and 1.16%; and Class P—1.22% and 1.16%. Net expenses reflect fee waivers and/or expense reimbursements, if any, pursuant to an agreement that is in effect to cap the expenses. The Portfolio and UBS Global Asset Management (Americas) Inc. ("UBS Global AM") have entered into a written fee waiver/expense reimbursement agreement pursuant to which UBS Global AM is contractually obligated to waive its management fees and/or reimburse expenses so that the Portfolio's ordinary total operating expenses through November 30, 2013 (excluding dividend expense, borrowing costs, and interest expense relating to short sales, and expenses attributable to investment in other investment companies, interest, taxes, brokerage commissions and extraordinary expenses) would not exceed Class A—1.41%; Class C—2.16%; Class Y—1.16% and Class P—1.16%. The Portfolio has agreed to repay UBS Global AM for any waived fees/reimbursed expenses to the extent that it can do so over the following three fiscal years without causing the Portfolio's expenses in any of those three years to exceed this expense cap. The fee waiver/expense reimbursement agreement may be terminated by the Portfolio's board at any time and also will terminate automatically upon the expiration or termination of the Portfolio's advisory contract with UBS Global AM. Upon termination of the agreement, however, UBS Global AM's three year recoupment rights will survive.
1 Maximum sales charge for Class A shares is 5.5%. Class A shares bear ongoing 12b-1 service fees.
2 Maximum contingent deferred sales charge for Class C shares is 1% imposed on redemptions and is reduced to 0% after one year. Class C shares bear ongoing 12b-1 service and distribution fees. Prior to September 30, 2003, Class C shares were subject to a maximum front-end sales charge of 1%; this front-end sales charge is not reflected in the average annual total returns presented for the Class C shares shown above.
3 The Portfolio offers Class Y shares to a limited group of eligible investors, including certain qualifying retirement plans. Class Y shares do not bear initial or contingent deferred sales charges or ongoing 12b-1 service and distribution fees.
4 Class P shares do not bear initial or contingent deferred sales charges or ongoing 12b-1 service and distribution fees, but are subject to a maximum annual PACE Select program fee of 2% of the value of Class P shares. Prior to June 14, 2010, the maximum annual PACE Select program fee was 1.5% of the value of Class P shares; however, the current maximum annual PACE Select program fee of 2% is reflected in the performance returns throughout all periods in the average annual total returns presented for the Class P shares shown above.
5 The Russell 2500 Value Index measures the performance of the small to mid-cap value segment of the US equity universe. It includes those Russell 2500 Index companies with lower price-to-book ratios and lower forecasted growth values. The Russell 2500 Value Index is constructed to provide a comprehensive and unbiased barometer of the small to mid-cap value market. The Index is completely reconstituted annually to ensure larger stocks do not distort the performance and characteristics of the true small to mid-cap opportunity set and that the represented companies continue to reflect value characteristics. Investors should note that indices do not reflect the deduction of fees and expenses.
If an investor sells or exchanges shares less than 90 days after purchase, a redemption fee of 1.00% of the amount sold or exchanged will be deducted at the time of the transaction, except as noted otherwise in the prospectuses.
Past performance does not predict future performance, and the performance information provided does not reflect the deduction of taxes that a shareholder would pay on Portfolio distributions or the redemption of Portfolio shares. The return and principal value of an investment will fluctuate, so that an investor's shares, when redeemed, may be worth more or less than their original cost. Performance results assume reinvestment of all dividends and capital gain distributions at net asset value on the ex-dividend dates. Current performance may be higher or lower than the performance data quoted. For month-end performance figures, please visit http://globalam-us.ubs.com/corpweb/performance.do.
Lipper peer group data calculated by Lipper Inc.; used with permission. The Lipper median is the return of the fund that places in the middle of a Lipper peer group.
127
PACE Select Advisors Trust
PACE Small/Medium Co Value Equity Investments
Portfolio statistics (unaudited)
Characteristics | | 07/31/13 | |
Net assets (mm) | | $ | 486.6 | | |
Number of holdings | | | 186 | | |
Portfolio composition1 | | 07/31/13 | |
Common stocks | | | 94.7 | % | |
Investment company | | | 0.7 | | |
Cash equivalents and other assets less liabilities | | | 4.6 | | |
Total | | | 100.0 | % | |
Top five sectors1 | | 07/31/13 | |
Financials | | | 22.3 | % | |
Industrials | | | 19.7 | | |
Information technology | | | 15.0 | | |
Consumer discretionary | | | 14.6 | | |
Health care | | | 7.4 | | |
Total | | | 79.0 | % | |
Top ten equity holdings1 | | 07/31/13 | |
Eaton Vance Corp. | | | 1.7 | % | |
Jones Lang LaSalle, Inc. | | | 1.4 | | |
KAR Auction Services, Inc. | | | 1.4 | | |
Syntel, Inc. | | | 1.3 | | |
Jack Henry & Associates, Inc. | | | 1.2 | | |
EMCOR Group, Inc. | | | 1.1 | | |
Regions Financial Corp. | | | 1.1 | | |
First Cash Financial Services, Inc. | | | 1.1 | | |
FactSet Research Systems, Inc. | | | 1.0 | | |
Thor Industries, Inc. | | | 1.0 | | |
Total | | | 12.3 | % | |
1 Weightings represent percentages of the Portfolio's net assets as of July 31, 2013. The Portfolio is actively managed and its composition will vary over time.
128
PACE Select Advisors Trust
PACE Small/Medium Co Value Equity Investments
Portfolio of investments—July 31, 2013
| | | Number of
shares | | Value | |
Common stocks—94.72% | |
Air freight & logistics—0.74% | |
Expeditors International of
Washington, Inc. | | | 89,000 | | | $ | 3,588,480 | | |
Auto components—2.02% | |
Dana Holding Corp. | | | 117,000 | | | | 2,556,450 | | |
Lear Corp. | | | 16,275 | | | | 1,127,369 | | |
Stoneridge, Inc.* | | | 109,600 | | | | 1,323,968 | | |
TRW Automotive Holdings Corp.* | | | 19,150 | | | | 1,403,887 | | |
Visteon Corp.* | | | 51,650 | | | | 3,402,185 | | |
| | | | | | 9,813,859 | | |
Automobiles—0.98% | |
Thor Industries, Inc. | | | 88,600 | | | | 4,788,830 | | |
Biotechnology—0.30% | |
Myriad Genetics, Inc.*,1 | | | 49,200 | | | | 1,459,764 | | |
Capital markets—3.96% | |
Ares Capital Corp. | | | 129,700 | | | | 2,307,363 | | |
Cohen & Steers, Inc.1 | | | 56,200 | | | | 1,931,594 | | |
E*TRADE Financial Corp.* | | | 147,200 | | | | 2,193,280 | | |
Eaton Vance Corp. | | | 202,725 | | | | 8,204,281 | | |
Evercore Partners, Inc., Class A | | | 33,625 | | | | 1,594,498 | | |
Stifel Financial Corp.* | | | 80,250 | | | | 3,021,412 | | |
| | | | | | 19,252,428 | | |
Chemicals—0.49% | |
FutureFuel Corp. | | | 21,825 | | | | 344,617 | | |
Huntsman Corp. | | | 98,600 | | | | 1,776,772 | | |
Methanex Corp. | | | 5,800 | | | | 277,414 | | |
| | | | | | 2,398,803 | | |
Commercial banks—5.67% | |
Associated Banc-Corp | | | 151,450 | | | | 2,565,563 | | |
Cathay General Bancorp | | | 55,550 | | | | 1,319,868 | | |
Hancock Holding Co. | | | 89,000 | | | | 2,915,640 | | |
Huntington Bancshares, Inc. | | | 161,625 | | | | 1,381,894 | | |
KeyCorp | | | 243,600 | | | | 2,993,844 | | |
MB Financial, Inc. | | | 73,375 | | | | 2,111,732 | | |
Prosperity Bancshares, Inc. | | | 41,700 | | | | 2,461,134 | | |
Regions Financial Corp. | | | 544,075 | | | | 5,446,191 | | |
TCF Financial Corp. | | | 108,400 | | | | 1,652,016 | | |
Zions Bancorporation | | | 160,650 | | | | 4,761,666 | | |
| | | | | | 27,609,548 | | |
Commercial services & supplies—2.96% | |
ACCO Brands Corp.* | | | 140,550 | | | | 929,035 | | |
Avery Dennison Corp. | | | 17,675 | | | | 790,603 | | |
Herman Miller, Inc. | | | 58,500 | | | | 1,644,435 | | |
KAR Auction Services, Inc. | | | 264,020 | | | | 6,716,669 | | |
Multi-Color Corp. | | | 18,450 | | | | 638,555 | | |
Schawk, Inc. | | | 94,200 | | | | 1,298,076 | | |
United Stationers, Inc. | | | 57,650 | | | | 2,386,133 | | |
| | | | | | 14,403,506 | | |
| | | Number of
shares | | Value | |
Common stocks—(continued) | |
Communications equipment—1.44% | |
ADTRAN, Inc.1 | | | 104,100 | | | $ | 2,751,363 | | |
ARRIS Group, Inc.* | | | 88,875 | | | | 1,336,680 | | |
Finisar Corp.* | | | 88,000 | | | | 1,701,040 | | |
Plantronics, Inc. | | | 26,000 | | | | 1,208,740 | | |
| | | | | | 6,997,823 | | |
Computers & peripherals—0.32% | |
Avid Technology, Inc.* | | | 261,200 | | | | 1,556,752 | | |
Construction & engineering—2.75% | |
AECOM Technology Corp.* | | | 106,975 | | | | 3,626,453 | | |
Dycom Industries, Inc.* | | | 43,575 | | | | 1,153,866 | | |
EMCOR Group, Inc. | | | 133,955 | | | | 5,529,662 | | |
Pike Electric Corp. | | | 249,800 | | | | 3,050,058 | | |
| | | | | | 13,360,039 | | |
Construction materials—0.31% | |
Texas Industries, Inc.*,1 | | | 23,900 | | | | 1,485,146 | | |
Consumer finance—1.07% | |
First Cash Financial Services, Inc.* | | | 97,800 | | | | 5,222,520 | | |
Containers & packaging—1.38% | |
AptarGroup, Inc. | | | 40,400 | | | | 2,358,956 | | |
Graphic Packaging Holding Co.* | | | 385,500 | | | | 3,315,300 | | |
Greif, Inc., Class A | | | 19,150 | | | | 1,059,378 | | |
| | | | | | 6,733,634 | | |
Diversified telecommunication services—0.21% | |
General Communication, Inc., Class A* | | | 113,000 | | | | 1,000,050 | | |
Electric utilities—1.11% | |
Cleco Corp. | | | 62,625 | | | | 3,037,939 | | |
Westar Energy, Inc. | | | 70,300 | | | | 2,361,377 | | |
| | | | | | 5,399,316 | | |
Electrical equipment—0.47% | |
Generac Holdings, Inc.* | | | 52,375 | | | | 2,270,456 | | |
Electronic equipment, instruments & components—3.09% | |
Avnet, Inc. | | | 85,125 | | | | 3,206,659 | | |
Checkpoint Systems, Inc.* | | | 74,525 | | | | 1,281,830 | | |
Cognex Corp. | | | 63,800 | | | | 3,388,418 | | |
Jabil Circuit, Inc. | | | 172,100 | | | | 3,956,579 | | |
Vishay Intertechnology, Inc.* | | | 223,150 | | | | 3,211,128 | | |
| | | | | | 15,044,614 | | |
Energy equipment & services—3.61% | |
CARBO Ceramics, Inc.1 | | | 49,800 | | | | 4,375,428 | | |
Dresser-Rand Group, Inc.* | | | 63,000 | | | | 3,834,810 | | |
Exterran Holdings, Inc.* | | | 41,350 | | | | 1,312,862 | | |
Forum Energy Technologies, Inc.*,1 | | | 102,800 | | | | 2,968,864 | | |
Helix Energy Solutions Group, Inc.* | | | 107,840 | | | | 2,735,901 | | |
Parker Drilling Co.* | | | 169,425 | | | | 1,028,410 | | |
TETRA Technologies, Inc.* | | | 129,250 | | | | 1,308,010 | | |
| | | | | | 17,564,285 | | |
129
PACE Select Advisors Trust
PACE Small/Medium Co Value Equity Investments
Portfolio of investments—July 31, 2013
| | | Number of
shares | | Value | |
Common stocks—(continued) | |
Food & staples retailing—1.11% | |
Rite Aid Corp.* | | | 775,525 | | | $ | 2,326,575 | | |
SUPERVALU, Inc.*,1 | | | 229,950 | | | | 1,841,900 | | |
Village Super Market, Inc., Class A | | | 33,900 | | | | 1,249,215 | | |
| | | | | | 5,417,690 | | |
Food products—1.11% | |
Brooklyn Cheesecake & Deserts
Co., Inc.*,2 | | | 4,355 | | | | 871 | | |
Flowers Foods, Inc. | | | 105,600 | | | | 2,424,576 | | |
J&J Snack Foods Corp. | | | 20,350 | | | | 1,621,488 | | |
The J.M. Smucker Co. | | | 11,800 | | | | 1,327,736 | | |
| | | | | | 5,374,671 | | |
Gas utilities—0.98% | |
Questar Corp. | | | 200,000 | | | | 4,772,000 | | |
Health care equipment & supplies—0.93% | |
NuVasive, Inc.* | | | 88,250 | | | | 2,013,865 | | |
STERIS Corp. | | | 56,200 | | | | 2,530,124 | | |
| | | | | | 4,543,989 | | |
Health care providers & services—2.52% | |
AMN Healthcare Services, Inc.* | | | 171,350 | | | | 2,532,553 | | |
Centene Corp.* | | | 14,100 | | | | 782,127 | | |
Omnicare, Inc. | | | 64,375 | | | | 3,398,356 | | |
Owens & Minor, Inc. | | | 33,025 | | | | 1,187,579 | | |
Patterson Cos., Inc. | | | 107,000 | | | | 4,375,230 | | |
| | | | | | 12,275,845 | | |
Health care technology—0.97% | |
Computer Programs & Systems, Inc. | | | 69,400 | | | | 3,868,356 | | |
MedAssets, Inc.* | | | 39,575 | | | | 861,548 | | |
| | | | | | 4,729,904 | | |
Hotels, restaurants & leisure—0.97% | |
Bally Technologies, Inc.* | | | 12,750 | | | | 913,920 | | |
International Game Technology | | | 49,250 | | | | 909,648 | | |
Six Flags Entertainment Corp. | | | 78,500 | | | | 2,888,015 | | |
| | | | | | 4,711,583 | | |
Household durables—2.21% | |
Mohawk Industries, Inc.* | | | 16,225 | | | | 1,930,613 | | |
Newell Rubbermaid, Inc. | | | 28,750 | | | | 776,825 | | |
Taylor Morrison Home Corp., Class A* | | | 98,500 | | | | 2,386,655 | | |
The Ryland Group, Inc. | | | 88,075 | | | | 3,561,753 | | |
Whirlpool Corp. | | | 15,775 | | | | 2,112,903 | | |
| | | | | | 10,768,749 | | |
Household products—0.71% | |
WD-40 Co. | | | 59,700 | | | | 3,433,347 | | |
Independent power producers & energy traders—0.42% | |
NRG Energy, Inc. | | | 76,850 | | | | 2,061,117 | | |
Insurance—3.91% | |
HCC Insurance Holdings, Inc. | | | 69,575 | | | | 3,098,175 | | |
Horace Mann Educators Corp. | | | 46,000 | | | | 1,303,640 | | |
Lincoln National Corp. | | | 95,725 | | | | 3,988,861 | | |
| | | Number of
shares | | Value | |
Common stocks—(continued) | |
Insurance—(concluded) | |
RLI Corp. | | | 54,100 | | | $ | 4,465,414 | | |
StanCorp Financial Group, Inc. | | | 58,250 | | | | 3,092,492 | | |
Unum Group | | | 21,550 | | | | 681,842 | | |
Validus Holdings Ltd. | | | 67,400 | | | | 2,387,982 | | |
| | | | | | 19,018,406 | | |
Internet & catalog retail—0.22% | |
Orbitz Worldwide, Inc.* | | | 114,225 | | | | 1,052,012 | | |
Internet software & services—0.38% | |
Web.com Group, Inc.* | | | 71,525 | | | | 1,858,220 | | |
IT services—4.44% | |
Computer Services, Inc. | | | 79,000 | | | | 2,437,150 | | |
CoreLogic, Inc.* | | | 26,175 | | | | 730,282 | | |
DST Systems, Inc. | | | 21,300 | | | | 1,491,639 | | |
Fidelity National Information
Services, Inc. | | | 2,075 | | | | 89,557 | | |
Jack Henry & Associates, Inc. | | | 124,900 | | | | 6,032,670 | | |
Syntel, Inc. | | | 85,800 | | | | 6,158,724 | | |
VeriFone Systems, Inc.* | | | 245,500 | | | | 4,681,685 | | |
| | | | | | 21,621,707 | | |
Life sciences tools & services—2.36% | |
Bio-Rad Laboratories, Inc., Class A* | | | 25,000 | | | | 3,049,750 | | |
Charles River Laboratories
International, Inc.* | | | 40,300 | | | | 1,835,262 | | |
ICON PLC* | | | 61,325 | | | | 2,405,166 | | |
Waters Corp.* | | | 41,700 | | | | 4,209,198 | | |
| | | | | | 11,499,376 | | |
Machinery—5.83% | |
AGCO Corp. | | | 47,125 | | | | 2,650,781 | | |
Graco, Inc. | | | 57,100 | | | | 3,984,438 | | |
Harsco Corp. | | | 88,700 | | | | 2,284,912 | | |
IDEX Corp. | | | 65,250 | | | | 3,892,163 | | |
Lincoln Electric Holdings, Inc. | | | 58,400 | | | | 3,447,936 | | |
RBC Bearings, Inc.* | | | 56,000 | | | | 3,072,160 | | |
Terex Corp.* | | | 62,850 | | | | 1,852,818 | | |
Trinity Industries, Inc. | | | 117,250 | | | | 4,616,132 | | |
Wabtec Corp. | | | 44,000 | | | | 2,554,640 | | |
| | | | | | 28,355,980 | | |
Marine—0.53% | |
Kirby Corp.* | | | 30,700 | | | | 2,592,922 | | |
Media—0.48% | |
Gannett Co., Inc. | | | 54,375 | | | | 1,400,700 | | |
Nexstar Broadcasting Group, Inc.,
Class A | | | 26,250 | | | | 946,050 | | |
| | | | | | 2,346,750 | | |
Metals & mining—0.91% | |
Steel Dynamics, Inc. | | | 197,550 | | | | 3,073,878 | | |
Walter Energy, Inc.1 | | | 120,400 | | | | 1,347,276 | | |
| | | | | | 4,421,154 | | |
130
PACE Select Advisors Trust
PACE Small/Medium Co Value Equity Investments
Portfolio of investments—July 31, 2013
| | | Number of
shares | | Value | |
Common stocks—(continued) | |
Multi-utilities—1.17% | |
CMS Energy Corp. | | | 107,150 | | | $ | 2,999,129 | | |
NiSource, Inc. | | | 87,150 | | | | 2,677,248 | | |
| | | | | | 5,676,377 | | |
Oil, gas & consumable fuels—2.85% | |
Energen Corp. | | | 23,750 | | | | 1,422,387 | | |
Newfield Exploration Co.* | | | 108,525 | | | | 2,669,715 | | |
Oasis Petroleum, Inc.* | | | 61,500 | | | | 2,585,460 | | |
Peabody Energy Corp. | | | 113,225 | | | | 1,875,006 | | |
Tesoro Corp. | | | 23,850 | | | | 1,355,873 | | |
Whiting Petroleum Corp.* | | | 77,200 | | | | 3,973,484 | | |
| | | | | | 13,881,925 | | |
Pharmaceuticals—0.35% | |
Jazz Pharmaceuticals PLC* | | | 22,425 | | | | 1,693,312 | | |
Professional services—2.37% | |
Exponent, Inc. | | | 9,703 | | | | 641,562 | | |
Korn/Ferry International* | | | 105,700 | | | | 2,064,321 | | |
Manpowergroup, Inc. | | | 36,200 | | | | 2,420,694 | | |
Resources Connection, Inc. | | | 215,500 | | | | 2,866,150 | | |
Towers Watson & Co., Class A | | | 42,100 | | | | 3,546,083 | | |
| | | | | | 11,538,810 | | |
Real estate investment trusts—5.75% | |
BioMed Realty Trust, Inc. | | | 148,850 | | | | 3,075,241 | | |
Brandywine Realty Trust | | | 271,275 | | | | 3,781,574 | | |
CBL & Associates Properties, Inc. | | | 143,694 | | | | 3,271,913 | | |
CommonWealth REIT | | | 68,990 | | | | 1,591,599 | | |
Corrections Corp. of America | | | 29,445 | | | | 973,157 | | |
DuPont Fabros Technology, Inc.1 | | | 73,400 | | | | 1,681,594 | | |
EPR Properties | | | 81,000 | | | | 4,080,780 | | |
Kilroy Realty Corp. | | | 70,250 | | | | 3,676,885 | | |
Liberty Property Trust | | | 35,425 | | | | 1,353,589 | | |
NorthStar Realty Finance Corp. | | | 145,900 | | | | 1,429,820 | | |
Redwood Trust, Inc.1 | | | 179,500 | | | | 3,040,730 | | |
| | | | | | 27,956,882 | | |
Real estate management & development—1.44% | |
Jones Lang LaSalle, Inc. | | | 77,075 | | | | 7,016,137 | | |
Road & rail—2.16% | |
AMERCO* | | | 8,690 | | | | 1,445,321 | | |
Landstar System, Inc. | | | 88,000 | | | | 4,757,280 | | |
Ryder System, Inc. | | | 20,100 | | | | 1,242,984 | | |
Swift Transportation Co.* | | | 171,625 | | | | 3,061,790 | | |
| | | | | | 10,507,375 | | |
Semiconductors & semiconductor equipment—3.40% | |
ATMI, Inc.* | | | 61,800 | | | | 1,535,730 | | |
International Rectifier Corp.* | | | 104,900 | | | | 2,529,139 | | |
Lam Research Corp.* | | | 25,100 | | | | 1,235,422 | | |
Linear Technology Corp. | | | 93,400 | | | | 3,788,304 | | |
Micron Technology, Inc.* | | | 78,025 | | | | 1,033,831 | | |
NXP Semiconductor NV* | | | 102,275 | | | | 3,339,279 | | |
Skyworks Solutions, Inc.* | | | 128,275 | | | | 3,081,165 | | |
| | | | | | 16,542,870 | | |
| | | Number of
shares | | Value | |
Common stocks—(concluded) | |
Software—1.95% | |
AVG Technologies NV*,1 | | | 63,550 | | | $ | 1,417,165 | | |
FactSet Research Systems, Inc.1 | | | 44,400 | | | | 4,847,592 | | |
Informatica Corp.* | | | 84,200 | | | | 3,213,914 | | |
| | | | | | 9,478,671 | | |
Specialty retail—5.99% | |
Abercrombie & Fitch Co., Class A | | | 73,000 | | | | 3,640,510 | | |
Advance Auto Parts, Inc. | | | 39,800 | | | | 3,283,102 | | |
Aeropostale, Inc.* | | | 110,000 | | | | 1,664,300 | | |
Ascena Retail Group, Inc.* | | | 179,500 | | | | 3,426,655 | | |
Chico's FAS, Inc. | | | 181,100 | | | | 3,102,243 | | |
DSW, Inc., Class A | | | 22,550 | | | | 1,709,065 | | |
Group 1 Automotive, Inc. | | | 30,500 | | | | 2,220,095 | | |
Guess?, Inc. | | | 29,400 | | | | 990,192 | | |
OfficeMax, Inc.1 | | | 354,750 | | | | 4,040,602 | | |
Penske Automotive Group, Inc. | | | 21,500 | | | | 799,370 | | |
Ross Stores, Inc. | | | 52,200 | | | | 3,521,934 | | |
The Children's Place Retail Stores, Inc.* | | | 13,650 | | | | 737,646 | | |
| | | | | | 29,135,714 | | |
Textiles, apparel & luxury goods—1.04% | |
Iconix Brand Group, Inc.* | | | 51,300 | | | | 1,684,692 | | |
The Jones Group Inc. | | | 205,500 | | | | 3,374,310 | | |
| | | | | | 5,059,002 | | |
Thrifts & mortgage finance—0.67% | |
EverBank Financial Corp. | | | 69,625 | | | | 1,080,580 | | |
Nationstar Mortgage Holdings, Inc.*,1 | | | 47,575 | | | | 2,201,771 | | |
| | | | | | 3,282,351 | | |
Trading companies & distributors—1.71% | |
AerCap Holdings NV* | | | 201,800 | | | | 3,535,536 | | |
MSC Industrial Direct Co, Inc. | | | 58,900 | | | | 4,767,955 | | |
| | | | | | 8,303,491 | | |
Total common stocks
(cost—$383,701,548) | | | | | 460,878,192 | | |
Investment company—0.71% | |
iShares Russell 2000 Value ETF
(cost—$3,491,271)1 | | | 38,000 | | | | 3,457,240 | | |
| | | Face
amount | | | |
Repurchase agreement—5.56% | |
Repurchase agreement dated
07/31/13 with State Street Bank
and Trust Co., 0.010% due 08/01/13,
collateralized by $1,181,757
Federal Home Loan Mortgage Corp.
obligations, 1.960% due 11/07/22,
$27,241,872 Federal National
Mortgage Association obligations,
2.140% to 2.170% due 11/07/22
and $895,783 US Treasury Notes,
0.250% to 0.750% due 10/31/13 to
12/15/13; (value—$27,571,929);
proceeds: $27,031,008
(cost—$27,031,000) | | $ | 27,031,000 | | | | 27,031,000 | | |
131
PACE Select Advisors Trust
PACE Small/Medium Co Value Equity Investments
Portfolio of investments—July 31, 2013
| | | Number of
shares | | Value | |
Investment of cash collateral from securities loaned—6.24% | |
Money market fund—6.24% | |
UBS Private Money Market Fund LLC3
(cost—$30,367,763) | | | 30,367,763 | | | $ | 30,367,763 | | |
Total investments
(cost—$444,591,582)—107.23% | | | | | 521,734,195 | | |
Liabilities in excess of
other assets—(7.23)% | | | | | (35,174,209 | ) | |
Net assets—100.00% | | | | $ | 486,559,986 | | |
For a listing of defined portfolio acronyms that are used throughout the Portfolio of investments as well as the tables that follow, please refer to page 218.
Aggregate cost for federal income tax purposes was $445,560,956; and net unrealized appreciation consisted of:
Gross unrealized appreciation | | $ | 83,099,919 | | |
Gross unrealized depreciation | | | (6,926,680 | ) | |
Net unrealized appreciation | | $ | 76,173,239 | | |
Fair valuation summary
The following is a summary of the fair valuations according to the inputs used as of July 31, 2013 in valuing the Portfolio's investments:
| | | Unadjusted
quoted prices in
active markets for
identical investments
(Level 1) | | Other significant
observable inputs
(Level 2) | | Unobservable
inputs
(Level 3) | | Total | |
Common stocks | | $ | 460,877,321 | | | $ | — | | | $ | 871 | | | $ | 460,878,192 | | |
Investment company | | | 3,457,240 | | | | — | | | | — | | | | 3,457,240 | | |
Repurchase agreement | | | — | | | | 27,031,000 | | | | — | | | | 27,031,000 | | |
Investment of cash collateral from securities loaned | | | — | | | | 30,367,763 | | | | — | | | | 30,367,763 | | |
Total | | $ | 464,334,561 | | | $ | 57,398,763 | | | $ | 871 | | | $ | 521,734,195 | | |
At July 31, 2013, there were no transfers between Level 1 and Level 2.
The following is a rollforward of the Portfolio's investment that was valued using unobservable inputs (Level 3) for the year ended July 31, 2013:
| | | Common
stock | |
Beginning balance | | $ | — | | |
Purchases | | | — | | |
Sales | | | — | | |
Accrued discounts/(premiums) | | | — | | |
Total realized gain/(loss) | | | — | | |
Net change in unrealized appreciation/depreciation | | | — | | |
Transfers into Level 3 | | | 871 | | |
Transfers out of Level 3 | | | — | | |
Ending balance | | $ | 871 | | |
The change in net unrealized appreciation/depreciation relating to the Level 3 investment held at July 31, 2013 was $10,105. Transfer into Level 3 represents the value at the end of the year. At July 31, 2013, one security was transferred from Level 2 to Level 3 as the valuation was based primarily on unobservable inputs.
132
PACE Select Advisors Trust
PACE Small/Medium Co Value Equity Investments
Portfolio of investments—July 31, 2013
Issuer breakdown by country or territory of origin (unaudited)
| | | Percentage of
total investments | |
United States | | | 97.1 | % | |
Netherlands | | | 1.6 | | |
Ireland | | | 0.8 | | |
Bermuda | | | 0.4 | | |
Canada | | | 0.1 | | |
Total | | | 100.0 | % | |
Portfolio footnotes
* Non-income producing security.
1 Security, or portion thereof, was on loan at July 31, 2013.
2 Illiquid investment representing 0.00% of net assets as of July 31, 2013.
3 The table below details the Portfolio's transaction activity in an affiliated issuer during the year ended July 31, 2013. The investment manager earns a management fee from UBS Private Money Market Fund LLC. Please see the Notes to financial statements for further information.
Security description | | Value at
07/31/12 | | Purchases
during the
year ended
07/31/13 | | Sales
during the
year ended
07/31/13 | | Value at
07/31/13 | | Net income
earned from
affiliate for the
year ended
07/31/13 | |
UBS Private Money Market Fund LLC | | $ | 12,446,836 | | | $ | 198,748,169 | | | $ | 180,827,242 | | | $ | 30,367,763 | | | $ | 3,634 | | |
See accompanying notes to financial statements.
133
PACE Select Advisors Trust
PACE Small/Medium Co Growth Equity Investments
Performance
For the 12 months ended July 31, 2013, the Portfolio's Class P shares returned 32.57% before the deduction of the maximum PACE Select program fee. (Class P shares returned 29.94% after the deduction of the maximum PACE Select program fee for the same 12-month period.) In comparison, the Russell 2500 Growth Index (the "benchmark") returned 34.55%, and the Lipper Small-Cap Growth Funds category posted a median return of 32.56%. (Returns for all share classes over various time periods are shown in the "Performance at a glance" table on page 138. Please note that the returns shown do not reflect the deduction of taxes that a shareholder would pay on Portfolio distributions or the redemption of Portfolio shares.) For a detailed commentary on the market environment in general during the reporting period, please refer to page 2.
Sub-Advisor's comments1
Copper Rock
Our portion of the Portfolio outperformed the benchmark during the reporting period, driven by positive individual stock selection. Throughout the reporting period, we generally saw a return to a more normal market where stocks with good fundamental and earnings that exceeded Wall Street expectations were rewarded. In particular, stock selection within the financials, information technology and energy sectors drove our portion of the Portfolio's outperformance. Significant contributors from the financials sector included MarketAxess Holdings, Affiliated Managers Group, Inc. and Portfolio Recovery Associates, Inc. MarketAxess Holdings, Inc., which operates as a leading electronic trading platform, reported strong results, as its revenues and earnings exceeded expectations in conjunction with a strategic alliance with BlackRock that was well received in the marketplace. Subsequent to the earnings report, the company continued to register market share gains in its monthly volume statistics. We saw good investment performance across global asset management company Affiliated Managers Group Inc., a complex of high quality, investment management boutiques, which led to strong flows during the reporting period. In addition, the company made some acquisitions during the 12 months, which helped drive earnings higher. Long-term holding, Portfolio Recovery Associates, Inc., a debt collections company, reported strong quarterly results in the first quarter of 2013. The company has maintained excellent cash collections, coupled with debt purchases that continue to push Wall Street estimates higher. Fundamentals in the industry and execution at the company remain very strong. Elsewhere, information technology company, IPG Photonics, Inc., which develops high performance fiber lasers for materials processing and advanced technologies, delivered a strong outlook during the first quarter of 2013, which helped its stock's performance. This remains a very strong secular growth story within the laser industry, as fiber lasers
PACE Select Advisors Trust – PACE Small/Medium Co Growth Equity Investments
Investment Sub-Advisors:
Copper Rock Capital Partners, LLC ("Copper Rock"), Riverbridge Partners, LLC ("Riverbridge"), and Palisade Capital Management, L.L.C. ("Palisade")
Portfolio Managers:
Copper Rock: Tucker Walsh;
Riverbridge: Mark Thompson;
Palisade: Sammy Oh
Objective:
Capital appreciation
Investment process:
Copper Rock employs a fundamental, bottom-up investment approach that focuses on identifying emerging companies that exhibit the potential for strong and sustainable revenue growth over each of the following two years. Copper Rock utilizes a "pure" growth investment style that emphasizes growth and momentum characteristics. Copper Rock attempts to manage risk by diversifying and understanding its holdings and employing a stringent sell discipline.
1 All Sub-Advisors discuss performance on a gross of fees basis—meaning that no fees or expenses are reflected in their sleeves'/sleeve's performance. Alternately, Portfolio performance is shown net of fees, which does factor in fees and expenses associated with the Portfolio.
134
PACE Select Advisors Trust
PACE Small/Medium Co Growth Equity Investments
Sub-Advisor's comments – continued
provide cost and efficiency advantages over existing cutting and welding tools. However, we sold out of our position in IPG Photonics, Inc. in January, as the stock had essentially reached our price target.
There was some modest relative underperformance from stock selection within the consumer discretionary and consumer staples sectors. Individual detractors from each sector included Zumiez, Inc. and Elizabeth Arden, Inc., respectively. We saw Zumiez begin to underperform, as comparisons to prior periods started to slow in July 2013. At the same time, as sales began to moderate in the summer of 2012, the Chief Financial Officer departed and we exited our position in Zumiez. We also exited our position in Elizabeth Arden, Inc., a global beauty products company, after it reported quarterly earnings in January 2013 and missed the previously stated outlook by a wide margin. The weakness in the business was across multiple channels and involved slower-than-anticipated retail sales and delays in the re-launch of the Elizabeth Arden brand. These factors coupled with a lack of visibility on future prospects caused us to exit our position in the global beauty products company.
Derivatives were not used during the reporting period.
Riverbridge Partners
Our portion of the Portfolio slightly underperformed the benchmark during the reporting period. Historically, we perform the best on a relative basis during periods in which the equity markets struggle. Considering the continued strength of the US equity markets during the reporting period, our investment results for the fiscal year were as expected.
Our positions in healthcare, traditionally one of our largest weighted sectors, detracted from performance during the fiscal year. In particular, Greenway Medical Technologies struggled due to concerns over a drop in demand and the company's transition to a new billing model, which reduced its short-term financial outlook. We continue to hold our position in Greenway Medical Technologies, as we believe that the long-term fundamentals of the business remain intact. Stock selection in the consumer staples sector also detracted from the performance of our portion of the Portfolio.
The sector that was the most beneficial for performance was financials. We focus on identifying niche companies within the sector that are providing a differentiated service. Unlike traditional financial institutions, these types of companies provide a greater barrier to entry and higher returns on invested capital, while utilizing significantly less debt. The financial stocks we hold positions in that performed particularly well included Portfolio Recovery Associates and Financial Engines. Our consumer discretionary holdings, particularly Grand Canyon Education, also performed well.
Derivatives were not used during the reporting period.
Investment process (concluded)
Riverbridge believes that earnings power determines the value of a franchise. Riverbridge focuses on companies that are viewed as building their earnings power and building the intrinsic value of the company over long periods of time. Riverbridge looks to invest in high-quality growth companies that demonstrate the ability to sustain strong secular earnings growth, regardless of overall economic conditions.
Palisade seeks fundamentally strong and dynamic small- and mid-cap companies that are trading at a discount to their growth rates. Palisade's goal is to ascertain a dynamic of change before it manifests in consensus estimates. Palisade believes that the small- and mid-cap market is inherently less efficient than the large-cap market, and attempts to gain an information advantage through fundamental research.
135
PACE Select Advisors Trust
PACE Small/Medium Co Growth Equity Investments
Sub-Advisor's comments – concluded
Palisade
Our portion of the Portfolio underperformed the benchmark during the reporting period. Our worst relative performing sectors were industrials, energy and consumer staples. Cash also proved to be a significant drag on performance, due to strong overall market performance. Our best relative performing sectors were financials, healthcare and materials.
Within industrials, Acacia Research Corporation, an intellectual property company, underperformed the benchmark, as investors have become wary of its unpredictable business model. However, we remain confident in the growing value of the company's patent portfolio. Other underperformance in the industrials sector was mainly due to our lack of exposure to certain areas, such as airlines and housing related stocks. Our underperformance in energy and consumer staples was also due to poor relative stock selection in those areas, as we failed to own some of the best-performing stocks.
On the positive side, we had good stock selection in financials, healthcare and materials. Within financials, strong performance from Affiliated Managers Group and Financial Engines, coupled with our underexposure to real estate investment trusts (REITs), aided relative performance. Within healthcare, Dexcom, Onyx and Health Management Associates performed well. Onyx and Health Management Associates are currently in active discussions to be acquired. US Silica was the best performer in materials and was sold as it reached our price target.
Despite our underperformance during the reporting period, we remain confident in the companies we hold in our portion of the Portfolio and in our ability to identify dynamic growth companies. The market has been mainly sentiment-and liquidity-driven, but as focus turns back to company fundamentals, we believe that our portion of the Portfolio will prosper.
Derivatives were not used during the reporting period.
Special considerations
The Portfolio may be appropriate for long-term investors seeking capital appreciation who are able to withstand short-term fluctuations in the equity markets in return for potentially higher returns over the long term. The value of the Portfolio changes every day and can be affected by changes in interest rates, general market conditions and other political, social and economic developments, as well as specific matters relating to the companies in whose securities the Portfolio invests. It is important to note that an investment in the Portfolio is only one component of a balanced investment plan. In addition, small- and mid-cap companies are typically subject to a greater degree of change in earnings and business prospects than are larger, more established companies. Therefore, they are considered to have a higher level of volatility and risk. Also, to the extent the Portfolio invests a large portion of its assets in a particular sector, the Portfolio may experience greater volatility and risk of loss due to unfavorable developments in that sector.
136
PACE Select Advisors Trust
PACE Small/Medium Co Growth Equity Investments
Illustration of an assumed investment of $10,000 in Class P shares of the Portfolio (unaudited)
The following graph depicts the performance of PACE Small/Medium Co Growth Equity Investments Class P shares versus the Russell 2500 Growth Index over the 10 years ended July 31, 2013. The performance of the other classes will vary based upon the different class specific expenses and sales charges. The performance provided does not reflect the deduction of taxes that a shareholder would pay on Portfolio distributions or the redemption of Portfolio shares. Past performance is no guarantee of future results. Share price and returns will vary with market conditions; investors may realize a gain or loss upon redemption. It is important to note that PACE Small/Medium Co Growth Equity Investments is a professionally managed portfolio while the Index is not available for investment and is unmanaged. The comparison is shown for illustration purposes only.
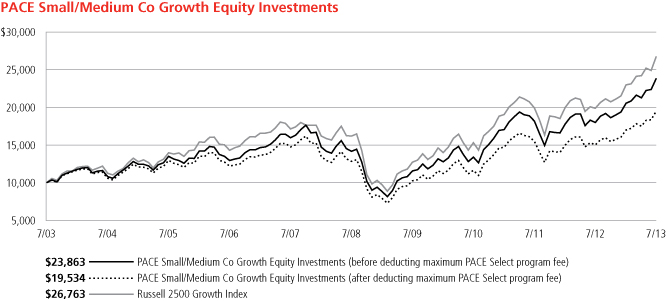
137
PACE Select Advisors Trust
PACE Small/Medium Co Growth Equity Investments
Performance at a glance (unaudited)
Average annual total returns for periods ended 07/31/13 | | 1 year | | 5 years | | 10 years | |
Before deducting maximum sales charge or PACE Select program fee | |
Class A1 | | | 32.44 | % | | | 10.78 | % | | | 8.88 | % | |
Class C2 | | | 31.42 | % | | | 9.92 | % | | | 8.03 | % | |
Class Y3 | | | 32.55 | % | | | 11.01 | % | | | 9.20 | % | |
Class P4 | | | 32.57 | % | | | 10.98 | % | | | 9.09 | % | |
After deducting maximum sales charge or PACE Select program fee | |
Class A1 | | | 25.13 | % | | | 9.53 | % | | | 8.27 | % | |
Class C2 | | | 30.42 | % | | | 9.92 | % | | | 8.03 | % | |
Class P4 | | | 29.94 | % | | | 8.78 | % | | | 6.93 | % | |
Russell 2500 Growth Index5 | | | 34.55 | % | | | 10.59 | % | | | 10.35 | % | |
Lipper Small-Cap Growth Funds median | | | 32.56 | % | | | 10.05 | % | | | 9.35 | % | |
Average annual total returns for periods ended June 30, 2013, after deduction of the maximum sales charge or PACE Select program fee, were as follows: Class A—1-year period, 15.44%; 5-year period, 7.61%; 10-year period, 7.95%; Class C—1-year period, 20.20%; 5-year period, 8.00%; 10-year period, 7.72%; Class Y—1-year period, 22.36%; 5-year period, 9.07%; 10-year period, 8.89%; Class P—1-year period, 19.91%; 5-year period, 6.88%; 10-year period, 6.62%.
The annualized gross and net expense ratios, respectively, for each class of shares as in the November 28, 2012 prospectuses, were as follows: Class A—1.30% and 1.30%; Class C—2.05% and 2.05%; Class Y—1.25% and 1.13%; and Class P—1.18% and 1.13%. Net expenses reflect fee waivers and/or expense reimbursements, if any, pursuant to an agreement that is in effect to cap the expenses. The Portfolio and UBS Global Asset Management (Americas) Inc. ("UBS Global AM") have entered into a written fee waiver/expense reimbursement agreement pursuant to which UBS Global AM is contractually obligated to waive its management fees and/or reimburse expenses so that the Portfolio's ordinary total operating expenses of each class through November 30, 2013 (excluding dividend expense, borrowing costs, and interest expense relating to short sales, and expenses attributable to investment in other investment companies, interest, taxes, brokerage commissions and extraordinary expenses) would not exceed Class A—1.38%; Class C—2.13%; Class Y—1.13%; and Class P—1.13%. The Portfolio has agreed to repay UBS Global AM for any waived fees/reimbursed expenses to the extent that it can do so over the following three fiscal years without causing the Portfolio's expenses in any of those three years to exceed these expense caps. The fee waiver/expense reimbursement agreement may be terminated by the Portfolio's board at any time and also will terminate automatically upon the expiration or termination of the Portfolio's advisory contract with UBS Global AM. Upon termination of the agreement, however, UBS Global AM's three year recoupment rights will survive.
1 Maximum sales charge for Class A shares is 5.5%. Class A shares bear ongoing 12b-1 service fees.
2 Maximum contingent deferred sales charge for Class C shares is 1% imposed on redemptions and is reduced to 0% after one year. Class C shares bear ongoing 12b-1 service and distribution fees. Prior to September 30, 2003, Class C shares were subject to a maximum front-end sales charge of 1%; this front-end sales charge is not reflected in the average annual total returns presented for the Class C shares shown above.
3 The Portfolio offers Class Y shares to a limited group of eligible investors, including certain qualifying retirement plans. Class Y shares do not bear initial or contingent deferred sales charges or ongoing 12b-1 service and distribution fees.
4 Class P shares do not bear initial or contingent deferred sales charges or ongoing 12b-1 service and distribution fees, but are subject to a maximum annual PACE Select program fee of 2% of the value of Class P shares. Prior to June 14, 2010, the maximum annual PACE Select program fee was 1.5% of the value of Class P shares; however, the current maximum annual PACE Select program fee of 2% is reflected in the performance returns throughout all periods in the average annual total returns presented for the Class P shares shown above.
5 The Russell 2500 Growth Index measures the performance of the small to mid-cap growth segment of the US equity universe. It includes those Russell 2500 Index companies with higher price-to-book ratios and higher forecasted growth values. The Russell 2500 Growth Index is constructed to provide a comprehensive and unbiased barometer of the small to mid-cap growth market. The Index is completely reconstituted annually to ensure larger stocks do not distort the performance and characteristics of the true small to mid-cap opportunity set and that the represented companies continue to reflect growth characteristics. Investors should note that indices do not reflect the deduction of fees and expenses.
If an investor sells or exchanges shares less than 90 days after purchase, a redemption fee of 1.00% of the amount sold or exchanged will be deducted at the time of the transaction, except as noted otherwise in the prospectuses.
Past performance does not predict future performance, and the performance information provided does not reflect the deduction of taxes that a shareholder would pay on Portfolio distributions or the redemption of Portfolio shares. The return and principal value of an investment will fluctuate, so that an investor's shares, when redeemed, may be worth more or less than their original cost. Performance results assume reinvestment of all dividends and capital gain distributions at net asset value on the ex-dividend dates. Current performance may be higher or lower than the performance data quoted. For month-end performance figures, please visit http://globalam-us.ubs.com/corpweb/performance.do.
Lipper peer group data calculated by Lipper Inc.; used with permission. The Lipper median is the return of the fund that places in the middle of a Lipper peer group.
138
PACE Select Advisors Trust
PACE Small/Medium Co Growth Equity Investments
Portfolio statistics (unaudited)
Characteristics | | 07/31/13 | |
Net assets (mm) | | $ | 503.4 | | |
Number of holdings | | | 205 | | |
Portfolio composition1 | | 07/31/13 | |
Common stocks | | | 98.2 | % | |
Investment companies | | | 0.3 | | |
Cash equivalents and other assets less liabilities | | | 1.5 | | |
Total | | | 100.0 | % | |
Top five sectors1 | | 07/31/13 | |
Information technology | | | 26.8 | % | |
Consumer discretionary | | | 19.5 | | |
Industrials | | | 19.1 | | |
Health care | | | 16.3 | | |
Financials | | | 7.1 | | |
Total | | | 88.8 | % | |
Top ten equity holdings1 | | 07/31/13 | |
Ultimate Software Group, Inc. | | | 1.8 | % | |
CoStar Group, Inc. | | | 1.6 | | |
Beacon Roofing Supply, Inc. | | | 1.4 | | |
Affiliated Managers Group, Inc. | | | 1.2 | | |
Polaris Industries, Inc. | | | 1.1 | | |
Portfolio Recovery Associates, Inc. | | | 1.0 | | |
Synchronoss Technologies, Inc. | | | 1.0 | | |
Financial Engines, Inc. | | | 1.0 | | |
The Hain Celestial Group, Inc. | | | 1.0 | | |
Semtech Corp. | | | 0.9 | | |
Total | | | 12.0 | % | |
1 Weightings represent percentages of the Portfolio's net assets as of July 31, 2013. The Portfolio is actively managed and its composition will vary over time.
139
PACE Select Advisors Trust
PACE Small/Medium Co Growth Equity Investments
Portfolio of investments—July 31, 2013
| | | Number of
shares | | Value | |
Common stocks—98.18% | |
Aerospace & defense—2.36% | |
BE Aerospace, Inc.* | | | 57,806 | | | $ | 4,029,656 | | |
Hexcel Corp.* | | | 77,810 | | | | 2,739,690 | | |
TransDigm Group, Inc. | | | 14,099 | | | | 2,038,575 | | |
Triumph Group, Inc. | | | 39,320 | | | | 3,085,047 | | |
| | | | 11,892,968 | | |
Air freight & logistics—0.83% | |
Forward Air Corp. | | | 32,580 | | | | 1,191,451 | | |
Hub Group, Inc., Class A* | | | 77,600 | | | | 2,968,200 | | |
| | | | 4,159,651 | | |
Airlines—0.23% | |
Spirit Airlines, Inc.* | | | 35,861 | | | | 1,185,206 | | |
Auto components—0.79% | |
Gentex Corp. | | | 102,857 | | | | 2,322,511 | | |
Tenneco, Inc.* | | | 34,377 | | | | 1,661,440 | | |
| | | | 3,983,951 | | |
Biotechnology—2.40% | |
Ariad Pharmaceuticals, Inc.* | | | 80,930 | | | | 1,503,679 | | |
Cepheid, Inc.* | | | 103,472 | | | | 3,608,069 | | |
Medivation, Inc.* | | | 44,850 | | | | 2,595,470 | | |
Onyx Pharmaceuticals, Inc.* | | | 33,145 | | | | 4,351,938 | | |
| | | | 12,059,156 | | |
Building products—0.25% | |
A.O. Smith Corp. | | | 30,758 | | | | 1,270,921 | | |
Capital markets—3.16% | |
Affiliated Managers Group, Inc.* | | | 33,697 | | | | 6,077,254 | | |
Financial Engines, Inc. | | | 102,740 | | | | 4,904,808 | | |
HFF, Inc., Class A | | | 57,150 | | | | 1,200,150 | | |
Lazard Ltd., Class A | | | 62,205 | | | | 2,261,774 | | |
WisdomTree Investments, Inc.* | | | 112,231 | | | | 1,453,391 | | |
| | | | 15,897,377 | | |
Chemicals—2.18% | |
Axiall Corp. | | | 38,540 | | | | 1,698,843 | | |
Balchem Corp. | | | 26,388 | | | | 1,313,067 | | |
FMC Corp. | | | 58,529 | | | | 3,872,279 | | |
H.B. Fuller Co. | | | 101,752 | | | | 4,085,343 | | |
| | | | 10,969,532 | | |
Commercial banks—0.93% | |
PrivateBancorp, Inc. | | | 77,303 | | | | 1,823,578 | | |
Signature Bank* | | | 31,182 | | | | 2,854,712 | | |
| | | | 4,678,290 | | |
Commercial services & supplies—4.90% | |
Clean Harbors, Inc.* | | | 60,560 | | | | 3,418,006 | | |
CyrusOne, Inc. | | | 96,327 | | | | 1,960,255 | | |
Innerworkings, Inc.* | | | 130,105 | | | | 1,519,626 | | |
Mobile Mini, Inc.* | | | 88,815 | | | | 3,065,006 | | |
Portfolio Recovery Associates, Inc.* | | | 34,400 | | | | 5,136,264 | | |
Ritchie Brothers Auctioneers, Inc.1 | | | 136,348 | | | | 2,624,699 | | |
Rollins, Inc. | | | 143,150 | | | | 3,650,325 | | |
| | | Number of
shares | | Value | |
Common stocks—(continued) | |
Commercial services & supplies—(concluded) | |
Waste Connections, Inc. | | | 76,020 | | | $ | 3,288,625 | | |
| | | | 24,662,806 | | |
Communications equipment—0.70% | |
Digi International, Inc.* | | | 132,070 | | | | 1,311,455 | | |
Palo Alto Networks, Inc.* | | | 45,550 | | | | 2,229,217 | | |
| | | | 3,540,672 | | |
Computers & peripherals—0.57% | |
Stratasys Ltd.*,1 | | | 23,620 | | | | 2,093,913 | | |
Synaptics, Inc.* | | | 19,062 | | | | 762,480 | | |
| | | | 2,856,393 | | |
Consumer finance—0.63% | |
Encore Capital Group, Inc.*,1 | | | 39,974 | | | | 1,553,390 | | |
First Cash Financial Services, Inc.* | | | 30,165 | | | | 1,610,811 | | |
| | | | 3,164,201 | | |
Distributors—1.09% | |
LKQ Corp.* | | | 131,893 | | | | 3,438,451 | | |
Pool Corp. | | | 39,036 | | | | 2,060,320 | | |
| | | | 5,498,771 | | |
Diversified consumer services—1.96% | |
Bright Horizons Family Solutions, Inc.* | | | 48,690 | | | | 1,724,113 | | |
Grand Canyon Education, Inc.* | | | 123,070 | | | | 4,162,227 | | |
K12, Inc.*,1 | | | 80,125 | | | | 2,491,888 | | |
Outerwall, Inc.*,1 | | | 27,260 | | | | 1,506,115 | | |
| | | | 9,884,343 | | |
Diversified financial services—0.68% | |
CBOE Holdings, Inc. | | | 36,825 | | | | 1,844,932 | | |
MarketAxess Holdings, Inc. | | | 30,178 | | | | 1,560,203 | | |
| | | | 3,405,135 | | |
Diversified telecommunication services—0.24% | |
Cogent Communications Group, Inc. | | | 43,009 | | | | 1,230,918 | | |
Electronic equipment, instruments & components—2.16% | |
Belden, Inc. | | | 35,720 | | | | 2,093,549 | | |
Coherent, Inc. | | | 50,759 | | | | 2,877,020 | | |
FEI Co. | | | 26,112 | | | | 2,022,374 | | |
National Instruments Corp. | | | 138,360 | | | | 3,900,369 | | |
| | | | 10,893,312 | | |
Energy equipment & services—1.49% | |
Core Laboratories N.V. | | | 8,303 | | | | 1,242,129 | | |
Dril-Quip, Inc.* | | | 9,388 | | | | 853,463 | | |
Exterran Holdings, Inc.* | | | 38,268 | | | | 1,215,009 | | |
Oceaneering International, Inc. | | | 26,250 | | | | 2,128,612 | | |
Rowan Cos., PLC, Class A* | | | 60,450 | | | | 2,076,458 | | |
| | | | 7,515,671 | | |
Food & staples retailing—1.05% | |
The Fresh Market, Inc.* | | | 35,341 | | | | 1,865,298 | | |
United Natural Foods, Inc.* | | | 58,388 | | | | 3,421,537 | | |
| | | | 5,286,835 | | |
140
PACE Select Advisors Trust
PACE Small/Medium Co Growth Equity Investments
Portfolio of investments—July 31, 2013
| | | Number of
shares | | Value | |
Common stocks—(continued) | |
Food products—1.31% | |
Snyders-Lance, Inc. | | | 56,943 | | | $ | 1,802,246 | | |
The Hain Celestial Group, Inc.* | | | 65,759 | | | | 4,797,777 | | |
| | | | 6,600,023 | | |
Health care equipment & supplies—5.16% | |
Abaxis, Inc. | | | 50,778 | | | | 2,137,754 | | |
Align Technology, Inc.* | | | 26,437 | | | | 1,137,848 | | |
Cyberonics, Inc.* | | | 28,985 | | | | 1,506,930 | | |
DexCom, Inc.* | | | 210,024 | | | | 4,574,323 | | |
Endologix, Inc.* | | | 195,454 | | | | 3,054,946 | | |
Neogen Corp.* | | | 53,535 | | | | 3,023,657 | | |
Sirona Dental Systems, Inc.* | | | 36,604 | | | | 2,584,242 | | |
The Cooper Cos., Inc. | | | 25,736 | | | | 3,277,480 | | |
Thoratec Corp.* | | | 80,770 | | | | 2,648,448 | | |
West Pharmaceutical Services, Inc. | | | 27,402 | | | | 2,021,172 | | |
| | | | 25,966,800 | | |
Health care providers & services—6.19% | |
Acadia Healthcare Co., Inc.* | | | 107,190 | | | | 3,952,095 | | |
Bio-Reference Laboratories, Inc.*,1 | | | 79,679 | | | | 2,131,413 | | |
Chemed Corp.1 | | | 47,390 | | | | 3,345,260 | | |
ExamWorks Group, Inc.* | | | 42,157 | | | | 1,023,572 | | |
Health Management Associates, Inc.,
Class A* | | | 137,715 | | | | 1,856,398 | | |
HMS Holdings Corp.* | | | 69,730 | | | | 1,686,769 | | |
IPC The Hospitalist Co.* | | | 65,994 | | | | 3,324,118 | | |
Magellan Health Services, Inc.* | | | 60,175 | | | | 3,439,001 | | |
MEDNAX, Inc.* | | | 35,150 | | | | 3,424,313 | | |
MWI Veterinary Supply, Inc.* | | | 19,322 | | | | 2,747,009 | | |
Team Health Holdings, Inc.* | | | 34,445 | | | | 1,385,378 | | |
WellCare Health Plans, Inc.* | | | 46,240 | | | | 2,822,027 | | |
| | | | 31,137,353 | | |
Health care technology—0.98% | |
Athenahealth, Inc.*,1 | | | 32,048 | | | | 3,587,773 | | |
Greenway Medical Technologies, Inc.* | | | 116,870 | | | | 1,352,186 | | |
| | | | 4,939,959 | | |
Hotels, restaurants & leisure—4.15% | |
Bally Technologies, Inc.* | | | 47,160 | | | | 3,380,429 | | |
Buffalo Wild Wings, Inc.* | | | 15,257 | | | | 1,580,320 | | |
Papa John's International, Inc.* | | | 32,919 | | | | 2,200,964 | | |
Penn National Gaming, Inc.* | | | 33,470 | | | | 1,673,165 | | |
Red Robin Gourmet Burgers, Inc.* | | | 55,805 | | | | 3,174,188 | | |
Sonic Corp.* | | | 123,912 | | | | 1,904,528 | | |
The Cheesecake Factory, Inc. | | | 97,535 | | | | 4,139,385 | | |
Wyndham Worldwide Corp. | | | 45,705 | | | | 2,847,422 | | |
| | | | 20,900,401 | | |
Household durables—0.69% | |
Jarden Corp.* | | | 22,935 | | | | 1,042,854 | | |
Meritage Homes Corp.* | | | 31,532 | | | | 1,427,138 | | |
Tupperware Brands Corp. | | | 11,763 | | | | 991,386 | | |
| | | | 3,461,378 | | |
| | | Number of
shares | | Value | |
Common stocks—(continued) | |
Internet & catalog retail—0.44% | |
HomeAway, Inc.* | | | 73,010 | | | $ | 2,198,331 | | |
Internet software & services—2.02% | |
DealerTrack Holdings, Inc.* | | | 81,328 | | | | 3,041,667 | | |
OpenTable, Inc.*,1 | | | 24,944 | | | | 1,588,434 | | |
SciQuest, Inc.* | | | 83,395 | | | | 2,056,521 | | |
SPS Commerce, Inc.* | | | 53,946 | | | | 3,481,135 | | |
| | | | 10,167,757 | | |
IT services—3.06% | |
Cass Information Systems, Inc. | | | 37,405 | | | | 2,065,130 | | |
Echo Global Logistics, Inc.* | | | 73,211 | | | | 1,593,804 | | |
Gartner, Inc.* | | | 38,556 | | | | 2,313,746 | | |
Heartland Payment Systems, Inc.1 | | | 64,345 | | | | 2,400,712 | | |
Jack Henry & Associates, Inc. | | | 37,408 | | | | 1,806,806 | | |
MAXIMUS, Inc. | | | 108,590 | | | | 4,084,070 | | |
WEX, Inc.* | | | 12,976 | | | | 1,128,133 | | |
| | | | 15,392,401 | | |
Leisure equipment & products—1.59% | |
Brunswick Corp. | | | 61,929 | | | | 2,337,820 | | |
Polaris Industries, Inc. | | | 50,354 | | | | 5,646,697 | | |
| | | | 7,984,517 | | |
Life sciences tools & services—1.33% | |
Covance, Inc.* | | | 14,937 | | | | 1,232,302 | | |
Mettler-Toledo International, Inc.* | | | 7,546 | | | | 1,664,648 | | |
PAREXEL International Corp.* | | | 31,023 | | | | 1,534,087 | | |
Techne Corp. | | | 30,490 | | | | 2,248,333 | | |
| | | | 6,679,370 | | |
Machinery—3.15% | |
Chart Industries, Inc.* | | | 14,581 | | | | 1,657,860 | | |
Lincoln Electric Holdings, Inc. | | | 31,288 | | | | 1,847,243 | | |
Middleby Corp.* | | | 10,718 | | | | 1,917,879 | | |
Proto Labs, Inc.*,1 | | | 35,540 | | | | 2,404,992 | | |
Sun Hydraulics Corp. | | | 39,015 | | | | 1,227,022 | | |
The Manitowoc Co., Inc. | | | 72,600 | | | | 1,490,478 | | |
The Toro Co. | | | 39,195 | | | | 1,931,529 | | |
Trimas Corp.* | | | 35,095 | | | | 1,299,568 | | |
Woodward, Inc. | | | 50,610 | | | | 2,070,961 | | |
| | | | 15,847,532 | | |
Media—0.53% | |
Cinemark Holdings, Inc. | | | 91,720 | | | | 2,670,886 | | |
Oil, gas & consumable fuels—2.18% | |
Bill Barrett Corp.*,1 | | | 104,560 | | | | 2,344,235 | | |
Gulfport Energy Corp.* | | | 15,825 | | | | 841,890 | | |
Magnum Hunter Resources Corp.*,1 | | | 534,940 | | | | 2,048,820 | | |
Oasis Petroleum, Inc.* | | | 98,176 | | | | 4,127,319 | | |
QEP Resources, Inc. | | | 52,220 | | | | 1,592,188 | | |
| | | | 10,954,452 | | |
Paper & forest products—0.43% | |
Boise Cascade Co.* | | | 82,700 | | | | 2,188,242 | | |
141
PACE Select Advisors Trust
PACE Small/Medium Co Growth Equity Investments
Portfolio of investments—July 31, 2013
| | | Number of
shares | | Value | |
Common stocks—(continued) | |
Personal products—0.45% | |
Prestige Brands Holdings, Inc.* | | | 67,631 | | | $ | 2,293,367 | | |
Pharmaceuticals—0.22% | |
Perrigo Co. | | | 8,854 | | | | 1,101,349 | | |
Professional services—4.38% | |
Acacia Research1 | | | 106,740 | | | | 2,435,807 | | |
CoStar Group, Inc.* | | | 52,410 | | | | 8,204,785 | | |
Equifax, Inc. | | | 18,450 | | | | 1,166,594 | | |
Huron Consulting Group, Inc.* | | | 61,290 | | | | 3,122,113 | | |
Manpower, Inc. | | | 20,427 | | | | 1,365,953 | | |
The Advisory Board Co.* | | | 31,570 | | | | 1,852,843 | | |
TrueBlue, Inc.* | | | 64,876 | | | | 1,732,189 | | |
WageWorks, Inc.* | | | 63,680 | | | | 2,150,474 | | |
| | | | 22,030,758 | | |
Real estate investment trusts—0.36% | |
Extra Space Storage, Inc. | | | 43,063 | | | | 1,810,799 | | |
Real estate management & development—0.30% | |
Jones Lang LaSalle, Inc. | | | 16,685 | | | | 1,518,836 | | |
Road & rail—1.48% | |
Genesee & Wyoming, Inc., Class A* | | | 29,540 | | | | 2,648,556 | | |
Knight Transportation, Inc. | | | 130,015 | | | | 2,206,355 | | |
Old Dominion Freight Line, Inc.* | | | 59,605 | | | | 2,603,546 | | |
| | | | 7,458,457 | | |
Semiconductors & semiconductor equipment—4.10% | |
Atmel Corp.* | | | 470,188 | | | | 3,714,485 | | |
Cabot Microelectronics Corp.* | | | 60,076 | | | | 2,221,610 | | |
CEVA, Inc.* | | | 119,122 | | | | 2,171,594 | | |
Diodes, Inc.* | | | 33,516 | | | | 918,674 | | |
Power Integrations, Inc. | | | 46,470 | | | | 2,562,821 | | |
Semtech Corp.* | | | 151,570 | | | | 4,584,992 | | |
Teradyne, Inc.* | | | 150,690 | | | | 2,484,878 | | |
Ultratech, Inc.* | | | 68,480 | | | | 2,000,986 | | |
| | | | 20,660,040 | | |
Software—14.62% | |
ACI Worldwide, Inc.* | | | 40,175 | | | | 1,902,286 | | |
Allot Communications Ltd.*,1 | | | 179,007 | | | | 2,618,873 | | |
BroadSoft, Inc.* | | | 62,255 | | | | 1,857,689 | | |
Cadence Design Systems, Inc.* | | | 196,590 | | | | 2,866,282 | | |
CommVault Systems, Inc.* | | | 43,411 | | | | 3,665,191 | | |
Concur Technologies, Inc.*,1 | | | 30,916 | | | | 2,748,123 | | |
Ebix, Inc.1 | | | 72,182 | | | | 837,311 | | |
Fortinet, Inc.* | | | 122,644 | | | | 2,606,185 | | |
Guidewire Software, Inc.* | | | 42,434 | | | | 1,856,912 | | |
Imperva, Inc.* | | | 59,730 | | | | 3,023,533 | | |
Infoblox, Inc.* | | | 72,860 | | | | 2,382,522 | | |
Informatica Corp.* | | | 89,934 | | | | 3,432,781 | | |
Jive Software, Inc.*,1 | | | 186,084 | | | | 2,497,247 | | |
Manhattan Associates, Inc.* | | | 31,901 | | | | 2,818,134 | | |
Pegasystems, Inc. | | | 37,437 | | | | 1,343,988 | | |
Proofpoint, Inc.* | | | 87,300 | | | | 2,349,243 | | |
PROS Holdings, Inc.* | | | 41,822 | | | | 1,372,598 | | |
QLIK Technologies, Inc.* | | | 110,608 | | | | 3,464,243 | | |
| | | Number of
shares | | Value | |
Common stocks—(concluded) | |
Software—(concluded) | |
ServiceNow, Inc.* | | | 66,920 | | | $ | 2,916,374 | | |
Sourcefire, Inc.* | | | 46,665 | | | | 3,519,941 | | |
SS&C Technologies Holdings, Inc.* | | | 99,920 | | | | 3,575,138 | | |
Synchronoss Technologies, Inc.* | | | 147,017 | | | | 5,070,616 | | |
TIBCO Software, Inc.* | | | 155,680 | | | | 3,882,659 | | |
Ultimate Software Group, Inc.* | | | 68,122 | | | | 9,216,907 | | |
Verint Systems, Inc.* | | | 49,635 | | | | 1,775,940 | | |
| | | | 73,600,716 | | |
Specialty retail—7.50% | |
Aeropostale, Inc.* | | | 153,650 | | | | 2,324,725 | | |
Asbury Automotive Group, Inc.* | | | 81,298 | | | | 3,970,594 | | |
Ascena Retail Group, Inc.* | | | 127,480 | | | | 2,433,593 | | |
Dick's Sporting Goods, Inc. | | | 68,705 | | | | 3,532,124 | | |
Five Below, Inc.*,1 | | | 29,665 | | | | 1,152,782 | | |
Foot Locker, Inc. | | | 87,175 | | | | 3,149,633 | | |
Francesca's Holdings Corp.*,1 | | | 79,190 | | | | 1,968,663 | | |
Genesco, Inc.* | | | 21,548 | | | | 1,516,548 | | |
GNC Holdings, Inc., Class A | | | 32,762 | | | | 1,729,178 | | |
Penske Automotive Group, Inc. | | | 46,722 | | | | 1,737,124 | | |
PetSmart, Inc. | | | 13,909 | | | | 1,018,417 | | |
Restoration Hardware Holdings, Inc.* | | | 34,980 | | | | 2,337,364 | | |
The Children's Place Retail Stores, Inc.* | | | 49,810 | | | | 2,691,733 | | |
Tractor Supply Co. | | | 8,745 | | | | 1,059,282 | | |
Ulta Salon, Cosmetics &
Fragrance, Inc.* | | | 20,050 | | | | 2,023,045 | | |
Urban Outfitters, Inc.* | | | 80,570 | | | | 3,429,059 | | |
Williams-Sonoma, Inc. | | | 28,440 | | | | 1,673,978 | | |
| | | | 37,747,842 | | |
Textiles, apparel & luxury goods—0.80% | |
Hanesbrands, Inc. | | | 25,917 | | | | 1,644,693 | | |
Steven Madden Ltd.* | | | 15,882 | | | | 816,652 | | |
Under Armour, Inc., Class A* | | | 23,309 | | | | 1,564,733 | | |
| | | | 4,026,078 | | |
Trading companies & distributors—2.16% | |
Beacon Roofing Supply, Inc.* | | | 170,607 | | | | 6,959,060 | | |
United Rentals, Inc.* | | | 38,935 | | | | 2,231,754 | | |
WESCO International, Inc.* | | | 21,940 | | | | 1,662,613 | | |
| | | | 10,853,427 | | |
Total common stocks
(cost—$355,933,374) | | | | | 494,227,180 | | |
Investment companies—0.30% | |
iShares Russell 2000 Growth
Index Fund ETF1 | | | 4,441 | | | | 532,920 | | |
iShares Russell Midcap Growth
Index Fund ETF | | | 12,761 | | | | 971,623 | | |
Total investment companies
(cost—$1,436,251) | | | | | 1,504,543 | | |
142
PACE Select Advisors Trust
PACE Small/Medium Co Growth Equity Investments
Portfolio of investments—July 31, 2013
| | | Face
amount | | Value | |
Repurchase agreement—1.30% | |
Repurchase agreement dated
07/31/13 with State Street Bank and
Trust Co., 0.010% due 08/01/13,
collateralized by $286,313 Federal
Home Loan Mortgage Corp.
obligations, 1.960% due 11/07/22,
$6,600,090 Federal National
Mortgage Association obligations,
2.140% to 2.170% due 11/07/22
and $217,028 US Treasury Notes,
0.250% to 0.750% due 10/31/13
to 12/15/13; (value—$6,680,055);
proceeds: $6,549,002
(cost—$6,549,000) | | $ | 6,549,000 | | | $ | 6,549,000 | | |
| | | Number of
shares | | Value | |
Investment of cash collateral from securities loaned—8.23% | |
Money market fund—8.23% | |
UBS Private Money Market Fund LLC2
(cost—$41,413,440) | | | 41,413,440 | | | $ | 41,413,440 | | |
Total investments
(cost—$405,332,065)—108.01% | | | | | 543,694,163 | | |
Liabilities in excess of
other assets—(8.01)% | | | | | (40,336,811 | ) | |
Net assets—100.00% | | | | $ | 503,357,352 | | |
For a listing of defined portfolio acronyms that are used throughout the Portfolio of investments as well as the tables that follow, please refer to page 218.
Aggregate cost for federal income tax purposes was $407,174,172; and net unrealized appreciation consisted of:
Gross unrealized appreciation | | $ | 143,703,591 | | |
Gross unrealized depreciation | | | (7,183,600 | ) | |
Net unrealized appreciation | | $ | 136,519,991 | | |
Fair valuation summary
The following is a summary of the fair valuations according to the inputs used as of July 31, 2013 in valuing the Portfolio's investments:
| | | Unadjusted
quoted prices in
active markets for
identical investments
(Level 1) | | Other significant
observable inputs
(Level 2) | | Unobservable
inputs
(Level 3) | | Total | |
Common stocks | | $ | 494,227,180 | | | $ | — | | | $ | — | | | $ | 494,227,180 | | |
Investment companies | | | 1,504,543 | | | | — | | | | — | | | | 1,504,543 | | |
Repurchase agreement | | | — | | | | 6,549,000 | | | | — | | | | 6,549,000 | | |
Investment of cash collateral from securities loaned | | | — | | | | 41,413,440 | | | | — | | | | 41,413,440 | | |
Total | | $ | 495,731,723 | | | $ | 47,962,440 | | | $ | — | | | $ | 543,694,163 | | |
At July 31, 2013, there were no transfers between Level 1 and Level 2.
Issuer breakdown by country or territory of origin (unaudited)
| | | Percentage of
total investments | |
United States | | | 97.6 | % | |
Israel | | | 0.9 | | |
Canada | | | 0.5 | | |
Bermuda | | | 0.4 | | |
United Kingdom | | | 0.4 | | |
Netherlands | | | 0.2 | | |
Total | | | 100.0 | % | |
143
PACE Select Advisors Trust
PACE Small/Medium Co Growth Equity Investments
Portfolio of investments—July 31, 2013
Portfolio footnotes
* Non-income producing security.
1 Security, or portion thereof, was on loan at July 31, 2013.
2 The table below details the Portfolio's transaction activity in an affiliated issuer during the year ended July 31, 2013. The investment manager earns a management fee from UBS Private Money Market Fund LLC. Please see the Notes to financial statements for further information.
Security description | | Value at
07/31/12 | | Purchases
during the
year ended
07/31/13 | | Sales
during the
year ended
07/31/13 | | Value at
07/31/13 | | Net income
earned from
affiliate for the
year ended
07/31/13 | |
UBS Private Money Market Fund LLC | | $ | 38,114,969 | | | $ | 184,237,953 | | | $ | 180,939,482 | | | $ | 41,413,440 | | | $ | 14,676 | | |
See accompanying notes to financial statements.
144
PACE Select Advisors Trust
PACE International Equity Investments
Performance
For the 12 months ended July 31, 2013, the Portfolio's Class P shares returned 22.92% before the deduction of the maximum PACE Select program fee. (Class P shares returned 20.49% after the deduction of the maximum PACE Select program fee for the same 12-month period.) In comparison, the MSCI EAFE Index (net) (the "benchmark") returned 23.48% and the Lipper International Large-Cap Core Funds category posted a median return of 22.43%. (Returns for all share classes over various time periods are shown in the "Performance at a glance" table on page 150. Please note that the returns shown do not reflect the deduction of taxes that a shareholder would pay on Portfolio distributions or the redemption of Portfolio shares.) For a detailed commentary on the market environment in general during the reporting period, please refer to page 2.
Sub-Advisors' comments1
Martin Currie
Our portion of the Portfolio slightly outperformed the benchmark during the reporting period, largely due to regional allocation decisions.
At a regional level, Japan was the biggest detractor from performance, followed by emerging markets. Asia, where both stock selection and allocation effects were strong, was the top-contributing region. By sector, energy was by far the weakest, while financials and telecommunication services added the most value.
In terms of individual stocks, the main detractors from the performance of our portion of the portfolio were a mixed bag in terms of sectors and regions. Newcrest Mining, an Australian gold mine, Petrofac, a London-listed oil services company, and Nikon, a Japanese camera manufacturer, were all negative for performance. Newcrest Mining was especially weak in the second quarter of 2013, as falling gold prices and asset write-downs weighed heavily on the stock. We eliminated our position in the company, after a call with management. Performance of Petrofac was hampered by reduced spending from major oil companies. In addition, its plans to develop an expensive offshore vessel raised concerns about capital deployment. This represents a marked departure from the firm's very successful and capital-light onshore business, prompting us to review and subsequently sell the stock. Shares of Nikon fell sharply after reporting surprisingly
1 All Sub-Advisors discuss performance on a gross of fees basis—meaning that no fees or expenses are reflected in their sleeves'/sleeve's performance. Alternately, Portfolio performance is shown net of fees, which does factor in fees and expenses associated with the Portfolio.
PACE Select Advisors Trust –
PACE International Equity Investments
Investment Sub-Advisors:
Martin Currie Inc. ("Martin Currie") until August 2, 2013, after the close of the reporting period, Mondrian Investment Partners Limited ("Mondrian"), J.P. Morgan Investment Management Inc. ("J.P. Morgan") until September 13, 2013, after the close of the reporting period, Chautauqua Capital Management, LLC ("Chautauqua"), commenced after the close of the reporting period and Los Angeles Capital Management and Equity Research, Inc. ("Los Angeles Capital"), commenced after the close of the reporting period.
Portfolio Managers:
Martin Currie: Christine Montgomery;
Mondrian: Elizabeth A. Desmond, Nigel G. May and Russell J. Mackie;
J.P. Morgan: International REI Segment—Beltran Lastra and Demetris Georghiou; EAFE Opportunities Segment—Jeroen Huysinga
Objective:
Capital appreciation
Investment process:
Martin Currie has a highly active "conviction" approach, seeking the best opportunities for growth across global stock markets. At Martin Currie, they believe stock focused portfolios, driven by fundamental research, are the best way to exploit market inefficiencies and generate consistent outperformance. They use a consistent analytical framework to find undervalued stocks by assessing quality, value and growth characteristics over a three to five year time horizon. The result is the construction of portfolios which exhibit quality and growth characteristics and attractive valuations. In managing its
145
PACE Select Advisors Trust
PACE International Equity Investments
Sub-Advisors' comments – continued
poor fiscal third quarter results in February 2013, which included disappointing volumes and weak prices in the run-up to Christmas. With the company still struggling to improve sales and pricing several months later, we sold out of our position in Nikon.
Conversely, the top contributors to performance were UK house builder Persimmon, German broadcaster ProSiebenSat and French aerospace company Safran. Results from Persimmon have confirmed it is ahead of margin and cash generation expectations when compared to its nine-year strategic plan. ProSiebenSat outperformed after releasing strong year-end results. With the stock looking fully valued, we sold out of our position in July 2013. Safran benefited from a positive reaction to its "capital markets day" in June 2013, an event for investors and analysts at which management confirmed the company's potential for long-term growth, as well as its commitment to increase shareholder returns and to wisely deploy cash.
We made no use of derivatives during the review period.
J.P. Morgan (International REI)
Our portion of the Portfolio outperformed the benchmark during the reporting period. Stock selection added value across the majority of sectors, most notably in the areas of transport services and consumer cyclicals, banks and finance and retail. Stock selection in insurance and technology hardware combined with a slight underweight to capital market banks detracted from relative results. At the regional level, stock selection added value in all the major regions, especially Europe.
At the stock level, French utility company Electricite de France was a significant contributor to results, as its sales grew and management raised its full-year profit outlook given cost cuts, improved atomic power output and an increase in domestic tariffs. On the downside, Teva Pharmaceutical, an Israeli pharmaceutical company, was an underperformer. The company has a new Chief Executive Officer, and there are still some questions as to his vision for the company.
The EAFE REI portfolio seeks to harness the stock-specific insights of J.P. Morgan's team of research analysts. Overall, the portfolio displays characteristics very similar to those of the MSCI EAFE benchmark in terms of geographic breakdown, sector composition and exposure to various macro and factor risks. However, individual components of the benchmark are
Investment process (continued)
segment of the Portfolio's assets, Martin Currie uses a fully integrated international investment process seeking to identify the connections that others miss. So rather than running distinct regional portfolios, it compares and ranks stock opportunities across the whole investment universe. To help identify and evaluate the best stock ideas, Martin Currie works closely with teams of dedicated regional and global sector research specialists with the sole objective of finding those companies that can deliver outperformance.
J.P. Morgan manages two separate segments of the Portfolio's assets, utilizing distinct principal investment strategies and portfolio management for each. In managing one segment of the Portfolio's assets, the International Research Enhanced Index Strategy segment ("International REI" segment), J.P. Morgan uses a bottom-up, research driven strategy that seeks to generate risk characteristics that closely match those of the Portfolio's benchmark yet at the same time capitalize on the information advantage created by the firm's proprietary research capabilities to generate outperformance. The strategy is driven by valuation based fundamental analysis, focused on normalized earnings and earnings growth. The J.P. Morgan team seeks to maintain regional weights and sector/industry weights close to those of the benchmark. Stock selection is the focus, being the expected primary source of added value.
In managing the second segment of the Portfolio's assets, the Europe, Australasia, and Far East Opportunities Strategy segment ("EAFE Opportunities" segment), J.P. Morgan uses an active equity strategy, which represents a partnership between portfolio management and the firm's proprietary network of analysts. J.P. Morgan applies a uniform valuation methodology across regions and sectors, and analysts
146
PACE Select Advisors Trust
PACE International Equity Investments
Sub-Advisors' comments – continued
marginally overweighted or underweighted, based on the fundamental research carried out by J.P. Morgan analysts in an effort to generate excess returns.
The portfolio used derivatives in the form of currency forwards and futures during the reporting period. Derivatives are only used for the efficient management of cash flow and to reduce currency deviations from the benchmark, where practical, for the purposes of risk management. Derivatives are not used as a source of excess returns. Exchange traded equity futures can be used to gain or reduce exposure to a market quickly and cheaply and, as such, are used for the efficient management of cash flows, subject to regulatory guidelines.
J.P. Morgan (EAFE Opportunities)
Our portion of the Portfolio slightly underperformed the benchmark during the reporting period, largely driven by stock selection within the energy sector and our exposure to emerging markets. Concerns about slower growth in countries such as China caused emerging market stocks to underperform their developed counterparts by a significant margin during the reporting period. While our direct exposure to emerging markets was relatively modest, averaging roughly 5.5% over the reporting period, those out-of-benchmark positions had a significant impact on our relative performance. Furthermore, that weakness extended to developed market stocks where businesses were perceived to be closely tied to the emerging economics (e.g. mining companies). On the upside, stock selection in telecommunication services, healthcare and property added value.
At the stock level, Belle International, a Chinese footwear retailer, was an underperformer, reflecting growing concerns about the Chinese economy. The company's same-store sales have fallen short of targets and management does not expect to see a significant recovery during the second half of the year. However, despite the short-term challenges, our longer-term outlook for the company remains promising given the continued, albeit slower, growth in China and government efforts to transform the economy into one fueled more by domestic demand. On the upside, Softbank, a Japanese telecommunication service provider, significantly contributed to results. Companies geared to the domestic Japanese economy have generally performed well given the new government's commitment to re-flating the Japanese economy. Softbank's net profits have been boosted by sales of the Apple iPhones and iPads and an increase in subscribers. Also, a proposal to take a controlling stake in Sprint has generated additional interest in the stock, due to the potential synergies that might ensue and the prospect of the company establishing a presence outside of Japan.
Investment process (concluded)
conduct thorough analysis with a particular emphasis on a company's normalized (or mid-cycle) earnings and their intermediate growth rate. J.P. Morgan typically focuses on the most attractive companies, within a sector, that possess a catalyst for share price appreciation in an effort to build a portfolio where stock selection is the primary source of added value.
Mondrian conducts research on a global basis in an effort to identify securities that have the potential for capital appreciation over a market cycle. The center of its research effort is a value-oriented dividend discount methodology toward individual securities and market analysis that attempts to identify value across country boundaries. This approach focuses on future anticipated dividends, and discounts the value of those dividends back to what they would be worth if they were being paid today. Comparisons of the values of different possible investments are then made. In an international portfolio, currency returns can be an integral component of an investment's total return. Mondrian uses a purchasing power parity approach to assess the value of individual currencies. Purchasing power parity attempts to identify the amount of goods and services that a dollar will buy in the United States, and compares that to the amount of a foreign currency required to buy the same amount of goods and services in another country.
147
PACE Select Advisors Trust
PACE International Equity Investments
Sub-Advisors' comments – concluded
The portfolio used derivatives in the form of currency forwards and futures during the reporting period. Derivatives are only used for the efficient management of cash flow and to reduce currency deviations from the benchmark, where practical, for the purposes of risk management. Derivatives are not used as a source of excess returns. Exchange traded equity futures can be used to gain or reduce exposure to a market quickly and cheaply and, as such, are used for the efficient management of cash flows, subject to regulatory guidelines.
Mondrian
Our portion of the Portfolio underperformed the benchmark during the reporting period. Underweight positions in consumer discretionary and financials, the two strongest sectors during the reporting period, detracted from results. However, this underperformance was partially offset by an underweight in the relatively weak materials sector, as well as stock selection in the consumer staples, consumer discretionary and materials sectors. Overall, stock selection held back investment returns for the reporting period. In particular, our holdings in Japan, the UK and Germany were negative for performance. In contrast, our positions in the Netherlands, Spain and Australia were beneficial for results.
We have been in a period of ultra-loose monetary policy, which has pushed equity markets to rise, creating higher valuations. At Mondrian, we have continued to focus on identifying companies that we believe can deliver long-term sustainable earnings and cash flow in what we expect to be a relatively low-growth environment. These companies have tended to be less financially and operationally leveraged and in more stable sectors, such as healthcare and consumer staples. In international equity markets, these companies have benefited the least from quantitative easing but have equally less to lose in a period of more normal monetary policy.
The main highlights of the strategy being adopted for our portion of the Portfolio are overweight positions in selected European markets and overweights in the telecommunications services, consumer staples and healthcare sectors. We are underweight the materials and industrials sectors and have maintained our defensive currency hedge of the Australian dollar.
The derivative exposure within our portion of the Portfolio was in the form of defensive forward currency contracts in an unleveraged and fully covered manner. At the end of the reporting period, we hedged 73% of the Australian dollar exposure. This hedging is undertaken using three-month forward currency contracts. We have chosen to hedge this currency, as our analysis shows that it is significantly overvalued and we wish to protect the value of the underlying investment in these markets. Our defensive currency hedging positively contributed to results during the reporting period.
(Please note: After the close of the fiscal reporting period, Martin Currie and J.P. Morgan were both terminated as Sub-Advisors for the Portfolio. Also after the close of the fiscal reporting period, Chautauqua and Los Angeles Capital were appointed to serve as Sub-Advisors of the Portfolio.
Special considerations
The Portfolio may be appropriate for long-term investors seeking capital appreciation who are able to withstand short-term fluctuations in the equity markets in return for potentially higher returns over the long term. The value of the Portfolio changes every day and can be affected by changes in interest rates, general market conditions and other political, social and economic developments, as well as specific matters relating to the companies in whose securities the Portfolio invests. It is important to note that an investment in the Portfolio is only one component of a balanced investment plan. The value of the Portfolio's investments in foreign securities may fall due to adverse political, social, and economic developments abroad and due to decreases in foreign currency values relative to the US dollar. These risks are greater for investments in emerging market issuers than for issuers in more developed countries.
148
PACE Select Advisors Trust
PACE International Equity Investments
Illustration of an assumed investment of $10,000 in Class P shares of the Portfolio (unaudited)
The following graph depicts the performance of PACE International Equity Investments Class P shares versus the MSCI EAFE Index (net) over the 10 years ended July 31, 2013. The performance of the other classes will vary based upon the different class specific expenses and sales charges. The performance provided does not reflect the deduction of taxes that a shareholder would pay on Portfolio distributions or the redemption of Portfolio shares. Past performance is no guarantee of future results. Share price and returns will vary with market conditions; investors may realize a gain or loss upon redemption. It is important to note that PACE International Equity Investments is a professionally managed portfolio while the Index is not available for investment and is unmanaged. The comparison is shown for illustration purposes only.
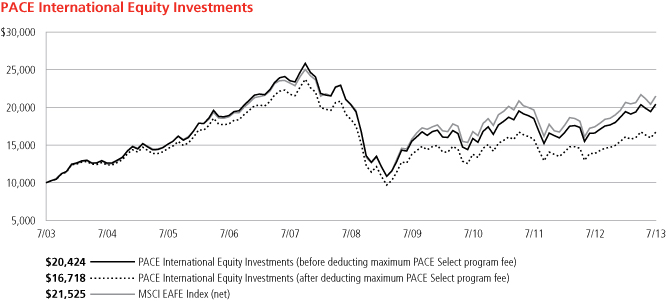
149
PACE Select Advisors Trust
PACE International Equity Investments
Performance at a glance (unaudited)
Average annual total returns for periods ended 07/31/13 | | 1 year | | 5 years | | 10 years | |
Before deducting maximum sales charge or PACE Select program fee | |
Class A1 | | | 22.63 | % | | | (0.21 | )% | | | 7.11 | % | |
Class C2 | | | 21.50 | % | | | (1.06 | )% | | | 6.21 | % | |
Class Y3 | | | 22.97 | % | | | 0.09 | % | | | 7.49 | % | |
Class P4 | | | 22.92 | % | | | 0.04 | % | | | 7.40 | % | |
After deducting maximum sales charge or PACE Select program fee | |
Class A1 | | | 15.86 | % | | | (1.33 | )% | | | 6.51 | % | |
Class C2 | | | 20.50 | % | | | (1.06 | )% | | | 6.21 | % | |
Class P4 | | | 20.49 | % | | | (1.95 | )% | | | 5.27 | % | |
MSCI EAFE Index (net)5 | | | 23.48 | % | | | 1.05 | % | | | 7.97 | % | |
Lipper International Large-Cap Core Funds median | | | 22.43 | % | | | 0.92 | % | | | 7.84 | % | |
Average annual total returns for periods ended June 30, 2013, after deduction of the maximum sales charge or PACE Select program fee, were as follows: Class A—1-year period, 10.56%; 5-year period, (2.94)%; 10-year period, 6.25%; Class C—1-year period, 15.01%; 5-year period, (2.66)%; 10-year period, 5.97%; Class Y—1-year period, 17.36%; 5-year period, (1.54)%; 10-year period, 7.22%; Class P—1-year period, 14.97%; 5-year period, (3.54)%; 10-year period, 5.01%.
The annualized gross and net expense ratios, respectively, for each class of shares as in the November 28, 2012 prospectuses, were as follows: Class A—1.43% and 1.43%; Class C—2.27% and 2.27%; Class Y—1.18% and 1.18%; and Class P—1.18% and 1.18%. Net expenses reflect fee waivers and/or expense reimbursements, if any, pursuant to an agreement that is in effect to cap the expenses. The Portfolio and UBS Global Asset Management (Americas) Inc. ("UBS Global AM") have entered into a written fee waiver/expense reimbursement agreement pursuant to which UBS Global AM is contractually obligated to waive its management fees and/or reimburse expenses so that the Portfolio's ordinary total operating expenses of each class through November 30, 2013 (excluding dividend expense, borrowing costs, and interest expense relating to short sales, and expenses attributable to investment in other investment companies, interest, taxes, brokerage commissions and extraordinary expenses) would not exceed Class A—1.55%; Class C—2.30%; Class Y—1.30%; and Class P—1.30%. The Portfolio has agreed to repay UBS Global AM for any waived fees/reimbursed expenses to the extent that it can do so over the following three fiscal years without causing the Portfolio's expenses in any of those three years to exceed these expense caps. The fee waiver/expense reimbursement agreement may be terminated by the Portfolio's board at any time and also will terminate automatically upon the expiration or termination of the Portfolio's advisory contract with UBS Global AM. Upon termination of the agreement, however, UBS Global AM's three year recoupment rights will survive.
1 Maximum sales charge for Class A shares is 5.5%. Class A shares bear ongoing 12b-1 service fees.
2 Maximum contingent deferred sales charge for Class C shares is 1% imposed on redemptions and is reduced to 0% after one year. Class C shares bear ongoing 12b-1 service and distribution fees. Prior to September 30, 2003, Class C shares were subject to a maximum front-end sales charge of 1%; this front-end sales charge is not reflected in the average annual total returns presented for the Class C shares shown above.
3 The Portfolio offers Class Y shares to a limited group of eligible investors, including certain qualifying retirement plans. Class Y shares do not bear initial or contingent deferred sales charges or ongoing 12b-1 service and distribution fees.
4 Class P shares do not bear initial or contingent deferred sales charges or ongoing 12b-1 service and distribution fees, but are subject to a maximum annual PACE Select program fee of 2% of the value of Class P shares. Prior to June 14, 2010, the maximum annual PACE Select program fee was 1.5% of the value of Class P shares; however, the current maximum annual PACE Select program fee of 2% is reflected in the performance returns throughout all periods in the average annual total returns presented for the Class P shares shown above.
5 The MSCI EAFE Index (net) is an index of stocks designed to measure the investment returns of developed economies outside of North America. Net total return indices reinvest dividends after the deduction of withholding taxes, using a tax rate applicable to non-resident institutional investors who do not benefit from double taxation treaties. The Index is constructed and managed with a view to being fully investable from the perspective of international institutional investors. Investors should note that indices do not reflect the deduction of fees and expenses.
If an investor sells or exchanges shares less than 90 days after purchase, a redemption fee of 1.00% of the amount sold or exchanged will be deducted at the time of the transaction, except as noted otherwise in the prospectuses.
Past performance does not predict future performance, and the performance information provided does not reflect the deduction of taxes that a shareholder would pay on Portfolio distributions or the redemption of Portfolio shares. The return and principal value of an investment will fluctuate, so that an investor's shares, when redeemed, may be worth more or less than their original cost. Performance results assume reinvestment of all dividends and capital gain distributions at net asset value on the ex-dividend dates. Current performance may be higher or lower than the performance data quoted. For month-end performance figures, please visit http://globalam-us.ubs.com/corpweb/performance.do.
Lipper peer group data calculated by Lipper Inc.; used with permission. The Lipper median is the return of the fund that places in the middle of a Lipper peer group.
150
PACE Select Advisors Trust
PACE International Equity Investments
Portfolio statistics (unaudited)
Characteristics | | 07/31/13 | |
Net assets (mm) | | $ | 942.2 | | |
Number of holdings | | | 274 | | |
Portfolio composition1 | | 07/31/13 | |
Common stocks and preferred stocks | | | 96.3 | % | |
ADRs and GDRs | | | 2.2 | | |
Futures and forward foreign currency contracts | | | (0.1 | ) | |
Cash equivalents and other assets less liabilities | | | 1.6 | | |
Total | | | 100.0 | % | |
Regional allocation (equity investments)1 | | 07/31/13 | |
Europe and European territories | | | 66.5 | % | |
Asia | | | 28.2 | | |
Oceania | | | 3.3 | | |
The Americas | | | 0.5 | | |
Total | | | 98.5 | % | |
Top five countries (equity investments)1 | | 07/31/13 | |
United Kingdom | | | 23.0 | % | |
Japan | | | 19.8 | | |
France | | | 12.6 | | |
Switzerland | | | 8.9 | | |
Germany | | | 8.0 | | |
Total | | | 72.3 | % | |
Top five sectors1 | | 07/31/13 | |
Financials | | | 19.4 | % | |
Consumer discretionary | | | 13.5 | | |
Health care | | | 12.1 | | |
Consumer staples | | | 11.8 | | |
Industrials | | | 10.6 | | |
Total | | | 67.4 | % | |
Top ten equity holdings1 | | 07/31/13 | |
Novartis AG | | | 2.4 | % | |
Sanofi SA | | | 2.2 | | |
HSBC Holdings PLC | | | 2.0 | | |
BG Group PLC | | | 1.8 | | |
Vodafone Group PLC | | | 1.4 | | |
GlaxoSmithKline PLC | | | 1.4 | | |
ENI SpA | | | 1.4 | | |
Roche Holding AG | | | 1.3 | | |
Seven & I Holdings Co. Ltd. | | | 1.3 | | |
Toyota Motor Corp. | | | 1.2 | | |
Total | | | 16.4 | % | |
For a listing of defined portfolio acronyms that are used throughout the Portfolio statistics, please refer to page 218.
1 Weightings represent percentages of the Portfolio's net assets as of July 31, 2013. The Portfolio is actively managed and its composition will vary over time.
151
PACE Select Advisors Trust
PACE International Equity Investments
Industry diversification—(unaudited)
As a percentage of net assets as of July 31, 2013
Common stocks
Aerospace & defense | | | 0.83 | % | |
Air freight & logistics | | | 0.26 | | |
Airlines | | | 0.31 | | |
Auto components | | | 1.19 | | |
Automobiles | | | 3.30 | | |
Beverages | | | 1.40 | | |
Building products | | | 1.53 | | |
Capital markets | | | 1.48 | | |
Chemicals | | | 3.31 | | |
Commercial banks | | | 9.21 | | |
Commercial services & supplies | | | 0.72 | | |
Communications equipment | | | 0.45 | | |
Computers & peripherals | | | 0.04 | | |
Construction & engineering | | | 0.65 | | |
Construction materials | | | 0.28 | | |
Containers & packaging | | | 0.42 | | |
Diversified financial services | | | 1.43 | | |
Diversified telecommunication services | | | 4.14 | | |
Electric utilities | | | 1.59 | | |
Electrical equipment | | | 2.17 | | |
Electronic equipment, instruments & components | | | 1.69 | | |
Energy equipment & services | | | 0.71 | | |
Food & staples retailing | | | 4.31 | | |
Food products | | | 2.65 | | |
Gas utilities | | | 0.20 | | |
Health care providers & services | | | 0.27 | | |
Hotels, restaurants & leisure | | | 2.54 | | |
Household durables | | | 1.34 | | |
Independent power producers & energy traders | | | 0.04 | | |
Industrial conglomerates | | | 1.26 | | |
Insurance | | | 5.94 | | |
IT services | | | 0.03 | | |
Leisure equipment & products | | | 0.03 | | |
Common stocks—(concluded)
Machinery | | | 1.49 | % | |
Media | | | 1.73 | | |
Metals & mining | | | 1.45 | | |
Multi-utilities | | | 1.89 | | |
Multiline retail | | | 0.48 | | |
Office electronics | | | 1.00 | | |
Oil, gas & consumable fuels | | | 7.94 | | |
Paper & forest products | | | 0.38 | | |
Personal products | | | 0.79 | | |
Pharmaceuticals | | | 11.82 | | |
Professional services | | | 0.17 | | |
Real estate investment trusts | | | 0.03 | | |
Real estate management & development | | | 1.29 | | |
Road & rail | | | 0.60 | | |
Semiconductors & semiconductor equipment | | | 1.94 | | |
Software | | | 1.16 | | |
Specialty retail | | | 0.95 | | |
Textiles, apparel & luxury goods | | | 1.45 | | |
Tobacco | | | 2.32 | | |
Trading companies & distributors | | | 0.29 | | |
Transportation infrastructure | | | 0.37 | | |
Wireless telecommunication services | | | 2.41 | | |
Total common stocks | | | 97.67 | | |
Preferred stocks
Automobiles | | | 0.44 | | |
Household products | | | 0.36 | | |
Total preferred stocks | | | 0.80 | | |
Repurchase agreement | | | 1.92 | | |
Investments of cash collateral from securities loaned | | | 0.58 | | |
Liabilities in excess of other assets | | | (0.97 | ) | |
Net assets | | | 100.00 | % | |
152
PACE Select Advisors Trust
PACE International Equity Investments
Portfolio of investments—July 31, 2013
| | | Number of
shares | | Value | |
Common stocks—97.67% | |
Australia—3.23% | |
Amcor Ltd. | | | 413,546 | | | $ | 3,936,469 | | |
AMP Ltd. | | | 1,164,490 | | | | 4,731,091 | | |
Aurizon Holdings Ltd. | | | 723,008 | | | | 2,950,435 | | |
Australia & New Zealand Banking
Group Ltd. | | | 179,351 | | | | 4,797,598 | | |
BHP Billiton Ltd.1 | | | 27,300 | | | | 850,017 | | |
Commonwealth Bank of Australia | | | 7,520 | | | | 501,611 | | |
Goodman Group | | | 61,830 | | | | 262,318 | | |
Incitec Pivot Ltd. | | | 112,537 | | | | 266,035 | | |
Insurance Australia Group Ltd. | | | 16,881 | | | | 88,158 | | |
Macquarie Group Ltd. | | | 123,245 | | | | 4,862,079 | | |
National Australia Bank Ltd. | | | 5,794 | | | | 162,644 | | |
Origin Energy Ltd. | | | 31,536 | | | | 338,736 | | |
QBE Insurance Group Ltd. | | | 345,011 | | | | 5,088,955 | | |
Rio Tinto Ltd. | | | 8,852 | | | | 457,585 | | |
Wesfarmers Ltd. | | | 16,709 | | | | 609,166 | | |
Westpac Banking Corp. | | | 18,939 | | | | 525,850 | | |
Total Australia common stocks | | | | | 30,428,747 | | |
Austria—0.03% | |
Andritz AG | | | 5,724 | | | | 308,785 | | |
Belgium—0.99% | |
Ageas STRIP VVPR*,2 | | | 7,563 | | | | 10 | | |
Anheuser-Busch InBev N.V. | | | 54,747 | | | | 5,271,628 | | |
Solvay SA | | | 30,147 | | | | 4,082,796 | | |
Total Belgium common stocks | | | | | 9,354,434 | | |
Bermuda—0.36% | |
Jardine Matheson Holdings Ltd., ADR | | | 62,400 | | | | 3,415,152 | | |
Canada—0.26% | |
First Quantum Minerals Ltd. | | | 152,091 | | | | 2,443,288 | | |
Cayman Islands—0.68% | |
Belle International Holdings Ltd.1 | | | 1,642,000 | | | | 2,371,241 | | |
ENN Energy Holdings Ltd.1 | | | 256,000 | | | | 1,417,711 | | |
Sands China Ltd. | | | 478,000 | | | | 2,585,500 | | |
Total Cayman Islands common stocks | | | | | 6,374,452 | | |
China—0.22% | |
China Shenhua Energy Co. Ltd.,
Class H | | | 722,000 | | | | 2,085,306 | | |
Denmark—0.36% | |
Chr. Hansen Holding A/S | | | 7,722 | | | | 255,597 | | |
Danske Bank A/S* | | | 131,430 | | | | 2,422,576 | | |
Novo-Nordisk A/S, Class B | | | 4,445 | | | | 751,904 | | |
Total Denmark common stocks | | | | | 3,430,077 | | |
Finland—0.44% | |
Nokian Renkaat Oyj | | | 4,293 | | | | 190,697 | | |
Outokumpu Oyj*,1 | | | 218,615 | | | | 135,820 | | |
Outotec Oyj1 | | | 18,726 | | | | 227,323 | | |
Stora Enso Oyj, R Shares | | | 248,948 | | | | 1,846,373 | | |
UPM-Kymmene Oyj1 | | | 156,381 | | | | 1,744,427 | | |
Total Finland common stocks | | | | | 4,144,640 | | |
| | | Number of
shares | | Value | |
Common stocks—(continued) | |
France—12.55% | |
Air Liquide SA | | | 9,063 | | | $ | 1,203,043 | | |
Atos Origin SA | | | 4,194 | | | | 315,297 | | |
AXA SA | | | 157,560 | | | | 3,474,284 | | |
BNP Paribas | | | 141,886 | | | | 9,180,246 | | |
Carrefour SA | | | 143,934 | | | | 4,417,503 | | |
Cie de Saint-Gobain | | | 238,905 | | | | 11,076,279 | | |
Electricite de France (EDF) | | | 92,907 | | | | 2,725,972 | | |
France Telecom SA | | | 704,109 | | | | 6,921,359 | | |
GDF Suez | | | 85,527 | | | | 1,794,324 | | |
GDF Suez, STRIP VVPR*,2 | | | 23,226 | | | | 31 | | |
Kering | | | 16,527 | | | | 3,783,909 | | |
Lafarge SA | | | 6,255 | | | | 399,965 | | |
LVMH Moet Hennessy Louis
Vuitton SA | | | 939 | | | | 170,703 | | |
Renault SA | | | 7,023 | | | | 552,828 | | |
Safran SA | | | 101,996 | | | | 5,989,372 | | |
Sanofi SA | | | 194,249 | | | | 20,717,461 | | |
Schneider Electric SA | | | 121,778 | | | | 9,689,659 | | |
SCOR SE | | | 119,655 | | | | 3,824,372 | | |
Societe Generale SA | | | 76,606 | | | | 3,079,295 | | |
Sodexo | | | 53,921 | | | | 4,925,242 | | |
Suez Environnement Co. | | | 114,526 | | | | 1,623,392 | | |
Thales SA | | | 6,687 | | | | 344,722 | | |
Total SA | | | 186,953 | | | | 9,973,387 | | |
Valeo SA | | | 32,137 | | | | 2,548,961 | | |
Vallourec SA | | | 62,554 | | | | 3,692,414 | | |
Vinci SA | | | 108,453 | | | | 5,856,342 | | |
Total France common stocks | | | | | 118,280,362 | | |
Germany—7.19% | |
Adidas AG | | | 35,189 | | | | 3,922,986 | | |
Allianz SE | | | 33,516 | | | | 5,225,714 | | |
BASF SE | | | 55,908 | | | | 4,957,984 | | |
Bayer AG | | | 63,324 | | | | 7,358,632 | | |
Bayerische Motoren Werke AG | | | 4,776 | | | | 467,572 | | |
Brenntag AG | | | 2,638 | | | | 433,419 | | |
Continental AG | | | 27,985 | | | | 4,408,013 | | |
Daimler AG | | | 131,997 | | | | 9,169,946 | | |
Deutsche Bank AG | | | 6,835 | | | | 308,296 | | |
Deutsche Boerse AG | | | 67,534 | | | | 4,777,896 | | |
Deutsche Telekom AG | | | 788,059 | | | | 9,590,710 | | |
E.ON SE | | | 13,798 | | | | 234,133 | | |
Fresenius Medical Care
AG & Co. KGaA | | | 34,740 | | | | 2,199,205 | | |
GEA Group AG | | | 89,199 | | | | 3,680,422 | | |
HeidelbergCement AG | | | 1,665 | | | | 127,896 | | |
Osram Licht AG* | | | 389 | | | | 15,163 | | |
RWE AG | | | 122,829 | | | | 3,695,416 | | |
SAP AG | | | 91,477 | | | | 6,728,594 | | |
Siemens AG | | | 3,899 | | | | 426,945 | | |
Total Germany common stocks | | | | | 67,728,942 | | |
153
PACE Select Advisors Trust
PACE International Equity Investments
Portfolio of investments—July 31, 2013
| | | Number of
shares | | Value | |
Common stocks—(continued) | |
Hong Kong—2.85% | |
AIA Group Ltd. | | | 1,027,805 | | | $ | 4,870,266 | | |
Bank of East Asia Ltd. | | | 70,200 | | | | 263,399 | | |
Cheung Kong Holdings Ltd. | | | 30,894 | | | | 434,195 | | |
China Merchants Holdings
International Co. Ltd. | | | 1,108,000 | | | | 3,464,464 | | |
China Mobile Ltd. | | | 485,000 | | | | 5,159,175 | | |
China Overseas Land &
Investment Ltd.1 | | | 912,000 | | | | 2,628,191 | | |
Hang Seng Bank Ltd. | | | 22,423 | | | | 343,186 | | |
Hutchison Whampoa Ltd. | | | 360,491 | | | | 4,069,445 | | |
Power Assets Holdings Ltd. | | | 47,567 | | | | 427,181 | | |
SJM Holdings Ltd. | | | 1,073,700 | | | | 2,691,311 | | |
Wharf Holdings Ltd. | | | 288,000 | | | | 2,478,725 | | |
Total Hong Kong common stocks | | | | | 26,829,538 | | |
Ireland—0.05% | |
Ryanair Holdings PLC | | | 8,430 | | | | 434,314 | | |
Israel—1.45% | |
Check Point Software
Technologies Ltd.* | | | 70,000 | | | | 3,941,700 | | |
Teva Pharmaceutical
Industries Ltd., ADR | | | 244,406 | | | | 9,702,918 | | |
Total Israel common stocks | | | | | 13,644,618 | | |
Italy—1.87% | |
Assicurazioni Generali SpA | | | 20,682 | | | | 407,487 | | |
Azimut Holding SpA | | | 13,749 | | | | 309,117 | | |
Enel SpA | | | 60,931 | | | | 202,973 | | |
ENI SpA | | | 597,204 | | | | 13,196,483 | | |
Intesa Sanpaolo SpA EURO 52 | | | 285,161 | | | | 540,973 | | |
Mediobanca SpA | | | 448,983 | | | | 2,755,963 | | |
Telecom Italia SpA | | | 84,000 | | | | 56,824 | | |
UniCredit SpA | | | 28,238 | | | | 153,722 | | |
Total Italy common stocks | | | | | 17,623,542 | | |
Japan—19.85% | |
Asahi Group Holdings Ltd. | | | 10,629 | | | | 271,289 | | |
Astellas Pharma, Inc. | | | 184,405 | | | | 9,887,920 | | |
Canon, Inc. | | | 292,687 | | | | 9,042,776 | | |
Central Japan Railway Co. | | | 4,688 | | | | 575,526 | | |
Daicel Corp. | | | 36,081 | | | | 311,393 | | |
Daikin Industries Ltd. | | | 79,600 | | | | 3,317,005 | | |
Daiwa House Industry Co. Ltd. | | | 22,428 | | | | 413,009 | | |
Denso Corp. | | | 85,600 | | | | 3,899,254 | | |
Dentsu, Inc. | | | 12,630 | | | | 403,758 | | |
East Japan Railway Co. | | | 26,800 | | | | 2,159,657 | | |
Electric Power Development Co. Ltd. | | | 12,043 | | | | 399,137 | | |
Fujitsu Ltd. | | | 93,616 | | | | 359,510 | | |
Hirose Electric Co. Ltd. | | | 2,400 | | | | 320,866 | | |
Hitachi Ltd. | | | 1,479,408 | | | | 9,942,299 | | |
Honda Motor Co. Ltd. | | | 136,593 | | | | 5,064,167 | | |
Hoya Corp. | | | 126,800 | | | | 2,737,771 | | |
Japan Airlines Co. Ltd. | | | 47,400 | | | | 2,517,414 | | |
Japan Tobacco, Inc. | | | 293,071 | | | | 10,251,947 | | |
JFE Holdings, Inc. | | | 19,607 | | | | 443,966 | | |
| | | Number of
shares | | Value | |
Common stocks—(continued) | |
Japan—(concluded) | |
JX Holdings, Inc. | | | 85,230 | | | $ | 453,527 | | |
Kao Corp. | | | 232,700 | | | | 7,462,752 | | |
KDDI Corp. | | | 12,453 | | | | 688,088 | | |
Lawson, Inc. | | | 41,500 | | | | 3,255,234 | | |
Marui Group Co. Ltd. | | | 34,423 | | | | 335,757 | | |
Mitsubishi Estate Co. Ltd. | | | 204,000 | | | | 5,190,113 | | |
Mitsubishi Gas Chemical Co., Inc. | | | 37,056 | | | | 274,769 | | |
Mitsubishi Heavy Industries Ltd. | | | 533,592 | | | | 2,872,056 | | |
Mitsubishi UFJ Financial
Group, Inc. (MUFG) | | | 1,874,671 | | | | 11,507,275 | | |
Mitsui & Co. Ltd. | | | 34,326 | | | | 461,022 | | |
Mitsui Fudosan Co. Ltd. | | | 17,164 | | | | 519,425 | | |
Mori Seiki Co. Ltd. | | | 22,428 | | | | 291,603 | | |
Nabtesco Corp. | | | 154,000 | | | | 3,232,254 | | |
Nissan Motor Co. Ltd. | | | 400,702 | | | | 4,203,053 | | |
Nitto Denko Corp. | | | 88,298 | | | | 4,987,110 | | |
Nomura Holdings, Inc. | | | 30,000 | | | | 228,884 | | |
North Pacific Bank Ltd. | | | 80,501 | | | | 311,612 | | |
ORIX Corp. | | | 569,900 | | | | 8,469,048 | | |
Otsuka Holdings Co. Ltd. | | | 59,592 | | | | 1,926,347 | | |
Ricoh Co. Ltd. | | | 32,519 | | | | 366,009 | | |
Sega Sammy Holdings, Inc. | | | 12,384 | | | | 288,635 | | |
Sekisui Chemical Co. Ltd. | | | 251,000 | | | | 2,522,562 | | |
Sekisui House Ltd. | | | 172,200 | | | | 2,228,346 | | |
Seven & I Holdings Co. Ltd. | | | 312,600 | | | | 11,813,094 | | |
Shin-Etsu Chemical Co. Ltd. | | | 62,100 | | | | 3,881,646 | | |
Softbank Corp. | | | 52,992 | | | | 3,377,286 | | |
Sumitomo Bakelite Co. Ltd. | | | 96,000 | | | | 361,802 | | |
Sumitomo Chemical Co. Ltd. | | | 122,872 | | | | 405,348 | | |
Sumitomo Corp. | | | 73,400 | | | | 983,565 | | |
Sumitomo Electric Industries Ltd. | | | 214,000 | | | | 2,896,027 | | |
Sumitomo Mitsui Financial Group, Inc. | | | 130,019 | | | | 5,955,829 | | |
Sumitomo Rubber Industries Ltd.1 | | | 12,083 | | | | 201,527 | | |
Suzuken Co. Ltd. | | | 10,141 | | | | 317,457 | | |
Takeda Pharmaceutical Co. Ltd. | | | 187,500 | | | | 8,378,230 | | |
The Dai-ichi Life Insurance Co. Ltd. | | | 298 | | | | 406,931 | | |
The Nishi-Nippon City Bank Ltd. | | | 110,682 | | | | 286,003 | | |
Tokio Marine Holdings, Inc. | | | 194,500 | | | | 6,227,735 | | |
Tokyo Electron Ltd. | | | 69,900 | | | | 3,187,657 | | |
Tokyo Gas Co. Ltd. | | | 77,037 | | | | 424,093 | | |
Toyota Motor Corp. | | | 190,326 | | | | 11,605,007 | | |
Yamato Holdings Co. Ltd. | | | 86,800 | | | | 1,907,809 | | |
Total Japan common stocks | | | | | 187,011,191 | | |
Jersey—0.84% | |
Experian PLC | | | 83,970 | | | | 1,575,027 | | |
Glencore Xstrata PLC | | | 51,774 | | | | 218,562 | | |
Petrofac Ltd. | | | 111,432 | | | | 2,225,745 | | |
Shire PLC | | | 108,002 | | | | 3,946,440 | | |
Total Jersey common stocks | | | | | 7,965,774 | | |
Luxembourg—0.03% | |
ArcelorMittal | | | 24,617 | | | | 324,119 | | |
154
PACE Select Advisors Trust
PACE International Equity Investments
Portfolio of investments—July 31, 2013
| | | Number of
shares | | Value | |
Common stocks—(continued) | |
Mexico—0.26% | |
Grupo Financiero Banorte SAB de C.V.,
Series O | | | 385,800 | | | $ | 2,433,611 | | |
Netherlands—3.12% | |
Aegon N.V. | | | 40,050 | | | | 308,761 | | |
ASML Holding N.V. | | | 56,255 | | | | 5,059,105 | | |
European Aeronautic Defense and
Space Co. N.V. | | | 16,023 | | | | 956,777 | | |
Koninklijke Ahold N.V. | | | 567,711 | | | | 9,353,823 | | |
Koninklijke Philips Electronics N.V. | | | 18,344 | | | | 587,159 | | |
PostNL N.V.* | | | 140,026 | | | | 504,456 | | |
Reed Elsevier N.V. | | | 317,960 | | | | 6,091,172 | | |
Unilever N.V. | | | 163,807 | | | | 6,589,919 | | |
Total Netherlands common stocks | | | | | 29,451,172 | | |
New Zealand—0.04% | |
Telecom Corp. of New Zealand Ltd. | | | 192,329 | | | | 345,630 | | |
Norway—0.49% | |
DnB NOR ASA | | | 246,407 | | | | 4,104,135 | | |
Telenor ASA | | | 22,510 | | | | 498,499 | | |
Total Norway common stocks | | | | | 4,602,634 | | |
Portugal—0.04% | |
EDP-Electricidade de Portugal SA | | | 97,034 | | | | 344,668 | | |
Singapore—1.96% | |
CapitaMalls Asia Ltd. | | | 138,944 | | | | 218,117 | | |
DBS Group Holdings Ltd. | | | 40,086 | | | | 526,763 | | |
Global Logistic Properties Ltd. | | | 136,881 | | | | 305,891 | | |
Oversea-Chinese Banking Corp. Ltd. | | | 454,000 | | | | 3,772,467 | | |
SembCorp Industries Ltd. | | | 833,000 | | | | 3,329,771 | | |
Singapore Exchange Ltd. | | | 41,553 | | | | 249,478 | | |
Singapore Telecommunications Ltd. | | | 1,641,000 | | | | 5,074,659 | | |
United Overseas Bank Ltd. | | | 293,420 | | | | 4,954,789 | | |
Total Singapore common stocks | | | | | 18,431,935 | | |
South Korea—0.64% | |
LG Chem Ltd. | | | 6,998 | | | | 1,756,625 | | |
Samsung Electronics Co. Ltd. | | | 1,735 | | | | 1,976,812 | | |
Samsung Electronics Co. Ltd., GDR3 | | | 3,971 | | | | 2,275,383 | | |
Total South Korea common stocks | | | | | 6,008,820 | | |
Spain—3.27% | |
Banco Bilbao Vizcaya Argentaria SA | | | 39,185 | | | | 371,060 | | |
Banco Santander SA | | | 544,160 | | | | 3,977,234 | | |
Bankia SA* | | | 155,358 | | | | 137,029 | | |
Distribuidora Internacional de
Alimentacion SA | | | 53,243 | | | | 441,140 | | |
Iberdrola SA | | | 2,001,501 | | | | 11,050,190 | | |
Industria de Diseno Textil SA (Inditex) | | | 21,871 | | | | 2,915,427 | | |
Repsol SA | | | 127,440 | | | | 3,050,021 | | |
Telefonica SA* | | | 620,715 | | | | 8,848,105 | | |
Total Spain common stocks | | | | | 30,790,206 | | |
Sweden—1.55% | |
Electrolux AB, Series B | | | 129,738 | | | | 3,779,791 | | |
Modern Times Group AB, B Shares | | | 53,031 | | | | 2,487,957 | | |
| | | Number of
shares | | Value | |
Common stocks—(continued) | |
Sweden—(concluded) | |
Swedbank AB, A Shares | | | 169,196 | | | $ | 4,080,546 | | |
Telefonaktiebolaget LM Ericsson,
B Shares | | | 362,564 | | | | 4,285,811 | | |
Total Sweden common stocks | | | | | 14,634,105 | | |
Switzerland—8.86% | |
ABB Ltd.* | | | 353,474 | | | | 7,807,022 | | |
Compagnie Financiere Richemont SA,
A Shares | | | 94,063 | | | | 9,208,610 | | |
Credit Suisse Group* | | | 173,683 | | | | 5,102,859 | | |
Holcim Ltd.* | | | 29,306 | | | | 2,118,506 | | |
Nestle SA | | | 128,465 | | | | 8,703,610 | | |
Novartis AG | | | 311,131 | | | | 22,390,539 | | |
Roche Holding AG | | | 51,486 | | | | 12,684,432 | | |
Swiss Re AG* | | | 43,263 | | | | 3,445,333 | | |
Syngenta AG | | | 10,654 | | | | 4,228,445 | | |
Zurich Insurance Group AG* | | | 28,958 | | | | 7,794,519 | | |
Total Switzerland common stocks | | | | | 83,483,875 | | |
Taiwan—0.92% | |
HON HAI Precision
Industry Co. Ltd., GDR4 | | | 308,353 | | | | 1,597,268 | | |
HON HAI Precision
Industry Co. Ltd., GDR | | | 254,926 | | | | 1,320,517 | | |
Taiwan Semiconductor
Manufacturing Co. Ltd. | | | 883,000 | | | | 3,018,275 | | |
Taiwan Semiconductor
Manufacturing Co. Ltd., ADR | | | 162,200 | | | | 2,754,156 | | |
Total Taiwan common stocks | | | | | 8,690,216 | | |
Thailand—0.24% | |
Bangkok Bank Public Co. Ltd. | | | 340,300 | | | | 2,272,291 | | |
United Kingdom—23.03% | |
| 3i Group PLC | | | 58,063 | | | | 338,651 | | |
AMEC PLC | | | 269,508 | | | | 4,415,583 | | |
Anglo American PLC | | | 10,725 | | | | 229,721 | | |
Associated British Foods PLC | | | 16,204 | | | | 479,203 | | |
AstraZeneca PLC | | | 5,346 | | | | 271,222 | | |
Aveva Group PLC | | | 8,223 | | | | 300,722 | | |
Barclays PLC | | | 107,897 | | | | 472,554 | | |
Barratt Developments PLC* | | | 73,898 | | | | 366,481 | | |
BG Group PLC | | | 951,324 | | | | 17,171,051 | | |
BHP Billiton PLC | | | 5,962 | | | | 170,420 | | |
| BP PLC | | | 1,102,284 | | | | 7,622,121 | | |
Brammer PLC | | | 68,620 | | | | 412,072 | | |
British American Tobacco PLC | | | 217,259 | | | | 11,587,517 | | |
British Sky Broadcasting Group PLC | | | 277,282 | | | | 3,492,631 | | |
BT Group PLC | | | 742,156 | | | | 3,846,520 | | |
Burberry Group PLC | | | 14,982 | | | | 348,708 | | |
Centrica PLC | | | 372,339 | | | | 2,214,705 | | |
Compass Group PLC | | | 526,819 | | | | 7,196,784 | | |
Debenhams PLC | | | 225,665 | | | | 372,130 | | |
Diageo PLC | | | 98,857 | | | | 3,088,933 | | |
Domino's Pizza UK & IRL PLC | | | 38,411 | | | | 333,651 | | |
G4S PLC | | | 1,092,939 | | | | 3,739,263 | | |
155
PACE Select Advisors Trust
PACE International Equity Investments
Portfolio of investments—July 31, 2013
| | | Number of
shares | | Value | |
Common stocks—(concluded) | |
United Kingdom—(concluded) | |
GlaxoSmithKline PLC | | | 522,753 | | | $ | 13,391,811 | | |
HSBC Holdings PLC5 | | | 29,357 | | | | 329,886 | | |
HSBC Holdings PLC6 | | | 1,673,017 | | | | 19,032,091 | | |
Inmarsat PLC | | | 365,493 | | | | 3,800,303 | | |
InterContinental Hotels Group PLC | | | 182,628 | | | | 5,298,083 | | |
ITV PLC | | | 213,940 | | | | 548,719 | | |
Johnson Matthey PLC | | | 98,515 | | | | 4,248,700 | | |
Kingfisher PLC | | | 550,966 | | | | 3,331,675 | | |
National Grid PLC | | | 706,848 | | | | 8,457,178 | | |
Partnership Assurance Group PLC* | | | 46,711 | | | | 354,585 | | |
Pearson PLC | | | 158,503 | | | | 3,255,157 | | |
Persimmon PLC* | | | 199,956 | | | | 3,759,704 | | |
Prudential PLC | | | 549,350 | | | | 9,752,606 | | |
Rio Tinto PLC | | | 187,313 | | | | 8,420,272 | | |
Rolls-Royce Holdings PLC* | | | 29,572 | | | | 528,590 | | |
Royal Dutch Shell PLC, A Shares6 | | | 31,162 | | | | 1,060,928 | | |
Royal Dutch Shell PLC, A Shares7 | | | 340,055 | | | | 11,578,976 | | |
Royal Dutch Shell PLC, B Shares6 | | | 165,821 | | | | 5,851,061 | | |
SABMiller PLC | | | 93,868 | | | | 4,598,769 | | |
Serco Group PLC | | | 323,296 | | | | 3,083,675 | | |
SIG PLC | | | 145,306 | | | | 401,863 | | |
Standard Chartered PLC | | | 12,737 | | | | 295,390 | | |
Tate & Lyle PLC | | | 34,049 | | | | 434,577 | | |
Tesco PLC | | | 1,859,487 | | | | 10,389,981 | | |
Tullow Oil PLC | | | 153,858 | | | | 2,429,507 | | |
Unilever PLC | | | 215,380 | | | | 8,744,896 | | |
Vodafone Group PLC | | | 4,487,802 | | | | 13,483,464 | | |
WH Smith PLC | | | 30,675 | | | | 363,282 | | |
Whitbread PLC | | | 8,360 | | | | 410,780 | | |
William Hill PLC | | | 67,217 | | | | 497,465 | | |
WM Morrison Supermarkets PLC | | | 81,563 | | | | 358,709 | | |
Total United Kingdom common stocks | | | | | 216,963,326 | | |
Total common stocks
(cost—$822,367,128) | | | | | 920,279,770 | | |
| | | Number of
shares | | Value | |
Preferred stocks—0.80% | |
Germany—0.80% | |
Henkel AG & Co. KGaA Vorzug | | | 34,953 | | | $ | 3,424,239 | | |
Volkswagen AG | | | 17,376 | | | | 4,129,702 | | |
Total preferred stocks
(cost—$5,373,541) | | | | | 7,553,941 | | |
| | Face
amount | | | |
Repurchase agreement—1.92% | |
Repurchase agreement dated 07/31/13
with State Street Bank and Trust Co.,
0.010% due 08/01/13, collateralized
by $787,983 Federal Home Loan
Mortgage Corp. obligations,
1.960% due 11/07/22, $18,164,607
Federal National Mortgage
Association obligations, 2.140% to
2.170% due 11/07/22 and
$597,299 US Treasury Notes,
0.250% to 0.750% due 10/31/13
to 12/15/13; (value—$18,384,686);
proceeds: $18,024,005
(cost—$18,024,000) | | $ | 18,024,000 | | | | 18,024,000 | | |
| | | Number of
shares | | | |
Investment of cash collateral from securities loaned—0.58% | |
Money market fund—0.58% | |
UBS Private Money Market Fund LLC8
(cost—$5,492,556) | | | 5,492,556 | | | | 5,492,556 | | |
Total investments
(cost—$851,257,225)—100.97% | | | | | 951,350,267 | | |
Liabilities in excess of
other assets—(0.97)% | | | | | (9,142,247 | ) | |
Net assets—100.00% | | | | $ | 942,208,020 | | |
For a listing of defined portfolio acronyms, counterparty acronyms and currency abbreviations that are used throughout the Portfolio of investments as well as the tables that follow, please refer to page 218.
Aggregate cost for federal income tax purposes was $863,335,059; and net unrealized appreciation consisted of:
Gross unrealized appreciation | | $ | 131,706,307 | | |
Gross unrealized depreciation | | | (43,691,099 | ) | |
Net unrealized appreciation | | $ | 88,015,208 | | |
156
PACE Select Advisors Trust
PACE International Equity Investments
Portfolio of investments—July 31, 2013
Futures contracts
Number of
contracts | | Currency | | | | Expiration
date | | Cost | | Current
value | | Unrealized
appreciation | |
Index futures buy contracts: | | | |
2 | | AUD | | | | ASX SPI 200 Index Futures | | September 2013 | | $ | 214,563 | | | $ | 224,811 | | | $ | 10,248 | | |
24 | | EUR | | | | Euro STOXX 50 Index Futures | | September 2013 | | | 849,812 | | | | 878,293 | | | | 28,481 | | |
5 | | GBP | | | | FTSE 100 Index Futures | | September 2013 | | | 475,731 | | | | 497,530 | | | | 21,799 | | |
5 | | JPY | | | | TOPIX Index Futures | | September 2013 | | | 566,834 | | | | 572,162 | | | | 5,328 | | |
| | | | | | | | | | | $ | 2,106,940 | | | $ | 2,172,796 | | | $ | 65,856 | | |
Forward foreign currency contracts
| Counterparty | | Contracts to
deliver | | In
exchange for | | Maturity
date | | Unrealized
appreciation
(depreciation) | |
ANZ | | EUR | 1,200,328 | | | USD | 1,592,356 | | | 09/18/13 | | $ | (4,756 | ) | |
ANZ | | GBP | 864,188 | | | USD | 1,314,067 | | | 09/18/13 | | | (161 | ) | |
BB | | USD | 542,773 | | | CHF | 503,476 | | | 08/05/13 | | | 1,261 | | |
BNP | | HKD | 6,057,424 | | | USD | 781,329 | | | 09/18/13 | | | 143 | | |
BNP | | USD | 1,146,326 | | | DKK | 6,579,909 | | | 09/18/13 | | | 28,399 | | |
CITI | | CAD | 1,968,738 | | | USD | 1,931,437 | | | 09/18/13 | | | 16,852 | | |
CITI | | EUR | 415,750 | | | USD | 540,847 | | | 09/18/13 | | | (12,335 | ) | |
CITI | | GBP | 1,166,374 | | | USD | 1,778,602 | | | 09/18/13 | | | 4,820 | | |
CITI | | USD | 18,325,112 | | | AUD | 19,179,100 | | | 09/18/13 | | | (1,140,653 | ) | |
CITI | | USD | 6,289,919 | | | CHF | 5,805,099 | | | 09/18/13 | | | (14,913 | ) | |
CITI | | USD | 2,944,639 | | | GBP | 1,930,490 | | | 09/18/13 | | | (8,815 | ) | |
CSI | | GBP | 619,120 | | | EUR | 727,562 | | | 09/18/13 | | | 26,529 | | |
GSI | | EUR | 688,612 | | | AUD | 994,314 | | | 09/18/13 | | | (25,336 | ) | |
GSI | | EUR | 717,546 | | | JPY | 90,779,256 | | | 09/18/13 | | | (27,346 | ) | |
GSI | | GBP | 5,348,108 | | | USD | 8,353,745 | | | 09/18/13 | | | 220,525 | | |
GSI | | USD | 551,755 | | | CHF | 523,874 | | | 09/18/13 | | | 14,525 | | |
GSI | | USD | 1,640,598 | | | EUR | 1,254,966 | | | 09/18/13 | | | 29,212 | | |
GSI | | USD | 543,501 | | | GBP | 347,755 | | | 09/18/13 | | | (14,647 | ) | |
GSI | | USD | 814,037 | | | JPY | 81,232,765 | | | 09/18/13 | | | 15,830 | | |
HSBC | | EUR | 549,694 | | | USD | 727,646 | | | 09/18/13 | | | (3,757 | ) | |
HSBC | | SEK | 5,170,481 | | | USD | 798,449 | | | 09/18/13 | | | 6,029 | | |
HSBC | | USD | 750,763 | | | JPY | 73,022,051 | | | 09/18/13 | | | (4,776 | ) | |
RBC | | USD | 774,965 | | | EUR | 600,699 | | | 09/18/13 | | | 24,303 | | |
RBS | | USD | 534,238 | | | GBP | 350,700 | | | 09/18/13 | | | (906 | ) | |
SSC | | AUD | 10,960,500 | | | USD | 10,075,220 | | | 10/31/13 | | | 282,211 | | |
SSC | | EUR | 3,629,285 | | | USD | 4,836,857 | | | 09/18/13 | | | 7,868 | | |
SSC | | HKD | 54,091,658 | | | USD | 6,972,519 | | | 09/18/13 | | | (3,327 | ) | |
SSC | | USD | 2,137,569 | | | NOK | 12,326,290 | | | 09/18/13 | | | (49,459 | ) | |
SSC | | USD | 4,535,334 | | | SGD | 5,673,158 | | | 09/18/13 | | | (71,126 | ) | |
WBC | | JPY | 539,017,640 | | | USD | 5,682,124 | | | 09/18/13 | | | 175,564 | | |
WBC | | SEK | 3,906,670 | | | USD | 601,931 | | | 09/18/13 | | | 3,200 | | |
| | $ | (525,042 | ) | |
157
PACE Select Advisors Trust
PACE International Equity Investments
Portfolio of investments—July 31, 2013
Fair valuation summary
The following is a summary of the fair valuations according to the inputs used as of July 31, 2013 in valuing the Portfolio's investments:
| | Unadjusted
quoted prices in
active markets for
identical investments
(Level 1) | | Other significant
observable inputs
(Level 2) | | Unobservable
inputs
(Level 3) | | Total | |
Common stocks | | $ | 920,279,729 | | | $ | — | | | $ | 41 | | | $ | 920,279,770 | | |
Preferred stocks | | | 7,553,941 | | | | — | | | | — | | | | 7,553,941 | | |
Repurchase agreement | | | — | | | | 18,024,000 | | | | — | | | | 18,024,000 | | |
Investment of cash collateral from securities loaned | | | — | | | | 5,492,556 | | | | — | | | | 5,492,556 | | |
Futures contracts, net | | | 65,856 | | | | — | | | | — | | | | 65,856 | | |
Forward foreign currency contracts, net | | | — | | | | (525,042 | ) | | | — | | | | (525,042 | ) | |
Total | | $ | 927,899,526 | | | $ | 22,991,514 | | | $ | 41 | | | $ | 950,891,081 | | |
At July 31, 2013, there were no transfers between Level 1 and Level 2. At July 31, 2012, $732,148,623 of foreign investments were classified within Level 2 of the fair value hierarchy pursuant to the Portfolio's fair valuation procedures.
The following is a rollforward of the Portfolio's investments that were valued using unobservable inputs (Level 3) for the year ended July 31, 2013:
| | Common
stocks | |
Beginning balance | | $ | — | | |
Purchases | | | — | | |
Sales | | | — | | |
Accrued discounts/(premiums) | | | — | | |
Total realized gain/(loss) | | | — | | |
Net change in unrealized appreciation/depreciation | | | — | | |
Transfers into Level 3 | | | 41 | | |
Transfers out of Level 3 | | | — | | |
Ending balance | | $ | 41 | | |
The change in net unrealized appreciation/depreciation relating to the Level 3 investments held at July 31, 2013 was $2. Transfer into Level 3 represents the value at the end of the year. At July 31, 2013, two securities were transferred from Level 2 to Level 3 as the valuations are based primarily on unobservable inputs.
Portfolio footnotes
* Non-income producing security.
1 Security, or portion thereof, was on loan at July 31, 2013.
2 Illiquid investments representing 0.00% of net assets as of July 31, 2013.
3 Security exempt from registration pursuant to Rule 144A under the Securities Act of 1933. This security, which represents 0.24% of net assets as of July 31, 2013, is considered liquid and may be resold in transactions exempt from registration, normally to qualified institutional buyers.
4 Security is traded on the over-the-counter ("OTC") market.
5 Security is traded on the Hong Kong Exchange.
6 Security is traded on the London Exchange.
7 Security is traded on the Amsterdam Exchange.
158
PACE Select Advisors Trust
PACE International Equity Investments
Portfolio of investments—July 31, 2013
8 The table below details the Portfolio's transaction activity in an affiliated issuer during the year ended July 31, 2013. The investment manager earns a management fee from UBS Private Money Market Fund LLC. Please see the Notes to financial statements for further information.
Security description | | Value at
07/31/12 | | Purchases
during the
year ended
07/31/13 | | Sales
during the
year ended
07/31/13 | | Value at
07/31/13 | | Net income
earned from
affiliate for the
the year ended
07/31/13 | |
UBS Private Money Market Fund LLC | | $ | 26,182,588 | | | $ | 492,423,678 | | | $ | 513,113,710 | | | $ | 5,492,556 | | | $ | 14,319 | | |
See accompanying notes to financial statements.
159
PACE Select Advisors Trust
PACE International Emerging Markets Equity Investments
Performance
For the 12 months ended July 31, 2013, the Portfolio's Class P shares returned 4.87% before the deduction of the maximum PACE Select program fee. (Class P shares returned 2.80% after the deduction of the maximum PACE Select program fee for the same 12-month period.) In comparison, the MSCI Emerging Markets Index (the "benchmark") returned 2.29%, and the Lipper Emerging Markets Funds category posted a median return of 3.90%. (Returns for all share classes over various time periods are shown in the "Performance at a glance" table on page 166. Please note that the returns shown do not reflect the deduction of taxes that a shareholder would pay on Portfolio distributions or the redemption of Portfolio shares.) For a detailed commentary on the market environment in general during the reporting period, please refer to page 2.
Sub-Advisors' comments1
Please note: On October 16, 2012, Lee Munder Capital Group, LLC began serving as a third Sub-Advisor for this Fund, replacing Delaware and Pzena, which were both terminated as Sub-Advisors for the Portfolio effective October 15, 2012.
Mondrian
Our portion of the Portfolio outperformed the benchmark during the reporting period. Stock selection was the primary driver of our outperformance, with strong results achieved in Latin America, China and Indonesia. Market and currency selection slightly detracted from results, primarily due to our overweight to Latin America, where currency weakness further reduced returns in poor performing local markets. Also detracting from relative results was our underweight to Taiwan, where the market and currency were relatively buoyant. At the sector level, we benefited from good stock selection in the utilities sector, an underweight to the materials sector and our positioning in consumer discretionary stocks. However, these positives were offset by the negative impact on relative results of our underweight to the information technology sector.
In Latin America, the positive impact of our increased exposure to Mexico and strong stock selection in Peru, Brazil and Chile were partially offset by the negative impact of overweighting the latter three countries, where exposure to commodity sectors negatively impacted returns. Mexican financial holdings Compartamos and Santander Mexico performed well, along
PACE Select Advisors Trust – PACE
International Emerging Markets
Equity Investments
Investment Sub-Advisors:
Mondrian Investment Partners Limited ("Mondrian"),
Delaware Management Company ("Delaware") until October 15, 2012,
Pzena Investment Management, LLC ("Pzena") until October 15, 2012,
William Blair & Company L.L.C.
("William Blair") and
Lee Munder Capital Group, LLC ("Lee Munder")
Portfolio Managers:
Mondrian: Ginny Chong, Gregory Halton and Andrew Miller
Delaware: Liu-Er Chen
Pzena: Allison Fisch, Caroline Cai and John P. Goetz
William Blair: Todd M. McClone and Jeffrey A. Urbina
Lee Munder: Gordon Johnson, Shannon Ericson and Vikram Srimurthy
Objective:
Capital appreciation
Investment process:
Mondrian conducts research on a global basis in an effort to identify securities that have the potential for capital appreciation over a market cycle. The center of its research effort is a value-oriented dividend discount methodology toward individual securities and market analysis that attempts to identify value across country boundaries. This approach focuses on future anticipated dividends, and discounts
1 All Sub-Advisors discuss performance on a gross of fees basis—meaning that no fees or expenses are reflected in their sleeves'/sleeve's performance. Alternately, Portfolio performance is shown net of fees, which does factor in fees and expenses associated with the Portfolio.
160
PACE Select Advisors Trust
PACE International Emerging Markets Equity Investments
Sub-Advisors' comments – continued
with paper products company Kimberly-Clark de Mexico. In Peru, leading financial institution Credicorp significantly outperformed the benchmark, while in Chile, utility holdings Enersis and IAM contributed to results. In Asia, our portion of the Portfolio benefited on a relative basis from correctly underweighting the Korean market and overweighting the relatively stronger performance of China and India. However, this positive performance was offset by underweight exposures to Taiwan and Malaysia.
As mentioned, stock selection was the main driver of our outperformance, with strong results achieved in China, where gaming company Sands China and defensive stocks such as gas utility China Gas, healthcare equipment provider Mindray and personal hygiene products company Hengan all performed well. In Indonesia, we benefited from exposure to the gas utility Perusahaan Gas and micro-lending specialist Bank Rakyat Indonesia. These gains were partially offset by poor performance from infrastructure-related stocks in India, where our exposure to engineering group Larsen & Toubro and power sector lender Rural Electrification Co. held back the gains achieved in other areas. We believe that the decline in the share prices of both Larsen & Toubro and Rural Electrification Co. was not justified by the underlying financial performance of these two companies. As a result, we believe that the market is undervaluing the long term prospects for these stocks and continue to hold them in the Portfolio. Elsewhere, our portion of the Portfolio benefited from good positioning in South Africa, underweighting Russia and overweighting Turkey.
There were no derivative positions held or traded during the reporting period.
William Blair
Our portion of the Portfolio outperformed the benchmark during the reporting period. Our focus on growth companies with leading market positions and good operating performance aided results. In addition, strong stock selection drove our relative and absolute returns. Stock selection in the consumer discretionary sector was bolstered by strong operating performance by Great Wall Motor, due to solid demand for their SUVs in China, coupled with good expectations for its new models. Naspers, a South African media company, also added value. Detracting from our portion of the Portfolio's performance was oil/gas stock selection within the energy sector. Elsewhere, performance in the financials sector was hampered by weakness in our Latin American holdings, and Turkish state-owned bank Halk Bank
Investment process (continued)
the value of those dividends back to what they would be worth if they were being paid today. Comparisons of the values of different possible investments are then made. In an international portfolio, currency returns can be an integral component of an investment's total return. Mondrian uses a purchasing power parity approach to assess the value of individual currencies. Purchasing power parity attempts to identify the amount of goods and services that a dollar will buy in the United States, and compares that to the amount of a foreign currency required to buy the same amount of goods and services in another country.
Delaware selects growth-oriented and value-oriented investments on the basis of the investment's discount to its intrinsic value. When selecting growth-oriented securities, Delaware typically seeks high growth caused by long-term economic factors, which may include demographics, economic deregulation, and technological developments. When selecting value-oriented securities, Delaware typically seeks lower valuations caused by cyclical economic factors or temporary changes in business operations. Strong management and sustainable business franchise are key considerations in selecting both growth-oriented and value-oriented securities.
Pzena follows a disciplined investment process to implement its value philosophy. Pzena focuses exclusively on companies that are underperforming their historically demonstrated earnings power, and applies intensive fundamental research to these companies in an effort to determine whether the causes of the earnings shortfall are temporary or permanent. Pzena looks for companies where, in its opinion: (1) the
161
PACE Select Advisors Trust
PACE International Emerging Markets Equity Investments
Sub-Advisors' comments – continued
underperformed, due to concerns about demonstrations and the government's response. While there were certainly some external factors, we believe they are short term in nature and the fundamentals of the stock remain strong and we continue to hold our position in Halk Bank.
Our overweights to healthcare and consumer staples and underweights in materials and energy added value. Within materials, we benefited from an underweight in metals/mining companies. Our healthcare stocks substantially outperformed the benchmark, partially due to strong performance by Sun Pharmaceutical and IHH Healthcare. Regionally, stock selection added value across all regions, particularly in Europe, the Middle East and Africa (EMEA) and Latin America. In EMEA, strong performance by stocks held in Qatar and the UAE (frontier markets) added value, as did strong stock selection in Russia and South Africa, given our lack of resources exposure. Within Latin America, strong performance in Brazil and Chile more than offset weakness in resource-oriented holdings in the region.
Derivatives were not used during the reporting period.
Lee Munder
Our portion of the Portfolio outperformed the benchmark during the reporting period from our inception as a Sub-Advisor on October 16, 2012 through July 31, 2013. Emerging market equities faltered during much of the period we managed a portion of the Portfolio. This was largely due to slow growth in China and concerns in early 2013 that the banking crisis in Cyprus could spill over to neighboring emerging markets. In this uncertain market, our Market Dynamics factor, which ranks stocks versus their peers on earnings growth prospects and relative strength, added the most value. In uncertain times, investors tend to favor stocks that have good earnings growth prospects while exiting stocks that had previously been more attractive on a valuation basis. As a result of the market's focus away from cheapness, our Valuation factor, which evaluates stocks on several relative value measures, was negative for performance during the reporting period, especially so at the height of the uncertainty that followed the Federal Reserve Board's announcement in May 2013 that it might end or slow its stimulus program. To draw a contrast, global equity markets were soaring at the very end of 2012 on hopes that the US government would reach an agreement on taxes and spending to avert the "fiscal cliff," and our Valuation factor was especially additive to performance at that time. Elsewhere, the performance from
Investment process (continued)
current market price is low compared to the company's normalized earnings power; (2) current earnings are below historic norms; (3) the problems are temporary; (4) management has a viable strategy to generate earnings recovery; and/or (5) there is meaningful downside protection in case the earnings recovery does not materialize.
William Blair invests in a portfolio of mid cap and large cap equity securities issued by companies in emerging markets worldwide, according to a quality growth philosophy. William Blair's primary focus is on identifying such companies whose growth characteristics (rate and durability) are underestimated by the market and supported by quality management and strong competitive positioning. After screening the universe of emerging country issuers for certain quality, growth and liquidity characteristics to create a prospective list of investible securities, William Blair undertakes detailed fundamental analysis of these companies, focusing attention on areas where short- to intermediate-term earnings trends and overall operating performance are improving or are strong. Key considerations are the sustainability of a company's competitive advantage relative to peers, its industry and market conditions, a sound financial structure and high reinvestment rates that combine to create favorable conditions for prospective growth.
Lee Munder uses a bottom-up quantitative approach to investing in emerging markets equity securities. Inefficiencies in the market create opportunities, and Lee Munder believes that a quantitative process, which relies on sophisticated mathematical or statistical models in selecting investments, is well-suited to capture these inefficiencies
162
PACE Select Advisors Trust
PACE International Emerging Markets Equity Investments
Sub-Advisors' comments – continued
our Quality factor, which assesses a company's earnings quality as well as its operating efficiency and use of capital, was muted during the reporting period.
Positive stock selection accounted for the majority of our outperformance, whether measured on a sector basis or by country. Across sectors, stock selection in consumer staples and industrials was the most additive to performance. We also benefited from an underweight to the materials sector. On the negative side, we underperformed in the consumer discretionary sector. In terms of country exposures, stock selection was strongest in Indonesia, Malaysia and South Africa. Country allocations were beneficial to performance, particularly our underweight in Brazil and overweight in Thailand. However, our overall positioning in China detracted from performance during the reporting period.
Derivatives were not used during the reporting period.
Delaware (Note: Delaware was terminated as a Sub-Advisor for the Portfolio effective October 15, 2012, and its portion of the Portfolio was transitioned to Lee Munder Capital Group on October 16, 2012. The following commentary only covers the period of time during which Delaware sub-advised a portion of the Portfolio, from August 1, 2012 to October 15, 2012.)
Our portion of the Portfolio outperformed its benchmark during the reporting period. Our overweight in consumer staples contributed to performance during the reporting period. In particular, shares of KT&G, a Korean manufacturer of tobacco and ginseng products, rose after reporting steady earnings growth and due to the general defensive nature of its business. Tingyi, a Chinese beverage and noodle maker, and Brasil Foods, a diversified food manufacturer, also contributed to performance during the reporting period.
Our allocation to the materials sector was another key source of positive performance, largely driven by our position in Mexico-based Cemex, one of the world's largest cement producers. Shares of Cemex rose as the company took steps to restructure its high level of debt and also due to signs of fundamental improvement in key markets, including the US.
Energy also contributed to our performance, primarily due to an overweight in Petrobras, a Brazilian integrated oil producer. Shares of Petrobras moved higher as investors became more comfortable with the company's large capital expenditure plans for its newest offshore oil fields.
Only two sectors detracted from performance during the period: financials and healthcare. In the financials sector, South Africa's Standard Bank was a key detractor from performance, as investors became concerned about weak economic growth and its impact on new lending. Banco Santander do Brasil detracted from performance, as Brazil's economy slowed sharply during the reporting period. Despite their underperformance, we still to hold both Standard Bank and Banco Santander do Brasil in our portion of the Portfolio as we continue to believe in their strong fundamentals. Some of this underperformance was offset by the positive contributions of Korea's KB Financial and Hungary's OTP Bank. We subsequently sold our position in OTP Bank due to deteriorating fundamentals in several of its key markets. Healthcare detracted from our relative performance, as we maintained a zero weighting in the sector due to a lack of companies that met our investment criteria.
Derivatives were not used during the reporting period.
Investment process (concluded)
and provide an opportunity to outperform the market. Lee Munder's stock selection model groups factors used to select investments into three major categories: market dynamics, value and quality.
163
PACE Select Advisors Trust
PACE International Emerging Markets Equity Investments
Sub-Advisors' comments – concluded
Pzena (Note: Pzena was terminated as a Sub-Advisor for the Portfolio effective October 15, 2012, and its portion of the Portfolio was transitioned to Lee Munder Capital Group. The following commentary only covers the period of time during which Pzena sub-advised a portion of the Portfolio, from August 1, 2012 to October 15, 2012.)
Our portion of the Portfolio significantly outperformed the benchmark during the reporting period. Our performance benefited from our deep value positioning, as emerging markets equities rebounded from weakness in the first half of 2012. The positive trend seen in emerging markets equities was in line with broader global markets, as investors became more optimistic regarding the European sovereign debt crisis, the US "fiscal cliff" and China's ability to avoid a hard landing for its economy. With the exception of utilities, all sectors positively contributed to our performance during the reporting period. The broad-based nature of our outperformance was reflected in the diversity of the top performing stocks in our portfolio, such as Usiminas (industrials), Hon Hai (information technology) and Petrobras (energy). The largest individual detractors from performance were also diverse and reflected individual stock issues, including Texwinca Holdings (manufacturing), Huadian Power (utilities) and Compal Electronics (information technology). Despite being detractors for the reporting period, we continued to hold our positions in Texwinca Holdings, Huadian Power and Compal Electronics as we had not changed our long term view of normalized earnings for these companies.
During the reporting period, emerging markets equity performance was similar to that of developed market equities, as the more defensive sectors, such as health care and consumer staples, outperformed more economically sensitive sectors. While the two heaviest-weighted countries in the benchmark, China and Brazil, fared relatively poorly, Taiwan and India posted impressive returns. Government reform measures in India are expected to avert the possibility of a credit rating downgrade and, consequently, these actions boosted stocks as well as the rupee during the reporting period.
We did not employ the use of derivatives during the reporting period.
Special considerations
The Portfolio may be appropriate for long-term investors seeking capital appreciation who are able to withstand short-term fluctuations in the equity markets in return for potentially higher returns over the long term. The value of the Portfolio changes every day and can be affected by changes in interest rates, general market conditions and other political, social and economic developments, as well as specific matters relating to the companies in whose securities the Portfolio invests. It is important to note that an investment in the Portfolio is only one component of a balanced investment plan. The value of the Portfolio's investments in foreign securities may fall due to adverse political, social, and economic developments abroad and due to decreases in foreign currency values relative to the US dollar. These risks are greater for investments in emerging market issuers than for issuers in more developed countries.
164
PACE Select Advisors Trust
PACE International Emerging Markets Equity Investments
Illustration of an assumed investment of $10,000 in Class P shares of the Portfolio (unaudited)
The following graph depicts the performance of PACE International Emerging Markets Equity Investments Class P shares versus the MSCI Emerging Markets Index over the 10 years ended July 31, 2013. The performance of the other classes will vary based upon the different class specific expenses and sales charges. The performance provided does not reflect the deduction of taxes that a shareholder would pay on Portfolio distributions or the redemption of Portfolio shares. Past performance is no guarantee of future results. Share price and returns will vary with market conditions; investors may realize a gain or loss upon redemption. It is important to note that PACE International Emerging Markets Equity Investments is a professionally managed portfolio while the Index is not available for investment and is unmanaged. The comparison is shown for illustration purposes only.
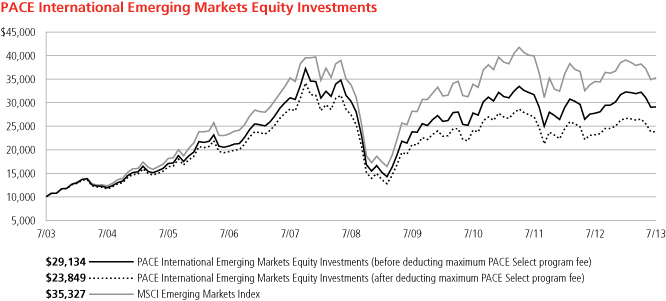
165
PACE Select Advisors Trust
PACE International Emerging Markets Equity Investments
Performance at a glance (unaudited)
Average annual total returns for periods ended 07/31/13 | | 1 year | | 5 years | | 10 years | |
Before deducting maximum sales charge or PACE Select program fee | |
Class A1 | | | 4.81 | % | | | (0.81 | )% | | | 11.23 | % | |
Class C2 | | | 3.99 | % | | | (1.54 | )% | | | 10.40 | % | |
Class Y3 | | | 5.13 | % | | | (0.52 | )% | | | 11.61 | % | |
Class P4 | | | 4.87 | % | | | (0.79 | )% | | | 11.29 | % | |
After deducting maximum sales charge or PACE Select program fee | |
Class A1 | | | (0.97 | )% | | | (1.92 | )% | | | 10.60 | % | |
Class C2 | | | 2.99 | % | | | (1.54 | )% | | | 10.40 | % | |
Class P4 | | | 2.80 | % | | | (2.76 | )% | | | 9.08 | % | |
MSCI Emerging Markets Index5 | | | 2.29 | % | | | 0.86 | % | | | 13.45 | % | |
Lipper Emerging Markets Funds median | | | 3.90 | % | | | 0.05 | % | | | 12.41 | % | |
Average annual total returns for periods ended June 30, 2013, after deduction of the maximum sales charge or PACE Select program fee, were as follows: Class A—1-year period, (0.42)%; 5-year period, (2.78)%; 10-year period, 11.31%; Class C—1-year period, 3.47%; 5-year period, (2.42)%; 10-year period, 11.09%; Class Y—1-year period, 5.58%; 5-year period, (1.40)%; 10-year period, 12.32%; Class P—1-year period, 3.24%; 5-year period, (3.61)%; 10-year period, 9.77%.
The annualized gross and net expense ratios, respectively, for each class of shares as in the November 28, 2012 prospectuses, were as follows: Class A—1.90% and 1.90%; Class C—2.65% and 2.65%; Class Y—1.67% and 1.67%; and Class P—1.88% and 1.88%. Net expenses reflect fee waivers and/or expense reimbursements, if any, pursuant to an agreement that is in effect to cap the expenses. The Portfolio and UBS Global Asset Management (Americas) Inc. ("UBS Global AM") have entered into a written fee waiver/expense reimbursement agreement pursuant to which UBS Global AM is contractually obligated to waive its management fees and/or reimburse expenses so that the Portfolio's ordinary total operating expenses of each class through November 30, 2013 (excluding dividend expense, borrowing costs, and interest expense relating to short sales, and expenses attributable to investment in other investment companies, interest, taxes, brokerage commissions and extraordinary expenses) would not exceed Class A—2.15%; Class C—2.90%; Class Y—1.90%; and Class P—1.90%. The Portfolio has agreed to repay UBS Global AM for any waived fees/reimbursed expenses to the extent that it can do so over the following three fiscal years without causing the Portfolio's expenses in any of those three years to exceed these expense caps. The fee waiver/expense reimbursement agreement may be terminated by the Portfolio's board at any time and also will terminate automatically upon the expiration or termination of the Portfolio's advisory contract with UBS Global AM. Upon termination of the agreement, however, UBS Global AM's three year recoupment rights will survive.
1 Maximum sales charge for Class A shares is 5.5%. Class A shares bear ongoing 12b-1 service fees.
2 Maximum contingent deferred sales charge for Class C shares is 1% imposed on redemptions and is reduced to 0% after one year. Class C shares bear ongoing 12b-1 service and distribution fees. Prior to September 30, 2003, Class C shares were subject to a maximum front-end sales charge of 1%; this front-end sales charge is not reflected in the average annual total returns presented for the Class C shares shown above.
3 The Portfolio offers Class Y shares to a limited group of eligible investors, including certain qualifying retirement plans. Class Y shares do not bear initial or contingent deferred sales charges or ongoing 12b-1 service and distribution fees.
4 Class P shares do not bear initial or contingent deferred sales charges or ongoing 12b-1 service and distribution fees, but are subject to a maximum annual PACE Select program fee of 2% of the value of Class P shares. Prior to June 14, 2010, the maximum annual PACE Select program fee was 1.5% of the value of Class P shares; however, the current maximum annual PACE Select program fee of 2% is reflected in the performance returns throughout all periods in the average annual total returns presented for the Class P shares shown above.
5 The MSCI Emerging Markets Index is a market capitalization-weighted index composed of different emerging market countries in Europe, Latin America, and the Pacific Basin. The index is constructed and managed with a view to being fully investable from the perspective of international institutional investors. Investors should note that indices do not reflect the deduction of fees and expenses.
If an investor sells or exchanges shares less than 90 days after purchase, a redemption fee of 1.00% of the amount sold or exchanged will be deducted at the time of the transaction, except as noted otherwise in the prospectuses.
Past performance does not predict future performance, and the performance information provided does not reflect the deduction of taxes that a shareholder would pay on Portfolio distributions or the redemption of Portfolio shares. The return and principal value of an investment will fluctuate, so that an investor's shares, when redeemed, may be worth more or less than their original cost. Performance results assume reinvestment of all dividends and capital gain distributions at net asset value on the ex-dividend dates. Current performance may be higher or lower than the performance data quoted. For month-end performance figures, please visit http://globalam-us.ubs.com/corpweb/performance.do.
Lipper peer group data calculated by Lipper Inc.; used with permission. The Lipper median is the return of the fund that places in the middle of a Lipper peer group.
166
PACE Select Advisors Trust
PACE International Emerging Markets Equity Investments
Portfolio statistics (unaudited)
Characteristics | | 07/31/13 | |
Net assets (mm) | | $ | 366.4 | | |
Number of holdings | | | 214 | | |
Portfolio composition1 | | 07/31/13 | |
Common stocks and preferred stocks | | | 77.8 | % | |
ADRs, GDRs and NVDRs | | | 15.4 | | |
Investment companies | | | 4.0 | | |
Cash equivalents and other assets less liabilities | | | 2.8 | | |
Total | | | 100.0 | % | |
Regional allocation (equity investments)1,2 | | 07/31/13 | |
Asia | | | 54.2 | % | |
The Americas | | | 18.2 | | |
Europe and European territories | | | 8.9 | | |
Africa | | | 7.6 | | |
Russia | | | 4.3 | | |
Total | | | 93.2 | % | |
Top five countries (equity investments)1,2 | | 07/31/13 | |
South Korea | | | 11.8 | % | |
Brazil | | | 9.9 | | |
South Africa | | | 7.4 | | |
Taiwan | | | 7.1 | | |
India | | | 6.0 | | |
Total | | | 42.2 | % | |
Top five sectors1,2 | | 07/31/13 | |
Financials | | | 21.7 | % | |
Information technology | | | 12.2 | | |
Consumer staples | | | 11.3 | | |
Consumer discretionary | | | 9.7 | | |
Telecommunication services | | | 8.9 | | |
Total | | | 63.8 | % | |
Top ten equity holdings1,2 | | 07/31/13 | |
Samsung Electronics Co. Ltd. | | | 3.4 | % | |
China Mobile Ltd. | | | 2.4 | | |
Taiwan Semiconductor Manufacturing Co. Ltd. | | | 1.6 | | |
Hyundai Mobis | | | 1.4 | | |
Gazprom, ADR | | | 1.3 | | |
Sberbank, ADR | | | 1.3 | | |
SABMiller PLC | | | 1.1 | | |
PT Bank Rakyat Indonesia (Persero) Tbk | | | 1.0 | | |
PT Bank Mandiri (Persero) Tbk | | | 1.0 | | |
MTN Group Ltd. | | | 0.9 | | |
Total | | | 15.4 | % | |
For a listing of defined portfolio acronyms that are used throughout the Portfolio statistics, please refer to page 218.
1 Weightings represent percentages of the Portfolio's net assets as of July 31, 2013. The Portfolio is actively managed and its composition will vary over time.
2 Figures represent the breakdown of direct investments of PACE International Emerging Markets Equity Investments. Figures would be different if a breakdown of the underlying investment companies was included.
167
PACE Select Advisors Trust
PACE International Emerging Markets Equity Investments
Industry diversification—(unaudited)
As a percentage of net assets as of July 31, 2013
Common stocks
Aerospace & defense | | | 0.19 | % | |
Airlines | | | 1.37 | | |
Auto components | | | 1.43 | | |
Automobiles | | | 3.34 | | |
Beverages | | | 2.40 | | |
Building products | | | 0.52 | | |
Chemicals | | | 1.09 | | |
Commercial banks | | | 13.49 | | |
Computers & peripherals | | | 0.64 | | |
Construction & engineering | | | 0.74 | | |
Consumer finance | | | 0.75 | | |
Distributors | | | 0.52 | | |
Diversified consumer services | | | 0.24 | | |
Diversified financial services | | | 1.66 | | |
Diversified telecommunication services | | | 2.82 | | |
Electric utilities | | | 1.68 | | |
Electronic equipment, instruments & components | | | 0.47 | | |
Food & staples retailing | | | 2.06 | | |
Food products | | | 3.17 | | |
Gas utilities | | | 0.75 | | |
Health care equipment & supplies | | | 0.51 | | |
Health care providers & services | | | 1.58 | | |
Hotels, restaurants & leisure | | | 1.52 | | |
Household durables | | | 1.22 | | |
Household products | | | 0.35 | | |
Independent power producers & energy traders | | | 1.24 | | |
Industrial conglomerates | | | 2.29 | | |
Insurance | | | 1.07 | | |
Internet software & services | | | 1.23 | | |
IT services | | | 1.37 | | |
Life sciences tools & services | | | 0.65 | | |
Media | | | 0.45 | | |
Metals & mining | | | 1.97 | | |
Multiline retail | | | 0.98 | | |
Common stocks—(concluded)
Oil, gas & consumable fuels | | | 7.57 | % | |
Paper & forest products | | | 0.47 | | |
Personal products | | | 0.88 | | |
Pharmaceuticals | | | 0.97 | | |
Real estate investment trusts | | | 0.89 | | |
Real estate management & development | | | 1.93 | | |
Road & rail | | | 0.09 | | |
Semiconductors & semiconductor equipment | | | 8.45 | | |
Specialty retail | | | 0.45 | | |
Thrifts & mortgage finance | | | 1.39 | | |
Tobacco | | | 0.84 | | |
Transportation infrastructure | | | 2.83 | | |
Water utilities | | | 0.53 | | |
Wireless telecommunication services | | | 6.06 | | |
Total common stocks | | | 89.11 | | |
Preferred stocks
Automobiles | | | 0.18 | | |
Beverages | | | 0.86 | | |
Chemicals | | | 0.44 | | |
Commercial banks | | | 0.56 | | |
Food & staples retailing | | | 0.33 | | |
Metals & mining | | | 0.88 | | |
Oil, gas & consumable fuels | | | 0.39 | | |
Paper & forest products | | | 0.49 | | |
Total preferred stocks | | | 4.13 | | |
Investment companies | | | 4.02 | | |
Repurchase agreement | | | 2.57 | | |
Investments of cash collateral from securities loaned | | | 9.33 | | |
Liabilities in excess of other assets | | | (9.16 | ) | |
Net assets | | | 100.00 | % | |
168
PACE Select Advisors Trust
PACE International Emerging Markets Equity Investments
Portfolio of investments—July 31, 2013
| | | Number of
shares | | Value | |
Common stocks—89.11% | |
Bermuda—1.82% | |
China Gas Holdings Ltd. | | | 418,000 | | | $ | 472,673 | | |
COSCO Pacific Ltd. | | | 1,072,000 | | | | 1,506,627 | | |
Credicorp Ltd. | | | 23,852 | | | | 2,833,379 | | |
Huabao International Holdings Ltd.1 | | | 1,198,000 | | | | 515,927 | | |
VimpelCom Ltd., ADR | | | 133,680 | | | | 1,338,137 | | |
Total Bermuda common stocks | | | | | 6,666,743 | | |
Brazil—5.92% | |
Banco Bradesco SA, ADR1 | | | 178,887 | | | | 2,185,999 | | |
BB Seguridade Participacoes SA* | | | 178,700 | | | | 1,444,420 | | |
BR Malls Participacoes SA | | | 61,450 | | | | 544,642 | | |
Cielo SA | | | 60,092 | | | | 1,481,392 | | |
Companhia de Concessoes
Rodoviarias (CCR) | | | 316,100 | | | | 2,480,194 | | |
Companhia de Saneamento Basico do
Estado de Sao Paulo-SABESP ADR*,1 | | | 158,154 | | | | 1,628,986 | | |
| CPFL Energia SA | | | 91,500 | | | | 846,676 | | |
Cyrela Brazil Realty SA
Empreendimentos e Participacoes | | | 206,200 | | | | 1,472,373 | | |
Diagnosticos da America SA | | | 76,400 | | | | 400,193 | | |
EcoRodovias Infraestrutura e
Logistica SA | | | 149,800 | | | | 1,053,889 | | |
Embraer SA, ADR1 | | | 20,074 | | | | 681,914 | | |
Grupo BTG Pactual | | | 104,600 | | | | 1,263,627 | | |
Hypermarcas SA | | | 240,300 | | | | 1,739,038 | | |
JBS SA | | | 506,200 | | | | 1,413,415 | | |
Kroton Educacional SA | | | 62,600 | | | | 891,797 | | |
Localiza Rent A Car SA | | | 23,135 | | | | 329,580 | | |
Transmissora Alianca de Energia
Eletrica SA | | | 64,300 | | | | 643,465 | | |
Ultrapar Participacoes SA | | | 32,300 | | | | 766,671 | | |
Vale SA, ADR1 | | | 30,400 | | | | 417,088 | | |
Total Brazil common stocks | | | | | 21,685,359 | | |
Canada—0.45% | |
Pacific Rubiales Energy Corp.1 | | | 84,392 | | | | 1,640,841 | | |
Cayman Islands—4.36% | |
Belle International Holdings Ltd. | | | 1,133,976 | | | | 1,637,595 | | |
Chaoda Modern Agriculture
Holdings Ltd.*,1,2 | | | 1,038,000 | | | | 1,338 | | |
Geely Automobile Holdings Ltd.1 | | | 3,415,000 | | | | 1,426,660 | | |
Golden Eagle Retail Group Ltd.1 | | | 420,000 | | | | 617,360 | | |
Hengan International
Group Co. Ltd.1 | | | 135,000 | | | | 1,483,057 | | |
Mindray Medical
International Ltd., ADR1 | | | 46,000 | | | | 1,883,700 | | |
Sands China Ltd. | | | 431,200 | | | | 2,332,359 | | |
Tencent Holdings Ltd. | | | 59,100 | | | | 2,680,822 | | |
Want Want China Holdings Ltd. | | | 1,103,000 | | | | 1,493,308 | | |
WuXi PharmaTech Cayman, Inc., ADR* | | | 108,024 | | | | 2,398,133 | | |
Total Cayman Islands common stocks | | | | | 15,954,332 | | |
Chile—1.40% | |
Banco Santander Chile, ADR1 | | | 33,772 | | | | 761,896 | | |
Cia Cervecerias Unidas SA | | | 32,968 | | | | 445,583 | | |
| | | Number of
shares | | Value | |
Common stocks—(continued) | |
Chile—(concluded) | |
Enersis SA, ADR | | | 189,178 | | | $ | 2,875,506 | | |
Inversiones Aguas Metropolitanas
SA (IAM), ADR3 | | | 8,500 | | | | 320,368 | | |
S.A.C.I. Falabella | | | 72,103 | | | | 736,676 | | |
Total Chile common stocks | | | | | 5,140,029 | | |
China—4.67% | |
Bank of China Ltd., Class H | | | 7,498,000 | | | | 3,142,052 | | |
China Bluechemical Ltd., Class H | | | 1,172,000 | | | | 540,997 | | |
China Communications
Construction Co. Ltd., Class H | | | 1,578,000 | | | | 1,206,553 | | |
China Communications Services
Corp. Ltd., Class H | | | 2,092,000 | | | | 1,359,493 | | |
China Construction Bank Corp.,
Class H | | | 2,693,000 | | | | 2,010,479 | | |
China Minsheng Banking
Corp. Ltd., Class H1 | | | 1,592,000 | | | | 1,609,325 | | |
China Shenhua Energy Co. Ltd.,
Class H | | | 294,000 | | | | 849,141 | | |
Great Wall Motor Co. Ltd., Class H1 | | | 355,000 | | | | 1,656,996 | | |
Huaneng Power International, Inc.,
Class H1 | | | 1,582,000 | | | | 1,652,251 | | |
Industrial & Commercial Bank of
China Ltd., Class H | | | 2,971,000 | | | | 1,953,698 | | |
Jiangsu Expressway Co. Ltd., Class H1 | | | 1,098,000 | | | | 1,141,096 | | |
Total China common stocks | | | | | 17,122,081 | | |
Colombia—0.35% | |
Bancolombia SA, ADR | | | 7,700 | | | | 442,365 | | |
Ecopetrol SA | | | 372,881 | | | | 853,115 | | |
Total Colombia common stocks | | | | | 1,295,480 | | |
Hong Kong—5.23% | |
Beijing Enterprises Holdings Ltd.1 | | | 135,500 | | | | 905,884 | | |
China Mobile Ltd. | | | 827,500 | | | | 8,802,510 | | |
China Overseas Land &
Investment Ltd.1 | | | 788,000 | | | | 2,270,849 | | |
China Power International
Development Ltd.1 | | | 3,639,000 | | | | 1,529,623 | | |
China Resources Power
Holdings Co. Ltd. | | | 578,000 | | | | 1,345,954 | | |
China Unicom (Hong Kong) Ltd. | | | 1,122,000 | | | | 1,646,341 | | |
CNOOC Ltd. | | | 1,053,000 | | | | 1,900,820 | | |
Sun Art Retail Group Ltd.1 | | | 552,500 | | | | 767,955 | | |
Total Hong Kong common stocks | | | | | 19,169,936 | | |
Hungary—0.45% | |
MOL Hungarian Oil and Gas PLC | | | 21,866 | | | | 1,642,345 | | |
India—5.96% | |
Axis Bank Ltd. | | | 63,826 | | | | 1,085,950 | | |
Bajaj Auto Ltd. | | | 30,142 | | | | 959,086 | | |
GAIL India Ltd. | | | 58,985 | | | | 292,185 | | |
HCL Technologies Ltd. | | | 143,172 | | | | 2,207,564 | | |
HDFC Bank Ltd., ADR | | | 20,800 | | | | 684,320 | | |
Housing Development Finance Corp. | | | 235,168 | | | | 3,095,802 | | |
169
PACE Select Advisors Trust
PACE International Emerging Markets Equity Investments
Portfolio of investments—July 31, 2013
| | | Number of
shares | | Value | |
Common stocks—(continued) | |
India—(concluded) | |
ICICI Bank Ltd., ADR | | | 50,719 | | | $ | 1,662,569 | | |
ITC Ltd. | | | 290,007 | | | | 1,629,724 | | |
Larsen & Toubro Ltd. | | | 109,070 | | | | 1,519,583 | | |
Lupin Ltd. | | | 83,919 | | | | 1,202,303 | | |
Rural Electrification Corp. Ltd. | | | 298,898 | | | | 779,135 | | |
Sterlite Industries India Ltd, ADR | | | 113,274 | | | | 569,768 | | |
Sun Pharmaceutical Industries Ltd. | | | 170,138 | | | | 1,581,761 | | |
Tata Consultancy Services Ltd. | | | 44,125 | | | | 1,317,473 | | |
Tata Motors Ltd. | | | 137,266 | | | | 655,798 | | |
Tata Motors Ltd., ADR | | | 107,656 | | | | 2,588,050 | | |
Total India common stocks | | | | | 21,831,071 | | |
Indonesia—4.41% | |
PT Astra International Tbk | | | 1,986,000 | | | | 1,256,045 | | |
PT Bank Mandiri (Persero) Tbk | | | 4,158,500 | | | | 3,601,133 | | |
PT Bank Rakyat Indonesia
(Persero) Tbk | | | 4,700,000 | | | | 3,772,805 | | |
PT Indofood CBP Sukses Makmur Tbk | | | 1,845,500 | | | | 2,011,150 | | |
PT Jasa Marga Persero Tbk | | | 615,000 | | | | 320,141 | | |
PT Kalbe Farma Tbk | | | 1,764,500 | | | | 245,511 | | |
PT Perusahaan Gas Negara | | | 3,487,500 | | | | 2,002,068 | | |
PT Telekomunikasi Indonesia (Persero),
Series B | | | 2,550,500 | | | | 2,953,145 | | |
Total Indonesia common stocks | | | | | 16,161,998 | | |
Kazakhstan—0.17% | |
KazMunaiGas Exploration
Production, GDR4 | | | 15,668 | | | | 229,849 | | |
KazMunaiGas Exploration
Production, GDR5 | | | 26,604 | | | | 390,281 | | |
Total Kazakhstan common stocks | | | | | 620,130 | | |
Malaysia—3.21% | |
AMMB Holdings Berhad | | | 1,075,100 | | | | 2,594,955 | | |
CIMB Group Holdings Berhad | | | 775,200 | | | | 1,880,649 | | |
IHH Healthcare Berhad* | | | 905,400 | | | | 1,116,399 | | |
IOI Corp. Berhad | | | 1,045,400 | | | | 1,759,520 | | |
Malayan Banking Berhad | | | 204,300 | | | | 646,152 | | |
Malaysia Building Society | | | 2,074,300 | | | | 1,982,223 | | |
Tenaga Nasional Berhad | | | 654,200 | | | | 1,792,798 | | |
Total Malaysia common stocks | | | | | 11,772,696 | | |
Mexico—5.36% | |
America Movil SA de C.V., ADR,
Series L | | | 55,300 | | | | 1,160,194 | | |
Compartamos SAB de C.V.1 | | | 611,700 | | | | 1,106,282 | | |
Fibra Uno Administracion SA de C.V. | | | 585,000 | | | | 1,868,666 | | |
Fomento Economico
Mexicano SAB de C.V.1 | | | 266,200 | | | | 2,650,798 | | |
Fomento Economico
Mexicano SAB de C.V., ADR | | | 11,597 | | | | 1,153,785 | | |
Grupo Aeroportuario del
Pacifico SA de C.V., ADR | | | 8,400 | | | | 438,732 | | |
Grupo Aeroportuario del
Pacifico SAB de C.V. | | | 319,500 | | | | 1,667,946 | | |
Grupo Comercial Chedraui SA de C.V.1 | | | 527,100 | | | | 1,709,302 | | |
| | | Number of
shares | | Value | |
Common stocks—(continued) | |
Mexico—(concluded) | |
Grupo Financiero Banorte SAB de C.V.,
Series O | | | 301,450 | | | $ | 1,901,535 | | |
Grupo Financiero Santander
Mexico SAB de C.V., Class B, ADR* | | | 167,200 | | | | 2,411,024 | | |
Grupo Mexico SAB de C.V., Series B1 | | | 827,350 | | | | 2,539,813 | | |
Grupo Sanborns SA de C.V. | | | 228,100 | | | | 530,392 | | |
Kimberly-Clark de Mexico SA de C.V.,
Series A | | | 148,400 | | | | 489,138 | | |
Total Mexico common stocks | | | | | 19,627,607 | | |
Netherlands—0.50% | |
Yandex N.V.* | | | 56,572 | | | | 1,838,590 | | |
Nigeria—0.20% | |
Guaranty Trust Bank PLC | | | 4,705,801 | | | | 741,325 | | |
Panama—0.16% | |
Copa Holdings SA, Class A | | | 4,116 | | | | 572,824 | | |
Philippines—1.34% | |
Alliance Global Group, Inc.* | | | 3,486,500 | | | | 2,107,314 | | |
Philippine Long Distance
Telephone Co., ADR | | | 26,300 | | | | 1,853,624 | | |
SM Prime Holdings, Inc. | | | 2,333,000 | | | | 944,373 | | |
Total Philippines common stocks | | | | | 4,905,311 | | |
Poland—0.77% | |
KGHM Polska Miedz SA | | | 32,164 | | | | 1,117,015 | | |
Polski Koncern Naftowy Orlen SA | | | 126,503 | | | | 1,719,716 | | |
Total Poland common stocks | | | | | 2,836,731 | | |
Qatar—0.93% | |
Industries Qatar Q.S.C. | | | 51,405 | | | | 2,243,194 | | |
Qatar National Bank | | | 24,028 | | | | 1,167,961 | | |
Total Qatar common stocks | | | | | 3,411,155 | | |
Russia—4.29% | |
Gazprom, ADR | | | 599,873 | | | | 4,661,013 | | |
LUKOIL, ADR | | | 31,096 | | | | 1,848,968 | | |
Magnit OJSC2 | | | 1,135 | | | | 276,337 | | |
Magnit OJSC, GDR3 | | | 34,109 | | | | 1,657,080 | | |
Sberbank, ADR | | | 399,887 | | | | 4,634,690 | | |
Severstal OAO | | | 53,685 | | | | 404,517 | | |
Severstal OAO, GDR | | | 33,555 | | | | 252,837 | | |
Tatneft, ADR*,5 | | | 32,674 | | | | 1,203,384 | | |
Tatneft, ADR*,4 | | | 21,357 | | | | 786,578 | | |
Total Russia common stocks | | | | | 15,725,404 | | |
South Africa—7.38% | |
African Bank Investments Ltd.1 | | | 288,689 | | | | 425,769 | | |
African Rainbow Minerals Ltd. | | | 116,286 | | | | 1,915,410 | | |
Aspen Pharmacare Holdings Ltd.* | | | 23,587 | | | | 523,311 | | |
Bidvest Group Ltd. | | | 79,158 | | | | 1,957,707 | | |
Clicks Group Ltd.1 | | | 72,886 | | | | 424,069 | | |
Discovery Ltd. | | | 93,289 | | | | 843,956 | | |
FirstRand Ltd. | | | 336,355 | | | | 1,011,230 | | |
Imperial Holdings Ltd. | | | 91,980 | | | | 1,919,781 | | |
Liberty Holdings Ltd. | | | 130,254 | | | | 1,618,685 | | |
170
PACE Select Advisors Trust
PACE International Emerging Markets Equity Investments
Portfolio of investments—July 31, 2013
| | | Number of
shares | | Value | |
Common stocks—(continued) | |
South Africa—(concluded) | |
Life Healthcare Group
Holdings Pte. Ltd. | | | 124,344 | | | $ | 453,741 | | |
Mediclinic International Ltd. | | | 263,304 | | | | 1,841,300 | | |
Mondi Ltd. | | | 116,861 | | | | 1,724,101 | | |
MTN Group Ltd. | | | 175,947 | | | | 3,303,855 | | |
Naspers Ltd., N Shares | | | 19,872 | | | | 1,663,604 | | |
Netcare Ltd. | | | 828,410 | | | | 1,964,907 | | |
Sasol Ltd. | | | 30,438 | | | | 1,402,360 | | |
Shoprite Holdings Ltd. | | | 41,448 | | | | 701,030 | | |
Steinhoff International Holdings Ltd.*,1 | | | 462,568 | | | | 1,228,451 | | |
Tiger Brands Ltd.1 | | | 18,861 | | | | 588,839 | | |
Vodacom Group Ltd.1 | | | 128,260 | | | | 1,517,331 | | |
Total South Africa common stocks | | | | | 27,029,437 | | |
South Korea—11.67% | |
CJ CheilJedang Corp. | | | 5,081 | | | | 1,282,207 | | |
Hanwha Corp. | | | 48,940 | | | | 1,339,569 | | |
Hyundai Mobis | | | 21,418 | | | | 5,223,786 | | |
Hyundai Motor Co. | | | 15,458 | | | | 3,199,132 | | |
Kangwon Land, Inc. | | | 33,300 | | | | 847,747 | | |
KCC Corp. | | | 6,086 | | | | 1,890,659 | | |
KT&G Corp. | | | 21,237 | | | | 1,431,018 | | |
LG Display Co. Ltd.* | | | 68,890 | | | | 1,707,801 | | |
LG Electronics, Inc. | | | 27,334 | | | | 1,773,726 | | |
LG Household & Health Care Ltd. | | | 1,480 | | | | 779,901 | | |
LG Uplus Corp.* | | | 195,430 | | | | 2,383,240 | | |
Lotte Shopping Co. Ltd. | | | 5,461 | | | | 1,708,651 | | |
Samsung Card Co. Ltd. | | | 48,710 | | | | 1,636,783 | | |
Samsung Electronics Co. Ltd. | | | 10,950 | | | | 12,476,133 | | |
SK Holdings Co. Ltd | | | 7,462 | | | | 1,172,346 | | |
SK Hynix, Inc.* | | | 88,010 | | | | 2,130,869 | | |
SK Telecom Co. Ltd. | | | 8,962 | | | | 1,759,015 | | |
Total South Korea common stocks | | | | | 42,742,583 | | |
Taiwan—7.07% | |
Chipbond Technology Corp. | | | 1,046,000 | | | | 2,309,212 | | |
Chong Hong Construction Co. | | | 513,000 | | | | 2,129,908 | | |
King Yuan Electronics Co. Ltd. | | | 2,662,000 | | | | 1,775,466 | | |
Pegatron Corp.* | | | 1,045,000 | | | | 1,543,811 | | |
President Chain Store Corp. | | | 269,000 | | | | 2,004,952 | | |
Quanta Computer, Inc. | | | 237,000 | | | | 551,668 | | |
Taiwan Semiconductor
Manufacturing Co. Ltd. | | | 1,716,156 | | | | 5,866,173 | | |
Taiwan Semiconductor
Manufacturing Co. Ltd., ADR | | | 163,255 | | | | 2,772,070 | | |
Uni-President Enterprises Corp. | | | 1,501,000 | | | | 3,063,419 | | |
United Microelectronics Corp. | | | 3,886,000 | | | | 1,730,049 | | |
Vanguard International
Semiconductor Corp. | | | 1,912,000 | | | | 1,912,861 | | |
Wistron Corp. | | | 249,307 | | | | 237,780 | | |
Total Taiwan common stocks | | | | | 25,897,369 | | |
Thailand—4.40% | |
Advanced Information Services
Public Co. Ltd. | | | 93,100 | | | | 826,895 | | |
Bangchak Petroleum PCL | | | 1,810,200 | | | | 1,995,268 | | |
| | | Number of
shares | | Value | |
Common stocks—(concluded) | |
Thailand—(concluded) | |
Kasikornbank PCL | | | 159,400 | | | $ | 929,409 | | |
Kasikornbank Public Co. Ltd. | | | 190,500 | | | | 1,138,131 | | |
Kasikornbank Public Co. Ltd., NVDR | | | 289,800 | | | | 1,689,728 | | |
PTT Exploration & Production PCL | | | 293,600 | | | | 1,463,310 | | |
PTT Global Chemical PCL | | | 762,800 | | | | 1,608,460 | | |
PTT Public Co. Ltd.2 | | | 217,300 | | | | 2,297,965 | | |
Quality Houses PCL1 | | | 13,667,900 | | | | 1,187,754 | | |
Siam Commercial Bank PCL | | | 344,400 | | | | 1,744,006 | | |
Thai Airways International PCL | | | 1,712,700 | | | | 1,242,118 | | |
Total Thailand common stocks | | | | | 16,123,044 | | |
Turkey—4.65% | |
Coca-Cola Icecek A.S. | | | 25,608 | | | | 720,905 | | |
Emlak Konut Gayrimenkul Yatirim
Ortakligi AS | | | 1,023,039 | | | | 1,410,943 | | |
TAV Havalimanlari Holding A.S. | | | 281,707 | | | | 1,767,990 | | |
Tofas Turk Otomobil Fabrikasi A.S. | | | 75,031 | | | | 498,023 | | |
Tupras-Turkiye Petrol Rafinerileri A.S. | | | 97,796 | | | | 2,091,353 | | |
Turk Hava Yollari Anonim
Ortakligi (THY) | | | 759,439 | | | | 3,201,024 | | |
Turk Telekomunikasyon A.S. | | | 548,301 | | | | 1,976,880 | | |
Turkcell Iletisim Hizmetleri A.S.
(Turkcell)* | | | 278,357 | | | | 1,624,750 | | |
Turkiye Garanti Bankasi A.S. | | | 251,823 | | | | 985,985 | | |
Turkiye Halk Bankasi AS, Class C | | | 169,717 | | | | 1,275,540 | | |
Turkiye Is Bankasi (Isbank), Class C | | | 558,601 | | | | 1,483,101 | | |
Total Turkey common stocks | | | | | 17,036,494 | | |
United Arab Emirates—0.29% | |
First Gulf Bank PJSC | | | 234,827 | | | | 1,054,899 | | |
United Kingdom—1.05% | |
SABMiller PLC | | | 78,413 | | | | 3,831,034 | | |
United States—0.65% | |
Yum! Brands, Inc. | | | 32,800 | | | | 2,391,776 | | |
Total common stocks
(cost—$326,312,935) | | | | | 326,468,624 | | |
Preferred stocks—4.13% | |
Brazil—3.95% | |
Braskem SA* | | | 208,000 | | | | 1,602,840 | | |
Companhia Brasileira de Distribuicao
Grupo Pao de Acucar, ADR1 | | | 26,690 | | | | 1,190,641 | | |
Companhia de Bebidas das Americas
(AmBev), ADR | | | 83,346 | | | | 3,148,812 | | |
Itau Unibanco Holding SA | | | 160,720 | | | | 2,052,899 | | |
Petroleo Brasileiro SA, ADR* | | | 201,900 | | | | 1,441,668 | | |
Suzano Papel e Celulose SA | | | 531,000 | | | | 1,810,849 | | |
Vale SA, ADR | | | 262,126 | | | | 3,226,771 | | |
Total Brazil preferred stocks | | | | | 14,474,480 | | |
South Korea—0.18% | |
Hyundai Motor Co. | | | 6,775 | | | | 642,266 | | |
Total preferred stocks
(cost—$17,550,530) | | | | | 15,116,746 | | |
171
PACE Select Advisors Trust
PACE International Emerging Markets Equity Investments
Portfolio of investments—July 31, 2013
| | | Number of
shares | | Value | |
Investment companies—4.02% | |
United States—4.02% | |
iPath MSCI India Index ETN*,1 | | | 164,986 | | | $ | 8,571,023 | | |
iShares MSCI Emerging Markets
Index Fund1 | | | 157,796 | | | | 6,149,310 | | |
Total investment companies
(cost—$16,191,688) | | | | | 14,720,333 | | |
| | | Face
amount | | | |
Repurchase agreement—2.57% | |
Repurchase agreement dated
07/31/13 with State Street Bank and
Trust Co., 0.010% due 08/01/13,
collateralized by $412,310
Federal Home Loan Mortgage Corp.
obligations, 1.960% due 11/07/22,
$9,504,572 Federal National
Mortgage Association obligations,
2.140% to 2.170% due 11/07/22
and $312,535 US Treasury Notes,
0.250% to 0.750% due 10/31/13 to
12/15/13; (value—$9,619,728);
proceeds: $9,431,003
(cost—$9,431,000) | | $ | 9,431,000 | | | | 9,431,000 | | |
| | | Number of
shares | | Value | |
Investment of cash collateral from securities loaned—9.33% | |
Money market fund—9.33% | |
UBS Private Money Market Fund LLC6
(cost—$34,204,798) | | | 34,204,798 | | | $ | 34,204,798 | | |
Total investments
(cost—$403,690,951)—109.16% | | | | | 399,941,501 | | |
Liabilities in excess of
other assets—(9.16)% | | | | | (33,569,682 | ) | |
Net assets—100.00% | | | | $ | 366,371,819 | | |
For a listing of defined portfolio acronyms, counterparty acronyms and currency abbreviations that are used throughout the Portfolio of investments as well as the tables that follow, please refer to page 218.
Aggregate cost for federal income tax purposes was $405,264,115; and net unrealized depreciation consisted of:
Gross unrealized appreciation | | $ | 22,186,515 | | |
Gross unrealized depreciation | | | (27,509,129 | ) | |
Net unrealized depreciation | | $ | (5,322,614 | ) | |
Fair valuation summary
The following is a summary of the fair valuations according to the inputs used as of July 31, 2013 in valuing the Portfolio's investments:
| | Unadjusted
quoted prices in
active markets for
identical investments
(Level 1) | | Other significant
observable inputs
(Level 2) | | Unobservable
inputs
(Level 3) | | Total | |
Common stocks | | $ | 311,056,844 | | | $ | 15,410,442 | | | $ | 1,338 | | | $ | 326,468,624 | | |
Preferred stocks | | | 15,116,746 | | | | — | | | | — | | | | 15,116,746 | | |
Investment companies | | | 14,720,333 | | | | — | | | | — | | | | 14,720,333 | | |
Repurchase agreement | | | — | | | | 9,431,000 | | | | — | | | | 9,431,000 | | |
Investment of cash collateral from securities loaned | | | — | | | | 34,204,798 | | | | — | | | | 34,204,798 | | |
Total | | $ | 340,893,923 | | | $ | 59,046,240 | | | $ | 1,338 | | | $ | 399,941,501 | | |
At July 31, 2013, there was a transfer between Level 1 and Level 2 of $826,895 due to the valuation being based primarily on the valuation of shares of the security as traded on the local exchange rather than an unadjusted quoted price from a US exchange. At July 31, 2012, $148,414,447 of foreign investments were classified as Level 2 of the fair value hierarchy pursuant to the Portfolio's fair valuation procedures.
172
PACE Select Advisors Trust
PACE International Emerging Markets Equity Investments
Portfolio of investments—July 31, 2013
The following is a rollforward of the Portfolio's investment that was valued using unobservable inputs (Level 3) for the year ended July 31, 2013:
| | | Common
stock | |
Beginning balance | | $ | 1,339 | | |
Purchases | | | — | | |
Sales | | | — | | |
Accrued discounts/(premiums) | | | — | | |
Total realized gain/(loss) | | | — | | |
Net change in unrealized appreciation/depreciation | | | (1 | ) | |
Transfers into Level 3 | | | — | | |
Transfers out of Level 3 | | | — | | |
Ending balance | | $ | 1,338 | | |
The change in net unrealized appreciation/depreciation relating to the Level 3 investment held at July 31, 2013 was $(1).
Portfolio footnotes
* Non-income producing security.
1 Security, or portion thereof, was on loan at July 31, 2013.
2 Security is being fair valued by a valuation committee under the direction of the board of trustees.
3 Security exempt from registration pursuant to Rule 144A under the Securities Act of 1933. These securities, which represent 0.54% of net assets as of July 31, 2013, are considered liquid and may be resold in transactions exempt from registration, normally to qualified institutional buyers.
4 Security is traded on the Turquoise Exchange.
5 Security is traded on the over-the-counter ("OTC") market.
6 The table below details the Portfolio's transaction activity in an affiliated issuer during the year ended July 31, 2013. The investment manager earns a management fee from UBS Private Money Market Fund LLC. Please see the Notes to financial statements for further information.
Security description | | Value at
07/31/12 | | Purchases
during the
year ended
07/31/13 | | Sales
during the
year ended
07/31/13 | | Value at
07/31/13 | | Net income
earned from
affiliate for the
year ended
07/31/13 | |
UBS Private Money Market Fund LLC | | $ | 8,124,467 | | | $ | 154,557,033 | | | $ | 128,476,702 | | | $ | 34,204,798 | | | $ | 4,456 | | |
See accompanying notes to financial statements.
173
PACE Select Advisors Trust
PACE Global Real Estate Securities Investments
Performance
For the 12 months ended July 31, 2013, the Portfolio's Class P shares returned 12.57% before the deduction of the maximum PACE Select program fee. (Class P shares returned 10.34% after the deduction of the maximum PACE Select program fee for the same 12-month period.) In comparison, the FTSE EPRA/NAREIT Developed Index (the "benchmark") returned 11.62%, while the Lipper Global Real Estate Funds category posted a median return of 11.31%. (Returns for all share classes over various time periods are shown in the "Performance at a glance" table on page 178. Please note that the returns shown do not reflect the deduction of taxes that a shareholder would pay on Portfolio distributions or the redemption of Portfolio shares.) For a detailed commentary on the market environment in general during the reporting period, please refer to page 2.
Sub-Advisors' comments1
CBRE Clarion
While we generated a positive absolute return, our portion of the Portfolio modestly underperformed the benchmark during the reporting period, primarily due to stock selection, particularly in the US and UK, coupled with asset allocation decisions in Asia Pacific and Continental Europe. In the US, underperformance was driven by our exposure to apartment, central business district office and mall companies. This occurred despite high earnings growth potential, strong balance sheets and capable managements in these areas. In Europe, favorable decisions on the continent, where dominant shopping center/mall companies based in Western Europe outperformed, were more than offset by negative stock selection in the UK. In the Asia-Pacific region, stock selection added value in three of the four major geographies, with particular value generated in Japan, where overweight positions in companies with exposure to the Tokyo office market generated positive results. Asset allocation decisions marginally detracted from the performance of our portion of the Portfolio, as the relative benefit of an underweight to the underperforming Canadian market was offset by our positioning in the Asia-Pacific region and an underweight to outperforming Continental Europe.
We expect that with an improving economic outlook, markets will embrace listed property companies with more exposure to growth that are anchored by solid yields. We expect that the variation of operating performance between defensively-oriented companies and more economically sensitive companies will become more
PACE Select Advisors Trust –
PACE Global Real Estate Securities Investments
Investment Sub-Advisors:
CBRE Clarion Securities, LLC ("CBRE Clarion") and Brookfield Investment Management Inc. ("Brookfield")
Portfolio Managers:
CBRE Clarion: T. Ritson Ferguson, Steven D. Burton & Joseph P. Smith
Brookfield: Jason Baine and Bernhard Krieg
Objective:
Total Return
Investment process:
CBRE Clarion (formerly, ING Clarion Real Estate Securities) uses a multi-step investment process for constructing the investment portfolio. This process combines top-down region and sector allocation with bottom-up individual stock selection. First, CBRE Clarion selects property sectors and geographic regions in which to invest and determines the degree of representation of such sectors and regions, through a systematic evaluation of public and private real estate market trends and conditions. Second, CBRE Clarion uses a proprietary valuation process in an effort to identify investments with superior current income and growth potential relative to their peers.
1 All Sub-Advisors discuss performance on a gross of fees basis—meaning that no fees or expenses are reflected in their sleeves'/sleeve's performance. Alternately, Portfolio performance is shown net of fees, which does factor in fees and expenses associated with the Portfolio.
174
PACE Select Advisors Trust
PACE Global Real Estate Securities Investments
Sub-Advisors' comments – continued
pronounced as the economic and commercial property market recovery matures further. We also believe that more economically sensitive companies will be able to generate superior growth in revenue, dividends and capital value. Our positioning is focused on investing in what we believe are attractively priced companies, geographies and property sectors that stand to benefit the most from improving economic conditions in our view. Our positioning notably includes overweight in Japanese property companies, as well as US real estate investment trusts (REITs), with a focus on the more economically sensitive company profiles and property types. Conversely, we are underweight the more "bond-like" property types. Additionally, our view on European property companies is worth mentioning, as we believe that the investment environment is improving. European positions have been increased over the course of the fiscal year to approximately a market weight position. The decision to increase these positions was based on our belief that much of the poor macro-economic news is reflected in the valuation of property stocks and that the "tail risks" of a eurozone collapse have diminished further, particularly as economic and property company releases have recently shown signs of improvement.
We continue to believe that global property stocks offer investors an attractive investment option, anchored by current yield via a growing dividend and underpinned by increasing real estate cash flows derived from improving economic and commercial property fundamentals.
Derivatives were not used during the reporting period.
Brookfield
Our portion of the Portfolio outperformed the benchmark during the reporting period, primarily driven by stock selection in North America. Additionally, asset allocation by region, country and industry positively contributed to results. By region, an overweight to Europe was beneficial, as it was the strongest performing region during the reporting period.
Stock selection in the US contributed significantly to performance. Specifically, our holdings in the US healthcare sector meaningfully contributed to results. Our portion of the Portfolio has been significantly underweight healthcare real estate investment trusts (REITs), despite owning select healthcare owner/operators. Our out-of-benchmark holding in Brookdale Senior Living Inc., a US healthcare owner/operator, was the top contributor to performance. Other top contributors within the US included out-of-benchmark company Lennar Corp. (homebuilder) and an overweight to Equity Residential (residential). We sold out of our position in Lennar Corp. in January because the company began to screen less attractively in our proprietary valuation model following strong price appreciation. Additionally, a significant underweight to Canada contributed to relative results, as it was the weakest performing country in the benchmark during the reporting period.
Investment process (concluded)
Brookfield invests in a diversified portfolio of global securities of companies primarily in the real estate industry, including real estate investment trusts, real estate operating companies, companies whose value is significantly affected by the value of such companies' real estate holdings, and related entities and structures. Brookfield utilizes a fundamental, bottom-up, value-based stock selection methodology.
175
PACE Select Advisors Trust
PACE Global Real Estate Securities Investments
Sub-Advisors' comments – continued
There were a few notable detractors from performance during the fiscal year. For our portion of the Portfolio, an overweight to Australia was not rewarded. Australian equity markets have been impacted by concerns over Chinese growth prospects, and the effect on the resource-driven Australian economy caused the country to underperform. Our position in Australian retail holding Westfield Retail Trust was one of the largest detractors from performance. We believe that Australian retail is attractively priced and maintain a large active weight in Westfield Retail Trust. We favor opportunities in Australian retail where we aim to capitalize on the favorable cap rate environment relative to interest rates. Furthermore, the Australian real estate marketplace continues to benefit from strong global institutional investor interest. Our underweight to Japan was a negative for relative results, as the country was one of the top performers in the benchmark. While stock selection in Japan was positive overall, not owning Sumitomo Realty & Development Co. Ltd. (residential) was a top detractor from relative performance as the company's shares were up sharply. Additionally, Iron Mountain, a US document storage company, was a leading detractor from performance. During the second quarter, Iron Mountain disclosed that the US Internal Revenue Service ("IRS") is taking a closer look at Real Estate Investment Trust ("REIT") conversion requests. The IRM 8K stated that the IRS formed a new working group to study the current legal standards it uses to define "real estate" for the purposes of the REIT provisions and what changes, if any, should be made. The stock sold off on this news. We remain optimistic about the company, despite this development and believe Iron Mountain offers attractive growth prospects coupled with a stable cash flow business model. Furthermore, we believe that the company will raise its capital distributions to shareholders in the future, regardless of whether or not it is classified as a REIT.
Derivatives were not used during the reporting period.
Special considerations
The Portfolio may be appropriate for long-term investors seeking to diversify a portion of their assets into real estate related investments. Investors should be willing to withstand short-term fluctuations in the equity and real estate markets in return for potentially higher returns over the long term. The value of the Portfolio changes every day and can be affected by changes in interest rates, general market conditions and other political, social and economic developments, as well as specific matters relating to the companies or issuers in whose securities the Portfolio invests. The value of the Portfolio's investments in foreign securities may fall due to adverse political, social, and economic developments abroad and due to decreases in foreign currency values relative to the US dollar. These risks are greater for investments in emerging market issuers than for issuers in more developed countries. There are certain risks associated with investing in real estate-related investments, including sensitivity to economic downturns, interest rates, declines in property values and variation in property management.
176
PACE Select Advisors Trust
PACE Global Real Estate Securities Investments
Illustration of an assumed investment of $10,000 in Class A shares of the Portfolio (unaudited)
The following graph depicts the performance of PACE Global Real Estate Securities Investments Class A shares versus the FTSE EPRA/NAREIT Developed Index from December 31, 2006, the month-end after the inception date of the Class A shares, through July 31, 2013. The performance of the other classes will vary based upon the different class specific expenses and sales charges. The performance provided does not reflect the deduction of taxes that a shareholder would pay on Portfolio distributions or the redemption of Portfolio shares. Past performance is no guarantee of future results. Share price and returns will vary with market conditions; investors may realize a gain or loss upon redemption. It is important to note that PACE Global Real Estate Securities Investments is a professionally managed portfolio while the Index is not available for investment and is unmanaged. The comparison is shown for illustration purposes only.
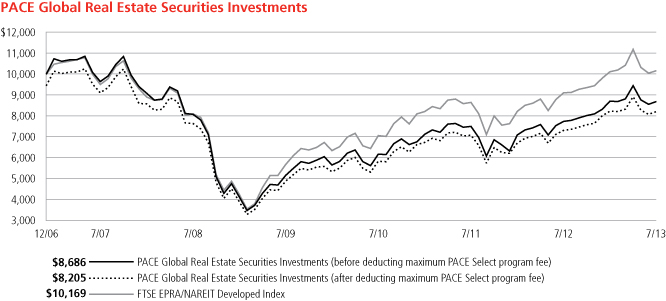
177
PACE Select Advisors Trust
PACE Global Real Estate Securities Investments
Performance at a glance (unaudited)
Average annual total returns for periods ended 07/31/13 | | 1 year | | 5 years | | Since inception1 | |
Before deducting maximum sales charge or PACE Select program fee | |
Class A2 | | | 12.24 | % | | | 1.45 | % | | | (1.97 | )% | |
Class C3 | | | 11.52 | % | | | 0.67 | % | | | (2.73 | )% | |
Class Y4 | | | 12.53 | % | | | N/A | | | | 15.09 | % | |
Class P5 | | | 12.57 | % | | | 1.71 | % | | | (2.44 | )% | |
After deducting maximum sales charge or PACE Select program fee | |
Class A2 | | | 6.10 | % | | | 0.31 | % | | | (2.80 | )% | |
Class C3 | | | 10.52 | % | | | 0.67 | % | | | (2.73 | )% | |
Class P5 | | | 10.34 | % | | | (0.31 | )% | | | (4.38 | )% | |
FTSE EPRA/NAREIT Developed Index6 | | | 11.62 | % | | | 4.67 | % | | | 0.25 | % | |
Lipper Global Real Estate Funds median | | | 11.31 | % | | | 4.10 | % | | | (0.69 | )% | |
Average annual total returns for periods ended June 30, 2013, after deduction of the maximum sales charge or PACE Select program fee, were as follows: Class A—1-year period, 7.33%; 5-year period, (0.07)%; since inception, (3.06)%; Class C—1-year period, 11.62%; 5-year period, 0.28%; since inception, (2.99)%; Class Y—1-year period, 13.80%; since inception, 15.00%; Class P—1-year period, 11.40%; 5-year period, (0.69)%; since inception, (4.64)%.
The annualized gross and net expense ratios, respectively, for each class of shares as in the November 28, 2012 prospectuses, were as follows: Class A—1.69% and 1.45%; Class C—2.44% and 2.20%; Class Y—1.39% and 1.20%; and Class P—1.65% and 1.20%. Net expenses reflect fee waivers and/or expense reimbursements, if any, pursuant to an agreement that is in effect to cap the expenses. The Portfolio and UBS Global Asset Management (Americas) Inc. ("UBS Global AM") have entered into a written fee waiver/expense reimbursement agreement pursuant to which UBS Global AM is contractually obligated to waive its management fees and/or reimburse expenses so that the Portfolio's ordinary total operating expenses of each class through November 30, 2013 (excluding dividend expense, borrowing costs, and interest expense relating to short sales, and expenses attributable to investment in other investment companies, interest, taxes, brokerage commissions and extraordinary expenses) would not exceed Class A—1.45%; Class C—2.20%; Class Y—1.20% and Class P—1.20%. The Portfolio has agreed to repay UBS Global AM for any waived fees/reimbursed expenses to the extent that it can do so over the following three fiscal years without causing the Portfolio's expenses in any of those three years to exceed these expense caps. The fee waiver/expense reimbursement agreement may be terminated by the Portfolio's board at any time and also will terminate automatically upon the expiration or termination of the Portfolio's advisory contract with UBS Global AM. Upon termination of the agreement, however, UBS Global AM's three year recoupment rights will survive.
1 Since inception returns are calculated as of commencement of issuance on December 18, 2006 for Class A and C shares, and January 22, 2007 for Class P shares. Class Y shares commenced issuance on November 30, 2006 and had fully redeemed by February 15, 2007 remaining inactive through December 25, 2008. The inception return of Class Y shares is calculated from December 26, 2008, which is the date the Class Y shares recommenced investment operations. Since inception returns for the Index and Lipper median are shown as of December 31, 2006, which is the month-end after the inception date of the oldest share classes (Class A and Class C).
2 Maximum sales charge for Class A shares is 5.5%. Class A shares bear ongoing 12b-1 service fees.
3 Maximum contingent deferred sales charge for Class C shares is 1% imposed on redemptions and is reduced to 0% after one year. Class C shares bear ongoing 12b-1 service and distribution fees.
4 The Portfolio offers Class Y shares to a limited group of eligible investors, including certain qualifying retirement plans. Class Y shares do not bear initial or contingent deferred sales charges or ongoing 12b-1 service and distribution fees.
5 Class P shares do not bear initial or contingent deferred sales charges or ongoing 12b-1 service and distribution fees, but are subject to a maximum annual PACE Select program fee of 2% of the value of Class P shares. Prior to June 14, 2010, the maximum annual PACE Select program fee was 1.5% of the value of Class P shares; however, the current maximum annual PACE Select program fee of 2% is reflected in the performance returns throughout all periods in the average annual total returns presented for the Class P shares shown above.
6 The FTSE EPRA/NAREIT Developed Index is designed to track the performance of listed real estate companies and real estate investment trusts ("REITs") worldwide. By making the index constituents free-float adjusted, liquidity, size and revenue screened, the series is suitable for use as the basis for investment products, such as derivatives and exchange traded funds. Investors should note that indices do not reflect the deduction of fees and expenses.
If an investor sells or exchanges shares less than 90 days after purchase, a redemption fee of 1.00% of the amount sold or exchanged will be deducted at the time of the transaction, except as noted otherwise in the prospectuses.
Past performance does not predict future performance, and the performance information provided does not reflect the deduction of taxes that a shareholder would pay on Portfolio distributions or the redemption of Portfolio shares. The return and principal value of an investment will fluctuate, so that an investor's shares, when redeemed, may be worth more or less than their original cost. Performance results assume reinvestment of all dividends and capital gain distributions at net asset value on the ex-dividend dates. Current performance may be higher or lower than the performance data quoted. For month-end performance figures, please visit http://globalam-us.ubs.com/corpweb/performance.do.
Lipper peer group data calculated by Lipper Inc.; used with permission. The Lipper median is the return of the fund that places in the middle of a Lipper peer group.
178
PACE Select Advisors Trust
PACE Global Real Estate Securities Investments
Portfolio statistics (unaudited)
Characteristics | | 07/31/13 | |
Net assets (mm) | | $ | 122.3 | | |
Number of holdings | | | 130 | | |
Portfolio composition1 | | 07/31/13 | |
Common stocks | | | 98.1 | % | |
Rights | | | 0.02 | | |
Cash equivalents and other assets less liabilities | | | 1.9 | | |
| | | | 100.0 | % | |
Top five countries (equity investments)1 | | 07/31/13 | |
United States | | | 48.4 | % | |
Japan | | | 13.9 | | |
Australia | | | 8.6 | | |
United Kingdom | | | 5.2 | | |
Hong Kong | | | 4.9 | | |
Total | | | 81.0 | % | |
Top ten equity holdings1 | | 07/31/13 | |
Simon Property Group, Inc. | | | 5.2 | % | |
Mitsubishi Estate Co. Ltd. | | | 4.7 | | |
Equity Residential | | | 4.0 | | |
Mitsui Fudosan Co. Ltd. | | | 3.4 | | |
Unibail Rodamco | | | 3.0 | | |
Host Hotels & Resorts, Inc. | | | 2.6 | | |
SL Green Realty Corp. | | | 2.2 | | |
Sun Hung Kai Properties Ltd. | | | 2.1 | | |
Dexus Property Group | | | 2.0 | | |
Westfield Retail Trust | | | 1.9 | | |
Total | | | 31.1 | % | |
1 Weightings represent percentages of the Portfolio's net assets as of July 31, 2013. The Portfolio is actively managed and its composition will vary over time.
2 Amount is less than 0.05%.
179
PACE Select Advisors Trust
PACE Global Real Estate Securities Investments
Industry diversification—(unaudited)
As a percentage of net assets as of July 31, 2013
Common stocks
Apartments | | | 10.10 | % | |
Commercial services | | | 1.36 | | |
Diversified | | | 21.71 | | |
Diversified operations | | | 0.95 | | |
Health care | | | 4.04 | | |
Hotels | | | 0.82 | | |
Hotels & motels | | | 3.60 | | |
Manufactured homes | | | 0.42 | | |
Office property | | | 10.84 | | |
Real estate management/service | | | 7.98 | | |
Real estate operations/development | | | 13.07 | | |
Regional malls | | | 8.72 | | |
Retirement/aged care | | | 0.68 | | |
Shopping centers | | | 8.12 | | |
Storage | | | 1.78 | | |
Storage/warehousing | | | 0.80 | | |
Warehouse/industrial | | | 3.14 | | |
Total common stocks | | | 98.13 | | |
Rights | | | 0.001 | | |
Repurchase agreement | | | 2.27 | | |
Investments of cash collateral from securities loaned | | | 2.84 | | |
Liabilities in excess of other assets | | | (3.24 | ) | |
Net assets | | | 100.00 | % | |
1 Weighting represents less than 0.005% of the Portfolio's net assets as of July 31, 2013.
180
PACE Select Advisors Trust
PACE Global Real Estate Securities Investments
Portfolio of investments—July 31, 2013
| | | Number of
shares | | Value | |
Common stocks—98.13% | |
Australia—8.62% | |
Dexus Property Group1 | | | 2,550,264 | | | $ | 2,406,919 | | |
Federation Centres | | | 201,800 | | | | 424,448 | | |
Goodman Group | | | 207,246 | | | | 879,256 | | |
Investa Office Fund | | | 45,450 | | | | 120,516 | | |
Mirvac Group1 | | | 1,213,321 | | | | 1,788,573 | | |
Stockland1 | | | 149,700 | | | | 481,717 | | |
Westfield Group | | | 211,919 | | | | 2,137,223 | | |
Westfield Retail Trust | | | 850,335 | | | | 2,300,613 | | |
Total Australia common stocks | | | | | 10,539,265 | | |
Austria—0.64% | |
Conwert Immobilien Invest SE*,1 | | | 72,589 | | | | 782,110 | | |
Belgium—0.62% | |
Befimmo SCA Sicafi | | | 11,100 | | | | 760,494 | | |
Bermuda—1.63% | |
Hongkong Land Holdings Ltd. | | | 150,300 | | | | 1,017,531 | | |
Kerry Properties Ltd. | | | 237,500 | | | | 976,875 | | |
Total Bermuda common stocks | | | | | 1,994,406 | | |
Brazil—0.04% | |
Sonae Sierra Brasil SA | | | 4,700 | | | | 47,487 | | |
Canada—1.21% | |
Boardwalk Real Estate Investment Trust | | | 5,900 | | | | 330,988 | | |
Calloway Real Estate Investment Trust | | | 11,200 | | | | 275,557 | | |
Canadian Real Estate Investment Trust | | | 3,300 | | | | 132,276 | | |
Cominar Real Estate
Investment Trust2,3 | | | 5,731 | | | | 112,544 | | |
RioCan Real Estate
Investment Trust2,3,4 | | | 2,200 | | | | 52,135 | | |
RioCan Real Estate Investment Trust5 | | | 24,100 | | | | 571,117 | | |
Total Canada common stocks | | | | | 1,474,617 | | |
Cayman Islands—0.24% | |
China Resources Land Ltd. | | | 52,000 | | | | 142,813 | | |
Country Garden Holdings Co. Ltd.1 | | | 268,293 | | | | 151,519 | | |
Total Cayman Islands common stocks | | | | | 294,332 | | |
France—4.18% | |
Fonciere des Regions | | | 2,634 | | | | 215,715 | | |
ICADE | | | 3,836 | | | | 346,151 | | |
Klepierre | | | 18,149 | | | | 786,870 | | |
Mercialys SA | | | 3,450 | | | | 67,515 | | |
Unibail Rodamco | | | 15,252 | | | | 3,695,914 | | |
Total France common stocks | | | | | 5,112,165 | | |
Germany—1.89% | |
Alstria Office REIT-AG* | | | 84,200 | | | | 985,736 | | |
DIC Asset AG | | | 52,500 | | | | 532,835 | | |
GSW Immobilien AG | | | 3,534 | | | | 143,018 | | |
LEG Immobilien AG* | | | 5,100 | | | | 256,465 | | |
TAG Immobilien AG | | | 33,100 | | | | 391,908 | | |
Total Germany common stocks | | | | | 2,309,962 | | |
| | | Number of
shares | | Value | |
Common stocks—(continued) | |
Hong Kong—4.92% | |
China Overseas Land & Investment Ltd.1 | | | 62,000 | | | $ | 178,671 | | |
Hang Lung Properties Ltd. | | | 58,000 | | | | 188,084 | | |
New World Development Co. Ltd. | | | 233,000 | | | | 340,685 | | |
Sino Land Co. Ltd. | | | 241,100 | | | | 340,716 | | |
Sun Hung Kai Properties Ltd. | | | 193,230 | | | | 2,578,692 | | |
Swire Properties Ltd. | | | 132,000 | | | | 388,055 | | |
The Link REIT | | | 171,300 | | | | 838,212 | | |
Wharf (Holdings) Ltd. | | | 134,170 | | | | 1,154,759 | | |
Total Hong Kong common stocks | | | | | 6,007,874 | | |
Italy—0.44% | |
Beni Stabili SpA1 | | | 825,287 | | | | 535,126 | | |
Japan—13.85% | |
Activia Properties, Inc. | | | 28 | | | | 200,470 | | |
Aeon Mall Co. Ltd. | | | 26,070 | | | | 650,219 | | |
GLP J-Reit | | | 1,191 | | | | 1,167,766 | | |
Hulic Co. Ltd. | | | 25,900 | | | | 310,821 | | |
Japan Logistics Fund, Inc. | | | 14 | | | | 124,400 | | |
Japan Real Estate Investment Corp. | | | 91 | | | | 962,884 | | |
Japan Retail Fund Investment Corp. | | | 402 | | | | 792,422 | | |
Kenedix Realty Investment Corp. | | | 51 | | | | 203,146 | | |
Mitsubishi Estate Co. Ltd. | | | 227,589 | | | | 5,790,258 | | |
Mitsui Fudosan Co. Ltd. | | | 135,621 | | | | 4,104,229 | | |
Nippon Building Fund, Inc. | | | 18 | | | | 196,160 | | |
Nippon Prologis REIT, Inc. | | | 14 | | | | 121,540 | | |
Sumitomo Realty & Development
Co. Ltd. | | | 38,600 | | | | 1,618,353 | | |
Tokyo Tatemono Co. Ltd. | | | 43,000 | | | | 357,931 | | |
United Urban Investment Corp. | | | 269 | | | | 334,636 | | |
Total Japan common stocks | | | | | 16,935,235 | | |
Jersey—0.89% | |
Atrium European Real Estate Ltd. | | | 193,500 | | | | 1,086,324 | | |
Netherlands—1.36% | |
Corio N.V. | | | 31,800 | | | | 1,391,204 | | |
Eurocommercial Properties N.V. | | | 7,261 | | | | 276,122 | | |
Total Netherlands common stocks | | | | | 1,667,326 | | |
Norway—0.96% | |
Norwegian Property ASA | | | 838,814 | | | | 1,174,351 | | |
Singapore—2.33% | |
Ascendas Real Estate Investment
Trust (A-REIT) | | | 71,000 | | | | 128,497 | | |
CapitaCommercial Trust1 | | | 472,000 | | | | 521,824 | | |
Capitaland Ltd. | | | 253,600 | | | | 644,551 | | |
CapitaMall Trust | | | 254,200 | | | | 406,048 | | |
Global Logistic Properties Ltd. | | | 368,000 | | | | 822,379 | | |
Mapletree Greater China
Commercial Trust* | | | 434,000 | | | | 321,013 | | |
Total Singapore common stocks | | | | | 2,844,312 | | |
181
PACE Select Advisors Trust
PACE Global Real Estate Securities Investments
Portfolio of investments—July 31, 2013
| | | Number of
shares | | Value | |
Common stocks—(continued) | |
Sweden—0.42% | |
Castellum AB | | | 23,536 | | | $ | 335,808 | | |
Hufvudstaden AB, Class A | | | 14,047 | | | | 178,331 | | |
Total Sweden common stocks | | | | | 514,139 | | |
Switzerland—0.29% | |
PSP Swiss Property AG* | | | 4,044 | | | | 356,354 | | |
United Kingdom—5.24% | |
British Land Co. PLC | | | 60,004 | | | | 545,405 | | |
Derwent London PLC | | | 17,626 | | | | 646,475 | | |
Great Portland Estates PLC | | | 142,341 | | | | 1,203,942 | | |
Hammerson PLC | | | 215,914 | | | | 1,739,192 | | |
Land Securities Group PLC | | | 90,061 | | | | 1,300,180 | | |
Safestore Holdings PLC | | | 477,126 | | | | 974,424 | | |
Total United Kingdom common stocks | | | | | 6,409,618 | | |
United States—48.36% | |
American Tower Corp. | | | 7,400 | | | | 523,846 | | |
AvalonBay Communities, Inc. | | | 15,100 | | | | 2,043,634 | | |
BioMed Realty Trust, Inc. | | | 25,900 | | | | 535,094 | | |
Boston Properties, Inc. | | | 14,400 | | | | 1,540,080 | | |
Brandywine Realty Trust | | | 24,300 | | | | 338,742 | | |
BRE Properties, Inc. | | | 34,300 | | | | 1,819,958 | | |
Brookdale Senior Living, Inc.* | | | 28,644 | | | | 834,113 | | |
Campus Crest Communities, Inc. | | | 11,100 | | | | 125,985 | | |
CBL & Associates Properties, Inc. | | | 6,700 | | | | 152,559 | | |
DDR Corp. | | | 39,900 | | | | 681,492 | | |
DiamondRock Hospitality Co. | | | 51,100 | | | | 495,670 | | |
Digital Realty Trust, Inc.1 | | | 9,800 | | | | 541,842 | | |
Douglas Emmett, Inc. | | | 55,100 | | | | 1,378,051 | | |
Duke Realty Corp. | | | 47,900 | | | | 788,913 | | |
DuPont Fabros Technology, Inc.1 | | | 28,700 | | | | 657,517 | | |
EastGroup Properties, Inc. | | | 9,400 | | | | 581,484 | | |
Equity Lifestyle Properties, Inc. | | | 13,200 | | | | 508,068 | | |
Equity Residential | | | 88,300 | | | | 4,944,800 | | |
Essex Property Trust, Inc. | | | 8,800 | | | | 1,419,352 | | |
Federal Realty Investment Trust | | | 1,900 | | | | 200,127 | | |
General Growth Properties, Inc. | | | 72,396 | | | | 1,501,493 | | |
HCP, Inc. | | | 19,100 | | | | 837,917 | | |
Health Care REIT, Inc. | | | 23,700 | | | | 1,528,413 | | |
Healthcare Realty Trust, Inc. | | | 10,400 | | | | 267,384 | | |
Healthcare Trust of America, Inc.,
Class A | | | 18,500 | | | | 202,575 | | |
Highwoods Properties, Inc. | | | 41,900 | | | | 1,520,132 | | |
Host Hotels & Resorts, Inc. | | | 180,883 | | | | 3,230,570 | | |
Iron Mountain, Inc. | | | 60,000 | | | | 1,668,000 | | |
Kilroy Realty Corp. | | | 16,500 | | | | 863,610 | | |
Kimco Realty Corp. | | | 49,400 | | | | 1,113,970 | | |
Lexington Realty Trust | | | 22,200 | | | | 278,388 | | |
Liberty Property Trust | | | 49,200 | | | | 1,879,932 | | |
Pebblebrook Hotel Trust | | | 10,000 | | | | 266,500 | | |
Pennsylvania Real Estate
Investment Trust | | | 40,900 | | | | 846,630 | | |
Post Properties, Inc. | | | 13,000 | | | | 604,760 | | |
ProLogis, Inc. | | | 44,091 | | | | 1,691,331 | | |
PS Business Parks, Inc. | | | 11,200 | | | | 820,624 | | |
Public Storage, Inc. | | | 13,677 | | | | 2,177,652 | | |
Ramco-Gershenson Properties Trust | | | 8,600 | | | | 133,214 | | |
| | | Number of
shares | | Value | |
Common stocks—(concluded) | |
United States—(concluded) | |
Rayonier, Inc. | | | 9,900 | | | $ | 578,556 | | |
Senior Housing Properties Trust | | | 20,400 | | | | 513,060 | | |
Simon Property Group, Inc. | | | 39,902 | | | | 6,386,714 | | |
SL Green Realty Corp. | | | 30,100 | | | | 2,728,565 | | |
Starwood Hotels & Resorts
Worldwide, Inc. | | | 13,600 | | | | 899,640 | | |
Strategic Hotels & Resorts, Inc.* | | | 22,800 | | | | 202,008 | | |
Sunstone Hotel Investors, Inc.* | | | 23,200 | | | | 300,208 | | |
Tanger Factory Outlet Centers, Inc. | | | 7,900 | | | | 256,197 | | |
Taubman Centers, Inc. | | | 5,320 | | | | 389,531 | | |
The Macerich Co. | | | 18,226 | | | | 1,130,923 | | |
UDR, Inc. | | | 42,300 | | | | 1,059,192 | | |
Ventas, Inc. | | | 24,236 | | | | 1,593,275 | | |
Vornado Realty Trust | | | 14,991 | | | | 1,271,387 | | |
Weyerhaeuser Co. | | | 9,500 | | | | 269,800 | | |
Total United States common stocks | | | | | 59,123,478 | | |
Total common stocks
(cost—$109,449,359) | | | | | 119,968,975 | | |
| | | Number of
rights | | | |
Rights*—0.00% | |
Hong Kong—0.00% | |
New Hotel, expires 12/31/13
(cost—$0) | | | 3,212 | | | | 0 | | |
| | | Face
amount | | | |
Repurchase agreement—2.27% | |
Repurchase agreement dated 07/31/13
with State Street Bank and Trust Co.,
0.010% due 08/01/13, collateralized
by $121,144 Federal Home Loan
Mortgage Corp. obligations, 1.960%
due 11/07/22, $2,792,617 Federal
National Mortgage Association
obligations, 2.140% to 2.170%
due 11/07/22 and $91,828
US Treasury Notes, 0.250% to 0.750%
due 10/31/13 to 12/15/13;
(value—$2,826,452);
proceeds: $2,771,001
(cost—$2,771,000) | | $ | 2,771,000 | | | | 2,771,000 | | |
| | | Number of
shares | | | |
Investment of cash collateral from securities loaned—2.84% | |
Money market fund—2.84% | |
UBS Private Money Market Fund LLC6
(cost—$3,476,030) | | | 3,476,030 | | | | 3,476,030 | | |
Total investments
(cost—$115,696,389)—103.24% | | | | | 126,216,005 | | |
Liabilities in excess of
other assets—(3.24)% | | | | | (3,957,918 | ) | |
Net assets—100.00% | | | | $ | 122,258,087 | | |
182
PACE Select Advisors Trust
PACE Global Real Estate Securities Investments
Portfolio of investments—July 31, 2013
For a listing of defined portfolio acronyms that are used throughout the Portfolio of investments as well as the tables that follow please refer to page 218.
Aggregate cost for federal income tax purposes, was $118,031,943; and net unrealized appreciation consisted of:
Gross unrealized appreciation | | $ | 12,529,584 | | |
Gross unrealized depreciation | | | (4,345,522 | ) | |
Net unrealized appreciation | | $ | 8,184,062 | | |
Fair valuation summary
The following is a summary of the fair valuations according to the inputs used as of July 31, 2013 in valuing the Portfolio's investments:
| | | Unadjusted
quoted prices in
active markets for
identical investments
(Level 1) | | Other significant
observable inputs
(Level 2) | | Unobservable
inputs
(Level 3) | | Total | |
Common stocks | | $ | 119,804,296 | | | $ | 164,679 | | | $ | — | | | $ | 119,968,975 | | |
Rights | | | — | | | | — | | | | 0 | | | | 0 | | |
Repurchase agreement | | | — | | | | 2,771,000 | | | | — | | | | 2,771,000 | | |
Investment of cash collateral from securities loaned | | | — | | | | 3,476,030 | | | | — | | | | 3,476,030 | | |
Total | | $ | 119,804,296 | | | $ | 6,411,709 | | | $ | 0 | | | $ | 126,216,005 | | |
At July 31, 2013, there were no transfers between Level 1 and Level 2. At July 31, 2012, $51,230,119 of foreign securities were classified as Level 2 of the fair value hierarchy pursuant to the Portfolio's fair valuation procedures.
The following is a rollforward of the Portfolio's investment that was valued using unobservable inputs (Level 3) for the year ended July 31, 2013:
| | Rights | |
Beginning balance | | $ | — | | |
Purchases | | | — | | |
Issuances | | | 0 | | |
Sales | | | — | | |
Accrued discounts/(premiums) | | | — | | |
Total realized gain/(loss) | | | — | | |
Net change in unrealized appreciation/depreciation | | | — | | |
Transfers into Level 3 | | | — | | |
Transfers out of Level 3 | | | — | | |
Ending balance | | $ | 0 | | |
The change in net unrealized appreciation/depreciation relating to the Level 3 investment held at July 31, 2013 was $0.
Portfolio footnotes
* Non-income producing security.
1 Security, or portion thereof, was on loan at July 31, 2013.
2 Security is being fair valued by a valuation committee under the direction of the board of trustees.
3 Security exempt from registration pursuant to Rule 144A under the Securities Act of 1933. These securities, which represent 0.13% of net assets as of July 31, 2013, are considered liquid and may be resold in transactions exempt from registration, normally to qualified institutional buyers.
4 Security is traded on the over-the-counter ("OTC") market.
5 Security is traded on the Toronto Stock Exchange.
183
PACE Select Advisors Trust
PACE Global Real Estate Securities Investments
Portfolio of investments—July 31, 2013
6 The table below details the Portfolio's transaction activity in an affiliated issuer during the year ended July 31, 2013. The investment manager earns a management fee from UBS Private Money Market Fund LLC. Please see the Notes to financial statements for further information.
Security description | | Value at
07/31/12 | | Purchases
during the
year ended
ended
07/31/13 | | Sales
during the
year ended
ended
07/31/13 | | Value at
07/31/13 | | Net income
earned from
affiliate for the
year ended
ended
07/31/13 | |
UBS Private Money Market Fund LLC | | $ | 3,162,016 | | | $ | 60,862,351 | | | $ | 60,548,337 | | | $ | 3,476,030 | | | $ | 2,267 | | |
See accompanying notes to financial statements.
184
PACE Select Advisors Trust
PACE Alternative Strategies Investments
Performance
For the 12 months ended July 31, 2013, the Portfolio's Class P shares returned 9.93% before the deduction of the maximum PACE Select program fee. (Class P shares returned 7.75% after the deduction of the maximum PACE Select program fee for the same 12-month period.) In comparison, the Citigroup Three-Month US Treasury Bill Index (the "benchmark") returned 0.08%, the MSCI World Free Index (net) returned 23.24%, the Barclays Global Aggregate Index declined 2.09%, and the HFRI Fund of Funds Composite Index (net) returned 7.89 %, while the Lipper Absolute Return Funds category posted a median return of 3.18%. (Returns for all share classes over various time periods are shown in the "Performance at a glance" table on page 191. Please note that the returns shown do not reflect the deduction of taxes that a shareholder would pay on Portfolio distributions or the redemption of Portfolio shares.) For a detailed commentary on the market environment in general during the reporting period, please refer to page 2.
Sub-Advisors' comments1
Please note: On December 3, 2012, First Quadrant L.P. began serving as a Sub-Advisor for the Equitized Global Macro portion of this Portfolio, a new portion of the Portfolio. First Quadrant now manages two portions of the Portfolio.
Analytic Investors
Our portion of the Portfolio consists of long-short equity positions.2 Our process is based on the premise that investor behavior changes—although slowly—and is fairly persistent from month to month. To support this premise, our model is driven by specific security characteristics within seven groups (such as valuation, quality and liquidity) to help us identify potential investment opportunities.
Within our stock selection model, characteristic positioning was favorable, as our continued overweight to the Valuation category (predicted earnings-to-price and sales-to-price) and the Revisions category (earnings revision) helped produce positive results. However, not all positioning helped, as an overweight position to the Quality category (return-on-assets and profit margin) detracted from performance, as investors did not reward high-quality companies.
PACE Select Advisors Trust –
PACE Alternative Strategies Investments
Investment Sub-Advisors:
Analytic Investors, LLC ("Analytic Investors"); Wellington Management Company, LLP ("Wellington Management") until November 30, 2012, First Quadrant L.P. ("First Quadrant") and Standard Life Investments (Corporate Funds) Limited ("Standard Life Investments")
Portfolio Managers:
Analytic Investors: Dennis Bein, David Krider and Harindra de Silva
Wellington Management: Rick A. Wurster and Stephen A. Gorman
First Quadrant: Dori Levanoni and Ed Peters
Standard Life Investments: Guy Stern
Objective:
Long-term capital appreciation
Investment process:
Analytic Investors primarily employs a long/short global equity strategy. This strategy is implemented by taking long and short positions of equity securities publicly traded in the United States and in foreign markets both by direct equity investment and through derivatives. Analytic Investors' strategy may also employ the use of derivatives, such as swaps, futures, non-deliverable forwards ("NDFs"), and forward contracts.
1 All Sub-Advisors discuss performance on a gross of fees basis—meaning that no fees or expenses are reflected in their sleeves'/sleeve's performance. Alternately, Portfolio performance is shown net of fees, which does factor in fees and expenses associated with the Portfolio.
2 When a long position is taken, a security is purchased with the expectation that it will rise in value. A short position is taken when we believe, based on our research, that securities are overpriced, and, therefore, we hope to make a profit when the security falls in value. When shorting an investment, we borrow the security, sell it, and then buy an equal number of shares later—hopefully at a lower price—to replace those we borrowed.
185
PACE Select Advisors Trust
PACE Alternative Strategies Investments
Sub-Advisors' comments – continued
In terms of stock selection, we experienced strong results within North America, while an underweight and poor stock selection within Europe negatively impacted relative performance. Within North America, stock selection was strong within both the US and Canada. For example, our top ten stock contributors to performance all occurred within those two countries. Within Europe, underweight positions to France and Spain negatively impacted performance. In addition, stock selection within the UK and Finland detracted from performance, with Sampo Oyj, a financial services company based in Finland, as our worst performing stock held during the fiscal year.
In terms of sectors, we produced positive results within energy and materials, where stock selection was positive. Additionally, stock selection and an overweight to healthcare was beneficial for results, as the sector was one of the top performers. In contrast, we experienced negative results within financials and consumer staples.
The top equity performers during the reporting period included a long position in US-based SLM Corp. and a short and long position in the US-based energy companies Peabody Energy Corp. and Marathon Petroleum Corp, respectively. The worst performing stocks were all financial services companies. Particularly, a short position in the previously mentioned Sampo Oyj and long positions in Canadian-based Riocan Real Estate Company and US-based American Capital Agency were the largest detractors from performance. We started covering the short position in Sampo Oyj in March and completely closed the position in July. However, we continue to hold our positions in both Riocan Real Estate Company and American Capital Agency based on the strength of their forward earnings yield. We employ a quantitative investment approach that looks at the total portfolio. A security is sold (or bought in the case of covering a short position) if it is not contained in the new optimal portfolio that seeks to meet the risk and return objectives after considering trading costs.
Derivative securities were not used during the reporting period.
Investment process (continued)
Wellington Management pursues an "opportunistic equity plus alpha" strategy by opportunistically seeking non-core equity exposures that Wellington Management believes are attractively valued, have positive structural characteristics in the current market environment or are expected to benefit from anticipated economic cycles. In addition, Wellington Management may employ other investment approaches, for example, by allocating assets to fixed income securities or other non-equity investments that are expected to contribute positive returns over time. Wellington Management may buy and sell, directly or indirectly, listed or unlisted equity and fixed income securities issued by entities around the world, as well as derivative instruments.
First Quadrant employs a "global macro strategy" which is implemented by combining several different complex investment techniques. It uses a "tactical risk allocation" approach across global markets which increases investment risk where it believes opportunities for risk-adjusted profit are high and attempts to lower market risks when it believes gains have been realized and future gains are unlikely. First Quadrant also assesses the combination of local market and economic factors as well as global equity, fixed income or currency market factors and attempts to capture inefficiencies in those markets. First Quadrant's strategy is primarily implemented through the use of derivatives. First Quadrant presently manages two separate portions of the Fund's assets, using the aforementioned strategies and investments. With respect to the first portion, First Quadrant seeks positive absolute returns from its global macro strategy, and the returns of this portion are not expected to be closely correlated with those of global equity markets. With respect to the second
186
PACE Select Advisors Trust
PACE Alternative Strategies Investments
Sub-Advisors' comments – continued
First Quadrant (Global Macro)
During the reporting period, our portion of the Portfolio had positive performance from the currency selection, volatility alpha (which seeks to profit from the difference between prices of options) and global asset class selection sleeves. Partially offsetting these gains were losses from country selection of both stocks and bonds. Currency selection gains were the result of overweights to both the euro and US dollar and an underweight to the Japanese yen. These positives were modestly offset by our underweights to the Swedish krona and Swiss franc. Positive performance was attributable to nearly every factor, although the relative valuation factor (which indicates whether a currency is expensive or inexpensive) contributed the most.
On average, global asset class selection had an overweight to equities and an underweight to bonds. Most of the gains were spread out somewhat evenly during the reporting period, with two short periods of weakness in 2013: in mid-April and mid-June. During those periods, the equity rally reversed course, as concerns about both global growth and the Federal Reserve Board tapering its asset purchase program led to underperformance of stocks relative to bonds globally. Global bond selection losses were attributed to the underweight in Japanese bonds in June 2013, as they outperformed during the sharp rise in global bond yields, mostly driven by the relative valuation factor (which indicates whether a bond market is expensive or inexpensive).
As a general rule, derivatives are the primary instrument used to implement all of the sleeves in our portfolio. Specifically, we used developed market futures in order to implement stock and bond country selection, global asset class selection and market contagion strategies. We used currency forwards to implement currency selection. Futures and forwards were used to gain economic exposure in a more cost-efficient manner relative to traditional instruments (e.g., physical stocks, bonds and currencies). The volatility alpha sleeve was implemented using exchanged traded options. Options were used to exploit structural characteristics of options pricing. Overall, the liquidity and low transaction cost of these instruments offers the investment team the ability to be more nimble and to implement at a lower cost. We find both attributes to be positive contributors towards portfolio performance.
First Quadrant (Equitized Global Macro)
For the period from December 3, 2012 through July 31, 2013, when we managed a portion of the Portfolio, positive performance from currency selection, volatility alpha (which seeks to profit from the difference between prices of options) and global asset class selection were partially offset by losses from country selection of both stocks and bonds.
Currency selection gains were the result of overweights to the euro and US dollar, along with an underweight to the Japanese yen. These positives were modestly offset by our underweights to the Swedish krona and Swiss franc.
Investment process (concluded)
portion, First Quadrant combines its global macro strategy with passive exposure to global equity markets while targeting a specific level of risk, which is expected to result in returns more closely correlated with those of global equity markets.
Standard Life Investments employs a "global multi-asset strategy" and seeks to achieve a total return by delivering a diversified global portfolio that makes use of multiple strategies across various asset classes. Standard Life Investments aims to exploit market cyclicality and a diverse array of inefficiencies across and within global markets to maximize risk adjusted absolute return. Standard Life Investments' portion of the Portfolio consists of listed equity, equity-related and debt securities, including exchange traded funds, and will routinely make use of derivatives or other instruments both for investment and hedging purposes. Standard Life Investments may take long and/or short positions, and its derivative investments may include, but are not restricted to, futures, options, swaps, and forward currency contracts.
187
PACE Select Advisors Trust
PACE Alternative Strategies Investments
Sub-Advisors' comments – continued
Positive performance was attributable to nearly every factor, though the relative valuation factor (which indicates whether a currency is expensive or inexpensive) contributed the most.
On average, global asset class selection had an overweight to equities and an underweight to bonds. Most of the gains were spread out somewhat evenly through the reporting period, with two short periods of weakness in 2013: in mid-April and mid-June. During those periods, the equity rally reversed course as concerns about both global growth and the Federal Reserve Board tapering its asset purchase program led to underperformance of stocks relative to bonds globally. Bond country selection losses were attributed to the underweight in Japanese bonds in June 2013, as they outperformed during the sharp rise in global bond yields, driven mostly by the relative valuation factor (which indicates whether a bond market is expensive or inexpensive).
As a general rule, derivatives are the primary instrument used to implement all of the sleeves in our portfolio. Specifically, we used developed market futures in order to implement stock and bond country selection, global asset class selection and market contagion strategies and the MSCI World equity replication. We used currency forwards to implement currency selection. Futures and forwards were used to gain economic exposure in a more cost-efficient manner relative to traditional instruments (e.g., physical stocks, bonds and currencies). The volatility alpha sleeve was implemented using exchange traded options. Options were used to exploit structural characteristics of options pricing. Overall, the liquidity and low transaction cost of these instruments offers the investment team the ability to be more nimble and to implement at a lower cost. We find both attributes to be positive contributors towards portfolio performance.
Standard Life Investments
The largest contributors to performance during the reporting period were our global equity exposure (which uses equity futures to increase or decrease exposures to various markets) and allocations to high yield and investment grade corporate bonds (which use interest rate swaps and swaptions to change the interest rate risk of these strategies). At the beginning of the reporting period, continued quantitative easing ("QE") and associated bond purchases by central banks in developed markets led to strong performance for bonds. However, later in the reporting period, concerns over tapering of QE caused the bond market to give back much of its previous gains.
Our currency positions (which use foreign exchange forwards and options to gain exposure to moves between currencies) were strong performers. Bold action by the Japanese government saw the yen weaken significantly against the US dollar. Elsewhere, the Canadian and Australian dollars fell based on concerns over domestic growth and that slowing growth in China would diminish demand for commodities, which are vital to these economies. This same fear caused our Chinese equity strategy to detract from performance. The Mexican peso rose in value, generating good returns in both our Mexican bonds versus euro strategy and our long Mexican peso versus Australian dollar strategy. While we expected the US dollar to appreciate, we generated a negative return from our long US dollar versus euro strategy, as political and economic risk in Europe lessened and the euro correspondingly strengthened.
The theme of developed markets outperforming emerging markets played out in our relative value positions, with US equity technology versus Taiwan producing good results. However, smaller US companies with less global exposure outperformed their larger counterparts. This generated a loss in both our US equity technology versus small-cap and US equity large-cap versus small-cap strategies. The aforementioned strategies are implemented using equity index futures.
As equity markets fluctuated, our relative variance income strategy (which recently transitioned into an Asian versus Standard & Poor's variance strategy based on more favorable pricing) generated solid returns. This was
188
PACE Select Advisors Trust
PACE Alternative Strategies Investments
Sub-Advisors' comments – concluded
implemented using variance swaps. Finally, foreign exchange forwards were used throughout our portion of the Portfolio to hedge the currency risk of foreign investments.
Wellington Management (Note: Wellington Management was terminated as a Sub-Advisor for the Portfolio effective November 30, 2012, and its portion of the Portfolio was transitioned to First Quadrant Equitized Global Macro. The following commentary only covers the period of time during which Wellington Management sub-advised a portion of the Portfolio, from August 1, 2012 to November 30, 2012.)
Our portion of the Portfolio posted a positive absolute return during the reporting period. Our exposure to developed global equities and thematic exposure to European equities contributed to absolute performance during the reporting period. Despite continued concerns about the looming US "fiscal cliff" and economic malaise in Europe, investor risk appetite was largely strong during the period, amid further signs of economic recovery in China and a strengthening US housing market. European equities rallied despite a host of weak economic data during the reporting period. Investors continued to take solace in the European Central Bank's bond buying plan and were encouraged when Eurozone finance ministers reached a deal of reducing Greece's debt, clearing the way for the country's next loan disbursement. Also contributing to performance was stock selection within a number of sectors. In particular, top contributors included financials holdings Societe Generale and BNP Paribas, leading producer of private-brand foods and food services products Ralcorp and diversified manufacturer Carlisle.
Our portion of the Portfolio was hurt by its tactical exposures to precious metals, particularly to gold. A lack of inflationary pressures spurred a drop in gold demand during the reporting period. Top detractors included positions in Banro and Centamin. Our exposure to Japanese equities, German bonds and US Treasuries also detracted from absolute returns. Furthermore, we were hurt by our downside protection hedges. Puts on the S&P 500 and DAX detracted from returns, as both markets rose during the reporting period.
Certain derivative instruments, including interest rate swaps and bond futures, were used to gain exposure to global bond markets, implement yield curve and duration strategies and take advantage of inefficiencies within the global bond market. Equity index futures and equity index options were utilized to gain exposure to certain global equity markets and to hedge against anticipated declines. Our portion of the Portfolio also made use of currency forwards to gain exposure to certain currencies, hedge against anticipated changes in currency values and take advantage of inefficiencies between various currencies. The results of the derivatives used during the reporting period were within our expectations.
Special considerations
The Portfolio may be appropriate for investors seeking long term capital appreciation who are able to withstand short-term fluctuations in the equity markets and fixed income markets in return for potentially higher returns over the long-term. The Portfolio may employ investment strategies that involve greater risks than the strategies used by many other mutual funds, including increased use of short sales (which involve the risk of an unlimited increase in the market value of the security sold short, which could result in a theoretically unlimited loss), leverage and derivative transactions, and hedging strategies. The value of the Portfolio changes every day and can be affected by changes in interest rates, general market conditions and other political, social and economic developments, as well as specific matters relating to the issuers of securities in which the Portfolio invests. The value of the Portfolio's investments in foreign securities may fall due to adverse political, social and economic developments abroad and due to decreases in foreign currency values relative to the US dollar. It is important to note that an investment in the Portfolio is only one component of a balanced investment plan.
189
PACE Select Advisors Trust
PACE Alternative Strategies Investments
Illustration of an assumed investment of $10,000 in Class P shares of the Portfolio (unaudited)
The following graph depicts the performance of PACE Alternative Strategies Investments Class P shares versus the Citigroup Three-Month US Treasury Bill Index, the MSCI World Free Index (net), Barclays Global Aggregate Index and the HFRI Fund of Funds Composite Index (net) from April 30, 2006, the month-end after the inception date of the Class P shares, through July 31, 2013. The performance of the other classes will vary based upon the different class specific expenses and sales charges. The performance provided does not reflect the deduction of taxes that a shareholder would pay on Portfolio distributions or the redemption of Portfolio shares. Past performance is no guarantee of future results. Share price and returns will vary with market conditions; investors may realize a gain or loss upon redemption. It is important to note that PACE Alternative Strategies Investments is a professionally managed portfolio while the Indices are not available for investment and are unmanaged. The comparison is shown for illustration purposes only.
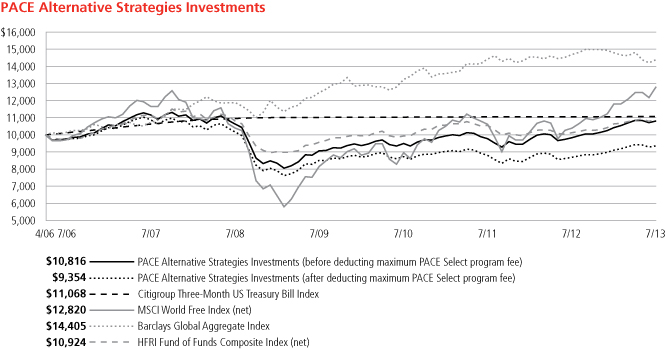
190
PACE Select Advisors Trust
PACE Alternative Strategies Investments
Performance at a glance (unaudited)
Average annual total returns for periods ended 07/31/13 | | 1 year | | 5 years | | Since inception1 | |
Before deducting maximum sales charge or PACE Select program fee | |
Class A2 | | | 9.54 | % | | | 0.06 | % | | | 1.05 | % | |
Class C3 | | | 8.79 | % | | | (0.64 | )% | | | 0.38 | % | |
Class Y4 | | | 9.89 | % | | | 0.31 | % | | | 0.29 | % | |
Class P5 | | | 9.93 | % | | | 0.33 | % | | | 1.31 | % | |
After deducting maximum sales charge or PACE Select program fee | |
Class A2 | | | 3.57 | % | | | (1.06 | )% | | | 0.27 | % | |
Class C3 | | | 7.79 | % | | | (0.64 | )% | | | 0.38 | % | |
Class P5 | | | 7.75 | % | | | (1.65 | )% | | | (0.70 | )% | |
Citigroup Three-Month US Treasury Bill Index6 | | | 0.08 | % | | | 0.20 | % | | | 1.41 | % | |
MSCI World Free Index (net)7,10 | | | 23.24 | % | | | 4.27 | % | | | 3.49 | % | |
Barclays Global Aggregate Index8,10 | | | (2.09 | )% | | | 3.91 | % | | | 5.16 | % | |
HFRI Fund of Funds Composite Index (net)9,10 | | | 7.89 | % | | | 0.19 | % | | | 1.23 | % | |
Lipper Absolute Return Funds median | | | 3.18 | % | | | 1.92 | % | | | 1.64 | % | |
Average annual total returns for periods ended June 30, 2013, after deduction of the maximum sales charge or PACE Select program fee, were as follows: Class A—1-year period, 3.70%; 5-year period, (1.61)%; since inception, 0.17%: Class C—1-year period, 7.87%; 5-year period, (1.22)%; since inception, 0.27%: Class Y—1-year period, 9.97%; since inception, 0.12%; Class P—1-year period, 7.84%; 5-year period, (2.23)%; since inception, (0.80)%.
The annualized gross and net expense ratios, respectively, for each class of shares as in the November 28, 2012 prospectuses, were as follows: Class A—2.12% and 2.03%; Class C—2.82% and 2.78%; Class Y—1.91% and 1.78%; and Class P—1.85% and 1.78%. Net expenses reflect fee waivers and/or expense reimbursements, if any, pursuant to an agreement that is in effect to cap the expenses. The Portfolio and UBS Global Asset Management (Americas) Inc. ("UBS Global AM") have entered into a written fee waiver/expense reimbursement agreement pursuant to which UBS Global AM is contractually obligated to waive its management fees and/or reimburse expenses so that the Portfolio's ordinary total operating expenses of each class through November 30, 2013 (excluding dividend expense, borrowing costs, and interest expense relating to short sales, and expenses attributable to investment in other investment companies, interest, taxes, brokerage commissions and extraordinary expenses) would not exceed Class A—1.88%; Class C—2.63%; Class Y—1.63%; and Class P—1.63%. The Portfolio has agreed to repay UBS Global AM for any waived fees/reimbursed expenses to the extent that it can do so over the following three fiscal years without causing the Portfolio's expenses in any of those three years to exceed these expense caps. The fee waiver/expense reimbursement agreement may be terminated by the Portfolio's board at any time and also will terminate automatically upon the expiration or termination of the Portfolio's advisory contract with UBS Global AM. Upon termination of the agreement, however, UBS Global AM's three year recoupment rights will survive.
1 Since inception returns are calculated as of commencement of issuance on April 10, 2006 for Class P and Class A shares, and April 11, 2006 for Class C shares. Class Y shares commenced issuance on April 3, 2006, and had fully redeemed by July 27, 2006 remaining inactive through July 22, 2008. The inception return of Class Y shares is calculated from July 23, 2008, which is the date the Class Y shares recommenced investment operations. Since inception returns for the Indices and Lipper median are shown as of April 30, 2006, which is the month-end after the inception date of the oldest share classes (Class P and Class A).
2 Maximum sales charge for Class A shares is 5.5%. Class A shares bear ongoing 12b-1 service fees.
3 Maximum contingent deferred sales charge for Class C shares is 1% imposed on redemptions and is reduced to 0% after one year. Class C shares bear ongoing 12b-1 service and distribution fees.
4 The Portfolio offers Class Y shares to a limited group of eligible investors, including certain qualifying retirement plans. Class Y shares do not bear initial or contingent deferred sales charges or ongoing 12b-1 service and distribution fees.
5 Class P shares do not bear initial or contingent deferred sales charges or ongoing 12b-1 service and distribution fees, but are subject to a maximum annual PACE Select program fee of 2% of the value of Class P shares. Prior to June 14, 2010, the maximum annual PACE Select program fee was 1.5% of the value of Class P shares; however, the current maximum annual PACE Select program fee of 2% is reflected in the performance returns throughout all periods in the average annual total returns presented for the Class P shares shown above.
6 The Citigroup Three-Month US Treasury Bill Index is an unmanaged index reflecting monthly return equivalents of yield averages that are not marked to the market and an average of the last three 3-month T-bill month-end rates. 3-month T-bills are the short-term debt obligations of the US government. Investors should note that indices do not reflect the deduction of fees and expenses.
7 The MSCI World Free Index (net) is a free float-adjusted market capitalization weighted index that is designed to measure the equity market performance of developed markets. Net total return indices reinvest dividends after the deduction of withholding taxes, using a tax rate applicable to non-resident institutional investors who do not benefit from double taxation treaties. The index is constructed and managed with a view to being fully investable from the perspective of international institutional investors. Investors should note that indices do not reflect the deduction of fees and expenses.
8 The Barclays Global Aggregate Index is an unmanaged broad-based, market capitalization weighted index which is designed to measure the broad global markets for US and non US corporate, government, governmental agency, supranational, mortgage-backed and asset-backed fixed income securities. Investors should note that indices do not reflect the deduction of fees and expenses.
9 The HFRI Fund of Funds Composite Index is a Fund of Funds index with multiple managers through funds or managed accounts. The strategy designs a diversified portfolio of managers with the objective of significantly lowering the risk (volatility) of investing with an individual manager. The Fund of Funds manager has discretion in choosing which strategies to invest in for the portfolio. A manager may allocate funds to numerous managers within a single strategy, or with numerous managers in multiple strategies. The minimum investment in a Fund of Funds may be lower than an investment in an individual hedge fund or managed account. The investor has the advantage of diversification among managers and styles with significantly less capital than investing with separate managers. Investors should note that indices do not reflect fees and expenses.
10 The PACE Alternative Strategies Investments' secondary indexes have been changed to include the MSCI World Free Index (net), and HFRI Fund of Funds Index along with Barclays Global Aggregate Index, a current secondary index, to better reflect the fund's flexible investment approach.
If an investor sells or exchanges shares less than 90 days after purchase, a redemption fee of 1.00% of the amount sold or exchanged will be
deducted at the time of the transaction, except as noted otherwise in the prospectuses.
Past performance does not predict future performance, and the performance information provided does not reflect the deduction of taxes that a shareholder would pay on Portfolio distributions or the redemption of Portfolio shares. The return and principal value of an investment will fluctuate, so that an investor's shares, when redeemed, may be worth more or less than their original cost. Performance results assume reinvestment of all dividends and capital gain distributions at net asset value on the ex-dividend dates. Current performance may be higher or lower than the performance data quoted. For month-end performance figures, please visit http://globalam-us.ubs.com/corpweb/performance.do.
Lipper peer group data calculated by Lipper Inc.; used with permission. The Lipper median is the return of the fund that places in the middle of a Lipper peer group.
191
PACE Select Advisors Trust
PACE Alternative Strategies Investments
Portfolio statistics (unaudited)
Characteristics | | 07/31/13 | |
Net assets (mm) | | $ | 554.8 | | |
Number of holdings | | | 537 | | |
Portfolio composition1 | | 07/31/13 | |
Common stocks and preferred stock | | | 30.8 | % | |
Bonds and notes | | | 6.9 | | |
ADRs and GDRs | | | 0.4 | | |
Rights | | | 0.02 | | |
Investments sold short | | | (4.6 | ) | |
Options, futures, swaps and forward foreign currency contracts | | | 1.1 | | |
Cash equivalents and other assets less liabilities | | | 65.4 | | |
Total | | | 100.0 | % | |
Top five countries (long holdings)1,3 | | 07/31/13 | |
United States | | | 15.9 | % | |
Japan | | | 3.4 | | |
United Kingdom | | | 2.7 | | |
Canada | | | 2.2 | | |
Mexico | | | 2.2 | | |
Total | | | 26.4 | % | |
Top five equity sectors (long holdings)1,3 | | 07/31/13 | |
Financials | | | 8.4 | % | |
Consumer discretionary | | | 5.9 | | |
Health care | | | 4.0 | | |
Energy | | | 2.8 | | |
Information technology | | | 2.6 | | |
Total | | | 23.7 | % | |
Top five countries (short holdings)1,3 | | 07/31/13 | |
United States | | | (1.5 | )% | |
Canada | | | (0.8 | ) | |
Germany | | | (0.4 | ) | |
Japan | | | (0.4 | ) | |
France | | | (0.4 | ) | |
Total | | | (3.5 | )% | |
Top five equity sectors (short holdings)1,3 | | 07/31/13 | |
Energy | | | (1.6 | )% | |
Financials | | | (0.8 | ) | |
Consumer discretionary | | | (0.5 | ) | |
Information technology | | | (0.4 | ) | |
Materials | | | (0.4 | ) | |
Total | | | (3.7 | )% | |
For a listing of defined portfolio acronyms that are used throughout the Portfolio statistics, please refer to page 218.
1 Weightings represent percentages of the Portfolio's net assets as of July 31, 2013. The Portfolio is actively managed and its composition will vary over time.
2 Amount is less than 0.05%.
3 Figures represent the breakdown of direct investments of PACE Alternative Strategies Investments. Figures would be different if a breakdown of the underlying investment companies was included.
192
PACE Select Advisors Trust
PACE Alternative Strategies Investments
Portfolio statistics (unaudited) (concluded)
Top ten equity holdings (long holdings)1,2 | | 07/31/13 | |
TJX Cos., Inc. | | | 0.6 | % | |
SLM Corp. | | | 0.4 | | |
Liberty Media Corp., Class A | | | 0.4 | | |
PetSmart, Inc. | | | 0.4 | | |
Gilead Sciences, Inc. | | | 0.4 | | |
Edison International | | | 0.4 | | |
Amgen, Inc. | | | 0.4 | | |
Twenty-First Century Fox, Inc., Class B | | | 0.4 | | |
Maxim Integrated Products, Inc. | | | 0.3 | | |
RioCan Real Estate Investment Trust | | | 0.3 | | |
Total | | | 4.0 | % | |
Top ten equity holdings (short holdings)1,2 | | 07/31/13 | |
QEP Resources, Inc. | | | (0.2 | )% | |
Cobalt International Energy, Inc. | | | (0.2 | ) | |
Veolia Environnement SA | | | (0.2 | ) | |
Erste Group Bank AG | | | (0.2 | ) | |
Encana Corp. | | | (0.2 | ) | |
Ultra Petroleum Corp. | | | (0.2 | ) | |
DISH Network Corp., Class A | | | (0.2 | ) | |
FMC Technologies, Inc. | | | (0.2 | ) | |
Banco Popular Espanol SA | | | (0.2 | ) | |
Infineon Technologies AG | | | (0.2 | ) | |
Total | | | (2.0 | )% | |
Top ten long-term fixed income holdings
(long holdings)1,2 | | 07/31/13 | |
Mexican Bonos, 10.000%, 12/05/24 | | | 0.5 | % | |
Mexican Bonos, 6.500%, 06/10/21 | | | 0.5 | | |
Mexican Bonos, 8.500%, 05/31/29 | | | 0.5 | | |
Mexican Bonos, 7.500%, 06/03/27 | | | 0.5 | | |
Volkswagen Leasing GmbH, 3.250%, 05/10/18 | | | 0.1 | | |
GE Capital European Funding, 3.750%, 04/04/16 | | | 0.1 | | |
Rabobank Nederland, 4.125%, 01/14/20 | | | 0.1 | | |
Electricite de France, 6.250%, 01/25/21 | | | 0.1 | | |
Royal Bank of Scotland PLC, 4.875%, 01/20/17 | | | 0.1 | | |
Bundesrepublik Deutschland, 1.500%, 02/15/23 | | | 0.1 | | |
Total | | | 2.6 | % | |
1 Weightings represent percentages of the Portfolio's net assets as of July 31, 2013. The Portfolio is actively managed and its composition will vary over time.
2 Figures represent the breakdown of direct investments of PACE Alternative Strategies Investments. Figures would be different if a breakdown of the underlying investment companies was included.
193
PACE Select Advisors Trust
PACE Alternative Strategies Investments
Industry diversification—(unaudited)
As a percentage of net assets as of July 31, 2013
Common stocks
Aerospace & defense | | | 0.27 | % | |
Air freight & logistics | | | 0.14 | | |
Airlines | | | 0.15 | | |
Auto components | | | 0.15 | | |
Automobiles | | | 0.21 | | |
Beverages | | | 0.27 | | |
Biotechnology | | | 1.18 | | |
Capital markets | | | 0.65 | | |
Chemicals | | | 0.44 | | |
Commercial banks | | | 2.12 | | |
Commercial services & supplies | | | 0.55 | | |
Computers & peripherals | | | 0.11 | | |
Construction & engineering | | | 0.10 | | |
Consumer finance | | | 0.58 | | |
Containers & packaging | | | 0.08 | | |
Diversified consumer services | | | 0.15 | | |
Diversified financial services | | | 0.37 | | |
Diversified telecommunication services | | | 0.32 | | |
Electric utilities | | | 0.39 | | |
Electrical equipment | | | 0.18 | | |
Electronic equipment, instruments & components | | | 0.12 | | |
Energy equipment & services | | | 0.23 | | |
Food & staples retailing | | | 0.74 | | |
Food products | | | 0.38 | | |
Gas utilities | | | 0.07 | | |
Health care equipment & supplies | | | 0.96 | | |
Health care providers & services | | | 0.51 | | |
Hotels, restaurants & leisure | | | 0.90 | | |
Household durables | | | 0.51 | | |
Independent power producers & energy traders | | | 0.23 | | |
Industrial conglomerates | | | 0.16 | | |
Insurance | | | 0.25 | | |
Internet software & services | | | 0.91 | | |
IT services | | | 0.42 | | |
Leisure equipment & products | | | 0.31 | | |
Machinery | | | 0.34 | | |
Media | | | 1.88 | | |
Metals & mining | | | 0.98 | | |
Multi-utilities | | | 0.16 | | |
Multiline retail | | | 0.10 | | |
Oil, gas & consumable fuels | | | 2.59 | | |
Personal products | | | 0.36 | | |
Common stocks—(concluded)
Pharmaceuticals | | | 1.37 | % | |
Professional services | | | 0.10 | | |
Real estate investment trusts | | | 3.51 | | |
Real estate management & development | | | 0.94 | | |
Road & rail | | | 0.41 | | |
Semiconductors & semiconductor equipment | | | 0.62 | | |
Software | | | 0.41 | | |
Specialty retail | | | 1.39 | | |
Textiles, apparel & luxury goods | | | 0.31 | | |
Thrifts & mortgage finance | | | 0.02 | | |
Transportation infrastructure | | | 0.03 | | |
Water utilities | | | 0.19 | | |
Wireless telecommunication services | | | 0.30 | | |
Total common stocks | | | 31.12 | | |
Preferred stock
Metals & mining | | | 0.07 | | |
Total preferred stock | | | 0.07 | | |
Rights | | | 0.001 | | |
Corporate notes
Apparel | | | 0.02 | | |
Auto manufacturers | | | 0.20 | | |
Banking non-US | | | 0.75 | | |
Beverages | | | 0.09 | | |
Building materials | | | 0.07 | | |
Building societies | | | 0.09 | | |
Chemicals | | | 0.03 | | |
Commercial services | | | 0.08 | | |
Diversified banking institution | | | 0.67 | | |
Diversified financial services | | | 0.01 | | |
Diversified operations | | | 0.10 | | |
Electric-generation | | | 0.07 | | |
Electric-integrated | | | 0.37 | | |
Energy-alternate sources | | | 0.04 | | |
Engineering & construction | | | 0.09 | | |
Finance-auto loans | | | 0.16 | | |
Finance-consumer loans | | | 0.08 | | |
Food-retail | | | 0.08 | | |
Gas-distribution | | | 0.08 | | |
Gas-transportation | | | 0.04 | | |
Insurance | | | 0.24 | | |
194
PACE Select Advisors Trust
PACE Alternative Strategies Investments
Industry diversification—(unaudited) (concluded)
As a percentage of net assets as of July 31, 2013
Corporate notes—(concluded)
Investment companies | | | 0.03 | % | |
Machinery-general industrial | | | 0.07 | | |
Medical | | | 0.05 | | |
Mining | | | 0.02 | | |
Money center banks | | | 0.11 | | |
Multimedia | | | 0.02 | | |
Oil & gas | | | 0.10 | | |
Paper & forest products | | | 0.02 | | |
REITS-diversified | | | 0.03 | | |
REITS-shopping centers | | | 0.04 | | |
Retail-discount | | | 0.02 | | |
Satellite telecommunications | | | 0.03 | | |
Software | | | 0.03 | | |
Steel-producers | | | 0.04 | | |
Telecommunications | | | 0.38 | | |
Tobacco | | | 0.09 | | |
Transportation | | | 0.08 | | |
Water | | | 0.04 | | |
Total corporate notes | | | 4.56 | | |
Non-US government obligations | | | 2.31 | | |
Time deposits | | | 15.47 | | |
Short-term US government obligations | | | 38.66 | | |
Repurchase agreement | | | 6.34 | | |
Options purchased
Call options purchased | | | 2.09 | | |
Put options purchased | | | 0.70 | | |
Total options purchased | | | 2.79 | | |
Investments sold short
Common stocks
Automobiles | | | (0.17 | )% | |
Commercial banks | | | (0.54 | ) | |
Construction & engineering | | | (0.07 | ) | |
Electric utilities | | | (0.18 | ) | |
Electronic equipment, instruments & components | | | (0.13 | ) | |
Energy equipment & services | | | (0.30 | ) | |
Food & staples retailing | | | (0.08 | ) | |
Food products | | | (0.12 | ) | |
Health care providers & services | | | (0.09 | ) | |
Insurance | | | (0.01 | ) | |
Machinery | | | (0.10 | ) | |
Media | | | (0.36 | ) | |
Metals & mining | | | (0.39 | ) | |
Multi-utilities | | | (0.21 | ) | |
Oil, gas & consumable fuels | | | (1.34 | ) | |
Real estate management & development | | | (0.23 | ) | |
Semiconductors & semiconductor equipment | | | (0.18 | ) | |
Software | | | (0.10 | ) | |
Total investments sold short | | | (4.60 | ) | |
Other assets in excess of liabilities | | | 3.28 | | |
Net assets | | | 100.00 | % | |
1 Weighting represents less than 0.005% of the Portfolio's net assets as of July 31, 2013.
195
PACE Select Advisors Trust
PACE Alternative Strategies Investments
Portfolio of investments—July 31, 2013
| | | Number of
shares | | Value | |
Common stocks—31.12% | |
Australia—0.90% | |
Caltex Australia Ltd. | | | 37,236 | | | $ | 626,216 | | |
Dexus Property Group | | | 90,492 | | | | 85,406 | | |
GPT Group | | | 75,135 | | | | 247,178 | | |
Mirvac Group | | | 232,812 | | | | 343,191 | | |
Rio Tinto Ltd. | | | 24,478 | | | | 1,265,338 | | |
Santos Ltd. | | | 62,260 | | | | 765,006 | | |
Sydney Airport | | | 56,347 | | | | 181,824 | | |
Westfield Group | | | 60,686 | | | | 612,024 | | |
Westfield Retail Trust | | | 328,432 | | | | 888,585 | | |
Total Australia common stocks | | | | | 5,014,768 | | |
Austria—0.14% | |
Oesterreichische Post AG | | | 18,032 | | | | 770,043 | | |
Belgium—0.25% | |
Ageas | | | 34,726 | | | | 1,390,321 | | |
Bermuda—0.36% | |
Bunge Ltd. | | | 5,687 | | | | 432,269 | | |
First Pacific Co. Ltd. | | | 168,000 | | | | 189,974 | | |
Hongkong Land Holdings Ltd. | | | 31,000 | | | | 209,870 | | |
Lazard Ltd., Class A | | | 22,911 | | | | 833,044 | | |
Yue Yuen Industrial Holdings Ltd. | | | 115,500 | | | | 317,954 | | |
Total Bermuda common stocks | | | | | 1,983,111 | | |
Canada—2.19% | |
Africa Oil Corp.* | | | 51,684 | | | | 388,533 | | |
Alimentation Couche Tard, Inc.,
Class B | | | 19,931 | | | | 1,221,552 | | |
Canadian Imperial Bank of Commerce | | | 17,400 | | | | 1,320,205 | | |
Canadian Tire Corp. Ltd., Class A | | | 6,600 | | | | 543,178 | | |
Empire Co. Ltd. | | | 100 | | | | 7,860 | | |
First Quantum Minerals Ltd. | | | 38,761 | | | | 622,682 | | |
Genworth MI Canada, Inc. | | | 3,300 | | | | 91,922 | | |
H&R Real Estate Investment Trust | | | 48,300 | | | | 1,016,223 | | |
Husky Energy, Inc. | | | 33,900 | | | | 976,964 | | |
Metro, Inc. | | | 1,900 | | | | 136,280 | | |
National Bank of Canada | | | 18,400 | | | | 1,415,426 | | |
Open Text Corp. | | | 1,300 | | | | 91,877 | | |
RioCan Real Estate Investment Trust | | | 80,100 | | | | 1,898,193 | | |
Rogers Communications, Inc., Class B | | | 29,700 | | | | 1,186,728 | | |
Suncor Energy, Inc. | | | 32,563 | | | | 1,029,106 | | |
Yamana Gold, Inc. | | | 17,300 | | | | 180,731 | | |
Total Canada common stocks | | | | | 12,127,460 | | |
Cayman Islands—0.56% | |
51job, Inc., ADR* | | | 8,396 | | | | 558,334 | | |
China Mengniu Dairy Co. Ltd. | | | 160,000 | | | | 640,569 | | |
China Metal Recycling
Holdings Ltd.*,1,2 | | | 352,200 | | | | 0 | | |
Herbalife Ltd.3 | | | 19,106 | | | | 1,251,443 | | |
Sands China Ltd. | | | 116,400 | | | | 629,607 | | |
Total Cayman Islands common stocks | | | | | 3,079,953 | | |
Denmark—0.19% | |
Danske Bank A/S* | | | 57,275 | | | | 1,055,718 | | |
| | | Number of
shares | | Value | |
Common stocks—(continued) | |
Finland—0.16% | |
Wartsila Oyj | | | 19,932 | | | $ | 902,092 | | |
France—0.89% | |
BNP Paribas SA | | | 20,543 | | | | 1,329,164 | | |
Carrefour SA | | | 38,090 | | | | 1,169,027 | | |
Ingenico SA | | | 9,053 | | | | 676,974 | | |
Klepierre | | | 5,880 | | | | 254,934 | | |
Sanofi | | | 9,578 | | | | 1,021,533 | | |
Unibail-Rodamco SE | | | 2,041 | | | | 494,582 | | |
Total France common stocks | | | | | 4,946,214 | | |
Germany—0.06% | |
GSW Immobilien AG | | | 2,319 | | | | 93,848 | | |
Hugo Boss AG | | | 976 | | | | 113,196 | | |
Merck KGaA | | | 736 | | | | 121,707 | | |
Total Germany common stocks | | | | | 328,751 | | |
Hong Kong—1.12% | |
BOC Hong Kong (Holdings) Ltd. | | | 337,500 | | | | 1,059,638 | | |
Henderson Land Development
Co. Ltd. | | | 34,400 | | | | 214,678 | | |
HKT Trust and HKT Ltd. | | | 246,000 | | | | 240,747 | | |
Hopewell Holdings Ltd. | | | 73,500 | | | | 233,135 | | |
New World Development Co. Ltd. | | | 158,000 | | | | 231,023 | | |
SJM Holdings Ltd. | | | 72,000 | | | | 180,474 | | |
Sun Hung Kai Properties Ltd. | | | 119,000 | | | | 1,588,078 | | |
Swire Properties Ltd. | | | 30,000 | | | | 88,194 | | |
The Link REIT | | | 357,000 | | | | 1,746,886 | | |
Wheelock & Co. Ltd. | | | 125,000 | | | | 651,142 | | |
Total Hong Kong common stocks | | | | | 6,233,995 | | |
Ireland—0.20% | |
Accenture PLC, Class A | | | 14,582 | | | | 1,076,297 | | |
Warner Chilcott PLC, Class A3 | | | 438 | | | | 9,334 | | |
Total Ireland common stocks | | | | | 1,085,631 | | |
Israel—0.05% | |
Mellanox Technologies Ltd.* | | | 6,300 | | | | 287,595 | | |
Italy—0.08% | |
Prada SpA | | | 46,800 | | | | 436,887 | | |
Japan—3.39% | |
ABC-Mart, Inc. | | | 8,600 | | | | 388,234 | | |
Daiwa Securities Group, Inc. | | | 94,000 | | | | 802,615 | | |
Hakuhodo DY Holdings, Inc. | | | 6,640 | | | | 457,767 | | |
Mazda Motor Corp.* | | | 18,000 | | | | 75,375 | | |
Medipal Holdings Corp. | | | 46,800 | | | | 581,236 | | |
Mitsubishi Estate Co. Ltd. | | | 13,000 | | | | 330,743 | | |
Mitsubishi Materials Corp. | | | 139,000 | | | | 491,206 | | |
Mitsui Fudosan Co. Ltd. | | | 49,000 | | | | 1,482,862 | | |
NAMCO BANDAI Holdings, Inc. | | | 52,300 | | | | 847,184 | | |
Nippon Building Fund, Inc. | | | 11 | | | | 119,875 | | |
Nippon Prologis REIT, Inc. | | | 17 | | | | 147,585 | | |
Nippon Steel & Sumitomo Metal | | | 341,000 | | | | 992,595 | | |
Nomura Real Estate Office Fund, Inc. | | | 95 | | | | 415,764 | | |
Olympus Corp.* | | | 400 | | | | 12,252 | | |
196
PACE Select Advisors Trust
PACE Alternative Strategies Investments
Portfolio of investments—July 31, 2013
| | | Number of
shares | | Value | |
Common stocks—(continued) | |
Japan—(concluded) | |
Oracle Corp. Japan | | | 6,700 | | | $ | 261,403 | | |
Oriental Land Co. Ltd. | | | 8,200 | | | | 1,335,819 | | |
ORIX Corp. | | | 59,200 | | | | 879,747 | | |
Otsuka Corp. | | | 11,300 | | | | 1,278,766 | | |
Park24 Co. Ltd. | | | 35,000 | | | | 644,878 | | |
Resorttrust, Inc. | | | 19,200 | | | | 583,981 | | |
Sekisui House Ltd. | | | 78,000 | | | | 1,009,356 | | |
Seven & I Holdings Co. Ltd. | | | 22,000 | | | | 831,376 | | |
Shionogi & Co. Ltd. | | | 41,000 | | | | 833,735 | | |
Sumitomo Mitsui Financial Group, Inc. | | | 33,100 | | | | 1,516,224 | | |
Suzuken Co. Ltd. | | | 2,600 | | | | 81,391 | | |
Taisei Corp. | | | 148,000 | | | | 577,428 | | |
Tokyo Gas Co. Ltd. | | | 70,000 | | | | 385,354 | | |
Tsumura & Co. | | | 20,200 | | | | 576,436 | | |
Yamaha Corp. | | | 66,800 | | | | 858,282 | | |
Total Japan common stocks | | | | | 18,799,469 | | |
Jersey—0.10% | |
Petrofac Ltd. | | | 28,689 | | | | 573,035 | | |
Netherlands—0.43% | |
Koninklijke Philips N.V. | | | 27,211 | | | | 870,976 | | |
LyondellBasell Industries N.V.,
Class A3 | | | 21,800 | | | | 1,497,878 | | |
Total Netherlands common stocks | | | | | 2,368,854 | | |
Norway—0.24% | |
DNB ASA | | | 78,740 | | | | 1,311,487 | | |
Papua New Guinea—0.14% | |
Oil Search Ltd. | | | 108,647 | | | | 791,024 | | |
Portugal—0.16% | |
Galp Energia, SGPS SA | | | 54,825 | | | | 875,237 | | |
Russia—0.46% | |
Magnit OJSC4 | | | 12,417 | | | | 715,219 | | |
Mining and Metallurgical Co.
Norilsk Nickel, ADR | | | 69,635 | | | | 933,805 | | |
Rosneft Oil Co., GDR4 | | | 93,356 | | | | 660,961 | | |
VTB Bank OJSC, GDR4 | | | 93,077 | | | | 263,036 | | |
Total Russia common stocks | | | | | 2,573,021 | | |
Singapore—0.52% | |
Ascendas Real Estate Investment
Trust (A-REIT) | | | 804,000 | | | | 1,455,089 | | |
Capitaland Ltd. | | | 39,000 | | | | 99,123 | | |
ComfortDelGro Corp. Ltd. | | | 510,000 | | | | 802,612 | | |
Mapletree Commercial Trust | | | 69,000 | | | | 64,610 | | |
StarHub Ltd. | | | 131,000 | | | | 453,555 | | |
Total Singapore common stocks | | | | | 2,874,989 | | |
South Korea—0.05% | |
Samsung Electronics Co. Ltd. | | | 259 | | | | 295,098 | | |
Spain—0.33% | |
Grifols SA | | | 42,761 | | | | 1,803,889 | | |
| | | Number of
shares | | Value | |
Common stocks—(continued) | |
Sweden—0.30% | |
Elekta AB, B Shares | | | 61,437 | | | $ | 1,049,061 | | |
Lundin Petroleum AB* | | | 29,035 | | | | 639,664 | | |
Total Sweden common stocks | | | | | 1,688,725 | | |
Switzerland—0.38% | |
Roche Holding AG | | | 4,777 | | | | 1,176,893 | | |
Syngenta AG | | | 2,388 | | | | 947,769 | | |
Total Switzerland common stocks | | | | | 2,124,662 | | |
United Kingdom—2.10% | |
Aveva Group PLC | | | 13,614 | | | | 497,876 | | |
British Sky Broadcasting Group PLC | | | 131,915 | | | | 1,661,595 | | |
BT Group PLC | | | 220,262 | | | | 1,141,596 | | |
Derwent London PLC | | | 5,100 | | | | 187,054 | | |
DS Smith PLC | | | 110,562 | | | | 436,291 | | |
Great Portland Estates PLC | | | 28,394 | | | | 240,161 | | |
Hammerson PLC | | | 54,044 | | | | 435,325 | | |
Inmarsat PLC | | | 35,698 | | | | 371,179 | | |
Land Securities Group PLC | | | 26,132 | | | | 377,259 | | |
Lloyds Banking Group PLC* | | | 1,368,158 | | | | 1,425,073 | | |
Persimmon PLC* | | | 40,745 | | | | 766,114 | | |
Rio Tinto PLC | | | 20,654 | | | | 928,458 | | |
Royal Dutch Shell PLC, A Shares | | | 22,872 | | | | 778,691 | | |
Segro PLC | | | 42,449 | | | | 200,701 | | |
Telecity Group PLC | | | 25,000 | | | | 338,098 | | |
Tui Travel PLC | | | 127,467 | | | | 741,121 | | |
United Utilities Group PLC | | | 97,375 | | | | 1,068,771 | | |
Workspace Group PLC | | | 9,953 | | | | 68,377 | | |
Total United Kingdom common stocks | | | | | 11,663,740 | | |
United States—15.37% | |
Abbott Laboratories3 | | | 10,644 | | | | 389,890 | | |
AbbVie, Inc.3 | | | 39,935 | | | | 1,816,244 | | |
Acuity Brands, Inc. | | | 11,298 | | | | 977,277 | | |
American Capital Agency Corp.3 | | | 42,193 | | | | 950,608 | | |
Amgen, Inc.3 | | | 19,669 | | | | 2,129,956 | | |
Annaly Capital Management, Inc.3 | | | 103,054 | | | | 1,228,404 | | |
AvalonBay Communities, Inc. | | | 2,485 | | | | 336,320 | | |
Avery Dennison Corp.3 | | | 41,142 | | | | 1,840,282 | | |
Baxter International, Inc. | | | 14,449 | | | | 1,055,355 | | |
Beam, Inc. | | | 12,566 | | | | 816,664 | | |
Biogen Idec, Inc.* | | | 1,836 | | | | 400,487 | | |
BMC Software, Inc.* | | | 3,609 | | | | 165,906 | | |
BorgWarner, Inc.* | | | 8,860 | | | | 845,510 | | |
Boston Properties, Inc. | | | 2,326 | | | | 248,766 | | |
CA, Inc. | | | 20,196 | | | | 600,629 | | |
Calpine Corp.* | | | 63,291 | | | | 1,266,453 | | |
Citigroup, Inc. | | | 35,765 | | | | 1,864,787 | | |
CMS Energy Corp. | | | 31,808 | | | | 890,306 | | |
Cobalt International Energy, Inc.* | | | 14,452 | | | | 416,940 | | |
Comcast Corp., Class A3 | | | 20,767 | | | | 936,176 | | |
CST Brands, Inc.* | | | 3,292 | | | | 107,352 | | |
DDR Corp. | | | 14,429 | | | | 246,447 | | |
Delta Air Lines, Inc.* | | | 39,687 | | | | 842,555 | | |
eBay, Inc.* | | | 19,146 | | | | 989,657 | | |
197
PACE Select Advisors Trust
PACE Alternative Strategies Investments
Portfolio of investments—July 31, 2013
| | | Number of
shares | | Value | |
Common stocks—(continued) | |
United States—(continued) | |
Edison International3 | | | 42,995 | | | $ | 2,143,301 | | |
Edwards Lifesciences Corp.*,3 | | | 18,979 | | | | 1,354,721 | | |
Equinix, Inc.* | | | 4,084 | | | | 732,465 | | |
Equity Residential | | | 5,793 | | | | 324,408 | | |
Essex Property Trust, Inc. | | | 1,340 | | | | 216,129 | | |
Express Scripts Holding Co.* | | | 13,432 | | | | 880,468 | | |
Extra Space Storage, Inc. | | | 5,825 | | | | 244,941 | | |
Facebook, Inc., Class A* | | | 2,303 | | | | 84,820 | | |
Federal Realty Investment Trust | | | 2,210 | | | | 232,779 | | |
First Republic Bank | | | 25,037 | | | | 1,081,348 | | |
General Growth Properties, Inc. | | | 21,218 | | | | 440,061 | | |
General Motors Co.* | | | 31,187 | | | | 1,118,678 | | |
Gilead Sciences, Inc.*,3 | | | 35,841 | | | | 2,202,429 | | |
Google, Inc., Class A* | | | 1,940 | | | | 1,721,944 | | |
H&R Block, Inc. | | | 25,688 | | | | 807,374 | | |
Halliburton Co. | | | 15,457 | | | | 698,502 | | |
Hanesbrands, Inc. | | | 13,812 | | | | 876,510 | | |
Health Care REIT, Inc. | | | 4,071 | | | | 262,539 | | |
Hologic, Inc.*,3 | | | 81,834 | | | | 1,857,632 | | |
Host Hotels & Resorts, Inc. | | | 18,857 | | | | 336,786 | | |
J.B. Hunt Transport Services, Inc. | | | 10,817 | | | | 810,518 | | |
Kansas City Southern | | | 6,330 | | | | 682,058 | | |
Kilroy Realty Corp. | | | 2,751 | | | | 143,987 | | |
Kimco Realty Corp. | | | 13,796 | | | | 311,100 | | |
Kraft Foods Group, Inc. | | | 18,554 | | | | 1,049,785 | | |
Las Vegas Sands Corp. | | | 7,369 | | | | 409,495 | | |
Lennar Corp., Class A | | | 2,996 | | | | 101,475 | | |
Liberty Media Corp., Class A*,3 | | | 15,958 | | | | 2,293,643 | | |
Marathon Petroleum Corp.3 | | | 17,927 | | | | 1,314,587 | | |
Maxim Integrated Products, Inc.3 | | | 67,719 | | | | 1,936,763 | | |
McKesson Corp.3 | | | 10,284 | | | | 1,261,435 | | |
Monster Beverage Corp.* | | | 10,926 | | | | 666,377 | | |
NetApp, Inc. | | | 15,110 | | | | 621,323 | | |
Northrop Grumman Corp. | | | 6,434 | | | | 592,314 | | |
Occidental Petroleum Corp. | | | 12,035 | | | | 1,071,717 | | |
ON Semiconductor Corp.* | | | 110,655 | | | | 911,797 | | |
Pall Corp. | | | 14,418 | | | | 1,008,683 | | |
PetSmart, Inc.3 | | | 30,511 | | | | 2,234,015 | | |
Phillips 663 | | | 25,630 | | | | 1,576,245 | | |
Precision Castparts Corp. | | | 4,138 | | | | 917,477 | | |
ProLogis, Inc. | | | 12,989 | | | | 498,258 | | |
Public Storage | | | 1,544 | | | | 245,836 | | |
PulteGroup, Inc.*,3 | | | 58,785 | | | | 977,595 | | |
Simon Property Group, Inc. | | | 4,636 | | | | 742,038 | | |
SL Green Realty Corp. | | | 4,757 | | | | 431,222 | | |
SLM Corp.3 | | | 95,222 | | | | 2,352,936 | | |
Starbucks Corp. | | | 14,743 | | | | 1,050,291 | | |
Starwood Hotels & Resorts
Worldwide, Inc. | | | 1,396 | | | | 92,345 | | |
Starz - Liberty Capital*,3 | | | 37,556 | | | | 847,639 | | |
State Street Corp. | | | 13,288 | | | | 925,775 | | |
Tesoro Corp.3 | | | 20,573 | | | | 1,169,575 | | |
The ADT Corp.* | | | 13,723 | | | | 550,018 | | |
The Charles Schwab Corp. | | | 48,521 | | | | 1,071,829 | | |
The Estee Lauder Cos., Inc., Class A | | | 10,979 | | | | 720,771 | | |
| | | Number of
shares | | Value | |
Common stocks—(concluded) | |
United States—(concluded) | |
The Gap, Inc.3 | | | 12,195 | | | $ | 559,751 | | |
The Home Depot, Inc. | | | 13,575 | | | | 1,072,832 | | |
The Macerich Co. | | | 4,518 | | | | 280,342 | | |
Time Warner Cable, Inc. | | | 6,809 | | | | 776,703 | | |
Time Warner, Inc. | | | 14,608 | | | | 909,494 | | |
TJX Cos., Inc.3 | | | 63,958 | | | | 3,328,374 | | |
Twenty-First Century Fox, Inc. | | | 19,065 | | | | 569,662 | | |
Twenty-First Century Fox, Inc.,
Class B3 | | | 65,907 | | | | 1,976,551 | | |
Valero Energy Corp.3 | | | 35,746 | | | | 1,278,634 | | |
VeriSign, Inc.*,3 | | | 23,069 | | | | 1,103,621 | | |
VMware, Inc., Class A*,3 | | | 9,379 | | | | 770,860 | | |
Vornado Realty Trust | | | 5,088 | | | | 431,513 | | |
Zoetis, Inc.3 | | | 55,887 | | | | 1,665,991 | | |
Total United States common stocks | | | | | 85,296,056 | | |
Total common stocks
(cost—$157,648,065) | | | | | 172,681,825 | | |
Preferred stock—0.07% | |
Brazil—0.07% | |
Vale SA
(cost—$395,181) | | | 30,200 | | | | 372,643 | | |
Rights—0.00% | |
Hong Kong—0.00% | |
New Hotel, expires 12/31/13*
(cost—$0) | | | 1,925 | | | | 0 | | |
| | | Face
amount | | | |
Corporate notes—4.56% | |
Australia—0.05% | |
Santos Finance Ltd.
8.250%, due 09/22/705 | | EUR | 100,000 | | | | 146,172 | | |
Telstra Corp. Ltd.
2.500%, due 09/15/23 | | EUR | 100,000 | | | | 131,348 | | |
Total Australia corporate notes | | | | | 277,520 | | |
Belgium—0.04% | |
Anheuser-Busch InBev N.V.
2.000%, due 12/16/194 | | EUR | 150,000 | | | | 202,426 | | |
Canada—0.02% | |
Great-West Lifeco, Inc.
2.500%, due 04/18/234 | | EUR | 100,000 | | | | 129,807 | | |
Cayman Islands—0.08% | |
Hutchison Whampoa
Finance 09 Ltd.
4.750%, due 11/14/164 | | EUR | 200,000 | | | | 294,218 | | |
IPIC GMTN Ltd.
4.875%, due 05/14/164 | | EUR | 100,000 | | | | 145,008 | | |
Total Cayman Islands
corporate notes | | | | | 439,226 | | |
198
PACE Select Advisors Trust
PACE Alternative Strategies Investments
Portfolio of investments—July 31, 2013
| | | Face
amount | | Value | |
Corporate notes—(continued) | |
Czech Republic—0.03% | |
CEZ AS
4.500%, due 06/29/20 | | EUR | 100,000 | | | $ | 151,243 | | |
Denmark—0.12% | |
AP Moller - Maersk A/S
3.375%, due 08/28/194 | | EUR | 100,000 | | | | 137,399 | | |
4.875%, due 10/30/14 | | EUR | 50,000 | | | | 69,516 | | |
Danske Bank A/S
3.875%, due 02/28/17 | | EUR | 200,000 | | | | 287,683 | | |
4.100%, due 03/16/185 | | EUR | 60,000 | | | | 81,577 | | |
DONG Energy A/S
6.250%, due 06/26/30134,5 | | EUR | 78,000 | | | | 105,713 | | |
Total Denmark corporate notes | | | | | 681,888 | | |
Finland—0.03% | |
Teollisuuden Voima OYJ
4.625%, due 02/04/194 | | EUR | 100,000 | | | | 148,508 | | |
France—0.92% | |
Areva SA
3.500%, due 03/22/21 | | EUR | 100,000 | | | | 135,877 | | |
3.875%, due 09/23/16 | | EUR | 50,000 | | | | 70,495 | | |
ASF
7.375%, due 03/20/19 | | EUR | 150,000 | | | | 255,689 | | |
AXA SA
5.250%, due 04/16/404,5 | | EUR | 100,000 | | | | 138,172 | | |
BNP Paribas SA
2.875%, due 11/27/174 | | EUR | 100,000 | | | | 140,076 | | |
2.875%, due 09/26/23 | | EUR | 100,000 | | | | 132,351 | | |
3.000%, due 02/24/17 | | EUR | 150,000 | | | | 210,824 | | |
4.730%, due 04/12/164,5,6 | | EUR | 50,000 | | | | 66,019 | | |
BPCE SA
2.000%, due 04/24/18 | | EUR | 100,000 | | | | 133,949 | | |
Casino Guichard-Perrachon SA
3.311%, due 01/25/234 | | EUR | 100,000 | | | | 131,371 | | |
4.379%, due 02/08/17 | | EUR | 200,000 | | | | 290,092 | | |
Christian Dior SA
4.000%, due 05/12/16 | | EUR | 100,000 | | | | 141,077 | | |
Cie de St. Gobain
3.625%, due 06/15/214 | | EUR | 100,000 | | | | 138,024 | | |
4.500%, due 09/30/194 | | EUR | 120,000 | | | | 176,995 | | |
CNP Assurances
6.875%, due 09/30/415 | | EUR | 100,000 | | | | 146,671 | | |
Credit Agricole SA
3.900%, due 04/19/21 | | EUR | 100,000 | | | | 131,908 | | |
Electricite de France
4.500%, due 11/12/40 | | EUR | 50,000 | | | | 73,695 | | |
4.625%, due 04/26/30 | | EUR | 50,000 | | | | 75,378 | | |
6.250%, due 01/25/21 | | EUR | 250,000 | | | | 421,306 | | |
Eutelsat SA
5.000%, due 01/14/194 | | EUR | 100,000 | | | | 150,633 | | |
GDF Suez
3.500%, due 10/18/22 | | EUR | 100,000 | | | | 144,702 | | |
Lafarge SA
8.875%, due 05/27/144,7 | | EUR | 60,000 | | | | 84,422 | | |
| | | Face
amount | | Value | |
Corporate notes—(continued) | |
France—(concluded) | |
Orange SA
8.125%, due 01/28/33 | | EUR | 70,000 | | | $ | 140,678 | | |
Pernod-Ricard SA
4.875%, due 03/18/16 | | EUR | 100,000 | | | | 145,165 | | |
5.000%, due 03/15/174 | | EUR | 100,000 | | | | 148,727 | | |
RCI Banque SA
3.250%, due 01/17/144 | | EUR | 180,000 | | | | 241,925 | | |
4.000%, due 03/16/164 | | EUR | 200,000 | | | | 279,855 | | |
4.250%, due 04/27/174 | | EUR | 30,000 | | | | 42,763 | | |
Societe Fonciere Lyonnaise SA
4.625%, due 05/25/16 | | EUR | 100,000 | | | | 142,740 | | |
Societe Generale SA
4.750%, due 03/02/21 | | EUR | 100,000 | | | | 152,023 | | |
9.375%, due 09/04/194,5,6 | | EUR | 50,000 | | | | 73,834 | | |
Suez Environnement Co.
4.125%, due 06/24/22 | | EUR | 50,000 | | | | 74,959 | | |
Veolia Environnement SA
4.450%, due 04/16/184,5,6 | | EUR | 100,000 | | | | 129,257 | | |
Vivendi SA
4.750%, due 07/13/21 | | EUR | 100,000 | | | | 150,286 | | |
Total France corporate notes | | | | | 5,111,938 | | |
Germany—0.17% | |
MAN SE
7.250%, due 05/20/16 | | EUR | 50,000 | | | | 78,056 | | |
RWE AG
4.625%, due 09/28/154,5,6 | | EUR | 46,000 | | | | 62,151 | | |
ThyssenKrupp AG
9.250%, due 06/18/147 | | EUR | 150,000 | | | | 212,272 | | |
Volkswagen Leasing GmbH
3.250%, due 05/10/18 | | EUR | 400,000 | | | | 575,655 | | |
Total Germany corporate notes | | | | | 928,134 | | |
Ireland—0.23% | |
Bord Gais Eireann
3.625%, due 12/04/174 | | EUR | 100,000 | | | | 140,190 | | |
ESB Finance Ltd.
6.250%, due 09/11/174 | | EUR | 100,000 | | | | 153,456 | | |
FGA Capital Ireland PLC
4.375%, due 09/18/144 | | EUR | 100,000 | | | | 136,076 | | |
GE Capital European Funding
3.750%, due 04/04/16 | | EUR | 350,000 | | | | 498,193 | | |
5.375%, due 01/23/20 | | EUR | 80,000 | | | | 126,396 | | |
6.000%, due 01/15/19 | | EUR | 50,000 | | | | 80,341 | | |
Willow No.2 Ireland PLC for
Zurich Insurance Co. Ltd.
3.375%, due 06/27/224 | | EUR | 100,000 | | | | 139,964 | | |
Total Ireland corporate notes | | | | | 1,274,616 | | |
Italy—0.22% | |
Assicurazioni Generali SpA MTN
5.125%, due 09/16/244 | | EUR | 75,000 | | | | 106,546 | | |
Edison SpA
3.250%, due 03/17/154 | | EUR | 50,000 | | | | 68,837 | | |
199
PACE Select Advisors Trust
PACE Alternative Strategies Investments
Portfolio of investments—July 31, 2013
| | | Face
amount | | Value | |
Corporate notes—(continued) | |
Italy—(concluded) | |
Enel SpA
5.250%, due 06/20/174 | | EUR | 210,000 | | | $ | 306,542 | | |
Intesa Sanpaolo SpA
5.000%, due 02/28/174 | | EUR | 200,000 | | | | 282,915 | | |
Snam SpA
5.000%, due 01/18/194 | | EUR | 150,000 | | | | 221,280 | | |
Telecom Italia Capital SA
5.250%, due 11/15/13 | | USD | 120,000 | | | | 121,213 | | |
UniCredit SpA
4.875%, due 03/07/174 | | EUR | 100,000 | | | | 140,405 | | |
Total Italy corporate notes | | | | | 1,247,738 | | |
Jersey—0.08% | |
Heathrow Funding Ltd.
4.600%, due 02/15/184 | | EUR | 150,000 | | | | 224,800 | | |
Prosecure Funding
4.668%, due 06/30/16 | | EUR | 160,000 | | | | 218,177 | | |
Total Jersey corporate notes | | | | | 442,977 | | |
Luxembourg—0.10% | |
Fiat Finance & Trade SA
7.000%, due 03/23/174 | | EUR | 100,000 | | | | 141,323 | | |
Fiat Industrial Finance Europe SA
6.250%, due 03/09/184 | | EUR | 100,000 | | | | 147,097 | | |
Gazprom (Gaz Capital SA)
8.125%, due 02/04/15 | | EUR | 100,000 | | | | 145,141 | | |
Wind Acquisition Finance SA
7.375%, due 02/15/184 | | EUR | 100,000 | | | | 137,691 | | |
Total Luxembourg corporate notes | | | | | 571,252 | | |
Mexico—0.03% | |
America Movil SAB de C.V.
4.125%, due 10/25/19 | | EUR | 100,000 | | | | 146,837 | | |
Netherlands—0.68% | |
ABN Amro Bank N.V.
4.310%, due 03/10/165,6 | | EUR | 20,000 | | | | 24,944 | | |
6.375%, due 04/27/214 | | EUR | 100,000 | | | | 149,162 | | |
Allianz Finance II BV
5.750%, due 07/08/415 | | EUR | 100,000 | | | | 148,436 | | |
BMW Finance N.V.
3.625%, due 01/29/18 | | EUR | 180,000 | | | | 263,409 | | |
Deutsche Bahn Finance BV
3.000%, due 03/08/24 | | EUR | 100,000 | | | | 140,980 | | |
Deutsche Telekom International
Finance BV
6.000%, due 01/20/17 | | EUR | 200,000 | | | | 309,330 | | |
ELM BV (Swiss Reinsurance Co.)
5.252%, due 05/25/165,6 | | EUR | 50,000 | | | | 68,513 | | |
Enel Finance International N.V.
5.750%, due 10/24/18 | | EUR | 100,000 | | | | 150,596 | | |
ING Bank N.V.
4.000%, due 12/23/164 | | EUR | 150,000 | | | | 216,335 | | |
4.250%, due 01/13/174 | | EUR | 120,000 | | | | 174,626 | | |
4.500%, due 02/21/224 | | EUR | 100,000 | | | | 150,209 | | |
4.625%, due 03/15/195 | | EUR | 120,000 | | | | 159,163 | | |
| | | Face
amount | | Value | |
Corporate notes—(continued) | |
Netherlands—(concluded) | |
KBC IFIMA N.V.
3.875%, due 03/31/154 | | EUR | 80,000 | | | $ | 111,429 | | |
4.375%, due 10/26/154 | | EUR | 100,000 | | | | 142,520 | | |
Koninklijke KPN N.V.
3.250%, due 02/01/214 | | EUR | 100,000 | | | | 135,435 | | |
LeasePlan Corp. N.V.
3.875%, due 09/16/154 | | EUR | 100,000 | | | | 140,348 | | |
Linde Finance BV
7.375%, due 07/14/665 | | EUR | 120,000 | | | | 182,241 | | |
OI European Group BV
6.750%, due 09/15/204 | | EUR | 100,000 | | | | 151,992 | | |
Rabobank Nederland
4.125%, due 01/14/20 | | EUR | 300,000 | | | | 446,134 | | |
Repsol International Finance BV
4.250%, due 02/12/164 | | EUR | 100,000 | | | | 141,555 | | |
RWE Finance BV
6.625%, due 01/31/19 | | EUR | 50,000 | | | | 82,447 | | |
Siemens
Financieringsmaatschappij N.V.
2.875%, due 03/10/28 | | EUR | 100,000 | | | | 132,920 | | |
Telefonica Europe BV
5.875%, due 02/14/33 | | EUR | 50,000 | | | | 73,375 | | |
Ziggo Bond Co.
8.000%, due 05/15/184 | | EUR | 70,000 | | | | 99,643 | | |
Total Netherlands corporate notes | | | | | 3,795,742 | | |
Norway—0.03% | |
DnB NOR Bank ASA
4.375%, due 02/24/214 | | EUR | 110,000 | | | | 166,783 | | |
Spain—0.36% | |
Amadeus Capital Markets SA
4.875%, due 07/15/16 | | EUR | 100,000 | | | | 145,418 | | |
Banco Bilbao Vizcaya
Argentaria SA
3.500%, due 12/05/17 | | EUR | 100,000 | | | | 138,817 | | |
4.250%, due 03/30/15 | | EUR | 50,000 | | | | 69,366 | | |
Bankia SA
3.500%, due 11/13/14 | | EUR | 50,000 | | | | 66,591 | | |
BBVA Senior Finance SAU
4.375%, due 09/21/15 | | EUR | 100,000 | | | | 138,468 | | |
Ferrovial Emisiones SA
3.375%, due 01/30/184 | | EUR | 200,000 | | | | 272,620 | | |
Gas Natural Capital Markets SA
4.125%, due 01/26/18 | | EUR | 200,000 | | | | 284,156 | | |
Iberdrola Finanzas SAU
4.750%, due 01/25/16 | | EUR | 200,000 | | | | 286,666 | | |
Santander International Debt SAU
3.500%, due 08/12/144 | | EUR | 100,000 | | | | 135,553 | | |
Telefonica Emisiones SAU
4.710%, due 01/20/204 | | EUR | 100,000 | | | | 142,607 | | |
4.797%, due 02/21/184 | | EUR | 200,000 | | | | 289,148 | | |
Total Spain corporate notes | | | | | 1,969,410 | | |
200
PACE Select Advisors Trust
PACE Alternative Strategies Investments
Portfolio of investments—July 31, 2013
| | | Face
amount | | Value | |
Corporate notes—(continued) | |
Sweden—0.20% | |
Atlas Copco AB
2.500%, due 02/28/234 | | EUR | 100,000 | | | $ | 133,306 | | |
Nordea Bank AB
3.750%, due 02/24/17 | | EUR | 90,000 | | | | 130,123 | | |
4.000%, due 06/29/20 | | EUR | 100,000 | | | | 148,487 | | |
6.250%, due 09/10/185 | | EUR | 125,000 | | | | 167,093 | | |
Svenska Handelsbanken AB
4.375%, due 10/20/214 | | EUR | 200,000 | | | | 306,983 | | |
TeliaSonera AB
3.625%, due 02/14/244 | | EUR | 100,000 | | | | 144,445 | | |
3.875%, due 10/01/25 | | EUR | 50,000 | | | | 73,015 | | |
Total Sweden corporate notes | | | | | 1,103,452 | | |
United Arab Emirates—0.02% | |
Xstrata Finance Dubai Ltd.
1.750%, due 05/19/164,7 | | EUR | 100,000 | | | | 132,991 | | |
United Kingdom—0.64% | |
Abbey National Treasury
Services PLC
3.375%, due 10/20/154 | | EUR | 100,000 | | | | 139,412 | | |
Aviva PLC
5.250%, due 10/02/235 | | EUR | 50,000 | | | | 66,517 | | |
Barclays Bank PLC
6.625%, due 03/30/224 | | EUR | 70,000 | | | | 108,400 | | |
7.625%, due 11/21/22 | | USD | 200,000 | | | | 199,000 | | |
BAT International Finance PLC
3.625%, due 11/09/214 | | EUR | 100,000 | | | | 145,211 | | |
Brambles Finance PLC
4.625%, due 04/20/18 | | EUR | 100,000 | | | | 149,052 | | |
Coventry Building Society
2.250%, due 12/04/174 | | EUR | 150,000 | | | | 200,951 | | |
Experian Finance PLC
4.750%, due 02/04/20 | | EUR | 50,000 | | | | 76,336 | | |
FCE Bank PLC
4.750%, due 01/19/154 | | EUR | 150,000 | | | | 210,074 | | |
G4S International Finance PLC
2.625%, due 12/06/184 | | EUR | 100,000 | | | | 130,674 | | |
Hammerson PLC
2.750%, due 09/26/194 | | EUR | 100,000 | | | | 135,150 | | |
4.875%, due 06/19/154 | | EUR | 50,000 | | | | 71,183 | | |
HSBC Holdings PLC
6.000%, due 06/10/194 | | EUR | 80,000 | | | | 124,216 | | |
Imperial Tobacco Finance PLC
4.500%, due 07/05/18 | | EUR | 150,000 | | | | 223,902 | | |
LBG Capital No. 2 PLC, Series 22
15.000%, due 12/21/194 | | EUR | 50,000 | | | | 93,850 | | |
Legal & General Group PLC
4.000%, due 06/08/255 | | EUR | 50,000 | | | | 67,489 | | |
Lloyds TSB Bank PLC
6.500%, due 03/24/204 | | EUR | 90,000 | | | | 133,834 | | |
10.375%, due 02/12/244,5 | | EUR | 50,000 | | | | 80,629 | | |
Mondi Finance PLC
3.375%, due 09/28/204 | | EUR | 100,000 | | | | 135,713 | | |
| | | Face
amount | | Value | |
Corporate notes—(concluded) | |
United Kingdom—(concluded) | |
Nationwide Building Society
3.125%, due 04/03/17 | | EUR | 100,000 | | | $ | 140,893 | | |
6.750%, due 07/22/20 | | EUR | 100,000 | | | | 148,380 | | |
Royal Bank of Scotland PLC
4.875%, due 01/20/17 | | EUR | 270,000 | | | | 396,802 | | |
6.934%, due 04/09/18 | | EUR | 50,000 | | | | 69,173 | | |
SSE PLC
5.025%, due 10/01/155,6 | | EUR | 150,000 | | | | 209,291 | | |
Stagecoach Group PLC
5.750%, due 12/16/16 | | GBP | 50,000 | | | | 84,420 | | |
Total United Kingdom
corporate notes | | | | | 3,540,552 | | |
United States—0.51% | |
American International Group, Inc.
5.000%, due 06/26/17 | | EUR | 50,000 | | | | 73,854 | | |
AT&T, Inc.
2.500%, due 03/15/23 | | EUR | 100,000 | | | | 131,138 | | |
Bank of America Corp.
4.750%, due 04/03/174 | | EUR | 200,000 | | | | 295,263 | | |
Citigroup, Inc.
0.870%, due 05/31/175 | | EUR | 100,000 | | | | 126,716 | | |
1.469%, due 11/30/175 | | EUR | 75,000 | | | | 96,434 | | |
4.000%, due 11/26/15 | | EUR | 150,000 | | | | 212,511 | | |
7.375%, due 09/04/19 | | EUR | 120,000 | | | | 204,969 | | |
GE Capital Trust II
5.500%, due 09/15/674,5 | | EUR | 50,000 | | | | 68,222 | | |
HSBC Finance Corp.
3.750%, due 11/04/15 | | EUR | 100,000 | | | | 140,658 | | |
Merrill Lynch & Co., Inc.
4.625%, due 09/14/18 | | EUR | 100,000 | | | | 142,733 | | |
MetLife Global Funding I
4.625%, due 05/16/17 | | EUR | 100,000 | | | | 149,639 | | |
Morgan Stanley
4.000%, due 11/17/15 | | EUR | 205,000 | | | | 288,121 | | |
4.500%, due 02/23/16 | | EUR | 50,000 | | | | 71,167 | | |
5.500%, due 10/02/17 | | EUR | 50,000 | | | | 75,336 | | |
Pemex Project Funding
Master Trust
6.375%, due 08/05/164 | | EUR | 100,000 | | | | 151,460 | | |
Philip Morris International, Inc.
2.750%, due 03/19/25 | | EUR | 100,000 | | | | 130,844 | | |
Roche Holdings, Inc.
6.500%, due 03/04/214 | | EUR | 150,000 | | | | 262,902 | | |
Wal-Mart Stores, Inc.
4.875%, due 09/21/29 | | EUR | 60,000 | | | | 97,504 | | |
Zurich Finance (USA), Inc.
5.750%, due 10/02/235 | | EUR | 80,000 | | | | 106,960 | | |
Total United States
corporate notes | | | | | 2,826,431 | | |
Total corporate notes
(cost—$24,014,318) | | | | | 25,289,471 | | |
201
PACE Select Advisors Trust
PACE Alternative Strategies Investments
Portfolio of investments—July 31, 2013
| | | Face
amount | | Value | |
Non-US government obligations—2.31% | |
Germany—0.11% | |
Bundesrepublik Deutschland
1.500%, due 02/15/23 | | EUR | 300,000 | | | $ | 394,355 | | |
1.500%, due 05/15/23 | | EUR | 125,000 | | | | 163,650 | | |
3.250%, due 01/04/20 | | EUR | 50,000 | | | | 75,951 | | |
Total Germany | | | | | 633,956 | | |
Italy—0.02% | |
Italy Buoni Poliennali Del Tesoro
4.250%, due 03/01/20 | | EUR | 75,000 | | | | 102,860 | | |
Mexico—2.18% | |
Mexican Bonos
6.500%, due 06/10/21 | | MXN | 37,230,000 | | | | 3,036,388 | | |
7.500%, due 06/03/27 | | MXN | 34,870,000 | | | | 3,001,379 | | |
8.500%, due 05/31/29 | | MXN | 32,600,000 | | | | 3,001,764 | | |
10.000%, due 12/05/24 | | MXN | 29,140,000 | | | | 3,040,002 | | |
Total Mexico | | | | | 12,079,533 | | |
Total non-US government
obligations
(cost—$13,066,786) | | | | | 12,816,349 | | |
Time deposits—15.47% | |
Abbey National
0.100%, due 08/01/13 | | USD | 11,001,064 | | | | 11,001,064 | | |
ABN Amro Bank N.V.
0.380%, due 01/21/14 | | USD | 5,000,000 | | | | 5,000,000 | | |
BNP Paribas
0.100%, due 08/01/13 | | USD | 8,550,714 | | | | 8,550,714 | | |
Commerzbank AG
0.315%, due 08/19/13 | | USD | 5,000,000 | | | | 5,000,000 | | |
Credit Agricole
0.440%, due 09/06/13 | | USD | 2,500,000 | | | | 2,500,000 | | |
0.450%, due 11/14/13 | | USD | 2,500,000 | | | | 2,500,000 | | |
Deutsche Bank AG
0.250%, due 10/08/13 | | USD | 5,000,000 | | | | 5,000,000 | | |
DGZ Dekabank
0.195%, due 08/08/13 | | USD | 7,500,000 | | | | 7,499,716 | | |
DZ Bank AG
0.090%, due 08/01/13 | | USD | 11,000,722 | | | | 11,000,722 | | |
Export Development Canada
0.160%, due 01/13/14 | | USD | 5,000,000 | | | | 4,996,336 | | |
ING Bank N.V.
0.890%, due 10/17/13 | | USD | 2,000,000 | | | | 2,000,000 | | |
0.530%, due 04/30/14 | | USD | 2,500,000 | | | | 2,500,000 | | |
KBC Bank N.V.
0.330%, due 09/26/13 | | USD | 5,000,000 | | | | 5,000,000 | | |
KFW
0.110%, due 10/28/13 | | USD | 5,000,000 | | | | 4,998,656 | | |
Natixis
0.470%, due 10/15/13 | | USD | 2,500,000 | | | | 2,500,000 | | |
Societe Generale
0.450%, due 11/01/13 | | USD | 2,500,000 | | | | 2,500,000 | | |
Societe Generale, Cayman Islands
0.080%, due 08/01/13 | | USD | 3,300,502 | | | | 3,300,502 | | |
Total time deposits
(cost—$85,847,710) | | | | | 85,847,710 | | |
| | | Face
amount | | Value | |
Short-term US government obligations8—38.66% | |
US Treasury Bills
0.020%, due 08/22/13 | | USD | 10,000,000 | | | $ | 9,999,940 | | |
0.045%, due 09/19/133 | | USD | 23,000,000 | | | | 22,999,149 | | |
0.053%, due 09/26/133 | | USD | 107,150,000 | | | | 107,144,964 | | |
0.072%, due 11/21/133 | | USD | 58,600,000 | | | | 58,592,265 | | |
0.075%, due 11/29/133 | | USD | 15,753,000 | | | | 15,750,905 | | |
Total short-term US government
obligations
(cost—$214,468,716) | | | | | 214,487,223 | | |
Repurchase agreement—6.34% | |
Repurchase agreement dated
07/31/13 with State Street
Bank and Trust Co., 0.010%
due 08/01/13, collateralized by
$1,537,451 Federal Home Loan
Mortgage Corp. obligations,
1.960% due 11/07/22,
$35,441,342 Federal National
Mortgage Association
obligations, 2.140% to 2.170%
due 11/07/22 and $1,165,403
US Treasury Notes, 0.250% to
0.750% due 10/31/13 to
12/15/13; (value—$35,870,742);
proceeds: $35,167,010
(cost—$35,167,000) | | | 35,167,000 | | | | 35,167,000 | | |
| | | Number of
contracts/
Notional
amount | | | |
Options purchased—2.79% | |
Call options purchased—2.09% | |
DAX Index, strike @ 8,900,
expires 08/16/13 | | | 1,270 | | | | 7,603 | | |
DAX Index, strike @ 9,250,
expires 09/20/13 | | | 1,016 | | | | 4,055 | | |
Euro STOXX 50 Index,
strike @ 2,925, expires 08/16/13 | | | 508 | | | | 6,082 | | |
Euro STOXX 50 Index,
strike @ 2,975, expires 08/16/13 | | | 1,016 | | | | 4,055 | | |
Euro STOXX 50 Index,
strike @ 3,100, expires 09/20/13 | | | 508 | | | | 7,434 | | |
Euro STOXX 50 Index,
strike @ 3,150, expires 09/20/13 | | | 508 | | | | 676 | | |
GBP Currency Futures,
strike @ 152, expires 08/09/13 | | | 82 | | | | 49,448 | | |
GBP Currency Futures,
strike @ 153, expires 08/09/13 | | | 71 | | | | 36,831 | | |
GBP Currency Futures,
strike @ 158, expires 08/09/13 | | | 752 | | | | 18,800 | | |
GBP Currency Futures,
strike @ 159, expires 08/09/13 | | | 100 | | | | 1,250 | | |
GBP Currency Futures,
strike @ 160, expires 08/09/13 | | | 100 | | | | 625 | | |
202
PACE Select Advisors Trust
PACE Alternative Strategies Investments
Portfolio of investments—July 31, 2013
| | | Number of
contracts/
Notional
amount | | Value | |
Options purchased—(continued) | |
Call options purchased—(concluded) | |
GBP Currency Futures,
strike @ 160, expires 09/06/13 | | | 152 | | | $ | 6,650 | | |
JPY Currency Futures,
strike @ 108, expires 08/09/13 | | | 102 | | | | 3,187 | | |
JPY Currency Futures,
strike @ 109, expires 08/09/13 | | | 102 | | | | 1,913 | | |
JPY Currency Futures,
strike @ 110, expires 08/09/13 | | | 204 | | | | 2,550 | | |
JPY Currency Futures,
strike @ 111.5, expires 09/06/13 | | | 204 | | | | 17,850 | | |
S&P 500 Index, strike @ 1,550,
expires 03/22/14 | | | 180 | | | | 2,883,600 | | |
S&P 500 Index, strike @ 1,565,
expires 09/21/13 | | | 20 | | | | 243,600 | | |
S&P 500 Index, strike @ 1,575,
expires 09/21/13 | | | 32 | | | | 374,400 | | |
S&P 500 Index, strike @ 1,580,
expires 09/21/13 | | | 25 | | | | 270,750 | | |
S&P 500 Index, strike @ 1,605,
expires 09/21/13 | | | 3 | | | | 26,010 | | |
S&P 500 Index, strike @ 1,610,
expires 08/17/13 | | | 178 | | | | 1,444,470 | | |
S&P 500 Index, strike @ 1,620,
expires 09/21/13 | | | 30 | | | | 222,900 | | |
S&P 500 Index, strike @ 1,645,
expires 09/21/13 | | | 25 | | | | 141,625 | | |
S&P 500 Index, strike @ 1,665,
expires 09/21/13 | | | 15 | | | | 71,850 | | |
S&P 500 Index, strike @ 1,675,
expires 09/21/13 | | | 15 | | | | 54,900 | | |
S&P 500 Index, strike @ 1,690,
expires 09/21/13 | | | 44 | | | | 123,200 | | |
S&P 500 Index, strike @ 1,700,
expires 08/17/13 | | | 152 | | | | 150,480 | | |
S&P 500 Index, strike @ 1,850,
expires 08/17/13 | | | 152 | | | | 760 | | |
S&P 500 Index, strike @ 1,870,
expires 09/21/13 | | | 152 | | | | 760 | | |
USD Call/CNY Put,
strike @ CNY 6.38,
expires 12/11/13 | | USD | 23,000,000 | | | | 32,729 | | |
USD Call/JPY Put, strike @ JPY 82,
expires 02/09/15 | | USD | 9,000,000 | | | | 1,516,131 | | |
USD Call/JPY Put, strike @ JPY 84.5,
expires 12/11/13 | | USD | 23,000,000 | | | | 3,142,651 | | |
USD Call/JPY Put, strike @ JPY 86,
expires 12/10/15 | | USD | 1,000,000 | | | | 140,540 | | |
USD Call/JPY Put, strike @ JPY 88,
expires 05/16/14 | | USD | 1,250,000 | | | | 138,213 | | |
USD Call/JPY Put, strike @ JPY 94,
expires 08/15/13 | | USD | 11,700,000 | | | | 470,971 | | |
Total call options purchased | | | | | 11,619,549 | | |
| | | Number of
contracts/
Notional
amount | | Value | |
Options purchased—(continued) | |
Put options purchased—0.70% | |
Apple, Inc., strike @ 515,
expires 10/19/13 | | | 17 | | | $ | 115,217 | | |
DAX Index, strike @ 6,750,
expires 09/20/13 | | | 2,032 | | | | 121,647 | | |
DAX Index, strike @ 6,900,
expires 08/16/13 | | | 1,000 | | | | 4,656 | | |
Euro STOXX 50 Index,
strike @ 2,275, expires 09/20/13 | | | 1,016 | | | | 44,604 | | |
Euro STOXX 50 Index,
strike @ 2,300, expires 08/16/13 | | | 1,524 | | | | 14,192 | | |
Euro STOXX 50 Index,
strike @ 2,350, expires 09/20/13 | | | 1,270 | | | | 81,098 | | |
Euro STOXX 50 Index,
strike @ 2,375, expires 12/20/13 | | | 1,016 | | | | 423,089 | | |
GBP Currency Futures,
strike @ 141, expires 08/09/13 | | | 100 | | | | 625 | | |
GBP Currency Futures,
strike @ 142, expires 08/09/13 | | | 400 | | | | 2,500 | | |
GBP Currency Futures,
strike @ 143, expires 09/06/13 | | | 152 | | | | 7,600 | | |
GBP Currency Futures,
strike @ 144, expires 08/09/13 | | | 200 | | | | 1,250 | | |
GBP Currency Futures,
strike @ 146, expires 08/09/13 | | | 244 | | | | 4,575 | | |
GBP Currency Futures,
strike @ 147, expires 08/09/13 | | | 193 | | | | 6,031 | | |
GBP Currency Futures,
strike @ 151, expires 08/09/13 | | | 82 | | | | 51,498 | | |
GBP Currency Futures,
strike @ 152, expires 08/09/13 | | | 71 | | | | 40,381 | | |
JPY Currency Futures,
strike @ 91.5, expires 08/09/13 | | | 300 | | | | 1,875 | | |
JPY Currency Futures,
strike @ 93, expires 08/09/13 | | | 36 | | | | 225 | | |
JPY Currency Futures,
strike @ 94, expires 09/06/13 | | | 102 | | | | 4,463 | | |
Kospi 200 Index, strike @ 241.79,
expires 12/12/13 | | KRW | 35,100,000 | | | | 184,857 | | |
S&P 500 Index, strike @ 1,150,
expires 08/17/13 | | | 1,016 | | | | 5,080 | | |
S&P 500 Index, strike @ 1,180,
expires 08/17/13 | | | 305 | | | | 1,525 | | |
S&P 500 Index, strike @ 1,200,
expires 08/17/13 | | | 1,727 | | | | 8,635 | | |
S&P 500 Index, strike @ 1,230,
expires 08/17/13 | | | 152 | | | | 760 | | |
S&P 500 Index, strike @ 1,250,
expires 08/17/13 | | | 1,110 | | | | 5,550 | | |
S&P 500 Index, strike @ 1,280,
expires 08/17/13 | | | 305 | | | | 1,525 | | |
S&P 500 Index, strike @ 1,300,
expires 09/21/13 | | | 1,778 | | | | 44,450 | | |
203
PACE Select Advisors Trust
PACE Alternative Strategies Investments
Portfolio of investments—July 31, 2013
| | | Number of
contracts/
Notional
amount | | Value | |
Options purchased—(concluded) | |
Put options purchased—(concluded) | |
S&P 500 Index, strike @ 1,320,
expires 09/21/13 | | | 305 | | | $ | 6,100 | | |
S&P 500 Index, strike @ 1,350,
expires 08/17/13 | | | 228 | | | | 1,140 | | |
S&P 500 Index, strike @ 1,350,
expires 09/21/13 | | | 508 | | | | 10,160 | | |
S&P 500 Index, strike @ 1,380,
expires 08/17/13 | | | 58 | | | | 290 | | |
S&P 500 Index, strike @ 1,400,
expires 08/17/13 | | | 635 | | | | 6,350 | | |
S&P 500 Index, strike @ 1,400,
expires 12/21/13 | | | 762 | | | | 638,556 | | |
S&P 500 Index, strike @ 1,410,
expires 08/17/13 | | | 152 | | | | 760 | | |
S&P 500 Index, strike @ 1,420,
expires 08/17/13 | | | 508 | | | | 2,540 | | |
S&P 500 Index, strike @ 1,430,
expires 08/17/13 | | | 305 | | | | 1,525 | | |
S&P 500 Index, strike @ 1,450,
expires 08/17/13 | | | 305 | | | | 4,575 | | |
S&P 500 Index, strike @ 1,480,
expires 09/21/13 | | | 107 | | | | 23,540 | | |
S&P 500 Index, strike @ 1,495,
expires 08/17/13 | | | 67 | | | | 1,675 | | |
S&P 500 Index, strike @ 1,560,
expires 10/19/13 | | | 106 | | | | 112,890 | | |
S&P 500 Index, strike @ 1,615,
expires 09/21/13 | | | 20 | | | | 24,300 | | |
S&P 500 Index, strike @ 1,650,
expires 09/21/13 | | | 428 | | | | 890,240 | | |
S&P 500 Index, strike @ 1,655,
expires 08/17/13 | | | 305 | | | | 253,150 | | |
S&P 500 Index, strike @ 1,685,
expires 09/21/13 | | | 25 | | | | 80,000 | | |
US Treasury Note 10 Year Futures,
strike @ 119.5, expires 08/23/13 | | | 406 | | | | 6,344 | | |
US Treasury Note 10 Year Futures,
strike @ 120.5, expires 08/23/13 | | | 304 | | | | 4,750 | | |
US Treasury Note 10 Year Futures,
strike @ 121, expires 08/23/13 | | | 152 | | | | 4,750 | | |
USD Put/CNY Call, strike @ CNY
6.38, expires 12/11/13 | | USD | 23,000,000 | | | | 599,656 | | |
USD Put/JPY Call, strike @ JPY 71,
expires 05/16/14 | | USD | 1,250,000 | | | | 1,344 | | |
USD Put/JPY Call, strike @ JPY 79.5,
expires 12/11/13 | | USD | 23,000,000 | | | | 14,260 | | |
Total put options purchased | | | | | 3,866,803 | | |
Total options purchased
(cost—$13,978,310) | | | | | 15,486,352 | | |
Total investments before
investments sold short
(cost—$544,586,086)—101.32% | | | | | 562,148,573 | | |
| | | Shares | | Value | |
Investments sold short—(4.60)% | |
Common stocks—(4.60)% | |
Australia—(0.24)% | |
Alumina Ltd. | | | (808,328 | ) | | $ | (704,768 | ) | |
Iluka Resources Ltd. | | | (64,833 | ) | | | (642,192 | ) | |
Total Australia common stocks | | | | | (1,346,960 | ) | |
Austria—(0.20)% | |
Erste Group Bank AG | | | (37,209 | ) | | | (1,130,108 | ) | |
Bermuda—(0.12)% | |
Nabors Industries Ltd. | | | (41,732 | ) | | | (642,255 | ) | |
Canada—(0.76)% | |
Catamaran Corp. | | | (9,700 | ) | | | (510,924 | ) | |
Encana Corp. | | | (64,100 | ) | | | (1,124,605 | ) | |
MEG Energy Corp. | | | (32,000 | ) | | | (977,354 | ) | |
Pengrowth Energy Corp. | | | (31,300 | ) | | | (180,407 | ) | |
Turquoise Hill Resources Ltd. | | | (78,300 | ) | | | (313,322 | ) | |
Ultra Petroleum Corp. | | | (51,429 | ) | | | (1,113,438 | ) | |
Total Canada common stocks | | | | | (4,220,050 | ) | |
France—(0.39)% | |
Electricite de France SA | | | (33,507 | ) | | | (983,125 | ) | |
JCDecaux SA | | | (572 | ) | | | (18,354 | ) | |
Veolia Environnement SA | | | (86,095 | ) | | | (1,155,100 | ) | |
Total France common stocks | | | | | (2,156,579 | ) | |
Germany—(0.44)% | |
Daimler AG | | | (14,028 | ) | | | (974,537 | ) | |
Infineon Technologies AG | | | (111,699 | ) | | | (985,804 | ) | |
Metro AG | | | (13,588 | ) | | | (468,460 | ) | |
Total Germany common stocks | | | | | (2,428,801 | ) | |
Japan—(0.39)% | |
Hulic Co. Ltd. | | | (43,200 | ) | | | (518,435 | ) | |
Mitsubishi Estate Co. Ltd. | | | (16,000 | ) | | | (407,068 | ) | |
Nexon Co. Ltd. | | | (42,200 | ) | | | (534,019 | ) | |
Nippon Electric Glass Co. Ltd. | | | (132,000 | ) | | | (710,489 | ) | |
Total Japan common stocks | | | | | (2,170,011 | ) | |
Portugal—(0.13)% | |
Banco Espirito Santo SA | | | (758,805 | ) | | | (736,918 | ) | |
Spain—(0.18)% | |
Banco Popular Espanol SA | | | (225,784 | ) | | | (992,730 | ) | |
Mapfre SA | | | (8,605 | ) | | | (31,481 | ) | |
Total Spain common stocks | | | | | (1,024,211 | ) | |
Sweden—(0.09)% | |
Lundin Petroleum AB | | | (22,009 | ) | | | (484,876 | ) | |
Switzerland—(0.03)% | |
Banque Cantonale Vaudoise | | | (312 | ) | | | (161,150 | ) | |
United Kingdom—(0.10)% | |
Melrose Industries PLC | | | (135,234 | ) | | | (580,144 | ) | |
204
PACE Select Advisors Trust
PACE Alternative Strategies Investments
Portfolio of investments—July 31, 2013
| | | Shares | | Value | |
Investments sold short—(continued) | |
Common stocks—(continued) | |
United States—(1.53)% | |
Allegheny Technologies, Inc. | | | (17,456 | ) | | $ | (481,262 | ) | |
Cablevision Systems Corp., Class A | | | (43,794 | ) | | | (818,510 | ) | |
CBRE Group, Inc., Class A | | | (16,005 | ) | | | (370,836 | ) | |
Cobalt International Energy, Inc. | | | (40,993 | ) | | | (1,182,648 | ) | |
CONSOL Energy, Inc. | | | (1,622 | ) | | | (50,331 | ) | |
DISH Network Corp., Class A | | | (23,779 | ) | | | (1,061,732 | ) | |
FMC Technologies, Inc. | | | (19,179 | ) | | | (1,022,241 | ) | |
Green Mountain Coffee Roasters, Inc. | | | (8,457 | ) | | | (652,711 | ) | |
KBR, Inc. | | | (12,824 | ) | | | (401,135 | ) | |
Peabody Energy Corp. | | | (58,436 | ) | | | (967,700 | ) | |
| | | Shares | | Value | |
Investments sold short—(concluded) | |
Common stocks—(concluded) | |
United States—(concluded) | |
QEP Resources, Inc. | | | (45,036 | ) | | $ | (1,373,147 | ) | |
Sirius XM Radio, Inc. | | | (22,617 | ) | | | (84,361 | ) | |
Total United States common stocks | | | | | (8,466,614 | ) | |
Total investments sold short
(proceeds—$24,663,438)—(4.60)% | | | | | (25,548,677 | ) | |
Other assets in excess
of liabilities—3.28% | | | | | 18,209,672 | | |
Net assets—100.00% | | | | $ | 554,809,568 | | |
For a listing of defined portfolio acronyms, counterparty acronyms and currency abbreviations that are used throughout the Portfolio of investments as well as the tables that follow, please refer to page 218.
Aggregate cost for federal income tax purposes before investments sold short was $546,617,852; and net unrealized appreciation consisted of:
Gross unrealized appreciation | | $ | 24,697,602 | | |
Gross unrealized depreciation | | | (9,166,881 | ) | |
Net unrealized appreciation | | $ | 15,530,721 | | |
Written options
Number of
contracts/
Notional
amount | | Call options written | | Expiration
date | | Premiums
received | | Current
value | | Unrealized
appreciation
(depreciation) | |
| | 17 | | | Apple, Inc., strike @ 515 | | 10/19/13 | | $ | 93,425 | | | $ | (4,547 | ) | | $ | 88,878 | | |
| | 1,254 | | | DAX Index, strike @ 8,650 | | 08/16/13 | | | 119,952 | | | | (57,555 | ) | | | 62,397 | | |
| | 16 | | | DAX Index, strike @ 8,700 | | 08/16/13 | | | 1,816 | | | | (404 | ) | | | 1,412 | | |
| | 508 | | | DAX Index, strike @ 9,000 | | 09/20/13 | | | 25,762 | | | | (32,101 | ) | | | (6,339 | ) | |
| | 508 | | | DAX Index, strike @ 9,100 | | 09/20/13 | | | 28,200 | | | | (10,475 | ) | | | 17,725 | | |
| | 1,270 | | | Euro STOXX 50 Index, strike @ 2,825 | | 09/20/13 | | | 373,674 | | | | (680,887 | ) | | | (307,213 | ) | |
| | 508 | | | Euro STOXX 50 Index, strike @ 2,850 | | 08/16/13 | | | 23,345 | | | | (44,604 | ) | | | (21,259 | ) | |
| | 1,016 | | | Euro STOXX 50 Index, strike @ 2,875 | | 08/16/13 | | | 65,090 | | | | (45,956 | ) | | | 19,134 | | |
| | 1,016 | | | Euro STOXX 50 Index, strike @ 3,000 | | 09/20/13 | | | 46,972 | | | | (68,933 | ) | | | (21,961 | ) | |
| | 102 | | | GBP Currency Futures, strike @ 155 | | 08/09/13 | | | 10,529 | | | | (10,529 | ) | | | — | | |
| | 304 | | | GBP Currency Futures, strike @ 156 | | 08/09/13 | | | 41,507 | | | | (24,700 | ) | | | 16,807 | | |
| | 546 | | | GBP Currency Futures, strike @ 157 | | 08/09/13 | | | 57,665 | | | | (23,888 | ) | | | 33,777 | | |
| | 152 | | | GBP Currency Futures, strike @ 158 | | 09/06/13 | | | 20,441 | | | | (18,050 | ) | | | 2,391 | | |
| | 204 | | | JPY Currency Futures, strike @ 105 | | 08/09/13 | | | 45,884 | | | | (45,900 | ) | | | (16 | ) | |
| | 102 | | | JPY Currency Futures, strike @ 106 | | 08/09/13 | | | 21,367 | | | | (11,475 | ) | | | 9,892 | | |
| | 102 | | | JPY Currency Futures, strike @ 107 | | 08/09/13 | | | 22,642 | | | | (5,738 | ) | | | 16,904 | | |
| | 102 | | | JPY Currency Futures, strike @ 107 | | 09/06/13 | | | 27,783 | | | | (47,175 | ) | | | (19,392 | ) | |
| | 102 | | | JPY Currency Futures, strike @ 109.5 | | 09/06/13 | | | 23,917 | | | | (19,125 | ) | | | 4,792 | | |
KRW | 35,100,000 | | | Kospi 200 Index, strike @ 241.79 | | 12/12/13 | | | 327,600 | | | | (457,994 | ) | | | (130,394 | ) | |
| | 20 | | | S&P 500 Index, strike @ 1,615 | | 09/21/13 | | | 95,958 | | | | (156,600 | ) | | | (60,642 | ) | |
| | 124 | | | S&P 500 Index, strike @ 1,650 | | 09/21/13 | | | 638,339 | | | | (738,420 | ) | | | (100,081 | ) | |
| | 67 | | | S&P 500 Index, strike @ 1,675 | | 08/17/13 | | | 50,109 | | | | (159,460 | ) | | | (109,351 | ) | |
205
PACE Select Advisors Trust
PACE Alternative Strategies Investments
Portfolio of investments—July 31, 2013
Written options—(continued)
Number of
contracts/
Notional
amount | | Call options written | | Expiration
date | | Premiums
received | | Current
value | | Unrealized
appreciation
(depreciation) | |
| | 25 | | | S&P 500 Index, strike @ 1,685 | | 09/21/13 | | $ | 89,947 | | | $ | (75,000 | ) | | $ | 14,947 | | |
| | 107 | | | S&P 500 Index, strike @ 1,705 | | 09/21/13 | | | 80,023 | | | | (246,100 | ) | | | (166,077 | ) | |
| | 102 | | | S&P 500 Index, strike @ 1,730 | | 08/17/13 | | | 12,905 | | | | (17,646 | ) | | | (4,741 | ) | |
| | 254 | | | S&P 500 Index, strike @ 1,750 | | 08/17/13 | | | 57,070 | | | | (15,240 | ) | | | 41,830 | | |
| | 304 | | | S&P 500 Index, strike @ 1,770 | | 08/17/13 | | | 36,139 | | | | (6,080 | ) | | | 30,059 | | |
| | 98 | | | S&P 500 Index, strike @ 1,770 | | 10/19/13 | | | 89,218 | | | | (68,404 | ) | | | 20,814 | | |
| | 50 | | | S&P 500 Index, strike @ 1,780 | | 08/17/13 | | | 3,645 | | | | (1,000 | ) | | | 2,645 | | |
| | 8 | | | S&P 500 Index, strike @ 1,780 | | 10/19/13 | | | 6,783 | | | | (4,216 | ) | | | 2,567 | | |
| | 254 | | | S&P 500 Index, strike @ 1,790 | | 08/17/13 | | | 17,245 | | | | (1,270 | ) | | | 15,975 | | |
| | 152 | | | S&P 500 Index, strike @ 1,810 | | 09/21/13 | | | 24,000 | | | | (9,272 | ) | | | 14,728 | | |
| | 254 | | | S&P 500 Index, strike @ 1,840 | | 09/21/13 | | | 21,055 | | | | (3,810 | ) | | | 17,245 | | |
| | | | | | | | | $ | 2,600,007 | | | $ | (3,112,554 | ) | | $ | (512,547 | ) | |
| | | Put options written | | | | | | | | | |
| | 1,014 | | | DAX Index, strike @ 7,250 | | 09/20/13 | | | 139,326 | | | | (141,642 | ) | | | (2,316 | ) | |
| | 500 | | | DAX Index, strike @ 7,300 | | 08/16/13 | | | 83,047 | | | | (10,643 | ) | | | 72,404 | | |
| | 254 | | | DAX Index, strike @ 7,600 | | 08/16/13 | | | 14,666 | | | | (11,996 | ) | | | 2,670 | | |
| | 1,270 | | | Euro STOXX 50 Index, strike @ 2,200 | | 09/20/13 | | | 336,970 | | | | (38,859 | ) | | | 298,111 | | |
| | 508 | | | Euro STOXX 50 Index, strike @ 2,425 | | 08/16/13 | | | 38,430 | | | | (8,786 | ) | | | 29,644 | | |
| | 508 | | | Euro STOXX 50 Index, strike @ 2,425 | | 09/20/13 | | | 69,552 | | | | (48,659 | ) | | | 20,893 | | |
| | 508 | | | Euro STOXX 50 Index, strike @ 2,500 | | 08/16/13 | | | 20,202 | | | | (14,868 | ) | | | 5,334 | | |
| | 508 | | | Euro STOXX 50 Index, strike @ 2,525 | | 08/16/13 | | | 29,532 | | | | (17,571 | ) | | | 11,961 | | |
| | 508 | | | Euro STOXX 50 Index, strike @ 2,575 | | 12/20/13 | | | 453,460 | | | | (453,460 | ) | | | — | | |
| | 300 | | | GBP Currency Futures, strike @ 143 | | 08/09/13 | | | 39,214 | | | | (1,875 | ) | | | 37,339 | | |
| | 152 | | | GBP Currency Futures, strike @ 145 | | 09/06/13 | | | 22,341 | | | | (15,200 | ) | | | 7,141 | | |
| | 635 | | | GBP Currency Futures, strike @ 148 | | 08/09/13 | | | 77,545 | | | | (35,719 | ) | | | 41,826 | | |
| | 202 | | | GBP Currency Futures, strike @ 149 | | 08/09/13 | | | 19,077 | | | | (22,725 | ) | | | (3,648 | ) | |
| | 97 | | | JPY Currency Futures, strike @ 94 | | 08/09/13 | | | 22,783 | | | | (606 | ) | | | 22,177 | | |
| | 236 | | | JPY Currency Futures, strike @ 95.5 | | 08/09/13 | | | 42,917 | | | | (1,475 | ) | | | 41,442 | | |
| | 3 | | | JPY Currency Futures, strike @ 96 | | 08/09/13 | | | 704 | | | | (19 | ) | | | 685 | | |
| | 102 | | | JPY Currency Futures, strike @ 96 | | 09/06/13 | | | 18,817 | | | | (12,750 | ) | | | 6,067 | | |
| | 381 | | | S&P 500 Index, strike @ 1,300 | | 08/17/13 | | | 89,317 | | | | (1,905 | ) | | | 87,412 | | |
| | 152 | | | S&P 500 Index, strike @ 1,310 | | 08/17/13 | | | 21,480 | | | | (760 | ) | | | 20,720 | | |
| | 406 | | | S&P 500 Index, strike @ 1,320 | | 08/17/13 | | | 121,259 | | | | (2,030 | ) | | | 119,229 | | |
| | 432 | | | S&P 500 Index, strike @ 1,330 | | 08/17/13 | | | 114,304 | | | | (2,160 | ) | | | 112,144 | | |
| | 254 | | | S&P 500 Index, strike @ 1,340 | | 08/17/13 | | | 37,355 | | | | (1,270 | ) | | | 36,085 | | |
| | 305 | | | S&P 500 Index, strike @ 1,375 | | 08/17/13 | | | 86,907 | | | | (2,440 | ) | | | 84,467 | | |
| | 254 | | | S&P 500 Index, strike @ 1,380 | | 09/21/13 | | | 31,215 | | | | (16,510 | ) | | | 14,705 | | |
| | 254 | | | S&P 500 Index, strike @ 1,420 | | 09/21/13 | | | 37,565 | | | | (25,400 | ) | | | 12,165 | | |
| | 107 | | | S&P 500 Index, strike @ 1,425 | | 09/21/13 | | | 165,624 | | | | (11,235 | ) | | | 154,389 | | |
| | 67 | | | S&P 500 Index, strike @ 1,445 | | 08/17/13 | | | 82,269 | | | | (335 | ) | | | 81,934 | | |
| | 762 | | | S&P 500 Index, strike @ 1,450 | | 09/21/13 | | | 190,164 | | | | (83,820 | ) | | | 106,344 | | |
| | 152 | | | S&P 500 Index, strike @ 1,460 | | 08/17/13 | | | 20,960 | | | | (3,040 | ) | | | 17,920 | | |
| | 152 | | | S&P 500 Index, strike @ 1,470 | | 08/17/13 | | | 27,039 | | | | (3,800 | ) | | | 23,239 | | |
206
PACE Select Advisors Trust
PACE Alternative Strategies Investments
Portfolio of investments—July 31, 2013
Written options—(concluded)
Number of
contracts/
Notional
amount | | Put options written | | Expiration
date | | Premiums
received | | Current
value | | Unrealized
appreciation
(depreciation) | |
| | 152 | | | S&P 500 Index, strike @ 1,470 | | 09/21/13 | | $ | 39,960 | | | $ | (22,800 | ) | | $ | 17,160 | | |
| | 8 | | | S&P 500 Index, strike @ 1,475 | | 10/19/13 | | | 5,583 | | | | (3,656 | ) | | | 1,927 | | |
| | 456 | | | S&P 500 Index, strike @ 1,480 | | 08/17/13 | | | 60,599 | | | | (13,680 | ) | | | 46,919 | | |
| | 49 | | | S&P 500 Index, strike @ 1,480 | | 10/19/13 | | | 43,997 | | | | (25,235 | ) | | | 18,762 | | |
| | 254 | | | S&P 500 Index, strike @ 1,490 | | 08/17/13 | | | 29,945 | | | | (12,700 | ) | | | 17,245 | | |
| | 254 | | | S&P 500 Index, strike @ 1,490 | | 09/21/13 | | | 65,505 | | | | (53,848 | ) | | | 11,657 | | |
| | 49 | | | S&P 500 Index, strike @ 1,490 | | 10/19/13 | | | 48,407 | | | | (28,910 | ) | | | 19,497 | | |
| | 304 | | | S&P 500 Index, strike @ 1,500 | | 08/17/13 | | | 66,999 | | | | (10,640 | ) | | | 56,359 | | |
| | 152 | | | S&P 500 Index, strike @ 1,510 | | 08/17/13 | | | 24,000 | | | | (5,320 | ) | | | 18,680 | | |
| | 406 | | | S&P 500 Index, strike @ 1,520 | | 08/17/13 | | | 74,004 | | | | (20,300 | ) | | | 53,704 | | |
| | 660 | | | S&P 500 Index, strike @ 1,530 | | 08/17/13 | | | 120,199 | | | | (33,000 | ) | | | 87,199 | | |
| | 254 | | | S&P 500 Index, strike @ 1,540 | | 08/17/13 | | | 68,045 | | | | (19,050 | ) | | | 48,995 | | |
| | 254 | | | S&P 500 Index, strike @ 1,550 | | 08/17/13 | | | 55,345 | | | | (17,526 | ) | | | 37,819 | | |
| | 20 | | | S&P 500 Index, strike @ 1,565 | | 09/21/13 | | | 113,958 | | | | (12,400 | ) | | | 101,558 | | |
| | 32 | | | S&P 500 Index, strike @ 1,575 | | 09/21/13 | | | 169,532 | | | | (21,760 | ) | | | 147,772 | | |
| | 254 | | | S&P 500 Index, strike @ 1,575 | | 12/21/13 | | | 880,845 | | | | (711,200 | ) | | | 169,645 | | |
| | 25 | | | S&P 500 Index, strike @ 1,580 | | 09/21/13 | | | 120,967 | | | | (19,500 | ) | | | 101,467 | | |
| | 3 | | | S&P 500 Index, strike @ 1,605 | | 09/21/13 | | | 14,394 | | | | (3,018 | ) | | | 11,376 | | |
| | 178 | | | S&P 500 Index, strike @ 1,610 | | 08/17/13 | | | 124,225 | | | | (48,060 | ) | | | 76,165 | | |
| | 30 | | | S&P 500 Index, strike @ 1,620 | | 09/21/13 | | | 143,037 | | | | (38,700 | ) | | | 104,337 | | |
| | 25 | | | S&P 500 Index, strike @ 1,645 | | 09/21/13 | | | 124,947 | | | | (46,500 | ) | | | 78,447 | | |
| | 15 | | | S&P 500 Index, strike @ 1,665 | | 09/21/13 | | | 59,968 | | | | (31,500 | ) | | | 28,468 | | |
| | 15 | | | S&P 500 Index, strike @ 1,675 | | 09/21/13 | | | 56,968 | | | | (40,875 | ) | | | 16,093 | | |
| | 44 | | | S&P 500 Index, strike @ 1,690 | | 09/21/13 | | | 142,807 | | | | (145,200 | ) | | | (2,393 | ) | |
| | 254 | | | US Treasury Note 10 Year Futures,
strike @ 122 | | 08/23/13 | | | 35,140 | | | | (15,875 | ) | | | 19,265 | | |
| | 304 | | | US Treasury Note 10 Year Futures,
strike @ 122.5 | | 08/23/13 | | | 44,401 | | | | (23,750 | ) | | | 20,651 | | |
| | 304 | | | US Treasury Note 10 Year Futures,
strike @ 123.5 | | 08/23/13 | | | 39,682 | | | | (38,000 | ) | | | 1,682 | | |
| | | | | | | | | $ | 5,227,500 | | | $ | (2,454,561 | ) | | $ | 2,772,939 | | |
| | | | | | | | | $ | 7,827,507 | | | $ | (5,567,115 | ) | | $ | 2,260,392 | | |
Written options activity for the year ended July 31, 2013 was as follows:
| | | Number of
contracts | | Premiums
received | |
Options outstanding at July 31, 2012 | | | 3,643 | | | $ | 1,815,494 | | |
Options written | | | 154,869 | | | | 47,436,891 | | |
Options terminated in closing purchase transactions | | | (62,112 | ) | | | (26,337,047 | ) | |
Options expired prior to exercise | | | (71,014 | ) | | | (15,415,431 | ) | |
Options outstanding at July 31, 2013 | | | 25,386 | | | $ | 7,499,907 | | |
| | Notional
amount | | Premiums
received | |
Options outstanding at July 31, 2012 | | $ | — | | | $ | — | | |
Options written | | | 35,100,000 | | | | 327,600 | | |
Options terminated in closing purchase transactions | | | — | | | | — | | |
Options expired prior to exercise | | | — | | | | — | | |
Options outstanding at July 31, 2013 | | $ | 35,100,000 | | | $ | 327,600 | | |
207
PACE Select Advisors Trust
PACE Alternative Strategies Investments
Portfolio of investments—July 31, 2013
Foreign exchange written options
Notional
amount
(000) | | Calls written | | Counterparty | | Expiration
date | | Premiums
received | | Current
value | | Unrealized
appreciation
(depreciation) | |
USD | 23,000 | | | USD Call/CNY Put,
strike @ CNY 6.38 | | RBS | | 12/11/13 | | $ | 23,000 | | | $ | (32,729 | ) | | $ | (9,729 | ) | |
USD | 23,000 | | | USD Call/JPY Put,
strike @ JPY 84.50 | | RBS | | 12/11/13 | | | 957,974 | | | | (3,142,651 | ) | | | (2,184,677 | ) | |
USD | 1,250 | | | USD Call/JPY Put,
strike @ JPY 88 | | BB | | 05/16/14 | | | 50,525 | | | | (137,318 | ) | | | (86,793 | ) | |
USD | 2,500 | | | USD Call/JPY Put,
strike @ JPY 105 | | BB | | 05/12/14 | | | 75,450 | | | | (39,407 | ) | | | 36,043 | | |
USD | 2,500 | | | USD Call/JPY Put,
strike @ JPY 105 | | BB | | 05/09/14 | | | 78,775 | | | | (39,210 | ) | | | 39,565 | | |
USD | 2,500 | | | USD Call/JPY Put,
strike @ JPY 105 | | BB | | 05/07/14 | | | 85,249 | | | | (38,826 | ) | | | 46,423 | | |
USD | 2,500 | | | USD Call/JPY Put,
strike @ JPY 105 | | BB | | 05/08/14 | | | 83,525 | | | | (39,010 | ) | | | 44,515 | | |
USD | 2,500 | | | USD Call/JPY Put,
strike @ JPY 105 | | BB | | 05/13/14 | | | 45,900 | | | | (39,605 | ) | | | 6,295 | | |
| | | | | | | | | | | $ | 1,400,398 | | | $ | (3,508,756 | ) | | $ | (2,108,358 | ) | |
| | Puts written | | | | | | | | | | | |
USD | 23,000 | | | USD Put/CNY Call,
strike @ CNY 6.38 | | RBS | | 12/11/13 | | $ | 549,700 | | | $ | (599,656 | ) | | $ | (49,956 | ) | |
USD | 9,000 | | | USD Put/JPY Call,
strike @ JPY 67 | | RBS | | 02/09/15 | | | 423,000 | | | | (28,944 | ) | | | 394,056 | | |
USD | 1,000 | | | USD Put/JPY Call,
strike @ JPY 68 | | RBS | | 12/10/15 | | | 84,275 | | | | (9,058 | ) | | | 75,217 | | |
USD | 1,250 | | | USD Put/JPY Call,
strike @ JPY 71 | | BB | | 05/16/14 | | | 67,475 | | | | (1,714 | ) | | | 65,761 | | |
USD | 11,700 | | | USD Put/JPY Call,
strike @ JPY 75 | | RBS | | 08/15/13 | | | 592,605 | | | | — | | | | 592,605 | | |
USD | 23,000 | | | USD Put/JPY Call,
strike @ JPY 79.50 | | RBS | | 12/11/13 | | | 332,577 | | | | (14,261 | ) | | | 318,316 | | |
USD | 2,500 | | | USD Put/JPY Call,
strike @ JPY 95 | | BB | | 05/07/14 | | | 43,500 | | | | (76,923 | ) | | | (33,423 | ) | |
USD | 2,500 | | | USD Put/JPY Call,
strike @ JPY 95 | | BB | | 05/08/14 | | | 45,225 | | | | (77,210 | ) | | | (31,985 | ) | |
USD | 2,500 | | | USD Put/JPY Call,
strike @ JPY 95 | | BB | | 05/09/14 | | | 49,975 | | | | (77,473 | ) | | | (27,498 | ) | |
USD | 2,500 | | | USD Put/JPY Call,
strike @ JPY 95 | | BB | | 05/12/14 | | | 53,300 | | | | (77,732 | ) | | | (24,432 | ) | |
USD | 2,500 | | | USD Put/JPY Call,
strike @ JPY 95 | | BB | | 05/13/14 | | | 82,850 | | | | (77,995 | ) | | | 4,855 | | |
| | | | | | | | | | | $ | 2,324,482 | | | $ | (1,040,966 | ) | | $ | 1,283,516 | | |
| | | | | | | | | | | $ | 3,724,880 | | | $ | (4,549,722 | ) | | $ | (824,842 | ) | |
Swaptions and foreign exchange written options activity for the year ended July 31, 2013 was as follows:
| | | Premiums
received | |
Swaptions and foreign exchange options outstanding at July 31, 2012 | | $ | 5,134,778 | | |
Swaptions and foreign exchange options written | | | 3,537,572 | | |
Swaptions and foreign exchange options terminated in closing purchase transactions | | | (4,947,470 | ) | |
Swaptions and foreign exchange options expired prior to exercise | | | — | | |
Swaptions and foreign exchange options outstanding at July 31, 2013 | | $ | 3,724,880 | | |
208
PACE Select Advisors Trust
PACE Alternative Strategies Investments
Portfolio of investments—July 31, 2013
Futures contracts
Number of
contracts | | Currency | |
| | Expiration
date | | Cost | | Current
value | | Unrealized
appreciation
(depreciation) | |
US Treasury futures buy contracts: | | | |
588 | | USD | | | | US Treasury Note 10 Year Futures | | September 2013 | | $ | 76,043,820 | | | $ | 74,345,250 | | | $ | (1,698,570 | ) | |
Index futures buy contracts: | | | |
26 | | AUD | | | | ASX SPI 200 Index Futures | | September 2013 | | | 2,723,633 | | | | 2,922,546 | | | | 198,913 | | |
76 | | CAD | | | | S&P TSE 60 Index Futures | | September 2013 | | | 10,314,043 | | | | 10,543,378 | | | | 229,335 | | |
17 | | EUR | | | | Amerstdam Index Futures | | August 2013 | | | 1,648,478 | | | | 1,662,986 | | | | 14,508 | | |
49 | | EUR | | | | DAX Index Futures | | September 2013 | | | 13,289,138 | | | | 13,418,773 | | | | 129,635 | | |
72 | | GBP | | | | FTSE 100 Index Futures | | September 2013 | | | 6,871,827 | | | | 7,164,426 | | | | 292,599 | | |
109 | | HKD | | | | H-Shares Index Futures | | August 2013 | | | 6,862,131 | | | | 6,793,394 | | | | (68,737 | ) | |
64 | | HKD | | | | Hang Seng Index Futures | | August 2013 | | | 9,018,295 | | | | 9,021,489 | | | | 3,194 | | |
52 | | JPY | | | | NIKKEI 225 Index Futures | | September 2013 | | | 7,580,499 | | | | 7,190,280 | | | | (390,219 | ) | |
73 | | JPY | | | | TOPIX Index Futures | | September 2013 | | | 8,118,398 | | | | 8,353,566 | | | | 235,168 | | |
632 | | USD | | | | MSCI EAFE Mini Index Futures | | September 2013 | | | 53,132,103 | | | | 54,456,280 | | | | 1,324,177 | | |
367 | | USD | | | | NASDAQ 100 Emini Index Futures | | September 2013 | | | 21,652,418 | | | | 22,629,220 | | | | 976,802 | | |
877 | | USD | | | | S&P 500 E-Mini Index Futures | | September 2013 | | | 71,660,185 | | | | 73,689,925 | | | | 2,029,740 | | |
Interest rate futures buy contracts: | | | |
32 | | EUR | | | | German Euro Bund Futures | | September 2013 | | | 6,095,297 | | | | 6,049,473 | | | | (45,824 | ) | |
91 | | GBP | | | | United Kingdom Long Gilt Bond Futures | | September 2013 | | | 15,478,882 | | | | 15,545,391 | | | | 66,509 | | |
| | | | | | | | | $ | 310,489,147 | | | $ | 313,786,377 | | | $ | 3,297,230 | | |
Number of
contracts | | Currency | |
| | Expiration
date | | Proceeds | | Current
value | | Unrealized
appreciation
(depreciation) | |
US Treasury futures sell contracts: | | | |
106 | | USD | | | | Ultra Long US Treasury Bond Futures | | September 2013 | | $ | 16,165,273 | | | $ | 15,290,500 | | | $ | 874,773 | | |
Index futures sell contracts: | | | |
19 | | AUD | | | | ASX SPI 200 Index Futures | | September 2013 | | | 2,028,642 | | | | 2,135,707 | | | | (107,065 | ) | |
34 | | CHF | | | | Swiss Market Index Futures | | September 2013 | | | 2,825,063 | | | | 2,864,102 | | | | (39,039 | ) | |
322 | | EUR | | | | CAC 40 Index Futures | | August 2013 | | | 16,593,936 | | | | 17,062,092 | | | | (468,156 | ) | |
271 | | EUR | | | | EURO STOXX 50 Index Futures | | September 2013 | | | 9,467,737 | | | | 9,917,394 | | | | (449,657 | ) | |
22 | | EUR | | | | DAX Index Futures | | September 2013 | | | 5,840,659 | | | | 6,024,755 | | | | (184,096 | ) | |
75 | | EUR | | | | FTSE MIB Index Futures | | September 2013 | | | 7,930,072 | | | | 8,218,563 | | | | (288,491 | ) | |
116 | | EUR | | | | IBEX 35 Index Futures | | August 2013 | | | 12,016,639 | | | | 12,943,348 | | | | (926,709 | ) | |
7 | | HKD | | | | Hang Seng Index Futures | | August 2013 | | | 989,536 | | | | 986,725 | | | | 2,811 | | |
48 | | JPY | | | | TOPIX Index Futures | | September 2013 | | | 5,434,778 | | | | 5,492,756 | | | | (57,978 | ) | |
110 | | SEK | | | | OMX 30 Index Futures | | August 2013 | | | 2,048,858 | | | | 2,077,258 | | | | (28,400 | ) | |
261 | | USD | | | | MSCI Taiwan Index Futures | | August 2013 | | | 7,481,578 | | | | 7,422,840 | | | | 58,738 | | |
408 | | USD | | | | Russell 2000 Mini Index Futures | | September 2013 | | | 39,961,778 | | | | 42,550,320 | | | | (2,588,542 | ) | |
413 | | USD | | | | S&P 500 E-Mini Index Futures | | September 2013 | | | 34,327,124 | | | | 34,702,325 | | | | (375,201 | ) | |
Interest rate futures sell contracts: | | | |
56 | | AUD | | | | Australian Treasury Bond 10 Year Futures | | September 2013 | | | 5,874,762 | | | | 5,970,705 | | | | (95,943 | ) | |
79 | | CAD | | | | Canada Government Bond 10 Year Futures | | September 2013 | | | 10,462,380 | | | | 10,108,895 | | | | 353,485 | | |
268 | | JPY | | | | JGB MINI 10 Year Futures | | September 2013 | | | 38,937,410 | | | | 39,128,462 | | | | (191,052 | ) | |
| | | | | | | | | | | $ | 218,386,225 | | | $ | 222,896,747 | | | $ | (4,510,522 | ) | |
| | | | | | | | | | | | | | | | | | | $ | (1,213,292 | ) | |
209
PACE Select Advisors Trust
PACE Alternative Strategies Investments
Portfolio of investments—July 31, 2013
Forward foreign currency contracts
Counterparty | | Contracts to
deliver | | In
exchange for | | Maturity
date | | Unrealized
appreciation
(depreciation) | |
BB | | AUD | 13,785,615 | | | USD | 12,832,708 | | | 09/18/13 | | $ | 480,807 | | |
BB | | CAD | 11,252,505 | | | USD | 11,027,057 | | | 09/17/13 | | | 83,808 | | |
BB | | CAD | 6,586,605 | | | USD | 6,365,012 | | | 09/18/13 | | | (40,416 | ) | |
BB | | CAD | 13,096,893 | | | USD | 12,752,822 | | | 09/18/13 | | | 16,185 | | |
BB | | CHF | 14,978,755 | | | USD | 16,082,873 | | | 09/18/13 | | | (108,374 | ) | |
BB | | CHF | 8,958,183 | | | USD | 9,729,742 | | | 09/18/13 | | | 46,417 | | |
BB | | CNY | 29,997,380 | | | USD | 4,773,005 | | | 08/28/13 | | | (111,665 | ) | |
BB | | CNY | 29,997,380 | | | USD | 4,773,005 | | | 08/29/13 | | | (111,291 | ) | |
BB | | DKK | 1,200,000 | | | USD | 208,929 | | | 10/10/13 | | | (5,359 | ) | |
BB | | EUR | 208,626 | | | USD | 279,413 | | | 09/05/13 | | | 1,836 | | |
BB | | EUR | 20,041,947 | | | USD | 25,851,867 | | | 09/05/13 | | | (813,933 | ) | |
BB | | EUR | 597,843 | | | USD | 781,873 | | | 09/11/13 | | | (13,574 | ) | |
BB | | EUR | 11,709,015 | | | USD | 15,263,170 | | | 09/18/13 | | | (316,403 | ) | |
BB | | EUR | 2,714,317 | | | USD | 3,621,286 | | | 09/18/13 | | | 9,719 | | |
BB | | EUR | 13,518,331 | | | USD | 18,052,812 | | | 09/24/13 | | | 65,440 | | |
BB | | EUR | 4,921,811 | | | USD | 6,334,926 | | | 10/17/13 | | | (214,562 | ) | |
BB | | EUR | 383,007 | | | USD | 500,110 | | | 10/25/13 | | | (9,576 | ) | |
BB | | GBP | 211,804 | | | USD | 314,583 | | | 09/11/13 | | | (7,534 | ) | |
BB | | GBP | 1,974,983 | | | USD | 3,034,528 | | | 09/18/13 | | | 31,041 | | |
BB | | HKD | 326,201 | | | USD | 42,062 | | | 09/11/13 | | | (5 | ) | |
BB | | HKD | 3,900,000 | | | USD | 503,125 | | | 10/10/13 | | | 129 | | |
BB | | JPY | 92,602,100 | | | USD | 1,000,000 | | | 08/21/13 | | | 54,120 | | |
BB | | JPY | 2,137,770,232 | | | USD | 24,293,092 | | | 08/23/13 | | | 2,456,702 | | |
BB | | JPY | 1,053,135,791 | | | USD | 11,998,676 | | | 08/26/13 | | | 1,241,188 | | |
BB | | JPY | 1,053,123,793 | | | USD | 11,998,676 | | | 08/27/13 | | | 1,241,255 | | |
BB | | JPY | 94,777,900 | | | USD | 1,000,000 | | | 08/28/13 | | | 31,860 | | |
BB | | JPY | 48,134,700 | | | USD | 500,000 | | | 08/29/13 | | | 8,310 | | |
BB | | JPY | 4,994,991 | | | USD | 51,698 | | | 09/11/13 | | | 672 | | |
BB | | JPY | 85,387,713 | | | USD | 857,808 | | | 09/11/13 | | | (14,474 | ) | |
BB | | JPY | 323,000,000 | | | USD | 3,242,659 | | | 10/10/13 | | | (57,470 | ) | |
BB | | NOK | 12,942,222 | | | USD | 2,231,377 | | | 09/18/13 | | | 38,927 | | |
BB | | NZD | 18,569,478 | | | USD | 14,364,995 | | | 09/18/13 | | | (417,036 | ) | |
BB | | SEK | 2,214,956 | | | USD | 331,206 | | | 09/05/13 | | | (8,350 | ) | |
BB | | SEK | 104,030,184 | | | USD | 15,770,466 | | | 09/18/13 | | | (173,051 | ) | |
BB | | SGD | 713,083 | | | USD | 571,796 | | | 09/11/13 | | | 10,673 | | |
BB | | SGD | 7,323,492 | | | USD | 5,809,552 | | | 09/18/13 | | | 46,697 | | |
BB | | SGD | 8,448,512 | | | USD | 6,830,502 | | | 10/21/13 | | | 182,228 | | |
BB | | SGD | 5,686,857 | | | USD | 4,590,340 | | | 11/21/13 | | | 115,055 | | |
BB | | USD | 469 | | | AUD | 493 | | | 09/05/13 | | | (27 | ) | |
BB | | USD | 16,327,924 | | | AUD | 17,833,497 | | | 09/18/13 | | | (349,124 | ) | |
BB | | USD | 4,156,362 | | | CAD | 4,360,498 | | | 09/18/13 | | | 84,191 | | |
BB | | USD | 7,814,213 | | | CHF | 7,344,953 | | | 09/18/13 | | | 125,295 | | |
BB | | USD | 2,002,655 | | | CHF | 1,848,368 | | | 09/18/13 | | | (4,666 | ) | |
BB | | USD | 1,006,398 | | | EUR | 767,499 | | | 09/05/13 | | | 14,759 | | |
BB | | USD | 28,926 | | | EUR | 21,771 | | | 09/11/13 | | | 41 | | |
210
PACE Select Advisors Trust
PACE Alternative Strategies Investments
Portfolio of investments—July 31, 2013
Forward foreign currency contracts—(continued)
Counterparty | | Contracts to
deliver | | In
exchange for | | Maturity
date | | Unrealized
appreciation
(depreciation) | |
BB | | USD | 28,985,985 | | | EUR | 21,804,540 | | | 09/18/13 | | $ | 26,312 | | |
BB | | USD | 6,230,717 | | | EUR | 4,652,990 | | | 09/18/13 | | | (39,624 | ) | |
BB | | USD | 38,576 | | | GBP | 24,646 | | | 09/11/13 | | | (1,094 | ) | |
BB | | USD | 16,554,589 | | | GBP | 10,648,606 | | | 09/18/13 | | | (360,553 | ) | |
BB | | USD | 171,641 | | | HKD | 1,330,905 | | | 09/13/13 | | | (6 | ) | |
BB | | USD | 6,773,834 | | | INR | 379,673,405 | | | 10/21/13 | | | (656,169 | ) | |
BB | | USD | 4,630,965 | | | INR | 260,190,750 | | | 11/21/13 | | | (468,031 | ) | |
BB | | USD | 73,000,000 | | | JPY | 6,476,757,100 | | | 08/21/13 | | | (6,843,433 | ) | |
BB | | USD | 1,703,603 | | | JPY | 165,043,352 | | | 09/18/13 | | | (17,534 | ) | |
BB | | USD | 2,599,597 | | | NOK | 15,425,662 | | | 09/18/13 | | | 13,555 | | |
BB | | USD | 4,404,092 | | | NOK | 25,420,201 | | | 09/18/13 | | | (97,836 | ) | |
BB | | USD | 6,939,890 | | | NZD | 8,891,211 | | | 09/18/13 | | | 137,862 | | |
BB | | USD | 1,253,909 | | | NZD | 1,559,187 | | | 09/18/13 | | | (12,735 | ) | |
BB | | USD | 2,304,835 | | | SEK | 15,513,918 | | | 09/18/13 | | | 72,806 | | |
BB | | USD | 44,285 | | | SGD | 55,937 | | | 09/11/13 | | | (268 | ) | |
BB | | USD | 918,101 | | | SGD | 1,167,120 | | | 09/18/13 | | | 306 | | |
BNP | | AUD | 32,166 | | | USD | 30,631 | | | 09/05/13 | | | 1,785 | | |
BNP | | AUD | 1,522,544 | | | USD | 1,444,567 | | | 09/11/13 | | | 79,736 | | |
BNP | | AUD | 11,200,000 | | | USD | 11,453,456 | | | 09/24/13 | | | 1,422,248 | | |
BNP | | AUD | 1,900,000 | | | USD | 1,713,604 | | | 10/10/13 | | | 13,668 | | |
BNP | | CAD | 453,047 | | | USD | 434,996 | | | 09/05/13 | | | (5,728 | ) | |
BNP | | CAD | 11,915,760 | | | USD | 11,693,249 | | | 09/12/13 | | | 103,565 | | |
BNP | | CAD | 1,660,000 | | | USD | 1,570,949 | | | 10/10/13 | | | (42,519 | ) | |
BNP | | CAD | 2,281,880 | | | USD | 2,239,662 | | | 11/21/13 | | | 24,057 | | |
BNP | | CAD | 7,280,156 | | | USD | 7,119,991 | | | 11/25/13 | | | 51,984 | | |
BNP | | CHF | 1,700,000 | | | USD | 1,795,021 | | | 10/10/13 | | | (42,952 | ) | |
BNP | | CNY | 6,248,000 | | | USD | 1,000,000 | | | 08/22/13 | | | (17,870 | ) | |
BNP | | CNY | 150,118,212 | | | USD | 23,907,981 | | | 08/23/13 | | | (546,112 | ) | |
BNP | | CNY | 33,083,672 | | | USD | 5,273,005 | | | 08/26/13 | | | (115,051 | ) | |
BNP | | CNY | 29,938,672 | | | USD | 4,773,005 | | | 08/27/13 | | | (102,478 | ) | |
BNP | | CNY | 8,177,000 | | | USD | 1,300,000 | | | 08/28/13 | | | (31,514 | ) | |
BNP | | CNY | 12,523,000 | | | USD | 2,000,000 | | | 08/29/13 | | | (39,046 | ) | |
BNP | | EUR | 400,000 | | | USD | 525,906 | | | 08/13/13 | | | (6,253 | ) | |
BNP | | EUR | 5,240,000 | | | USD | 6,948,255 | | | 08/19/13 | | | (23,168 | ) | |
BNP | | EUR | 402,704 | | | USD | 523,901 | | | 09/05/13 | | | (11,897 | ) | |
BNP | | EUR | 189,605 | | | USD | 247,094 | | | 09/11/13 | | | (5,181 | ) | |
BNP | | EUR | 2,575,794 | | | USD | 3,344,320 | | | 10/10/13 | | | (83,214 | ) | |
BNP | | GBP | 4,272,519 | | | USD | 6,640,759 | | | 08/13/13 | | | 141,702 | | |
BNP | | GBP | 283,731 | | | USD | 427,346 | | | 09/05/13 | | | (4,176 | ) | |
BNP | | GBP | 7,529 | | | USD | 11,375 | | | 09/11/13 | | | (75 | ) | |
BNP | | GBP | 825,857 | | | USD | 1,270,817 | | | 09/11/13 | | | 14,830 | | |
BNP | | JPY | 50,000,000 | | | USD | 488,358 | | | 08/13/13 | | | (22,344 | ) | |
BNP | | JPY | 47,974,050 | | | USD | 500,000 | | | 08/26/13 | | | 9,958 | | |
BNP | | JPY | 136,020,750 | | | USD | 1,500,000 | | | 08/30/13 | | | 110,557 | | |
BNP | | JPY | 24,818,125 | | | USD | 248,571 | | | 09/11/13 | | | (4,960 | ) | |
211
PACE Select Advisors Trust
PACE Alternative Strategies Investments
Portfolio of investments—July 31, 2013
Forward foreign currency contracts—(continued)
Counterparty | | Contracts to
deliver | | In
exchange for | | Maturity
date | | Unrealized
appreciation
(depreciation) | |
BNP | | MXN | 80,029,630 | | | USD | 6,220,000 | | | 09/17/13 | | $ | (18,291 | ) | |
BNP | | MXN | 15,200,000 | | | USD | 1,169,051 | | | 10/22/13 | | | (12,105 | ) | |
BNP | | NOK | 1,000,000 | | | USD | 162,990 | | | 10/10/13 | | | (6,273 | ) | |
BNP | | SEK | 1,462 | | | USD | 216 | | | 09/05/13 | | | (9 | ) | |
BNP | | SEK | 3,800,000 | | | USD | 565,058 | | | 10/10/13 | | | (17,046 | ) | |
BNP | | SGD | 18,399 | | | USD | 14,528 | | | 09/11/13 | | | 50 | | |
BNP | | USD | 29,847 | | | AUD | 31,673 | | | 09/05/13 | | | (1,444 | ) | |
BNP | | USD | 42,149 | | | AUD | 44,138 | | | 09/11/13 | | | (2,583 | ) | |
BNP | | USD | 1,810,000 | | | AUD | 1,928,825 | | | 09/24/13 | | | (82,460 | ) | |
BNP | | USD | 423,739 | | | CAD | 432,685 | | | 09/05/13 | | | (2,823 | ) | |
BNP | | USD | 35,000,000 | | | CNY | 219,730,000 | | | 08/21/13 | | | 799,262 | | |
BNP | | USD | 1,200,000 | | | CNY | 7,563,000 | | | 08/29/13 | | | 31,438 | | |
BNP | | USD | 6,220,000 | | | EUR | 4,662,144 | | | 08/19/13 | | | (17,370 | ) | |
BNP | | USD | 663,073 | | | EUR | 507,697 | | | 09/05/13 | | | 12,417 | | |
BNP | | USD | 72,184 | | | EUR | 53,836 | | | 09/05/13 | | | (555 | ) | |
BNP | | USD | 26,847 | | | EUR | 20,042 | | | 09/11/13 | | | (180 | ) | |
BNP | | USD | 123,789 | | | EUR | 93,991 | | | 09/11/13 | | | 1,269 | | |
BNP | | USD | 427,880 | | | GBP | 272,244 | | | 09/05/13 | | | (13,829 | ) | |
BNP | | USD | 36,361 | | | GBP | 24,407 | | | 09/11/13 | | | 758 | | |
BNP | | USD | 83,467 | | | HKD | 647,316 | | | 09/11/13 | | | 11 | | |
BNP | | USD | 232,264 | | | HKD | 1,801,604 | | | 09/13/13 | | | 73 | | |
BNP | | USD | 125,985 | | | HKD | 976,875 | | | 09/13/13 | | | (6 | ) | |
BNP | | USD | 101,600 | | | JPY | 10,021,441 | | | 09/11/13 | | | 774 | | |
BNP | | USD | 53,647 | | | JPY | 5,072,358 | | | 09/11/13 | | | (1,830 | ) | |
BNP | | USD | 1,811,662 | | | MXN | 22,200,000 | | | 10/18/13 | | | (85,943 | ) | |
BNP | | USD | 1,824,093 | | | MXN | 22,500,000 | | | 10/21/13 | | | (75,516 | ) | |
BNP | | USD | 12,673,385 | | | MXN | 156,300,000 | | | 10/22/13 | | | (527,680 | ) | |
BNP | | USD | 1,823,797 | | | MXN | 22,500,000 | | | 10/23/13 | | | (75,529 | ) | |
BNP | | USD | 329,134 | | | MXN | 4,000,000 | | | 10/24/13 | | | (18,358 | ) | |
BNP | | USD | 334,668 | | | SEK | 2,216,424 | | | 09/05/13 | | | 5,113 | | |
BNP | | USD | 65,094 | | | SGD | 82,425 | | | 09/11/13 | | | (234 | ) | |
BNP | | USD | 198,148 | | | SGD | 253,649 | | | 09/11/13 | | | 1,448 | | |
MSCI | | AUD | 11,295,540 | | | USD | 10,601,046 | | | 09/18/13 | | | 480,250 | | |
MSCI | | CAD | 17,473,147 | | | USD | 17,099,795 | | | 09/18/13 | | | 107,281 | | |
MSCI | | CAD | 3,586,364 | | | USD | 3,417,687 | | | 09/18/13 | | | (70,027 | ) | |
MSCI | | CHF | 17,563,662 | | | USD | 18,855,587 | | | 09/18/13 | | | (129,808 | ) | |
MSCI | | EUR | 5,420,327 | | | USD | 7,009,959 | | | 09/18/13 | | | (202,124 | ) | |
MSCI | | EUR | 1,052,937 | | | USD | 1,408,928 | | | 09/18/13 | | | 7,929 | | |
MSCI | | JPY | 880,860,077 | | | USD | 9,124,673 | | | 09/18/13 | | | 125,879 | | |
MSCI | | NZD | 10,787,431 | | | USD | 8,427,929 | | | 09/18/13 | | | (159,289 | ) | |
MSCI | | SEK | 37,393,656 | | | USD | 5,568,549 | | | 09/18/13 | | | (162,349 | ) | |
MSCI | | SGD | 13,583,382 | | | USD | 10,810,147 | | | 09/18/13 | | | 121,385 | | |
MSCI | | USD | 11,530,537 | | | AUD | 12,534,737 | | | 09/18/13 | | | (299,422 | ) | |
MSCI | | USD | 1,682,873 | | | CAD | 1,754,994 | | | 09/18/13 | | | 23,847 | | |
MSCI | | USD | 8,353,402 | | | CAD | 8,530,851 | | | 09/18/13 | | | (57,209 | ) | |
212
PACE Select Advisors Trust
PACE Alternative Strategies Investments
Portfolio of investments—July 31, 2013
Forward foreign currency contracts—(continued)
Counterparty | | Contracts to
deliver | | In
exchange for | | Maturity
date | | Unrealized
appreciation
(depreciation) | |
MSCI | | USD | 1,185,349 | | | CHF | 1,105,919 | | | 09/18/13 | | $ | 10,091 | | |
MSCI | | USD | 26,806,254 | | | EUR | 20,188,638 | | | 09/18/13 | | | 55,984 | | |
MSCI | | USD | 9,470,302 | | | GBP | 6,077,614 | | | 09/18/13 | | | (227,674 | ) | |
MSCI | | USD | 2,420,237 | | | JPY | 242,462,743 | | | 09/18/13 | | | 56,742 | | |
MSCI | | USD | 4,787,299 | | | JPY | 463,068,210 | | | 09/18/13 | | | (56,632 | ) | |
MSCI | | USD | 1,885,636 | | | NOK | 11,437,733 | | | 09/18/13 | | | 51,950 | | |
MSCI | | USD | 2,211,574 | | | NOK | 12,853,224 | | | 09/18/13 | | | (34,200 | ) | |
MSCI | | USD | 7,024,977 | | | NZD | 8,953,347 | | | 09/18/13 | | | 102,237 | | |
MSCI | | USD | 1,488,120 | | | SGD | 1,884,894 | | | 09/18/13 | | | (4,897 | ) | |
RBS | | AUD | 900,000 | | | USD | 916,180 | | | 08/13/13 | | | 107,823 | | |
RBS | | AUD | 2,156,537 | | | USD | 2,154,600 | | | 09/18/13 | | | 222,345 | | |
RBS | | AUD | 1,961,835 | | | USD | 1,995,000 | | | 09/19/13 | | | 237,313 | | |
RBS | | AUD | 2,109,851 | | | USD | 2,130,000 | | | 09/20/13 | | | 239,825 | | |
RBS | | AUD | 1,962,341 | | | USD | 1,995,000 | | | 09/23/13 | | | 237,326 | | |
RBS | | AUD | 375,386 | | | USD | 372,400 | | | 09/24/13 | | | 36,188 | | |
RBS | | CAD | 1,950,000 | | | USD | 1,922,118 | | | 08/13/13 | | | 24,113 | | |
RBS | | CAD | 2,191,100 | | | USD | 2,138,827 | | | 11/22/13 | | | 11,418 | | |
RBS | | CHF | 1,030,000 | | | USD | 1,106,073 | | | 08/13/13 | | | (6,970 | ) | |
RBS | | CNY | 219,730,000 | | | USD | 35,245,948 | | | 08/21/13 | | | (553,315 | ) | |
RBS | | CNY | 6,296,500 | | | USD | 1,000,000 | | | 08/26/13 | | | (25,457 | ) | |
RBS | | CNY | 3,152,750 | | | USD | 500,000 | | | 08/27/13 | | | (13,422 | ) | |
RBS | | EUR | 3,597,936 | | | USD | 4,724,179 | | | 08/13/13 | | | (62,507 | ) | |
RBS | | EUR | 4,276,948 | | | USD | 5,552,110 | | | 08/19/13 | | | (138,046 | ) | |
RBS | | EUR | 383,072 | | | USD | 492,227 | | | 10/17/13 | | | (17,529 | ) | |
RBS | | GBP | 57,081 | | | USD | 85,476 | | | 09/05/13 | | | (1,338 | ) | |
RBS | | HKD | 2,600,000 | | | USD | 335,228 | | | 08/13/13 | | | (29 | ) | |
RBS | | HKD | 279,312 | | | USD | 36,011 | | | 09/11/13 | | | (9 | ) | |
RBS | | HKD | 12,673,179 | | | USD | 1,633,353 | | | 09/13/13 | | | (995 | ) | |
RBS | | JPY | 253,000,000 | | | USD | 2,580,350 | | | 08/13/13 | | | (3,801 | ) | |
RBS | | JPY | 6,384,155,000 | | | USD | 65,321,741 | | | 08/21/13 | | | 111,054 | | |
RBS | | JPY | 99,467,500 | | | USD | 1,000,000 | | | 08/22/13 | | | (16,012 | ) | |
RBS | | JPY | 93,513,900 | | | USD | 1,000,000 | | | 08/27/13 | | | 44,777 | | |
RBS | | JPY | 1,148,096,495 | | | USD | 13,104,778 | | | 08/28/13 | | | 1,377,172 | | |
RBS | | JPY | 2,245,708,024 | | | USD | 25,604,778 | | | 08/29/13 | | | 2,665,143 | | |
RBS | | SEK | 2,400,000 | | | USD | 368,440 | | | 08/13/13 | | | 328 | | |
RBS | | SGD | 11,930 | | | USD | 9,418 | | | 09/11/13 | | | 30 | | |
RBS | | SGD | 450,000 | | | USD | 353,704 | | | 10/10/13 | | | (405 | ) | |
RBS | | USD | 26,436 | | | AUD | 28,916 | | | 09/11/13 | | | (515 | ) | |
RBS | | USD | 19,960 | | | CAD | 20,362 | | | 09/05/13 | | | (151 | ) | |
RBS | | USD | 1,002,728 | | | CNY | 6,248,000 | | | 08/22/13 | | | 15,142 | | |
RBS | | USD | 24,092,154 | | | CNY | 150,118,212 | | | 08/23/13 | | | 361,939 | | |
RBS | | USD | 6,320,041 | | | CNY | 39,380,172 | | | 08/26/13 | | | 93,472 | | |
RBS | | USD | 5,310,772 | | | CNY | 33,091,422 | | | 08/27/13 | | | 78,133 | | |
RBS | | USD | 6,126,526 | | | CNY | 38,174,380 | | | 08/28/13 | | | 89,658 | | |
RBS | | USD | 5,610,236 | | | CNY | 34,957,380 | | | 08/29/13 | | | 81,667 | | |
213
PACE Select Advisors Trust
PACE Alternative Strategies Investments
Portfolio of investments—July 31, 2013
Forward foreign currency contracts—(concluded)
Counterparty | | Contracts to
deliver | | In
exchange for | | Maturity
date | | Unrealized
appreciation
(depreciation) | |
RBS | | USD | 4,487 | | | GBP | 3,012 | | | 09/05/13 | | $ | 94 | | |
RBS | | USD | 13,039 | | | GBP | 8,462 | | | 09/05/13 | | | (169 | ) | |
RBS | | USD | 44,342 | | | HKD | 344,026 | | | 09/11/13 | | | 24 | | |
RBS | | USD | 54,593 | | | HKD | 423,213 | | | 09/13/13 | | | (14 | ) | |
RBS | | USD | 15,184 | | | HKD | 117,762 | | | 09/13/13 | | | 3 | | |
RBS | | USD | 1,017,779 | | | JPY | 99,467,500 | | | 08/22/13 | | | (1,767 | ) | |
RBS | | USD | 21,874,695 | | | JPY | 2,137,770,232 | | | 08/23/13 | | | (38,305 | ) | |
RBS | | USD | 11,267,317 | | | JPY | 1,101,109,841 | | | 08/26/13 | | | (19,787 | ) | |
RBS | | USD | 11,733,310 | | | JPY | 1,146,637,693 | | | 08/27/13 | | | (20,665 | ) | |
RBS | | USD | 12,718,210 | | | JPY | 1,242,874,396 | | | 08/28/13 | | | (22,465 | ) | |
RBS | | USD | 23,472,905 | | | JPY | 2,293,842,725 | | | 08/29/13 | | | (41,580 | ) | |
RBS | | USD | 1,391,915 | | | JPY | 136,020,750 | | | 08/30/13 | | | (2,473 | ) | |
RBS | | USD | 4,659,518 | | | JPY | 463,732,000 | | | 11/21/13 | | | 79,857 | | |
RBS | | USD | 1,645,641 | | | MXN | 20,000,000 | | | 10/24/13 | | | (91,762 | ) | |
RBS | | USD | 30,122 | | | SGD | 37,865 | | | 09/11/13 | | | (326 | ) | |
| | | $ | 901,098 | | |
Interest rate swaps
| | | | | | | Rate type | | | | | | | |
Counterparty | |
Notional
amount
(000) | |
Termination
date | | Payments
made by
the Portfolio9 | | Payments
received by
the Portfolio9 | | Upfront
payments
received
(made) | |
Value | | Unrealized
appreciation
(depreciation) | |
RBS | | EUR | 17,520 | | | 03/22/27 | | | 6 Month EURIBOR | | | | 2.645 | % | | $ | — | | | $ | (511,630 | ) | | $ | (511,630 | ) | |
RBS | | EUR | 10,260 | | | 03/27/27 | | | 6 Month EURIBOR | | | | 2.615 | | | | — | | | | (338,007 | ) | | | (338,007 | ) | |
RBS | | EUR | 3,720 | | | 03/27/27 | | | 6 Month EURIBOR | | | | 2.681 | | | | — | | | | (94,437 | ) | | | (94,437 | ) | |
RBS | | EUR | 7,500 | | | 03/22/47 | | | 2.671 | % | | | 6 Month EURIBOR | | | | — | | | | 253,765 | | | | 253,765 | | |
RBS | | EUR | 4,400 | | | 03/27/47 | | | 2.644 | | | | 6 Month EURIBOR | | | | — | | | | 181,143 | | | | 181,143 | | |
RBS | | EUR | 1,600 | | | 03/27/47 | | | 2.710 | | | | 6 Month EURIBOR | | | | — | | | | 37,817 | | | | 37,817 | | |
| | | | | | | | | | | $ | — | | | $ | (471,349 | ) | | $ | (471,349 | ) | |
Credit default swaps on credit indices—sell protection10
| | | | | | | | | Rate type | | | | | | | | | |
Counterparty | | Referenced obligations11 | | Notional
amount
(000) | | Termination
date | | Payments
received by
the Portfolio9 | | Upfront
payments
received
(made) | | Value | | Unrealized
appreciation | | Credit
spread12 | |
| BB CDX North America | |
HighYield Index | | USD | 8,300 | | | 06/20/18 | | | 5.000 | % | | $ | (238,167 | ) | | $ | 479,756 | | | $ | 241,589 | | | | 3.65 | | |
| RBS CDX North America | |
HighYield Index | | USD | 15,100 | | | 06/20/18 | | | 5.000 | | | | (442,135 | ) | | | 872,808 | | | | 430,673 | | | | 3.65 | | |
| | | | | | | | | | | $ | (680,302 | ) | | $ | 1,352,564 | | | $ | 672,262 | | | | | | |
214
PACE Select Advisors Trust
PACE Alternative Strategies Investments
Portfolio of investments—July 31, 2013
Variance Swaps2,13
Counterparty | | Notional
amount
(000) | | Termination
date | | Pay/
receive
variance | | Reference
entity | | Volatility
strike
price | | Upfront
payments
received
(made) | | Value | | Unrealized
appreciation
(depreciation) | |
BB | | GBP | 9 | | | 12/20/13 | | Pay | | FTSE 100 Index | | | 27.95 | % | | $ | — | | | $ | 138,920 | | | $ | 138,920 | | |
BB | | HKD | 86 | | | 12/30/13 | | Receive | | China Enterprises Index (Hang Seng) | | | 37.75 | | | | — | | | | (132,935 | ) | | | (132,935 | ) | |
BNP | | GBP | 5 | | | 12/20/13 | | Pay | | FTSE 100 Index | | | 24.00 | | | | — | | | | 58,668 | | | | 58,668 | | |
BNP | | GBP | 25 | | | 12/20/13 | | Pay | | FTSE 100 Index | | | 27.50 | | | | — | | | | 370,737 | | | | 370,737 | | |
BNP | | GBP | 5 | | | 12/19/14 | | Pay | | FTSE 100 Index | | | 25.00 | | | | — | | | | 48,832 | | | | 48,832 | | |
BNP | | GBP | 10 | | | 12/19/14 | | Pay | | FTSE 100 Index | | | 25.20 | | | | — | | | | 100,835 | | | | 100,835 | | |
BNP | | GBP | 13 | | | 12/19/14 | | Pay | | FTSE 100 Index | | | 26.90 | | | | — | | | | 156,579 | | | | 156,579 | | |
BNP | | GBP | 2 | | | 12/19/14 | | Pay | | FTSE 100 Index | | | 28.20 | | | | — | | | | 32,009 | | | | 32,009 | | |
BNP | | GBP | 4 | | | 12/19/14 | | Pay | | FTSE 100 Index | | | 28.50 | | | | — | | | | 56,594 | | | | 56,594 | | |
BNP | | HKD | 194 | | | 12/30/14 | | Receive | | China Enterprises Index (Hang Seng) | | | 28.90 | | | | — | | | | 49,319 | | | | 49,319 | | |
BNP | | HKD | 85 | | | 12/30/14 | | Receive | | China Enterprises Index (Hang Seng) | | | 33.30 | | | | — | | | | (55,117 | ) | | | (55,117 | ) | |
BNP | | HKD | 15 | | | 12/30/14 | | Receive | | China Enterprises Index (Hang Seng) | | | 33.50 | | | | — | | | | (9,804 | ) | | | (9,804 | ) | |
BNP | | HKD | 129 | | | 12/30/14 | | Receive | | China Enterprises Index (Hang Seng) | | | 33.65 | | | | — | | | | (89,823 | ) | | | (89,823 | ) | |
BNP | | HKD | 53 | | | 12/30/14 | | Receive | | China Enterprises Index (Hang Seng) | | | 34.00 | | | | — | | | | (38,475 | ) | | | (38,475 | ) | |
BNP | | HKD | 41 | | | 12/30/14 | | Receive | | China Enterprises Index (Hang Seng) | | | 34.25 | | | | — | | | | (30,796 | ) | | | (30,796 | ) | |
BNP | | HKD | 85 | | | 12/30/13 | | Receive | | China Enterprises Index (Hang Seng) | | | 32.60 | | | | — | | | | (86,040 | ) | | | (86,040 | ) | |
BNP | | HKD | 254 | | | 12/30/13 | | Receive | | China Enterprises Index (Hang Seng) | | | 37.40 | | | | — | | | | (382,481 | ) | | | (382,481 | ) | |
BNP | | HKD | 155 | | | 12/30/14 | | Receive | | Hang Seng Index | | | 23.00 | | | | — | | | | 24,209 | | | | 24,209 | | |
BNP | | USD | 20 | | | 12/19/14 | | Pay | | S&P 500 Index | | | 21.40 | | | | — | | | | 40,482 | | | | 40,482 | | |
BNP | | USD | 25 | | | 12/19/14 | | Pay | | S&P 500 Index | | | 21.60 | | | | — | | | | 54,972 | | | | 54,972 | | |
| | | | | | | | | | | | | $ | — | | | $ | 306,685 | | | $ | 306,685 | | |
Centrally cleared credit default swap agreement—sell protection10
| | | Rate type | | | | | | | | | |
Referenced obligation11 | | Notional
amount
(000) | | Termination
date | | Payments
received by
the Portfolio9 | | Upfront
payments
made | | Value | | Unrealized
appreciation | | Credit
spread12 | |
CDX HighYield Index | | USD | 1,000 | | | 06/20/18 | | | 5.000 | % | | $ | (50,269 | ) | | $ | 55,596 | | | $ | 5,327 | | | | 3.65 | | |
Centrally cleared interest rate swap agreements
| | | | | Rate type | | | | | |
Notional
amount
(000) | | Termination
date | | Payments made by
the Portfolio9 | | Payments received by
the Portfolio9 | | Value | | Unrealized
appreciation
(depreciation) | |
EUR | 5,719 | | | 06/26/16 | | 6 Month EURIBOR | | | 1.380 | % | | $ | 25,056 | | | $ | 25,056 | | |
EUR | 11,438 | | | 06/29/16 | | 6 Month EURIBOR | | | 1.250 | | | | 29,939 | | | | 29,939 | | |
EUR | 1,000 | | | 06/06/27 | | 2.784% | | | 6 Month EURIBOR | | | | 20,220 | | | | 20,220 | | |
EUR | 300 | | | 06/06/47 | | 6 Month EURIBOR | | | 2.790 | | | | (3,424 | ) | | | (3,424 | ) | |
| | | | | | | | | | | | | | | | | $ | 71,791 | | | $ | 71,791 | | |
215
PACE Select Advisors Trust
PACE Alternative Strategies Investments
Portfolio of investments—July 31, 2013
Fair valuation summary
The following is a summary of the fair valuations according to the inputs used as of July 31, 2013 in valuing the Portfolio's investments:
| | | Unadjusted
quoted prices in
active markets for
identical investments
(Level 1) | | Other significant
observable inputs
(Level 2) | | Unobservable
inputs
(Level 3) | | Total | |
Common stocks | | $ | 172,681,825 | | | $ | — | | | $ | 0 | | | $ | 172,681,825 | | |
Preferred stock | | | 372,643 | | | | — | | | | — | | | | 372,643 | | |
Rights | | | — | | | | — | | | | 0 | | | | 0 | | |
Corporate notes | | | — | | | | 25,289,471 | | | | — | | | | 25,289,471 | | |
Non-US government obligations | | | — | | | | 12,816,349 | | | | — | | | | 12,816,349 | | |
Time deposits | | | — | | | | 85,847,710 | | | | — | | | | 85,847,710 | | |
Short-term US government obligations | | | — | | | | 214,487,223 | | | | — | | | | 214,487,223 | | |
Repurchase agreement | | | — | | | | 35,167,000 | | | | — | | | | 35,167,000 | | |
Options purchased | | | 9,129,783 | | | | 6,356,569 | | | | — | | | | 15,486,352 | | |
Investments sold short | | | (25,548,677 | ) | | | — | | | | — | | | | (25,548,677 | ) | |
Written options | | | (5,104,574 | ) | | | (462,541 | ) | | | — | | | | (5,567,115 | ) | |
Foreign exchange written options | | | — | | | | (4,549,722 | ) | | | — | | | | (4,549,722 | ) | |
Futures contracts, net | | | (1,213,292 | ) | | | — | | | | — | | | | (1,213,292 | ) | |
Forward foreign currency contracts, net | | | — | | | | 901,098 | | | | — | | | | 901,098 | | |
Swap agreements, net14 | | | — | | | | 1,265,018 | | | | — | | | | 1,265,018 | | |
Total | | $ | 150,317,708 | | | $ | 377,118,175 | | | $ | 0 | | | $ | 527,435,883 | | |
At July 31, 2013, there were no transfers between Level 1 and Level 2. At July 31, 2012, $69,935,376 of foreign investments were classified within Level 2 of the fair value hierarchy pursuant to the Portfolio's fair valuation procedures.
The following is a rollforward of the Portfolio's investments that were valued using unobservable inputs (Level 3) for the year ended July 31, 2013:
| | Common
Stocks | | Rights | |
Beginning balance | | $ | — | | | $ | — | | |
Purchases | | | 368,576 | | | | — | | |
Issuances | | | — | | | | 0 | | |
Sales | | | (115,976 | ) | | | — | | |
Accrued discounts/(premiums) | | | — | | | | — | | |
Total realized gain/(loss) | | | 25,913 | | | | — | | |
Net change in unrealized appreciation/depreciation | | | (278,513 | ) | | | — | | |
Transfers into Level 3 | | | — | | | | — | | |
Transfers out of Level 3 | | | — | | | | — | | |
Ending balance | | $ | 0 | | | $ | 0 | | |
The change in net unrealized appreciation/depreciation relating to the Level 3 investments held at July 31, 2013, was $(278,513).
Portfolio footnotes
* Non-income producing security.
1 Security is being fair valued by a valuation committee under the direction of the board of trustees.
2 Illiquid investments representing 0.35% of net assets as of July 31, 2013.
3 Security, or portion thereof, pledged as collateral for investments sold short, written options or futures.
4 Security exempt from registration pursuant to Regulation S under the Securities Act of 1933. Regulation S applies to securities offerings that are made outside of the United States and do not involve direct selling efforts in the United States. At July 31, 2013, the value of these securities amounted to 2.34% of net assets.
216
PACE Select Advisors Trust
PACE Alternative Strategies Investments
Portfolio of investments—July 31, 2013
5 Variable or floating rate security. The interest rate shown is the current rate as of July 31, 2013 and changes periodically.
6 Perpetual bond security. The maturity date reflects the next call date.
7 Step bond that converts to the noted fixed rate at a designated future date.
8 Rate shown is the discount rate at date of purchase.
9 Payments made/received are based on the notional amount.
10 If the Portfolio is a seller of protection and a credit event occurs, as defined under the terms of that particular swap agreement, the Portfolio will either (i) pay to the buyer of protection an amount equal to the notional amount of the swap and take delivery of the referenced obligation or underlying securities comprising the referenced index or (ii) pay a net settlement amount in the form of cash or securities equal to the notional amount of the swap less the recovery value of the referenced obligation or underlying securities comprising the referenced index.
11 Payments from/to the counterparty will be received/made upon the occurrence of a failure to pay, obligation acceleration, repudiation or restructuring of the referenced obligation.
12 Credit spreads, represented in absolute terms, utilized in determining the market value as of period end serve as an indicator of the current status of the payment/performance risk and represent the likelihood or risk of default for the credit derivative. The credit spread of a particular referenced entity reflects the cost of buying/selling protection and may include upfront payments required to be made to enter into the agreement. Wider credit spreads represent a deterioration of the referenced entity's credit soundness and a greater likelihood or risk of default or other credit event occurring as defined under the terms of the agreement. A credit spread identified as "Defaulted" indicates a credit event has occurred for the referenced entity. Credit spreads are unaudited.
13 At the maturity date, a net cash flow is exchanged, where the payoff amount is equivalent to the difference between the realized price variance of the reference entity and the strike price multiplied by the notional amount. As a receiver of the realized price variance, the Portfolio would receive the payoff amount when the realized price variance of the reference entity is greater than the strike price and would owe the payoff amount when the variance is less than the strike price. As a payer of the realized price variance, the Portfolio would owe the payoff amount when the realized price variance of the reference entity is greater than the strike price and would receive the payoff amount when the variance is less than the strike price.
14 Swap agreements are included in the table at value, with the exception of centrally cleared swap agreements which are included in the table at unrealized appreciation/(depreciation).
See accompanying notes to financial statements.
217
PACE Select Advisors Trust
Portfolio acronyms:
ABS Asset-backed Security
ADR American Depositary Receipt
AGC Associated General Contractors
AGM Assured Guaranty Municipal Corporation
AMBAC American Municipal Bond Assurance Corporation
AMT Alternative Minimum Tax
ARM Adjustable Rate Mortgage—The interest rate shown is the current rate as of July 31, 2013.
ASX Australian Securities Exchange
BHAC Berkshire Hathaway Assurance Corporation
BOBL Bundesobligationen
CAC 40 French Stock Market Index
CDO Collateralized Debt Obligation
CLO Collateralized Loan Obligation
CETIP Central of Custody and Settlement of Private Bonds
COFI Cost of Funds Index
DAX German Stock Index
ETF Exchange Traded Fund
ETN Exchange Traded Notes
EURIBOR Euro Interbank Offered Rate
FGIC Financial Guaranty Insurance Company
FHA Federal Housing Administration
FHLB Federal Home Loan Bank
FHLMC Federal Home Loan Mortgage Corporation
FNMA Federal National Mortgage Association
FTSE London Stock Exchange Index
GDR Global Depositary Receipt
GMAC General Motors Acceptance Corporation
GMTN Global Medium Term Note
GNMA Government National Mortgage Association
GTD Guaranteed
IBC Insured Bond Certificate
IBEX 35 Spanish Exchange Index
ICC International Code Council
JGB Japan Government Bond
KOSPI Korea Composite Stock Price Index
LIBOR London Interbank Offered Rate
MLCC Merrill Lynch Credit Corporation
MTN Medium Term Note
NATL-RE National Reinsurance
NCUA National Credit Union Administration
NIKKEI Tokyo Stock Exchange Index
NVDR Non Voting Depositary Receipt
OJSC Open Joint Stock Company
OMX 30 Stockholm Stock Exchange
PSF Permanent School Fund
REIT Real Estate Investment Trust
REMIC Real Estate Mortgage Investment Conduit
SBA Small Business Administration
S&P Standard and Poor's
SCSDE South Carolina School District Enhancement
SPI Swiss Performance Index
STOXX A series of market indexes that are representative of the European and global markets.
STRIP Separate Trading of Registered Interest and Principal of Securities
TBA (To Be Announced) Security is purchased on a forward commitment basis with an approximate principal amount (generally +/- 1.0%) and no definite maturity date. The actual principal amount and maturity date will be determined upon settlement when the specific mortgage pools are assigned.
TIPS Treasury inflation protected securities ("TIPS") are debt securities issued by the US Treasury whose principal and/or interest payments are adjusted for inflation, unlike debt securities that make fixed principal and interest payments. The interest rate paid by the TIPS is fixed, while the principal value rises or falls based on changes in a published Consumer Price Index ("CPI"). Thus, if inflation occurs, the principal and interest payments on TIPS are adjusted accordingly to protect investors from inflationary loss. During a deflationary period, the principal and interest payments decrease, although the TIPS principal amounts will not drop below their face amounts at maturity. In exchange for the inflation protection, the TIPS generally pay lower interest rates than typical US Treasury securities. Only if inflation occurs will TIPS offer a higher real yield than a conventional Treasury bond of the same maturity.
TOPIX Tokyo Stock Exchange
TSE Tokyo Stock Exchange
VRD Variable rate demand notes are payable on demand. The interest rates shown are the current rates as of July 31, 2013 and reset periodically.
VVPR Verminderde Voorheffing Precompte Reduit (Belgium dividend coupon)
See accompanying notes to financial statements.
218
PACE Select Advisors Trust
Currency type abbreviations:
AUD Australian Dollar
BRL Brazilian Real
CAD Canadian Dollar
CHF Swiss Franc
CLP Chilean Peso
CNY Chinese Yuan Renminbi
CZK Czech Koruna
DKK Danish Krone
EUR Euro
GBP Great Britain Pound
HKD Hong Kong Dollar
INR Indian Rupee
JPY Japanese Yen
KRW South Korean Won
MXN Mexican Peso
MYR Malaysian Rupiah
NOK Norwegian Krone
NZD New Zealand Dollar
PEN Peruvian Nouveau Sol
PHP Philippine Peso
PLN Polish Zloty
RUB Russian Ruble
SEK Swedish Krona
SGD Singapore Dollar
THB Thai Baht
USD United States Dollar
Counterparty acronyms:
ANZ Australia and New Zealand Banking Group
BB Barclays Bank PLC
BNP BNP Paribas
BOA Bank of America
CITI Citibank NA
CSI Credit Suisse International
DB Deutsche Bank AG
GS Goldman Sachs
GSB Goldman Sachs Bank
GSCM Goldman Sachs Capital Management
GSI Goldman Sachs International
HSBC HSBC Bank PLC
JPMCB JPMorgan Chase Bank
JPMSI JP Morgan Securities Inc.
MSC Morgan Stanley & Co., Inc.
MSCI Morgan Stanley & Co. International PLC
RBC Royal Bank of Canada
RBS Royal Bank of Scotland PLC
SSC State Street Bank and Trust Co.
WBC Westpac Banking Corp.
See accompanying notes to financial statements.
219
PACE Select Advisors Trust
Understanding your Portfolio's expenses (unaudited)
As a shareholder of a Portfolio, you incur two types of costs: (1) transactional costs (as applicable), including sales charges (loads), or ongoing program fees; and (2) ongoing Portfolio costs, including management fees; service and/or distribution (12b-1) fees (if applicable); and other Portfolio expenses. These examples are intended to help you understand your ongoing costs (in dollars) of investing in each Portfolio and to compare these costs with the ongoing costs of investing in other mutual funds.
The examples below are based on an investment of $1,000 invested at the beginning of the period and held for the entire period, February 1, 2013 to July 31, 2013.
Actual expenses (unaudited)
The first line for each class of shares in the table below for each Portfolio provides information about its actual account values and actual expenses. You may use the information in this line, together with the amount you invested, to estimate the expenses that you paid over a period. Simply divide your account value by $1,000 (for example, an $8,600 account value divided by $1,000 = 8.6), then multiply the result by the number in the first line for each class of shares for each respective Portfolio under the heading entitled "Expenses paid during period" to estimate the expenses you paid on your account during the period.
Hypothetical example for comparison purposes (unaudited)
The second line for each class of shares in the table below for each Portfolio provides information about hypothetical account values and hypothetical expenses based on that Portfolio's actual expense ratios for each class of shares and an assumed rate of return of 5% per year before expenses, which is not that Portfolio's actual return for each class of shares. The hypothetical account values and expenses may not be used to estimate the actual ending account balance or expenses you paid for the period. You may use this information to compare the ongoing costs of investing in a Portfolio and other funds. To do so, compare this 5% hypothetical example with the 5% hypothetical examples that appear in the shareholder reports of other funds.
Please note that the expenses shown in the table are meant to highlight your ongoing Portfolio costs only and do not reflect any transactional costs (as applicable), such as sales charges (loads), or program fees. Therefore, the second line in the table for each class of shares for each Portfolio is useful in comparing ongoing Portfolio costs only, and will not help you determine the relative total costs of owning different funds. In addition, if these transactional costs or program fees were included, your costs would have been higher.
220
PACE Select Advisors Trust
| |
| | Beginning
account value
February 1, 2013 | | Ending
account value
July 31, 2013 | | Expenses paid
during period1
02/01/13 to 07/31/13 | | Expense
ratio during
the period | |
PACE Money Market Investments | |
Class P | | Actual | | $ | 1,000.00 | | | $ | 1,000.00 | | | $ | 0.89 | | | | 0.18 | % | |
| | | Hypothetical
(5% annual return before expenses) | | | 1,000.00 | | | | 1,023.90 | | | | 0.90 | | | | 0.18 | | |
PACE Government Securities Fixed Income Investments | |
Class A | | Actual | | | 1,000.00 | | | | 978.00 | | | | 4.81 | | | | 0.98 | | |
| | | Hypothetical
(5% annual return before expenses) | | | 1,000.00 | | | | 1,019.94 | | | | 4.91 | | | | 0.98 | | |
Class C | | Actual | | | 1,000.00 | | | | 975.60 | | | | 7.25 | | | | 1.48 | | |
| | | Hypothetical
(5% annual return before expenses) | | | 1,000.00 | | | | 1,017.46 | | | | 7.40 | | | | 1.48 | | |
Class Y | | Actual | | | 1,000.00 | | | | 979.20 | | | | 3.58 | | | | 0.73 | | |
| | | Hypothetical
(5% annual return before expenses) | | | 1,000.00 | | | | 1,021.18 | | | | 3.66 | | | | 0.73 | | |
Class P | | Actual | | | 1,000.00 | | | | 980.00 | | | | 3.58 | | | | 0.73 | | |
| | | Hypothetical
(5% annual return before expenses) | | | 1,000.00 | | | | 1,021.18 | | | | 3.66 | | | | 0.73 | | |
PACE Intermediate Fixed Income Investments | |
Class A | | Actual | | | 1,000.00 | | | | 988.40 | | | | 4.54 | | | | 0.92 | | |
| | | Hypothetical
(5% annual return before expenses) | | | 1,000.00 | | | | 1,020.23 | | | | 4.61 | | | | 0.92 | | |
Class C | | Actual | | | 1,000.00 | | | | 986.00 | | | | 6.99 | | | | 1.42 | | |
| | | Hypothetical
(5% annual return before expenses) | | | 1,000.00 | | | | 1,017.75 | | | | 7.10 | | | | 1.42 | | |
Class Y | | Actual | | | 1,000.00 | | | | 989.60 | | | | 3.26 | | | | 0.66 | | |
| | | Hypothetical
(5% annual return before expenses) | | | 1,000.00 | | | | 1,021.52 | | | | 3.31 | | | | 0.66 | | |
Class P | | Actual | | | 1,000.00 | | | | 988.80 | | | | 3.30 | | | | 0.67 | | |
| | | Hypothetical
(5% annual return before expenses) | | | 1,000.00 | | | | 1,021.47 | | | | 3.36 | | | | 0.67 | | |
PACE Strategic Fixed Income Investments | |
Class A | | Actual | | | 1,000.00 | | | | 965.40 | | | | 5.12 | | | | 1.05 | | |
| | | Hypothetical
(5% annual return before expenses) | | | 1,000.00 | | | | 1,019.59 | | | | 5.26 | | | | 1.05 | | |
Class C | | Actual | | | 1,000.00 | | | | 963.10 | | | | 7.35 | | | | 1.51 | | |
| | | Hypothetical
(5% annual return before expenses) | | | 1,000.00 | | | | 1,017.31 | | | | 7.55 | | | | 1.51 | | |
Class Y | | Actual | | | 1,000.00 | | | | 966.50 | | | | 3.95 | | | | 0.81 | | |
| | | Hypothetical
(5% annual return before expenses) | | | 1,000.00 | | | | 1,020.78 | | | | 4.06 | | | | 0.81 | | |
Class P | | Actual | | | 1,000.00 | | | | 966.60 | | | | 3.95 | | | | 0.81 | | |
| | | Hypothetical
(5% annual return before expenses) | | | 1,000.00 | | | | 1,020.78 | | | | 4.06 | | | | 0.81 | | |
221
PACE Select Advisors Trust
| |
| | Beginning
account value
February 1, 2013 | | Ending
account value
July 31, 2013 | | Expenses paid
during period1
02/01/13 to 07/31/13 | | Expense
ratio during
the period | |
PACE Municipal Fixed Income Investments | |
Class A | | Actual | | $ | 1,000.00 | | | $ | 968.90 | | | $ | 4.39 | | | | 0.90 | % | |
| | | Hypothetical
(5% annual return before expenses) | | | 1,000.00 | | | | 1,020.33 | | | | 4.51 | | | | 0.90 | | |
Class C | | Actual | | | 1,000.00 | | | | 966.50 | | | | 6.83 | | | | 1.40 | | |
| | | Hypothetical
(5% annual return before expenses) | | | 1,000.00 | | | | 1,017.85 | | | | 7.00 | | | | 1.40 | | |
Class Y | | Actual | | | 1,000.00 | | | | 970.10 | | | | 3.18 | | | | 0.65 | | |
| | | Hypothetical
(5% annual return before expenses) | | | 1,000.00 | | | | 1,021.57 | | | | 3.26 | | | | 0.65 | | |
Class P | | Actual | | | 1,000.00 | | | | 970.10 | | | | 3.18 | | | | 0.65 | | |
| | | Hypothetical
(5% annual return before expenses) | | | 1,000.00 | | | | 1,021.57 | | | | 3.26 | | | | 0.65 | | |
PACE International Fixed Income Investments | |
Class A | | Actual | | | 1,000.00 | | | | 940.80 | | | | 5.82 | | | | 1.21 | | |
| | | Hypothetical
(5% annual return before expenses) | | | 1,000.00 | | | | 1,018.79 | | | | 6.06 | | | | 1.21 | | |
Class C | | Actual | | | 1,000.00 | | | | 939.40 | | | | 8.13 | | | | 1.69 | | |
| | | Hypothetical
(5% annual return before expenses) | | | 1,000.00 | | | | 1,016.41 | | | | 8.45 | | | | 1.69 | | |
Class Y | | Actual | | | 1,000.00 | | | | 942.60 | | | | 4.82 | | | | 1.00 | | |
| | | Hypothetical
(5% annual return before expenses) | | | 1,000.00 | | | | 1,019.84 | | | | 5.01 | | | | 1.00 | | |
Class P | | Actual | | | 1,000.00 | | | | 941.80 | | | | 4.81 | | | | 1.00 | | |
| | | Hypothetical
(5% annual return before expenses) | | | 1,000.00 | | | | 1,019.84 | | | | 5.01 | | | | 1.00 | | |
PACE High Yield Investments | |
Class A | | Actual | | | 1,000.00 | | | | 1,011.20 | | | | 6.28 | | | | 1.26 | | |
| | | Hypothetical
(5% annual return before expenses) | | | 1,000.00 | | | | 1,018.55 | | | | 6.31 | | | | 1.26 | | |
Class C | | Actual | | | 1,000.00 | | | | 1,008.90 | | | | 8.62 | | | | 1.73 | | |
| | | Hypothetical
(5% annual return before expenses) | | | 1,000.00 | | | | 1,016.22 | | | | 8.65 | | | | 1.73 | | |
Class Y | | Actual | | | 1,000.00 | | | | 1,012.40 | | | | 5.14 | | | | 1.03 | | |
| | | Hypothetical
(5% annual return before expenses) | | | 1,000.00 | | | | 1,019.69 | | | | 5.16 | | | | 1.03 | | |
Class P | | Actual | | | 1,000.00 | | | | 1,012.40 | | | | 5.14 | | | | 1.03 | | |
| | | Hypothetical
(5% annual return before expenses) | | | 1,000.00 | | | | 1,019.69 | | | | 5.16 | | | | 1.03 | | |
222
PACE Select Advisors Trust
| |
| | Beginning
account value
February 1, 2013 | | Ending
account value
July 31, 2013 | | Expenses paid
during period1
02/01/13 to 07/31/13 | | Expense
ratio during
the period | |
PACE Large Co Value Equity Investments | |
Class A | | Actual | | $ | 1,000.00 | | | $ | 1,157.20 | | | $ | 6.10 | | | | 1.14 | % | |
| | | Hypothetical
(5% annual return before expenses) | | | 1,000.00 | | | | 1,019.14 | | | | 5.71 | | | | 1.14 | | |
Class C | | Actual | | | 1,000.00 | | | | 1,153.00 | | | | 10.30 | | | | 1.93 | | |
| | | Hypothetical
(5% annual return before expenses) | | | 1,000.00 | | | | 1,015.22 | | | | 9.64 | | | | 1.93 | | |
Class Y | | Actual | | | 1,000.00 | | | | 1,159.00 | | | | 4.82 | | | | 0.90 | | |
| | | Hypothetical
(5% annual return before expenses) | | | 1,000.00 | | | | 1,020.33 | | | | 4.51 | | | | 0.90 | | |
Class P | | Actual | | | 1,000.00 | | | | 1,159.00 | | | | 4.82 | | | | 0.90 | | |
| | | Hypothetical
(5% annual return before expenses) | | | 1,000.00 | | | | 1,020.33 | | | | 4.51 | | | | 0.90 | | |
PACE Large Co Growth Equity Investments | |
Class A | | Actual | | | 1,000.00 | | | | 1,114.70 | | | | 6.29 | | | | 1.20 | | |
| | | Hypothetical
(5% annual return before expenses) | | | 1,000.00 | | | | 1,018.84 | | | | 6.01 | | | | 1.20 | | |
Class C | | Actual | | | 1,000.00 | | | | 1,110.60 | | | | 10.73 | | | | 2.05 | | |
| | | Hypothetical
(5% annual return before expenses) | | | 1,000.00 | | | | 1,014.63 | | | | 10.24 | | | | 2.05 | | |
Class Y | | Actual | | | 1,000.00 | | | | 1,116.50 | | | | 4.99 | | | | 0.95 | | |
| | | Hypothetical
(5% annual return before expenses) | | | 1,000.00 | | | | 1,020.08 | | | | 4.76 | | | | 0.95 | | |
Class P | | Actual | | | 1,000.00 | | | | 1,116.50 | | | | 4.93 | | | | 0.94 | | |
| | | Hypothetical
(5% annual return before expenses) | | | 1,000.00 | | | | 1,020.13 | | | | 4.71 | | | | 0.94 | | |
PACE Small/Medium Co Value Equity Investments | |
Class A | | Actual | | | 1,000.00 | | | | 1,134.50 | | | | 6.62 | | | | 1.25 | | |
| | | Hypothetical
(5% annual return before expenses) | | | 1,000.00 | | | | 1,018.60 | | | | 6.26 | | | | 1.25 | | |
Class C | | Actual | | | 1,000.00 | | | | 1,130.60 | | | | 10.62 | | | | 2.01 | | |
| | | Hypothetical
(5% annual return before expenses) | | | 1,000.00 | | | | 1,014.83 | | | | 10.04 | | | | 2.01 | | |
Class Y | | Actual | | | 1,000.00 | | | | 1,135.50 | | | | 6.14 | | | | 1.16 | | |
| | | Hypothetical
(5% annual return before expenses) | | | 1,000.00 | | | | 1,019.04 | | | | 5.81 | | | | 1.16 | | |
Class P | | Actual | | | 1,000.00 | | | | 1,135.50 | | | | 6.14 | | | | 1.16 | | |
| | | Hypothetical
(5% annual return before expenses) | | | 1,000.00 | | | | 1,019.04 | | | | 5.81 | | | | 1.16 | | |
223
PACE Select Advisors Trust
| |
| | Beginning
account value
February 1, 2013 | | Ending
account value
July 31, 2013 | | Expenses paid
during period1
02/01/13 to 07/31/13 | | Expense
ratio during
the period | |
PACE Small/Medium Co Growth Equity Investments | |
Class A | | Actual | | $ | 1,000.00 | | | $ | 1,161.00 | | | $ | 6.64 | | | | 1.24 | % | |
| | | Hypothetical
(5% annual return before expenses) | | | 1,000.00 | | | | 1,018.65 | | | | 6.21 | | | | 1.24 | | |
Class C | | Actual | | | 1,000.00 | | | | 1,156.90 | | | | 10.70 | | | | 2.00 | | |
| | | Hypothetical
(5% annual return before expenses) | | | 1,000.00 | | | | 1,014.88 | | | | 9.99 | | | | 2.00 | | |
Class Y | | Actual | | | 1,000.00 | | | | 1,161.70 | | | | 6.06 | | | | 1.13 | | |
| | | Hypothetical
(5% annual return before expenses) | | | 1,000.00 | | | | 1,019.19 | | | | 5.66 | | | | 1.13 | | |
Class P | | Actual | | | 1,000.00 | | | | 1,161.70 | | | | 6.06 | | | | 1.13 | | |
| | | Hypothetical
(5% annual return before expenses) | | | 1,000.00 | | | | 1,019.19 | | | | 5.66 | | | | 1.13 | | |
PACE International Equity Investments | |
Class A | | Actual | | | 1,000.00 | | | | 1,048.00 | | | | 7.21 | | | | 1.42 | | |
| | | Hypothetical
(5% annual return before expenses) | | | 1,000.00 | | | | 1,017.75 | | | | 7.10 | | | | 1.42 | | |
Class C | | Actual | | | 1,000.00 | | | | 1,042.70 | | | | 11.40 | | | | 2.25 | | |
| | | Hypothetical
(5% annual return before expenses) | | | 1,000.00 | | | | 1,013.64 | | | | 11.23 | | | | 2.25 | | |
Class Y | | Actual | | | 1,000.00 | | | | 1,049.70 | | | | 5.84 | | | | 1.15 | | |
| | | Hypothetical
(5% annual return before expenses) | | | 1,000.00 | | | | 1,019.09 | | | | 5.76 | | | | 1.15 | | |
Class P | | Actual | | | 1,000.00 | | | | 1,049.00 | | | | 5.94 | | | | 1.17 | | |
| | | Hypothetical
(5% annual return before expenses) | | | 1,000.00 | | | | 1,018.99 | | | | 5.86 | | | | 1.17 | | |
PACE International Emerging Markets Equity Investments | |
Class A | | Actual | | | 1,000.00 | | | | 901.00 | | | | 8.06 | | | | 1.71 | | |
| | | Hypothetical
(5% annual return before expenses) | | | 1,000.00 | | | | 1,016.32 | | | | 8.55 | | | | 1.71 | | |
Class C | | Actual | | | 1,000.00 | | | | 897.60 | | | | 11.53 | | | | 2.45 | | |
| | | Hypothetical
(5% annual return before expenses) | | | 1,000.00 | | | | 1,012.65 | | | | 12.23 | | | | 2.45 | | |
Class Y | | Actual | | | 1,000.00 | | | | 902.10 | | | | 6.89 | | | | 1.46 | | |
| | | Hypothetical
(5% annual return before expenses) | | | 1,000.00 | | | | 1,017.56 | | | | 7.30 | | | | 1.46 | | |
Class P | | Actual | | | 1,000.00 | | | | 901.00 | | | | 7.59 | | | | 1.61 | | |
| | | Hypothetical
(5% annual return before expenses) | | | 1,000.00 | | | | 1,016.81 | | | | 8.05 | | | | 1.61 | | |
224
PACE Select Advisors Trust
| |
| | Beginning
account value
February 1, 2013 | | Ending
account value
July 31, 2013 | | Expenses paid
during period1
02/01/13 to 07/31/13 | | Expense
ratio during
the period | |
PACE Global Real Estate Securities Investments | |
Class A | | Actual | | $ | 1,000.00 | | | $ | 996.90 | | | $ | 7.18 | | | | 1.45 | % | |
| | | Hypothetical
(5% annual return before expenses) | | | 1,000.00 | | | | 1,017.60 | | | | 7.25 | | | | 1.45 | | |
Class C | | Actual | | | 1,000.00 | | | | 993.90 | | | | 10.88 | | | | 2.20 | | |
| | | Hypothetical
(5% annual return before expenses) | | | 1,000.00 | | | | 1,013.89 | | | | 10.99 | | | | 2.20 | | |
Class Y | | Actual | | | 1,000.00 | | | | 998.50 | | | | 5.95 | | | | 1.20 | | |
| | | Hypothetical
(5% annual return before expenses) | | | 1,000.00 | | | | 1,018.84 | | | | 6.01 | | | | 1.20 | | |
Class P | | Actual | | | 1,000.00 | | | | 998.50 | | | | 5.95 | | | | 1.20 | | |
| | | Hypothetical
(5% annual return before expenses) | | | 1,000.00 | | | | 1,018.84 | | | | 6.01 | | | | 1.20 | | |
PACE Alternative Strategies Investments | |
Class A | | Actual | | | 1,000.00 | | | | 1,035.50 | | | | 9.99 | | | | 1.98 | | |
| | | Hypothetical
(5% annual return before expenses) | | | 1,000.00 | | | | 1,014.98 | | | | 9.89 | | | | 1.98 | | |
Class C | | Actual | | | 1,000.00 | | | | 1,032.30 | | | | 13.76 | | | | 2.73 | | |
| | | Hypothetical
(5% annual return before expenses) | | | 1,000.00 | | | | 1,011.26 | | | | 13.61 | | | | 2.73 | | |
Class Y | | Actual | | | 1,000.00 | | | | 1,037.30 | | | | 8.74 | | | | 1.73 | | |
| | | Hypothetical
(5% annual return before expenses) | | | 1,000.00 | | | | 1,016.22 | | | | 8.65 | | | | 1.73 | | |
Class P | | Actual | | | 1,000.00 | | | | 1,037.40 | | | | 8.74 | | | | 1.73 | | |
| | | Hypothetical
(5% annual return before expenses) | | | 1,000.00 | | | | 1,016.22 | | | | 8.65 | | | | 1.73 | | |
1 Expenses are equal to the Portfolios' annualized net expense ratios, multiplied by the average account value over the period, multiplied by 181 divided by 365 (to reflect the one-half year period).
225
PACE Select Advisors Trust
Statement of assets and liabilities
July 31, 2013
| | | PACE
Money Market
Investments | | PACE
Government
Securities
Fixed Income
Investments | | PACE
Intermediate
Fixed Income
Investments | | PACE
Strategic
Fixed Income
Investments | |
Assets: | |
Investments in unaffiliated securities, at value (cost—$259,178,175; $895,624,529;
$457,708,339; $938,597,942; $370,980,330; $534,589,243 and $361,517,766, respectively)1 | | $ | 259,178,175 | | | $ | 893,382,887 | | | $ | 456,579,805 | | | $ | 924,715,237 | | |
Investments in affiliated security, at value (cost—$0; $0; $702,620; $3,121,965; $0;
$1,096,145 and $44,014,743, respectively) | | | — | | | | — | | | | 702,620 | | | | 3,121,965 | | |
Repurchase agreements, at value (cost—$50,692,000; $779,000; $15,258,000;
$13,633,000; $0; $3,348,000 and $2,408,000, respectively) | | | 50,692,000 | | | | 779,000 | | | | 15,258,000 | | | | 13,633,000 | | |
Total investments in securities, at value (cost—$309,870,175; $896,403,529;
$473,668,959; $955,352,907; $370,980,330; $539,033,388 and $407,940,509,
respectively) | | $ | 309,870,175 | | | $ | 894,161,887 | | | $ | 472,540,425 | | | $ | 941,470,202 | | |
Cash | | | 172 | | | | 553,252 | | | | 5,447 | | | | 41,341 | | |
Cash collateral on futures | | | — | | | | — | | | | 388,454 | | | | — | | |
Cash collateral on swap agreements | | | — | | | | — | | | | — | | | | — | | |
Foreign currency, at value (cost—$0; $0; $50,467; $1,716,335; $0; $893,712 and
$1,773,678, respectively) | | | — | | | | — | | | | 43,131 | | | | 1,609,691 | | |
Receivable from affiliate | | | 27,073 | | | | — | | | | — | | | | — | | |
Receivable for investments sold | | | — | | | | 251,273,391 | | | | 42,293,144 | | | | 31,656,135 | | |
Receivable for investments sold short | | | — | | | | 106,647,305 | | | | — | | | | 1,569,375 | | |
Receivable for shares of beneficial interest sold | | | 516,616 | | | | 676,264 | | | | 467,825 | | | | 1,111,755 | | |
Receivable for interest | | | 62,853 | | | | 1,588,953 | | | | 1,530,490 | | | | 4,531,431 | | |
Swap agreements, at value2 | | | — | | | | — | | | | 734,936 | | | | 1,155,104 | | |
Due from broker | | | — | | | | — | | | | 584,672 | | | | 16,022 | | |
Unrealized appreciation on forward foreign currency contracts | | | — | | | | — | | | | 402,913 | | | | 3,616,947 | | |
Receivable for variation margin on futures contracts | | | — | | | | — | | | | 240,341 | | | | 8,491 | | |
Receivable for variation margin on swap agreements | | | — | | | | — | | | | 2,424 | | | | 193,419 | | |
Receivable for foreign tax reclaims | | | — | | | | — | | | | 9,215 | | | | 831 | | |
Other assets | | | 19,704 | | | | 27,699 | | | | 28,622 | | | | 35,835 | | |
Total assets | | | 310,496,593 | | | | 1,254,928,751 | | | | 519,272,039 | | | | 987,016,579 | | |
Liabilities: | |
Payable for shares of beneficial interest repurchased | | | 459,893 | | | | 1,448,738 | | | | 1,362,628 | | | | 2,574,876 | | |
Payable to custodian | | | 7,214 | | | | 52,229 | | | | 51,310 | | | | 123,153 | | |
Dividends payable to shareholders | | | 1,412 | | | | — | | | | — | | | | — | | |
Payable for when issued TBA securities | | | — | | | | 436,215,703 | | | | 39,283,719 | | | | 26,941,172 | | |
Payable for investments purchased | | | — | | | | 120,204,813 | | | | 16,209,561 | | | | 13,043,426 | | |
Investments sold short, at value (proceeds—$0; $106,647,305; $0; $1,569,375; $0;
$0 and $0, respectively) | | | — | | | | 106,945,548 | | | | — | | | | 1,578,320 | | |
Due to broker | | | — | | | | 1,196,000 | | | | 100,148 | | | | 2,279,976 | | |
Payable to affiliate | | | — | | | | 252,599 | | | | 156,950 | | | | 530,743 | | |
Payable for dollar roll transactions | | | — | | | | — | | | | 10,011,800 | | | | 6,175,144 | | |
Payable for cash collateral from securities loaned | | | — | | | | — | | | | 702,620 | | | | 3,121,965 | | |
Options and swaptions written, at value (premiums received $0; $0; $344,921; $0; $0;
$0 and $0, respectively) | | | — | | | | — | | | | 359,005 | | | | — | | |
Unrealized depreciation on forward foreign currency contracts | | | — | | | | — | | | | 265,189 | | | | 3,288,718 | | |
Deferred payable for dollar roll transactions | | | — | | | | — | | | | 2,650 | | | | 4,099 | | |
Payable for foreign withholding taxes | | | — | | | | — | | | | — | | | | — | | |
Swap agreements, at value2 | | | — | | | | — | | | | — | | | | 1,727,432 | | |
Accrued expenses and other liabilities | | | 186,130 | | | | 223,076 | | | | 158,213 | | | | 227,947 | | |
Total liabilities | | | 654,649 | | | | 666,538,706 | | | | 68,663,793 | | | | 61,616,971 | | |
1 Includes $0; $0; $686,463; $3,079,792; $0; $1,076,916 and $42,954,941, respectively, of investments in securities on loan, at value plus accrued interest and dividends, if any.
2 Net upfront payments received by PACE Strategic Fixed Income Investments were $354,390.
226
| | | PACE
Municipal
Fixed Income
Investments | | PACE
International
Fixed Income
Investments | | PACE
High Yield
Investments | |
Assets: | |
Investments in unaffiliated securities, at value (cost—$259,178,175; $895,624,529;
$457,708,339; $938,597,942; $370,980,330; $534,589,243 and $361,517,766, respectively)1 | | $ | 377,789,535 | | | $ | 535,862,198 | | | $ | 376,925,421 | | |
Investments in affiliated security, at value (cost—$0; $0; $702,620; $3,121,965; $0;
$1,096,145 and $44,014,743, respectively) | | | — | | | | 1,096,145 | | | | 44,014,743 | | |
Repurchase agreements, at value (cost—$50,692,000; $779,000; $15,258,000;
$13,633,000; $0; $3,348,000 and $2,408,000, respectively) | | | — | | | | 3,348,000 | | | | 2,408,000 | | |
Total investments in securities, at value (cost—$309,870,175; $896,403,529;
$473,668,959; $955,352,907; $370,980,330; $539,033,388 and $407,940,509,
respectively) | | $ | 377,789,535 | | | $ | 540,306,343 | | | $ | 423,348,164 | | |
Cash | | | — | | | | 635 | | | | 1,801,935 | | |
Cash collateral on futures | | | — | | | | 3,860,778 | | | | — | | |
Cash collateral on swap agreements | | | — | | | | — | | | | — | | |
Foreign currency, at value (cost—$0; $0; $50,467; $1,716,335; $0; $893,712 and
$1,773,678, respectively) | | | — | | | | 975,040 | | | | 1,831,969 | | |
Receivable from affiliate | | | — | | | | — | | | | — | | |
Receivable for investments sold | | | — | | | | 2,726,972 | | | | 30,872 | | |
Receivable for investments sold short | | | — | | | | — | | | | — | | |
Receivable for shares of beneficial interest sold | | | 576,843 | | | | 679,698 | | | | 727,758 | | |
Receivable for interest | | | 3,522,358 | | | | 6,084,945 | | | | 7,551,105 | | |
Swap agreements, at value2 | | | — | | | | — | | | | — | | |
Due from broker | | | — | | | | — | | | | — | | |
Unrealized appreciation on forward foreign currency contracts | | | — | | | | 2,105,641 | | | | 984,761 | | |
Receivable for variation margin on futures contracts | | | — | | | | 2,888,943 | | | | 893,547 | | |
Receivable for variation margin on swap agreements | | | — | | | | — | | | | — | | |
Receivable for foreign tax reclaims | | | — | | | | 32,410 | | | | 90,300 | | |
Other assets | | | 23,450 | | | | 28,217 | | | | 26,646 | | |
Total assets | | | 381,912,186 | | | | 559,689,622 | | | | 437,287,057 | | |
Liabilities: | |
Payable for shares of beneficial interest repurchased | | | 657,427 | | | | 745,410 | | | | 636,730 | | |
Payable to custodian | | | 31,761 | | | | 127,221 | | | | 41,543 | | |
Dividends payable to shareholders | | | — | | | | — | | | | — | | |
Payable for when issued TBA securities | | | — | | | | — | | | | — | | |
Payable for investments purchased | | | 4,132,230 | | | | 816,971 | | | | 3,589,505 | | |
Investments sold short, at value (proceeds—$0; $106,647,305; $0; $1,569,375; $0;
$0 and $0, respectively) | | | — | | | | — | | | | — | | |
Due to broker | | | — | | | | — | | | | 335,237 | | |
Payable to affiliate | | | 195,917 | | | | 333,256 | | | | 230,509 | | |
Payable for dollar roll transactions | | | — | | | | — | | | | — | | |
Payable for cash collateral from securities loaned | | | — | | | | 1,096,145 | | | | 44,014,743 | | |
Options and swaptions written, at value (premiums received $0; $0; $344,921; $0; $0;
$0 and $0, respectively) | | | — | | | | — | | | | — | | |
Unrealized depreciation on forward foreign currency contracts | | | — | | | | 8,142,383 | | | | 958 | | |
Deferred payable for dollar roll transactions | | | — | | | | — | | | | — | | |
Payable for foreign withholding taxes | | | — | | | | 6,528 | | | | — | | |
Swap agreements, at value2 | | | — | | | | — | | | | — | | |
Accrued expenses and other liabilities | | | 98,799 | | | | 216,044 | | | | 152,303 | | |
Total liabilities | | | 5,116,134 | | | | 11,483,958 | | | | 49,001,528 | | |
See accompanying notes to financial statements.
227
PACE Select Advisors Trust
Statement of assets and liabilities (continued)
July 31, 2013
| | | PACE
Money Market
Investments | | PACE
Government
Securities
Fixed Income
Investments | | PACE
Intermediate
Fixed Income
Investments | | PACE
Strategic
Fixed Income
Investments | |
Net assets: | |
Beneficial interest shares of $0.001 par value (unlimited amount authorized) | | $ | 309,843,419 | | | $ | 611,863,216 | | | $ | 451,945,504 | | | $ | 914,819,720 | | |
Accumulated undistributed (distributions in excess of) net investment income | | | — | | | | 275,474 | | | | 1,328,417 | | | | 7,614,796 | | |
Accumulated net realized gain (loss) | | | (1,475 | ) | | | (21,208,760 | ) | | | (2,845,064 | ) | | | 29,875,506 | | |
Net unrealized appreciation (depreciation) | | | — | | | | (2,539,885 | ) | | | 179,389 | | | | (26,910,414 | ) | |
Net assets | | $ | 309,841,944 | | | $ | 588,390,045 | | | $ | 450,608,246 | | | $ | 925,399,608 | | |
Class A | |
Net assets | | $ | — | | | $ | 66,553,815 | | | $ | 31,355,125 | | | $ | 67,416,959 | | |
Shares outstanding | | | — | | | | 5,274,071 | | | | 2,569,895 | | | | 4,760,776 | | |
Net asset value per share | | $ | — | | | $ | 12.62 | | | $ | 12.20 | | | $ | 14.16 | | |
Maximum offering price per share | | $ | — | | | $ | 13.21 | | | $ | 12.77 | | | $ | 14.83 | | |
Class C | |
Net assets | | $ | — | | | $ | 16,906,636 | | | $ | 2,685,276 | | | $ | 20,991,878 | | |
Shares outstanding | | | — | | | | 1,338,286 | | | | 219,800 | | | | 1,481,634 | | |
Net asset value and offering price per share | | $ | — | | | $ | 12.63 | | | $ | 12.22 | | | $ | 14.17 | | |
Class Y | |
Net assets | | $ | — | | | $ | 57,567,299 | | | $ | 674,250 | | | $ | 3,638,339 | | |
Shares outstanding | | | — | | | | 4,561,056 | | | | 55,253 | | | | 257,082 | | |
Net asset value, offering price and redemption value per share1 | | $ | — | | | $ | 12.62 | | | $ | 12.20 | | | $ | 14.15 | | |
Class P | |
Net assets | | $ | 309,841,944 | | | $ | 447,362,295 | | | $ | 415,893,595 | | | $ | 833,352,432 | | |
Shares outstanding | | | 309,843,709 | | | | 35,432,859 | | | | 34,076,783 | | | | 58,848,007 | | |
Net asset value, offering price and redemption value per share1 | | $ | 1.00 | | | $ | 12.63 | | | $ | 12.20 | | | $ | 14.16 | | |
1 Assumes shares were held a sufficient period or are otherwise not subject to a redemption fee.
228
| | | PACE
Municipal
Fixed Income
Investments | | PACE
International
Fixed Income
Investments | | PACE
High Yield
Investments | |
Net assets: | |
Beneficial interest shares of $0.001 par value (unlimited amount authorized) | | $ | 367,767,242 | | | $ | 586,950,449 | | | $ | 372,891,818 | | |
Accumulated undistributed (distributions in excess of) net investment income | | | — | | | | (17,359,961 | ) | | | — | | |
Accumulated net realized gain (loss) | | | 2,219,605 | | | | (19,635,403 | ) | | | (1,954,990 | ) | |
Net unrealized appreciation (depreciation) | | | 6,809,205 | | | | (1,749,421 | ) | | | 17,348,701 | | |
Net assets | | $ | 376,796,052 | | | $ | 548,205,664 | | | $ | 388,285,529 | | |
Class A | |
Net assets | | $ | 63,539,566 | | | $ | 70,051,516 | | | $ | 23,400,207 | | |
Shares outstanding | | | 4,921,611 | | | | 6,631,576 | | | | 2,248,860 | | |
Net asset value per share | | $ | 12.91 | | | $ | 10.56 | | | $ | 10.41 | | |
Maximum offering price per share | | $ | 13.52 | | | $ | 11.06 | | | $ | 10.90 | | |
Class C | |
Net assets | | $ | 12,336,117 | | | $ | 5,862,144 | | | $ | 5,606,507 | | |
Shares outstanding | | | 955,437 | | | | 554,712 | | | | 539,254 | | |
Net asset value and offering price per share | | $ | 12.91 | | | $ | 10.57 | | | $ | 10.40 | | |
Class Y | |
Net assets | | $ | 82,364 | | | $ | 5,170,983 | | | $ | 1,552,328 | | |
Shares outstanding | | | 6,375 | | | | 490,800 | | | | 148,726 | | |
Net asset value, offering price and redemption value per share1 | | $ | 12.92 | | | $ | 10.54 | | | $ | 10.44 | | |
Class P | |
Net assets | | $ | 300,838,005 | | | $ | 467,121,021 | | | $ | 357,726,487 | | |
Shares outstanding | | | 23,295,266 | | | | 44,216,411 | | | | 34,309,097 | | |
Net asset value, offering price and redemption value per share1 | | $ | 12.91 | | | $ | 10.56 | | | $ | 10.43 | | |
See accompanying notes to financial statements.
229
PACE Select Advisors Trust
Statement of assets and liabilities (continued)
July 31, 2013
| | | PACE
Large Co
Value Equity
Investments | | PACE
Large Co
Growth Equity
Investments | | PACE
Small/Medium Co
Value Equity
Investments | | PACE
Small/Medium Co
Growth Equity
Investments | |
Assets: | |
Investments in unaffiliated securities, at value (cost—$1,047,965,427; $898,013,604;
$387,192,819; $357,369,625; $827,740,669; $360,055,153; $109,449,359 and
$509,419,086, respectively)1 | | $ | 1,283,854,634 | | | $ | 1,160,717,142 | | | $ | 464,335,432 | | | $ | 495,731,723 | | |
Investments in affiliated security, at value (cost—$2,009,700; $22,558,968; $30,367,763;
$41,413,440; $5,492,556; $34,204,798; $3,476,030 and $0, respectively) | | | 2,009,700 | | | | 22,558,968 | | | | 30,367,763 | | | | 41,413,440 | | |
Repurchase agreements, at value (cost—$34,728,000; $41,783,000; $27,031,000;
$6,549,000; $18,024,000; $9,431,000; $2,771,000 and $35,167,000, respectively) | | | 34,728,000 | | | | 41,783,000 | | | | 27,031,000 | | | | 6,549,000 | | |
Total investments in securities, at value (cost—$1,084,703,127; $962,355,572;
$444,591,582; $405,332,065; $851,257,225; $403,690,951; $115,696,389 and
$544,586,086, respectively) | | $ | 1,320,592,334 | | | $ | 1,225,059,110 | | | $ | 521,734,195 | | | $ | 543,694,163 | | |
Cash | | | 1,495 | | | | 1,711 | | | | 62,994 | | | | 710 | | |
Cash collateral on futures | | | — | | | | — | | | | — | | | | — | | |
Cash collateral on swap agreements | | | — | | | | — | | | | — | | | | — | | |
Cash collateral on investments sold short | | | — | | | | — | | | | — | | | | — | | |
Foreign currency, at value (cost—$0; $0; $0; $0; $2,009,675; $1,074,173; $29,206 and
$592,742, respectively) | | | — | | | | — | | | | — | | | | — | | |
Receivable for investments sold | | | 5,046,060 | | | | 1,856,636 | | | | 8,869,394 | | | | 1,807,711 | | |
Receivable for shares of beneficial interest sold | | | 918,649 | | | | 981,847 | | | | 536,077 | | | | 642,318 | | |
Receivable for dividends and interest | | | 1,876,815 | | | | 494,149 | | | | 249,305 | | | | 78,996 | | |
Swap agreements, at value2 | | | — | | | | — | | | | — | | | | — | | |
Receivable for variation margin on futures contracts | | | — | | | | — | | | | — | | | | — | | |
Due from broker | | | — | | | | — | | | | — | | | | — | | |
Unrealized appreciation on forward foreign currency contracts | | | — | | | | — | | | | — | | | | — | | |
Receivable for foreign tax reclaims | | | 2,310 | | | | — | | | | — | | | | — | | |
Other assets | | | 37,028 | | | | 34,650 | | | | 24,067 | | | | 23,646 | | |
Total assets | | | 1,328,474,691 | | | | 1,228,428,103 | | | | 531,476,032 | | | | 546,247,544 | | |
Liabilities: | |
Payable for investments purchased | | | 4,444,711 | | | | 7,831,469 | | | | 13,563,121 | | | | 454,567 | | |
Payable for cash collateral from securities loaned | | | 2,009,700 | | | | 22,558,968 | | | | 30,367,763 | | | | 41,413,440 | | |
Payable for shares of beneficial interest repurchased | | | 1,249,010 | | | | 1,435,085 | | | | 367,512 | | | | 409,524 | | |
Payable to affiliate | | | 855,060 | | | | 800,413 | | | | 380,688 | | | | 375,147 | | |
Payable to custodian | | | 127,807 | | | | 116,452 | | | | 46,166 | | | | 47,542 | | |
Payable for foreign withholding and foreign capital gains taxes | | | 1,733 | | | | — | | | | — | | | | 399 | | |
Unrealized depreciation on forward foreign currency contracts | | | — | | | | — | | | | — | | | | — | | |
Investments sold short, at value (proceeds—$0; $0; $0; $0; $0; $0; $0 and
$24,663,438, respectively) | | | — | | | | — | | | | — | | | | — | | |
Options and swaptions written, at value (premiums received $0; $0; $0; $0; $0; $0; $0 and
$11,552,387, respectively) | | | — | | | | — | | | | — | | | | — | | |
Payable for variation margin on futures contracts | | | — | | | | — | | | | — | | | | — | | |
Due to broker | | | — | | | | — | | | | — | | | | — | | |
Payable for variation margin on swap agreements2 | | | — | | | | — | | | | — | | | | — | | |
Swap agreements, at value2 | | | — | | | | — | | | | — | | | | — | | |
Payable for dividend and interest expense on investments sold short | | | — | | | | — | | | | — | | | | — | | |
Accrued expenses and other liabilities | | | 217,691 | | | | 216,758 | | | | 190,796 | | | | 189,573 | | |
Total liabilities | | | 8,905,712 | | | | 32,959,145 | | | | 44,916,046 | | | | 42,890,192 | | |
1 Includes $15,490,386; $36,572,894; $29,711,862; $40,020,764; $5,234,742; $32,722,576; $3,291,862 and $0, respectively, of investments in securities on loan, at value plus accrued interest and dividends, if any.
2 Net upfront payments made by PACE Alternative Strategies Investments were $730,571.
230
| | | PACE
International
Equity
Investments | | PACE
International
Emerging
Markets Equity
Investments | | PACE
Global
Real Estate
Securities
Investments | | PACE
Alternative
Strategies
Investments | |
Assets: | |
Investments in unaffiliated securities, at value (cost—$1,047,965,427; $898,013,604;
$387,192,819; $357,369,625; $827,740,669; $360,055,153; $109,449,359 and
$509,419,086, respectively)1 | | $ | 927,833,711 | | | $ | 356,305,703 | | | $ | 119,968,975 | | | $ | 526,981,573 | | |
Investments in affiliated security, at value (cost—$2,009,700; $22,558,968; $30,367,763;
$41,413,440; $5,492,556; $34,204,798; $3,476,030 and $0, respectively) | | | 5,492,556 | | | | 34,204,798 | | | | 3,476,030 | | | | — | | |
Repurchase agreements, at value (cost—$34,728,000; $41,783,000; $27,031,000;
$6,549,000; $18,024,000; $9,431,000; $2,771,000 and $35,167,000, respectively) | | | 18,024,000 | | | | 9,431,000 | | | | 2,771,000 | | | | 35,167,000 | | |
Total investments in securities, at value (cost—$1,084,703,127; $962,355,572;
$444,591,582; $405,332,065; $851,257,225; $403,690,951; $115,696,389 and
$544,586,086, respectively) | | $ | 951,350,267 | | | $ | 399,941,501 | | | $ | 126,216,005 | | | $ | 562,148,573 | | |
Cash | | | 1,955 | | | | 2,039 | | | | 890 | | | | — | | |
Cash collateral on futures | | | 512,000 | | | | — | | | | — | | | | 9,852,145 | | |
Cash collateral on swap agreements | | | — | | | | — | | | | — | | | | 159,665 | | |
Cash collateral on investments sold short | | | — | | | | — | | | | — | | | | 25,461,898 | | |
Foreign currency, at value (cost—$0; $0; $0; $0; $2,009,675; $1,074,173; $29,206 and
$592,742, respectively) | | | 2,012,994 | | | | 1,070,352 | | | | 28,558 | | | | 568,597 | | |
Receivable for investments sold | | | 3,328,773 | | | | 515,427 | | | | 871,501 | | | | 4,098,486 | | |
Receivable for shares of beneficial interest sold | | | 1,133,194 | | | | 800,821 | | | | 258,847 | | | | 1,068,877 | | |
Receivable for dividends and interest | | | 1,286,386 | | | | 993,658 | | | | 238,771 | | | | 979,806 | | |
Swap agreements, at value2 | | | — | | | | — | | | | — | | | | 2,957,445 | | |
Receivable for variation margin on futures contracts | | | 65,952 | | | | — | | | | — | | | | 2,612,712 | | |
Due from broker | | | 21,983 | | | | — | | | | — | | | | 136,500 | | |
Unrealized appreciation on forward foreign currency contracts | | | 857,271 | | | | — | | | | — | | | | 16,723,318 | | |
Receivable for foreign tax reclaims | | | 705,871 | | | | — | | | | 5,580 | | | | 31,663 | | |
Other assets | | | 33,204 | | | | 20,673 | | | | 11,569 | | | | 29,380 | | |
Total assets | | | 961,309,850 | | | | 403,344,471 | | | | 127,631,721 | | | | 626,829,065 | | |
Liabilities: | |
Payable for investments purchased | | | 10,058,314 | | | | 1,175,366 | | | | 1,538,132 | | | | 2,883,971 | | |
Payable for cash collateral from securities loaned | | | 5,492,556 | | | | 34,204,798 | | | | 3,476,030 | | | | — | | |
Payable for shares of beneficial interest repurchased | | | 842,113 | | | | 420,652 | | | | 90,519 | | | | 779,950 | | |
Payable to affiliate | | | 710,934 | | | | 315,485 | | | | 31,188 | | | | 716,614 | | |
Payable to custodian | | | 226,869 | | | | 166,749 | | | | 23,980 | | | | 537,592 | | |
Payable for foreign withholding and foreign capital gains taxes | | | 124,032 | | | | 423,431 | | | | 63,123 | | | | 50,749 | | |
Unrealized depreciation on forward foreign currency contracts | | | 1,382,313 | | | | — | | | | — | | | | 15,822,220 | | |
Investments sold short, at value (proceeds—$0; $0; $0; $0; $0; $0; $0 and
$24,663,438, respectively) | | | — | | | | — | | | | — | | | | 25,548,677 | | |
Options and swaptions written, at value (premiums received $0; $0; $0; $0; $0; $0; $0 and
$11,552,387, respectively) | | | — | | | | — | | | | — | | | | 10,116,837 | | |
Payable for variation margin on futures contracts | | | — | | | | — | | | | — | | | | 3,832,750 | | |
Due to broker | | | — | | | | — | | | | — | | | | 9,733,489 | | |
Payable for variation margin on swap agreements2 | | | — | | | | — | | | | — | | | | 807 | | |
Swap agreements, at value2 | | | — | | | | — | | | | — | | | | 1,769,545 | | |
Payable for dividend and interest expense on investments sold short | | | — | | | | — | | | | — | | | | 2,763 | | |
Accrued expenses and other liabilities | | | 264,699 | | | | 266,171 | | | | 150,662 | | | | 223,533 | | |
Total liabilities | | | 19,101,830 | | | | 36,972,652 | | | | 5,373,634 | | | | 72,019,497 | | |
See accompanying notes to financial statements.
231
PACE Select Advisors Trust
Statement of assets and liabilities (concluded)
July 31, 2013
| | | PACE
Large Co
Value Equity
Investments | | PACE
Large Co
Growth Equity
Investments | | PACE
Small/Medium Co
Value Equity
Investments | | PACE
Small/Medium Co
Growth Equity
Investments | |
Net assets: | |
Beneficial interest shares of $0.001 par value (unlimited amount authorized) | | $ | 1,141,993,293 | | | $ | 861,866,534 | | | $ | 370,466,847 | | | $ | 321,141,336 | | |
Accumulated undistributed (distributions in excess of) net investment income | | | 8,400,806 | | | | 4,082,837 | | | | 1,862,609 | | | | 64,038 | | |
Accumulated net realized gain (loss) | | | (66,714,327 | ) | | | 66,816,049 | | | | 37,087,917 | | | | 43,789,880 | | |
Net unrealized appreciation (depreciation) | | | 235,889,207 | | | | 262,703,538 | | | | 77,142,613 | | | | 138,362,098 | | |
Net assets | | $ | 1,319,568,979 | | | $ | 1,195,468,958 | | | $ | 486,559,986 | | | $ | 503,357,352 | | |
Class A | |
Net assets | | $ | 151,582,762 | | | $ | 63,108,431 | | | $ | 31,930,215 | | | $ | 41,720,820 | | |
Shares outstanding | | | 6,726,907 | | | | 2,682,687 | | | | 1,439,268 | | | | 1,947,976 | | |
Net asset value per share | | $ | 22.53 | | | $ | 23.52 | | | $ | 22.19 | | | $ | 21.42 | | |
Maximum offering price per share | | $ | 23.84 | | | $ | 24.89 | | | $ | 23.48 | | | $ | 22.67 | | |
Class C | |
Net assets | | $ | 14,436,741 | | | $ | 4,032,556 | | | $ | 4,983,398 | | | $ | 4,037,541 | | |
Shares outstanding | | | 640,870 | | | | 189,441 | | | | 249,175 | | | | 212,290 | | |
Net asset value and offering price per share | | $ | 22.53 | | | $ | 21.29 | | | $ | 20.00 | | | $ | 19.02 | | |
Class Y | |
Net assets | | $ | 18,535,781 | | | $ | 14,814,457 | | | $ | 767,795 | | | $ | 587,614 | | |
Shares outstanding | | | 820,279 | | | | 615,838 | | | | 33,693 | | | | 26,304 | | |
Net asset value, offering price and redemption value per share1 | | $ | 22.60 | | | $ | 24.06 | | | $ | 22.79 | | | $ | 22.34 | | |
Class P | |
Net assets | | $ | 1,135,013,695 | | | $ | 1,113,513,514 | | | $ | 448,878,578 | | | $ | 457,011,377 | | |
Shares outstanding | | | 50,397,562 | | | | 46,500,919 | | | | 19,837,748 | | | | 20,654,654 | | |
Net asset value, offering price and redemption value per share1 | | $ | 22.52 | | | $ | 23.95 | | | $ | 22.63 | | | $ | 22.13 | | |
1 Assumes shares were held a sufficient period or are otherwise not subject to a redemption fee.
232
| | | PACE
International
Equity
Investments | | PACE
International
Emerging
Markets Equity
Investments | | PACE
Global
Real Estate
Securities
Investments | | PACE
Alternative
Strategies
Investments | |
Net assets: | |
Beneficial interest shares of $0.001 par value (unlimited amount authorized) | | $ | 1,105,996,243 | | | $ | 393,967,716 | | | $ | 140,552,409 | | | $ | 614,841,831 | | |
Accumulated undistributed (distributions in excess of) net investment income | | | 12,643,178 | | | | 2,082,021 | | | | (681,537 | ) | | | 8,236,335 | | |
Accumulated net realized gain (loss) | | | (275,938,812 | ) | | | (25,798,009 | ) | | | (28,127,291 | ) | | | (86,636,424 | ) | |
Net unrealized appreciation (depreciation) | | | 99,507,411 | | | | (3,879,909 | ) | | | 10,514,506 | | | | 18,367,826 | | |
Net assets | | $ | 942,208,020 | | | $ | 366,371,819 | | | $ | 122,258,087 | | | $ | 554,809,568 | | |
Class A | |
Net assets | | $ | 55,533,237 | | | $ | 16,809,830 | | | $ | 5,233,246 | | | $ | 53,727,720 | | |
Shares outstanding | | | 3,979,265 | | | | 1,367,760 | | | | 802,504 | | | | 5,262,156 | | |
Net asset value per share | | $ | 13.96 | | | $ | 12.29 | | | $ | 6.52 | | | $ | 10.21 | | |
Maximum offering price per share | | $ | 14.77 | | | $ | 13.01 | | | $ | 6.90 | | | $ | 10.80 | | |
Class C | |
Net assets | | $ | 2,746,332 | | | $ | 2,201,290 | | | $ | 222,390 | | | $ | 4,826,649 | | |
Shares outstanding | | | 200,701 | | | | 191,743 | | | | 34,334 | | | | 487,689 | | |
Net asset value and offering price per share | | $ | 13.68 | | | $ | 11.48 | | | $ | 6.48 | | | $ | 9.90 | | |
Class Y | |
Net assets | | $ | 20,864,993 | | | $ | 12,835,239 | | | $ | 293,517 | | | $ | 2,731,588 | | |
Shares outstanding | | | 1,496,217 | | | | 1,024,749 | | | | 44,801 | | | | 265,329 | | |
Net asset value, offering price and redemption value per share1 | | $ | 13.95 | | | $ | 12.53 | | | $ | 6.55 | | | $ | 10.30 | | |
Class P | |
Net assets | | $ | 863,063,458 | | | $ | 334,525,460 | | | $ | 116,508,934 | | | $ | 493,523,611 | | |
Shares outstanding | | | 62,015,472 | | | | 26,827,442 | | | | 17,832,994 | | | | 48,060,046 | | |
Net asset value, offering price and redemption value per share1 | | $ | 13.92 | | | $ | 12.47 | | | $ | 6.53 | | | $ | 10.27 | | |
See accompanying notes to financial statements.
233
PACE Select Advisors Trust
Statement of operations
For the year ended July 31, 2013
| | | PACE
Money Market
Investments | | PACE
Government
Securities
Fixed Income
Investments | | PACE
Intermediate
Fixed Income
Investments | | PACE
Strategic
Fixed Income
Investments | |
Investment income: | |
Dividends | | $ | — | | | $ | — | | | $ | 10,034 | | | $ | 480,000 | | |
Interest (net of foreign withholding taxes of $0; $0; $0; $0; $0; $5,417 and $0,
respectively) | | | 661,630 | | | | 11,012,676 | | | | 8,720,356 | | | | 34,650,740 | | |
Securities lending income (includes $36; $0; $2,051; $1,763; $0; $947 and $17,945,
respectively earned from an affiliated entity) | | | 45 | | | | — | | | | 19,170 | | | | 5,049 | | |
| | | | 661,675 | | | | 11,012,676 | | | | 8,749,560 | | | | 35,135,789 | | |
Expenses: | |
Investment management and administration fees | | | 1,139,856 | | | | 3,738,414 | | | | 2,419,164 | | | | 5,553,129 | | |
Service fees–Class A | | | — | | | | 184,926 | | | | 85,142 | | | | 204,183 | | |
Service and distribution fees–Class C | | | — | | | | 143,184 | | | | 22,373 | | | | 174,449 | | |
Transfer agency and related services fees | | | 1,373,101 | | | | 829,729 | | | | 458,670 | | | | 1,017,064 | | |
Reports and notices to shareholders | | | 130,301 | | | | 54,211 | | | | 30,799 | | | | 74,324 | | |
Professional fees | | | 99,283 | | | | 173,717 | | | | 143,378 | | | | 162,083 | | |
State registration fees | | | 41,862 | | | | 63,591 | | | | 58,813 | | | | 73,052 | | |
Custody and accounting fees | | | 29,434 | | | | 206,907 | | | | 204,662 | | | | 478,401 | | |
Trustees' fees | | | 19,342 | | | | 22,550 | | | | 20,878 | | | | 26,257 | | |
Insurance expense | | | 12,887 | | | | 19,368 | | | | 14,570 | | | | 27,778 | | |
Interest expense | | | — | | | | — | | | | 12,824 | | | | 46,540 | | |
Other expenses | | | 26,228 | | | | 47,322 | | | | 22,266 | | | | 28,223 | | |
| | | | 2,872,294 | | | | 5,483,919 | | | | 3,493,539 | | | | 7,865,483 | | |
Fee waivers and/or expense reimbursements | | | (2,243,226 | ) | | | (674,055 | ) | | | (254,708 | ) | | | (5,086 | ) | |
Recoupment of fees waived or expenses previously reimbursed | | | — | | | | — | | | | — | | | | 75,594 | | |
Net expenses | | | 629,068 | | | | 4,809,864 | | | | 3,238,831 | | | | 7,935,991 | | |
Net investment income | | | 32,607 | | | | 6,202,812 | | | | 5,510,729 | | | | 27,199,798 | | |
Net realized and unrealized gains (losses) from investment activities: | |
Net realized gains (losses) from: | |
Investments | | | 42 | | | | (11,911,392 | ) | | | 1,617,789 | | | | 14,066,088 | | |
Futures | | | — | | | | — | | | | 704,264 | | | | 13,089,342 | | |
Options and swaptions written | | | — | | | | — | | | | (63,130 | ) | | | 1,860,995 | | |
Investments sold short | | | — | | | | (3,945 | ) | | | — | | | | 781 | | |
Swap agreements | | | — | | | | — | | | | 733,707 | | | | 6,831,777 | | |
Forward foreign currency contracts | | | — | | | | — | | | | 226,214 | | | | (514,340 | ) | |
Foreign currency transactions | | | — | | | | — | | | | (76,804 | ) | | | 111,347 | | |
Net realized gain (loss) | | | 42 | | | | (11,915,337 | ) | | | 3,142,040 | | | | 35,445,990 | | |
Net change in unrealized appreciation/depreciation of: | |
Investments | | | — | | | | (7,087,309 | ) | | | (13,311,570 | ) | | | (65,727,354 | ) | |
Futures | | | — | | | | — | | | | 472,780 | | | | 6,666 | | |
Options and swaptions written | | | — | | | | — | | | | (14,644 | ) | | | (1,584,410 | ) | |
Investments sold short | | | — | | | | 14,489 | | | | (11,343 | ) | | | 67,774 | | |
Swap agreements | | | — | | | | — | | | | 933,472 | | | | (21,097,044 | ) | |
Forward foreign currency contracts | | | — | | | | — | | | | 185,893 | | | | 1,639,006 | | |
Other assets and liabilities denominated in foreign currency | | | — | | | | — | | | | (7,181 | ) | | | (107,646 | ) | |
Net change in unrealized appreciation/depreciation | | | — | | | | (7,072,820 | ) | | | (11,752,593 | ) | | | (86,803,008 | ) | |
Net realized and unrealized gain (loss) from investment activities | | | 42 | | | | (18,988,157 | ) | | | (8,610,553 | ) | | | (51,357,018 | ) | |
Net increase (decrease) in net assets resulting from operations | | $ | 32,649 | | | $ | (12,785,345 | ) | | $ | (3,099,824 | ) | | $ | (24,157,220 | ) | |
234
| | | PACE
Municipal
Fixed Income
Investments | | PACE
International
Fixed Income
Investments | | PACE
High Yield
Investments | |
Investment income: | |
Dividends | | $ | — | | | $ | — | | | $ | 154,460 | | |
Interest (net of foreign withholding taxes of $0; $0; $0; $0; $0; $5,417 and $0,
respectively) | | | 11,153,102 | | | | 15,406,301 | | | | 24,407,758 | | |
Securities lending income (includes $36; $0; $2,051; $1,763; $0; $947 and $17,945,
respectively earned from an affiliated entity) | | | — | | | | 14,414 | | | | 263,605 | | |
| | | | 11,153,102 | | | | 15,420,715 | | | | 24,825,823 | | |
Expenses: | |
Investment management and administration fees | | | 1,782,643 | | | | 4,008,377 | | | | 2,709,396 | | |
Service fees–Class A | | | 172,529 | | | | 198,054 | | | | 59,923 | | |
Service and distribution fees–Class C | | | 99,512 | | | | 49,844 | | | | 43,997 | | |
Transfer agency and related services fees | | | 166,494 | | | | 971,113 | | | | 574,807 | | |
Reports and notices to shareholders | | | 18,236 | | | | 73,628 | | | | 35,184 | | |
Professional fees | | | 125,824 | | | | 164,805 | | | | 145,377 | | |
State registration fees | | | 54,550 | | | | 61,386 | | | | 59,067 | | |
Custody and accounting fees | | | 113,047 | | | | 492,786 | | | | 147,651 | | |
Trustees' fees | | | 19,301 | | | | 21,667 | | | | 19,419 | | |
Insurance expense | | | 9,998 | | | | 16,858 | | | | 8,922 | | |
Interest expense | | | — | | | | 1,585 | | | | — | | |
Other expenses | | | 24,294 | | | | 27,659 | | | | 22,837 | | |
| | | | 2,586,428 | | | | 6,087,762 | | | | 3,826,580 | | |
Fee waivers and/or expense reimbursements | | | (127,777 | ) | | | (513,375 | ) | | | (172,704 | ) | |
Recoupment of fees waived or expenses previously reimbursed | | | — | | | | — | | | | — | | |
Net expenses | | | 2,458,651 | | | | 5,574,387 | | | | 3,653,876 | | |
Net investment income | | | 8,694,451 | | | | 9,846,328 | | | | 21,171,947 | | |
Net realized and unrealized gains (losses) from investment activities: | |
Net realized gains (losses) from: | |
Investments | | | 2,793,293 | | | | 3,970,529 | | | | 1,375,936 | | |
Futures | | | — | | | | (2,270,587 | ) | | | (243,812 | ) | |
Options and swaptions written | | | — | | | | — | | | | — | | |
Investments sold short | | | — | | | | — | | | | — | | |
Swap agreements | | | — | | | | — | | | | — | | |
Forward foreign currency contracts | | | — | | | | (11,626,735 | ) | | | (3,028,999 | ) | |
Foreign currency transactions | | | — | | | | (485,611 | ) | | | (14,450 | ) | |
Net realized gain (loss) | | | 2,793,293 | | | | (10,412,404 | ) | | | (1,911,325 | ) | |
Net change in unrealized appreciation/depreciation of: | |
Investments | | | (19,944,620 | ) | | | (21,705,370 | ) | | | 9,540,545 | | |
Futures | | | — | | | | 3,672,554 | | | | 1,052,388 | | |
Options and swaptions written | | | — | | | | — | | | | — | | |
Investments sold short | | | — | | | | — | | | | — | | |
Swap agreements | | | — | | | | — | | | | — | | |
Forward foreign currency contracts | | | — | | | | (6,868,711 | ) | | | 1,223,131 | | |
Other assets and liabilities denominated in foreign currency | | | — | | | | 141,064 | | | | 85,309 | | |
Net change in unrealized appreciation/depreciation | | | (19,944,620 | ) | | | (24,760,463 | ) | | | 11,901,373 | | |
Net realized and unrealized gain (loss) from investment activities | | | (17,151,327 | ) | | | (35,172,867 | ) | | | 9,990,048 | | |
Net increase (decrease) in net assets resulting from operations | | $ | (8,456,876 | ) | | $ | (25,326,539 | ) | | $ | 31,161,995 | | |
See accompanying notes to financial statements.
235
PACE Select Advisors Trust
Statement of operations (concluded)
For the year ended July 31, 2013
| | | PACE
Large Co
Value Equity
Investments | | PACE
Large Co
Growth Equity
Investments | | PACE
Small/Medium Co
Value Equity
Investments | | PACE
Small/Medium Co
Growth Equity
Investments | |
Investment income: | |
Dividends (net of foreign withholding taxes of $232,876; $91,156; $614; $9,726;
$2,038,191; $891,474; $204,263 and $227,994, respectively) | | $ | 28,951,113 | | | $ | 18,652,038 | | | $ | 8,424,063 | | | $ | 3,124,897 | | |
Interest | | | 2,149 | | | | 3,232 | | | | 1,549 | | | | 1,115 | | |
Securities lending income (includes $2,698; $3,585; $3,634; $14,676; $14,319;
$4,456; $2,267 and $0, respectively earned from an affiliated entity) | | | 80,860 | | | | 100,527 | | | | 102,224 | | | | 726,800 | | |
| | | | 29,034,122 | | | | 18,755,797 | | | | 8,527,836 | | | | 3,852,812 | | |
Expenses: | |
Investment management and administration fees | | | 9,362,027 | | | | 9,146,658 | | | | 3,498,765 | | | | 3,691,304 | | |
Service fees–Class A | | | 350,514 | | | | 153,782 | | | | 74,134 | | | | 96,654 | | |
Service and distribution fees–Class C | | | 131,458 | | | | 37,406 | | | | 46,168 | | | | 35,856 | | |
Transfer agency and related services fees | | | 1,165,316 | | | | 1,091,639 | | | | 1,009,591 | | | | 1,015,029 | | |
Custody and accounting fees | | | 490,812 | | | | 457,310 | | | | 170,988 | | | | 180,411 | | |
Professional fees | | | 157,309 | | | | 142,166 | | | | 126,891 | | | | 127,762 | | |
Reports and notices to shareholders | | | 86,297 | | | | 107,517 | | | | 79,259 | | | | 60,238 | | |
State registration fees | | | 68,315 | | | | 65,351 | | | | 56,391 | | | | 56,814 | | |
Insurance expense | | | 35,980 | | | | 34,484 | | | | 12,274 | | | | 13,384 | | |
Trustees' fees | | | 29,745 | | | | 28,836 | | | | 20,559 | | | | 20,885 | | |
Interest expense | | | 5,192 | | | | 121 | | | | 130 | | | | 1,055 | | |
Dividend expense, interest expense and other borrowing costs for investments sold short | | | — | | | | — | | | | — | | | | — | | |
Other expenses | | | 39,386 | | | | 40,132 | | | | 27,560 | | | | 26,929 | | |
| | | | 11,922,351 | | | | 11,305,402 | | | | 5,122,710 | | | | 5,326,321 | | |
Fee waivers and/or expense reimbursements | | | (22,487 | ) | | | — | | | | (182 | ) | | | (28,069 | ) | |
Recoupment of fees waived or expenses previously reimbursed | | | — | | | | 237 | | | | 25,353 | | | | — | | |
Net expenses | | | 11,899,864 | | | | 11,305,639 | | | | 5,147,881 | | | | 5,298,252 | | |
Net investment income (loss) | | | 17,134,258 | | | | 7,450,158 | | | | 3,379,955 | | | | (1,445,440 | ) | |
Net realized and unrealized gains (losses) from investment activities: | |
Net realized gains (losses) from: | |
Investments (net of foreign tax expense of $0; $0; $0; $0; $18,095; $390,753;
$0 and $0, respectively) | | | 167,042,721 | | | | 148,429,235 | | | | 64,525,402 | | | | 55,506,406 | | |
Futures | | | — | | | | — | | | | — | | | | — | | |
Options and swaptions written | | | — | | | | — | | | | — | | | | — | | |
Investments sold short | | | — | | | | — | | | | — | | | | — | | |
Swap agreements | | | — | | | | — | | | | — | | | | — | | |
Forward foreign currency contracts | | | — | | | | — | | | | — | | | | — | | |
Foreign currency transactions | | | — | | | | (799 | ) | | | 8 | | | | — | | |
Net realized gain (loss) | | | 167,042,721 | | | | 148,428,436 | | | | 64,525,410 | | | | 55,506,406 | | |
Net change in unrealized appreciation/depreciation of: | |
Investments (net of foreign tax expense of $0; $0; $0; $0; $0; $78,817;
$0 and $0, respectively) | | | 172,907,385 | | | | 79,047,355 | | | | 61,853,898 | | | | 77,571,558 | | |
Futures | | | — | | | | — | | | | — | | | | — | | |
Options and swaptions written | | | — | | | | — | | | | — | | | | — | | |
Investments sold short | | | — | | | | — | | | | — | | | | — | | |
Swap agreements | | | — | | | | — | | | | — | | | | — | | |
Forward foreign currency contracts | | | — | | | | — | | | | — | | | | — | | |
Other assets and liabilities denominated in foreign currency | | | — | | | | — | | | | — | | | | — | | |
Net change in unrealized appreciation/depreciation | | | 172,907,385 | | | | 79,047,355 | | | | 61,853,898 | | | | 77,571,558 | | |
Net realized and unrealized gain (loss) from investment activities | | | 339,950,106 | | | | 227,475,791 | | | | 126,379,308 | | | | 133,077,964 | | |
Net increase in net assets resulting from operations | | $ | 357,084,364 | | | $ | 234,925,949 | | | $ | 129,759,263 | | | $ | 131,632,524 | | |
236
| | | PACE
International
Equity
Investments | | PACE
International
Emerging
Markets Equity
Investments | | PACE
Global
Real Estate
Securities
Investments | | PACE
Alternative
Strategies
Investments | |
Investment income: | |
Dividends (net of foreign withholding taxes of $232,876; $91,156; $614; $9,726;
$2,038,191; $891,474; $204,263 and $227,994, respectively) | | $ | 28,138,049 | | | $ | 7,614,909 | | | $ | 3,306,173 | | | $ | 4,670,027 | | |
Interest | | | 1,159 | | | | 273 | | | | 200 | | | | 3,233,298 | | |
Securities lending income (includes $2,698; $3,585; $3,634; $14,676; $14,319;
$4,456; $2,267 and $0, respectively earned from an affiliated entity) | | | 377,777 | | | | 60,706 | | | | 18,224 | | | | — | | |
| | | | 28,516,985 | | | | 7,675,888 | | | | 3,324,597 | | | | 7,903,325 | | |
Expenses: | |
Investment management and administration fees | | | 7,717,435 | | | | 3,273,224 | | | | 995,487 | | | | 7,392,128 | | |
Service fees–Class A | | | 136,333 | | | | 46,089 | | | | 13,117 | | | | 114,531 | | |
Service and distribution fees–Class C | | | 26,896 | | | | 24,631 | | | | 2,156 | | | | 49,309 | | |
Transfer agency and related services fees | | | 1,039,091 | | | | 914,962 | | | | 518,506 | | | | 475,194 | | |
Custody and accounting fees | | | 841,674 | | | | 550,497 | | | | 93,327 | | | | 395,073 | | |
Professional fees | | | 310,955 | | | | 194,363 | | | | 140,871 | | | | 326,756 | | |
Reports and notices to shareholders | | | 67,628 | | | | 86,187 | | | | 32,385 | | | | 62,247 | | |
State registration fees | | | 65,351 | | | | 54,347 | | | | 50,508 | | | | 64,087 | | |
Insurance expense | | | 25,093 | | | | 8,242 | | | | 3,278 | | | | 16,114 | | |
Trustees' fees | | | 25,228 | | | | 18,835 | | | | 17,116 | | | | 26,593 | | |
Interest expense | | | — | | | | 413 | | | | — | | | | 9,197 | | |
Dividend expense, interest expense and other borrowing costs for investments sold short | | | — | | | | — | | | | — | | | | 408,004 | | |
Other expenses | | | 43,772 | | | | 43,381 | | | | 29,195 | | | | 41,027 | | |
| | | | 10,299,456 | | | | 5,215,171 | | | | 1,895,946 | | | | 9,380,260 | | |
Fee waivers and/or expense reimbursements | | | (7,803 | ) | | | (231,019 | ) | | | (387,440 | ) | | | (178,305 | ) | |
Recoupment of fees waived or expenses previously reimbursed | | | — | | | | — | | | | — | | | | 5,526 | | |
Net expenses | | | 10,291,653 | | | | 4,984,152 | | | | 1,508,506 | | | | 9,207,481 | | |
Net investment income (loss) | | | 18,225,332 | | | | 2,691,736 | | | | 1,816,091 | | | | (1,304,156 | ) | |
Net realized and unrealized gains (losses) from investment activities: | |
Net realized gains (losses) from: | |
Investments (net of foreign tax expense of $0; $0; $0; $0; $18,095; $390,753;
$0 and $0, respectively) | | | 27,472,067 | | | | (15,111,960 | ) | | | 18,804,254 | | | | 10,284,449 | | |
Futures | | | 1,064,260 | | | | — | | | | — | | | | 3,550,652 | | |
Options and swaptions written | | | — | | | | — | | | | — | | | | 11,733,049 | | |
Investments sold short | | | — | | | | — | | | | — | | | | (5,367,874 | ) | |
Swap agreements | | | — | | | | — | | | | — | | | | 2,727,436 | | |
Forward foreign currency contracts | | | 1,293,807 | | | | 1,148 | | | | — | | | | 3,398,100 | | |
Foreign currency transactions | | | (323,907 | ) | | | (398,677 | ) | | | (99,882 | ) | | | (140,585 | ) | |
Net realized gain (loss) | | | 29,506,227 | | | | (15,509,489 | ) | | | 18,704,372 | | | | 26,185,227 | | |
Net change in unrealized appreciation/depreciation of: | |
Investments (net of foreign tax expense of $0; $0; $0; $0; $0; $78,817;
$0 and $0, respectively) | | | 128,563,093 | | | | 13,483,440 | | | | (5,334,960 | ) | | | 17,114,598 | | |
Futures | | | (247,833 | ) | | | — | | | | — | | | | (3,285,962 | ) | |
Options and swaptions written | | | — | | | | — | | | | — | | | | 4,010,065 | | |
Investments sold short | | | — | | | | — | | | | — | | | | (3,412,252 | ) | |
Swap agreements | | | — | | | | — | | | | — | | | | 5,281,166 | | |
Forward foreign currency contracts | | | (1,284,004 | ) | | | — | | | | — | | | | 5,183,510 | | |
Other assets and liabilities denominated in foreign currency | | | (14,533 | ) | | | 288,360 | | | | (9,518 | ) | | | 9,267 | | |
Net change in unrealized appreciation/depreciation | | | 127,016,723 | | | | 13,771,800 | | | | (5,344,478 | ) | | | 24,900,392 | | |
Net realized and unrealized gain (loss) from investment activities | | | 156,522,950 | | | | (1,737,689 | ) | | | 13,359,894 | | | | 51,085,619 | | |
Net increase in net assets resulting from operations | | $ | 174,748,282 | | | $ | 954,047 | | | $ | 15,175,985 | | | $ | 49,781,463 | | |
See accompanying notes to financial statements.
237
PACE Select Advisors Trust
Statement of changes in net assets
| | | PACE
Money Market
Investments | | PACE
Government Securities
Fixed Income Investments | | PACE
Intermediate Fixed Income
Investments | |
| | | Years ended July 31, | | Years ended July 31, | | Years ended July 31, | |
| | | 2013 | | 2012 | | 2013 | | 2012 | | 2013 | | 2012 | |
From operations: | |
Net investment income | | $ | 32,607 | | | $ | 41,391 | | | $ | 6,202,812 | | | $ | 11,503,237 | | | $ | 5,510,729 | | | $ | 8,987,000 | | |
Net realized gains (losses) | | | 42 | | | | 496 | | | | (11,915,337 | ) | | | 19,752,993 | | | | 3,142,040 | | | | 8,013,394 | | |
Net change in unrealized appreciation/depreciation | | | — | | | | — | | | | (7,072,820 | ) | | | (4,222,902 | ) | | | (11,752,593 | ) | | | 2,533,868 | | |
Net increase (decrease) in net assets resulting from operations | | | 32,649 | | | | 41,887 | | | | (12,785,345 | ) | | | 27,033,328 | | | | (3,099,824 | ) | | | 19,534,262 | | |
Dividends and distributions to shareholders from: | |
Net investment income–Class A | | | — | | | | — | | | | (1,718,895 | ) | | | (2,036,547 | ) | | | (319,974 | ) | | | (678,182 | ) | |
Net investment income–Class B | | | — | | | | — | | | | — | | | | (858 | ) | | | — | | | | (414 | ) | |
Net investment income–Class C | | | — | | | | — | | | | (347,567 | ) | | | (436,750 | ) | | | (13,195 | ) | | | (43,908 | ) | |
Net investment income–Class Y | | | — | | | | — | | | | (1,574,730 | ) | | | (1,601,468 | ) | | | (10,111 | ) | | | (22,145 | ) | |
Net investment income–Class P | | | (32,607 | ) | | | (41,391 | ) | | | (11,699,549 | ) | | | (12,784,254 | ) | | | (4,999,341 | ) | | | (8,578,959 | ) | |
Net realized gains–Class A | | | — | | | | — | | | | (1,394,346 | ) | | | (389,455 | ) | | | — | | | | — | | |
Net realized gains–Class B | | | — | | | | — | | | | — | | | | (285 | ) | | | — | | | | — | | |
Net realized gains–Class C | | | — | | | | — | | | | (361,507 | ) | | | (105,626 | ) | | | — | | | | — | | |
Net realized gains–Class Y | | | — | | | | — | | | | (1,154,929 | ) | | | (282,582 | ) | | | — | | | | — | | |
Net realized gains–Class P | | | — | | | | — | | | | (8,342,666 | ) | | | (2,266,496 | ) | | | — | | | | — | | |
| | | | (32,607 | ) | | �� | (41,391 | ) | | | (26,594,189 | ) | | | (19,904,321 | ) | | | (5,342,621 | ) | | | (9,323,608 | ) | |
From beneficial interest transactions: | |
Net proceeds from shares sold | | | 350,456,561 | | | | 494,925,726 | | | | 172,704,074 | | | | 122,376,857 | | | | 162,546,504 | | | | 94,555,070 | | |
Cost of shares repurchased | | | (377,723,554 | ) | | | (523,702,775 | ) | | | (184,404,522 | ) | | | (140,954,155 | ) | | | (171,188,613 | ) | | | (106,204,595 | ) | |
Proceeds from dividends reinvested | | | 17,850 | | | | 23,969 | | | | 24,671,779 | | | | 18,515,115 | | | | 4,891,984 | | | | 8,578,398 | | |
Net increase (decrease) in net assets from beneficial interest
transactions | | | (27,249,143 | ) | | | (28,753,080 | ) | | | 12,971,331 | | | | (62,183 | ) | | | (3,750,125 | ) | | | (3,071,127 | ) | |
Redemption fees | | | — | | | | — | | | | 54,968 | | | | 26,868 | | | | 53,602 | | | | 40,317 | | |
Net increase (decrease) in net assets | | | (27,249,101 | ) | | | (28,752,584 | ) | | | (26,353,235 | ) | | | 7,093,692 | | | | (12,138,968 | ) | | | 7,179,844 | | |
Net assets: | |
Beginning of year | | | 337,091,045 | | | | 365,843,629 | | | | 614,743,280 | | | | 607,649,588 | | | | 462,747,214 | | | | 455,567,370 | | |
End of year | | $ | 309,841,944 | | | $ | 337,091,045 | | | $ | 588,390,045 | | | $ | 614,743,280 | | | $ | 450,608,246 | | | $ | 462,747,214 | | |
Accumulated undistributed (distributions in excess of) net investment income | | $ | — | | | $ | — | | | $ | 275,474 | | | $ | 299,480 | | | $ | 1,328,417 | | | $ | 1,007,427 | | |
238
| | | PACE
Strategic Fixed Income
Investments | | PACE
Municipal Fixed Income
Investments | |
| | | Years ended July 31, | | Years ended July 31, | |
| | | 2013 | | 2012 | | 2013 | | 2012 | |
From operations: | |
Net investment income | | $ | 27,199,798 | | | $ | 26,479,278 | | | $ | 8,694,451 | | | $ | 9,257,800 | | |
Net realized gains (losses) | | | 35,445,990 | | | | 37,505,702 | | | | 2,793,293 | | | | 3,146,535 | | |
Net change in unrealized appreciation/depreciation | | | (86,803,008 | ) | | | 26,597,744 | | | | (19,944,620 | ) | | | 10,505,028 | | |
Net increase (decrease) in net assets resulting from operations | | | (24,157,220 | ) | | | 90,582,724 | | | | (8,456,876 | ) | | | 22,909,363 | | |
Dividends and distributions to shareholders from: | |
Net investment income–Class A | | | (2,312,004 | ) | | | (2,600,716 | ) | | | (1,679,750 | ) | | | (2,010,084 | ) | |
Net investment income–Class B | | | — | | | | (3,583 | ) | | | — | | | | (542 | ) | |
Net investment income–Class C | | | (548,567 | ) | | | (497,631 | ) | | | (256,306 | ) | | | (318,886 | ) | |
Net investment income–Class Y | | | (188,996 | ) | | | (147,864 | ) | | | (2,994 | ) | | | (3,582 | ) | |
Net investment income–Class P | | | (25,143,925 | ) | | | (28,400,664 | ) | | | (6,755,976 | ) | | | (6,924,775 | ) | |
Net realized gains–Class A | | | (1,859,515 | ) | | | (1,340,754 | ) | | | (315,355 | ) | | | — | | |
Net realized gains–Class B | | | — | | | | (3,405 | ) | | | — | | | | — | | |
Net realized gains–Class C | | | (518,187 | ) | | | (287,757 | ) | | | (61,126 | ) | | | — | | |
Net realized gains–Class Y | | | (147,902 | ) | | | (69,829 | ) | | | (549 | ) | | | — | | |
Net realized gains–Class P | | | (17,500,726 | ) | | | (13,831,800 | ) | | | (1,038,308 | ) | | | — | | |
| | | | (48,219,822 | ) | | | (47,184,003 | ) | | | (10,110,364 | ) | | | (9,257,869 | ) | |
From beneficial interest transactions: | |
Net proceeds from shares sold | | | 260,174,318 | | | | 179,327,499 | | | | 136,283,919 | | | | 43,632,620 | | |
Cost of shares repurchased | | | (215,719,231 | ) | | | (177,314,844 | ) | | | (65,939,182 | ) | | | (65,317,529 | ) | |
Proceeds from dividends reinvested | | | 44,765,797 | | | | 44,340,892 | | | | 8,527,192 | | | | 7,776,825 | | |
Net increase (decrease) in net assets from beneficial interest
transactions | | | 89,220,884 | | | | 46,353,547 | | | | 78,871,929 | | | | (13,908,084 | ) | |
Redemption fees | | | 56,084 | | | | 48,013 | | | | 36,761 | | | | 14,289 | | |
Net increase (decrease) in net assets | | | 16,899,926 | | | | 89,800,281 | | | | 60,341,450 | | | | (242,301 | ) | |
Net assets: | |
Beginning of year | | | 908,499,682 | | | | 818,699,401 | | | | 316,454,602 | | | | 316,696,903 | | |
End of year | | $ | 925,399,608 | | | $ | 908,499,682 | | | $ | 376,796,052 | | | $ | 316,454,602 | | |
Accumulated undistributed (distributions in excess of) net investment income | | $ | 7,614,796 | | | $ | 4,552,458 | | | $ | — | | | $ | — | | |
See accompanying notes to financial statements.
239
PACE Select Advisors Trust
Statement of changes in net assets (continued)
| | | PACE
International Fixed Income
Investments | | PACE
High Yield
Investments | | PACE
Large Co Value Equity
Investments | |
| | | Years ended July 31, | | Years ended July 31, | | Years ended July 31, | |
| | | 2013 | | 2012 | | 2013 | | 2012 | | 2013 | | 2012 | |
From operations: | |
Net investment income | | $ | 9,846,328 | | | $ | 12,483,094 | | | $ | 21,171,947 | | | $ | 19,722,510 | | | $ | 17,134,258 | | | $ | 18,362,612 | | |
Net realized gains (losses) | | | (10,412,404 | ) | | | (1,101,611 | ) | | | (1,911,325 | ) | | | 5,293,799 | | | | 167,042,721 | | | | 45,563,978 | | |
Net change in unrealized appreciation/depreciation | | | (24,760,463 | ) | | | (24,175,285 | ) | | | 11,901,373 | | | | (8,212,448 | ) | | | 172,907,385 | | | | (36,563,090 | ) | |
Net increase (decrease) in net assets resulting from operations | | | (25,326,539 | ) | | | (12,793,802 | ) | | | 31,161,995 | | | | 16,803,861 | | | | 357,084,364 | | | | 27,363,500 | | |
Dividends and distributions to shareholders from: | |
Net investment income–Class A | | | (1,138,791 | ) | | | (6,155,271 | ) | | | (1,421,528 | ) | | | (1,398,278 | ) | | | (1,715,660 | ) | | | (1,741,145 | ) | |
Net investment income–Class B | | | — | | | | (512 | ) | | | — | | | | — | | | | — | | | | (133 | ) | |
Net investment income–Class C | | | (81,329 | ) | | | (465,096 | ) | | | (321,743 | ) | | | (293,781 | ) | | | (58,764 | ) | | | (53,456 | ) | |
Net investment income–Class Y | | | (72,062 | ) | | | (346,486 | ) | | | (66,755 | ) | | | (33,399 | ) | | | (240,829 | ) | | | (241,462 | ) | |
Net investment income–Class P | | | (6,391,654 | ) | | | (30,504,876 | ) | | | (18,981,394 | ) | | | (17,987,293 | ) | | | (15,927,508 | ) | | | (15,109,729 | ) | |
Net realized gains–Class A | | | — | | | | — | | | | (333,992 | ) | | | (197,101 | ) | | | — | | | | — | | |
Net realized gains–Class C | | | — | | | | — | | | | (80,332 | ) | | | (45,733 | ) | | | — | | | | — | | |
Net realized gains–Class Y | | | — | | | | — | | | | (14,168 | ) | | | (4,616 | ) | | | — | | | | — | | |
Net realized gains–Class P | | | — | | | | — | | | | (4,036,170 | ) | | | (2,579,219 | ) | | | — | | | | — | | |
Return of capital–Class A | | | (1,023,864 | ) | | | — | | | | (27,894 | ) | | | — | | | | — | | | | — | | |
Return of capital–Class C | | | (68,111 | ) | | | — | | | | (6,125 | ) | | | — | | | | — | | | | — | | |
Return of capital–Class Y | | | (73,857 | ) | | | — | | | | (1,614 | ) | | | — | | | | — | | | | — | | |
Return of capital–Class P | | | (6,775,328 | ) | | | — | | | | (395,975 | ) | | | — | | | | — | | | | — | | |
| | | | (15,624,996 | ) | | | (37,472,241 | ) | | | (25,687,690 | ) | | | (22,539,420 | ) | | | (17,942,761 | ) | | | (17,145,925 | ) | |
From beneficial interest transactions: | |
Net proceeds from shares sold | | | 156,802,544 | | | | 69,144,496 | | | | 157,057,758 | | | | 71,379,724 | | | | 150,537,298 | | | | 136,886,464 | | |
Cost of shares repurchased | | | (108,693,581 | ) | | | (104,498,744 | ) | | | (98,356,565 | ) | | | (64,491,912 | ) | | | (339,465,707 | ) | | | (210,843,891 | ) | |
Proceeds from dividends reinvested | | | 14,421,847 | | | | 34,540,470 | | | | 23,918,169 | | | | 21,066,129 | | | | 17,003,690 | | | | 16,277,750 | | |
Net increase (decrease) in net assets from beneficial interest
transactions | | | 62,530,810 | | | | (813,778 | ) | | | 82,619,362 | | | | 27,953,941 | | | | (171,924,719 | ) | | | (57,679,677 | ) | |
Redemption fees | | | 27,787 | | | | 16,643 | | | | 31,407 | | | | 18,468 | | | | 30,063 | | | | 23,925 | | |
Net increase (decrease) in net assets | | | 21,607,062 | | | | (51,063,178 | ) | | | 88,125,074 | | | | 22,236,850 | | | | 167,246,947 | | | | (47,438,177 | ) | |
Net assets: | |
Beginning of year | | | 526,598,602 | | | | 577,661,780 | | | | 300,160,455 | | | | 277,923,605 | | | | 1,152,322,032 | | | | 1,199,760,209 | | |
End of year | | $ | 548,205,664 | | | $ | 526,598,602 | | | $ | 388,285,529 | | | $ | 300,160,455 | | | $ | 1,319,568,979 | | | $ | 1,152,322,032 | | |
Accumulated undistributed (distributions in excess of) net investment income | | $ | (17,359,961 | ) | | $ | (4,314,633 | ) | | $ | — | | | $ | — | | | $ | 8,400,806 | | | $ | 9,215,754 | | |
240
| | | PACE
Large Co Growth Equity
Investments | | PACE
Small/Medium Co Value
Equity Investments | |
| | | Years ended July 31, | | Years ended July 31, | |
| | | 2013 | | 2012 | | 2013 | | 2012 | |
From operations: | |
Net investment income | | $ | 7,450,158 | | | $ | 2,458,957 | | | $ | 3,379,955 | | | $ | 1,342,991 | | |
Net realized gains (losses) | | | 148,428,436 | | | | 77,525,004 | | | | 64,525,410 | | | | 13,350,166 | | |
Net change in unrealized appreciation/depreciation | | | 79,047,355 | | | | (33,725,864 | ) | | | 61,853,898 | | | | (26,247,454 | ) | |
Net increase (decrease) in net assets resulting from operations | | | 234,925,949 | | | | 46,258,097 | | | | 129,759,263 | | | | (11,554,297 | ) | |
Dividends and distributions to shareholders from: | |
Net investment income–Class A | | | (104,343 | ) | | | — | | | | (146,859 | ) | | | — | | |
Net investment income–Class B | | | — | | | | — | | | | — | | | | — | | |
Net investment income–Class C | | | — | | | | — | | | | — | | | | — | | |
Net investment income–Class Y | | | (68,046 | ) | | | (27,666 | ) | | | (3,299 | ) | | | (214 | ) | |
Net investment income–Class P | | | (5,649,791 | ) | | | (2,409,749 | ) | | | (2,622,888 | ) | | | (71,538 | ) | |
Net realized gains–Class A | | | — | | | | — | | | | — | | | | — | | |
Net realized gains–Class C | | | — | | | | — | | | | — | | | | — | | |
Net realized gains–Class Y | | | — | | | | — | | | | — | | | | — | | |
Net realized gains–Class P | | | — | | | | — | | | | — | | | | — | | |
Return of capital–Class A | | | — | | | | — | | | | — | | | | — | | |
Return of capital–Class C | | | — | | | | — | | | | — | | | | — | | |
Return of capital–Class Y | | | — | | | | — | | | | — | | | | — | | |
Return of capital–Class P | | | — | | | | — | | | | — | | | | — | | |
| | | | (5,822,180 | ) | | | (2,437,415 | ) | | | (2,773,046 | ) | | | (71,752 | ) | |
From beneficial interest transactions: | |
Net proceeds from shares sold | | | 154,641,555 | | | | 134,548,925 | | | | 69,360,098 | | | | 48,477,413 | | |
Cost of shares repurchased | | | (306,901,653 | ) | | | (218,180,504 | ) | | | (99,257,811 | ) | | | (75,411,539 | ) | |
Proceeds from dividends reinvested | | | 5,549,008 | | | | 2,330,006 | | | | 2,658,999 | | | | 69,150 | | |
Net increase (decrease) in net assets from beneficial interest
transactions | | | (146,711,090 | ) | | | (81,301,573 | ) | | | (27,238,714 | ) | | | (26,864,976 | ) | |
Redemption fees | | | 26,946 | | | | 26,989 | | | | 8,801 | | | | 11,706 | | |
Net increase (decrease) in net assets | | | 82,419,625 | | | | (37,453,902 | ) | | | 99,756,304 | | | | (38,479,319 | ) | |
Net assets: | |
Beginning of year | | | 1,113,049,333 | | | | 1,150,503,235 | | | | 386,803,682 | | | | 425,283,001 | | |
End of year | | $ | 1,195,468,958 | | | $ | 1,113,049,333 | | | $ | 486,559,986 | | | $ | 386,803,682 | | |
Accumulated undistributed (distributions in excess of) net investment income | | $ | 4,082,837 | | | $ | 2,455,658 | | | $ | 1,862,609 | | | $ | 1,328,280 | | |
See accompanying notes to financial statements.
241
PACE Select Advisors Trust
Statement of changes in net assets (concluded)
| | | PACE
Small/Medium Co Growth Equity
Investments | | PACE
International Equity
Investments | | PACE
International Emerging Markets
Equity Investments | |
| | | Years ended July 31, | | Years ended July 31, | | Years ended July 31, | |
| | | 2013 | | 2012 | | 2013 | | 2012 | | 2013 | | 2012 | |
From operations: | |
Net investment income (loss) | | $ | (1,445,440 | ) | | $ | (2,489,635 | ) | | $ | 18,225,332 | | | $ | 19,487,259 | | | $ | 2,691,736 | | | $ | 2,524,940 | | |
Net realized gains (losses) | | | 55,506,406 | | | | 30,343,266 | | | | 29,506,227 | | | | (35,551,957 | ) | | | (15,509,489 | ) | | | (8,061,327 | ) | |
Net change in unrealized appreciation/depreciation | | | 77,571,558 | | | | (34,367,046 | ) | | | 127,016,723 | | | | (79,515,575 | ) | | | 13,771,800 | | | | (33,179,844 | ) | |
Net increase (decrease) in net assets resulting from operations | | | 131,632,524 | | | | (6,513,415 | ) | | | 174,748,282 | | | | (95,580,273 | ) | | | 954,047 | | | | (38,716,231 | ) | |
Dividends and distributions to shareholders from: | |
Net investment income–Class A | | | — | | | | — | | | | (1,151,644 | ) | | | (1,567,928 | ) | | | (133,643 | ) | | | (172,206 | ) | |
Net investment income–Class C | | | — | | | | — | | | | (35,675 | ) | | | (55,784 | ) | | | — | | | | — | | |
Net investment income–Class Y | | | — | | | | — | | | | (451,927 | ) | | | (556,690 | ) | | | (138,544 | ) | | | (166,164 | ) | |
Net investment income–Class P | | | — | | | | — | | | | (18,291,738 | ) | | | (21,631,424 | ) | | | (1,787,929 | ) | | | (2,196,656 | ) | |
Net realized gains–Class A | | | (623,754 | ) | | | — | | | | — | | | | — | | | | — | | | | (198,675 | ) | |
Net realized gains–Class B | | | — | | | | — | | | | — | | | | — | | | | — | | | | (256 | ) | |
Net realized gains–Class C | | | (63,671 | ) | | | — | | | | — | | | | — | | | | — | | | | (31,489 | ) | |
Net realized gains–Class Y | | | (4,434 | ) | | | — | | | | — | | | | — | | | | — | | | | (152,682 | ) | |
Net realized gains–Class P | | | (6,538,198 | ) | | | — | | | | — | | | | — | | | | — | | | | (2,349,530 | ) | |
| | | | (7,230,057 | ) | | | — | | | | (19,930,984 | ) | | | (23,811,826 | ) | | | (2,060,116 | ) | | | (5,267,658 | ) | |
From beneficial interest transactions: | |
Net proceeds from shares sold | | | 66,510,686 | | | | 47,028,375 | | | | 172,911,160 | | | | 119,381,381 | | | | 167,350,314 | | | | 40,324,768 | | |
Cost of shares repurchased | | | (118,229,752 | ) | | | (85,394,343 | ) | | | (174,721,550 | ) | | | (161,217,188 | ) | | | (53,864,836 | ) | | | (58,328,685 | ) | |
Proceeds from dividends reinvested | | | 6,954,318 | | | | — | | | | 19,040,236 | | | | 22,766,345 | | | | 1,980,763 | | | | 5,091,320 | | |
Net increase (decrease) in net assets from beneficial interest
transactions | | | (44,764,748 | ) | | | (38,365,968 | ) | | | 17,229,846 | | | | (19,069,462 | ) | | | 115,466,241 | | | | (12,912,597 | ) | |
Redemption fees | | | 17,669 | | | | 11,918 | | | | 33,777 | | | | 25,565 | | | | 26,311 | | | | 12,819 | | |
Net increase (decrease) in net assets | | | 79,655,388 | | | | (44,867,465 | ) | | | 172,080,921 | | | | (138,435,996 | ) | | | 114,386,483 | | | | (56,883,667 | ) | |
Net assets: | |
Beginning of year | | | 423,701,964 | | | | 468,569,429 | | | | 770,127,099 | | | | 908,563,095 | | | | 251,985,336 | | | | 308,869,003 | | |
End of year | | $ | 503,357,352 | | | $ | 423,701,964 | | | $ | 942,208,020 | | | $ | 770,127,099 | | | $ | 366,371,819 | | | $ | 251,985,336 | | |
Accumulated undistributed (distributions in excess of) net investment income | | $ | 64,038 | | | $ | (1,229,320 | ) | | $ | 12,643,178 | | | $ | 12,231,816 | | | $ | 2,082,021 | | | $ | 1,594,936 | | |
242
| | | PACE
Global Real Estate Securities
Investments | | PACE
Alternative Strategies
Investments | |
| | | Years ended July 31, | | Years ended July 31, | |
| | | 2013 | | 2012 | | 2013 | | 2012 | |
From operations: | |
Net investment income (loss) | | $ | 1,816,091 | | | $ | 1,863,273 | | | $ | (1,304,156 | ) | | $ | (83,260 | ) | |
Net realized gains (losses) | | | 18,704,372 | | | | 1,900,548 | | | | 26,185,227 | | | | 9,561,281 | | |
Net change in unrealized appreciation/depreciation | | | (5,344,478 | ) | | | 165,711 | | | | 24,900,392 | | | | (7,894,021 | ) | |
Net increase (decrease) in net assets resulting from operations | | | 15,175,985 | | | | 3,929,532 | | | | 49,781,463 | | | | 1,584,000 | | |
Dividends and distributions to shareholders from: | |
Net investment income–Class A | | | (205,882 | ) | | | (99,380 | ) | | | (173,223 | ) | | | — | | |
Net investment income–Class C | | | (6,960 | ) | | | (3,799 | ) | | | — | | | | — | | |
Net investment income–Class Y | | | (11,611 | ) | | | (5,123 | ) | | | (12,562 | ) | | | — | | |
Net investment income–Class P | | | (4,990,785 | ) | | | (2,459,520 | ) | | | (3,346,509 | ) | | | — | | |
Net realized gains–Class A | | | — | | | | — | | | | — | | | | — | | |
Net realized gains–Class B | | | — | | | | — | | | | — | | | | — | | |
Net realized gains–Class C | | | — | | | | — | | | | — | | | | — | | |
Net realized gains–Class Y | | | — | | | | — | | | | — | | | | — | | |
Net realized gains–Class P | | | — | | | | — | | | | — | | | | — | | |
| | | | (5,215,238 | ) | | | (2,567,822 | ) | | | (3,532,294 | ) | | | — | | |
From beneficial interest transactions: | |
Net proceeds from shares sold | | | 39,031,765 | | | | 23,601,011 | | | | 140,092,032 | | | | 91,436,927 | | |
Cost of shares repurchased | | | (45,062,966 | ) | | | (20,109,909 | ) | | | (135,183,027 | ) | | | (141,185,540 | ) | |
Proceeds from dividends reinvested | | | 5,001,250 | | | | 2,474,017 | | | | 3,405,704 | | | | — | | |
Net increase (decrease) in net assets from beneficial interest
transactions | | | (1,029,951 | ) | | | 5,965,119 | | | | 8,314,709 | | | | (49,748,613 | ) | |
Redemption fees | | | 6,250 | | | | 5,701 | | | | 19,888 | | | | 36,115 | | |
Net increase (decrease) in net assets | | | 8,937,046 | | | | 7,332,530 | | | | 54,583,766 | | | | (48,128,498 | ) | |
Net assets: | |
Beginning of year | | | 113,321,041 | | | | 105,988,511 | | | | 500,225,802 | | | | 548,354,300 | | |
End of year | | $ | 122,258,087 | | | $ | 113,321,041 | | | $ | 554,809,568 | | | $ | 500,225,802 | | |
Accumulated undistributed (distributions in excess of) net investment income | | $ | (681,537 | ) | | $ | (564,930 | ) | | $ | 8,236,335 | | | $ | 5,787,726 | | |
See accompanying notes to financial statements.
243
PACE Select Advisors Trust
PACE Money Market Investments
Financial highlights
Selected data for a share of beneficial interest outstanding throughout each year is presented below:
| | | Class P | |
| | | Years ended July 31, | |
| | | 2013 | | 2012 | | 2011 | | 2010 | | 2009 | |
Net asset value, beginning of year | | $ | 1.00 | | | $ | 1.00 | | | $ | 1.00 | | | $ | 1.00 | | | $ | 1.00 | | |
Net investment income | | | 0.0001 | | | | 0.0001 | | | | 0.0001 | | | | 0.0001 | | | | 0.008 | | |
Dividends from net investment income | | | (0.000 | )1 | | | (0.000 | )1 | | | (0.000 | )1 | | | (0.000 | )1 | | | (0.008 | ) | |
Distributions from net realized gains | | | — | | | | — | | | | (0.000 | )1 | | | (0.000 | )1 | | | (0.000 | )1 | |
Total dividends and distributions | | | (0.000 | )1 | | | (0.000 | )1 | | | (0.000 | )1 | | | (0.000 | )1 | | | (0.008 | ) | |
Net asset value, end of year | | $ | 1.00 | | | $ | 1.00 | | | $ | 1.00 | | | $ | 1.00 | | | $ | 1.00 | | |
Total investment return2 | | | 0.01 | % | | | 0.01 | % | | | 0.01 | % | | | 0.01 | % | | | 0.81 | % | |
Ratios to average net assets: | |
Expenses before fee waivers and/or expense reimbursements | | | 0.88 | % | | | 0.89 | % | | | 0.88 | % | | | 0.90 | % | | | 0.89 | % | |
Expenses after fee waivers and/or expense reimbursements | | | 0.19 | % | | | 0.19 | % | | | 0.25 | % | | | 0.27 | % | | | 0.59 | % | |
Net investment income | | | 0.01 | % | | | 0.01 | % | | | 0.01 | % | | | 0.01 | % | | | 0.78 | % | |
Supplemental data: | |
Net assets, end of year (000's) | | $ | 309,842 | | | $ | 337,091 | | | $ | 365,844 | | | $ | 386,217 | | | $ | 529,959 | | |
1 Amount represents less than $0.0005 per share.
2 Total investment return is calculated assuming a $10,000 investment on the first day of each year reported, reinvestment of all dividends and other distributions, if any, at net asset value on the payable dates, and a sale at net asset value on the last day of each year reported. The figures do not include program fees; results would be lower if these fees were included. Returns do not reflect the deduction of taxes that a shareholder would pay on Portfolio distributions.
See accompanying notes to financial statements.
244
This page intentionally left blank.
245
PACE Select Advisors Trust
PACE Government Securities Fixed Income Investments
Financial highlights
Selected data for a share of beneficial interest outstanding throughout each year is presented below:
| | | Class A | |
| | | Years ended July 31, | |
| | | 2013 | | 2012 | | 2011 | | 2010 | | 2009 | |
Net asset value, beginning of year | | $ | 13.46 | | | $ | 13.31 | | | $ | 13.71 | | | $ | 13.36 | | | $ | 12.87 | | |
Net investment income1 | | | 0.11 | | | | 0.22 | | | | 0.29 | | | | 0.41 | | | | 0.57 | | |
Net realized and unrealized gains (losses) | | | (0.39 | ) | | | 0.34 | | | | 0.20 | | | | 0.86 | | | | 0.56 | | |
Net increase (decrease) from operations | | | (0.28 | ) | | | 0.56 | | | | 0.49 | | | | 1.27 | | | | 1.13 | | |
Dividends from net investment income | | | (0.31 | ) | | | (0.34 | ) | | | (0.38 | ) | | | (0.46 | ) | | | (0.64 | ) | |
Distributions from net realized gains | | | (0.25 | ) | | | (0.07 | ) | | | (0.51 | ) | | | (0.46 | ) | | | — | | |
Total dividends and distributions | | | (0.56 | ) | | | (0.41 | ) | | | (0.89 | ) | | | (0.92 | ) | | | (0.64 | ) | |
Net asset value, end of year | | $ | 12.62 | | | $ | 13.46 | | | $ | 13.31 | | | $ | 13.71 | | | $ | 13.36 | | |
Total investment return2 | | | (2.29 | )% | | | 4.34 | % | | | 3.74 | % | | | 9.92 | % | | | 9.09 | % | |
Ratios to average net assets: | |
Expenses before fee waivers and/or expense reimbursements | | | 1.05 | % | | | 1.05 | % | | | 1.06 | %3 | | | 1.08 | %3 | | | 1.07 | %3 | |
Expenses after fee waivers and/or expense reimbursements | | | 0.99 | % | | | 1.02 | % | | | 1.02 | %3 | | | 1.02 | %3 | | | 1.02 | %3 | |
Net investment income | | | 0.83 | % | | | 1.68 | % | | | 2.16 | % | | | 3.06 | % | | | 4.41 | % | |
Supplemental data: | |
Net assets, end of year (000's) | | $ | 66,554 | | | $ | 78,764 | | | $ | 80,727 | | | $ | 92,416 | | | $ | 90,386 | | |
Portfolio turnover | | | 1,336 | % | | | 1,046 | % | | | 1,105 | % | | | 1,065 | % | | | 877 | % | |
| | | Class Y | |
| | | Years ended July 31, | |
| | | 2013 | | 2012 | | 2011 | | 2010 | | 2009 | |
Net asset value, beginning of year | | $ | 13.47 | | | $ | 13.31 | | | $ | 13.71 | | | $ | 13.36 | | | $ | 12.87 | | |
Net investment income1 | | | 0.14 | | | | 0.26 | | | | 0.32 | | | | 0.44 | | | | 0.61 | | |
Net realized and unrealized gains (losses) | | | (0.40 | ) | | | 0.35 | | | | 0.20 | | | | 0.86 | | | | 0.55 | | |
Net increase (decrease) from operations | | | (0.26 | ) | | | 0.61 | | | | 0.52 | | | | 1.30 | | | | 1.16 | | |
Dividends from net investment income | | | (0.34 | ) | | | (0.38 | ) | | | (0.41 | ) | | | (0.49 | ) | | | (0.67 | ) | |
Distributions from net realized gains | | | (0.25 | ) | | | (0.07 | ) | | | (0.51 | ) | | | (0.46 | ) | | | — | | |
Total dividends and distributions | | | (0.59 | ) | | | (0.45 | ) | | | (0.92 | ) | | | (0.95 | ) | | | (0.67 | ) | |
Net asset value, end of year | | $ | 12.62 | | | $ | 13.47 | | | $ | 13.31 | | | $ | 13.71 | | | $ | 13.36 | | |
Total investment return2 | | | (2.05 | )% | | | 4.60 | % | | | 4.00 | % | | | 10.20 | % | | | 9.29 | % | |
Ratios to average net assets: | |
Expenses before fee waivers and/or expense reimbursements | | | 0.85 | % | | | 0.86 | % | | | 0.88 | %3 | | | 0.89 | %3 | | | 0.92 | %3 | |
Expenses after fee waivers and/or expense reimbursements | | | 0.74 | % | | | 0.77 | % | | | 0.77 | %3 | | | 0.77 | %3 | | | 0.77 | %3 | |
Net investment income | | | 1.08 | % | | | 1.92 | % | | | 2.42 | % | | | 3.29 | % | | | 4.65 | % | |
Supplemental data: | |
Net assets, end of year (000's) | | $ | 57,567 | | | $ | 61,428 | | | $ | 50,830 | | | $ | 49,486 | | | $ | 39,199 | | |
Portfolio turnover | | | 1,336 | % | | | 1,046 | % | | | 1,105 | % | | | 1,065 | % | | | 877 | % | |
1 Calculated using the average shares method.
2 Total investment return is calculated assuming a $10,000 investment on the first day of each year reported, reinvestment of all dividends and other distributions, if any, at net asset value on the ex-dividend dates, and a sale at net asset value on the last day of each year reported. The figures do not include any applicable sales charges, redemption fees or program fees; results would be lower if they were included. Returns do not reflect the deduction of taxes that a shareholder would pay on Portfolio distributions or the redemption of Portfolio shares.
3 Includes interest expense representing less than 0.005%.
246
| | | Class C | |
| | | Years ended July 31, | |
| | | 2013 | | 2012 | | 2011 | | 2010 | | 2009 | |
Net asset value, beginning of year | | $ | 13.48 | | | $ | 13.32 | | | $ | 13.72 | | | $ | 13.37 | | | $ | 12.88 | | |
Net investment income1 | | | 0.04 | | | | 0.16 | | | | 0.22 | | | | 0.35 | | | | 0.51 | | |
Net realized and unrealized gains (losses) | | | (0.40 | ) | | | 0.34 | | | | 0.20 | | | | 0.85 | | | | 0.55 | | |
Net increase (decrease) from operations | | | (0.36 | ) | | | 0.50 | | | | 0.42 | | | | 1.20 | | | | 1.06 | | |
Dividends from net investment income | | | (0.24 | ) | | | (0.27 | ) | | | (0.31 | ) | | | (0.39 | ) | | | (0.57 | ) | |
Distributions from net realized gains | | | (0.25 | ) | | | (0.07 | ) | | | (0.51 | ) | | | (0.46 | ) | | | — | | |
Total dividends and distributions | | | (0.49 | ) | | | (0.34 | ) | | | (0.82 | ) | | | (0.85 | ) | | | (0.57 | ) | |
Net asset value, end of year | | $ | 12.63 | | | $ | 13.48 | | | $ | 13.32 | | | $ | 13.72 | | | $ | 13.37 | | |
Total investment return2 | | | (2.78 | )% | | | 3.81 | % | | | 3.22 | % | | | 9.37 | % | | | 8.45 | % | |
Ratios to average net assets: | |
Expenses before fee waivers and/or expense reimbursements | | | 1.56 | % | | | 1.56 | % | | | 1.58 | %3 | | | 1.61 | %3 | | | 1.63 | %3 | |
Expenses after fee waivers and/or expense reimbursements | | | 1.49 | % | | | 1.52 | % | | | 1.52 | %3 | | | 1.52 | %3 | | | 1.52 | %3 | |
Net investment income | | | 0.33 | % | | | 1.19 | % | | | 1.66 | % | | | 2.56 | % | | | 3.90 | % | |
Supplemental data: | |
Net assets, end of year (000's) | | $ | 16,907 | | | $ | 20,710 | | | $ | 22,064 | | | $ | 24,394 | | | $ | 24,477 | | |
Portfolio turnover | | | 1,336 | % | | | 1,046 | % | | | 1,105 | % | | | 1,065 | % | | | 877 | % | |
| | | Class P | |
| | | Years ended July 31, | |
| | | 2013 | | 2012 | | 2011 | | 2010 | | 2009 | |
Net asset value, beginning of year | | $ | 13.47 | | | $ | 13.32 | | | $ | 13.71 | | | $ | 13.36 | | | $ | 12.87 | | |
Net investment income1 | | | 0.14 | | | | 0.26 | | | | 0.32 | | | | 0.44 | | | | 0.61 | | |
Net realized and unrealized gains (losses) | | | (0.39 | ) | | | 0.34 | | | | 0.21 | | | | 0.86 | | | | 0.55 | | |
Net increase (decrease) from operations | | | (0.25 | ) | | | 0.60 | | | | 0.53 | | | | 1.30 | | | | 1.16 | | |
Dividends from net investment income | | | (0.34 | ) | | | (0.38 | ) | | | (0.41 | ) | | | (0.49 | ) | | | (0.67 | ) | |
Distributions from net realized gains | | | (0.25 | ) | | | (0.07 | ) | | | (0.51 | ) | | | (0.46 | ) | | | — | | |
Total dividends and distributions | | | (0.59 | ) | | | (0.45 | ) | | | (0.92 | ) | | | (0.95 | ) | | | (0.67 | ) | |
Net asset value, end of year | | $ | 12.63 | | | $ | 13.47 | | | $ | 13.32 | | | $ | 13.71 | | | $ | 13.36 | | |
Total investment return2 | | | (1.97 | )% | | | 4.52 | % | | | 4.08 | % | | | 10.20 | % | | | 9.27 | % | |
Ratios to average net assets: | |
Expenses before fee waivers and/or expense reimbursements | | | 0.86 | % | | | 0.85 | % | | | 0.86 | %3 | | | 0.88 | %3 | | | 0.86 | %3 | |
Expenses after fee waivers and/or expense reimbursements | | | 0.74 | % | | | 0.77 | % | | | 0.77 | %3 | | | 0.77 | %3 | | | 0.77 | %3 | |
Net investment income | | | 1.08 | % | | | 1.93 | % | | | 2.41 | % | | | 3.30 | % | | | 4.66 | % | |
Supplemental data: | |
Net assets, end of year (000's) | | $ | 447,362 | | | $ | 453,841 | | | $ | 453,931 | | | $ | 477,172 | | | $ | 422,024 | | |
Portfolio turnover | | | 1,336 | % | | | 1,046 | % | | | 1,105 | % | | | 1,065 | % | | | 877 | % | |
See accompanying notes to financial statements.
247
PACE Select Advisors Trust
PACE Intermediate Fixed Income Investments
Financial highlights
Selected data for a share of beneficial interest outstanding throughout each year is presented below:
| | | Class A | |
| | | Years ended July 31, | |
| | | 2013 | | 2012 | | 2011 | | 2010 | | 2009 | |
Net asset value, beginning of year | | $ | 12.42 | | | $ | 12.15 | | | $ | 12.02 | | | $ | 11.58 | | | $ | 11.51 | | |
Net investment income1 | | | 0.12 | | | | 0.21 | | | | 0.26 | | | | 0.34 | | | | 0.44 | | |
Net realized and unrealized gains (losses) | | | (0.22 | ) | | | 0.28 | | | | 0.12 | | | | 0.49 | | | | 0.08 | | |
Net increase (decrease) from operations | | | (0.10 | ) | | | 0.49 | | | | 0.38 | | | | 0.83 | | | | 0.52 | | |
Dividends from net investment income | | | (0.12 | ) | | | (0.22 | ) | | | (0.25 | ) | | | (0.39 | ) | | | (0.45 | ) | |
Net asset value, end of year | | $ | 12.20 | | | $ | 12.42 | | | $ | 12.15 | | | $ | 12.02 | | | $ | 11.58 | | |
Total investment return2 | | | (0.93 | )% | | | 4.16 | % | | | 3.24 | % | | | 7.24 | % | | | 4.88 | % | |
Ratios to average net assets: | |
Expenses before fee waivers and/or expense reimbursements | | | 0.99 | %3 | | | 1.00 | % | | | 0.99 | %3 | | | 1.00 | %3 | | | 1.02 | % | |
Expenses after fee waivers and/or expense reimbursements | | | 0.93 | %3 | | | 0.93 | % | | | 0.93 | %3 | | | 0.93 | %3 | | | 0.93 | % | |
Net investment income | | | 0.98 | % | | | 1.73 | % | | | 2.18 | % | | | 2.93 | % | | | 3.97 | % | |
Supplemental data: | |
Net assets, end of year (000's) | | $ | 31,355 | | | $ | 36,665 | | | $ | 39,022 | | | $ | 42,905 | | | $ | 45,165 | | |
Portfolio turnover | | | 818 | % | | | 398 | % | | | 664 | % | | | 974 | % | | | 512 | % | |
| | | Class Y | |
| | | Years ended July 31, | |
| | | 2013 | | 2012 | | 2011 | | 2010 | | 2009 | |
Net asset value, beginning of year | | $ | 12.43 | | | $ | 12.15 | | | $ | 12.02 | | | $ | 11.59 | | | $ | 11.51 | | |
Net investment income1 | | | 0.15 | | | | 0.24 | | | | 0.29 | | | | 0.38 | | | | 0.47 | | |
Net realized and unrealized gains (losses) | | | (0.23 | ) | | | 0.29 | | | | 0.12 | | | | 0.48 | | | | 0.09 | | |
Net increase (decrease) from operations | | | (0.08 | ) | | | 0.53 | | | | 0.41 | | | | 0.86 | | | | 0.56 | | |
Dividends from net investment income | | | (0.15 | ) | | | (0.25 | ) | | | (0.28 | ) | | | (0.43 | ) | | | (0.48 | ) | |
Net asset value, end of year | | $ | 12.20 | | | $ | 12.43 | | | $ | 12.15 | | | $ | 12.02 | | | $ | 11.59 | | |
Total investment return2 | | | (0.68 | )% | | | 4.42 | % | | | 3.49 | % | | | 7.53 | % | | | 5.15 | % | |
Ratios to average net assets: | |
Expenses before fee waivers and/or expense reimbursements | | | 0.89 | %3 | | | 0.88 | % | | | 0.83 | %3 | | | 0.74 | %3 | | | 0.68 | % | |
Expenses after fee waivers and/or expense reimbursements | | | 0.68 | %3 | | | 0.68 | % | | | 0.68 | %3 | | | 0.68 | %3 | | | 0.68 | %4 | |
Net investment income | | | 1.24 | % | | | 1.99 | % | | | 2.42 | % | | | 3.19 | % | | | 4.17 | % | |
Supplemental data: | |
Net assets, end of year (000's) | | $ | 674 | | | $ | 990 | | | $ | 1,277 | | | $ | 1,997 | | | $ | 2,313 | | |
Portfolio turnover | | | 818 | % | | | 398 | % | | | 664 | % | | | 974 | % | | | 512 | % | |
1 Calculated using the average shares method.
2 Total investment return is calculated assuming a $10,000 investment on the first day of each year reported, reinvestment of all dividends and other distributions, if any, at net asset value on the ex-dividend dates, and a sale at net asset value on the last day of each year reported. The figures do not include any applicable sales charges, redemption fees or program fees; results would be lower if they were included. Returns do not reflect the deduction of taxes that a shareholder would pay on Portfolio distributions or the redemption of Portfolio shares.
3 Includes interest expense representing less than 0.005%.
4 During the year ended July 31, 2009, UBS Global Asset Management (Americas) Inc. waived fees and/or reimbursed a portion of ordinary operating expenses. The ratios after and before fee waivers and/or expense reimbursements are the same since the fee waiver/reimbursement represents less than 0.01%.
248
| | | Class C | |
| | | Years ended July 31, | |
| | | 2013 | | 2012 | | 2011 | | 2010 | | 2009 | |
Net asset value, beginning of year | | $ | 12.44 | | | $ | 12.17 | | | $ | 12.03 | | | $ | 11.59 | | | $ | 11.52 | | |
Net investment income1 | | | 0.06 | | | | 0.15 | | | | 0.20 | | | | 0.29 | | | | 0.38 | | |
Net realized and unrealized gains (losses) | | | (0.23 | ) | | | 0.28 | | | | 0.13 | | | | 0.48 | | | | 0.09 | | |
Net increase (decrease) from operations | | | (0.17 | ) | | | 0.43 | | | | 0.33 | | | | 0.77 | | | | 0.47 | | |
Dividends from net investment income | | | (0.05 | ) | | | (0.16 | ) | | | (0.19 | ) | | | (0.33 | ) | | | (0.40 | ) | |
Net asset value, end of year | | $ | 12.22 | | | $ | 12.44 | | | $ | 12.17 | | | $ | 12.03 | | | $ | 11.59 | | |
Total investment return2 | | | (1.34 | )% | | | 3.55 | % | | | 2.80 | % | | | 6.70 | % | | | 4.36 | % | |
Ratios to average net assets: | |
Expenses before fee waivers and/or expense reimbursements | | | 1.49 | %3 | | | 1.51 | % | | | 1.49 | %3 | | | 1.50 | %3 | | | 1.53 | % | |
Expenses after fee waivers and/or expense reimbursements | | | 1.43 | %3 | | | 1.43 | % | | | 1.43 | %3 | | | 1.43 | %3 | | | 1.43 | % | |
Net investment income | | | 0.48 | % | | | 1.23 | % | | | 1.67 | % | | | 2.43 | % | | | 3.43 | % | |
Supplemental data: | |
Net assets, end of year (000's) | | $ | 2,685 | | | $ | 3,270 | | | $ | 3,474 | | | $ | 4,646 | | | $ | 5,185 | | |
Portfolio turnover | | | 818 | % | | | 398 | % | | | 664 | % | | | 974 | % | | | 512 | % | |
| | | Class P | |
| | | Years ended July 31, | |
| | | 2013 | | 2012 | | 2011 | | 2010 | | 2009 | |
Net asset value, beginning of year | | $ | 12.43 | | | $ | 12.16 | | | $ | 12.02 | | | $ | 11.59 | | | $ | 11.51 | | |
Net investment income1 | | | 0.15 | | | | 0.24 | | | | 0.29 | | | | 0.37 | | | | 0.47 | | |
Net realized and unrealized gains (losses) | | | (0.23 | ) | | | 0.28 | | | | 0.13 | | | | 0.48 | | | | 0.09 | | |
Net increase (decrease) from operations | | | (0.08 | ) | | | 0.52 | | | | 0.42 | | | | 0.85 | | | | 0.56 | | |
Dividends from net investment income | | | (0.15 | ) | | | (0.25 | ) | | | (0.28 | ) | | | (0.42 | ) | | | (0.48 | ) | |
Net asset value, end of year | | $ | 12.20 | | | $ | 12.43 | | | $ | 12.16 | | | $ | 12.02 | | | $ | 11.59 | | |
Total investment return2 | | | (0.68 | )% | | | 4.33 | % | | | 3.58 | % | | | 7.51 | % | | | 5.14 | % | |
Ratios to average net assets: | |
Expenses before fee waivers and/or expense reimbursements | | | 0.74 | %3 | | | 0.74 | % | | | 0.72 | %3 | | | 0.73 | %3 | | | 0.74 | % | |
Expenses after fee waivers and/or expense reimbursements | | | 0.68 | %3 | | | 0.68 | % | | | 0.68 | %3 | | | 0.68 | %3 | | | 0.68 | % | |
Net investment income | | | 1.22 | % | | | 1.97 | % | | | 2.43 | % | | | 3.16 | % | | | 4.22 | % | |
Supplemental data: | |
Net assets, end of year (000's) | | $ | 415,894 | | | $ | 421,822 | | | $ | 411,723 | | | $ | 420,801 | | | $ | 353,068 | | |
Portfolio turnover | | | 818 | % | | | 398 | % | | | 664 | % | | | 974 | % | | | 512 | % | |
See accompanying notes to financial statements.
249
PACE Select Advisors Trust
PACE Strategic Fixed Income Investments
Financial highlights
Selected data for a share of beneficial interest outstanding throughout each year is presented below:
| | | Class A | |
| | | Years ended July 31, | |
| | | 2013 | | 2012 | | 2011 | | 2010 | | 2009 | |
Net asset value, beginning of year | | $ | 15.29 | | | $ | 14.55 | | | $ | 14.56 | | | $ | 13.09 | | | $ | 13.75 | | |
Net investment income1 | | | 0.41 | | | | 0.42 | | | | 0.48 | | | | 0.47 | | | | 0.60 | | |
Net realized and unrealized gains (losses) | | | (0.78 | ) | | | 1.11 | | | | 0.43 | | | | 1.60 | | | | 0.39 | | |
Net increase (decrease) from operations | | | (0.37 | ) | | | 1.53 | | | | 0.91 | | | | 2.07 | | | | 0.99 | | |
Dividends from net investment income | | | (0.43 | ) | | | (0.52 | ) | | | (0.51 | ) | | | (0.58 | ) | | | (0.73 | ) | |
Distributions from net realized gains | | | (0.33 | ) | | | (0.27 | ) | | | (0.41 | ) | | | (0.02 | ) | | | (0.92 | ) | |
Total dividends and distributions | | | (0.76 | ) | | | (0.79 | ) | | | (0.92 | ) | | | (0.60 | ) | | | (1.65 | ) | |
Net asset value, end of year | | $ | 14.16 | | | $ | 15.29 | | | $ | 14.55 | | | $ | 14.56 | | | $ | 13.09 | | |
Total investment return2 | | | (2.60 | )% | | | 10.86 | % | | | 6.54 | % | | | 16.09 | % | | | 8.31 | % | |
Ratios to average net assets: | |
Expenses before fee waivers and/or expense reimbursements/recoupments, including interest expense | | | 1.03 | % | | | 1.04 | %3 | | | 1.09 | % | | | 1.09 | % | | | 1.10 | % | |
Expenses after fee waivers and/or expense reimbursements/recoupments, including interest expense | | | 1.06 | %4 | | | 1.06 | %3,4 | | | 1.06 | % | | | 1.06 | % | | | 1.07 | % | |
Expenses after fee waivers and/or expense reimbursements/recoupments, excluding interest expense | | | 1.05 | %4 | | | 1.06 | %4 | | | 1.06 | % | | | 1.06 | % | | | 1.06 | % | |
Net investment income | | | 2.72 | % | | | 2.85 | % | | | 3.38 | % | | | 3.36 | % | | | 4.75 | % | |
Supplemental data: | |
Net assets, end of year (000's) | | $ | 67,417 | | | $ | 85,571 | | | $ | 56,151 | | | $ | 45,499 | | | $ | 33,293 | | |
Portfolio turnover | | | 186 | % | | | 162 | % | | | 444 | % | | | 239 | % | | | 178 | % | |
| | | Class Y | |
| | | Years ended July 31, | |
| | | 2013 | | 2012 | | 2011 | | 2010 | | 2009 | |
Net asset value, beginning of year | | $ | 15.28 | | | $ | 14.54 | | | $ | 14.54 | | | $ | 13.08 | | | $ | 13.74 | | |
Net investment income1 | | | 0.42 | | | | 0.46 | | | | 0.52 | | | | 0.51 | | | | 0.64 | | |
Net realized and unrealized gains (losses) | | | (0.76 | ) | | | 1.10 | | | | 0.44 | | | | 1.59 | | | | 0.39 | | |
Net increase (decrease) from operations | | | (0.34 | ) | | | 1.56 | | | | 0.96 | | | | 2.10 | | | | 1.03 | | |
Dividends from net investment income | | | (0.46 | ) | | | (0.55 | ) | | | (0.55 | ) | | | (0.62 | ) | | | (0.77 | ) | |
Distributions from net realized gains | | | (0.33 | ) | | | (0.27 | ) | | | (0.41 | ) | | | (0.02 | ) | | | (0.92 | ) | |
Total dividends and distributions | | | (0.79 | ) | | | (0.82 | ) | | | (0.96 | ) | | | (0.64 | ) | | | (1.69 | ) | |
Net asset value, end of year | | $ | 14.15 | | | $ | 15.28 | | | $ | 14.54 | | | $ | 14.54 | | | $ | 13.08 | | |
Total investment return2 | | | (2.38 | )% | | | 11.10 | % | | | 6.80 | % | | | 16.47 | % | | | 8.68 | % | |
Ratios to average net assets: | |
Expenses before fee waivers and/or expense reimbursements/recoupments, including interest expense | | | 0.90 | % | | | 0.89 | %3 | | | 0.96 | % | | | 0.85 | % | | | 0.73 | % | |
Expenses after fee waivers and/or expense reimbursements/recoupments, including interest expense | | | 0.81 | % | | | 0.81 | %3 | | | 0.81 | % | | | 0.81 | % | | | 0.73 | % | |
Expenses after fee waivers and/or expense reimbursements/recoupments, excluding interest expense | | | 0.81 | % | | | 0.81 | % | | | 0.81 | % | | | 0.81 | % | | | 0.72 | % | |
Net investment income | | | 2.80 | % | | | 3.09 | % | | | 3.62 | % | | | 3.63 | % | | | 5.09 | % | |
Supplemental data: | |
Net assets, end of year (000's) | | $ | 3,638 | | | $ | 5,907 | | | $ | 2,810 | | | $ | 3,058 | | | $ | 3,186 | | |
Portfolio turnover | | | 186 | % | | | 162 | % | | | 444 | % | | | 239 | % | | | 178 | % | |
1 Calculated using the average shares method.
2 Total investment return is calculated assuming a $10,000 investment on the first day of each year reported, reinvestment of all dividends and other distributions, if any, at net asset value on the ex-dividend dates, and a sale at net asset value on the last day of each year reported. The figures do not include any applicable sales charges, redemption fees or program fees; results would be lower if they were included. Returns do not reflect the deduction of taxes that a shareholder would pay on Portfolio distributions or the redemption of Portfolio shares.
3 Includes interest expense representing less than 0.005%.
4 The investment manager recouped expenses previously reimbursed by the investment manager on behalf of the Portfolio, not to exceed the expense cap.
250
| | | Class C | |
| | | Years ended July 31, | |
| | | 2013 | | 2012 | | 2011 | | 2010 | | 2009 | |
Net asset value, beginning of year | | $ | 15.29 | | | $ | 14.56 | | | $ | 14.56 | | | $ | 13.09 | | | $ | 13.75 | | |
Net investment income1 | | | 0.34 | | | | 0.35 | | | | 0.42 | | | | 0.40 | | | | 0.54 | | |
Net realized and unrealized gains (losses) | | | (0.78 | ) | | | 1.10 | | | | 0.43 | | | | 1.60 | | | | 0.39 | | |
Net increase (decrease) from operations | | | (0.44 | ) | | | 1.45 | | | | 0.85 | | | | 2.00 | | | | 0.93 | | |
Dividends from net investment income | | | (0.35 | ) | | | (0.45 | ) | | | (0.44 | ) | | | (0.51 | ) | | | (0.67 | ) | |
Distributions from net realized gains | | | (0.33 | ) | | | (0.27 | ) | | | (0.41 | ) | | | (0.02 | ) | | | (0.92 | ) | |
Total dividends and distributions | | | (0.68 | ) | | | (0.72 | ) | | | (0.85 | ) | | | (0.53 | ) | | | (1.59 | ) | |
Net asset value, end of year | | $ | 14.17 | | | $ | 15.29 | | | $ | 14.56 | | | $ | 14.56 | | | $ | 13.09 | | |
Total investment return2 | | | (2.99 | )% | | | 10.25 | % | | | 6.10 | % | | | 15.52 | % | | | 7.78 | % | |
Ratios to average net assets: | |
Expenses before fee waivers and/or expense reimbursements/recoupments, including interest expense | | | 1.51 | %3 | | | 1.52 | %3 | | | 1.53 | % | | | 1.56 | % | | | 1.58 | % | |
Expenses after fee waivers and/or expense reimbursements/recoupments, including interest expense | | | 1.51 | %3 | | | 1.52 | %3 | | | 1.55 | %4 | | | 1.56 | % | | | 1.57 | % | |
Expenses after fee waivers and/or expense reimbursements/recoupments, excluding interest expense | | | 1.51 | % | | | 1.52 | % | | | 1.55 | %4 | | | 1.56 | % | | | 1.56 | % | |
Net investment income | | | 2.26 | % | | | 2.38 | % | | | 2.88 | % | | | 2.86 | % | | | 4.24 | % | |
Supplemental data: | |
Net assets, end of year (000's) | | $ | 20,992 | | | $ | 21,193 | | | $ | 12,856 | | | $ | 12,289 | | | $ | 8,797 | | |
Portfolio turnover | | | 186 | % | | | 162 | % | | | 444 | % | | | 239 | % | | | 178 | % | |
| | | Class P | |
| | | Years ended July 31, | |
| | | 2013 | | 2012 | | 2011 | | 2010 | | 2009 | |
Net asset value, beginning of year | | $ | 15.29 | | | $ | 14.55 | | | $ | 14.55 | | | $ | 13.08 | | | $ | 13.74 | | |
Net investment income1 | | | 0.44 | | | | 0.46 | | | | 0.52 | | | | 0.50 | | | | 0.64 | | |
Net realized and unrealized gains (losses) | | | (0.78 | ) | | | 1.10 | | | | 0.44 | | | | 1.60 | | | | 0.38 | | |
Net increase (decrease) from operations | | | (0.34 | ) | | | 1.56 | | | | 0.96 | | | | 2.10 | | | | 1.02 | | |
Dividends from net investment income | | | (0.46 | ) | | | (0.55 | ) | | | (0.55 | ) | | | (0.61 | ) | | | (0.76 | ) | |
Distributions from net realized gains | | | (0.33 | ) | | | (0.27 | ) | | | (0.41 | ) | | | (0.02 | ) | | | (0.92 | ) | |
Total dividends and distributions | | | (0.79 | ) | | | (0.82 | ) | | | (0.96 | ) | | | (0.63 | ) | | | (1.68 | ) | |
Net asset value, end of year | | $ | 14.16 | | | $ | 15.29 | | | $ | 14.55 | | | $ | 14.55 | | | $ | 13.08 | | |
Total investment return2 | | | (2.37 | )% | | | 11.09 | % | | | 6.88 | % | | | 16.39 | % | | | 8.58 | % | |
Ratios to average net assets: | |
Expenses before fee waivers and/or expense reimbursements/recoupments, including interest expense | | | 0.81 | %3 | | | 0.82 | %3 | | | 0.84 | % | | | 0.87 | % | | | 0.87 | % | |
Expenses after fee waivers and/or expense reimbursements/recoupments, including interest expense | | | 0.81 | %3 | | | 0.81 | %3 | | | 0.81 | % | | | 0.81 | % | | | 0.82 | % | |
Expenses after fee waivers and/or expense reimbursements/recoupments, excluding interest expense | | | 0.81 | % | | | 0.81 | % | | | 0.81 | % | | | 0.81 | % | | | 0.81 | % | |
Net investment income | | | 2.96 | % | | | 3.10 | % | | | 3.63 | % | | | 3.62 | % | | | 5.00 | % | |
Supplemental data: | |
Net assets, end of year (000's) | | $ | 833,352 | | | $ | 795,829 | | | $ | 746,653 | | | $ | 691,186 | | | $ | 584,235 | | |
Portfolio turnover | | | 186 | % | | | 162 | % | | | 444 | % | | | 239 | % | | | 178 | % | |
See accompanying notes to financial statements.
251
PACE Select Advisors Trust
PACE Municipal Fixed Income Investments
Financial highlights
Selected data for a share of beneficial interest outstanding throughout each year is presented below:
| | | Class A | |
| | | Years ended July 31, | |
| | | 2013 | | 2012 | | 2011 | | 2010 | | 2009 | |
Net asset value, beginning of year | | $ | 13.56 | | | $ | 13.00 | | | $ | 12.94 | | | $ | 12.45 | | | $ | 12.15 | | |
Net investment income1 | | | 0.33 | | | | 0.37 | | | | 0.38 | | | | 0.39 | | | | 0.41 | | |
Net realized and unrealized gains (losses) | | | (0.59 | ) | | | 0.56 | | | | 0.06 | | | | 0.49 | | | | 0.30 | | |
Net increase (decrease) from operations | | | (0.26 | ) | | | 0.93 | | | | 0.44 | | | | 0.88 | | | | 0.71 | | |
Dividends from net investment income | | | (0.33 | ) | | | (0.37 | ) | | | (0.38 | ) | | | (0.39 | ) | | | (0.41 | ) | |
Distributions from net realized gains | | | (0.06 | ) | | | — | | | | — | | | | — | | | | — | | |
Total dividends and distributions | | | (0.39 | ) | | | (0.37 | ) | | | (0.38 | ) | | | (0.39 | ) | | | (0.41 | ) | |
Net asset value, end of year | | $ | 12.91 | | | $ | 13.56 | | | $ | 13.00 | | | $ | 12.94 | | | $ | 12.45 | | |
Total investment return2 | | | (1.99 | )% | | | 7.21 | % | | | 3.49 | % | | | 7.18 | % | | | 5.97 | % | |
Ratios to average net assets: | |
Expenses before fee waivers and/or expense reimbursements | | | 0.93 | % | | | 0.95 | % | | | 0.94 | % | | | 0.95 | % | | | 0.96 | % | |
Expenses after fee waivers and/or expense reimbursements | | | 0.91 | % | | | 0.93 | % | | | 0.93 | % | | | 0.93 | % | | | 0.93 | % | |
Net investment income | | | 2.47 | % | | | 2.75 | % | | | 2.96 | % | | | 3.08 | % | | | 3.35 | % | |
Supplemental data: | |
Net assets, end of year (000's) | | $ | 63,540 | | | $ | 71,639 | | | $ | 73,528 | | | $ | 83,501 | | | $ | 88,167 | | |
Portfolio turnover | | | 69 | % | | | 32 | % | | | 34 | % | | | 10 | % | | | 25 | % | |
| | | Class Y | |
| | | Years ended July 31, | |
| | | 2013 | | 2012 | | 2011 | | 2010 | | 2009 | |
Net asset value, beginning of year | | $ | 13.57 | | | $ | 13.00 | | | $ | 12.95 | | | $ | 12.45 | | | $ | 12.16 | | |
Net investment income1 | | | 0.37 | | | | 0.40 | | | | 0.41 | | | | 0.42 | | | | 0.44 | | |
Net realized and unrealized gains (losses) | | | (0.60 | ) | | | 0.57 | | | | 0.05 | | | | 0.50 | | | | 0.29 | | |
Net increase (decrease) from operations | | | (0.23 | ) | | | 0.97 | | | | 0.46 | | | | 0.92 | | | | 0.73 | | |
Dividends from net investment income | | | (0.36 | ) | | | (0.40 | ) | | | (0.41 | ) | | | (0.42 | ) | | | (0.44 | ) | |
Distributions from net realized gains | | | (0.06 | ) | | | — | | | | — | | | | — | | | | — | | |
Total dividends and distributions | | | (0.42 | ) | | | (0.40 | ) | | | (0.41 | ) | | | (0.42 | ) | | | (0.44 | ) | |
Net asset value, end of year | | $ | 12.92 | | | $ | 13.57 | | | $ | 13.00 | | | $ | 12.95 | | | $ | 12.45 | | |
Total investment return2 | | | (1.74 | )% | | | 7.56 | % | | | 3.67 | % | | | 7.45 | % | | | 6.23 | % | |
Ratios to average net assets: | |
Expenses before fee waivers and/or expense reimbursements | | | 0.72 | % | | | 0.73 | % | | | 0.74 | % | | | 0.74 | % | | | 0.76 | % | |
Expenses after fee waivers and/or expense reimbursements | | | 0.66 | % | | | 0.68 | % | | | 0.68 | % | | | 0.68 | % | | | 0.68 | % | |
Net investment income | | | 2.72 | % | | | 3.00 | % | | | 3.21 | % | | | 3.33 | % | | | 3.60 | % | |
Supplemental data: | |
Net assets, end of year (000's) | | $ | 82 | | | $ | 121 | | | $ | 118 | | | $ | 123 | | | $ | 145 | | |
Portfolio turnover | | | 69 | % | | | 32 | % | | | 34 | % | | | 10 | % | | | 25 | % | |
1 Calculated using the average shares method.
2 Total investment return is calculated assuming a $10,000 investment on the first day of each year reported, reinvestment of all dividends and other distributions, if any, at net asset value on the ex-dividend dates, and a sale at net asset value on the last day of each year reported. The figures do not include any applicable sales charges, redemption fees or program fees; results would be lower if they were included. Returns do not reflect the deduction of taxes that a shareholder could pay on Portfolio distributions or the redemption of Portfolio shares.
252
| | | Class C | |
| | | Years ended July 31, | |
| | | 2013 | | 2012 | | 2011 | | 2010 | | 2009 | |
Net asset value, beginning of year | | $ | 13.57 | | | $ | 13.00 | | | $ | 12.94 | | | $ | 12.45 | | | $ | 12.16 | | |
Net investment income1 | | | 0.26 | | | | 0.30 | | | | 0.32 | | | | 0.33 | | | | 0.35 | | |
Net realized and unrealized gains (losses) | | | (0.60 | ) | | | 0.57 | | | | 0.06 | | | | 0.49 | | | | 0.29 | | |
Net increase (decrease) from operations | | | (0.34 | ) | | | 0.87 | | | | 0.38 | | | | 0.82 | | | | 0.64 | | |
Dividends from net investment income | | | (0.26 | ) | | | (0.30 | ) | | | (0.32 | ) | | | (0.33 | ) | | | (0.35 | ) | |
Distributions from net realized gains | | | (0.06 | ) | | | — | | | | — | | | | — | | | | — | | |
Total dividends and distributions | | | (0.32 | ) | | | (0.30 | ) | | | (0.32 | ) | | | (0.33 | ) | | | (0.35 | ) | |
Net asset value, end of year | | $ | 12.91 | | | $ | 13.57 | | | $ | 13.00 | | | $ | 12.94 | | | $ | 12.45 | | |
Total investment return2 | | | (2.56 | )% | | | 6.76 | % | | | 2.97 | % | | | 6.65 | % | | | 5.36 | % | |
Ratios to average net assets: | |
Expenses before fee waivers and/or expense reimbursements | | | 1.44 | % | | | 1.45 | % | | | 1.45 | % | | | 1.46 | % | | | 1.47 | % | |
Expenses after fee waivers and/or expense reimbursements | | | 1.41 | % | | | 1.43 | % | | | 1.43 | % | | | 1.43 | % | | | 1.43 | % | |
Net investment income | | | 1.97 | % | | | 2.25 | % | | | 2.46 | % | | | 2.58 | % | | | 2.85 | % | |
Supplemental data: | |
Net assets, end of year (000's) | | $ | 12,336 | | | $ | 13,684 | | | $ | 13,943 | | | $ | 15,767 | | | $ | 15,474 | | |
Portfolio turnover | | | 69 | % | | | 32 | % | | | 34 | % | | | 10 | % | | | 25 | % | |
| | | Class P | |
| | | Years ended July 31, | |
| | | 2013 | | 2012 | | 2011 | | 2010 | | 2009 | |
Net asset value, beginning of year | | $ | 13.57 | | | $ | 13.00 | | | $ | 12.95 | | | $ | 12.45 | | | $ | 12.16 | | |
Net investment income1 | | | 0.36 | | | | 0.40 | | | | 0.41 | | | | 0.42 | | | | 0.44 | | |
Net realized and unrealized gains (losses) | | | (0.60 | ) | | | 0.57 | | | | 0.05 | | | | 0.50 | | | | 0.29 | | |
Net increase (decrease) from operations | | | (0.24 | ) | | | 0.97 | | | | 0.46 | | | | 0.92 | | | | 0.73 | | |
Dividends from net investment income | | | (0.36 | ) | | | (0.40 | ) | | | (0.41 | ) | | | (0.42 | ) | | | (0.44 | ) | |
Distributions from net realized gains | | | (0.06 | ) | | | — | | | | — | | | | — | | | | — | | |
Total dividends and distributions | | | (0.42 | ) | | | (0.40 | ) | | | (0.41 | ) | | | (0.42 | ) | | | (0.44 | ) | |
Net asset value, end of year | | $ | 12.91 | | | $ | 13.57 | | | $ | 13.00 | | | $ | 12.95 | | | $ | 12.45 | | |
Total investment return2 | | | (1.82 | )% | | | 7.56 | % | | | 3.67 | % | | | 7.54 | % | | | 6.14 | % | |
Ratios to average net assets: | |
Expenses before fee waivers and/or expense reimbursements | | | 0.70 | % | | | 0.72 | % | | | 0.72 | % | | | 0.74 | % | | | 0.74 | % | |
Expenses after fee waivers and/or expense reimbursements | | | 0.66 | % | | | 0.68 | % | | | 0.68 | % | | | 0.68 | % | | | 0.68 | % | |
Net investment income | | | 2.70 | % | | | 3.00 | % | | | 3.21 | % | | | 3.33 | % | | | 3.61 | % | |
Supplemental data: | |
Net assets, end of year (000's) | | $ | 300,838 | | | $ | 231,010 | | | $ | 229,062 | | | $ | 229,028 | | | $ | 187,814 | | |
Portfolio turnover | | | 69 | % | | | 32 | % | | | 34 | % | | | 10 | % | | | 25 | % | |
See accompanying notes to financial statements.
253
PACE Select Advisors Trust
PACE International Fixed Income Investments
Financial highlights
Selected data for a share of beneficial interest outstanding throughout each year is presented below:
| | | Class A | |
| | | Years ended July 31, | |
| | | 2013 | | 2012 | | 2011 | | 2010 | | 2009 | |
Net asset value, beginning of year | | $ | 11.40 | | | $ | 12.52 | | | $ | 11.43 | | | $ | 11.64 | | | $ | 11.84 | | |
Net investment income1 | | | 0.19 | | | | 0.25 | | | | 0.26 | | | | 0.27 | | | | 0.30 | | |
Net realized and unrealized gains (losses) | | | (0.72 | ) | | | (0.56 | ) | | | 1.13 | | | | 0.24 | | | | (0.06 | ) | |
Net increase (decrease) from operations | | | (0.53 | ) | | | (0.31 | ) | | | 1.39 | | | | 0.51 | | | | 0.24 | | |
Dividends from net investment income | | | (0.16 | ) | | | (0.81 | ) | | | (0.30 | ) | | | (0.70 | ) | | | (0.44 | ) | |
Return of capital | | | (0.15 | ) | | | — | | | | — | | | | (0.02 | ) | | | — | | |
Total dividends and return of capital | | | (0.31 | ) | | | (0.81 | ) | | | (0.30 | ) | | | (0.72 | ) | | | (0.44 | ) | |
Net asset value, end of year | | $ | 10.56 | | | $ | 11.40 | | | $ | 12.52 | | | $ | 11.43 | | | $ | 11.64 | | |
Total investment return2 | | | (4.80 | )% | | | (2.33 | )% | | | 12.36 | % | | | 4.32 | % | | | 2.35 | % | |
Ratios to average net assets: | |
Expenses before fee waivers and/or expense reimbursements/recoupments | | | 1.27 | %3 | | | 1.27 | % | | | 1.26 | % | | | 1.30 | % | | | 1.32 | % | |
Expenses after fee waivers and/or expense reimbursements/recoupments | | | 1.22 | %3 | | | 1.21 | %4 | | | 1.22 | %4 | | | 1.25 | %4 | | | 1.25 | % | |
Net investment income | | | 1.65 | % | | | 2.16 | % | | | 2.16 | % | | | 2.30 | % | | | 2.83 | % | |
Supplemental data: | |
Net assets, end of year (000's) | | $ | 70,052 | | | $ | 84,661 | | | $ | 98,636 | | | $ | 98,039 | | | $ | 103,708 | | |
Portfolio turnover | | | 63 | % | | | 40 | % | | | 66 | % | | | 67 | % | | | 37 | % | |
| | | Class Y | |
| | | Years ended July 31, | |
| | | 2013 | | 2012 | | 2011 | | 2010 | | 2009 | |
Net asset value, beginning of year | | $ | 11.37 | | | $ | 12.49 | | | $ | 11.40 | | | $ | 11.63 | | | $ | 11.83 | | |
Net investment income1 | | | 0.21 | | | | 0.28 | | | | 0.28 | | | | 0.30 | | | | 0.34 | | |
Net realized and unrealized gains (losses) | | | (0.71 | ) | | | (0.57 | ) | | | 1.14 | | | | 0.23 | | | | (0.07 | ) | |
Net increase (decrease) from operations | | | (0.50 | ) | | | (0.29 | ) | | | 1.42 | | | | 0.53 | | | | 0.27 | | |
Dividends from net investment income | | | (0.17 | ) | | | (0.83 | ) | | | (0.33 | ) | | | (0.74 | ) | | | (0.47 | ) | |
Return of capital | | | (0.16 | ) | | | — | | | | — | | | | (0.02 | ) | | | — | | |
Total dividends and return of capital | | | (0.33 | ) | | | (0.83 | ) | | | (0.33 | ) | | | (0.76 | ) | | | (0.47 | ) | |
Net asset value, end of year | | $ | 10.54 | | | $ | 11.37 | | | $ | 12.49 | | | $ | 11.40 | | | $ | 11.63 | | |
Total investment return2 | | | (4.60 | )% | | | (2.04 | )% | | | 12.54 | % | | | 4.68 | % | | | 2.71 | % | |
Ratios to average net assets: | |
Expenses before fee waivers and/or expense reimbursements | | | 1.09 | %3 | | | 1.11 | % | | | 1.11 | % | | | 1.01 | % | | | 0.94 | % | |
Expenses after fee waivers and/or expense reimbursements | | | 1.00 | %3 | | | 1.00 | % | | | 1.00 | % | | | 0.96 | % | | | 0.89 | % | |
Net investment income | | | 1.88 | % | | | 2.37 | % | | | 2.38 | % | | | 2.57 | % | | | 3.19 | % | |
Supplemental data: | |
Net assets, end of year (000's) | | $ | 5,171 | | | $ | 4,720 | | | $ | 5,216 | | | $ | 5,825 | | | $ | 7,773 | | |
Portfolio turnover | | | 63 | % | | | 40 | % | | | 66 | % | | | 67 | % | | | 37 | % | |
1 Calculated using the average shares method.
2 Total investment return is calculated assuming a $10,000 investment on the first day of each year reported, reinvestment of all dividends and other distributions, if any, at net asset value on the ex-dividend dates, and a sale at net asset value on the last day of each year reported. The figures do not include any applicable sales charges, redemption fees or program fees; results would be lower if they were included. Returns do not reflect the deduction of taxes that a shareholder would pay on Portfolio distributions or the redemption of Portfolio shares.
3 Includes interest expense representing less than 0.005%.
4 The investment manager recouped expenses previously reimbursed by the investment manager on behalf of the Portfolio, not to exceed the expense cap.
254
| | | Class C | |
| | | Years ended July 31, | |
| | | 2013 | | 2012 | | 2011 | | 2010 | | 2009 | |
Net asset value, beginning of year | | $ | 11.41 | | | $ | 12.52 | | | $ | 11.43 | | | $ | 11.64 | | | $ | 11.85 | | |
Net investment income1 | | | 0.13 | | | | 0.20 | | | | 0.20 | | | | 0.21 | | | | 0.25 | | |
Net realized and unrealized gains (losses) | | | (0.72 | ) | | | (0.56 | ) | | | 1.14 | | | | 0.24 | | | | (0.08 | ) | |
Net increase (decrease) from operations | | | (0.59 | ) | | | (0.36 | ) | | | 1.34 | | | | 0.45 | | | | 0.17 | | |
Dividends from net investment income | | | (0.13 | ) | | | (0.75 | ) | | | (0.25 | ) | | | (0.64 | ) | | | (0.38 | ) | |
Return of capital | | | (0.12 | ) | | | — | | | | — | | | | (0.02 | ) | | | — | | |
Total dividends and return of capital | | | (0.25 | ) | | | (0.75 | ) | | | (0.25 | ) | | | (0.66 | ) | | | (0.38 | ) | |
Net asset value, end of year | | $ | 10.57 | | | $ | 11.41 | | | $ | 12.52 | | | $ | 11.43 | | | $ | 11.64 | | |
Total investment return2 | | | (5.26 | )% | | | (2.72 | )% | | | 11.83 | % | | | 3.81 | % | | | 1.85 | % | |
Ratios to average net assets: | |
Expenses before fee waivers and/or expense reimbursements/recoupments | | | 1.75 | %3 | | | 1.75 | % | | | 1.74 | % | | | 1.77 | % | | | 1.80 | % | |
Expenses after fee waivers and/or expense reimbursements/recoupments | | | 1.69 | %3 | | | 1.69 | % | | | 1.69 | % | | | 1.72 | %4 | | | 1.75 | %4 | |
Net investment income | | | 1.17 | % | | | 1.68 | % | | | 1.69 | % | | | 1.83 | % | | | 2.32 | % | |
Supplemental data: | |
Net assets, end of year (000's) | | $ | 5,862 | | | $ | 6,949 | | | $ | 8,034 | | | $ | 7,154 | | | $ | 7,234 | | |
Portfolio turnover | | | 63 | % | | | 40 | % | | | 66 | % | | | 67 | % | | | 37 | % | |
| | | Class P | |
| | | Years ended July 31, | |
| | | 2013 | | 2012 | | 2011 | | 2010 | | 2009 | |
Net asset value, beginning of year | | $ | 11.40 | | | $ | 12.52 | | | $ | 11.43 | | | $ | 11.64 | | | $ | 11.84 | | |
Net investment income1 | | | 0.21 | | | | 0.28 | | | | 0.28 | | | | 0.30 | | | | 0.33 | | |
Net realized and unrealized gains (losses) | | | (0.72 | ) | | | (0.57 | ) | | | 1.14 | | | | 0.23 | | | | (0.07 | ) | |
Net increase (decrease) from operations | | | (0.51 | ) | | | (0.29 | ) | | | 1.42 | | | | 0.53 | | | | 0.26 | | |
Dividends from net investment income | | | (0.17 | ) | | | (0.83 | ) | | | (0.33 | ) | | | (0.72 | ) | | | (0.46 | ) | |
Return of capital | | | (0.16 | ) | | | — | | | | — | | | | (0.02 | ) | | | — | | |
Total dividends and return of capital | | | (0.33 | ) | | | (0.83 | ) | | | (0.33 | ) | | | (0.74 | ) | | | (0.46 | ) | |
Net asset value, end of year | | $ | 10.56 | | | $ | 11.40 | | | $ | 12.52 | | | $ | 11.43 | | | $ | 11.64 | | |
Total investment return2 | | | (4.59 | )% | | | (2.12 | )% | | | 12.60 | % | | | 4.65 | % | | | 2.60 | % | |
Ratios to average net assets: | |
Expenses before fee waivers and/or expense reimbursements | | | 1.10 | %3 | | | 1.11 | % | | | 1.11 | % | | | 1.15 | % | | | 1.17 | % | |
Expenses after fee waivers and/or expense reimbursements | | | 1.00 | %3 | | | 1.00 | % | | | 1.00 | % | | | 1.00 | % | | | 1.00 | % | |
Net investment income | | | 1.88 | % | | | 2.37 | % | | | 2.38 | % | | | 2.56 | % | | | 3.09 | % | |
Supplemental data: | |
Net assets, end of year (000's) | | $ | 467,121 | | | $ | 430,268 | | | $ | 465,625 | | | $ | 404,680 | | | $ | 364,616 | | |
Portfolio turnover | | | 63 | % | | | 40 | % | | | 66 | % | | | 67 | % | | | 37 | % | |
See accompanying notes to financial statements.
255
PACE Select Advisors Trust
PACE High Yield Investments
Financial highlights
Selected data for a share of beneficial interest outstanding throughout each period is presented below:
| | | Class A | |
| | | Years ended July 31, | |
| | | | |
| | | 2013 | | 2012 | | 2011 | | 2010 | | 2009 | |
Net asset value, beginning of period | | $ | 10.15 | | | $ | 10.39 | | | $ | 10.17 | | | $ | 8.94 | | | $ | 9.04 | | |
Net investment income2 | | | 0.64 | | | | 0.69 | | | | 0.75 | | | | 0.82 | | | | 0.66 | | |
Net realized and unrealized gains (losses) | | | 0.41 | | | | (0.12 | ) | | | 0.25 | | | | 1.21 | | | | 0.02 | | |
Net increase from operations | | | 1.05 | | | | 0.57 | | | | 1.00 | | | | 2.03 | | | | 0.68 | | |
Dividends from net investment income | | | (0.63 | ) | | | (0.70 | ) | | | (0.73 | ) | | | (0.74 | ) | | | (0.78 | ) | |
Distributions from net realized gains | | | (0.15 | ) | | | (0.11 | ) | | | (0.05 | ) | | | (0.06 | ) | | | — | | |
Return of capital | | | (0.01 | ) | | | — | | | | — | | | | — | | | | — | | |
Total dividends and distributions | | | (0.79 | ) | | | (0.81 | ) | | | (0.78 | ) | | | (0.80 | ) | | | (0.78 | ) | |
Net asset value, end of period | | $ | 10.41 | | | $ | 10.15 | | | $ | 10.39 | | | $ | 10.17 | | | $ | 8.94 | | |
Total investment return3 | | | 10.48 | % | | | 5.97 | % | | | 10.00 | % | | | 23.35 | % | | | 9.49 | % | |
Ratios to average net assets: | |
Expenses before fee waivers and/or expense reimbursements/recoupments | | | 1.27 | % | | | 1.32 | % | | | 1.31 | % | | | 1.35 | % | | | 1.46 | % | |
Expenses after fee waivers and/or expense reimbursements/recoupments | | | 1.27 | % | | | 1.33 | %5 | | | 1.33 | %5 | | | 1.35 | %5 | | | 1.35 | % | |
Net investment income | | | 6.07 | % | | | 7.01 | % | | | 7.11 | % | | | 8.36 | % | | | 8.46 | % | |
Supplemental data: | |
Net assets, end of period (000's) | | $ | 23,400 | | | $ | 22,405 | | | $ | 25,550 | | | $ | 13,158 | | | $ | 7,538 | | |
Portfolio turnover | | | 26 | % | | | 20 | % | | | 36 | % | | | 30 | % | | | 49 | % | |
| | | Class Y | |
| | | Years ended July 31, | | Period ended | |
| | | | | July 31, | |
| | | 2013 | | 2012 | | 2011 | | 2010 | | 20096 | |
Net asset value, beginning of period | | $ | 10.18 | | | $ | 10.42 | | | $ | 10.20 | | | $ | 8.95 | | | $ | 6.83 | | |
Net investment income2 | | | 0.66 | | | | 0.72 | | | | 0.74 | | | | 0.85 | | | | 0.42 | | |
Net realized and unrealized gains (losses) | | | 0.41 | | | | (0.12 | ) | | | 0.28 | | | | 1.22 | | | | 2.11 | | |
Net increase from operations | | | 1.07 | | | | 0.60 | | | | 1.02 | | | | 2.07 | | | | 2.53 | | |
Dividends from net investment income | | | (0.65 | ) | | | (0.73 | ) | | | (0.75 | ) | | | (0.76 | ) | | | (0.41 | ) | |
Distributions from net realized gains | | | (0.15 | ) | | | (0.11 | ) | | | (0.05 | ) | | | (0.06 | ) | | | — | | |
Return of capital | | | (0.01 | ) | | | — | | | | — | | | | — | | | | — | | |
Total dividends and distributions | | | (0.81 | ) | | | (0.84 | ) | | | (0.80 | ) | | | (0.82 | ) | | | (0.41 | ) | |
Net asset value, end of period | | $ | 10.44 | | | $ | 10.18 | | | $ | 10.42 | | | $ | 10.20 | | | $ | 8.95 | | |
Total investment return3 | | | 10.74 | % | | | 6.29 | % | | | 10.24 | % | | | 23.82 | % | | | 38.23 | % | |
Ratios to average net assets: | |
Expenses before fee waivers and/or expense reimbursements/recoupments | | | 1.02 | % | | | 1.03 | % | | | 1.03 | % | | | 1.10 | % | | | 1.37 | %4 | |
Expenses after fee waivers and/or expense reimbursements/recoupments | | | 1.02 | % | | | 1.03 | % | | | 1.05 | %5 | | | 1.10 | % | | | 1.10 | %4 | |
Net investment income | | | 6.26 | % | | | 7.25 | % | | | 7.86 | % | | | 8.61 | % | | | 9.13 | %4 | |
Supplemental data: | |
Net assets, end of period (000's) | | $ | 1,552 | | | $ | 572 | | | $ | 385 | | | $ | 9 | | | $ | 7 | | |
Portfolio turnover | | | 26 | % | | | 20 | % | | | 36 | % | | | 30 | % | | | 49 | % | |
1 For the period January 21, 2009 (commencement of issuance) through July 31, 2009.
2 Calculated using the average shares method.
3 Total investment return is calculated assuming a $10,000 investment on the first day of each period reported, reinvestment of all dividends and other distributions, if any, at net asset value on the ex-dividend dates, and a sale at net asset value on the last day of each period reported. The figures do not include any applicable sales charges, redemption fees or program fees; results would be lower if they were included. Total investment return for periods of less than one year has not been annualized. Returns do not reflect the deduction of taxes that a shareholder would pay on Portfolio distributions or the redemption of Portfolio shares.
4 Annualized.
5 The investment manager recouped expenses previously reimbursed by the investment manager on behalf of the Portfolio, not to exceed the expense cap.
6 For the period December 26, 2008 (recommencement of issuance) through July 31, 2009.
256
| | | Class C | |
| | | Years ended July 31, | | Period ended | |
| | | | | July 31, | |
| | | 2013 | | 2012 | | 2011 | | 2010 | | 20091 | |
Net asset value, beginning of period | | $ | 10.14 | | | $ | 10.38 | | | $ | 10.16 | | | $ | 8.93 | | | $ | 7.49 | | |
Net investment income2 | | | 0.59 | | | | 0.64 | | | | 0.71 | | | | 0.77 | | | | 0.29 | | |
Net realized and unrealized gains (losses) | | | 0.41 | | | | (0.12 | ) | | | 0.24 | | | | 1.21 | | | | 1.54 | | |
Net increase from operations | | | 1.00 | | | | 0.52 | | | | 0.95 | | | | 1.98 | | | | 1.83 | | |
Dividends from net investment income | | | (0.58 | ) | | | (0.65 | ) | | | (0.68 | ) | | | (0.69 | ) | | | (0.39 | ) | |
Distributions from net realized gains | | | (0.15 | ) | | | (0.11 | ) | | | (0.05 | ) | | | (0.06 | ) | | | — | | |
Return of capital | | | (0.01 | ) | | | — | | | | — | | | | — | | | | — | | |
Total dividends and distributions | | | (0.74 | ) | | | (0.76 | ) | | | (0.73 | ) | | | (0.75 | ) | | | (0.39 | ) | |
Net asset value, end of period | | $ | 10.40 | | | $ | 10.14 | | | $ | 10.38 | | | $ | 10.16 | | | $ | 8.93 | | |
Total investment return3 | | | 9.98 | % | | | 5.51 | % | | | 9.50 | % | | | 22.81 | % | | | 25.40 | % | |
Ratios to average net assets: | |
Expenses before fee waivers and/or expense reimbursements/recoupments | | | 1.73 | % | | | 1.77 | % | | | 1.77 | % | | | 1.81 | % | | | 1.92 | %4 | |
Expenses after fee waivers and/or expense reimbursements/recoupments | | | 1.73 | % | | | 1.77 | % | | | 1.77 | % | | | 1.81 | %5 | | | 1.85 | %4 | |
Net investment income | | | 5.61 | % | | | 6.49 | % | | | 6.69 | % | | | 7.91 | % | | | 6.96 | %4 | |
Supplemental data: | |
Net assets, end of period (000's) | | $ | 5,607 | | | $ | 5,832 | | | $ | 3,791 | | | $ | 2,834 | | | $ | 1,819 | | |
Portfolio turnover | | | 26 | % | | | 20 | % | | | 36 | % | | | 30 | % | | | 49 | % | |
| | | Class P | |
| | | Years ended July 31, | |
| | | | |
| | | 2013 | | 2012 | | 2011 | | 2010 | | 2009 | |
Net asset value, beginning of period | | $ | 10.17 | | | $ | 10.41 | | | $ | 10.18 | | | $ | 8.95 | | | $ | 9.04 | | |
Net investment income2 | | | 0.66 | | | | 0.72 | | | | 0.77 | | | | 0.85 | | | | 0.69 | | |
Net realized and unrealized gains (losses) | | | 0.41 | | | | (0.14 | ) | | | 0.26 | | | | 1.20 | | | | 0.02 | | |
Net increase from operations | | | 1.07 | | | | 0.58 | | | | 1.03 | | | | 2.05 | | | | 0.71 | | |
Dividends from net investment income | | | (0.65 | ) | | | (0.71 | ) | | | (0.75 | ) | | | (0.76 | ) | | | (0.80 | ) | |
Distributions from net realized gains | | | (0.15 | ) | | | (0.11 | ) | | | (0.05 | ) | | | (0.06 | ) | | | — | | |
Return of capital | | | (0.01 | ) | | | — | | | | — | | | | — | | | | — | | |
Total dividends and distributions | | | (0.81 | ) | | | (0.82 | ) | | | (0.80 | ) | | | (0.82 | ) | | | (0.80 | ) | |
Net asset value, end of period | | $ | 10.43 | | | $ | 10.17 | | | $ | 10.41 | | | $ | 10.18 | | | $ | 8.95 | | |
Total investment return3 | | | 10.70 | % | | | 6.19 | % | | | 10.30 | % | | | 23.60 | % | | | 9.87 | % | |
Ratios to average net assets: | |
Expenses before fee waivers and/or expense reimbursements/recoupments | | | 1.11 | % | | | 1.15 | % | | | 1.15 | % | | | 1.19 | % | | | 1.34 | % | |
Expenses after fee waivers and/or expense reimbursements/recoupments | | | 1.05 | % | | | 1.10 | % | | | 1.10 | % | | | 1.10 | % | | | 1.10 | % | |
Net investment income | | | 6.28 | % | | | 7.21 | % | | | 7.36 | % | | | 8.60 | % | | | 8.80 | % | |
Supplemental data: | |
Net assets, end of period (000's) | | $ | 357,726 | | | $ | 271,352 | | | $ | 248,197 | | | $ | 209,650 | | | $ | 147,029 | | |
Portfolio turnover | | | 26 | % | | | 20 | % | | | 36 | % | | | 30 | % | | | 49 | % | |
See accompanying notes to financial statements.
257
PACE Select Advisors Trust
PACE Large Co Value Equity Investments
Financial highlights
Selected data for a share of beneficial interest outstanding throughout each year is presented below:
| | | Class A | |
| | | Years ended July 31, | |
| | | 20131 | | 2012 | | 2011 | | 2010 | | 2009 | |
Net asset value, beginning of year | | $ | 17.27 | | | $ | 17.10 | | | $ | 14.76 | | | $ | 13.16 | | | $ | 16.67 | | |
Net investment income (loss)2 | | | 0.23 | | | | 0.24 | | | | 0.16 | | | | 0.12 | | | | 0.19 | | |
Net realized and unrealized gains (losses) | | | 5.27 | | | | 0.15 | | | | 2.31 | | | | 1.62 | | | | (3.44 | ) | |
Net increase (decrease) from operations | | | 5.50 | | | | 0.39 | | | | 2.47 | | | | 1.74 | | | | (3.25 | ) | |
Dividends from net investment income | | | (0.24 | ) | | | (0.22 | ) | | | (0.13 | ) | | | (0.14 | ) | | | (0.26 | ) | |
Net asset value, end of year | | $ | 22.53 | | | $ | 17.27 | | | $ | 17.10 | | | $ | 14.76 | | | $ | 13.16 | | |
Total investment return4 | | | 32.12 | % | | | 2.41 | % | | | 16.79 | % | | | 13.20 | % | | | (19.27 | )% | |
Ratios to average net assets: | |
Expenses before fee waivers and/or expense reimbursements/recoupments | | | 1.16 | % | | | 1.18 | % | | | 1.17 | % | | | 1.20 | % | | | 1.24 | % | |
Expenses after fee waivers and/or expense reimbursements/recoupments | | | 1.15 | % | | | 1.18 | % | | | 1.17 | % | | | 1.20 | % | | | 1.24 | % | |
Net investment income (loss) | | | 1.16 | % | | | 1.43 | % | | | 0.94 | % | | | 0.81 | % | | | 1.52 | % | |
Supplemental data: | |
Net assets, end of year (000's) | | $ | 151,583 | | | $ | 132,417 | | | $ | 147,471 | | | $ | 143,284 | | | $ | 146,510 | | |
Portfolio turnover | | | 71 | % | | | 62 | % | | | 49 | % | | | 61 | % | | | 87 | % | |
| | | Class Y | |
| | | Years ended July 31, | |
| | | 20131 | | 2012 | | 2011 | | 2010 | | 2009 | |
Net asset value, beginning of year | | $ | 17.32 | | | $ | 17.15 | | | $ | 14.81 | | | $ | 13.21 | | | $ | 16.75 | | |
Net investment income2 | | | 0.27 | | | | 0.28 | | | | 0.20 | | | | 0.16 | | | | 0.23 | | |
Net realized and unrealized gains (losses) | | | 5.29 | | | | 0.15 | | | | 2.31 | | | | 1.63 | | | | (3.45 | ) | |
Net increase (decrease) from operations | | | 5.56 | | | | 0.43 | | | | 2.51 | | | | 1.79 | | | | (3.22 | ) | |
Dividends from net investment income | | | (0.28 | ) | | | (0.26 | ) | | | (0.17 | ) | | | (0.19 | ) | | | (0.32 | ) | |
Net asset value, end of year | | $ | 22.60 | | | $ | 17.32 | | | $ | 17.15 | | | $ | 14.81 | | | $ | 13.21 | | |
Total investment return4 | | | 32.46 | % | | | 2.68 | % | | | 17.00 | % | | | 13.55 | % | | | (18.93 | )% | |
Ratios to average net assets: | |
Expenses before fee waivers and/or expense reimbursements | | | 0.92 | % | | | 0.94 | % | | | 0.94 | % | | | 0.89 | % | | | 0.86 | % | |
Expenses after fee waivers and/or expense reimbursements | | | 0.91 | % | | | 0.94 | % | | | 0.94 | % | | | 0.89 | % | | | 0.86 | % | |
Net investment income | | | 1.40 | % | | | 1.66 | % | | | 1.17 | % | | | 1.11 | % | | | 1.90 | % | |
Supplemental data: | |
Net assets, end of year (000's) | | $ | 18,536 | | | $ | 15,642 | | | $ | 16,984 | | | $ | 17,345 | | | $ | 23,834 | | |
Portfolio turnover | | | 71 | % | | | 62 | % | | | 49 | % | | | 61 | % | | | 87 | % | |
1 As of the close of business, May 28, 2013, Westwood Management Corp. was terminated as investment sub-advisor and Robeco Investment Management became an investment sub-advisor of the Portfolio on May 29, 2013. Institutional Capital LLC and Pzena Investment Management LLC also continue to provide a portion of the investment advisory function.
2 Calculated using the average shares method.
3 Amount represents less than $0.005 per share.
4 Total investment return is calculated assuming a $10,000 investment on the first day of each year reported, reinvestment of all dividends and other distributions, if any, at net asset value on the ex-dividend dates, and a sale at net asset value on the last day of each year reported. The figures do not include any applicable sales charges, redemption fees or program fees; results would be lower if they were included. Returns do not reflect the deduction of taxes that a shareholder would pay on Portfolio distributions or the redemption of Portfolio shares.
5 The investment manager recouped expenses previously reimbursed by the investment manager on behalf of the Portfolio, not to exceed the expense cap.
258
| | | Class C | |
| | | Years ended July 31, | |
| | | 20131 | | 2012 | | 2011 | | 2010 | | 2009 | |
Net asset value, beginning of year | | $ | 17.26 | | | $ | 17.07 | | | $ | 14.73 | | | $ | 13.15 | | | $ | 16.59 | | |
Net investment income (loss)2 | | | 0.07 | | | | 0.10 | | | | 0.02 | | | | (0.00 | )3 | | | 0.09 | | |
Net realized and unrealized gains (losses) | | | 5.29 | | | | 0.16 | | | | 2.32 | | | | 1.61 | | | | (3.41 | ) | |
Net increase (decrease) from operations | | | 5.36 | | | | 0.26 | | | | 2.34 | | | | 1.61 | | | | (3.32 | ) | |
Dividends from net investment income | | | (0.09 | ) | | | (0.07 | ) | | | — | | | | (0.03 | ) | | | (0.12 | ) | |
Net asset value, end of year | | $ | 22.53 | | | $ | 17.26 | | | $ | 17.07 | | | $ | 14.73 | | | $ | 13.15 | | |
Total investment return4 | | | 31.13 | % | | | 1.55 | % | | | 15.81 | % | | | 12.31 | % | | | (19.89 | )% | |
Ratios to average net assets: | |
Expenses before fee waivers and/or expense reimbursements/recoupments | | | 1.95 | % | | | 1.98 | % | | | 1.96 | % | | | 2.02 | % | | | 2.05 | % | |
Expenses after fee waivers and/or expense reimbursements/recoupments | | | 1.95 | % | | | 1.98 | % | | | 1.98 | %5 | | | 2.02 | %5 | | | 2.02 | % | |
Net investment income (loss) | | | 0.36 | % | | | 0.63 | % | | | 0.13 | % | | | (0.01 | )% | | | 0.74 | % | |
Supplemental data: | |
Net assets, end of year (000's) | | $ | 14,437 | | | $ | 12,439 | | | $ | 14,807 | | | $ | 15,272 | | | $ | 16,560 | | |
Portfolio turnover | | | 71 | % | | | 62 | % | | | 49 | % | | | 61 | % | | | 87 | % | |
| | | Class P | |
| | | Years ended July 31, | |
| | | 20131 | | 2012 | | 2011 | | 2010 | | 2009 | |
Net asset value, beginning of year | | $ | 17.26 | | | $ | 17.10 | | | $ | 14.76 | | | $ | 13.16 | | | $ | 16.69 | | |
Net investment income2 | | | 0.27 | | | | 0.28 | | | | 0.20 | | | | 0.16 | | | | 0.22 | | |
Net realized and unrealized gains (losses) | | | 5.27 | | | | 0.14 | | | | 2.31 | | | | 1.61 | | | | (3.44 | ) | |
Net increase (decrease) from operations | | | 5.54 | | | | 0.42 | | | | 2.51 | | | | 1.77 | | | | (3.22 | ) | |
Dividends from net investment income | | | (0.28 | ) | | | (0.26 | ) | | | (0.17 | ) | | | (0.17 | ) | | | (0.31 | ) | |
Net asset value, end of year | | $ | 22.52 | | | $ | 17.26 | | | $ | 17.10 | | | $ | 14.76 | | | $ | 13.16 | | |
Total investment return4 | | | 32.47 | % | | | 2.64 | % | | | 17.07 | % | | | 13.48 | % | | | (19.01 | )% | |
Ratios to average net assets: | |
Expenses before fee waivers and/or expense reimbursements | | | 0.91 | % | | | 0.93 | % | | | 0.93 | % | | | 0.95 | % | | | 0.99 | % | |
Expenses after fee waivers and/or expense reimbursements | | | 0.91 | % | | | 0.93 | % | | | 0.93 | % | | | 0.95 | % | | | 0.99 | % | |
Net investment income | | | 1.40 | % | | | 1.66 | % | | | 1.18 | % | | | 1.05 | % | | | 1.76 | % | |
Supplemental data: | |
Net assets, end of year (000's) | | $ | 1,135,014 | | | $ | 991,824 | | | $ | 1,020,412 | | | $ | 899,926 | | | $ | 819,420 | | |
Portfolio turnover | | | 71 | % | | | 62 | % | | | 49 | % | | | 61 | % | | | 87 | % | |
See accompanying notes to financial statements.
259
PACE Select Advisors Trust
PACE Large Co Growth Equity Investments
Financial highlights
Selected data for a share of beneficial interest outstanding throughout each year is presented below:
| | | Class A | |
| | | Years ended July 31, | |
| | | 20131 | | 2012 | | 20112 | | 20103 | | 2009 | |
Net asset value, beginning of year | | $ | 19.40 | | | $ | 18.62 | | | $ | 14.95 | | | $ | 13.36 | | | $ | 16.67 | | |
Net investment income (loss)4 | | | 0.08 | | | | (0.00 | )5 | | | (0.00 | )5 | | | (0.01 | ) | | | 0.03 | | |
Net realized and unrealized gains (losses) | | | 4.08 | | | | 0.78 | | | | 3.67 | | | | 1.63 | | | | (3.27 | ) | |
Net increase (decrease) from operations | | | 4.16 | | | | 0.78 | | | | 3.67 | | | | 1.62 | | | | (3.24 | ) | |
Dividends from net investment income | | | (0.04 | ) | | | — | | | | — | | | | (0.03 | ) | | | — | | |
Distributions from net realized gains | | | — | | | | — | | | | — | | | | — | | | | (0.07 | ) | |
Total dividends and distributions | | | (0.04 | ) | | | — | | | | — | | | | (0.03 | ) | | | (0.07 | ) | |
Net asset value, end of year | | $ | 23.52 | | | $ | 19.40 | | | $ | 18.62 | | | $ | 14.95 | | | $ | 13.36 | | |
Total investment return6 | | | 21.45 | % | | | 4.19 | % | | | 24.55 | % | | | 12.12 | % | | | (19.39 | )% | |
Ratios to average net assets: | |
Expenses before fee waivers and/or expense reimbursements/recoupments | | | 1.21 | % | | | 1.23 | % | | | 1.23 | % | | | 1.26 | % | | | 1.30 | % | |
Expenses after fee waivers and/or expense reimbursements/recoupments | | | 1.21 | % | | | 1.23 | % | | | 1.22 | % | | | 1.23 | % | | | 1.26 | % | |
Net investment income (loss) | | | 0.40 | % | | | (0.02 | )% | | | (0.02 | )% | | | (0.08 | )% | | | 0.21 | % | |
Supplemental data: | |
Net assets, end of year (000's) | | $ | 63,108 | | | $ | 59,435 | | | $ | 64,315 | | | $ | 55,978 | | | $ | 56,038 | | |
Portfolio turnover | | | 76 | % | | | 54 | % | | | 84 | % | | | 91 | % | | | 100 | % | |
| | | Class Y | |
| | | Years ended July 31, | |
| | | 20131 | | 2012 | | 20112 | | 20103 | | 2009 | |
Net asset value, beginning of year | | $ | 19.86 | | | $ | 19.05 | | | $ | 15.29 | | | $ | 13.67 | | | $ | 17.03 | | |
Net investment income4 | | | 0.14 | | | | 0.04 | | | | 0.04 | | | | 0.04 | | | | 0.08 | | |
Net realized and unrealized gains (losses) | | | 4.17 | | | | 0.81 | | | | 3.75 | | | | 1.67 | | | | (3.34 | ) | |
Net increase (decrease) from operations | | | 4.31 | | | | 0.85 | | | | 3.79 | | | | 1.71 | | | | (3.26 | ) | |
Dividends from net investment income | | | (0.11 | ) | | | (0.04 | ) | | | (0.03 | ) | | | (0.09 | ) | | | (0.03 | ) | |
Distributions from net realized gains | | | — | | | | — | | | | — | | | | — | | | | (0.07 | ) | |
Total dividends and distributions | | | (0.11 | ) | | | (0.04 | ) | | | (0.03 | ) | | | (0.09 | ) | | | (0.10 | ) | |
Net asset value, end of year | | $ | 24.06 | | | $ | 19.86 | | | $ | 19.05 | | | $ | 15.29 | | | $ | 13.67 | | |
Total investment return6 | | | 21.77 | % | | | 4.49 | % | | | 24.83 | % | | | 12.49 | % | | | (19.04 | )% | |
Ratios to average net assets: | |
Expenses before fee waivers and/or expense reimbursements | | | 0.96 | % | | | 0.97 | % | | | 0.99 | % | | | 0.94 | % | | | 0.88 | % | |
Expenses after fee waivers and/or expense reimbursements | | | 0.96 | % | | | 0.97 | % | | | 0.98 | % | | | 0.91 | % | | | 0.84 | % | |
Net investment income | | | 0.66 | % | | | 0.23 | % | | | 0.22 | % | | | 0.25 | % | | | 0.63 | % | |
Supplemental data: | |
Net assets, end of year (000's) | | $ | 14,814 | | | $ | 13,258 | | | $ | 13,858 | | | $ | 12,619 | | | $ | 16,885 | | |
Portfolio turnover | | | 76 | % | | | 54 | % | | | 84 | % | | | 91 | % | | | 100 | % | |
1 As of the close of business, October 4, 2012, Marisco Capital Management, LLC and Wellington Management Company, LLP were terminated as investment sub-advisors to PACE Large Co Growth Equity Investments and J.P. Morgan Investment Management became an investment sub-advisor of the Portfolio on October 5, 2012. Delaware Management Company and Roxbury Capital Management, LLC also continue to provide a portion of the investment advisory function.
2 A portion of the investment advisory function for this Portfolio was transferred from SSgA Funds Management, Inc. to Roxbury Capital Management, LLC and Delaware Management Company at the close of business on November 29, 2010.
3 A portion of the investment advisory function for this Portfolio was transferred to Roxbury Capital Management, LLC on May 25, 2010.
4 Calculated using the average shares method.
5 Amount represents less than $0.005 per share.
6 Total investment return is calculated assuming a $10,000 investment on the first day of each year reported, reinvestment of all dividends and other distributions, if any, at net asset value on the ex-dividend dates, and a sale at net asset value on the last day of each year reported. The figures do not include any applicable sales charges, redemption fees or program fees; results would be lower if they were included. Returns do not reflect the deduction of taxes that a shareholder would pay on Portfolio distributions or the redemption of Portfolio shares.
7 The investment manager recouped expenses previously reimbursed by the investment manager on behalf of the Portfolio, not to exceed the expense cap.
260
| | | Class C | |
| | | Years ended July 31, | |
| | | 20131 | | 2012 | | 20112 | | 20103 | | 2009 | |
Net asset value, beginning of year | | $ | 17.67 | | | $ | 17.10 | | | $ | 13.84 | | | $ | 12.45 | | | $ | 15.66 | | |
Net investment income (loss)4 | | | (0.08 | ) | | | (0.14 | ) | | | (0.14 | ) | | | (0.12 | ) | | | (0.07 | ) | |
Net realized and unrealized gains (losses) | | | 3.70 | | | | 0.71 | | | | 3.40 | | | | 1.51 | | | | (3.07 | ) | |
Net increase (decrease) from operations | | | 3.62 | | | | 0.57 | | | | 3.26 | | | | 1.39 | | | | (3.14 | ) | |
Dividends from net investment income | | | — | | | | — | | | | — | | | | — | | | | — | | |
Distributions from net realized gains | | | — | | | | — | | | | — | | | | — | | | | (0.07 | ) | |
Total dividends and distributions | | | — | | | | — | | | | — | | | | — | | | | (0.07 | ) | |
Net asset value, end of year | | $ | 21.29 | | | $ | 17.67 | | | $ | 17.10 | | | $ | 13.84 | | | $ | 12.45 | | |
Total investment return6 | | | 20.49 | % | | | 3.33 | % | | | 23.47 | % | | | 11.24 | % | | | (20.00 | )% | |
Ratios to average net assets: | |
Expenses before fee waivers and/or expense reimbursements/recoupments | | | 2.04 | % | | | 2.07 | % | | | 2.07 | % | | | 2.13 | % | | | 2.20 | % | |
Expenses after fee waivers and/or expense reimbursements/recoupments | | | 2.05 | %7 | | | 2.05 | % | | | 2.05 | % | | | 2.05 | % | | | 2.05 | % | |
Net investment income (loss) | | | (0.43 | )% | | | (0.84 | )% | | | (0.84 | )% | | | (0.90 | )% | | | (0.57 | )% | |
Supplemental data: | |
Net assets, end of year (000's) | | $ | 4,033 | | | $ | 3,720 | | | $ | 4,209 | | | $ | 3,956 | | | $ | 4,170 | | |
Portfolio turnover | | | 76 | % | | | 54 | % | | | 84 | % | | | 91 | % | | | 100 | % | |
| | | Class P | |
| | | Years ended July 31, | |
| | | 20131 | | 2012 | | 20112 | | 20103 | | 2009 | |
Net asset value, beginning of year | | $ | 19.77 | | | $ | 18.97 | | | $ | 15.21 | | | $ | 13.59 | | | $ | 16.94 | | |
Net investment income4 | | | 0.14 | | | | 0.05 | | | | 0.04 | | | | 0.03 | | | | 0.06 | | |
Net realized and unrealized gains (losses) | | | 4.15 | | | | 0.79 | | | | 3.75 | | | | 1.66 | | | | (3.32 | ) | |
Net increase (decrease) from operations | | | 4.29 | | | | 0.84 | | | | 3.79 | | | | 1.69 | | | | (3.26 | ) | |
Dividends from net investment income | | | (0.11 | ) | | | (0.04 | ) | | | (0.03 | ) | | | (0.07 | ) | | | (0.02 | ) | |
Distributions from net realized gains | | | — | | | | — | | | | — | | | | — | | | | (0.07 | ) | |
Total dividends and distributions | | | (0.11 | ) | | | (0.04 | ) | | | (0.03 | ) | | | (0.07 | ) | | | (0.09 | ) | |
Net asset value, end of year | | $ | 23.95 | | | $ | 19.77 | | | $ | 18.97 | | | $ | 15.21 | | | $ | 13.59 | | |
Total investment return6 | | | 21.79 | % | | | 4.48 | % | | | 24.92 | % | | | 12.42 | % | | | (19.19 | )% | |
Ratios to average net assets: | |
Expenses before fee waivers and/or expense reimbursements | | | 0.95 | % | | | 0.96 | % | | | 0.97 | % | | | 0.99 | % | | | 1.01 | % | |
Expenses after fee waivers and/or expense reimbursements | | | 0.95 | % | | | 0.96 | % | | | 0.96 | % | | | 0.96 | % | | | 0.97 | % | |
Net investment income | | | 0.65 | % | | | 0.24 | % | | | 0.24 | % | | | 0.19 | % | | | 0.50 | % | |
Supplemental data: | |
Net assets, end of year (000's) | | $ | 1,113,514 | | | $ | 1,036,636 | | | $ | 1,068,052 | | | $ | 895,889 | | | $ | 822,192 | | |
Portfolio turnover | | | 76 | % | | | 54 | % | | | 84 | % | | | 91 | % | | | 100 | % | |
See accompanying notes to financial statements.
261
PACE Select Advisors Trust
PACE Small/Medium Co Value Equity Investments
Financial highlights
Selected data for a share of beneficial interest outstanding throughout each year is presented below:
| | | Class A | |
| | | Years ended July 31, | |
| | | 20131 | | 20122 | | 2011 | | 2010 | | 20093 | |
Net asset value, beginning of year | | $ | 16.61 | | | $ | 17.05 | | | $ | 14.28 | | | $ | 11.99 | | | $ | 14.27 | | |
Net investment income (loss)4 | | | 0.13 | | | | 0.03 | | | | (0.03 | ) | | | (0.01 | ) | | | 0.05 | | |
Net realized and unrealized gains (losses) | | | 5.55 | | | | (0.47 | ) | | | 2.80 | | | | 2.31 | | | | (2.25 | ) | |
Net increase (decrease) from operations | | | 5.68 | | | | (0.44 | ) | | | 2.77 | | | | 2.30 | | | | (2.20 | ) | |
Dividends from net investment income | | | (0.10 | ) | | | — | | | | — | | | | (0.01 | ) | | | (0.08 | ) | |
Distributions from net realized gains | | | — | | | | — | | | | — | | | | — | | | | (0.00 | )5 | |
Total dividends and distributions | | | (0.10 | ) | | | — | | | | — | | | | (0.01 | ) | | | (0.08 | ) | |
Net asset value, end of year | | $ | 22.19 | | | $ | 16.61 | | | $ | 17.05 | | | $ | 14.28 | | | $ | 11.99 | | |
Total investment return6 | | | 34.23 | % | | | (2.58 | )% | | | 19.40 | % | | | 19.17 | % | | | (15.29 | )% | |
Ratios to average net assets: | |
Expenses before fee waivers and/or expense reimbursements | | | 1.28 | % | | | 1.32 | % | | | 1.29 | % | | | 1.35 | % | | | 1.39 | % | |
Expenses after fee waivers and/or expense reimbursements | | | 1.28 | % | | | 1.32 | % | | | 1.29 | % | | | 1.35 | % | | | 1.38 | % | |
Net investment income (loss) | | | 0.68 | % | | | 0.21 | % | | | (0.18 | )% | | | (0.05 | )% | | | 0.44 | % | |
Supplemental data: | |
Net assets, end of year (000's) | | $ | 31,930 | | | $ | 27,101 | | | $ | 32,166 | | | $ | 27,920 | | | $ | 24,661 | | |
Portfolio turnover | | | 97 | % | | | 72 | % | | | 70 | % | | | 81 | % | | | 111 | % | |
| | | Class Y | |
| | | Years ended July 31, | |
| | | 20131 | | 20122 | | 2011 | | 2010 | | 20093 | |
Net asset value, beginning of year | | $ | 17.06 | | | $ | 17.51 | | | $ | 14.63 | | | $ | 12.29 | | | $ | 14.64 | | |
Net investment income (loss)4 | | | 0.16 | | | | 0.06 | | | | 0.01 | | | | 0.07 | | | | 0.09 | | |
Net realized and unrealized gains (losses) | | | 5.70 | | | | (0.50 | ) | | | 2.88 | | | | 2.32 | | | | (2.31 | ) | |
Net increase (decrease) from operations | | | 5.86 | | | | (0.44 | ) | | | 2.89 | | | | 2.39 | | | | (2.22 | ) | |
Dividends from net investment income | | | (0.13 | ) | | | (0.01 | ) | | | (0.01 | ) | | | (0.05 | ) | | | (0.13 | ) | |
Distributions from net realized gains | | | — | | | | — | | | | — | | | | — | | | | (0.00 | )5 | |
Total dividends and distributions | | | (0.13 | ) | | | (0.01 | ) | | | (0.01 | ) | | | (0.05 | ) | | | (0.13 | ) | |
Net asset value, end of year | | $ | 22.79 | | | $ | 17.06 | | | $ | 17.51 | | | $ | 14.63 | | | $ | 12.29 | | |
Total investment return6 | | | 34.41 | % | | | (2.45 | )% | | | 19.74 | % | | | 19.50 | % | | | (14.92 | )% | |
Ratios to average net assets: | |
Expenses before fee waivers and/or expense reimbursements | | | 1.19 | % | | | 1.16 | % | | | 1.08 | % | | | 0.97 | % | | | 0.98 | % | |
Expenses after fee waivers and/or expense reimbursements | | | 1.16 | % | | | 1.16 | % | | | 1.08 | % | | | 0.97 | % | | | 0.97 | % | |
Net investment income (loss) | | | 0.80 | % | | | 0.36 | % | | | 0.03 | % | | | 0.47 | % | | | 0.85 | % | |
Supplemental data: | |
Net assets, end of year (000's) | | $ | 768 | | | $ | 443 | | | $ | 371 | | | $ | 318 | | | $ | 3,255 | | |
Portfolio turnover | | | 97 | % | | | 72 | % | | | 70 | % | | | 81 | % | | | 111 | % | |
1 As of the close of business, October 2, 2012, Buckhead Capital Management, LLC was terminated as an investment sub-advisor to PACE Small/Medium Co Value Equity Investments. Cash from the sale of securities from the portfolio managed by Buckhead Capital Management, LLC was transferred to Kayne Anderson Rudnick Management, LLC, Systematic Financial Management, L.P. and Metropolitan West Capital Management, LLC; which continue to provide a portion of the investment advisory function.
2 A portion of the investment advisory function for this Portfolio was transferred to Kayne Anderson Rudnick Management, LLC on March 6, 2012.
3 A portion of the investment advisory function for this Portfolio was transferred to Buckhead Capital Management, LLC and Systematic Financial Management, L.P. on May 28, 2009.
4 Calculated using the average shares method.
5 Amount represents less than $0.005 per share.
6 Total investment return is calculated assuming a $10,000 investment on the first day of each year reported, reinvestment of all dividends and other distributions, if any, at net asset value on the ex-dividend dates, and a sale at net asset value on the last day of each year reported. The figures do not include any applicable sales charges, redemption fees or program fees; results would be lower if they were included. Returns do not reflect the deduction of taxes that a shareholder would pay on Portfolio distributions or the redemption of Portfolio shares.
7 The investment manager recouped expenses previously reimbursed by the investment manager on behalf of the Portfolio, not to exceed the expense cap.
262
| | | Class C | |
| | | Years ended July 31, | |
| | | 20131 | | 20122 | | 2011 | | 2010 | | 20093 | |
Net asset value, beginning of year | | $ | 15.00 | | | $ | 15.53 | | | $ | 13.10 | | | $ | 11.07 | | | $ | 13.18 | | |
Net investment income (loss)4 | | | (0.01 | )5 | | | (0.08 | ) | | | (0.14 | ) | | | (0.10 | ) | | | (0.03 | ) | |
Net realized and unrealized gains (losses) | | | 5.01 | | | | (0.45 | ) | | | 2.57 | | | | 2.13 | | | | (2.08 | ) | |
Net increase (decrease) from operations | | | 5.00 | | | | (0.53 | ) | | | 2.43 | | | | 2.03 | | | | (2.11 | ) | |
Dividends from net investment income | | | — | | | | — | | | | — | | | | — | | | | — | | |
Distributions from net realized gains | | | — | | | | — | | | | — | | | | — | | | | (0.00 | )5 | |
Total dividends and distributions | | | — | | | | — | | | | — | | | | — | | | | (0.00 | )5 | |
Net asset value, end of year | | $ | 20.00 | | | $ | 15.00 | | | $ | 15.53 | | | $ | 13.10 | | | $ | 11.07 | | |
Total investment return6 | | | 33.24 | % | | | (3.35 | )% | | | 18.55 | % | | | 18.34 | % | | | (15.98 | )% | |
Ratios to average net assets: | |
Expenses before fee waivers and/or expense reimbursements | | | 2.03 | % | | | 2.07 | % | | | 2.05 | % | | | 2.11 | % | | | 2.15 | % | |
Expenses after fee waivers and/or expense reimbursements | | | 2.03 | % | | | 2.07 | % | | | 2.05 | % | | | 2.11 | % | | | 2.14 | % | |
Net investment income (loss) | | | (0.08 | )% | | | (0.54 | )% | | | (0.93 | )% | | | (0.80 | )% | | | (0.32 | )% | |
Supplemental data: | |
Net assets, end of year (000's) | | $ | 4,983 | | | $ | 4,325 | | | $ | 5,109 | | | $ | 5,178 | | | $ | 5,603 | | |
Portfolio turnover | | | 97 | % | | | 72 | % | | | 70 | % | | | 81 | % | | | 111 | % | |
| | | Class P | |
| | | Years ended July 31, | |
| | | 20131 | | 20122 | | 2011 | | 2010 | | 20093 | |
Net asset value, beginning of year | | $ | 16.94 | | | $ | 17.38 | | | $ | 14.53 | | | $ | 12.20 | | | $ | 14.53 | | |
Net investment income (loss)4 | | | 0.15 | | | | 0.06 | | | | (0.01 | ) | | | 0.02 | | | | 0.07 | | |
Net realized and unrealized gains (losses) | | | 5.67 | | | | (0.50 | ) | | | 2.87 | | | | 2.34 | | | | (2.30 | ) | |
Net increase (decrease) from operations | | | 5.82 | | | | (0.44 | ) | | | 2.86 | | | | 2.36 | | | | (2.23 | ) | |
Dividends from net investment income | | | (0.13 | ) | | | (0.00 | )5 | | | (0.01 | ) | | | (0.03 | ) | | | (0.10 | ) | |
Distributions from net realized gains | | | — | | | | — | | | | — | | | | — | | | | (0.00 | )5 | |
Total dividends and distributions | | | (0.13 | ) | | | (0.00 | )5 | | | (0.01 | ) | | | (0.03 | ) | | | (0.10 | ) | |
Net asset value, end of year | | $ | 22.63 | | | $ | 16.94 | | | $ | 17.38 | | | $ | 14.53 | | | $ | 12.20 | | |
Total investment return6 | | | 34.51 | % | | | (2.51 | )% | | | 19.66 | % | | | 19.38 | % | | | (15.14 | )% | |
Ratios to average net assets: | |
Expenses before fee waivers and/or expense reimbursements | | | 1.15 | % | | | 1.22 | % | | | 1.17 | % | | | 1.25 | % | | | 1.32 | % | |
Expenses after fee waivers and/or expense reimbursements | | | 1.16 | %7 | | | 1.16 | % | | | 1.16 | % | | | 1.16 | % | | | 1.16 | % | |
Net investment income (loss) | | | 0.79 | % | | | 0.37 | % | | | (0.05 | )% | | | 0.14 | % | | | 0.66 | % | |
Supplemental data: | |
Net assets, end of year (000's) | | $ | 448,879 | | | $ | 354,936 | | | $ | 387,634 | | | $ | 345,494 | | | $ | 310,059 | | |
Portfolio turnover | | | 97 | % | | | 72 | % | | | 70 | % | | | 81 | % | | | 111 | % | |
See accompanying notes to financial statements.
263
PACE Select Advisors Trust
PACE Small/Medium Co Growth Equity Investments
Financial highlights
Selected data for a share of beneficial interest outstanding throughout each year is presented below:
| | | Class A | |
| | | Years ended July 31, | |
| | | 2013 | | 2012 | | 2011 | | 2010 | | 20091 | |
Net asset value, beginning of year | | $ | 16.45 | | | $ | 16.66 | | | $ | 12.28 | | | $ | 10.63 | | | $ | 13.06 | | |
Net investment loss2 | | | (0.08 | ) | | | (0.12 | ) | | | (0.13 | ) | | | (0.09 | ) | | | (0.05 | ) | |
Net realized and unrealized gains (losses) | | | 5.35 | | | | (0.09 | ) | | | 4.51 | | | | 1.74 | | | | (2.38 | ) | |
Net increase (decrease) from operations | | | 5.27 | | | | (0.21 | ) | | | 4.38 | | | | 1.65 | | | | (2.43 | ) | |
Distributions from net realized gains | | | (0.30 | ) | | | — | | | | — | | | | — | | | | — | | |
Net asset value, end of year | | $ | 21.42 | | | $ | 16.45 | | | $ | 16.66 | | | $ | 12.28 | | | $ | 10.63 | | |
Total investment return3 | | | 32.44 | % | | | (1.26 | )% | | | 35.67 | % | | | 15.52 | % | | | (18.61 | )% | |
Ratios to average net assets: | |
Expenses before fee waivers and/or expense reimbursements/recoupments | | | 1.26 | % | | | 1.30 | % | | | 1.28 | % | | | 1.35 | % | | | 1.40 | % | |
Expenses after fee waivers and/or expense reimbursements/recoupments | | | 1.26 | % | | | 1.30 | % | | | 1.28 | % | | | 1.35 | %4 | | | 1.38 | % | |
Net investment loss | | | (0.43 | )% | | | (0.73 | )% | | | (0.83 | )% | | | (0.71 | )% | | | (0.56 | )% | |
Supplemental data: | |
Net assets, end of year (000's) | | $ | 41,721 | | | $ | 36,620 | | | $ | 40,992 | | | $ | 32,053 | | | $ | 29,429 | | |
Portfolio turnover | | | 60 | % | | | 94 | % | | | 103 | % | | | 133 | % | | | 154 | % | |
| | | Class Y | |
| | | Years ended July 31, | |
| | | 2013 | | 2012 | | 2011 | | 2010 | | 20091 | |
Net asset value, beginning of year | | $ | 17.13 | | | $ | 17.31 | | | $ | 12.74 | | | $ | 11.02 | | | $ | 13.47 | | |
Net investment loss2 | | | (0.07 | ) | | | (0.10 | ) | | | (0.10 | ) | | | (0.02 | ) | | | (0.01 | ) | |
Net realized and unrealized gains (losses) | | | 5.58 | | | | (0.08 | ) | | | 4.67 | | | | 1.74 | | | | (2.44 | ) | |
Net increase (decrease) from operations | | | 5.51 | | | | (0.18 | ) | | | 4.57 | | | | 1.72 | | | | (2.45 | ) | |
Distributions from net realized gains | | | (0.30 | ) | | | — | | | | — | | | | — | | | | — | | |
Net asset value, end of year | | $ | 22.34 | | | $ | 17.13 | | | $ | 17.31 | | | $ | 12.74 | | | $ | 11.02 | | |
Total investment return3 | | | 32.55 | % | | | (1.04 | )% | | | 35.87 | % | | | 15.71 | % | | | (18.26 | )% | |
Ratios to average net assets: | |
Expenses before fee waivers and/or expense reimbursements | | | 1.25 | % | | | 1.25 | % | | | 1.08 | % | | | 0.94 | % | | | 0.96 | % | |
Expenses after fee waivers and/or expense reimbursements | | | 1.13 | % | | | 1.13 | % | | | 1.08 | % | | | 0.94 | % | | | 0.96 | % | |
Net investment loss | | | (0.33 | )% | | | (0.59 | )% | | | (0.61 | )% | | | (0.14 | )% | | | (0.15 | )% | |
Supplemental data: | |
Net assets, end of year (000's) | | $ | 588 | | | $ | 224 | | | $ | 98 | | | $ | 62 | | | $ | 4,369 | | |
Portfolio turnover | | | 60 | % | | | 94 | % | | | 103 | % | | | 133 | % | | | 154 | % | |
1 A portion of the investment advisory function for this Portfolio was transferred from AG Asset Management LLC to Palisade Capital Management, LLC on February 2, 2009. Copper Rock Capital Partners, LLC and Riverbridge Partners, LLC continue to provide a portion of the investment advisory function.
2 Calculated using the average shares method.
3 Total investment return is calculated assuming a $10,000 investment on the first day of each year reported, reinvestment of all dividends and other distributions, if any, at net asset value on the ex-dividend dates, and a sale at net asset value on the last day of each year reported. The figures do not include any applicable sales charges, redemption fees or program fees; results would be lower if they were included. Returns do not reflect the deduction of taxes that a shareholder would pay on Portfolio distributions or the redemption of Portfolio shares.
4 The investment manager recouped expenses previously reimbursed by the investment manager on behalf of the Portfolio, not to exceed the expense cap.
264
| | | Class C | |
| | | Years ended July 31, | |
| | | 2013 | | 2012 | | 2011 | | 2010 | | 20091 | |
Net asset value, beginning of year | | $ | 14.75 | | | $ | 15.05 | | | $ | 11.19 | | | $ | 9.76 | | | $ | 12.07 | | |
Net investment loss2 | | | (0.20 | ) | | | (0.21 | ) | | | (0.23 | ) | | | (0.16 | ) | | | (0.11 | ) | |
Net realized and unrealized gains (losses) | | | 4.77 | | | | (0.09 | ) | | | 4.09 | | | | 1.59 | | | | (2.20 | ) | |
Net increase (decrease) from operations | | | 4.57 | | | | (0.30 | ) | | | 3.86 | | | | 1.43 | | | | (2.31 | ) | |
Distributions from net realized gains | | | (0.30 | ) | | | — | | | | — | | | | — | | | | — | | |
Net asset value, end of year | | $ | 19.02 | | | $ | 14.75 | | | $ | 15.05 | | | $ | 11.19 | | | $ | 9.76 | | |
Total investment return3 | | | 31.42 | % | | | (1.99 | )% | | | 34.50 | % | | | 14.65 | % | | | (19.21 | )% | |
Ratios to average net assets: | |
Expenses before fee waivers and/or expense reimbursements/recoupments | | | 2.02 | % | | | 2.05 | % | | | 2.05 | % | | | 2.13 | % | | | 2.19 | % | |
Expenses after fee waivers and/or expense reimbursements/recoupments | | | 2.02 | % | | | 2.05 | % | | | 2.09 | %4 | | | 2.13 | %4 | | | 2.13 | % | |
Net investment loss | | | (1.19 | )% | | | (1.49 | )% | | | (1.63 | )% | | | (1.49 | )% | | | (1.30 | )% | |
Supplemental data: | |
Net assets, end of year (000's) | | $ | 4,038 | | | $ | 3,529 | | | $ | 4,158 | | | $ | 3,217 | | | $ | 3,285 | | |
Portfolio turnover | | | 60 | % | | | 94 | % | | | 103 | % | | | 133 | % | | | 154 | % | |
| | | Class P | |
| | | Years ended July 31, | |
| | | 2013 | | 2012 | | 2011 | | 2010 | | 20091 | |
Net asset value, beginning of year | | $ | 16.97 | | | $ | 17.14 | | | $ | 12.62 | | | $ | 10.90 | | | $ | 13.36 | | |
Net investment loss2 | | | (0.06 | ) | | | (0.09 | ) | | | (0.11 | ) | | | (0.06 | ) | | | (0.03 | ) | |
Net realized and unrealized gains (losses) | | | 5.52 | | | | (0.08 | ) | | | 4.63 | | | | 1.78 | | | | (2.43 | ) | |
Net increase (decrease) from operations | | | 5.46 | | | | (0.17 | ) | | | 4.52 | | | | 1.72 | | | | (2.46 | ) | |
Distributions from net realized gains | | | (0.30 | ) | | | — | | | | — | | | | — | | | | — | | |
Net asset value, end of year | | $ | 22.13 | | | $ | 16.97 | | | $ | 17.14 | | | $ | 12.62 | | | $ | 10.90 | | |
Total investment return3 | | | 32.57 | % | | | (0.99 | )% | | | 35.82 | % | | | 15.78 | % | | | (18.41 | )% | |
Ratios to average net assets: | |
Expenses before fee waivers and/or expense reimbursements | | | 1.14 | % | | | 1.18 | % | | | 1.16 | % | | | 1.23 | % | | | 1.31 | % | |
Expenses after fee waivers and/or expense reimbursements | | | 1.13 | % | | | 1.13 | % | | | 1.13 | % | | | 1.13 | % | | | 1.13 | % | |
Net investment loss | | | (0.30 | )% | | | (0.56 | )% | | | (0.67 | )% | | | (0.50 | )% | | | (0.31 | )% | |
Supplemental data: | |
Net assets, end of year (000's) | | $ | 457,011 | | | $ | 383,330 | | | $ | 423,310 | | | $ | 338,951 | | | $ | 310,425 | | |
Portfolio turnover | | | 60 | % | | | 94 | % | | | 103 | % | | | 133 | % | | | 154 | % | |
See accompanying notes to financial statements.
265
PACE Select Advisors Trust
PACE International Equity Investments
Financial highlights
Selected data for a share of beneficial interest outstanding throughout each year is presented below:
| | | Class A | |
| | | Years ended July 31, | |
| | | 2013 | | 2012 | | 20111 | | 2010 | | 2009 | |
Net asset value, beginning of year | | $ | 11.63 | | | $ | 13.41 | | | $ | 11.72 | | | $ | 11.72 | | | $ | 16.17 | | |
Net investment income2 | | | 0.24 | | | | 0.26 | | | | 0.25 | | | | 0.19 | | | | 0.27 | | |
Net realized and unrealized gains (losses) | | | 2.36 | | | | (1.71 | ) | | | 1.66 | | | | 0.06 | | | | (4.22 | ) | |
Net increase (decrease) from operations | | | 2.60 | | | | (1.45 | ) | | | 1.91 | | | | 0.25 | | | | (3.95 | ) | |
Dividends from net investment income | | | (0.27 | ) | | | (0.33 | ) | | | (0.22 | ) | | | (0.25 | ) | | | (0.50 | ) | |
Net asset value, end of year | | $ | 13.96 | | | $ | 11.63 | | | $ | 13.41 | | | $ | 11.72 | | | $ | 11.72 | | |
Total investment return3 | | | 22.63 | % | | | (10.58 | )% | | | 16.37 | % | | | 2.05 | % | | | (24.02 | )% | |
Ratios to average net assets: | |
Expenses before fee waivers and/or expense reimbursements | | | 1.42 | % | | | 1.43 | %4 | | | 1.40 | % | | | 1.43 | % | | | 1.46 | % | |
Expenses after fee waivers and/or expense reimbursements | | | 1.42 | %5 | | | 1.43 | %4 | | | 1.40 | %5 | | | 1.43 | % | | | 1.46 | % | |
Net investment income | | | 1.84 | % | | | 2.27 | % | | | 1.91 | % | | | 1.54 | % | | | 2.47 | % | |
Supplemental data: | |
Net assets, end of year (000's) | | $ | 55,533 | | | $ | 51,294 | | | $ | 66,904 | | | $ | 66,355 | | | $ | 71,466 | | |
Portfolio turnover | | | 36 | % | | | 44 | % | | | 66 | % | | | 60 | % | | | 60 | % | |
| | | Class Y | |
| | | Years ended July 31, | |
| | | 2013 | | 2012 | | 20111 | | 2010 | | 2009 | |
Net asset value, beginning of year | | $ | 11.63 | | | $ | 13.41 | | | $ | 11.71 | | | $ | 11.72 | | | $ | 16.20 | | |
Net investment income2 | | | 0.28 | | | | 0.29 | | | | 0.28 | | | | 0.22 | | | | 0.31 | | |
Net realized and unrealized gains (losses) | | | 2.35 | | | | (1.70 | ) | | | 1.67 | | | | 0.07 | | | | (4.23 | ) | |
Net increase (decrease) from operations | | | 2.63 | | | | (1.41 | ) | | | 1.95 | | | | 0.29 | | | | (3.92 | ) | |
Dividends from net investment income | | | (0.31 | ) | | | (0.37 | ) | | | (0.25 | ) | | | (0.30 | ) | | | (0.56 | ) | |
Net asset value, end of year | | $ | 13.95 | | | $ | 11.63 | | | $ | 13.41 | | | $ | 11.71 | | | $ | 11.72 | | |
Total investment return3 | | | 22.97 | % | | | (10.37 | )% | | | 16.65 | % | | | 2.43 | % | | | (23.73 | )% | |
Ratios to average net assets: | |
Expenses before fee waivers and/or expense reimbursements | | | 1.16 | % | | | 1.18 | %4 | | | 1.16 | % | | | 1.10 | % | | | 1.06 | % | |
Expenses after fee waivers and/or expense reimbursements | | | 1.16 | %5 | | | 1.18 | %4 | | | 1.16 | %5 | | | 1.10 | % | | | 1.06 | % | |
Net investment income | | | 2.13 | % | | | 2.51 | % | | | 2.14 | % | | | 1.77 | % | | | 2.89 | % | |
Supplemental data: | |
Net assets, end of year (000's) | | $ | 20,865 | | | $ | 18,004 | | | $ | 21,046 | | | $ | 23,368 | | | $ | 33,012 | | |
Portfolio turnover | | | 36 | % | | | 44 | % | | | 66 | % | | | 60 | % | | | 60 | % | |
1 A portion of the investment advisory function for this Portfolio was transferred to J.P. Morgan Investment Management Inc. (EAFE Opportunities Segment) on November 8, 2010. Martin Currie Inc., Mondrian Investment Partners Limited and J.P. Morgan Investment Management Inc. (REI Segment) continue to provide a portion of the investment advisory function.
2 Calculated using the average shares method.
3 Total investment return is calculated assuming a $10,000 investment on the first day of each year reported, reinvestment of all dividends and other distributions, if any, at net asset value on the ex-dividend dates, and a sale at net asset value on the last day of each year reported. The figures do not include any applicable sales charges, redemption fees or program fees; results would be lower if they were included. Returns do not reflect the deduction of taxes that a shareholder would pay on Portfolio distributions or the redemption of Portfolio shares.
4 Includes interest expense representing less than 0.005%.
5 During the year ended July 31, 2011, UBS Global Asset Management (Americas) Inc. waived fees and/or reimbursed a portion of ordinary operating expenses. The ratios after and before fee waivers and/or expense reimbursements are the same since the fee waiver/reimbursement for the fiscal year represents less than 0.01%.
266
| | | Class C | |
| | | Years ended July 31, | |
| | | 2013 | | 2012 | | 20111 | | 2010 | | 2009 | |
Net asset value, beginning of year | | $ | 11.41 | | | $ | 13.14 | | | $ | 11.47 | | | $ | 11.49 | | | $ | 15.79 | | |
Net investment income2 | | | 0.13 | | | | 0.16 | | | | 0.14 | | | | 0.08 | | | | 0.17 | | |
Net realized and unrealized gains (losses) | | | 2.31 | | | | (1.67 | ) | | | 1.64 | | | | 0.05 | | | | (4.11 | ) | |
Net increase (decrease) from operations | | | 2.44 | | | | (1.51 | ) | | | 1.78 | | | | 0.13 | | | | (3.94 | ) | |
Dividends from net investment income | | | (0.17 | ) | | | (0.22 | ) | | | (0.11 | ) | | | (0.15 | ) | | | (0.36 | ) | |
Net asset value, end of year | | $ | 13.68 | | | $ | 11.41 | | | $ | 13.14 | | | $ | 11.47 | | | $ | 11.49 | | |
Total investment return3 | | | 21.50 | % | | | (11.35 | )% | | | 15.57 | % | | | 1.10 | % | | | (24.67 | )% | |
Ratios to average net assets: | |
Expenses before fee waivers and/or expense reimbursements | | | 2.26 | % | | | 2.27 | %4 | | | 2.23 | % | | | 2.26 | % | | | 2.31 | % | |
Expenses after fee waivers and/or expense reimbursements | | | 2.25 | % | | | 2.27 | %4 | | | 2.23 | %5 | | | 2.26 | % | | | 2.31 | % | |
Net investment income | | | 1.01 | % | | | 1.41 | % | | | 1.08 | % | | | 0.69 | % | | | 1.62 | % | |
Supplemental data: | |
Net assets, end of year (000's) | | $ | 2,746 | | | $ | 2,573 | | | $ | 3,601 | | | $ | 3,769 | | | $ | 4,342 | | |
Portfolio turnover | | | 36 | % | | | 44 | % | | | 66 | % | | | 60 | % | | | 60 | % | |
| | | Class P | |
| | | Years ended July 31, | |
| | | 2013 | | 2012 | | 20111 | | 2010 | | 2009 | |
Net asset value, beginning of year | | $ | 11.60 | | | $ | 13.39 | | | $ | 11.69 | | | $ | 11.70 | | | $ | 16.16 | | |
Net investment income2 | | | 0.28 | | | | 0.29 | | | | 0.29 | | | | 0.22 | | | | 0.29 | | |
Net realized and unrealized gains (losses) | | | 2.35 | | | | (1.71 | ) | | | 1.66 | | | | 0.05 | | | | (4.21 | ) | |
Net increase (decrease) from operations | | | 2.63 | | | | (1.42 | ) | | | 1.95 | | | | 0.27 | | | | (3.92 | ) | |
Dividends from net investment income | | | (0.31 | ) | | | (0.37 | ) | | | (0.25 | ) | | | (0.28 | ) | | | (0.54 | ) | |
Net asset value, end of year | | $ | 13.92 | | | $ | 11.60 | | | $ | 13.39 | | | $ | 11.69 | | | $ | 11.70 | | |
Total investment return3 | | | 22.92 | % | | | (10.39 | )% | | | 16.79 | % | | | 2.21 | % | | | (23.81 | )% | |
Ratios to average net assets: | |
Expenses before fee waivers and/or expense reimbursements | | | 1.17 | % | | | 1.18 | %4 | | | 1.16 | % | | | 1.18 | % | | | 1.22 | % | |
Expenses after fee waivers and/or expense reimbursements | | | 1.17 | %5 | | | 1.18 | %4 | | | 1.16 | %5 | | | 1.18 | % | | | 1.22 | % | |
Net investment income | | | 2.12 | % | | | 2.54 | % | | | 2.20 | % | | | 1.80 | % | | | 2.72 | % | |
Supplemental data: | |
Net assets, end of year (000's) | | $ | 863,063 | | | $ | 698,255 | | | $ | 817,011 | | | $ | 698,546 | | | $ | 684,359 | | |
Portfolio turnover | | | 36 | % | | | 44 | % | | | 66 | % | | | 60 | % | | | 60 | % | |
See accompanying notes to financial statements.
267
PACE Select Advisors Trust
PACE International Emerging Markets Equity Investments
Financial highlights
Selected data for a share of beneficial interest outstanding throughout each year is presented below:
| | | Class A | |
| | | Years ended July 31, | |
| | | 20131 | | 2012 | | 20112 | | 2010 | | 2009 | |
Net asset value, beginning of year | | $ | 11.81 | | | $ | 13.80 | | | $ | 12.19 | | | $ | 10.58 | | | $ | 19.46 | | |
Net investment income (loss)3 | | | 0.09 | | | | 0.11 | | | | 0.12 | | | | 0.09 | | | | 0.20 | | |
Net realized and unrealized gains (losses) | | | 0.49 | | | | (1.86 | ) | | | 1.59 | | | | 1.68 | | | | (5.71 | ) | |
Net increase (decrease) from operations | | | 0.58 | | | | (1.75 | ) | | | 1.71 | | | | 1.77 | | | | (5.51 | ) | |
Dividends from net investment income | | | (0.10 | ) | | | (0.11 | ) | | | (0.10 | ) | | | (0.16 | ) | | | (0.13 | ) | |
Distributions from net realized gains | | | — | | | | (0.13 | ) | | | — | | | | — | | | | (3.24 | ) | |
Total dividends and distributions | | | (0.10 | ) | | | (0.24 | ) | | | (0.10 | ) | | | (0.16 | ) | | | (3.37 | ) | |
Net asset value, end of year | | $ | 12.29 | | | $ | 11.81 | | | $ | 13.80 | | | $ | 12.19 | | | $ | 10.58 | | |
Total investment return5 | | | 4.81 | % | | | (12.52 | )% | | | 14.01 | % | | | 16.81 | % | | | (21.37 | )% | |
Ratios to average net assets: | |
Expenses before fee waivers and/or expense reimbursements | | | 1.82 | % | | | 1.90 | % | | | 1.84 | % | | | 1.87 | % | | | 1.93 | % | |
Expenses after fee waivers and/or expense reimbursements | | | 1.75 | % | | | 1.90 | % | | | 1.84 | %6 | | | 1.87 | % | | | 1.93 | % | |
Net investment income (loss) | | | 0.72 | % | | | 0.93 | % | | | 0.87 | % | | | 0.75 | % | | | 2.06 | % | |
Supplemental data: | |
Net assets, end of year (000's) | | $ | 16,810 | | | $ | 17,559 | | | $ | 22,648 | | | $ | 19,111 | | | $ | 17,784 | | |
Portfolio turnover | | | 158 | % | | | 30 | % | | | 111 | % | | | 60 | % | | | 77 | % | |
| | | Class Y | |
| | | Years ended July 31, | |
| | | 20131 | | 2012 | | 20112 | | 2010 | | 2009 | |
Net asset value, beginning of year | | $ | 12.03 | | | $ | 14.06 | | | $ | 12.41 | | | $ | 10.78 | | | $ | 19.79 | | |
Net investment income3 | | | 0.12 | | | | 0.14 | | | | 0.15 | | | | 0.10 | | | | 0.28 | | |
Net realized and unrealized gains (losses) | | | 0.51 | | | | (1.90 | ) | | | 1.61 | | | | 1.74 | | | | (5.83 | ) | |
Net increase (decrease) from operations | | | 0.63 | | | | (1.76 | ) | | | 1.76 | | | | 1.84 | | | | (5.55 | ) | |
Dividends from net investment income | | | (0.13 | ) | | | (0.14 | ) | | | (0.11 | ) | | | (0.21 | ) | | | (0.22 | ) | |
Distributions from net realized gains | | | — | | | | (0.13 | ) | | | — | | | | — | | | | (3.24 | ) | |
Total dividends and distributions | | | (0.13 | ) | | | (0.27 | ) | | | (0.11 | ) | | | (0.21 | ) | | | (3.46 | ) | |
Net asset value, end of year | | $ | 12.53 | | | $ | 12.03 | | | $ | 14.06 | | | $ | 12.41 | | | $ | 10.78 | | |
Total investment return5 | | | 5.13 | % | | | (12.35 | )% | | | 14.22 | % | | | 17.15 | % | | | (21.00 | )% | |
Ratios to average net assets: | |
Expenses before fee waivers and/or expense reimbursements | | | 1.58 | % | | | 1.67 | % | | | 1.61 | % | | | 1.62 | % | | | 1.47 | % | |
Expenses after fee waivers and/or expense reimbursements | | | 1.51 | % | | | 1.67 | % | | | 1.61 | %6 | | | 1.62 | % | | | 1.47 | % | |
Net investment income | | | 0.94 | % | | | 1.17 | % | | | 1.08 | % | | | 0.88 | % | | | 2.87 | % | |
Supplemental data: | |
Net assets, end of year (000's) | | $ | 12,835 | | | $ | 13,835 | | | $ | 17,808 | | | $ | 21,524 | | | $ | 33,069 | | |
Portfolio turnover | | | 158 | % | | | 30 | % | | | 111 | % | | | 60 | % | | | 77 | % | |
1 As of the close of business, October 15, 2012, Delaware Management Company and Pzena Investment Management, LLC were terminated as investment sub-advisors to PACE International Emerging Markets Equity Investments and Lee Munder Capital Group, LLC became an investment sub-advisor of the Portfolio on October 16, 2012. Mondrian Investment Partners Limited and William Blair & Company LLC also continue to provide a portion of the investment advisory function.
2 Portions of the investment advisory function for this Portfolio were transferred to Delaware Management Company and Pzena Investment Management, LLC, respectively, on November 4, 2010 and to William Blair & Company LLC on March 23, 2011. Gartmore Global Partners provided a portion of the investment advisory function during this period and then was subsequently terminated as a sub-advisor to the Portfolio at the close of business on March 22, 2011.
3 Calculated using the average shares method.
268
| | | Class C | |
| | | Years ended July 31, | |
| | | 20131 | | 2012 | | 20112 | | 2010 | | 2009 | |
Net asset value, beginning of year | | $ | 11.04 | | | $ | 12.87 | | | $ | 11.38 | | | $ | 9.90 | | | $ | 18.48 | | |
Net investment income (loss)3 | | | 0.00 | | | | 0.02 | | | | 0.01 | | | | (0.00 | )4 | | | 0.13 | | |
Net realized and unrealized gains (losses) | | | 0.44 | | | | (1.72 | ) | | | 1.48 | | | | 1.58 | | | | (5.47 | ) | |
Net increase (decrease) from operations | | | 0.44 | | | | (1.70 | ) | | | 1.49 | | | | 1.58 | | | | (5.34 | ) | |
Dividends from net investment income | | | — | | | | — | | | | — | | | | (0.10 | ) | | | — | | |
Distributions from net realized gains | | | — | | | | (0.13 | ) | | | — | | | | — | | | | (3.24 | ) | |
Total dividends and distributions | | | — | | | | (0.13 | ) | | | — | | | | (0.10 | ) | | | (3.24 | ) | |
Net asset value, end of year | | $ | 11.48 | | | $ | 11.04 | | | $ | 12.87 | | | $ | 11.38 | | | $ | 9.90 | | |
Total investment return5 | | | 3.99 | % | | | (13.13 | )% | | | 13.19 | % | | | 15.96 | % | | | (21.97 | )% | |
Ratios to average net assets: | |
Expenses before fee waivers and/or expense reimbursements | | | 2.57 | % | | | 2.65 | % | | | 2.58 | % | | | 2.61 | % | | | 2.67 | % | |
Expenses after fee waivers and/or expense reimbursements | | | 2.49 | % | | | 2.65 | % | | | 2.58 | %6 | | | 2.61 | % | | | 2.67 | % | |
Net investment income (loss) | | | (0.04 | )% | | | 0.16 | % | | | 0.11 | % | | | (0.01 | )% | | | 1.35 | % | |
Supplemental data: | |
Net assets, end of year (000's) | | $ | 2,201 | | | $ | 2,396 | | | $ | 3,373 | | | $ | 3,682 | | | $ | 3,525 | | |
Portfolio turnover | | | 158 | % | | | 30 | % | | | 111 | % | | | 60 | % | | | 77 | % | |
| | | Class P | |
| | | Years ended July 31, | |
| | | 20131 | | 2012 | | 20112 | | 2010 | | 2009 | |
Net asset value, beginning of year | | $ | 11.98 | | | $ | 14.00 | | | $ | 12.36 | | | $ | 10.72 | | | $ | 19.68 | | |
Net investment income3 | | | 0.12 | | | | 0.12 | | | | 0.13 | | | | 0.09 | | | | 0.20 | | |
Net realized and unrealized gains (losses) | | | 0.47 | | | | (1.89 | ) | | | 1.60 | | | | 1.71 | | | | (5.77 | ) | |
Net increase (decrease) from operations | | | 0.59 | | | | (1.77 | ) | | | 1.73 | | | | 1.80 | | | | (5.57 | ) | |
Dividends from net investment income | | | (0.10 | ) | | | (0.12 | ) | | | (0.09 | ) | | | (0.16 | ) | | | (0.15 | ) | |
Distributions from net realized gains | | | — | | | | (0.13 | ) | | | — | | | | — | | | | (3.24 | ) | |
Total dividends and distributions | | | (0.10 | ) | | | (0.25 | ) | | | (0.09 | ) | | | (0.16 | ) | | | (3.39 | ) | |
Net asset value, end of year | | $ | 12.47 | | | $ | 11.98 | | | $ | 14.00 | | | $ | 12.36 | | | $ | 10.72 | | |
Total investment return5 | | | 4.87 | % | | | (12.49 | )% | | | 14.04 | % | | | 16.85 | % | | | (21.42 | )% | |
Ratios to average net assets: | |
Expenses before fee waivers and/or expense reimbursements | | | 1.75 | % | | | 1.88 | % | | | 1.79 | % | | | 1.85 | % | | | 1.97 | % | |
Expenses after fee waivers and/or expense reimbursements | | | 1.67 | % | | | 1.88 | % | | | 1.79 | %6 | | | 1.85 | % | | | 1.97 | % | |
Net investment income | | | 0.92 | % | | | 0.97 | % | | | 0.95 | % | | | 0.78 | % | | | 2.03 | % | |
Supplemental data: | |
Net assets, end of year (000's) | | $ | 334,525 | | | $ | 218,196 | | | $ | 264,991 | | | $ | 232,908 | | | $ | 210,680 | | |
Portfolio turnover | | | 158 | % | | | 30 | % | | | 111 | % | | | 60 | % | | | 77 | % | |
4 Amount represents less than $0.005 per share.
5 Total investment return is calculated assuming a $10,000 investment on the first day of each year reported, reinvestment of all dividends and other distributions, if any, at net asset value on the ex-dividend dates, and a sale at net asset value on the last day of each year reported. The figures do not include any applicable sales charges, redemption fees or program fees; results would be lower if they were included. Returns do not reflect the deduction of taxes that a shareholder would pay on Portfolio distributions or the redemption of Portfolio shares.
6 During the year ended July 31, 2011, UBS Global Asset Management (Americas) Inc. waived fees and/or reimbursed a portion of ordinary operating expenses. The ratios after and before fee waivers and/or expense reimbursements are the same since the fee waiver/reimbursement represents less than 0.01%.
See accompanying notes to financial statements.
269
PACE Select Advisors Trust
PACE Global Real Estate Securities Investments
Financial highlights
Selected data for a share of beneficial interest outstanding throughout each period is presented below:
| | | Class A | |
| | | Years ended July 31, | |
| | | 2013 | | 2012 | | 2011 | | 20101 | | 2009 | |
Net asset value, beginning of year | | $ | 6.05 | | | $ | 6.02 | | | $ | 5.31 | | | $ | 4.86 | | | $ | 7.73 | | |
Net investment income2 | | | 0.08 | | | | 0.09 | | | | 0.09 | | | | 0.11 | | | | 0.16 | | |
Net realized and unrealized gains (losses) | | | 0.65 | | | | 0.08 | | | | 1.01 | | | | 0.83 | | | | (2.97 | ) | |
Net increase (decrease) from operations | | | 0.73 | | | | 0.17 | | | | 1.10 | | | | 0.94 | | | | (2.81 | ) | |
Dividends from net investment income | | | (0.26 | ) | | | (0.14 | ) | | | (0.39 | ) | | | (0.49 | ) | | | (0.06 | ) | |
Net asset value, end of year | | $ | 6.52 | | | $ | 6.05 | | | $ | 6.02 | | | $ | 5.31 | | | $ | 4.86 | | |
Total investment return3 | | | 12.24 | % | | | 3.28 | % | | | 21.49 | % | | | 19.70 | % | | | (36.25 | )% | |
Ratios to average net assets: | |
Expenses before fee waivers and/or expense reimbursements | | | 1.56 | % | | | 1.69 | % | | | 1.68 | % | | | 1.89 | % | | | 2.06 | % | |
Expenses after fee waivers and/or expense reimbursements | | | 1.45 | % | | | 1.45 | % | | | 1.45 | % | | | 1.45 | % | | | 1.45 | % | |
Net investment income | | | 1.19 | % | | | 1.61 | % | | | 1.54 | % | | | 2.13 | % | | | 3.32 | % | |
Supplemental data: | |
Net assets, end of year (000's) | | $ | 5,233 | | | $ | 4,838 | | | $ | 4,566 | | | $ | 3,975 | | | $ | 3,238 | | |
Portfolio turnover | | | 92 | % | | | 66 | % | | | 51 | % | | | 117 | % | | | 127 | % | |
| | | Class Y | |
| | | Years ended July 31, | | Period ended | |
| | | | | July 31, | |
| | | 2013 | | 2012 | | 2011 | | 20101 | | 20094 | |
Net asset value, beginning of period | | $ | 6.08 | | | $ | 6.05 | | | $ | 5.33 | | | $ | 4.87 | | | $ | 4.35 | | |
Net investment income2 | | | 0.09 | | | | 0.11 | | | | 0.10 | | | | 0.12 | | | | 0.09 | | |
Net realized and unrealized gains (losses) | | | 0.66 | | | | 0.07 | | | | 1.02 | | | | 0.84 | | | | 0.43 | | |
Net increase (decrease) from operations | | | 0.75 | | | | 0.18 | | | | 1.12 | | | | 0.96 | | | | 0.52 | | |
Dividends from net investment income | | | (0.28 | ) | | | (0.15 | ) | | | (0.40 | ) | | | (0.50 | ) | | | — | | |
Net asset value, end of period | | $ | 6.55 | | | $ | 6.08 | | | $ | 6.05 | | | $ | 5.33 | | | $ | 4.87 | | |
Total investment return3 | | | 12.53 | % | | | 3.46 | % | | | 21.89 | % | | | 20.15 | % | | | 11.95 | % | |
Ratios to average net assets: | |
Expenses before fee waivers and/or expense reimbursements | | | 1.39 | % | | | 1.39 | % | | | 1.34 | % | | | 1.51 | % | | | 1.87 | %5 | |
Expenses after fee waivers and/or expense reimbursements | | | 1.20 | % | | | 1.20 | % | | | 1.20 | % | | | 1.20 | % | | | 1.20 | %5 | |
Net investment income | | | 1.43 | % | | | 1.90 | % | | | 1.74 | % | | | 2.34 | % | | | 3.84 | %5 | |
Supplemental data: | |
Net assets, end of period (000's) | | $ | 294 | | | $ | 210 | | | $ | 195 | | | $ | 111 | | | $ | 13 | | |
Portfolio turnover | | | 92 | % | | | 66 | % | | | 51 | % | | | 117 | % | | | 127 | % | |
1 Investment advisory functions for this Portfolio were transferred from Goldman Sachs Asset Management, L.P. to Brookfield Investment Management Inc. and CBRE Clarion Services, LLC (formerly ING Clarion Real Estate Securities, LLC) on November 17, 2009.
2 Calculated using the average shares method.
3 Total investment return is calculated assuming a $10,000 investment on the first day of each period reported, reinvestment of all dividends and other distributions, if any, at net asset value on the ex-dividend dates, and a sale at net asset value on the last day of each period reported. The figures do not include any applicable sales charges, redemption fees or program fees; results would be lower if they were included. Total investment return for periods of less than one year has not been annualized. Returns do not reflect the deduction of taxes that a shareholder would pay on Portfolio distributions or the redemption of Portfolio shares.
4 For the period December 26, 2008 (recommencement of issuance) through July 31, 2009.
5 Annualized.
270
| | | Class C | |
| | | Years ended July 31, | |
| | | 2013 | | 2012 | | 2011 | | 20101 | | 2009 | |
Net asset value, beginning of year | | $ | 6.00 | | | $ | 5.99 | | | $ | 5.29 | | | $ | 4.85 | | | $ | 7.69 | | |
Net investment income2 | | | 0.03 | | | | 0.05 | | | | 0.05 | | | | 0.07 | | | | 0.12 | | |
Net realized and unrealized gains (losses) | | | 0.65 | | | | 0.07 | | | | 1.00 | | | | 0.82 | | | | (2.95 | ) | |
Net increase (decrease) from operations | | | 0.68 | | | | 0.12 | | | | 1.05 | | | | 0.89 | | | | (2.83 | ) | |
Dividends from net investment income | | | (0.20 | ) | | | (0.11 | ) | | | (0.35 | ) | | | (0.45 | ) | | | (0.01 | ) | |
Net asset value, end of year | | $ | 6.48 | | | $ | 6.00 | | | $ | 5.99 | | | $ | 5.29 | | | $ | 4.85 | | |
Total investment return3 | | | 11.52 | % | | | 2.42 | % | | | 20.51 | % | | | 18.74 | % | | | (36.73 | )% | |
Ratios to average net assets: | |
Expenses before fee waivers and/or expense reimbursements | | | 2.27 | % | | | 2.44 | % | | | 2.45 | % | | | 2.69 | % | | | 2.96 | % | |
Expenses after fee waivers and/or expense reimbursements | | | 2.20 | % | | | 2.20 | % | | | 2.20 | % | | | 2.20 | % | | | 2.20 | % | |
Net investment income | | | 0.40 | % | | | 0.92 | % | | | 0.79 | % | | | 1.37 | % | | | 2.67 | % | |
Supplemental data: | |
Net assets, end of year (000's) | | $ | 222 | | | $ | 172 | | | $ | 220 | | | $ | 171 | | | $ | 136 | | |
Portfolio turnover | | | 92 | % | | | 66 | % | | | 51 | % | | | 117 | % | | | 127 | % | |
| | | Class P | |
| | | Years ended July 31, | |
| | | | |
| | | 2013 | | 2012 | | 2011 | | 20101 | | 2009 | |
Net asset value, beginning of period | | $ | 6.06 | | | $ | 6.03 | | | $ | 5.32 | | | $ | 4.86 | | | $ | 7.75 | | |
Net investment income2 | | | 0.10 | | | | 0.10 | | | | 0.10 | | | | 0.12 | | | | 0.17 | | |
Net realized and unrealized gains (losses) | | | 0.65 | | | | 0.08 | | | | 1.01 | | | | 0.83 | | | | (2.97 | ) | |
Net increase (decrease) from operations | | | 0.75 | | | | 0.18 | | | | 1.11 | | | | 0.95 | | | | (2.80 | ) | |
Dividends from net investment income | | | (0.28 | ) | | | (0.15 | ) | | | (0.40 | ) | | | (0.49 | ) | | | (0.09 | ) | |
Net asset value, end of period | | $ | 6.53 | | | $ | 6.06 | | | $ | 6.03 | | | $ | 5.32 | | | $ | 4.86 | | |
Total investment return3 | | | 12.57 | % | | | 3.47 | % | | | 21.74 | % | | | 20.10 | % | | | (36.09 | )% | |
Ratios to average net assets: | |
Expenses before fee waivers and/or expense reimbursements | | | 1.52 | % | | | 1.65 | % | | | 1.65 | % | | | 1.91 | % | | | 2.17 | % | |
Expenses after fee waivers and/or expense reimbursements | | | 1.20 | % | | | 1.20 | % | | | 1.20 | % | | | 1.20 | % | | | 1.20 | % | |
Net investment income | | | 1.47 | % | | | 1.88 | % | | | 1.77 | % | | | 2.36 | % | | | 3.67 | % | |
Supplemental data: | |
Net assets, end of period (000's) | | $ | 116,509 | | | $ | 108,101 | | | $ | 101,008 | | | $ | 73,866 | | | $ | 52,925 | | |
Portfolio turnover | | | 92 | % | | | 66 | % | | | 51 | % | | | 117 | % | | | 127 | % | |
See accompanying notes to financial statements.
271
PACE Select Advisors Trust
PACE Alternative Strategies Investments
Financial highlights
Selected data for a share of beneficial interest outstanding throughout each year is presented below:
| | | Class A | |
| | | Years ended July 31, | |
| | | 20131 | | 20122 | | 20113 | | 2010 | | 20094 | |
Net asset value, beginning of year | | $ | 9.35 | | | $ | 9.32 | | | $ | 9.16 | | | $ | 8.79 | | | $ | 10.46 | | |
Net investment income (loss)5 | | | (0.05 | ) | | | (0.02 | ) | | | (0.00 | )6 | | | 0.006 | | | | 0.06 | | |
Net realized and unrealized gains (losses) | | | 0.95 | | | | 0.05 | | | | 0.25 | | | | 0.40 | | | | (1.63 | ) | |
Net increase (decrease) from operations | | | 0.90 | | | | 0.03 | | | | 0.25 | | | | 0.40 | | | | (1.57 | ) | |
Dividends from net investment income | | | (0.04 | ) | | | — | | | | (0.09 | ) | | | (0.03 | ) | | | (0.03 | ) | |
Distributions from net realized gains | | | — | | | | — | | | | — | | | | — | | | | (0.07 | ) | |
Total dividends and distributions | | | (0.04 | ) | | | — | | | | (0.09 | ) | | | (0.03 | ) | | | (0.10 | ) | |
Net asset value, end of year | | $ | 10.21 | | | $ | 9.35 | | | $ | 9.32 | | | $ | 9.16 | | | $ | 8.79 | | |
Total investment return7 | | | 9.54 | % | | | 0.43 | % | | | 2.69 | % | | | 4.41 | % | | | (14.95 | )% | |
Ratios to average net assets: | |
Expenses before fee waivers and/or expense reimbursements/recoupments, including dividend
expense, interest expense and other borrowing costs for investments sold short | | | 2.01 | % | | | 2.12 | % | | | 2.08 | % | | | 2.06 | % | | | 2.23 | % | |
Expenses after fee waivers and/or expense reimbursements/recoupments, including dividend
expense, interest expense and other borrowing costs for investments sold short | | | 1.98 | %9 | | | 2.10 | %9 | | | 2.05 | % | | | 2.00 | % | | | 2.20 | % | |
Expenses after fee waivers and/or expense reimbursements/recoupments, excluding dividend
expense, interest expense and other borrowing costs for investments sold short | | | 1.90 | %9 | | | 1.95 | %9 | | | 1.95 | % | | | 1.95 | % | | | 1.95 | % | |
Net investment income (loss) | | | (0.49 | )% | | | (0.23 | )% | | | (0.02 | )% | | | 0.04 | % | | | 0.69 | % | |
Supplemental data: | |
Net assets, end of year (000's) | | $ | 53,728 | | | $ | 43,644 | | | $ | 63,767 | | | $ | 56,772 | | | $ | 65,429 | | |
Portfolio turnover | | | 140 | % | | | 242 | % | | | 295 | % | | | 244 | % | | | 423 | % | |
| | | Class Y | |
| | | Years ended July 31, | |
| | | 20131 | | 20122 | | 20113 | | 2010 | | 20094 | |
Net asset value, beginning of year | | $ | 9.43 | | | $ | 9.38 | | | $ | 9.19 | | | $ | 8.80 | | | $ | 10.51 | | |
Net investment income (loss)5 | | | (0.03 | ) | | | 0.006 | | | | 0.02 | | | | 0.03 | | | | 0.08 | | |
Net realized and unrealized gains (losses) | | | 0.97 | | | | 0.05 | | | | 0.25 | | | | 0.40 | | | | (1.66 | ) | |
Net increase (decrease) from operations | | | 0.94 | | | | 0.05 | | | | 0.27 | | | | 0.43 | | | | (1.58 | ) | |
Dividends from net investment income | | | (0.07 | ) | | | — | | | | (0.08 | ) | | | (0.04 | ) | | | (0.06 | ) | |
Distributions from net realized gains | | | — | | | | — | | | | — | | | | — | | | | (0.07 | ) | |
Total dividends and distributions | | | (0.07 | ) | | | — | | | | (0.08 | ) | | | (0.04 | ) | | | (0.13 | ) | |
Net asset value, end of year | | $ | 10.30 | | | $ | 9.43 | | | $ | 9.38 | | | $ | 9.19 | | | $ | 8.80 | | |
Total investment return7 | | | 9.89 | % | | | 0.64 | % | | | 2.84 | % | | | 4.83 | % | | | (14.81 | )% | |
Ratios to average net assets: | |
Expenses before fee waivers and/or reimbursements/recoupments, including dividend expense,
interest expense and other borrowing costs for investments sold short | | | 1.77 | % | | | 1.91 | % | | | 1.85 | % | | | 1.76 | % | | | 1.98 | % | |
Expenses after fee waivers and/or expense reimbursements/recoupments, including dividend
expense, interest expense and other borrowing costs for investments sold short | | | 1.73 | %9 | | | 1.86 | %9 | | | 1.80 | % | | | 1.76 | %9 | | | 1.95 | % | |
Expenses after fee waivers and/or expense reimbursements/recoupments, excluding dividend
expense, interest expense and other borrowing costs for investments sold short | | | 1.65 | %9 | | | 1.70 | %9 | | | 1.70 | % | | | 1.70 | %9 | | | 1.70 | % | |
Net investment income (loss) | | | (0.25 | )% | | | 0.00 | %10 | | | 0.21 | % | | | 0.37 | % | | | 0.95 | % | |
Supplemental data: | |
Net assets, end of year (000's) | | $ | 2,732 | | | $ | 1,668 | | | $ | 1,565 | | | $ | 1,977 | | | $ | 13,707 | | |
Portfolio turnover | | | 140 | % | | | 242 | % | | | 295 | % | | | 244 | % | | | 423 | % | |
1 As of the close of business, November 30, 2012, Wellington Management Company, LLP ("Wellington") was terminated as an investment sub-advisor to PACE Alternative Strategies Investments. Cash from the sale of securities from the portfolio previously managed by Wellington was transferred to First Quadrant L.P., an existing investment advisor of the Portfolio on December 3, 2012. Analytic Investors, LLC and Standard Life Investments (Corporate Funds) Limited also continue to provide a portion of the investment advisory function.
2 As of the close of business, February 10, 2012, Goldman Sachs Asset Management, L.P. ("Goldman Sachs") was terminated as a sub-advisor to PACE Alternative Strategies Investments. Cash from the sale of securities from the portfolio previously managed by Goldman Sachs was transferred to Standard Life Investments (Corporate Funds) Limited, an existing sub-advisor of the Portfolio.
3 A portion of the investment advisory function for this Portfolio was transferred to Standard Life Investments (Corporate Funds) Limited on August 5, 2010.
4 A portion of the investment advisory function for this Portfolio was transferred to First Quadrant L.P. on April 8, 2009.
272
| | Class C | |
| | | Years ended July 31, | |
| | | 20131 | | 20122 | | 20113 | | 2010 | | 20094 | |
Net asset value, beginning of year | | $ | 9.09 | | | $ | 9.13 | | | $ | 8.97 | | | $ | 8.64 | | | $ | 10.34 | | |
Net investment income (loss)5 | | | (0.11 | ) | | | (0.08 | ) | | | (0.07 | ) | | | (0.06 | ) | | | (0.01 | ) | |
Net realized and unrealized gains (losses) | | | 0.92 | | | | 0.04 | | | | 0.25 | | | | 0.39 | | | | (1.62 | ) | |
Net increase (decrease) from operations | | | 0.81 | | | | (0.04 | ) | | | 0.18 | | | | 0.33 | | | | (1.63 | ) | |
Dividends from net investment income | | | — | | | | — | | | | (0.02 | ) | | | — | | | | — | | |
Distributions from net realized gains | | | — | | | | — | | | | — | | | | — | | | | (0.07 | ) | |
Total dividends and distributions | | | — | | | | — | | | | (0.02 | ) | | | — | | | | (0.07 | ) | |
Net asset value, end of year | | $ | 9.90 | | | $ | 9.09 | | | $ | 9.13 | | | $ | 8.97 | | | $ | 8.64 | | |
Total investment return7 | | | 8.79 | % | | | (0.22 | )% | | | 1.93 | % | | | 3.70 | % | | | (15.61 | )% | |
Ratios to average net assets: | |
Expenses before fee waivers and/or expense reimbursements/recoupments, including dividend
expense, interest expense and other borrowing costs for investments sold short | | | 2.72 | % | | | 2.82 | % | | | 2.78 | %8 | | | 2.75 | % | | | 2.96 | % | |
Expenses after fee waivers and/or expense reimbursements/recoupments, including dividend
expense, interest expense and other borrowing costs for investments sold short | | | 2.70 | % | | | 2.78 | % | | | 2.78 | %8,9 | | | 2.75 | % | | | 2.96 | % | |
Expenses after fee waivers and/or expense reimbursements/recoupments, excluding dividend
expense, interest expense and other borrowing costs for investments sold short | | | 2.62 | % | | | 2.63 | % | | | 2.68 | %9 | | | 2.70 | % | | | 2.70 | % | |
Net investment income (loss) | | | (1.20 | )% | | | (0.91 | )% | | | (0.77 | )% | | | (0.72 | )% | | | (0.08 | )% | |
Supplemental data: | |
Net assets, end of year (000's) | | $ | 4,827 | | | $ | 4,989 | | | $ | 6,479 | | | $ | 6,887 | | | $ | 6,565 | | |
Portfolio turnover | | | 140 | % | | | 242 | % | | | 295 | % | | | 244 | % | | | 423 | % | |
| | | Class P | |
| | | Years ended July 31, | |
| | | 20131 | | 20122 | | 20113 | | 2010 | | 20094 | |
Net asset value, beginning of year | | $ | 9.41 | | | $ | 9.36 | | | $ | 9.19 | | | $ | 8.82 | | | $ | 10.51 | | |
Net investment income (loss)5 | | | (0.02 | ) | | | 0.006 | | | | 0.02 | | | | 0.03 | | | | 0.08 | | |
Net realized and unrealized gains (losses) | | | 0.95 | | | | 0.05 | | | | 0.26 | | | | 0.40 | | | | (1.65 | ) | |
Net increase (decrease) from operations | | | 0.93 | | | | 0.05 | | | | 0.28 | | | | 0.43 | | | | (1.57 | ) | |
Dividends from net investment income | | | (0.07 | ) | | | — | | | | (0.11 | ) | | | (0.06 | ) | | | (0.05 | ) | |
Distributions from net realized gains | | | — | | | | — | | | | — | | | | — | | | | (0.07 | ) | |
Total dividends and distributions | | | (0.07 | ) | | | — | | | | (0.11 | ) | | | (0.06 | ) | | | (0.12 | ) | |
Net asset value, end of year | | $ | 10.27 | | | $ | 9.41 | | | $ | 9.36 | | | $ | 9.19 | | | $ | 8.82 | | |
Total investment return7 | | | 9.93 | % | | | 0.64 | % | | | 2.94 | % | | | 4.71 | % | | | (14.73 | )% | |
Ratios to average net assets: | |
Expenses before fee waivers and/or reimbursements/recoupments, including dividend expense,
interest expense and other borrowing costs for investments sold short | | | 1.74 | % | | | 1.85 | % | | | 1.81 | % | | | 1.79 | % | | | 1.96 | % | |
Expenses after fee waivers and/or expense reimbursements/recoupments, including dividend
expense, interest expense and other borrowing costs for investments sold short | | | 1.71 | % | | | 1.85 | %9 | | | 1.80 | % | | | 1.75 | % | | | 1.95 | % | |
Expenses after fee waivers and/or expense reimbursements/recoupments, excluding dividend
expense, interest expense and other borrowing costs for investments sold short | | | 1.63 | % | | | 1.69 | %9 | | | 1.70 | % | | | 1.70 | % | | | 1.70 | % | |
Net investment income (loss) | | | (0.21 | )% | | | 0.02 | % | | | 0.22 | % | | | 0.28 | % | | | 0.93 | % | |
Supplemental data: | |
Net assets, end of year (000's) | | $ | 493,524 | | | $ | 449,925 | | | $ | 476,544 | | | $ | 399,477 | | | $ | 356,352 | | |
Portfolio turnover | | | 140 | % | | | 242 | % | | | 295 | % | | | 244 | % | | | 423 | % | |
5 Calculated using the average shares method.
6 Amount represents less than $0.005 per share.
7 Total investment return is calculated assuming a $10,000 investment on the first day of each year reported, reinvestment of all dividends and other distributions, if any, at net asset value on the ex-dividend dates, and a sale at net asset value on the last day of each year reported. The figures do not include any applicable sales charges, redemption fees or program fees; results would be lower if they were included. Returns do not reflect the deduction of taxes that a shareholder would pay on Portfolio distributions or the redemption of Portfolio shares.
8 The ratios after and before fee waivers and/or expense reimbursements by and recoupments to manager are the same since the recoupments to manager represent less than 0.01%.
9 The investment manager recouped expenses previously reimbursed by the investment manager on behalf of the Portfolio, not to exceed the expense cap.
10 Amount represents less than 0.005%.
See accompanying notes to financial statements.
273
PACE Select Advisors Trust
Notes to financial statements
Organization and significant accounting policies
PACE Select Advisors Trust (the "Trust") is registered with the US Securities and Exchange Commission ("SEC") under the Investment Company Act of 1940 (the "1940 Act"), as amended, as an open-end management investment company currently composed of fifteen separate investment portfolios and was organized as a Delaware statutory trust under the laws of the State of Delaware by Certificate of Trust dated September 9, 1994, as amended June 9, 1995 and thereafter. The trustees of the Trust have authority to issue an unlimited number of shares of beneficial interest, par value $0.001 per share.
The Trust has fifteen portfolios available for investment, each having its own investment objectives and policies: PACE Money Market Investments, PACE Government Securities Fixed Income Investments, PACE Intermediate Fixed Income Investments, PACE Strategic Fixed Income Investments, PACE Municipal Fixed Income Investments, PACE International Fixed Income Investments, PACE High Yield Investments, PACE Large Co Value Equity Investments, PACE Large Co Growth Equity Investments, PACE Small/Medium Co Value Equity Investments, PACE Small/Medium Co Growth Equity Investments, PACE International Equity Investments, PACE International Emerging Markets Equity Investments, PACE Global Real Estate Securities Investments and PACE Alternative Strategies Investments (each a "Portfolio" and collectively, the "Portfolios").
Each of the Portfolios is classified as a diversified investment company with the exception of PACE Intermediate Fixed Income Investments, PACE International Fixed Income Investments, PACE Global Real Estate Securities Investments and PACE Alternative Strategies Investments. With the exception of PACE Money Market Investments (which currently offers Class P shares only) each Portfolio currently offers Class A, Class C, Class Y and Class P shares. Each class represents interests in the same assets of the applicable Portfolio and the classes are identical except for differences in their sales charge structures, ongoing service and distribution charges and certain transfer agency and related services expenses. Prior to March 1, 2012, each Portfolio except PACE Money Market Investments and PACE Global Real Estate Securities Investments offered Class B shares. Effective on March 1, 2012 all outstanding Class B shares converted to Class A shares of the same Portfolio. All classes of shares have equal voting privileges except that each class has exclusive voting rights with respect to its service and/or distribution plan, if any. Class Y and Class P shares have no service or distribution plan. The Portfolios' Class P shares currently are available for purchase only to participants in the PACESM Select Advisors Program, except that PACE Money Market Investments shares are also available to participants in the PACESM Multi Advisor Program.
The Trust accounts separately for the assets, liabilities and operations of each Portfolio. Expenses directly attributable to each Portfolio are charged to that Portfolio's operations; expenses which are applicable to all Portfolios are allocated among them on a pro rata basis.
In the normal course of business, the Portfolios may enter into contracts that contain a variety of representations or that provide indemnification for certain liabilities. The Portfolios' maximum exposure under these arrangements is unknown, as this would involve future claims that may be made against the Portfolios that have not yet occurred. However, the Portfolios have not had such claims or losses through July 31, 2013 pursuant to these contracts and expect the risk of loss to be remote.
PACE Money Market Investments attempts to maintain a stable net asset value of $1.00 per share; the Portfolio has adopted certain investment, portfolio valuation and dividend/distribution policies in an attempt to enable it to do so. As with any money market portfolio, there is no assurance, however, that the Portfolio will be able to maintain a stable net asset value of $1.00 per share.
The Financial Accounting Standards Board ("FASB") Accounting Standards Codification ("ASC") is the exclusive reference of authoritative US generally accepted accounting principles ("US GAAP") recognized by the FASB to be applied by nongovernmental entities. Rules and interpretive releases of the SEC under authority of federal laws are
274
PACE Select Advisors Trust
Notes to financial statements
also sources of authoritative US GAAP for SEC registrants. The Portfolios' financial statements are prepared in accordance with US GAAP, which may require the use of management estimates and assumptions. Actual results could differ from those estimates. The following is a summary of significant accounting policies:
Valuation of investments
Each Portfolio calculates its net asset value on days that the New York Stock Exchange ("NYSE") is open. A Portfolio calculates net asset value separately for each class as of the close of regular trading on the NYSE (generally, 4:00 p.m., Eastern time). If trading on the NYSE is halted for the day before 4:00 p.m., Eastern time, a Portfolio's net asset value per share will be calculated as of the time trading was halted.
PACE Money Market Investments' net asset value per share is expected to be $1.00 per share, although this value is not guaranteed. PACE Money Market Investments values its securities at amortized cost. This method uses a constant amortization to maturity of the difference between the cost of the instrument to the fund and the amount due at maturity.
Each Portfolio (other than PACE Money Market Investments) calculates its net asset value based on the current market value, where available, for its portfolio securities. The Portfolios normally obtain market values for their investments from independent pricing sources and broker-dealers. Independent pricing sources may use reported last sale prices, official market closing prices, current market quotations or valuations from computerized evaluation systems that derive values based on comparable investments. An evaluation system incorporates parameters such as security quality, maturity and coupon, and/or research and evaluations by its staff, including review of broker-dealer market price quotations, if available, in determining the valuation of the portfolio investments. If a market value is not readily available from an independent pricing source for a particular investment, that investment is valued at fair value as determined in good faith by or under the direction of the board of trustees (the "board").
The amortized cost method of valuation, which approximates market value, generally is used to value short-term debt instruments with 60 days or less remaining to maturity, unless the board determines that this does not represent fair value. Investments in open-end investment companies are valued at the daily closing net asset value of the respective investment company. Pursuant to the Portfolios' use of the practical expedient within ASC Topic 820, investments in non-registered investment companies are also valued at the daily closing net asset value. All investments quoted in foreign currencies will be valued daily in US dollars on the basis of the foreign currency exchange rates prevailing at the time such valuation is determined by the Portfolios' custodian and accounting agent. Foreign currency exchange rates are generally determined as of the close of the NYSE.
Investments traded in the over-the-counter ("OTC") market and listed on The NASDAQ Stock Market, Inc. ("NASDAQ") normally are valued at the NASDAQ Official Closing Price. Other OTC securities are valued at the last bid price on the valuation date available prior to valuation. Investments which are listed on US and foreign stock exchanges are normally valued at the market closing price, the last sale price on the day the securities are valued or, lacking any sales on such day, at the last available bid price.
The board has delegated to the UBS Global Asset Management (Americas) Inc. Global Valuation Committee ("GVC") the responsibility for making fair value determinations with respect to the Portfolios' holdings. The GVC is comprised of representatives of management, including members of the investment team. The GVC provides reports to the board at each quarterly meeting regarding any investments that have been fair valued, valued pursuant to standing instructions approved by the GVC, or where non-vendor pricing sources had been used to make fair value determinations when sufficient information exists during the prior quarter. Fair valuation determinations are subject to review at least monthly by the GVC during scheduled meetings. Pricing decisions, processes, and controls over fair value determinations are subject to internal and external reviews, including annual internal compliance reviews and periodic internal audit reviews of securities valuations.
275
PACE Select Advisors Trust
Notes to financial statements
The types of investments for which such fair value pricing may be necessary include, but are not limited to: foreign investments under some circumstances, as discussed below; securities of an issuer that has entered into a restructuring; investments whose trading has been halted or suspended; fixed income securities that are in default and for which there is no current market value quotation; and investments that are restricted as to transfer or resale. Various factors may be reviewed in order to make a good faith determination of a investment's fair value. These factors include, but are not limited to, fundamental analytical data relating to the investment; the nature and duration of restrictions on disposition of the investments; and the evaluation of forces which influence the market in which the investments are purchased and sold. Valuing investments at fair value involves greater reliance on judgment than valuing investments that have readily available market quotations. Fair value determinations can also involve reliance on quantitative models employed by an independent third party.
Each Portfolio expects to price most of its portfolio holdings based on current market value, as discussed previously. Investments for which market quotations are not readily available may be valued based upon appraisals received from a pricing service using a computerized evaluation system or formula method that takes into consideration market indices, matrices, yield curves and other specific adjustments. Investments also may be valued based on appraisals derived from information concerning the investment or similar investments received from recognized dealers in those holdings. If a Portfolio concludes that a market quotation is not readily available for a portfolio investment for any number of reasons, including the occurrence of a "significant event" (e.g., natural disaster or governmental action), after the close of trading in its principal domestic or foreign market but before the close of regular trading on the NYSE, the Portfolio will use fair value methods to reflect those events. This policy is intended to assure that each Portfolio's net asset value fairly reflects the value of its portfolio holdings as of the time of pricing. PACE International Equity Investments, PACE International Emerging Markets Equity Investments, PACE Global Real Estate Securities Investments and PACE Alternative Strategies Investments may use a systematic fair valuation model provided by an independent third party to value investments principally traded in foreign markets in order to adjust for possible stale pricing that may occur between the close of the foreign exchanges and the time for valuation. If an investment is valued at a "fair value," that value is likely to be different from the last quoted market price for the investment. The use of the fair valuation model may result in investments being transferred between Level 1 and Level 2 of the fair value hierarchy at reporting period ends. In cases where investments are traded on more than one exchange, the investments are valued on the exchange designated as the primary market by UBS Global Asset Management (Americas) Inc. ("UBS Global AM"), the investment manager of the Portfolios.
Futures contracts are generally valued at the settlement price established each day on the exchange on which they are traded. Forward foreign currency contracts are valued daily using forward exchange rates quoted by independent pricing services. Swaps and other OTC derivatives are marked to market daily based upon values from third party vendors or quotations from market makers to the extent available. In the event that market quotations are not readily available or deemed unreliable, the swap is valued at fair value as determined in good faith by or under the direction of the board.
US GAAP requires disclosure regarding the various inputs that are used in determining the value of each Portfolio's investments. These inputs are summarized into the three broad levels listed below:
Level 1—Unadjusted quoted prices in active markets for identical investments.
Level 2—Other significant observable inputs, including but not limited to, quoted prices for similar investments, interest rates, prepayment speeds and credit risks.
Level 3—Unobservable inputs inclusive of each Portfolio's own assumptions in determining the fair value of investments.
276
PACE Select Advisors Trust
Notes to financial statements
In accordance with the requirements of US GAAP, a fair value hierarchy has been included near the end of each Portfolio's Portfolio of investments.
In January 2013, Accounting Standards Update 2013-01 ("ASU 2013-01"), "Clarifying the Scope of Disclosures about Offsetting Assets and Liabilities", replaced Accounting Standards Update 2011-11 ("ASU 2011-11"), "Disclosures about Offsetting Assets and Liabilities". ASU 2013-01 is effective for fiscal years beginning on or after January 1, 2013, and interim periods within those annual periods. ASU 2011-11 was intended to enhance disclosure requirements on the offsetting of financial assets and liabilities. ASU 2013-01 limits the scope of the new balance sheet offsetting disclosures to derivatives, repurchase agreements, and securities lending transactions to the extent that they are (1) offset in the financial statements or (2) subject to an enforceable master netting arrangement or similar agreement. Management is currently evaluating the application of ASU 2013-01 and its impact, if any, on the Fund's financial statements.
The provisions of ASC Topic 815 "Derivatives and Hedging" ("ASC Topic 815") require qualitative disclosures about objectives and strategies for using derivatives, quantitative disclosures about fair value amounts of gains and losses on derivative instruments and disclosures about credit-risk related contingent features in derivative agreements. Since investment companies value their derivatives at fair value and recognize changes in fair value through the Statement of operations, they do not qualify for hedge accounting under ASC Topic 815. Accordingly, even though a Portfolio's investments in derivatives may represent economic hedges, they are considered to be non-hedge transactions for purposes of disclosure under ASC Topic 815. ASC Topic 815 requires (1) objectives for using derivative instruments be disclosed in terms of underlying risk and accounting designation, (2) the fair values of derivative instruments and their gains and losses be disclosed in a tabular format, and (3) information be disclosed about credit-risk contingent features of derivatives contracts. Details of this disclosure can be found below as well as in the Portfolio of investments. Swap agreements, forward foreign currency contracts, swaptions and options written entered into by the Portfolios may contain credit-risk related contingent features that could be triggered subject to certain circumstances. Such circumstances include agreed upon net asset value thresholds. If triggered, the derivative counterparty could request additional cash margin and/or terminate the derivative contract. The aggregate fair value of the derivative contracts that are in a net liability position that contain these triggers can be found in the applicable Portfolio of investments. The aggregate fair value of assets that are already posted as collateral as of July 31, 2013 is reflected in the Statement of assets and liabilities. If the applicable credit-risk related contingent features were triggered as of July 31, 2013, a Portfolio would be required to post additional collateral or may be required to terminate the contract and settle any amounts outstanding. The Portfolios are not aware of any additional credit-risk contingent features on other derivative contracts held by the Portfolios (other than those described earlier). The volume of derivatives that is presented in the Portfolio of investments of each Portfolio is consistent with the derivative activity during the year ended July 31, 2013.
277
PACE Select Advisors Trust
Notes to financial statements
At July 31, 2013, the Portfolios had the following derivatives categorized by underlying risk:
Asset derivatives1
| | | Interest
rate risk | | Foreign
exchange
risk | | Credit
risk | | Equity
risk | | Total | |
PACE Intermediate Fixed Income Investments | |
Futures contracts | | $ | 364,225 | | | $ | — | | | $ | — | | | $ | — | | | $ | 364,225 | | |
Options and swaptions purchased | | | 820,417 | | | | 45,565 | | | | — | | | | — | | | | 865,982 | | |
Forward foreign currency contracts | | | — | | | | 402,913 | | | | — | | | | — | | | | 402,913 | | |
Swap agreements | | | 994,226 | | | | — | | | | — | | | | — | | | | 994,226 | | |
Total value | | $ | 2,178,868 | | | $ | 448,478 | | | $ | — | | | $ | — | | | $ | 2,627,346 | | |
PACE Strategic Fixed Income Investments | |
Futures contracts | | $ | 15,348 | | | $ | — | | | $ | — | | | $ | — | | | $ | 15,348 | | |
Forward foreign currency contracts | | | — | | | | 3,616,947 | | | | — | | | | — | | | | 3,616,947 | | |
Swap agreements | | | 371,154 | | | | — | | | | 1,062,701 | | | | — | | | | 1,433,855 | | |
Total value | | $ | 386,502 | | | $ | 3,616,947 | | | $ | 1,062,701 | | | $ | — | | | $ | 5,066,150 | | |
PACE International Fixed Income Investments | |
Futures contracts | | $ | 5,863,457 | | | $ | — | | | $ | — | | | $ | — | | | $ | 5,863,457 | | |
Forward foreign currency contracts | | | — | | | | 2,105,641 | | | | — | | | | — | | | | 2,105,641 | | |
Total value | | $ | 5,863,457 | | | $ | 2,105,641 | | | $ | — | | | $ | — | | | $ | 7,969,098 | | |
PACE High Yield Investments | |
Futures contracts | | $ | 890,157 | | | $ | — | | | $ | — | | | $ | — | | | $ | 890,157 | | |
Forward foreign currency contracts | | | — | | | | 984,761 | | | | — | | | | — | | | | 984,761 | | |
Total value | | $ | 890,157 | | | $ | 984,761 | | | $ | — | | | $ | — | | | $ | 1,874,918 | | |
PACE International Equity Investments | |
Futures contracts | | $ | — | | | $ | — | | | $ | — | | | $ | 65,856 | | | $ | 65,856 | | |
Forward foreign currency contracts | | | — | | | | 857,271 | | | | — | | | | — | | | | 857,271 | | |
Total value | | $ | — | | | $ | 857,271 | | | $ | — | | | $ | 65,856 | | | $ | 923,127 | | |
PACE Alternative Strategies Investments | |
Futures contracts | | $ | 1,294,767 | | | $ | — | | | $ | — | | | $ | 5,495,620 | | | $ | 6,790,387 | | |
Options and swaptions purchased | | | 275,970 | | | | 6,056,495 | | | | — | | | | 9,153,887 | | | | 15,486,352 | | |
Forward foreign currency contracts | | | — | | | | 16,723,318 | | | | — | | | | — | | | | 16,723,318 | | |
Swap agreements | | | 547,940 | | | | — | | | | 1,357,891 | | | | 1,132,156 | | | | 3,037,987 | | |
Total value | | $ | 2,118,677 | | | $ | 22,779,813 | | | $ | 1,357,891 | | | $ | 15,781,663 | | | $ | 42,038,044 | | |
Liability derivatives2
| | | Interest
rate risk | | Foreign
exchange
risk | | Credit
risk | | Equity
risk | | Total | |
PACE Intermediate Fixed Income Investments | |
Futures contracts | | $ | (125,001 | ) | | $ | — | | | $ | — | | | $ | — | | | $ | (125,001 | ) | |
Forward foreign currency contracts | | | — | | | | (265,189 | ) | | | — | | | | — | | | | (265,189 | ) | |
Swap agreements | | | (41,823 | ) | | | — | | | | — | | | | — | | | | (41,823 | ) | |
Options and swaptions written | | | (359,005 | ) | | | — | | | | — | | | | — | | | | (359,005 | ) | |
Total value | | $ | (525,829 | ) | | $ | (265,189 | ) | | $ | — | | | $ | — | | | $ | (791,018 | ) | |
278
PACE Select Advisors Trust
Notes to financial statements
Liability derivatives2
| | | Interest
rate risk | | Foreign
exchange
risk | | Credit
risk | | Equity
risk | | Total | |
PACE Strategic Fixed Income Investments | |
Futures contracts | | $ | (8,682 | ) | | $ | — | | | $ | — | | | $ | — | | | $ | (8,682 | ) | |
Forward foreign currency contracts | | | — | | | | (3,288,718 | ) | | | — | | | | — | | | | (3,288,718 | ) | |
Swap agreements | | | (14,083,675 | ) | | | — | | | | (806,905 | ) | | | — | | | | (14,890,580 | ) | |
Total value | | $ | (14,092,357 | ) | | $ | (3,288,718 | ) | | $ | (806,905 | ) | | $ | — | | | $ | (18,187,980 | ) | |
PACE International Fixed Income Investments | |
Futures contracts | | $ | (2,980,897 | ) | | $ | — | | | $ | — | | | $ | — | | | $ | (2,980,897 | ) | |
Forward foreign currency contracts | | | — | | | | (8,142,383 | ) | | | — | | | | — | | | | (8,142,383 | ) | |
Total value | | $ | (2,980,897 | ) | | $ | (8,142,383 | ) | | $ | — | | | $ | — | | | $ | (11,123,280 | ) | |
PACE High Yield Investments | |
Forward foreign currency contracts | | $ | — | | | $ | (958 | ) | | $ | — | | | $ | — | | | $ | (958 | ) | |
Total value | | $ | — | | | $ | (958 | ) | | $ | — | | | $ | — | | | $ | (958 | ) | |
PACE International Equity Investments | |
Forward foreign currency contracts | | $ | — | | | $ | (1,382,313 | ) | | $ | — | | | $ | — | | | $ | (1,382,313 | ) | |
Total value | | $ | — | | | $ | (1,382,313 | ) | | $ | — | | | $ | — | | | $ | (1,382,313 | ) | |
PACE Alternative Strategies Investments | |
Futures contracts | | $ | (2,031,389 | ) | | $ | — | | | $ | — | | | $ | (5,972,290 | ) | | $ | (8,003,679 | ) | |
Written options and foreign exchange
options | | | (374,573 | ) | | | (4,549,722 | ) | | | — | | | | (5,192,542 | ) | | | (10,116,837 | ) | |
Forward foreign currency contracts | | | — | | | | (15,822,220 | ) | | | — | | | | — | | | | (15,822,220 | ) | |
Swap agreements | | | (947,498 | ) | | | — | | | | — | | | | (825,471 | ) | | | (1,772,969 | ) | |
Total value | | $ | (3,353,460 | ) | | $ | (20,371,942 | ) | | $ | — | | | $ | (11,990,303 | ) | | $ | (35,715,705 | ) | |
1 In the Statement of assets and liabilities, options and swaptions purchased are shown within Investments in securities of unaffiliated issuers, at value, swap agreements (other than centrally cleared swaps) are shown at value while forward foreign currency contracts are shown using unrealized appreciation. Futures contracts and centrally cleared swaps are reported in the table above using the cumulative appreciation as detailed in the futures contract and centrally cleared swaps tables at the end of the Portfolio of investments, respectively, but only the variation margin to be received, if any, is reported within the Statement of assets and liabilities.
2 In the Statement of assets and liabilities, swap agreements and written options and swaptions are shown at value while forward foreign currency contracts are shown using unrealized depreciation. Futures contracts and centrally cleared swaps are reported in the table above using the cumulative depreciation as detailed in the futures contract table at the end of the Portfolio of investments, but only the variation margin to be paid, if any, is reported within the Statement of assets and liabilities.
279
PACE Select Advisors Trust
Notes to financial statements
Net realized and unrealized gains (losses) from derivative instruments during the year ended July 31, 2013, were as follows:
| | | Interest
rate risk | | Foreign
exchange
risk | | Credit
risk | | Equity
risk | | Total | |
PACE Intermediate Fixed Income Investments | |
Net realized gain (loss)3 | |
Futures contracts | | $ | 704,264 | | | $ | — | | | $ | — | | | $ | — | | | $ | 704,264 | | |
Options and swaptions purchased4 | | | (255,835 | ) | | | (124,436 | ) | | | — | | | | — | | | | (380,271 | ) | |
Forward foreign currency contracts | | | — | | | | 226,214 | | | | — | | | | — | | | | 226,214 | | |
Swap agreements | | | 668,276 | | | | — | | | | 65,431 | | | | — | | | | 733,707 | | |
Options and swaptions written | | | (136,392 | ) | | | 73,262 | | | | — | | | | — | | | | (63,130 | ) | |
Total net realized gain (loss) | | $ | 980,313 | | | $ | 175,040 | | | $ | 65,431 | | | $ | — | | | $ | 1,220,784 | | |
Net change in unrealized appreciation/depreciation5 | |
Futures contracts | | $ | 472,780 | | | $ | — | | | $ | — | | | $ | — | | | $ | 472,780 | | |
Options and swaptions purchased4 | | | 67,327 | | | | (9,382 | ) | | | — | | | | — | | | | 57,945 | | |
Forward foreign currency contracts | | | — | | | | 185,893 | | | | — | | | | — | | | | 185,893 | | |
Swap agreements | | | 1,027,766 | | | | — | | | | (94,294 | ) | | | — | | | | 933,472 | | |
Options and swaptions written | | | (14,644 | ) | | | — | | | | — | | | | — | | | | (14,644 | ) | |
Total net change in unrealized
appreciation/depreciation | | $ | 1,553,229 | | | $ | 176,511 | | | $ | (94,294 | ) | | $ | — | | | $ | 1,635,446 | | |
PACE Strategic Fixed Income Investments | |
Net realized gain (loss)3 | |
Options and swaptions purchased4 | | $ | 1,602,149 | | | $ | — | | | $ | — | | | $ | — | | | $ | 1,602,149 | | |
Futures contracts | | | 13,089,342 | | | | — | | | | — | | | | — | | | | 13,089,342 | | |
Options and swaptions written | | | 1,860,995 | | | | — | | | | — | | | | — | | | | 1,860,995 | | |
Swap agreements | | | 6,553,872 | | | | — | | | | 277,905 | | | | — | | | | 6,831,777 | | |
Forward foreign currency contracts | | | — | | | | (514,340 | ) | | | — | | | | — | | | | (514,340 | ) | |
Total net realized gain (loss) | | $ | 23,106,358 | | | $ | (514,340 | ) | | $ | 277,905 | | | $ | — | | | $ | 22,869,923 | | |
Net change in unrealized appreciation/depreciation5 | |
Options and swaptions purchased4 | | $ | 1,430,778 | | | $ | — | | | $ | — | | | $ | — | | | $ | 1,430,778 | | |
Futures contracts | | | 6,666 | | | | — | | | | — | | | | — | | | | 6,666 | | |
Options and swaptions written4 | | | (1,584,410 | ) | | | — | | | | — | | | | — | | | | (1,584,410 | ) | |
Swap agreements | | | (21,368,950 | ) | | | — | | | | 271,906 | | | | — | | | | (21,097,044 | ) | |
Forward foreign currency contracts | | | — | | | | 1,639,006 | | | | — | | | | — | | | | 1,639,006 | | |
Total net change in unrealized
appreciation/depreciation | | $ | (21,515,916 | ) | | $ | 1,639,006 | | | $ | 271,906 | | | $ | — | | | $ | (19,605,004 | ) | |
PACE International Fixed Income Investments | |
Net realized gain (loss)3 | |
Futures contracts | | $ | (2,270,587 | ) | | $ | — | | | $ | — | | | $ | — | | | $ | (2,270,587 | ) | |
Forward foreign currency contracts | | | — | | | | (11,626,735 | ) | | | — | | | | — | | | | (11,626,735 | ) | |
Total net realized gain (loss) | | $ | (2,270,587 | ) | | $ | (11,626,735 | ) | | $ | — | | | $ | — | | | $ | (13,897,322 | ) | |
Net change in unrealized appreciation/depreciation5 | |
Futures contracts | | $ | 3,672,554 | | | $ | — | | | $ | — | | | $ | — | | | $ | 3,672,554 | | |
Forward foreign currency contracts | | | — | | | | (6,868,711 | ) | | | — | | | | — | | | | (6,868,711 | ) | |
Total net change in unrealized
appreciation/depreciation | | $ | 3,672,554 | | | $ | (6,868,711 | ) | | $ | — | | | $ | — | | | $ | (3,196,157 | ) | |
280
PACE Select Advisors Trust
Notes to financial statements
| | | Interest
rate risk | | Foreign
exchange
risk | | Credit
risk | | Equity
risk | | Total | |
PACE High Yield Investments | |
Net realized gain (loss)3 | |
Futures contracts | | $ | (243,812 | ) | | $ | — | | | $ | — | | | $ | — | | | $ | (243,812 | ) | |
Forward foreign currency contracts | | | — | | | | (3,028,999 | ) | | | — | | | | — | | | | (3,028,999 | ) | |
Total net realized gain (loss) | | $ | (243,812 | ) | | $ | (3,028,999 | ) | | $ | — | | | $ | — | | | $ | (3,272,811 | ) | |
Net change in unrealized appreciation/depreciation5 | |
Futures contracts | | $ | 1,052,388 | | | $ | — | | | $ | — | | | $ | — | | | $ | 1,052,388 | | |
Forward foreign currency contracts | | | — | | | | 1,223,131 | | | | — | | | | — | | | | 1,223,131 | | |
Total net change in unrealized
appreciation/depreciation | | $ | 1,052,388 | | | $ | 1,223,131 | | | $ | — | | | $ | — | | | $ | 2,275,519 | | |
PACE International Equity Investments | |
Net realized gain (loss)3 | |
Futures contracts | | $ | — | | | $ | — | | | $ | — | | | $ | 1,064,260 | | | $ | 1,064,260 | | |
Forward foreign currency contracts | | | — | | | | 1,293,807 | | | | — | | | | — | | | | 1,293,807 | | |
Total net realized gain (loss) | | $ | — | | | $ | 1,293,807 | | | $ | — | | | $ | 1,064,260 | | | $ | 2,358,067 | | |
Net change in unrealized appreciation/depreciation5 | |
Futures contracts | | $ | — | | | $ | — | | | $ | — | | | $ | (247,833 | ) | | $ | (247,833 | ) | |
Forward foreign currency contracts | | | — | | | | (1,284,004 | ) | | | — | | | | — | | | | (1,284,004 | ) | |
Total net change in unrealized
appreciation/depreciation | | $ | — | | | $ | (1,284,004 | ) | | $ | — | | | $ | (247,833 | ) | | $ | (1,531,837 | ) | |
PACE Alternative Strategies Investments | |
Net realized gain (loss)3 | |
Futures contracts | | $ | 1,449,889 | | | $ | 28,422 | | | $ | — | | | $ | 2,072,341 | | | $ | 3,550,652 | | |
Options and swaptions purchased4 | | | 1,340,014 | | | | — | | | | — | | | | (16,518,524 | ) | | | (15,178,510 | ) | |
Options and swaptions written | | | 366,012 | | | | (14,012 | ) | | | — | | | | 11,381,049 | | | | 11,733,049 | | |
Forward foreign currency contracts | | | — | | | | 3,398,100 | | | | — | | | | — | | | | 3,398,100 | | |
Swap agreements | | | (1,387,271 | ) | | | — | | | | 2,784,923 | | | | 1,329,784 | | | | 2,727,436 | | |
Total net realized gain (loss) | | $ | 1,768,644 | | | $ | 3,412,510 | | | $ | 2,784,923 | | | $ | (1,735,350 | ) | | $ | 6,230,727 | | |
Net change in unrealized appreciation/depreciation5 | |
Futures contracts | | $ | (3,150,431 | ) | | $ | — | | | $ | — | | | $ | (135,531 | ) | | $ | (3,285,962 | ) | |
Options and swaptions purchased4 | | | (618,986 | ) | | | 1,802,648 | | | | — | | | | 2,513,506 | | | | 3,697,168 | | |
Written options, swaptions and
foreign exchange options written | | | 3,941,843 | | | | (1,391,090 | ) | | | — | | | | 1,459,312 | | | | 4,010,065 | | |
Forward foreign currency contracts | | | — | | | | 5,183,510 | | | | — | | | | — | | | | 5,183,510 | | |
Swap agreements | | | 941,450 | | | | — | | | | 3,238,792 | | | | 1,100,924 | | | | 5,281,166 | | |
Total net change in unrealized
appreciation/depreciaton | | $ | 1,113,876 | | | $ | 5,595,068 | | | $ | 3,238,792 | | | $ | 4,938,211 | | | $ | 14,885,947 | | |
3 The net realized gains (losses) are shown in the Statement of operations in net realized gains (losses) from futures, options and swaptions written, swap agreements and forward foreign currency contracts.
4 Realized and unrealized gain (loss) is included in net realized gain (loss) from investments and net change in unrealized appreciation/depreciation on investments.
5 The net change in unrealized appreciation/depreciation is shown in the Statement of operations in net change in unrealized appreciation/depreciation on futures, options and swaptions written, swap agreements and forward foreign currency contracts.
Repurchase agreements—The Portfolios may purchase securities or other obligations from a bank or securities dealer (or its affiliate), subject to the seller's agreement to repurchase them at an agreed upon date (or upon demand) and price. The Portfolios maintain custody of the underlying obligations prior to their repurchase, either
281
PACE Select Advisors Trust
Notes to financial statements
through its regular custodian or through a special "tri-party" custodian or sub-custodian that maintains a separate account for both the Portfolios and their counterparty. The underlying collateral is valued daily in an effort to ensure that the value, including accrued interest, is at least equal to the repurchase price. In the event of default of the obligation to repurchase, the Portfolios generally have the right to liquidate the collateral and apply the proceeds in satisfaction of the obligation. Repurchase agreements involving obligations other than US government securities (such as commercial paper, corporate bonds, equities and mortgage loans) may be subject to special risks and may not have the benefit of certain protections in the event of counterparty insolvency. Moreover, repurchase agreements secured by obligations that are not eligible for direct investment under Rule 2a-7 under the Investment Company Act or a Portfolio's investment strategies and limitations, may require the Portfolio to promptly dispose of such collateral if the seller or guarantor becomes insolvent. If the seller (or seller's guarantor, if any) becomes insolvent, the Portfolios may suffer delays, costs and possible losses in connection with the disposition or retention of the collateral. Under certain circumstances, in the event of default or bankruptcy by the other party to the agreement, realization and/or retention of the collateral may be subject to legal proceedings. Each Portfolio (with the exception of PACE Municipal Fixed Income Investments) may participate in joint repurchase agreement transactions with other funds managed, advised or sub-advised by UBS Global AM.
Under certain circumstances, the Portfolios may engage in a repurchase agreement transaction with a yield of zero in order to invest cash amounts remaining in its portfolio at the end of the day in order to avoid having the Portfolios assessed a fee for uninvested cash held in a business account at a bank.
Restricted securities—The Portfolios may invest in securities that are subject to legal or contractual restrictions on resale. These securities generally may be resold in transactions exempt from registration or to the public if the securities are registered. Disposal of these securities may involve time-consuming negotiations and expense, and prompt sale at an acceptable price may be difficult. Information regarding restricted securities, if any, is included at the end of each Portfolio's Portfolio of investments.
Investment transactions, investment income and expenses—Investment transactions are recorded on the trade date. Realized gains and losses from investment transactions and foreign exchange transactions are calculated using the identified cost method. Dividend income is recorded net of withholding taxes on the ex-dividend date ("ex-date") (except in the case of certain dividends from foreign securities which are recorded as soon after the ex-date as the respective Portfolio, using reasonable diligence, becomes aware of such dividends). Interest income is recorded on an accrual basis. Discounts are accreted and premiums are amortized as adjustments to interest income and the identified cost of investments.
Income, expenses (excluding class-specific expenses) and realized/unrealized gains/losses are allocated proportionately to each class of shares based upon the relative net asset value of outstanding shares (or the value of dividend-eligible shares, as appropriate) of each class at the beginning of the day (after adjusting for current capital share activity of the respective classes). Class-specific expenses are charged directly to the applicable class of shares.
Foreign currency translation—The books and records of the Portfolios are maintained in US dollars. Foreign currency amounts are translated into US dollars as follows: (1) the foreign currency market value of investment securities and other assets and liabilities stated in foreign currencies are translated into US dollars based on the current exchange rates each business day; and (2) purchases, sales, income and expenses are translated at the rate of exchange prevailing on the respective dates of such transactions. The resulting exchange gains and losses are included on the Statement of operations.
The Portfolios do not generally isolate the effects of fluctuations in foreign exchange rates from the effects of fluctuations in the market prices of securities. However, the Portfolios do isolate the effect of fluctuations in foreign
282
PACE Select Advisors Trust
Notes to financial statements
exchange rates when determining the realized gain or loss upon the sale or maturity of foreign currency-denominated debt obligations pursuant to US federal income tax regulations. Net realized foreign currency transaction gain (loss) is treated as ordinary income (loss) for income tax reporting purposes.
Forward foreign currency contracts—Certain Portfolios may enter into forward foreign currency contracts ("forward contracts") as part of its investment strategy, in connection with planned purchases or sales of securities or to hedge the US dollar value of portfolio securities denominated in a particular currency. The Portfolios may also engage in cross-hedging by using forward contracts in one currency to hedge fluctuations in the value of securities denominated in a different currency if the applicable investment sub-advisor anticipates that there is a correlation between the two currencies. Forward contracts may also be used to shift a Portfolio's exposure to foreign currency fluctuations from one country to another.
The Portfolios have no specific limitation on the percentage of assets which may be committed to such contracts; however, the value of all forward contracts will not exceed the value of a Portfolio's total assets. The Portfolios may enter into forward contracts or maintain a net exposure to forward contracts only if (1) the consummation of the contracts would not obligate the Portfolios to deliver an amount of foreign currency in excess of the value of the positions being hedged by such contracts or (2) the Portfolios maintain cash or liquid securities in a segregated account in an amount determined pursuant to the Portfolios' segregation policies as disclosed in the Trust's Statement of Additional Information.
Risks may arise upon entering into forward contracts from the potential inability of counterparties to meet the terms of their contracts and from unanticipated movements in the value of foreign currencies relative to the US dollar or each other.
Fluctuations in the value of open forward contracts are recorded for book purposes as unrealized gains or losses on forward foreign currency contracts by the Portfolios. Realized gains and losses on forward foreign currency contracts include net gains or losses recognized by the Portfolios on contracts which have matured.
Securities traded on to-be-announced basis—The Portfolios may from time to time purchase securities on a to-be-announced ("TBA") basis. In a TBA transaction, the Portfolio commits to purchasing or selling securities for which all specific information is not yet known at the time of the trade, particularly the face amount and maturity date of the underlying security transactions. Securities purchased on a TBA basis are not settled until they are delivered to the Portfolio, normally 15 to 45 days later. Beginning on the date the Portfolio enters into a TBA transaction, cash, US government securities or other liquid securities are segregated in an amount equal in value to the purchase price of the TBA security. These transactions are subject to market fluctuations, and their current value is determined in the same manner as for other securities.
Option writing—Certain Portfolios may write (sell) put and call options on securities or derivative instruments in order to gain exposure to or protect against changes in the markets. When a Portfolio writes a call or a put option, an amount equal to the premium received by the Portfolio is included on the Portfolio's Statement of assets and liabilities as an asset and as an equivalent liability. The amount of the liability is subsequently marked-to-market to reflect the current market value of the option written. If an option which the Portfolio has written either expires on its stipulated expiration date or the Portfolio enters into a closing purchase transaction, the Portfolio realizes a gain (or loss if the cost of a closing purchase transaction exceeds the premium received when the option was written) without regard to any unrealized gain or loss on the underlying security or derivative instrument, and the liability related to such option is extinguished. If a call option which the Portfolio has written is exercised, the Portfolio recognizes a realized gain or loss (long-term or short-term, depending on the holding period of the underlying security) from the sale of the underlying security or derivative instrument and the proceeds from the sale are increased by the premium originally received. If a put option which the Portfolio has written is exercised, the
283
PACE Select Advisors Trust
Notes to financial statements
amount of the premium originally received reduces the cost of the security or derivative instrument which the Portfolio purchases upon exercise of the option.
In writing an option, the Portfolios bear the market risk of an unfavorable change in the price of the derivative instrument, security or currency underlying the written option. Exercise of an option written by a Portfolio could result in the Portfolio selling or buying a derivative instrument, security or currency at a price different from current market value.
Purchased options—Certain Portfolios may also purchase put and call options. Purchasing call options tends to increase exposure to the underlying instrument. Purchasing put options tends to decrease exposure to the underlying instrument. The Portfolio pays a premium which is included on the Statement of assets and liabilities as an investment and subsequently marked to market to reflect the current value of the option. Premiums paid for purchasing options which expire are treated as realized losses. The risk associated with purchasing put and call options is limited to the premium paid. Premiums paid for purchasing options which are exercised or closed are added to the amounts paid or offset against the proceeds on the underlying future, security or currency transaction to determine the realized gain or loss. Purchased options are shown as portfolio holdings within the Portfolio of investments and are included in the Statement of assets and liabilities in investments in unaffiliated securities, at value.
Futures contracts—Certain Portfolios may purchase or sell futures contracts to increase or reduce their exposure to an asset class without purchasing or selling the underlying securities. They may do this to enhance or realize gains, as a hedge and/or to manage the average duration of the Portfolio. Using futures contracts involves various market risks, including interest rate and equity risk as well as the risks that there may be an illiquid market or that a change in the value of the contract may not correlate with changes in the value of the underlying securities.
Upon entering into a futures contract, a Portfolio is required to deliver to a broker an amount of cash and/or government securities equal to a certain percentage of the contract amount. This amount is known as the "initial margin". Subsequent payments, known as "variation margin", generally are made or received by the Portfolio each day depending on the fluctuations in the value of the underlying futures contracts, except that in the case of certain futures contracts payments may be made or received at settlement. Such variation margin is recorded for financial statement purposes on a daily basis as an unrealized gain or loss on futures until the futures contract is closed or expires, at which time the net gain or loss is reclassified to realized gain or loss on futures.
Loan assignments—Certain Portfolios may invest in secured or unsecured fixed or floating rate loans ("Loans") arranged through private negotiations between a borrowing corporation, government or other entity and one or more financial institutions ("Lenders") which may be in the form of participations ("Participations") in Loans or assignments ("Assignments") of all or a portion of Loans from third parties. A Portfolio may invest in multiple series or tranches of a Loan, which may have varying terms and carry different associated risks. Participations typically result in a Portfolio having a contractual relationship only with the Lender, not with the borrower. A Portfolio has the right to receive payments of principal, interest and any fees to which it is entitled only from the Lender selling the Participation and only upon receipt by the Lender of the payments from the borrower. In connection with purchasing Participations, a Portfolio generally has no direct right to enforce compliance by the borrower with the terms of the loan agreement relating to the Loan, or any rights of set-off against the borrower, and a Portfolio may not directly benefit from any collateral supporting the Loan in which it has purchased the Participation. As a result, a Portfolio assumes the credit risk of both the borrower and the Lender that is selling the Participation. In the event of the insolvency of the selling Lender, the Portfolio may be treated as a general creditor of that Lender and may not benefit from any set-off between the Lender and the borrower. A Portfolio will acquire Participations only if its sub-advisor determines that the selling Lender is creditworthy. When a Portfolio purchases Assignments from Lenders, it acquires direct rights against the borrower on the Loan. In an Assignment, the Portfolio is entitled to
284
PACE Select Advisors Trust
Notes to financial statements
receive payments directly from the borrower and, therefore, does not depend on the selling bank to pass these payments onto the Portfolio. However, because Assignments are arranged through private negotiations between potential assignees and assignors, the rights and obligations acquired by a Portfolio as the purchaser of an Assignment may differ from, and be more limited than, those held by the assigning Lender.
Short sales "Against the Box"—Each Portfolio (other than PACE Money Market Investments and PACE Municipal Fixed Income Investments) may engage in short sales of securities it owns or has the right to acquire at no added cost through conversion or exchange of other securities it owns (short sales "against the box"). To make delivery to the purchaser in a short sale, the executing broker borrows the securities being sold short on behalf of a Portfolio, and that Portfolio is obligated to replace the securities borrowed at a date in the future. When a Portfolio sells short, it establishes a margin account with the broker effecting the short sale and deposits collateral with the broker. In addition, the Portfolio maintains, in a segregated account with its custodian, the securities that could be used to cover the short sale. Each Portfolio may incur transaction costs, including dividend and interest expense, in connection with opening, maintaining and closing short sales "against the box".
A Portfolio might make a short sale "against the box" to hedge against market risks when its sub-advisor believes that the price of a security may decline, thereby causing a decline in the value of a security owned by the Portfolio or a security convertible into or exchangeable for a security owned by the Portfolio. In such case, any loss in the Portfolio's long position after the short sale should be reduced by a corresponding gain in the short position. Conversely, any gain in the long position after the short sale should be reduced by a corresponding loss in the short position. The extent to which gains or losses in the long position are reduced will depend upon the amount of the securities sold short relative to the amount of the securities a Portfolio owns, either directly or indirectly, and in the case where the Portfolio owns convertible securities, changes in the investment values or conversion premiums of such securities.
Uncovered short sales—PACE Government Securities Fixed Income Investments (with respect to securities issued by the US Treasury and TBA securities coupon trades), PACE Global Real Estate Securities Investments and PACE Alternative Strategies Investments may engage in short sale transactions in which the Portfolio sells a security it does not own (or does not have the right to acquire at no added cost). The Portfolio must borrow the security to make delivery to the buyer. In a short sale where a Portfolio is not holding a position in the same security (or convertible into the same security), the Portfolio will maintain an account containing cash or liquid assets at such a level that the amount deposited in the account plus that amount deposited with the broker as collateral will, at minimum, equal the current value of the investment sold short. The initial amount of a short sale is recorded as a liability which is marked to market daily. Fluctuations in the value of this liability are recorded as unrealized gains or losses on the Statement of operations. A Portfolio incurs transaction costs, including interest expenses, in connection with opening, maintaining and closing short sales. Because PACE Alternative Strategies Investments is multi-managed and has the ability to engage in short sales, one investment advisor may take a short position and another advisor may take a long position in the same security. A Portfolio will be required to pay the buyer for any dividends or other corporate actions and interest payable on securities while those securities are in a short position. These dividends and interest are booked as an expense or liability to the Portfolio on an accrual basis. A Portfolio will incur a loss as a result of the short sale if the price of the security increases between the date of the short sale and the date on which the Portfolio replaces the borrowed security, and a Portfolio will realize a gain if the security declines in price between those same dates. Because a Portfolio's loss on a short sale arises from increases in the value of the investment sold short, such loss, like the potential increase in price of the security sold short, is theoretically unlimited. In addition, a Portfolio's investments held long could decline in value at the same time the value of the investment sold short increases, thereby increasing the Portfolio's potential for loss. PACE Global Real Estate Securities Investments did not engage in uncovered short sales during the year ended July 31, 2013.
285
PACE Select Advisors Trust
Notes to financial statements
Treasury roll transactions—Certain Portfolios may enter into treasury roll transactions. In a treasury roll transaction, a Portfolio sells a Treasury security to a counterparty with a simultaneous agreement to repurchase the same security at an agreed upon price and date. The Portfolio receives cash from the sale of the Treasury security to use for other investment purposes. For US GAAP purposes, a treasury roll transaction is accounted for as a secured borrowing and not as a purchase and sale. The difference between the sale price and repurchase price represents net interest income or net interest expense reflective of an agreed upon rate between the Portfolio and the counterparty over the term of the borrowing. The Portfolio will benefit from the transaction if the income earned on the investment purchased with the cash received in the treasury roll transaction exceeds the interest expense incurred by the Portfolio. If the interest expense exceeds the income earned, the Portfolio's net investment income and dividends to shareholders may be adversely impacted. Treasury roll transactions involve the risk that the market value of the securities that the Portfolio is required to repurchase may decline below the agreed upon repurchase price of those securities. During the year ended July 31, 2013, the only Portfolios that utilized treasury roll transactions were PACE Intermediate Fixed Income Investments and PACE Strategic Fixed Income Investments.
Reverse repurchase agreements—Certain Portfolios may enter into reverse repurchase agreements with qualified third party banks, securities dealers or their affiliates. Interest on the value of reverse repurchase agreements issued and outstanding is based upon competitive market rates at the time of issuance. At the time a Portfolio enters into a reverse repurchase agreement, the Portfolio establishes and maintains a segregated account with the Portfolio's custodian containing liquid securities having a value not less than the repurchase price, including accrued interest, of the reverse repurchase agreement. For the year ended July 31, 2013, PACE Strategic Fixed Income Investments had average daily reverse repurchase agreements of $22,818,061 for 74 days with a related weighted average annualized interest rate of 0.21%, which resulted in $10,013 of interest expense. There were no reverse repurchase agreements outstanding on July 31, 2013.
Swap agreements—Certain Portfolios may enter into interest rate swap agreements. This type of swap is an agreement that obligates two parties to exchange a series of cash flows at specified intervals based upon or calculated by reference to a specified interest rate(s) for a specified amount. The payment flows are usually netted against each other, with the difference being paid by one party to the other.
Risks may arise as a result of the failure of the counterparty to the swap agreement to comply with the terms of the agreement. The loss incurred by the failure of a counterparty is generally limited to the net interest payment to be received by the Portfolio. Therefore, the Portfolio considers the creditworthiness of the counterparty to a swap agreement in evaluating potential credit risk.
The Portfolio accrues for interim payments on swap agreements on a daily basis, with the net amount recorded within swap agreements on the Statement of assets and liabilities. Once interim payments are settled in cash, the net amount is recorded as realized gain/loss on swaps, in addition to realized gain/loss recorded upon the termination of swap contracts on the Statement of operations. Fluctuations in the value of swap agreements are recorded for financial statement purposes as unrealized appreciation or depreciation of swaps within the Statement of operations.
Inflation swap agreements are used to hedge inflation risk by transferring inflation risk from one party to another through an exchange of cash flows. In an inflation swap, one party pays a fixed rate on a notional principal amount while the other party pays a floating rate linked to an inflation index on that same notional amount. The party paying the floating rate pays the inflation adjusted rate multiplied by the notional principal amount. If the average inflation rate over the term of the swap is the same as the fixed rate of the swap, the two legs will have the same value and the swap will break even.
286
PACE Select Advisors Trust
Notes to financial statements
Credit default swap agreements involve commitments to make or receive payments in the event of a default of a security or a credit event. As a buyer, the Portfolio would make periodic payments to the counterparty, and the Portfolio would receive payments only upon the occurrence of a credit event. If no credit event occurs, the Portfolio will lose its periodic stream of payments over the term of the contract. However, if a credit event does occur, the Portfolio typically would receive full notional value for a reference obligation that may have little or no value. As a seller, the Portfolio would receive periodic payments from the counterparty, and the Portfolio would make payments only upon the occurrence of a credit event. If no default or credit event occurs, the Portfolio will gain the periodic stream of payments it received over the term of the contract and the counterparty will lose its periodic stream of payments over the term of the contract. However, if a default or credit event occurs, the Portfolio typically pays full notional value for a reference obligation that may have little or no value. Credit default swaps may involve greater risks than if the Portfolio had invested in the reference obligation directly and are subject to general market risk, liquidity risk and credit risk.
Credit default swap agreements on credit indices involve one party making a stream of payments to another party in exchange for the right to receive a specified return in the event of a write-down, principal shortfall, interest shortfall or default of all or part of the referenced entities comprising the credit index. A credit index is a list of a basket of credit instruments or exposures designed to be representative of some part of the credit market as a whole. These indices are made up of referenced credits that are judged by a poll of dealers to be the most liquid entities in the credit default swap market based on the sector of the index. Components of the indices may include, but are not limited to, investment grade securities, high yield securities, asset backed securities, emerging markets, and/or various credit ratings within each sector. Credit indices are traded using credit default swaps with standardized terms including a fixed spread and standard maturity dates. An index credit default swap references all the names in the index, and if there is a default, the credit event is settled based on that name's weight in the index. The composition of the indices changes periodically, usually every six months, and for most indices, each name has an equal weight in the index. A Portfolio may use credit default swaps on credit indices to hedge a portfolio of credit default swaps or bonds with a credit default swap on indices which is less expensive than it would be to buy many credit default swaps to achieve a similar effect. Credit default swaps on indices are benchmarks for protecting investors owning bonds against default, and traders use them to speculate on changes in credit quality.
Credit default swap agreements on corporate issues or sovereign issues of an emerging country involve one party making a stream of payments to another party in exchange for the right to receive a specified return in the event of a default or other credit event. If a credit event occurs and cash settlement is not elected, a variety of other deliverable obligations may be delivered in lieu of the specific referenced obligation. The ability to deliver other obligations may result in a cheapest-to-deliver option (the buyer of protection's right to choose the deliverable obligation with the lowest value following a credit event). The Portfolio may use credit default swaps on corporate issues or sovereign issues of an emerging country to provide a measure of protection against defaults of the issuers (i.e., to reduce risk where the Portfolio owns or has exposure to the referenced obligation) or to take an active long or short position with respect to the likelihood of a particular issuer's default.
The maximum potential amount of future payments (undiscounted) that a Portfolio as a seller of protection could be required to make under a credit default swap agreement would be an amount equal to the notional amount of the agreement which may exceed the amount of the value reflected on the Statement of assets and liabilities. Notional amounts of all credit default swap agreements outstanding as of July 31, 2013 for which a Portfolio is the seller of protection are disclosed under the sections "Credit default swaps on credit indices—sell protection" and "Credit default swaps on corporate and sovereign issues—sell protection" in the Portfolios of investments. These potential amounts would be partially offset by any recovery values of the respective referenced obligations, upfront payments received upon entering into the agreement, or net amounts received from the settlement of buy protection credit default swap agreements entered into, if any, by a Portfolio for the same referenced entity or entities.
287
PACE Select Advisors Trust
Notes to financial statements
Total return swap contracts involve commitments to pay interest in exchange for a market-linked return both based on notional amounts. To the extent the total return of the security or index underlying the transactions exceeds or falls short of the offsetting interest rate obligation, the Portfolio will receive a payment from or make a payment to the counterparty.
Variance swap agreements involve two parties agreeing to exchange cash flows based on the measured variance (or square of volatility) of a specified underlying asset. One party agrees to exchange a "fixed rate" or strike price payment for the "floating rate" or realized price variance on the underlying asset with respect to the notional amount. At inception, the strike price is generally chosen such that the fair value of the swap is zero. At the maturity date, a net cash flow is exchanged, where the payoff amount is equivalent to the difference between the realized price variance of the underlying asset and the strike price multiplied by the notional amount. As a receiver of the realized price variance, the Portfolio would receive the payoff amount when the realized price variance of the underlying asset is greater than the strike price and would owe the payoff amount when the variance is less than the strike price. As a payer of the realized price variance the Portfolio would owe the payoff amount when the realized price variance of the underlying asset is greater than the strike price and would receive the payoff amount when the variance is less than the strike price.
Certain clearinghouses currently offer clearing for limited types of derivatives transactions, such as interest and credit derivatives. In a cleared derivative transaction, a Portfolio typically enters into the transaction with a financial institution counterparty, and performance of the transaction is effectively guaranteed by a central clearinghouse, thereby reducing or eliminating the Portfolio's exposure to the credit risk of its original counterparty. The Portfolio will be required to post specified levels of margin with the clearinghouse or at the instruction of the clearinghouse; the margin required by a clearinghouse may be greater than the margin the Portfolio would be required to post in an uncleared transaction. Only a limited number of transactions are currently eligible for clearing. Centrally cleared swaps, if any, are reported on the Statement of assets and liabilities based on variation margin received or paid, if any.
The use of swaps involves investment techniques and risks different from those associated with ordinary portfolio security transactions. If a Portfolio's sub-adviser is incorrect in its forecast of market values, interest rates and other applicable factors, the investment performance of the Portfolios will be less favorable than it would have been if this investment technique was never used. Swaps do not involve the delivery of securities and are subject to counterparty risk. If the other party to a swap defaults and fails to consummate the transaction, a Portfolio's risk of loss will consist of the net amount of interest or other payments that the Portfolio is contractually entitled to receive. Therefore, the Portfolio would consider the creditworthiness of the counterparty to a swap agreement in evaluating potential credit risk.
Dividends and distributions—Dividends and distributions to shareholders are recorded on the ex-dividend date. The amounts of dividends and distributions are determined in accordance with federal income tax regulations, which may differ from US GAAP. These "book/tax" differences are either considered temporary or permanent in nature. To the extent these differences are permanent in nature, such amounts are reclassified within the capital accounts based on their federal tax-basis treatment; temporary differences do not require reclassification.
Concentration of risk—Investing in securities of foreign issuers and currency transactions may involve certain considerations and risks not typically associated with investments in the United States. These risks include revaluation of currencies, adverse fluctuations in foreign currency values and possible adverse political, social and economic developments, including those particular to a specific industry, country or region, which could cause the securities and their markets to be less liquid and prices more volatile than those of comparable US companies and US government securities. These risks are greater with respect to securities of issuers located in emerging market countries in which PACE International Fixed Income Investments, PACE High Yield Investments, PACE International
288
PACE Select Advisors Trust
Notes to financial statements
Equity Investments, PACE International Emerging Markets Equity Investments, PACE Global Real Estate Securities Investments and PACE Alternative Strategies Investments are authorized to invest.
Small capitalization ("small cap") companies may be more vulnerable than larger capitalization companies to adverse business or economic developments. Small cap companies may also have limited product lines, markets or financial resources, and may be dependent on a relatively small management group. Securities of such companies may be less liquid and more volatile than securities of larger capitalization companies or the market averages in general and therefore may involve greater risk than investing in larger capitalization companies. In addition, small cap companies may not be well-known to the investing public, may not have institutional ownership and may have only cyclical, static or moderate growth prospects. These risks are greater with respect to the securities in which PACE Small/Medium Co Value Equity Investments and PACE Small/Medium Co Growth Equity Investments tend to invest.
Investments in bonds with ratings of BB (Standard & Poor's Ratings Group) or Ba (Moody's Investors Service, Inc.) or below (commonly referred to as "high yield" bonds), or deemed of equivalent quality, have an increased risk of defaulting or otherwise being unable to honor a financial obligation. These securities are considered to be predominantly speculative with respect to an issuer's capacity to pay interest and repay principal in accordance with the terms of the obligations. Lower-quality bonds are more likely to be subject to an issuer's default or downgrade than investment grade (higher-quality) bonds.
The ability of the issuers of debt securities held by the Portfolios to meet their obligations may be affected by economic and political developments particular to a specific industry, country, state or region.
Investment management and administration fees and other transactions with affiliates
The Trust has entered into an investment management and administration contract ("Management Contract") with UBS Global AM. In accordance with the Management Contract, each Portfolio paid UBS Global AM investment management and administration fees, which were accrued daily and paid monthly, in accordance with the following schedule as of July 31, 2013:
Portfolio | | Annual rate as a percentage of
each Portfolio's average daily net assets | |
PACE Money Market Investments | | 0.350% | |
PACE Government Securities Fixed Income Investments | | 0.650% up to $250 million
0.600% above $250 million up to $500 million
0.575% above $500 million up to $750 million
0.550% above $750 million up to $1 billion
0.525% above $1 billion | |
PACE Intermediate Fixed Income Investments | | 0.550% up to $250 million
0.500% above $250 million up to $500 million
0.475% above $500 million up to $750 million
0.450% above $750 million up to $1 billion
0.425% above $1 billion | |
PACE Strategic Fixed Income Investments | | 0.650% up to $250 million
0.600% above $250 million up to $500 million
0.575% above $500 million up to $750 million
0.550% above $750 million up to $1 billion
0.525% above $1 billion | |
289
PACE Select Advisors Trust
Notes to financial statements
Portfolio | | Annual rate as a percentage of
each Portfolio's average daily net assets | |
PACE Municipal Fixed Income Investments | | 0.550% up to $250 million
0.500% above $250 million up to $500 million
0.475% above $500 million up to $750 million
0.450% above $750 million up to $1 billion
0.425% above $1 billion | |
PACE International Fixed Income Investments | | 0.750% up to $500 million
0.725% above $500 million up to $1 billion
0.700% above $1 billion | |
PACE High Yield Investments | | 0.800% up to $500 million
0.750% above $500 million up to $1 billion
0.725% above $1 billion up to $1.5 billion
0.700% above $1.5 billion up to $2 billion
0.675% above $2 billion | |
PACE Large Co Value Equity Investments | | 0.800% up to $250 million
0.770% above $250 million up to $500 million
0.730% above $500 million up to $1 billion
0.700% above $1 billion | |
PACE Large Co Growth Equity Investments | | 0.800% up to $500 million
0.775% above $500 million up to $1 billion
0.750% above $1 billion up to $1.5 billion
0.725% above $1.5 billion up to $2 billion
0.700% above $2 billion | |
PACE Small/Medium Co Value Equity Investments | | 0.800% up to $500 million
0.775% above $500 million | |
PACE Small/Medium Co Growth Equity Investments | | 0.800% up to $500 million
0.775% above $500 million | |
PACE International Equity Investments | | 0.900% up to $500 million
0.875% above $500 million up to $1 billion
0.850% above $1 billion up to $1.5 billion
0.825% above $1.5 billion up to $2 billion
0.800% above $2 billion | |
PACE International Emerging Markets Equity Investments | | 1.100% up to $500 million
1.075% above $500 million up to $1 billion
1.050% above $1 billion up to $1.5 billion
1.025% above $1.5 billion up to $2 billion
1.000% above $2 billion | |
PACE Global Real Estate Securities Investments | | 0.800% up to $500 million
0.750% above $500 million up to $1 billion
0.725% above $1 billion up to $1.5 billion
0.700% above $1.5 billion up to $2 billion
0.675% above $2 billion | |
PACE Alternative Strategies Investments | | 1.400% up to $500 million
1.350% above $500 million up to $1 billion
1.300% above $1 billion up to $1.5 billion
1.275% above $1.5 billion up to $2 billion
1.250% above $2 billion | |
290
PACE Select Advisors Trust
Notes to financial statements
Under separate Sub-Advisory Agreements, with the exception of PACE Money Market Investments, UBS Global AM (not the Portfolios) pays the following investment sub-advisors a fee from the investment management and administration fees which UBS Global AM receives, which is accrued daily and paid monthly:
Portfolio | | Investment sub-advisor | |
PACE Government Securities Fixed Income Investments | | Pacific Investment Management Company LLC | |
PACE Intermediate Fixed Income Investments | | BlackRock Financial Management, Inc. | |
PACE Strategic Fixed Income Investments | | Pacific Investment Management Company LLC | |
PACE Municipal Fixed Income Investments | | Standish Mellon Asset Management Company LLC | |
PACE International Fixed Income Investments | | Rogge Global Partners plc | |
PACE High Yield Investments | | MacKay Shields LLC | |
PACE Large Co Value Equity Investments1 | | Institutional Capital LLC
Pzena Investment Management, LLC
Robeco Investment Management2 | |
PACE Large Co Growth Equity Investments | | Delaware Management Company
J.P. Morgan Investment Management3
Roxbury Capital Management, LLC | |
PACE Small/Medium Co Value Equity Investments5 | | Kayne Anderson Rudnick Investment Management, LLC
Metropolitan West Capital Management, LLC
Systematic Financial Management, L.P. | |
PACE Small/Medium Co Growth Equity Investments | | Copper Rock Capital Partners, LLC
Palisade Capital Management, LLC
Riverbridge Partners, LLC | |
PACE International Equity Investments | | J.P. Morgan Investment Management Inc.—International REI segment4
J.P. Morgan Investment Management Inc.—EAFE Opportunities segment
Martin Currie Inc.6
Mondrian Investment Partners Ltd. | |
PACE International Emerging Markets Equity Investments | | Lee Munder Capital Group, LLC7
Mondrian Investment Partners Ltd.
William Blair & Company L.L.C | |
PACE Global Real Estate Securities Investments | | Brookfield Investment Management Inc.
CBRE Clarion Securities, LLC | |
PACE Alternative Strategies Investments | | Analytic Investors, LLC
First Quadrant L.P.8
Standard Life Investments (Corporate Funds) Limited | |
1 As of the close of business, September 11, 2013, Los Angeles Capital Management and Equity Research, Inc. became an investment sub-advisor of the Portfolio.
2 As of the close of business, May 28, 2013, Westwood Management Corp was terminated as investment sub-advisor and Robeco Investment Management became an investment sub-advisor of the Portfolio on May 29, 2013.
3 As of the close of business, October 4, 2012, Marsico Capital Management, LLC and Wellington Management Company, LLP ("Wellington") were terminated as investment sub-advisors and J.P. Morgan Investment Management became an investment sub-advisor of the Portfolio on October 5, 2012.
4 As of the close of business, September 12, 2013, J.P. Morgan Investment Management Inc.—International REI segment was terminated as investment sub-advisor and Los Angeles Capital Management and Equity Research, Inc. became an investment sub-advisor of the Portfolio on September 13, 2013.
5 As of the close of business, October 2, 2012, Buckhead Capital Management, LLC was terminated as an investment sub-advisor.
6 As of the close of business, August 4, 2013, Martin Currie Inc. was terminated as investment advisor and Chautauqua Capital became an investment sub-advisor of the Portfolio on August 5, 2013.
7 As of the close of business, October 15, 2012, Delaware Management Company and Pzena Investment Management, LLC were terminated as investment sub-advisors to PACE International Emerging Markets Equity Investments and Lee Munder Capital Group, LLC became an investment sub-advisor of the Portfolio on October 16, 2012.
8 As of the close of business, November 30, 2012, Wellington was terminated as an investment sub-advisor to PACE Alternative Strategies Investments. Cash from the sale of securities from the portfolio previously managed by Wellington was transferred to First Quadrant L.P., an existing investment sub-advisor of the Portfolio on December 3, 2012.
291
PACE Select Advisors Trust
Notes to financial statements
At July 31, 2013, certain Portfolios owe or are (owed by) UBS Global AM for investment management and administration fees, net of fee waivers/expense reimbursements and/or recoupments as follows:
Portfolio | | Amounts due
to (owed by)
UBS Global AM | |
PACE Money Market Investments | | $ | (27,073 | ) | |
PACE Government Securities Fixed Income Investments | | | 227,518 | | |
PACE Intermediate Fixed Income Investments | | | 148,533 | | |
PACE Strategic Fixed Income Investments | | | 502,143 | | |
PACE Municipal Fixed Income Investments | | | 174,395 | | |
PACE International Fixed Income Investments | | | 314,637 | | |
PACE High Yield Investments | | | 221,972 | | |
PACE Large Co Value Equity Investments | | | 811,197 | | |
PACE Large Co Growth Equity Investments | | | 783,696 | | |
PACE Small/Medium Co Value Equity Investments | | | 369,824 | | |
PACE Small/Medium Co Growth Equity Investments | | | 363,057 | | |
PACE International Equity Investments | | | 696,949 | | |
PACE International Emerging Markets Equity Investments | | | 310,020 | | |
PACE Global Real Estate Securities Investments | | | 29,836 | | |
PACE Alternative Strategies Investments | | | 701,021 | | |
UBS Global AM has entered into a written fee waiver agreement with each of PACE Government Securities Fixed Income Investments and PACE International Fixed Income Investments, under which UBS Global AM is contractually obligated to waive its management fees to the extent necessary to reflect the lower sub-advisory fees paid by UBS Global AM to each of these Portfolio's sub-advisors: Pacific Investment Management Company LLC and Rogge Global Partners plc. Additionally, effective October 1, 2011 through expiration on November 30, 2012, UBS Global AM had entered into a written fee waiver agreement with PACE Alternative Strategies Investments under which UBS Global AM was contractually obligated to waive its management fees equal to an annual rate of 0.05% of the Portfolio's average daily net assets. For the year ended July 31, 2013, UBS Global AM was contractually obligated to waive $151,670, $280,638 and $84,930 in investment management and administration fees for PACE Government Securities Fixed Income Investments, PACE International Fixed Income Investments and PACE Alternative Strategies Investments, respectively. These management fee waivers will not be subject to future recoupment.
With respect to the following Portfolios, UBS Global AM may voluntarily waive its management fees to the extent necessary to reflect lower sub-advisory fees paid. This management fee waiver will not be subject to future recoupment. Once started, there is no guarantee that UBS Global AM would continue to voluntarily waive a portion of its management fees. For the year ended July 31, 2013, UBS Global AM voluntarily waived fees of:
| | Management fees
waived | |
PACE Municipal Fixed Income Investments | | $ | 5,770 | | |
PACE Large Co Value Equity Investments | | | 22,487 | | |
PACE International Equity Investments | | | 7,803 | | |
PACE International Emerging Markets Equity Investments | | | 231,019 | | |
PACE Alternative Strategies Investments | | | 7,071 | | |
Additionally, with respect to PACE Money Market Investments, UBS Global AM may voluntarily waive fees and/or reimburse expenses from time to time in the event that the Portfolio's yield falls below a certain level. Once started, there is no guarantee that UBS Global AM would continue to voluntarily waive an additional portion of its fees
292
PACE Select Advisors Trust
Notes to financial statements
and/or reimburse expenses. For the year ended July 31, 2013, UBS Global AM voluntarily waived and/or reimbursed expenses of $1,285,806 for PACE Money Market Investments for that purpose.
UBS Global AM is contractually obligated to waive all or a portion of its investment management and administration fees and/or to reimburse the Portfolios for certain operating expenses in order to maintain the total annual ordinary operating expenses of each class (with certain exclusions such as dividend expense, borrowing costs and interest expense, if any) through November 30, 2013 at a level not to exceed the amounts in the table below.
Each Portfolio will repay UBS Global AM for any such waived fees/reimbursed expenses during a three-year period following July 31, 2012, to the extent that ordinary operating expenses (with certain exclusions such as dividend expense, borrowing costs and interest expense) are otherwise below the applicable expense cap in effect at the time the fees or expenses were waived/reimbursed. For the year ended July 31, 2013, UBS Global AM had the following voluntary fee waivers/expense reimbursements, and recoupments. The fee waivers/expense reimbursements, portions of which are subject to repayment by the Portfolios through July 31, 2016, and recoupments for the year ended July 31, 2013, were as follows:
Portfolio | | Class A
expense
cap | | Class C
expense
cap | | Class Y
expense
cap | | Class P
expense
cap | | Fee waivers/
expense
reimbursements | | Recoupments | |
PACE Money Market Investments | | | N/A | | | | N/A | | | | N/A | | | | 0.60 | % | | $ | 918,256 | | | $ | — | | |
PACE Government Securities Fixed Income Investments1 | | | 0.97 | % | | | 1.47 | % | | | 0.72 | % | | | 0.72 | | | | 522,385 | | | | — | | |
PACE Intermediate Fixed Income Investments | | | 0.93 | | | | 1.43 | | | | 0.68 | | | | 0.68 | | | | 254,708 | | | | — | | |
PACE Strategic Fixed Income Investments | | | 1.06 | | | | 1.56 | | | | 0.81 | | | | 0.81 | | | | 5,086 | | | | 75,594 | | |
PACE Municipal Fixed Income Investments1 | | | 0.90 | | | | 1.40 | | | | 0.65 | | | | 0.65 | | | | 122,007 | | | | — | | |
PACE International Fixed Income Investments | | | 1.25 | | | | 1.75 | | | | 1.00 | | | | 1.00 | | | | 232,737 | | | | — | | |
PACE High Yield Investments1 | | | 1.28 | | | | 1.78 | | | | 1.03 | | | | 1.03 | | | | 172,704 | | | | — | | |
PACE Large Co Value Equity Investments | | | 1.27 | | | | 2.02 | | | | 1.02 | | | | 1.02 | | | | — | | | | — | | |
PACE Large Co Growth Equity Investments | | | 1.30 | | | | 2.05 | | | | 1.05 | | | | 1.05 | | | | — | | | | 237 | | |
PACE Small/Medium Co Value Equity Investments | | | 1.41 | | | | 2.16 | | | | 1.16 | | | | 1.16 | | | | 182 | | | | 25,353 | | |
PACE Small/Medium Co Growth Equity Investments | | | 1.38 | | | | 2.13 | | | | 1.13 | | | | 1.13 | | | | 28,069 | | | | — | | |
PACE International Equity Investments | | | 1.55 | | | | 2.30 | | | | 1.30 | | | | 1.30 | | | | — | | | | — | | |
PACE International Emerging Markets Equity Investments | | | 2.15 | | | | 2.90 | | | | 1.90 | | | | 1.90 | | | | — | | | | — | | |
PACE Global Real Estate Securities Investments | | | 1.45 | | | | 2.20 | | | | 1.20 | | | | 1.20 | | | | 387,440 | | | | — | | |
PACE Alternative Strategies Investments1 | | | 1.88 | | | | 2.63 | | | | 1.63 | | | | 1.63 | | | | 86,304 | | | | 5,526 | | |
1 Expense caps in the table above became effective December 1, 2012. Prior to December 1, 2012, expense caps were as follows:
| | | Class A | | Class C | | Class Y | | Class P | |
PACE Government Securities Fixed Income Investments | | | 1.02 | % | | | 1.52 | % | | | 0.77 | % | | | 0.77 | % | |
PACE Municipal Fixed Income Investments | | | 0.93 | | | | 1.43 | | | | 0.68 | | | | 0.68 | | |
PACE High Yield Investments | | | 1.35 | | | | 1.85 | | | | 1.10 | | | | 1.10 | | |
PACE Alternative Strategies Investments | | | 1.95 | | | | 2.70 | | | | 1.70 | | | | 1.70 | | |
293
PACE Select Advisors Trust
Notes to financial statements
At July 31, 2013, the following Portfolios had remaining fee waivers/expense reimbursements subject to repayment to UBS Global AM and respective dates of expiration as follows:
Portfolio | | Fee waivers/
expense
reimbursements
subject to
repayment | | Expires
July 31,
2014 | | Expires
July 31,
2015 | | Expires
July 31,
2016 | |
PACE Money Market Investments | | $ | 3,090,058 | | | $ | 996,232 | | | $ | 1,175,570 | | | $ | 918,256 | | |
PACE Government Securities Fixed Income Investments—Class A | | | 45,946 | | | | 12,256 | | | | 5,842 | | | | 27,848 | | |
PACE Government Securities Fixed Income Investments—Class C | | | 19,953 | | | | 7,022 | | | | 3,791 | | | | 9,140 | | |
PACE Government Securities Fixed Income Investments—Class Y | | | 137,112 | | | | 44,298 | | | | 38,637 | | | | 54,177 | | |
PACE Government Securities Fixed Income Investments—Class P | | | 990,926 | | | | 299,909 | | | | 259,797 | | | | 431,220 | | |
PACE Intermediate Fixed Income Investments—Class A | | | 72,269 | | | | 24,476 | | | | 27,123 | | | | 20,670 | | |
PACE Intermediate Fixed Income Investments—Class C | | | 6,946 | | | | 2,496 | | | | 2,597 | | | | 1,853 | | |
PACE Intermediate Fixed Income Investments—Class Y | | | 6,397 | | | | 2,519 | | | | 2,171 | | | | 1,707 | | |
PACE Intermediate Fixed Income Investments—Class P | | | 631,307 | | | | 177,770 | | | | 223,059 | | | | 230,478 | | |
PACE Strategic Fixed Income Investments—Class Y | | | 12,420 | | | | 4,342 | | | | 2,992 | | | | 5,086 | | |
PACE Strategic Fixed Income Investments—Class P | | | 315,393 | | | | 220,315 | | | | 95,078 | | | | — | | |
PACE Municipal Fixed Income Investments—Class A | | | 36,963 | | | | 10,357 | | | | 11,866 | | | | 14,740 | | |
PACE Municipal Fixed Income Investments—Class C | | | 8,906 | | | | 2,530 | | | | 2,848 | | | | 3,528 | | |
PACE Municipal Fixed Income Investments—Class Y | | | 196 | | | | 69 | | | | 58 | | | | 69 | | |
PACE Municipal Fixed Income Investments—Class P | | | 307,608 | | | | 100,938 | | | | 103,000 | | | | 103,670 | | |
PACE International Fixed Income Investments—Class Y | | | 8,065 | | | | 3,207 | | | | 2,912 | | | | 1,946 | | |
PACE International Fixed Income Investments—Class P | | | 742,263 | | | | 248,516 | | | | 262,956 | | | | 230,791 | | |
PACE High Yield Investments—Class P | | | 418,982 | | | | 118,506 | | | | 127,772 | | | | 172,704 | | |
PACE Large Co Growth Equity Investments—Class C | | | 1,228 | | | | 538 | | | | 690 | | | | — | | |
PACE Small/Medium Co Value Equity Investments—Class Y | | | 199 | | | | — | | | | 17 | | | | 182 | | |
PACE Small/Medium Co Value Equity Investments—Class P | | | 256,039 | | | | 56,586 | | | | 199,453 | | | | — | | |
PACE Small/Medium Co Growth Equity Investments—Class Y | | | 557 | | | | — | | | | 154 | | | | 403 | | |
PACE Small/Medium Co Growth Equity Investments—Class P | | | 332,235 | | | | 116,115 | | | | 188,454 | | | | 27,666 | | |
PACE Global Real Estate Securities Investments—Class A | | | 25,712 | | | | 10,103 | | | | 9,971 | | | | 5,638 | | |
PACE Global Real Estate Securities Investments—Class C | | | 1,065 | | | | 492 | | | | 416 | | | | 157 | | |
PACE Global Real Estate Securities Investments—Class Y | | | 1,138 | | | | 234 | | | | 385 | | | | 519 | | |
PACE Global Real Estate Securities Investments—Class P | | | 1,210,417 | | | | 400,486 | | | | 428,805 | | | | 381,126 | | |
PACE Alternative Strategies Investments—Class A | | | 24,789 | | | | 15,999 | | | | — | | | | 8,790 | | |
PACE Alternative Strategies Investments—Class Y | | | 1,508 | | | | 702 | | | | 98 | | | | 708 | | |
PACE Alternative Strategies Investments—Class P | | | 76,806 | | | | — | | | | — | | | | 76,806 | | |
Under normal conditions, the Portfolios invest cash collateral from securities lending activities into an affiliated private money market fund, UBS Private Money Market Fund LLC ("Private Money Market"), which operates in compliance with most of the substantive provisions of Rule 2a-7 of the 1940 Act. Private Money Market is managed by UBS Global AM and is currently offered as a cash management option to mutual funds and certain other accounts managed by the Portfolios' Investment Manager. UBS Global AM acts as managing member and receives a management fee from Private Money Market payable monthly in arrears at the annual rate of 0.10% of Private Money Market's average daily members' equity, minus the aggregate operating expenses of, and incurred by, Private Money Market during each such related month, not including investment expenses (including brokerage commissions, taxes, interest charges and other costs with respect to transactions in securities) and extraordinary expenses including litigation expenses, if any. UBS Global AM may, in its sole discretion, waive all or any portion of the management fee to which it may be entitled from time to time in order to maintain operating expenses at a
294
PACE Select Advisors Trust
Notes to financial statements
certain level. Distributions received from Private Money Market, net of fee rebates paid to borrowers, are reflected as securities lending income in the Statement of operations.
During the year ended July 31, 2013, the Portfolios listed below paid broker commissions to affiliates of the investment manager as follows:
Affiliated broker | | PACE
Large Co
Value
Equity
Investments | | PACE
Large Co
Growth
Equity
Investments | | PACE
Small/Medium Co
Growth
Equity
Investments | | PACE
International
Equity
Investments | | PACE
International
Emerging
Markets
Equity
Investments | | PACE
Alternative
Strategies
Investments | |
UBS AG | | $ | — | | | $ | — | | | $ | — | | | $ | 3,807 | | | $ | 904 | | | $ | 6,936 | | |
UBS Securities Asia Ltd. | | | — | | | | — | | | | — | | | | — | | | | 3,124 | | | | 188 | | |
UBS Securities Canada Inc. | | | — | | | | — | | | | — | | | | — | | | | — | | | | 407 | | |
UBS Securities LLC | | | 2,048 | | | | 1,691 | | | | 1,321 | | | | — | | | | 3,813 | | | | — | | |
UBS Securities Pte Ltd. | | | — | | | | — | | | | — | | | | — | | | | 234 | | | | — | | |
UBS Warburg LLC | | | — | | | | — | | | | — | | | | — | | | | 298 | | | | — | | |
Additional information regarding compensation to affiliate of a board member
Professor Meyer Feldberg serves as a senior advisor to Morgan Stanley, a financial services firm with which the Portfolios may conduct transactions, resulting in him being an interested trustee of the Portfolios. The Portfolios' have been informed that Professor Feldberg's role at Morgan Stanley does not involve matters directly affecting any UBS funds. Portfolio transactions are executed through Morgan Stanley based on that firm's ability to provide best execution of the transactions. For the year ended July 31, 2013, the following Portfolios paid brokerage commissions to Morgan Stanley in the amounts as follows:
PACE Intermediate Fixed Income Investments | | $ | 1,349 | | |
PACE Strategic Fixed Income Investments | | | 60 | | |
PACE Large Co Value Equity Investments | | | 34,923 | | |
PACE Large Co Growth Equity Investments | | | 45,053 | | |
PACE Small/Medium Co Value Equity Investments | | | 1,217 | | |
PACE Small/Medium Co Growth Equity Investments | | | 18,676 | | |
PACE International Equity Investments | | | 49,280 | | |
PACE International Emerging Markets Equity Investments | | | 40,188 | | |
PACE Global Real Estate Securities Investments | | | 2,243 | | |
PACE Alternative Strategies Investments | | | 791,386 | | |
295
PACE Select Advisors Trust
Notes to financial statements
During the year ended July 31, 2013, the following Portfolios purchased and sold certain securities (e.g., fixed income securities) in principal trades with Morgan Stanley having aggregate values as follows:
PACE Money Market Investments | | $ | 95,805,334 | | |
PACE Government Securities Fixed Income Investments | | | 6,273,054,173 | | |
PACE Intermediate Fixed Income Investments | | | 805,684,033 | | |
PACE Strategic Fixed Income Investments | | | 9,162,488,659 | | |
PACE Municipal Fixed Income Investments | | | 16,837,012 | | |
PACE International Fixed Income Investments | | | 79,281,906 | | |
PACE High Yield Investments | | | 8,139,021 | | |
PACE Small/Medium Co Value Equity Investments | | | 186,109 | | |
PACE Small/Medium Co Growth Equity Investments | | | 464,695 | | |
PACE International Equity Investments | | | 92,606 | | |
PACE Global Real Estate Securities Investments | | | 1,182,150 | | |
PACE Alternative Strategies Investments | | | 108,221,099 | | |
Morgan Stanley received compensation in connection with these trades, which may have been in the form of a "mark-up" or "mark-down" of the price of the securities, a fee from the issuer for maintaining a commercial paper program, or some other form of compensation. Although the precise amount of this compensation is not generally known by the investment manager, it is believed that under normal circumstances it represents a small portion of the total value of the transactions.
Service and distribution plans
UBS Global Asset Management (US) Inc. ("UBS Global AM (US)") is the principal underwriter of each Portfolio's shares. Under separate plans of service and/or distribution pertaining to Class A and Class C shares, the Portfolios (with the exception of PACE Money Market Investments, which only offers Class P shares), pay UBS Global AM (US) monthly service fees at the annual rate of 0.25% of the average daily net assets of Class A and Class C shares and monthly distribution fees (1) at the annual rate of 0.75% of the average daily net assets of Class C shares for PACE Large Co Value Equity Investments, PACE Large Co Growth Equity Investments, PACE Small/Medium Co Value Equity Investments, PACE Small/Medium Co Growth Equity Investments, PACE International Equity Investments, PACE International Emerging Markets Equity Investments, PACE Global Real Estate Securities Investments and PACE Alternative Strategies Investments and (2) at the annual rate of 0.50% of the average daily net assets of Class C shares for PACE Government Securities Fixed Income Investments, PACE Intermediate Fixed Income Investments, PACE Strategic Fixed Income Investments, PACE Municipal Fixed Income Investments, PACE International Fixed Income Investments and PACE High Yield Investments.
UBS Global AM (US) also receives the proceeds of the initial sales charges paid upon the purchase of Class A shares and the contingent deferred sales charges paid by shareholders upon certain redemptions of Class A and Class C shares.
296
PACE Select Advisors Trust
Notes to financial statements
At July 31, 2013, certain Portfolios owed UBS Global AM (US) service and distribution fees, and for the year ended July 31, 2013, certain Portfolios were informed by UBS Global AM (US) that it had earned sales charges as follows:
| Portfolio | | Service and distribution
fees owed | | Sales charges earned
by distributor | |
PACE Government Securities Fixed Income Investments—Class A | | $ | 14,242 | | | $ | 4,339 | | |
PACE Government Securities Fixed Income Investments—Class C | | | 10,839 | | | | 454 | | |
PACE Intermediate Fixed Income Investments—Class A | | | 6,697 | | | | 4,922 | | |
PACE Intermediate Fixed Income Investments—Class C | | | 1,720 | | | | — | | |
PACE Strategic Fixed Income Investments—Class A | | | 14,774 | | | | 28,074 | | |
PACE Strategic Fixed Income Investments—Class C | | | 13,826 | | | | 3,864 | | |
PACE Municipal Fixed Income Investments—Class A | | | 13,648 | | | | 3,736 | | |
PACE Municipal Fixed Income Investments—Class C | | | 7,874 | | | | 300 | | |
PACE International Fixed Income Investments—Class A | | | 14,884 | | | | 4,182 | | |
PACE International Fixed Income Investments—Class C | | | 3,735 | | | | — | | |
PACE High Yield Investments—Class A | | | 4,976 | | | | 32,865 | | |
PACE High Yield Investments—Class C | | | 3,561 | | | | 168 | | |
PACE Large Co Value Equity Investments—Class A | | | 31,811 | | | | 12,809 | | |
PACE Large Co Value Equity Investments—Class C | | | 12,052 | | | | — | | |
PACE Large Co Growth Equity Investments—Class A | | | 13,355 | | | | 3,917 | | |
PACE Large Co Growth Equity Investments—Class C | | | 3,362 | | | | 5 | | |
PACE Small/Medium Co Value Equity Investments—Class A | | | 6,696 | | | | 1,291 | | |
PACE Small/Medium Co Value Equity Investments—Class C | | | 4,168 | | | | 12 | | |
PACE Small/Medium Co Growth Equity Investments—Class A | | | 8,740 | | | | 4,564 | | |
PACE Small/Medium Co Growth Equity Investments—Class C | | | 3,350 | | | | 5 | | |
PACE International Equity Investments—Class A | | | 11,679 | | | | 2,528 | | |
PACE International Equity Investments—Class C | | | 2,306 | | | | 60 | | |
PACE International Emerging Markets Equity Investments—Class A | | | 3,584 | | | | 2,574 | | |
PACE International Emerging Markets Equity Investments—Class C | | | 1,881 | | | | — | | |
PACE Global Real Estate Securities Investments—Class A | | | 1,160 | | | | 1,591 | | |
PACE Global Real Estate Securities Investments—Class C | | | 192 | | | | — | | |
PACE Alternative Strategies Investments—Class A | | | 11,472 | | | | 7,341 | | |
PACE Alternative Strategies Investments—Class C | | | 4,121 | | | | 697 | | |
Transfer agency and related services fees
UBS Financial Services Inc. provides certain services to the Portfolios pursuant to a delegation of authority from BNY Mellon Investment Servicing (US) Inc. ("BNY Mellon"), the Portfolios' transfer agent, and is compensated for these services by BNY Mellon, not the Portfolios.
Effective July 1, 2013, UBS Financial Services Inc. voluntarily agreed to waive a portion of the fee that it would otherwise have received from BNY Mellon with respect to PACE Money Market Investments so that BNY Mellon would correspondingly reduce the fees it would have charged to that Portfolio. Given that UBS Global AM has voluntarily undertaken to reduce its fees and/or reimburse expenses to keep the Portfolio's yield at or above a certain level, and that such amount exceeds the reduction in BNY Mellon's fees, the net effect of BNY Mellon's pass through of the waiver by UBS Financial Services Inc. is to partially reduce the amount that UBS Global AM would have otherwise voluntarily waived/reimbursed. For the period July 1, 2013, to July 31, 2013, the amount of the reduction in transfer agency and related services fees charged by BNY Mellon to the Portfolio was $39,164, which reflected an equal amount of compensation that was voluntarily waived by UBS Financial Services Inc. Voluntary fee waiver/expense reimbursement arrangements may end at any time.
297
PACE Select Advisors Trust
Notes to financial statements
For the year ended July 31, 2013, UBS Financial Services Inc. received from BNY Mellon, not the Portfolios, total delegated services fees as follows:
Portfolio | | Delegated
services
fees earned | |
PACE Money Market Investments | | $ | 682,529 | | |
PACE Government Securities Fixed Income Investments | | | 413,550 | | |
PACE Intermediate Fixed Income Investments | | | 257,866 | | |
PACE Strategic Fixed Income Investments | | | 548,974 | | |
PACE Municipal Fixed Income Investments | | | 88,772 | | |
PACE International Fixed Income Investments | | | 539,400 | | |
PACE High Yield Investments | | | 328,392 | | |
PACE Large Co Value Equity Investments | | | 645,252 | | |
PACE Large Co Growth Equity Investments | | | 613,918 | | |
PACE Small/Medium Co Value Equity Investments | | | 579,292 | | |
PACE Small/Medium Co Growth Equity Investments | | | 580,858 | | |
PACE International Equity Investments | | | 579,664 | | |
PACE International Emerging Markets Equity Investments | | | 512,820 | | |
PACE Global Real Estate Securities Investments | | | 301,789 | | |
PACE Alternative Strategies Investments | | | 274,032 | | |
For the year ended July 31, 2013, each Portfolio accrued transfer agency and related services fees payable to BNY Mellon on each class as follows:
Portfolio | | Class A | | Class C | | Class Y | | Class P | |
PACE Money Market Investments | | $ | — | | | $ | — | | | $ | — | | | $ | 1,373,101 | | |
PACE Government Securities Fixed Income Investments | | | 65,694 | | | | 18,926 | | | | 85,014 | | | | 660,095 | | |
PACE Intermediate Fixed Income Investments | | | 35,627 | | | | 3,157 | | | | 2,062 | | | | 417,824 | | |
PACE Strategic Fixed Income Investments | | | 71,226 | | | | 15,910 | | | | 12,356 | | | | 917,572 | | |
PACE Municipal Fixed Income Investments | | | 22,886 | | | | 5,090 | | | | 80 | | | | 138,438 | | |
PACE International Fixed Income Investments | | | 85,408 | | | | 5,753 | | | | 8,997 | | | | 870,955 | | |
PACE High Yield Investments | | | 22,113 | | | | 3,158 | | | | 1,017 | | | | 548,519 | | |
PACE Large Co Value Equity Investments | | | 123,379 | | | | 17,494 | | | | 16,291 | | | | 1,008,152 | | |
PACE Large Co Growth Equity Investments | | | 61,796 | | | | 6,987 | | | | 13,846 | | | | 1,009,010 | | |
PACE Small/Medium Co Value Equity Investments | | | 33,372 | | | | 5,398 | | | | 1,550 | | | | 969,271 | | |
PACE Small/Medium Co Growth Equity Investments | | | 41,365 | | | | 4,157 | | | | 1,204 | | | | 968,303 | | |
PACE International Equity Investments | | | 68,294 | | | | 5,586 | | | | 21,537 | | | | 943,674 | | |
PACE International Emerging Markets Equity Investments | | | 27,560 | | | | 3,573 | | | | 22,803 | | | | 861,026 | | |
PACE Global Real Estate Securities Investments | | | 11,175 | | | | 386 | | | | 820 | | | | 506,125 | | |
PACE Alternative Strategies Investments | | | 47,778 | | | | 3,164 | | | | 2,443 | | | | 421,809 | | |
Securities lending
Each Portfolio may lend securities up to 331/3% of its total assets to qualified broker-dealers or institutional investors. The loans are secured at all times by cash, US government securities or irrevocable letters of credit in an amount at least equal to the market value of the securities loaned, plus accrued interest and dividends, determined on a daily basis and adjusted accordingly. The Portfolio will regain ownership of loaned securities to exercise certain beneficial rights; however, each Portfolio may bear the risk of delay in recovery of, or even loss of rights in, the securities loaned should the borrower fail financially. Each Portfolio receives compensation for lending its securities from
298
PACE Select Advisors Trust
Notes to financial statements
interest or dividends earned on the cash, US government securities or irrevocable letters of credit held as collateral, net of fee rebates paid to the borrower plus reasonable administrative and custody fees. State Street Bank and Trust Company serves as the Portfolios' lending agent.
At July 31, 2013, the following Portfolios had securities on loan at value, cash collateral and non-cash collateral as follows:
| Portfolio | | Value of
securities
on loan | | Cash
collateral | | Non-cash
collateral* | | Total
collateral | | Security types
held as non-cash collateral | |
PACE Intermediate Fixed
Income Investments | | $ | 686,463 | | | $ | 702,620 | | | $ | — | | | $ | 702,620 | | | n/a | |
PACE Strategic Fixed
Income Investments | | | 3,079,792 | | | | 3,121,965 | | | | — | | | | 3,121,965 | | | n/a | |
PACE International Fixed
Income Investments | | | 1,076,916 | | | | 1,096,145 | | | | — | | | | 1,096,145 | | | n/a | |
PACE High Yield Investments | | | 42,954,941 | | | | 44,014,743 | | | | — | | | | 44,014,743 | | | n/a | |
PACE Large Co Value
Equity Investments | | | 15,490,386 | | | | 2,009,700 | | | | 13,630,829 | | | | 15,640,529 | | | US Treasury Notes and US Treasury Bills | |
PACE Large Co Growth
Equity Investments | | | 36,572,894 | | | | 22,558,968 | | | | 14,221,250 | | | | 36,780,218 | | | US Treasury Notes and US Treasury Bills | |
PACE Small/Medium Co Value
Equity Investments | | | 29,711,862 | | | | 30,367,763 | | | | 117,562 | | | | 30,485,325 | | | US Treasury Notes and US Treasury Bills | |
PACE Small/Medium Co Growth
Equity Investments | | | 40,020,764 | | | | 41,413,440 | | | | 313,280 | | | | 41,726,720 | | | US Treasury Notes | |
PACE International
Equity Investments | | | 5,234,742 | | | | 5,492,556 | | | | — | | | | 5,492,556 | | | n/a | |
PACE International Emerging
Markets Equity Investments | | | 32,722,576 | | | | 34,204,798 | | | | 63,425 | | | | 34,268,223 | | | US Treasury Notes; US Treasury Bills
and Federal National Mortgage
Association obligations | |
PACE Global Real Estate
Securities Investments | | | 3,291,862 | | | | 3,476,030 | | | | 3,190 | | | | 3,479,220 | | | US Treasury Notes and Federal National
Mortgage Association obligations | |
* These securities are held for the benefit of the Portfolio at the Portfolio's custodian. The Portfolio cannot repledge or resell this collateral. As such, this collateral is excluded from the Statement of assets and liabilities.
299
PACE Select Advisors Trust
Notes to financial statements
Bank line of credit
Each Portfolio, other than PACE Money Market Investments, participates with other funds managed, advised or sub-advised by UBS Global AM in a $100 million committed credit facility with State Street Bank and Trust Company ("Committed Credit Facility"), to be utilized for temporary financing until the settlement of sales or purchases of portfolio securities, the repurchase or redemption of shares of each Portfolio at the request of shareholders and other temporary or emergency purposes. Under the Committed Credit Facility arrangement, each Portfolio has agreed to pay commitment fees, pro rata, based on the relative asset size of the funds in the Committed Credit Facility. Each Portfolio borrows at prevailing rates in effect at the time of borrowings. For the year ended July 31, 2013, the following Portfolios had borrowings as follows:
Portfolio | | Average daily
amount of
borrowings
outstanding | | Days
outstanding | | Interest
expense | | Weighted average
annualized
interest rate | |
PACE Strategic Fixed Income Investments | | $ | 706,111 | | | | 7 | | | $ | 161 | | | | 1.175 | % | |
PACE Large Co Value Equity Investments | | | 27,300,042 | | | | 6 | | | | 5,192 | | | | 1.141 | | |
PACE Large Co Growth Equity Investments | | | 1,301,778 | | | | 3 | | | | 121 | | | | 1.117 | | |
PACE Small/Medium Co Value Equity Investments | | | 810,834 | | | | 5 | | | | 130 | | | | 1.156 | | |
PACE Small/Medium Co Growth Equity Investments | | | 16,650,793 | | | | 2 | | | | 1,055 | | | | 1.141 | | |
PACE International Emerging Markets Equity Investments | | | 3,152,509 | | | | 4 | | | | 413 | | | | 1.180 | | |
As of July 31, 2013, there were no borrowings outstanding.
Purchases and sales of securities
For the year ended July 31, 2013, aggregate purchases and sales of portfolio securities, excluding purchased options, short-term securities and US Government and agency securities, were as follows:
Portfolio | | Purchases | | Sales | |
PACE Government Securities Fixed Income Investments | | $ | 63,431,728 | | | $ | 51,691,581 | | |
PACE Intermediate Fixed Income Investments | | | 132,319,627 | | | | 147,969,400 | | |
PACE Strategic Fixed Income Investments | | | 211,285,427 | | | | 139,869,677 | | |
PACE Municipal Fixed Income Investments | | | 312,191,649 | | | | 230,486,533 | | |
PACE International Fixed Income Investments | | | 356,472,557 | | | | 317,742,561 | | |
PACE High Yield Investments | | | 153,461,366 | | | | 87,388,653 | | |
PACE Large Co Value Equity Investments | | | 872,109,164 | | | | 1,054,967,228 | | |
PACE Large Co Growth Equity Investments | | | 863,448,077 | | | | 990,782,285 | | |
PACE Small/Medium Co Value Equity Investments | | | 407,258,390 | | | | 447,335,688 | | |
PACE Small/Medium Co Growth Equity Investments | | | 268,098,781 | | | | 315,509,585 | | |
PACE International Equity Investments | | | 326,681,110 | | | | 304,715,698 | | |
PACE International Emerging Markets Equity Investments | | | 573,848,810 | | | | 463,183,538 | | |
PACE Global Real Estate Securities Investments | | | 112,181,000 | | | | 115,773,206 | | |
PACE Alternative Strategies Investments | | | 389,823,741 | | | | 470,621,747 | | |
300
PACE Select Advisors Trust
Notes to financial statements
For the year ended July 31, 2013, aggregate purchases and sales of US Government and agency securities, excluding short-term securities, were as follows:
Portfolio | | Purchases | | Sales | |
PACE Government Securities Fixed Income Investments | | $ | 10,309,876,123 | | | $ | 10,070,037,129 | | |
PACE Intermediate Fixed Income Investments | | | 3,789,611,058 | | | | 3,793,169,669 | | |
PACE Strategic Fixed Income Investments | | | 1,754,147,494 | | | | 1,707,527,595 | | |
PACE International Fixed Income Investments | | | 12,755,509 | | | | 6,082,299 | | |
PACE Alternative Strategies Investments | | | 24,292,672 | | | | 65,554,429 | | |
Commission recapture program
The following Portfolios participate in a brokerage commission recapture program: PACE Large Co Value Equity Investments, PACE Large Co Growth Equity Investments, PACE Small/Medium Co Value Equity Investments, PACE Small/Medium Co Growth Equity Investments, PACE International Equity Investments, PACE International Emerging Markets Equity Investments, PACE Global Real Estate Securities Investments and PACE Alternative Strategies Investments. These Portfolios have established commission recapture arrangements with certain participating brokers or dealers. If a Portfolio's investment sub-advisor chooses to execute a transaction through a participating broker subject to best price and execution, the broker will rebate a portion of the commission back to the Portfolio. Any collateral benefit received through participation in the commission recapture program is directed exclusively to the Portfolio. For the year ended July 31, 2013, the following Portfolios recorded recaptured commissions which are reflected on the Statement of operations within the net realized gains (losses) on investment activities:
Portfolio | | Amount | |
PACE Large Co Value Equity Investments | | $ | 128,929 | | |
PACE Large Co Growth Equity Investments | | | 60,308 | | |
PACE Small/Medium Co Value Equity Investments | | | 77,906 | | |
PACE Small/Medium Co Growth Equity Investments | | | 69,961 | | |
PACE International Equity Investments | | | 1,435 | | |
PACE International Emerging Markets Equity Investments | | | 5,400 | | |
PACE Global Real Estate Securities Investments | | | 53,934 | | |
PACE Alternative Strategies Investments | | | 180 | | |
301
PACE Select Advisors Trust
Notes to financial statements
Shares of beneficial interest
There is an unlimited amount of $0.001 par value shares of beneficial interest authorized. Transactions in shares of beneficial interest for each of the Portfolios, except PACE Money Market Investments, about which similar information is provided on the Statement of changes in net assets, were as follows:
PACE Government Securities Fixed Income Investments
For the year ended July 31, 2013:
| | | Class A | | Class C | |
| | | Shares | | Amount | | Shares | | Amount | |
Shares sold | | | 236,874 | | | $ | 3,130,040 | | | | 23,926 | | | $ | 316,962 | | |
Shares repurchased | | | (994,923 | ) | | | (13,053,892 | ) | | | (266,545 | ) | | | (3,491,433 | ) | |
Dividends reinvested | | | 182,565 | | | | 2,391,892 | | | | 44,417 | | | | 582,953 | | |
Net decrease | | | (575,484 | ) | | $ | (7,531,960 | ) | | | (198,202 | ) | | $ | (2,591,518 | ) | |
| | | Class Y | | Class P | |
| | | Shares | | Amount | | Shares | | Amount | |
Shares sold | | | 1,703,229 | | | $ | 22,428,776 | | | | 11,225,548 | | | $ | 146,828,296 | | |
Shares repurchased | | | (1,911,437 | ) | | | (25,083,392 | ) | | | (10,928,195 | ) | | | (142,775,805 | ) | |
Dividends reinvested | | | 208,162 | | | | 2,727,464 | | | | 1,447,463 | | | | 18,969,470 | | |
Net increase (decrease) | | | (46 | ) | | $ | 72,848 | | | | 1,744,816 | | | $ | 23,021,961 | | |
For the year ended July 31, 2012:
| | | Class A | | Class B1 | | Class C | |
| | | Shares | | Amount | | Shares | | Amount | | Shares | | Amount | |
Shares sold | | | 541,852 | | | $ | 7,250,046 | | | | — | | | $ | — | | | | 36,589 | | | $ | 490,029 | | |
Shares repurchased | | | (899,944 | ) | | | (12,042,640 | ) | | | (537 | ) | | | (7,158 | ) | | | (189,458 | ) | | | (2,536,223 | ) | |
Shares converted from
Class B to Class A | | | 6,909 | | | | 92,413 | | | | (6,905 | ) | | | (92,413 | ) | | | — | | | | — | | |
Dividends reinvested | | | 135,054 | | | | 1,802,479 | | | | 83 | | | | 1,104 | | | | 33,163 | | | | 442,979 | | |
Net decrease | | | (216,129 | ) | | $ | (2,897,702 | ) | | | (7,359 | ) | | $ | (98,467 | ) | | | (119,706 | ) | | $ | (1,603,215 | ) | |
| | | Class Y | | Class P | |
| | | Shares | | Amount | | Shares | | Amount | |
Shares sold | | | 2,052,243 | | | $ | 27,465,488 | | | | 6,501,814 | | | $ | 87,078,881 | | |
Shares repurchased | | | (1,450,709 | ) | | | (19,423,689 | ) | | | (7,982,134 | ) | | | (106,852,032 | ) | |
Dividends reinvested | | | 140,972 | | | | 1,882,183 | | | | 1,077,442 | | | | 14,386,370 | | |
Net increase (decrease) | | | 742,506 | | | $ | 9,923,982 | | | | (402,878 | ) | | $ | (5,386,781 | ) | |
302
PACE Select Advisors Trust
Notes to financial statements
PACE Intermediate Fixed Income Investments
For the year ended July 31, 2013:
| | | Class A | | Class C | |
| | | Shares | | Amount | | Shares | | Amount | |
Shares sold | | | 133,266 | | | $ | 1,653,049 | | | | 9,808 | | | $ | 121,786 | | |
Shares repurchased | | | (533,492 | ) | | | (6,609,843 | ) | | | (53,672 | ) | | | (668,114 | ) | |
Dividends reinvested | | | 18,882 | | | | 233,957 | | | | 819 | | | | 10,174 | | |
Net decrease | | | (381,344 | ) | | $ | (4,722,837 | ) | | | (43,045 | ) | | $ | (536,154 | ) | |
| | | Class Y | | Class P | |
| | | Shares | | Amount | | Shares | | Amount | |
Shares sold | | | 2,101 | | | $ | 25,873 | | | | 12,951,674 | | | $ | 160,745,796 | | |
Shares repurchased | | | (27,351 | ) | | | (339,829 | ) | | | (13,191,170 | ) | | | (163,570,827 | ) | |
Dividends reinvested | | | 816 | | | | 10,119 | | | | 374,358 | | | | 4,637,734 | | |
Net increase (decrease) | | | (24,434 | ) | | $ | (303,837 | ) | | | 134,862 | | | $ | 1,812,703 | | |
For the year ended July 31, 2012:
| | | Class A | | Class B1 | | Class C | |
| | | Shares | | Amount | | Shares | | Amount | | Shares | | Amount | |
Shares sold | | | 237,964 | | | $ | 2,913,176 | | | | — | | | $ | — | | | | 11,501 | | | $ | 139,336 | | |
Shares repurchased | | | (545,140 | ) | | | (6,667,464 | ) | | | — | | | | (1 | ) | | | (36,909 | ) | | | (450,325 | ) | |
Shares converted from
Class B to Class A | | | 5,969 | | | | 72,876 | | | | (5,959 | ) | | | (72,876 | ) | | | — | | | | — | | |
Dividends reinvested | | | 41,090 | | | | 500,418 | | | | 27 | | | | 335 | | | | 2,747 | | | | 33,474 | | |
Net decrease | | | (260,117 | ) | | $ | (3,180,994 | ) | | | (5,932 | ) | | $ | (72,542 | ) | | | (22,661 | ) | | $ | (277,515 | ) | |
| | | Class Y | | Class P | |
| | | Shares | | Amount | | Shares | | Amount | |
Shares sold | | | 3,345 | | | $ | 40,662 | | | | 7,486,849 | | | $ | 91,389,020 | | |
Shares repurchased | | | (30,530 | ) | | | (373,003 | ) | | | (8,075,913 | ) | | | (98,640,926 | ) | |
Dividends reinvested | | | 1,813 | | | | 22,078 | | | | 658,312 | | | | 8,022,093 | | |
Net increase (decrease) | | | (25,372 | ) | | $ | (310,263 | ) | | | 69,248 | | | $ | 770,187 | | |
PACE Strategic Fixed Income Investments
For the year ended July 31, 2013:
| | | Class A | | Class C | |
| | | Shares | | Amount | | Shares | | Amount | |
Shares sold | | | 1,271,239 | | | $ | 19,215,814 | | | | 377,265 | | | $ | 5,720,971 | | |
Shares repurchased | | | (2,336,703 | ) | | | (34,800,415 | ) | | | (330,458 | ) | | | (4,876,452 | ) | |
Dividends reinvested | | | 228,170 | | | | 3,409,656 | | | | 48,798 | | | | 729,504 | | |
Net increase (decrease) | | | (837,294 | ) | | $ | (12,174,945 | ) | | | 95,605 | | | $ | 1,574,023 | | |
| | | Class Y | | Class P | |
| | | Shares | | Amount | | Shares | | Amount | |
Shares sold | | | 180,374 | | | $ | 2,716,342 | | | | 15,533,571 | | | $ | 232,521,191 | | |
Shares repurchased | | | (325,514 | ) | | | (4,756,357 | ) | | | (11,456,321 | ) | | | (171,286,007 | ) | |
Dividends reinvested | | | 15,573 | | | | 232,613 | | | | 2,705,675 | | | | 40,394,024 | | |
Net increase (decrease) | | | (129,567 | ) | | $ | (1,807,402 | ) | | | 6,782,925 | | | $ | 101,629,208 | | |
303
PACE Select Advisors Trust
Notes to financial statements
For the year ended July 31, 2012:
| | | Class A | | Class B1 | | Class C | |
| | | Shares | | Amount | | Shares | | Amount | | Shares | | Amount | |
Shares sold | | | 2,977,049 | | | $ | 44,132,968 | | | | 2,080 | | | $ | 30,850 | | | | 607,119 | | | $ | 9,018,069 | | |
Shares repurchased | | | (1,472,506 | ) | | | (21,949,346 | ) | | | (1,091 | ) | | | (16,087 | ) | | | (145,036 | ) | | | (2,159,907 | ) | |
Shares converted from
Class B to Class A | | | 17,129 | | | | 251,984 | | | | (17,137 | ) | | | (251,984 | ) | | | — | | | | — | | |
Dividends reinvested | | | 218,377 | | | | 3,201,343 | | | | 365 | | | | 5,325 | | | | 40,704 | | | | 596,450 | | |
Net increase (decrease) | | | 1,740,049 | | | $ | 25,636,949 | | | | (15,783 | ) | | $ | (231,896 | ) | | | 502,787 | | | $ | 7,454,612 | | |
| | | Class Y | | Class P | |
| | | Shares | | Amount | | Shares | | Amount | |
Shares sold | | | 252,622 | | | $ | 3,768,183 | | | | 8,248,107 | | | $ | 122,125,445 | | |
Shares repurchased | | | (70,778 | ) | | | (1,043,728 | ) | | | (10,258,773 | ) | | | (151,893,792 | ) | |
Dividends reinvested | | | 11,568 | | | | 169,610 | | | | 2,753,875 | | | | 40,368,164 | | |
Net increase | | | 193,412 | | | $ | 2,894,065 | | | | 743,209 | | | $ | 10,599,817 | | |
PACE Municipal Fixed Income Investments
For the year ended July 31, 2013:
| | | Class A | | Class C | |
| | | Shares | | Amount | | Shares | | Amount | |
Shares sold | | | 110,954 | | | $ | 1,498,338 | | | | 49,387 | | | $ | 669,858 | | |
Shares repurchased | | | (579,860 | ) | | | (7,772,607 | ) | | | (117,167 | ) | | | (1,585,182 | ) | |
Dividends reinvested | | | 109,068 | | | | 1,463,784 | | | | 14,459 | | | | 194,124 | | |
Net decrease | | | (359,838 | ) | | $ | (4,810,485 | ) | | | (53,321 | ) | | $ | (721,200 | ) | |
| | | Class Y | | Class P | |
| | | Shares | | Amount | | Shares | | Amount | |
Shares sold | | | 26 | | | $ | 356 | | | | 9,968,281 | | | $ | 134,115,367 | | |
Shares repurchased | | | (2,627 | ) | | | (35,373 | ) | | | (4,211,642 | ) | | | (56,546,020 | ) | |
Dividends reinvested | | | 73 | | | | 974 | | | | 512,605 | | | | 6,868,310 | | |
Net increase (decrease) | | | (2,528 | ) | | $ | (34,043 | ) | | | 6,269,244 | | | $ | 84,437,657 | | |
For the year ended July 31, 2012:
| | | Class A | | Class B1 | | Class C | |
| | | Shares | | Amount | | Shares | | Amount | | Shares | | Amount | |
Shares sold | | | 113,163 | | | $ | 1,504,231 | | | | — | | | $ | — | | | | 55,762 | | | $ | 736,280 | | |
Shares repurchased | | | (603,268 | ) | | | (8,034,536 | ) | | | — | | | | — | | | | (134,223 | ) | | | (1,794,786 | ) | |
Shares converted from
Class B to Class A | | | 3,619 | | | | 48,732 | | | | (3,617 | ) | | | (48,732 | ) | | | — | | | | — | | |
Dividends reinvested | | | 109,800 | | | | 1,463,135 | | | | 41 | | | | 542 | | | | 14,378 | | | | 191,574 | | |
Net decrease | | | (376,686 | ) | | $ | (5,018,438 | ) | | | (3,576 | ) | | $ | (48,190 | ) | | | (64,083 | ) | | $ | (866,932 | ) | |
| | | Class Y | | Class P | |
| | | Shares | | Amount | | Shares | | Amount | |
Shares sold | | | — | | | $ | — | | | | 3,097,227 | | | $ | 41,343,377 | | |
Shares repurchased | | | (236 | ) | | | (3,099 | ) | | | (4,152,178 | ) | | | (55,436,376 | ) | |
Dividends reinvested | | | 77 | | | | 1,026 | | | | 459,174 | | | | 6,120,548 | | |
Net decrease | | | (159 | ) | | $ | (2,073 | ) | | | (595,777 | ) | | $ | (7,972,451 | ) | |
304
PACE Select Advisors Trust
Notes to financial statements
PACE International Fixed Income Investments
For the year ended July 31, 2013:
| | | Class A | | Class C | |
| | | Shares | | Amount | | Shares | | Amount | |
Shares sold | | | 139,851 | | | $ | 1,568,506 | | | | 13,765 | | | $ | 155,407 | | |
Shares repurchased | | | (1,085,450 | ) | | | (12,170,548 | ) | | | (77,120 | ) | | | (854,879 | ) | |
Dividends reinvested | | | 152,000 | | | | 1,709,650 | | | | 8,770 | | | | 98,799 | | |
Net decrease | | | (793,599 | ) | | $ | (8,892,392 | ) | | | (54,585 | ) | | $ | (600,673 | ) | |
| | | Class Y | | Class P | |
| | | Shares | | Amount | | Shares | | Amount | |
Shares sold | | | 135,369 | | | $ | 1,483,231 | | | | 13,905,232 | | | $ | 153,595,400 | | |
Shares repurchased | | | (72,271 | ) | | | (797,296 | ) | | | (8,532,354 | ) | | | (94,870,858 | ) | |
Dividends reinvested | | | 12,711 | | | | 142,224 | | | | 1,112,273 | | | | 12,471,174 | | |
Net increase | | | 75,809 | | | $ | 828,159 | | | | 6,485,151 | | | $ | 71,195,716 | | |
For the year ended July 31, 2012:
| | | Class A | | Class B1 | | Class C | |
| | | Shares | | Amount | | Shares | | Amount | | Shares | | Amount | |
Shares sold | | | 210,497 | | | $ | 2,462,979 | | | | — | | | $ | — | | | | 8,007 | | | $ | 94,820 | | |
Shares repurchased | | | (1,101,988 | ) | | | (12,889,349 | ) | | | (1,928 | ) | | | (23,768 | ) | | | (67,241 | ) | | | (786,801 | ) | |
Shares converted from
Class B to Class A | | | 10,147 | | | | 125,729 | | | | (10,114 | ) | | | (125,729 | ) | | | — | | | | — | | |
Dividends reinvested | | | 428,575 | | | | 4,864,850 | | | | 44 | | | | 499 | | | | 27,004 | | | | 306,077 | | |
Net decrease | | | (452,769 | ) | | $ | (5,435,791 | ) | | | (11,998 | ) | | $ | (148,998 | ) | | | (32,230 | ) | | $ | (385,904 | ) | |
| | | Class Y | | Class P | |
| | | Shares | | Amount | | Shares | | Amount | |
Shares sold | | | 23,946 | | | $ | 279,191 | | | | 5,690,319 | | | $ | 66,181,777 | | |
Shares repurchased | | | (56,241 | ) | | | (651,900 | ) | | | (7,699,860 | ) | | | (90,021,197 | ) | |
Dividends reinvested | | | 29,749 | | | | 336,958 | | | | 2,556,453 | | | | 29,032,086 | | |
Net increase (decrease) | | | (2,546 | ) | | $ | (35,751 | ) | | | 546,912 | | | $ | 5,192,666 | | |
PACE High Yield Investments
For the year ended July 31, 2013:
| | | Class A | | Class C | |
| | | Shares | | Amount | | Shares | | Amount | |
Shares sold | | | 603,917 | | | $ | 6,361,704 | | | | 44,412 | | | $ | 464,141 | | |
Shares repurchased | | | (697,651 | ) | | | (7,344,207 | ) | | | (103,160 | ) | | | (1,085,461 | ) | |
Dividends reinvested | | | 135,225 | | | | 1,419,444 | | | | 22,934 | | | | 240,357 | | |
Net increase (decrease) | | | 41,491 | | | $ | 436,941 | | | | (35,814 | ) | | $ | (380,963 | ) | |
| | | Class Y | | Class P | |
| | | Shares | | Amount | | Shares | | Amount | |
Shares sold | | | 98,653 | | | $ | 1,042,000 | | | | 13,969,493 | | | $ | 149,189,913 | | |
Shares repurchased | | | (13,911 | ) | | | (147,240 | ) | | | (8,450,693 | ) | | | (89,779,657 | ) | |
Dividends reinvested | | | 7,829 | | | | 82,536 | | | | 2,108,331 | | | | 22,175,832 | | |
Net increase | | | 92,571 | | | $ | 977,296 | | | | 7,627,131 | | | $ | 81,586,088 | | |
305
PACE Select Advisors Trust
Notes to financial statements
For the year ended July 31, 2012:
| | | Class A | | Class C | |
| | | Shares | | Amount | | Shares | | Amount | |
Shares sold | | | 714,335 | | | $ | 7,108,534 | | | | 232,625 | | | $ | 2,292,062 | | |
Shares repurchased | | | (1,096,847 | ) | | | (10,789,898 | ) | | | (42,572 | ) | | | (421,155 | ) | |
Dividends reinvested | | | 130,755 | | | | 1,282,145 | | | | 19,809 | | | | 194,544 | | |
Net increase (decrease) | | | (251,757 | ) | | $ | (2,399,219 | ) | | | 209,862 | | | $ | 2,065,451 | | |
| | | Class Y | | Class P | |
| | | Shares | | Amount | | Shares | | Amount | |
Shares sold | | | 15,715 | | | $ | 155,987 | | | | 6,219,652 | | | $ | 61,823,141 | | |
Shares repurchased | | | (343 | ) | | | (3,306 | ) | | | (5,373,409 | ) | | | (53,277,553 | ) | |
Dividends reinvested | | | 3,859 | | | | 38,015 | | | | 1,989,408 | | | | 19,551,425 | | |
Net increase | | | 19,231 | | | $ | 190,696 | | | | 2,835,651 | | | $ | 28,097,013 | | |
PACE Large Co Value Equity Investments
For the year ended July 31, 2013:
| | | Class A | | Class C | |
| | | Shares | | Amount | | Shares | | Amount | |
Shares sold | | | 175,040 | | | $ | 3,434,403 | | | | 26,182 | | | $ | 549,789 | | |
Shares repurchased | | | (1,197,776 | ) | | | (23,265,563 | ) | | | (108,766 | ) | | | (2,118,774 | ) | |
Dividends reinvested | | | 82,290 | | | | 1,528,957 | | | | 2,890 | | | | 53,922 | | |
Net decrease | | | (940,446 | ) | | $ | (18,302,203 | ) | | | (79,694 | ) | | $ | (1,515,063 | ) | |
| | | Class Y | | Class P | |
| | | Shares | | Amount | | Shares | | Amount | |
Shares sold | | | 62,979 | | | $ | 1,290,137 | | | | 7,426,463 | | | $ | 145,262,969 | | |
Shares repurchased | | | (158,831 | ) | | | (3,121,235 | ) | | | (15,306,648 | ) | | | (310,960,135 | ) | |
Dividends reinvested | | | 12,928 | | | | 240,457 | | | | 818,790 | | | | 15,180,354 | | |
Net decrease | | | (82,924 | ) | | $ | (1,590,641 | ) | | | (7,061,395 | ) | | $ | (150,516,812 | ) | |
For the year ended July 31, 2012:
| | | Class A | | Class B1 | | Class C | |
| | | Shares | | Amount | | Shares | | Amount | | Shares | | Amount | |
Shares sold | | | 254,460 | | | $ | 4,197,390 | | | | — | | | $ | — | | | | 2,455 | | | $ | 40,388 | | |
Shares repurchased | | | (1,316,566 | ) | | | (21,617,707 | ) | | | — | | | | — | | | | (152,597 | ) | | | (2,505,228 | ) | |
Shares converted from
Class B to Class A | | | 5,068 | | | | 89,275 | | | | (5,015 | ) | | | (89,275 | ) | | | — | | | | — | | |
Dividends reinvested | | | 101,311 | | | | 1,559,173 | | | | 5 | | | | 75 | | | | 3,157 | | | | 48,811 | | |
Net decrease | | | (955,727 | ) | | $ | (15,771,869 | ) | | | (5,010 | ) | | $ | (89,200 | ) | | | (146,985 | ) | | $ | (2,416,029 | ) | |
| | | Class Y | | Class P | |
| | | Shares | | Amount | | Shares | | Amount | |
Shares sold | | | 38,125 | | | $ | 654,716 | | | | 7,958,056 | | | $ | 131,904,695 | | |
Shares repurchased | | | (140,618 | ) | | | (2,334,544 | ) | | | (11,111,746 | ) | | | (184,297,137 | ) | |
Dividends reinvested | | | 15,657 | | | | 241,280 | | | | 939,350 | | | | 14,428,411 | | |
Net decrease | | | (86,836 | ) | | $ | (1,438,548 | ) | | | (2,214,340 | ) | | $ | (37,964,031 | ) | |
306
PACE Select Advisors Trust
Notes to financial statements
PACE Large Co Growth Equity Investments
For the year ended July 31, 2013:
| | | Class A | | Class C | |
| | | Shares | | Amount | | Shares | | Amount | |
Shares sold | | | 153,218 | | | $ | 3,209,919 | | | | 10,775 | | | $ | 220,850 | | |
Shares repurchased | | | (538,915 | ) | | | (11,499,521 | ) | | | (31,819 | ) | | | (603,270 | ) | |
Dividends reinvested | | | 4,781 | | | | 96,811 | | | | — | | | | — | | |
Net decrease | | | (380,916 | ) | | $ | (8,192,791 | ) | | | (21,044 | ) | | $ | (382,420 | ) | |
| | | Class Y | | Class P | |
| | | Shares | | Amount | | Shares | | Amount | |
Shares sold | | | 32,417 | | | $ | 718,161 | | | | 6,982,350 | | | $ | 150,492,625 | | |
Shares repurchased | | | (87,566 | ) | | | (1,883,848 | ) | | | (13,181,109 | ) | | | (292,915,014 | ) | |
Dividends reinvested | | | 3,292 | | | | 68,046 | | | | 261,620 | | | | 5,384,151 | | |
Net decrease | | | (51,857 | ) | | $ | (1,097,641 | ) | | | (5,937,139 | ) | | $ | (137,038,238 | ) | |
For the year ended July 31, 2012:
| | | Class A | | Class B1 | | Class C | |
| | | Shares | | Amount | | Shares | | Amount | | Shares | | Amount | |
Shares sold | | | 198,458 | | | $ | 3,702,773 | | | | — | | | $ | — | | | | 9,496 | | | $ | 158,106 | | |
Shares repurchased | | | (592,527 | ) | | | (10,831,332 | ) | | | (119 | ) | | | (1,917 | ) | | | (45,115 | ) | | | (745,843 | ) | |
Shares converted from
Class B to Class A | | | 3,605 | | | | 68,699 | | | | (3,945 | ) | | | (68,699 | ) | | | — | | | | — | | |
Net decrease | | | (390,464 | ) | | $ | (7,059,860 | ) | | | (4,064 | ) | | $ | (70,616 | ) | | | (35,619 | ) | | $ | (587,737 | ) | |
| | | Class Y | | Class P | |
| | | Shares | | Amount | | Shares | | Amount | |
Shares sold | | | 34,070 | | | $ | 667,348 | | | | 6,921,062 | | | $ | 129,951,999 | | |
Shares repurchased | | | (95,328 | ) | | | (1,830,327 | ) | | | (10,911,544 | ) | | | (204,702,386 | ) | |
Dividends reinvested | | | 1,596 | | | | 27,666 | | | | 133,392 | | | | 2,302,340 | | |
Net decrease | | | (59,662 | ) | | $ | (1,135,313 | ) | | | (3,857,090 | ) | | $ | (72,448,047 | ) | |
PACE Small/Medium Co Value Equity Investments
For the year ended July 31, 2013:
| | | Class A | | Class C | |
| | | Shares | | Amount | | Shares | | Amount | |
Shares sold | | | 105,403 | | | $ | 2,069,444 | | | | 1,427 | | | $ | 26,404 | | |
Shares repurchased | | | (305,512 | ) | | | (5,944,498 | ) | | | (40,470 | ) | | | (685,315 | ) | |
Dividends reinvested | | | 7,341 | | | | 134,550 | | | | — | | | | — | | |
Net decrease | | | (192,768 | ) | | $ | (3,740,504 | ) | | | (39,043 | ) | | $ | (658,911 | ) | |
| | | Class Y | | Class P | |
| | | Shares | | Amount | | Shares | | Amount | |
Shares sold | | | 17,951 | | | $ | 370,770 | | | | 3,346,884 | | | $ | 66,893,480 | | |
Shares repurchased | | | (10,376 | ) | | | (204,301 | ) | | | (4,590,581 | ) | | | (92,423,697 | ) | |
Dividends reinvested | | | 170 | | | | 3,199 | | | | 134,898 | | | | 2,521,250 | | |
Net increase (decrease) | | | 7,745 | | | $ | 169,668 | | | | (1,108,799 | ) | | $ | (23,008,967 | ) | |
307
PACE Select Advisors Trust
Notes to financial statements
For the year ended July 31, 2012:
| | | Class A | | Class B1 | | Class C | |
| | | Shares | | Amount | | Shares | | Amount | | Shares | | Amount | |
Shares sold | | | 112,445 | | | $ | 1,771,582 | | | | — | | | $ | — | | | | 2,139 | | | $ | 30,754 | | |
Shares repurchased | | | (366,734 | ) | | | (5,780,752 | ) | | | — | | | | — | | | | (42,985 | ) | | | (617,193 | ) | |
Shares converted from
Class B to Class A | | | 135 | | | | 2,265 | | | | (150 | ) | | | (2,265 | ) | | | — | | | | — | | |
Net decrease | | | (254,154 | ) | | $ | (4,006,905 | ) | | | (150 | ) | | $ | (2,265 | ) | | | (40,846 | ) | | $ | (586,439 | ) | |
| | | Class Y | | Class P | |
| | | Shares | | Amount | | Shares | | Amount | |
Shares sold | | | 9,091 | | | $ | 153,021 | | | | 2,858,900 | | | $ | 46,519,791 | | |
Shares repurchased | | | (4,370 | ) | | | (70,589 | ) | | | (4,223,095 | ) | | | (68,940,740 | ) | |
Dividends reinvested | | | 13 | | | | 205 | | | | 4,583 | | | | 68,945 | | |
Net increase (decrease) | | | 4,734 | | | $ | 82,637 | | | | (1,359,612 | ) | | $ | (22,352,004 | ) | |
PACE Small/Medium Co Growth Equity Investments
For the year ended July 31, 2013:
| | | Class A | | Class C | |
| | | Shares | | Amount | | Shares | | Amount | |
Shares sold | | | 157,216 | | | $ | 2,904,369 | | | | 11,126 | | | $ | 189,302 | | |
Shares repurchased | | | (468,233 | ) | | | (8,663,338 | ) | | | (41,648 | ) | | | (654,594 | ) | |
Dividends reinvested | | | 33,516 | | | | 583,850 | | | | 3,618 | | | | 56,228 | | |
Net decrease | | | (277,501 | ) | | $ | (5,175,119 | ) | | | (26,904 | ) | | $ | (409,064 | ) | |
| | | Class Y | | Class P | |
| | | Shares | | Amount | | Shares | | Amount | |
Shares sold | | | 18,856 | | | $ | 376,504 | | | | 3,277,242 | | | $ | 63,040,511 | | |
Shares repurchased | | | (5,849 | ) | | | (115,230 | ) | | | (5,566,751 | ) | | | (108,796,590 | ) | |
Dividends reinvested | | | 245 | | | | 4,434 | | | | 350,935 | | | | 6,309,806 | | |
Net increase (decrease) | | | 13,252 | | | $ | 265,708 | | | | (1,938,574 | ) | | $ | (39,446,273 | ) | |
For the year ended July 31, 2012:
| | | Class A | | Class B1 | | Class C | |
| | | Shares | | Amount | | Shares | | Amount | | Shares | | Amount | |
Shares sold | | | 113,934 | | | $ | 1,790,609 | | | | — | | | $ | — | | | | 5,841 | | | $ | 80,254 | | |
Shares repurchased | | | (350,179 | ) | | | (5,505,977 | ) | | | (185 | ) | | | (2,842 | ) | | | (43,005 | ) | | | (623,399 | ) | |
Shares converted from
Class B to Class A | | | 555 | | | | 8,850 | | | | (621 | ) | | | (8,850 | ) | | | — | | | | — | | |
Net decrease | | | (235,690 | ) | | $ | (3,706,518 | ) | | | (806 | ) | | $ | (11,692 | ) | | | (37,164 | ) | | $ | (543,145 | ) | |
| | | Class Y | | Class P | |
| | | Shares | | Amount | | Shares | | Amount | |
Shares sold | | | 8,813 | | | $ | 148,845 | | | | 2,762,834 | | | $ | 44,999,817 | | |
Shares repurchased | | | (1,403 | ) | | | (22,603 | ) | | | (4,860,046 | ) | | | (79,230,672 | ) | |
Net increase (decrease) | | | 7,410 | | | $ | 126,242 | | | | (2,097,212 | ) | | $ | (34,230,855 | ) | |
308
PACE Select Advisors Trust
Notes to financial statements
PACE International Equity Investments
For the year ended July 31, 2013:
| | | Class A | | Class C | |
| | | Shares | | Amount | | Shares | | Amount | |
Shares sold | | | 181,900 | | | $ | 2,416,147 | | | | 2,755 | | | $ | 33,990 | | |
Shares repurchased | | | (693,920 | ) | | | (9,056,688 | ) | | | (30,249 | ) | | | (379,121 | ) | |
Dividends reinvested | | | 82,561 | | | | 1,047,748 | | | | 2,683 | | | | 33,563 | | |
Net decrease | | | (429,459 | ) | | $ | (5,592,793 | ) | | | (24,811 | ) | | $ | (311,568 | ) | |
| | | Class Y | | Class P | |
| | | Shares | | Amount | | Shares | | Amount | |
Shares sold | | | 254,069 | | | $ | 3,355,213 | | | | 12,662,088 | | | $ | 167,105,810 | | |
Shares repurchased | | | (341,845 | ) | | | (4,454,025 | ) | | | (12,209,023 | ) | | | (160,831,716 | ) | |
Dividends reinvested | | | 35,303 | | | | 446,962 | | | | 1,385,385 | | | | 17,511,963 | | |
Net increase (decrease) | | | (52,473 | ) | | $ | (651,850 | ) | | | 1,838,450 | | | $ | 23,786,057 | | |
For the year ended July 31, 2012:
| | | Class A | | Class B1 | | Class C | |
| | | Shares | | Amount | | Shares | | Amount | | Shares | | Amount | |
Shares sold | | | 265,875 | | | $ | 3,054,930 | | | | — | | | $ | — | | | | 120 | | | $ | 1,303 | | |
Shares repurchased | | | (978,098 | ) | | | (11,303,342 | ) | | | — | | | | — | | | | (53,753 | ) | | | (613,810 | ) | |
Shares converted from
Class B to Class A | | | 65 | | | | 807 | | | | (63 | ) | | | (807 | ) | | | — | | | | — | | |
Dividends reinvested | | | 133,405 | | | | 1,430,100 | | | | — | | | | — | | | | 5,005 | | | | 52,900 | | |
Net decrease | | | (578,753 | ) | | $ | (6,817,505 | ) | | | (63 | ) | | $ | (807 | ) | | | (48,628 | ) | | $ | (559,607 | ) | |
| | | Class Y | | Class P | |
| | | Shares | | Amount | | Shares | | Amount | |
Shares sold | | | 124,952 | | | $ | 1,461,528 | | | | 9,879,509 | | | $ | 114,863,620 | | |
Shares repurchased | | | (197,012 | ) | | | (2,321,955 | ) | | | (12,670,518 | ) | | | (146,978,081 | ) | |
Dividends reinvested | | | 51,584 | | | | 551,438 | | | | 1,943,009 | | | | 20,731,907 | | |
Net decrease | | | (20,476 | ) | | $ | (308,989 | ) | | | (848,000 | ) | | $ | (11,382,554 | ) | |
PACE International Emerging Markets Equity Investments
For the year ended July 31, 2013:
| | | Class A | | Class C | |
| | | Shares | | Amount | | Shares | | Amount | |
Shares sold | | | 172,306 | | | $ | 2,281,095 | | | | 10,554 | | | $ | 127,024 | | |
Shares repurchased | | | (300,660 | ) | | | (3,875,486 | ) | | | (35,899 | ) | | | (427,383 | ) | |
Dividends reinvested | | | 9,393 | | | | 124,180 | | | | — | | | | — | | |
Net decrease | | | (118,961 | ) | | $ | (1,470,211 | ) | | | (25,345 | ) | | $ | (300,359 | ) | |
| | | Class Y | | Class P | |
| | | Shares | | Amount | | Shares | | Amount | |
Shares sold | | | 100,939 | | | $ | 1,350,865 | | | | 12,031,720 | | | $ | 163,591,330 | | |
Shares repurchased | | | (236,258 | ) | | | (3,121,985 | ) | | | (3,548,434 | ) | | | (46,439,982 | ) | |
Dividends reinvested | | | 10,286 | | | | 138,345 | | | | 128,227 | | | | 1,718,238 | | |
Net increase (decrease) | | | (125,033 | ) | | $ | (1,632,775 | ) | | | 8,611,513 | | | $ | 118,869,586 | | |
309
PACE Select Advisors Trust
Notes to financial statements
For the year ended July 31, 2012:
| | | Class A | | Class B1 | | Class C | |
| | | Shares | | Amount | | Shares | | Amount | | Shares | | Amount | |
Shares sold | | | 190,677 | | | $ | 2,302,673 | | | | — | | | $ | — | | | | 4,845 | | | $ | 54,015 | | |
Shares repurchased | | | (380,161 | ) | | | (4,576,967 | ) | | | (285 | ) | | | (3,250 | ) | | | (52,592 | ) | | | (596,330 | ) | |
Shares converted from
Class B to Class A | | | 3,283 | | | | 42,767 | | | | (3,481 | ) | | | (42,767 | ) | | | — | | | | — | | |
Dividends reinvested | | | 31,760 | | | | 345,230 | | | | 18 | | | | 186 | | | | 2,787 | | | | 28,426 | | |
Net decrease | | | (154,441 | ) | | $ | (1,886,297 | ) | | | (3,748 | ) | | $ | (45,831 | ) | | | (44,960 | ) | | $ | (513,889 | ) | |
| | | Class Y | | Class P | |
| | | Shares | | Amount | | Shares | | Amount | |
Shares sold | | | 82,814 | | | $ | 1,031,581 | | | | 3,020,724 | | | $ | 36,893,732 | | |
Shares repurchased | | | (228,576 | ) | | | (2,799,033 | ) | | | (4,133,118 | ) | | | (50,310,338 | ) | |
Dividends reinvested | | | 28,789 | | | | 318,402 | | | | 399,190 | | | | 4,399,076 | | |
Net decrease | | | (116,973 | ) | | $ | (1,449,050 | ) | | | (713,204 | ) | | $ | (9,017,530 | ) | |
PACE Global Real Estate Securities Investments
For the year ended July 31, 2013:
| | | Class A | | Class C | |
| | | Shares | | Amount | | Shares | | Amount | |
Shares sold | | | 151,236 | | | $ | 1,017,300 | | | | 8,230 | | | $ | 50,989 | | |
Shares repurchased | | | (179,874 | ) | | | (1,181,148 | ) | | | (3,635 | ) | | | (23,072 | ) | |
Dividends reinvested | | | 31,185 | | | | 194,597 | | | | 1,057 | | | | 6,586 | | |
Net increase | | | 2,547 | | | $ | 30,749 | | | | 5,652 | | | $ | 34,503 | | |
| | | Class Y | | Class P | |
| | | Shares | | Amount | | Shares | | Amount | |
Shares sold | | | 13,561 | | | $ | 86,525 | | | | 5,689,380 | | | $ | 37,876,951 | | |
Shares repurchased | | | (5,222 | ) | | | (35,371 | ) | | | (6,456,188 | ) | | | (43,823,375 | ) | |
Dividends reinvested | | | 1,854 | | | | 11,611 | | | | 767,381 | | | | 4,788,456 | | |
Net increase (decrease) | | | 10,193 | | | $ | 62,765 | | | | 573 | | | $ | (1,157,968 | ) | |
For the year ended July 31, 2012:
| | | Class A | | Class C | |
| | | Shares | | Amount | | Shares | | Amount | |
Shares sold | | | 179,031 | | | $ | 990,604 | | | | 197 | | | $ | 1,000 | | |
Shares repurchased | | | (156,603 | ) | | | (845,069 | ) | | | (8,938 | ) | | | (46,853 | ) | |
Dividends reinvested | | | 19,120 | | | | 94,455 | | | | 731 | | | | 3,595 | | |
Net increase (decrease) | | | 41,548 | | | $ | 239,990 | | | | (8,010 | ) | | $ | (42,258 | ) | |
| | | Class Y | | Class P | |
| | | Shares | | Amount | | Shares | | Amount | |
Shares sold | | | 8,072 | | | $ | 43,137 | | | | 4,082,579 | | | $ | 22,566,270 | | |
Shares repurchased | | | (6,675 | ) | | | (36,471 | ) | | | (3,477,922 | ) | | | (19,181,516 | ) | |
Dividends reinvested | | | 1,035 | | | | 5,123 | | | | 479,928 | | | | 2,370,844 | | |
Net increase | | | 2,432 | | | $ | 11,789 | | | | 1,084,585 | | | $ | 5,755,598 | | |
310
PACE Select Advisors Trust
Notes to financial statements
PACE Alternative Strategies Investments
For the year ended July 31, 2013:
| | | Class A | | Class C | |
| | | Shares | | Amount | | Shares | | Amount | |
Shares sold | | | 2,070,414 | | | $ | 20,789,043 | | | | 59,740 | | | $ | 575,821 | | |
Shares repurchased | | | (1,491,744 | ) | | | (14,705,573 | ) | | | (120,702 | ) | | | (1,161,430 | ) | |
Dividends reinvested | | | 17,054 | | | | 164,739 | | | | — | | | | — | | |
Net increase (decrease) | | | 595,724 | | | $ | 6,248,209 | | | | (60,962 | ) | | $ | (585,609 | ) | |
| | | Class Y | | Class P | |
| | | Shares | | Amount | | Shares | | Amount | |
Shares sold | | | 168,552 | | | $ | 1,695,712 | | | | 11,681,050 | | | $ | 117,031,456 | | |
Shares repurchased | | | (81,354 | ) | | | (810,749 | ) | | | (11,771,143 | ) | | | (118,505,275 | ) | |
Dividends reinvested | | | 1,292 | | | | 12,562 | | | | 332,825 | | | | 3,228,403 | | |
Net increase | | | 88,490 | | | $ | 897,525 | | | | 242,732 | | | $ | 1,754,584 | | |
For the year ended July 31, 2012:
| | | Class A | | Class C | |
| | | Shares | | Amount | | Shares | | Amount | |
Shares sold | | | 844,797 | | | $ | 7,762,278 | | | | 31,307 | | | $ | 280,135 | | |
Shares repurchased | | | (3,017,091 | ) | | | (27,616,717 | ) | | | (192,537 | ) | | | (1,723,222 | ) | |
Net decrease | | | (2,172,294 | ) | | $ | (19,854,439 | ) | | | (161,230 | ) | | $ | (1,443,087 | ) | |
| | | Class Y | | Class P | |
| | | Shares | | Amount | | Shares | | Amount | |
Shares sold | | | 61,586 | | | $ | 576,016 | | | | 8,938,057 | | | $ | 82,818,498 | | |
Shares repurchased | | | (51,519 | ) | | | (475,444 | ) | | | (12,052,756 | ) | | | (111,370,157 | ) | |
Net increase (decrease) | | | 10,067 | | | $ | 100,572 | | | | (3,114,699 | ) | | $ | (28,551,659 | ) | |
1 Effective March 1, 2012, all outstanding Class B shares converted to Class A shares of the same Portfolio.
Redemption fees
Each class of each series of the Trust, with the exception of PACE Money Market Investments, will impose a 1% redemption fee on shares sold or exchanged within 90 days of their purchase date, subject to limited exemptions as noted in the prospectuses. This amount is paid to the applicable Portfolio. The redemption fees earned by the Portfolios are disclosed in the Statement of changes in net assets. For the year ended July 31, 2013, redemption fees represent less than $0.005 per share.
Federal tax status
Each of the Portfolios intends to distribute substantially all of its income and to comply with the other requirements of the Internal Revenue Code applicable to regulated investment companies. Accordingly, no provision for federal income taxes is required. In addition, by distributing during each calendar year substantially all of its net investment income, net realized capital gains and certain other amounts, if any, each Portfolio intends not to be subject to a federal excise tax.
311
PACE Select Advisors Trust
Notes to financial statements
The tax character of distributions paid during the fiscal years ended July 31, 2013 and July 31, 2012 were as follows:
| | | 2013 | | 2012 | |
Portfolio | | Tax-exempt
income | | Ordinary
Income | | Long-term
realized
capital gains | | Return
of
capital | | Tax-exempt
income | | Ordinary
Income | | Long-term
realized
capital gains | |
PACE Money Market Investments | | $ | — | | | $ | 32,607 | | | $ | — | | | $ | — | | | $ | — | | | $ | 41,391 | | | $ | — | | |
PACE Government Securities Fixed Income
Investments | | | — | | | | 25,224,699 | | | | 1,369,490 | | | | — | | | | — | | | | 19,051,510 | | | | 852,811 | | |
PACE Intermediate Fixed Income Investments | | | — | | | | 5,342,621 | | | | — | | | | — | | | | — | | | | 9,323,608 | | | | — | | |
PACE Strategic Fixed Income Investments | | | — | | | | 47,208,681 | | | | 1,011,141 | | | | — | | | | — | | | | 37,273,980 | | | | 9,910,023 | | |
PACE Municipal Fixed Income Investments | | | 8,685,325 | | | | 9,701 | | | | 1,415,338 | | | | — | | | | 9,257,071 | | | | 798 | | | | — | | |
PACE International Fixed Income Investments | | | — | | | | 7,683,836 | | | | — | | | | 7,941,160 | | | | — | | | | 37,472,241 | | | | — | | |
PACE High Yield Investments | | | — | | | | 21,801,123 | | | | 3,454,959 | | | | 431,608 | | | | — | | | | 20,081,213 | | | | 2,458,207 | | |
PACE Large Co Value Equity Investments | | | — | | | | 17,942,761 | | | | — | | | | — | | | | — | | | | 17,145,925 | | | | — | | |
PACE Large Co Growth Equity Investments | | | — | | | | 5,822,180 | | | | — | | | | — | | | | — | | | | 2,437,415 | | | | — | | |
PACE Small/Medium Co Value Equity
Investments | | | — | | | | 2,773,046 | | | | — | | | | — | | | | — | | | | 71,752 | | | | — | | |
PACE Small/Medium Co Growth Equity
Investments | | | — | | | | 3,700,117 | | | | 3,529,940 | | | | — | | | | — | | | | — | | | | — | | |
PACE International Equity Investments | | | — | | | | 19,930,984 | | | | — | | | | — | | | | — | | | | 23,811,826 | | | | — | | |
PACE International Emerging Markets Equity
Investments | | | — | | | | 2,060,116 | | | | — | | | | — | | | | — | | | | 2,537,195 | | | | 2,730,463 | | |
PACE Global Real Estate Securities Investments | | | — | | | | 5,215,238 | | | | — | | | | — | | | | — | | | | 2,567,822 | | | | — | | |
PACE Alternative Strategies Investments | | | — | | | | 3,532,294 | | | | — | | | | — | | | | — | | | | — | | | | — | | |
At July 31, 2013, the components of accumulated earnings (deficit) on a tax basis were as follows:
| Portfolio | | Undistributed
ordinary
income | | Undistributed
long-term
capital gains | | Accumulated
realized
capital and
other losses | | Unrealized
appreciation
(depreciation) | | Total | |
PACE Money Market Investments | | $ | — | | | $ | — | | | $ | (63 | ) | | $ | — | | | $ | (63 | ) | |
PACE Government Securities Fixed Income
Investments | | | 275,476 | | | | — | | | | (20,811,790 | ) | | | (2,936,855 | ) | | | (23,473,169 | ) | |
PACE Intermediate Fixed Income Investments | | | 748,065 | | | | — | | | | (1,235,968 | ) | | | (849,355 | ) | | | (1,337,258 | ) | |
PACE Strategic Fixed Income Investments | | | 7,683,390 | | | | 23,185,807 | | | | — | | | | (20,289,309 | ) | | | 10,579,888 | | |
PACE Municipal Fixed Income Investments | | | — | | | | 2,219,606 | | | | — | | | | 6,809,204 | | | | 9,028,810 | | |
PACE International Fixed Income Investments | | | — | | | | — | | | | (33,498,197 | ) | | | (5,246,588 | ) | | | (38,744,785 | ) | |
PACE High Yield Investments | | | — | | | | — | | | | (81,029 | ) | | | 15,474,740 | | | | 15,393,711 | | |
PACE Large Co Value Equity Investments | | | 8,400,806 | | | | — | | | | (41,391,491 | ) | | | 210,566,371 | | | | 177,575,686 | | |
PACE Large Co Growth Equity Investments | | | 4,082,836 | | | | 76,832,342 | | | | — | | | | 252,687,246 | | | | 333,602,424 | | |
PACE Small/Medium Co Value Equity Investments | | | 1,786,595 | | | | 38,133,309 | | | | — | | | | 76,173,235 | | | | 116,093,139 | | |
PACE Small/Medium Co Growth Equity Investments | | | 9,639,953 | | | | 36,056,073 | | | | — | | | | 136,519,990 | | | | 182,216,016 | | |
PACE International Equity Investments | | | 14,407,131 | | | | — | | | | (266,075,318 | ) | | | 87,879,964 | | | | (163,788,223 | ) | |
PACE International Emerging Markets Equity
Investments | | | 2,141,275 | | | | — | | | | (24,195,880 | ) | | | (5,541,292 | ) | | | (27,595,897 | ) | |
PACE Global Real Estate Securities Investments | | | 1,212,489 | | | | — | | | | (27,685,761 | ) | | | 8,178,950 | | | | (18,294,322 | ) | |
PACE Alternative Strategies Investments | | | 10,322,846 | | | | — | | | | (82,946,173 | ) | | | 12,591,064 | | | | (60,032,263 | ) | |
312
PACE Select Advisors Trust
Notes to financial statements
On December 22, 2010, the Regulated Investment Company Modernization Act of 2010 (the "Act") was enacted, which changed various technical rules governing the tax treatment of regulated investment companies. The changes are generally effective for taxable years beginning after the date of enactment. One of the more prominent changes addresses capital loss carryforwards. Under the Act, each Portfolio will be permitted to carry forward capital losses incurred in taxable years beginning after the date of enactment for an unlimited period. However, any losses incurred during those future taxable years will be required to be utilized prior to the losses incurred in pre-enactment taxable years, which carry an expiration date. As a result of this ordering rule, pre-enactment capital loss carryforwards may be more likely to expire unused. Additionally, post-enactment capital loss carryforwards will retain their character as either short-term or long-term capital losses rather than being considered all short-term as permitted under previous regulation. Post enactment losses incurred that will be carried forward indefinitely are as follows:
Portfolio | | Short-term | | Long-term | | Total | |
PACE Money Market Investments | | $ | 98 | | | $ | — | | | $ | 98 | | |
PACE Government Securities Fixed Income Investments | | | 162,420 | | | | 405,010 | | | | 567,430 | | |
PACE International Fixed Income Investments | | | 2,780,698 | | | | — | | | | 2,780,698 | | |
PACE International Equity Investments | | | 8,322,731 | | | | 480,537 | | | | 8,803,268 | | |
PACE International Emerging Markets Equity Investments | | | 5,295,208 | | | | 14,621,693 | | | | 19,916,901 | | |
At July 31, 2013, the following Portfolios had pre-enactment capital loss carryforwards for federal income tax purposes available to offset future capital gains through the indicated expiration dates.
| Portfolio | | July 31,
2014 | | July 31,
2015 | | July 31,
2016 | | July 31,
2017 | | July 31,
2018 | | July 31,
2019 | | July 31,
2020 | | Total | |
PACE Money Market Investments | | $ | — | | | $ | — | | | $ | — | | | $ | — | | | $ | 94 | | | $ | 23 | | | $ | — | | | $ | 117 | | |
PACE International Fixed Income
Investments | | | — | | | | 1,422,528 | | | | 2,354,563 | | | | 765,140 | | | | 7,784,695 | | | | — | | | | — | | | | 12,326,926 | | |
PACE Large Co Value Equity Investments | | | — | | | | — | | | | — | | | | — | | | | 41,391,491 | | | | — | | | | — | | | | 41,391,491 | | |
PACE International Equity Investments | | | — | | | | — | | | | — | | | | 42,420,347 | | | | 214,851,703 | | | | — | | | | — | | | | 257,272,050 | | |
PACE Global Real Estate Securities
Investments | | | — | | | | — | | | | — | | | | 856,814 | | | | 26,828,947 | | | | — | | | | — | | | | 27,685,761 | | |
PACE Alternative Strategies Investments | | | — | | | | — | | | | — | | | | — | | | | 82,944,930 | | | | — | | | | — | | | | 82,944,930 | | |
During the fiscal year, the following Portfolios utilized capital loss carryforwards to offset current year realized gains:
| Portfolio | | Capital loss
carryforwards
utilized | |
PACE Money Market Investments | | $ | 42 | | |
PACE Intermediate Fixed Income Investments | | | 2,781,410 | | |
PACE International Fixed Income Investments | | | 862,021 | | |
PACE Large Co Value Equity Investments | | | 155,023,614 | | |
PACE Large Co Growth Equity Investments | | | 65,398,756 | | |
PACE Small/Medium Co Value Equity Investments | | | 25,977,028 | | |
PACE International Equity Investments | | | 8,922,890 | | |
PACE Global Real Estate Securities Investments | | | 13,909,136 | | |
PACE Alternative Strategies Investments | | | 18,558,581 | | |
313
PACE Select Advisors Trust
Notes to financial statements
Qualified late year losses are deemed to arise on the first business day of a Portfolio's next taxable year. For the year ended July 31, 2013, the following Portfolios incurred, and elected to defer, losses of the following:
| | Late year
ordinary | | Post-October capital losses | |
| | losses | | Short-term | | Long-term | |
PACE Government Securities Fixed Income Investments | | $ | — | | | $ | 15,184,199 | | | $ | 5,060,161 | | |
PACE Intermediate Fixed Income Investments | | | — | | | | 1,235,968 | | | | — | | |
PACE International Fixed Income Investments | | | 11,316,516 | | | | — | | | | — | | |
PACE High Yield Investments | | | — | | | | — | | | | 81,029 | | |
PACE International Emerging Markets Equity Investments | | | — | | | | 4,278,979 | | | | — | | |
At July 31, 2013, the effect of permanent "book/tax" reclassifications resulted in increases and decreases to components of the Portfolios' net assets as follows:
| Portfolio | | Accumulated
undistributed
(distributions
in excess of)
net investment
income | | Accumulated
net realized
gain/loss | | Beneficial
interest | |
PACE Government Securities Fixed Income Investments | | $ | 9,113,923 | | | $ | (9,113,923 | ) | | $ | — | | |
PACE Intermediate Fixed Income Investments | | | 152,882 | | | | (152,882 | ) | | | — | | |
PACE Strategic Fixed Income Investments | | | 4,056,032 | | | | (4,056,032 | ) | | | — | | |
PACE Municipal Fixed Income Investments | | | 575 | | | | — | | | | (575 | ) | |
PACE International Fixed Income Investments | | | (15,207,820 | ) | | | 15,273,415 | | | | (65,595 | ) | |
PACE High Yield Investments | | | (380,527 | ) | | | 380,527 | | | | — | | |
PACE Large Co Value Equity Investments | | | (6,445 | ) | | | 6,445 | | | | — | | |
PACE Large Co Growth Equity Investments | | | (799 | ) | | | 799 | | | | — | | |
PACE Small/Medium Co Value Equity Investments | | | (72,580 | ) | | | 72,580 | | | | — | | |
PACE Small/Medium Co Growth Equity Investments | | | 2,738,798 | | | | (2,738,798 | ) | | | — | | |
PACE International Equity Investments | | | 2,117,014 | | | | (2,117,014 | ) | | | — | | |
PACE International Emerging Markets Equity Investments | | | (144,535 | ) | | | 144,535 | | | | — | | |
PACE Global Real Estate Securities Investments | | | 3,282,540 | | | | (3,282,540 | ) | | | — | | |
PACE Alternative Strategies Investments | | | 7,285,059 | | | | (3,828,008 | ) | | | (3,457,051 | ) | |
These differences are primarily due to tax treatment of foreign currency and futures transactions, net operating losses, paydown gains and losses, distributions in excess of net investment income, disposition of PFIC investments, swap adjustments, REIT adjustments, tax character of distributions and adjustments for certain debt obligations.
As of and during the year ended July 31, 2013, no Portfolio other than PACE International Emerging Markets Equity Investments had any liabilities for any uncertain tax positions. PACE International Emerging Markets Equity Investments had an accrued liability for uncertain tax positions of $167,038 at July 31, 2013 which is included in the Payable for foreign withholding and foreign capital gains taxes in the Statement of assets and liabilities. The Portfolios recognize interest and penalties, if any, related to uncertain tax positions as income tax expense in the Statements of operations. During the year ended July 31, 2013, the Portfolios did not incur any interest or penalties.
Each of the tax years in the four year period ended July 31, 2013, remains subject to examination by the Internal Revenue Service and state taxing authorities.
314
PACE Select Advisors Trust
Report of Ernst & Young LLP, independent registered public accounting firm
The Board of Trustees and Shareholders of
PACE Select Advisors Trust
We have audited the accompanying statements of assets and liabilities, including the portfolios of investments, of PACE Select Advisors Trust (comprising, respectively, PACE Money Market Investments, PACE Government Securities Fixed Income Investments, PACE Intermediate Fixed Income Investments, PACE Strategic Fixed Income Investments, PACE Municipal Fixed Income Investments, PACE International Fixed Income Investments, PACE High Yield Investments, PACE Large Co Value Equity Investments, PACE Large Co Growth Equity Investments, PACE Small/Medium Co Value Equity Investments, PACE Small/Medium Co Growth Equity Investments, PACE International Equity Investments, PACE International Emerging Markets Equity Investments, PACE Global Real Estate Securities Investments and PACE Alternative Strategies Investments, collectively the "Trust") as of July 31, 2013, and the related statements of operations for the year then ended, the statements of changes in net assets for each of the two years in the period then ended, and the financial highlights for each of the periods indicated therein. These financial statements and financial highlights are the responsibility of the Trust's management. Our responsibility is to express an opinion on these financial statements and financial highlights based on our audits.
We conducted our audits in accordance with the standards of the Public Company Accounting Oversight Board (United States). Those standards require that we plan and perform the audit to obtain reasonable assurance about whether the financial statements and financial highlights are free of material misstatement. We were not engaged to perform an audit of the Trust's internal control over financial reporting. Our audits included consideration of internal control over financial reporting as a basis for designing audit procedures that are appropriate in the circumstances, but not for the purpose of expressing an opinion on the effectiveness of the Trust's internal control over financial reporting. Accordingly, we express no such opinion. An audit also includes examining, on a test basis, evidence supporting the amounts and disclosures in the financial statements and financial highlights, assessing the accounting principles used and significant estimates made by management, and evaluating the overall financial statement presentation. Our procedures included confirmation of securities owned as of July 31, 2013, by correspondence with the custodian and others, or by other appropriate auditing procedures where replies from others were not received. We believe that our audits provide a reasonable basis for our opinion.
In our opinion, the financial statements and financial highlights referred to above present fairly, in all material respects, the financial position of each of the respective series constituting PACE Select Advisors Trust at July 31, 2013, the results of their operations for the year then ended, the changes in their net assets for each of the two years in the period then ended, and the financial highlights for each of the indicated periods, in conformity with US generally accepted accounting principles.

New York, New York
September 27, 2013
315
PACE Select Advisors Trust
Tax information (unaudited)
We are required by Subchapter M of the Internal Revenue Code of 1986, as amended, to advise you within 60 days of each Portfolio's fiscal year end (July 31, 2013) as to the federal tax status of distributions received by shareholders during such fiscal year. Accordingly, the percentage of dividends paid that qualify for the dividends received deduction for corporate shareholders and the amount of foreign tax credit to be passed through to shareholders are as follows:
| Portfolio | | Dividend
Received
Deduction | | Foreign
Tax
Credit | |
PACE Large Co Value Equity Investments | | | 100 | % | | | — | | |
PACE Large Co Growth Equity Investments | | | 100 | | | | — | | |
PACE Small/Medium Co Value Equity Investments | | | 100 | | | | — | | |
PACE Small/Medium Co Growth Equity Investments | | | 70.54 | | | | |
PACE International Equity Investments | | | — | | | $ | 651,420 | | |
PACE International Emerging Markets Equity Investments | | | — | | | | 1,167,498 | | |
PACE Global Real Estate Securities Investments | | | 0.53 | | | | — | | |
PACE Alternative Strategies Investments | | | 45.16 | | | | — | | |
Also, for the fiscal year ended July 31, 2013, the foreign source income for information reporting purposes for PACE International Equity Investments and PACE International Emerging Markets Equity Investments is $10,887,367 and $7,405,805, respectively.
For the period ended July 31, 2013, certain dividends paid by the Portfolios below may be subject to a maximum tax rate of 15%, as provided for by the Jobs and Growth Tax Relief Reconciliation Act of 2003. Of the distributions paid during the period, the amounts below represent the maximum amount that may be considered qualified dividend income.
| Portfolio | | Maximum amount
considered qualified
dividend income | |
PACE Large Co Value Equity Investments | | $ | 17,942,761 | | |
PACE Large Co Growth Equity Investments | | | 5,822,180 | | |
PACE Small/Medium Co Value Equity Investments | | | 2,773,046 | | |
PACE Small/Medium Co Growth Equity Investments | | | 3,700,117 | | |
PACE International Equity Investments | | | 19,930,984 | | |
PACE International Emerging Markets Equity Investments | | | 2,060,116 | | |
PACE Global Real Estate Securities Investments | | | 5,215,238 | | |
PACE Alternative Strategies Investments | | | 3,532,294 | | |
Dividends received by tax-exempt recipients (e.g., IRAs and Keoghs) need not be reported as taxable income. Some retirement trusts (e.g., corporate, Keogh and 403(b)(7) plans) may need this information for their annual information reporting.
Shareholders should not use the above information to prepare their tax returns. Since each Portfolio's fiscal year is not the calendar year, another notification will be sent with respect to calendar year 2013. Such notification, which will reflect the amount to be used by calendar year taxpayers on their federal income tax returns, will be made in conjunction with Form 1099 DIV and will be mailed in February 2014. Shareholders are advised to consult their own tax advisers with respect to the tax consequences of their investment in each of the Portfolios.
316
PACE Select Advisors Trust
General information (unaudited)
Monthly and quarterly portfolio holdings disclosure
Each Portfolio will file its complete schedule of portfolio holdings with the Securities and Exchange Commission ("SEC") for the first and third quarters of each fiscal year on Form N-Q. The Portfolios' Forms N-Q are available on the SEC's Web site at http://www.sec.gov. The Portfolios' Forms N-Q may be reviewed and copied at the SEC's Public Reference Room in Washington, D.C. Information on the operation of the SEC's Public Reference Room may be obtained by calling 1-800-SEC 0330. Additionally, you may obtain copies of Forms N-Q from the Portfolios upon request by calling 1-800-647 1568.
In addition, PACE Money Market Investments discloses, on a monthly basis: (a) a complete schedule of its portfolio holdings; and (b) information regarding its weighted average maturity and weighted average life on UBS's Web site at the following internet address: www.ubs.com/usmoneymarketfundsholdings. In addition, at this location, you will find a link to more detailed Portfolio information appearing in filings with the SEC on Form N-MFP.
Proxy voting policies, procedures and record
You may obtain a description of each Portfolio's (1) proxy voting policies, (2) proxy voting procedures and (3) information regarding how a Portfolio voted any proxies related to portfolio securities during the most recent 12-month period ended June 30 for which an SEC filing has been made, without charge, upon request by contacting a Portfolio directly at 1-800-647 1568, online on a Portfolio's Web site: www.ubs.com/ubsglobalam-proxy, or on the EDGAR Database on the SEC's Web site (http://www.sec.gov).
317
PACE Select Advisors Trust
Board approvals of investment management and administration agreement and sub-advisory agreements (unaudited)
May 2013 Board Meeting
Robeco Investment Management, Inc.
Background—At a meeting of the board of PACE Select Advisors Trust (the "Trust") on May 21-22, 2013, the members of the board, including the trustees who are not "interested persons" of the Trust (the "Independent Trustees") as defined in the Investment Company Act of 1940, as amended, considered and approved the proposed sub-advisory agreement between UBS Global Asset Management (Americas) Inc. ("UBS Global AM") and Robeco Investment Management, Inc. ("Robeco") (the "Robeco Sub-Advisory Agreement") with respect to PACE Large Co Value Equity Investments (the "Portfolio"). Management discussed with the board its proposal to terminate Westwood Management Corp. ("Westwood") as a sub-advisor to the Portfolio and to reallocate the portion of assets managed by Westwood to Robeco. It was noted that on February 19, 2013, Rabobank Group, which wholly owned Robeco's parent company (Robeco Groep, N.V.), signed an agreement with ORIX Corporation ("ORIX") in which ORIX would acquire approximately 90.01% of the equity in Robeco Groep, N.V. from Rabobank. The transaction (the "Change of Control") was expected to be complete within six months. Management noted that it did not expect the investment team, philosophy or process to change under the new ORIX parent company. In considering the approval of the Robeco Sub-Advisory Agreement, the board was able to draw on its knowledge of the Trust, its portfolios and UBS Global AM. The board recognized its familiarity with UBS Global AM and the investment management and sub-advisory agreements for this and the other portfolios of the Trust, including the extensive materials the board had previously reviewed in connection with the annual reconsideration of the contracts for the portfolios. The board also received a memorandum from UBS Global AM discussing UBS Global AM's reasons for recommending Robeco as a sub-advisor to the Portfolio.
In its consideration of the approval of the Robeco Sub-Advisory Agreement, the board considered the following factors:
Nature, extent and quality of the services under the Robeco Sub-Advisory Agreement—The board's evaluation of the services to be provided by Robeco to the Portfolio took into account the board's knowledge and familiarity gained as board members of funds in the UBS New York fund complex, including the Trust and its portfolios. The board considered management's reasons for recommending Robeco as an additional sub-advisor to the Portfolio, including its belief that Robeco's quality value style with its capital preservation approach, focus on companies with strong fundamentals and preference for stocks with positive business momentum, while similar to Westwood, had the potential to deliver more competitive risk-adjusted returns than Westwood. The board also received materials from Robeco detailing its investment philosophy and met with representatives of Robeco, who discussed with the board that investment philosophy and process and the backgrounds and qualifications of the portfolio management team, as well as the continuity of personnel expected to exist after the Change of Control. The board concluded that, overall, it was satisfied with the nature, extent and quality of services expected to be provided to the Portfolio under the proposed Robeco Sub-Advisory Agreement.
Sub-Advisory fee—The board reviewed and considered the proposed contractual sub-advisory fee to be payable by UBS Global AM to Robeco in light of the nature, extent and quality of the sub-advisory services anticipated to be provided by Robeco. The board noted that the proposed contractual sub-advisory fee, with its breakpoints, was more favorable than the sub-advisory fee currently charged by Westwood and would result in a lower overall blended sub-advisory fee for the Portfolio. The board determined that the proposed sub-advisory fee was reasonable in light of the nature, extent and quality of the services proposed to be provided to the Portfolio under the Robeco Sub-Advisory Agreement.
Fund performance—The board received and considered composite performance information provided by Robeco. The board also noted that, as Robeco would be a new sub-advisor to the Portfolio, the current
318
PACE Select Advisors Trust
Board approvals of investment management and administration agreement and sub-advisory agreements (unaudited)
performance of the Portfolio was not a significant factor in the consideration of the approval of the Robeco Sub-Advisory Agreement.
Advisor profitability—Profitability of Robeco or its affiliates or UBS Global AM or its affiliates in providing services to the Portfolio was not a significant factor considered by the board, as the sub-advisory fee would be paid by UBS Global AM out of the management fee paid to it by the Portfolio, and not by the Portfolio. As noted above, the board observed that the fees paid by UBS Global AM to Robeco would be lower than the costs currently incurred by the manager. The board indicated that it would consider this difference, among other matters, further when it engaged in its next full annual reconsideration of the management contract with UBS Global AM.
Economies of scale—The board noted that, as the sub-advisory fee for the Portfolio would be paid by UBS Global AM, not by the Portfolio, consideration of economies of scale with respect specifically to the sub-advisory fee was not relevant.
Other benefits to Robeco—The board was informed by management that Robeco's relationship with the Portfolio would be limited to its provision of sub-advisory services to the Portfolio and that therefore management believed that Robeco would not receive tangible ancillary benefits as a result of its relationship with the Portfolio, with the exception of possible benefits from soft dollars (e.g., research credits related to transaction commissions) for the Portfolio (which would also potentially benefit the Portfolio). The board recognized that Robeco could receive intangible benefits from its association with the Portfolio, such as increased name recognition or publicity from being selected as a sub-advisor to the Portfolio after an extensive review process. Similarly, the Portfolio could benefit from having a sub-advisor with an established or well-regarded reputation.
In light of all of the foregoing, the board approved the proposed Robeco Sub-Advisory Agreement for the Portfolio, and the approval was intended to cover periods prior to and after Robeco's Change of Control. No single factor reviewed by the board was identified by the board as the principal factor in determining whether to approve the Robeco Sub-Advisory Agreement. The Independent Trustees were advised by separate independent legal counsel throughout the process.
At a subsequent meeting held on July 16-17, 2013, the board re-approved the Robeco Sub-Advisory Agreement. Because Robeco had been serving as sub-advisor to the Portfolio for such a short period of time between the initial approval of the Robeco Sub-Advisory Agreement and the subsequent re-approval (less than two months), the factors considered by and the conclusions of the board were substantially similar to those outlined above.
319
PACE Select Advisors Trust
Board approvals of investment management and administration agreement and sub-advisory agreements (unaudited)
July 2013 Board Meeting—Part I (Explanatory Note: Consideration of certain new arrangements appears immediately below; consideration of other arrangements appears in a separate section, Part II, that then follows.)
Chautauqua Capital Management, LLC
Background—At a meeting of the board of PACE Select Advisors Trust (the "Trust") on July 16-17, 2013, the members of the board, including the trustees who are not "interested persons" of the Trust (the "Independent Trustees") as defined in the Investment Company Act of 1940, as amended, considered and approved the proposed sub-advisory agreement between UBS Global Asset Management (Americas) Inc. ("UBS Global AM") and Chautauqua Capital Management, LLC ("Chautauqua") (the "Chautauqua Sub-Advisory Agreement") with respect to PACE International Equity Investments (the "Portfolio"). Management discussed with the board its proposal to terminate Martin Currie Inc. ("Martin Currie") as a sub-advisor to the Portfolio and to reallocate the portion of assets managed by Martin Currie to Chautauqua. In considering the approval of the Chautauqua Sub-Advisory Agreement, the board was able to draw on its knowledge of the Trust, its portfolios and UBS Global AM. The board recognized its familiarity with UBS Global AM and the investment management and sub-advisory arrangements for this and the other portfolios of the Trust, including the extensive materials the board was receiving in connection with the annual reconsideration of the contracts for all of the portfolios at the same July 2013 meeting. The board also received a memorandum from UBS Global AM discussing UBS Global AM's reasons for recommending Chautauqua as a sub-advisor to the Portfolio.
In its consideration of the approval of the Chautauqua Sub-Advisory Agreement, the board considered the following factors:
Nature, extent and quality of the services under the Chautauqua Sub-Advisory Agreement—The board's evaluation of the services to be provided by Chautauqua to the Portfolio took into account the board's knowledge and familiarity gained as board members of funds in the UBS New York fund complex, including the Trust and its portfolios. The board considered management's reasons for recommending Chautauqua as an additional sub-advisor to the Portfolio, including its belief that Chautauqua's higher beta growth style is expected to be a good complement to the investment philosophies of the current sub-advisors to the Portfolio (excluding Martin Currie). The board also received materials from Chautauqua detailing its investment philosophy and met with representatives of Chautauqua, who discussed with the board their investment philosophies and process and the backgrounds and qualifications of the portfolio management team. The board concluded that, overall, it was satisfied with the nature, extent and quality of services expected to be provided to the Portfolio under the proposed Chautauqua Sub-Advisory Agreement.
Sub-Advisory fee—The board reviewed and considered the proposed contractual sub-advisory fee to be payable by UBS Global AM to Chautauqua in light of the nature, extent and quality of the sub-advisory services anticipated to be provided by Chautauqua. The board noted that the proposed contractual sub-advisory fee, with its breakpoints, was more favorable than the sub-advisory fee currently charged by Martin Currie and would result in a lower overall blended sub-advisory fee to be paid by UBS Global AM for the Portfolio. Management proposed that the savings resulting from the lower overall blended sub-advisory fee be passed through to shareholders. The board determined that the proposed sub-advisory fee was reasonable in light of the nature, extent and quality of the services proposed to be provided to the Portfolio under the Chautauqua Sub-Advisory Agreement.
Fund performance—The board received and considered composite performance information provided by Chautauqua. The board also noted that, as Chautauqua would be a new sub-advisor to the Portfolio, the current performance of the Portfolio was not a significant factor in the consideration of the approval of the Chautauqua Sub-Advisory Agreement.
320
PACE Select Advisors Trust
Board approvals of investment management and administration agreement and sub-advisory agreements (unaudited)
Advisor profitability—Profitability of Chautauqua or its affiliates or UBS Global AM or its affiliates in providing services to the Portfolio was not a significant factor considered by the board, as the sub-advisory fee would be paid by UBS Global AM out of the management fee paid to it by the Portfolio, and not by the Portfolio.
Economies of scale—The board noted that, as the sub-advisory fee for the Portfolio would be paid by UBS Global AM, not by the Portfolio, consideration of economies of scale with respect specifically to the sub-advisory fee was not relevant.
Other benefits to Chautauqua—The board was informed by management that Chautauqua's relationship with the Portfolio would be limited to its provision of sub-advisory services to the Portfolio and that therefore management believed that Chautauqua would not receive tangible ancillary benefits as a result of its relationship with the Portfolio, with the exception of possible benefits from soft dollars (e.g., research credits related to transaction commissions) for the Portfolio (which would also potentially benefit the Portfolio). The board recognized that Chautauqua could receive intangible benefits from its association with the Portfolio, such as increased name recognition or publicity from being selected as a sub-advisor to the Portfolio after an extensive review process. Similarly, the Portfolio could benefit from having a sub-advisor with an established or well-regarded reputation.
In light of all of the foregoing, the board approved the proposed Chautauqua Sub-Advisory Agreement for the Portfolio. No single factor reviewed by the board was identified by the board as the principal factor in determining whether to approve the Chautauqua Sub-Advisory Agreement. The Independent Trustees were advised by separate independent legal counsel throughout the process.
Los Angeles Capital Management and Equity Research, Inc.
Background—At the same meeting, the members of the board, including the Independent Trustees, considered and approved the proposed separate sub-advisory agreements between UBS Global AM and Los Angeles Capital Management and Equity Research, Inc. ("LA Capital") (each an "LA Capital Sub-Advisory Agreement") with respect to PACE Large Co Value Equity Investments and PACE International Equity Investments, respectively (each a "Portfolio" and together the "Portfolios"). Management discussed with the board its proposals: (1) to reduce the allocation to Institutional Capital LLC ("ICAP") and Pzena Investment Management, LLC ("Pzena") and reallocate this portion of assets managed by ICAP and Pzena to LA Capital for PACE Large Co Value Equity Investments and (2) to terminate J.P. Morgan Investment Management Inc.'s ("J.P. Morgan") Research Enhanced Indexed strategy sub-advised sleeve, reduce J.P. Morgan's EAFE Opportunities strategy sub-advised sleeve and reallocate these portions of assets managed by J.P. Morgan to LA Capital for PACE International Equity Investments. In considering the approval of the LA Capital Sub-Advisory Agreements, the board was able to draw on its knowledge of the Trust, its portfolios and UBS Global AM. The board recognized its familiarity with UBS Global AM and the investment management and sub-advisory arrangements for this and the other portfolios of the Trust, including the extensive materials the board was receiving in connection with the annual reconsideration of the contracts for all of the portfolios at the same July 2013 meeting. The board also received memoranda from UBS Global AM discussing UBS Global AM's reasons for recommending LA Capital as a sub-advisor to the Portfolios.
In its consideration of the approvals of the LA Capital Sub-Advisory Agreements, the board considered the following factors:
Nature, extent and quality of the services under the LA Capital Sub-Advisory Agreements—The board's evaluation of the services to be provided by LA Capital to the Portfolios took into account the board's knowledge and familiarity gained as board members of funds in the UBS New York fund complex, including the Trust and its
321
PACE Select Advisors Trust
Board approvals of investment management and administration agreement and sub-advisory agreements (unaudited)
portfolios. The board considered management's reasons for recommending LA Capital as an additional sub-advisor to each Portfolio, including its belief that LA Capital's dynamic, quantitative factor-based approach to investing represents a unique and additional alpha source and is expected to improve the risk-adjusted returns of each Portfolio. The board also received materials from LA Capital detailing its investment philosophy and met with representatives of LA Capital at its May 2013 board meeting, who discussed with the board their investment philosophies and process and the backgrounds and qualifications of the portfolio management team. The board concluded that, overall, it was satisfied with the nature, extent and quality of services expected to be provided to each Portfolio under the proposed LA Capital Sub-Advisory Agreement.
Sub-Advisory fees—The board reviewed and considered the proposed contractual sub-advisory fees to be payable by UBS Global AM to LA Capital for each of the two Portfolios in light of the nature, extent and quality of the sub-advisory services anticipated to be provided by LA Capital. The board noted that the proposed contractual sub-advisory fee to be paid by UBS Global AM for each Portfolio was in line with the sub-advisory fees paid by UBS Global AM to the Portfolio's current sub-advisors. Management proposed that any savings resulting from the overall blended sub-advisory fee be shared, in part, with shareholders. The board determined that the proposed sub-advisory fee for each Portfolio was reasonable in light of the nature, extent and quality of the services proposed to be provided to the Portfolio under the LA Capital Sub-Advisory Agreement.
Fund performance—The board received and considered composite performance information provided by LA Capital. The board also noted that, as LA Capital would be a new sub-advisor to each Portfolio, the current performance of each Portfolio was not a significant factor in the consideration of the approval of the LA Capital Sub-Advisory Agreements.
Advisor profitability—Profitability of LA Capital or its affiliates or UBS Global AM or its affiliates in providing services to each Portfolio was not a significant factor considered by the board, as the sub-advisory fee would be paid by UBS Global AM out of the management fee paid to it by each Portfolio, and not by the Portfolio.
Economies of scale—The board noted that, as the sub-advisory fee for each Portfolio would be paid by UBS Global AM, not by the Portfolio, consideration of economies of scale with respect specifically to the sub-advisory fee was not relevant.
Other benefits to LA Capital—The board was informed by management that LA Capital's relationship with the Portfolios would be limited to its provision of sub-advisory services to the Portfolios and that therefore management believed that LA Capital would not receive tangible ancillary benefits as a result of its relationship with the Portfolios, with the exception of possible benefits from soft dollars (e.g., research credits related to transaction commissions) for the Portfolios (which would also potentially benefit the Portfolios). The board recognized that LA Capital could receive intangible benefits from its association with the Portfolios, such as increased name recognition or publicity from being selected as a sub-advisor to the Portfolios after an extensive review process. Similarly, the Portfolios could benefit from having a sub-advisor with an established or well-regarded reputation.
In light of all of the foregoing, the board approved the proposed LA Capital Sub-Advisory Agreement for each Portfolio. No single factor reviewed by the board was identified by the board as the principal factor in determining whether to approve the LA Capital Sub-Advisory Agreements. The Independent Trustees were advised by separate independent legal counsel throughout the process.
322
PACE Select Advisors Trust
Board approvals of investment management and administration agreement and sub-advisory agreements (unaudited)
Mondrian Investment Partners Limited
Background—At the same meeting, the members of the board, including the Independent Trustees, considered and approved the proposed sub-advisory agreement between UBS Global AM and Mondrian Investment Partners Limited ("Mondrian") (the "Mondrian Sub-Advisory Agreement") with respect to PACE International Equity Investments (the "Portfolio"). The board was asked to approve the Mondrian Sub-Advisory Agreement as Mondrian had agreed to a reduced sub-advisory fee schedule. (It was proposed that the then-effective sub-advisory agreement with Mondrian be replaced by a newer, substantially similar agreement, but with a lower fee schedule.)
In its consideration of the approval of the Mondrian Sub-Advisory Agreement, the board considered the following factors:
Nature, extent and quality of the services under the Mondrian Sub-Advisory Agreement—The board's evaluation of the services currently provided and expected to be provided by Mondrian to the Portfolio took into account the board's knowledge and familiarity gained as board members of funds in the UBS New York fund complex, including the Trust and its portfolios. The board noted that Mondrian had served as a sub-advisor to the Portfolio since April 2004 and that no terms of the then-current sub-advisory agreement between Mondrian and UBS Global AM, other than the reduction in the sub-advisory fee, and no changes from the services provided by Mondrian to the Portfolio, were being proposed. The board concluded that, overall, it was satisfied with the nature, extent and quality of services expected to be provided to the Portfolio under the proposed Mondrian Sub-Advisory Agreement.
Sub-Advisory fee—The board reviewed and considered the proposed contractual sub-advisory fee to be payable by UBS Global AM to Mondrian in light of the nature, extent and quality of the sub-advisory services anticipated to be provided by Mondrian. The board considered that the compensation to be paid to Mondrian would be paid by UBS Global AM, not the Portfolio. Management proposed that the savings resulting from the fee reduction be passed through to shareholders. The board determined that the proposed sub-advisory fee was reasonable in light of the nature, extent and quality of the services proposed to be provided to the Portfolio under the Mondrian Sub-Advisory Agreement.
Other factors—Portfolio performance, profitability, economies of scale and other benefits to Mondrian were not factors specifically considered by the board in its approval of the Mondrian Sub-Advisory Agreement (although the board reviewed Portfolio performance generally, as it does at each regular board meeting), as no changes to the then-current sub-advisory agreement for Mondrian, other than the reduced sub-advisory fee schedule, were being proposed.
In light of all of the foregoing, the board approved the proposed Mondrian Sub-Advisory Agreement for the Portfolio. No single factor reviewed by the board was identified by the board as the principal factor in determining whether to approve the Mondrian Sub-Advisory Agreement. The Independent Trustees were advised by separate independent legal counsel throughout the process.
Standish Mellon Asset Management Company LLC
Background—At the same meeting, the members of the board, including the Independent Trustees, considered and approved the proposed sub-advisory agreement between UBS Global AM and Standish Mellon Asset Management Company LLC ("Standish Mellon") (the "Standish Mellon Sub-Advisory Agreement") with respect to PACE Municipal Fixed Income Investments (the "Portfolio"). The board was asked to approve the Standish Mellon Sub-Advisory Agreement as Standish Mellon had agreed to a reduced sub-advisory fee schedule. (It was proposed
323
PACE Select Advisors Trust
Board approvals of investment management and administration agreement and sub-advisory agreements (unaudited)
that the then-effective sub-advisory agreement with Standish Mellon be replaced by a newer, substantially similar agreement, but with a lower fee schedule.)
In its consideration of the approval of the Standish Mellon Sub-Advisory Agreement, the board considered the following factors:
Nature, extent and quality of the services under the Standish Mellon Sub-Advisory Agreement—The board's evaluation of the services currently provided and expected to be provided by Standish Mellon to the Portfolio took into account the board's knowledge and familiarity gained as board members of funds in the UBS New York fund complex, including the Trust and its portfolios. The board noted that Standish Mellon had served as a sub-advisor to the Portfolio since June 2000 and that no terms of the then-current sub-advisory agreement between Standish Mellon and UBS Global AM, other than the reduction in the sub-advisory fee, and no changes from the services provided by Standish Mellon to the Portfolio, were being proposed. The board concluded that, overall, it was satisfied with the nature, extent and quality of services expected to be provided to the Portfolio under the proposed Standish Mellon Sub-Advisory Agreement.
Sub-Advisory fee—The board reviewed and considered the proposed contractual sub-advisory fee to be payable by UBS Global AM to Standish Mellon in light of the nature, extent and quality of the sub-advisory services anticipated to be provided by Standish Mellon. The board considered that the compensation to be paid to Standish Mellon would be paid by UBS Global AM, not the Portfolio. Management proposed that the savings resulting from the fee reduction be passed through to shareholders. The board determined that the proposed sub-advisory fee was reasonable in light of the nature, extent and quality of the services proposed to be provided to the Portfolio under the Standish Mellon Sub-Advisory Agreement.
Other factors—Portfolio performance, profitability, economies of scale and other benefits to Standish Mellon were not factors specifically considered by the board in its approval of the Standish Mellon Sub-Advisory Agreement (although the board reviewed Portfolio performance generally, as it does at each regular board meeting), as no changes to the then-current sub-advisory agreement for Standish Mellon, other than the reduced sub-advisory fee schedule, were being proposed.
In light of all of the foregoing, the board approved the proposed Standish Mellon Sub-Advisory Agreement for the Portfolio. No single factor reviewed by the board was identified by the board as the principal factor in determining whether to approve the Standish Mellon Sub-Advisory Agreement. The Independent Trustees were advised by separate independent legal counsel throughout the process.
MacKay Shields LLC
Background—At the same meeting, the members of the board, including the Independent Trustees, considered and approved the proposed sub-advisory agreement between UBS Global AM and MacKay Shields LLC ("MacKay") (the "MacKay Sub-Advisory Agreement") with respect to PACE High Yield Investments (the "Portfolio"). The board was asked to approve the MacKay Sub-Advisory Agreement as MacKay had agreed to a reduced sub-advisory fee schedule. (It was proposed that the then-effective sub-advisory agreement with MacKay be replaced by a newer, substantially similar agreement, but with a lower fee schedule.)
In its consideration of the approval of the MacKay Sub-Advisory Agreement, the board considered the following factors:
Nature, extent and quality of the services under the MacKay Sub-Advisory Agreement—The board's evaluation of the services currently provided and expected to be provided by MacKay to the Portfolio took into
324
PACE Select Advisors Trust
Board approvals of investment management and administration agreement and sub-advisory agreements (unaudited)
account the board's knowledge and familiarity gained as board members of funds in the UBS New York fund complex, including the Trust and its portfolios. The board noted that MacKay had served as a sub-advisor to the Portfolio since April 2006 and that no terms of the then-current sub-advisory agreement between MacKay and UBS Global AM, other than the reduction in the sub-advisory fee, and no changes from the services provided by MacKay to the Portfolio, were being proposed. The board concluded that, overall, it was satisfied with the nature, extent and quality of services expected to be provided to the Portfolio under the proposed MacKay Sub-Advisory Agreement.
Sub-Advisory fee—The board reviewed and considered the proposed contractual sub-advisory fee to be payable by UBS Global AM to MacKay in light of the nature, extent and quality of the sub-advisory services anticipated to be provided by MacKay. The board considered that the compensation to be paid to MacKay would be paid by UBS Global AM, not the Portfolio. Management proposed that the savings resulting from the fee reduction be passed through to shareholders. The board determined that the proposed sub-advisory fee was reasonable in light of the nature, extent and quality of the services proposed to be provided to the Portfolio under the MacKay Sub-Advisory Agreement.
Other factors—Portfolio performance, profitability, economies of scale and other benefits to MacKay were not factors specifically considered by the board in its approval of the MacKay Sub-Advisory Agreement (although the board reviewed Portfolio performance generally, as it does at each regular board meeting), as no changes to the then-current sub-advisory agreement for MacKay, other than the reduced sub-advisory fee schedule, were being proposed.
In light of all of the foregoing, the board approved the proposed MacKay Sub-Advisory Agreement for the Portfolio. No single factor reviewed by the board was identified by the board as the principal factor in determining whether to approve the MacKay Sub-Advisory Agreement. The Independent Trustees were advised by separate independent legal counsel throughout the process.
Analytic Investors, LLC
Background—At the same meeting, the members of the board, including the Independent Trustees, considered and approved the proposed sub-advisory agreement between UBS Global AM and Analytic Investors, LLC ("Analytic") (the "Analytic Sub-Advisory Agreement") with respect to PACE Alternative Strategies Investments (the "Portfolio"). The board was asked to approve the Analytic Sub-Advisory Agreement as Analytic had agreed to a reduced sub-advisory fee schedule. (It was proposed that the then-effective sub-advisory agreement with Analytic be replaced by a newer, substantially similar agreement, but with a lower fee schedule.)
In its consideration of the approval of the Analytic Sub-Advisory Agreement, the board considered the following factors:
Nature, extent and quality of the services under the Analytic Sub-Advisory Agreement—The board's evaluation of the services currently provided and expected to be provided by Analytic to the Portfolio took into account the board's knowledge and familiarity gained as board members of funds in the UBS New York fund complex, including the Trust and its portfolios. The board noted that Analytic had served as a sub-advisor to the Portfolio since April 2006 and that no terms of the then-current sub-advisory agreement between Analytic and UBS Global AM, other than the reduction in the sub-advisory fee, and no changes from the services provided by Analytic to the Portfolio, were being proposed. The board concluded that, overall, it was satisfied with the nature, extent and quality of services expected to be provided to the Portfolio under the proposed Analytic Sub-Advisory Agreement.
325
PACE Select Advisors Trust
Board approvals of investment management and administration agreement and sub-advisory agreements (unaudited)
Sub-Advisory fee—The board reviewed and considered the proposed contractual sub-advisory fee to be payable by UBS Global AM to Analytic in light of the nature, extent and quality of the sub-advisory services anticipated to be provided by Analytic. The board considered that the compensation to be paid to Analytic would be paid by UBS Global AM, not the Portfolio. Management proposed that the savings resulting from the fee reduction be passed through to shareholders. The board determined that the proposed sub-advisory fee was reasonable in light of the nature, extent and quality of the services proposed to be provided to the Portfolio under the Analytic Sub-Advisory Agreement.
Other factors—Portfolio performance, profitability, economies of scale and other benefits to Analytic were not factors specifically considered by the board in its approval of the Analytic Sub-Advisory Agreement (although the board reviewed Portfolio performance generally, as it does at each regular board meeting), as no changes to the then-current sub-advisory agreement for Analytic, other than the reduced sub-advisory fee schedule, were being proposed.
In light of all of the foregoing, the board approved the proposed Analytic Sub-Advisory Agreement for the Portfolio. No single factor reviewed by the board was identified by the board as the principal factor in determining whether to approve the Analytic Sub-Advisory Agreement. The Independent Trustees were advised by separate independent legal counsel throughout the process.
326
PACE Select Advisors Trust
Board approvals of investment management and administration agreement and sub-advisory agreements (unaudited)
July 2013 Board Meeting—Part II (Explanatory note: Consideration of certain new arrangements at the July 2013 Board meeting appears in the immediately preceding section; consideration of other arrangements appears below.)
Background—At a meeting of the board of PACE Select Advisors Trust (the "Trust") on July 16-17, 2013, the members of the board, including the trustees who are not "interested persons" of the Trust (the "Independent Trustees"), as defined in the Investment Company Act of 1940, as amended, considered and approved the continuance of the investment management and administration agreement (the "Investment Management and Administration Agreement") between UBS Global Asset Management (Americas) Inc. ("UBS Global AM") and the Trust, on behalf of each series of the Trust (each a "Portfolio" and together the "Portfolios") and, for those Portfolios with sub-advisors, the sub-advisory agreements that were proposed for renewal for the Portfolios. (Throughout this discussion, each sub-advisor to a Portfolio is referred to as a "Sub-Advisor" and each sub-advisory agreement is referred to as a "Sub-Advisory Agreement.") In preparing for the meeting, the board members had requested and received extensive information from UBS Global AM to assist them, including information about the Portfolios' Sub-Advisors, as well as the management, sub-advisory, administrative and distribution arrangements for the Portfolios. Independent Trustees discussed the materials initially provided by management among themselves on several occasions prior to the scheduled board meeting, and independent legal counsel participated in several such discussions. The Independent Trustees also met in executive session with their independent legal counsel to review the presentation that had been made to them at the meeting. The Independent Trustees also received a memorandum from their independent legal counsel discussing the duties of board members in considering approval of management, sub-advisory, administration and distribution agreements.
In its consideration of the approval of the Investment Management and Administration Agreement and the Sub-Advisory Agreements, the board considered the following factors:
Nature, extent and quality of the services under the Investment Management and Administration Agreement and the Sub-Advisory Agreements—The board received and considered information regarding the nature, extent and quality of management services provided to the Portfolios by UBS Global AM and, for those Portfolios with sub-advisor(s), sub-advisory services provided by the particular Sub-Advisor during the past year. The board also considered the nature, extent and quality of administrative, distribution, and shareholder services performed by UBS Global AM and its affiliates for the Portfolios and the resources devoted to, and the record of compliance with, each Portfolio's compliance policies and procedures. The board noted that it received information at regular meetings throughout the year regarding the services rendered by UBS Global AM concerning the management of each Portfolio's affairs and UBS Global AM's role in coordinating providers of other services to the Portfolios. The board noted the complexity of this process for the Portfolios, given their broad range of investment strategies. The board noted that UBS Global AM provided extensive oversight of the Sub-Advisors for the Portfolios and reported to the board at each regular meeting on the Sub-Advisors' performance and made recommendations with respect to Sub-Advisor changes from time to time based on the performance of the Sub-Advisors and other relevant factors. The board's evaluation of the services provided by UBS Global AM and the Sub-Advisors took into account the board's knowledge and familiarity gained as board members of funds in the UBS New York fund complex, including the scope and quality of UBS Global AM's investment management and other capabilities and the quality of its administrative and other services. The board observed that the scope of services provided by UBS Global AM had expanded over time as a result of regulatory and other developments, including maintaining and monitoring its own and the Portfolios' expanded compliance programs.
The board had available to it the qualifications, backgrounds and responsibilities of the senior personnel at UBS Global AM responsible for the Portfolios and had previously met with and received information regarding the
327
PACE Select Advisors Trust
Board approvals of investment management and administration agreement and sub-advisory agreements (unaudited)
person, persons or portfolio management team primarily responsible for the day-to-day portfolio management of each Portfolio and recognized that the Portfolios' senior personnel at UBS Global AM report to the board regularly and that at each regular meeting the board receives a detailed report on each Portfolio's performance and receives more extensive information periodically from each Sub-Advisor. The board also considered, based on its knowledge of UBS Global AM and its affiliates, the financial resources available to UBS Global AM and its parent organization, UBS AG. In that regard, the board received extensive financial information regarding UBS Global AM and noted that it was a wholly owned, indirect subsidiary of one of the largest financial services firms in the world. It was also noted that UBS Global AM had approximately $159 billion in assets under management as of March 31, 2013 and was part of the UBS Global Asset Management Division, which had approximately $632 billion in assets under management worldwide as of March 31, 2013. The board was also cognizant of, and considered, the regulatory and litigation actions and investigations occurring in the past few years involving UBS AG, UBS Global AM and certain of their affiliates.
The board concluded that, overall, it was satisfied with the nature, extent and quality of services provided (and expected to be provided) to the Portfolios under the Investment Management and Administration Agreement as well as under the Sub-Advisory Agreements that were proposed for continuance. It was noted that the board had also been asked to consider the appointment of new sub-advisors for certain portfolios and the termination of some current sub-advisers (discussed elsewhere herein). Management asked the board to consider the continuance of the agreements for the sub-advisors being terminated only through shortened periods to facilitate the transition to newer arrangements, but not for another complete annual renewal cycle.
Management and sub-advisory fees and expense ratios—For each Portfolio, the board reviewed and considered the contractual management fee (the "Contractual Management Fee") payable by the Portfolio to UBS Global AM in light of the nature, extent and quality of the advisory and administrative services provided by UBS Global AM. The board also reviewed and considered the fee waiver and/or expense reimbursement arrangements for the Portfolio (if any) and considered the actual fee rate (after taking any waivers and reimbursements into account) (the "Actual Management Fee"). The board considered whether UBS Global AM had entered into one or more fee waiver and/or expense reimbursement agreements with respect to a Portfolio under which UBS Global AM was contractually obligated to waive its management fees and/or reimburse the Portfolio so that the total ordinary operating expenses of certain or all classes of a given Portfolio through November 30, 2013 (excluding dividend expense, borrowing costs, interest expense relating to short sales, expenses attributable to investment in other investment companies, interest, taxes, brokerage commissions and extraordinary expenses) would not exceed specified limits for each class (or, with respect to certain Portfolios, an agreement to waive a portion of its management fee). The board also considered that each Portfolio with such a fee waiver/reimbursement agreement had agreed to repay UBS Global AM for those waived fees and/or reimbursed expenses if the Portfolio can do so over the following three fiscal years without causing its expenses in any of those years to exceed the expense caps. Moreover, the board considered that, in addition to continuing to waive fees as in past years, UBS Global AM also offered specific new waivers or expense caps for certain Portfolios as discussed below. Additionally, the board received and considered information comparing each Portfolio's Contractual Management Fee, Actual Management Fee and overall expenses with those of funds in a group of funds selected and provided by Lipper, an independent provider of investment company data (the "Expense Group"), and, when appropriate, the board also received from UBS Global AM comparative data on a supplemental expense group of sub-advised peers (which may include certain of the sub-advised peers contained within the primary Expense Group) (the "Supplemental Expense Group"). A discussion of the board's considerations with respect to each Portfolio's fees is set forth below.
In connection with its consideration of each Portfolio's management fees, the board also received information on UBS Global AM's standard institutional account fees for accounts of a similar investment type to each of the Portfolios. The board noted management's explanation that comparisons with such accounts may be of limited
328
PACE Select Advisors Trust
Board approvals of investment management and administration agreement and sub-advisory agreements (unaudited)
relevance given the different structures and regulatory requirements of mutual funds versus such accounts and the differences in the levels of services required by mutual funds and such accounts. The board also received information on fees charged to other mutual funds managed by UBS Global AM. The board observed that it had received certain information regarding fees, profitability, compensation from other similar funds, and economies of scale from certain Sub-Advisors as part of the summary of each Sub-Advisor's responses to requests for due diligence materials in connection with the board's annual reconsideration of the Sub-Advisory Agreements; however, the board also observed that the compensation paid to a Sub-Advisor is paid by UBS Global AM, not by the particular Portfolio and, accordingly, that the retention of a Sub-Advisor generally does not increase the fees otherwise incurred by a Portfolio's shareholders (unless a management fee waiver level was affected by a sub-advisory fee increase or a reallocation of assets).
Portfolio performance—For each Portfolio, the board received and considered (a) annualized total return information of the Portfolio compared to other funds (the "Performance Universe") selected by Lipper over the one-, three-, five-, ten-year (or shorter for newer Portfolios) and since inception periods ended April 30, 2013, and (b) annualized performance information for each year in the ten-year (or shorter) period ended April 30, 2013. The board was provided with a description of the methodology Lipper used to determine the similarity of a Portfolio with the funds included in its Performance Universe and had separately met with senior representatives of Lipper to discuss how such reports were prepared and related matters. The board also received updated supplemental data showing each Portfolio's performance through June 30, 2013. The board also considered UBS Global AM's statement that while management believed that the Lipper peer groups were useful in evaluating Portfolio expenses relative to peers, they were less useful in evaluating performance, as in many cases they were broad-based and consisted of funds that did not necessarily have similar investment parameters to the applicable Portfolio. The board also noted that it had received information throughout the year at periodic intervals with respect to each Portfolio's performance, in most cases with respect to certain benchmark indices, including with respect to each Sub-Advisor's performance. Further discussion of the board's considerations with respect to each Portfolio's performance is set forth below.
Advisor profitability—The board received and considered a profitability analysis of UBS Global AM and its affiliates in providing services to each Portfolio. The board also received profitability information with respect to the UBS New York fund complex as a whole. UBS Global AM's profitability was considered not excessive in light of the nature, extent and quality of the services provided to the Portfolios. To the extent provided by a Sub-Advisor, the board also reviewed information with respect to the Sub-Advisor's profitability in providing services to a Portfolio. The board did not consider such Sub-Advisor profitability information highly relevant as the sub-advisory fees are paid by UBS Global AM, not by the relevant Portfolio.
Economies of scale—The board received and considered information from management regarding whether UBS Global AM realized economies of scale as the Portfolios' assets grew, whether the Portfolios have appropriately benefited from any economies of scale, and whether there is potential for realization of any further economies of scale for the Portfolios. The board considered whether economies of scale in the provision of services to the Portfolios were being passed along to the shareholders. The board noted that each Portfolio's Contractual Management Fee contained breakpoints, with the exception of PACE Money Markets Investments. The board also noted that as of April 30, 2013, with the exception of PACE Small/Medium Co Growth Equity Investments, PACE Small/Medium Co Value Equity Investments, PACE International Emerging Markets Equity Investments, PACE Global Real Estate Securities Investments and PACE High Yield Investments, for those Portfolios having breakpoints, each Portfolio's asset level exceeded at least its first breakpoint. Accordingly, the board determined that actual economies of scale existed for those Portfolios whose assets had reached the first breakpoint level and potential economies of scale existed for those Portfolios whose assets had not yet reached their first breakpoint level. The board also noted that to the extent a Portfolio's assets have increased over time, it has realized other economies of scale as certain expenses, such as fees for Trustees, auditor and legal fees and printing and postage,
329
PACE Select Advisors Trust
Board approvals of investment management and administration agreement and sub-advisory agreements (unaudited)
become a smaller percentage of overall assets. The board also took note of the relationship between any breakpoints in a sub-advisory fee and the breakpoints in fees paid by the Portfolios to UBS Global AM.
In light of UBS Global AM's profitability data, the Actual Management Fee, the Contractual Management Fee and the breakpoints currently in place for the Portfolios, the board believed that UBS Global AM's sharing of potential and current economies of scale with the Portfolios was acceptable.
Other benefits to UBS Global AM and the Sub-Advisors—The board was informed by management that the Sub-Advisors' relationships with the sub-advised Portfolios were limited to their provision of sub-advisory services to these Portfolios, and that therefore, management believed that the Sub-Advisors and their affiliates did not receive tangible ancillary benefits as a result of the Sub-Advisors' relationships with the sub-advised Portfolios, with the exception of possible benefits from soft dollars (e.g., research credits related to transaction commissions) for the equity Portfolios (which would also potentially benefit such Portfolios) and possible limited benefits to certain affiliates of a Sub-Advisor, such as broker-dealers (e.g., an affiliate's execution of portfolio transactions subject to detailed restrictions in SEC rules and board oversight procedures). The board recognized that certain Sub-Advisors could receive intangible benefits from their association with the Trust, such as increased name recognition or publicity from being selected as Sub-Advisors to the Trust after an extensive review process. Similarly, a Portfolio could benefit from having a Sub-Advisor with an established or well-regarded reputation. In light of the costs of providing investment management, administrative and other services to the Portfolios and UBS Global AM's ongoing commitment to the Portfolios, the profits and other ancillary benefits that UBS Global AM and its affiliates received were considered reasonable.
In the discussions that follow, reference is made to "quintile" placement in Lipper expense group and performance universe categories. With respect to expenses, the first quintile represents that 20% of the funds in the Expense Group with the lowest fees or expenses, as applicable, and the fifth quintile represents that 20% of the funds in the Expense Group with the highest fees or expenses, as applicable. With respect to performance, the first quintile represents that 20% of the funds in the Performance Universe with the best relative performance, and the fifth quintile represents that 20% of the funds in the Performance Universe with the worst relative performance. Lipper quintile placement information is calculated on a share class basis. References to quintile placement appearing below relate to Class A shares, and the board had information relevant to other share classes (e.g., Class P shares) during its considerations.
PACE Large Co Growth Equity Investments
In approving the Investment Management and Administration Agreement and the Sub-Advisory Agreements with each of Delaware Management Company, J.P. Morgan Investment Management Inc. and Roxbury Capital Management LLC, the board, including the Independent Trustees, also considered the following factors:
Portfolio performance—The comparative Lipper information showed that the Portfolio's performance was in the second quintile for the one-year period, in the third quintile for the three-, five- and ten-year periods and in the fourth quintile since inception. Management noted that the Portfolio's performance was above the median for the one-year period and that the Portfolio has shown consistent long-term performance in the third quintile over the three-, five- and ten-year periods.
Management and sub-advisory fees and expense ratios—The comparative Lipper information showed that the Portfolio's Contractual Management Fee and Actual Management Fee were in the fourth quintile and its total expenses were in the third quintile in the Portfolio's Expense Group for the comparison periods utilized in the Lipper report. Management noted that the Portfolio's total expenses were one basis point (i.e., 0.01%) above the median. Management also noted that, compared to the Supplemental Expense Group, consisting of ten other sub-advised
330
PACE Select Advisors Trust
Board approvals of investment management and administration agreement and sub-advisory agreements (unaudited)
funds, the Portfolio's Actual Management Fee and total expenses were both below the median and, thus, in line with its peers.
PACE Large Co Value Equity Investments
In approving the Investment Management and Administration Agreement and the Sub-Advisory Agreements with each of Institutional Capital LLC, Pzena Investment Management, LLC and Robeco Investment Management, Inc. ("Robeco"), the board, including the Independent Trustees, also considered the following factors:
Portfolio performance—The comparative Lipper information showed that the Portfolio's performance was in the third quintile for the one-, three-, five- and ten-year periods and since inception. Management noted that the Portfolio's performance was above the median for the five- and ten-year periods and since inception.
Management and sub-advisory fees and expense ratios—The comparative Lipper information showed that the Portfolio's Contractual Management Fee, Actual Management Fee and total expenses were in the fourth quintile in the Portfolio's Expense Group for the comparison periods utilized in the Lipper report. Management noted that, compared to the Supplemental Expense Group, consisting of ten other sub-advised funds, the Portfolio's Contractual Management Fee, Actual Management Fee and total expenses were generally in line with the respective medians. Management further noted that, as previously discussed with the board, changes to the Sub-Advisor allocations and Sub-Advisor line-up were proposed to take place in two phases, each of which was expected to result in a Sub-Advisory fee savings to UBS Global AM, which UBS Global AM would share with the Portfolio's shareholders. Management explained that these savings had not yet been fully reflected in the Lipper materials. The board also referenced the factors it considered and conclusions it reached at its May 2013 meeting with respect to its initial approval of Robeco, which it reaffirmed.
PACE Small/Medium Co Growth Equity Investments
In approving the Investment Management and Administration Agreement and the Sub-Advisory Agreements with each of Copper Rock Capital Partners, LLC, Palisade Capital Management, L.L.C. and Riverbridge Partners, LLC, the board, including the Independent Trustees, also considered the following factors:
Portfolio performance—The comparative Lipper information showed that the Portfolio's performance was in the fourth quintile for the one- and ten-year periods and since inception and in the third quintile for the three- and five-year periods. Management explained that the Portfolio had been particularly impacted over the first four months of 2013 due to the underperformance of all three of its Sub-Advisors, despite all three Sub-Advisors having very different investment styles. Management further explained that the common denominator to underperformance across all three Sub-Advisors had been poor stock selection in certain sectors, even though those sectors performed well in the index.
Management and sub-advisory fees and expense ratios—The comparative Lipper information showed that the Portfolio's Contractual Management Fee and Actual Management Fee were in the third quintile and its total expenses were in the first quintile in the Portfolio's Expense Group for the comparison periods utilized in the Lipper report. Management noted that the Portfolio's Contractual Management Fee and Actual Management Fee were both below the respective medians.
331
PACE Select Advisors Trust
Board approvals of investment management and administration agreement and sub-advisory agreements (unaudited)
PACE Small/Medium Co Value Equity Investments
In approving the Investment Management and Administration Agreement and the Sub-Advisory Agreements with each of Kayne Anderson Rudnick Investment Management, LLC, Metropolitan West Capital Management, LLC and Systematic Financial Management, L.P., the board, including the Independent Trustees, also considered the following factors:
Portfolio performance—The comparative Lipper information showed that the Portfolio's performance was in the second quintile for the one-year period, in the fourth quintile for the three-year period, in the third quintile for the five-year period and since inception and in the fifth quintile for the ten-year period. Management noted that the Portfolio had strong relative performance during the one-year period, outperforming the benchmark and its Lipper peer group median.
Management and sub-advisory fees and expense ratios—The comparative Lipper information showed that the Portfolio's Contractual Management Fee and Actual Management Fee were in the second quintile and its total expenses were in the first quintile in the Portfolio's Expense Group for the comparison periods utilized in the Lipper report.
PACE International Equity Investments
In approving the Investment Management and Administration Agreement and the Sub-Advisory Agreements with each of Martin Currie Inc. ("Martin Currie"), Mondrian Investment Partners Limited ("Mondrian") and J.P. Morgan Investment Management Inc. ("JP Morgan"), the board, including the Independent Trustees, also considered the following factors:
Portfolio performance—The comparative Lipper information showed that the Portfolio's performance was in the third quintile for the one- and three-year periods, in the fifth quintile for the five-year period and in the fourth quintile for the ten-year period and since inception. Management noted the Portfolio's improved performance for the one- and three-year periods.
Management and sub-advisory fees and expense ratios—The comparative Lipper information showed that the Portfolio's Contractual Management Fee and total expenses were in the fourth quintile and its Actual Management Fee was in the fifth quintile in the Portfolio's Expense Group for the comparison periods utilized in the Lipper report. Management noted that, compared to the Supplemental Expense Group, consisting of five other sub-advised funds, the Portfolio's Contractual Management Fee, Actual Management Fee and total expenses were slightly above the respective medians. Management also noted that UBS Global AM had recently negotiated a new Sub-Advisory fee schedule with Mondrian resulting in savings to the Portfolio (see separate discussion regarding the July 2013 board approval of the new Mondrian Sub-Advisory Agreement elsewhere herein), which would be passed through entirely to the Portfolio's shareholders. Management explained that these new savings were not reflected in the Lipper materials. It was noted that the approval with respect to Martin Currie was of limited duration to facilitate the transition involving Chautauqua Capital Management, LLC ("Chautauqua"), a new Sub-Advisor to the Portfolio (see the discussion regarding the appointment of Chautauqua and termination of Martin Currie elsewhere herein). It was also noted that the approval with respect to JP Morgan's International Research Enhanced Equity Index Strategy ("JP Morgan-REI") segment was of limited duration to facilitate the transition involving Los Angeles Capital Management and Equity Research, Inc. ("LA Capital"), a new Sub-Advisor to the Portfolio (see the discussion regarding the appointment of LA Capital and termination of JP Morgan-REI elsewhere herein). (The approval with respect to J.P. Morgan's other segment of the Portfolio, namely the Europe, Australasia, and Far East Opportunities Strategy segment, was not so limited.)
332
PACE Select Advisors Trust
Board approvals of investment management and administration agreement and sub-advisory agreements (unaudited)
PACE International Emerging Markets Equity Investments
In approving the Investment Management and Administration Agreement and the Sub-Advisory Agreements with each of Lee Munder Capital Group, LLC, Mondrian Investment Partners Limited and William Blair & Company L.L.C., the board, including the Independent Trustees, also considered the following factors:
Portfolio performance—The comparative Lipper information showed that the Portfolio's performance was in the second quintile for the one- and three-year periods, in the third quintile for the five- and ten-year periods and in the fifth quintile since inception. Management noted the Portfolio's strong relative performance during the one-year period, outperforming the Lipper peer group median by 3.65%.
Management and sub-advisory fees and expense ratios—The comparative Lipper information showed that the Portfolio's Contractual Management Fee was in the second quintile, its Actual Management Fee was in the third quintile and its total expenses were in the fourth quintile in the Portfolio's Expense Group for the comparison periods utilized in the Lipper report. Management noted that the Portfolio's Contractual Management Fee and Actual Management Fee were both below the respective median, and that its total expenses were above the median mostly due to higher custodian fees and other non-management expenses versus the median. Management noted that the major component of custody fees for an emerging markets fund was sub-custody fees, namely costs related to holding Portfolio assets in different emerging markets as part of investing in a given developing country—which may vary significantly based on the specific country. Management stated that the higher custodial costs were related to the Portfolio's superior performance for the one- and three-year periods. Management further noted that, at the September 2012 board meeting, the board approved changes to the Sub-Advisor allocations and Sub-Advisor line-up of this Portfolio which were expected to result in a Sub-Advisory fee savings to UBS Global AM, which UBS Global AM agreed to share with the Portfolio's shareholders. Management explained that these savings have not yet been fully reflected in the Lipper materials. Management also proposed to lower the expense cap for each share class of the Portfolio by 20 basis points (0.20%).
PACE Alternative Strategies Investments
In approving the Investment Management and Administration Agreement and the Sub-Advisory Agreements with each of Analytic Investors, LLC, First Quadrant L.P. ("First Quadrant") and Standard Life Investments (Corporate Funds) Limited, the board, including the Independent Trustees, also considered the following factors:
Portfolio performance—The comparative Lipper information showed that the Portfolio's performance was in the first quintile for the one-year period, in the third quintile for the three-year period and since inception and in the fourth quintile for the five-year period. Management noted the Portfolio's strong relative performance for the one-year period, significantly outperforming the Lipper peer group median and continuing an improving trend from prior periods.
Management and sub-advisory fees and expense ratios—The comparative Lipper information showed that the Portfolio's Contractual Management Fee and Actual Management Fee were in the fifth quintile (with the Portfolio's Actual Management Fee being the highest in the Portfolio's Expense Group of eleven funds) and its total expenses were in the fourth quintile in the Portfolio's Expense Group for the comparison periods utilized in the Lipper report. Management noted that the Portfolio's Lipper category, Absolute Return, encompasses a wide range of underlying strategies, with ongoing and continuous evolution and development as more managers have offered different versions of "liquid alternatives" over the last few years. Management noted that the changing composition of this universe led the median expense ratio for this group to decline by 34 basis points (i.e., 0.34%) from 2013 to 2012. Management stated that certain funds in the peer group were fixed income oriented, for which expense ratios tend to be substantially lower than those of a pure "liquid alternative" fund like the
333
PACE Select Advisors Trust
Board approvals of investment management and administration agreement and sub-advisory agreements (unaudited)
Portfolio. Management noted that, excluding fixed income oriented funds from the Supplemental Expense Group, consisting of seven other sub-advised funds, the median total expense ratio for the peer group would become 1.87%, much closer to that of the Portfolio.
Management noted that, at the September 2012 board meeting, UBS Global AM agreed to reduce the expense caps of this Portfolio for each share class by 5 basis points (i.e., 0.05%), effective the end of November 2012, and that, consequently, the total expense ratio reflected in the Lipper materials reflected a blended rate of the former expense caps and the current expense caps. Management noted that for Class A shares, the expense cap prior to the end of November 2012, was 1.95% and since November 28, 2012, was 1.88%. Management stated that, based on the new cap of 1.88% compared to the adjusted peer group, excluding fixed income oriented funds, the Portfolio's total expenses would appear to be median.
Management further noted that it had successfully negotiated a fee reduction with Analytic Investors, LLC ("Analytic") and that savings from the lower sub-advisory fee would pass through 100% to the shareholders via a fee waiver arrangement, which would further lower the pro-forma expense ratio for the Portfolio (see the discussion regarding the approval of the new Analytic Sub-Advisory agreement elsewhere herein).
In light of management's explanation, the board determined that the management fee and the sub-advisory fees were satisfactory. Nonetheless, the board determined that it would continue to closely monitor the Portfolio's expenses over the next year. (The approvals with respect to First Quadrant covered two separate Sub-Advisory Agreements related to two separate strategies implemented with respect to two distinct segments of the Portfolio.)
PACE Global Real Estate Securities Investments
In approving the Investment Management and Administration Agreement and the Sub-Advisory Agreement with each of Brookfield Investment Management Inc. and CBRE Clarion Securities, LLC, the board, including the Independent Trustees, also considered the following factors:
Portfolio performance—The comparative Lipper information showed that the Portfolio's performance was in the third quintile for the one- and three-year periods and in the fifth quintile for the five-year period and since inception.
Management and sub-advisory fees and expense ratios—The comparative Lipper information showed that the Portfolio's Contractual Management Fee was in the second quintile, its Actual Management Fee was in the first quintile and its total expenses were in the fourth quintile in the Portfolio's Expense Group for the comparison periods utilized in the Lipper report. Management noted that the Portfolio's total expenses were slightly above the median in the Portfolio's Expense Group. Management explained that the Portfolio's other non-management expenses were higher than those of some peers due to certain fixed costs, such as the large number of smaller shareholder accounts. Management further noted that, compared to the Supplemental Expense Group, consisting of five other sub-advised funds, the Portfolio's Contractual Management Fee and Actual Management Fee were well below the median, and the Portfolio's total expenses were essentially in line with the median.
334
PACE Select Advisors Trust
Board approvals of investment management and administration agreement and sub-advisory agreements (unaudited)
PACE Government Securities Fixed Income Investments
In approving the Investment Management and Administration Agreement and the Sub-Advisory Agreement with Pacific Investment Management Company LLC, the board, including the Independent Trustees, also considered the following factors:
Portfolio performance—The comparative Lipper information showed that the Portfolio's performance was in the fifth quintile for the one-year period, in the fourth quintile for the three-year period, in the third quintile for the five-year period and in the second quintile for the ten-year period and since inception. Management stated that the Portfolio's recent performance is largely due to the Sub-Advisor's more defensive positioning (i.e., underweight "Fed coupons" and very modest exposure to more credit-sensitive products) in a market that has been artificially supported by the US Federal Reserve's quantitative-easing bond-buying efforts. Management further stated that the defensive positioning of the Portfolio is reflected in the more favorable risk-adjusted performance, placing the Portfolio close to the median for the three- and five-year periods.
Management and sub-advisory fees and expense ratios—The comparative Lipper information showed that the Portfolio's Contractual Management Fee, Actual Management Fee and total expenses were in the fifth quintile in the Portfolio's Expense Group for the comparison periods utilized in the Lipper report (with the Portfolio's Contractual Management Fee and total expenses being the highest in the Portfolio's Expense Group of seven funds). Management noted that, at the September 2012 board meeting, UBS Global AM had agreed to reduce the expense caps of this Portfolio for each share class by 5 basis points (i.e., 0.05%) effective the end of November 2012, and that, consequently, the total expense ratio reflected in the Lipper materials reflects a blended rate of the former expense caps and the current expense caps. Management further noted that for Class A shares, the expense cap prior to the end of November 2012 was 1.02% and since November 28, 2012 was 0.97%. On this basis, the Class A shares of the Portfolio, at 0.97% waiver-adjusted, was 5 basis points (i.e., 0.05%) above the median expense ratio. Management recognized that the sub-advised universe of two other funds would not allow for a particularly meaningful comparison given its small size. Noting the wide dispersion between the low and high of 35 basis points (i.e., 0.35%) in total expenses, management stated that it believes the primary drivers are related to the differing risk profiles of the various funds. Management further stated that, since this is a relatively small peer group, this waiver has a disproportionate impact on the calculated median. Management noted that the sector allocations for the two lowest-priced funds had much less exposure to credit sensitive products and that, while the Portfolio would still be at the high end based on a small sample size of the other funds, the Portfolio would be among a close cluster of funds that are all priced within 10 basis points (i.e., 0.10%). In light of the Portfolio's long-term performance versus its peers and management's explanation, the board determined that the management fee and the sub-advisory fees were satisfactory. Nonetheless, the board determined that it would continue to closely monitor the Portfolio's expenses over the next year.
PACE High Yield Investments
In approving the Investment Management and Administration Agreement and the Sub-Advisory Agreement with MacKay Shields LLC ("MacKay Shields"), the board, including the Independent Trustees, also considered the following factors:
Portfolio performance—The comparative Lipper information showed that the Portfolio was in the second quintile for the one-year period, in the fourth quintile for the three-year period and in the first quintile for the five-year period and since inception. Management noted that the fourth quintile ranking for the three-year period was within its investment expectations given the Sub-Advisor's investment philosophy of "winning by not losing." Management explained that, in a strong "risk-on" market that witnessed a large compression of credit spreads, the Sub-Advisor was not expected to keep up, even though its "risk-aware" process continued to enable the
335
PACE Select Advisors Trust
Board approvals of investment management and administration agreement and sub-advisory agreements (unaudited)
Portfolio to participate on the up-side while protecting on the down-side, generating respectable long-term five-year and since inception performance.
Management and sub-advisory fees and expense ratios—The comparative Lipper information showed that the Portfolio's Contractual Management Fee and Actual Management Fee were in the fifth quintile and its total expenses were in the fourth quintile in the Portfolio's Expense Group for the comparison periods utilized in the Lipper report. Management noted that the Portfolio's global strategy warrants a higher expense ratio relative to its U.S.-centric peers, as exposure to non-USD issues is associated with added transaction costs due to lower liquidity, research costs associated with analyzing and monitoring opportunities in more obscure issuers, and additional management complexity related to the implementation of currency hedging. Management noted, however, that it believes that the additional diversification and the potential return benefits of global investing for the Portfolio's shareholders outweigh this additional cost. Management also noted that it had recently negotiated a breakpoint with the Sub-Advisor when assets increase above $400 million. In light of these considerations, the board determined that the management fee and the sub-advisory fee were satisfactory. Nonetheless, the board determined that it would continue to monitor the Portfolio's expenses over the next year. (See the discussion regarding the approval of the new MacKay Shields Sub-Advisory Agreement elsewhere herein.)
PACE Intermediate Fixed Income Investments
In approving the Investment Management and Administration Agreement and the Sub-Advisory Agreement with BlackRock Financial Management, Inc., the board, including the Independent Trustees, also considered the following factors:
Portfolio performance—The comparative Lipper information showed that the Portfolio's performance was in the fourth quintile for the one- and five-year periods, in the third quintile for the three- and ten-year periods and in the fifth quintile since inception. Management noted the wide range in portfolio duration for the funds in the Performance Universe, that the Portfolio has been median in terms of volatility and that it believes that the Portfolio's risk-adjusted performance is within expectations for this wide-ranging category.
Management and sub-advisory fees and expense ratios—The comparative Lipper information showed that the Portfolio's Contractual Management Fee was in the third quintile and its Actual Management Fee and total expenses were in the fourth quintile in the Portfolio's Expense Group for the comparison periods utilized in the Lipper report. Taking into account the range of duration strategies within the Expense Group, management stated its belief that the fees for the Portfolio are closer to the median. Management stated that it calculated the median total expense for the four funds that are more similar in duration at 88 basis points (i.e., 0.88%), which is within 5 basis points (i.e., 0.05%) of the Portfolio's total expense ratio. Management noted that, compared to the Supplemental Expense Group, consisting of three other sub-advised funds, the Portfolio appears closer to the median. Management also noted that the Portfolio's mandate was recently expanded to include the ability to allocate an increased portion of its assets to high yield debt, emerging market debt and municipals, all of which tend to have higher transaction costs and require more research and monitoring. Management stated its belief that it expects the broader opportunity set should also enable the Sub-Advisor to generate more competitive returns going forward.
PACE International Fixed Income Investments
In approving the Investment Management and Administration Agreement and the Sub-Advisory Agreement with Rogge Global Partners plc, the board, including the Independent Trustees, also considered the following factors:
336
PACE Select Advisors Trust
Board approvals of investment management and administration agreement and sub-advisory agreements (unaudited)
Portfolio performance—The comparative Lipper information showed that the Portfolio's performance was in the fourth quintile for the one-, three-, five- and ten-year periods and since inception. Management explained that the Portfolio's Performance Universe contains strategies that are more concentrated, making performance comparisons difficult, at best. Management further explained that, in addition, there is a range of currency exposure in the Performance Universe, from fully US dollar hedged strategies to fully un-hedged strategies, noting that fully US dollar hedged strategies may perform very differently versus un-hedged strategies. Management stated that it believes the Portfolio is best judged against its performance benchmark, which the Portfolio has outperformed by 1.65% for the one-year period, 76 basis points (i.e., 0.76%) annualized for the three-year period and 74 basis points (i.e., 0.74%) annualized for the five-year period.
Management and sub-advisory fees and expense ratios—Lipper requires a minimum of six funds for a quintile ranking. Because the expense peer group consists of five funds, including the Portfolio, a quintile ranking was not provided. The comparative Lipper information showed that the Portfolio's Contractual Management Fee, Actual Management Fee and total expenses were only 0.08%, 0.02% and 0.02% above the median, respectively, for the comparison periods utilized in the Lipper report. Management noted that, compared to the Supplemental Expense Group, consisting of three other sub-advised funds, the Portfolio's total expenses were only one basis point (i.e., 0.01%) above the median.
PACE Municipal Fixed Income Investments
In approving the Investment Management and Administration Agreement and the Sub-Advisory Agreement with Standish Mellon Asset Management Company LLC ("Standish Mellon"), the board, including the Independent Trustees, also considered the following factors:
Portfolio performance—The comparative Lipper information showed that the Portfolio's performance was in the fourth quintile for the one- and ten-year periods and since inception and in the third quintile for the three- and five year periods. Management noted that the Lipper universe has a wide range of portfolio durations, and that longer duration municipals have posted higher returns over the past few years than have shorter duration municipals. Management further noted that the Portfolio's risk-adjusted performance, taking into account the difference in duration range in the universe, appears average over a three- and five-year basis. Management also noted that municipals are a segment of the market where issue sizes are small and can be less liquid than other bonds; therefore, the market is very fragmented which contributes to performance dispersion more generally.
Management and sub-advisory fees and expense ratios—The comparative Lipper information showed that the Portfolio's Contractual Management Fee was in the third quintile, its Actual Management Fee was in the fourth quintile and its total expenses were in the fifth quintile in the Portfolio's Expense Group for the comparison periods utilized in the Lipper report. Management noted that, compared to the Supplemental Expense Group, consisting of five other sub-advised funds, the Portfolio's Actual Management Fee and total expenses were only slightly above the respective medians. Management also noted that, at the September 2012 board meeting, UBS Global AM had agreed to reduce the expense caps of this Portfolio for each share class by 3 basis points (i.e., 0.03%) effective the end of November 2012 and that, consequently, the total expense ratio reflected in the Lipper materials reflects a blended rate of the former expense caps and the current expense caps. Management further noted that for Class A shares, the expense cap prior to the end of November 2012 was 0.93% and since November 28, 2012 was 0.90%. On this basis, the Portfolio would be 3 basis points (i.e., 0.03%) above the sub-advised peer group median, which it believes is not material in such a fragmented, credit-intensive segment of the market. In light of management's explanation, the board determined that the management fee and the sub-advisory fees were satisfactory. Nonetheless, the board determined that it would continue to closely monitor the Portfolio's expenses over the next year. (See the discussion regarding the approval of the new Standish Mellon Sub-Advisory Agreement elsewhere herein.)
337
PACE Select Advisors Trust
Board approvals of investment management and administration agreement and sub-advisory agreements (unaudited)
PACE Strategic Fixed Income Investments
In approving the Investment Management and Administration Agreement and the Sub-Advisory Agreement with Pacific Investment Management Company LLC, the board, including the Independent Trustees, also considered the following factors:
Portfolio performance—The comparative Lipper information showed that the Portfolio's performance was in the first quintile for the one-, three-, five- and ten-year periods and since inception. Management noted that the Portfolio continues to perform extremely well, ranking in the first quintile for all time periods in the Lipper Intermediate Investment-Grade Debt classification.
Management and sub-advisory fees and expense ratios—The comparative Lipper information showed that the Portfolio's Contractual Management Fee, Actual Management Fee and total expenses were in the fifth quintile in the Portfolio's Expense Group for the comparison periods utilized in the Lipper report. Management noted that, compared to the Supplemental Expense Group, consisting of nine other sub-advised funds, the Portfolio's Contractual Management Fee and Actual Management Fee are both 9.5 basis points (i.e., 0.095%) above the median, and its total expenses are 15.2 basis points (0.152%) above the respective median. Management stated its view that the Portfolio was not classified in the most appropriate category, since the peers' risk and return was not consistent with that of the Portfolio. Management noted that, from a risk and portfolio positioning perspective, the Portfolio was more broadly similar to the Lipper category "Global Income," and that, when the Portfolio was compared to the three most similar funds in that category, the Portfolio's total expenses would fall close to the middle range. In light of management's explanation, the board determined that the management fee and the sub-advisory fees were satisfactory. Nonetheless, the board determined that it would continue to closely monitor the Portfolio's expenses over the next year.
PACE Money Market Investments
In approving the Investment Management and Administration Agreement, the board, including the Independent Trustees, also considered the following factors:
Portfolio performance—The comparative Lipper information showed that the Portfolio's performance was in the second quintile for the one-, three- and ten-year periods and since inception and in the third quintile for the five-year period.
Management fees and expense ratios—The comparative Lipper information showed that the Portfolio's Contractual Management Fee and Actual Management Fee were in the first quintile and its total expenses were in the third quintile in the Portfolio's Expense Group for the comparison periods utilized in the Lipper report.
Conclusion
Based on its review and, in certain instances, management's explanations upon further questioning, the board concluded that each Portfolio's investment performance was satisfactory or acceptable and that each management fee and sub-advisory fee was reasonable in light of the nature, extent and quality of the services provided to the Portfolio under the applicable Investment Management and Administration Agreement and Sub-Advisory Agreement or Sub-Advisory Agreements, respectively. However, there were certain Portfolios that the board determined to continue to closely monitor over the next year.
In light of all of the foregoing, the board approved the Investment Management and Administration Agreement for each Portfolio and, for those Portfolios with Sub-Advisors, the Sub-Advisory Agreement(s). No single factor reviewed by the board was identified by the board as the principal factor in determining whether to approve the
338
PACE Select Advisors Trust
Board approvals of investment management and administration agreement and sub-advisory agreements (unaudited)
Investment Management and Administration Agreement or, for the sub-advised Portfolios, the Sub-Advisory Agreement(s). The Independent Trustees were advised by separate independent legal counsel throughout the process. The board discussed the proposed continuance of the Investment Management and Administration Agreement and the Sub-Advisory Agreements in private sessions with their independent legal counsel at which no representatives of UBS Global AM or the Sub-Advisors were present.
339
PACE Select Advisors Trust
Supplemental information (unaudited)
Board of Trustees & Officers
The Trust is governed by a Board of Trustees which oversees the Portfolios' operations. Each Trustee serves an indefinite term of office. Officers are appointed by the trustees and serve at the pleasure of the Board. The table below shows, for each trustee and officer, his or her name, address and age, the position held with the Trust, the length of time served as a trustee or officer of the Trust, the trustee's or officer's principal occupations during the last five years, the number of portfolios in the UBS fund complex overseen by the trustee or for which a person served as an officer, and other directorships held by the trustee.
The Trust's Statement of Additional Information contains additional information about the trustees and is available, without charge, upon request by calling 1-800-647 1568.
Interested Trustees:
Name,
address,
and age | | Position(s)
held with
Trust | | Term of office1
and length of
time served | | Principal
occupation(s)
during past
5 years | | Number of
portfolios in fund
complex overseen
by trustee | | Other
directorships
held by
trustee | |
Meyer Feldberg2; 71
Morgan Stanley
1585 Broadway
36th Floor
New York, NY
10036 | | Trustee | | Since 2001 | | Professor Feldberg is Dean Emeritus and Professor of Leadership and Ethics at Columbia Business School, although on an extended leave of absence. He is also a senior advisor to Morgan Stanley (financial services) (since 2005). Professor Feldberg also serves as president of New York City Global Partners (an organization located in part of the Office of the Mayor of the City of New York that promotes interaction with other cities around the world) (since 2007). Prior to 2004, he was Dean and Professor of Management and Ethics of the Graduate School of Business at Columbia University (since 1989). | | Professor Feldberg is a director or trustee of 23 investment companies (consisting of 55 portfolios) for which UBS Global AM or one of its affiliates serves as investment advisor, sub-advisor or manager. | | Professor Feldberg is also a director of Macy's, Inc. (operator of department stores), Revlon, Inc. (cosmetics), SAPPI, Ltd. (producer of paper) and the New York City Ballet. | |
340
PACE Select Advisors Trust
Supplemental information (unaudited)
Interested Trustees (concluded):
Name,
address,
and age | | Position(s)
held with
Trust | | Term of office1
and length of
time served | | Principal
occupation(s)
during past
5 years | | Number of
portfolios in fund
complex overseen
by trustee | | Other
directorships
held by
trustee | |
Barry M. Mandinach*3; 57 | | Trustee | | Since 2010 | | Mr. Mandinach is a managing director of UBS Global Asset Management (US) Inc. and UBS Global AM (collectively, "UBS Global AM—Americas region"). He has been with UBS Global AM—Americas region or its predecessors since 2001. He is the Head of Institutional & Wholesale Business (US) (since 2009) as well as Chief Marketing Officer (US) (since 2006). | | Mr. Mandinach is a director or trustee of 13 investment companies (consisting of 45 portfolios) for which UBS Global AM serves as investment advisor or manager. | | None | |
Independent Trustees:
Richard Q. Armstrong; 78
c/o Keith Weller
Assistant Fund Secretary
UBS Global Asset Management (Americas) Inc.
1285 Avenue of the Americas,
New York, NY 10019 | | Trustee and Chairman of the Board of Trustees | | Since 2001 (Trustee) Since 2004 (Chairman of the Board of Trustees) | | Mr. Armstrong is chairman and principal of R.Q.A. Enterprises (management consulting firm) (since 1991 and principal occupation since 1995). Mr. Armstrong was president or chairman of a number of packaged goods companies (responsible for such brands as Canada Dry, Dr. Pepper, Adirondack Beverages and Moët Hennessy) (from 1982 until 1995). | | Mr. Armstrong is a director or trustee of 13 investment companies (consisting of 45 portfolios) for which UBS Global AM serves as investment advisor or manager. | | None | |
341
PACE Select Advisors Trust
Supplemental information (unaudited)
Independent Trustees (continued):
Name,
address,
and age | | Position(s)
held with
Trust | | Term of office1
and length of
time served | | Principal
occupation(s)
during past
5 years | | Number of
portfolios in fund
complex overseen
by trustee | | Other
directorships
held by
trustee | |
Alan S. Bernikow;
72
207 Benedict Ave.
Staten Island, NY
10314 | | Trustee | | Since 2005 | | Mr. Bernikow is retired. He was a consultant on non-management matters for the firm of Deloitte & Touche (international accounting and consulting firm) (from 2003 to 2007). Previously, he was deputy chief executive officer at Deloitte & Touche. | | Mr. Bernikow is a director or trustee of 13 investment companies (consisting of 45 portfolios) for which UBS Global AM serves as investment advisor or manager. | | Mr. Bernikow is also a director of Revlon, Inc. (cosmetics) (and serves as the chair of its audit committee and as the chair of its compensation committee), a director of Mack-Cali Realty Corporation (real estate investment trust) (and serves as the chair of its audit committee); and a director of the Casual Male Retail Group, Inc. (menswear) (and serves as a member of its audit committee and as a member of its nominating and corporate governance committee). He is also a director of Premier American Bank, N.A. | |
Richard R. Burt; 66
McLarty Associates
900 17th Street,
8th Floor
Washington, D.C.
20006 | | Trustee | | Since 2001 | | Mr. Burt is a managing director to McLarty Associates (a consulting firm) with which he has been employed since 2007. He was chairman of IEP Advisors (international investments and consulting firm) until 2009. Prior to 2007, he was chairman of Diligence Inc. (information and risk management firm). | | Mr. Burt is a director or trustee of 13 investment companies (consisting of 45 portfolios) for which UBS Global AM serves as investment advisor or manager. | | Mr. Burt is also a director of Central Europe & Russia Fund, Inc., European Equity Fund, Inc. and The New Germany Fund, Inc. | |
342
PACE Select Advisors Trust
Supplemental information (unaudited)
Independent Trustees (concluded):
Name,
address,
and age | | Position(s)
held with
Trust | | Term of office1
and length of
time served | | Principal
occupation(s)
during past
5 years | | Number of
portfolios in fund
complex overseen
by trustee | | Other
directorships
held by
trustee | |
Bernard H. Garil; 73
6754 Casa Grande Way
Delray Beach, FL
33446 | | Trustee | | Since 2005 | | Mr. Garil is retired (since 2001). He was a managing director at PIMCO Advisory Services (from 1999 to 2001) where he served as president of closed-end funds and vice-president of the variable insurance product funds advised by OpCap Advisors (until 2001). | | Mr. Garil is a director or trustee of 13 investment companies (consisting of 45 portfolios) for which UBS Global AM serves as investment advisor or manager. | | Mr. Garil is also a director of OFI Global Trust Company (commercial trust company), the Leukemia and Lymphoma Society (voluntary health agency) and a trustee for the Brooklyn College Foundation, Inc. (charitable foundation). | |
Heather R. Higgins; 54
255 E. 49th St.,
Suite 23D
New York, NY
10017 | | Trustee | | Since 2005 | | Ms. Higgins is the president and director of The Randolph Foundation (charitable foundation) (since 1991). Ms. Higgins also serves (or had served) on the boards of several non-profit charitable groups, including the Independent Women's Forum (chairman) and the Philanthropy Roundtable (vice chairman). She also serves on the board of the Hoover Institution (from 2001 to 2007 and since 2009). | | Ms. Higgins is a director or trustee of 13 investment companies (consisting of 45 portfolios) for which UBS Global AM serves as investment advisor or manager. | | None | |
343
PACE Select Advisors Trust
Supplemental information (unaudited)
Name,
address,
and age | | Position(s)
held with
Trust | | Term of office1
and length of
time served | | Principal occupation(s) during past 5 years;
number of portfolios in fund complex
for which person serves as officer | |
Joseph Allessie*; 48 | | Vice President and Assistant Secretary | | Since 2005 | | Mr. Allessie is an executive director (since 2007) (prior to which he was a director) and deputy general counsel (since 2005) UBS Global AM—Americas region. Mr. Allessie is a vice president and assistant secretary of 17 investment companies (consisting of 80 portfolios) for which UBS Global AM serves as investment advisor or manager. | |
Rose Ann Bubloski*; 45 | | Vice President and Assistant Treasurer | | Since 2011 | | Ms. Bubloski is a director (since 2012) (prior to which she was an associate director) and senior manager of the US mutual fund treasury administration department of UBS Global AM—Americas region. She was vice president at Cohen & Steers Capital Management, Inc. (investment manager) (from 2007 to 2008). She is vice president and assistant treasurer of 17 investment companies (consisting of 80 portfolios) for which UBS Global AM serves as investment advisor or manager. | |
Mark E. Carver*; 50 | | President | | Since 2010 | | Mr. Carver is a managing director and Head of Product Development and Management-Americas for UBS Global AM—Americas region (since 2008). In this role, he oversees product development and management for both wholesale and institutional businesses. He is a member of the Americas Management Committee (since 2008) and the Regional Operating Committee (since 2008). Prior to 2008, Mr. Carver held a number of product-related or sales responsibilities with respect to funds, advisory programs and separately managed accounts. Mr. Carver joined a predecessor of an affiliated firm in 1985 and has been with UBS Global AM—Americas region (or its affiliates) since 1996. Mr. Carver is president of 17 investment companies (consisting of 80 portfolios) for which UBS Global AM serves as investment advisor or manager. | |
Thomas Disbrow*; 47 | | Vice President and Treasurer | | Since 2000
(Vice President)
Since 2004
(Treasurer) | | Mr. Disbrow is a managing director (since 2011) (prior to which he was an executive director) (since 2007) and head of North America Fund Treasury (since 2011) of UBS Global AM—Americas region. Mr. Disbrow is a vice president and treasurer and/or principal accounting officer of 17 investment companies (consisting of 80 portfolios) for which UBS Global AM serves as investment advisor or manager. | |
Michael J. Flook*; 48 | | Vice President and Assistant Treasurer | | Since 2006 | | Mr. Flook is a director (since 2010) (prior to which he was an associate director) (since 2006) and a senior manager of the US mutual fund treasury administration department of UBS Global AM—Americas region. Mr. Flook is a vice president and assistant treasurer of 17 investment companies (consisting of 80 portfolios) for which UBS Global AM serves as investment advisor or manager. | |
344
PACE Select Advisors Trust
Supplemental information (unaudited)
Name,
address,
and age | | Position(s)
held with
Trust | | Term of office1
and length of
time served | | Principal occupation(s) during past 5 years;
number of portfolios in fund complex
for which person serves as officer | |
Christopher S. Ha*; 33 | | Vice President and Assistant Secretary | | Since 2012 | | Mr. Ha is a director and associate general counsel (since September 2012) at UBS Global AM—Americas region. Prior to joining UBS Global AM—Americas region, Mr. Ha was of counsel at Buhler, Duggal & Henry LLP (law firm)(from March 2012 to July 2012) and an associate attorney at Dechert LLP (law firm)(from 2007 to 2009). Mr. Ha is a vice president and assistant secretary of 17 investment companies (consisting of 80 portfolios) for which UBS Global AM serves as investment advisor or manager. | |
Mark F. Kemper**; 55 | | Vice President and Secretary | | Since 2004 | | Mr. Kemper is a managing director (since 2006) and head of the legal department of UBS Global AM—Americas region (since 2004). He has been secretary of UBS Global AM—Americas region (since 2004), secretary of UBS Global Asset Management Trust Company (since 1993) and secretary of UBS AM Holdings (USA) Inc. (since 2001). Mr. Kemper is vice president and secretary of 17 investment companies (consisting of 80 portfolios) for which UBS Global AM serves as investment advisor or manager. | |
Joanne M. Kilkeary*; 45 | | Vice President and Assistant Treasurer | | Since 1999 | | Ms. Kilkeary is an executive director (since March 2013) (prior to which she was a director) (since 2008) and a senior manager (since 2004) of the US mutual fund treasury administration department of UBS Global AM—Americas region. Ms. Kilkeary is a vice president and assistant treasurer of 17 investment companies (consisting of 80 portfolios) for which UBS Global AM serves as investment advisor or manager. | |
Tammie Lee*; 42 | | Vice President and Assistant Secretary | | Since 2005 | | Ms. Lee is an executive director (since 2010) (prior to which she was a director) and associate general counsel of UBS Global AM—Americas region (since 2005). Ms. Lee is a vice president and assistant secretary of 17 investment companies (consisting of 80 portfolios) for which UBS Global AM serves as investment advisor or manager. | |
Joseph McGill*; 51 | | Vice President and Chief Compliance Officer | | Since 2004 | | Mr. McGill is a managing director (since 2006) and chief compliance officer (since 2003) at UBS Global AM—Americas region. Mr. McGill is a vice president and chief compliance officer of 17 investment companies (consisting of 80 portfolios) for which UBS Global AM serves as investment advisor or manager. | |
Nancy D. Osborn*; 47 | | Vice President and Assistant Treasurer | | Since 2007 | | Mrs. Osborn is a director (since 2010) (prior to which she was an associate director) and a senior manager of the US mutual fund treasury administration department of UBS Global AM—Americas region (since 2006). Mrs. Osborn is a vice president and assistant treasurer of 17 investment companies (consisting of 80 portfolios) for which UBS Global AM serves as investment advisor or manager. | |
Robert Sabatino**; 40 | | Vice President | | Since 2001 | | Mr. Sabatino is a managing director (since 2010) (prior to which he was an executive director) (since 2007), head of US taxable money markets (since 2009), and portfolio manager of UBS Global AM—Americas region in the short duration fixed income group (since 2001). Mr. Sabatino is a vice president of six investment companies (consisting of 37 portfolios) for which UBS Global AM serves as investment advisor or manager. | |
345
PACE Select Advisors Trust
Supplemental information (unaudited)
Name,
address,
and age | | Position(s)
held with
Trust | | Term of office1
and length of
time served | | Principal occupation(s) during past 5 years;
number of portfolios in fund complex
for which person serves as officer | |
Eric Sanders*; 47 | | Vice President and Assistant Secretary | | Since 2005 | | Mr. Sanders is a director and associate general counsel of UBS Global AM—Americas region (since 2005). Mr. Sanders is a vice president and assistant secretary of 17 investment companies (consisting of 80 portfolios) for which UBS Global AM serves as investment advisor or manager. | |
Andrew Shoup*; 57 | | Vice President and Chief Operating Officer | | Since 2006 | | Mr. Shoup is a managing director and global head of the treasury administration department of UBS Global AM—Americas region (since 2006). Mr. Shoup is also a director of UBS (IRL) Fund p.l.c. (since 2008). Mr. Shoup is a vice president and chief operating officer of 17 investment companies (consisting of 80 portfolios) for which UBS Global AM serves as investment advisor or manager. | |
Keith A. Weller*; 52 | | Vice President and Assistant Secretary | | Since 2000 | | Mr. Weller is an executive director and senior associate general counsel of UBS Global AM—Americas region (since 2005) and has been an attorney with affiliated entities since 1995. Mr. Weller is a vice president and assistant secretary of 17 investment companies (consisting of 80 portfolios) for which UBS Global AM serves as investment advisor or manager. | |
Mandy Yu*; 29 | | Vice President | | Since February 2013 | | Ms. Yu is an authorized officer (since 2012) and tax compliance manager (since March 2013) of the US mutual fund treasury administration department of UBS Global AM—Americas region. She was a Fund Treasury Manager (from 2012 to March 2013) and a Mutual Fund Administrator (from 2007 to 2012) for UBS Global AM—Americas region. Ms. Yu is a vice president of 17 investment companies (consisting of 80 portfolios) for which UBS Global AM serves as investment advisor or manager. | |
1 Each trustee holds office for an indefinite term. Officers are appointed by the trustees and serve at the pleasure of the Board.
2 Professor Feldberg is deemed an "interested person" of the Trust as defined in the Investment Company Act of 1940, as amended, because he is a senior advisor to Morgan Stanley, a financial services firm with which the Trust may conduct transactions.
3 Mr. Mandinach is deemed an "interested person" of the Trust as defined in the Investment Company Act of 1940, as amended, because of his employment by UBS Global AM—Americas region.
* This person's business address is 1285 Avenue of the Americas, New York, New York 10019-6028.
** This person's business address is One North Wacker Drive, Chicago, Illinois 60606.
346
This page intentionally left blank.
347
This page intentionally left blank.
348
Trustees
Richard Q. Armstrong
Chairman
Alan S. Bernikow
Richard R. Burt | | Meyer Feldberg
Bernard H. Garil
Heather R. Higgins
Barry M. Mandinach | |
Principal Officers
Mark E. Carver
President | | Thomas Disbrow
Vice President and Treasurer | |
Mark F. Kemper
Vice President and Secretary | | | |
Investment Manager and
Administrator
UBS Global Asset Management (Americas) Inc.
1285 Avenue of the Americas
New York, New York 10019-6028
Principal Underwriter
UBS Global Asset Management (US) Inc.
1285 Avenue of the Americas
New York, New York 10019-6028
This report is not to be used in connection with the offering of shares of the Portfolios unless accompanied or preceded by an effective prospectus.
© UBS 2013. All rights reserved.
UBS Global Asset Management (Americas) Inc.
PRESORTED
STANDARD
U.S. POSTAGE
PAID
COMPUTERSHARE

UBS Global Asset Management (Americas) Inc.
1285 Avenue of the Americas
New York, NY 10019-6028

PACE® Money Market Investments
Annual Report
July 31, 2013
PACE Money Market Investments
September 14, 2013
Dear Shareholder,
Performance
For the 12 months ended July 31, 2013, the Portfolio returned 0.01% before the deduction of the maximum PACE program fee. (The Portfolio declined 1.97%, after the deduction of the maximum PACE program fee, for the same 12-month period.) Please remember that the PACE program fee is assessed outside the Portfolio at the PACE program account level. The program fee does not impact the determination of the Portfolio's net asset value per share. For comparison purposes, the median return of the Lipper Money Market Funds category was 0.01%. (Returns over various time periods are shown in the "Performance at a glance" table on page 4. Please note that the returns shown do not reflect the deduction of taxes that a shareholder would pay on Portfolio distributions.)
Advisor's comments
The Portfolio's yield remained low during the reporting period, reflecting the Federal Reserve Board's decision to maintain the federal funds rate at an extremely low level between 0% and 0.25%, which continued to depress yields on a wide range of short-term investments. (The federal funds rate, or "fed funds" rate, is the rate that banks charge one another for funds they borrow on an overnight basis) As a result, the yields
PACE Money
Market Investments
Investment Advisor:
UBS Global Asset Management (Americas) Inc.
Portfolio Manager:
Robert Sabatino
Objective:
Current income consistent with preservation of capital and liquidity.
Investment process:
The Portfolio is a money market mutual fund and seeks to maintain a stable price of $1.00 per share, although it may be possible to lose money by investing in this Portfolio. The Portfolio invests in a diversified portfolio of high-quality money market instruments of governmental and private issuers. Security selection is based on the assessment of relative values and changes in market and economic conditions.
1
PACE Money Market Investments
of the securities in which the Portfolio invests remained extremely low. In turn, this kept the Portfolio's yield low.
We tactically adjusted the Portfolio's weighted average maturity (WAM)—which is the average duration of the securities in the Portfolio—throughout the 12-month review period. When the reporting period began, the Portfolio had a WAM of 31 days. While there were concerns regarding the ongoing challenges in Europe, they were overshadowed by the Fed's third round of quantitative easing ("QE3"). Thus, in anticipation of further downward pressure on short-term interest rates with QE3, we significantly increased the Portfolio's WAM in September 2012, and ended the first six months of the reporting period with a WAM of 50 days. During the second half of the period, we pared the Portfolio's WAM and ended the fiscal year at 29 days.
At the issuer level, we maintained a high level of diversification, investing in smaller positions with the goal of reducing risk and keeping the Portfolio highly liquid. To that end, we typically purchased up to 3% in single nongovernment issuers throughout the reporting period. (The Portfolio is generally able to hold up to 5% in any one issuer, subject to certain exceptions.)
Several adjustments were made to the Portfolio's sector positioning during the 12-month period. We increased the Portfolio's exposure to certificates of deposit. Conversely, we reduced our allocations to repurchase agreements and short-term corporate obligations and, to lesser extents, commercial paper and US government and agency obligations. (Repurchase agreements are transactions in which the seller of a security agrees to buy it back at a predetermined time and price or upon demand.)
As always, we thank you for your continued support and welcome any comments or questions you may have.
2
PACE Money Market Investments
Sincerely,

| | 
| |
Mark E. Carver
President,
PACE Select Advisors Trust
Managing Director,
UBS Global Asset Management
(Americas) Inc. | | Robert Sabatino
Portfolio Manager,
PACE Money Market
Investments
Managing Director,
UBS Global Asset Management
(Americas) Inc. | |
3
PACE Money Market Investments
Performance at a glance (unaudited)
Average annual total returns for periods ended 07/31/13
| | 1 year | | 5 years | | 10 years | |
PACE Money Market Investments
before deducting maximum PACE program fee1 | | | 0.01 | % | | | 0.17 | % | | | 1.52 | % | |
PACE Money Market Investments
after deducting maximum PACE program fee1 | | | (1.97 | )% | | | (1.82 | )% | | | (0.50 | )% | |
Lipper Money Market Funds median | | | 0.01 | % | | | 0.18 | % | | | 1.47 | % | |
For PACE Money Market Investments, average annual total returns for periods ended June 30, 2013, after deduction of the maximum PACE program fee, were as follows: 1-year period, (1.97)%; 5-year period, (1.78)%; 10-year period, (0.49)%.
For PACE Money Market Investments, the 7-day current yield for the period ended July 31, 2013 was 0.01% (without maximum PACE program fee and after fee waivers and/or expense reimbursements; the yield was 0.01% before fee waivers and/or expense reimbursements). With the maximum PACE program fee, the 7-day current yield was (1.99)% after fee waivers and/or expense reimbursements; the yield was (1.99%) before fee waivers and/or expense reimbursements. The Portfolio's yield quotation more closely reflects the current earnings of the Portfolio than the total return quotation. Yields will fluctuate and reflect fee waivers and/or expense reimbursements.
1 The maximum annual PACE program fee is 2% of the value of PACE assets. Prior to June 14, 2010, the maximum annual PACE program fee was 1.5% of the value of PACE assets; however, the current maximum annual PACE program fee of 2% is reflected in the performance returns throughout all periods in the average annual total returns shown above.
Past performance does not predict future performance and the performance information provided does not reflect the deduction of taxes that a shareholder would pay on Portfolio distributions. The return of an investment will fluctuate. Performance results assume reinvestment of all dividends and capital gain distributions at net asset value on the payable dates. Current performance may be higher or lower than the performance data quoted.
Lipper peer group data calculated by Lipper Inc.; used with permission. The Lipper median is the return of the fund that places in the middle of a Lipper peer group.
An investment in PACE Money Market Investments is not insured or guaranteed by the Federal Deposit Insurance Corporation or any other government agency. Although the Portfolio seeks to preserve the value of your investment at $1.00 per share, it is possible to lose money by investing in the Portfolio.
Not FDIC Insured. May lose value. No bank guarantee.
4
PACE Money Market Investments
Understanding your Portfolio's expenses (unaudited)
As a shareholder of the Portfolio, you incur two types of costs: (1) on-going program fees; and (2) ongoing Portfolio costs, including management fees and other Portfolio expenses. This example is intended to help you understand your ongoing costs (in dollars) of investing in the Portfolio and to compare these costs with the ongoing costs of investing in other mutual funds.
The example below is based on an investment of $1,000 invested at the beginning of the period and held for the entire period, February 1, 2013 to July 31, 2013.
Actual expenses
The first line in the table below provides information about actual account values and actual expenses. You may use the information in this line, together with the amount you invested, to estimate the expenses that you paid over a period. Simply divide your account value by $1,000 (for example, an $8,600 account value divided by $1,000 = 8.6), then multiply the result by the number in the first line under the heading "Expenses paid during period" to estimate the expenses you paid on your account during this period.
Hypothetical example for comparison purposes
The second line in the table below provides information about hypothetical account values and hypothetical expenses based on the Portfolio's actual expense ratio and an assumed rate of return of 5% per year before expenses, which is not the Portfolio's actual return. The hypothetical account values and expenses may not be used to estimate your actual ending account balance or expenses you paid for the period. You may use this information to compare the ongoing costs of investing in the Portfolio and other funds. To do so, compare this 5% hypothetical example with the 5% hypothetical examples that appear in the shareholder reports of other funds.
5
PACE Money Market Investments
Understanding your Portfolio's expenses (unaudited) (concluded)
Please note that the expenses shown in the table are meant to highlight your ongoing Portfolio costs only and do not reflect any program fees. Therefore, the second line in the table is useful in comparing ongoing Portfolio costs only, and will not help you determine the relative total costs of owning different funds. In addition, if program fees were included, your costs would have been higher.
| | | Beginning
account value
February 1,
2013 | | Ending
account value
July 31,
2013 | | Expenses paid
during period1
02/01/13 to
07/31/13 | | Expense
ratio
during the
period | |
Actual | | $ | 1,000.00 | | | $ | 1,000.00 | | | $ | 0.89 | | | | 0.18 | % | |
Hypothetical (5% annual
return before expenses) | | | 1,000.00 | | | | 1,023.90 | | | | 0.90 | | | | 0.18 | | |
1 Expenses are equal to the Portfolio's annualized net expense ratios, multiplied by the average account value over the period, multiplied by 181 divided by 365 (to reflect the one-half year period).
6
PACE Money Market Investments
Portfolio statistics (unaudited)
Characteristics | | 07/31/13 | |
Net assets (mm) | | $ | 309.8 | | |
Number of holdings | | | 82 | | |
Weighted average maturity | | | 29 days | | |
Portfolio composition1 | | 07/31/13 | |
Commercial paper | | | 56.0 | % | |
Repurchase agreements | | | 16.4 | | |
Certificates of deposit | | | 14.8 | | |
US government and agency obligations | | | 12.8 | | |
Other assets less liabilities | | | (0.0 | )2 | |
Total | | | 100.0 | % | |
Top 10 holdings1 | | 07/31/13 | |
Repurchase agreement with Deutsche Bank Securities, Inc.,
0.090% due 08/01/13 | | | 9.8 | % | |
Repurchase agreement with Barclays Capital, Inc.,
0.070% due 08/01/13 | | | 6.5 | | |
BNP Paribas Finance, Inc., 0.250% due 10/09/13 | | | 2.6 | | |
Sumitomo Mitsui Banking Corp., 0.170% due 08/08/13 | | | 2.3 | | |
US Treasury Notes, 0.750% due 12/15/13 | | | 1.9 | | |
US Treasury Notes, 0.500% due 11/15/13 | | | 1.9 | | |
Norinchukin Bank, 0.160% due 08/08/13 | | | 1.9 | | |
Federal Home Loan Mortgage Corp., 0.070% due 08/26/13 | | | 1.9 | | |
Federal National Mortgage Association, 0.150% due 09/03/13 | | | 1.9 | | |
Erste Finance LLC, 0.200% due 08/01/13 | | | 1.6 | | |
Total | | | 32.3 | % | |
1 Weightings represent percentages of the Portfolio's net assets as of July 31, 2013. The Portfolio is actively managed and its composition will vary over time.
2 Amount is less than 0.05%.
7
PACE Money Market Investments
Statement of net assets—July 31, 2013
Security description | | Face
amount | | Value | |
US government and agency obligations—12.76% | |
Federal Home Loan Bank | |
0.050%, due 08/15/131 | | $ | 4,000,000 | | | $ | 3,999,922 | | |
0.125%, due 03/27/14 | | | 1,500,000 | | | | 1,499,540 | | |
Federal Home Loan Mortgage Corp. | |
0.070%, due 08/26/13*1 | | | 6,000,000 | | | | 5,999,709 | | |
Federal National Mortgage Association | |
0.150%, due 09/03/13*1 | | | 6,000,000 | | | | 5,999,175 | | |
US Treasury Bill | |
0.106%, due 08/01/131 | | | 3,000,000 | | | | 3,000,000 | | |
US Treasury Notes | |
3.125%, due 08/31/13 | | | 3,000,000 | | | | 3,007,184 | | |
0.125%, due 09/30/13 | | | 3,000,000 | | | | 2,999,625 | | |
0.500%, due 11/15/13 | | | 6,000,000 | | | | 6,005,422 | | |
0.750%, due 12/15/13 | | | 6,000,000 | | | | 6,012,543 | | |
1.000%, due 01/15/14 | | | 1,000,000 | | | | 1,003,739 | | |
Total US government and agency obligations (cost—$39,526,859) | | | | | 39,526,859 | | |
Certificates of deposit—14.85% | |
Banking-non-US—12.59% | |
Bank of Montreal | |
0.180%, due 09/04/13 | | | 3,000,000 | | | | 3,000,000 | | |
Bank of Tokyo-Mitsubishi UFJ Ltd. | |
0.200%, due 10/07/13 | | | 3,000,000 | | | | 3,000,000 | | |
Credit Agricole Corporate & Investment Bank | |
0.170%, due 08/13/13 | | | 5,000,000 | | | | 5,000,000 | | |
Credit Industriel et Commercial | |
0.160%, due 08/23/13 | | | 2,000,000 | | | | 2,000,000 | | |
0.240%, due 09/05/13 | | | 3,000,000 | | | | 3,000,000 | | |
Mizuho Corporate Bank Ltd. | |
0.160%, due 08/08/13 | | | 4,000,000 | | | | 4,000,000 | | |
Norinchukin Bank | |
0.160%, due 08/08/13 | | | 6,000,000 | | | | 6,000,000 | | |
0.160%, due 08/16/13 | | | 3,000,000 | | | | 3,000,000 | | |
Sumitomo Mitsui Banking Corp. | |
0.170%, due 08/08/13 | | | 7,000,000 | | | | 7,000,000 | | |
8
PACE Money Market Investments
Statement of net assets—July 31, 2013
Security description | | Face
amount | | Value | |
Certificates of deposit—(concluded) | |
Banking-non-US—(concluded) | |
0.170%, due 08/09/13 | | $ | 3,000,000 | | | $ | 2,999,993 | | |
| | | | 38,999,993 | | |
Banking-US—2.26% | |
Bank of America N.A. | |
0.190%, due 08/06/13 | | | 2,000,000 | | | | 2,000,000 | | |
Branch Banking & Trust Co. | |
0.190%, due 08/15/13 | | | 5,000,000 | | | | 5,000,000 | | |
| | | | 7,000,000 | | |
Total certificates of deposit (cost—$45,999,993) | | | | | 45,999,993 | | |
Commercial paper1—56.04% | |
Asset backed-miscellaneous—21.32% | |
Barton Capital LLC | |
0.180%, due 08/02/13 | | | 3,065,000 | | | | 3,064,985 | | |
Cancara Asset Securitisation LLC | |
0.170%, due 08/14/13 | | | 2,000,000 | | | | 1,999,877 | | |
0.190%, due 08/16/13 | | | 1,000,000 | | | | 999,921 | | |
0.150%, due 08/21/13 | | | 5,000,000 | | | | 4,999,583 | | |
0.190%, due 09/20/13 | | | 1,000,000 | | | | 999,736 | | |
Ciesco LLC | |
0.220%, due 09/20/13 | | | 2,000,000 | | | | 2,000,000 | | |
Gotham Funding Corp. | |
0.150%, due 08/16/13 | | | 5,000,000 | | | | 4,999,688 | | |
0.180%, due 08/20/13 | | | 1,000,000 | | | | 999,905 | | |
Jupiter Securitization Co. LLC | |
0.260%, due 09/10/13 | | | 3,000,000 | | | | 2,999,133 | | |
Liberty Street Funding LLC | |
0.080%, due 08/01/13 | | | 5,000,000 | | | | 5,000,000 | | |
0.180%, due 09/09/13 | | | 4,000,000 | | | | 3,999,220 | | |
LMA Americas LLC | |
0.180%, due 08/12/13 | | | 2,500,000 | | | | 2,499,863 | | |
0.170%, due 08/21/13 | | | 2,000,000 | | | | 1,999,811 | | |
Market Street Funding LLC | |
0.130%, due 08/23/13 | | | 3,500,000 | | | | 3,499,722 | | |
9
PACE Money Market Investments
Statement of net assets—July 31, 2013
Security description | | Face
amount | | Value | |
Commercial paper1—(continued) | |
Asset backed-miscellaneous—(concluded) | |
0.160%, due 09/10/13 | | $ | 3,000,000 | | | $ | 2,999,467 | | |
Nieuw Amsterdam Receivables Corp. | |
0.150%, due 08/13/13 | | | 5,000,000 | | | | 4,999,750 | | |
Regency Markets No. 1 LLC | |
0.150%, due 08/19/13 | | | 3,000,000 | | | | 2,999,775 | | |
0.150%, due 08/20/13 | | | 5,000,000 | | | | 4,999,604 | | |
Sheffield Receivables Corp. | |
0.200%, due 09/05/13 | | | 2,000,000 | | | | 1,999,611 | | |
Victory Receivables Corp. | |
0.150%, due 08/08/13 | | | 5,000,000 | | | | 4,999,854 | | |
0.170%, due 09/10/13 | | | 3,000,000 | | | | 2,999,433 | | |
| | | | 66,058,938 | | |
Banking-non-US—6.00% | |
Lloyds TSB Bank PLC | |
0.100%, due 08/05/13 | | | 3,000,000 | | | | 2,999,967 | | |
0.100%, due 08/07/13 | | | 5,000,000 | | | | 4,999,917 | | |
Mizuho Funding LLC | |
0.220%, due 10/01/13 | | | 5,000,000 | | | | 4,998,136 | | |
Nordea Bank AB | |
0.220%, due 11/15/13 | | | 1,000,000 | | | | 999,352 | | |
Oversea-Chinese Banking Corp., Ltd. | |
0.150%, due 08/15/13 | | | 3,615,000 | | | | 3,614,789 | | |
Westpac Securities NZ Ltd. | |
0.353%, due 01/02/142,3 | | | 1,000,000 | | | | 1,000,000 | | |
| | | | 18,612,161 | | |
Banking-US—18.07% | |
Bedford Row Funding Corp. | |
0.420%, due 12/16/13 | | | 1,500,000 | | | | 1,497,603 | | |
BNP Paribas Finance, Inc. | |
0.250%, due 10/09/13 | | | 8,000,000 | | | | 7,996,167 | | |
Erste Finance LLC | |
0.200%, due 08/01/13 | | | 5,000,000 | | | | 5,000,000 | | |
ING (US) Funding LLC | |
0.210%, due 10/22/13 | | | 1,500,000 | | | | 1,499,283 | | |
10
PACE Money Market Investments
Statement of net assets—July 31, 2013
Security description | | Face
amount | | Value | |
Commercial paper1—(continued) | |
Banking-US—(concluded) | |
National Australia Funding Delaware, Inc. | |
0.225%, due 12/09/13 | | $ | 5,000,000 | | | $ | 4,995,937 | | |
Natixis US Finance Co. LLC | |
0.110%, due 08/06/13 | | | 1,000,000 | | | | 999,985 | | |
0.170%, due 08/06/13 | | | 3,000,000 | | | | 2,999,929 | | |
Northern Pines Funding LLC | |
0.160%, due 08/19/13 | | | 2,500,000 | | | | 2,499,800 | | |
0.210%, due 09/27/13 | | | 5,000,000 | | | | 4,998,337 | | |
0.240%, due 10/01/13 | | | 2,500,000 | | | | 2,498,983 | | |
Rabobank USA Finance Corp. | |
0.245%, due 08/12/13 | | | 2,000,000 | | | | 1,999,850 | | |
Societe Generale N.A., Inc. | |
0.070%, due 08/01/13 | | | 3,000,000 | | | | 3,000,000 | | |
0.200%, due 08/01/13 | | | 5,000,000 | | | | 5,000,000 | | |
State Street Corp. | |
0.170%, due 09/03/13 | | | 3,000,000 | | | | 2,999,532 | | |
Toronto-Dominion Holdings USA, Inc. | |
0.130%, due 08/26/13 | | | 5,000,000 | | | | 4,999,549 | | |
0.170%, due 10/15/13 | | | 1,000,000 | | | | 999,646 | | |
Wells Fargo | |
0.180%, due 08/15/13 | | | 2,000,000 | | | | 1,999,860 | | |
| | | | 55,984,461 | | |
Brokerage—1.29% | |
Prudential Funding LLC | |
0.140%, due 08/22/13 | | | 4,000,000 | | | | 3,999,673 | | |
Energy-integrated—2.90% | |
CNPC Finance HK Ltd. | |
0.250%, due 08/01/13 | | | 2,000,000 | | | | 2,000,000 | | |
0.270%, due 08/05/13 | | | 2,000,000 | | | | 1,999,940 | | |
0.250%, due 08/16/13 | | | 5,000,000 | | | | 4,999,479 | | |
| | | | 8,999,419 | | |
Finance-captive automotive—2.26% | |
Toyota Motor Credit Corp. | |
0.240%, due 08/30/13 | | | 3,000,000 | | | | 2,999,420 | | |
11
PACE Money Market Investments
Statement of net assets—July 31, 2013
Security description | | Face
amount | | Value | |
Commercial paper1—(concluded) | |
Finance-captive automotive—(concluded) | |
0.170%, due 10/10/13 | | $ | 2,000,000 | | | $ | 1,999,339 | | |
0.231%, due 02/18/142 | | | 2,000,000 | | | | 2,000,000 | | |
| | | | | | 6,998,759 | | |
Finance-noncaptive diversified—0.65% | |
General Electric Capital Corp. | |
0.240%, due 10/02/13 | | | 1,000,000 | | | | 999,587 | | |
0.200%, due 12/19/13 | | | 1,000,000 | | | | 999,222 | | |
| | | | 1,998,809 | | |
Insurance-life—2.90% | |
MetLife Short Term Funding LLC | |
0.120%, due 08/19/13 | | | 4,000,000 | | | | 3,999,760 | | |
0.120%, due 08/20/13 | | | 3,000,000 | | | | 2,999,810 | | |
0.130%, due 09/26/13 | | | 2,000,000 | | | | 1,999,596 | | |
| | | | 8,999,166 | | |
Pharmaceuticals—0.65% | |
Roche Holdings, Inc. | |
0.060%, due 08/20/13 | | | 2,000,000 | | | | 1,999,937 | | |
Total commercial paper (cost—$173,651,323) | | | | | 173,651,323 | | |
Repurchase agreements—16.36% | |
Repurchase agreement dated 07/31/13 with
Barclays Capital, Inc., 0.070% due 08/01/13,
collateralized by $20,425,600 US Treasury Notes,
0.250% due 07/31/15; (value—$20,400,068);
proceeds: $20,000,039 | | | 20,000,000 | | | | 20,000,000 | | |
Repurchase agreement dated 07/31/13 with
Deutsche Bank Securities, Inc., 0.090% due 08/01/13,
collateralized by $18,963,000 Federal Home Loan
Mortgage Corp. obligations, 0.850% due 07/29/16
and $10,317,000 Federal National Mortgage
Association obligations, 5.355% due 11/24/17;
(value—$31,110,163); proceeds: $30,500,076 | | | 30,500,000 | | | | 30,500,000 | | |
12
PACE Money Market Investments
Statement of net assets—July 31, 2013
Security description | | Face
amount | | Value | |
Repurchase agreements—(concluded) | |
Repurchase agreement dated 07/31/13 with
State Street Bank and Trust Co., 0.010% due 08/01/13,
collateralized by $211,772 Federal Home Loan
Mortgage Corp. obligations, 2.100% due 10/17/22;
(value—$196,211); proceeds: $192,000 | | $ | 192,000 | | | $ | 192,000 | | |
Total repurchase agreements (cost—$50,692,000) | | | | | 50,692,000 | | |
Total investments (cost—$309,870,175 which approximates
cost for federal income tax purposes)—100.01% | | | | | 309,870,175 | | |
Liabilities in excess of other assets—(0.01)% | | | | | (28,231 | ) | |
Net assets (applicable to 309,843,709 shares of beneficial
interest outstanding equivalent to $1.00 per share)—100.00% | | | | $ | 309,841,944 | | |
Affiliated issuer activity
The table below details the Portfolio's transaction activity in an affiliated issuer during the year ended July 31, 2013. The investment manager earns a management fee from UBS Private Money Market Fund LLC. Please see the Notes to financial statements for further information.
Security
description | | Value at
07/31/12 | | Purchases
during the
year ended
07/31/13 | | Sales
during the
year ended
07/31/13 | | Value at
07/31/13 | | Net income
earned from
affiliate for the
year ended
07/31/13 | |
UBS Private Money
Market Fund LLC | | $ | — | | | $ | 15,300,000 | | | $ | 15,300,000 | | | $ | — | | | $ | 36 | | |
13
PACE Money Market Investments
Statement of net assets—July 31, 2013
Fair valuation summary
The following is a summary of the fair valuations according to the inputs used as of July 31, 2013 in valuing the Portfolio's investments:
| | | Unadjusted
quoted prices
in active
markets for
identical
investments
(Level 1) | | Other
significant
observable
inputs
(Level 2) | | Unobservable
inputs
(Level 3) | | Total | |
US government and
agency obligations | | $ | — | | | $ | 39,526,859 | | | $ | — | | | $ | 39,526,859 | | |
Certificates of deposit | | | — | | | | 45,999,993 | | | | — | | | | 45,999,993 | | |
Commercial paper | | | — | | | | 173,651,323 | | | | — | | | | 173,651,323 | | |
Repurchase agreements | | | — | | | | 50,692,000 | | | | — | | | | 50,692,000 | | |
Total | | $ | — | | | $ | 309,870,175 | | | $ | — | | | $ | 309,870,175 | | |
At July 31, 2013, there were no transfers between Level 1 and Level 2.
Issuer breakdown by country or territory of origin (unaudited)
| | | Percentage of
total investments | |
United States | | | 76.6 | % | |
Japan | | | 12.2 | | |
France | | | 3.2 | | |
China | | | 2.9 | | |
United Kingdom | | | 2.6 | | |
Singapore | | | 1.2 | | |
Canada | | | 1.0 | | |
Australia | | | 0.3 | | |
Total | | | 100.0 | % | |
Portfolio footnotes
* On September 7, 2008, the Federal Housing Finance Agency placed the Federal National Mortgage Association and the Federal Home Loan Mortgage Corporation into conservatorship, and the US Treasury guaranteed the debt issued by those organizations.
1 Rates shown are the discount rates at date of purchase.
2 Variable or floating rate security. The interest rate shown is the current rate as of July 31, 2013 and changes periodically. The maturity date reflects earlier of reset date or stated maturity date.
3 Security exempt from registration pursuant to Rule 144A under the Securities Act of 1933. This security, which represents 0.32% of net assets as of July 31, 2013, is considered liquid and may be resold in transactions exempt from registration, normally to qualified institutional buyers.
See accompanying notes to financial statements.
14
PACE Money Market Investments
Statement of operations
| | | For the
year ended
July 31, 2013 | |
Investment income: | |
Interest | | $ | 661,630 | | |
Securities lending income (includes $36 earned from an
affiliated entity) | | | 45 | | |
| | | | 661,675 | | |
Expenses: | |
Transfer agency and related services fees | | | 1,373,101 | | |
Investment management and administration fees | | | 1,139,856 | | |
Reports and notices to shareholders | | | 130,301 | | |
Professional fees | | | 99,283 | | |
State registration fees | | | 41,862 | | |
Custody and accounting fees | | | 29,434 | | |
Trustees' fees | | | 19,342 | | |
Insurance expense | | | 12,887 | | |
Other expenses | | | 26,228 | | |
| | | | 2,872,294 | | |
Fee waivers and/or expense reimbursements | | | (2,243,226 | ) | |
Net expenses | | | 629,068 | | |
Net investment income | | | 32,607 | | |
Net realized gain | | | 42 | | |
Net increase in net assets resulting from operations | | $ | 32,649 | | |
See accompanying notes to financial statements.
15
PACE Money Market Investments
Statement of changes in net assets
| | For the years ended July 31, | |
| | | 2013 | | 2012 | |
From operations: | |
Net investment income | | $ | 32,607 | | | $ | 41,391 | | |
Net realized gain | | | 42 | | | | 496 | | |
Net increase in net assets resulting
from operations | | | 32,649 | | | | 41,887 | | |
Dividends and distributions to shareholders from: | |
Net investment income | | | (32,607 | ) | | | (41,391 | ) | |
From beneficial interest transactions: | |
Net decrease in net assets from beneficial
interest transactions | | | (27,249,143 | ) | | | (28,753,080 | ) | |
Net decrease in net assets | | | (27,249,101 | ) | | | (28,752,584 | ) | |
Net assets: | |
Beginning of year | | | 337,091,045 | | | | 365,843,629 | | |
End of year | | $ | 309,841,944 | | | $ | 337,091,045 | | |
Accumulated undistributed net investment income | | $ | — | | | $ | — | | |
See accompanying notes to financial statements.
16
PACE Money Market Investments
Financial highlights
Selected data for a share of beneficial interest outstanding throughout each year is presented below:
| | | Years ended July 31, | |
| | | 2013 | | 2012 | | 2011 | | 2010 | | 2009 | |
Net asset value,
beginning of year | | $ | 1.00 | | | $ | 1.00 | | | $ | 1.00 | | | $ | 1.00 | | | $ | 1.00 | | |
Net investment income | | | 0.0001 | | | | 0.0001 | | | | 0.0001 | | | | 0.0001 | | | | 0.008 | | |
Dividends from net
investment income | | | (0.000 | )1 | | | (0.000 | )1 | | | (0.000 | )1 | | | (0.000 | )1 | | | (0.008 | ) | |
Distributions from net
realized gains | | | — | | | | — | | | | (0.000 | )1 | | | (0.000 | )1 | | | (0.000 | )1 | |
Total dividends and
distributions | | | (0.000 | )1 | | | (0.000 | )1 | | | (0.000 | )1 | | | (0.000 | )1 | | | (0.008 | ) | |
Net asset value,
end of year | | $ | 1.00 | | | $ | 1.00 | | | $ | 1.00 | | | $ | 1.00 | | | $ | 1.00 | | |
Total investment
return2 | | | 0.01 | % | | | 0.01 | % | | | 0.01 | % | | | 0.01 | % | | | 0.81 | % | |
Ratios to average
net assets: | |
Expenses before fee
waivers and/or expense
reimbursements | | | 0.88 | % | | | 0.89 | % | | | 0.88 | % | | | 0.90 | % | | | 0.89 | % | |
Expenses after fee
waivers and/or expense
reimbursements | | | 0.19 | % | | | 0.19 | % | | | 0.25 | % | | | 0.27 | % | | | 0.59 | % | |
Net investment income | | | 0.01 | % | | | 0.01 | % | | | 0.01 | % | | | 0.01 | % | | | 0.78 | % | |
Supplemental data: | |
Net assets, end of
year (000's) | | $ | 309,842 | | | $ | 337,091 | | | $ | 365,844 | | | $ | 386,217 | | | $ | 529,959 | | |
1 Amount represents less than $0.0005 per share.
2 Total investment return is calculated assuming a $10,000 investment on the first day of each year reported, reinvestment of all dividends and other distributions, if any, at net asset value on the payable dates, and a sale at net asset value on the last day of each year reported. The figures do not include program fees; results would be lower if these fees were included. Returns do not reflect the deduction of taxes that a shareholder would pay on Portfolio distributions.
See accompanying notes to financial statements.
17
PACE Money Market Investments
Notes to financial statements
Organization and significant accounting policies
PACE Money Market Investments (the "Portfolio") is a diversified portfolio of PACE Select Advisors Trust (the "Trust"), which was organized as a Delaware statutory trust under the laws of the State of Delaware by Certificate of Trust dated September 9, 1994, as amended June 9, 1995 and thereafter, and is registered with the Securities and Exchange Commission ("SEC") under the Investment Company Act of 1940, as amended (the "1940 Act"), as an open-end management investment company. The trustees of the Trust have authority to issue an unlimited number of shares of beneficial interest, par value $0.001 per share.
The Trust has fifteen Portfolios available for investment, each having its own investment objectives and policies. Shares of the Portfolio currently are available only to participants in the PACESM Select Advisors Program and the PACESM Multi Advisor Program.
The Trust accounts separately for the assets, liabilities and operations of each Portfolio. Expenses directly attributable to each Portfolio are charged to that Portfolio's operations; expenses which are applicable to all Portfolios are allocated among them on a pro rata basis.
In the normal course of business, the Portfolio may enter into contracts that contain a variety of representations or that provide indemnification for certain liabilities. The Portfolio's maximum exposure under these arrangements is unknown, as this would involve future claims that may be made against the Portfolio that have not yet occurred. However, the Portfolio has not had prior claims or losses pursuant to these contracts and expects the risk of loss to be remote.
The Portfolio attempts to maintain a stable net asset value of $1.00 per share; the Portfolio has adopted certain investment, portfolio valuation and dividend/distribution policies in an attempt to enable it to do so. As with any money market fund, there is no assurance, however, that the Portfolio will be able to maintain a stable net asset value of $1.00 per share.
18
PACE Money Market Investments
Notes to financial statements
The Financial Accounting Standards Board ("FASB") Accounting Standards Codification ("ASC") is the exclusive reference of authoritative US generally accepted accounting principles ("US GAAP") recognized by the FASB to be applied by nongovernmental entities. Rules and interpretive releases of the SEC under authority of federal laws are also sources of authoritative US GAAP for SEC registrants. The Portfolio's financial statements are prepared in accordance with US GAAP, which may require the use of management estimates and assumptions. The following is a summary of significant accounting policies:
Valuation of investments—investments are valued at amortized cost. Periodic review and monitoring of the valuation of the securities held by the Portfolio is performed in an effort to ensure that amortized cost approximates market value.
US GAAP requires disclosure surrounding the various inputs that are used in determining the value of the Portfolio's investments. These inputs are summarized into the three broad levels listed below:
Level 1—Unadjusted quoted prices in active markets for identical investments.
Level 2—Other significant observable inputs, including but not limited to, quoted prices for similar investments, interest rates, prepayment speeds and credit risks.
Level 3—Unobservable inputs inclusive of the Portfolio's own assumptions in determining the fair value of investments.
In accordance with the requirements of US GAAP, a fair value hierarchy has been included near the end of the Portfolio's Statement of net assets.
In January 2013, Accounting Standards Update 2013-01 ("ASU 2013-01"), "Clarifying the Scope of Disclosures about Offsetting Assets and Liabilities", replaced Accounting Standards Update 2011-11 ("ASU 2011-11"), "Disclosures about Offsetting Assets and Liabilities". ASU 2013-01 is effective for fiscal years beginning on or after January 1,
19
PACE Money Market Investments
Notes to financial statements
2013, and interim periods within those annual periods. ASU 2011-11 was intended to enhance disclosure requirements on the offsetting of financial assets and liabilities. ASU 2013-01 limits the scope of the new balance sheet offsetting disclosures to derivatives, repurchase agreements, and securities lending transactions to the extent that they are (1) offset in the financial statements or (2) subject to an enforceable master netting arrangement or similar agreement. Management is currently evaluating the application of ASU 2013-01 and its impact, if any, on the Fund's financial statements.
Repurchase agreements—The Portfolio may purchase securities or other obligations from a bank or securities dealer (or its affiliate), subject to the seller's agreement to repurchase them at an agreed upon date (or upon demand) and price. The Portfolio maintains custody of the underlying obligations prior to their repurchase, either through its regular custodian or through a special "tri-party" custodian or sub-custodian that maintains a separate account for both the Portfolio and its counterparty. The underlying collateral is valued daily in an effort to ensure that the value, including accrued interest, is at least equal to the repurchase price. In the event of default of the obligation to repurchase, the Portfolio generally has the right to liquidate the collateral and apply the proceeds in satisfaction of the obligation. Repurchase agreements involving obligations other than US government securities (such as commercial paper, corporate bonds, equities and mortgage loans) may be subject to special risks and may not have the benefit of certain protections in the event of counterparty insolvency. Moreover, repurchase agreements secured by obligations that are not eligible for direct investment under Rule 2a-7 under the Investment Company Act or a Portfolio's investment strategies and limitations, may require the Portfolio to promptly dispose of such collateral if the seller or guarantor becomes insolvent. If the seller (or seller's guarantor, if any) becomes insolvent, the Portfolio may suffer delays, costs and possible losses in connection with the disposition or retention of the collateral. Under certain circumstances, in the event of default or bankruptcy by the other party to the agreement, realization and/or retention of the collateral may be subject to legal proceedings. The Portfolio may participate in joint repurchase agreement transactions
20
PACE Money Market Investments
Notes to financial statements
with other funds managed, advised or sub-advised by UBS Global Asset Management (Americas) Inc. ("UBS Global AM").
Under certain circumstances, the Portfolio may engage in a repurchase agreement transaction with a yield of zero in order to invest cash amounts remaining in its portfolio at the end of the day in order to avoid having the Portfolio assessed a fee for uninvested cash held in a business account at a bank.
Investment transactions and investment income—Investment transactions are recorded on the trade date. Realized gains and losses from investment transactions are calculated using the identified cost method. Interest income is recorded on an accrual basis. Discounts are accreted and premiums are amortized as adjustments to interest income and the identified cost of investments.
Dividends and distributions—Dividends and distributions to shareholders are recorded on the ex-dividend date. The amount of dividends and distributions is determined in accordance with federal income tax regulations, which may differ from US GAAP. These "book/tax" differences are either considered temporary or permanent in nature. To the extent these differences are permanent in nature, such amounts are reclassified within the capital accounts based on their federal tax-basis treatment; temporary differences do not require reclassification.
Concentration of risk—The ability of the issuers of debt securities held by the Portfolio to meet their obligations may be affected by economic and political developments particular to a specific industry, country, state or region.
Investment management and administration fees and other transactions with affiliates—The Portfolio's Board of Trustees has approved an investment management and administration contract ("Management Contract") with UBS Global AM. In accordance with the Management Contract, the Portfolio pays UBS Global AM an investment management and administration fee, which is accrued daily
21
PACE Money Market Investments
Notes to financial statements
and paid monthly, at an annual rate of 0.35% of the Portfolio's average daily net assets. At July 31, 2013, the Portfolio is owed $27,073 from UBS Global AM, representing investment management and administration fees net of fee waivers/expense reimbursements.
UBS Global AM has contractually undertaken to waive a portion of the Portfolio's investment management and administration fees and/or reimburse a portion of the Portfolio's other expenses, when necessary, to maintain the total ordinary annual operating expenses (excluding dividend expense, borrowing costs and interest expense, if any) through November 30, 2013 at a level not to exceed 0.60%. The Portfolio will make a payment to UBS Global AM for any previously waived fees/reimbursed expenses during the following three fiscal years to the extent that operating expenses are otherwise below the expense cap.
At July 31, 2013, the Portfolio had remaining fee waivers/expense reimbursements subject to repayment to UBS Global AM and respective dates of expiration as follows:
Fee waivers/expense
reimbursements
subject to repayment | | Expires
July 31,
2014 | | Expires
July 31,
2015 | | Expires
July 31,
2016 | |
$ | 3,090,058 | | | $ | 996,232 | | | $ | 1,175,570 | | | $ | 918,256 | | |
UBS Global AM may voluntarily waive fees and/or reimburse expenses from time to time in the event that the Portfolio's yield falls below a certain level. Once started, there is no guarantee that UBS Global AM would continue to voluntarily waive an additional portion of its fees and/or reimburse expenses. This management fee waiver will not be subject to future recoupment. For the year ended July 31, 2013, UBS Global AM voluntarily waived and/or reimbursed expenses of $1,285,806 for that purpose.
For the year ended July 31, 2013, UBS Global AM waived fees/reimbursed expenses, in total, of $2,204,062.
22
PACE Money Market Investments
Notes to financial statements
Under normal conditions, the Portfolio invests cash collateral from securities lending activities into an affiliated private money market fund, UBS Private Money Market Fund LLC ("Private Money Market"), which operates in compliance with most of the substantive provisions of Rule 2a-7 of the 1940 Act. Private Money Market is managed by UBS Global AM and is currently offered as a cash management option to mutual funds and certain other accounts managed by the Portfolio's Investment Manager. UBS Global AM acts as managing member and receives a management fee from Private Money Market payable monthly in arrears at the annual rate of 0.10% of Private Money Market's average daily members' equity, minus the aggregate operating expenses of, and incurred by, Private Money Market during each such related month, not including investment expenses (including brokerage commissions, taxes, interest charges and other costs with respect to transactions in securities) and extraordinary expenses including litigation expenses, if any. UBS Global AM may, in its sole discretion, waive all or any portion of the management fee to which it may be entitled from time to time in order to maintain operating expenses at a certain level. Distributions received from Private Money Market, net of fee rebates paid to borrowers, are reflected as securities lending income in the Statement of operations.
Additional information regarding compensation to affiliate of a board member
Professor Meyer Feldberg serves as a senior advisor to Morgan Stanley, a financial services firm with which the Portfolio may conduct transactions, resulting in him being an interested trustee of the Portfolio. The Portfolio has been informed that Professor Feldberg's role at Morgan Stanley does not involve matters directly affecting any UBS funds. Portfolio transactions are executed through Morgan Stanley based on that firm's ability to provide best execution of the transactions. During the year ended July 31, 2013, the Portfolio purchased and sold certain securities (e.g., fixed income securities) in principal trades with Morgan Stanley, having an aggregate value of $95,805,334. Morgan Stanley received compensation in connection with these trades, which may have been in the form of a "mark-up" or "mark-down" of the price of the securities, a fee from the issuer for maintaining a commercial paper program, or some other form of compensation. Although the precise amount of this compensation is not
23
PACE Money Market Investments
Notes to financial statements
generally known by the Portfolio's investment manager, it is believed that under normal circumstances it represents a small portion of the total value of the transactions.
Transfer agency and related services fees
UBS Financial Services Inc. provides certain services to the Portfolio pursuant to a delegation of authority from BNY Mellon Investment Servicing (US) Inc. ("BNY Mellon"), the Portfolio's transfer agent, and is compensated for these services by BNY Mellon, not the Portfolio.
Effective July 1, 2013, UBS Financial Services Inc. voluntarily agreed to waive a portion of the fee that it would otherwise have received from BNY Mellon with respect to PACE Money Market Investments so that BNY Mellon would correspondingly reduce the fees it would have charged to that Portfolio. Given that UBS Global AM has voluntarily undertaken to reduce its fees and/or reimburse expenses to keep the Portfolio's yield at or above a certain level, and that such amount exceeds the reduction in BNY Mellon's fees, the net effect of BNY Mellon's pass through of the waiver by UBS Financial Services Inc. is to partially reduce the amount that UBS Global AM would have otherwise voluntarily waived/reimbursed. For the period July 1, 2013, to July 31, 2013, the amount of the reduction in transfer agency and related services fees charged by BNY Mellon to the Portfolio was $39,164, which reflected an equal amount of compensation that was voluntarily waived by UBS Financial Services Inc. Voluntary fee waiver/expense reimbursement arrangements may end at any time.
For the year ended July 31, 2013, UBS Financial Services Inc. received from BNY Mellon, not the Portfolio, $682,529 of the total transfer agency and related services fees paid by the Portfolio to BNY Mellon.
Securities lending
The Portfolio may lend securities up to 331/3% of its total assets to qualified broker-dealers or institutional investors. The loans are secured at all times by cash, US government securities or irrevocable letters of credit in an amount at least equal to the market value of the securities loaned, plus accrued interest and dividends, determined on a daily basis and adjusted accordingly. The Portfolio will regain ownership of loaned securities to
24
PACE Money Market Investments
Notes to financial statements
exercise certain beneficial rights; however, the Portfolio may bear the risk of delay in recovery of, or even loss of rights in, the securities loaned should the borrower fail financially. The Portfolio receives compensation for lending its securities from interest or dividends earned on the cash, US government securities or irrevocable letters of credit held as collateral, net of fee rebates paid to the borrower plus reasonable administrative and custody fees. State Street Bank and Trust Company serves as the Portfolio's lending agent. At July 31, 2013, there were no borrowings outstanding.
Other liabilities and components of net assets
At July 31, 2013, the Portfolio had the following liabilities outstanding:
Payable for shares of beneficial interest repurchased | | $ | 459,893 | | |
Payable to custodian | | | 7,214 | | |
Dividends payable to shareholders | | | 1,412 | | |
Other accrued expenses* | | | 186,130 | | |
* Excludes investment management and administration fees.
At July 31, 2013, the components of net assets were as follows:
Accumulated paid in capital | | $ | 309,843,419 | | |
Accumulated net realized loss | | | (1,475 | ) | |
Net assets | | $ | 309,841,944 | | |
Shares of beneficial interest
There is an unlimited amount of $0.001 par value shares of beneficial interest authorized. Transactions in shares of beneficial interest, at $1.00 per share, were as follows:
| | | Years ended July 31, | |
| | | 2013 | | 2012 | |
Shares sold | | | 350,456,561 | | | | 494,925,726 | | |
Shares repurchased | | | (377,723,554 | ) | | | (523,702,775 | ) | |
Dividends reinvested | | | 17,850 | | | | 23,969 | | |
Net decrease in shares outstanding | | | (27,249,143 | ) | | | (28,753,080 | ) | |
25
PACE Money Market Investments
Notes to financial statements
Federal tax status
The Portfolio intends to distribute substantially all of its income and to comply with the other requirements of the Internal Revenue Code applicable to regulated investment companies. Accordingly, no provision for federal income taxes is required. In addition, by distributing during each calendar year substantially all of its net investment income, net realized capital gains and certain other amounts, if any, the Portfolio intends not to be subject to a federal excise tax.
The tax character of distributions paid to shareholders by the Portfolio during the fiscal years ended July 31, 2013 and July 31, 2012 was ordinary income.
At July 31, 2013 the components of accumulated earnings on a tax basis were accumulated realized capital and other losses of $63.
On December 31, 2010, the Regulated Investment Company Modernization Act of 2010 (the "Act") was enacted, which changed various technical rules governing the tax treatment of regulated investment companies. The changes are generally effective for taxable years beginning after the date of enactment. One of the more prominent changes addresses capital loss carryforwards. Under the Act, the Portfolio will be permitted to carry forward capital losses incurred in taxable years beginning after the date of enactment for an unlimited period. However, any losses incurred during those future taxable years will be required to be utilized prior to the losses incurred in pre-enactment taxable years, which carry an expiration date. As a result of this ordering rule, pre-enactment capital loss carryforwards may be more likely to expire unused. Additionally, post-enactment capital loss carryforwards will retain their character as either short-term or long-term capital losses rather than being considered all short-term as permitted under previous regulation.
At July 31, 2013, the Portfolio had post-enactment short-term capital loss carryforwards of $98 and the following pre-enactment capital loss
26
PACE Money Market Investments
Notes to financial statements
carryforwards through the indicated expiration dates for federal income tax purposes available to offset future capital gains:
| | | Expiration dates | | | |
Portfolio | | July 31,
2018 | | July 31,
2019 | | Total | |
PACE Money Market Investments | | $ | 94 | | | $ | 23 | | | $ | 117 | | |
During the current year, the Portfolio utilized $42 of post-enactment capital loss carryforwards to offset current year net realized gains.
As of and during the year ended July 31, 2013, the Portfolio did not have any liabilities for any uncertain tax positions. The Portfolio recognizes interest and penalties, if any, related to uncertain tax positions as income tax expense in the Statement of operations. During the year ended July 31, 2013, the Portfolio did not incur any interest or penalties related to uncertain tax positions.
Each of the tax years in the four year period ended July 31, 2013, remains subject to examination by the Internal Revenue Service and state taxing authorities.
27
PACE Money Market Investments
Report of Ernst & Young LLP, independent registered public accounting firm
The Board of Trustees and Shareholders of
PACE Select Advisors Trust
We have audited the accompanying statement of net assets of PACE Money Market Investments (one of the series comprising PACE Select Advisors Trust) (the "Portfolio") as of July 31, 2013, and the related statement of operations for the year then ended, the statement of changes in net assets for each of the two years in the period then ended, and the financial highlights for each of the five years in the period then ended. These financial statements and financial highlights are the responsibility of the Portfolio's management. Our responsibility is to express an opinion on these financial statements and financial highlights based on our audits.
We conducted our audits in accordance with the standards of the Public Company Accounting Oversight Board (United States). Those standards require that we plan and perform the audit to obtain reasonable assurance about whether the financial statements and financial highlights are free of material misstatement. We were not engaged to perform an audit of the Portfolio's internal control over financial reporting. Our audits included consideration of internal control over financial reporting as a basis for designing audit procedures that are appropriate in the circumstances, but not for the purpose of expressing an opinion on the effectiveness of the Portfolio's internal control over financial reporting. Accordingly, we express no such opinion. An audit also includes examining, on a test basis, evidence supporting the amounts and disclosures in the financial statements and financial highlights, assessing the accounting principles used and significant estimates made by management, and evaluating the overall financial statement presentation. Our procedures included confirmation of securities owned as of July 31, 2013, by correspondence with the custodian and others. We believe that our audits provide a reasonable basis for our opinion.
In our opinion, the financial statements and financial highlights referred to above present fairly, in all material respects, the financial position of PACE Money Market Investments at July 31, 2013, the results of its
28
PACE Money Market Investments
Report of Ernst & Young LLP, independent registered public accounting firm (concluded)
operations for the year then ended, the changes in its net assets for each of the two years in the period then ended, and the financial highlights for each of the five years in the period then ended, in conformity with US generally accepted accounting principles.

New York, New York
September 27, 2013
29
PACE Money Market Investments
General information (unaudited)
Monthly and quarterly portfolio holdings disclosure
The Portfolio will file its complete schedule of portfolio holdings with the Securities and Exchange Commission ("SEC") for the first and third quarters of each fiscal year on Form N-Q. The Portfolio's Forms N-Q are available on the SEC's Web site at http://www.sec.gov. The Portfolio's Forms N-Q may be reviewed and copied at the SEC's Public Reference Room in Washington, D.C. Information on the operation of the SEC's Public Reference Room may be obtained by calling 1-800-SEC 0330. Additionally, you may obtain copies of Forms N-Q from the Portfolio upon request by calling 1-800-647 1568.
In addition, the Portfolio discloses, on a monthly basis: (a) a complete schedule of its portfolio holdings; and (b) information regarding its weighted average maturity and weighted average life on UBS's Web site at the following internet address: www.ubs.com/usmoneymarketfundsholdings. In addition, at this location, you will find a link to more detailed Portfolio information appearing in filings with the SEC on Form N-MFP.
Proxy voting policies, procedures and record
You may obtain a description of the Portfolio's (1) proxy voting policies, (2) proxy voting procedures and (3) information regarding how the Portfolio voted any proxies related to portfolio securities during the most recent 12-month period ended June 30 for which an SEC filing has been made, without charge, upon request by contacting the Portfolio directly at 1-800-647 1568, online on the Portfolio's Web site: www.ubs.com/ubsglobalam-proxy, or on the EDGAR Database on the SEC's Web site (http://www.sec.gov).
30
PACE Money Market Investments
Board approval of investment management and administration agreement (unaudited)
Background—At a meeting of the board of PACE Select Advisors Trust (the "Trust") on July 16-17, 2013, the members of the board, including the trustees who are not "interested persons" of the Trust ("Independent Trustees"), as defined in the Investment Company Act of 1940, as amended (the "1940 Act"), considered and approved the continuance of the investment management and administration agreement (the "Investment Management and Administration Agreement") between UBS Global Asset Management (Americas) Inc. ("UBS Global AM") and the Trust, on behalf of PACE Money Market Investments (the "Portfolio"). In preparing for the meeting, the board members had requested and received extensive information from UBS Global AM to assist them, including performance and expense information for other investment companies with similar investment objectives as the Portfolio. Independent Trustees discussed the materials initially provided by management amongst themselves on several occasions prior to the scheduled board meeting, and independent legal counsel participated in several such discussions. The Independent Trustees also met in executive session with their independent legal counsel to review the presentation that had been made to them at the meeting. At these sessions, the Independent Trustees were joined by their independent legal counsel. The Independent Trustees also received a memorandum from their independent legal counsel discussing the duties of board members in considering approval of management, administration and distribution agreements.
In its consideration of the approval of the Investment Management and Administration Agreement, the board considered the following factors:
Nature, extent and quality of the services under the Investment Management and Administration Agreement—The board received and considered information regarding the nature, extent and quality of management services provided to the Portfolio by UBS Global AM. The board also considered the nature, extent and quality of administrative, distribution, and shareholder services performed by UBS Global AM and its affiliates for the Portfolio and
31
PACE Money Market Investments
Board approval of investment management and administration agreement (unaudited)
the resources devoted to, and the record of compliance with, the Portfolio's compliance policies and procedures. The board noted that it received information at regular meetings throughout the year regarding the services rendered by UBS Global AM concerning the management of the Portfolio's affairs and UBS Global AM's role in coordinating providers of other services to the Portfolio. The board's evaluation of the services provided by UBS Global AM took into account the board's knowledge and familiarity gained as board members of funds in the UBS New York fund complex, including the scope and quality of UBS Global AM's investment management and other capabilities and the quality of its administrative and other services. The board observed that the scope of services provided by UBS Global AM had expanded over time as a result of regulatory and other developments, including maintaining and monitoring its own and the Portfolio's expanded compliance programs.
The board had available to it the qualifications, backgrounds and responsibilities of the senior personnel at UBS Global AM responsible for the Portfolio and had previously received information regarding the person primarily responsible for the day-to-day portfolio management of the Portfolio and recognized that the Portfolio's senior personnel at UBS Global AM report to the board regularly and that at each regular meeting the board receives a detailed report on the Portfolio's performance. The board also considered, based on its knowledge of UBS Global AM and its affiliates, the financial resources available to UBS Global AM and its parent organization, UBS AG. In that regard, the board received extensive financial information regarding UBS Global AM and noted that it was a wholly owned, indirect subsidiary of one of the largest financial services firms in the world. It was also noted that UBS Global AM had approximately $159 billion in assets under management as of March 31, 2013 and was part of the UBS Global Asset Management Division, which had approximately $632 billion in assets under management worldwide as of March 31, 2013. The board was also cognizant of, and considered, the regulatory and litigation actions and investigations occurring in the past few years involving UBS AG, UBS Global AM and certain of their affiliates.
32
PACE Money Market Investments
Board approval of investment management and administration agreement (unaudited)
The board concluded that, overall, it was satisfied with the nature, extent and quality of services provided (and expected to be provided) to the Portfolio under the Investment Management and Administration Agreement.
Management fees and expense ratios—The board reviewed and considered the contractual management fee (the "Contractual Management Fee") payable by the Portfolio to UBS Global AM in light of the nature, extent and quality of the management and administrative services provided by UBS Global AM. The board also reviewed and considered the fee waiver and/or expense reimbursement arrangements for the Portfolio and considered the actual fee rate (after taking any waivers and reimbursements into account) (the "Actual Management Fee"). The board considered that UBS Global AM had entered into an agreement with the Portfolio under which UBS Global AM was contractually obligated to waive its management fees and/or reimburse the Portfolio so that the total ordinary operating expenses of the Portfolio through November 30, 2013 (excluding certain miscellaneous items) would not exceed a specified limit. The board also considered that the Portfolio had agreed to repay UBS Global AM for those waived fees and/or reimbursed expenses if the Portfolio can do so during a three-year period following July 31, 2012 without causing its expenses in any of those years to exceed the expense cap. Additionally, the board received and considered information comparing the Portfolio's Contractual Management Fee, Actual Management Fee and overall expenses with those of funds in a group of funds selected and provided by Lipper, an independent provider of investment company data (the "Expense Group").
In connection with its consideration of the Portfolio's management fees, the board also received information from UBS Global AM with respect to fees paid by institutional or separate accounts; however, in management's view, such fee information was not very relevant to the Portfolio because, among other reasons, separately managed and institutional accounts with a "cash" mandate (a) were not
33
PACE Money Market Investments
Board approval of investment management and administration agreement (unaudited)
subject to all of the constraints of Rule 2a-7 under the 1940 Act to which the Portfolio is subject and (b) do not involve the management responsibilities attendant to the operation of a 1940 Act regulated fund, and, therefore, were not totally comparable. The board also received information on fees charged to other mutual funds managed by UBS Global AM.
The comparative Lipper information showed that the Portfolio's Contractual Management Fee and Actual Management Fee were in the first quintile and its total expenses were in the third quintile in the Portfolio's Expense Group for the comparison periods utilized in the Lipper report. (The first quintile represents that 20% of the funds in the Expense Group with the lowest fees or expenses, as applicable, and the fifth quintile represents that 20% of the funds in the Expense Group with the highest fees or expenses, as applicable.) It was noted that the Portfolio's total expenses were below the median for the Expense Group.
In light of the foregoing, the board determined that the proposed contractual management fee payable by the Portfolio to UBS Global AM was reasonable in light of the nature, extent and quality of services expected to be provided to the Portfolio under the Investment Management and Administration Agreement.
Portfolio performance—The board received and considered (a) annualized total return information of the Portfolio compared to other funds (the "Performance Universe") selected by Lipper over the one-, three-, five-, ten-year and since inception periods ended April 30, 2013 and (b) annualized performance information for each year in the ten-year period ended April 30, 2013. The board was provided with a description of the methodology Lipper used to determine the similarity of the Portfolio with the funds included in its Performance Universe. The board also noted that it had received information throughout the year at periodic intervals with respect to the Portfolio's performance.
34
PACE Money Market Investments
Board approval of investment management and administration agreement (unaudited)
The comparative Lipper information showed that the Portfolio's performance was in the second quintile for the one-, three- and ten-year periods and since inception and in the third quintile for the five-year period. (The first quintile represents that 20% of the funds in the Performance Universe with the best relative performance, and the fifth quintile represents that 20% of the funds in the Performance Universe with the worst relative performance.) Based on its review of the Portfolio, the board concluded that the Portfolio's investment performance was acceptable.
Advisor profitability—The board received and considered a profitability analysis of UBS Global AM and its affiliates in providing services to the Portfolio. The board also received profitability information with respect to the UBS New York fund complex as a whole. UBS Global AM's profitability was considered not excessive in light of the nature, extent and quality of the services provided to the Portfolio.
Economies of scale—The board received and considered information from management regarding whether UBS Global AM realized economies of scale as the Portfolio's assets grew, whether the Portfolio has appropriately benefited from any economies of scale, and whether there is potential for realization of any further economies of scale for the Portfolio. The board considered whether economies of scale in the provision of services to the Portfolio were being passed along to the shareholders. The board noted that the Portfolio's Contractual Management Fee did not contain breakpoints. However, the board also noted that to the extent the Portfolio's assets increase over time, it will realize economies of scale as certain expenses, such as fees for trustees, auditor and legal fees and printing and postage, become a smaller percentage of overall assets.
In light of UBS Global AM's profitability data, the Actual Management Fee and the Contractual Management Fee, the board believed that UBS Global AM's sharing of potential and current economies of scale with the Portfolio was acceptable.
35
PACE Money Market Investments
Board approval of investment management and administration agreement (unaudited)
Other benefits to UBS Global AM—The board considered other benefits received by UBS Global AM and its affiliates as a result of its relationship with the Portfolio, including the opportunity to offer additional products and services to Portfolio shareholders. In light of the costs of providing investment management, administrative and other services to the Portfolio and UBS Global AM's ongoing commitment to the Portfolio, the profits and other ancillary benefits that UBS Global AM and its affiliates received were considered reasonable.
In light of all of the foregoing, the board approved the Investment Management and Administration Agreement for the Portfolio. No single factor reviewed by the board was identified by the board as the principal factor in determining whether to approve the Investment Management and Administration Agreement. The Independent Trustees were advised by separate independent legal counsel throughout the process. The board discussed the proposed continuance of the Investment Management and Administration Agreement in private sessions with their independent legal counsel at which no representatives of UBS Global AM were present.
36
This page intentionally left blank.
37
PACE Money Market Investments
Supplemental information (unaudited)
Board of Trustees & Officers
The Trust is governed by a Board of Trustees which oversees the Portfolios' operations. Each Trustee serves an indefinite term of office. Officers are appointed by the trustees and serve at the pleasure of the Board. The table below shows, for each trustee and officer, his or her name, address and age, the position held with the Trust, the length of time served as a trustee or officer of the Trust, the trustee's or officer's principal occupations during the last five years, the number of portfolios in the UBS fund complex overseen by the trustee or for which a person served as an officer, and other directorships held by the trustee.
The Trust's Statement of Additional Information contains additional information about the trustees and is available, without charge, upon request by calling 1-800-647 1568.
Interested Trustees
| Name, address, and age | | Position(s)
held with
Trust | | Term of office1
and length of time served | |
Principal occupation(s)
during past 5 years | | Number of
portfolios in fund complex
overseen by trustee | | Other directorships
held by trustee | |
Meyer Feldberg2; 71
Morgan Stanley
1585 Broadway
36th Floor
New York, NY 10036 | | Trustee | | Since 2001 | | Professor Feldberg is Dean Emeritus and Professor of Leadership and Ethics at Columbia Business School, although on an extended leave of absence. He is also a senior advisor to Morgan Stanley (financial services) (since 2005). Professor Feldberg also serves as president of New York City Global Partners (an organization located in part of the Office of the Mayor of the City of New York that promotes interaction with other cities around the world) (since 2007). Prior to 2004, he was Dean and Professor of Management and Ethics of the Graduate School of Business at Columbia University (since 1989). | | Professor Feldberg is a director or trustee of 23 investment companies (consisting of 55 portfolios) for which UBS Global AM or one of its affiliates serves as investment advisor, sub-advisor or manager. | | Professor Feldberg is also a director of Macy's, Inc. (operator of department stores), Revlon, Inc. (cosmetics), SAPPI, Ltd. (producer of paper) and the New York City Ballet. | |
38
PACE Money Market Investments
Supplemental information (unaudited)
39
PACE Money Market Investments
Supplemental information (unaudited)
Interested Trustees (concluded)
| Name, address, and age | | Position(s)
held with
Trust | | Term of office1
and length of time served | |
Principal occupation(s)
during past 5 years | | Number of
portfolios in fund complex
overseen by trustee | | Other directorships
held by trustee | |
| Barry M. Mandinach*3; 57 | | Trustee | | Since 2010 | | Mr. Mandinach is a managing director of UBS Global Asset Management (US) Inc. and UBS Global AM (collectively, "UBS Global AM—Americas region"). He has been with UBS Global AM—Americas region or its predecessors since 2001. He is the Head of Institutional & Wholesale Business (US) (since 2009) as well as Chief Marketing Officer (US) (since 2006). | | Mr. Mandinach is a director or trustee of 13 investment companies (consisting of 45 portfolios) for which UBS Global AM serves as investment advisor or manager. | | None | |
Independent Trustees
| Name, address, and age | | Position(s)
held with
Trust | | Term of office1
and length of time served | |
Principal occupation(s)
during past 5 years | | Number of
portfolios in fund complex
overseen by trustee | | Other directorships
held by trustee | |
Richard Q. Armstrong; 78
c/o Keith Weller
Assistant Fund Secretary
UBS Global Asset Management (Americas) Inc.
1285 Avenue of the Americas
New York, NY, 10019 | | Trustee and Chairman of the Board of Trustees | | Since 2001 (Trustee) Since 2004 (Chairman of the Board of Trustees) | | Mr. Armstrong is chairman and principal of R.Q.A. Enterprises (management consulting firm) (since 1991 and principal occupation since 1995). Mr. Armstrong was president or chairman of a number of packaged goods companies (responsible for such brands as Canada Dry, Dr. Pepper, Adirondack Beverages and Moët Hennessy) (from 1982 until 1995). | | Mr. Armstrong is a director or trustee of 13 investment companies (consisting of 45 portfolios) for which UBS Global AM serves as investment advisor or manager. | | None | |
40
PACE Money Market Investments
Supplemental information (unaudited)
41
PACE Money Market Investments
Supplemental information (unaudited)
Independent Trustees (continued)
| Name, address, and age | | Position(s)
held with
Trust | | Term of office1
and length of time served | |
Principal occupation(s)
during past 5 years | | Number of
portfolios in fund complex
overseen by trustee | | Other directorships
held by trustee | |
Alan S. Bernikow; 72
207 Benedict Ave.
Staten Island, NY 10314 | | Trustee | | Since 2005 | | Mr. Bernikow is retired. He was a consultant on non-management matters for the firm of Deloitte & Touche (international accounting and consulting firm) (from 2003 to 2007). Previously, he was deputy chief executive officer at Deloitte & Touche. | | Mr. Bernikow is a director or trustee of 13 investment companies (consisting of 45 portfolios) for which UBS Global AM serves as investment advisor or manager. | | Mr. Bernikow is also a director of Revlon, Inc. (cosmetics) (and serves as the chair of its audit committee and as the chair of its compensation committee), a director of Mack-Cali Realty Corporation (real estate investment trust) (and serves as the chair of its audit committee); and a director of the Casual Male Retail Group, Inc. (menswear) (and serves as a member of its audit committee and as a member of its nominating and corporate governance committee). He is also a director of Premier American Bank, N.A. | |
Richard R. Burt; 66
McLarty Associates
900 17th Street, 8th Floor
Washington, D.C. 20006 | | Trustee | | Since 2001 | | Mr. Burt is a managing director to McLarty Associates (a consulting firm) with which he has been employed since 2007. He was chairman of IEP Advisors (international investments and consulting firm) until 2009. Prior to 2007, he was chairman of Diligence Inc. (information and risk management firm). | | Mr. Burt is a director or trustee of 13 investment companies (consisting of 45 portfolios) for which UBS Global AM serves as investment advisor or manager. | | Mr. Burt is also a director of Central Europe & Russia Fund, Inc., European Equity Fund, Inc. and The New Germany Fund, Inc. | |
42
PACE Money Market Investments
Supplemental information (unaudited)
43
PACE Money Market Investments
Supplemental information (unaudited)
Independent Trustees (concluded)
| Name, address, and age | | Position(s)
held with
Trust | | Term of office1
and length of time served | |
Principal occupation(s)
during past 5 years | | Number of
portfolios in fund complex
overseen by trustee | | Other directorships
held by trustee | |
Bernard H. Garil; 73
6754 Casa Grande Way
Delray Beach, FL 33446 | | Trustee | | Since 2005 | | Mr. Garil is retired (since 2001). He was a managing director at PIMCO Advisory Services (from 1999 to 2001) where he served as president of closed-end funds and vice-president of the variable insurance product funds advised by OpCap Advisors (until 2001). | | Mr. Garil is a director or trustee of 13 investment companies (consisting of 45 portfolios) for which UBS Global AM serves as investment advisor or manager. | | Mr. Garil is also a director of OFI Global Trust Company (commercial trust company), the Leukemia and Lymphoma Society (voluntary health agency) and a trustee for the Brooklyn College Foundation, Inc. (charitable foundation). | |
Heather R. Higgins; 54
255 E. 49th St., Suite 23D
New York, NY 10017 | | Trustee | | Since 2005 | | Ms. Higgins is the president and director of The Randolph Foundation (charitable foundation) (since 1991). Ms. Higgins also serves (or had served) on the boards of several non-profit charitable groups, including the Independent Women's Forum (chairman) and the Philanthropy Roundtable (vice chairman). She also serves on the board of the Hoover Institution (from 2001 to 2007 and since 2009). | | Ms. Higgins is a director or trustee of 13 investment companies (consisting of 45 portfolios) for which UBS Global AM serves as investment advisor or manager. | | None | |
44
PACE Money Market Investments
Supplemental information (unaudited)
45
PACE Money Market Investments
Supplemental information (unaudited)
Officers
Name, address,
and age | | Position(s)
held
with Trust | | Term of
office1 and
length of
time served | | Principal occupation(s)
during past 5 years;
number of portfolios in
fund complex for which person
serves as officer | |
Joseph Allessie*;
48 | | Vice President and Assistant Secretary | | Since 2005 | | Mr. Allessie is an executive director (since 2007) (prior to which he was a director) and deputy general counsel (since 2005) UBS Global AM—Americas region. Mr. Allessie is a vice president and assistant secretary of 17 investment companies (consisting of 80 portfolios) for which UBS Global AM serves as investment advisor or manager. | |
Rose Ann Bubloski*;
45 | | Vice President and Assistant Treasurer | | Since 2011 | | Ms. Bubloski is a director (since 2012) (prior to which she was an associate director) and senior manager of the US mutual fund treasury administration department of UBS Global AM—Americas region. She was vice president at Cohen & Steers Capital Management, Inc. (investment manager) (from 2007 to 2008). She is vice president and assistant treasurer of 17 investment companies (consisting of 80 portfolios) for which UBS Global AM serves as investment advisor or manager. | |
46
PACE Money Market Investments
Supplemental information (unaudited)
Officers (continued)
Name, address,
and age | | Position(s)
held
with Trust | | Term of
office1 and
length of
time served | | Principal occupation(s)
during past 5 years;
number of portfolios in
fund complex for which person
serves as officer | |
Mark E. Carver*;
50 | | President | | Since 2010 | | Mr. Carver is a managing director and Head of Product Development and Management-Americas for UBS Global AM—Americas region (since 2008). In this role, he oversees product development and management for both wholesale and institutional businesses. He is a member of the Americas Management Committee (since 2008) and the Regional Operating Committee (since 2008). Prior to 2008, Mr. Carver held a number of product-related or sales responsibilities with respect to funds, advisory programs and separately managed accounts. Mr. Carver joined a predecessor of an affiliated firm in 1985 and has been with UBS Global AM—Americas region (or its affiliates) since 1996. Mr. Carver is president of 17 investment companies (consisting of 80 portfolios) for which UBS Global AM serves as investment advisor or manager. | |
47
PACE Money Market Investments
Supplemental information (unaudited)
Officers (continued)
Name, address,
and age | | Position(s)
held
with Trust | | Term of
office1 and
length of
time served | | Principal occupation(s)
during past 5 years;
number of portfolios in
fund complex for which person
serves as officer | |
Thomas Disbrow*;
47 | | Vice President and Treasurer | | Since 2000 (Vice President) Since 2004 (Treasurer) | | Mr. Disbrow is a managing director (since 2011) (prior to which he was an executive director) (since 2007) and head of North America Fund Treasury (since 2011) of UBS Global AM—Americas region. Mr. Disbrow is a vice president and treasurer and/or principal accounting officer of 17 investment companies (consisting of 80 portfolios) for which UBS Global AM serves as investment advisor or manager. | |
Michael J. Flook*;
48 | | Vice President and Assistant Treasurer | | Since 2006 | | Mr. Flook is a director (since 2010) (prior to which he was an associate director) (since 2006) and a senior manager of the US mutual fund treasury administration department of UBS Global AM—Americas region. Mr. Flook is a vice president and assistant treasurer of 17 investment companies (consisting of 80 portfolios) for which UBS Global AM serves as investment advisor or manager. | |
48
PACE Money Market Investments
Supplemental information (unaudited)
Officers (continued)
Name, address,
and age | | Position(s)
held
with Trust | | Term of
office1 and
length of
time served | | Principal occupation(s)
during past 5 years;
number of portfolios in
fund complex for which person
serves as officer | |
Christopher S. Ha*;
33 | | Vice President and Assistant Secretary | | Since 2012 | | Mr. Ha is a director and associate general counsel (since September 2012) at UBS Global AM—Americas region. Prior to joining UBS Global AM—Americas region, Mr. Ha was of counsel at Buhler, Duggal & Henry LLP (law firm) (from March 2012 to July 2012) and an associate attorney at Dechert LLP (law firm) (from 2007 to 2009). Mr. Ha is a vice president and assistant secretary of 17 investment companies (consisting of 80 portfolios) for which UBS Global AM serves as investment advisor or manager. | |
Mark F. Kemper**;
55 | | Vice President and Secretary | | Since 2004 | | Mr. Kemper is a managing director (since 2006) and head of the legal department of UBS Global AM—Americas region (since 2004). He has been secretary of UBS Global AM—Americas region (since 2004), secretary of UBS Global Asset Management Trust Company (since 1993) and secretary of UBS AM Holdings (USA) Inc. (since 2001). Mr. Kemper is vice president and secretary of 17 investment companies (consisting of 80 portfolios) for which UBS Global AM serves as investment advisor or manager. | |
49
PACE Money Market Investments
Supplemental information (unaudited)
Officers (continued)
Name, address,
and age | | Position(s)
held
with Trust | | Term of
office1 and
length of
time served | | Principal occupation(s)
during past 5 years;
number of portfolios in
fund complex for which person
serves as officer | |
Joanne M. Kilkeary*;
45 | | Vice President and Assistant Treasurer | | Since 1999 | | Ms. Kilkeary is an executive director (since March 2013) (prior to which she was a director) (since 2008) and a senior manager (since 2004) of the US mutual fund treasury administration department of UBS Global AM—Americas region. Ms. Kilkeary is a vice president and assistant treasurer of 17 investment companies (consisting of 80 portfolios) for which UBS Global AM serves as investment advisor or manager. | |
Tammie Lee*;
42 | | Vice President and Assistant Secretary | | Since 2005 | | Ms. Lee is an executive director (since 2010) (prior to which she was a director) and associate general counsel of UBS Global AM—Americas region (since 2005). Ms. Lee is a vice president and assistant secretary of 17 investment companies (consisting of 80 portfolios) for which UBS Global AM serves as investment advisor or manager. | |
50
PACE Money Market Investments
Supplemental information (unaudited)
Officers (continued)
Name, address,
and age | | Position(s)
held
with Trust | | Term of
office1 and
length of
time served | | Principal occupation(s)
during past 5 years;
number of portfolios in
fund complex for which person
serves as officer | |
Joseph McGill*;
51 | | Vice President and Chief Compliance Officer | | Since 2004 | | Mr. McGill is a managing director (since 2006) and chief compliance officer (since 2003) at UBS Global AM—Americas region. Mr. McGill is a vice president and chief compliance officer of 17 investment companies (consisting of 80 portfolios) for which UBS Global AM serves as investment advisor or manager. | |
Nancy D. Osborn*;
47 | | Vice President and Assistant Treasurer | | Since 2007 | | Mrs. Osborn is a director (since 2010) (prior to which she was an associate director) and a senior manager of the US mutual fund treasury administration department of UBS Global AM—Americas region (since 2006). Mrs. Osborn is a vice president and assistant treasurer of 17 investment companies (consisting of 80 portfolios) for which UBS Global AM serves as investment advisor or manager. | |
51
PACE Money Market Investments
Supplemental information (unaudited)
Officers (continued)
Name, address,
and age | | Position(s)
held
with Trust | | Term of
office1 and
length of
time served | | Principal occupation(s)
during past 5 years;
number of portfolios in
fund complex for which person
serves as officer | |
Robert Sabatino**;
40 | | Vice President | | Since 2001 | | Mr. Sabatino is a managing director (since 2010) (prior to which he was an executive director) (since 2007), head of US taxable money markets (since 2009), and portfolio manager of UBS Global AM—Americas region in the short duration fixed income group (since 2001). Mr. Sabatino is a vice president of six investment companies (consisting of 37 portfolios) for which UBS Global AM serves as investment advisor or manager. | |
Eric Sanders*;
47 | | Vice President and Assistant Secretary | | Since 2005 | | Mr. Sanders is a director and associate general counsel of UBS Global AM—Americas region (since 2005). Mr. Sanders is a vice president and assistant secretary of 17 investment companies (consisting of 80 portfolios) for which UBS Global AM serves as investment advisor or manager. | |
52
PACE Money Market Investments
Supplemental information (unaudited)
Officers (continued)
Name, address,
and age | | Position(s)
held
with Trust | | Term of
office1 and
length of
time served | | Principal occupation(s)
during past 5 years;
number of portfolios in
fund complex for which person
serves as officer | |
Andrew Shoup*;
57 | | Vice President and Chief Operating Officer | | Since 2006 | | Mr. Shoup is a managing director and global head of the treasury administration department of UBS Global AM—Americas region (since 2006). Mr. Shoup is also a director of UBS (IRL) Fund p.l.c. (since 2008). Mr. Shoup is a vice president and chief operating officer of 17 investment companies (consisting of 80 portfolios) for which UBS Global AM serves as investment advisor or manager. | |
Keith A. Weller*;
52 | | Vice President and Assistant Secretary | | Since 2000 | | Mr. Weller is an executive director and senior associate general counsel of UBS Global AM—Americas region (since 2005) and has been an attorney with affiliated entities since 1995. Mr. Weller is a vice president and assistant secretary of 17 investment companies (consisting of 80 portfolios) for which UBS Global AM serves as investment advisor or manager. | |
53
PACE Money Market Investments
Supplemental information (unaudited)
Officers (concluded)
Name, address,
and age | | Position(s)
held
with Trust | | Term of
office1 and
length of
time served | | Principal occupation(s)
during past 5 years;
number of portfolios in
fund complex for which person
serves as officer | |
Mandy Yu*;
29 | | Vice President | | Since February 2013 | | Ms. Yu is an authorized officer (since 2012) and tax compliance manager (since March 2013) of the US mutual fund treasury administration department of UBS Global AM—Americas region. She was a Fund Treasury Manager (from 2012 to March 2013) and a Mutual Fund Administrator (from 2007 to 2012) for UBS Global AM—Americas region. Ms. Yu is a vice president of 17 investment companies (consisting of 80 portfolios) for which UBS Global AM serves as investment advisor or manager. | |
1 Each trustee holds office for an indefinite term. Officers are appointed by the trustees and serve at the pleasure of the Board.
2 Professor Feldberg is deemed an "interested person" of the Trust as defined in the Investment Company Act of 1940, as amended, because he is a senior advisor to Morgan Stanley, a financial services firm with which the Trust may conduct transactions.
3 Mr. Mandinach is deemed an "interested person" of the Trust as defined in the Investment Company Act of 1940, as amended, because of his employment by UBS Global AM—Americas region.
* This person's business address is 1285 Avenue of the Americas, New York, New York 10019-6028.
** This person's business address is One North Wacker Drive, Chicago, Illinois 60606.
54
This page intentionally left blank.
55
This page intentionally left blank.
56
Trustees
Richard Q. Armstrong
Chairman
Alan S. Bernikow
Richard R. Burt | | Meyer Feldberg
Bernard H. Garil
Heather R. Higgins
Barry M. Mandinach | |
Principal Officers
Mark E. Carver
President | | Thomas Disbrow
Vice President and Treasurer | |
Mark F. Kemper
Vice President and Secretary | | Robert Sabatino
Vice President | |
Investment Manager and
Administrator
UBS Global Asset Management (Americas) Inc.
1285 Avenue of the Americas
New York, New York 10019-6028
Principal Underwriter
UBS Global Asset Management (US) Inc.
1285 Avenue of the Americas
New York, New York 10019-6028
This report is not to be used in connection with the offering of shares of the Portfolio unless accompanied or preceded by an effective prospectus.
© UBS 2013. All rights reserved.
PRESORTED
STANDARD
U.S. POSTAGE
PAID
COMPUTERSHARE

UBS Global Asset Management (Americas) Inc.
1285 Avenue of the Americas
New York, New York 10019-6028
Item 2. Code of Ethics.
The registrant has adopted a code of ethics that applies to its principal executive officer, principal financial officer, principal accounting officer or controller, or persons performing similar functions pursuant to Section 406 of the Sarbanes-Oxley Act of 2002. (The registrant has designated the code of ethics adopted pursuant to Sarbanes-Oxley as a “Code of Conduct” to lessen the risk of confusion with its separate code of ethics adopted pursuant to Rule 17j-1 under the Investment Company Act of 1940, as amended.)
Item 3. Audit Committee Financial Expert.
The registrant’s Board has determined that the following person serving on the registrant’s Audit Committee is an “audit committee financial expert” as defined in item 3 of Form N-CSR: Alan S. Bernikow. Mr. Bernikow is independent as defined in item 3 of Form N-CSR.
Item 4. Principal Accountant Fees and Services.
(a) Audit Fees:
For the fiscal years ended July 31, 2013 and July 31, 2012, the aggregate Ernst & Young LLP (E&Y) audit fees for professional services rendered to the registrant were approximately $954,750 and $927,150, respectively.
Fees included in the audit fees category are those associated with the annual audits of financial statements and services that are normally provided in connection with statutory and regulatory filings.
(b) Audit-Related Fees:
In each of the fiscal years ended July 31, 2013 and July 31, 2012, the aggregate audit-related fees billed by E&Y for services rendered to the registrant that are reasonably related to the performance of the audits of the financial statements, but not reported as audit fees, were approximately $65,806 and $75,156, respectively.
Fees included in the audit-related fees category are those associated with (1) the reading and providing of comments on the 2013 and 2012 semiannual financial statements and (2) review of the consolidated 2012 and 2011 reports on the profitability of the UBS Funds to UBS Global Asset Management (Americas) Inc. and its affiliates to assist the board members in their annual advisory/administration contract and service/distribution plan reviews.
There were no audit-related fees required to be approved pursuant to paragraph (c)(7)(ii) of Rule 2-01 of Regulation S-X during the fiscal years indicated above.
(c) Tax Fees:
In each of the fiscal years ended July 31, 2013 and July 31, 2012, the aggregate tax fees billed by E&Y for professional services rendered to the registrant were approximately $435,890 and $296,050, respectively.
Fees included in the tax fees category comprise all services performed by professional staff in the independent accountant’s tax division except those services related to the audits. This category comprises fees for review of tax compliance, tax return preparation and excise tax calculations.
There were no tax fees required to be approved pursuant to paragraph (c)(7)(ii) of Rule 2-01 of Regulation S-X during the fiscal years indicated above.
(d) All Other Fees:
In each of the fiscal years ended July 31, 2013 and July 31, 2012, there were no fees billed by E&Y for products and services, other than the services reported in Item 4(a)-(c) above, rendered to the registrant.
Fees included in the all other fees category would consist of services related to internal control reviews, strategy and other consulting, financial information systems design and implementation, consulting on other information systems, and other tax services unrelated to the registrant.
There were no “all other fees” required to be approved pursuant to paragraph (c)(7)(ii) of Rule 2-01 of Regulation S-X during the fiscal years indicated above.
(e) (1) Audit Committee Pre-Approval Policies and Procedures:
The registrant’s Audit Committee (“audit committee”) has adopted an “Audit Committee Charter (Amended and Restated as of May 12, 2004 — with revisions through July 2008)” (the “charter”). The charter contains the audit committee’s pre-approval policies and procedures. Reproduced below is an excerpt from the charter regarding pre-approval policies and procedures:
The [audit] Committee shall:
…
2. Pre-approve (a) all audit and permissible non-audit services(1) to be provided to the Fund and (b) all permissible non-audit services to be provided by the Fund’s independent auditors to UBS Global [Asset Management (Americas) Inc. (“UBS Global AM”)] and any Covered Service Providers, if the engagement relates directly to the operations and financial reporting of the Fund. In carrying out this responsibility, the Committee shall seek periodically from UBS Global [AM] and from the independent auditors a list of such audit and permissible non-audit services that can be expected to be rendered to the Fund, UBS Global [AM] or any Covered Service Providers by the Fund’s independent auditors, and an estimate of the fees sought to be paid in connection with such services. The Committee may delegate its responsibility to pre-approve any such audit and permissible non-audit services to a sub-committee consisting of the Chairperson of the Committee
and two other members of the Committee as the Chairperson, from time to time, may determine and appoint, and such sub-committee shall report to the Committee, at its next regularly scheduled meeting after the sub-committee’s meeting, its decision(s). From year to year, the Committee shall report to the Board whether this system of pre-approval has been effective and efficient or whether this Charter should be amended to allow for pre-approval pursuant to such policies and procedures as the Committee shall approve, including the delegation of some or all of the Committee’s pre-approval responsibilities to other persons (other than UBS Global [AM] or the Fund’s officers).
(1) The Committee will not approve non-audit services that the Committee believes may taint the independence of the auditors. Currently, permissible non-audit services include any professional services (including tax services) that are not prohibited services as described below, provided to the Fund by the independent auditors, other than those provided to the Fund in connection with an audit or a review of the financial statements of the Fund. Permissible non-audit services may not include: (i) bookkeeping or other services related to the accounting records or financial statements of the Fund; (ii) financial information systems design and implementation; (iii) appraisal or valuation services, fairness opinions or contribution-in-kind reports; (iv) actuarial services; (v) internal audit outsourcing services; (vi) management functions or human resources; (vii) broker or dealer, investment adviser or investment banking services; (viii) legal services and expert services unrelated to the audit; and (ix) any other service the Public Company Accounting Oversight Board determines, by regulation, is impermissible.
Pre-approval by the Committee of any permissible non-audit services is not required so long as: (i) the aggregate amount of all such permissible non-audit services provided to the Fund, UBS Global [AM] and any service providers controlling, controlled by or under common control with UBS Global [AM] that provide ongoing services to the Fund (“Covered Service Providers”) constitutes not more than 5% of the total amount of revenues paid to the independent auditors (during the fiscal year in which the permissible non-audit services are provided) by (a) the Fund, (b) its investment adviser and (c) any entity controlling, controlled by, or under common control with the investment adviser that provides ongoing services to the Fund during the fiscal year in which the services are provided that would have to be approved by the Committee; (ii) the permissible non-audit services were not recognized by the Fund at the time of the engagement to be non-audit services; and (iii) such services are promptly brought to the attention of the Committee and approved by the Committee (or its delegate(s)) prior to the completion of the audit.
(e) (2) Services approved pursuant to paragraph (c)(7)(i)(C) of Rule 2-01 of Regulation S-X:
Audit-Related Fees:
There were no amounts that were approved by the audit committee pursuant to the de minimis exception for the fiscal years ended July 31, 2013 and July 31, 2012 on behalf of the registrant.
There were no amounts that were required to be approved by the audit committee pursuant to the de minimis exception for the fiscal years ended July 31, 2013 and July 31, 2012 on behalf of the registrant’s service providers that relate directly to the operations and financial reporting of the registrant.
Tax Fees:
There were no amounts that were approved by the audit committee pursuant to the de minimis exception for the fiscal years ended July 31, 2013 and July 31, 2012 on behalf of the registrant.
There were no amounts that were required to be approved by the audit committee pursuant to the de minimis exception for the fiscal years ended July 31, 2013 and July 31, 2012 on behalf of the registrant’s service providers that relate directly to the operations and financial reporting of the registrant.
All Other Fees:
There were no amounts that were approved by the audit committee pursuant to the de minimis exception for the fiscal years ended July 31, 2013 and July 31, 2012 on behalf of the registrant.
There were no amounts that were required to be approved by the audit committee pursuant to the de minimis exception for the fiscal years ended July 31, 2013 and July 31, 2012 on behalf of the registrant’s service providers that relate directly to the operations and financial reporting of the registrant.
(f) According to E&Y, for the fiscal year ended July 31, 2013, the percentage of hours spent on the audit of the registrant’s financial statements for the most recent fiscal year that were attributed to work performed by persons who are not full-time, permanent employees of E&Y was 0%.
(g) For the fiscal years ended July 31, 2013 and July 31, 2012, the aggregate fees billed by E&Y of $674,821 and $702,253, respectively, for non-audit services rendered on behalf of the registrant (“covered”), its investment adviser (not including any sub-adviser whose role is primarily portfolio management and is subcontracted with or overseen by another investment adviser) and any entity controlling, controlled by, or under common control with the adviser (“non-covered”) that provides ongoing services to the registrant for each of the last two fiscal years of the registrant is shown in the table below:
| | 2013 | | 2012 | |
Covered Services | | $ | 501,696 | | $ | 371,206 | |
Non-Covered Services | | 173,125 | | 331,047 | |
| | | | | | | |
(h) The registrant’s audit committee was not required to consider whether the provision of non-audit services that were rendered to the registrant’s investment adviser (not including any sub-adviser whose role is primarily portfolio management and is subcontracted with or
overseen by another investment adviser), and any entity controlling, controlled by, or under common control with the investment adviser that provides ongoing services to the registrant that were not pre-approved pursuant to paragraph (c)(7)(ii) of Rule 2-01 of Regulation S-X is compatible with maintaining the principal accountant’s independence.
Item 5. Audit Committee of Listed Registrants.
Not applicable to the registrant.
Item 6. Investments.
(a) Included as part of the report to shareholders filed under Item 1 of this form.
(b) Not applicable.
Item 7. Disclosure of Proxy Voting Policies and Procedures for Closed-End Management Investment Companies.
Not applicable to the registrant.
Item 8. Portfolio Managers of Closed-End Management Investment Companies.
Not applicable to the registrant.
Item 9. Purchases of Equity Securities by Closed-End Management Investment Company and Affiliated Purchasers.
Not applicable to the registrant.
Item 10. Submission of Matters to a Vote of Security Holders.
The registrant’s Board has established a Nominating and Corporate Governance Committee. The Nominating and Corporate Governance Committee will consider nominees recommended by shareholders if a vacancy occurs among those board members who are not “interested persons” as defined in Section 2(a)(19) of the Investment Company Act of 1940, as amended. In order to recommend a nominee, a shareholder should send a letter to the chairperson of the Nominating and Corporate Governance Committee, Richard R. Burt, care of the Secretary of the registrant at UBS Global Asset Management, UBS Building, One North Wacker Drive, Chicago, IL 60606, Attn: Mark Kemper, Secretary, and indicate on the envelope “Nominating and Corporate Governance Committee.” The shareholder’s letter should state the nominee’s name and should include the nominee’s resume or curriculum vitae, and must be accompanied by a written consent of the individual to stand for election if nominated for the Board and to serve if elected by shareholders.
Item 11. Controls and Procedures.
(a) The registrant’s principal executive officer and principal financial officer have concluded that the registrant’s disclosure controls and procedures (as defined in Rule 30a-3(c) under the Investment Company Act of 1940, as amended) are effective based on their evaluation of these controls and procedures as of a date within 90 days of the filing date of this document.
(b) The registrant’s principal executive officer and principal financial officer are aware of no changes in the registrant’s internal control over financial reporting that occurred during the second fiscal quarter of the period covered by this report that has materially affected, or is reasonably likely to materially affect, the registrant’s internal control over financial reporting.
Item 12. Exhibits.
(a) (1) Code of Ethics as required pursuant to Section 406 of the Sarbanes-Oxley Act of 2002 (and designated by registrant as a “Code of Conduct”) is filed herewith as Exhibit EX-99.CODE ETH.
(a) (2) Certifications of principal executive officer and principal financial officer pursuant to Section 302 of the Sarbanes-Oxley Act of 2002 are attached hereto as Exhibit EX-99.CERT.
(a) (3) Written solicitation to purchase securities under Rule 23c-1 under the Investment Company Act of 1940 sent or given during the period covered by the report by or on behalf of the registrant to 10 or more persons — not applicable to the registrant.
(b) Certifications of principal executive officer and principal financial officer pursuant to Section 906 of the Sarbanes-Oxley Act of 2002 are attached hereto as Exhibit EX-99.906CERT.
(c) Disclosure pursuant to Section 13(r) of the Securities Exchange Act of 1934, as amended, is attached hereto as Exhibit EX-99.IRANNOTICE.
SIGNATURES
Pursuant to the requirements of the Securities Exchange Act of 1934 and the Investment Company Act of 1940, the registrant has duly caused this report to be signed on its behalf by the undersigned, thereunto duly authorized.
PACE Select Advisors Trust
By: | /s/ Mark E. Carver | |
| Mark E. Carver | |
| President | |
| | |
Date: | October 9, 2013 | |
Pursuant to the requirements of the Securities Exchange Act of 1934 and the Investment Company Act of 1940, this report has been signed below by the following persons on behalf of the registrant and in the capacities and on the dates indicated.
By: | /s/ Mark E. Carver | |
| Mark E. Carver | |
| President | |
| | |
Date: | October 9, 2013 | |
| | |
By: | /s/ Thomas Disbrow | |
| Thomas Disbrow | |
| Vice President and Treasurer | |
| | |
Date: | October 9, 2013 | |