UNITED STATES
SECURITIES AND EXCHANGE COMMISSION
Washington, D.C. 20549
FORM N-CSR
CERTIFIED SHAREHOLDER REPORT OF REGISTERED
MANAGEMENT INVESTMENT COMPANIES
Investment Company Act file number | 811-08764 |
|
PACE® Select Advisors Trust |
(Exact name of registrant as specified in charter) |
|
1285 Avenue of the Americas, New York, New York | | 10019-6028 |
(Address of principal executive offices) | | (Zip code) |
|
Mark F. Kemper, Esq. UBS Global Asset Management 1285 Avenue of the Americas New York, NY 10019-6028 |
(Name and address of agent for service) |
Copy to: Jack W. Murphy, Esq. Dechert LLP 1900 K Street, N.W. Washington, DC 20006 |
Registrant’s telephone number, including area code: | 212-821 3000 | |
|
Date of fiscal year end: | July 31 | |
|
Date of reporting period: | July 31, 2015 | |
| | | | | | | | |
Item 1. Reports to Stockholders.

PACE® Select Advisors Trust
Annual Report
PACE® Select Advisors Trust
Table of contents | |
Introduction | | | 2 | | |
Portfolio Advisor's and Sub-Advisors' commentaries and Portfolios of investments | |
| PACE® Money Market Investments | | | 4 | | |
| PACE® Mortgage-Backed Securities Fixed Income Investments | | | 11 | | |
| PACE® Intermediate Fixed Income Investments | | | 28 | | |
| PACE® Strategic Fixed Income Investments | | | 55 | | |
| PACE® Municipal Fixed Income Investments | | | 87 | | |
| PACE® International Fixed Income Investments | | | 99 | | |
| PACE® High Yield Investments | | | 112 | | |
| PACE® Large Co Value Equity Investments | | | 129 | | |
| PACE® Large Co Growth Equity Investments | | | 146 | | |
| PACE® Small/Medium Co Value Equity Investments | | | 155 | | |
| PACE® Small/Medium Co Growth Equity Investments | | | 166 | | |
| PACE® International Equity Investments | | | 178 | | |
| PACE® International Emerging Markets Equity Investments | | | 194 | | |
| PACE® Global Real Estate Securities Investments | | | 206 | | |
| PACE® Alternative Strategies Investments | | | 214 | | |
Understanding your Portfolio's expenses | | | 256 | | |
Statement of assets and liabilities | | | 262 | | |
Statement of operations | | | 270 | | |
Statement of changes in net assets | | | 274 | | |
Statement of cash flows | | | 280 | | |
Financial highlights | | | 283 | | |
Notes to financial statements | | | 312 | | |
Report of independent registered public accounting firm | | | 361 | | |
Tax information | | | 362 | | |
General information | | | 363 | | |
Board approvals of sub-advisory agreements | | | 364 | | |
Supplemental information, trustees and officers | | | 382 | | |
PACE Select Advisors Trust offers multiple share classes representing interests in 15 separate Portfolios. (PACE Money Market Investments offers only one share class.) Different classes of shares and/or Portfolios are offered by separate prospectuses.
For more information on a portfolio or class of shares, contact your financial advisor. He or she can send you a current prospectus relating to a portfolio or class of shares. Investors should carefully read and consider a mutual fund's investment objectives, risks, charges, and expenses before investing. The prospectus contains this and other information about a mutual fund. For a current prospectus, contact UBS Global Asset Management (Americas) Inc. at 888-793 8637, or visit us on the Web at www.ubs.com/globalam-us.
Derivatives vary in complexity, involve risks which are different from, and may be greater than, the risks associated with investing in securities or other instruments. Please see the funds' prospectuses for more complete discussion of the risks associated with investing in derivatives.
1
PACE Select Advisors Trust
Introduction
September 18, 2015
Dear PACE Shareholder,
We are pleased to provide you with the annual report for the PACE portfolios (the "Portfolios"), comprising the PACE Select Advisors Trust. This report includes summaries of the performance of each Portfolio, as well as commentaries from the investment advisor and sub-advisors regarding the events that affected Portfolio performance during the 12 months ended July 31, 2015. Please note that the opinions of the sub-advisors do not necessarily represent those of UBS Global Asset Management (Americas) Inc., the Portfolios' investment advisor.
Global growth generally improves
Growth in the US fluctuated during the reporting period. The US Commerce Department reported that gross domestic product ("GDP") expanded at a 4.3% seasonally adjusted annualized rate during the third quarter of 2014. GDP growth then moderated to 2.1% during the fourth quarter and 0.6% for the first quarter of 2015. However, the US economy then improved, as the Commerce Department's second estimate for second quarter GDP was 3.7%.1
The US Federal Reserve Board (the "Fed") largely maintained its accommodative monetary policy during the reporting period, and continued to hold the fed funds rate at a historically low range between 0% and 0.25%. (The federal funds rate or the "fed funds rate," is the rate US banks charge one another for funds they borrow on an overnight basis.) However, at its March 2015 meeting, the Fed said that it "... anticipates that it will be appropriate to raise the target range for the federal funds rate when it has seen further improvement in the labor market and is reasonably confident that inflation will move back to its 2% objective over the medium term." Finally, at the central bank's meeting that concluded in June 2015, the Fed said that it "...currently anticipates that, even after employment and inflation are near mandate-consistent levels, economic conditions may, for some time, warrant keeping the target federal funds rate below levels the Committee views as normal in the longer run."
In terms of the global economy, the International Monetary Fund's ("IMF") July 2015 World Economic Outlook Update said "A setback to activity in the first quarter of 2015, mostly in North America, has resulted in a small downward revision to global growth for 2015 relative to the April 2015 World Economic Outlook. Nevertheless, the underlying drivers for a gradual acceleration in economic activity in advanced economies—easy financial conditions, more neutral fiscal policy in the euro area, lower fuel prices, and improving confidence and labor market conditions—remain intact." The IMF projects that 2015 growth in the eurozone will be 1.5%, versus 0.8% in 2014. Japan's economy is expected to expand 0.8% in 2015, an improvement from the 0.1% contraction in 2014. In contrast, the IMF sees growth in emerging market countries decelerating in 2015, with GDP of 4.2% compared to 4.6% in 2014.
US equities post superior results
While it experienced several setbacks, the US equity market generated strong results during the reporting period. Investor sentiment was challenged at times given some mixed global economic data and corporate profit figures, as well as numerous geopolitical issues. All told, the US stock market, as measured by the S&P 500 Index,2 gained 11.21% for the 12 months ended July 31, 2015. In contrast, international equities produced weak results, as they were dragged down by growth concerns, fluctuating oil prices and the crisis in Greece. International developed
1 Based on the Commerce Department's second estimate announced on August 27, 2015, after the reporting period had ended.
2 The S&P 500 Index is an unmanaged, weighted index composed of 500 widely held common stocks varying in composition and is not available for direct investment. Investors should note that indices do not reflect the deduction of fees and expenses.
2
PACE Select Advisors Trust
market equities, as measured by the MSCI EAFE Index (net),3 fell 0.27% during the period. Emerging market equities, as measured by the MSCI Emerging Markets Index (net),4 declined 13.38% over the same period.
Mixed returns in the fixed income market
The global fixed income market was also volatile at times during the reporting period. This was triggered by incoming economic data, uncertainties surrounding future monetary policy and—as was the case for the equity market—unfolding geopolitical events. Against this backdrop, the yield on the 10-year US Treasury fell from 2.58% to 2.20% during the reporting period, and the overall US bond market, as measured by the Barclays US Aggregate Index,5 gained 2.82%. Riskier fixed income securities generated weaker results for the 12 months ended July 31, 2015. High yield bonds, as measured by the BofA Merrill Lynch US High Yield Cash Pay Constrained Index6 returned 0.22%, whereas emerging markets debt, as measured by the J.P. Morgan Emerging Markets Bond Index Global (EMBI Global),7 declined 1.28%.
Sincerely,

Mark E. Carver
President, PACE Select Advisors Trust
Managing Director, UBS Global Asset Management (Americas) Inc.
This report is intended to assist investors in understanding how the Portfolios performed during the 12-month period ended July 31, 2015. The views expressed in the Advisor's and Sub-Advisors' comments sections are as of the end of the reporting period, reflect performance results gross of fees and expenses, and are those of the investment advisor (with respect to PACE Money Market Investments only) and sub-advisors. Sub-advisors' comments on Portfolios that have more than one sub-advisor are reflective of their portion of the Portfolio only. The views and opinions in this report were current as of September 18, 2015. They are not guarantees of future performance or investment results and should not be taken as investment advice. Investment decisions reflect a variety of factors, and the investment advisor and sub-advisors reserve the right to change their views about individual securities, sectors and markets at any time. As a result, the views expressed should not be relied upon as a forecast of a Portfolio's future investment intent.
3 The MSCI EAFE Index (net) is an index of stocks designed to measure the investment returns of developed economies outside of North America. Net total return indices reinvest dividends after the deduction of withholding taxes, using a tax rate applicable to non-resident institutional investors who do not benefit from double taxation treaties. The index is constructed and managed with a view to being fully investable from the perspective of international institutional investors. Investors should note that indices do not reflect the deduction of fees and expenses.
4 The MSCI Emerging Markets Index (net) is a market capitalization-weighted index composed of different emerging market countries in Europe, Latin America and the Pacific Basin. Net total return indices reinvest dividends after the deduction of withholding taxes, using a tax rate applicable to non-resident institutional investors who do not benefit from double taxation treaties. The index is constructed and managed with a view to being fully investable from the perspective of international institutional investors. Investors should note that indices do not reflect the deduction of fees and expenses.
5 The Barclays US Aggregate Index is an unmanaged broad based index designed to measure the US dollar-denominated, investment grade, taxable bond market. The index includes bonds from the Treasury, government-related, corporate, mortgage-backed, asset-backed and commercial mortgage-backed sectors. Investors should note that indices do not reflect the deduction of fees and expenses.
6 The BofA Merrill Lynch US High Yield Cash Pay Constrained Index is an unmanaged index of publicly placed, non-convertible, coupon-bearing US dollar-denominated, below investment grade corporate debt with a term to maturity of at least one year. The index is market-capitalization-weighted, so that larger bond issuers have a greater effect on the index's return. However, the representation of any single bond issuer is restricted to a maximum of 2% of the total index. Investors should note that indices do not reflect the deduction of fees and expenses.
7 The J.P. Morgan Emerging Markets Bond Index Global (EMBI Global) is an unmanaged index which is designed to track total returns for US dollar-denominated debt instruments issued by emerging market sovereign and quasi-sovereign entities: Brady bonds, loans and Eurobonds. Investors should note that indices do not reflect the deduction of fees and expenses.
3
PACE Select Advisors Trust
PACE Money Market Investments
On September 22, 2015, the Portfolio's Board of Trustees ("the Board") approved a new policy on behalf of the Portfolio to invest at least 99.5% of its total assets in cash, government securities and/or repurchase agreements that are collateralized fully by cash or government securities to allow the Portfolio to qualify as a government money market fund, as defined under the amended Rule 2a-7 of the Investment Company Act of 1940. In addition, the Board approved changing the Portfolio's name to PACE Government Money Market Investments to ensure that the Portfolio is understood to be a government money market fund. In connection with the change to the Portfolio's name, the Portfolio also will adopt a non-fundamental investment policy that the Portfolio invests, under normal circumstances, at least 80% of its net assets (plus the amount of any borrowing for investment purposes) in government securities, including government securities subject to repurchase agreements. The changes are expected to become effective on or about November 28, 2015.
Performance (unaudited)
For the 12 months ended July 31, 2015, the Portfolio returned 0.01% before the deduction of the maximum PACE program fee.1 Please remember that the PACE program fee is assessed outside the Portfolio at the PACE program account level. The program fee does not impact the determination of the Portfolio's net asset value per share. For comparison purposes, the median return of the Lipper Money Market Funds category was 0.01%. (Returns over various time periods are shown in the "Performance at a glance" table on page 6. Please note that the returns shown do not reflect the deduction of taxes that a shareholder would pay on Portfolio distributions or the redemption of Portfolio shares.) For a detailed commentary on the market environment in general during the period, please refer to page 2.
Advisor's Comments
Throughout the reporting period, the US Federal Reserve Board (the "Fed") continued to hold the federal funds rate at a historically low range between 0% and 0.25%. The federal funds rate, or the "fed funds rate," is the rate US banks charge one another for funds they borrow on an overnight basis. (For more details on the Fed's actions, see page 2.) This continued to depress yields on a wide range of short-term investments. As a result, the Portfolio's yield remained low during the reporting period.
We tactically adjusted the Portfolio's weighted average maturity ("WAM") throughout the 12-month review period. When the reporting period began, the Portfolio had a WAM of 40 days. This was decreased to 38 days at the end of the reporting period.
PACE Select Advisors Trust – PACE Money Market Investments
Investment Advisor:
UBS Global Asset Management (Americas) Inc.
Portfolio Manager:
Robert Sabatino
Objective:
Current income consistent with preservation of capital and liquidity
Investment process:
The Portfolio is a money market mutual fund and seeks to maintain a stable price of $1.00 per share, although it may be possible to lose money by investing in this Portfolio. The Portfolio invests in a diversified portfolio of high-quality money market instruments of governmental and private issuers. Security selection is based on the assessment of relative values and changes in market and economic conditions.
1 Class P shares held through the PACE Select Advisors Program are subject to a maximum Program fee of 2.50%, which, if included, would have reduced performance. Class P shares held through other advisory programs also may be subject to a program fee, which, if included, would have reduced performance.
4
PACE Select Advisors Trust
PACE Money Market Investments
Sub-advisor's comments – concluded
At the issuer level, we maintained a high level of diversification, investing in smaller positions with the goal of reducing risk and keeping the Portfolio highly liquid. To that end, we typically purchased up to 3% in single nongovernment issuers throughout the reporting period. (The Portfolio is generally able to hold up to 5% in any one issuer, subject to certain exceptions.)
Several adjustments were made to the Portfolio's sector positioning during the 12-month period. We increased the Portfolio's exposures to repurchase agreements, US government and agency obligations and certificates of deposit. Conversely, we reduced our allocation to commercial paper and modestly pared our exposure to short-term corporate obligations. (Repurchase agreements are transactions in which the seller of a security agrees to buy it back at a predetermined time and price or upon demand.)
5
PACE Select Advisors Trust
PACE Money Market Investments
Performance at a glance (unaudited)
Average annual total returns for periods ended 07/31/15 | | 1 year | | 5 years | | 10 years | |
PACE Money Market Investments1 | | | 0.01 | % | | | 0.01 | % | | | 1.29 | % | |
Lipper Money Market Funds median | | | 0.01 | | | | 0.01 | | | | 1.27 | | |
Most recent calendar quarter-end returns (unaudited)
Average annual total returns for periods ended 06/30/15 | | 1 year | | 5 years | | 10 years | |
PACE Money Market Investments1 | | | 0.01 | % | | | 0.01 | % | | | 1.31 | % | |
For PACE Money Market Investments1 , the 7-day current yield for the period ended July 31, 2015 was 0.01% after fee waivers and/or expense reimbursements; the yield was (0.70)% before fee waivers and/or expense reimbursements. The Portfolio's yield quotation more closely reflects the current earnings of the Portfolio than the total return quotation. Yields will fluctuate and reflect fee waivers and/or expense reimbursements.
1 Class P shares held through advisory programs may be subject to a program fee, which, if included, would have reduced performance.
Past performance does not predict future performance, and the performance information provided does not reflect the deduction of taxes that a shareholder would pay on Portfolio distributions. The return of an investment will fluctuate. Performance results assume reinvestment of all dividends and capital gain distributions at net asset value on the payable dates. Current performance may be higher or lower than the performance data quoted.
Lipper peer group data calculated by Lipper Inc.; used with permission. The Lipper median is the return of the fund that places in the middle of a Lipper peer group.
An investment in PACE Money Market Investments is not insured or guaranteed by the Federal Deposit Insurance Corporation or any other government agency. Although the Portfolio seeks to preserve the value of your investment at $1.00 per share, it is possible to lose money by investing in the Portfolio.
Not FDIC Insured. May lose value. No bank guarantee.
6
PACE Select Advisors Trust
PACE Money Market Investments
Portfolio statistics (unaudited)
Characteristics | | 07/31/15 | |
Net assets (mm) | | $ | 168.5 | | |
Number of holdings | | | 52 | | |
Weighted average maturity | | | 38 days | | |
Portfolio composition1 | | 07/31/15 | |
Commercial paper | | | 45.4 | % | |
Repurchase agreements | | | 22.2 | | |
Certificates of deposit | | | 17.2 | | |
US government and agency obligations | | | 14.0 | | |
Short-term corporate obligation | | | 1.2 | | |
Other assets less liabilities | | | 0.02 | | |
Total | | | 100.0 | % | |
Top ten holdings1 | | 07/31/15 | |
Repurchase agreement with Goldman Sachs, Inc., 0.120% due 08/03/15 | | | 16.0 | % | |
Repurchase agreement with Barclays Capital, Inc., 0.130% due 08/03/15 | | | 5.9 | | |
Natixis, 0.080% due 08/03/15 | | | 3.0 | | |
Federal Home Loan Bank, 0.065% due 08/05/15 | | | 3.0 | | |
Working Capital Management Co., 0.150% due 08/03/15 | | | 3.0 | | |
Federal Home Loan Bank, 0.070% due 08/12/15 | | | 3.0 | | |
Atlantic Asset Securitization LLC, 0.140% due 08/07/15 | | | 3.0 | | |
Pfizer, Inc., 0.090% due 08/13/15 | | | 3.0 | | |
Starbird Funding Corp., 0.280% due 09/21/15 | | | 2.9 | | |
Federal Home Loan Bank, 0.170% due 12/09/15 | | | 2.9 | | |
Total | | | 45.7 | % | |
1 Weightings represent percentages of the Portfolio's net assets as of July 31, 2015. The Portfolio is actively managed and its composition will vary over time.
2 Represent less than 0.05% of net assets as of July 31, 2015.
7
PACE Select Advisors Trust
PACE Money Market Investments
Portfolio of investments—July 31, 2015
| | | Face
amount | | Value | |
US government and agency obligations—13.95% | |
Federal Home Loan Bank
0.065%, due 08/05/151 | | $ | 5,000,000 | | | $ | 4,999,964 | | |
0.070%, due 08/12/151 | | | 5,000,000 | | | | 4,999,893 | | |
0.170%, due 12/09/151 | | | 5,000,000 | | | | 4,996,931 | | |
Federal Home Loan Mortgage Corp.*
0.170%, due 11/04/151 | | | 1,000,000 | | | | 999,551 | | |
Federal National Mortgage
Association*
0.231%, due 03/21/161 | | | 2,000,000 | | | | 1,997,010 | | |
US Treasury Bills
0.180%, due 02/04/161 | | | 1,500,000 | | | | 1,498,597 | | |
0.100%, due 02/04/161 | | | 3,000,000 | | | | 2,996,572 | | |
US Treasury Notes
2.000%, due 04/30/16 | | | 1,000,000 | | | | 1,013,160 | | |
Total US government and agency obligations
(cost—$23,501,678) | | | | | 23,501,678 | | |
Certificates of deposit—17.21% | |
Banking-non-US—10.09% | |
Credit Industriel et Commercial
0.140%, due 08/05/15 | | | 3,000,000 | | | | 3,000,000 | | |
Mizuho Bank Ltd.
0.250%, due 09/01/15 | | | 2,000,000 | | | | 2,000,000 | | |
0.280%, due 10/20/15 | | | 2,000,000 | | | | 2,000,000 | | |
Natixis
0.255%, due 08/03/152 | | | 2,000,000 | | | | 2,000,000 | | |
Norinchukin Bank
0.160%, due 08/17/15 | | | 2,000,000 | | | | 2,000,000 | | |
0.160%, due 08/20/15 | | | 3,000,000 | | | | 3,000,000 | | |
Rabobank Nederland NV
0.295%, due 10/13/15 | | | 2,000,000 | | | | 2,000,000 | | |
Toronto-Dominion Bank
0.520%, due 02/23/16 | | | 1,000,000 | | | | 1,000,000 | | |
| | | | 17,000,000 | | |
Banking-US—7.12% | |
BMO Harris Bank N.A.
0.310%, due 10/08/15 | | | 2,000,000 | | | | 2,000,000 | | |
Citibank N.A.
0.200%, due 10/01/15 | | | 2,000,000 | | | | 2,000,000 | | |
HSBC Bank USA N.A.
0.280%, due 08/03/15 | | | 2,000,000 | | | | 2,000,000 | | |
0.400%, due 12/07/15 | | | 2,000,000 | | | | 2,000,000 | | |
JPMorgan Chase Bank N.A.
0.320%, due 10/28/15 | | | 2,000,000 | | | | 2,000,000 | | |
State Street Bank & Trust Co.
0.220%, due 11/09/15 | | | 2,000,000 | | | | 2,000,000 | | |
| | | | 12,000,000 | | |
Total certificates of deposit
(cost—$29,000,000) | | | | | 29,000,000 | | |
Commercial paper1—45.39% | |
Asset backed-miscellaneous—24.62% | |
Albion Capital Corp.
0.190%, due 08/20/15 | | | 1,000,000 | | | | 999,900 | | |
| | | Face
amount | | Value | |
Commercial paper1—(continued) | |
Asset backed-miscellaneous—(concluded) | |
Antalis US Funding Corp.
0.210%, due 08/21/15 | | $ | 2,000,000 | | | $ | 1,999,767 | | |
Atlantic Asset Securitization LLC
0.140%, due 08/07/15 | | | 5,000,000 | | | | 4,999,883 | | |
Barton Capital Corp.
0.257%, due 08/17/152 | | | 2,000,000 | | | | 2,000,000 | | |
Cancara Asset Securitisation LLC
0.170%, due 08/03/15 | | | 2,000,000 | | | | 1,999,981 | | |
Fairway Finance Co. LLC
0.260%, due 08/17/15 | | | 2,000,000 | | | | 1,999,769 | | |
Gotham Funding Corp.
0.160%, due 08/10/15 | | | 3,000,000 | | | | 2,999,880 | | |
Liberty Street Funding LLC
0.250%, due 10/26/15 | | | 2,000,000 | | | | 1,998,806 | | |
LMA Americas LLC
0.140%, due 08/03/15 | | | 4,000,000 | | | | 3,999,969 | | |
Manhattan Asset Funding Co. LLC
0.180%, due 08/25/15 | | | 4,000,000 | | | | 3,999,520 | | |
Starbird Funding Corp.
0.280%, due 09/21/15 | | | 5,000,000 | | | | 4,998,017 | | |
Victory Receivables Corp.
0.190%, due 08/10/15 | | | 4,500,000 | | | | 4,499,786 | | |
Working Capital Management Co.
0.150%, due 08/03/15 | | | 5,000,000 | | | | 4,999,958 | | |
| | | | 41,495,236 | | |
Banking-non-US—7.71% | |
Australia & New Zealand Banking
Group Ltd.
0.276%, due 08/13/152 | | | 2,000,000 | | | | 2,000,000 | | |
Caisse Centrale Desjardins
0.170%, due 08/11/15 | | | 1,000,000 | | | | 999,953 | | |
Mitsubishi UFJ Trust & Banking Corp.
0.160%, due 08/17/15 | | | 3,000,000 | | | | 2,999,786 | | |
National Australia Bank Ltd.
0.415%, due 01/08/16 | | | 2,000,000 | | | | 1,996,311 | | |
Natixis
0.080%, due 08/03/15 | | | 5,000,000 | | | | 4,999,978 | | |
| | | | 12,996,028 | | |
Banking-US—2.96% | |
Bedford Row Funding Corp.
0.110%, due 08/17/15 | | | 3,000,000 | | | | 2,999,853 | | |
0.470%, due 01/04/16 | | | 2,000,000 | | | | 1,995,927 | | |
| | | | 4,995,780 | | |
Electric-integrated—1.19% | |
CNPC Finance HK Ltd.
0.400%, due 08/04/15 | | | 2,000,000 | | | | 1,999,933 | | |
Finance-non-captive diversified—1.19% | |
General Electric Capital Corp.
0.350%, due 10/02/15 | | | 2,000,000 | | | | 1,998,794 | | |
8
PACE Select Advisors Trust
PACE Money Market Investments
Portfolio of investments—July 31, 2015
| | | Face
amount | | Value | |
Commercial paper1—(concluded) | |
Insurance-life—1.78% | |
MetLife Short Term Funding LLC
0.150%, due 08/24/15 | | $ | 3,000,000 | | | $ | 2,999,713 | | |
Machinery-agriculture & construction—2.97% | |
Caterpillar Financial Services Corp.
0.100%, due 08/04/15 | | | 2,000,000 | | | | 1,999,983 | | |
0.110%, due 09/14/15 | | | 3,000,000 | | | | 2,999,597 | | |
| | | | 4,999,580 | | |
Pharmaceuticals—2.97% | |
Pfizer, Inc.
0.090%, due 08/13/15 | | | 5,000,000 | | | | 4,999,850 | | |
Total commercial paper
(cost—$76,784,914) | | | | | 76,484,914 | | |
Short-term corporate obligation—1.19% | |
Finance-non-captive diversified—1.19% | |
General Electric Capital Corp
2.250%, due 11/09/15
(cost—$2,010,309) | | | 2,000,000 | | | | 2,010,309 | | |
Repurchase agreements—22.22% | |
Repurchase agreement dated
07/31/15 with Barclays Capital, Inc.,
0.130% due 08/03/15, collateralized
by $10,200,000 US Treasury Note,
1.625% due 07/31/20;
(value—$10,200,000);
proceeds: $10,000,108 | | | 10,000,000 | | | | 10,000,000 | | |
Repurchase agreement dated
07/31/15 with Goldman Sachs & Co.,
0.120% due 08/03/15, collateralized
by $27,451,000 Federal Home Loan
Mortgage Corp. obligation,
1.840% due 04/08/20;
(value—$27,540,094);
proceeds: $27,000,270 | | | 27,000,000 | | | | 27,000,000 | | |
| | | Face
amount | | Value | |
Repurchase agreements—(concluded) | |
Repurchase agreement dated
07/31/15 with State Street Bank
and Trust Co., 0.000% due
08/03/15, collateralized by
$417,935 Federal Home Loan
Mortgage Corp. obligation,
1.960% due 11/07/22 and $49,820
Federal National Mortgage
Association obligation,
2.170% due 11/07/22;
(value—$450,464);
proceeds: $441,000 | | $ | 441,000 | | | $ | 441,000 | | |
Total repurchase agreements
(cost—$37,441,000) | | | | | 37,441,000 | | |
Total investments
(cost—$168,437,901 which
approximates cost for federal
income tax purposes)—99.96% | | | | | 168,437,901 | | |
Other assets in excess of
liabilities—0.04% | | | | | 65,216 | | |
Net assets (applicable to 168,501,248
shares of beneficial interest
outstanding equivalent to $1.00
per share)—100.00% | | | | $ | 168,503,117 | | |
For a listing of defined portfolio acronyms that are used throughout the Portfolio of investments as well as the tables that follow, please refer to page 254.
9
PACE Select Advisors Trust
PACE Money Market Investments
Portfolio of investments—July 31, 2015
Fair valuation summary
The following is a summary of the fair valuations according to the inputs used as of July 31, 2015 in valuing the Portfolio's investments:
Assets
Description | | Unadjusted
quoted prices in
active markets for
identical investments
(Level 1) | | Other significant
observable inputs
(Level 2) | | Unobservable
inputs
(Level 3) | | Total | |
US government and agency obligations | | $ | — | | | $ | 23,501,678 | | | $ | — | | | $ | 23,501,678 | | |
Certificates of deposit | | | — | | | | 29,000,000 | | | | — | | | | 29,000,000 | | |
Commercial paper | | | — | | | | 76,484,914 | | | | — | | | | 76,484,914 | | |
Short-term corporate obligation | | | — | | | | 2,010,309 | | | | — | | | | 2,010,309 | | |
Repurchase agreements | | | — | | | | 37,441,000 | | | | — | | | | 37,441,000 | | |
Total | | $ | — | | | $ | 168,437,901 | | | $ | — | | | $ | 168,437,901 | | |
At July 31, 2015, there were no transfers between Level 1 and Level 2.
Issuer breakdown by country or territory of origin (unaudited)
| | | Percentage of
total investments | |
United States | | | 81.0 | % | |
Japan | | | 7.1 | | |
France | | | 5.9 | | |
Australia | | | 2.4 | | |
Netherlands | | | 1.2 | | |
Canada | | | 1.2 | | |
China | | | 1.2 | | |
Total | | | 100.0 | % | |
Portfolio footnotes
* On September 7, 2008, the Federal Housing Finance Agency placed the Federal National Mortgage Association and the Federal Home Loan Mortgage Corporation into conservatorship, and the US Treasury guaranteed the debt issued by those organizations.
1 Rates shown are the discount rates at date of purchase unless otherwise noted.
2 Variable or floating rate security. The interest rate shown is the current rate as of July 31, 2015 and changes periodically. The maturity date reflects earlier of reset date or stated maturity date.
See accompanying notes to financial statements.
10
PACE Select Advisors Trust
PACE Mortgage-Backed Securities Fixed Income Investments
Performance (unaudited)
For the 12 months ended July 31, 2015, the Portfolio's Class P shares gained 3.04% before the deduction of the maximum PACE Select program fee.1 In comparison, the Barclays US Mortgage-Backed Securities Index (the "benchmark") rose 3.54%, and the Lipper US Mortgage Funds category posted a median return of 3.24%.3 (Returns for all share classes over various time periods are shown in the "Performance at a glance" table on page 14. Please note that the returns shown do not reflect the deduction of taxes that a shareholder would pay on Portfolio distributions or the redemption of Portfolio shares.) For a detailed commentary on the market environment in general during the reporting period, please refer to page 2.
Sub-advisor's comments2
(Please note that while the sub-advisor outperformed the benchmark on a gross-of-fees basis, the Portfolio underperformed net of fees, as reported in the "Performance at a glance" table. As stated in footnote two, the comments that follow address performance on a gross-of-fees basis.)
The Portfolio outperformed its benchmark during the reporting period. Positioning within the agency mortgage-backed security ("MBS") sector was neutral to modestly positive for performance. An overall underweight to agency MBS contributed to results as they lagged like-duration Treasuries. However, less exposure to lower coupon Freddie Mac ("FHLMC") and Fannie Mae ("FNMA") mortgages during the first half of the period detracted from returns, as these securities outperformed higher coupons given elevated prepayment concerns. An underweight to 15-year conventional FNMA and FHLMC securities detracted from returns, as they outperformed the broader market and like-duration Treasuries. Additionally, an underweight to Ginnie Mae ("GNMA") bonds for most of the period contributed to results as they underperformed FHLMC and FNMA mortgages.
An allocation to non-agency MBS contributed to results as prices on selected securities rose amid strong demand and continued limited supply.
1 Class P shares held through the PACE Select Advisors Program are subject to a maximum Program fee of 2.50%, which, if included, would have reduced performance. Class P shares held through other advisory programs also may be subject to a program fee, which, if included, would have reduced performance.
2 All sub-advisors discuss performance on a gross-of-fees basis—meaning that no fees or expenses are reflected in their sleeves'/sleeve's performance. Alternately, Portfolio performance is shown net of fees, which does factor in fees and expenses associated with the Portfolio.
3 Barclays US Mortgage-Backed Securities Index, as calculated by the investment advisor, which as of July 31, 2015 had a duration of approximately 4.34 years.
PACE Select Advisors Trust – PACE Mortgage-Backed Securities Fixed
Income Investments
Investment Sub-Advisor:
Pacific Investment Management Company LLC ("PIMCO")
Portfolio Managers:
Daniel Hyman and Michael Cudzil
Objective:
Current income
Investment process:
The Portfolio invests primarily in government fixed income securities which include US bonds, including those backed by mortgages, and related repurchase agreements. Mortgage-backed securities include "to be announced" or "TBA" securities, which usually are traded on a forward commitment basis with an approximate principal amount and no defined maturity date; issued or guaranteed by US government agencies and instrumentalities. The Portfolio also invests, to a lesser extent, in investment grade bonds of private issuers, including those backed by mortgages or other assets. The Portfolio may invest in bonds of varying maturities, but normally limits its duration to within +/- 50% of the effective duration of the Portfolio's benchmark index.3 (Duration is a measure of a portfolio's sensitivity to interest rate changes.) The Portfolio may engage in short selling with respect to securities issued by the US Treasury and certain TBA securities coupon trades. PIMCO establishes duration targets based on its expectations for changes in interest rates, and then positions the Portfolio to take advantage of yield curve shifts. PIMCO decides to buy and sell specific bonds based on an analysis of their values relative to other similar securities.
11
PACE Select Advisors Trust
PACE Mortgage-Backed Securities Fixed Income Investments
Sub-advisor's comments – concluded
An underweight to US duration detracted from performance as the yield on the 10-year US Treasury fell 38 basis points (0.38%). (Duration measures a portfolio's sensitivity to interest rate changes.)
Overall, derivative usage was positive during the reporting period, primarily due to income generated from selling mortgage pool options as a way to manage interest rate and volatility risk within the sector. This was partially offset by negative price action of synthetic interest-only agency MBS that were traded as total return swaps. The Portfolio also used interest rate swaps to adjust interest rate and yield curve exposures, as well as to substitute for physical securities. Additionally, options on swaps were used to manage interest rate and volatility exposures, as well as to generate income in expected interest rate scenarios. Government futures were utilized to adjust interest rate exposures and replicate government bond positions.
Special considerations
The Portfolio may be appropriate for long-term investors seeking current income who are able to withstand short-term fluctuations in the fixed income markets in return for potentially higher returns over the long term. The yield and value of the Portfolio change every day and can be affected by changes in interest rates, general market conditions, and other political, social and economic developments, as well as specific matters relating to the issuers in which the Portfolio invests. It is important to note that an investment in the Portfolio is only one component of a balanced investment plan.
12
PACE Select Advisors Trust
PACE Mortgage-Backed Securities Fixed Income Investments
Illustration of an assumed investment of $10,000 in Class P shares of the Portfolio (unaudited)
The following graph depicts the performance of PACE Mortgage-Backed Securities Fixed Income Investments Class P shares versus the Barclays US Mortgage-Backed Securities Index over the 10 years ended July 31, 2015. Class P shares held through advisory programs may be subject to a program fee, which, if included, would have reduced performance. The performance of the other classes will vary based upon the different class specific expenses and sales charges. The performance provided does not reflect the deduction of taxes that a shareholder would pay on Portfolio distributions or the redemption of Portfolio shares. Past performance is no guarantee of future results. Share price and returns will vary with market conditions; investors may realize a gain or loss upon redemption. It is important to note that PACE Mortgage-Backed Securities Fixed Income Investments is a professionally managed portfolio while the Index is not available for investment and is unmanaged. The comparison is shown for illustration purposes only.

13
PACE Select Advisors Trust
PACE Mortgage-Backed Securities Fixed Income Investments
Performance at a glance (unaudited)
Average annual total returns for periods ended 07/31/15 | | 1 year | | 5 years | | 10 years | |
Before deducting maximum sales charge | |
Class A1 | | | 2.86 | % | | | 2.45 | % | | | 4.25 | % | |
Class C2 | | | 2.27 | | | | 1.93 | | | | 3.73 | | |
Class Y3 | | | 3.12 | | | | 2.71 | | | | 4.53 | | |
Class P4 | | | 3.04 | | | | 2.70 | | | | 4.51 | | |
After deducting maximum sales charge | |
Class A1 | | | (1.74 | ) | | | 1.50 | | | | 3.78 | | |
Class C2 | | | 1.52 | | | | 1.93 | | | | 3.73 | | |
Barclays US Mortgage-Backed Securities Index5 | | | 3.54 | | | | 2.85 | | | | 4.68 | | |
Lipper US Mortgage Funds median | | | 3.24 | | | | 2.97 | | | | 4.18 | | |
Most recent calendar quarter-end returns (unaudited)
Average annual total returns for periods ended 06/30/15 | | 1 year | | 5 years | | 10 years | |
Before deducting maximum sales charge | |
Class A1 | | | 1.97 | % | | | 2.58 | % | | | 4.16 | % | |
Class C2 | | | 1.38 | | | | 2.06 | | | | 3.63 | | |
Class Y3 | | | 2.23 | | | | 2.83 | | | | 4.44 | | |
Class P4 | | | 2.14 | | | | 2.82 | | | | 4.41 | | |
After deducting maximum sales charge | |
Class A1 | | | (2.64 | ) | | | 1.64 | | | | 3.68 | | |
Class C2 | | | 0.63 | | | | 2.06 | | | | 3.63 | | |
The annualized gross and net expense ratios, respectively, for each class of shares as in the November 28, 2014 prospectuses, were as follows: Class A—1.07% and 0.97%; Class C—1.59% and 1.47%; Class Y—0.87% and 0.72%; and Class P—0.90% and 0.72%. Net expenses reflect fee waivers and/or expense reimbursements, if any, pursuant to an agreement that is in effect to cap the expenses. The Portfolio and UBS Global Asset Management (Americas) Inc. ("UBS Global AM") have entered into a written fee waiver/expense reimbursement agreement pursuant to which UBS Global AM is contractually obligated to (1) waive its management fees through November 30, 2015 to the extent necessary to reflect the lower sub-advisory fee paid by UBS Global AM to Pacific Investment Management Company LLC, the Portfolio's investment sub-advisor; and (2) waive its management fees and/or reimburse expenses so that the Portfolio's ordinary total operating expenses of each class through November 30, 2015 (excluding dividend expense, borrowing costs, and interest expense relating to short sales, and expenses attributable to investment in other investment companies, interest, taxes, brokerage commissions and extraordinary expenses) would not exceed Class A—0.97%; Class C—1.47%; Class Y—0.72%; and Class P—0.72%. The Portfolio has agreed to repay UBS Global AM for any waived fees/reimbursed expenses (pursuant to item (2)) to the extent that it can do so over the following three fiscal years without causing the Portfolio's expenses in any of those three years to exceed these expense caps. The fee waiver/expense reimbursement agreement may be terminated by the Portfolio's board at any time and also will terminate automatically upon the expiration or termination of the Portfolio's advisory contract with UBS Global AM. Upon termination of the agreement, however, UBS Global AM's three year recoupment rights will survive.
1 Maximum sales charge for Class A shares is 4.5%. Class A shares bear ongoing 12b-1 service fees.
2 Maximum contingent deferred sales charge for Class C shares is 0.75% imposed on redemptions and is reduced to 0% after one year. Class C shares bear ongoing 12b-1 service and distribution fees.
3 The Portfolio offers Class Y shares to a limited group of eligible investors, including certain qualifying retirement plans. Class Y shares do not bear initial or contingent deferred sales charges or ongoing 12b-1 service and distribution fees.
4 Class P shares do not bear initial or contingent deferred sales charges or ongoing 12b-1 service and distribution fees, but Class P shares held through advisory programs may be subject to a program fee, which, if included, would have reduced performance.
5 The Barclays US Mortgage-Backed Securities Index is an unmanaged index which primarily covers the mortgage-backed pass-through securities issued by Ginnie Mae (formally known as the Government National Mortgage Association or GNMA), Freddie Mac (formally known as Federal Home Loan Mortgage Corporation or FHLMC), and Fannie Mae (formally known as Federal National Mortgage Association or FNMA). Investors should note that indices do not reflect the deduction of fees and expenses.
Prior to February 17, 2015, if an investor sold or exchanged shares less than 90 days after purchase, a redemption fee of 1.00% of the amount sold or exchanged was deducted at the time of the transaction, except as noted otherwise in the prospectus. For sales or exchanges taking place on or after February 17, 2015 but prior to August 3, 2015, there is a reduction in the redemption holding period from 90 days to 30 days. Effective August 3, 2015, the 1.00% redemption fee imposed on sales or exchanges of any class of shares of the portfolios made during the holding periods specified in the prospectus was eliminated. Please refer to the prospectus for further information.
Past performance does not predict future performance, and the performance information provided does not reflect the deduction of taxes that a shareholder would pay on Portfolio distributions or the redemption of Portfolio shares. The return and principal value of an investment will fluctuate, so that an investor's shares, when redeemed, may be worth more or less than their original cost. Performance results assume reinvestment of all dividends and capital gain distributions at net asset value on the ex-dividend dates. Current performance may be higher or lower than the performance data quoted. For month-end performance figures, please visit http://globalam-us.ubs.com/corpweb/performance.do.
Lipper peer group data calculated by Lipper Inc.; used with permission. The Lipper median is the return of the fund that places in the middle of a Lipper peer group.
14
PACE Select Advisors Trust
PACE Mortgage-Backed Securities Fixed Income Investments
Portfolio statistics (unaudited)
Characteristics | | 07/31/15 | |
Weighted average duration | | | 3.28 yrs. | | |
Weighted average maturity | | | 4.27 yrs. | | |
Average coupon | | | 2.50 | % | |
Net assets (mm) | | $ | 529.4 | | |
Number of holdings | | | 521 | | |
Portfolio composition1 | | 07/31/15 | |
Bonds | | | 149.2 | % | |
Investments sold short | | | (32.7 | ) | |
Options and swaps | | | (0.3 | ) | |
Cash equivalents and other assets less liabilities | | | (16.2 | ) | |
Total | | | 100.0 | % | |
Asset allocation1 | | 07/31/15 | |
US government agency mortgage pass-through certificates | | | 122.9 | % | |
Collateralized mortgage obligations | | | 13.9 | | |
Asset-backed securities | | | 6.2 | | |
US government obligations | | | 4.9 | | |
Stripped mortgage-backed securities | | | 1.3 | | |
Options and swaps | | | (0.3 | ) | |
Investments sold short | | | (32.7 | ) | |
Cash equivalents and other assets less liabilities | | | (16.2 | ) | |
Total | | | 100.0 | % | |
1 Weightings represent percentages of the Portfolio's net assets as of July 31, 2015. The Portfolio is actively managed and its composition will vary over time.
15
PACE Select Advisors Trust
PACE Mortgage-Backed Securities Fixed Income Investments
Portfolio of investments—July 31, 2015
| | | Face
amount | | Value | |
US government obligations—4.85% | |
US Treasury Notes
1.875%, due 05/31/221 | | $ | 8,700,000 | | | $ | 8,675,536 | | |
2.000%, due 07/31/22 | | | 6,200,000 | | | | 6,224,461 | | |
2.000%, due 02/15/25 | | | 10,950,000 | | | | 10,760,937 | | |
Total US government obligations
(cost—$25,690,599) | | | 25,660,934 | | |
Government national mortgage association
certificates—34.06% | |
GNMA
3.000%, due 01/15/45 | | | 22,999,999 | | | | 23,429,501 | | |
3.000%, due 02/15/45 | | | 999,999 | | | | 1,018,673 | | |
3.000%, due 07/15/45 | | | 1,000,000 | | | | 1,018,674 | | |
4.000%, due 12/15/41 | | | 2,089,726 | | | | 2,246,230 | | |
4.500%, due 09/15/39 | | | 1,389,420 | | | | 1,522,331 | | |
4.500%, due 11/15/39 | | | 320,600 | | | | 349,016 | | |
4.500%, due 05/15/40 | | | 153,445 | | | | 166,796 | | |
4.500%, due 06/15/40 | | | 675,403 | | | | 734,668 | | |
5.000%, due 12/15/34 | | | 295,978 | | | | 330,630 | | |
5.000%, due 04/15/38 | | | 235,251 | | | | 261,034 | | |
5.000%, due 05/15/38 | | | 8,361 | | | | 9,269 | | |
5.000%, due 08/15/39 | | | 621,012 | | | | 689,326 | | |
5.000%, due 09/15/39 | | | 824,951 | | | | 915,170 | | |
5.000%, due 10/15/39 | | | 8,569 | | | | 9,498 | | |
5.000%, due 12/15/39 | | | 22,826 | | | | 25,350 | | |
5.000%, due 02/15/40 | | | 391,102 | | | | 434,273 | | |
5.000%, due 05/15/40 | | | 601,571 | | | | 667,932 | | |
5.000%, due 09/15/40 | | | 13,235 | | | | 14,695 | | |
5.000%, due 05/15/41 | | | 169,529 | | | | 189,840 | | |
5.500%, due 08/15/35 | | | 53,919 | | | | 61,277 | | |
5.500%, due 02/15/38 | | | 6,492 | | | | 7,307 | | |
5.500%, due 04/15/38 | | | 549,089 | | | | 617,083 | | |
5.500%, due 05/15/38 | | | 558,681 | | | | 629,353 | | |
5.500%, due 06/15/38 | | | 296,377 | | | | 333,607 | | |
5.500%, due 10/15/38 | | | 1,447,478 | | | | 1,629,287 | | |
5.500%, due 11/15/38 | | | 80,299 | | | | 90,422 | | |
5.500%, due 12/15/38 | | | 16,380 | | | | 18,437 | | |
5.500%, due 03/15/39 | | | 278,021 | | | | 313,977 | | |
5.500%, due 05/15/39 | | | 139,385 | | | | 156,893 | | |
5.500%, due 09/15/39 | | | 693,476 | | | | 780,516 | | |
5.500%, due 01/15/40 | | | 11,386 | | | | 12,823 | | |
5.500%, due 03/15/40 | | | 978,686 | | | | 1,101,523 | | |
5.500%, due 05/15/40 | | | 60,500 | | | | 68,060 | | |
6.500%, due 02/15/29 | | | 1,228 | | | | 1,402 | | |
6.500%, due 01/15/36 | | | 12,261 | | | | 13,991 | | |
6.500%, due 09/15/36 | | | 327,957 | | | | 383,580 | | |
6.500%, due 02/15/37 | | | 17,923 | | | | 20,799 | | |
6.500%, due 04/15/37 | | | 12,418 | | | | 14,171 | | |
6.500%, due 01/15/38 | | | 12,063 | | | | 13,819 | | |
6.500%, due 06/15/38 | | | 41,440 | | | | 47,822 | | |
6.500%, due 07/15/38 | | | 43,760 | | | | 53,691 | | |
6.500%, due 11/15/38 | | | 11,365 | | | | 13,711 | | |
7.500%, due 08/15/21 | | | 3,014 | | | | 3,121 | | |
8.000%, due 02/15/23 | | | 584 | | | | 645 | | |
8.250%, due 04/15/19 | | | 94,347 | | | | 100,939 | | |
10.500%, due 02/15/19 | | | 15,543 | | | | 15,633 | | |
| | | Face
amount | | Value | |
Government national mortgage association
certificates—(continued) | |
10.500%, due 06/15/19 | | $ | 19,686 | | | $ | 19,799 | | |
10.500%, due 07/15/19 | | | 25,191 | | | | 25,336 | | |
10.500%, due 07/15/20 | | | 2,150 | | | | 2,163 | | |
10.500%, due 08/15/20 | | | 19,826 | | | | 20,265 | | |
GNMA II
2.500%, due 03/20/45 | | | 994,527 | | | | 969,863 | | |
3.000%, due 07/20/451 | | | 9,999,000 | | | | 10,184,309 | | |
5.000%, due 12/20/33 | | | 444,616 | | | | 494,793 | | |
5.000%, due 01/20/34 | | | 252,253 | | | | 281,700 | | |
5.000%, due 02/20/38 | | | 344,503 | | | | 374,566 | | |
5.000%, due 04/20/38 | | | 392,944 | | | | 427,992 | | |
5.000%, due 08/20/41 | | | 51,109 | | | | 56,688 | | |
5.000%, due 12/20/42 | | | 69,549 | | | | 77,441 | | |
5.000%, due 08/20/43 | | | 6,804,647 | | | | 7,388,720 | | |
9.000%, due 04/20/25 | | | 10,281 | | | | 11,794 | | |
9.000%, due 12/20/26 | | | 3,529 | | | | 3,748 | | |
9.000%, due 01/20/27 | | | 10,835 | | | | 11,180 | | |
9.000%, due 09/20/30 | | | 1,175 | | | | 1,180 | | |
9.000%, due 10/20/30 | | | 3,846 | | | | 4,024 | | |
9.000%, due 11/20/30 | | | 5,210 | | | | 5,310 | | |
GNMA II ARM
1.625%, due 07/20/17 | | | 1,470 | | | | 1,492 | | |
1.625%, due 09/20/21 | | | 77,969 | | | | 80,530 | | |
1.625%, due 06/20/22 | | | 69,075 | | | | 71,730 | | |
1.625%, due 04/20/24 | | | 108,600 | | | | 112,194 | | |
1.625%, due 08/20/25 | | | 20,555 | | | | 21,386 | | |
1.625%, due 09/20/25 | | | 26,801 | | | | 27,907 | | |
1.625%, due 04/20/26 | | | 135,288 | | | | 140,074 | | |
1.625%, due 06/20/26 | | | 58,150 | | | | 60,387 | | |
1.625%, due 08/20/26 | | | 29,806 | | | | 31,016 | | |
1.625%, due 04/20/27 | | | 33,611 | | | | 34,959 | | |
1.625%, due 07/20/27 | | | 11,050 | | | | 11,499 | | |
1.625%, due 04/20/30 | | | 11,444 | | | | 11,904 | | |
1.625%, due 05/20/30 | | | 124,215 | | | | 129,206 | | |
1.625%, due 07/20/30 | | | 63,949 | | | | 66,530 | | |
1.750%, due 01/20/23 | | | 50,002 | | | | 51,594 | | |
1.750%, due 03/20/23 | | | 25,217 | | | | 26,042 | | |
1.750%, due 01/20/24 | | | 58,980 | | | | 60,892 | | |
1.750%, due 02/20/25 | | | 15,356 | | | | 15,900 | | |
1.750%, due 03/20/26 | | | 14,798 | | | | 15,366 | | |
1.750%, due 01/20/27 | | | 83,088 | | | | 84,030 | | |
1.750%, due 01/20/28 | | | 13,876 | | | | 14,404 | | |
1.750%, due 02/20/28 | | | 9,614 | | | | 9,948 | | |
2.000%, due 01/20/25 | | | 7,034 | | | | 7,248 | | |
2.000%, due 05/20/25 | | | 7,813 | | | | 8,072 | | |
2.000%, due 09/20/26 | | | 4,715 | | | | 4,880 | | |
2.000%, due 01/20/27 | | | 5,578 | | | | 5,801 | | |
2.000%, due 02/20/27 | | | 11,457 | | | | 11,849 | | |
2.000%, due 04/20/27 | | | 3,676 | | | | 3,887 | | |
2.000%, due 08/20/27 | | | 31,373 | | | | 33,355 | | |
2.000%, due 04/20/30 | | | 12,612 | | | | 13,077 | | |
2.000%, due 05/20/30 | | | 395,195 | | | | 409,786 | | |
2.000%, due 07/20/30 | | | 21,094 | | | | 21,951 | | |
2.000%, due 08/20/30 | | | 109,042 | | | | 113,487 | | |
2.500%, due 04/20/18 | | | 1,996 | | | | 2,005 | | |
16
PACE Select Advisors Trust
PACE Mortgage-Backed Securities Fixed Income Investments
Portfolio of investments—July 31, 2015
| | | Face
amount | | Value | |
Government national mortgage association
certificates—(concluded) | |
2.500%, due 11/20/21 | | $ | 16,787 | | | $ | 17,205 | | |
2.500%, due 03/20/25 | | | 25,300 | | | | 26,116 | | |
2.500%, due 07/20/30 | | | 42,620 | | | | 45,114 | | |
2.500%, due 08/20/30 | | | 4,175 | | | | 4,313 | | |
2.500%, due 10/20/30 | | | 14,481 | | | | 14,846 | | |
3.000%, due 04/20/18 | | | 2,586 | | | | 2,645 | | |
3.000%, due 05/20/25 | | | 52,468 | | | | 55,529 | | |
3.000%, due 06/20/25 | | | 19,733 | | | | 20,533 | | |
3.500%, due 03/20/25 | | | 10,168 | | | | 10,263 | | |
4.000%, due 01/20/18 | | | 34,249 | | | | 35,441 | | |
4.000%, due 05/20/18 | | | 2,717 | | | | 2,743 | | |
4.000%, due 06/20/19 | | | 14,502 | | | | 14,731 | | |
GNMA TBA
3.000% | | | 2,000,000 | | | | 2,034,062 | | |
| 3.500% | | | 6,000,000 | | | | 6,261,872 | | |
| 4.000% | | | 3,000,000 | | | | 3,187,033 | | |
| 4.500% | | | 4,000,000 | | | | 4,334,688 | | |
| 6.000% | | | 1,000,000 | | | | 1,128,403 | | |
GNMA II TBA
3.000% | | | 20,000,000 | | | | 20,340,624 | | |
| 3.500% | | | 35,000,000 | | | | 36,460,153 | | |
| 4.000% | | | 27,000,000 | | | | 28,631,073 | | |
| 4.500% | | | 14,000,000 | | | | 15,086,095 | | |
Total government national mortgage
association certificates
(cost—$178,874,228) | | | 180,325,536 | | |
Federal home loan mortgage corporation
certificates*—27.91% | |
FHLMC
3.000%, due 04/01/43 | | | 467,423 | | | | 470,015 | | |
3.000%, due 05/01/43 | | | 486,827 | | | | 489,458 | | |
3.000%, due 12/01/44 | | | 336,044 | | | | 337,547 | | |
3.000%, due 04/01/45 | | | 239,999 | | | | 240,948 | | |
3.000%, due 05/01/45 | | | 249,999 | | | | 250,988 | | |
3.000%, due 06/01/45 | | | 6,510,006 | | | | 6,535,752 | | |
3.500%, due 09/01/32 | | | 864,354 | | | | 911,331 | | |
4.000%, due 01/01/37 | | | 688,934 | | | | 733,489 | | |
4.000%, due 07/01/43 | | | 350,044 | | | | 375,463 | | |
4.000%, due 06/01/44 | | | 1,823,535 | | | | 1,936,937 | | |
5.000%, due 10/01/25 | | | 111,602 | | | | 122,702 | | |
5.000%, due 11/01/27 | | | 10,066 | | | | 11,093 | | |
5.000%, due 10/01/29 | | | 387,837 | | | | 426,623 | | |
5.000%, due 09/01/33 | | | 328,729 | | | | 362,419 | | |
5.000%, due 01/01/34 | | | 60,961 | | | | 67,725 | | |
5.000%, due 06/01/34 | | | 21,127 | | | | 23,401 | | |
5.000%, due 04/01/35 | | | 59,446 | | | | 65,394 | | |
5.000%, due 05/01/35 | | | 239,248 | | | | 264,829 | | |
5.000%, due 07/01/35 | | | 1,923,507 | | | | 2,130,471 | | |
5.000%, due 08/01/35 | | | 69,868 | | | | 77,354 | | |
5.000%, due 10/01/35 | | | 56,643 | | | | 62,585 | | |
5.000%, due 12/01/35 | | | 6,264 | | | | 6,897 | | |
5.000%, due 02/01/37 | | | 171,474 | | | | 188,589 | | |
5.000%, due 06/01/37 | | | 99,715 | | | | 109,771 | | |
5.000%, due 07/01/38 | | | 489,024 | | | | 537,473 | | |
| | | Face
amount | | Value | |
Federal home loan mortgage corporation
certificates*—(continued) | |
5.000%, due 11/01/38 | | $ | 531,905 | | | $ | 584,927 | | |
5.000%, due 06/01/39 | | | 125,682 | | | | 138,441 | | |
5.000%, due 08/01/39 | | | 52,016 | | | | 57,470 | | |
5.000%, due 03/01/40 | | | 14,121 | | | | 15,636 | | |
5.000%, due 07/01/40 | | | 801,107 | | | | 886,387 | | |
5.000%, due 08/01/40 | | | 112,443 | | | | 124,563 | | |
5.000%, due 09/01/40 | | | 322,915 | | | | 355,025 | | |
5.000%, due 11/01/40 | | | 519,610 | | | | 575,762 | | |
5.000%, due 02/01/41 | | | 886,196 | | | | 981,658 | | |
5.000%, due 03/01/41 | | | 60,033 | | | | 66,471 | | |
5.000%, due 04/01/41 | | | 2,053,267 | | | | 2,263,370 | | |
5.000%, due 05/01/41 | | | 420,399 | | | | 464,891 | | |
5.000%, due 06/01/41 | | | 129,073 | | | | 142,973 | | |
5.000%, due 07/01/41 | | | 78,401 | | | | 86,534 | | |
5.000%, due 08/01/44 | | | 180,376 | | | | 200,164 | | |
5.500%, due 06/01/28 | | | 2,828 | | | | 3,157 | | |
5.500%, due 02/01/32 | | | 3,585 | | | | 4,021 | | |
5.500%, due 12/01/32 | | | 4,970 | | | | 5,574 | | |
5.500%, due 02/01/33 | | | 96,446 | | | | 107,705 | | |
5.500%, due 05/01/33 | | | 1,891 | | | | 2,116 | | |
5.500%, due 06/01/33 | | | 299,746 | | | | 339,300 | | |
5.500%, due 12/01/33 | | | 110,910 | | | | 124,813 | | |
5.500%, due 12/01/34 | | | 90,228 | | | | 101,363 | | |
5.500%, due 06/01/351 | | | 1,590,338 | | | | 1,785,934 | | |
5.500%, due 07/01/35 | | | 10,807 | | | | 12,122 | | |
5.500%, due 10/01/35 | | | 371,017 | | | | 416,865 | | |
5.500%, due 12/01/35 | | | 241,660 | | | | 270,829 | | |
5.500%, due 06/01/36 | | | 884,253 | | | | 991,652 | | |
5.500%, due 12/01/361 | | | 1,469,871 | | | | 1,641,677 | | |
5.500%, due 03/01/37 | | | 181,859 | | | | 203,250 | | |
5.500%, due 07/01/37 | | | 95,600 | | | | 104,782 | | |
5.500%, due 10/01/37 | | | 9,267 | | | | 10,345 | | |
5.500%, due 04/01/38 | | | 282,001 | | | | 314,793 | | |
5.500%, due 05/01/38 | | | 33,824 | | | | 37,757 | | |
5.500%, due 12/01/38 | | | 6,179 | | | | 6,973 | | |
5.500%, due 01/01/39 | | | 126,091 | | | | 140,753 | | |
5.500%, due 09/01/39 | | | 387,269 | | | | 436,361 | | |
5.500%, due 02/01/40 | | | 18,682 | | | | 20,855 | | |
5.500%, due 03/01/40 | | | 14,665 | | | | 16,389 | | |
5.500%, due 05/01/40 | | | 253,222 | | | | 282,667 | | |
5.500%, due 02/01/41 | | | 74,216 | | | | 82,963 | | |
5.500%, due 03/01/41 | | | 267,977 | | | | 299,215 | | |
6.000%, due 11/01/37 | | | 2,448,639 | | | | 2,766,065 | | |
7.000%, due 08/01/25 | | | 373 | | | | 422 | | |
9.000%, due 04/01/25 | | | 30,329 | | | | 30,575 | | |
11.000%, due 12/01/15 | | | 52 | | | | 52 | | |
11.000%, due 06/01/19 | | | 229 | | | | 230 | | |
11.000%, due 09/01/20 | | | 194 | | | | 197 | | |
11.500%, due 01/01/16 | | | 272 | | | | 274 | | |
11.500%, due 01/01/18 | | | 444 | | | | 444 | | |
11.500%, due 06/01/19 | | | 11,309 | | | | 11,450 | | |
FHLMC ARM
2.262%, due 01/01/28 | | | 16,406 | | | | 17,024 | | |
2.332%, due 11/01/27 | | | 80,297 | | | | 83,450 | | |
2.356%, due 04/01/29 | | | 116,987 | | | | 122,950 | | |
17
PACE Select Advisors Trust
PACE Mortgage-Backed Securities Fixed Income Investments
Portfolio of investments—July 31, 2015
| | | Face
amount | | Value | |
Federal home loan mortgage corporation
certificates*—(concluded) | |
2.388%, due 07/01/24 | | $ | 148,129 | | | $ | 149,926 | | |
2.398%, due 10/01/23 | | | 52,542 | | | | 54,270 | | |
2.456%, due 11/01/29 | | | 320,451 | | | | 336,924 | | |
2.486%, due 06/01/28 | | | 262,024 | | | | 276,762 | | |
2.511%, due 07/01/28 | | | 110,099 | | | | 114,989 | | |
2.511%, due 12/01/29 | | | 59,978 | | | | 62,539 | | |
2.589%, due 01/01/29 | | | 171,597 | | | | 183,019 | | |
2.590%, due 10/01/27 | | | 206,754 | | | | 220,424 | | |
2.594%, due 11/01/25 | | | 187,668 | | | | 200,231 | | |
2.630%, due 10/01/27 | | | 199,028 | | | | 211,742 | | |
2.750%, due 01/01/30 | | | 30,308 | | | | 30,530 | | |
FHLMC TBA
3.000%1 | | | 46,000,000 | | | | 46,136,250 | | |
| 3.500% | | | 28,000,000 | | | | 28,932,977 | | |
| 4.000% | | | 19,000,000 | | | | 20,125,157 | | |
| 4.500% | | | 15,000,000 | | | | 16,237,404 | | |
Total federal home loan mortgage
corporation certificates
(cost—$146,346,500) | | | 147,754,034 | | |
Federal housing administration certificates—0.06% | |
FHA GMAC
7.400%, due 02/01/212 | | | 67,806 | | | | 67,696 | | |
FHA Reilly
6.896%, due 07/01/20 | | | 238,642 | | | | 238,642 | | |
Total federal housing administration
certificates
(cost—$306,803) | | | 306,338 | | |
Federal national mortgage association
certificates*—60.83% | |
FNMA
2.000%, due 05/01/28 | | | 292,357 | | | | 291,505 | | |
2.000%, due 08/01/28 | | | 401,245 | | | | 400,076 | | |
2.000%, due 10/01/28 | | | 1,948,079 | | | | 1,942,409 | | |
2.354%, due 03/01/23 | | | 1,821,377 | | | | 1,826,474 | | |
2.500%, due 06/01/28 | | | 400,763 | | | | 410,521 | | |
2.500%, due 07/01/28 | | | 3,198,361 | | | | 3,276,455 | | |
2.500%, due 08/01/28 | | | 122,763 | | | | 125,760 | | |
2.500%, due 07/01/29 | | | 518,456 | | | | 526,761 | | |
2.500%, due 12/01/29 | | | 28,982 | | | | 29,446 | | |
2.500%, due 01/01/30 | | | 1,884,042 | | | | 1,914,224 | | |
2.500%, due 04/01/30 | | | 25,179 | | | | 25,582 | | |
2.500%, due 05/01/301 | | | 48,089,462 | | | | 48,859,841 | | |
2.500%, due 06/01/30 | | | 7,033,207 | | | | 7,145,876 | | |
2.500%, due 07/01/301 | | | 51,192,642 | | | | 52,012,736 | | |
2.500%, due 08/01/30 | | | 1,171,099 | | | | 1,189,828 | | |
3.000%, due 10/01/42 | | | 873,832 | | | | 883,289 | | |
3.000%, due 01/01/43 | | | 3,426,553 | | | | 3,462,537 | | |
3.000%, due 04/01/43 | | | 1,301,564 | | | | 1,314,634 | | |
3.000%, due 05/01/43 | | | 1,362,932 | | | | 1,376,368 | | |
3.000%, due 06/01/43 | | | 191,690 | | | | 193,555 | | |
3.000%, due 09/01/43 | | | 1,526,034 | | | | 1,539,810 | | |
3.330%, due 07/01/22 | | | 3,886,000 | | | | 4,121,486 | | |
3.500%, due 11/01/25 | | | 963,561 | | | | 1,021,673 | | |
| | | Face
amount | | Value | |
Federal national mortgage association
certificates*—(continued) | |
3.500%, due 03/01/42 | | $ | 770,090 | | | $ | 802,208 | | |
3.500%, due 12/01/42 | | | 3,002,968 | | | | 3,129,002 | | |
3.500%, due 03/01/43 | | | 1,659,083 | | | | 1,728,670 | | |
3.500%, due 05/01/43 | | | 6,121,343 | | | | 6,395,361 | | |
3.500%, due 05/01/44 | | | 75,000 | | | | 77,905 | | |
3.500%, due 06/01/45 | | | 604,393 | | | | 627,807 | | |
3.500%, due 07/01/45 | | | 12,355,379 | | | | 12,834,487 | | |
3.600%, due 08/01/23 | | | 817,000 | | | | 880,589 | | |
3.765%, due 12/01/25 | | | 3,000,000 | | | | 3,218,824 | | |
4.000%, due 03/01/19 | | | 35,664 | | | | 37,414 | | |
4.000%, due 06/01/19 | | | 44,434 | | | | 46,618 | | |
4.000%, due 07/01/25 | | | 37,208 | | | | 39,047 | | |
4.000%, due 08/01/25 | | | 93,542 | | | | 98,971 | | |
4.000%, due 09/01/25 | | | 93,666 | | | | 99,228 | | |
4.000%, due 10/01/25 | | | 33,891 | | | | 36,052 | | |
4.000%, due 11/01/25 | | | 286,307 | | | | 305,478 | | |
4.000%, due 01/01/26 | | | 498,187 | | | | 529,735 | | |
4.000%, due 02/01/26 | | | 2,064,443 | | | | 2,202,344 | | |
4.000%, due 03/01/26 | | | 1,650,660 | | | | 1,758,426 | | |
4.000%, due 04/01/26 | | | 3,774,600 | | | | 4,026,990 | | |
4.000%, due 05/01/39 | | | 233,640 | | | | 250,356 | | |
4.000%, due 09/01/39 | | | 536,974 | | | | 577,314 | | |
4.000%, due 12/01/41 | | | 1,634,027 | | | | 1,757,573 | | |
4.000%, due 07/01/42 | | | 2,622,279 | | | | 2,828,845 | | |
4.000%, due 09/01/42 | | | 9,934,581 | | | | 10,686,520 | | |
4.000%, due 10/01/42 | | | 7,244,189 | | | | 7,792,512 | | |
4.500%, due 11/01/17 | | | 17,529 | | | | 18,279 | | |
4.500%, due 02/01/18 | | | 433,500 | | | | 452,054 | | |
4.500%, due 04/01/18 | | | 2,523,640 | | | | 2,631,652 | | |
4.500%, due 05/01/18 | | | 68,032 | | | | 70,944 | | |
4.500%, due 06/01/18 | | | 92,070 | | | | 96,010 | | |
4.500%, due 05/01/19 | | | 6,826 | | | | 7,119 | | |
4.500%, due 09/01/19 | | | 136,877 | | | | 143,235 | | |
4.500%, due 08/01/20 | | | 64,965 | | | | 67,808 | | |
4.500%, due 05/01/21 | | | 350,451 | | | | 365,451 | | |
4.500%, due 03/01/23 | | | 13,415 | | | | 14,432 | | |
4.500%, due 08/01/41 | | | 1,499,501 | | | | 1,654,545 | | |
5.000%, due 05/01/17 | | | 155,001 | | | | 162,260 | | |
5.000%, due 12/01/17 | | | 355,981 | | | | 372,653 | | |
5.000%, due 03/01/23 | | | 7,360 | | | | 7,976 | | |
5.000%, due 05/01/23 | | | 179,311 | | | | 194,547 | | |
5.000%, due 09/01/23 | | | 652,016 | | | | 720,709 | | |
5.000%, due 07/01/24 | | | 926,401 | | | | 1,024,002 | | |
5.000%, due 03/01/25 | | | 40,463 | | | | 44,725 | | |
5.000%, due 07/01/27 | | | 954,870 | | | | 1,055,470 | | |
5.000%, due 10/01/34 | | | 47,753 | | | | 52,784 | | |
5.000%, due 08/01/41 | | | 51,754 | | | | 57,351 | | |
5.500%, due 07/01/27 | | | 238,733 | | | | 267,681 | | |
5.500%, due 02/01/32 | | | 12,139 | | | | 13,616 | | |
5.500%, due 11/01/32 | | | 141,847 | | | | 159,062 | | |
5.500%, due 03/01/33 | | | 148,189 | | | | 166,048 | | |
5.500%, due 12/01/33 | | | 1,793 | | | | 2,032 | | |
5.500%, due 04/01/34 | | | 105,840 | | | | 119,635 | | |
5.500%, due 01/01/35 | | | 136,311 | | | | 152,840 | | |
5.500%, due 04/01/36 | | | 92,958 | | | | 104,261 | | |
18
PACE Select Advisors Trust
PACE Mortgage-Backed Securities Fixed Income Investments
Portfolio of investments—July 31, 2015
| | | Face
amount | | Value | |
Federal national mortgage association
certificates*—(continued) | |
5.500%, due 05/01/37 | | $ | 448,726 | | | $ | 507,014 | | |
5.500%, due 07/01/37 | | | 232,343 | | | | 262,661 | | |
5.500%, due 06/01/39 | | | 2,189,911 | | | | 2,475,028 | | |
5.500%, due 11/01/39 | | | 838,297 | | | | 949,924 | | |
6.000%, due 11/01/21 | | | 83,044 | | | | 88,548 | | |
6.000%, due 01/01/23 | | | 242,835 | | | | 260,640 | | |
6.000%, due 03/01/23 | | | 399,166 | | | | 439,956 | | |
6.000%, due 11/01/26 | | | 48,692 | | | | 55,171 | | |
6.000%, due 02/01/32 | | | 84,925 | | | | 96,291 | | |
6.000%, due 09/01/32 | | | 8,768 | | | | 9,934 | | |
6.000%, due 10/01/32 | | | 9,336 | | | | 10,586 | | |
6.000%, due 12/01/32 | | | 27,190 | | | | 31,120 | | |
6.000%, due 01/01/33 | | | 150,973 | | | | 171,337 | | |
6.000%, due 02/01/33 | | | 32,453 | | | | 36,770 | | |
6.000%, due 09/01/34 | | | 249,678 | | | | 284,196 | | |
6.000%, due 04/01/35 | | | 1,093 | | | | 1,239 | | |
6.000%, due 05/01/35 | | | 149,126 | | | | 169,208 | | |
6.000%, due 06/01/35 | | | 34,947 | | | | 39,927 | | |
6.000%, due 07/01/35 | | | 92,610 | | | | 105,408 | | |
6.000%, due 08/01/35 | | | 111,209 | | | | 126,110 | | |
6.000%, due 09/01/35 | | | 2,623 | | | | 2,989 | | |
6.000%, due 01/01/36 | | | 71,820 | | | | 81,396 | | |
6.000%, due 06/01/36 | | | 3,286 | | | | 3,727 | | |
6.000%, due 09/01/36 | | | 81,550 | | | | 92,943 | | |
6.000%, due 10/01/36 | | | 27,514 | | | | 31,236 | | |
6.000%, due 12/01/36 | | | 341,924 | | | | 391,792 | | |
6.000%, due 01/01/37 | | | 22,343 | | | | 25,312 | | |
6.000%, due 03/01/37 | | | 33,820 | | | | 38,769 | | |
6.000%, due 12/01/37 | | | 136,098 | | | | 154,203 | | |
6.000%, due 01/01/38 | | | 799,858 | | | | 906,498 | | |
6.000%, due 08/01/38 | | | 2,273 | | | | 2,576 | | |
6.000%, due 11/01/38 | | | 859,225 | | | | 981,855 | | |
6.000%, due 05/01/39 | | | 103,350 | | | | 118,153 | | |
6.000%, due 11/01/40 | | | 1,184,038 | | | | 1,356,805 | | |
6.500%, due 07/01/19 | | | 10,487 | | | | 12,037 | | |
6.500%, due 10/01/36 | | | 572,701 | | | | 657,316 | | |
6.500%, due 02/01/37 | | | 8,673 | | | | 10,332 | | |
6.500%, due 07/01/37 | | | 71,463 | | | | 82,021 | | |
6.500%, due 08/01/37 | | | 157,691 | | | | 180,989 | | |
6.500%, due 09/01/37 | | | 158,316 | | | | 181,706 | | |
6.500%, due 12/01/37 | | | 255,694 | | | | 293,472 | | |
6.500%, due 08/01/38 | | | 3,374 | | | | 3,872 | | |
6.500%, due 05/01/40 | | | 2,585,482 | | | | 2,967,479 | | |
7.500%, due 11/01/26 | | | 20,377 | | | | 20,867 | | |
8.000%, due 11/01/26 | | | 14,802 | | | | 15,506 | | |
9.000%, due 02/01/26 | | | 16,712 | | | | 19,057 | | |
10.500%, due 08/01/20 | | | 88 | | | | 89 | | |
10.500%, due 04/01/22 | | | 9 | | | | 9 | | |
FNMA ARM
1.356%, due 03/01/44 | | | 354,476 | | | | 363,688 | | |
1.645%, due 07/01/30 | | | 21,430 | | | | 21,751 | | |
1.680%, due 10/01/26 | | | 210,876 | | | | 213,793 | | |
2.205%, due 02/01/26 | | | 37,262 | | | | 37,401 | | |
2.220%, due 09/01/26 | | | 22,021 | | | | 22,117 | | |
2.366%, due 05/01/30 | | | 43,282 | | | | 45,156 | | |
| | | Face
amount | | Value | |
Federal national mortgage association
certificates*—(concluded) | | | |
2.377%, due 02/01/30 | | $ | 5,587 | | | $ | 5,615 | | |
2.546%, due 03/01/25 | | | 99,763 | | | | 104,640 | | |
2.621%, due 12/01/27 | | | 22,457 | | | | 23,351 | | |
FNMA TBA
3.000% | | | 30,500,000 | | | | 30,944,089 | | |
| 3.500% | | | 37,500,000 | | | | 38,848,270 | | |
| 4.000% | | | 10,000,000 | | | | 10,613,671 | | |
| 4.500% | | | 9,500,000 | | | | 10,289,316 | | |
| 5.000% | | | 4,000,000 | | | | 4,417,033 | | |
| 5.500% | | | 3,000,000 | | | | 3,365,156 | | |
| 6.000% | | | 1,000,000 | | | | 1,134,966 | | |
Total federal national mortgage
association certificates
(cost—$318,621,279) | | | 322,062,390 | | |
Collateralized mortgage obligations—13.91% | | | |
Alternative Loan Trust,
Series 2003-16T1, Class A2
0.661%, due 09/25/333 | | | 91,595 | | | | 90,283 | | |
Series 2004-J7, Class 2A1
0.967%, due 09/25/343 | | | 125,999 | | | | 123,494 | | |
ARM Trust,
Series 2005-8, Class 3A21
2.774%, due 11/25/353 | | | 1,411,435 | | | | 1,198,861 | | |
BAMLL Commercial Mortgage
Securities Trust, Series 2015-ASHF,
Class A
1.407%, due 01/15/283,4 | | | 500,000 | | | | 497,174 | | |
BCAP LLC 2010-RR1 Trust,
Series 2010-RR1, Class 1A4
2.792%, due 03/26/373,4 | | | 315,719 | | | | 250,547 | | |
BCAP LLC 2011-RR6-I Trust,
Series 2011-RR6, Class 11A1
0.437%, due 07/26/353,4 | | | 121,827 | | | | 120,560 | | |
BCAP LLC 2011-RR10 Trust,
Series 2011-RR10, Class 3A5
2.648%, due 06/26/353,4 | | | 407,400 | | | | 408,033 | | |
BCAP LLC 2011-RR11 Trust,
Series 2011-R11, Class 8A5
0.387%, due 07/26/363,4 | | | 412,564 | | | | 390,652 | | |
Series 2011-R11, Class 22A1
1.673%, due 10/26/353,4 | | | 243,537 | | | | 243,842 | | |
BCAP LLC 2013-RR1 Trust,
Series 2013-RR1, Class 3A4 | |
7.425%, due 10/26/373,4 | | | 482,468 | | | | 448,187 | | |
BCAP LLC 2013-RR5 Trust,
Series 2013-RR5, Class 5A1 | |
0.986%, due 11/26/463,4 | | | 372,547 | | | | 357,555 | | |
BCAP LLC 2014-RR1 Trust,
Series 2014-RR1, Class 3A1 | |
0.347%, due 03/26/373,4 | | | 123,860 | | | | 121,126 | | |
Bear Stearns ARM Trust, | |
Series 2002-011, Class 1A2
2.595%, due 02/25/333 | | | 14,895 | | | | 13,877 | | |
19
PACE Select Advisors Trust
PACE Mortgage-Backed Securities Fixed Income Investments
Portfolio of investments—July 31, 2015
| | | Face
amount | | Value | |
Collateralized mortgage obligations—(continued) | |
Series 2004-002, Class 12A2
2.699%, due 05/25/343 | | $ | 84,406 | | | $ | 82,447 | | |
Bear Stearns Asset-Backed
Securities Trust,
Series 2003-AC5, Class A1
5.750%, due 10/25/335 | | | 1,205,741 | | | | 1,255,677 | | |
Series 2004-AC3, Class A2
6.000%, due 06/25/345 | | | 1,509,048 | | | | 1,542,426 | | |
Chevy Chase Mortgage Funding
Corp., Series 2004-1, Class A1
0.471%, due 01/25/353,4 | | | 151,964 | | | | 136,602 | | |
CHL Mortgage Pass-Through Trust,
Series 2003-HYB1, Class 1A1
2.704%, due 05/19/333 | | | 7,106 | | | | 6,988 | | |
CSMC Trust,
Series 2013-5R, Class 1A1
0.449%, due 02/27/363,4 | | | 663,735 | | | | 629,462 | | |
Series 2013-MH1, Class A
4.792%, due 05/27/533,6 | | | 1,078,426 | | | | 1,115,340 | | |
FHLMC REMIC,
Series 0023, Class KZ
6.500%, due 11/25/23 | | | 30,273 | | | | 34,029 | | |
Series 0159, Class H
4.500%, due 09/15/21 | | | 7,274 | | | | 7,616 | | |
Series 1003, Class H
0.937%, due 10/15/203 | | | 12,917 | | | | 13,076 | | |
Series 1349, Class PS
7.500%, due 08/15/22 | | | 1,592 | | | | 1,800 | | |
Series 1502, Class PX
7.000%, due 04/15/23 | | | 214,007 | | | | 235,986 | | |
Series 1534, Class Z
5.000%, due 06/15/23 | | | 94,906 | | | | 101,970 | | |
Series 1573, Class PZ
7.000%, due 09/15/23 | | | 31,881 | | | | 35,575 | | |
Series 1658, Class GZ
7.000%, due 01/15/24 | | | 15,400 | | | | 17,374 | | |
Series 1694, Class Z
6.500%, due 03/15/24 | | | 132,395 | | | | 147,736 | | |
Series 1775, Class Z
8.500%, due 03/15/25 | | | 3,948 | | | | 4,584 | | |
Series 2400, Class FQ
0.687%, due 01/15/323 | | | 266,881 | | | | 270,473 | | |
Series 2411, Class FJ
0.537%, due 12/15/293 | | | 29,940 | | | | 30,093 | | |
Series 2614, Class WO
0.000%, due 05/15/334,7 | | | 2,036,347 | | | | 1,846,148 | | |
Series 3096, Class FL
0.587%, due 01/15/363 | | | 262,054 | | | | 263,340 | | |
Series 3114, Class PF
0.587%, due 02/15/363 | | | 1,320,284 | | | | 1,330,069 | | |
Series 3153, Class UF
0.617%, due 05/15/363 | | | 287,547 | | | | 289,363 | | |
Series 3339, Class LI
6.293%, due 07/15/373,4,8 | | | 1,735,342 | | | | 253,556 | | |
Series 3442, Class MT
0.187%, due 07/15/343,4 | | | 168,815 | | | | 166,297 | | |
| | | Face
amount | | Value | |
Collateralized mortgage obligations—(continued) | |
Series 3667, Class FW
0.737%, due 02/15/383 | | $ | 259,130 | | | $ | 262,372 | | |
Series 3671, Class FQ
1.037%, due 12/15/363 | | | 2,594,046 | | | | 2,651,177 | | |
Series 3864, Class NT
5.500%, due 03/15/393 | | | 1,372,290 | | | | 1,502,168 | | |
Series 4037, Class PI
3.000%, due 04/15/274,8 | | | 5,934,801 | | | | 593,777 | | |
Series 4136, Class EZ
3.000%, due 11/15/42 | | | 1,844,172 | | | | 1,697,967 | | |
Series 4182, Class YI
2.500%, due 03/15/284,8 | | | 8,401,132 | | | | 862,548 | | |
Series 4255, Class SN
11.769%, due 05/15/353 | | | 675,965 | | | | 727,286 | | |
Series 4263, Class SD
11.767%, due 11/15/433,4 | | | 913,657 | | | | 1,058,538 | | |
Series 4265, Class ES
13.163%, due 11/15/433,4 | | | 2,129,166 | | | | 2,203,534 | | |
Series 4326, Class SB
11.636%, due 04/15/443,4 | | | 537,783 | | | | 560,130 | | |
FNMA REMIC,
Trust 1987-002, Class Z
11.000%, due 11/25/17 | | | 4,838 | | | | 4,887 | | |
Trust 1988-007, Class Z
9.250%, due 04/25/18 | | | 49,178 | | | | 52,559 | | |
Trust 1992-129, Class L
6.000%, due 07/25/22 | | | 4,062 | | | | 4,395 | | |
Trust 1992-158, Class ZZ
7.750%, due 08/25/22 | | | 12,000 | | | | 13,422 | | |
Trust 1993-037, Class PX
7.000%, due 03/25/23 | | | 165,106 | | | | 183,864 | | |
Trust 1993-250, Class Z
7.000%, due 12/25/23 | | | 138 | | | | 138 | | |
Trust 1997-022, Class F
0.644%, due 03/25/273 | | | 167,548 | | | | 164,746 | | |
Trust 2002-060, Class F1
0.591%, due 06/25/323 | | | 118,247 | | | | 118,016 | | |
Trust 2006-112, Class LF
0.741%, due 11/25/363 | | | 3,586,650 | | | | 3,629,339 | | |
Trust 2007-067, Class FB
0.511%, due 07/25/373 | | | 1,051,908 | | | | 1,057,526 | | |
Trust 2009-033, Class FB
1.011%, due 03/25/373 | | | 1,681,772 | | | | 1,716,810 | | |
Trust 2010-035, Class EF
0.741%, due 04/25/403 | | | 441,676 | | | | 446,935 | | |
Trust 2010-141, Class FA
0.691%, due 12/25/403 | | | 939,447 | | | | 947,563 | | |
Trust 2012-090, Class FB
0.631%, due 08/25/423 | | | 466,049 | | | | 468,317 | | |
Trust 2012-111, Class HS
3.508%, due 10/25/423 | | | 230,226 | | | | 189,619 | | |
Trust 2012-128, Class FK
0.541%, due 11/25/423 | | | 755,180 | | | | 765,895 | | |
Trust 2013-010, Class US
7.542%, due 02/25/433 | | | 349,487 | | | | 349,002 | | |
20
PACE Select Advisors Trust
PACE Mortgage-Backed Securities Fixed Income Investments
Portfolio of investments—July 31, 2015
| | | Face
amount | | Value | |
Collateralized mortgage obligations—(continued) | |
Trust 2013-028, Class YS
5.960%, due 07/25/423,4,8 | | $ | 1,730,858 | | | $ | 346,689 | | |
Trust 2013-030, Class GI
3.000%, due 01/25/434,8 | | | 5,254,636 | | | | 790,663 | | |
Trust 2013-030, Class JI
3.000%, due 04/25/434,8 | | | 1,807,975 | | | | 252,020 | | |
Trust 2013-034, Class PS
5.960%, due 08/25/423,4,8 | | | 1,372,011 | | | | 270,651 | | |
Trust 2013-044, Class ZG
3.500%, due 03/25/42 | | | 1,088,828 | | | | 1,044,014 | | |
Trust 2013-045, Class IK
3.000%, due 02/25/434,8 | | | 3,352,699 | | | | 499,322 | | |
Trust 2013-116, Class IY
3.000%, due 09/25/434,8 | | | 1,028,838 | | | | 143,778 | | |
Trust G92-040, Class ZC
7.000%, due 07/25/22 | | | 17,079 | | | | 18,757 | | |
Trust G94-006, Class PJ
8.000%, due 05/17/24 | | | 23,659 | | | | 27,271 | | |
GMAC Mortgage Loan Trust,
Series 2004-AR1, Class 12A | |
3.034%, due 06/25/343 | | | 43,630 | | | | 44,339 | | |
GNMA REMIC,
Trust 2000-009, Class FH
0.687%, due 02/16/303 | | | 18,813 | | | | 18,930 | | |
Trust 2000-035, Class F
0.737%, due 12/16/253 | | | 139,885 | | | | 141,756 | | |
Trust 2007-018, Class CO
0.010%, due 03/20/354,7 | | | 30,108 | | | | 22,944 | | |
Trust 2010-H01, Class FA
1.006%, due 01/20/603 | | | 4,620,919 | | | | 4,666,749 | | |
Trust 2013-H19, Class DF
0.833%, due 05/20/633 | | | 1,831,160 | | | | 1,846,186 | | |
Trust 2013-H20, Class FB
1.183%, due 08/20/633 | | | 2,828,200 | | | | 2,903,752 | | |
Trust 2013-H23, Class TA
0.903%, due 09/20/633 | | | 1,081,734 | | | | 1,094,688 | | |
GS Mortgage Securities Trust,
Series 2015-GC28, Class AAB | |
3.206%, due 02/10/48 | | | 1,200,000 | | | | 1,225,876 | | |
GSR Mortgage Loan Trust,
Series 2004-14, Class 2A1 | |
0.521%, due 12/25/343 | | | 12,551 | | | | 11,284 | | |
Indymac Index Mortgage Loan
Trust, Series 2005-AR2, Class 2A1A
0.511%, due 02/25/353 | | | 767,140 | | | | 709,387 | | |
JPMorgan Alternative Loan Trust,
Series 2008-R4, Class 2A1
0.686%, due 06/27/373,4 | | | 2,294,337 | | | | 1,895,434 | | |
JPMorgan Resecuritization Trust,
Series 2009-7, Class 1A1 | |
2.710%, due 08/27/373,4 | | | 199,874 | | | | 201,888 | | |
LB Commercial Conduit Mortgage
Trust, Series 2007-C3, Class A4 | |
5.899%, due 07/15/443 | | | 2,460,578 | | | | 2,610,568 | | |
| | | Face
amount | | Value | |
Collateralized mortgage obligations—(continued) | |
Merrill Lynch Mortgage
Investors Trust,
Series 2004-1, Class 2A2
2.165%, due 12/25/343 | | $ | 496,547 | | | $ | 497,066 | | |
Series 2004-A, Class A1
0.651%, due 04/25/293 | | | 119,104 | | | | 114,318 | | |
Morgan Stanley Mortgage
Loan Trust,
Series 2004-11AR, Class 1A1
0.511%, due 01/25/353 | | | 102,194 | | | | 95,294 | | |
Series 2005-6AR, Class 1A1
0.471%, due 11/25/353 | | | 196,797 | | | | 189,922 | | |
Morgan Stanley Re-REMIC Trust,
Series 2010-R4, Class 4B
0.507%, due 02/26/373,4 | | | 409,095 | | | | 271,067 | | |
Series 2013-R10, Class 3A
0.497%, due 01/26/513,4 | | | 632,352 | | | | 600,007 | | |
Mortgage Equity Conversion
Asset Trust, Series 2006-SFG3,
Class A 0.780%, due 10/25/413,4 | | | 1,295,425 | | | | 1,062,248 | | |
Series 2007-FF3, Class A
0.740%, due 05/25/423,4 | | | 4,661,672 | | | | 4,061,715 | | |
Opteum Mortgage Acceptance
Corp., Asset Backed Pass-Through
Certificates, Series 2005-2,
Class AII2 0.501%, due 04/25/353 | | | 167,286 | | | | 164,495 | | |
RALI, Series 2005-QA1 Trust,
Series 2005-FQA1, Class A1
0.491%, due 01/25/353 | | | 223,392 | | | | 213,271 | | |
RBSSP Resecuritization Trust
Certificate, Series 2009-6,
Class 18A1 0.691%,
due 12/26/363,4 | | | 1,613,115 | | | | 1,566,493 | | |
Sequoia Mortgage Trust,
Series 5, Class A
0.888%, due 10/19/263 | | | 206,613 | | | | 201,727 | | |
Structured ARM Loan,
Series 2007-4, Class 1A2
0.411%, due 05/25/373 | | | 363,871 | | | | 297,852 | | |
Structured Asset Mortgage
Investments, Inc.,
Series 2006-AR3, Class 11A1
0.401%, due 04/25/363 | | | 1,169,892 | | | | 839,287 | | |
Series 2007-AR5, Class A2
0.741%, due 09/25/473 | | | 5,789,514 | | | | 3,574,805 | | |
Thornburg Mortgage Securities Trust,
Series 2005-1, Class A3
2.230%, due 04/25/453 | | | 187,512 | | | | 188,001 | | |
Washington Mutual Commercial
Mortgage Securities Trust,
Series 2007-SL3, Class A1A
5.336%, due 03/23/453,4 | | | 512,684 | | | | 520,546 | | |
21
PACE Select Advisors Trust
PACE Mortgage-Backed Securities Fixed Income Investments
Portfolio of investments—July 31, 2015
| | | Face
amount | | Value | |
Collateralized mortgage obligations—(concluded) | |
Washington Mutual Mortgage
Pass-Through Certificates,
Series 2003-AR9, Class 1A6
2.411%, due 09/25/333 | | $ | 1,633,230 | | | $ | 1,649,175 | | |
Series 2003-AR9, Class 2A
2.443%, due 09/25/333 | | | 427,943 | | | | 424,488 | | |
Total collateralized mortgage obligations
(cost—$72,664,462) | | | 73,633,471 | | |
Asset-backed securities—6.17% | |
ALM V Ltd.,
Series 2012-5A, Class A1R
1.507%, due 02/13/233,4 | | | 1,200,000 | | | | 1,198,460 | | |
Ameriquest Mortgage
Securities, Inc., Asset-Backed
Pass-Through Certificates,
Series 2004-R9, Class M2
1.166%, due 10/25/343 | | | 1,275,000 | | | | 1,261,903 | | |
Series 2005-R1, Class M4
1.301%, due 03/25/353 | | | 200,000 | | | | 160,140 | | |
Series 2005-R11, Class M1
0.641%, due 01/25/363 | | | 400,000 | | | | 372,087 | | |
Amortizing Residential
Collateral Trust,
Series 2004-1, Class A5 | |
1.191%, due 10/25/343 | | | 330,488 | | | | 324,660 | | |
Bear Stearns Asset-Backed
Securities Trust, | |
Series 2004-2, Class M1
1.387%, due 08/25/343 | | | 7,485,131 | | | | 6,791,799 | | |
Series 2006-2, Class M1
0.611%, due 07/25/363 | | | 200,000 | | | | 197,443 | | |
Chase Funding Trust,
Series 2002-3, Class 2A1
0.831%, due 08/25/323 | | | 194,746 | | | | 177,823 | | |
Series 2002-4, Class 2A1
0.931%, due 10/25/323 | | | 11,720 | | | | 10,879 | | |
Countrywide Asset-Backed
Certificates,
Series 2004-2, Class 3A4
0.691%, due 07/25/343 | | | 80,086 | | | | 73,813 | | |
Series 2004-4, Class M1
0.911%, due 07/25/343 | | | 275,826 | | | | 259,608 | | |
Series 2004-6, Class M1
1.091%, due 10/25/343 | | | 821,679 | | | | 793,122 | | |
Series 2005-8, Class M1
0.661%, due 12/25/353 | | | 1,240,517 | | | | 1,238,186 | | |
Series 2005-13, Class 3AV3
0.437%, due 04/25/363 | | | 245,885 | | | | 244,240 | | |
Dryden Senior Loan Fund,
Series 2011-22A, Class A1R | |
1.459%, due 01/15/223,4 | | | 483,093 | | | | 482,340 | | |
EMC Mortgage Loan Trust,
Series 2003-A, Class A2 | |
0.941%, due 08/25/403,4 | | | 156,581 | | | | 153,461 | | |
| | | Face
amount | | Value | |
Asset-backed securities—(continued) | |
FBR Securitization Trust,
Series 2005-5, Class AV24
0.927%, due 11/25/353 | | $ | 211,964 | | | $ | 210,051 | | |
First Franklin Mortgage Loan
Trust, Series 2005-FFH1, Class M1
0.641%, due 06/25/363 | | | 219,092 | | | | 210,545 | | |
Fremont Home Loan Trust,
Series 2004-A, Class M1 | |
1.016%, due 01/25/343 | | | 752,670 | | | | 684,505 | | |
Green Tree Financial Corp.,
Series 1998-2, Class A5 | |
6.240%, due 12/01/283 | | | 21,828 | | | | 22,453 | | |
GSAA Home Equity Trust,
Series 2005-4, Class A5 | |
0.411%, due 03/25/353 | | | 871,808 | | | | 859,510 | | |
JP Morgan Mortgage
Acquisition Corp.,
Series 2005-FRE1, Class A2F3
3.324%, due 10/25/355 | | | 148,141 | | | | 141,728 | | |
Series 2006-FRE1, Class A1
0.421%, due 05/25/353 | | | 517,656 | | | | 502,712 | | |
Series 2006-FRE1, Class A3
0.381%, due 05/25/353 | | | 447,810 | | | | 439,964 | | |
Series 2006-FRE2, Class A1
0.371%, due 02/25/363 | | | 462,750 | | | | 442,049 | | |
JP Morgan Mortgage
Acquisition Trust,
Series 2006-ACC1, Class A1
0.347%, due 05/25/363 | | | 501,133 | | | | 483,490 | | |
Series 2006-ACC1, Class M1
0.457%, due 05/25/363 | | | 300,000 | | | | 249,536 | | |
Series 2006-CH1, Class A5
0.415%, due 07/25/363 | | | 225,000 | | | | 214,811 | | |
Series 2007-CH2, Class AV1
0.351%, due 01/25/373 | | | 899,902 | | | | 875,202 | | |
Merrill Lynch Mortgage
Investors Trust,
Series 2006-FF1, Class M3 | |
0.501%, due 08/25/363 | | | 300,000 | | | | 270,976 | | |
Park Place Securities, Inc.,
Asset-Backed Pass Through
Certificates, Series 2005-WHQ3,
Class M4 1.136%, due 06/25/353 | | | 200,000 | | | | 173,023 | | |
RAAC, Series 2005-SP3 Trust,
Series 2005-SP3, Class M1
0.721%, due 12/25/353 | | | 1,500,000 | | | | 1,417,676 | | |
RASC, Series 2005-KS11 Trust,
Series 2005-KS11, Class M2
0.611%, due 12/25/353 | | | 400,000 | | | | 339,469 | | |
Renaissance Home Equity
Loan Trust,
Series 2003-2, Class A
1.067%, due 08/25/333 | | | 220,670 | | | | 207,269 | | |
Saturn CLO Ltd.,
Series 2007-1A, Class A1
0.502%, due 05/13/223,4 | | | 906,604 | | | | 900,190 | | |
22
PACE Select Advisors Trust
PACE Mortgage-Backed Securities Fixed Income Investments
Portfolio of investments—July 31, 2015
| | | Face
amount | | Value | |
Asset-backed securities—(concluded) | |
Securitized Asset-Backed
Receivables LLC Trust,
Series 2005-FR5, Class A1B
0.471%, due 08/25/353 | | $ | 253,416 | | | $ | 251,169 | | |
SLM Student Loan Trust,
Series 2008-9, Class A
1.795%, due 04/25/233 | | | 3,588,725 | | | | 3,606,640 | | |
Series 2010-A, Class 2A
3.437%, due 05/16/443,4 | | | 1,092,171 | | | | 1,141,681 | | |
Specialty Underwriting &
Residential Financing,
Series 2003-BC1, Class A | |
0.871%, due 01/25/343 | | | 63,563 | | | | 55,033 | | |
Stone Tower CLO Ltd.,
Series 2007-6A, Class A1
0.519%, due 04/17/213,4 | | | 250,777 | | | | 246,611 | | |
Symphony CLO Ltd.,
Series 2012-10AR, Class AR
1.564%, due 07/23/233,4 | | | 5,000,000 | | | | 4,994,805 | | |
Total asset-backed securities
(cost—$32,596,476) | | | 32,681,062 | | |
Stripped mortgage-backed securities—1.27% | |
FHLMC Multifamily Structured
Pass-Through Certificates,* | |
Series K005, Class AX
1.372%, due 11/25/193,4,8 | | | 23,674,910 | | | | 1,227,000 | | |
Series K006, Class AX1
1.015%, due 01/25/203,4,8 | | | 13,465,358 | | | | 509,179 | | |
Series K014, Class X1
1.236%, due 04/25/213,4,8 | | | 7,887,129 | | | | 468,164 | | |
Series K027, Class X1
0.835%, due 01/25/233,4,8 | | | 7,016,878 | | | | 345,069 | | |
Series K712, Class X1
1.385%, due 11/25/193,4,8 | | | 4,578,300 | | | | 219,630 | | |
Series KAIV, Class X1
1.351%, due 06/25/213,4,8 | | | 4,735,514 | | | | 283,994 | | |
FHLMC REMIC,*
Series 0013, Class B
7.000%, due 06/25/234,8 | | | 65,771 | | | | 13,496 | | |
Series 2136, Class GD
7.000%, due 03/15/294,8 | | | 5,374 | | | | 732 | | |
Series 2178, Class PI
7.500%, due 08/15/294,8 | | | 28,777 | | | | 4,133 | | |
FNMA Aces, Trust 2013-M5,
Class X2 2.350%, due 01/25/22*,3,4,8 | | | 2,125,781 | | | | 219,829 | | |
GNMA REMIC, Trust 2011-92,
Class IX 0.750%, due 11/16/443,4,8 | | | 16,591,986 | | | | 934,477 | | |
KGS Alpha SBA, Series 2012
1.081%, due 04/25/382,3,6,8 | | | 58,955,343 | | | | 2,512,091 | | |
Total stripped mortgage-backed securities
(cost—$6,526,432) | | | 6,737,794 | | |
| | | Face
amount | | Value | |
Short-term US government and agency obligations9—6.04% | |
Federal Home Loan Bank
Discount Notes
0.095%, due 11/04/15 | | $ | 5,800,000 | | | $ | 5,798,546 | | |
0.100%, due 11/03/15 | | | 2,500,000 | | | | 2,499,347 | | |
0.100%, due 11/16/15 | | | 9,000,000 | | | | 8,997,325 | | |
0.123%, due 10/30/15 | | | 300,000 | | | | 299,908 | | |
0.165%, due 01/15/16 | | | 2,000,000 | | | | 1,998,469 | | |
0.190%, due 01/22/16 | | | 700,000 | | | | 699,532 | | |
0.191%, due 01/20/16 | | | 3,500,000 | | | | 3,497,687 | | |
Federal National Mortgage
Association Discount Notes | |
0.140%, due 01/13/16 | | | 1,800,000 | | | | 1,798,845 | | |
0.145%, due 01/13/16 | | | 4,800,000 | | | | 4,796,810 | | |
US Treasury Bill
0.113%, due 01/14/161 | | | 1,586,000 | | | | 1,585,122 | | |
Total short-term US government and agency
obligations
(cost—$31,970,536) | | | 31,971,591 | | |
Repurchase agreement—0.05% | |
Repurchase agreement dated
07/31/15 with State Street
Bank and Trust Co., 0.000%
due 08/03/15, collateralized by
$73,040 Federal Home Loan
Mortgage Corp. obligation,
2.080% due 10/17/22,
$18,330 Federal National
Mortgage Association obligation,
2.170% due 10/17/22 and
$163,436 US Treasury Notes,
1.625% to 3.625%
due 03/31/19 to 06/30/20;
(value-$259,084);
proceeds: $254,000
(cost—$254,000) | | | 254,000 | | | | 254,000 | | |
| | Notional
amount | | | |
Options purchased6—0.00%†† | |
Put swaptions purchased—0.00%†† | |
3 Month USD LIBOR 10 Year
Swap, strike @ 2.450%, expires
08/04/15 (Counterparty:
GSB; receive floating rate);
underlying swap terminates
08/06/25 | | USD | 9,000,000 | | | | 446 | | |
23
PACE Select Advisors Trust
PACE Mortgage-Backed Securities Fixed Income Investments
Portfolio of investments—July 31, 2015
| | Notional
amount | | Value | |
Options purchased6—(concluded) | |
Put swaptions purchased—(concluded) | |
3 Month USD LIBOR 10 Year
Swap, strike @ 2.500%, expires
08/04/15 (Counterparty:
MSCI; receive floating rate);
underlying swap terminates
08/06/25 | | USD | 21,000,000 | | | $ | 147 | | |
Total put swaptions purchased | | | | | 593 | | |
Total options purchased
(cost—$289,650) | | | | | 593 | | |
Total investments before
investments sold short
(cost—$814,140,965)—155.15% | | | | | 821,387,743 | | |
| | Face
amount | |
Value | |
Investments sold short—(32.75)% | | | |
FHLMC TBA*
3.000% | | $ | (37,000,000 | ) | | $ | (37,115,625 | ) | |
| 5.500% | | | (2,000,000 | ) | | | (2,236,250 | ) | |
FNMA TBA*
2.500% | | | (95,000,000 | ) | | | (96,425,000 | ) | |
| 3.000% | | | (3,000,000 | ) | | | (3,010,029 | ) | |
| 4.000% | | | (1,000,000 | ) | | | (1,049,062 | ) | |
GNMA TBA
3.000% | | | (23,000,000 | ) | | | (23,391,718 | ) | |
GNMA II TBA
3.000% | | | (10,000,000 | ) | | | (10,170,312 | ) | |
Total investments sold short
(proceeds—$171,712,656) | | | (173,397,996 | ) | |
Liabilities in excess of
other assets—(22.40)% | | | | | (118,567,422 | ) | |
Net assets—100.00% | | | | $ | 529,422,325 | | |
For a listing of defined portfolio acronyms that are used throughout the Portfolio of investments as well as the tables that follow, please refer to page 254.
Aggregate cost for federal income tax purposes before investments sold short was $814,463,155; and net unrealized appreciation
consisted of:
Gross unrealized appreciation | | $ | 10,570,913 | | |
Gross unrealized depreciation | | | (3,646,325 | ) | |
Net unrealized appreciation | | $ | 6,924,588 | | |
Written options*
Notional
amount | | Call options written | | Expiration
date | | Premiums
received | | Current
value | | Unrealized
appreciation
(depreciation) | |
$ | 13,000,000 | | | FNMA TBA, 3.500%, strike @ 103.33 | | 08/06/15 | | $ | 30,469 | | | $ | (70,195 | ) | | $ | (39,726 | ) | |
| | 12,000,000 | | | FNMA TBA, 3.500%, strike @ 103.36 | | 08/06/15 | | | 29,999 | | | | (61,911 | ) | | | (31,912 | ) | |
| | 9,000,000 | | | FNMA TBA, 3.500%, strike @ 103.42 | | 08/06/15 | | | 17,578 | | | | (42,238 | ) | | | (24,660 | ) | |
| | | | | | | | | $ | 78,046 | | | $ | (174,344 | ) | | $ | (96,298 | ) | |
| | | Put options written | | | | | | | | | |
$ | 6,000,000 | | | FNMA TBA, 3.500%, strike @ 101.06 | | 08/06/15 | | $ | 20,627 | | | $ | (1 | ) | | $ | 20,626 | | |
| | 5,000,000 | | | FNMA TBA, 3.500%, strike @ 101.50 | | 08/06/15 | | | 10,938 | | | | (6 | ) | | | 10,932 | | |
| | 7,000,000 | | | FNMA TBA, 3.500%, strike @ 102.73 | | 08/06/15 | | | 27,890 | | | | (1,021 | ) | | | 26,869 | | |
| | | | | | | | | $ | 59,455 | | | $ | (1,028 | ) | | $ | 58,427 | | |
| | | | | | | | | $ | 137,501 | | | $ | (175,372 | ) | | $ | (37,871 | ) | |
24
PACE Select Advisors Trust
PACE Mortgage-Backed Securities Fixed Income Investments
Portfolio of investments—July 31, 2015
Written options activity for the year ended July 31, 2015 was as follows:
| | | Notional
amount | | Premiums
received | |
Options outstanding at July 31, 2014 | | $ | 42,000,000 | | | $ | 111,641 | | |
Options written | | | 428,000,000 | | | | 950,821 | | |
Options terminated in closing purchase transactions | | | (9,000,000 | ) | | | (21,797 | ) | |
Options exercised | | | (150,000,000 | ) | | | (345,547 | ) | |
Options expired prior to exercise | | | (259,000,000 | ) | | | (557,617 | ) | |
Options outstanding at July 31, 2015 | | $ | 52,000,000 | | | $ | 137,501 | | |
Written swaptions6
Notional
amount
(000) | | Call swaptions written | | Counterparty | | Pay/
receive
floating
rate | | Expiration
date | | Premiums
received | | Current
value | | Unrealized
appreciation
(depreciation) | |
USD | 32,000 | | | 3 Month USD LIBOR Interest
Rate Swap strike @ 2.200%,
terminating 02/03/26 | | JPMCB | | Receive | | 02/01/16 | | $ | 972,800 | | | $ | (378,816 | ) | | $ | 593,984 | | |
| | | Put swaptions written | | | | | | | | | | | | | |
USD | 32,000 | | | 3 Month USD LIBOR Interest
Rate Swap strike @ 2.200%,
terminating 02/03/26 | | JPMCB | | Pay | | 02/01/16 | | $ | 972,800 | | | $ | (1,094,944 | ) | | $ | (122,144 | ) | |
| | | | | | | | | | | $ | 1,945,600 | | | $ | (1,473,760 | ) | | $ | 471,840 | | |
Written Swaption activity for the year ended July 31, 2015 was as follows:
| | | Premiums
received | |
Swaption outstanding at July 31, 2014 | | $ | — | | |
Swaption written | | | 2,647,837 | | |
Swaption terminated in closing purchase transactions | | | (525,935 | ) | |
Swaption expired prior to exercise | | | (176,302 | ) | |
Swaption outstanding at July 31, 2015 | | $ | 1,945,600 | | |
Centrally cleared interest rate swap agreements
Notional
amount
(000) | | Termination
date | | Payments made by
the Portfolio10 | | Payments received by
the Portfolio10 | | Value | | Unrealized
appreciation
(depreciation) | |
USD | 16,000 | | | 06/30/25 | | | 2.400 | % | | 3 Month USD LIBOR | | $ | (188,377 | ) | | $ | (188,377 | ) | |
USD | 10,000 | | | 07/09/25 | | | 2.220 | | | 3 Month USD LIBOR | | | 54,915 | | | | 54,915 | | |
| | | | | | | | | $ | (133,462 | ) | | $ | (133,462 | ) | |
Total return swap agreements6
| Counterparty | | Notional
amount
(000) | | Termination
date | | Payments made by the
Portfolio10 | | Payments
received by
the Portfolio10,11 | | Upfront
payments
received | | Value | | Unrealized
depreciation | |
CSI | | USD | 1,847 | | | 01/12/43 | | 1 Month USD LIBOR | | | 3.000 | % | | $ | 9,239 | | | $ | (15,883 | ) | | $ | (6,644 | ) | |
GSI | | USD | 2,008 | | | 01/12/43 | | 1 Month USD LIBOR | | | 3.000 | | | | 9,050 | | | | (17,264 | ) | | | (8,214 | ) | |
| | | | | | | | | | | $ | 18,289 | | | $ | (33,147 | ) | | $ | (14,858 | ) | |
25
PACE Select Advisors Trust
PACE Mortgage-Backed Securities Fixed Income Investments
Portfolio of investments—July 31, 2015
Fair valuation summary
The following is a summary of the fair valuations according to the inputs used as of July 31, 2015 in valuing the Portfolio's investments:
Assets
Description | | Unadjusted
quoted prices in
active markets for
identical investments
(Level 1) | | Other significant
observable inputs
(Level 2) | | Unobservable
inputs
(Level 3) | | Total | |
US government obligations | | $ | — | | | $ | 25,660,934 | | | $ | — | | | $ | 25,660,934 | | |
Government national mortgage association certificates | | | — | | | | 180,325,536 | | | | — | | | | 180,325,536 | | |
Federal home loan mortgage corporation certificates | | | — | | | | 147,754,034 | | | | — | | | | 147,754,034 | | |
Federal housing administration certificates | | | — | | | | — | | | | 306,338 | | | | 306,338 | | |
Federal national mortgage association certificates | | | — | | | | 322,062,390 | | | | — | | | | 322,062,390 | | |
Collateralized mortgage obligations | | | — | | | | 68,509,508 | | | | 5,123,963 | | | | 73,633,471 | | |
Asset-backed securities | | | — | | | | 32,681,062 | | | | — | | | | 32,681,062 | | |
Stripped mortgage-backed securities | | | — | | | | 4,225,703 | | | | 2,512,091 | | | | 6,737,794 | | |
Short-term US government and agency obligations | | | — | | | | 31,971,591 | | | | — | | | | 31,971,591 | | |
Repurchase agreement | | | — | | | | 254,000 | | | | — | | | | 254,000 | | |
Options purchased | | | — | | | | 593 | | | | — | | | | 593 | | |
Swap agreements | | | — | | | | 54,915 | | | | — | | | | 54,915 | | |
Total | | $ | — | | | $ | 813,500,266 | | | $ | 7,942,392 | | | $ | 821,442,658 | | |
Liabilities | |
Investments sold short | | $ | — | | | $ | (173,397,996 | ) | | $ | — | | | $ | (173,397,996 | ) | |
Written options | | | — | | | | (175,372 | ) | | | — | | | | (175,372 | ) | |
Written swaptions | | | — | | | | (1,473,760 | ) | | | — | | | | (1,473,760 | ) | |
Swap agreements | | | — | | | | (221,524 | ) | | | — | | | | (221,524 | ) | |
Total | | $ | — | | | $ | (175,268,652 | ) | | $ | — | | | $ | (175,268,652 | ) | |
At July 31, 2015, there were no transfers between Level 1 and Level 2.
The following is a rollforward of the Portfolio's investments that was valued using unobservable inputs (Level 3) for the year ended July 31, 2015:
| | | Federal
housing
administration
certificates | | Collateralized
mortgage
obligations | | Stripped
mortgage-backed
securities | | Total | |
Beginning balance | | $ | 616,873 | | | $ | 6,259,761 | | | $ | 3,772,021 | | | $ | 10,648,655 | | |
Purchases | | | — | | | | — | | | | — | | | | — | | |
Sales | | | (314,185 | ) | | | (404,318 | ) | | | — | | | | (718,503 | ) | |
Accrued discounts/(premiums) | | | (76 | ) | | | 41,387 | | | | (71,107 | ) | | | (29,796 | ) | |
Total realized gain/(loss) | | | 70 | | | | 15,291 | | | | (855,864 | ) | | | (840,503 | ) | |
Net change in unrealized appreciation/depreciation | | | 3,656 | | | | 327,182 | | | | (332,959 | ) | | | (2,121 | ) | |
Transfers into Level 3 | | | — | | | | — | | | | — | | | | — | | |
Transfers out of Level 3 | | | — | | | | (1,115,340 | ) | | | — | | | | (1,115,340 | ) | |
Ending balance | | $ | 306,338 | | | $ | 5,123,963 | | | $ | 2,512,091 | | | $ | 7,942,392 | | |
The change in net unrealized appreciation/depreciation relating to the Level 3 investments held at July 31, 2015 was $(144,445). At July 31, 2015, a security was transferred from Level 3 to Level 2 as the valuation is based on observable inputs from an established pricing source. The transfer out of Level 3 represents the value at the end of the year.
26
PACE Select Advisors Trust
PACE Mortgage-Backed Securities Fixed Income Investments
Portfolio of investments—July 31, 2015
Portfolio footnotes
* On September 7, 2008, the Federal Housing Finance Agency placed the Federal National Mortgage Association and the Federal Home Loan Mortgage Corporation into conservatorship, and the US Treasury guaranteed the debt issued by those organizations.
†† Amount represents less than 0.005%.
1 Security, or portion thereof, pledged as collateral for investments sold short or written options.
2 Security is being fair valued by a valuation committee under the direction of the board of trustees.
3 Variable or floating rate security. The interest rate shown is the current rate as of July 31, 2015 and changes periodically.
4 Security exempt from registration pursuant to Rule 144A under the Securities Act of 1933. These securities, which represent 6.99% of net assets as of July 31, 2015, are considered liquid and may be resold in transactions exempt from registration, normally to qualified institutional buyers.
5 Step bond that converts to the noted fixed rate at a designated future date.
6 Illiquid investment as of July 31, 2015.
7 Principal Only Security. This security entitles the holder to receive principal payments from an underlying pool of assets. High prepayments return principal faster than expected and cause the yield to increase. Low prepayments return principal more slowly than expected and cause the yield to decrease.
8 Interest Only Securities. These securities entitle the holder to receive interest payments from an underlying pool of mortgages. The risk associated with this security is related to the speed of the principal paydowns. High prepayments would result in a smaller amount of interest being received and cause the yield to decrease. Low prepayments would result in a greater amount of interest being received and cause the yield to increase.
9 Rates shown are the discount rates at date of purchase unless otherwise noted.
10 Payments made or received are based on the notional amount.
11 Payment is based on the performance of the underlying 1 Month USD LIBOR.
See accompanying notes to financial statements.
27
PACE Select Advisors Trust
PACE Intermediate Fixed Income Investments
Performance (unaudited)
For the 12 months ended July 31, 2015, the Portfolio's Class P shares gained 1.90% before the deduction of the maximum PACE Select program fee.1 In comparison, the Barclays US Intermediate Government/Credit Index (the "benchmark") rose 2.27%, and the Lipper Core Bond Funds category posted a median return of 1.99%. (Returns for all share classes over various time periods are shown in the "Performance at a glance" table on page 32. Please note that the returns shown do not reflect the deduction of taxes that a shareholder would pay on Portfolio distributions or the redemption of Portfolio shares.) For a detailed commentary on the market environment in general during the reporting period, please refer to page 2.
Sub-advisors' comments2
(Please note that while the sub-advisors outperformed the benchmark on a gross-of-fees basis, the Portfolio underperformed net of fees, as reported in the "Performance at a glance" table. As stated in footnote two, the comments that follow address performance on a gross of fees basis.)
Blackrock
Our portion of the Portfolio outperformed its benchmark during the reporting period. The largest contributor to returns was our allocation to high yield corporate bonds. We maintained this allocation throughout the reporting period, using a mix of bottom-up issuer selection, alongside broad-based sector hedging by way of credit index derivatives. Other major contributors to performance included our non-US dollar exposures and allocations to securitized assets. Non-US dollar exposures included positioning around the increasing value of the US dollar, mostly against European currencies (i.e. the euro and the Swiss franc). This was beneficial given heightened volatility in European interest rates and changes to peripheral spreads due to the ongoing Greek debt crisis. Securitized assets performed well during the reporting period as they were largely insulated from global growth concerns and heightened headline risk, which pushed credit spreads generally wider. Investment grade corporate bond security selection also supported returns as reflected in our preference for financials over industrials, due to our positive outlook for subordinated bank debt. Our early decision to be underweight energy and commodities-related sectors also proved to be beneficial.
PACE Select Advisors Trust – PACE Intermediate Fixed Income Investments
Investment Sub-Advisors:
BlackRock Financial Management, Inc. ("BlackRock");
Babson Capital Management LLC ("Babson")
Portfolio Managers:
BlackRock: David Antonelli and Akiva Dickstein;
Babson: William Awad, Ronald Desautels, David Nagle, Charles Sanford and Douglas Trevallion
Objective:
Current income, consistent with reasonable stability of principal
Investment process:
BlackRock The Portfolio invests primarily in fixed income securities. BlackRock decides to buy specific bonds based on its credit analysis and review. BlackRock strives to add value by controlling the Portfolio's duration within a narrow band relative to the Barclays US Intermediate Government/Credit Index. To accomplish this, BlackRock employs an analytical process that involves evaluating macroeconomic trends, technical market factors, yield-curve exposure and market volatility. Once BlackRock establishes the investment themes on duration, yield curve exposure, convexity, sector weighting, credit quality and liquidity, the Portfolio's investments are diversified by sector, subsector and security.
1 Class P shares held through the PACE Select Advisors Program are subject to a maximum Program fee of 2.50%, which, if included, would have reduced performance. Class P shares held through other advisory programs also may be subject to a program fee, which, if included, would have reduced performance.
2 All sub-advisors discuss performance on a gross-of-fees basis—meaning that no fees or expenses are reflected in their sleeves'/sleeve's performance. Alternately, Portfolio performance is shown net of fees, which does factor in fees and expenses associated with the Portfolio.
28
PACE Select Advisors Trust
PACE Intermediate Fixed Income Investments
Sub-advisor's comments – continued
Detracting from performance was our allocation to Treasury Inflation-Protected Securities ("TIPS"). Our underweight duration positioning for most of the fiscal year was also negative for results. The sharp decline in oil prices and subsequent drop in interest rates during the fourth quarter of 2014 was the main driver of the negative impact.
A number of derivatives instruments were used during the reporting period, primarily to adjust our duration and curve exposure, as well as to hedge risk. We believe that derivatives are beneficial for performance as they help us manage our portion of the Portfolio more efficiently. Interest rate swaps are the most common type of swap, and they were useful in managing exposure to interest rates by adding duration or subtracting it at particular points on the yield curve. Credit default swaps were used to provide insurance or protection against a particular issuer or basket of issuers defaulting and were also used as a way to express a negative or positive view on an issuer's or group of issuers' credit strength. Options on interest rate swaps (swaptions) were used to hedge convexity, as well as take a view on volatility and interest rates. Options on futures were most often used to take a view on volatility and/or interest rates. Foreign exchange options were used to give us the right, but not the obligation, to buy (call) or sell (put) a currency at a specified price for a specified period of time. Foreign exchange forwards were typically used to hedge non-US dollar currency risk back to the US dollar, as well as to implement active currency positions.
Babson Capital Management
Our portion of the Portfolio outperformed the benchmark during the reporting period. The 12-month period has been characterized by persistent but restrained volatility. Spreads over Treasury bonds have widened due to slow economic activity globally in the US, along with a sell-off in commodities and related sectors. Despite bouts of volatility, our portion of the Portfolio performed relatively well during the reporting period. The primary contributor to performance was an underweight to Treasuries. Investment grade corporate bonds also contributed to results, particularly financials, such as our holdings in the banking sector. Due to a more aggressive regulatory environment, banks are continuing to improve their capital levels, and we have invested down the capital structure. Our positions in the consumer products sector was the largest detractor from results within the investment grade corporate bond market.
Our positioning within the securitized sector benefited performance overall. In particular, the headwind from non-agency residential mortgage-backed securities ("RMBS") was more than offset by gains from commercial mortgage-backed securities ("CMBS") and consumer asset-backed securities ("ABS"). RMBS lagged the benchmark and detracted from performance. We continue to have an active exposure to this sector, although we remain more selective with our purchases. New issue supply has been strong in the ABS sector, with good demand for these securities. ABS deals backed by equipment or railcar leases were the best performing sub-sector. We added to the
Investment process (concluded)
Babson seeks to invest primarily in a diversified portfolio of short-term fixed income securities through an investment process that consists of a top-down, macroeconomic view, coupled with a bottom-up perspective driven by rigorous fundamental credit analysis. Babson seeks to add value through security selection, sector rotation, convexity biases and yield curve positioning. Finally, Babson employs a quantitative rules-based approach to manage duration, which involves limiting the portfolio duration to a range of 0-3 years, driven by the dynamics and shape of the yield curve.
29
PACE Select Advisors Trust
PACE Intermediate Fixed Income Investments
Sub-advisor's comments – concluded
collateralized mortgage obligation ("CMO") agency sector during the reporting period, as these securities offered attractive pricing and more stable duration characteristics relative to agency mortgage-backed securities. Finally, we benefited from yield curve positioning and exposure to maturities of three and five years, taking advantage of the steepness of the yield curve.
Our portion of the Portfolio used derivative instruments for yield curve, duration and credit risk management. We used Treasury futures for duration management and CMBS credit default swaps to gain exposure to BBB-rated commercial mortgage backed securities. Over the reporting period, performance from Treasury futures contributed to performance, and our position in CMBS credit default swaps resulted in almost neutral performance.
Special considerations
The Portfolio may be appropriate for long-term investors seeking current income and a reasonable stability of principal. Investors should be able to withstand short-term fluctuations in the fixed income markets. The value of the Portfolio changes every day and can be affected by changes in interest rates, general market conditions, and other political, social and economic developments, as well as specific matters relating to the companies in whose securities the Portfolio invests. It is important to note that an investment in the Portfolio is only one component of a balanced investment plan.
30
PACE Select Advisors Trust
PACE Intermediate Fixed Income Investments
Illustration of an assumed investment of $10,000 in Class P shares of the Portfolio (unaudited)
The following graph depicts the performance of PACE Intermediate Fixed Income Investments Class P shares versus the Barclays US Intermediate Government/Credit Index over the 10 years ended July 31, 2015. Class P shares held through advisory programs may be subject to a program fee, which, if included, would have reduced performance. The performance of the other classes will vary based upon the different class specific expenses and sales charges. The performance provided does not reflect the deduction of taxes that a shareholder would pay on Portfolio distributions or the redemption of Portfolio shares. Past performance is no guarantee of future results. Share price and returns will vary with market conditions; investors may realize a gain or loss upon redemption. It is important to note that PACE Intermediate Fixed Income Investments is a professionally managed portfolio while the Index is not available for investment and is unmanaged. The comparison is shown for illustration purposes only.
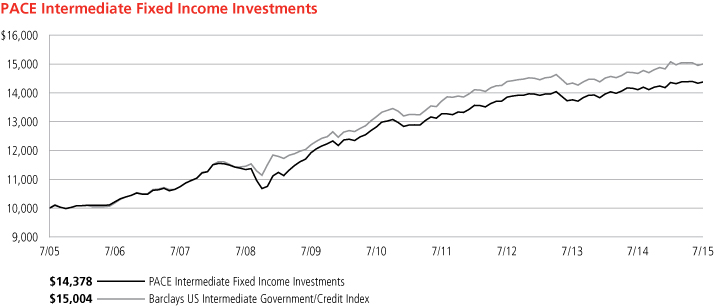
31
PACE Select Advisors Trust
PACE Intermediate Fixed Income Investments
Performance at a glance (unaudited)
Average annual total returns for periods ended 07/31/15 | | 1 year | | 5 years | | 10 years | |
Before deducting maximum sales charge | |
Class A1 | | | 1.64 | % | | | 2.07 | % | | | 3.44 | % | |
Class C2 | | | 1.05 | | | | 1.55 | | | | 2.91 | | |
Class Y3 | | | 1.90 | | | | 2.32 | | | | 3.70 | | |
Class P4 | | | 1.90 | | | | 2.32 | | | | 3.70 | | |
After deducting maximum sales charge | |
Class A1 | | | (2.93 | ) | | | 1.13 | | | | 2.97 | | |
Class C2 | | | 0.30 | | | | 1.55 | | | | 2.91 | | |
Barclays US Intermediate Government/Credit Index5 | | | 2.27 | | | | 2.64 | | | | 4.14 | | |
Lipper Core Bond Funds median | | | 1.99 | | | | 3.38 | | | | 4.36 | | |
Most recent calendar quarter-end returns (unaudited)
Average annual total returns for periods ended 06/30/15 | | 1 year | | 5 years | | 10 years | |
Before deducting maximum sales charge | |
Class A1 | | | 0.96 | % | | | 2.21 | % | | | 3.33 | % | |
Class C2 | | | 0.45 | | | | 1.69 | | | | 2.80 | | |
Class Y3 | | | 1.22 | | | | 2.46 | | | | 3.59 | | |
Class P4 | | | 1.22 | | | | 2.46 | | | | 3.58 | | |
After deducting maximum sales charge | |
Class A1 | | | (3.55 | ) | | | 1.27 | | | | 2.86 | | |
Class C2 | | | (0.30 | ) | | | 1.69 | | | | 2.80 | | |
The annualized gross and net expense ratios, respectively, for each class of shares as in the November 28, 2014 prospectuses, were as follows: Class A—1.03% and 0.93%; Class C—1.52% and 1.43%; Class Y—1.05% and 0.68%; and Class P—0.82% and 0.68%. Net expenses reflect fee waivers and/or expense reimbursements, if any, pursuant to an agreement that is in effect to cap the expenses. The Portfolio and UBS Global Asset Management (Americas) Inc. ("UBS Global AM") have entered into a written fee waiver/expense reimbursement agreement pursuant to which UBS Global AM is contractually obligated to waive its management fees and/or reimburse expenses so that the Portfolio's ordinary total operating expenses of each class through November 30, 2015 (excluding dividend expense, borrowing costs, and interest expense relating to short sales, and expenses attributable to investment in other investment companies, interest, taxes, brokerage commissions and extraordinary expenses) would not exceed Class A—0.93%; Class C—1.43%; Class Y—0.68%; and Class P—0.68%. The Portfolio has agreed to repay UBS Global AM for any waived fees/reimbursed expenses to the extent that it can do so over the following three fiscal years without causing the Portfolio's expenses in any of those three years to exceed these expense caps. The fee waiver/expense reimbursement agreement may be terminated by the Portfolio's board at any time and also will terminate automatically upon the expiration or termination of the Portfolio's advisory contract with UBS Global AM. Upon termination of the agreement, however, UBS Global AM's three year recoupment rights will survive.
1 Maximum sales charge for Class A shares is 4.5%. Class A shares bear ongoing 12b-1 service fees.
2 Maximum contingent deferred sales charge for Class C shares is 0.75% imposed on redemptions and is reduced to 0% after one year. Class C shares bear ongoing 12b-1 service and distribution fees.
3 The Portfolio offers Class Y shares to a limited group of eligible investors, including certain qualifying retirement plans. Class Y shares do not bear initial or contingent deferred sales charges or ongoing 12b-1 service and distribution fees.
4 Class P shares do not bear initial or contingent deferred sales charges or ongoing 12b-1 service and distribution fees, but Class P shares held through advisory programs may be subject to a program fee, which, if included, would have reduced performance.
5 The Barclays US Intermediate Government/Credit Index is an unmanaged subset of the Barclays US Government/Credit Index covering all investment grade issues with maturities from one up to (but not including) 10 years. The average-weighted maturity is typically between four and five years. Investors should note that indices do not reflect the deduction of fees and expenses.
Prior to February 17, 2015, if an investor sold or exchanged shares less than 90 days after purchase, a redemption fee of 1.00% of the amount sold or exchanged was deducted at the time of the transaction, except as noted otherwise in the prospectus. For sales or exchanges taking place on or after February 17, 2015 but prior to August 3, 2015, there is a reduction in the redemption holding period from 90 days to 30 days. Effective August 3, 2015, the 1.00% redemption fee imposed on sales or exchanges of any class of shares of the portfolios made during the holding periods specified in the prospectus was eliminated. Please refer to the prospectus for further information.
Past performance does not predict future performance, and the performance information provided does not reflect the deduction of taxes that a shareholder would pay on Portfolio distributions or the redemption of Portfolio shares. The return and principal value of an investment will fluctuate, so that an investor's shares, when redeemed, may be worth more or less than their original cost. Performance results assume reinvestment of all dividends and capital gain distributions at net asset value on the ex-dividend dates. Current performance may be higher or lower than the performance data quoted. For month-end performance figures, please visit http://globalam-us.ubs.com/corpweb/performance.do.
Lipper peer group data calculated by Lipper Inc.; used with permission. The Lipper median is the return of the fund that places in the middle of a Lipper peer group.
32
PACE Select Advisors Trust
PACE Intermediate Fixed Income Investments
Portfolio statistics (unaudited)
Characteristics | | 07/31/15 | |
Weighted average duration | | | 3.50 yrs. | | |
Weighted average maturity | | | 5.10 yrs. | | |
Average coupon | | | 2.50 | % | |
Net assets (mm) | | $ | 425.7 | | |
Number of holdings | | | 690 | | |
Portfolio composition1 | | 07/31/15 | |
Bonds and notes | | | 97.4 | % | |
Preferred stocks | | | 0.1 | | |
Investments sold short | | | (0.8 | ) | |
Options, futures, swaps, and forward foreign currency contracts | | | (0.1 | ) | |
Cash equivalents and other assets less liabilities | | | 3.4 | | |
Total | | | 100.0 | % | |
Quality diversification1,2 | | 07/31/15 | |
US government and agency securities | | | 37.3 | % | |
AAA | | | 5.9 | | |
AA | | | 3.4 | | |
A | | | 13.4 | | |
BBB and below/non-rated | | | 37.4 | | |
Preferred stock | | | 0.1 | | |
Investments sold short | | | (0.8 | ) | |
Options, futures, swaps and forward foreign currency contracts | | | (0.1 | ) | |
Cash equivalents and other assets less liabilities | | | 3.4 | | |
Total | | | 100.0 | % | |
Asset allocation1 | | 07/31/15 | |
Corporate notes | | | 37.6 | % | |
US government obligations | | | 36.1 | | |
Asset-backed securities | | | 13.4 | | |
Collateralized mortgage obligations | | | 8.6 | | |
US government agency mortgage pass-through certificates | | | 1.2 | | |
Non-US government obligations | | | 0.4 | | |
Preferred stock | | | 0.1 | | |
Municipal bonds and notes | | | 0.1 | | |
Investments sold short | | | (0.8 | ) | |
Options, futures, swaps and forward foreign currency contracts | | | (0.1 | ) | |
Cash equivalents and other assets less liabilities | | | 3.4 | | |
Total | | | 100.0 | % | |
1 Weightings represent percentages of the Portfolio's net assets as of July 31, 2015. The Portfolio is actively managed and its composition will vary over time.
2 Credit quality ratings shown are based on the ratings assigned to portfolio holdings by Standard & Poor's Ratings Group, an independent rating agency.
33
PACE Select Advisors Trust
PACE Intermediate Fixed Income Investments
Portfolio of investments—July 31, 2015
| | | Face
amount1 | | Value | |
US government obligations—36.07% | |
US Treasury Bonds
3.000%, due 05/15/45 | | | 6,036,000 | | | $ | 6,119,937 | | |
US Treasury Inflation Index
Notes (TIPS) | |
0.250%, due 01/15/25 | | | 3,473,321 | | | | 3,394,087 | | |
0.375%, due 07/15/25 | | | 837,188 | | | | 828,816 | | |
US Treasury Notes
0.625%, due 05/31/17 | | | 6,250,000 | | | | 6,247,556 | | |
0.625%, due 11/30/17 | | | 6,800,000 | | | | 6,774,500 | | |
0.875%, due 04/30/172 | | | 1,310,000 | | | | 1,315,936 | | |
0.875%, due 11/15/17 | | | 8,000,000 | | | | 8,019,376 | | |
0.875%, due 07/15/18 | | | 7,655,000 | | | | 7,630,481 | | |
1.000%, due 12/15/17 | | | 6,930,000 | | | | 6,961,940 | | |
1.250%, due 11/30/18 | | | 1,165,000 | | | | 1,169,278 | | |
1.500%, due 12/31/18 | | | 4,090,000 | | | | 4,136,012 | | |
1.500%, due 11/30/19 | | | 2,000,000 | | | | 2,008,594 | | |
1.625%, due 03/31/19 | | | 4,810,000 | | | | 4,876,513 | | |
1.625%, due 04/30/19 | | | 4,480,000 | | | | 4,539,499 | | |
1.625%, due 06/30/20 | | | 3,795,000 | | | | 3,810,715 | | |
1.625%, due 07/31/20 | | | 26,180,000 | | | | 26,276,130 | | |
2.000%, due 07/31/22 | | | 30,585,000 | | | | 30,705,667 | | |
2.125%, due 06/30/22 | | | 2,305,000 | | | | 2,333,453 | | |
2.125%, due 05/15/25 | | | 17,255,000 | | | | 17,136,372 | | |
2.250%, due 04/30/21 | | | 4,725,000 | | | | 4,853,832 | | |
2.625%, due 11/15/20 | | | 4,205,000 | | | | 4,408,682 | | |
Total US government obligations
(cost—$152,618,027) | | | | | 153,547,376 | | |
Federal home loan bank certificate—0.18% | |
FHLB
4.000%, due 09/01/28
(cost—$678,954) | | | 680,000 | | | | 753,525 | | |
Federal home loan mortgage corporation certificates*—0.13% | |
FHLMC
6.250%, due 07/15/32 | | | 302,000 | | | | 425,717 | | |
6.750%, due 03/15/31 | | | 82,000 | | | | 119,278 | | |
Total federal home loan mortgage
corporation certificates
(cost—$491,928) | | | | | 544,995 | | |
Federal national mortgage association certificates*—0.87% | |
FNMA TBA
3.000% | | | 500,000 | | | | 518,447 | | |
| | 4.000 | % | | | 3,000,000 | | | | 3,187,005 | | |
Total federal national mortgage
association certificates
(cost—$3,680,216) | | | | | 3,705,452 | | |
Collateralized mortgage obligations—8.62% | |
Banc of America Commercial
Mortgage Trust,
Series 2007-4, Class AM
5.809%, due 02/10/513 | | | 400,000 | | | | 428,224 | | |
Series 2008-1, Class A4
6.215%, due 02/10/513 | | | 238,906 | | | | 258,955 | | |
| | | Face
amount1 | | Value | |
Collateralized mortgage obligations—(continued) | |
Bear Stearns Commercial Mortgage
Securities Trust, Series 2006-PWR12,
Class A1A
5.709%, due 09/11/383 | | | 1,428,805 | | | $ | 1,463,758 | | |
BHMS Mortgage Trust,
Series 2014-ATLS, Class AFL
1.684%, due 07/05/333,4 | | | 965,000 | | | | 959,570 | | |
Commercial Mortgage Pass-Through
Certificates,
Series 2006-C8, Class AM
5.347%, due 12/10/46 | | | 655,000 | | | | 686,569 | | |
Series 2006-GG7, Class AM
5.819%, due 07/10/383 | | | 210,000 | | | | 216,184 | | |
Series 2010-C1, Class A1
3.156%, due 07/10/464 | | | 357,871 | | | | 357,864 | | |
Series 2013-GAM, Class A2
3.367%, due 02/10/284 | | | 1,090,000 | | | | 1,111,191 | | |
Series 2014-CR16, Class A4
4.051%, due 04/10/47 | | | 145,000 | | | | 155,778 | | |
Series 2014-CR17, Class A5
3.977%, due 05/10/47 | | | 155,000 | | | | 165,650 | | |
Series 2014-PAT, Class A
0.986%, due 08/13/273,4 | | | 915,000 | | | | 910,248 | | |
Series 2014-TWC, Class A
1.036%, due 02/13/323,4 | | | 1,395,000 | | | | 1,386,281 | | |
Series 2015-CR24, Class A5
3.696%, due 08/10/555 | | | 820,000 | | | | 844,536 | | |
Series 2015-RUM, Class B
2.350%, due 07/15/303,4 | | | 775,000 | | | | 775,000 | | |
Credit Suisse Commercial Mortgage
Trust,
Series 2006-C2, Class AM
5.671%, due 03/15/393 | | | 1,520,000 | | | | 1,541,879 | | |
Series 2006-C5, Class AM
5.343%, due 12/15/39 | | | 840,000 | | | | 877,639 | | |
Series 2007-C4, Class A1AM
5.949%, due 09/15/393 | | | 1,110,000 | | | | 1,183,368 | | |
CSAIL Commercial Mortgage Trust,
Series 2015-C1, Class D
3.802%, due 04/15/503,4 | | | 515,000 | | | | 447,542 | | |
DBRR Trust, Series 2013-EZ3, Class A
1.636%, due 12/18/493,4 | | | 1,052,809 | | | | 1,052,809 | | |
DBUBS Mortgage Trust,
Series 2011-LC1A, Class A1
3.742%, due 11/10/464 | | | 165,024 | | | | 166,159 | | |
FHLMC Multifamily Structured Pass
Through Certificates,
Series K038, Class X1*
1.198%, due 03/25/243,6 | | | 6,396,875 | | | | 523,117 | | |
FHLMC REMIC,*
Trust 2626, Class A
4.000%, due 06/15/33 | | | 207,936 | | | | 221,642 | | |
Trust 3990, Class VA
3.500%, due 01/15/25 | | | 324,970 | | | | 344,987 | | |
Trust 4213, Class VE
3.500%, due 06/15/26 | | | 299,648 | | | | 320,306 | | |
34
PACE Select Advisors Trust
PACE Intermediate Fixed Income Investments
Portfolio of investments—July 31, 2015
| | | Face
amount1 | | Value | |
Collateralized mortgage obligations—(continued) | |
Trust 4323, Class CA
4.000%, due 03/15/40 | | | 317,841 | | | $ | 340,873 | | |
Trust 4325, Class MA
4.000%, due 09/15/39 | | | 1,201,699 | | | | 1,271,028 | | |
Trust 4328, Class DA
4.000%, due 01/15/36 | | | 1,225,705 | | | | 1,300,796 | | |
Trust 4336, Class MA
4.000%, due 01/15/40 | | | 1,080,770 | | | | 1,146,659 | | |
Trust 4447, Class PA
3.000%, due 12/15/44 | | | 143,738 | | | | 149,906 | | |
FNMA Connecticut Avenue Securities,*
Series 2015-C02, Class 1M1
1.341%, due 05/25/253 | | | 192,932 | | | | 191,915 | | |
Series 2015-C03, Class 1M1
1.689%, due 07/25/253 | | | 255,000 | | | | 255,000 | | |
FNMA REMIC,*
Trust 2005-109, Class PV
6.000%, due 10/25/32 | | | 297,161 | | | | 313,768 | | |
Trust 2013-112, Class HQ
4.000%, due 11/25/43 | | | 136,246 | | | | 145,324 | | |
Trust 2014-12, Class GV
3.500%, due 03/25/27 | | | 182,265 | | | | 194,910 | | |
Trust 2014-48, Class AB
4.000%, due 10/25/40 | | | 339,314 | | | | 365,287 | | |
Trust 2015-20, Class EV
3.500%, due 07/25/26 | | | 341,436 | | | | 363,512 | | |
Trust 2015-62, Class VA
4.000%, due 10/25/26 | | | 100,000 | | | | 108,032 | | |
Trust 4443, Class BA
3.500%, due 04/15/41 | | | 177,633 | | | | 187,648 | | |
FREMF Mortgage Trust,
Series 2013-K712, Class B
3.368%, due 05/25/453,4 | | | 110,000 | | | | 112,204 | | |
GAHR Commericial Mortgage Trust,
Series 2015-NRF, Class DFX
3.382%, due 12/15/193,4 | | | 1,025,000 | | | | 1,011,702 | | |
GNMA, Trust 2014-131, Class BW
3.854%, due 05/20/413 | | | 231,342 | | | | 239,675 | | |
GS Mortgage Securities Corp.,
Series 2014-4R, Class 1A,
0.367%, due 01/26/343,4 | | | 140,000 | | | | 134,238 | | |
Hilton USA Trust,
Series 2013-HLT, Class AFX
2.662%, due 11/05/304 | | | 875,000 | | | | 876,949 | | |
JPMBB Commercial
Mortgage Securities Trust,
Series 2014-C22, Class XA
0.984%, due 09/15/473,6 | | | 14,251,628 | | | | 914,356 | | |
JPMorgan Chase Commercial
Mortgage Securities,
Series 2006-CB14, Class AM
5.474%, due 12/12/443 | | | 400,000 | | | | 403,446 | | |
Series 2006-LDP8, Class AJ
5.480%, due 05/15/453 | | | 500,000 | | | | 515,223 | | |
Series 2007-CB18, Class A1A
5.431%, due 06/12/473 | | | 1,369,137 | | | | 1,432,361 | | |
| | | Face
amount1 | | Value | |
Collateralized mortgage obligations—(concluded) | |
Series 2007-CB20, Class AM
5.879%, due 02/12/513 | | | 150,000 | | | $ | 162,266 | | |
Series 2007-LDPX, Class A1A
5.439%, due 01/15/49 | | | 170,944 | | | | 180,041 | | |
Series 2011-PLSD, Class A2
3.364%, due 11/13/284 | | | 800,000 | | | | 819,615 | | |
LSTAR Securities Investment Trust,
Series 2014-1, Class NOTE
3.284%, due 09/01/213,4 | | | 772,816 | | | | 775,576 | | |
Series 2014-2, Class A
2.184%, due 12/01/213,4 | | | 751,264 | | | | 745,825 | | |
ML-CFC Commercial Mortgage Trust,
Series 2006-4, Class A1A
5.166%, due 12/12/49 | | | 469,109 | | | | 488,120 | | |
Series 2007-9, Class AM
5.856%, due 09/12/493 | | | 350,000 | | | | 378,082 | | |
Morgan Stanley Bank of
America Merrill Lynch Trust,
Series 2013-C13, Class C
4.895%, due 11/15/463 | | | 815,000 | | | | 862,927 | | |
Series 2015-C24, Class A3
3.479%, due 05/15/48 | | | 795,000 | | | | 807,330 | | |
Morgan Stanley Capital I,
Series 2007-HQ11, Class AJ
5.508%, due 02/12/443 | | | 110,000 | | | | 112,908 | | |
Series 2007-IQ14, Class A1A
5.665%, due 04/15/493 | | | 677,931 | | | | 718,668 | | |
SFAVE Commercial Mortgage
Securities Trust,
Series 2015-5AVE, Class A2B
4.144%, due 01/05/353,4 | | | 540,000 | | | | 533,514 | | |
STRPS 2012-1 Ltd.,
Series 2012-1A, Class A
1.500%, due 12/25/444 | | | 241,460 | | | | 236,631 | | |
VFC LLC,
Series 2014-2, Class A
2.750%, due 07/20/307 | | | 99,434 | | | | 99,421 | | |
Series 2015-3, Class A
2.750%, due 12/20/317 | | | 182,554 | | | | 182,228 | | |
Wachovia Bank Commercial
Mortgage Trust,
Series 2007-C33, Class AM
5.951%, due 02/15/513 | | | 250,000 | | | | 267,933 | | |
Wells Fargo Commercial
Mortgage Trust,
Series 2015-C27, Class XA
1.006%, due 02/15/483,6 | | | 12,642,043 | | | | 894,766 | | |
Wells Fargo Resecuritization Trust,
Series 2012-IO, Class A
1.750%, due 08/20/214 | | | 44,917 | | | | 44,917 | | |
Total collateralized mortgage
obligations
(cost—$37,122,202) | | | | | 36,684,836 | | |
35
PACE Select Advisors Trust
PACE Intermediate Fixed Income Investments
Portfolio of investments—July 31, 2015
| | | Face
amount1 | | Value | |
Asset-backed securities—13.44% | |
321 Henderson Receivables I LLC,
Series 2006-1A, Class A1
0.387%, due 03/15/413,4 | | | 113,532 | | | $ | 111,302 | | |
Access Group, Inc.,
Series 2015-1, Class A
0.887%, due 07/25/563,4 | | | 270,000 | | | | 263,925 | | |
Series 2015-1, Class B
1.687%, due 07/25/583,4 | | | 100,000 | | | | 86,051 | | |
ACE Securities Corp.
Home Equity Loan Trust,
Series 2005-RM1, Class M2
0.941%, due 03/25/353 | | | 110,045 | | | | 109,058 | | |
ALM VIII Ltd.,
Series 2013-8A, Class A1A
1.737%, due 01/20/263,4 | | | 290,000 | | | | 289,999 | | |
Alterna Funding I LLC,
Series 2014-1A, Class Note
1.639%, due 02/15/214 | | | 94,476 | | | | 94,863 | | |
American Credit Acceptance
Receivables Trust,
Series 2012-3, Class C
2.780%, due 09/17/184 | | | 150,000 | | | | 149,971 | | |
Series 2014-3, Class A
0.990%, due 08/10/184 | | | 90,031 | | | | 89,997 | | |
Series 2015-2, Class A
1.570%, due 06/12/194 | | | 234,834 | | | | 234,748 | | |
American Homes 4 Rent,
Series 2014-SFR2, Class A
3.786%, due 10/17/364 | | | 291,383 | | | | 300,200 | | |
Series 2014-SFR3, Class A
3.678%, due 12/17/364 | | | 945,280 | | | | 965,295 | | |
AmeriCredit Automobile
Receivables Trust,
Series 2012-2, Class C
2.640%, due 10/10/17 | | | 129,042 | | | | 129,886 | | |
Series 2013-5, Class D
2.860%, due 12/09/19 | | | 585,000 | | | | 592,188 | | |
ARL First LLC,
Series 2012-1A, Class A1
1.937%, due 12/15/423,4 | | | 187,553 | | | | 189,253 | | |
ARL Second LLC,
Series 2014-1A, Class A1
2.920%, due 06/15/444 | | | 355,132 | | | | 355,456 | | |
Auto ABS Compartiment,
Series 2012-2, Class A
2.800%, due 04/27/258 | | EUR | 41,578 | | | | 45,809 | | |
Avery Point V CLO Ltd.,
Series 2014-5A, Class A
1.736%, due 07/17/263,4 | | | 250,000 | | | | 249,031 | | |
Avis Budget Rental Car Funding
AESOP LLC,
Series 2012-3A, Class A
2.100%, due 03/20/194 | | | 100,000 | | | | 100,637 | | |
BCC Funding VIII LLC,
Series 2014-1A, Class A
1.794%, due 06/20/204 | | | 106,775 | | | | 106,742 | | |
| | | Face
amount1 | | Value | |
Asset-backed securities—(continued) | |
BCC Funding X LLC,
Series 2015-1, Class A2
2.224%, due 10/20/204 | | | 240,000 | | | $ | 240,575 | | |
Bear Stearns Asset Backed
Securities I Trust,
Series 2005-HE12, Class M1
0.667%, due 12/25/353 | | | 200,000 | | | | 195,346 | | |
Series 2006-HE3, Class A2
0.367%, due 04/25/363 | | | 37,719 | | | | 37,450 | | |
Birchwood Park CLO Ltd.,
Series 2014-1A, Class A
1.729%, due 07/15/263,4 | | | 250,000 | | | | 249,313 | | |
Blue Hill CLO Ltd.,
Series 2013-1A, Class A
1.769%, due 01/15/263,4 | | | 450,000 | | | | 449,898 | | |
BlueMountain CLO Ltd.,
Series 2015-2A, Class A1
1.714%, due 07/18/273,4 | | | 280,000 | | | | 279,835 | | |
CAN Capital Funding LLC,
Series 2014-1A, Class A
3.117%, due 04/15/204 | | | 150,000 | | | | 150,375 | | |
Capital Automotive REIT,
Series 2010-1A, Class A
5.730%, due 12/15/384 | | | 93,171 | | | | 98,491 | | |
CarFinance Capital Auto Trust,
Series 2014-2A, Class A
1.440%, due 11/16/204 | | | 96,810 | | | | 96,610 | | |
Series 2015-1A, Class A
1.750%, due 06/15/214 | | | 143,453 | | | | 143,123 | | |
Carlyle Global Market
Strategies CLO Ltd.,
Series 2012-4A, Class A
1.677%, due 01/20/253,4 | | | 270,000 | | | | 269,135 | | |
Series 2013-4A, Class A1
1.745%, due 10/15/253,4 | | | 250,000 | | | | 249,991 | | |
Carnow Auto Receivables Trust,
Series 2014-1A, Class A
0.960%, due 01/17/174 | | | 76,934 | | | | 76,893 | | |
Carrington Mortgage Loan Trust,
Series 2005-NC4, Class A3
0.591%, due 09/25/353 | | | 27,594 | | | | 27,434 | | |
Cazenovia Creek Funding I LLC,
Series 2015-1A, Class A
2.000%, due 12/10/234 | | | 120,000 | | | | 120,089 | | |
Chesapeake Funding LLC,
Series 2015-1A, Class B
1.138%, due 02/07/273,4 | | | 200,000 | | | | 199,573 | | |
Chrysler Capital Auto
Receivables Trust,
Series 2013-BA, Class A4
1.270%, due 03/15/194 | | | 930,000 | | | | 929,170 | | |
Citi Held For Asset Issuance,
Series 2015-PM1, Class A
1.850%, due 12/15/214 | | | 100,000 | | | | 99,987 | | |
CKE Restaurant Holdings, Inc.,
Series 2013-1A, Class A2
4.474%, due 03/20/434 | | | 67,638 | | | | 69,053 | | |
36
PACE Select Advisors Trust
PACE Intermediate Fixed Income Investments
Portfolio of investments—July 31, 2015
| | | Face
amount1 | | Value | |
Asset-backed securities—(continued) | |
CLI Funding LLC,
Series 2006-1A, Class A
0.364%, due 08/18/213,4 | | | 216,310 | | | $ | 214,991 | | |
CLI Funding V LLC,
Series 2014-1A, Class A
3.290%, due 06/18/294 | | | 345,843 | | | | 347,845 | | |
CNH Equipment Trust,
Series 2015-B, Class A2A
0.840%, due 08/15/18 | | | 1,365,000 | | | | 1,364,143 | | |
College Loan Corp. Trust I,
Series 2005-2, Class B
0.779%, due 01/15/373 | | | 182,723 | | | | 158,428 | | |
Colony American Homes,
Series 2015-1A, Class A
1.386%, due 07/17/323,4 | | | 825,000 | | | | 818,392 | | |
Countrywide Asset-Backed
Certificates, Series 2005-6,
Class M1
0.681%, due 12/25/353 | | | 27,974 | | | | 27,955 | | |
CPS Auto Receivables Trust,
Series 2013-A, Class A
1.310%, due 06/15/204 | | | 40,300 | | | | 40,186 | | |
Series 2013-C, Class A
1.640%, due 04/16/184 | | | 65,219 | | | | 65,335 | | |
Series 2014-B, Class A
1.110%, due 11/15/184 | | | 223,600 | | | | 223,002 | | |
Series 2014-C, Class A
1.310%, due 02/15/194 | | | 138,201 | | | | 138,148 | | |
CPS Auto Trust,
Series 2012-C, Class A
1.820%, due 12/16/194 | | | 114,442 | | | | 114,973 | | |
Credit Acceptance Auto Loan Trust,
Series 2013-1A, Class A
1.210%, due 10/15/204 | | | 981,726 | | | | 981,746 | | |
Series 2013-2A, Class B
2.260%, due 10/15/214 | | | 840,000 | | | | 845,612 | | |
Series 2014-2A, Class A
1.880%, due 03/15/224 | | | 1,190,000 | | | | 1,193,920 | | |
Credit Suisse Seasoned Loan Trust,
Series 2006-1, Class A
0.431%, due 10/25/343,4 | | | 173,688 | | | | 169,787 | | |
Credit-Based Asset Servicing and
Securitization LLC,
Series 2006-RP2, Class A3
0.491%, due 07/25/363,4 | | | 180,000 | | | | 177,902 | | |
DB Master Finance LLC,
Series 2015-1A, Class A2I
3.262%, due 02/20/454 | | | 129,675 | | | | 130,634 | | |
DCP Rights LLC,
Series 2014-1A, Class A
5.463%, due 10/25/444 | | | 1,791,000 | | | | 1,806,811 | | |
Diamond Resorts Owner Trust,
Series 2014-1, Class A
2.540%, due 05/20/274 | | | 68,923 | | | | 69,165 | | |
Series 2015-1, Class A
2.730%, due 07/20/274 | | | 100,000 | | | | 99,990 | | |
| | | Face
amount1 | | Value | |
Asset-backed securities—(continued) | |
Domino's Pizza Master Issuer LLC,
Series 2012-1A, Class A2
5.216%, due 01/25/424 | | | 318,863 | | | $ | 329,606 | | |
Dong Fang Container Finance II
SPV Ltd., Series 2014-1A, Class A1
1.950%, due 11/25/394 | | | 208,333 | | | | 205,890 | | |
DRB Prime Student Loan Trust,
Series 2015-A, Class A3
2.320%, due 04/25/30 | | | 230,000 | | | | 229,909 | | |
Drive Auto Receivables Trust,
Series 2015-AA, Class A2
1.010%, due 11/15/174 | | | 1,081,459 | | | | 1,081,508 | | |
Series 2015-AA, Class B
2.280%, due 06/17/194 | | | 960,000 | | | | 962,417 | | |
Drug Royalty II LP 2,
Series 2014-1, Class A1
3.139%, due 07/15/233,4 | | | 234,003 | | | | 237,166 | | |
Eaton Vance CLO Ltd.,
Series 2014-1A, Class A
1.739%, due 07/15/263,4 | | | 500,000 | | | | 500,500 | | |
Education Funding Capital Trust IV,
Series 2004-1, Class A4
1.681%, due 06/15/433 | | | 250,000 | | | | 250,142 | | |
Element Rail Leasing II LLC,
Series 2015-1A, Class A1
2.707%, due 02/19/454 | | | 95,128 | | | | 95,375 | | |
Exeter Automobile Receivables Trust,
Series 2013-2A, Class A
1.490%, due 11/15/174 | | | 41,262 | | | | 41,311 | | |
Series 2013-2A, Class B
3.090%, due 07/16/184 | | | 180,000 | | | | 181,715 | | |
Series 2014-1A, Class A
1.290%, due 05/15/184 | | | 44,283 | | | | 44,332 | | |
Series 2014-3A, Class A
1.320%, due 01/15/194 | | | 76,813 | | | | 76,706 | | |
Series 2015-2A, Class A
1.540%, due 11/15/194 | | | 147,109 | | | | 146,962 | | |
First Investors Auto Owner Trust,
Series 2011-2A, Class C
5.020%, due 08/15/174 | | | 50,873 | | | | 51,015 | | |
Series 2013-3A, Class A3
1.440%, due 10/15/194 | | | 149,083 | | | | 149,382 | | |
Flagship Credit Auto Trust,
Series 2014-1, Class A
1.210%, due 04/15/194 | | | 83,970 | | �� | | 83,675 | | |
Series 2014-2, Class A
1.430%, due 12/16/194 | | | 112,888 | | | | 112,415 | | |
Series 2015-2, Class A
1.980%, due 10/15/204 | | | 160,000 | | | | 159,983 | | |
FNA Trust, Series 2014-1A, Class A
1.296%, due 12/10/224 | | | 276,290 | | | | 275,848 | | |
Ford Credit Floorplan Master
Owner Trust, Series 2012-2,
Class A
1.920%, due 01/15/19 | | | 1,900,000 | | | | 1,921,751 | | |
37
PACE Select Advisors Trust
PACE Intermediate Fixed Income Investments
Portfolio of investments—July 31, 2015
| | | Face
amount1 | | Value | |
Asset-backed securities—(continued) | |
Fremont Home Loan Trust,
Series 2005-2, Class M2
0.911%, due 06/25/353 | | | 116,785 | | | $ | 114,424 | | |
Galaxy XX CLO Ltd.,
Series 2015-20A, Class A
1.731%, due 07/20/273,4 | | | 280,000 | | | | 279,995 | | |
Global Container Assets Ltd.,
Series 2013-1A, Class A1
2.200%, due 11/05/284 | | | 198,393 | | | | 198,116 | | |
GLS Auto Receivables Trust,
Series 2015-1A, Class A
2.250%, due 12/15/204 | | | 97,362 | | | | 97,323 | | |
GO Financial Auto
Securitization Trust,
Series 2015-1, Class A
1.810%, due 03/15/184 | | | 70,945 | | | | 70,873 | | |
GoldenTree Loan Opportunities VII
Ltd., Series 2013-7A, Class A
1.427%, due 04/25/253,4 | | | 285,000 | | | | 281,331 | | |
Hilton Grand Vacations Trust,
Series 2013-A, Class A
2.280%, due 01/25/264 | | | 100,250 | | | | 100,697 | | |
Series 2014-AA, Class A
1.770%, due 11/25/264 | | | 376,068 | | | | 373,154 | | |
Home Equity Mortgage Trust,
Series 2005-HF1, Class A1
0.711%, due 02/25/363 | | | 87,091 | | | | 84,573 | | |
Series 2005-HF1, Class A2B
0.891%, due 02/25/363 | | | 97,786 | | | | 94,982 | | |
HSBC Home Equity Loan Trust USA,
Series 2007-3, Class A4
1.688%, due 11/20/363 | | | 70,000 | | | | 69,619 | | |
Icon Brands Holdings LLC,
Series 2012-1A, Class A
4.229%, due 01/25/434 | | | 131,726 | | | | 132,169 | | |
ING Investment Management CLO V
Ltd., Series 2007-5A, Class A1A
0.530%, due 05/01/223,4 | | | 395,045 | | | | 391,614 | | |
Invitation Homes Trust,
Series 2014-SFR2, Class A
1.288%, due 09/17/313,4 | | | 875,000 | | | | 869,743 | | |
Series 2014-SFR3, Class A
1.386%, due 12/17/313,4 | | | 640,000 | | | | 637,592 | | |
JP Morgan Mortgage
Acquisition Corp.,
Series 2005-FRE1, Class A2V2
0.407%, due 10/25/353 | | | 189,097 | | | | 186,510 | | |
Kentucky Higher Education
Student Loan Corp.,
Series 2015-1, Class A1
0.939%, due 12/01/313 | | | 173,026 | | | | 171,066 | | |
KeyCorp Student Loan Trust,
Series 2006-A, Class 2A4
0.592%, due 09/27/353 | | | 300,000 | | | | 291,570 | | |
LCM XI LP, Series 11A, Class A
1.587%, due 04/19/223,4 | | | 700,000 | | | | 698,729 | | |
| | | Face
amount1 | | Value | |
Asset-backed securities—(continued) | |
Lehman XS Trust,
Series 2005-6, Class 1A1
0.451%, due 11/25/353 | | | 301,297 | | | $ | 209,680 | | |
Madison Park Funding XIV Ltd.,
Series 2014-14A, Class A2
1.737%, due 07/20/263,4 | | | 250,000 | | | | 249,380 | | |
Merrill Lynch Mortgage Synthetic,
Series 2005-ACR1, Class M1
0.924%, due 06/28/353,4 | | | 222,027 | | | | 219,832 | | |
Miramax LLC,
Series 2014-1A, Class A2
3.340%, due 07/20/264 | | | 82,680 | | | | 83,049 | | |
MVW Owner Trust,
Series 2014-1A, Class A
2.250%, due 09/22/314 | | | 205,634 | | | | 205,508 | | |
National Collegiate Student
Loan Trust,
Series 2004-1, Class A2
0.541%, due 06/25/273 | | | 149,896 | | | | 148,831 | | |
Series 2005-1, Class A4
0.431%, due 11/27/283 | | | 155,161 | | | | 152,362 | | |
Series 2006-3, Class A3
0.341%, due 10/25/273 | | | 184,851 | | | | 183,276 | | |
Series 2007-1, Class A2
0.321%, due 11/27/283 | | | 104,421 | | | | 103,436 | | |
Nations Equipment Finance
Funding II LLC,
Series 2014-1A, Class A
1.558%, due 07/20/184 | | | 68,391 | | | | 68,411 | | |
Navient Private Education
Loan Trust,
Series 2015-AA, Class A1
0.687%, due 12/15/213,4 | | | 783,178 | | | | 783,178 | | |
Navient Student Loan Trust,
Series 2014-AA, Class A1
0.667%, due 05/16/223,4 | | | 654,367 | | | | 653,852 | | |
Navitas Equipment Receivables LLC,
Series 2015-1, Class A2
2.120%, due 11/15/184 | | | 150,000 | | | | 150,023 | | |
NCF Dealer Floorplan Master Trust,
Series 2014-1A, Class A
1.688%, due 10/20/203,4 | | | 110,000 | | | | 110,000 | | |
Nelnet Student Loan Trust,
Series 2006-3, Class B
0.531%, due 06/25/413 | | | 176,613 | | | | 160,523 | | |
Series 2014-1A, Class B
1.691%, due 10/25/473,4 | | | 100,000 | | | | 92,904 | | |
Series 2015-3A, Class B
1.691%, due 07/27/503,4 | | | 100,000 | | | | 87,801 | | |
New York City Tax Lien Trust,
Series 2014-A, Class A
1.030%, due 11/10/274 | | | 53,778 | | | | 53,729 | | |
NextGear Floorplan Master
Owner Trust,
Series 2014-1A, Class A
1.920%, due 10/15/194 | | | 800,000 | | | | 800,183 | | |
38
PACE Select Advisors Trust
PACE Intermediate Fixed Income Investments
Portfolio of investments—July 31, 2015
| | | Face
amount1 | | Value | |
Asset-backed securities—(continued) | |
NovaStar Mortgage Funding Trust,
Series 2003-2, Class A2
0.871%, due 09/25/333 | | | 78,174 | | | $ | 77,258 | | |
Series 2005-3, Class A2D
0.561%, due 01/25/363 | | | 146,224 | | | | 143,962 | | |
OneMain Financial Issuance Trust,
Series 2014-1, Class A
2.430%, due 06/18/244 | | | 100,000 | | | | 100,303 | | |
Series 2015-1A, Class A
3.190%, due 03/18/264 | | | 1,655,000 | | | | 1,672,584 | | |
Series 2015-2A, Class A
2.570%, due 07/18/254 | | | 852,000 | | | | 851,734 | | |
Option One Mortgage Loan Trust
Asset-Backed Certificates,
Series 2005-5, Class A3
0.401%, due 12/25/353 | | | 209,031 | | | | 207,318 | | |
Orange Lake Timeshare Trust,
Series 2014-AA, Class A
2.290%, due 07/09/294 | | | 73,763 | | | | 73,609 | | |
Oscar US Funding Trust,
Series 2014-1A, Class A2
1.000%, due 08/15/174 | | | 167,550 | | | | 167,666 | | |
Ownit Mortgage Loan Trust,
Series 2005-2, Class M4
1.121%, due 03/25/363 | | | 88,408 | | | | 86,836 | | |
Progress Residential Trust,
Series 2015-SFR2, Class A
2.740%, due 06/12/324 | | | 1,055,000 | | | | 1,043,580 | | |
RAAC Trust,
Series 2005-RP2, Class M1
0.837%, due 06/25/353,4 | | | 54,434 | | | | 54,447 | | |
Series 2006-RP2, Class A
0.437%, due 02/25/373,4 | | | 248,071 | | | | 244,859 | | |
RASC Trust,
Series 2005-AHL3, Class A2
0.431%, due 11/25/353 | | | 213,339 | | | | 209,930 | | |
Santander Drive Auto
Receivables Trust,
Series 2012-1, Class C
3.780%, due 11/15/17 | | | 417,782 | | | | 419,898 | | |
Series 2012-1, Class D
4.560%, due 11/15/17 | | | 1,250,000 | | | | 1,282,022 | | |
Series 2012-5, Class C
2.700%, due 08/15/18 | | | 1,200,000 | | | | 1,211,912 | | |
Series 2013-4, Class B
2.160%, due 01/15/20 | | | 1,200,000 | | | | 1,208,111 | | |
Series 2013-5, Class D
2.730%, due 10/15/19 | | | 749,000 | | | | 757,380 | | |
Series 2014-4, Class C
2.600%, due 11/16/20 | | | 865,000 | | | | 876,045 | | |
Series 2014-5, Class A2A
0.720%, due 04/16/18 | | | 951,350 | | | | 950,695 | | |
Series 2015-S2, Class R1
1.840%, due 11/18/194 | | | 79,866 | | | | 79,865 | | |
SBA Tower Trust,
Series 2014-1A, Class C
2.898%, due 10/15/444,9 | | | 170,000 | | | | 170,253 | | |
| | | Face
amount1 | | Value | |
Asset-backed securities—(continued) | |
Seneca Park CLO Ltd.,
Series 2014-1A, Class A
1.769%, due 07/17/263,4 | | | 250,000 | | | $ | 249,898 | | |
Sierra Timeshare Receivables
Funding Co. LLC,
Series 2012-2A, Class A
2.380%, due 03/20/294 | | | 218,639 | | | | 220,552 | | |
Series 2014-2A, Class A
2.050%, due 06/20/314 | | | 114,135 | | | | 114,861 | | |
Silver Bay Realty Trust,
Series 2014-1, Class A
1.186%, due 09/17/313,4 | | | 1,243,369 | | | | 1,229,929 | | |
SLM Student Loan Trust,
Series 2004-10, Class B
0.665%, due 01/25/403 | | | 132,250 | | | | 115,539 | | |
Series 2005-8, Class B
0.605%, due 01/25/403 | | | 141,301 | | | | 118,340 | | |
Series 2012-A, Class A1
1.587%, due 08/15/253,4 | | | 552,049 | | | | 556,178 | | |
Series 2012-D, Class A1
1.237%, due 06/15/233,4 | | | 354,017 | | | | 354,851 | | |
SoFi Professional Loan Program LLC,
Series 2014-A, Class A2
3.020%, due 10/25/274 | | | 74,441 | | | | 75,940 | | |
Series 2015-C, Class A2
2.510%, due 08/25/334 | | | 1,055,000 | | | | 1,049,208 | | |
Sonic Capital LLC,
Series 2011-1A, Class A2
5.438%, due 05/20/414 | | | 218,640 | | | | 229,467 | | |
Specialty Underwriting &
Residential Finance Trust,
Series 2005-AB2, Class M1
0.641%, due 06/25/363 | | | 40,000 | | | | 38,080 | | |
SpringCastle America Funding LLC,
Series 2014-AA, Class A
2.700%, due 05/25/234 | | | 1,049,219 | | | | 1,054,454 | | |
Store Master Funding I LLC,
Series 2015-1A, Class A1
3.750%, due 04/20/454 | | | 99,875 | | | | 98,862 | | |
SWAY Residential Trust,
Series 2014-1, Class A
1.486%, due 01/17/323,4 | | | 753,388 | | | | 752,092 | | |
Symphony CLO XV Ltd.,
Series 2014-15A, Class A
1.739%, due 10/17/263,4 | | | 250,000 | | | | 249,332 | | |
TAL Advantage I LLC,
Series 2006-1A, Class Note
0.378%, due 04/20/213,4 | | | 487,500 | | | | 485,404 | | |
Tidewater Auto Receivables Trust,
Series 2014-AA, Class A2
0.960%, due 07/15/174 | | | 140,131 | | | | 140,099 | | |
Series 2014-AA, Class A3
1.400%, due 07/15/184 | | | 500,000 | | | | 500,215 | | |
Trade MAPS 1 Ltd.,
Series 2013-1A, Class A
0.889%, due 12/10/183,4 | | | 250,000 | | | | 250,022 | | |
39
PACE Select Advisors Trust
PACE Intermediate Fixed Income Investments
Portfolio of investments—July 31, 2015
| | | Face
amount1 | | Value | |
Asset-backed securities—(concluded) | |
Tricon American Homes,
Series 2015 SFR1, Class A
1.436%, due 05/17/323,4 | | | 1,030,000 | | | $ | 1,020,616 | | |
United Auto Credit
Securitization Trust,
Series 2014-1, Class A2
0.740%, due 06/15/164 | | | 32,033 | | | | 32,034 | | |
Welk Resorts LLC,
Series 2015-AA, Class A
2.790%, due 06/16/314 | | | 107,727 | | | | 107,905 | | |
Wendys Funding LLC,
Series 2015-1A, Class-A2I
3.371%, due 06/15/454 | | | 250,000 | | | | 249,861 | | |
Westgate Resorts LLC,
Series 2012-2A, Class A
3.000%, due 01/20/254 | | | 71,385 | | | | 71,492 | | |
Series 2013-1A, Class A
2.250%, due 08/20/254 | | | 100,927 | | | | 100,957 | | |
Series 2014-1A, Class A
2.150%, due 12/20/264 | | | 188,530 | | | | 187,625 | | |
Westlake Automobile
Receivables Trust,
Series 2013-1A, Class A2
1.120%, due 01/15/184 | | | 10,046 | | | | 10,047 | | |
Series 2014-2A, Class A2
0.970%, due 10/16/174 | | | 78,472 | | | | 78,445 | | |
World Financial Network
Credit Card Master Trust,
Series 2014-B, Class A
0.610%, due 07/15/19 | | | 1,365,000 | | | | 1,364,728 | | |
Total asset-backed securities
(cost—$57,186,788) | | | | | 57,230,663 | | |
Corporate notes—37.60% | |
Aerospace & defense—0.57% | |
Lockheed Martin Corp.
2.900%, due 03/01/25 | | | 195,000 | | | | 186,539 | | |
Precision Castparts Corp.
0.700%, due 12/20/15 | | | 1,140,000 | | | | 1,139,365 | | |
The Boeing Co.
2.350%, due 10/30/21 | | | 170,000 | | | | 169,929 | | |
2.500%, due 03/01/25 | | | 70,000 | | | | 67,569 | | |
United Continental Holdings, Inc.
6.000%, due 12/01/20 | | | 340,000 | | | | 354,450 | | |
United Technologies Corp.
1.778%, due 05/04/189 | | | 505,000 | | | | 505,486 | | |
| | | 2,423,338 | | |
Airlines—0.18% | |
American Airlines Group, Inc.
4.625%, due 03/01/204 | | | 270,000 | | | | 263,925 | | |
American Airlines Pass Through
Trust 2014-1, Class B
4.375%, due 10/01/22 | | | 19,078 | | | | 19,197 | | |
| | | Face
amount1 | | Value | |
Corporate notes—(continued) | |
Airlines—(concluded) | |
American Airlines Pass Through
Trust 2015-1, Class A
3.375%, due 05/01/27 | | | 480,000 | | | $ | 465,600 | | |
| | | 748,722 | | |
Auto & truck—0.15% | |
General Motors Co.
3.500%, due 10/02/18 | | | 630,000 | | | | 640,823 | | |
Automotive—0.08% | |
Asciano Finance Ltd.
3.125%, due 09/23/154 | | | 350,000 | | | | 350,932 | | |
Banking-non-US—1.29% | |
BNP Paribas SA
2.375%, due 05/21/20 | | | 200,000 | | | | 199,476 | | |
Caixa Economica Federal
2.375%, due 11/06/174,10 | | | 290,000 | | | | 277,965 | | |
Commonwealth Bank of
Australia GMTN
2.300%, due 03/12/20 | | | 250,000 | | | | 249,901 | | |
Cooperatieve Centrale
Raiffeisen-Boerenleenbank BA
4.375%, due 08/04/25 | | | 260,000 | | | | 261,064 | | |
Credit Agricole SA
2.500%, due 04/15/194 | | | 250,000 | | | | 252,745 | | |
2.750%, due 06/10/204 | | | 250,000 | | | | 251,821 | | |
4.375%, due 03/17/254,10 | | | 200,000 | | | | 195,024 | | |
Credit Suisse Group Funding
Guernsey Ltd.
2.750%, due 03/26/204 | | | 345,000 | | | | 343,100 | | |
Credit Suisse New York
1.700%, due 04/27/18 | | | 395,000 | | | | 393,083 | | |
Deutsche Bank AG
3.700%, due 05/30/2410 | | | 305,000 | | | | 305,096 | | |
Discover Financial Services
3.750%, due 03/04/25 | | | 35,000 | | | | 33,653 | | |
HSBC Holdings PLC
4.250%, due 03/14/24 | | | 500,000 | | | | 508,850 | | |
ING Bank N.V.
5.800%, due 09/25/234 | | | 200,000 | | | | 218,701 | | |
Itau Unibanco Holding SA
2.850%, due 05/26/184 | | | 200,000 | | | | 197,200 | | |
Royal Bank of Scotland Group PLC
5.125%, due 05/28/24 | | | 630,000 | | | | 636,606 | | |
6.000%, due 12/19/23 | | | 205,000 | | | | 219,737 | | |
6.125%, due 12/15/22 | | | 25,000 | | | | 26,836 | | |
Standard Chartered PLC
2.250%, due 04/17/204,10 | | | 325,000 | | | | 320,992 | | |
Swedbank AB
2.200%, due 03/04/204,10 | | | 415,000 | | | | 413,846 | | |
The Bank of New York Mellon Corp.
4.950%, due 06/20/203,10,11 | | | 170,000 | | | | 169,150 | | |
| | | 5,474,846 | | |
40
PACE Select Advisors Trust
PACE Intermediate Fixed Income Investments
Portfolio of investments—July 31, 2015
| | | Face
amount1 | | Value | |
Corporate notes—(continued) | |
Banking-US—4.87% | |
Bank of America Corp.
2.250%, due 04/21/20 | | | 677,000 | | | $ | 666,985 | | |
3.875%, due 08/01/25 | | | 390,000 | | | | 393,722 | | |
3.950%, due 04/21/25 | | | 340,000 | | | | 329,733 | | |
4.000%, due 01/22/25 | | | 410,000 | | | | 402,200 | | |
5.625%, due 10/14/16 | | | 1,325,000 | | | | 1,391,564 | | |
6.100%, due 03/17/253,10,11 | | | 740,000 | | | | 736,670 | | |
6.500%, due 08/01/16 | | | 1,370,000 | | | | 1,438,651 | | |
Bank of America Corp. MTN
1.351%, due 03/22/183 | | | 770,000 | | | | 776,364 | | |
Bank of America Corp., Series 1
3.750%, due 07/12/16 | | | 650,000 | | | | 665,501 | | |
Capital One Bank USA N.A.
1.300%, due 06/05/1710 | | | 250,000 | | | | 248,359 | | |
Capital One Financial Corp.
3.200%, due 02/05/25 | | | 180,000 | | | | 169,786 | | |
3.500%, due 06/15/23 | | | 245,000 | | | | 240,661 | | |
5.550%, due 06/01/203,10,11 | | | 450,000 | | | | 450,540 | | |
Capital One NA/Mclean VA
2.950%, due 07/23/21 | | | 260,000 | | | | 254,347 | | |
CIT Group, Inc.
3.875%, due 02/19/1910 | | | 1,170,000 | | | | 1,175,850 | | |
5.250%, due 03/15/1810 | | | 400,000 | | | | 415,000 | | |
5.500%, due 02/15/194 | | | 615,000 | | | | 650,362 | | |
Discover Bank/Greenwood DE
3.100%, due 06/04/20 | | | 250,000 | | | | 251,239 | | |
4.200%, due 08/08/23 | | | 270,000 | | | | 274,913 | | |
Goldman Sachs Group, Inc.
1.497%, due 04/30/183 | | | 530,000 | | | | 534,959 | | |
2.550%, due 10/23/1910 | | | 231,000 | | | | 232,377 | | |
2.600%, due 04/23/2010 | | | 349,000 | | | | 348,890 | | |
3.500%, due 01/23/25 | | | 250,000 | | | | 244,598 | | |
3.700%, due 08/01/15 | | | 830,000 | | | | 830,000 | | |
3.750%, due 05/22/25 | | | 635,000 | | | | 633,298 | | |
5.375%, due 05/10/203,11 | | | 475,000 | | | | 472,150 | | |
5.950%, due 01/18/18 | | | 1,030,000 | | | | 1,131,178 | | |
HSBC USA, Inc.
2.350%, due 03/05/20 | | | 780,000 | | | | 775,522 | | |
JPMorgan Chase & Co.
1.195%, due 01/25/183 | | | 525,000 | | | | 528,460 | | |
3.250%, due 09/23/22 | | | 105,000 | | | | 105,039 | | |
4.500%, due 01/24/22 | | | 130,000 | | | | 139,586 | | |
JPMorgan Chase & Co. GMTN
0.902%, due 02/26/163 | | | 850,000 | | | | 851,178 | | |
Santander Holdings USA, Inc.
4.500%, due 07/17/25 | | | 160,000 | | | | 162,185 | | |
State Street Capital Trust IV
1.286%, due 06/15/373,10 | | | 570,000 | | | | 496,612 | | |
The Bank of New York Mellon Corp.
2.150%, due 02/24/20 | | | 445,000 | | | | 441,617 | | |
3.000%, due 02/24/25 | | | 160,000 | | | | 154,588 | | |
Wells Fargo & Co.
0.924%, due 04/23/183 | | | 685,000 | | | | 686,256 | | |
Wells Fargo & Co. GMTN
2.600%, due 07/22/20 | | | 465,000 | | | | 467,183 | | |
4.300%, due 07/22/27 | | | 175,000 | | | | 178,105 | | |
| | | Face
amount1 | | Value | |
Corporate notes—(continued) | |
Banking-US—(concluded) | |
Wells Fargo & Co. MTN
3.000%, due 02/19/25 | | | 380,000 | | | $ | 365,591 | | |
| | | 20,711,819 | | |
Biotechnology—0.25% | |
Amgen, Inc.
3.125%, due 05/01/2510 | | | 540,000 | | | | 513,448 | | |
5.150%, due 11/15/41 | | | 215,000 | | | | 224,690 | | |
Celgene Corp.
3.250%, due 08/15/22 | | | 130,000 | | | | 127,959 | | |
Gilead Sciences, Inc.
3.700%, due 04/01/24 | | | 205,000 | | | | 209,536 | | |
| | | 1,075,633 | | |
Building & construction—0.23% | |
D.R. Horton, Inc.
3.750%, due 03/01/19 | | | 550,000 | | | | 558,938 | | |
Lennar Corp.
4.125%, due 12/01/18 | | | 302,000 | | | | 306,530 | | |
4.500%, due 11/15/19 | | | 115,000 | | | | 118,881 | | |
| | | 984,349 | | |
Building products—0.29% | |
Building Materials Corp. of America
6.750%, due 05/01/214 | | | 191,000 | | | | 200,550 | | |
Cemex SAB de CV
5.875%, due 03/25/194,10 | | | 200,000 | | | | 203,500 | | |
Kimberly-Clark Corp.
2.650%, due 03/01/25 | | | 65,000 | | | | 63,188 | | |
Martin Marietta Materials, Inc.
1.382%, due 06/30/173 | | | 110,000 | | | | 109,642 | | |
Masco Corp.
7.125%, due 03/15/20 | | | 250,000 | | | | 291,250 | | |
Standard Pacific Corp.
8.375%, due 01/15/21 | | | 300,000 | | | | 353,250 | | |
| | | 1,221,380 | | |
Cable—0.08% | |
CCO Holdings LLC/CCO Holdings
Capital Corp.
5.375%, due 05/01/254 | | | 340,000 | | | | 334,900 | | |
Chemicals—0.46% | |
Eastman Chemical Co.
2.700%, due 01/15/20 | | | 420,000 | | | | 420,049 | | |
3.800%, due 03/15/25 | | | 255,000 | | | | 251,068 | | |
Huntsman International LLC
4.875%, due 11/15/2010 | | | 440,000 | | | | 431,200 | | |
Incitec Pivot Ltd.
4.000%, due 12/07/154 | | | 550,000 | | | | 554,740 | | |
LYB International Finance BV
4.000%, due 07/15/23 | | | 125,000 | | | | 127,099 | | |
The Dow Chemical Co.
3.500%, due 10/01/2410 | | | 185,000 | | | | 180,731 | | |
| | | 1,964,887 | | |
41
PACE Select Advisors Trust
PACE Intermediate Fixed Income Investments
Portfolio of investments—July 31, 2015
| | | Face
amount1 | | Value | |
Corporate notes—(continued) | |
Commercial services—0.36% | |
Air Lease Corp.
5.625%, due 04/01/17 | | | 1,000,000 | | | $ | 1,056,160 | | |
Republic Services, Inc.
3.200%, due 03/15/2510 | | | 180,000 | | | | 174,856 | | |
Waste Management, Inc.
3.125%, due 03/01/25 | | | 309,000 | | | | 299,351 | | |
| | | 1,530,367 | | |
Communications equipment—0.39% | |
Apple, Inc.
2.000%, due 05/06/2010 | | | 321,000 | | | | 320,369 | | |
2.850%, due 05/06/2110 | | | 462,000 | | | | 468,694 | | |
NXP BV/NXP Funding LLC
4.625%, due 06/15/224 | | | 200,000 | | | | 198,000 | | |
QUALCOMM, Inc.
2.250%, due 05/20/2010 | | | 200,000 | | | | 197,484 | | |
3.000%, due 05/20/22 | | | 245,000 | | | | 238,266 | | |
3.450%, due 05/20/25 | | | 245,000 | | | | 232,006 | | |
| | | 1,654,819 | | |
Computers—0.17% | |
Hewlett-Packard Co.
2.750%, due 01/14/19 | | | 60,000 | | | | 60,734 | | |
Leidos Holdings, Inc.
4.450%, due 12/01/20 | | | 300,000 | | | | 297,642 | | |
Seagate HDD Cayman
3.750%, due 11/15/18 | | | 370,000 | | | | 385,275 | | |
| | | 743,651 | | |
Consumer products—0.12% | |
Avon Products, Inc.
6.500%, due 03/01/1910 | | | 535,000 | | | | 505,575 | | |
Diversified financial services—0.32% | |
Audatex North America, Inc.
6.125%, due 11/01/234 | | | 180,000 | | | | 175,950 | | |
First Data Corp.
7.375%, due 06/15/194 | | | 122,000 | | | | 127,258 | | |
General Electric Capital Corp.
5.500%, due 01/08/20 | | | 465,000 | | | | 527,424 | | |
General Electric Capital Corp. MTN
4.375%, due 09/16/20 | | | 480,000 | | | | 524,463 | | |
| | | 1,355,095 | | |
Electric utilities—0.13% | |
Exelon Generation Co. LLC
4.250%, due 06/15/22 | | | 235,000 | | | | 241,527 | | |
NRG Energy, Inc.
7.875%, due 05/15/21 | | | 170,000 | | | | 179,030 | | |
8.250%, due 09/01/20 | | | 145,000 | | | | 151,018 | | |
| | | 571,575 | | |
Electric-integrated—1.53% | |
Delphi Corp.
5.000%, due 02/15/23 | | | 165,000 | | | | 174,900 | | |
| | | Face
amount1 | | Value | |
Corporate notes—(continued) | |
Electric-integrated—(concluded) | |
Eaton Corp.
0.950%, due 11/02/15 | | | 910,000 | | | $ | 910,400 | | |
1.500%, due 11/02/17 | | | 298,000 | | | | 297,267 | | |
2.750%, due 11/02/22 | | | 271,000 | | | | 263,370 | | |
Entergy Corp.
4.000%, due 07/15/22 | | | 195,000 | | | | 198,716 | | |
Exelon Corp.
2.850%, due 06/15/20 | | | 70,000 | | | | 70,321 | | |
Jabil Circuit, Inc.
8.250%, due 03/15/18 | | | 620,000 | | | | 699,050 | | |
Jersey Central Power & Light Co.
5.625%, due 05/01/16 | | | 550,000 | | | | 566,508 | | |
Oncor Electric Delivery Co. LLC
4.100%, due 06/01/22 | | | 290,000 | | | | 307,717 | | |
Pacificorp
5.500%, due 01/15/19 | | | 486,000 | | | | 543,941 | | |
5.750%, due 04/01/37 | | | 275,000 | | | | 330,815 | | |
Progress Energy, Inc.
5.625%, due 01/15/16 | | | 995,000 | | | | 1,015,477 | | |
Puget Energy, Inc.
5.625%, due 07/15/22 | | | 450,000 | | | | 504,361 | | |
6.000%, due 09/01/21 | | | 75,000 | | | | 86,367 | | |
The ADT Corp.
4.125%, due 04/15/1910 | | | 180,000 | | | | 182,925 | | |
Virginia Electric & Power Co.
3.100%, due 05/15/25 | | | 185,000 | | | | 182,482 | | |
WEC Energy Group, Inc.
2.450%, due 06/15/20 | | | 170,000 | | | | 170,467 | | |
| | | 6,505,084 | | |
Electric/gas—0.34% | |
Ameren Illinois Co.
6.125%, due 11/15/17 | | | 1,085,000 | | | | 1,200,550 | | |
CenterPoint Energy, Inc.
6.500%, due 05/01/18 | | | 241,000 | | | | 269,559 | | |
| | | 1,470,109 | | |
Electronic equipment & instruments—0.03% | |
Thermo Fisher Scientific, Inc.
3.600%, due 08/15/21 | | | 147,000 | | | | 150,052 | | |
Environmental—0.11% | |
Clean Harbors, Inc.
5.250%, due 08/01/20 | | | 450,000 | | | | 460,755 | | |
Finance-captive automotive—3.24% | |
American Honda Finance Corp.
1.000%, due 08/11/154 | | | 1,315,000 | | | | 1,315,170 | | |
Ares Capital Corp.
3.875%, due 01/15/20 | | | 275,000 | | | | 280,066 | | |
Associated Banc-Corp.
5.125%, due 03/28/16 | | | 822,000 | | | | 837,955 | | |
BB&T Corp.
2.450%, due 01/15/20 | | | 360,000 | | | | 362,003 | | |
BB&T Corp. MTN
2.625%, due 06/29/20 | | | 365,000 | | | | 367,723 | | |
42
PACE Select Advisors Trust
PACE Intermediate Fixed Income Investments
Portfolio of investments—July 31, 2015
| | | Face
amount1 | | Value | |
Corporate notes—(continued) | |
Finance-captive automotive—(concluded) | |
CDP Financial, Inc.
4.400%, due 11/25/194,10 | | | 1,160,000 | | | $ | 1,269,738 | | |
Daimler Finance North America LLC
2.250%, due 03/02/204 | | | 325,000 | | | | 321,054 | | |
2.450%, due 05/18/204,10 | | | 590,000 | | | | 585,590 | | |
ERP Operating LP
3.000%, due 04/15/23 | | | 525,000 | | | | 512,599 | | |
Ford Motor Credit Co. LLC
1.529%, due 05/09/163 | | | 680,000 | | | | 683,037 | | |
1.700%, due 05/09/16 | | | 1,455,000 | | | | 1,459,151 | | |
2.240%, due 06/15/18 | | | 200,000 | | | | 199,784 | | |
6.625%, due 08/15/17 | | | 220,000 | | | | 240,075 | | |
FS Investment Corp.
4.000%, due 07/15/19 | | | 200,000 | | | | 202,741 | | |
General Motors Financial Co., Inc.
3.200%, due 07/13/20 | | | 240,000 | | | | 237,240 | | |
3.450%, due 04/10/2210 | | | 350,000 | | | | 337,204 | | |
3.500%, due 07/10/1910 | | | 675,000 | | | | 685,986 | | |
Harley-Davidson Financial
Services, Inc.
3.875%, due 03/15/164 | | | 450,000 | | | | 458,213 | | |
Hyundai Capital America
2.550%, due 02/06/194 | | | 550,000 | | | | 552,802 | | |
Janus Capital Group, Inc.
6.700%, due 06/15/17 | | | 1,000,000 | | | | 1,085,467 | | |
Lazard Group LLC
4.250%, due 11/14/20 | | | 170,000 | | | | 178,581 | | |
Regions Bank
7.500%, due 05/15/18 | | | 450,000 | | | | 513,701 | | |
Schaeffler Finance BV
4.750%, due 05/15/234 | | | 265,000 | | | | 259,038 | | |
Synchrony Financial
4.500%, due 07/23/25 | | | 285,000 | | | | 285,967 | | |
Volkswagen Group of
America Finance LLC
1.600%, due 11/20/174 | | | 550,000 | | | | 550,616 | | |
| | | 13,781,501 | | |
Finance-other—0.25% | |
FMS Wertmanagement AoeR
1.125%, due 09/05/17 | | | 525,000 | | | | 527,584 | | |
International Lease Finance Corp.
3.875%, due 04/15/18 | | | 550,000 | | | | 556,187 | | |
| | | 1,083,771 | | |
Financial services—5.22% | |
Ally Financial, Inc.
3.250%, due 02/13/18 | | | 690,000 | | | | 689,137 | | |
4.125%, due 02/13/22 | | | 460,000 | | | | 453,100 | | |
5.500%, due 02/15/17 | | | 1,150,000 | | | | 1,200,312 | | |
8.000%, due 11/01/31 | | | 275,000 | | | | 328,625 | | |
American Express Credit Corp. MTN
2.375%, due 05/26/2010 | | | 350,000 | | | | 348,489 | | |
| | | Face
amount1 | | Value | |
Corporate notes—(continued) | |
Financial services—(continued) | |
Barclays PLC
2.750%, due 11/08/1910 | | | 580,000 | | | $ | 577,416 | | |
3.650%, due 03/16/25 | | | 200,000 | | | | 191,765 | | |
4.375%, due 09/11/24 | | | 555,000 | | | | 541,878 | | |
Citigroup, Inc.
1.800%, due 02/05/18 | | | 700,000 | | | | 698,759 | | |
2.400%, due 02/18/2010 | | | 430,000 | | | | 427,227 | | |
4.587%, due 12/15/15 | | | 575,000 | | | | 583,186 | | |
5.950%, due 05/15/253,11 | | | 545,000 | | | | 531,375 | | |
Corp Financiera de Desarrollo SA
4.750%, due 07/15/254,10 | | | 210,000 | | | | 212,625 | | |
Credit Suisse AG Guernsey
2.600%, due 05/27/164 | | | 1,660,000 | | | | 1,683,987 | | |
Doric Nimrod Air Alpha Ltd.
2013-1 Pass Through Trust
5.250%, due 05/30/234 | | | 342,904 | | | | 358,335 | | |
ERAC USA Finance LLC
6.375%, due 10/15/174 | | | 1,000,000 | | | | 1,098,244 | | |
Hutchison Whampoa
International 14 Ltd.
1.625%, due 10/31/174 | | | 495,000 | | | | 491,302 | | |
Icahn Enterprises LP/Icahn
Enterprises Finance Corp.
3.500%, due 03/15/17 | | | 455,000 | | | | 459,777 | | |
5.875%, due 02/01/2210 | | | 75,000 | | | | 77,625 | | |
6.000%, due 08/01/20 | | | 850,000 | | | | 894,625 | | |
Intesa Sanpaolo SpA
3.875%, due 01/16/18 | | | 530,000 | | | | 547,443 | | |
JPMorgan Chase & Co.
1.700%, due 03/01/18 | | | 835,000 | | | | 833,699 | | |
2.200%, due 10/22/19 | | | 410,000 | | | | 409,336 | | |
2.250%, due 01/23/20 | | | 1,005,000 | | | | 992,175 | | |
2.750%, due 06/23/20 | | | 720,000 | | | | 724,409 | | |
3.900%, due 07/15/2510 | | | 280,000 | | | | 285,408 | | |
5.300%, due 05/01/203,11 | | | 380,000 | | | | 378,632 | | |
Morgan Stanley
1.875%, due 01/05/18 | | | 280,000 | | | | 280,891 | | |
2.125%, due 04/25/18 | | | 860,000 | | | | 866,341 | | |
2.650%, due 01/27/2010 | | | 595,000 | | | | 597,192 | | |
2.800%, due 06/16/20 | | | 880,000 | | | | 884,806 | | |
3.750%, due 02/25/23 | | | 210,000 | | | | 214,177 | | |
3.950%, due 04/23/27 | | | 325,000 | | | | 310,531 | | |
6.625%, due 04/01/18 | | | 400,000 | | | | 448,058 | | |
Morgan Stanley GMTN
4.000%, due 07/23/25 | | | 290,000 | | | | 295,683 | | |
Morgan Stanley MTN
2.200%, due 12/07/18 | | | 125,000 | | | | 126,319 | | |
SteelRiver Transmission Co. LLC
4.710%, due 06/30/174 | | | 654,820 | | | | 680,334 | | |
The Hartford Financial Services
Group, Inc.
8.125%, due 06/15/383 | | | 380,000 | | | | 428,450 | | |
The Western Union Co.
5.930%, due 10/01/16 | | | 500,000 | | | | 523,770 | | |
43
PACE Select Advisors Trust
PACE Intermediate Fixed Income Investments
Portfolio of investments—July 31, 2015
| | | Face
amount1 | | Value | |
Corporate notes—(continued) | |
Financial services—(concluded) | |
US Bancorp MTN
1.950%, due 11/15/1810 | | | 560,000 | | | $ | 565,288 | | |
| | | 22,240,731 | | |
Food & drug retailing—0.33% | |
CVS Health Corp.
2.800%, due 07/20/20 | | | 951,000 | | | | 959,417 | | |
3.375%, due 08/12/2410 | | | 315,000 | | | | 310,368 | | |
3.875%, due 07/20/25 | | | 144,000 | | | | 146,481 | | |
| | | 1,416,266 | | |
Food/beverage—0.42% | |
General Mills, Inc.
3.650%, due 02/15/24 | | | 105,000 | | | | 107,836 | | |
JBS Investments GmbH
7.750%, due 10/28/204 | | | 525,000 | | | | 567,000 | | |
Tyson Foods, Inc.
6.600%, due 04/01/16 | | | 300,000 | | | | 310,944 | | |
Unilever Capital Corp.
3.100%, due 07/30/25 | | | 120,000 | | | | 119,397 | | |
WM Wrigley Jr Co.
1.400%, due 10/21/164 | | | 665,000 | | | | 666,492 | | |
| | | 1,771,669 | | |
Gas pipelines—0.36% | |
Kinder Morgan, Inc.
3.050%, due 12/01/19 | | | 255,000 | | | | 252,885 | | |
7.000%, due 06/15/17 | | | 680,000 | | | | 735,364 | | |
Plains All American Pipeline LP/PAA
Finance Corp.
2.600%, due 12/15/1910 | | | 370,000 | | | | 367,024 | | |
3.600%, due 11/01/24 | | | 200,000 | | | | 192,315 | | |
| | | 1,547,588 | | |
Health care equipment & supplies—0.20% | |
Becton Dickinson and Co.
1.800%, due 12/15/17 | | | 110,000 | | | | 109,571 | | |
2.675%, due 12/15/19 | | | 55,000 | | | | 55,396 | | |
3.734%, due 12/15/24 | | | 85,000 | | | | 84,486 | | |
Boston Scientific Corp.
2.850%, due 05/15/20 | | | 275,000 | | | | 274,031 | | |
3.850%, due 05/15/25 | | | 330,000 | | | | 319,297 | | |
| | | 842,781 | | |
Health care providers & services—0.14% | |
Aetna, Inc.
2.750%, due 11/15/22 | | | 130,000 | | | | 122,907 | | |
Cigna Corp.
3.250%, due 04/15/25 | | | 140,000 | | | | 132,604 | | |
Memorial Sloan-Kettering
Cancer Center
4.200%, due 07/01/55 | | | 113,000 | | | | 106,187 | | |
Zimmer Biomet Holdings, Inc.
2.000%, due 04/01/18 | | | 232,000 | | | | 231,799 | | |
| | | 593,497 | | |
| | | Face
amount1 | | Value | |
Corporate notes—(continued) | |
Industrial conglomerates—0.05% | |
General Electric Co.
3.375%, due 03/11/24 | | | 190,000 | | | $ | 193,896 | | |
Insurance—0.43% | |
American International Group, Inc.
3.750%, due 07/10/2510 | | | 190,000 | | | | 189,986 | | |
MetLife, Inc.
3.000%, due 03/01/25 | | | 155,000 | | | | 149,189 | | |
5.250%, due 06/15/203,10,11 | | | 225,000 | | | | 224,438 | | |
Pacific LifeCorp.
5.125%, due 01/30/434 | | | 360,000 | | | | 371,051 | | |
Prudential Financial, Inc. MTN
3.000%, due 05/12/16 | | | 260,000 | | | | 264,308 | | |
4.750%, due 09/17/15 | | | 270,000 | | | | 271,285 | | |
Willis Group Holdings PLC
5.750%, due 03/15/21 | | | 145,000 | | | | 161,585 | | |
Willis North America, Inc.
6.200%, due 03/28/17 | | | 185,000 | | | | 196,436 | | |
| | | 1,828,278 | | |
Manufacturing-diversified—0.02% | |
SPX Corp.
6.875%, due 09/01/17 | | | 95,000 | | | | 102,006 | | |
Media—1.44% | |
Alibaba Group Holding Ltd.
2.500%, due 11/28/194 | | | 315,000 | | | | 310,636 | | |
CCO Safari II LLC
3.579%, due 07/23/204 | | | 850,000 | | | | 852,511 | | |
4.464%, due 07/23/224 | | | 415,000 | | | | 417,241 | | |
Comcast Corp.
3.375%, due 08/15/25 | | | 496,000 | | | | 494,490 | | |
4.250%, due 01/15/33 | | | 360,000 | | | | 358,263 | | |
DIRECTV Holdings LLC/DIRECTV
Financing Co., Inc.
3.800%, due 03/15/22 | | | 73,000 | | | | 73,128 | | |
3.950%, due 01/15/2510 | | | 70,000 | | | | 68,905 | | |
4.450%, due 04/01/24 | | | 276,000 | | | | 283,780 | | |
4.600%, due 02/15/21 | | | 118,000 | | | | 125,271 | | |
Discovery Communications LLC
3.450%, due 03/15/25 | | | 140,000 | | | | 131,716 | | |
Expedia, Inc.
7.456%, due 08/15/18 | | | 465,000 | | | | 530,399 | | |
NBCUniversal Enterprise, Inc.
5.250%, due 03/19/214,11 | | | 375,000 | | | | 398,906 | | |
NBCUniversal Media LLC
4.450%, due 01/15/43 | | | 280,000 | | | | 278,524 | | |
Sirius XM Radio, Inc.
4.250%, due 05/15/204 | | | 500,000 | | | | 498,125 | | |
Sky PLC
2.625%, due 09/16/194 | | | 200,000 | | | | 199,904 | | |
Thomson Reuters Corp.
1.300%, due 02/23/17 | | | 650,000 | | | | 649,178 | | |
Time Warner Cable, Inc.
4.500%, due 09/15/4210 | | | 205,000 | | | | 165,397 | | |
5.000%, due 02/01/2010 | | | 265,000 | | | | 284,269 | | |
| | | 6,120,643 | | |
44
PACE Select Advisors Trust
PACE Intermediate Fixed Income Investments
Portfolio of investments—July 31, 2015
| | | Face
amount1 | | Value | |
Corporate notes—(continued) | |
Medical providers—0.54% | |
Anthem, Inc.
3.300%, due 01/15/23 | | | 83,000 | | | $ | 80,312 | | |
3.500%, due 08/15/24 | | | 200,000 | | | | 193,929 | | |
HCA, Inc.
3.750%, due 03/15/19 | | | 310,000 | | | | 314,456 | | |
Laboratory Corp. of
America Holdings
2.625%, due 02/01/20 | | | 255,000 | | | | 253,867 | | |
UnitedHealth Group, Inc.
2.700%, due 07/15/20 | | | 641,000 | | | | 648,477 | | |
2.875%, due 12/15/2110 | | | 250,000 | | | | 249,353 | | |
2.875%, due 03/15/22 | | | 565,000 | | | | 558,169 | | |
| | | 2,298,563 | | |
Metals & mining—1.12% | |
ArcelorMittal
5.125%, due 06/01/2010 | | | 140,000 | | | | 140,350 | | |
5.250%, due 02/25/17 | | | 550,000 | | | | 568,562 | | |
Constellium NV
8.000%, due 01/15/234,10 | | | 275,000 | | | | 264,688 | | |
Freeport-McMoRan, Inc.
4.000%, due 11/14/21 | | | 320,000 | | | | 279,200 | | |
Glencore Funding LLC
1.700%, due 05/27/164 | | | 550,000 | | | | 549,777 | | |
Harsco Corp.
2.700%, due 10/15/15 | | | 500,000 | | | | 500,625 | | |
5.750%, due 05/15/18 | | | 550,000 | | | | 563,750 | | |
Novelis, Inc.
8.750%, due 12/15/20 | | | 665,000 | | | | 701,575 | | |
Southern Copper Corp.
3.875%, due 04/23/2510 | | | 100,000 | | | | 96,064 | | |
Vale Overseas Ltd.
6.250%, due 01/11/16 | | | 650,000 | | | | 662,025 | | |
Wise Metals Group LLC/Wise
Alloys Finance Corp.
8.750%, due 12/15/184 | | | 441,000 | | | | 451,055 | | |
| | | 4,777,671 | | |
Multi-line insurance—0.10% | |
American International Group, Inc.
4.875%, due 06/01/2210 | | | 245,000 | | | | 270,768 | | |
5.450%, due 05/18/17 | | | 150,000 | | | | 160,740 | | |
| | | 431,508 | | |
Oil & gas—1.66% | |
Chesapeake Energy Corp.
3.250%, due 03/15/16 | | | 550,000 | | | | 544,156 | | |
6.625%, due 08/15/2010 | | | 300,000 | | | | 268,500 | | |
Chevron Phillips Chemical Co. LLC/
Chevron Phillips Chemical Co. LP
2.450%, due 05/01/204 | | | 140,000 | | | | 140,100 | | |
CONSOL Energy, Inc.
5.875%, due 04/15/22 | | | 310,000 | | | | 240,831 | | |
Continental Resources, Inc.
4.900%, due 06/01/4410 | | | 90,000 | | | | 70,860 | | |
5.000%, due 09/15/22 | | | 235,000 | | | | 223,837 | | |
| | | Face
amount1 | | Value | |
Corporate notes—(continued) | |
Oil & gas—(concluded) | |
Ecopetrol SA
4.125%, due 01/16/2510 | | | 195,000 | | | $ | 178,425 | | |
Ensco PLC
4.500%, due 10/01/2410 | | | 195,000 | | | | 178,691 | | |
5.750%, due 10/01/44 | | | 14,000 | | | | 12,187 | | |
EOG Resources, Inc.
3.150%, due 04/01/25 | | | 65,000 | | | | 63,517 | | |
Freeport-McMoran
Oil & Gas LLC/FCX Oil & Gas, Inc.
6.500%, due 11/15/20 | | | 505,000 | | | | 489,850 | | |
Kinder Morgan Energy Partners LP
3.500%, due 09/01/23 | | | 40,000 | | | | 36,726 | | |
3.950%, due 09/01/22 | | | 105,000 | | | | 101,177 | | |
4.150%, due 02/01/2410 | | | 100,000 | | | | 95,107 | | |
4.250%, due 09/01/24 | | | 180,000 | | | | 170,832 | | |
MEG Energy Corp.
7.000%, due 03/31/244 | | | 175,000 | | | | 160,563 | | |
Petrobras Global Finance BV
6.250%, due 03/17/2410 | | | 254,000 | | | | 235,458 | | |
Petroleos Mexicanos
4.875%, due 01/24/22 | | | 159,000 | | | | 165,137 | | |
6.000%, due 03/05/20 | | | 35,000 | | | | 39,156 | | |
8.000%, due 05/03/19 | | | 100,000 | | | | 116,875 | | |
Pioneer Natural Resources Co.
6.875%, due 05/01/18 | | | 865,000 | | | | 961,246 | | |
Rowan Cos., Inc.
5.000%, due 09/01/17 | | | 69,000 | | | | 71,114 | | |
Shell International Finance BV
2.125%, due 05/11/20 | | | 330,000 | | | | 329,686 | | |
3.250%, due 05/11/25 | | | 660,000 | | | | 651,939 | | |
Southwestern Energy Co.
3.300%, due 01/23/18 | | | 70,000 | | | | 71,029 | | |
Statoil ASA
2.650%, due 01/15/24 | | | 435,000 | | | | 416,998 | | |
Transocean, Inc.
5.550%, due 12/15/1610 | | | 786,000 | | | | 793,860 | | |
6.000%, due 03/15/1810 | | | 17,000 | | | | 16,320 | | |
WPX Energy, Inc.
7.500%, due 08/01/2010 | | | 210,000 | | | | 213,150 | | |
| | | 7,057,327 | | |
Oil field equipment & services—0.17% | |
Cameron International Corp.
1.400%, due 06/15/17 | | | 170,000 | | | | 168,764 | | |
SESI LLC
7.125%, due 12/15/21 | | | 520,000 | | | | 540,800 | | |
| | | 709,564 | | |
Oil services—0.45% | |
BP Capital Markets PLC
2.750%, due 05/10/2310 | | | 145,000 | | | | 138,770 | | |
3.062%, due 03/17/2210 | | | 265,000 | | | | 264,963 | | |
Petrobras International Finance Co. SA
3.875%, due 01/27/16 | | | 1,505,000 | | | | 1,507,258 | | |
| | | 1,910,991 | | |
45
PACE Select Advisors Trust
PACE Intermediate Fixed Income Investments
Portfolio of investments—July 31, 2015
| | | Face
amount1 | | Value | |
Corporate notes—(continued) | |
Paper & forest products—0.25% | |
Domtar Corp.
10.750%, due 06/01/17 | | | 350,000 | | | $ | 402,563 | | |
International Paper Co.
3.650%, due 06/15/24 | | | 125,000 | | | | 124,009 | | |
Sappi Papier Holding GmbH
7.750%, due 07/15/174 | | | 498,000 | | | | 535,350 | | |
| | | 1,061,922 | | |
Pharmaceuticals—1.95% | |
AbbVie, Inc.
1.800%, due 05/14/18 | | | 900,000 | | | | 897,545 | | |
2.500%, due 05/14/20 | | | 340,000 | | | | 337,911 | | |
2.900%, due 11/06/22 | | | 415,000 | | | | 402,647 | | |
3.600%, due 05/14/25 | | | 105,000 | | | | 103,442 | | |
Actavis Funding SCS
2.350%, due 03/12/18 | | | 300,000 | | | | 300,924 | | |
3.000%, due 03/12/20 | | | 880,000 | | | | 875,567 | | |
3.450%, due 03/15/22 | | | 430,000 | | | | 422,986 | | |
3.850%, due 06/15/24 | | | 45,000 | | | | 44,101 | | |
4.550%, due 03/15/35 | | | 205,000 | | | | 192,631 | | |
4.750%, due 03/15/45 | | | 80,000 | | | | 75,430 | | |
Eli Lilly & Co.
2.750%, due 06/01/25 | | | 60,000 | | | | 58,436 | | |
Endo Finance LLC/Endo Finco, Inc.
5.375%, due 01/15/234 | | | 195,000 | | | | 197,071 | | |
Forest Laboratories, Inc.
5.000%, due 12/15/214 | | | 1,100,000 | | | | 1,191,875 | | |
Medtronic, Inc.
2.500%, due 03/15/204 | | | 490,000 | | | | 492,890 | | |
3.500%, due 03/15/254 | | | 310,000 | | | | 309,427 | | |
4.625%, due 03/15/454 | | | 170,000 | | | | 171,991 | | |
Merck & Co., Inc.
2.350%, due 02/10/22 | | | 235,000 | | | | 229,961 | | |
2.750%, due 02/10/25 | | | 240,000 | | | | 229,727 | | |
Mylan, Inc.
3.125%, due 01/15/234 | | | 340,000 | | | | 324,670 | | |
Novartis Capital Corp.
3.400%, due 05/06/2410 | | | 255,000 | | | | 260,088 | | |
Teva Pharmaceutical Finance Co. BV
2.950%, due 12/18/22 | | | 200,000 | | | | 191,705 | | |
Valeant Pharmaceuticals
International, Inc.
5.375%, due 03/15/204 | | | 255,000 | | | | 262,013 | | |
5.875%, due 05/15/234 | | | 295,000 | | | | 306,770 | | |
Zoetis, Inc.
1.875%, due 02/01/18 | | | 420,000 | | | | 417,989 | | |
| | | 8,297,797 | | |
Pipelines—1.66% | |
Buckeye Partners LP
2.650%, due 11/15/18 | | | 220,000 | | | | 219,446 | | |
El Paso Pipeline Partners
Operating Co. LLC
4.100%, due 11/15/15 | | | 2,725,000 | | | | 2,747,304 | | |
4.300%, due 05/01/24 | | | 120,000 | | | | 115,611 | | |
| | | Face
amount1 | | Value | |
Corporate notes—(continued) | |
Pipelines—(concluded) | |
Energy Transfer Partners LP
2.500%, due 06/15/18 | | | 195,000 | | | $ | 195,286 | | |
4.150%, due 10/01/20 | | | 95,000 | | | | 97,450 | | |
5.150%, due 03/15/45 | | | 110,000 | | | | 96,418 | | |
Enterprise Products Operating LLC
3.200%, due 02/01/16 | | | 1,145,000 | | | | 1,157,046 | | |
3.350%, due 03/15/23 | | | 80,000 | | | | 78,045 | | |
3.700%, due 02/15/26 | | | 65,000 | | | | 62,939 | | |
8.375%, due 08/01/663 | | | 585,000 | | | | 596,700 | | |
Sabine Pass Liquefaction LLC
5.625%, due 03/01/254 | | | 395,000 | | | | 389,075 | | |
Sunoco Logistics Partners
Operations LP
3.450%, due 01/15/23 | | | 215,000 | | | | 201,454 | | |
Williams Cos., Inc.
7.875%, due 09/01/21 | | | 390,000 | | | | 449,466 | | |
Williams Partners LP
3.600%, due 03/15/22 | | | 295,000 | | | | 284,646 | | |
4.000%, due 11/15/21 | | | 145,000 | | | | 145,252 | | |
4.500%, due 11/15/2310 | | | 240,000 | | | | 237,480 | | |
| | | 7,073,618 | | |
Real estate investment trusts—1.04% | |
American Tower Corp.
4.000%, due 06/01/2510 | | | 71,000 | | | | 69,573 | | |
ARC Properties Operating Partnership
LP/Clark Acquisition LLC
2.000%, due 02/06/17 | | | 820,000 | | | | 802,575 | | |
3.000%, due 02/06/19 | | | 240,000 | | | | 229,410 | | |
AvalonBay Communities, Inc. MTN
2.850%, due 03/15/23 | | | 335,000 | | | | 322,354 | | |
DDR Corp.
9.625%, due 03/15/16 | | | 900,000 | | | | 944,844 | | |
Duke Realty LP
5.950%, due 02/15/17 | | | 400,000 | | | | 426,471 | | |
HCP, Inc.
6.000%, due 01/30/17 | | | 300,000 | | | | 318,578 | | |
Highwoods Realty LP
7.500%, due 04/15/18 | | | 400,000 | | | | 455,632 | | |
Simon Property Group LP
3.375%, due 03/15/22 | | | 375,000 | | | | 385,052 | | |
UDR, Inc. MTN
4.250%, due 06/01/18 | | | 350,000 | | | | 370,651 | | |
Ventas Realty LP
4.125%, due 01/15/26 | | | 110,000 | | | | 110,195 | | |
| | | 4,435,335 | | |
Retail—0.61% | |
Amazon.com, Inc.
0.650%, due 11/27/15 | | | 1,190,000 | | | | 1,190,283 | | |
Family Tree Escrow LLC
5.250%, due 03/01/204,10 | | | 70,000 | | | | 73,850 | | |
5.750%, due 03/01/234 | | | 215,000 | | | | 226,825 | | |
Macy's Retail Holdings, Inc.
7.450%, due 07/15/17 | | | 1,000,000 | | | | 1,110,166 | | |
| | | 2,601,124 | | |
46
PACE Select Advisors Trust
PACE Intermediate Fixed Income Investments
Portfolio of investments—July 31, 2015
| | | Face
amount1 | | Value | |
Corporate notes—(continued) | |
Semiconductor equipment & products—0.04% | |
Intel Corp.
3.700%, due 07/29/25 | | | 145,000 | | | $ | 146,373 | | |
4.900%, due 07/29/45 | | | 40,000 | | | | 41,084 | | |
| | | 187,457 | | |
Software & services—0.16% | |
Oracle Corp.
2.800%, due 07/08/21 | | | 340,000 | | | | 342,582 | | |
2.950%, due 05/15/25 | | | 295,000 | | | | 284,198 | | |
3.400%, due 07/08/24 | | | 44,000 | | | | 44,301 | | |
| | | 671,081 | | |
Special purpose entity—0.71% | |
Bunge Ltd. Finance Corp.
3.200%, due 06/15/17 | | | 1,127,000 | | | | 1,158,922 | | |
CNH Industrial Capital LLC
3.375%, due 07/15/19 | | | 580,000 | | | | 570,575 | | |
Crown Castle Towers LLC
6.113%, due 01/15/204 | | | 495,000 | | | | 551,799 | | |
Penske Truck Leasing Co.
LP/PTL Finance Corp.
2.500%, due 06/15/194 | | | 150,000 | | | | 148,482 | | |
3.050%, due 01/09/204 | | | 315,000 | | | | 316,314 | | |
3.375%, due 02/01/224 | | | 265,000 | | | | 258,734 | | |
| | | 3,004,826 | | |
Technology, hardware & equipment—0.25% | |
Pitney Bowes, Inc. MTN
5.750%, due 09/15/17 | | | 994,000 | | | | 1,070,340 | | |
Telecommunications—0.80% | |
Alcatel-Lucent USA, Inc.
6.750%, due 11/15/204 | | | 460,000 | | | | 494,500 | | |
Altice SA
7.625%, due 02/15/254 | | | 200,000 | | | | 196,000 | | |
Cisco Systems, Inc.
2.450%, due 06/15/20 | | | 550,000 | | | | 555,147 | | |
Harris Corp.
2.700%, due 04/27/20 | | | 45,000 | | | | 44,300 | | |
Sprint Corp.
7.875%, due 09/15/23 | | | 530,000 | | | | 508,138 | | |
Verizon Communications, Inc.
2.450%, due 11/01/22 | | | 560,000 | | | | 533,868 | | |
2.625%, due 02/21/20 | | | 370,000 | | | | 369,598 | | |
3.000%, due 11/01/21 | | | 210,000 | | | | 208,413 | | |
4.400%, due 11/01/34 | | | 350,000 | | | | 328,103 | | |
5.150%, due 09/15/23 | | | 149,000 | | | | 163,992 | | |
| | | 3,402,059 | | |
Telephone-integrated—0.06% | |
Level 3 Financing, Inc.
5.375%, due 08/15/22 | | | 245,000 | | | | 247,450 | | |
Textile/apparel—0.13% | |
Hanesbrands, Inc.
6.375%, due 12/15/20 | | | 520,000 | | | | 542,750 | | |
| | | Face
amount1 | | Value | |
Corporate notes—(concluded) | |
Tobacco—0.38% | |
Altria Group, Inc.
2.850%, due 08/09/22 | | | 250,000 | �� | | $ | 242,050 | | |
Imperial Tobacco Finance PLC
2.950%, due 07/21/204 | | | 425,000 | | | | 423,191 | | |
Philip Morris International, Inc.
1.875%, due 01/15/19 | | | 270,000 | | | | 269,967 | | |
Reynolds American, Inc.
2.300%, due 06/12/1810 | | | 165,000 | | | | 166,465 | | |
3.250%, due 06/12/20 | | | 85,000 | | | | 86,338 | | |
4.450%, due 06/12/25 | | | 420,000 | | | | 431,349 | | |
| | | 1,619,360 | | |
Transportation—0.22% | |
Burlington Northern Santa Fe LLC
3.000%, due 04/01/2510 | | | 165,000 | | | | 158,944 | | |
Canadian Pacific Railway Co.
3.700%, due 02/01/26 | | | 50,000 | | | | 49,950 | | |
Ryder System, Inc. MTN
2.450%, due 09/03/19 | | | 180,000 | | | | 180,043 | | |
2.650%, due 03/02/20 | | | 130,000 | | | | 130,093 | | |
Union Pacific Railroad Co. 2014-1
Pass Through Trust
3.227%, due 05/14/26 | | | 193,120 | | | | 193,512 | | |
Virgin Australia 2013-1B Trust
6.000%, due 10/23/204 | | | 233,922 | | | | 239,770 | | |
| | | 952,312 | | |
Utilities—0.30% | |
HD Supply, Inc.
7.500%, due 07/15/20 | | | 1,125,000 | | | | 1,200,937 | | |
IPALCO Enterprises, Inc.
5.000%, due 05/01/18 | | | 69,000 | | | | 72,321 | | |
| | | 1,273,258 | | |
Wireless telecommunications—0.95% | |
AT&T, Inc.
2.300%, due 03/11/1910 | | | 110,000 | | | | 110,427 | | |
2.375%, due 11/27/18 | | | 110,000 | | | | 111,002 | | |
2.450%, due 06/30/20 | | | 430,000 | | | | 422,963 | | |
2.625%, due 12/01/22 | | | 320,000 | | | | 302,227 | | |
3.000%, due 06/30/22 | | | 635,000 | | | | 614,459 | | |
3.400%, due 05/15/25 | | | 200,000 | | | | 191,052 | | |
Crown Castle Towers LLC
4.174%, due 08/15/174 | | | 200,000 | | | | 207,195 | | |
IAC/InterActiveCorp
4.875%, due 11/30/18 | | | 400,000 | | | | 413,300 | | |
Sprint Communications, Inc.
7.000%, due 03/01/204 | | | 498,000 | | | | 530,370 | | |
T-Mobile USA, Inc.
6.464%, due 04/28/19 | | | 755,000 | | | | 778,594 | | |
Vodafone Group PLC
2.500%, due 09/26/2210 | | | 207,000 | | | | 191,258 | | |
Zayo Group LLC/Zayo Capital, Inc.
6.000%, due 04/01/234 | | | 155,000 | | | | 155,502 | | |
| | | 4,028,349 | | |
Total corporate notes
(cost—$160,319,844) | | | | | 160,056,000 | | |
47
PACE Select Advisors Trust
PACE Intermediate Fixed Income Investments
Portfolio of investments—July 31, 2015
| | | Face
amount1 | | Value | |
Non-US government obligations—0.36% | |
Brazilian Government
International Bond
2.625%, due 01/05/2310 | | | 315,000 | | | $ | 274,050 | | |
4.250%, due 01/07/2510 | | | 255,000 | | | | 240,592 | | |
Republic of Columbia
2.625%, due 03/15/2310 | | | 200,000 | | | | 183,500 | | |
4.000%, due 02/26/24 | | | 430,000 | | | | 428,280 | | |
South Africa Government
International Bond
5.375%, due 07/24/4410 | | | 200,000 | | | | 201,500 | | |
Uruguay Government
International Bond
4.500%, due 08/14/24 | | | 190,000 | | | | 201,163 | | |
Total non-US government
obligations
(cost—$1,545,226) | | | | | 1,529,085 | | |
Municipal bonds and notes—0.05% | |
Education—0.05% | |
Access to Loans for Learning
Student Loan Corp. Revenue,
Student Loan Program, Series A13
0.495%, due 04/25/243
(cost—$211,413) | | | 215,103 | | | | 212,352 | | |
| | Number of
shares | | | |
Preferred stocks—0.14% | |
Oil & Gas—0.09% | |
Anadarko Petroleum Corp.3,12 | | | 5,200 | | | | 260,676 | | |
Southwestern Energy Co.3,13 | | | 2,350 | | | | 101,050 | | |
| | | 361,726 | | |
Pharmaceuticals—0.05% | |
Allergan PLC3,14 | | | 200 | | | | 222,426 | | |
Total preferred stocks
(cost—$580,133) | | | | | 584,152 | | |
| | Face
amount1 | | | |
Repurchase agreement—1.27% | |
Repurchase agreement dated
07/31/15 with State Street
Bank and Trust Co., 0.000%
due 08/03/15, collateralized by
$1,551,103 Federal Home Loan
Mortgage Corp. obligation,
2.080% due 10/17/22,
$389,249 Federal National
Mortgage Association obligation,
2.170% due 10/17/22 and
$3,470,773 US Treasury Notes,
1.625% to 3.625%
due 03/31/19 to 06/30/20;
(value—$5,501,969);
proceeds: $5,394,000
(cost—$5,394,000) | | | 5,394,000 | | | | 5,394,000 | | |
| | | Number of
contracts/
Notional
amount | | Value | |
Options purchased—0.01% | |
Put options & swaptions purchased—0.01% | |
3 Month USD LIBOR 30 Year Swap,
strike @ 3.050%, expires
01/11/16 (Counterparty: CSI;
receive fixed rate); underlying
swap terminates 01/13/4615 | | USD | 1,800,000 | | | $ | 40,874 | | |
3 Month USD LIBOR 7 Year Swap,
strike @ 2.250%, expires
08/04/15 (Counterparty: BOA;
receive fixed rate); underlying
swap terminates 08/06/2215 | | USD | 9,400,000 | | | | 12 | | |
EUR Put/USD Call, strike @ EUR
1.07, expires 08/17/15
(Counterparty: BNP) | | EUR | 1,395,000 | | | | 1,909 | | |
EUR Put/USD Call, strike @ EUR
1.10, expires 08/17/15
(Counterparty: BOA) | | EUR | 1,395,000 | | | | 12,174 | | |
Eurodollar Futures, strike @ 98,
expires 12/14/15 | | | 167 | | | | 1,044 | | |
Eurodollar Futures, strike @ 99,
expires 12/14/15 | | | 167 | | | | 1,044 | | |
Total put options & swaptions
purchased | | | | | 57,057 | | |
Total options purchased
(cost—$282,713) | | | | | 57,057 | | |
| | Number of
shares | | | |
Investment of cash collateral from securities loaned—3.62% | |
Money market fund—3.62% | |
UBS Private Money Market Fund LLC16
(cost—$15,390,673) | | | 15,390,673 | | | | 15,390,673 | | |
Total investments before
investments sold short
(cost—$435,502,117)—102.36% | | | | | 435,690,166 | | |
| | Face
amount1 | | | |
Investment sold short—(0.75)% | |
FNMA TBA*
4.000%
(proceeds—$(3,168,734)) | | | (3,000,000 | ) | | | (3,191,484 | ) | |
Liabilities in excess of
other assets—(1.61)% | | | | | (6,832,757 | ) | |
Net assets—100.00% | | | | $ | 425,665,925 | | |
48
PACE Select Advisors Trust
PACE Intermediate Fixed Income Investments
Portfolio of investments—July 31, 2015
For a listing of defined portfolio acronyms, counterparty acronyms and currency abbreviations that are used throughout the Portfolio of investments as well as the tables that follow, please refer to page 254.
Aggregate cost for federal income tax purposes before investments sold short was $435,687,258; and net unrealized appreciation consisted of:
Gross unrealized appreciation | | $ | 2,600,744 | | |
Gross unrealized depreciation | | | (2,597,836 | ) | |
Net unrealized appreciation | | $ | 2,908 | | |
Written options
Number of
contracts | | Put options written | | Expiration
date | | Premiums
received | | Current
value | | Unrealized
appreciation | |
| | 334 | | | Eurodollar Futures, strike @ 98.5 | | 12/14/15 | | $ | 66,282 | | | $ | (2,087 | ) | | $ | 64,195 | | |
Written options activity for the year ended July 31, 2015 was as follows:
| | Number of
contracts | | Premiums
received | |
Options outstanding at July 31, 2014 | | | — | | | $ | — | | |
Options written | | | 536 | | | | 94,678 | | |
Options terminated in closing purchase transactions | | | (42 | ) | | | (18,644 | ) | |
Options expired prior to exercise | | | (160 | ) | | | (9,752 | ) | |
Options outstanding at July 31, 2015 | | | 334 | | | $ | 66,282 | | |
Written swaptions and foreign exchange written options15
Notional
amount
(000) | | Call swaptions written | | Counterparty | | Pay/
receive
floating
rate | | Expiration
date | | Premiums
received | | Current
value | | Unrealized
appreciation
(depreciation) | |
USD | 5,900 | | | 3 Month USD LIBOR Interest
Rate Swap strike @ 1.80%,
terminating 02/08/27 | | CSI | | Receive | | 02/06/17 | | $ | 113,280 | | | $ | (62,709 | ) | | $ | 50,571 | | |
USD | 1,800 | | | 3 Month USD LIBOR Interest
Rate Swap strike @ 1.90%,
terminating 01/13/46 | | JPMCB | | Receive | | 01/11/16 | | | 55,946 | | | | (5,005 | ) | | | 50,941 | | |
USD | 4,300 | | | 3 Month USD LIBOR Interest
Rate Swap strike @ 1.90%,
terminating 02/15/27 | | CSI | | Receive | | 02/13/17 | | | 84,280 | | | | (54,350 | ) | | | 29,930 | | |
EUR | 3,960 | | | 6 Month EURIBOR Interest
Rate Swap strike @ 0.35%,
terminating 01/28/21 | | JPMCB | | Receive | | 01/26/16 | | | 6,955 | | | | (8,971 | ) | | | (2,016 | ) | |
EUR | 1,470 | | | 6 Month EURIBOR Interest
Rate Swap strike @ 1.35%,
terminating 12/18/45 | | CSI | | Receive | | 12/16/15 | | | 53,127 | | | | (46,902 | ) | | | 6,225 | | |
| | | | | | | | | | | | | $ | 313,588 | | | $ | (177,937 | ) | | $ | 135,651 | | |
| | Put swaptions written | | | | | | | | | | | | | |
USD | 5,900 | | | 3 Month USD LIBOR Interest
Rate Swap strike @ 2.80%,
terminating 02/08/27 | | CSI | | Pay | | 02/06/17 | | $ | 174,050 | | | $ | (189,944 | ) | | $ | (15,894 | ) | |
USD | 4,300 | | | 3 Month USD LIBOR Interest
Rate Swap strike @ 2.90%,
terminating 02/15/27 | | CSI | | Pay | | 02/13/17 | | | 122,550 | | | | (123,952 | ) | | | (1,402 | ) | |
EUR | 7,920 | | | 6 Month EURIBOR Interest
Rate Swap strike @ 0.55%,
terminating 01/28/21 | | CSI | | Pay | | 01/26/16 | | | 42,282 | | | | (39,042 | ) | | | 3,240 | | |
49
PACE Select Advisors Trust
PACE Intermediate Fixed Income Investments
Portfolio of investments—July 31, 2015
Written swaptions and foreign exchange written options15—(concluded)
Notional
amount
(000) | | Put swaptions written | | Counterparty | | Pay/
receive
floating
rate | | Expiration
date | | Premiums
received | | Current
value | | Unrealized
appreciation | |
EUR | 1,470 | | | 6 Month EURIBOR Interest
Rate Swap strike @ 1.65%,
terminating 12/18/45 | | CSI | | Pay | | 12/16/15 | | $ | 104,594 | | | $ | (53,797 | ) | | $ | 50,797 | | |
| | | | | | | | | | | | | $ | 443,476 | | | $ | (406,735 | ) | | $ | 36,741 | | |
| | Put options written | | | | | | | | | | | | | |
EUR | 1,395 | | | EUR Put/USD Call,
strike @ EUR 1.05 | | BOA | |
| | 08/17/15 | | $ | 3,474 | | | $ | (301 | ) | | $ | 3,173 | | |
EUR | 1,395 | | | EUR Put/USD Call,
strike @ EUR 1.10 | | BNP | |
| | 08/17/15 | | | 20,423 | | | | (12,535 | ) | | | 7,888 | | |
| | | | | | | | | | | | | $ | 23,897 | | | $ | (12,836 | ) | | $ | 11,061 | | |
| | | | | | | | | | | | | $ | 780,961 | | | $ | (597,508 | ) | | $ | 183,453 | | |
Swaptions and foreign exchange written options activity for the year ended July 31, 2015 was as follows:
| | Premiums
received | |
Swaptions and foreign exchange options outstanding at July 31, 2014 | | $ | 612,602 | | |
Swaptions and foreign exchange options written | | | 1,875,694 | | |
Swaptions and foreign exchange options exercised | | | (1,390,693 | ) | |
Swaptions and foreign exchange options terminated in closing purchase transactions | | | (316,642 | ) | |
Swaptions and foreign exchange options outstanding at July 31, 2015 | | $ | 780,961 | | |
Futures contracts
Number of
contracts | | Currency | |
| | Expiration
date | | Cost | | Current
value | | Unrealized
appreciation
(depreciation) | |
Interest rate futures buy contracts: | | | |
| | 101 | | | USD | | | | 90-Day Eurodollar Futures | | December 2016 | | $ | 24,840,768 | | | $ | 24,924,275 | | | $ | 83,507 | | |
US Treasury futures buy contracts: | | | |
| | 1 | | | USD | | | | US Long Bond Futures | | September 2015 | | | 152,261 | | | | 155,937 | | | | 3,676 | | |
| | 429 | | | USD | | | | US Treasury Note 2 Year Futures | | September 2015 | | | 93,775,179 | | | | 93,977,813 | | | | 202,634 | | |
| | 223 | | | USD | | | | US Treasury Note 5 Year Futures | | September 2015 | | | 26,607,877 | | | | 26,725,156 | | | | 117,279 | | |
| | | | | | | | | | | $ | 145,376,085 | | | $ | 145,783,181 | | | $ | 407,096 | | |
| | | | | | | | Proceeds | | | | | |
Interest rate futures sell contracts: | | | |
| | 101 | | | USD | | | | 90-Day Eurodollar Futures | | December 2017 | | $ | 24,707,388 | | | $ | 24,770,250 | | | $ | (62,862 | ) | |
US Treasury futures sell contracts: | | | |
| | 52 | | | USD | | | | Ultra Long US Treasury Bond Futures | | September 2015 | | | 8,158,151 | | | | 8,295,625 | | | | (137,474 | ) | |
| | 31 | | | USD | | | | US Long Bond Futures | | September 2015 | | | 4,770,164 | | | | 4,834,062 | | | | (63,898 | ) | |
| | 81 | | | USD | | | | US Treasury Note 10 Year Futures | | September 2015 | | | 10,267,508 | | | | 10,322,438 | | | | (54,930 | ) | |
| | | | | | | | | | | $ | 47,903,211 | | | $ | 48,222,375 | | | $ | (319,164 | ) | |
| | | | | | | | | | | | | | | $ | 87,932 | | |
50
PACE Select Advisors Trust
PACE Intermediate Fixed Income Investments
Portfolio of investments—July 31, 2015
Forward foreign currency contracts
| Counterparty | | Contracts to
deliver | | In
exchange for | | Maturity
date | | Unrealized
appreciation
(depreciation) | |
CSI | | USD | 805,000 | | | CHF | 774,899 | | | 08/05/15 | | $ | (3,051 | ) | |
DB | | USD | 810,000 | | | CHF | 766,437 | | | 08/05/15 | | | (16,809 | ) | |
CSI | | USD | 855,000 | | | CHF | 805,172 | | | 08/10/15 | | | (21,592 | ) | |
CSI | | CHF | 1,529,706 | | | USD | 1,635,000 | | | 08/05/15 | | | 51,896 | | |
BB | | CHF | 761,330 | | | USD | 835,000 | | | 08/10/15 | | | 46,972 | | |
| | | | | | | | $ | 57,416 | | |
Centrally cleared interest rate swap agreements
Notional
amount
(000) | | Termination
date | | Payments made by
the Portfolio17 | | Payments received by
the Portfolio17 | | Value | | Unrealized
appreciation
(depreciation) | |
USD | 9,900 | | | 02/11/25 | | | 2.050 | % | | 3 Month USD LIBOR | | $ | 90,085 | | | $ | 89,890 | | |
USD | 7,100 | | | 11/30/19 | | | 1.650 | | | 3 Month USD LIBOR | | | (14,048 | ) | | | (14,171 | ) | |
| | | | | | | | $ | 76,037 | | | $ | 75,719 | | |
Credit default swaps on credit index—sell protection18
| Counterparty | | Referenced obligations19 | | Notional
amount
(000) | | Termination
date | | Payments
received by
the Portfolio17 | | Upfront
payments
received | | Value | | Unrealized
appreciation | |
JPMCB | | Markit CMBX NA
Series 6 Index | | USD | 300 | | | 05/11/63 | | | 3.000 | % | | $ | 393 | | | $ | (250 | ) | | $ | 143 | | |
Fair valuation summary
The following is a summary of the fair valuations according to the inputs used as of July 31, 2015 in valuing the Portfolio's investments:
Assets | |
| Description | | Unadjusted
quoted prices in
active markets for
identical investments
(Level 1) | | Other significant
observable inputs
(Level 2) | | Unobservable
inputs
(Level 3) | | Total | |
US government obligations | | $ | — | | | $ | 153,547,376 | | | $ | — | | | $ | 153,547,376 | | |
Federal home loan bank certificate | | | — | | | | 753,525 | | | | — | | | | 753,525 | | |
Federal home loan mortgage corporation certificates | | | — | | | | 544,995 | | | | — | | | | 544,995 | | |
Federal national mortgage association certificates | | | — | | | | 3,705,452 | | | | — | | | | 3,705,452 | | |
Collateralized mortgage obligations | | | — | | | | 36,448,205 | | | | 236,631 | | | | 36,684,836 | | |
Asset-backed securities | | | — | | | | 54,919,146 | | | | 2,311,517 | | | | 57,230,663 | | |
Corporate notes | | | — | | | | 160,056,000 | | | | — | | | | 160,056,000 | | |
Non-US government obligations | | | — | | | | 1,529,085 | | | | — | | | | 1,529,085 | | |
Municipal bonds and notes | | | — | | | | 212,352 | | | | — | | | | 212,352 | | |
Preferred stocks | | | 584,152 | | | | — | | | | — | | | | 584,152 | | |
Repurchase agreement | | | — | | | | 5,394,000 | | | | — | | | | 5,394,000 | | |
Options and swaptions purchased | | | 2,088 | | | | 54,969 | | | | — | | | | 57,057 | | |
Investment of cash collateral from securities loaned | | | — | | | | 15,390,673 | | | | — | | | | 15,390,673 | | |
Futures contracts | | | 407,096 | | | | — | | | | — | | | | 407,096 | | |
Forward foreign currency contracts | | | — | | | | 98,868 | | | | — | | | | 98,868 | | |
Swap agreements | | | — | | | | 90,085 | | | | — | | | | 90,085 | | |
Total | | $ | 993,336 | | | $ | 432,744,731 | | | $ | 2,548,148 | | | $ | 436,286,215 | | |
51
PACE Select Advisors Trust
PACE Intermediate Fixed Income Investments
Portfolio of investments—July 31, 2015
Description | | Unadjusted
quoted prices in
active markets for
identical investments
(Level 1) | | Other significant
observable inputs
(Level 2) | | Unobservable
inputs
(Level 3) | | Total | |
Liabilities | |
Investments sold short | | $ | — | | | $ | (3,191,484 | ) | | $ | — | | | $ | (3,191,484 | ) | |
Written options | | | (2,087 | ) | | | — | | | | — | | | | (2,087 | ) | |
Written swaptions and foreign exchange written options | | | — | | | | (597,508 | ) | | | — | | | | (597,508 | ) | |
Futures contracts | | | (319,164 | ) | | | — | | | | — | | | | (319,164 | ) | |
Forward foreign currency contracts | | | — | | | | (41,452 | ) | | | — | | | | (41,452 | ) | |
Swap agreements | | | — | | | | (14,298 | ) | | | — | | | | (14,298 | ) | |
Total | | $ | (321,251 | ) | | $ | (3,844,742 | ) | | $ | — | | | $ | (4,165,993 | ) | |
At July 31, 2015, there were no transfers between Level 1 and Level 2.
The following is a rollforward of the Portfolio's investments that was valued using unobservable inputs (Level 3) for the year ended July 31, 2015:
| | Collateralized
mortgage
obligations | | Asset-backed
securities | | Total | |
Beginning balance | | $ | 691,108 | | | $ | 149,980 | | | $ | 841,088 | | |
Purchases | | | — | | | | 2,369,898 | | | | 2,369,898 | | |
Sales | | | (455,207 | ) | | | (167,147 | ) | | | (622,354 | ) | |
Accrued discounts/(premiums) | | | — | | | | 21 | | | | 21 | | |
Total realized gain/(loss) | | | 2,949 | | | | 4 | | | | 2,953 | | |
Net change in unrealized appreciation/depreciation | | | (2,219 | ) | | | 12,490 | | | | 10,271 | | |
Transfers into Level 3 | | | — | | | | — | | | | — | | |
Transfers out of Level 3 | | | — | | | | (53,729 | ) | | | (53,729 | ) | |
Ending balance | | $ | 236,631 | | | $ | 2,311,517 | | | $ | 2,548,148 | | |
The change in net unrealized appreciation/depreciation relating to the Level 3 investments held at July 31, 2015 was $10,124. At July 31, 2015, a security was transferred from Level 3 to Level 2 as the valuation is based on observable inputs from an established pricing source. The transfer out of Level 3 represents the value at the end of the year.
52
PACE Select Advisors Trust
PACE Intermediate Fixed Income Investments
Portfolio of investments—July 31, 2015
Issuer breakdown by country or territory of origin (unaudited)
| | Percentage of
total investments | |
United States | | | 92.2 | % | |
Cayman Islands | | | 1.6 | | |
United Kingdom | | | 1.0 | | |
Netherlands | | | 0.9 | | |
Canada | | | 0.8 | | |
Argentina | | | 0.7 | | |
Switzerland | | | 0.5 | | |
Australia | | | 0.3 | | |
Austria | | | 0.3 | | |
Brazil | | | 0.2 | | |
France | | | 0.2 | | |
Germany | | | 0.2 | | |
Colombia | | | 0.2 | | |
Guernsey | | | 0.2 | | |
Italy | | | 0.1 | | |
Mexico | | | 0.1 | | |
Norway | | | 0.1 | | |
Sweden | | | 0.1 | | |
Ireland | | | 0.1 | | |
Peru | | | 0.1 | | |
United States Virgin Islands | | | 0.1 | | |
South Africa | | | 0.0 | † | |
Uruguay | | | 0.0 | † | |
Curacao | | | 0.0 | † | |
Total | | | 100.0 | % | |
† Amount represents less than 0.05%
Portfolio footnotes
* On September 7, 2008, the Federal Housing Finance Agency placed the Federal National Mortgage Association and the Federal Home Loan Mortgage Corporation into conservatorship, and the US Treasury guaranteed the debt issued by those organizations.
1 In US Dollars unless otherwise indicated.
2 Security, or portion thereof, pledged as collateral for investments sold short, written options, futures or swaps.
3 Variable or floating rate security. The interest rate shown is the current rate as of July 31, 2015 and changes periodically.
4 Security exempt from registration pursuant to Rule 144A under the Securities Act of 1933. These securities, which represent 19.45% of net assets as of July 31, 2015, are considered liquid and may be resold in transactions exempt from registration, normally to qualified institutional buyers.
5 Security is being fair valued by a valuation committee under the direction of the board of trustees.
6 Interest Only Securities. These securities entitle the holder to receive interest payments from an underlying pool of mortgages. The risk associated with these securities is related to the speed of the principal paydowns. High prepayments would result in a smaller amount of interest being received and cause the yield to decrease. Low prepayments would result in a greater amount of interest being received and cause the yield to increase.
7 Security exempt from registration pursuant to Rule 144A under the Securities Act of 1933. These securities, which represent 0.07% of net assets as of July 31, 2015, are considered illiquid and restricted (see table below for more information).
| Illiquid & restricted securities | | Acquisition
Date | | Acquisition
Cost | | Acquisition Cost
as a percentage
of net assets | | Value at
07/31/15 | | Value as a
percentage of
net assets | |
VFC LLC, Series 2014-2, Class A 2.750%, due 07/20/30 | | 07/09/14 | | $ | 250,000 | | | | 0.06 | % | | $ | 99,421 | | | | 0.03 | % | |
VFC LLC, Series 2015-3, Class A 2.750%, due 12/20/31 | | 03/25/15 | | | 250,000 | | | | 0.06 | | | | 182,228 | | | | 0.04 | | |
| | | | | | | | $ | 281,649 | | | | 0.07 | % | |
8 Security exempt from registration pursuant to Regulation S under the Securities Act of 1933. Regulation S applies to securities offerings that are made outside of the United States and do not involve direct selling efforts in the United States. At July 31, 2015, the value of these securities amounted to 0.01% of net assets.
9 Step bond that converts to the noted fixed rate at a designated future date.
10 Security, or portion thereof, was on loan at July 31, 2015.
11 Perpetual investment. The maturity date reflects the next call date.
53
PACE Select Advisors Trust
PACE Intermediate Fixed Income Investments
Portfolio of investments—July 31, 2015
12 Non cumulative preferred stock. Convertible until 06/07/18.
13 Non cumulative preferred stock. Convertible until 01/15/18.
14 Non cumulative preferred stock. Convertible until 03/01/18.
15 Illiquid investment as of July 31, 2015.
16 The table below details the Portfolio's transaction activity in affiliated issuers for the year ended July 31, 2015. The investment manager earns a management fee from UBS Private Money Market Fund LLC. Please see the Notes to financial statements for further information.
| Security description | | Value at
07/31/14 | | Purchases
during the
year ended
07/31/15 | | Sales
during the
year ended
07/31/15 | | Value at
07/31/15 | | Net income
earned from
affiliate for the
year ended
07/31/15 | |
UBS Private Money Market Fund LLC | | $ | 66,357,164 | | | $ | 727,057,321 | | | $ | 778,023,812 | | | $ | 15,390,673 | | | $ | 2,762 | | |
17 Payments made/received are based on the notional amount.
18 If the Portfolio is a seller of protection and a credit event occurs, as defined under the terms of that particular swap agreement, the Portfolio will either (i) pay to the buyer of protection an amount equal to the notional amount of the swap and take delivery of the referenced obligation or (ii) pay a net settlement amount in the form of cash or securities equal to the notional amount of the swap less the recovery value of the referenced obligation.
19 Payments from/to the counterparty will be received/made upon the occurrence of a failure to pay, obligation acceleration, repudiation or restructuring of the reference obligation.
20 Credit spreads, where applicable, represented in absolute terms, utilized in determining the market value as of period end serve as an indicator of the current status of the payment/performance risk and represent the likelihood or risk of default for the credit derivative. The credit spread of a particular referenced entity reflects the cost of buying/selling protection and may include upfront payments required to be made to enter into the agreement. Wider credit spreads represent a deterioration of the referenced entity's credit soundness and a greater likelihood or risk of default or other credit event occurring as defined under the terms of the agreement. A credit spread identified as "Defaulted" indicates a credit event has occurred for the referenced entity. Credit spreads are unaudited.
See accompanying notes to financial statements.
54
PACE Select Advisors Trust
PACE Strategic Fixed Income Investments
Performance (unaudited)
For the 12 months ended July 31, 2015, the Portfolio's Class P shares gained 2.91% before the deduction of the maximum PACE Select program fee.1 In comparison, the Barclays US Government/Credit Index (the "benchmark") rose 2.55% and the Lipper Core Plus Bond Funds category posted a median return of 2.01%.2 (Returns for all share classes over various time periods are shown in the "Performance at a glance" table on page 58. Please note that the returns shown do not reflect the deduction of taxes that a shareholder would pay on Portfolio distributions or the redemption of Portfolio shares.) For a detailed commentary on the market environment in general during the reporting period, please refer to page 2.
Sub-advisors' comments3
Please note: On January 20, 2015, Neuberger Berman began serving as a sub-advisor for this Portfolio.
PIMCO
Our portion of the Portfolio outperformed its benchmark during the reporting period. An underweight to corporate bonds was positive for results. The sector lagged like-duration Treasuries as it was negatively impacted by the sell-off in oil, concerns over Greece and heavy primary market supply. Our returns were also helped by positive security selection within the high yield corporate bond market, as we focused on securities issued by financial and industrial companies.
Positive security selection within agency mortgage-backed securities ("MBS") and an allocation to non-agency MBS contributed to returns. However, an allocation to US Treasury Inflation-Protected Securities ("TIPS") detracted from performance, as inflation expectations declined during the reporting period. Lastly, we benefited from our long US dollar position against the euro and yen, as the latter two depreciated in value.
An underweight to US duration was negative for performance, as the yield on the 10-year US Treasury fell 38 basis points (0.38%). (Duration measures a portfolio's sensitivity to interest rate changes.) Additionally, short exposure to the long end of the yield curve was negative for performance as long rates fell more than short and intermediate rates. European interest rate
PACE Select Advisors Trust – PACE Strategic Fixed Income Investments
Investment Sub-Advisor:
Pacific Investment Management Company LLC ("PIMCO");
Neuberger Berman Fixed Income LLC ("Neuberger Berman")
Portfolio Managers:
PIMCO: Scott Mather;
Neuberger Berman: Thanos Bardas, David M. Brown, Andrew A. Johnson, Thomas J. Marthaler, Bradley C. Tank
Objective:
Total return consisting of income and capital appreciation
Investment process:
PIMCO The Portfolio invests primarily in investment grade fixed income securities of governmental and private issuers in the United States and foreign countries. Its duration (a measure of a portfolio's sensitivity to interest rate changes) is normally limited to within +/- 50% of the effective duration of the Portfolio's benchmark index. PIMCO seeks to invest in the areas of the bond market it considers undervalued, based on such factors as quality, sector, coupon and maturity. PIMCO decides to buy or sell specific bonds based on an analysis of their values relative to other similar bonds. PIMCO monitors the prepayment experience of the Portfolio's mortgage-backed bonds and will also buy and sell securities to adjust the average portfolio duration, credit quality, yield curve, sector and prepayment exposure, as appropriate.
1 Class P shares held through the PACE Select Advisors Program are subject to a maximum Program fee of 2.50%, which, if included, would have reduced performance. Class P shares held through other advisory programs also may be subject to a program fee, which, if included, would have reduced performance.
2 Barclays US Government Credit Index, as calculated by the investment advisor, which as of July, 31, 2015 had a duration of approximately 6.17 years.
3 All sub-advisors discuss performance on a gross-of-fees basis—meaning that no fees or expenses are reflected in their sleeves'/sleeve's performance. Alternately, Portfolio performance is shown net of fees, which does factor in fees and expenses associated with the Portfolio.
55
PACE Select Advisors Trust
PACE Strategic Fixed Income Investments
Sub-advisor's comments – concluded
strategies were negative for results as well. Tactical interest rate positioning within European core rates was a headwind for returns as yields fell during the first half of the reporting period and rose sharply during the second half. This was partially offset by an allocation to European peripherals, especially Spain and Italy, as yields in these regions moved lower.
Overall, derivative usage was positive during the reporting period, primarily due to income generated from selling interest rate and currency options. Additionally, the use of interest rate swaps to adjust interest rate and yield curve exposures, as well as to substitute for physical securities, was positive for performance as swap spreads tightened. Credit default swaps were utilized to manage credit exposure in lieu of the direct buying or selling of securities. Options and options on swaps were primarily used to manage interest rate and volatility exposures, but they were also used to generate income in expected interest rate scenarios. Currency options and forwards were used to gain exposure to foreign currency markets. Finally, government futures were utilized to adjust interest rate exposures and replicate government bond positions.
Neuberger Berman
We managed a portion of the Portfolio from January 20, 2015 to July 31, 2015. The reporting period began by actively transitioning the assets received in-kind, with an emphasis on diversified exposure to the spread sectors (non-US Treasury fixed income securities) versus US Treasury securities. During the reporting period as a whole, our portion of the Portfolio outperformed the benchmark. This was largely driven by our defensive duration positioning. In particular, having a duration that was shorter than the benchmark was rewarded as interest rates moved higher across the curve. This positive was modestly offset by our yield curve positioning.
Other contributors to performance included security selection of investment grade corporate bonds, an overweight to non-agency MBS, agency MBS, high yield corporate bonds and emerging markets debt. An overweight to TIPS was also slightly positive for performance. In contrast, an overweight to investment grade corporate bonds detracted from results. Transaction costs, mostly associated with the ramp up of our portion of the Portfolio, were also a drag on performance.
During the reporting period, currency forwards and futures, as well as Treasury futures, were used to manage interest rate risk and shorten our overall portfolio duration relative to the benchmark. The use of these instruments was beneficial for performance.
Investment process (concluded)
Neuberger Berman employs a consistently applied, risk-managed approach to portfolio management that leverages its proprietary fundamental research capabilities, decision-making frameworks, and quantitative risk management tools. Neuberger Berman establishes the investment profile for its portion of the Portfolio's assets, which it monitors on an ongoing basis, including exposures to sectors and duration/yield curve positioning, utilizing internally generated data that are produced by specialty sector investment teams in conjunction with asset allocation tools. Once the investment profile is established, Neuberger Berman determines industry/sub-sector weightings and makes securities selections.
Special considerations
The Portfolio may be appropriate for long-term investors seeking total return consisting of income and capital appreciation and who are able to withstand short-term fluctuations in the fixed income markets in return for potentially higher returns over the long term. The value of the Portfolio changes every day and can be affected by changes in interest rates, general market conditions, and other political, social and economic developments, as well as specific matters relating to the companies in whose securities the Portfolio invests. In addition, investments in foreign bonds involve special risks. It is important to note that an investment in the Portfolio is only one component of a balanced investment plan.
56
PACE Select Advisors Trust
PACE Strategic Fixed Income Investments
Illustration of an assumed investment of $10,000 in Class P shares of the Portfolio (unaudited)
The following graph depicts the performance of PACE Strategic Fixed Income Investments Class P shares versus the Barclays US Government/Credit Index over the 10 years ended July 31, 2015. Class P shares held through advisory programs may be subject to a program fee, which, if included, would have reduced performance. The performance of the other classes will vary based upon the different class specific expenses and sales charges. The performance provided does not reflect the deduction of taxes that a shareholder would pay on Portfolio distributions or the redemption of Portfolio shares. Past performance is no guarantee of future results. Share price and returns will vary with market conditions; investors may realize a gain or loss upon redemption. It is important to note that PACE Strategic Fixed Income Investments is a professionally managed portfolio while the Index is not available for investment and is unmanaged. The comparison is shown for illustration purposes only.
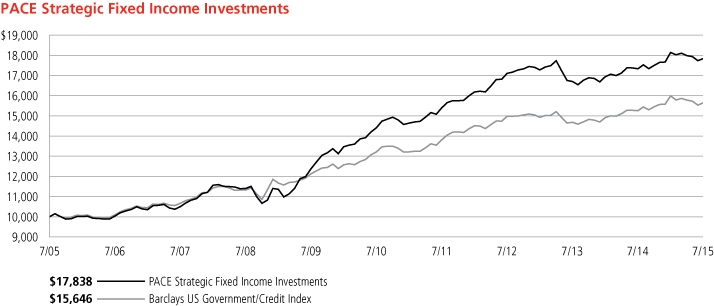
57
PACE Select Advisors Trust
PACE Strategic Fixed Income Investments
Performance at a glance (unaudited)
Average annual total returns for periods ended 07/31/15 | | 1 year | | 5 years | | 10 years | |
Before deducting maximum sales charge | |
Class A1 | | | 2.69 | % | | | 4.11 | % | | | 5.70 | % | |
Class C2 | | | 2.16 | | | | 3.62 | | | | 5.19 | | |
Class Y3 | | | 2.81 | | | | 4.33 | | | | 5.99 | | |
Class P4 | | | 2.91 | | | | 4.36 | | | | 5.96 | | |
After deducting maximum sales charge | |
Class A1 | | | (1.89 | ) | | | 3.15 | | | | 5.21 | | |
Class C2 | | | 1.41 | | | | 3.62 | | | | 5.19 | | |
Barclays US Government/Credit Index5 | | | 2.55 | | | | 3.43 | | | | 4.58 | | |
Lipper Core Plus Bond Funds median | | | 2.01 | | | | 4.07 | | | | 5.07 | | |
Most recent calendar quarter-end returns (unaudited)
Average annual total returns for periods ended 06/30/15 | | 1 year | | 5 years | | 10 years | |
Before deducting maximum sales charge | |
Class A1 | | | 1.85 | % | | | 4.29 | % | | | 5.51 | % | |
Class C2 | | | 1.33 | | | | 3.80 | | | | 5.00 | | |
Class Y3 | | | 1.99 | | | | 4.52 | | | | 5.80 | | |
Class P4 | | | 2.07 | | | | 4.55 | | | | 5.76 | | |
After deducting maximum sales charge | |
Class A1 | | | (2.75 | ) | | | 3.33 | | | | 5.03 | | |
Class C2 | | | 0.59 | | | | 3.80 | | | | 5.00 | | |
The annualized gross and net expense ratios, respectively, for each class of shares as in the November 28, 2014 prospectuses, were as follows: Class A—1.06% and 1.06%; Class C—1.53% and 1.53%; Class Y—0.93% and 0.81%; and Class P—0.80% and 0.80%. Net expenses reflect fee waivers and/or expense reimbursements, if any, pursuant to an agreement that is in effect to cap the expenses. The Portfolio and UBS Global Asset Management (Americas) Inc. ("UBS Global AM") have entered into a written fee waiver/expense reimbursement agreement pursuant to which UBS Global AM is contractually obligated to waive its management fees and/or reimburse expenses so that the Portfolio's ordinary total operating expenses of each class through November 30, 2015 (excluding dividend expense, borrowing costs, and interest expense relating to short sales, and expenses attributable to investment in other investment companies, interest, taxes, brokerage commissions and extraordinary expenses) would not exceed Class A—1.06%; Class C—1.56%; Class Y—0.81%; and Class P—0.81%. The Portfolio has agreed to repay UBS Global AM for any waived fees/reimbursed expenses to the extent that it can do so over the following three fiscal years without causing the Portfolio's expenses in any of those three years to exceed these expense caps. The fee waiver/expense reimbursement agreement may be terminated by the Portfolio's board at any time and also will terminate automatically upon the expiration or termination of the Portfolio's advisory contract with UBS Global AM. Upon termination of the agreement, however, UBS Global AM's three year recoupment rights will survive.
1 Maximum sales charge for Class A shares is 4.5%. Class A shares bear ongoing 12b-1 service fees.
2 Maximum contingent deferred sales charge for Class C shares is 0.75% imposed on redemptions and is reduced to 0% after one year. Class C shares bear ongoing 12b-1 service and distribution fees.
3 The Portfolio offers Class Y shares to a limited group of eligible investors, including certain qualifying retirement plans. Class Y shares do not bear initial or contingent deferred sales charges or ongoing 12b-1 service and distribution fees.
4 Class P shares do not bear initial or contingent deferred sales charges or ongoing 12b-1 service and distribution fees, but Class P shares held through advisory programs may be subject to a program fee, which, if included, would have reduced performance.
5 The Barclays US Government/Credit Index is an unmanaged index which is composed of all investment-grade bonds that have at least one year to maturity. The Index's total return comprises price appreciation/depreciation and income as a percentage of the original investment. The Index is rebalanced monthly by market capitalization. Investors should note that indices do not reflect the deduction of fees and expenses.
Prior to February 17, 2015, if an investor sold or exchanged shares less than 90 days after purchase, a redemption fee of 1.00% of the amount sold or exchanged was deducted at the time of the transaction, except as noted otherwise in the prospectus. For sales or exchanges taking place on or after February 17, 2015 but prior to August 3, 2015, there is a reduction in the redemption holding period from 90 days to 30 days. Effective August 3, 2015, the 1.00% redemption fee imposed on sales or exchanges of any class of shares of the portfolios made during the holding periods specified in the prospectus was eliminated. Please refer to the prospectus for further information.
Past performance does not predict future performance, and the performance information provided does not reflect the deduction of taxes that a shareholder would pay on Portfolio distributions or the redemption of Portfolio shares. The return and principal value of an investment will fluctuate, so that an investor's shares, when redeemed, may be worth more or less than their original cost. Performance results assume reinvestment of all dividends and capital gain distributions at net asset value on the ex-dividend dates. Current performance may be higher or lower than the performance data quoted. For month-end performance figures, please visit http://globalam-us.ubs.com/corpweb/performance.do.
Lipper peer group data calculated by Lipper Inc.; used with permission. The Lipper median is the return of the fund that places in the middle of a Lipper peer group.
58
PACE Select Advisors Trust
PACE Strategic Fixed Income Investments
Portfolio statistics (unaudited)
Characteristics | | 07/31/15 | |
Weighted average duration | | | 4.90 yrs. | | |
Weighted average maturity | | | 7.20 yrs. | | |
Average coupon | | | 3.40 | % | |
Net assets (mm) | | $ | 921.4 | | |
Number of holdings | | | 718 | | |
Portfolio composition1 | | 07/31/15 | |
Bonds, notes and loan assignments | | | 104.0 | % | |
Preferred stock | | | 0.8 | | |
Investment companies | | | 0.8 | | |
Options, futures, swaps and forward foreign currency contracts | | | (0.4 | ) | |
Cash equivalents and other assets less liabilities | | | (5.2 | ) | |
Total | | | 100.0 | % | |
Quality diversification1,2 | | 07/31/15 | |
US government and agency securities | | | 33.6 | % | |
AAA | | | 3.9 | | |
AA | | | 4.3 | | |
A | | | 16.1 | | |
BBB | | | 20.7 | | |
BB | | | 6.3 | | |
B | | | 4.4 | | |
Below B/non-rated | | | 14.7 | | |
Preferred stock | | | 0.8 | | |
Investment companies | | | 0.8 | | |
Options, futures, swaps and forward foreign currency contracts | | | (0.4 | ) | |
Cash equivalents and other assets less liabilities | | | (5.2 | ) | |
Total | | | 100.0 | % | |
Asset allocation1 | | 07/31/15 | |
Corporate notes | | | 38.5 | % | |
US government obligations | | | 31.4 | | |
Collateralized mortgage obligations | | | 14.8 | | |
Asset-backed securities | | | 8.0 | | |
Non-US government obligations | | | 7.2 | | |
US government agency mortgage pass-through certificates | | | 2.3 | | |
Municipal bonds and notes | | | 1.3 | | |
Preferred stock | | | 0.8 | | |
Investment companies | | | 0.8 | | |
Loan assignments | | | 0.5 | | |
Options, futures, swaps and forward foreign currency contracts | | | (0.4 | ) | |
Cash equivalents and other assets less liabilities | | | (5.2 | ) | |
Total | | | 100 | % | |
1 Weightings represent percentages of the Portfolio's net assets as of July 31, 2015. The Portfolio is actively managed and its composition will vary over time.
2 Credit quality ratings shown are based on the ratings assigned to portfolio holdings by Standard & Poor's Ratings Group, an independent rating agency.
59
PACE Select Advisors Trust
PACE Strategic Fixed Income Investments
Portfolio of investments—July 31, 2015
| | | Face
amount1 | | Value | |
US government obligations—31.37% | |
Residual Funding Corp.
Principal Strip
0.000%, due 04/15/302 | | | 1,300,000 | | | $ | 829,088 | | |
US Treasury Bonds
2.500%, due 02/15/45 | | | 55,700,000 | | | | 50,782,748 | | |
2.750%, due 08/15/42 | | | 1,000,000 | | | | 965,469 | | |
2.750%, due 11/15/42 | | | 5,800,000 | | | | 5,592,923 | | |
3.000%, due 05/15/42 | | | 5,200,000 | | | | 5,278,000 | | |
3.000%, due 11/15/44 | | | 15,100,000 | | | | 15,284,039 | | |
3.125%, due 02/15/42 | | | 3,300,000 | | | | 3,437,930 | | |
3.125%, due 08/15/44 | | | 16,900,000 | | | | 17,524,506 | | |
4.500%, due 02/15/36 | | | 455,000 | | | | 589,047 | | |
6.250%, due 08/15/23 | | | 145,000 | | | | 190,392 | | |
US Treasury Inflation Index
Bonds (TIPS)
0.750%, due 02/15/42 | | | 105,225 | | | | 97,785 | | |
0.750%, due 02/15/45 | | | 1,514,550 | | | | 1,400,604 | | |
1.375%, due 02/15/44 | | | 1,428,280 | | | | 1,540,757 | | |
1.750%, due 01/15/28 | | | 20,315,426 | | | | 23,067,536 | | |
2.000%, due 01/15/26 | | | 7,666,880 | | | | 8,783,369 | | |
2.375%, due 01/15/25 | | | 1,261,380 | | | | 1,477,687 | | |
2.375%, due 01/15/27 | | | 5,187,688 | | | | 6,209,014 | | |
2.500%, due 01/15/29 | | | 15,836,392 | | | | 19,560,415 | | |
3.875%, due 04/15/29 | | | 860,560 | | | | 1,220,516 | | |
US Treasury Inflation Index
Notes (TIPS)
0.125%, due 07/15/223 | | | 5,790,297 | | | | 5,720,183 | | |
0.125%, due 07/15/24 | | | 45,060,750 | | | | 43,761,739 | | |
0.250%, due 01/15/253 | | | 1,164,466 | | | | 1,137,902 | | |
0.375%, due 07/15/25 | | | 5,313,886 | | | | 5,260,747 | | |
US Treasury Notes
2.000%, due 02/28/21 | | | 18,100,000 | | | | 18,367,265 | | |
2.125%, due 09/30/21 | | | 27,500,000 | | | | 27,979,105 | | |
2.125%, due 12/31/21 | | | 50,000 | | | | 50,781 | | |
2.125%, due 05/15/25 | | | 3,100,000 | | | | 3,078,688 | | |
2.250%, due 04/30/21 | | | 17,400,000 | | | | 17,874,428 | | |
2.500%, due 05/15/24 | | | 800,000 | | | | 822,187 | | |
2.750%, due 02/15/24 | | | 550,000 | | | | 576,813 | | |
3.625%, due 08/15/19 | | | 545,000 | | | | 594,007 | | |
Total US government obligations
(cost—$298,427,041) | | | | | 289,055,670 | | |
Government national mortgage association
certificates—0.00%†† | |
GNMA II ARM
1.625%, due 11/20/234 | | | 3,651 | | | | 3,788 | | |
1.625%, due 07/20/254 | | | 4,848 | | | | 5,051 | | |
1.625%, due 05/20/264 | | | 15,848 | | | | 16,503 | | |
1.750%, due 01/20/264 | | | 8,607 | | | | 8,941 | | |
Total government national mortgage
association certificates
(cost—$33,288) | | | | | 34,283 | | |
| | | Face
amount1 | | Value | |
Federal home loan bank certificate—0.07% | |
FHLB
5.500%, due 07/15/36
(cost—$700,020) | | | 500,000 | | | $ | 658,246 | | |
Federal home loan mortgage corporation
certificates*—0.34% | |
FHLMC
7.645%, due 05/01/255 | | | 1,072,558 | | | | 1,145,044 | | |
FHLMC ARM
5.516%, due 03/01/364 | | | 52,012 | | | | 54,219 | | |
FHLMC TBA
4.000% | | | 1,800,000 | | | | 1,911,094 | | |
Total federal home loan mortgage
corporation certificates
(cost—$3,031,354) | | | | | 3,110,357 | | |
Federal housing administration certificates—0.00%†† | |
FHA GMAC
7.430%, due 06/01/21 | | | 12,928 | | | | 12,928 | | |
FHA Reilly
7.430%, due 10/01/20 | | | 3,008 | | | | 3,008 | | |
Total federal housing
administration certificates
(cost—$16,661) | | | | | 15,936 | | |
Federal national mortgage association certificates*—1.88% | |
FNMA
3.500%, due 11/01/21 | | | 1,125,187 | | | | 1,202,784 | | |
3.500%, due 12/01/25 | | | 76,093 | | | | 80,476 | | |
4.500%, due 04/01/29 | | | 395,983 | | | | 429,085 | | |
5.401%, due 11/01/34 | | | 8,368,040 | | | | 9,740,125 | | |
FNMA ARM
1.556%, due 08/01/404 | | | 47,755 | | | | 49,521 | | |
2.366%, due 05/01/304 | | | 43,282 | | | | 45,156 | | |
2.393%, due 10/01/354 | | | 72,748 | | | | 77,855 | | |
2.434%, due 04/01/274 | | | 13,529 | | | | 14,181 | | |
2.434%, due 09/01/354 | | | 62,340 | | | | 66,123 | | |
2.501%, due 05/01/274 | | | 10,517 | | | | 10,809 | | |
2.504%, due 01/01/364 | | | 69,116 | | | | 73,497 | | |
2.505%, due 03/01/364 | | | 39,228 | | | | 41,743 | | |
5.342%, due 01/01/364 | | | 104,193 | | | | 110,430 | | |
5.369%, due 11/01/354 | | | 103,955 | | | | 110,522 | | |
5.511%, due 12/01/354 | | | 96,000 | | | | 102,174 | | |
5.514%, due 03/01/364 | | | 71,262 | | | | 75,479 | | |
5.689%, due 06/01/364 | | | 17,312 | | | | 17,655 | | |
5.758%, due 02/01/364 | | | 87,913 | | | | 94,108 | | |
5.774%, due 03/01/364 | | | 57,981 | | | | 61,982 | | |
5.782%, due 03/01/364 | | | 81,185 | | | | 86,188 | | |
FNMA ARM COFI
3.250%, due 11/01/265 | | | 28,097 | | | | 24,519 | | |
FNMA TBA
3.500% | | | 1,000,000 | | | | 1,053,086 | | |
| 4.000% | | | 3,550,000 | | | | 3,776,590 | | |
Total federal national mortgage
association certificates
(cost—$15,898,367) | | | | | 17,344,088 | | |
60
PACE Select Advisors Trust
PACE Strategic Fixed Income Investments
Portfolio of investments—July 31, 2015
| | | Face
amount1 | | Value | |
Collateralized mortgage obligations—14.84% | |
Alba PLC, Series 2007-1, Class A3
0.743%, due 03/17/394,6 | | GBP | 700,000 | | | $ | 994,555 | | |
ARM Trust, Series 2005-5, Class 2A1
2.733%, due 09/25/354 | | | 274,650 | | | | 240,310 | | |
Banc of America Commercial
Mortgage Trust, Series 2007-2,
Class A1A
5.562%, due 04/10/494 | | | 399,167 | | | | 420,535 | | |
Banc of America Funding Corp.,
Series 2005-D, Class A1
2.695%, due 05/25/354 | | | 1,368,270 | | | | 1,391,904 | | |
Banc of America Large Loan,
Series 2010-UB5, Class A4A
5.650%, due 02/17/514,7 | | | 1,767,003 | | | | 1,828,743 | | |
Banc of America Merrill Lynch
Large Loan, Series 2012-PARK,
Class A
2.959%, due 12/10/307 | | | 1,000,000 | | | | 1,000,432 | | |
Bank of America Mortgage
Securities, Inc.,
Series 2002-G, Class 1A3
3.548%, due 07/20/324 | | | 3,418 | | | | 3,466 | | |
Series 2004-H, Class 2A2
2.655%, due 09/25/344 | | | 1,396,429 | | | | 1,371,453 | | |
BBCMS Trust, Series 2015-RRI,
Class A
1.336%, due 05/15/324,7 | | | 3,700,000 | | | | 3,681,930 | | |
BCAP LLC 2011-RR10 Trust,
Class 3A5
2.648%, due 06/26/354,7 | | | 1,148,128 | | | | 1,149,912 | | |
Bear Stearns Alternative Loan
Trust-A Trust,
Series 2003-3, Class 1A
2.088%, due 10/25/334 | | | 33,562 | | | | 30,918 | | |
Series 2004-9, Class 2A1
2.530%, due 09/25/344 | | | 720,228 | | | | 674,824 | | |
Series 2005-7, Class 22A1
2.694%, due 09/25/354 | | | 1,108,422 | | | | 942,745 | | |
Series 2006-1, Class 21A2
2.561%, due 02/25/364 | | | 1,059,090 | | | | 836,388 | | |
Bear Stearns ARM Trust,
Series 2003-1, Class 6A1
2.511%, due 04/25/334 | | | 50,585 | | | | 50,922 | | |
Series 2003-5, Class 2A1
2.593%, due 08/25/334 | | | 292,510 | | | | 291,838 | | |
Series 2004-3, Class 1A2
2.912%, due 07/25/344 | | | 233,587 | | | | 227,381 | | |
Series 2004-6, Class 2A1
2.805%, due 09/25/344 | | | 1,237,741 | | | | 1,188,895 | | |
Series 2004-7, Class 1A1
2.800%, due 10/25/344 | | | 347,291 | | | | 315,691 | | |
Series 2005-2, Class A1
2.680%, due 03/25/354 | | | 861,102 | | | | 868,449 | | |
Series 2005-5, Class A2
2.260%, due 08/25/354 | | | 1,543,670 | | | | 1,550,375 | | |
| | | Face
amount1 | | Value | |
Collateralized mortgage obligations—(continued) | |
Chase Mortgage Finance Corp.,
Series 2005-S3, Class A10
5.500%, due 11/25/35 | | | 2,527,000 | | | $ | 2,485,567 | | |
Series 2007-S6, Class 2A1
5.500%, due 12/25/22 | | | 1,068,736 | | | | 945,319 | | |
Citigroup Commercial
Mortgage Trust,
Series 2013-GC15, Class XA
1.260%, due 09/10/464,7,8 | | | 4,402,575 | | | | 264,441 | | |
Series 2013-GC17, Class XA
1.450%, due 02/10/484,7,8 | | | 3,673,910 | | | | 373,258 | | |
Series 2013-GC17, Class XA
1.517%, due 11/10/464,7,8 | | | 12,766,015 | | | | 890,761 | | |
Series 2015-GC29, Class XA
1.177%, due 04/10/484,7,8 | | | 3,336,937 | | | | 267,516 | | |
Citigroup Mortgage Loan
Trust, Inc.,
Series 2005-11, Class A1A
2.660%, due 05/25/354 | | | 545,136 | | | | 538,504 | | |
Series 2005-4, Class A
3.866%, due 08/25/354 | | | 1,273,709 | | | | 1,255,437 | | |
Series 2005-6, Class A2
2.410%, due 09/25/354 | | | 104,461 | | | | 104,856 | | |
Series 2005-6, Class A3
2.060%, due 09/25/354 | | | 20,764 | | | | 20,136 | | |
COMM Mortgage Trust,
Series 2014-LC15, Class XA
1.405%, due 04/10/474,7,8 | | | 12,807,363 | | | | 981,710 | | |
Countrywide Alternative
Loan Trust,
Series 2003-J3, Class 2A1
6.250%, due 12/25/33 | | | 119,301 | | | | 124,042 | | |
Series 2005-62, Class 2A1
1.170%, due 12/25/354 | | | 429,283 | | | | 354,432 | | |
Series 2006-41CB, Class 1A9
6.000%, due 01/25/37 | | | 831,520 | | | | 722,193 | | |
Countrywide Home Loan
Mortgage Pass Through Trust,
Series 2003-R4, Class 2A
5.603%, due 01/25/344,7 | | | 878,070 | | | | 879,612 | | |
Series 2004-12, Class 11A1
2.766%, due 08/25/344 | | | 385,900 | | | | 337,187 | | |
Series 2004-12, Class 11A2
2.766%, due 08/25/344 | | | 251,672 | | | | 229,295 | | |
Series 2004-12, Class 12A1
2.675%, due 08/25/344 | | | 84,305 | | | | 73,250 | | |
Series 2005-HYB9, Class 5A1
2.330%, due 02/20/364 | | | 348,126 | | | | 299,699 | | |
Credit Suisse Commercial
Mortgage Trust,
Series 2006-C2, Class A1A
5.671%, due 03/15/394 | | | 4,202,861 | | | | 4,280,875 | | |
Series 2007-C5, Class A4
5.695%, due 09/15/404 | | | 445,000 | | | | 471,288 | | |
61
PACE Select Advisors Trust
PACE Strategic Fixed Income Investments
Portfolio of investments—July 31, 2015
| | | Face
amount1 | | Value | |
Collateralized mortgage obligations—(continued) | |
DBRR 2013-EZ2 Trust,
Series 2013-EZ2, Class A
0.853%, due 02/25/454,7 | | | 74,670 | | | $ | 74,643 | | |
FHLMC REMIC,*
Series 0023, Class KZ
6.500%, due 11/25/23 | | | 68,802 | | | | 77,339 | | |
Series 1278, Class K
7.000%, due 05/15/22 | | | 29,115 | | | | 31,637 | | |
Series 1367, Class KA
6.500%, due 09/15/22 | | | 779 | | | | 871 | | |
Series 1502, Class PX
7.000%, due 04/15/23 | | | 238,070 | | | | 262,521 | | |
Series 1503, Class PZ
7.000%, due 05/15/23 | | | 70,004 | | | | 78,901 | | |
Series 1534, Class Z
5.000%, due 06/15/23 | | | 75,925 | | | | 81,576 | | |
Series 1548, Class Z
7.000%, due 07/15/23 | | | 52,562 | | | | 58,968 | | |
Series 1562, Class Z
7.000%, due 07/15/23 | | | 88,722 | | | | 99,495 | | |
Series 1694, Class Z
6.500%, due 03/15/24 | | | 40,338 | | | | 45,012 | | |
Series 2061, Class Z
6.500%, due 06/15/28 | | | 139,361 | | | | 159,418 | | |
Series 2400, Class FQ
0.687%, due 01/15/324 | | | 88,862 | | | | 90,058 | | |
Series 2764, Class LZ
4.500%, due 03/15/34 | | | 1,333,545 | | | | 1,445,004 | | |
Series 2764, Class ZG
5.500%, due 03/15/34 | | | 3,115,464 | | | | 3,508,704 | | |
Series 2835, Class JZ
5.000%, due 08/15/34 | | | 705,094 | | | | 781,162 | | |
Series 2921, Class PG
5.000%, due 01/15/35 | | | 5,111,332 | | | | 5,486,999 | | |
Series 2983, Class TZ
6.000%, due 05/15/35 | | | 3,086,290 | | | | 3,466,613 | | |
Series 3149, Class CZ
6.000%, due 05/15/36 | | | 3,576,659 | | | | 4,062,784 | | |
Series T-054, Class 2A
6.500%, due 02/25/43 | | | 657,421 | | | | 775,904 | | |
Series T-058, Class 2A
6.500%, due 09/25/43 | | | 2,346,813 | | | | 2,689,776 | | |
Series T-075, Class A1
0.231%, due 12/25/364 | | | 960,591 | | | | 955,070 | | |
First Horizon Mortgage
Pass-Through Trust,
Series 2005-AR3, Class 2A1
2.724%, due 08/25/354 | | | 68,992 | | | | 62,359 | | |
FNMA REMIC,*
Series 1991-065, Class Z
6.500%, due 06/25/21 | | | 2,326 | | | | 2,474 | | |
Series 1992-129, Class L
6.000%, due 07/25/22 | | | 3,939 | | | | 4,262 | | |
Series 1993-060, Class Z
7.000%, due 05/25/23 | | | 58,947 | | | | 64,923 | | |
| | | Face
amount1 | | Value | |
Collateralized mortgage obligations—(continued) | |
Series 1993-070, Class Z
6.900%, due 05/25/23 | | | 9,971 | | | $ | 11,215 | | |
Series 1993-096, Class PZ
7.000%, due 06/25/23 | | | 55,235 | | | | 60,914 | | |
Series 1993-160, Class ZB
6.500%, due 09/25/23 | | | 19,706 | | | | 21,583 | | |
Series 1993-163, Class ZB
7.000%, due 09/25/23 | | | 5,399 | | | | 6,061 | | |
Series 1998-066, Class FG
0.491%, due 12/25/284 | | | 40,702 | | | | 40,925 | | |
Series 1999-W4, Class A9
6.250%, due 02/25/29 | | | 344,399 | | | | 382,013 | | |
Series 2000-034, Class F
0.641%, due 10/25/303 | | | 7,459 | | | | 7,559 | | |
Series 2002-080, Class A1
6.500%, due 11/25/42 | | | 1,056,155 | | | | 1,210,919 | | |
Series 2003-064, Class AH
6.000%, due 07/25/33 | | | 2,902,393 | | | | 3,324,729 | | |
Series 2003-W8, Class 2A
7.000%, due 10/25/42 | | | 56,373 | | | | 65,489 | | |
Series 2004-T1, Class 1A1
6.000%, due 01/25/44 | | | 855,139 | | | | 969,977 | | |
Series 2004-W8, Class 2A
6.500%, due 06/25/44 | | | 996,698 | | | | 1,141,404 | | |
Series 2005-024, Class ZE
5.000%, due 04/25/35 | | | 1,400,838 | | | | 1,553,571 | | |
Series 2005-120, Class ZU
5.500%, due 01/25/36 | | | 3,737,211 | | | | 4,227,656 | | |
Series 2006-065, Class GD
6.000%, due 07/25/26 | | | 1,504,150 | | | | 1,693,238 | | |
Trust 1993-037, Class PX
7.000%, due 03/25/23 | | | 11,447 | | | | 12,748 | | |
Trust G92-040, Class ZC
7.000%, due 07/25/22 | | | 8,565 | | | | 9,406 | | |
GNMA REMIC,
Trust Series 2000-009, Class FG
0.787%, due 02/16/304 | | | 62,593 | | | | 63,073 | | |
Trust Series 2002-031, Class FW
0.587%, due 06/16/314 | | | 68,302 | | | | 68,644 | | |
Trust Series 2003-98, Class Z
6.000%, due 11/20/34 | | | 8,439,661 | | | | 9,706,336 | | |
Trust Series 2005-26, Class ZA
5.500%, due 01/20/35 | | | 8,462,552 | | | | 10,000,511 | | |
GS Residential Mortgage Loan Trust,
Series 2005-AR6, Class 2A1
2.687%, due 09/25/354 | | | 903,051 | | | | 904,481 | | |
Harborview Mortgage Loan Trust,
Series 2004-11, Class 3A1A
0.888%, due 01/19/354 | | | 89,614 | | | | 62,905 | | |
Series 2005-4, Class 3A1
2.671%, due 07/19/354 | | | 465,575 | | | | 415,066 | | |
Housing Security, Inc.,
Series 1992-8, Class B
2.229%, due 06/25/244 | | | 29,564 | | | | 29,679 | | |
62
PACE Select Advisors Trust
PACE Strategic Fixed Income Investments
Portfolio of investments—July 31, 2015
| | | Face
amount1 | | Value | |
Collateralized mortgage obligations—(continued) | |
JP Morgan Alternative Loan Trust,
Series 2007-A2, Class 12A3
0.381%, due 06/25/37 | | | 456,766 | | | $ | 424,834 | | |
JP Morgan Chase Commercial
Mortgage Securities Trust,
Series 2006-LDP8, Class A1A
5.397%, due 05/15/45 | | | 1,742,547 | | | | 1,799,342 | | |
Series 2006-LDP9, Class A1A
5.257%, due 05/15/47 | | | 1,859,140 | | | | 1,916,896 | | |
JP Morgan Mortgage Trust,
2005-A8, Series Class 1A1
5.003%, due 11/25/354 | | | 1,795,023 | | | | 1,700,669 | | |
JP Morgan Mortgage Trust,
2006-A4, Series 2006-A4,
Class 2A2
2.378%, due 06/25/364 | | | 717,952 | | | | 652,651 | | |
Lehman Brothers Mortgage Trust,
Series 1991-2, Class A3
8.593%, due 01/20/174 | | | 18,765 | | | | 18,837 | | |
Ludgate Funding PLC,
Series 2007-1, Class A2A
0.737%, due 01/01/614,6 | | GBP | 2,373,548 | | | | 3,344,139 | | |
Series 2008-W1X, Class A1
1.177%, due 01/01/614,6 | | GBP | 1,093,888 | | | | 1,604,823 | | |
Mansard Mortgages Parent Ltd,
Series 2007-1X, Class A2
0.764%, due 04/15/474,6 | | GBP | 1,562,887 | | | | 2,213,217 | | |
NAAC Reperforming Loan REMIC
Trust, Series 2004-R3, Class A1
6.500%, due 02/25/357 | | | 1,077,280 | | | | 1,101,345 | | |
Residential Accredit Loans, Inc.,
Series 2006-Q03, Class A1
0.401%, due 04/25/464 | | | 1,425,686 | | | | 738,538 | | |
Residential Asset Securitization Trust,
Series 2006-A14C, Class 2A6
0.641%, due 12/25/364 | | | 1,250,888 | | | | 365,199 | | |
Residential Funding Mortgage
Security I, Series 2004-S9,
Class 1A23
5.500%, due 12/25/34 | | | 1,515,179 | | | | 1,522,624 | | |
Sequoia Mortgage Trust,
Series 2007-3, Class 1A1
0.388%, due 07/20/364 | | | 365,485 | | | | 340,072 | | |
Structured ARM Loan Trust,
Series 2004-8, Class 3A
2.508%, due 07/25/344 | | | 770,520 | | | | 769,752 | | |
Structured Asset Mortgage
Investments, Inc.,
Series 2002-AR3, Class A1
0.848%, due 09/19/324 | | | 193,214 | | | | 188,292 | | |
Series 2006-AR3, Class 11A1
0.401%, due 04/25/364 | | | 2,573,763 | | | | 1,846,431 | | |
United States Small Business
Administration,
Series 1999-20K, Class 1
7.060%, due 11/01/19 | | | 69,654 | | | | 75,178 | | |
| | | Face
amount1 | | Value | |
Collateralized mortgage obligations—(concluded) | |
Series 2000-20K, Class 1
7.220%, due 11/01/20 | | | 109,469 | | | $ | 118,139 | | |
Series 2002-20K, Class 1
5.080%, due 11/01/22 | | | 617,469 | | | | 662,461 | | |
Series 2005-20H, Class 1
5.110%, due 08/01/25 | | | 751,536 | | | | 811,475 | | |
Series 2007-20D, Class 1
5.320%, due 04/01/27 | | | 2,432,396 | | | | 2,677,836 | | |
Wachovia Bank Commercial
Mortgage Trust,
Series 2006-C27, Class A1A
5.749%, due 07/15/454 | | | 6,394,227 | | | | 6,596,080 | | |
Series 2007-C32, Class A3,
5.715%, due 06/15/494 | | | 359,000 | | | | 378,521 | | |
WaMu Mortgage Pass Through
Certificates,
Series 2002-AR6, Class A
1.570%, due 06/25/424 | | | 37,014 | | | | 35,680 | | |
Series 2005-AR13, Class A1A1
0.481%, due 10/25/454 | | | 1,151,678 | | | | 1,082,655 | | |
Series 2005-AR15, Class A1A1
0.451%, due 11/25/454 | | | 133,450 | | | | 124,864 | | |
Series 2006-AR2, Class 2A1
3.847%, due 03/25/364 | | | 1,092,749 | | | | 983,271 | | |
Series 2006-AR7, Class 3A
2.180%, due 07/25/464 | | | 1,821,750 | | | | 1,634,727 | | |
Series 2006-AR9, Class 1A
1.170%, due 08/25/464 | | | 1,285,287 | | | | 1,072,191 | | |
Series 2006-AR9, Class 2A
2.180%, due 08/25/464 | | | 972,605 | | | | 869,680 | | |
Wells Fargo Mortgage Backed
Securities Trust,
Series 2003-M, Class A1
2.615%, due 12/25/334 | | | 237,451 | | | | 237,695 | | |
Series 2004-CC, Class A1
2.616%, due 01/25/354 | | | 143,738 | | | | 145,134 | | |
Series 2004-DD, Class 2A6
2.618%, due 01/25/354 | | | 1,746,772 | | | | 1,739,100 | | |
Series 2006-AR2, Class 2A1
2.625%, due 03/25/364 | | | 1,273,293 | | | | 1,266,912 | | |
WFRBS Commercial Mortgage
Trust, Series 2014-LC14,
Class XA
1.445%, due 03/15/474,7,8 | | | 4,623,493 | | | | 363,453 | | |
Total collateralized mortgage
obligations
(cost—$130,928,798) | | | | | 136,740,332 | | |
Asset-backed securities—7.96% | |
Accredited Mortgage Loan Trust,
Series 2005-3, Class M3
0.670%, due 09/25/354 | | | 1,825,000 | | | | 1,442,759 | | |
Aegis Asset Backed Securities Trust,
Series 2005-3, Class M2
0.671%, due 08/25/354 | | | 1,640,000 | | | | 1,424,926 | | |
63
PACE Select Advisors Trust
PACE Strategic Fixed Income Investments
Portfolio of investments—July 31, 2015
| | | Face
amount1 | | Value | |
| Asset-backed securities—(continued) | |
Ameriquest Mortgage
Securities, Inc. Asset-Backed
Pass-Through Certificates,
Series 2005-R5, Class M3
0.681%, due 07/25/354 | | | 1,590,000 | | | $ | 1,409,875 | | |
Series 2005-R8, Class M1
0.661%, due 10/25/354 | | | 1,000,000 | | | | 969,111 | | |
Series 2005-R8, Class M3
0.701%, due 10/25/354 | | | 1,700,000 | | | | 1,428,306 | | |
Argent Securities, Inc.
Asset-Backed Pass-Through
Certificates, Series 2005-W2,
Class M1
0.681%, due 10/25/354 | | | 770,000 | | | | 626,741 | | |
Bosphorus CLO, Series 1X, Class A
1.269%, due 11/10/234,6 | | EUR | 1,600,000 | | | | 1,754,259 | | |
Carlyle Global Market Strategies
CLO 2012-1 Ltd., Series 2012-1A,
Class AR
1.505%, due 04/20/224,7 | | | 1,900,000 | | | | 1,897,382 | | |
Centex Home Equity Loan Trust,
Series 2005-D, Class M3
0.671%, due 10/25/354 | | | 1,100,000 | | | | 965,903 | | |
CHEC Loan Trust, Series 2004-2,
Class M1
0.831%, due 06/25/344 | | | 1,453,143 | | | | 1,316,119 | | |
Citigroup Mortgage Loan Trust, Inc.
Series 2006-WFH4, Class M1
0.471%, due 11/25/36 | | | 488,000 | | | | 407,521 | | |
Countrywide Asset-Backed
Certificates,
0.371%, due 07/25/364 | | | 580,763 | | | | 568,961 | | |
Series 2005-13, Class 3AV3
0.437%, due 04/25/364 | | | 343,095 | | | | 340,800 | | |
Credit Suisse Mortgage Capital
Certificate, Series 2010-UD1
5.775%, due 12/16/494,7 | | | 948,426 | | | | 983,394 | | |
CSAB Mortgage Backed Trust,
Series 2006-1, Class A6A
6.172%, due 06/25/36 | | | 529,423 | | | | 310,379 | | |
Delta Funding Home Equity Loan
Trust, Series 1999-003,
Class A1A
1.007%, due 09/15/294 | | | 60,403 | | | | 55,318 | | |
Dryden Senior Loan Fund,
Series 2011-22A, Class A1R
1.459%, due 01/15/224,7 | | | 7,632,874 | | | | 7,620,975 | | |
EFS Volunteer LLC, Series 2010-1,
Class A1
1.145%, due 10/26/264,7 | | | 236,866 | | | | 237,145 | | |
Euro-Galaxy CLO BV,
Series 2006-1X, Class A2
0.221%, due 10/23/214,6 | | EUR | 932,762 | | | | 1,018,111 | | |
FBR Securitization Trust,
Series 2005-2, Class M2
0.937%, due 09/25/354 | | | 1,625,000 | | | | 1,435,790 | | |
| | | Face
amount1 | | Value | |
Asset-backed securities—(continued) | |
First Franklin Mortgage Loan Trust,
Series 2005-FFH3, Class M2
0.721%, due 09/25/354 | | | 1,000,000 | | | $ | 938,035 | | |
Franklin CLO Ltd. Series 5A,
Class A2
0.546%, due 06/15/184,7 | | | 1,038,988 | | | | 1,035,418 | | |
Fremont Home Loan Trust,
Series 2005-2, Class M3
0.941%, due 06/25/354 | | | 620,000 | | | | 535,030 | | |
Goldentree Loan Opportunities V
Ltd., Series 2007-5A, Class A
0.982%, due 10/18/214,7 | | | 1,283,207 | | | | 1,275,794 | | |
GSAMP Trust, Series 2006-HE4,
Class A1
0.331%, due 06/25/364 | | | 3,201,603 | | | | 2,716,938 | | |
Home Equity Asset Trust,
Series 2005-2, Class M5
1.286%, due 07/25/354 | | | 1,000,000 | | | | 890,475 | | |
Home Equity Mortgage Loan
Asset-Backed Trust,
Series 2005-D, Class AII4
0.541%, due 03/25/364 | | | 1,610,000 | | | | 1,404,067 | | |
HSI Asset Securitization Corp.
Trust, Series 2006-OPT2,
Class M2
0.581%, due 01/25/364 | | | 1,745,000 | | | | 1,380,295 | | |
Inwood Park CDO Ltd.,
Series 2006-1A, Class A1A
0.512%, due 01/20/214,7 | | | 1,448,480 | | | | 1,444,397 | | |
JP Morgan Mortgage Acquisition
Trust,
Series 2006-NC1, Class A1
0.357%, due 04/25/364 | | | 2,476,160 | | | | 2,307,885 | | |
Series 2007-CH1, Class MV2
0.467%, due 11/25/364 | | | 1,680,000 | | | | 1,440,062 | | |
Series 2007-CH2, Class AV1
0.351%, due 01/25/374 | | | 2,573,719 | | | | 2,503,078 | | |
LightPoint Pan-European
CLO 2006-1 PLC,
Series 2006-1X, Class A
0.228%, due 01/31/224,6 | | EUR | 56,072 | | | | 61,430 | | |
Morgan Stanley ABS Capital I,
Inc. Trust,
Series 2005-HE1, Class M2
0.896%, due 12/25/344 | | | 770,418 | | | | 748,286 | | |
Series 2006-NC1, Class M1
0.571%, due 12/25/354 | | | 1,700,000 | | | | 1,439,188 | | |
Morgan Stanley Home Equity Loan
Trust, Series 2005-4, Class M1
0.601%, due 09/25/354 | | | 1,660,000 | | | | 1,433,349 | | |
New Century Home Equity Loan
Trust, Series 2005-D, Class A2D
0.521%, due 02/25/364 | | | 2,000,000 | | | | 1,828,530 | | |
64
PACE Select Advisors Trust
PACE Strategic Fixed Income Investments
Portfolio of investments—July 31, 2015
| | | Face
amount1 | | Value | |
| Asset-backed securities—(continued) | |
Nomura Home Equity Loan, Inc.
Home Equity Loan Trust,
Series 2005-HE1, Class M4
0.781%, due 09/25/354 | | | 1,650,000 | | | $ | 1,440,221 | | |
Series 2006-HE1, Class M1
0.601%, due 02/25/364 | | | 1,600,000 | | | | 1,443,523 | | |
Option One Mortgage Loan Trust,
Asset-Backed Certificates,
Series 2005-4, Class M1
0.631%, due 11/25/354 | | | 1,500,000 | | | | 1,415,198 | | |
Park Place Securities, Inc.
Asset-Backed Pass-Through
Certificates, Series 2004-WHQ1,
Class M4
1.916%, due 09/25/344 | | | 220,733 | | | | 190,541 | | |
RAMP, Series 2006-RZ1 Trust,
Class M2
0.611%, due 03/25/364 | | | 1,110,000 | | | | 968,855 | | |
RASC,
Series 2005-KS4 Trust, Class M3
1.136%, due 05/25/354 | | | 1,690,000 | | | | 1,438,019 | | |
Series 2005-KS11 Trust, Class M2
0.611%, due 12/25/354 | | | 1,100,000 | | | | 933,539 | | |
Series 2005-KS12 Trust, Class M2
0.651%, due 01/25/364 | | | 1,700,000 | | | | 1,443,793 | | |
SASCO Mortgage Loan Trust,
Series 2005-GEL1, Class M2
1.087%, due 12/25/344 | | | 753,022 | | | | 667,854 | | |
Saxon Asset Securities Trust,
Series 2004-1, Class M1
0.982%, due 03/25/354 | | | 1,006,160 | | | | 910,773 | | |
Securitized Asset-Backed
Receivables LLC Trust,
Series 2006-OP1, Class M2
0.581%, due 10/25/354 | | | 1,655,000 | | | | 1,445,317 | | |
SLM Student Loan Trust,
Series 2008-9, Class A
1.795%, due 04/25/234 | | | 2,781,262 | | | | 2,795,146 | | |
Soundview Home Loan Trust,
Series 2005-OPT1, Class M2
0.866%, due 06/25/354 | | | 1,110,000 | | | | 975,552 | | |
Series 2005-OPT3, Class M1
0.661%, due 11/25/354 | | | 640,000 | | | | 533,654 | | |
Series 2006-1, Class A4
0.491%, due 02/25/364 | | | 600,000 | | | | 528,050 | | |
Series 2006-OPT2, Class A3
0.371%, due 05/25/364 | | | 1,737,332 | | | | 1,639,188 | | |
Series 2006-WF2, Class M1
0.411%, due 12/25/364 | | | 1,720,000 | | | | 1,448,264 | | |
Stoney Lane Funding I Corp.
Series 2007-1A, Class A1
0.529%, due 04/18/224,7 | | | 1,213,077 | | | | 1,188,380 | | |
Structured Asset Securities Corp.,
Series 2001-SB1, Class A2
3.375%, due 08/25/31 | | | 838,217 | | | | 826,606 | | |
| | | Face
amount1 | | Value | |
Asset-backed securities—(concluded) | |
Series 2005-WF1, Class M1
0.851%, due 02/25/354 | | | 253,326 | | | $ | 233,617 | | |
Sunrise SRL, Series 09, Class A
0.488%, due 08/27/314 | | EUR | 1,122,826 | | | | 1,228,950 | | |
Total asset-backed securities
(cost—$73,493,830) | | | | | 73,291,072 | | |
Corporate notes—38.51% | |
Aerospace & defense—0.17% | |
L-3 Communications Corp.
3.950%, due 11/15/16 | | | 1,500,000 | | | | 1,542,456 | | |
Airlines—1.08% | |
Air Canada 2013-1,
Class B Pass Through Trust
5.375%, due 05/15/217 | | | 2,034,952 | | | | 2,085,826 | | |
American Airlines 2013-2,
Class A Pass Through Trust
4.950%, due 01/15/23 | | | 2,256,357 | | | | 2,391,738 | | |
American Airlines 2014-1,
Class B Pass Through Trust
4.375%, due 10/01/22 | | | 1,907,806 | | | | 1,919,730 | | |
Continental Airlines 2009-2,
Series A Pass Through Trust
7.250%, due 11/10/19 | | | 149,570 | | | | 170,136 | | |
Continental Airlines 2012-2,
Class A Pass Through Trust
4.000%, due 10/29/24 | | | 1,474,974 | | | | 1,490,919 | | |
Northwest Airlines,
Series 2000-1, Class G
7.150%, due 10/01/19 | | | 1,789,194 | | | | 1,878,654 | | |
| | | 9,937,003 | | |
Auto & truck—0.36% | |
General Motors Co.
5.000%, due 04/01/35 | | | 3,400,000 | | | | 3,276,237 | | |
Auto parts & equipment—0.01% | |
The Goodyear Tire & Rubber Co.
6.500%, due 03/01/21 | | | 65,000 | | | | 68,819 | | |
Automaker—0.03% | |
FCA US LLC/CG Co-Issuer, Inc.
8.250%, due 06/15/21 | | | 255,000 | | | | 276,356 | | |
Banking-non-US—3.91% | |
Banco Santander Brasil SA
4.250%, due 01/14/167,9 | | | 2,800,000 | | | | 2,805,600 | | |
BPE Financiaciones SA
2.500%, due 02/01/17 | | EUR | 3,600,000 | | | | 4,032,428 | | |
Cooperatieve Centrale
Raiffeisen-Boerenleenbank BA
8.375%, due 07/26/164,6,10 | | | 1,800,000 | | | | 1,894,545 | | |
Depfa ACS Bank
5.125%, due 03/16/376 | | | 1,900,000 | | | | 2,326,314 | | |
DNB Bank ASA
3.200%, due 04/03/177 | | | 3,900,000 | | | | 4,012,757 | | |
65
PACE Select Advisors Trust
PACE Strategic Fixed Income Investments
Portfolio of investments—July 31, 2015
| | | Face
amount1 | | Value | |
Corporate notes—(continued) | |
Banking-non-US—(concluded) | |
Eksportfinans ASA
2.000%, due 09/15/15 | | | 1,872,000 | | | $ | 1,872,000 | | |
2.375%, due 05/25/16 | | | 1,298,000 | | | | 1,296,377 | | |
5.500%, due 05/25/16 | | | 800,000 | | | | 821,824 | | |
2.875%, due 11/16/16 | | CHF | 100,000 | | | | 105,092 | | |
5.500%, due 06/26/17 | | | 400,000 | | | | 423,036 | | |
Export-Import Bank of Korea
1.250%, due 11/20/15 | | | 600,000 | | | | 600,270 | | |
5.125%, due 06/29/20 | | | 400,000 | | | | 446,898 | | |
4.375%, due 09/15/21 | | | 1,300,000 | | | | 1,409,449 | | |
5.000%, due 04/11/22 | | | 3,300,000 | | | | 3,697,495 | | |
ICICI Bank Ltd.
5.000%, due 01/15/166 | | | 2,000,000 | | | | 2,029,040 | | |
ING Groep NV
6.500%, due 04/16/254,10 | | | 610,000 | | | | 598,563 | | |
KBC Bank NV
8.000%, due 01/25/234,6 | | | 2,200,000 | | | | 2,416,480 | | |
Lloyds Bank PLC
3.500%, due 05/14/25 | | | 3,700,000 | | | | 3,663,115 | | |
Royal Bank of Scotland PLC MTN
9.500%, due 03/16/224,6 | | | 600,000 | | | | 662,033 | | |
Societe Generale SA
4.250%, due 04/14/2511 | | | 1,000,000 | | | | 953,933 | | |
| | | 36,067,249 | | |
Banking-US—3.97% | |
ABN AMRO Bank NV
2.450%, due 06/04/207 | | | 5,700,000 | | | | 5,694,408 | | |
4.750%, due 07/28/257 | | | 820,000 | | | | 822,019 | | |
Aviation Capital Group Corp.
6.750%, due 04/06/217 | | | 4,820,000 | | | | 5,483,897 | | |
Bank of America Corp.
2.600%, due 01/15/19 | | | 500,000 | | | | 506,039 | | |
5.750%, due 12/01/17 | | | 500,000 | | | | 543,156 | | |
6.100%, due 03/17/254,10 | | | 490,000 | | | | 487,795 | | |
7.625%, due 06/01/199 | | | 2,900,000 | | | | 3,439,530 | | |
Bank of America Corp. MTN
3.300%, due 01/11/23 | | | 400,000 | | | | 394,299 | | |
4.000%, due 04/01/24 | | | 975,000 | | | | 998,328 | | |
4.000%, due 01/22/25 | | | 1,500,000 | | | | 1,471,464 | | |
4.125%, due 01/22/24 | | | 3,700,000 | | | | 3,828,235 | | |
Capital One Financial Corp.
5.550%, due 06/01/204,10 | | | 1,065,000 | | | | 1,066,278 | | |
CIT Group, Inc.
5.250%, due 03/15/18 | | | 245,000 | | | | 254,188 | | |
5.500%, due 02/15/197 | | | 60,000 | | | | 63,450 | | |
JPMorgan Chase & Co.
6.300%, due 04/23/19 | | | 400,000 | | | | 457,223 | | |
JPMorgan Chase Bank N.A.
0.616%, due 06/13/164 | | | 400,000 | | | | 399,208 | | |
4.375%, due 11/30/214,6 | | EUR | 500,000 | | | | 572,899 | | |
5.875%, due 06/13/16 | | | 1,100,000 | | | | 1,145,461 | | |
6.000%, due 10/01/179 | | | 2,700,000 | | | | 2,936,533 | | |
| | | Face
amount1 | | Value | |
Corporate notes—(continued) | |
Banking-US—(concluded) | |
Synchrony Financial
2.700%, due 02/03/20 | | | 500,000 | | | $ | 492,581 | | |
4.500%, due 07/23/25 | | | 615,000 | | | | 617,087 | | |
Wells Fargo & Co.
5.875%, due 06/15/254,10 | | | 1,000,000 | | | | 1,023,750 | | |
Wells Fargo & Co. MTN
3.000%, due 02/19/25 | | | 4,000,000 | | | | 3,848,332 | | |
| | | 36,546,160 | | |
Beverages—0.02% | |
Constellation Brands, Inc.
6.000%, due 05/01/22 | | | 115,000 | | | | 127,075 | | |
4.750%, due 11/15/24 | | | 60,000 | | | | 61,200 | | |
| | | 188,275 | | |
Building & construction—0.19% | |
D.R. Horton, Inc.
4.000%, due 02/15/20 | | | 20,000 | | | | 20,400 | | |
5.750%, due 08/15/23 | | | 120,000 | | | | 127,800 | | |
Lennar Corp.
4.750%, due 11/15/22 | | | 185,000 | | | | 185,462 | | |
Odebrecht Offshore Drilling
Finance Ltd.
6.625%, due 10/01/227 | | | 1,611,430 | | | | 1,015,201 | | |
PulteGroup, Inc.
6.000%, due 02/15/35 | | | 80,000 | | | | 78,000 | | |
Taylor Morrison Communities,
Inc./Monarch Communities, Inc.
5.250%, due 04/15/217 | | | 135,000 | | | | 134,662 | | |
5.625%, due 03/01/247 | | | 15,000 | | | | 14,588 | | |
The Ryland Group, Inc.
5.375%, due 10/01/22 | | | 130,000 | | | | 131,625 | | |
| | | 1,707,738 | | |
Building materials—0.02% | |
Masco Corp.
5.850%, due 03/15/17 | | | 120,000 | | | | 126,300 | | |
Vulcan Materials Co.
7.500%, due 06/15/21 | | | 50,000 | | | | 57,750 | | |
| | | 184,050 | | |
Building products—0.02% | |
Standard Pacific Corp.
8.375%, due 05/15/18 | | | 115,000 | | | | 131,388 | | |
USG Corp.
5.875%, due 11/01/217 | | | 60,000 | | | | 62,850 | | |
| | | 194,238 | | |
Cable—0.63% | |
CCO Holdings LLC/CCO Holdings
Capital Corp.
7.375%, due 06/01/20 | | | 180,000 | | | | 190,387 | | |
5.125%, due 05/01/237 | | | 15,000 | | | | 14,850 | | |
66
PACE Select Advisors Trust
PACE Strategic Fixed Income Investments
Portfolio of investments—July 31, 2015
| | | Face
amount1 | | Value | |
Corporate notes—(continued) | |
Chemicals—(concluded) | |
CCO Safari II LLC
4.464%, due 07/23/227 | | | 3,400,000 | | | $ | 3,418,360 | | |
4.908%, due 07/23/257 | | | 885,000 | | | | 886,959 | | |
6.484%, due 10/23/457 | | | 1,205,000 | | | | 1,247,127 | | |
| | | 5,757,683 | | |
Chemicals—0.11% | |
Huntsman International LLC
5.125%, due 11/15/227 | | | 190,000 | | | | 183,350 | | |
Momentive Performance
Materials, Inc.
3.880%, due 10/24/21 | | | 20,000 | | | | 17,350 | | |
MPM Escrow LLC
8.875%, due 10/15/205 | | | 20,000 | | | | — | | |
NOVA Chemicals Corp.
5.000%, due 05/01/257 | | | 130,000 | | | | 128,700 | | |
The Dow Chemical Co.
4.625%, due 10/01/44 | | | 750,000 | | | | 701,598 | | |
| | | 1,030,998 | | |
Commercial services—0.33% | |
Air Lease Corp.
3.375%, due 01/15/19 | | | 2,000,000 | | | | 2,040,000 | | |
Aircastle Ltd.
4.625%, due 12/15/18 | | | 255,000 | | | | 266,124 | | |
Iron Mountain, Inc.
5.750%, due 08/15/24 | | | 250,000 | | | | 251,875 | | |
R.R. Donnelley & Sons Co.
7.000%, due 02/15/22 | | | 115,000 | | | | 123,625 | | |
Service Corp. International
5.375%, due 01/15/22 | | | 180,000 | | | | 189,450 | | |
The ServiceMaster Co.
7.000%, due 08/15/20 | | | 115,000 | | | | 121,187 | | |
| | | 2,992,261 | | |
Communications equipment—0.20% | |
QUALCOMM, Inc.
4.800%, due 05/20/45 | | | 2,000,000 | | | | 1,806,706 | | |
Computer software & services—0.00%†† | |
NCR Corp.
4.625%, due 02/15/21 | | | 20,000 | | | | 19,987 | | |
5.875%, due 12/15/21 | | | 15,000 | | | | 15,525 | | |
| | | 35,512 | | |
Computers—0.22% | |
Seagate HDD Cayman
4.750%, due 06/01/23 | | | 1,500,000 | | | | 1,518,375 | | |
4.875%, due 06/01/277 | | | 565,000 | | | | 543,510 | | |
| | | 2,061,885 | | |
Diversified financials—3.02% | |
American Express Co.
5.200%, due 11/15/194,10 | | | 1,000,000 | | | | 1,000,000 | | |
6.800%, due 09/01/663 | | | 3,000,000 | | | | 3,086,250 | | |
| | | Face
amount1 | | Value | |
Corporate notes—(continued) | |
Diversified financials—(concluded) | |
Doric Nimrod Air Finance Alpha Ltd.
2012-1, Class A Pass Through Trust
5.125%, due 11/30/227 | | | 504,369 | | | $ | 527,643 | | |
First Data Corp.
6.750%, due 11/01/206 | | | 120,000 | | | | 126,900 | | |
General Electric Capital Corp.
5.250%, due 06/15/234,10 | | | 1,000,000 | | | | 1,025,000 | | |
Goldman Sachs Group, Inc.
0.731%, due 03/22/164 | | | 1,200,000 | | | | 1,199,296 | | |
3.700%, due 08/01/15 | | | 1,700,000 | | | | 1,700,000 | | |
3.750%, due 05/22/25 | | | 1,900,000 | | | | 1,894,906 | | |
5.150%, due 05/22/45 | | | 910,000 | | | | 901,453 | | |
5.700%, due 05/10/194,10 | | | 1,500,000 | | | | 1,514,520 | | |
5.950%, due 01/18/18 | | | 2,500,000 | | | | 2,745,578 | | |
6.000%, due 06/15/208 | | | 3,400,000 | | | | 3,897,141 | | |
Lehman Brothers Holdings, Inc. MTN
0.000%, due 12/30/1611,12 | | | 1,900,000 | | | | 201,875 | | |
1.000%, due 12/30/1611,12 | | | 900,000 | | | | 95,625 | | |
1.000%, due 01/24/4911,12 | | | 4,500,000 | | | | 495,000 | | |
Merrill Lynch & Co. MTN
6.875%, due 04/25/18 | | | 5,300,000 | | | | 5,977,833 | | |
Navient Corp. MTN
4.875%, due 06/17/19 | | | 315,000 | | | | 300,825 | | |
Rio Oil Finance Trust, Series 2014-1
6.250%, due 07/06/247 | | | 1,200,000 | | | | 1,116,000 | | |
| | | 27,805,845 | | |
Electric utilities—0.81% | |
Dynegy, Inc.
6.750%, due 11/01/197 | | | 125,000 | | | | 129,063 | | |
Exelon Corp.
2.850%, due 06/15/20 | | | 1,900,000 | | | | 1,908,711 | | |
Exelon Generation Co. LLC
2.950%, due 01/15/20 | | | 2,000,000 | | | | 2,009,588 | | |
IPALCO Enterprises, Inc.
3.450%, due 07/15/2011 | | | 2,800,000 | | | | 2,793,000 | | |
NRG Energy, Inc.
6.250%, due 07/15/22 | | | 60,000 | | | | 60,150 | | |
7.875%, due 05/15/21 | | | 300,000 | | | | 315,936 | | |
Talen Energy Supply LLC
4.625%, due 07/15/197 | | | 265,000 | | | | 257,050 | | |
| | | 7,473,498 | | |
Electric-generation—0.02% | |
Calpine Corp.
5.375%, due 01/15/23 | | | 120,000 | | | | 117,300 | | |
6.000%, due 01/15/227 | | | 95,000 | | | | 100,462 | | |
| | | 217,762 | | |
Electric-integrated—0.79% | |
Centrais Eletricas Brasileiras SA
6.875%, due 07/30/197,9 | | | 200,000 | | | | 194,500 | | |
Puget Energy, Inc.
6.500%, due 12/15/209 | | | 6,000,000 | | | | 7,061,160 | | |
| | | 7,255,660 | | |
67
PACE Select Advisors Trust
PACE Strategic Fixed Income Investments
Portfolio of investments—July 31, 2015
| | | Face
amount1 | | Value | |
Corporate notes—(continued) | |
Electronics—0.20% | |
Flextronics International Ltd.
4.750%, due 06/15/257,9 | | | 1,900,000 | | | $ | 1,854,875 | | |
Energy-exploration & production—0.01% | |
Antero Resources Corp.
5.375%, due 11/01/21 | | | 100,000 | | | | 97,250 | | |
Finance-captive automotive—1.18% | |
Bank of America NA
0.586%, due 06/15/174 | | | 2,800,000 | | | | 2,780,316 | | |
Denali Borrower LLC/Denali Finance Corp.
5.625%, due 10/15/207 | | | 1,400,000 | | | | 1,459,500 | | |
Ford Motor Credit Co. LLC
8.000%, due 12/15/16 | | | 600,000 | | | | 650,670 | | |
International Lease Finance Corp.
5.750%, due 05/15/16 | | | 100,000 | | | | 102,500 | | |
5.875%, due 08/15/22 | | | 225,000 | | | | 245,250 | | |
6.250%, due 05/15/19 | | | 120,000 | | | | 130,782 | | |
8.625%, due 09/15/15 | | | 1,020,000 | | | | 1,026,375 | | |
8.875%, due 09/01/17 | | | 335,000 | | | | 373,106 | | |
Schaeffler Holding Finance BV
6.875%, due 08/15/187 | | | 2,000,000 | | | | 2,070,000 | | |
The Depository Trust & Clearing Corp.
4.875%, due 06/15/204,7,10 | | | 2,000,000 | | | | 2,009,000 | | |
| | | 10,847,499 | | |
Finance-non-captive diversified—0.47% | |
Ford Motor Credit Co. LLC
2.597%, due 11/04/19 | | | 1,000,000 | | | | 995,196 | | |
4.250%, due 02/03/17 | | | 3,200,000 | | | | 3,320,237 | | |
| | | 4,315,433 | | |
Financial services—3.90% | |
Ally Financial, Inc.
3.250%, due 09/29/179 | | | 100,000 | | | | 100,125 | | |
3.250%, due 02/13/18 | | | 1,045,000 | | | | 1,043,694 | | |
7.500%, due 09/15/20 | | | 55,000 | | | | 64,289 | | |
8.000%, due 03/15/20 | | | 351,000 | | | | 414,180 | | |
8.000%, due 11/01/31 | | | 100,000 | | | | 125,000 | | |
Argos Merger Sub, Inc.
7.125%, due 03/15/237 | | | 155,000 | | | | 163,912 | | |
Citicorp Lease Pass-Through Trust 1999-1
8.040%, due 12/15/1911 | | | 1,000,000 | | | | 1,206,026 | | |
Citigroup, Inc.
0.985%, due 04/27/184 | | | 5,800,000 | | | | 5,777,954 | | |
1.974%, due 05/15/184 | | | 300,000 | | | | 307,372 | | |
4.000%, due 08/05/24 | | | 1,500,000 | | | | 1,498,092 | | |
6.125%, due 11/21/17 | | | 600,000 | | | | 657,367 | | |
8.500%, due 05/22/19 | | | 2,400,000 | | | | 2,926,589 | | |
HSBC Finance Corp.
6.676%, due 01/15/21 | | | 1,400,000 | | | | 1,634,472 | | |
Icahn Enterprises LP/Icahn Enterprises Finance Corp.
4.875%, due 03/15/19 | | | 185,000 | | | | 190,781 | | |
| | | Face
amount1 | | Value | |
Corporate notes—(continued) | |
Financial services—(concluded) | |
JPMorgan Chase & Co.
2.250%, due 01/23/209 | | | 3,900,000 | | | $ | 3,850,232 | | |
2.750%, due 06/23/20 | | | 1,400,000 | | | | 1,408,574 | | |
4.250%, due 10/15/20 | | | 2,800,000 | | | | 3,001,998 | | |
4.400%, due 07/22/209 | | | 600,000 | | | | 647,260 | | |
5.300%, due 05/01/204,10 | | | 1,800,000 | | | | 1,793,520 | | |
Morgan Stanley
3.950%, due 04/23/27 | | | 1,675,000 | | | | 1,600,431 | | |
5.450%, due 07/15/194,10 | | | 1,500,000 | | | | 1,491,000 | | |
5.550%, due 07/15/204,10 | | | 980,000 | | | | 975,100 | | |
7.300%, due 05/13/19 | | | 2,570,000 | | | | 3,023,137 | | |
Navient LLC MTN
6.250%, due 01/25/16 | | | 1,885,000 | | | | 1,903,850 | | |
The Nielsen Co. Luxembourg SARL
5.500%, due 10/01/217 | | | 125,000 | | | | 128,125 | | |
| | | 35,933,080 | | |
Food products—0.40% | |
Grupo Bimbo SAB de CV
4.875%, due 06/27/447 | | | 675,000 | | | | 634,500 | | |
Kraft Heinz Foods Co.
3.950%, due 07/15/257 | | | 420,000 | | | | 425,685 | | |
5.000%, due 07/15/357,9 | | | 1,800,000 | | | | 1,864,573 | | |
5.200%, due 07/15/457 | | | 605,000 | | | | 634,925 | | |
Post Holdings, Inc.
6.000%, due 12/15/227 | | | 135,000 | | | | 130,950 | | |
| | | 3,690,633 | | |
Gaming—0.51% | |
AMC Entertainment, Inc.
5.875%, due 02/15/22 | | | 60,000 | | | | 61,350 | | |
Cedar Fair LP/Canada's
Wonderland Co./Magnum
Management Corp.
5.375%, due 06/01/24 | | | 60,000 | | | | 61,361 | | |
GLP Capital LP/GLP Financing II, Inc.
4.875%, due 11/01/20 | | | 315,000 | | | | 324,844 | | |
5.375%, due 11/01/23 | | | 120,000 | | | | 125,031 | | |
Graton Economic Development Authority
9.625%, due 09/01/197 | | | 230,000 | | | | 247,537 | | |
Isle of Capri Casinos, Inc.
5.875%, due 03/15/21 | | | 125,000 | | | | 129,688 | | |
MGM Resorts International
6.000%, due 03/15/23 | | | 35,000 | | | | 35,613 | | |
6.875%, due 04/01/169 | | | 2,900,000 | | | | 2,987,000 | | |
7.625%, due 01/15/17 | | | 120,000 | | | | 127,500 | | |
Pinnacle Entertainment, Inc.
7.500%, due 04/15/21 | | | 125,000 | | | | 132,812 | | |
7.750%, due 04/01/22 | | | 120,000 | | | | 134,400 | | |
Regal Entertainment Group
5.750%, due 03/15/22 | | | 115,000 | | | | 117,875 | | |
Scientific Games International, Inc.
7.000%, due 01/01/227 | | | 180,000 | | | | 186,525 | | |
68
PACE Select Advisors Trust
PACE Strategic Fixed Income Investments
Portfolio of investments—July 31, 2015
| | | Face
amount1 | | Value | |
Corporate notes—(continued) | |
Gaming—(concluded) | |
Shingle Springs Tribal Gaming Authority
9.750%, due 09/01/217 | | | 55,000 | | | $ | 60,500 | | |
| | | 4,732,036 | | |
Gas distribution—0.02% | |
AmeriGas Finance LLC/AmeriGas
Finance Corp.
7.000%, due 05/20/22 | | | 190,000 | | | | 202,084 | | |
Gas pipelines—0.57% | |
Kinder Morgan, Inc.
3.050%, due 12/01/19 | | | 1,500,000 | | | | 1,487,556 | | |
MarkWest Energy Partners LP/
MarkWest Energy Finance Corp.
4.500%, due 07/15/23 | | | 105,000 | | | | 102,112 | | |
4.875%, due 06/01/25 | | | 3,800,000 | | | | 3,695,500 | | |
| | | 5,285,168 | | |
Health care providers & services—0.19% | |
CVS Health Corp.
3.875%, due 07/20/25 | | | 1,000,000 | | | | 1,017,230 | | |
Fresenius Medical Care US Finance, Inc.
5.750%, due 02/15/217 | | | 235,000 | | | | 252,037 | | |
Fresenius Medical Care US Finance II, Inc.
5.875%, due 01/31/227 | | | 115,000 | | | | 124,200 | | |
Hologic, Inc.
5.250%, due 07/15/227 | | | 65,000 | | | | 67,113 | | |
LifePoint Health, Inc.
5.500%, due 12/01/21 | | | 125,000 | | | | 129,687 | | |
Mallinckrodt International
Finance SA/Mallinckrodt CB LLC
5.500%, due 04/15/257 | | | 125,000 | | | | 125,938 | | |
| | | 1,716,205 | | |
Health facilities—0.07% | |
CHS/Community Health Systems, Inc.
5.125%, due 08/01/21 | | | 245,000 | | | | 254,187 | | |
7.125%, due 07/15/20 | | | 245,000 | | | | 260,925 | | |
DaVita HealthCare Partners, Inc.
5.125%, due 07/15/24 | | | 60,000 | | | | 60,463 | | |
5.750%, due 08/15/22 | | | 85,000 | | | | 90,525 | | |
| | | 666,100 | | |
Hotels, restaurants & leisure—0.41% | |
Starbucks Corp.
2.700%, due 06/15/229 | | | 1,900,000 | | | | 1,901,936 | | |
4.300%, due 06/15/459 | | | 1,900,000 | | | | 1,917,395 | | |
| | | 3,819,331 | | |
Hotels/gaming—0.01% | |
Wynn Las Vegas LLC/Wynn
Las Vegas Capital Corp.
5.500%, due 03/01/257 | | | 60,000 | | | | 57,750 | | |
Insurance—0.84% | |
MetLife, Inc.
5.250%, due 06/15/204,9,10 | | | 2,735,000 | | | | 2,728,162 | | |
| | | Face
amount1 | | Value | |
Corporate notes—(continued) | |
Insurance—(concluded) | |
Progressive Corp.
6.700%, due 06/15/374 | | | 2,200,000 | | | $ | 2,293,500 | | |
Prudential Financial, Inc.
5.200%, due 03/15/444 | | | 1,000,000 | | | | 975,393 | | |
5.375%, due 05/15/454 | | | 715,000 | | | | 706,063 | | |
Voya Financial, Inc. | |
5.650%, due 05/15/534 | | | 1,000,000 | | | | 1,021,600 | | |
| | | 7,724,718 | | |
IT consulting & services—0.01% | |
IHS, Inc.
5.000%, due 11/01/227 | | | 130,000 | | | | 130,163 | | |
Lodging—0.03% | |
Hilton Worldwide Finance LLC/
Hilton Worldwide Finance Corp.
5.625%, due 10/15/21 | | | 125,000 | | | | 130,156 | | |
NCL Corp. Ltd.
5.250%, due 11/15/197 | | | 120,000 | | | | 124,200 | | |
| | | 254,356 | | |
Machinery—0.01% | |
Terex Corp.
6.500%, due 04/01/20 | | | 125,000 | | | | 129,063 | | |
Media—1.51% | |
Alibaba Group Holding Ltd.
3.125%, due 11/28/217 | | | 6,500,000 | | | | 6,340,087 | | |
Clear Channel Worldwide Holdings, Inc.
6.500%, due 11/15/22 | | | 185,000 | | | | 192,862 | | |
7.625%, due 03/15/20 | | | 120,000 | | | | 126,075 | | |
DIRECTV Holdings LLC/
DIRECTV Financing Co., Inc.
3.800%, due 03/15/22 | | | 1,500,000 | | | | 1,502,634 | | |
DISH DBS Corp.
5.875%, due 07/15/22 | | | 60,000 | | | | 59,700 | | |
5.875%, due 11/15/24 | | | 80,000 | | | | 77,600 | | |
7.875%, due 09/01/19 | | | 170,000 | | | | 190,188 | | |
Liberty Interactive LLC
8.500%, due 07/15/29 | | | 25,000 | | | | 27,125 | | |
Nielsen Finance LLC/Nielsen Finance Co.
5.000%, due 04/15/227 | | | 65,000 | | | | 64,431 | | |
Sirius XM Radio, Inc.
4.250%, due 05/15/207 | | | 65,000 | | | | 64,756 | | |
5.250%, due 08/15/227 | | | 120,000 | | | | 126,150 | | |
Sky PLC
6.100%, due 02/15/187,9 | | | 1,000,000 | | | | 1,097,046 | | |
TEGNA, Inc.
5.125%, due 10/15/19 | | | 125,000 | | | | 130,313 | | |
5.500%, due 09/15/247 | | | 125,000 | | | | 125,625 | | |
Time Warner Cable, Inc.
5.850%, due 05/01/179 | | | 200,000 | | | | 212,929 | | |
6.750%, due 06/15/399 | | | 700,000 | | | | 726,209 | | |
7.300%, due 07/01/389 | | | 2,000,000 | | | | 2,182,578 | | |
Tribune Media Co.
5.875%, due 07/15/227 | | | 125,000 | | | | 129,063 | | |
69
PACE Select Advisors Trust
PACE Strategic Fixed Income Investments
Portfolio of investments—July 31, 2015
| | | Face
amount1 | | Value | |
Corporate notes—(continued) | |
Media—(concluded) | |
Univision Communications, Inc.
5.125%, due 05/15/237 | | | 125,000 | | | $ | 125,313 | | |
Viacom, Inc.
5.250%, due 04/01/44 | | | 480,000 | | | | 444,480 | | |
| | | 13,945,164 | | |
Media-cable—0.16% | |
Time Warner Entertainment Co. LP
8.375%, due 03/15/23 | | | 1,200,000 | | | | 1,493,862 | | |
Medical providers—0.47% | |
HCA, Inc.
5.000%, due 03/15/24 | | | 190,000 | | | | 197,838 | | |
6.500%, due 02/15/20 | | | 3,139,000 | | | | 3,509,794 | | |
7.500%, due 02/15/22 | | | 165,000 | | | | 192,225 | | |
Tenet Healthcare Corp.
6.000%, due 10/01/20 | | | 300,000 | | | | 326,250 | | |
6.250%, due 11/01/18 | | | 120,000 | | | | 131,100 | | |
| | | 4,357,207 | | |
Metals & mining—0.32% | |
Alcoa, Inc.
5.870%, due 02/23/22 | | | 115,000 | | | | 121,756 | | |
Freeport-McMoRan, Inc.
4.550%, due 11/14/24 | | | 1,625,000 | | | | 1,373,125 | | |
Glencore Funding LLC
2.875%, due 04/16/207 | | | 1,490,000 | | | | 1,433,586 | | |
| | | 2,928,467 | | |
Oil & gas—2.92% | |
BP Capital Markets PLC
3.506%, due 03/17/259 | | | 2,800,000 | | | | 2,770,281 | | |
California Resources Corp.
5.000%, due 01/15/20 | | | 155,000 | | | | 132,912 | | |
6.000%, due 11/15/24 | | | 90,000 | | | | 72,900 | | |
Chesapeake Energy Corp.
6.125%, due 02/15/21 | | | 305,000 | | | | 263,062 | | |
6.500%, due 08/15/17 | | | 120,000 | | | | 117,000 | | |
Concho Resources, Inc.
5.500%, due 04/01/23 | | | 65,000 | | | | 65,000 | | |
CONSOL Energy, Inc.
5.875%, due 04/15/22 | | | 140,000 | | | | 108,763 | | |
Crestwood Midstream Partners LP/
Crestwood Midstream Finance Corp.
6.250%, due 04/01/237 | | | 150,000 | | | | 150,750 | | |
Denbury Resources, Inc.
4.625%, due 07/15/23 | | | 300,000 | | | | 216,000 | | |
Ecopetrol SA
5.375%, due 06/26/26 | | | 2,100,000 | | | | 2,037,525 | | |
Encana Corp.
6.500%, due 05/15/19 | | | 1,400,000 | | | | 1,572,791 | | |
Energy Transfer Equity LP
7.500%, due 10/15/20 | | | 235,000 | | | | 263,200 | | |
EP Energy LLC/Everest Acquisition
Finance, Inc.
9.375%, due 05/01/20 | | | 90,000 | | | | 92,925 | | |
| | | Face
amount1 | | Value | |
Corporate notes—(continued) | |
Oil & gas—(concluded) | |
Ferrellgas LP/Ferrellgas Finance Corp.
6.750%, due 01/15/22 | | | 75,000 | | | $ | 75,563 | | |
KazMunayGas National Co. JS
7.000%, due 05/05/206 | | | 150,000 | | | | 159,750 | | |
Kinder Morgan Energy Partners LP
6.500%, due 09/01/39 | | | 1,500,000 | | | | 1,507,369 | | |
Linn Energy LLC/Linn Energy
Finance Corp.
8.625%, due 04/15/20 | | | 155,000 | | | | 95,325 | | |
Newfield Exploration Co.
5.750%, due 01/30/22 | | | 130,000 | | | | 128,700 | | |
Oasis Petroleum, Inc.
6.875%, due 03/15/22 | | | 40,000 | | | | 36,800 | | |
6.875%, due 01/15/23 | | | 145,000 | | | | 131,225 | | |
Petrobras Global Finance BV
1.881%, due 05/20/164,9 | | | 200,000 | | | | 197,260 | | |
2.643%, due 03/17/174 | | | 2,500,000 | | | | 2,425,000 | | |
3.250%, due 03/17/17 | | | 1,800,000 | | | | 1,754,100 | | |
3.500%, due 02/06/179 | | | 100,000 | | | | 98,077 | | |
3.875%, due 01/27/16 | | | 1,500,000 | | | | 1,502,250 | | |
5.750%, due 01/20/20 | | | 700,000 | | | | 674,968 | | |
6.250%, due 03/17/249 | | | 200,000 | | | | 185,400 | | |
Pioneer Natural Resources Co.
5.875%, due 07/15/16 | | | 1,535,000 | | | | 1,595,877 | | |
Sinopec Group Overseas
Development 2014 Ltd.
4.375%, due 04/10/246 | | | 4,620,000 | | | | 4,808,732 | | |
SM Energy Co.
5.000%, due 01/15/24 | | | 140,000 | | | | 128,100 | | |
Southwestern Energy Co.
7.500%, due 02/01/18 | | | 2,806,000 | | | | 3,103,952 | | |
Targa Resources Partners LP/
Targa Resources Partners
Finance Corp.
4.125%, due 11/15/197 | | | 125,000 | | | | 125,000 | | |
4.250%, due 11/15/23 | | | 50,000 | | | | 46,250 | | |
Transocean, Inc.
3.000%, due 10/15/17 | | | 40,000 | | | | 37,520 | | |
Whiting Petroleum Corp.
5.750%, due 03/15/21 | | | 65,000 | | | | 63,375 | | |
WPX Energy, Inc.
5.250%, due 09/15/24 | | | 150,000 | | | | 128,625 | | |
| | | 26,872,327 | | |
Packaging & containers—0.10% | |
Ball Corp.
5.000%, due 03/15/22 | | | 60,000 | | | | 61,466 | | |
Berry Plastics Corp.
5.125%, due 07/15/23 | | | 65,000 | | | | 63,863 | | |
5.500%, due 05/15/22 | | | 180,000 | | | | 181,800 | | |
Owens-Brockway Glass Container, Inc.
5.375%, due 01/15/257 | | | 60,000 | | | | 59,550 | | |
70
PACE Select Advisors Trust
PACE Strategic Fixed Income Investments
Portfolio of investments—July 31, 2015
| | | Face
amount1 | | Value | |
Corporate notes—(continued) | |
Packaging & containers—(concluded) | |
Reynolds Group Issuer, Inc./
Reynolds Group Issuer LLC
5.750%, due 10/15/20 | | | 425,000 | | | $ | 439,875 | | |
Sealed Air Corp.
5.500%, due 09/15/257 | | | 110,000 | | | | 112,337 | | |
| | | 918,891 | | |
Personal & household products—0.01% | |
Edgewell Personal Care Co.
4.700%, due 05/19/21 | | | 25,000 | | | | 25,600 | | |
4.700%, due 05/24/22 | | | 55,000 | | | | 56,063 | | |
| | | 81,663 | | |
Pharmaceuticals—1.89% | |
Actavis Funding SCS
3.450%, due 03/15/22 | | | 4,590,000 | | | | 4,515,133 | | |
3.800%, due 03/15/259 | | | 1,700,000 | | | | 1,657,270 | | |
Endo Finance LLC/Endo Finco, Inc.
5.375%, due 01/15/237 | | | 210,000 | | | | 212,230 | | |
Medtronic, Inc.
3.500%, due 03/15/257 | | | 3,900,000 | | | | 3,892,797 | | |
Merck & Co., Inc.
2.750%, due 02/10/25 | | | 3,100,000 | | | | 2,967,304 | | |
3.700%, due 02/10/45 | | | 4,020,000 | | | | 3,684,069 | | |
Valeant Pharmaceuticals International, Inc.
6.375%, due 10/15/207 | | | 245,000 | | | | 258,169 | | |
5.625%, due 12/01/217 | | | 185,000 | | | | 189,856 | | |
| | | 17,376,828 | | |
Pipelines—1.56% | |
DCP Midstream LLC
4.750%, due 09/30/217 | | | 15,000 | | | | 14,189 | | |
5.350%, due 03/15/207 | | | 15,000 | | | | 14,780 | | |
8.125%, due 08/16/30 | | | 15,000 | | | | 15,975 | | |
DCP Midstream Operating LP
2.500%, due 12/01/17 | | | 30,000 | | | | 28,920 | | |
5.600%, due 04/01/44 | | | 20,000 | | | | 16,470 | | |
Energy Transfer Partners LP
6.125%, due 12/15/45 | | | 1,100,000 | | | | 1,107,358 | | |
6.500%, due 02/01/42 | | | 1,000,000 | | | | 1,025,423 | | |
Enterprise Products Operating LLC
2.550%, due 10/15/19 | | | 2,000,000 | | | | 2,005,268 | | |
Rockies Express Pipeline LLC
5.625%, due 04/15/207 | | | 75,000 | | | | 75,750 | | |
6.850%, due 07/15/187 | | | 25,000 | | | | 26,250 | | |
Rose Rock Midstream LP/
Rose Rock Finance Corp.
5.625%, due 11/15/237 | | | 130,000 | | | | 123,500 | | |
Sabine Pass Liquefaction LLC
5.625%, due 02/01/21 | | | 125,000 | | | | 127,500 | | |
5.625%, due 03/01/257 | | | 125,000 | | | | 123,125 | | |
5.750%, due 05/15/24 | | | 7,400,000 | | | | 7,358,375 | | |
Tesoro Logistics LP/Tesoro Logistics
Finance Corp.
6.250%, due 10/15/227 | | | 60,000 | | | | 62,700 | | |
| | | Face
amount1 | | Value | |
Corporate notes—(continued) | |
Pipelines—(concluded) | |
Transcanada Trust
5.625%, due 05/20/754 | | | 1,055,000 | | | $ | 1,055,000 | | |
Williams Partners LP
3.600%, due 03/15/22 | | | 1,100,000 | | | | 1,061,392 | | |
6.125%, due 07/15/22 | | | 120,000 | | | | 125,987 | | |
| | | 14,367,962 | | |
Real estate—0.45% | |
Education Realty Operating
Partnership LP
4.600%, due 12/01/24 | | | 810,000 | | | | 815,766 | | |
EPR Properties
5.750%, due 08/15/22 | | | 1,500,000 | | | | 1,617,328 | | |
ESH Hospitality, Inc.
5.250%, due 05/01/257 | | | 65,000 | | | | 63,294 | | |
Iron Mountain, Inc.
7.750%, due 10/01/19 | | | 15,000 | | | | 15,712 | | |
MPT Operating Partnership LP/
MPT Finance Corp.
5.500%, due 05/01/24 | | | 245,000 | | | | 252,350 | | |
Omega Healthcare Investors, Inc.
4.500%, due 01/15/25 | | | 1,250,000 | | | | 1,236,394 | | |
Realogy Group LLC
7.625%, due 01/15/207 | | | 120,000 | | | | 126,750 | | |
| | | 4,127,594 | | |
Rental auto/equipment—0.02% | |
United Rentals North America, Inc.
5.750%, due 11/15/24 | | | 15,000 | | | | 14,663 | | |
7.375%, due 05/15/20 | | | 120,000 | | | | 127,650 | | |
| | | 142,313 | | |
Retail—0.03% | |
Dollar Tree, Inc.
5.250%, due 03/01/207 | | | 25,000 | | | | 26,375 | | |
5.750%, due 03/01/237 | | | 95,000 | | | | 100,225 | | |
QVC, Inc.
5.450%, due 08/15/34 | | | 25,000 | | | | 23,027 | | |
Suburban Propane Partners LP/
Suburban Energy Finance Corp.
7.375%, due 08/01/21 | | | 120,000 | | | | 128,700 | | |
| | | 278,327 | | |
Retail-specialty—0.03% | |
Rite Aid Corp.
8.000%, due 08/15/20 | | | 120,000 | | | | 124,992 | | |
Sally Holdings LLC/Sally Capital, Inc.
5.750%, due 06/01/22 | | | 120,000 | | | | 125,100 | | |
| | | 250,092 | | |
Semiconductor—0.02% | |
NXP BV/NXP Funding LLC
4.625%, due 06/15/227 | | | 200,000 | | | | 198,000 | | |
71
PACE Select Advisors Trust
PACE Strategic Fixed Income Investments
Portfolio of investments—July 31, 2015
| | | Face
amount1 | | Value | |
Corporate notes—(continued) | |
Software—0.04% | |
Infor US, Inc.
6.500%, due 05/15/227 | | | 155,000 | | | $ | 158,487 | | |
MSCI, Inc.
5.250%, due 11/15/247 | | | 120,000 | | | | 122,364 | | |
Nuance Communications, Inc.
5.375%, due 08/15/207 | | | 125,000 | | | | 126,875 | | |
| | | 407,726 | | |
Special purpose entity—1.32% | |
CC Holdings GS V LLC/
Crown Castle GS III Corp.
3.849%, due 04/15/23 | | | 3,200,000 | | | | 3,173,699 | | |
CVS Pass-Through Trust
4.704%, due 01/10/367 | | | 3,447,133 | | | | 3,652,711 | | |
Daimler Finance North
America LLC
1.010%, due 08/03/1711 | | | 3,800,000 | | | | 3,796,116 | | |
IPIC GMTN Ltd.
3.125%, due 11/15/157 | | | 1,600,000 | | | | 1,608,000 | | |
| | | 12,230,526 | | |
Steel producers/products—0.06% | |
ArcelorMittal
6.250%, due 03/01/21 | | | 190,000 | | | | 191,900 | | |
GTL Trade Finance, Inc.
7.250%, due 10/20/177 | | | 100,000 | | | | 105,800 | | |
Steel Dynamics, Inc.
6.125%, due 08/15/19 | | | 240,000 | | | | 252,000 | | |
| | | 549,700 | | |
Telecom-integrated/services—0.02% | |
Frontier Communications Corp.
7.625%, due 04/15/24 | | | 120,000 | | | | 109,200 | | |
9.000%, due 08/15/31 | | | 10,000 | | | | 9,125 | | |
Intelsat Jackson Holdings SA
7.250%, due 10/15/20 | | | 60,000 | | | | 59,475 | | |
| | | 177,800 | | |
Telecommunication services—0.05% | |
CommScope, Inc.
5.000%, due 06/15/217 | | | 130,000 | | | | 128,375 | | |
Sprint Capital Corp.
6.900%, due 05/01/19 | | | 255,000 | | | | 249,900 | | |
8.750%, due 03/15/32 | | | 125,000 | | | | 118,281 | | |
| | | 496,556 | | |
Telecommunications—0.51% | |
Embarq Corp.
7.995%, due 06/01/37 | | | 30,000 | | | | 32,784 | | |
| | | Face
amount1 | | Value | |
Corporate notes—(continued) | |
Telecommunications—(concluded) | |
Numericable Group SA
6.000%, due 05/15/227 | | | 380,000 | | | $ | 386,650 | | |
6.250%, due 05/15/247 | | | 60,000 | | | | 61,017 | | |
Qwest Corp.
6.750%, due 12/01/21 | | | 2,000,000 | | | | 2,176,080 | | |
6.875%, due 09/15/33 | | | 65,000 | | | | 63,863 | | |
Verizon Communications, Inc.
5.150%, due 09/15/23 | | | 500,000 | | | | 550,309 | | |
6.550%, due 09/15/43 | | | 1,000,000 | | | | 1,181,429 | | |
Virgin Media Secured Finance PLC
5.375%, due 04/15/217 | | | 225,000 | | | | 231,469 | | |
| | | 4,683,601 | | |
Telephone-integrated—0.06% | |
Level 3 Financing, Inc.
5.375%, due 08/15/22 | | | 250,000 | | | | 252,500 | | |
8.625%, due 07/15/20 | | | 240,000 | | | | 256,200 | | |
| | | 508,700 | | |
Theaters & entertainment—0.03% | |
Activision Blizzard, Inc.
6.125%, due 09/15/237 | | | 290,000 | | | | 312,475 | | |
Tobacco—1.40% | |
Altria Group, Inc.
5.375%, due 01/31/44 | | | 1,000,000 | | | | 1,074,362 | | |
Imperial Tobacco Finance PLC
3.500%, due 02/11/237 | | | 3,755,000 | | | | 3,656,867 | | |
Philip Morris International, Inc.
3.250%, due 11/10/24 | | | 1,900,000 | | | | 1,887,654 | | |
Reynolds American, Inc.
4.450%, due 06/12/25 | | | 2,100,000 | | | | 2,156,746 | | |
4.750%, due 11/01/42 | | | 1,000,000 | | | | 930,535 | | |
5.850%, due 08/15/45 | | | 3,010,000 | | | | 3,236,538 | | |
| | | 12,942,702 | | |
Transportation services—0.19% | |
Empresa de Transporte de Pasajeros
Metro SA
4.750%, due 02/04/247 | | | 1,500,000 | | | | 1,578,750 | | |
Transnet SOC Ltd.
4.000%, due 07/26/226 | | | 200,000 | | | | 191,200 | | |
| | | 1,769,950 | | |
Utilities—0.13% | |
Dominion Resources, Inc.
5.750%, due 10/01/544 | | | 1,000,000 | | | | 1,035,000 | | |
IPALCO Enterprises, Inc.
5.000%, due 05/01/18 | | | 120,000 | | | | 125,775 | | |
| | | 1,160,775 | | |
Wireless telecommunication services—0.05% | |
CenturyLink, Inc.
5.625%, due 04/01/20 | | | 120,000 | | | | 122,538 | | |
5.800%, due 03/15/22 | | | 25,000 | | | | 24,281 | | |
72
PACE Select Advisors Trust
PACE Strategic Fixed Income Investments
Portfolio of investments—July 31, 2015
| | | Face
amount1 | | Value | |
Corporate notes—(concluded) | |
Wireless telecommunication services—(concluded) | |
Sprint Corp.
7.125%, due 06/15/24 | | | 65,000 | | | $ | 59,475 | | |
7.250%, due 09/15/21 | | | 255,000 | | | | 243,844 | | |
Windstream Services LLC
7.750%, due 10/01/21 | | | 60,000 | | | | 50,700 | | |
| | | 500,838 | | |
Wireless telecommunications—0.42% | |
AT&T, Inc.
3.400%, due 05/15/25 | | | 1,955,000 | | | | 1,867,533 | | |
5.350%, due 09/01/40 | | | 1,155,000 | | | | 1,162,861 | | |
Crown Castle International Corp.
4.875%, due 04/15/22 | | | 160,000 | | | | 164,191 | | |
IAC/InterActiveCorp
4.875%, due 11/30/18 | | | 125,000 | | | | 129,156 | | |
T-Mobile USA, Inc.
6.125%, due 01/15/22 | | | 255,000 | | | | 266,475 | | |
6.633%, due 04/28/21 | | | 245,000 | | | | 259,382 | | |
| | | 3,849,598 | | |
Total corporate notes
(cost—$357,082,466) | | | | | 354,811,779 | | |
Loan assignment—0.51% | |
Lodging—0.51% | |
Hilton Worldwide Finance LLC,
Term Loan B2
3.500%, due 10/26/20
(cost—$4,665,217) | | | 4,704,386 | | | | 4,708,996 | | |
Non-US government obligations—7.16% | |
Bermuda Government
International Bond
4.854%, due 02/06/246 | | | 200,000 | | | | 210,000 | | |
Brazil Letras do Tesouro Nacional
12.000%, due 01/01/162 | | BRL | 20,000,000 | | | | 5,523,828 | | |
Brazilian Government
International Bond
4.875%, due 01/22/21 | | | 100,000 | | | | 103,200 | | |
5.625%, due 01/07/41 | | | 160,000 | | | | 148,000 | | |
8.250%, due 01/20/34 | | | 100,000 | | | | 119,750 | | |
Bundesrepublik Deutschland
2.500%, due 07/04/446 | | EUR | 400,000 | | | | 567,541 | | |
4.250%, due 07/04/396 | | EUR | 4,700,000 | | | | 8,365,384 | | |
4.750%, due 07/04/406 | | EUR | 300,000 | | | | 576,156 | | |
Colombia Government
International Bond
5.625%, due 02/26/44 | | | 200,000 | | | | 203,750 | | |
7.375%, due 03/18/19 | | | 100,000 | | | | 115,800 | | |
8.125%, due 05/21/24 | | | 50,000 | | | | 63,937 | | |
Costa Rica Government
International Bond
7.158%, due 03/12/456 | | | 200,000 | | | | 192,250 | | |
Croatia Government
International Bond
6.750%, due 11/05/196 | | | 200,000 | | | | 220,290 | | |
| | | Face
amount1 | | Value | |
Non-US government obligations—(continued) | |
Dominican Republic
International Bond
6.600%, due 01/28/247 | | | 200,000 | | | $ | 215,750 | | |
Ecuador Government
International Bond
7.950%, due 06/20/246 | | | 200,000 | | | | 165,250 | | |
El Salvador Government
International Bond
6.375%, due 01/18/276 | | | 174,000 | | | | 165,735 | | |
Emirate of Abu Dhabi
6.750%, due 04/08/197 | | | 1,800,000 | | | | 2,121,750 | | |
Hungary Government
International Bond
5.750%, due 11/22/23 | | | 200,000 | | | | 222,100 | | |
7.625%, due 03/29/41 | | | 200,000 | | | | 268,200 | | |
Indonesia Government
International Bond
4.125%, due 01/15/256 | | | 200,000 | | | | 197,500 | | |
4.875%, due 05/05/216 | | | 400,000 | | | | 423,000 | | |
11.625%, due 03/04/196 | | | 100,000 | | | | 130,750 | | |
Italy Buoni Poliennali Del Tesoro
2.500%, due 12/01/24 | | EUR | 435,000 | | | | 507,837 | | |
2.550%, due 09/15/416 | | EUR | 807,451 | | | | 1,109,765 | | |
Ivory Coast Government
International Bond
5.750%, due 12/31/326,13 | | | 400,000 | | | | 369,000 | | |
Kazakhstan Government
International Bond
3.875%, due 10/14/247 | | | 400,000 | | | | 370,000 | | |
Mexican Bonos,
Series M
7.750%, due 11/13/42 | | MXN | 43,050,000 | | | | 3,024,202 | | |
8.000%, due 06/11/20 | | MXN | 22,000,000 | | | | 1,520,511 | | |
10.000%, due 12/05/24 | | MXN | 12,700,000 | | | | 1,010,591 | | |
Mexico Government
International Bond
3.625%, due 03/15/22 | | | 200,000 | | | | 202,700 | | |
5.550%, due 01/21/45 | | | 330,000 | | | | 356,812 | | |
6.050%, due 01/11/40 | | | 1,300,000 | | | | 1,504,750 | | |
Mongolia Government
International Bond
5.125%, due 12/05/226 | | | 200,000 | | | | 172,000 | | |
Morocco Government
International Bond
4.250%, due 12/11/226 | | | 200,000 | | | | 203,500 | | |
New Zealand Government Bond
2.500%, due 09/20/356 | | NZD | 900,000 | | | | 638,544 | | |
4.500%, due 04/15/276 | | NZD | 2,155,000 | | | | 1,576,750 | | |
5.500%, due 04/15/236 | | NZD | 2,045,000 | | | | 1,578,152 | | |
Nigeria Government
International Bond
6.375%, due 07/12/236 | | | 200,000 | | | | 195,750 | | |
Panama Government
International Bond
6.700%, due 01/26/36 | | | 200,000 | | | | 249,500 | | |
73
PACE Select Advisors Trust
PACE Strategic Fixed Income Investments
Portfolio of investments—July 31, 2015
| | | Face
amount1 | | Value | |
Non-US government obligations—(concluded) | |
Peruvian Government
International Bond
7.350%, due 07/21/25 | | | 100,000 | | | $ | 130,625 | | |
Republic of Armenia
7.150%, due 03/26/257 | | | 200,000 | | | | 198,250 | | |
Republic of Azerbaijan
International Bond
4.750%, due 03/18/246 | | | 200,000 | | | | 197,184 | | |
Republic of Korea
7.125%, due 04/16/19 | | | 400,000 | | | | 474,420 | | |
Republic of Serbia
5.250%, due 11/21/176 | | | 250,000 | | | | 258,987 | | |
Romanian Government
International Bond
4.875%, due 01/22/246 | | | 200,000 | | | | 214,500 | | |
Russian Foreign Bond
5.000%, due 04/29/206 | | | 500,000 | | | | 510,000 | | |
Senegal Government
International Bond
6.250%, due 07/30/246 | | | 200,000 | | | | 192,800 | | |
Slovenia Government
International Bond
4.125%, due 02/18/196 | | | 200,000 | | | | 210,750 | | |
5.250%, due 02/18/246 | | | 200,000 | | | | 220,400 | | |
5.500%, due 10/26/226 | | | 3,400,000 | | | | 3,811,527 | | |
5.850%, due 05/10/236 | | | 4,100,000 | | | | 4,686,710 | | |
South Africa Government Bond
6.500%, due 02/28/41 | | ZAR | 42,630,000 | | | | 2,584,035 | | |
South Africa Government
International Bond
6.875%, due 05/27/19 | | | 200,000 | | | | 228,100 | | |
Spain Government Bond
2.150%, due 10/31/256,7 | | EUR | 4,400,000 | | | | 4,925,440 | | |
3.800%, due 04/30/246,7 | | EUR | 5,800,000 | | | | 7,410,369 | | |
5.150%, due 10/31/446 | | EUR | 1,015,000 | | | | 1,600,677 | | |
Sri Lanka Government
International Bond
6.250%, due 10/04/206 | | | 200,000 | | | | 206,000 | | |
State of Qatar
5.250%, due 01/20/207 | | | 1,700,000 | | | | 1,921,000 | | |
6.400%, due 01/20/407 | | | 200,000 | | | | 259,250 | | |
Turkey Government
International Bond
5.125%, due 03/25/22 | | | 250,000 | | | | 260,375 | | |
7.375%, due 02/05/25 | | | 95,000 | | | | 113,050 | | |
7.500%, due 07/14/17 | | | 200,000 | | | | 220,000 | | |
7.500%, due 11/07/19 | | | 100,000 | | | | 114,830 | | |
Vietnam Government
International Bond
6.750%, due 01/29/206 | | | 100,000 | | | | 111,000 | | |
Total non-US government obligations
(cost—$67,278,189) | | | | | 65,970,564 | | |
| | | Face
amount1 | | Value | |
Municipal bonds and notes—1.29% | |
Education—0.09% | |
New York City Transitional
Finance Authority Building
Aid Revenue Fiscal 2008,
Series S-1
5.000%, due 01/15/25 | | | 100,000 | | | $ | 109,631 | | |
Will County Community
High School District
No. 210 Lincoln-Way
(Capital Appreciation)
(AGM Insured)
0.000%, due 01/01/212 | | | 780,000 | | | | 707,468 | | |
| | | 817,099 | | |
General obligation—0.17% | |
California State (Build
America Bonds)
7.500%, due 04/01/34 | | | 1,100,000 | | | | 1,562,770 | | |
Transportation—0.65% | |
Bay Area Toll Authority Toll Bridge
Revenue (Build America Bonds)
6.263%, due 04/01/49 | | | 1,200,000 | | | | 1,594,176 | | |
Harris County Metropolitan
Transportation Authority
(Build America Bonds), Series C
6.875%, due 11/01/38 | | | 3,100,000 | | | | 3,564,442 | | |
Port Authority of New York &
New Jersey Consolidated
(One Hundred Fifty-Eight)
5.859%, due 12/01/24 | | | 700,000 | | | | 849,751 | | |
| | | 6,008,369 | | |
Utilities—0.38% | |
Cincinnati Water System Revenue
(Build America Bonds), Series B
6.458%, due 12/01/34 | | | 100,000 | | | | 114,488 | | |
Metropolitan Water District
Southern California
(Build America Bonds)
5.906%, due 07/01/25 | | | 1,700,000 | | | | 1,924,230 | | |
Tennessee Valley Authority
4.625%, due 09/15/60 | | | 1,300,000 | | | | 1,432,684 | | |
| | | 3,471,402 | | |
Total municipal bonds and notes
(cost—$10,118,090) | | | | | 11,859,640 | | |
| | Number of
shares | | | |
Preferred stock14—0.83% | |
Banks—0.83% | |
Wells Fargo & Co.
(cost—$3,810,820) | | | 6,400 | | | | 7,629,504 | | |
74
PACE Select Advisors Trust
PACE Strategic Fixed Income Investments
Portfolio of investments—July 31, 2015
| | | Face
amount1 | | Value | |
Time deposits—5.24% | |
Credit Suisse NY
0.000%, due 08/24/15 | | | 10,500,000 | | | $ | 10,501,393 | | |
ENI Finance USA, Inc.
1.280%, due 06/02/167 | | | 1,900,000 | | | | 1,879,328 | | |
Entergy Corp.
0.950%, due 08/27/157 | | | 3,700,000 | | | | 3,697,461 | | |
0.950%, due 09/04/157 | | | 3,200,000 | | | | 3,197,129 | | |
0.950%, due 10/23/157 | | | 1,500,000 | | | | 1,496,715 | | |
Ford Motor Credit Co.
0.850%, due 10/27/157 | | | 3,700,000 | | | | 3,692,400 | | |
Nationwide Building Society
0.430%, due 08/27/157 | | | 1,900,000 | | | | 1,899,410 | | |
Southwestern Energy Co.
0.970%, due 09/01/157 | | | 3,700,000 | | | | 3,696,909 | | |
Thermo Fisher Scientific, Inc.
0.940%, due 08/24/157 | | | 3,700,000 | | | | 3,697,778 | | |
1.040%, due 09/14/157 | | | 3,700,000 | | | | 3,695,297 | | |
Williams Partners LP
0.520%, due 08/27/15 | | | 3,700,000 | | | | 3,698,610 | | |
WPP CP LLC
0.530%, due 08/24/15 | | | 2,300,000 | | | | 2,299,221 | | |
0.540%, due 09/01/15 | | | 1,100,000 | | | | 1,099,489 | | |
0.540%, due 09/03/15 | | | 3,700,000 | | | | 3,698,168 | | |
Total time deposits
(cost—$48,249,308) | | | | | 48,249,308 | | |
Short-term US government obligations15—0.05% | |
United States Treasury Bills
0.012%, due 10/01/153 | | | 50,000 | | | | 50,000 | | |
0.012%, due 10/08/153 | | | 272,000 | | | | 271,974 | | |
0.104%, due 01/07/163 | | | 169,000 | | | | 168,922 | | |
Total short-term
US government obligations
(cost—$490,917) | | | | | 490,896 | | |
| | Number of
shares | | | |
Investment companies—0.76% | |
iShares iBoxx $ High Yield
Corporate Bond ETF | | | 29,000 | | | | 2,551,130 | | |
SPDR Barclays Short Term High
Yield Bond ETF | | | 156,200 | | | | 4,439,204 | | |
Total investment companies
(cost—$7,220,983) | | | | | 6,990,334 | | |
| | | Face
amount | | Value | |
Repurchase agreement—0.95% | |
Repurchase agreement dated
07/31/15 with State Street Bank
and Trust Co., 0.000% due
08/03/15, collateralized by
$2,527,660 Federal Home Loan
Mortgage Corp. obligations,
2.080% due 10/17/22,
$634,316 Federal National
Mortgage Association obligations,
2.170% due 10/17/22 and
$5,655,931 US Treasury Notes,
1.625% to 3.625% due
03/31/19 to 06/30/20;
(value—$8,965,946);
proceeds: $8,790,000
(cost—$8,790,000) | | $ | 8,790,000 | | | $ | 8,790,000 | | |
| | | Notional
amount | | | |
Swaptions purchased—0.06% | |
Call swaptions purchased10—0.03% | |
3 Month USD LIBOR Interest Rate
Swap, strike @ 0.800%, expires
01/19/16 (Counterparty: MSCI;
pay floating rate); underlying
swap terminates 01/21/17 | | USD | 23,600,000 | | | | 26,149 | | |
3 Month USD LIBOR Interest Rate
Swap, strike @ 1.100%, expires
01/29/16 (Counterparty: BOA;
pay floating rate); underlying
swap terminates 02/02/18 | | USD | 34,000,000 | | | | 82,484 | | |
3 Month USD LIBOR Interest Rate
Swap, strike @ 1.500%, expires
01/29/16 (Counterparty: MSCI;
pay floating rate); underlying
swap terminates 02/02/21 | | USD | 4,000,000 | | | | 14,404 | | |
3 Month USD LIBOR Interest Rate
Swap, strike @ 1.750%, expires
01/29/16 (Counterparty: MSCI;
pay floating rate); underlying
swap terminates 02/02/26 | | USD | 4,000,000 | | | | 12,392 | | |
3 Month USD LIBOR Interest Rate
Swap, strike @ 2.100%, expires
01/30/18 (Counterparty: JPMCB;
pay floating rate); underlying
swap terminates 02/01/20 | | USD | 7,900,000 | | | | 77,167 | | |
Total call swaptions purchased | | | | | 212,596 | | |
75
PACE Select Advisors Trust
PACE Strategic Fixed Income Investments
Portfolio of investments—July 31, 2015
| | | Notional
amount | | Value | |
Swaptions purchased—(concluded) | |
Put swaptions purchased11—0.03% | |
3 Month USD LIBOR Interest Rate
Swap, strike @ 2.580%, expires
05/12/16 (Counterparty: MSCI;
receive fixed rate); underlying
swap terminates 05/16/26 | | USD | 3,700,000 | | | $ | 87,404 | | |
3 Month USD LIBOR Interest Rate
Swap, strike @ 2.580%, expires
05/23/16 (Counterparty: MSCI;
receive fixed rate); underlying
swap terminates 05/25/26 | | USD | 8,700,000 | | | | 212,040 | | |
Total put swaptions purchased | | | | | 299,444 | | |
Total swaptions purchased
(cost—$742,064) | | | | | 512,040 | | |
| | | Number of
shares | | Value | |
Investment of cash collateral from securities loaned—1.57% | |
Money market fund—1.57% | |
UBS Private Money Market
Fund LLC16
(cost—$14,444,243) | | | 14,444,243 | | | $ | 14,444,243 | | |
Total investments
(cost—$1,045,421,656)—113.39% | | | 1,044,707,288 | | |
Liabilities in excess of
other assets—(13.39)% | | | | | (123,339,799 | ) | |
Net assets—100.00% | | | | $ | 921,367,489 | | |
For a listing of defined portfolio acronyms, counterparty acronyms and currency type abbreviation that are used throughout the Portfolio of investments as well as the tables that follow, please refer to page 254.
Aggregate cost for federal income tax purposes was $1,051,418,721; and net unrealized depreciation consisted of:
Gross unrealized appreciation | | $ | 25,710,716 | | |
Gross unrealized depreciation | | | (32,422,149 | ) | |
Net unrealized depreciation | | $ | (6,711,433 | ) | |
Written options
Number of
contracts | | Put options written | | Expiration
date | | Premiums
received | | Current
value | | Unrealized
appreciation | |
| | 45 | | | US Treasury Note 10 Year Futures, strike @ $126.00 | | 08/21/15 | | $ | 14,009 | | | $ | (7,735 | ) | | $ | 6,274 | | |
| | 45 | | | US Treasury Note 10 Year Futures, strike @ $126.50 | | 08/21/15 | | | 18,578 | | | | (12,656 | ) | | | 5,922 | | |
| | | | | | $ | 32,587 | | | $ | (20,391 | ) | | $ | 12,196 | | |
Written options activity for the year ended July 31, 2015 was as follows:
| | | Number of
Contracts | | Premiums
received | |
Options outstanding at July 31, 2014 | | | 125 | | | $ | 13,130 | | |
Options written | | | 3,273 | | | | 1,086,243 | | |
Options exercised | | | (968 | ) | | | (318,311 | ) | |
Options terminated in closing purchase transactions | | | (453 | ) | | | (125,858 | ) | |
Options expired prior to exercise | | | (1,887 | ) | | | (622,617 | ) | |
Options outstanding at July 31, 2015 | | | 90 | | | $ | 32,587 | | |
76
PACE Select Advisors Trust
PACE Strategic Fixed Income Investments
Portfolio of investments—July 31, 2015
Written swaptions and foreign exchange written options10
Notional
amount
(000) | | Call swaptions written | | Counterparty | | Pay/
receive
floating
rate | | Expiration
date | | Premiums
received | | Current
value | | Unrealized
appreciation
(depreciation) | |
USD | 15,700 | | | 3 Month USD LIBOR Interest
Rate Swap strike @ 0.500%,
terminating 01/21/17 | | MSCI | | Receive | | 01/19/16 | | $ | 9,420 | | | $ | (3,297 | ) | | $ | 6,123 | | |
USD | 7,900 | | | 3 Month USD LIBOR Interest
Rate Swap strike @ 0.520%,
terminating 01/21/17 | | MSCI | | Receive | | 01/19/16 | | | 4,740 | | | | (1,912 | ) | | | 2,828 | | |
USD | 15,700 | | | 3 Month USD LIBOR Interest
Rate Swap strike @ 0.650%,
terminating 01/21/17 | | MSCI | | Receive | | 01/19/16 | | | 17,270 | | | | (8,462 | ) | | | 8,808 | | |
USD | 7,900 | | | 3 Month USD LIBOR Interest
Rate Swap strike @ 0.660%,
terminating 01/21/17 | | MSCI | | Receive | | 01/19/16 | | | 7,900 | | | | (4,495 | ) | | | 3,405 | | |
USD | 34,000 | | | 3 Month USD LIBOR Interest
Rate Swap strike @ 0.730%,
terminating 02/02/18 | | BOA | | Receive | | 01/29/16 | | | 48,460 | | | | (16,796 | ) | | | 31,664 | | |
USD | 34,000 | | | 3 Month USD LIBOR Interest
Rate Swap strike @ 0.915%,
terminating 02/02/18 | | BOA | | Receive | | 01/29/16 | | | 83,320 | | | | (41,072 | ) | | | 42,248 | | |
USD | 4,000 | | | 3 Month USD LIBOR Interest
Rate Swap strike @ 1.100%,
terminating 02/02/21 | | MSCI | | Receive | | 01/29/16 | | | 15,200 | | | | (3,540 | ) | | | 11,660 | | |
USD | 7,900 | | | 3 Month USD LIBOR Interest
Rate Swap strike @ 1.100%,
terminating 02/01/20 | | JPMCB | | Receive | | 01/30/18 | | | 41,080 | | | | (24,000 | ) | | | 17,080 | | |
USD | 4,000 | | | 3 Month USD LIBOR Interest
Rate Swap strike @ 1.300%,
terminating 02/02/21 | | MSCI | | Receive | | 01/29/16 | | | 23,200 | | | | (7,456 | ) | | | 15,744 | | |
USD | 7,900 | | | 3 Month USD LIBOR Interest
Rate Swap strike @ 1.600%,
terminating 02/01/20 | | JPMCB | | Receive | | 01/30/18 | | | 71,495 | | | | (45,749 | ) | | | 25,746 | | |
USD | 8,900 | | | 3 Month USD LIBOR Interest
Rate Swap strike @ 2.350%,
terminating 08/05/25 | | MSCI | | Receive | | 08/03/15 | | | 49,840 | | | | (46,812 | ) | | | 3,028 | | |
| | | | | | | | | | | | | $ | 371,925 | | | $ | (203,591 | ) | | $ | 168,334 | | |
| | | Call options written | | | | | | | | | | | | | |
USD | 100 | | | USD Call/BRL Put, strike @ BRL 3.53 | | JPMCB | | | | 08/24/15 | | $ | 683 | | | $ | (997 | ) | | $ | (314 | ) | |
USD | 1,000 | | | USD Call/BRL Put, strike @ BRL 3.55 | | CITI | | | | 09/01/15 | | | 8,260 | | | | (11,681 | ) | | | (3,421 | ) | |
USD | 2,100 | | | USD Call/BRL Put, strike @ BRL 3.58 | | JPMCB | | | | 09/09/15 | | | 19,832 | | | | (26,214 | ) | | | (6,382 | ) | |
USD | 1,900 | | | USD Call/BRL Put, strike @ BRL 3.60 | | DB | | | | 08/26/15 | | | 8,208 | | | | (12,189 | ) | | | (3,981 | ) | |
| | | | | | | | | | | | | $ | 36,983 | | | $ | (51,081 | ) | | $ | (14,098 | ) | |
| | | Put swaptions written | | | | | | | | | | | | | |
USD | 35,500 | | | 3 Month USD LIBOR Interest
Rate Swap strike @ 2.500%,
terminating 05/16/19 | | MSCI | | Pay | | 05/12/16 | | $ | 119,579 | | | $ | (73,687 | ) | | $ | 45,892 | | |
USD | 82,600 | | | 3 Month USD LIBOR Interest
Rate Swap strike @ 2.500%,
terminating 05/25/19 | | MSCI | | Pay | | 05/23/16 | | | 258,113 | | | | (180,151 | ) | | | 77,962 | | |
USD | 8,900 | | | 3 Month USD LIBOR Interest
Rate Swap strike @ 2.750%,
terminating 08/05/25 | | MSCI | | Pay | | 08/03/15 | | | 21,360 | | | | (1 | ) | | | 21,359 | | |
| | | | | | | | | | | | | $ | 399,052 | | | $ | (253,839 | ) | | $ | 145,213 | | |
77
PACE Select Advisors Trust
PACE Strategic Fixed Income Investments
Portfolio of investments—July 31, 2015
Written swaptions and foreign exchange written options10—(concluded)
Notional
amount
(000) | | Put options written | | Counterparty | |
| | Expiration
date | | Premiums
received | | Current
value | | Unrealized
appreciation | |
EUR | 800 | | | EUR Put/USD Call, | | | | | | | | | | | | | | | |
| | | | | strike @ USD 1.06 | | CITI | | | | | | 09/04/15 | | $ | 7,322 | | | $ | (2,821 | ) | | $ | 4,501 | | |
EUR | 1,500 | | | EUR Put/USD Call, | | | | | | | | | | | | | | | |
| | | | | strike @ USD 1.07 | | WBC | | | | | | 08/06/15 | | | 9,990 | | | | (476 | ) | | | 9,514 | | |
EUR | 400 | | | EUR Put/USD Call, | | | | | | | | | | | | | | | |
| | | | | strike @ USD 1.07 | | HSBC | | | | | | 09/04/15 | | | 3,697 | | | | (1,361 | ) | | | 2,336 | | |
EUR | 800 | | | EUR Put/USD Call, | | | | | | | | | | | | | | | |
| | | | | strike @ USD 1.07 | | DB | | | | | | 09/04/15 | | | 6,535 | | | | (3,318 | ) | | | 3,217 | | |
EUR | 1,300 | | | EUR Put/USD Call, | | | | | | | | | | | | | | | |
| | | | | strike @ USD 1.09 | | BNP | | | | | | 08/06/15 | | | 12,391 | | | | (3,919 | ) | | | 8,472 | | |
USD | 2,100 | | | USD Put/BRL Call, | | | | | | | | | | | | | | | |
| | | | | strike @ BRL 3.26 | | JPMCB | | | | | | 09/09/15 | | | 20,456 | | | | (8,205 | ) | | | 12,251 | | |
USD | 100 | | | USD Put/BRL Call, | | | | | | | | | | | | | | | |
| | | | | strike @ BRL 3.27 | | JPMCB | | | | | | 08/24/15 | | | 855 | | | | (258 | ) | | | 597 | | |
USD | 1,000 | | | USD Put/BRL Call, | | | | | | | | | | | | | | | |
| | | | | strike @ BRL 3.27 | | CITI | | | | | | 09/01/15 | | | 7,850 | | | | (3,417 | ) | | | 4,433 | | |
USD | 1,900 | | | USD Put/BRL Call, | | | | | | | | | | | | | | | |
| | | | | strike @ BRL 3.30 | | DB | | | | | | 08/26/15 | | | 20,178 | | | | (8,181 | ) | | | 11,997 | | |
USD | 1,200 | | | USD Put/JPY Call, | | | | | | | | | | | | | | | |
| | | | | strike @ JPY 117.95 | | JPMCB | | | | | | 08/11/15 | | | 5,460 | | | | (5 | ) | | | 5,455 | | |
USD | 900 | | | USD Put/JPY Call,
strike @ JPY 118.15 | | CITI | | | | | | 08/06/15 | | | 4,140 | | | | 0 | | | | 4,140 | | |
USD | 1,100 | | | USD Put/JPY Call,
strike @ JPY 118.15 | | CITI | | | | | | 08/07/15 | | | 5,500 | | | | (1 | ) | | | 5,499 | | |
USD | 1,600 | | | USD Put/JPY Call,
strike @ JPY 119.45 | | WBC | | | | | | 08/12/15 | | | 6,096 | | | | (85 | ) | | | 6,011 | | |
| | | | | | | | | | | | | | | $ | 110,470 | | | $ | (32,047 | ) | | $ | 78,423 | | |
| | | | | | | | | | | | | | | $ | 918,430 | | | $ | (540,558 | ) | | $ | 377,872 | | |
Swaptions and foreign exchange written options activity for the year ended July 31, 2015 was as follows:
| | | Premiums
received | |
Swaptions and foreign exchange options outstanding at July 31, 2014 | | $ | 281,285 | | |
Swaptions and foreign exchange options written | | | 2,158,914 | | |
Swaptions and foreign exchange options exercised | | | (265,193 | ) | |
Swaptions and foreign exchange options terminated in closing purchase transactions | | | (413,120 | ) | |
Swaptions and foreign exchange options expired prior to exercise | | | (843,456 | ) | |
Swaptions and foreign exchange options outstanding at July 31, 2015 | | $ | 918,430 | | |
Futures contracts
Number of
contracts | | Currency | | | | Expiration
date | | Cost | | Current
value | | Unrealized
appreciation | |
US Treasury futures buy contracts: | | | |
| | 58 | | | USD | | US Long Bond Futures | | September 2015 | | $ | 8,722,086 | | | $ | 9,044,375 | | | $ | 322,289 | | |
| | 358 | | | USD | | US Treasury Note 10 Year Futures | | September 2015 | | | 45,242,200 | | | | 45,622,625 | | | | 380,425 | | |
| | 27 | | | USD | | US Treasury Note 5 Year Futures | | September 2015 | | | 3,223,994 | | | | 3,235,781 | | | | 11,787 | | |
| | | | | | | | | | | $ | 57,188,280 | | | $ | 57,902,781 | | | $ | 714,501 | | |
78
PACE Select Advisors Trust
PACE Strategic Fixed Income Investments
Portfolio of investments—July 31, 2015
Futures contracts—(concluded)
Number of
contracts | | Currency | | | | Expiration
date | | Cost | | Current
value | | Unrealized
appreciation
(depreciation) | |
Interest rate futures buy contracts: | | | |
| | 3 | | | AUD | | Australian Bond 10 Year Futures | | September 2015 | | $ | 272,917 | | | $ | 280,230 | | | $ | 7,313 | | |
| | 243 | | | EUR | | German Euro Schatz Futures | | September 2015 | | | 29,704,687 | | | | 29,701,841 | | | | (2,846 | ) | |
| | 169 | | | EUR | | Italian Government Bond Futures | | September 2015 | | | 24,678,772 | | | | 25,372,115 | | | | 693,343 | | |
| | 13 | | | GBP | | United Kingdom Long Gilt Bond Futures | | September 2015 | | | 2,332,963 | | | | 2,381,361 | | | | 48,398 | | |
| | 47 | | | JPY | | 3 Month EURIBOR Futures | | December 2015 | | | 9,467,067 | | | | 9,465,133 | | | | (1,934 | ) | |
| | 42 | | | NZD | | New Zealand Futures | | December 2015 | | | 27,482,284 | | | | 27,534,101 | | | | 51,817 | | |
| | 14 | | | NZD | | New Zealand Futures | | December 2016 | | | 9,176,719 | | | | 9,175,787 | | | | (932 | ) | |
| | 148 | | | USD | | 90-Day Eurodollar Futures | | September 2015 | | | 36,865,921 | | | | 36,864,950 | | | | (971 | ) | |
| | 53 | | | USD | | 90-Day Eurodollar Futures | | March 2016 | | | 13,165,842 | | | | 13,157,913 | | | | (7,929 | ) | |
| | 1 | | | USD | | New Zealand Dollar Futures | | September 2015 | | | 70,744 | | | | 65,620 | | | | (5,124 | ) | |
| | 23 | | | USD | | South African Rand Future | | September 2015 | | | 917,793 | | | | 899,875 | | | | (17,918 | ) | |
| | | | | | | | | | | $ | 154,135,709 | | | $ | 154,898,926 | | | $ | 763,217 | | |
Number of
contracts | | Currency | | | | Expiration
date | | Proceeds | | Current
value | | Unrealized
appreciation
(depreciation) | |
US Treasury futures sell contracts: | | | |
| | 101 | | | USD | | US Long Bond Futures | | September 2015 | | $ | 15,091,300 | | | $ | 15,749,688 | | | $ | (658,388 | ) | |
| | 164 | | | USD | | US Treasury Note 10 Year Futures | | September 2015 | | | 20,678,016 | | | | 20,899,750 | | | | (221,734 | ) | |
| | 5 | | | USD | | US Treasury Note 2 Year Futures | | September 2015 | | | 1,093,067 | | | | 1,095,312 | | | | (2,245 | ) | |
| | 54 | | | USD | | US Treasury Note 5 Year Futures | | September 2015 | | | 6,432,558 | | | | 6,471,562 | | | | (39,004 | ) | |
| | 48 | | | USD | | US Ultra Long Treasury Bond Futures | | September 2015 | | | 7,467,883 | | | | 7,657,500 | | | | (189,617 | ) | |
| | | | | | | | | | | $ | 50,762,824 | | | $ | 51,873,812 | | | $ | (1,110,988 | ) | |
Interest rate futures sell contracts: | | | |
| | 37 | | | EUR | | Euro—Bund Futures | | August 2015 | | $ | 20,953 | | | $ | 25,600 | | | $ | (4,647 | ) | |
| | 37 | | | EUR | | Euro—Bund Futures | | August 2015 | | | 13,221 | | | | 16,254 | | | | (3,033 | ) | |
| | 117 | | | EUR | | German Euro Bund Futures | | September 2015 | | | 19,698,434 | | | | 19,839,677 | | | | (141,243 | ) | |
| | 8 | | | EUR | | German Euro Buxl 30 Year Futures | | September 2015 | | | 1,396,425 | | | | 1,370,617 | | | | 25,808 | | |
| | 26 | | | EUR | | Mid-Term Euro-OAT Futures | | September 2015 | | | 4,228,135 | | | | 4,274,611 | | | | (46,476 | ) | |
| | 729 | | | GBP | | 90-Day Sterling Pound Futures | | March 2017 | | | 140,299,394 | | | | 140,270,466 | | | | 28,928 | | |
| | 108 | | | GBP | | 90-Day Sterling Pound Futures | | June 2017 | | | 20,750,726 | | | | 20,753,403 | | | | (2,677 | ) | |
| | 41 | | | JPY | | JGB MINI 10 Year Futures | | September 2015 | | | 4,862,299 | | | | 4,881,559 | | | | (19,260 | ) | |
| | 184 | | | USD | | 90-Day Eurodollar Futures | | September 2016 | | | 45,398,977 | | | | 45,498,600 | | | | (99,623 | ) | |
| | 815 | | | USD | | 90-Day Eurodollar Futures | | December 2016 | | | 200,657,286 | | | | 201,121,625 | | | | (464,339 | ) | |
| | 62 | | | USD | | 90-Day Eurodollar Futures | | March 2017 | | | 15,253,175 | | | | 15,274,475 | | | | (21,300 | ) | |
| | 237 | | | USD | | 90-Day Eurodollar Futures | | September 2017 | | | 58,072,210 | | | | 58,204,238 | | | | (132,028 | ) | |
| | 113 | | | USD | | 90-Day Eurodollar Futures | | March 2018 | | | 27,627,565 | | | | 27,680,763 | | | | (53,198 | ) | |
| | 12 | | | USD | | British Pound Future | | September 2015 | | | 1,139,351 | | | | 1,170,750 | | | | (31,399 | ) | |
| | 39 | | | USD | | Euro Fx Future with American Style Options | | September 2015 | | | 5,347,190 | | | | 5,348,362 | | | | (1,172 | ) | |
| | | | | | | | | | | $ | 544,765,341 | | | $ | 545,731,000 | | | $ | (965,659 | ) | |
| | | | | | | | | | | | | | | | | | | | | $ | (598,929 | ) | |
79
PACE Select Advisors Trust
PACE Strategic Fixed Income Investments
Portfolio of investments—July 31, 2015
Forward foreign currency contracts
| Counterparty | | Contracts to
deliver | | In
exchange for | | Maturity
date | | Unrealized
appreciation
(depreciation) | |
BNP | | BRL | 2,424,610 | | | USD | 772,415 | | | 08/04/15 | | $ | 64,282 | | |
BNP | | JPY | 1,960,800,000 | | | USD | 15,825,666 | | | 08/04/15 | | | 4,469 | | |
BNP | | USD | 714,381 | | | BRL | 2,424,610 | | | 08/04/15 | | | (6,249 | ) | |
BNP | | USD | 309,089 | | | MXN | 4,902,000 | | | 09/30/15 | | | (6,165 | ) | |
BOA | | EUR | 7,932,000 | | | USD | 8,641,882 | | | 08/04/15 | | | (69,441 | ) | |
BOA | | JPY | 1,057,200,000 | | | USD | 8,575,037 | | | 08/04/15 | | | 44,759 | | |
BOA | | USD | 2,311,559 | | | INR | 148,887,500 | | | 10/20/15 | | | (23,295 | ) | |
CITI | | EUR | 10,596,000 | | | USD | 11,779,628 | | | 08/04/15 | | | 142,565 | | |
CITI | | EUR | 3,597,000 | | | USD | 3,920,398 | | | 08/04/15 | | | (30,009 | ) | |
CITI | | EUR | 57,288,000 | | | USD | 63,249,481 | | | 09/02/15 | | | 310,416 | | |
CITI | | USD | 79,534,274 | | | EUR | 71,943,000 | | | 08/04/15 | | | (522,832 | ) | |
CITI | | USD | 3,074,496 | | | EUR | 2,803,000 | | | 09/02/15 | | | 5,001 | | |
CITI | | USD | 1,342,924 | | | INR | 87,061,764 | | | 08/24/15 | | | 9,772 | | |
CSI | | MXN | 15,795,440 | | | USD | 997,439 | | | 09/30/15 | | | 21,342 | | |
DB | | EUR | 4,304,000 | | | USD | 4,801,421 | | | 08/04/15 | | | 74,551 | | |
DB | | GBP | 2,141,000 | | | USD | 3,332,004 | | | 08/04/15 | | | (11,490 | ) | |
DB | | JPY | 1,162,100,000 | | | USD | 9,432,838 | | | 08/04/15 | | | 56,149 | | |
DB | | MXN | 4,727,850 | | | USD | 300,000 | | | 09/30/15 | | | 7,837 | | |
DB | | USD | 1,100,000 | | | CNY | 6,523,000 | | | 04/07/16 | | | (67,422 | ) | |
DB | | USD | 406,000 | | | MXN | 6,666,276 | | | 09/30/15 | | | 5,950 | | |
GSCM | | BRL | 2,424,610 | | | USD | 714,381 | | | 08/04/15 | | | 6,249 | | |
GSCM | | BRL | 2,424,610 | | | USD | 742,993 | | | 09/02/15 | | | 42,488 | | |
GSCM | | CHF | 138,000 | | | USD | 147,883 | | | 08/12/15 | | | 5,035 | | |
GSCM | | EUR | 37,713,000 | | | USD | 41,889,794 | | | 08/04/15 | | | 471,469 | | |
GSCM | | JPY | 649,500,000 | | | USD | 5,354,150 | | | 08/04/15 | | | 113,500 | | |
GSCM | | MXN | 10,522,485 | | | USD | 675,000 | | | 09/30/15 | | | 24,751 | | |
GSCM | | USD | 750,769 | | | BRL | 2,424,610 | | | 08/04/15 | | | (42,637 | ) | |
GSCM | | USD | 5,837,954 | | | EUR | 5,276,000 | | | 08/04/15 | | | (43,584 | ) | |
GSCM | | USD | 3,373,210 | | | INR | 218,988,799 | | | 08/24/15 | | | 29,264 | | |
HSBC | | GBP | 5,566,000 | | | USD | 8,679,620 | | | 09/02/15 | | | (10,705 | ) | |
HSBC | | MXN | 24,453,246 | | | USD | 1,572,000 | | | 09/30/15 | | | 60,884 | | |
HSBC | | USD | 8,681,390 | | | GBP | 5,566,000 | | | 08/04/15 | | | 10,758 | | |
HSBC | | USD | 293,418 | | | KRW | 333,601,200 | | | 10/20/15 | | | (8,933 | ) | |
JPMCB | | BRL | 2,275,823 | | | USD | 661,000 | | | 09/02/15 | | | 3,481 | | |
JPMCB | | BRL | 20,000,000 | | | USD | 5,906,762 | | | 01/05/16 | | | 354,033 | | |
JPMCB | | CAD | 521,000 | | | USD | 415,942 | | | 08/04/15 | | | 17,579 | | |
JPMCB | | CNY | 41,302,100 | | | USD | 6,423,344 | | | 04/07/16 | | | (114,695 | ) | |
JPMCB | | EUR | 14,683,000 | | | USD | 16,310,454 | | | 08/04/15 | | | 184,841 | | |
JPMCB | | EUR | 3,927,000 | | | USD | 4,301,844 | | | 08/04/15 | | | (10,987 | ) | |
JPMCB | | GBP | 3,425,000 | | | USD | 5,358,611 | | | 08/04/15 | | | 9,957 | | |
JPMCB | | JPY | 4,566,300,000 | | | USD | 36,948,988 | | | 09/02/15 | | | 94,810 | | |
JPMCB | | JPY | 83,800,000 | | | USD | 674,358 | | | 09/02/15 | | | (1,984 | ) | |
JPMCB | | KRW | 2,772,349,344 | | | USD | 2,489,091 | | | 09/11/15 | | | 122,648 | | |
JPMCB | | MXN | 9,684,576 | | | USD | 594,000 | | | 09/30/15 | | | (4,469 | ) | |
JPMCB | | USD | 5,860,000 | | | CNY | 34,779,100 | | | 04/07/16 | | | (354,539 | ) | |
JPMCB | | USD | 6,106,947 | | | EUR | 5,533,000 | | | 08/04/15 | | | (30,327 | ) | |
80
PACE Select Advisors Trust
PACE Strategic Fixed Income Investments
Portfolio of investments—July 31, 2015
Forward foreign currency contracts—(concluded)
Counterparty | | Contracts to
deliver | | In
exchange for | | Maturity
date | | Unrealized
appreciation
(depreciation) | |
JPMCB | | USD | 39,105,819 | | | JPY | 4,829,600,000 | | | 08/04/15 | | $ | (137,005 | ) | |
JPMCB | | USD | 4,299,987 | | | JPY | 531,200,000 | | | 09/02/15 | | | (12,722 | ) | |
JPMCB | | USD | 863,000 | | | KRW | 1,011,365,972 | | | 08/24/15 | | | 750 | | |
JPMCB | | USD | 928,000 | | | KRW | 1,085,760,000 | | | 09/11/15 | | | (1,209 | ) | |
RBC | | EUR | 9,224,636 | | | USD | 10,385,490 | | | 09/18/15 | | | 248,571 | | |
RBC | | GBP | 387,391 | | | USD | 609,343 | | | 09/18/15 | | | 4,565 | | |
RBC | | MXN | 23,804,333 | | | USD | 1,535,625 | | | 09/18/15 | | | 63,221 | | |
RBC | | MXN | 9,550,327 | | | USD | 586,083 | | | 09/18/15 | | | (4,647 | ) | |
RBC | | NZD | 6,031,792 | | | USD | 4,144,409 | | | 09/18/15 | | | 177,360 | | |
RBC | | USD | 56,893 | | | AUD | 74,483 | | | 09/18/15 | | | (2,579 | ) | |
RBC | | USD | 6,293,827 | | | EUR | 5,643,738 | | | 09/18/15 | | | (91,944 | ) | |
RBC | | USD | 980,765 | | | GBP | 630,660 | | | 09/18/15 | | | 3,794 | | |
RBC | | ZAR | 34,051,411 | | | USD | 2,697,889 | | | 09/18/15 | | | 27,350 | | |
SG | | EUR | 1,542,313 | | | USD | 1,713,512 | | | 09/18/15 | | | 18,670 | | |
SG | | USD | 1,302,665 | | | EUR | 1,177,398 | | | 09/18/15 | | | (8,826 | ) | |
SG | | USD | 114,085 | | | EUR | 103,879 | | | 09/18/15 | | | 67 | | |
SG | | USD | 107,590 | | | ZAR | 1,337,993 | | | 09/18/15 | | | (2,656 | ) | |
SSC | | EUR | 414,726 | | | USD | 463,834 | | | 09/18/15 | | | 8,094 | | |
SSC | | GBP | 121,499 | | | USD | 186,653 | | | 09/18/15 | | | (3,026 | ) | |
SSC | | MXN | 1,450,216 | | | USD | 93,280 | | | 09/18/15 | | | 3,578 | | |
SSC | | USD | 497,396 | | | EUR | 440,079 | | | 09/18/15 | | | (13,795 | ) | |
SSC | | USD | 123,944 | | | EUR | 112,995 | | | 09/18/15 | | | 226 | | |
SSC | | USD | 140,211 | | | GBP | 89,456 | | | 09/18/15 | | | (556 | ) | |
SSC | | USD | 106,356 | | | ZAR | 1,342,954 | | | 09/18/15 | | | (1,032 | ) | |
SSC | | ZAR | 2,142,398 | | | USD | 173,768 | | | 09/18/15 | | | 5,746 | | |
| | | | | | | | $ | 1,221,072 | | |
Credit default swaps on corporate issues—buy protection19
| Counterparty | | Referenced
obligations17 | | Notional
amount
(000) | | Termination
date | | Payments
made by the
Portfolio18 | | Upfront
payments
made | | Value | | Unrealized
depreciation | |
BB | | Macy's Retail Holdings, Inc. bond,
7.875%, due 07/15/15 | | USD | 1,643 | | | 09/20/15 | | | 7.150 | % | | $ | — | | | $ | (29,511 | ) | | $ | (29,511 | ) | |
Credit default swaps on corporate issues—sell protection20
| Counterparty | | Referenced obligations17 | | Notional
amount
(000) | | Termination
date | | Payments
received by
the Portfolio18 | | Upfront
payments
received
(made) | | Value | | Unrealized
appreciation
(depreciation) | | Credit
spread21 | |
| BNP | | Petroleo Brasileiro SA, bond,
8.375%, due 12/10/18 | | USD | 1,300 | | | 03/20/20 | | | 1.000 | % | | $ | 177,991 | | | $ | (198,364 | ) | | $ | (20,373 | ) | | | 4.82 | % | |
| BOA | | Federal Republic of Brazil
bond, 6.625%,
due 08/15/20 | | USD | 2,000 | | | 09/20/20 | | | 1.000 | | | | 149,649 | | | | (173,351 | ) | | | (23,702 | ) | | | 2.89 | | |
| BOA | | Goldman Sachs Group Inc.
bond, 5.950%,
due 01/18/18 | | USD | 5,300 | | | 06/20/19 | | | 1.000 | | | | (6,411 | ) | | | 65,894 | | | | 59,483 | | | | 0.70 | | |
81
PACE Select Advisors Trust
PACE Strategic Fixed Income Investments
Portfolio of investments—July 31, 2015
Credit default swaps on corporate issues—sell protection20—(concluded)
Counterparty | | Referenced obligations17 | | Notional
amount
(000) | | Termination
date | | Payments
received by
the Portfolio18 | | Upfront
payments
received
(made) | | Value | | Unrealized
appreciation
(depreciation) | | Credit
spread21 | |
| BOA | | Sprint Communications,
Inc. bond, 8.375%,
due 08/15/17 | | USD | 2,800 | | | 12/20/19 | | | 5.000 | % | | $ | (211,491 | ) | | $ | 23,055 | | | $ | (188,436 | ) | | | 4.93 | % | |
| DB | | Goldman Sachs Group Inc.
bond, 5.950%,
due 01/18/18 | | USD | 100 | | | 03/20/19 | | | 0.455 | | | | (329 | ) | | | 1,310 | | | | 981 | | | | 0.66 | | |
| DB | | Goldman Sachs Group Inc.
bond, 5.950%,
due 01/18/18 | | USD | 800 | | | 06/20/19 | | | 1.000 | | | | (1,172 | ) | | | 9,946 | | | | 8,774 | | | | 0.70 | | |
| GSI | | Federal Republic of Brazil
bond, 4.250%,
due 01/07/25 | | USD | 400 | | | 09/20/20 | | | 1.000 | | | | 27,761 | | | | (34,670 | ) | | | (6,909 | ) | | | 2.89 | | |
| GSI | | Petroleo Brasileiro SA, bond,
8.375%, due 12/10/18 | | USD | 1,500 | | | 03/20/20 | | | 1.000 | | | | 213,559 | | | | (228,881 | ) | | | (15,322 | ) | | | 4.82 | | |
| MSCI | | Ford Motor Co. bond,
6.500%, due 08/01/18 | | USD | 100 | | | 03/20/19 | | | 5.000 | | | | (13,475 | ) | | | 15,944 | | | | 2,469 | | | | 0.69 | | |
| MSCI | | Chesapeake Energy Corp.
bond, 6.625%,
due 08/15/20 | | USD | 1,500 | | | 03/20/19 | | | 5.000 | | | | 102,706 | | | | (77,107 | ) | | | 25,599 | | | | 6.89 | | |
| MSCI | | United Mexican States,
bond, 5.950%,
due 03/19/19 | | USD | 10,400 | | | 12/20/19 | | | 1.000 | | | | (87,222 | ) | | | (77,112 | ) | | | (164,334 | ) | | | 1.20 | | |
| | | | | | | | | | | | $ | 351,566 | | | $ | (673,336 | ) | | $ | (321,770 | ) | |
Centrally cleared credit default swap agreements—sell protection20
Referenced
obligations17 | | Notional
amount
(000) | | Termination
date | | Payments received
by the Portfolio18 | | Upfront
payments
made | | Value | | Unrealized
appreciation | | Credit
spread21 | |
iTraxx Europe Crossover
Series 23 Index | | EUR | 6,200 | | | 06/20/20 | | | 5.000 | % | | $ | (516,321 | ) | | $ | 684,869 | | | $ | 168,548 | | | | 2.84 | % | |
Centrally cleared interest rate swap agreements
Notional
amount
(000) | | Termination
date | | Payments made by the
Portfolio18 | | Payments
received by
the Portfolio18 | | Value | | Unrealized
appreciation
(depreciation) | |
EUR | 9,700 | | | 09/16/25 | | 0.750% | | 6 Month EURIBOR | | $ | 267,697 | | | $ | (276,120 | ) | |
GBP | 16,000 | | | 09/16/17 | | 1.500 | | 6 Month EURIBOR | | | (168,260 | ) | | | (20,454 | ) | |
GBP | 2,000 | | | 12/16/17 | | 1.500 | | 6 Month EURIBOR | | | (13,334 | ) | | | (9,527 | ) | |
GBP | 300 | | | 03/16/18 | | 1.500 | | 6 Month EURIBOR | | | (837 | ) | | | (412 | ) | |
MXN | 228,000 | | | 05/16/16 | | Mexico Interbank TIIE 28 Days | | 3.925% | | | 28,966 | | | | 28,966 | | |
MXN | 14,100 | | | 10/10/19 | | Mexico Interbank TIIE 28 Days | | 5.010 | | | (4,224 | ) | | | (13,048 | ) | |
MXN | 250,000 | | | 01/16/20 | | Mexico Interbank TIIE 28 Days | | 4.975 | | | (147,461 | ) | | | (147,461 | ) | |
MXN | 44,500 | | | 02/05/20 | | Mexico Interbank TIIE 28 Days | | 5.270 | | | 3,100 | | | | 24,085 | | |
MXN | 36,400 | | | 06/02/20 | | Mexico Interbank TIIE 28 Days | | 5.615 | | | 30,961 | | | | 14,046 | | |
MXN | 338,800 | | | 11/17/21 | | Mexico Interbank TIIE 28 Days | | 5.430 | | | (317,773 | ) | | | 303,254 | | |
MXN | 25,100 | | | 01/07/22 | | Mexico Interbank TIIE 28 Days | | 5.375 | | | (33,955 | ) | | | (52,977 | ) | |
MXN | 25,300 | | | 06/05/25 | | Mexico Interbank TIIE 28 Days | | 6.530 | | | 37,825 | | | | 25,227 | | |
MXN | 11,100 | | | 01/08/30 | | Mexico Interbank TIIE 28 Days | | 5.990 | | | (47,297 | ) | | | (25,494 | ) | |
USD | 15,100 | | | 06/17/16 | | 0.500 | | 3 Month USD LIBOR | | | (27,457 | ) | | | (15,283 | ) | |
82
PACE Select Advisors Trust
PACE Strategic Fixed Income Investments
Portfolio of investments—July 31, 2015
Centrally cleared interest rate swap agreements—(concluded)
Notional
amount
(000) | | Termination
date | | Payments made by the
Portfolio18 | | Payments
received by
the Portfolio18 | | Value | | Unrealized
depreciation | |
USD | 34,800 | | | 12/16/22 | | | 2.250 | | | 3 Month USD LIBOR | | $ | (248,565 | ) | | $ | (595,462 | ) | |
USD | 4,300 | | | 12/16/25 | | | 2.500 | | | 3 Month USD LIBOR | | | (40,417 | ) | | | (105,046 | ) | |
USD | 11,800 | | | 12/16/25 | | | 2.500 | | | 3 Month USD LIBOR | | | (99,943 | ) | | | (265,220 | ) | |
USD | 64,900 | | | 12/16/45 | | | 2.750 | | | 3 Month USD LIBOR | | | 539,517 | | | | (3,240,852 | ) | |
| | | | | | | | $ | (241,457 | ) | | $ | (4,371,778 | ) | |
Fair valuation summary
The following is a summary of the fair valuations according to the inputs used as of July 31, 2015 in valuing the Portfolio's investments:
Assets
Description | | Unadjusted
quoted prices in
active markets for
identical investments
(Level 1) | | Other significant
observable inputs
(Level 2) | | Unobservable
inputs
(Level 3) | | Total | |
US government obligations | | $ | — | | | $ | 289,055,670 | | | $ | — | | | $ | 289,055,670 | | |
Government national mortgage association certificates | | | — | | | | 34,283 | | | | — | | | | 34,283 | | |
Federal home loan bank certificate | | | — | | | | 658,246 | | | | — | | | | 658,246 | | |
Federal home loan mortgage corporation certificates | | | — | | | | 1,965,313 | | | | 1,145,044 | | | | 3,110,357 | | |
Federal housing administration certificates | | | — | | | | — | | | | 15,936 | | | | 15,936 | | |
Federal national mortgage association certificates | | | — | | | | 17,319,569 | | | | 24,519 | | | | 17,344,088 | | |
Collateralized mortgage obligations | | | — | | | | 136,721,495 | | | | 18,837 | | | | 136,740,332 | | |
Asset-backed securities | | | — | | | | 73,291,072 | | | | — | | | | 73,291,072 | | |
Corporate notes | | | — | | | | 354,811,779 | | | | — | | | | 354,811,779 | | |
Loan assignment | | | — | | | | 4,708,996 | | | | — | | | | 4,708,996 | | |
Non-US government obligations | | | — | | | | 65,970,564 | | | | — | | | | 65,970,564 | | |
Municipal bonds and notes | | | — | | | | 11,859,640 | | | | — | | | | 11,859,640 | | |
Preferred stock | | | 7,629,504 | | | | — | | | | — | | | | 7,629,504 | | |
Time deposits | | | — | | | | 48,249,308 | | | | — | | | | 48,249,308 | | |
Short-term US government obligations | | | — | | | | 490,896 | | | | — | | | | 490,896 | | |
Investment companies | | | 6,990,334 | | | | — | | | | — | | | | 6,990,334 | | |
Repurchase agreement | | | — | | | | 8,790,000 | | | | — | | | | 8,790,000 | | |
Swaptions purchased | | | — | | | | 512,040 | | | | — | | | | 512,040 | | |
Investment of cash collateral from securities loaned | | | — | | | | 14,444,243 | | | | — | | | | 14,444,243 | | |
Futures contracts | | | 1,570,108 | | | | — | | | | — | | | | 1,570,108 | | |
Forward foreign currency contracts | | | — | | | | 2,860,832 | | | | — | | | | 2,860,832 | | |
Swap agreements | | | — | | | | 1,709,084 | | | | — | | | | 1,709,084 | | |
Total | | $ | 16,189,946 | | | $ | 1,033,453,030 | | | $ | 1,204,336 | | | $ | 1,050,847,312 | | |
Liabilities | |
Written options | | $ | (20,391 | ) | | $ | — | | | $ | — | | | $ | (20,391 | ) | |
Written swaptions and foreign exchange written options | | | — | | | | (540,558 | ) | | | — | | | | (540,558 | ) | |
Futures contracts | | | (2,169,037 | ) | | | — | | | | — | | | | (2,169,037 | ) | |
Forward foreign currency contracts | | | — | | | | (1,639,760 | ) | | | — | | | | (1,639,760 | ) | |
Swap agreements | | | — | | | | (1,968,519 | ) | | | — | | | | (1,968,519 | ) | |
Total | | $ | (2,189,428 | ) | | $ | (4,148,837 | ) | | $ | — | | | $ | (6,338,265 | ) | |
83
PACE Select Advisors Trust
PACE Strategic Fixed Income Investments
Portfolio of investments—July 31, 2015
Fair valuation summary—(concluded)
The following is a rollforward of the Portfolio's investments that was valued using unobservable inputs (Level 3) for the year ended July 31, 2015:
| | Federal home
loan mortgage
corporation
certificates | | Federal housing
administration
certificates | | Federal national
mortgage
association
certificates | | Collateralized
mortgage
obligations | | Total | |
Beginning balance | | $ | 1,254,850 | | | $ | 18,564 | | | $ | 39,283 | | | $ | 2,269,811 | | | $ | 3,582,508 | | |
Purchases | | | — | | | | — | | | | — | | | | — | | | | — | | |
Sales/paydowns | | | (68,786 | ) | | | (2,628 | ) | | | (15,240 | ) | | | (2,176,238 | ) | | | (2,262,892 | ) | |
Accrued discounts/(premiums) | | | — | | | | (108 | ) | | | — | | | | — | | | | (108 | ) | |
Total realized gain/(loss) | | | (43 | ) | | | (127 | ) | | | — | | | | 8,016 | | | | 7,846 | | |
Net change in unrealized
appreciation/depreciation | | | (40,977 | ) | | | 235 | | | | 476 | | | | (8,109 | ) | | | (48,375 | ) | |
Transfers into Level 3 | | | — | | | | — | | | | — | | | | — | | | | — | | |
Transfers out of Level 3 | | | — | | | | — | | | | — | | | | (74,643 | ) | | | (74,643 | ) | |
Ending balance | | $ | 1,145,044 | | | $ | 15,936 | | | $ | 24,519 | | | $ | 18,837 | | | $ | 1,204,336 | | |
The change in net unrealized appreciation/depreciation relating to the Level 3 investments held at July 31, 2015 was $(35,117). At July 31, 2015, a security was transferred from Level 3 to Level 2 as the valuation is based on observable inputs from an established pricing source. The transfer out of Level 3 represents the value at the end of the year.
Issuer breakdown by country or territory of origin (unaudited)
| | Percentage of
total investments | |
United States | | | 82.4 | % | |
Cayman Islands | | | 2.2 | | |
Spain | | | 1.7 | | |
Netherlands | | | 1.5 | | |
United Kingdom | | | 1.2 | | |
Switzerland | | | 1.0 | | |
Germany | | | 0.9 | | |
Slovenia | | | 0.9 | | |
Brazil | | | 0.9 | | |
Luxembourg | | | 0.9 | | |
Norway | | | 0.8 | | |
Mexico | | | 0.8 | | |
South Korea | | | 0.6 | | |
Canada | | | 0.5 | | |
British Virgin Islands | | | 0.5 | | |
New Zealand | | | 0.4 | | |
South Africa | | | 0.3 | | |
Italy | | | 0.3 | | |
Colombia | | | 0.2 | | |
Belgium | | | 0.2 | | |
Ireland | | | 0.2 | | |
Qatar | | | 0.2 | | |
United Arab Emirates | | | 0.2 | | |
India | | | 0.2 | | |
Singapore | | | 0.2 | | |
Chile | | | 0.2 | | |
France | | | 0.1 | | |
Indonesia | | | 0.1 | | |
Turkey | | | 0.1 | | |
84
PACE Select Advisors Trust
PACE Strategic Fixed Income Investments
Portfolio of investments—July 31, 2015
Issuer breakdown by country or territory of origin (unaudited)—(concluded)
| | | Percentage of
total investments | |
Kazakhstan | | | 0.1 | % | |
Guernsey | | | 0.1 | | |
Russia | | | 0.1 | | |
Hungary | | | 0.0 | † | |
Azerbaijan | | | 0.0 | † | |
Ivory Coast | | | 0.0 | † | |
Bermuda | | | 0.0 | † | |
Serbia | | | 0.0 | † | |
Panama | | | 0.0 | † | |
Croatia | | | 0.0 | † | |
Dominican Republic | | | 0.0 | † | |
Romania | | | 0.0 | † | |
Sri Lanka | | | 0.0 | † | |
Morocco | | | 0.0 | † | |
Nigeria | | | 0.0 | † | |
Senegal | | | 0.0 | † | |
Costa Rica | | | 0.0 | † | |
Mongolia | | | 0.0 | † | |
El Salvador | | | 0.0 | † | |
Ecuador | | | 0.0 | † | |
Peru | | | 0.0 | † | |
Vietnam | | | 0.0 | † | |
Total | | | 100.0 | % | |
† Amount represents less than 0.05%
Portfolio footnotes
* On September 7, 2008, the Federal Housing Finance Agency placed the Federal National Mortgage Association and the Federal Home Loan Mortgage Corporation into conservatorship, and the US Treasury guaranteed the debt issued by those organizations.
†† Amount represents less than 0.005%.
1 In US Dollars unless otherwise indicated.
2 Zero coupon bond. The rate shown represents annualized yield at the date of purchase.
3 Security, or portion thereof, pledged as collateral for swaps or futures.
4 Variable or floating rate security. The interest rate shown is the current rate as of July 31, 2015 and changes periodically.
5 Security is being fair valued by a valuation committee under the direction of the board of trustees.
6 Security exempt from registration pursuant to Regulation S under the Securities Act of 1933. Regulation S applies to securities offerings that are made outside of the United States and do not involve direct selling efforts in the United States. At July 31, 2015, the value of these securities amounted to 7.34% of net assets.
7 Security exempt from registration pursuant to Rule 144A under the Securities Act of 1933. These securities, which represent 15.66% of net assets as of July 31, 2015, are considered liquid and may be resold in transactions exempt from registration, normally to qualified institutional buyers.
8 Interest Only Securities. These securities entitle the holder to receive interest payments from an underlying pool of mortgages. The risk associated with this security is related to the speed of the principal paydowns. High prepayments would result in a smaller amount of interest being received and cause the yield to decrease. Low prepayments would result in a greater amount of interest being received and cause the yield to increase.
9 Security, or portion thereof, was on loan at July 31, 2015.
10 Perpetual investment. The maturity date reflects the next call date.
11 Illiquid investment as of July 31, 2015.
12 Bond interest in default.
13 Step bond that converts to the noted fixed rate at a designated future date.
14 Non cumulative preferred stock. Convertible until 12/31/49.
15 Rates shown are the discount rates at date of purchase.
85
PACE Select Advisors Trust
PACE Strategic Fixed Income Investments
Portfolio of investments—July 31, 2015
16 The table below details the Portfolio's transaction activity in an affiliated issuer during the year ended July 31, 2015. The investment manager earns a management fee from UBS Private Money Market Fund LLC. Please see the Notes to financial statements for further information.
| Security description | | Value at
07/31/14 | | Purchases
during the
year ended
07/31/15 | | Sales
during the
year ended
07/31/15 | | Value at
07/31/15 | | Net income
earned from
affiliate for the
year ended
07/31/15 | |
UBS Private Money Market Fund LLC | | $ | 1,125,765 | | | $ | 186,314,887 | | | $ | 172,996,409 | | | $ | 14,444,243 | | | $ | 825 | | |
17 Payments from/to the counterparty will be received/made upon the occurrence of a failure to pay, obligation acceleration, repudiation or restructuring of the referenced obligation.
18 Payments made or received are based on the notional amount.
19 If the Portfolio is a buyer of protection and a credit event occurs, as defined under the terms of that particular swap agreement, the Portfolio will either (i) receive from the seller of protection an amount equal to the notional amount of the swap and take delivery of the referenced obligation or underlying securities comprising the referenced index or (ii) receive a net settlement amount in the form of cash or securities equal to the notional amount of the swap less the recovery value of the referenced obligation or underlying securities comprising the referenced index
20 If the Portfolio is a seller of protection and a credit event occurs, as defined under the terms of the particular swap agreement, the Portfolio will either (i) pay to the buyer of protection an amount equal to the notional amount of the swap and take delivery of the referenced obligation or (ii) pay a net settlement amount in the form of cash or securities equal to the notional amount of the swap less the recovery value of the referenced obligation.
21 Credit spreads, where applicable, represented in absolute terms, utilized in determining the market value as of period end serve as an indicator of the current status of the payment/performance risk and represent the likelihood or risk of default for the credit derivative. The credit spread of a particular referenced entity reflects the cost of buying/selling protection and may include upfront payments required to be made to enter into the agreement. Wider credit spreads represent a deterioration of the referenced entity's credit soundness and a greater likelihood or risk of default or other credit event occurring as defined under the terms of the agreement. A credit spread identified as "Defaulted" indicates a credit event has occurred for the referenced entity. Credit spreads are unaudited.
See accompanying notes to financial statements.
86
PACE Select Advisors Trust
PACE Municipal Fixed Income Investments
Performance (unaudited)
For the 12 months ended July 31, 2015, the Portfolio's Class P shares gained 2.39% before the deduction of the maximum PACE Select program fee.1 In comparison, the Barclays US Municipal 3-15 Year Blend Index (the "benchmark") rose 2.87%, and the Lipper Intermediate Municipal Debt Funds category posted a median return of 2.15%. (Returns for all share classes over various time periods are shown in the "Performance at a glance" table on page 90. Please note that the returns shown do not reflect the deduction of taxes that a shareholder could pay on Portfolio distributions or the redemption of Portfolio shares.) For a detailed commentary on the market environment in general during the reporting period, please refer to page 2.
Sub-advisor's comments2
(Please note that while the sub-advisor outperformed the benchmark on a gross-of-fees basis, the Portfolio underperformed net of fees, as reported in the "Performance at a glance" table. As stated in footnote two, the comments that follow address performance on a gross-of-fees basis.)
The Portfolio outperformed its benchmark during the reporting period. The primary drivers of performance were positive contributions from both sector allocation and security selection. Our interest rate strategy produced mixed results, as a favorable yield curve allocation was mitigated by the negative impact from having a modestly long duration posture.
From a sector standpoint, our preference for revenue bonds contributed to results. Amid an environment of relatively low volatility and tightening credit spreads, tactical sector positioning toward a more defensive stance was additive to performance. In particular, an emphasis on some of the more liquid, higher grade revenue sectors, such as essential service water/sewer and special tax bonds was rewarded. A mitigating factor was being overweight education bonds as they lagged the benchmark amid heavy issuance. Security selection was favorable for returns, led by modest exposure to Detroit sewer revenue bonds that were secured by dedicated income streams covering a large and diverse geographic region. Limited exposure to lower yielding and shorter maturity pre-refunded bonds was also beneficial for results given their underperformance versus the benchmark.
PACE Select Advisors Trust – PACE Municipal Fixed Income Investments
Investment Sub-Advisor:
Standish Mellon Asset Management Company LLC ("Standish")
Portfolio Manager:
Christine L. Todd
Objective:
High current income exempt from federal income tax
Investment process:
In deciding which securities to buy for the Portfolio, Standish seeks to identify undervalued sectors or geographical regions of the municipal market, or undervalued individual securities. To do this, Standish uses credit research and valuation analysis, and monitors the relationship of the municipal yield curve to the Treasury yield curve. Standish may also make modest duration adjustments based on economic analyses and interest rate forecasts. Standish generally sells securities if it identifies more attractive investment opportunities within its investment criteria that may improve the Portfolio's return. Standish also may sell securities with weakening credit profiles or to adjust the average duration of the Portfolio.
1 Class P shares held through the PACE Select Advisors Program are subject to a maximum Program fee of 2.50%, which, if included, would have reduced performance. Class P shares held through other advisory programs also may be subject to a program fee, which, if included, would have reduced performance.
2 All sub-advisors discuss performance on a gross-of-fees basis—meaning that no fees or expenses are reflected in their sleeves'/sleeve's performance. Alternately, Portfolio performance is shown net of fees, which does factor in fees and expenses associated with the Portfolio.
87
PACE Select Advisors Trust
PACE Municipal Fixed Income Investments
Sub-advisor's comments – concluded
Fundamental municipal credit conditions continued to be strong, as state and local tax revenues showed steady growth and state net tax-supported debt declined. Credit headlines were dominated, however, by negative news from Puerto Rico and Chicago, both situations that we view as not systemic to the broader municipal market. The Portfolio benefited from removing exposure to general obligation credits with higher debt and pension liabilities, such as Illinois, New Jersey and Chicago, given our expectations for rating and price downside. Maintaining a higher quality bias with underweight exposure to A-rated and BBB-rated bonds, which performed well versus the higher grade AA-rated and AAA-rated segments, was a modest detractor from performance.
Our interest rate strategy results were mixed during the reporting period. Our duration posture was slightly longer than the benchmark which hurt returns as shorter maturity interest rates drifted higher amid relatively heavy supply and growing expectations of Federal Reserve Board rate hikes. From a yield curve perspective, we focused new purchases on the 10- to-15-year maturity range driving a modest overweight in this portion of the yield curve. This proved to be positive as this area performed well versus shorter maturity bonds. Maintaining a yield or income advantage versus the benchmark, helped by heavier exposure to longer bonds, was also key a driver of performance.
No derivatives were used during the reporting period.
Special considerations
The Portfolio may be appropriate for long-term investors seeking high current income exempt from federal income taxes. Investors should be able to withstand short-term fluctuations in the fixed income markets in return for potentially higher returns over the long term. The yield and value of the Portfolio change every day and can be affected by changes in interest rates, general market conditions, and other political, social and economic developments, as well as specific matters relating to the issuers in which the Portfolio invests. It is important to note that an investment in the Portfolio is only one component of a balanced investment plan.
88
PACE Select Advisors Trust
PACE Municipal Fixed Income Investments
Illustration of an assumed investment of $10,000 in Class P shares of the Portfolio (unaudited)
The following graph depicts the performance of PACE Municipal Fixed Income Investments Class P shares versus the Barclays US Municipal 3-15 Year Blend Index over the 10 years ended July 31, 2015. Class P shares held through advisory programs may be subject to a program fee, which, if included, would have reduced performance. The performance of the other classes will vary based upon the different class specific expenses and sales charges. The performance provided does not reflect the deduction of taxes that a shareholder could pay on Portfolio distributions or the redemption of Portfolio shares. Past performance is no guarantee of future results. Share price and returns will vary with market conditions; investors may realize a gain or loss upon redemption. It is important to note that PACE Municipal Fixed Income Investments is a professionally managed portfolio while the Index is not available for investment and is unmanaged. The comparison is shown for illustration purposes only.
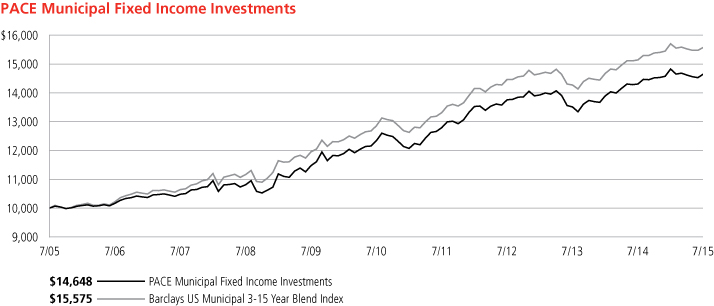
89
PACE Select Advisors Trust
PACE Municipal Fixed Income Investments
Performance at a glance (unaudited)
Average annual total returns for periods ended 07/31/15 | | 1 year | | 5 years | | 10 years | |
Before deducting maximum sales charge | |
Class A1 | | | 2.07 | % | | | 3.23 | % | | | 3.63 | % | |
Class C2 | | | 1.55 | | | | 2.71 | | | | 3.11 | | |
Class Y3 | | | 2.32 | | | | 3.49 | | | | 3.89 | | |
Class P4 | | | 2.39 | | | | 3.49 | | | | 3.89 | | |
After deducting maximum sales charge | |
Class A1 | | | (2.52 | ) | | | 2.29 | | | | 3.15 | | |
Class C2 | | | 0.80 | | | | 2.71 | | | | 3.11 | | |
Barclays US Municipal 3-15 Year Blend Index5 | | | 2.87 | | | | 3.91 | | | | 4.53 | | |
Lipper Intermediate Municipal Debt Funds median | | | 2.15 | | | | 3.28 | | | | 3.72 | | |
Most recent calendar quarter-end returns (unaudited)
Average annual total returns for periods ended 06/30/15 | | 1 year | | 5 years | | 10 years | |
Before deducting maximum sales charge | |
Class A1 | | | 1.44 | % | | | 3.39 | % | | | 3.49 | % | |
Class C2 | | | 0.93 | | | | 2.87 | | | | 2.97 | | |
Class Y3 | | | 1.69 | | | | 3.65 | | | | 3.75 | | |
Class P4 | | | 1.70 | | | | 3.63 | | | | 3.75 | | |
After deducting maximum sales charge | |
Class A1 | | | (3.11 | ) | | | 2.45 | | | | 3.02 | | |
Class C2 | | | 0.19 | | | | 2.87 | | | | 2.97 | | |
The annualized gross and net expense ratios, respectively, for each class of shares as in the November 28, 2014 prospectuses, were as follows: Class A—0.92% and 0.90%; Class C—1.43% and 1.40%; Class Y—0.72% and 0.65%; and Class P—0.68% and 0.65%. Net expenses reflect fee waivers and/or expense reimbursements, if any, pursuant to an agreement that is in effect to cap the expenses. The Portfolio and UBS Global Asset Management (Americas) Inc. ("UBS Global AM") have entered into a written fee waiver/expense reimbursement agreement pursuant to which UBS Global AM is contractually obligated to waive its management fees and/or reimburse expenses so that the Portfolio's ordinary total operating expenses of each class through November 30, 2015 (excluding dividend expense, borrowing costs, and interest expense relating to short sales, and expenses attributable to investment in other investment companies, interest, taxes, brokerage commissions and extraordinary expenses) could not exceed Class A—0.90%; Class C—1.40%; Class Y—0.65%; and Class P—0.65%. The Portfolio has agreed to repay UBS Global AM for any waived fees/reimbursed expenses to the extent that it can do so over the following three fiscal years without causing the Portfolio's expenses in any of those three years to exceed these expense caps. The fee waiver/expense reimbursement agreement may be terminated by the Portfolio's board at any time and also will terminate automatically upon the expiration or termination of the Portfolio's advisory contract with UBS Global AM. Upon termination of the agreement, however, UBS Global AM's three year recoupment rights will survive.
1 Maximum sales charge for Class A shares is 4.5%. Class A shares bear ongoing 12b-1 service fees.
2 Maximum contingent deferred sales charge for Class C shares is 0.75% imposed on redemptions and is reduced to 0% after one year. Class C shares bear ongoing 12b-1 service and distribution fees.
3 The Portfolio offers Class Y shares to a limited group of eligible investors, including certain qualifying retirement plans. Class Y shares do not bear initial or contingent deferred sales charges or ongoing 12b-1 service and distribution fees.
4 Class P shares do not bear initial or contingent deferred sales charges or ongoing 12b-1 service and distribution fees, but Class P shares held through advisory programs may be subject to a program fee, which, if included, would have reduced performance.
5 The Barclays US Municipal 3-15 Year Blend Index is an unmanaged total return performance benchmark for the tax-exempt bond market. The Index includes municipal bonds with an effective maturity between 2 and 17 years that have at least one year to maturity and are investment grade. Investors should note that indices do not reflect the deduction of fees and expenses.
Prior to February 17, 2015, if an investor sold or exchanged shares less than 90 days after purchase, a redemption fee of 1.00% of the amount sold or exchanged was deducted at the time of the transaction, except as noted otherwise in the prospectus. For sales or exchanges taking place on or after February 17, 2015 but prior to August 3, 2015, there is a reduction in the redemption holding period from 90 days to 30 days. Effective August 3, 2015, the 1.00% redemption fee imposed on sales or exchanges of any class of shares of the portfolios made during the holding periods specified in the prospectus was eliminated. Please refer to the prospectus for further information.
Past performance does not predict future performance, and the performance information provided does not reflect the deduction of taxes that a shareholder could pay on Portfolio distributions or the redemption of Portfolio shares. The return and principal value of an investment will fluctuate, so that an investor's shares, when redeemed, may be worth more or less than their original cost. Performance results assume reinvestment of all dividends and capital gain distributions at net asset value on the ex-dividend dates. Current performance may be higher or lower than the performance data quoted. For month-end performance figures, please visit http://globalam-us.ubs.com/corpweb/performance.do.
Lipper peer group data calculated by Lipper Inc.; used with permission. The Lipper median is the return of the fund that places in the middle of a Lipper peer group.
90
PACE Select Advisors Trust
PACE Municipal Fixed Income Investments
Portfolio statistics (unaudited)
Characteristics | | 07/31/15 | |
Weighted average duration | | | 5.0 yrs. | | |
Weighted average maturity | | | 8.7 yrs. | | |
Average coupon | | | 5.00 | % | |
Net assets (mm) | | $ | 409.5 | | |
Number of holdings | | | 169 | | |
Portfolio composition1 | | 07/31/15 | |
Municipal bonds and notes | | | 99.0 | % | |
Tax-free money market fund | | | 0.5 | | |
Cash equivalents and other assets less liabilities | | | 0.5 | | |
Total | | | 100.0 | % | |
Sectors1 | | 07/31/15 | |
Revenue | | | 57.9 | % | |
General obligations | | | 20.9 | | |
Lease revenue/special revenue | | | 16.5 | | |
Pre-refunded | | | 4.7 | | |
Total | | | 100.0 | % | |
Top five states1 | | 07/31/15 | |
Texas | | | 13.1 | % | |
California | | | 12.2 | | |
New York | | | 11.3 | | |
Illinois | | | 10.8 | | |
Florida | | | 5.6 | | |
Total | | | 53.0 | % | |
Quality diversification1,2 | | 07/31/15 | |
AAA and agency backed securities | | | 11.6 | % | |
AA | | | 47.9 | | |
A | | | 28.1 | | |
BBB | | | 3.1 | | |
Non-rated | | | 8.3 | | |
Tax-free money market fund | | | 0.5 | | |
Cash equivalents and other assets less liabilities | | | 0.5 | | |
Total | | | 100.0 | % | |
1 Weightings represent percentages of the Portfolio's net assets as of July 31, 2015. The Portfolio is actively managed and its composition will vary over time.
2 Credit quality ratings shown are based on the ratings assigned to portfolio holdings by Standard & Poor's Ratings Group, an independent rating agency.
91
PACE Select Advisors Trust
PACE Municipal Fixed Income Investments
Portfolio of investments—July 31, 2015
| | | Face
amount | | Value | |
Municipal bonds and notes—99.04% | |
Alabama—0.55% | |
Birmingham Waterworks Board
Water Revenue Series A
(Assured Guaranty Insured)
5.000%, due 01/01/24 | | $ | 2,005,000 | | | $ | 2,268,658 | | |
Arizona—0.42% | |
Pima County Sewer Revenue System
(AGM Insured)
5.000%, due 07/01/23 | | | 1,500,000 | | | | 1,716,900 | | |
Arkansas—0.68% | |
University of Arkansas,
(Fayetteville Campus),
Series A
5.000%, due 11/01/29 | | | 1,385,000 | | | | 1,613,317 | | |
5.000%, due 11/01/30 | | | 1,000,000 | | | | 1,160,460 | | |
| | | | 2,773,777 | | |
California—12.18% | |
California State
5.000%, due 08/01/19 | | | 3,000,000 | | | | 3,196,500 | | |
5.000%, due 09/01/23 | | | 1,000,000 | | | | 1,196,470 | | |
5.000%, due 12/01/24 | | | 2,000,000 | | | | 2,417,140 | | |
5.000%, due 09/01/25 | | | 1,725,000 | | | | 1,932,293 | | |
5.250%, due 10/01/20 | | | 1,000,000 | | | | 1,168,100 | | |
5.500%, due 04/01/21 | | | 3,000,000 | | | | 3,474,210 | | |
California State Department of Water
Resources Power Supply Revenue
Prerefunded Series H (AGM Insured)
5.000%, due 05/01/22 | | | 1,000,000 | | | | 1,113,820 | | |
Series L
5.000%, due 05/01/17 | | | 1,000,000 | | | | 1,077,880 | | |
Unrefunded Series H (AGM Insured)
5.000%, due 05/01/22 | | | 400,000 | | | | 444,768 | | |
California State Economic Recovery
Refunding Series A
5.000%, due 07/01/20 | | | 3,000,000 | | | | 3,461,010 | | |
California State Public Works
Board Lease Revenue
(Judicial Council Project), Series A
5.000%, due 03/01/24 | | | 1,750,000 | | | | 2,075,097 | | |
California State Public Works Board
Lease Revenue Refunding Series H
5.000%, due 12/01/23 | | | 2,705,000 | | | | 3,282,166 | | |
California Statewide Communities
Development Authority Revenue
Kaiser Permanente Series A
5.000%, due 04/01/19 | | | 3,000,000 | | | | 3,422,220 | | |
California Statewide Communities
Development Authority Revenue
St. Joseph Series F (AGM Insured)
5.250%, due 07/01/18 | | | 1,500,000 | | | | 1,669,935 | | |
| | | Face
amount | | Value | |
Municipal bonds and notes—(continued) | |
California—(concluded) | |
Los Angeles Department of Airports
(Los Angeles International Airport)
Series A
5.000%, due 05/15/321 | | $ | 2,000,000 | | | $ | 2,246,360 | | |
Los Angeles Department of Water &
Power Revenue Power Systems
Series B
5.000%, due 07/01/25 | | | 5,000,000 | | | | 5,840,700 | | |
North Natomas Community Facilities
District No. 4 Special Tax Series E
5.000%, due 09/01/19 | | | 1,385,000 | | | | 1,564,316 | | |
Northern California Power Agency
Refunding (Hydroelectric Project 1),
Series A
5.000%, due 07/01/28 | | | 1,845,000 | | | | 2,101,695 | | |
Orange County Transportation
Authority Toll Road Revenue
Refunding (Senior Lien 91
Express Lanes)
5.000%, due 08/15/29 | | | 1,000,000 | | | | 1,146,520 | | |
San Diego Public Facilities Financing
Authority Sewer Revenue Senior
Series A
5.000%, due 05/15/25 | | | 2,500,000 | | | | 2,842,025 | | |
Stockton Unified School District
(AGM Insured)
5.000%, due 07/01/23 | | | 1,270,000 | | | | 1,484,579 | | |
University of California Revenue
Prerefunded General Series Q
5.250%, due 05/15/23 | | | 2,390,000 | | | | 2,611,362 | | |
Unrefunded General Series Q
5.250%, due 05/15/23 | | | 110,000 | | | | 120,005 | | |
| | | | 49,889,171 | | |
Colorado—3.12% | |
Colorado Health Facilities Authority
Revenue Boulder Community
Hospital Project Series A
4.000%, due 10/01/18 | | | 1,500,000 | | | | 1,624,245 | | |
Denver City & County Airport Revenue
Series A
5.500%, due 11/15/191 | | | 2,500,000 | | | | 2,913,850 | | |
Subseries A
5.500%, due 11/15/261 | | | 7,000,000 | | | | 8,240,400 | | |
| | | | 12,778,495 | | |
Connecticut—0.53% | |
Hartford County Metropolitan District
Revenue (Green Bonds) Series A
5.000%, due 11/01/29 | | | 1,870,000 | | | | 2,186,516 | | |
92
PACE Select Advisors Trust
PACE Municipal Fixed Income Investments
Portfolio of investments—July 31, 2015
| | | Face
amount | | Value | |
Municipal bonds and notes—(continued) | |
District of Columbia—0.57% | |
Metropolitan Washington, Airport
Authority Airport System Revenue
Series A
5.000%, due 10/01/221 | | $ | 2,000,000 | | | $ | 2,321,860 | | |
Florida—5.59% | |
Broward Port Facilities Revenue
Refunding Series B
5.000%, due 09/01/211 | | | 2,000,000 | | | | 2,306,080 | | |
Citizens Property Insurance Corp.
Revenue Series A-1
5.000%, due 06/01/25 | | | 10,000,000 | | | | 11,810,700 | | |
Florida State Board of Education
Lottery Revenue Refunding Series E
5.000%, due 07/01/19 | | | 1,000,000 | | | | 1,145,370 | | |
Florida State Municipal Power Agency
Revenue All Requirements Power
Series A
5.250%, due 10/01/20 | | | 1,555,000 | | | | 1,787,737 | | |
5.250%, due 10/01/21 | | | 2,000,000 | | | | 2,249,360 | | |
JEA Electric System Revenue Series A
5.000%, due 10/01/24 | | | 1,200,000 | | | | 1,426,176 | | |
Lakeland Energy System Revenue
Refunding Series B (AGM Insured)
5.000%, due 10/01/17 | | | 2,000,000 | | | | 2,180,040 | | |
| | | | 22,905,463 | | |
Georgia—1.03% | |
Atlanta Development Authority
Revenue Senior Lien Series A-1
5.000%, due 07/01/32 | | | 2,000,000 | | | | 2,247,700 | | |
Municipal Electric Authority of
Georgia Project One Subseries D
5.750%, due 01/01/19 | | | 1,750,000 | | | | 1,988,175 | | |
| | | | 4,235,875 | | |
Illinois—10.85% | |
Chicago O'Hare International Airport
Revenue Refunding General Senior
Lien Series A
5.000%, due 01/01/181 | | | 2,000,000 | | | | 2,166,500 | | |
Chicago O'Hare International Airport
Revenue Refunding General Third
Lien Series B (NATL-RE Insured)
5.250%, due 01/01/18 | | | 1,000,000 | | | | 1,096,170 | | |
Chicago O'Hare International Airport
Revenue Series A
5.000%, due 01/01/231 | | | 1,150,000 | | | | 1,286,160 | | |
Chicago Park District Refunding
Limited Tax Series C
5.000%, due 01/01/27 | | | 1,625,000 | | | | 1,747,314 | | |
Chicago Wastewater Transmission
Revenue Second Lien
5.000%, due 01/01/25 | | | 1,000,000 | | | | 1,097,040 | | |
| | | Face
amount | | Value | |
Municipal bonds and notes—(continued) | |
Illinois—(concluded) | |
Cook County Forest Preservation
District (AMBAC Insured)
5.000%, due 11/15/19 | | $ | 5,180,000 | | | $ | 5,825,739 | | |
Illinois Development Finance Authority
Revenue School District Program
School District No. U-46
(AGM Insured)
5.150%, due 01/01/19 | | | 2,000,000 | | | | 2,235,840 | | |
Illinois Finance Authority Revenue
Advocate Health Care Network
5.000%, due 06/01/27 | | | 3,000,000 | | | | 3,436,260 | | |
Illinois Finance Authority Revenue
University of Chicago Series A
5.000%, due 10/01/29 | | | 2,440,000 | | | | 2,733,190 | | |
Illinois Health Facilities Authority
Revenue Evangelical Hospital
Series A (Escrowed to Maturity)
6.750%, due 04/15/17 | | | 290,000 | | | | 309,508 | | |
Illinois Toll Highway Authority Toll
Highway Revenue Refunding
Senior Series A-1
5.000%, due 01/01/25 | | | 1,250,000 | | | | 1,407,750 | | |
Railsplitter Tobacco Settlement
Authority
5.500%, due 06/01/23 | | | 6,115,000 | | | | 7,063,253 | | |
6.000%, due 06/01/28 | | | 2,500,000 | | | | 2,942,275 | | |
Regional Transportation Authority
Series A (AGM Insured)
5.750%, due 06/01/18 | | | 3,000,000 | | | | 3,390,900 | | |
Springfield Electric Revenue
Senior Lien Electric
5.000%, due 03/01/16 | | | 2,000,000 | | | | 2,050,800 | | |
University of Illinois (Auxiliary
Facilities System), Series A
5.000%, due 04/01/27 | | | 4,000,000 | | | | 4,508,400 | | |
University of Illinois, Series A
5.000%, due 04/01/30 | | | 1,000,000 | | | | 1,119,190 | | |
| | | | 44,416,289 | | |
Indiana—1.78% | |
Indiana Finance Authority Revenue
Refunding (Stadium Project) Series A
5.250%, due 02/01/35 | | | 1,000,000 | | | | 1,142,960 | | |
Indiana University Revenues Student
Fees Series S
5.000%, due 08/01/19 | | | 1,185,000 | | | | 1,326,110 | | |
Indianapolis Local Public Improvement
Bond Bank Airport Authority
Series F (AMBAC Insured)
5.000%, due 01/01/221 | | | 2,450,000 | | | | 2,546,162 | | |
Richmond Hospital Authority Revenue
Refunding Reid Hospital & Health
Care Series A
5.000%, due 01/01/30 | | | 2,055,000 | | | | 2,281,256 | | |
| | | | 7,296,488 | | |
93
PACE Select Advisors Trust
PACE Municipal Fixed Income Investments
Portfolio of investments—July 31, 2015
| | | Face
amount | | Value | |
Municipal bonds and notes—(continued) | |
Kansas—0.42% | |
Kansas State Department of
Transportation Highway Revenue
Refunding (Libor Index), Series B-5
0.525%, due 09/01/192 | | $ | 1,750,000 | | | $ | 1,731,153 | | |
Kentucky—0.59% | |
Pikeville Hospital Revenue
Refunding & Improvement (Pikeville
Medical Center)
6.000%, due 03/01/22 | | | 2,055,000 | | | | 2,433,736 | | |
Louisiana—2.71% | |
East Baton Rouge Sewerage
Commission Revenue Refunding
Series B
5.000%, due 02/01/28 | | | 1,000,000 | | | | 1,167,480 | | |
New Orleans Aviation Board Revenue
Series B (AGM Insured)
5.000%, due 01/01/281 | | | 1,500,000 | | | | 1,708,830 | | |
State of Louisiana State Highway
Improvement Revenue Series A
5.000%, due 06/15/29 | | | 3,500,000 | | | | 4,059,335 | | |
Tobacco Settlement Funding Corp.,
(Asset-Backed Refunding Bonds),
Series A
5.000%, due 05/15/27 | | | 4,000,000 | | | | 4,162,440 | | |
| | | | 11,098,085 | | |
Maryland—1.42% | |
Maryland Health & Higher Educational
Facilities Authority Revenue
Peninsula Regional Medical Center
5.000%, due 07/01/32 | | | 1,500,000 | | | | 1,649,310 | | |
State of Maryland Second Series C
5.250%, due 08/01/20 | | | 3,500,000 | | | | 4,161,710 | | |
| | | | 5,811,020 | | |
Massachusetts—4.87% | |
Commonwealth of Massachusetts
Federal Highway Grant Anticipation
Notes (Accelerated Bridge Program),
Series A,
5.000%, due 06/15/23 | | | 2,500,000 | | | | 2,974,950 | | |
Massachusetts Development Finance
Agency Revenue Unrefunded-
Partners Healthcare System
5.000%, due 07/01/19 | | | 475,000 | | | | 513,081 | | |
Massachusetts Educational Financing
Authority Series K
5.000%, due 07/01/221 | | | 2,500,000 | | | | 2,796,950 | | |
Massachusetts Health & Educational
Facilities Authority Revenue
Massachusetts Institute of
Technology Series M
5.250%, due 07/01/29 | | | 1,000,000 | | | | 1,291,470 | | |
| | | Face
amount | | Value | |
Municipal bonds and notes—(continued) | |
Massachusetts—(concluded) | |
Massachusetts State College Building
Authority Revenue Refunding
Series B
5.000%, due 05/01/29 | | $ | 2,500,000 | | | $ | 2,839,325 | | |
Massachusetts State School Building
Authority Dedicated Sales Tax
Revenue Series B
5.000%, due 08/15/28 | | | 3,000,000 | | | | 3,541,050 | | |
Massachusetts State Series B
5.000%, due 08/01/22 | | | 5,000,000 | | | | 5,995,500 | | |
| | | | 19,952,326 | | |
Michigan—3.77% | |
Detroit Sewer Disposal Revenue
Senior Lien Series A (AGM Insured)
5.250%, due 07/01/19 | | | 2,500,000 | | | | 2,828,775 | | |
Michigan State Finance Authority
Revenue Refunding (Beaumont
Health Credit Group)
5.000%, due 08/01/33 | | | 2,415,000 | | | | 2,649,593 | | |
Michigan State Finance Authority
Revenue Refunding (Detroit School
District), Series A
5.000%, due 05/01/22 | | | 1,485,000 | | | | 1,708,626 | | |
Michigan State Finance Authority
Revenue Refunding (Unemployment
Obligation Assessment), Series B
5.000%, due 07/01/21 | | | 4,000,000 | | | | 4,455,280 | | |
Michigan State Finance Authority
Revenue Refunding Senior Lien
(Detroit Water And Sewerage),
Series C-3 (AGM Insured)
5.000%, due 07/01/30 | | | 1,500,000 | | | | 1,664,955 | | |
Wayne County Airport Authority
Revenue Refunding Detroit
Metropolitan Airport
Series A
5.000%, due 12/01/161 | | | 1,500,000 | | | | 1,582,470 | | |
Series D
5.000%, due 12/01/17 | | | 510,000 | | | | 555,518 | | |
| | | | 15,445,217 | | |
Missouri—3.68% | |
City of Kansas City, Missouri Airport
Revenue Series A
5.000%, due 09/01/231 | | | 5,000,000 | | | | 5,657,000 | | |
Missouri Joint Municipal Electric Utility
Commission Revenue Refunding
Prairie State Project Series A
5.000%, due 12/01/25 | | | 2,300,000 | | | | 2,727,501 | | |
Missouri State Health & Educational
Facilities Authority Health Facilities
Revenue Coxhealth Series A
5.000%, due 11/15/34 | | | 2,000,000 | | | | 2,227,940 | | |
94
PACE Select Advisors Trust
PACE Municipal Fixed Income Investments
Portfolio of investments—July 31, 2015
| | | Face
amount | | Value | |
Municipal bonds and notes—(continued) | |
Missouri—(concluded) | |
Missouri State Health & Educational
Facilities Authority Health Facilities
Revenue SSM Health Care Series A
5.000%, due 06/01/27 | | $ | 1,500,000 | | | $ | 1,738,170 | | |
Missouri State Health & Educational
Facilities Authority Health Facilities
Revenue St. Lukes Health Systems
Series A (AGM Insured)
5.000%, due 11/15/17 | | | 2,500,000 | | | | 2,728,825 | | |
| | | | 15,079,436 | | |
Nebraska—2.14% | |
City of Lincoln, Nebraska Electric
System Revenue
5.000%, due 09/01/22 | | | 3,790,000 | | | | 4,541,065 | | |
Nebraska Public Power District
Series A-1
5.000%, due 01/01/30 | | | 1,245,000 | | | | 1,441,274 | | |
Public Power Generation Agency
Revenue Refunding Whelan Energy
Center Unit 2 Series A
5.000%, due 01/01/30 | | | 2,500,000 | | | | 2,787,925 | | |
| | | | 8,770,264 | | |
Nevada—1.75% | |
Las Vegas Valley Water District
Refunding & Improvement Series A
5.000%, due 02/01/17 | | | 1,500,000 | | | | 1,598,670 | | |
Las Vegas Valley Water District
Refunding Series A
5.000%, due 06/01/21 | | | 2,000,000 | | | | 2,363,940 | | |
Las Vegas Valley Water District
Series B
5.000%, due 06/01/25 | | | 2,700,000 | | | | 3,201,633 | | |
| | | | 7,164,243 | | |
New Jersey—2.18% | |
New Jersey Economic Development
Authority Water Facilities Revenue
Refunding American Water Co.
Series C
5.100%, due 06/01/231 | | | 1,000,000 | | | | 1,111,400 | | |
New Jersey Health Care Facilities
Financing Authority Revenue
Refunding (Virtua Health)
5.000%, due 07/01/25 | | | 1,500,000 | | | | 1,736,775 | | |
New Jersey State Higher Education
Assistance Authority Revenue,
Series 1A
5.000%, due 12/01/181 | | | 1,000,000 | | | | 1,099,810 | | |
Series 1A
5.000%, due 12/01/211 | | | 2,550,000 | | | | 2,876,017 | | |
| | | Face
amount | | Value | |
Municipal bonds and notes—(continued) | |
New Jersey—(concluded) | |
Rutgers State University Revenue
Series J
5.000%, due 05/01/19 | | $ | 1,860,000 | | | $ | 2,113,258 | | |
| | | | 8,937,260 | | |
New Mexico—0.92% | |
New Mexico Municipal Energy
Acquisition Authority Gas Supply
Revenue Subseries B
0.775%, due 02/01/192 | | | 1,000,000 | | | | 998,770 | | |
0.875%, due 11/01/392 | | | 2,750,000 | | | | 2,755,087 | | |
| | | | 3,753,857 | | |
New York—11.31% | |
Metropolitan Transportation Authority
New York Dedicated Tax Fund
Subseries B-1
5.000%, due 11/15/29 | | | 2,500,000 | | | | 2,872,325 | | |
Metropolitan Transportation Authority
Revenue Transportation
Series B
5.000%, due 11/15/27 | | | 2,090,000 | | | | 2,424,107 | | |
Series D
5.000%, due 11/15/23 | | | 1,400,000 | | | | 1,527,316 | | |
Series G
5.000%, due 11/15/18 | | | 2,500,000 | | | | 2,816,650 | | |
New York City Health & Hospital
Corp. Revenue Health System
Series A
5.000%, due 02/15/22 | | | 3,500,000 | | | | 3,994,655 | | |
New York City Municipal Finance
Authority Water & Sewer Systems
Revenue Refunding Series DD
5.000%, due 06/15/29 | | | 1,500,000 | | | | 1,756,335 | | |
New York City Municipal Water
Finance Authority Water & Sewer
Systems Revenue (Second General
Resolution) Series HH
5.000%, due 06/15/29 | | | 2,500,000 | | | | 2,870,600 | | |
New York City
Series B
5.000%, due 08/01/17 | | | 1,750,000 | | | | 1,898,505 | | |
Series E
5.000%, due 08/01/24 | | | 3,065,000 | | | | 3,619,367 | | |
Series H
5.000%, due 08/01/25 | | | 2,990,000 | | | | 3,543,509 | | |
New York City Transitional Finance
Authority Future Tax Secured
Revenue
Series B
5.000%, due 02/01/23 | | | 2,500,000 | | | | 2,899,825 | | |
Subseries I
5.000%, due 05/01/23 | | | 2,435,000 | | | | 2,922,877 | | |
95
PACE Select Advisors Trust
PACE Municipal Fixed Income Investments
Portfolio of investments—July 31, 2015
| | | Face
amount | | Value | |
Municipal bonds and notes—(continued) | |
New York—(concluded) | |
New York State Dorm Authority State
Personal Income Tax Revenue
General Purpose Series C
5.000%, due 03/15/25 | | $ | 2,320,000 | | | $ | 2,716,302 | | |
New York State Thruway Authority
General Revenue Junior
Indebtedness Series A
5.000%, due 05/01/19 | | | 3,000,000 | | | | 3,406,140 | | |
New York State Thruway Authority
General Revenue Series I
5.000%, due 01/01/20 | | | 1,500,000 | | | | 1,724,220 | | |
Port Authority of New York & New
Jersey Revenue Consolidated (One
Hundred Eighty-Fifth)
5.000%, due 09/01/221 | | | 2,400,000 | | | | 2,801,352 | | |
Tobacco Settlement Funding Corp.,
(Asset-Backed Revenue Bonds),
Series B
5.000%, due 06/01/20 | | | 1,000,000 | | | | 1,039,680 | | |
Triborough Bridge & Tunnel Authority
Revenue Subseries 2003B-2
0.475%, due 01/01/332 | | | 1,500,000 | | | | 1,481,760 | | |
| | | | 46,315,525 | | |
North Carolina—0.88% | |
North Carolina Capital Improvement
Obligations Series C
5.000%, due 05/01/30 | | | 1,000,000 | | | | 1,156,590 | | |
University of North Carolina Chapel
Hill Revenue Series A
5.000%, due 12/01/27 | | | 2,160,000 | | | | 2,460,391 | | |
| | | | 3,616,981 | | |
Ohio—0.82% | |
Kent State University Revenue
General Receipts Series B
(Assured Guaranty Insured)
5.000%, due 05/01/21 | | | 3,000,000 | | | | 3,371,700 | | |
Pennsylvania—2.40% | |
Allegheny County Port Authority
Special Revenue Refunding
Transportation
5.000%, due 03/01/25 | | | 1,000,000 | | | | 1,128,140 | | |
Pennsylvania Economic Development
Financing Authority Unemployment
Compensation Revenue Series B
5.000%, due 01/01/22 | | | 1,750,000 | | | | 1,886,815 | | |
Pennsylvania Intergovernmental
Cooperative Authority Special Tax
Revenue Refunding Philadelphia
Funding Program
5.000%, due 06/15/17 | | | 2,000,000 | | | | 2,161,220 | | |
| | | Face
amount | | Value | |
Municipal bonds and notes—(continued) | |
Pennsylvania—(concluded) | |
Pennsylvania State Higher Educational
Facilities Authority Revenue
University of Pennsylvania Series A
5.000%, due 09/01/17 | | $ | 1,150,000 | | | $ | 1,248,980 | | |
Philadelphia School District Refunding
Series E
5.000%, due 09/01/18 | | | 1,000,000 | | | | 1,105,680 | | |
University of Pittsburgh of the
Commonwealth System of Higher
Education Capital Project Series B
5.500%, due 09/15/21 | | | 2,000,000 | | | | 2,289,920 | | |
| | | | 9,820,755 | | |
Rhode Island—1.03% | |
Rhode Island Health & Educational
Building Corp. Higher Educational
Facilities Revenue (Brown University)
5.000%, due 09/01/22 | | | 3,500,000 | | | | 4,198,705 | | |
South Carolina—1.25% | |
Columbia Waterworks & Sewer
Systems Refunding
5.000%, due 02/01/28 | | | 2,500,000 | | | | 2,855,875 | | |
Richland County School District
No. 002 Series A (SCSDE Insured)
5.000%, due 02/01/21 | | | 2,000,000 | | | | 2,269,900 | | |
| | | | 5,125,775 | | |
Tennessee—1.42% | |
Metropolitan Government of
Nashville & Davidson County,
Series D
5.000%, due 07/01/23 | | | 5,000,000 | | | | 5,802,000 | | |
Texas—13.07% | |
Arlington Independent School District
School Building Bond
Series A (PSF-GTD)
5.000%, due 02/15/25 | | | 1,400,000 | | | | 1,654,814 | | |
5.000%, due 02/15/26 | | | 1,295,000 | | | | 1,517,287 | | |
Central Texas Turnpike System
Series C
5.000%, due 08/15/31 | | | 2,000,000 | | | | 2,201,400 | | |
City of Brownsville, Texas Utilities
System Revenue Series A
5.000%, due 09/01/28 | | | 2,225,000 | | | | 2,533,118 | | |
Clifton Higher Education Finance
Corp. Revenue Refunding Idea
Public Schools (PSF-GTD)
5.000%, due 08/15/28 | | | 1,100,000 | | | | 1,279,905 | | |
Cypress-Fairbanks Independent
School District (PSF-GTD)
5.000%, due 02/15/25 | | | 2,500,000 | | | | 2,955,975 | | |
Dickinson Independent School District
(PSF-GTD)
5.000%, due 02/15/30 | | | 2,500,000 | | | | 2,890,450 | | |
96
PACE Select Advisors Trust
PACE Municipal Fixed Income Investments
Portfolio of investments—July 31, 2015
| | | Face
amount | | Value | |
Municipal bonds and notes—(continued) | |
Texas—(continued) | |
EL Paso County Hospital District
5.000%, due 08/15/29 | | $ | 2,000,000 | | | $ | 2,176,440 | | |
Harris County Hospital District
Revenue Refunding Senior Lien
Series A (NATL-RE Insured)
5.000%, due 02/15/18 | | | 1,675,000 | | | | 1,767,594 | | |
Harris County Metropolitan
Transportation Authority Sales &
Use Tax Revenue Contractual
Obligations
5.000%, due 11/01/23 | | | 2,000,000 | | | | 2,410,240 | | |
Harris County Metropolitan
Transportation Authority Sales &
Use Tax Revenue Series A
5.000%, due 11/01/29 | | | 2,000,000 | | | | 2,302,640 | | |
Harris County-Houston Sports
Authority Revenue Refunding Senior
Lien Series A
5.000%, due 11/15/29 | | | 1,000,000 | | | | 1,131,580 | | |
Houston Utility System Revenue
First Lien Series D
5.000%, due 11/15/29 | | | 2,000,000 | | | | 2,308,120 | | |
Love Field Airport Modernization
Corp. General Airport Revenue
5.000%, due 11/01/353 | | | 1,700,000 | | | | 1,876,324 | | |
Lower Colorado River Authority
Refunding LCRA Transmission
Services (BHAC Insured)
5.000%, due 05/15/20 | | | 1,765,000 | | | | 1,959,168 | | |
North Texas Health Facilities
Development Corp. Hospital
Revenue United Regional Health
Care Systems (AGM Insured)
5.000%, due 09/01/21 | | | 1,450,000 | | | | 1,564,071 | | |
5.000%, due 09/01/22 | | | 1,400,000 | | | | 1,510,138 | | |
North Texas Tollway Authority
Revenue Refunding Series A
5.000%, due 01/01/31 | | | 2,750,000 | | | | 3,052,775 | | |
5.000%, due 01/01/34 | | | 2,775,000 | | | | 3,045,673 | | |
San Antonio Texas Refunding &
Improvement
5.000%, due 02/01/20 | | | 4,370,000 | | | | 5,070,817 | | |
Socorro Independent School District
Refunding Series A (PSF-GTD)
5.000%, due 08/15/28 | | | 3,885,000 | | | | 4,574,432 | | |
Texas Transportation Commission
State Highway Fund Revenue
Refunding First Tier
5.000%, due 10/01/26 | | | 1,905,000 | | | | 2,351,303 | | |
University of Texas University
Revenues Refunding Financing
System Series D Unrefunded Balance
5.000%, due 08/15/17 | | | 195,000 | | | | 208,079 | | |
| | | Face
amount | | Value | |
Municipal bonds and notes—(concluded) | |
Texas—(concluded) | |
West Travis County Public Utility
Agency Revenue
5.500%, due 08/15/24 | | $ | 1,000,000 | | | $ | 1,174,100 | | |
| | | | 53,516,443 | | |
Utah—0.40% | |
Intermountain Power Agency Power
Supply Revenue Refunding
Subseries A
5.000%, due 07/01/17 | | | 1,500,000 | | | | 1,621,980 | | |
Washington—2.54% | |
Energy Northwest Electric Revenue
Unrefunded (Columbia Station),
Series A
5.000%, due 07/01/23 | | | 1,715,000 | | | | 1,787,270 | | |
Port of Seattle Revenue Refunding
5.500%, due 12/01/221 | | | 500,000 | | | | 590,545 | | |
Port of Seattle Revenue Series C
5.000%, due 04/01/321,3 | | | 1,955,000 | | | | 2,146,179 | | |
Seattle Municipal Lighting & Power
Revenue Refunding & Improvement
Series A
5.000%, due 02/01/22 | | | 2,500,000 | | | | 2,926,750 | | |
Washington State Series A-Various
Purpose
5.000%, due 07/01/20 | | | 2,625,000 | | | | 2,932,493 | | |
| | | | 10,383,237 | | |
Wisconsin—2.17% | |
Wisconsin Health & Educational
Facilities Authority Revenue
(Aspirus, Inc. Obligated Group)
5.000%, due 08/15/27 | | | 1,000,000 | | | | 1,126,890 | | |
Wisconsin Health & Educational
Facilities Authority Revenue (Aurora
Health Care, Inc.) Series A
5.125%, due 04/15/31 | | | 3,000,000 | | | | 3,301,080 | | |
Wisconsin Health & Educational
Facilities Authority Revenue
(Unitypoint Health) Series A
5.000%, due 12/01/26 | | | 1,175,000 | | | | 1,357,383 | | |
WPPI Energy Power Supply Revenue
Series A
5.000%, due 07/01/32 | | | 2,760,000 | | | | 3,096,748 | | |
| | | | 8,882,101 | | |
Total municipal bonds and notes
(cost—$391,609,986) | | | | | 405,621,291 | | |
97
PACE Select Advisors Trust
PACE Municipal Fixed Income Investments
Portfolio of investments—July 31, 2015
| | | Face
amount | | Value | |
Tax-free money market fund—0.45% | |
State Street Institutional Tax Free
Money Market Fund
(cost—$1,851,928) | | $ | 1,851,948 | | | $ | 1,851,928 | | |
Total investments
(cost—$393,461,914)—99.49% | | | | | 407,473,219 | | |
Other assets in excess of
liabilities—0.51% | | | | | 2,075,400 | | |
Net assets—100.00% | | | | $ | 409,548,619 | | |
For a listing of defined portfolio acronyms that are used throughout the Portfolio of investments as well as the tables that follow, please refer to page 254.
Aggregate cost for federal income tax purposes was $393,461,914; and net unrealized appreciation consisted of:
Gross unrealized appreciation | | $ | 15,599,504 | | |
Gross unrealized depreciation | | | (1,588,199 | ) | |
Net unrealized appreciation | | $ | 14,011,305 | | |
Fair valuation summary
The following is a summary of the fair valuations according to the inputs used as of July 31, 2015 in valuing the Portfolio's investments:
Assets
Description | | Unadjusted
quoted prices in
active markets for
identical investments
(Level 1) | | Other significant
observable inputs
(Level 2) | | Unobservable
inputs
(Level 3) | | Total | |
Municipal bonds and notes | | $ | — | | | $ | 405,621,291 | | | $ | — | | | $ | 405,621,291 | | |
Tax-free money market fund | | | — | | | | 1,851,928 | | | | — | | | | 1,851,928 | | |
Total | | $ | — | | | $ | 407,473,219 | | | $ | — | | | $ | 407,473,219 | | |
At July 31, 2015 there were no transfers between Level 1 and Level 2.
Portfolio footnotes
1 Security subject to Alternative Minimum Tax.
2 Variable or floating rate security. The interest rate shown is the current rate as of July 31, 2015 and changes periodically.
3 Security purchased on a when-issued basis. When-issued refers to a transaction made conditionally because a security, although authorized, has not yet been issued.
See accompanying notes to financial statements.
98
PACE Select Advisors Trust
PACE International Fixed Income Investments
Performance (unaudited)
For the 12 months ended July 31, 2015, the Portfolio's Class P shares declined 4.99% before the deduction of the maximum PACE Select program fee.1 In comparison, the Barclays Global Aggregate ex US Index (the "benchmark") fell 12.13%, the Barclays Global Aggregate ex USD 50% Hedged Index declined 4.11% and the Lipper International Income Funds category posted a median return of -8.61%. (Returns for all share classes over various time periods are shown in the "Performance at a glance" table on page 102. Please note that the returns shown do not reflect the deduction of taxes that a shareholder would pay on Portfolio distributions or the redemption of Portfolio shares.) For a detailed commentary on the market environment in general during the reporting period, please refer to page 2.
Sub-advisor's comments2
The Portfolio outperformed its benchmark during the reporting period. Over the period, the investment environment for developed market sovereign bonds was generally favorable, as lackluster global growth, particularly in emerging market economies, put downward pressure on commodity prices and inflation expectations. Most central banks remained very accommodative and further eased monetary policy in many jurisdictions during the fourth quarter of 2014 and the first quarter of 2015. Most notable was the European Central Bank, which embarked on a program of quantitative easing in January 2015.
Against this backdrop, the Portfolio's return was negatively impacted by the bias to be underweight duration over some of the reporting period. In relative value terms, an overweight to peripheral European bonds contributed to returns overall. The only exception was during the second quarter of 2015, when uncertainties regarding Greece's debt repayments and likelihood of default put pressure on Italian and Spanish bonds.
In currencies, our long US dollar bias was rewarded as the US economy experienced relatively stronger growth than other regions. The US dollar was particularly attractive given a sharp decline in many emerging market and commodity exporting economies. Within credit, our preference to own financials over industrial securities was positive for performance.
PACE Select Advisors Trust – PACE International Fixed Income Investments
Investment Sub-Advisor:
Rogge Global Partners plc ("Rogge Global Partners")
Portfolio Managers:
Olaf Rogge, John Graham, Malie Conway, David Jacob and Jonathan Griggs
Objective:
High total return
Investment process:
Rogge Global Partners seeks to invest the Portfolio's assets in fixed income securities of financially healthy issuers, because it believes that these investments produce the highest bond and currency returns over time. In deciding which fixed income securities to buy for the Portfolio, Rogge Global Partners uses a top-down analysis to find value across countries and to forecast interest and currency-exchange rates over a one-year horizon in those countries. Rogge Global Partners generally sells securities that no longer meet these selection criteria or when it identifies more attractive investment opportunities, and may also sell securities to adjust the average duration of the Portfolio.
1 Class P shares held through the PACE Select Advisors Program are subject to a maximum Program fee of 2.50%, which, if included, would have reduced performance. Class P shares held through other advisory programs also may be subject to a program fee, which, if included, would have reduced performance.
2 All sub-advisors discuss performance on a gross-of-fees basis—meaning that no fees or expenses are reflected in their sleeves'/sleeve's performance. Alternately, Portfolio performance is shown net of fees, which does factor in fees and expenses associated with the Portfolio.
99
PACE Select Advisors Trust
PACE International Fixed Income Investments
Sub-advisor's comments – concluded
We utilized derivatives in the Portfolio, mainly interest rate futures and forward foreign exchange contracts. This allowed the Portfolio to take positions in various government bond markets, hedge interest rate exposure and take long and short positions in currencies. Overall, the use of derivatives was beneficial to the Portfolio during the reporting period.
Special considerations
The Portfolio may be appropriate for long-term investors seeking high total return and who are able to withstand short-term fluctuations in the fixed income markets in return for potentially higher returns over the long term. The yield and value of the Portfolio change every day and can be affected by changes in interest rates, general market conditions, and other political, social and economic developments, as well as specific matters relating to the issuers in which the Portfolio invests. It is important to note that an investment in the Portfolio is only one component of a balanced investment plan. The value of the Portfolio's investments in foreign securities may fall due to adverse political, social and economic developments abroad and due to decreases in foreign currency values relative to the US dollar. These risks are greater for investments in emerging markets than in more developed countries.
100
PACE Select Advisors Trust
PACE International Fixed Income Investments
Illustration of an assumed investment of $10,000 in Class P shares of the Portfolio (unaudited)
The following graph depicts the performance of PACE International Fixed Income Investments Class P shares versus the Barclays Global Aggregate ex US Index and the Barclays Global Aggregate ex USD 50% Hedged Index over the 10 years ended July 31, 2015. Class P shares held through advisory programs may be subject to a program fee, which, if included, would have reduced performance. The performance of the other classes will vary based upon the different class specific expenses and sales charges. The performance provided does not reflect the deduction of taxes that a shareholder would pay on Portfolio distributions or the redemption of Portfolio shares. Past performance is no guarantee of future results. Share price and returns will vary with market conditions; investors may realize a gain or loss upon redemption. It is important to note that PACE International Fixed Income Investments is a professionally managed portfolio while the Indices are not available for investment and are unmanaged. The comparison is shown for illustration purposes only.

101
PACE Select Advisors Trust
PACE International Fixed Income Investments
Performance at a glance (unaudited)
Average annual total returns for periods ended 07/31/15 | | 1 year | | 5 years | | 10 years | |
Before deducting maximum sales charge | |
Class A1 | | | (5.17 | )% | | | 0.81 | % | | | 2.91 | % | |
Class C2 | | | (5.55 | ) | | | 0.34 | | | | 2.42 | | |
Class Y3 | | | (5.00 | ) | | | 1.01 | | | | 3.19 | | |
Class P4 | | | (4.99 | ) | | | 1.02 | | | | 3.15 | | |
After deducting maximum sales charge | |
Class A1 | | | (9.44 | ) | | | (0.12 | ) | | | 2.44 | | |
Class C2 | | | (6.24 | ) | | | 0.34 | | | | 2.42 | | |
Barclays Global Aggregate ex US Index5 | | | (12.13 | ) | | | 0.06 | | | | 2.89 | | |
Barclays Global Aggregate ex USD 50% Hedged Index6 | | | (4.11 | ) | | | 2.09 | | | | 3.67 | | |
Lipper International Income Funds median | | | (8.61 | ) | | | 1.47 | | | | 3.56 | | |
Most recent calendar quarter-end returns (unaudited)
Average annual total returns for periods ended 06/30/15 | | 1 year | | 5 years | | 10 years | |
Before deducting maximum sales charge | |
Class A1 | | | (5.67 | )% | | | 1.82 | % | | | 2.81 | % | |
Class C2 | | | (6.04 | ) | | | 1.35 | | | | 2.32 | | |
Class Y3 | | | (5.50 | ) | | | 2.02 | | | | 3.09 | | |
Class P4 | | | (5.49 | ) | | | 2.03 | | | | 3.05 | | |
After deducting maximum sales charge | |
Class A1 | | | (9.90 | ) | | | 0.89 | | | | 2.34 | | |
Class C2 | | | (6.73 | ) | | | 1.35 | | | | 2.32 | | |
The annualized gross and net expense ratios, respectively, for each class of shares as in the November 28, 2014 prospectuses, were as follows: Class A—1.28% and 1.22%; Class C—1.76% and 1.70%; Class Y—1.07% and 1.00%; and Class P—1.10% and 1.00%. Net expenses reflect fee waivers and/or expense reimbursements, if any, pursuant to an agreement that is in effect to cap the expenses. The Portfolio and UBS Global Asset Management (Americas) Inc. ("UBS Global AM") have entered into a written fee waiver/expense reimbursement agreement pursuant to which UBS Global AM is contractually obligated to (1) waive its management fees through November 30, 2015 to the extent necessary to reflect the lower sub-advisory fee paid by UBS Global AM to Rogge Global Partners plc, the Portfolio's investment sub-advisor; and (2) waive its management fees and/or reimburse expenses so that the Portfolio's ordinary total operating expenses of each class through November 30, 2015 (excluding dividend expense, borrowing costs, and interest expense relating to short sales, and expenses attributable to investment in other investment companies, interest, taxes, brokerage commissions and extraordinary expenses) would not exceed Class A—1.25%; Class C—1.75%; Class Y—1.00%; and Class P—1.00%. The Portfolio has agreed to repay UBS Global AM for any waived fees/reimbursed expenses (pursuant to item (2)) to the extent that it can do so over the following three fiscal years without causing the Portfolio's expenses in any of those three years to exceed these expense caps. The fee waiver/expense reimbursement agreement may be terminated by the Portfolio's board at any time and also will terminate automatically upon the expiration or termination of the Portfolio's advisory contract with UBS Global AM. Upon termination of the agreement, however, UBS Global AM's three year recoupment rights will survive.
1 Maximum sales charge for Class A shares is 4.5%. Class A shares bear ongoing 12b-1 service fees.
2 Maximum contingent deferred sales charge for Class C shares is 0.75% imposed on redemptions and is reduced to 0% after one year. Class C shares bear ongoing 12b-1 service and distribution fees.
3 The Portfolio offers Class Y shares to a limited group of eligible investors, including certain qualifying retirement plans. Class Y shares do not bear initial or contingent deferred sales charges or ongoing 12b-1 service and distribution fees.
4 Class P shares do not bear initial or contingent deferred sales charges or ongoing 12b-1 service and distribution fees, but Class P shares held through advisory programs may be subject to a program fee, which, if included, would have reduced performance.
5 The Barclays Global Aggregate ex US Index is an unmanaged index which provides a broad-based measure of the global investment grade fixed income markets excluding the US dollar denominated debt market. The two major components of this Index are the Pan-European Aggregate and the Asian-Pacific Aggregate Indices. The Index also includes Global Treasury, Eurodollar, Euro-Yen, Canadian, and investment grade 144A index-eligible securities not already in the three regional aggregate indices. Investors should note that indices do not reflect the deduction of fees and expenses.
6 The Barclays Global Aggregate ex USD 50% Hedged Index, is an index which provides a broad-based measure of the global investment grade fixed income markets excluding US dollar-denominated debt and provides 50% of its currency exposure in the US dollar. The other major currency exposures in this index are the Euro, the Japanese yen and, to a lesser extent, the British pound and the Canadian dollar. The two major components of this index are the Pan-European Aggregate and the Asian-Pacific Aggregate indices. The index also includes Canadian, Euro-yen, and other non-USD-denominated investment grade aggregate index eligible securities not already in the indices already noted. Investors should note that indices do not reflect the deduction of fees and expenses
Prior to February 17, 2015, if an investor sold or exchanged shares less than 90 days after purchase, a redemption fee of 1.00% of the amount sold or exchanged was deducted at the time of the transaction, except as noted otherwise in the prospectus. For sales or exchanges taking place on or after February 17, 2015 but prior to August 3, 2015, there is a reduction in the redemption holding period from 90 days to 30 days. Effective August 3, 2015, the 1.00% redemption fee imposed on sales or exchanges of any class of shares of the portfolios made during the holding periods specified in the prospectus was eliminated. Please refer to the prospectus for further information.
Past performance does not predict future performance, and the performance information provided does not reflect the deduction of taxes that a shareholder would pay on Portfolio distributions or the redemption of Portfolio shares. The return and principal value of an investment will fluctuate, so that an investor's shares, when redeemed, may be worth more or less than their original cost. Performance results assume reinvestment of all dividends and capital gain distributions at net asset value on the ex-dividend dates. Current performance may be higher or lower than the performance data quoted. For month-end performance figures, please visit http://globalam-us.ubs.com/corpweb/performance.do.
Lipper peer group data calculated by Lipper Inc.; used with permission. The Lipper median is the return of the fund that places in the middle of a Lipper peer group.
102
PACE Select Advisors Trust
PACE International Fixed Income Investments
Portfolio statistics (unaudited)
Characteristics | | 07/31/15 | |
Weighted average duration | | | 6.2 yrs. | | |
Weighted average maturity | | | 10.0 yrs. | | |
Average coupon | | | 3.55 | % | |
Net assets (mm) | | $ | 554.4 | | |
Number of holdings | | | 193 | | |
Portfolio composition1 | | 07/31/15 | |
Long-term global debt securities | | | 95.6 | % | |
US government obligation | | | 2.0 | | |
Futures and forward foreign currency contracts | | | (0.1 | ) | |
Cash equivalents and other assets less liabilities | | | 2.5 | | |
Total | | | 100.0 | % | |
Quality diversification1,2 | | 07/31/15 | |
AAA | | | 6.3 | % | |
AA | | | 7.4 | | |
A | | | 23.0 | | |
BBB | | | 21.6 | | |
BB | | | 3.7 | | |
B | | | 0.7 | | |
Non-rated | | | 34.9 | | |
Futures and forward foreign currency contracts | | | (0.1 | ) | |
Cash equivalents and other assets less liabilities | | | 2.5 | | |
Total | | | 100.0 | % | |
Top five countries of incorporation1 | | 07/31/15 | |
United States | | | 24.5 | % | |
United Kingdom | | | 11.6 | | |
Japan | | | 11.3 | | |
Italy | | | 9.6 | | |
Spain | | | 8.3 | | |
Total | | | 65.3 | % | |
1 Weightings represent percentages of the Portfolio's net assets as of July 31, 2015. The Portfolio is actively managed and its composition will vary over time.
2 Credit quality ratings shown are based on the ratings assigned to portfolio holdings by Standard & Poor's Ratings Group, an independent rating agency.
103
PACE Select Advisors Trust
PACE International Fixed Income Investments
Portfolio of investments—July 31, 2015
| | | Face
amount | | Value | |
Long-term global debt securities—95.62% | |
Australia—0.74% | |
Australia & New Zealand
Banking Group Ltd.
5.125%, due 09/10/191 | | EUR | 1,800,000 | | | $ | 2,314,046 | | |
Westpac Banking Corp.
3.625%, due 02/28/231,2 | | USD | 1,750,000 | | | | 1,799,660 | | |
| | | | | | 4,113,706 | | |
Belgium—1.53% | |
Anheuser-Busch InBev SA
6.500%, due 06/23/171 | | GBP | 1,400,000 | | | | 2,384,310 | | |
Belgium Government Bond
4.250%, due 09/28/221 | | EUR | 4,400,000 | | | | 6,112,380 | | |
| | | | | | 8,496,690 | | |
Canada—3.57% | |
Canadian Government Bond
5.750%, due 06/01/33 | | CAD | 7,960,000 | | | | 9,516,882 | | |
Cards II Trust
3.333%, due 05/15/16 | | CAD | 2,300,000 | | | | 1,791,621 | | |
Royal Bank of Canada
1.400%, due 10/13/17 | | USD | 2,450,000 | | | | 2,446,935 | | |
Toronto-Dominion Bank
1.400%, due 04/30/18 | | USD | 6,050,000 | | | | 6,028,244 | | |
| | | | | | 19,783,682 | | |
Denmark—0.41% | |
Denmark Government Bond
1.500%, due 11/15/23 | | DKK | 14,450,000 | | | | 2,282,364 | | |
Dominican Republic—0.14% | |
Dominican Republic
International Bond
5.500%, due 01/27/251 | | USD | 750,000 | | | | 752,812 | | |
Finland—0.46% | |
Finland Government Bond
3.500%, due 04/15/211 | | EUR | 1,950,000 | | | | 2,538,545 | | |
France—8.19% | |
BNP Paribas Home Loan
SFH SA
2.200%, due 11/02/153 | | USD | 2,400,000 | | | | 2,408,784 | | |
BNP Paribas SA
2.375%, due 09/14/174 | | USD | 5,700,000 | | | | 5,795,680 | | |
4.250%, due 10/15/24 | | USD | 2,950,000 | | | | 2,948,519 | | |
Crown European Holdings SA
4.000%, due 07/15/221 | | EUR | 500,000 | | | | 568,345 | | |
Electricite de France SA
2.750%, due 03/10/231 | | EUR | 2,900,000 | | | | 3,534,724 | | |
4.250%, due 01/29/201,2,5 | | EUR | 1,100,000 | | | | 1,294,443 | | |
France Government Bond
2.250%, due 05/25/241 | | EUR | 7,750,000 | | | | 9,587,118 | | |
3.250%, due 10/25/211 | | EUR | 5,200,000 | | | | 6,721,790 | | |
4.750%, due 04/25/351 | | EUR | 3,300,000 | | | | 5,554,316 | | |
Numericable-SFR
5.375%, due 05/15/221 | | EUR | 950,000 | | | | 1,085,072 | | |
| | | Face
amount | | Value | |
Long-term global debt securities—(continued) | |
France—(concluded) | |
Republic of France
4.000%, due 04/25/551 | | EUR | 450,000 | | | $ | 772,834 | | |
Societe Generale SA
2.750%, due 10/12/17 | | USD | 4,150,000 | | | | 4,247,069 | | |
5.200%, due 04/15/211 | | USD | 800,000 | | | | 897,737 | | |
| | | | | | 45,416,431 | | |
Germany—1.53% | |
Bundesrepublik Deutschland
5.500%, due 01/04/311 | | EUR | 3,450,000 | | | | 6,225,117 | | |
Trionista Holdco GmbH
5.000%, due 04/30/201 | | EUR | 800,000 | | | | 909,351 | | |
Unitymedia Hessen GmbH & Co.
KG/Unitymedia NRW GmbH
3.500%, due 01/15/273 | | EUR | 200,000 | | | | 211,468 | | |
4.000%, due 01/15/251 | | EUR | 1,000,000 | | | | 1,120,216 | | |
| | | | | | 8,466,152 | | |
Indonesia—0.45% | |
Indonesia Government
International Bond
3.375%, due 04/15/231 | | USD | 2,600,000 | | | | 2,466,750 | | |
Ireland—0.88% | |
Ardagh Packaging Finance PLC/
Ardagh Holdings USA, Inc.
4.250%, due 01/15/223 | | EUR | 1,000,000 | | | | 1,106,970 | | |
German Residential
Funding PLC
1.138%, due 08/27/241,2 | | EUR | 1,875,890 | | | | 2,075,649 | | |
Willow No.2 Ireland PLC for
Zurich Insurance Co. Ltd.
3.375%, due 06/27/221 | | EUR | 1,350,000 | | | | 1,675,758 | | |
| | | | | | 4,858,377 | | |
Italy—9.60% | |
Assicurazioni Generali SpA
2.875%, due 01/14/201 | | EUR | 100,000 | | | | 118,321 | | |
Buoni Poliennali Del Tesoro
4.500%, due 02/01/201 | | EUR | 7,200,000 | | | | 9,233,476 | | |
4.750%, due 09/01/21 | | EUR | 3,700,000 | | | | 4,920,932 | | |
Enel SpA
6.500%, due 01/10/741,2 | | EUR | 900,000 | | | | 1,098,369 | | |
Intesa Sanpaolo SpA
4.375%, due 10/15/191 | | EUR | 1,200,000 | | | | 1,486,662 | | |
Italy Buoni Poliennali
Del Tesoro
1.500%, due 06/01/25 | | EUR | 6,800,000 | | | | 7,285,404 | | |
3.250%, due 09/01/461 | | EUR | 1,600,000 | | | | 1,915,391 | | |
3.750%, due 09/01/24 | | EUR | 2,000,000 | | | | 2,563,532 | | |
4.500%, due 03/01/24 | | EUR | 4,950,000 | | | | 6,654,124 | | |
4.750%, due 09/15/16 | | EUR | 7,050,000 | | | | 8,149,002 | | |
4.750%, due 09/01/441 | | EUR | 1,400,000 | | | | 2,127,706 | | |
5.000%, due 09/01/401 | | EUR | 4,000,000 | | | | 6,169,471 | | |
104
PACE Select Advisors Trust
PACE International Fixed Income Investments
Portfolio of investments—July 31, 2015
| | | Face
amount | | Value | |
Long-term global debt securities—(continued) | |
Italy—(concluded) | |
UniCredit SpA
3.375%, due 01/11/181 | | EUR | 1,300,000 | | | $ | 1,515,961 | | |
| | | | | | 53,238,351 | | |
Japan—11.26% | |
Development Bank of Japan
2.300%, due 03/19/26 | | JPY | 500,000,000 | | | | 4,797,906 | | |
Government of Japan
2.200%, due 09/20/26 | | JPY | 1,016,100,000 | | | | 9,705,155 | | |
2.300%, due 06/20/35 | | JPY | 1,177,000,000 | | | | 11,386,040 | | |
2.300%, due 12/20/36 | | JPY | 480,000,000 | | | | 4,641,517 | | |
Japan Government Thirty
Year Bond
2.000%, due 09/20/41 | | JPY | 882,600,000 | | | | 8,121,188 | | |
Japan Government Twenty
Year Bond
2.100%, due 09/20/29 | | JPY | 891,200,000 | | | | 8,517,293 | | |
Mizuho Bank Ltd.
1.300%, due 04/16/173 | | USD | 5,900,000 | | | | 5,875,574 | | |
Sumitomo Mitsui Banking Corp.
1.950%, due 07/23/18 | | USD | 800,000 | | | | 802,136 | | |
3.200%, due 07/18/22 | | USD | 2,600,000 | | | | 2,610,413 | | |
The Bank of Tokyo-Mitsubishi
UFJ Ltd.
1.450%, due 09/08/173 | | USD | 6,000,000 | | | | 5,974,902 | | |
| | | | | | 62,432,124 | | |
Kazakhstan—0.20% | |
Kazakhstan Government
International Bond
3.875%, due 10/14/241 | | USD | 1,200,000 | | | | 1,110,000 | | |
Liberia—0.07% | |
Royal Caribbean Cruises Ltd.
5.250%, due 11/15/22 | | USD | 350,000 | | | | 362,670 | | |
Luxembourg—1.25% | |
Actavis Funding SCS
3.450%, due 03/15/22 | | USD | 4,350,000 | | | | 4,279,047 | | |
Fiat Chrysler Finance Europe
4.750%, due 07/15/221 | | EUR | 100,000 | | | | 117,073 | | |
KION Finance SA
6.750%, due 02/15/201 | | EUR | 950,000 | | | | 1,101,504 | | |
Wind Acquisition Finance SA
4.000%, due 07/15/201 | | EUR | 1,250,000 | | | | 1,401,986 | | |
| | | | | | 6,899,610 | | |
Malaysia—0.28% | |
Malaysia Government Bond,
Series 0111
4.160%, due 07/15/21 | | MYR | 5,800,000 | | | | 1,546,869 | | |
Mexico—2.40% | |
Mexican Bonos
6.500%, due 06/10/21 | | MXN | 48,430,000 | | | | 3,141,539 | | |
6.500%, due 06/09/22 | | MXN | 157,500,000 | | | | 10,158,376 | | |
| | | | | | 13,299,915 | | |
| | | Face
amount | | Value | |
Long-term global debt securities—(continued) | |
Netherlands—4.60% | |
ABN AMRO Bank N.V.
4.250%, due 02/02/171 | | USD | 4,000,000 | | | $ | 4,160,632 | | |
6.375%, due 04/27/211 | | EUR | 1,100,000 | | | | 1,484,655 | | |
Deutsche Telekom
International Finance BV
2.250%, due 03/06/173 | | USD | 2,650,000 | | | | 2,683,308 | | |
EDP Finance BV
4.125%, due 01/15/203 | | USD | 800,000 | | | | 814,752 | | |
Enel Finance International N.V.
1.966%, due 01/27/25 | | EUR | 1,014,000 | | | | 1,136,820 | | |
5.000%, due 09/14/221 | | EUR | 1,100,000 | | | | 1,501,637 | | |
ING Bank N.V.
3.750%, due 03/07/173 | | USD | 3,150,000 | | | | 3,264,496 | | |
6.125%, due 05/29/232 | | EUR | 1,450,000 | | | | 1,789,542 | | |
Linde Finance BV
3.125%, due 12/12/18 | | EUR | 2,050,000 | | | | 2,461,182 | | |
Netherlands Government Bond
4.000%, due 01/15/371 | | EUR | 1,900,000 | | | | 3,152,963 | | |
Samvardhana Motherson
Automotive Systems Group BV
4.125%, due 07/15/211 | | EUR | 1,050,000 | | | | 1,169,769 | | |
Telefonica Europe BV
5.875%, due 03/31/241,2,5 | | EUR | 800,000 | | | | 957,455 | | |
UPC Holding BV
6.750%, due 03/15/233 | | EUR | 750,000 | | | | 901,938 | | |
| | | | | | 25,479,149 | | |
Norway—0.13% | |
DnB Bank ASA
4.375%, due 02/24/211 | | EUR | 570,000 | | | | 740,939 | | |
Poland—0.22% | |
Poland Government Bond
5.750%, due 09/23/22 | | PLN | 3,850,000 | | | | 1,220,710 | | |
Romania—0.17% | |
Romanian Government
International Bond
2.875%, due 10/28/241 | | EUR | 850,000 | | | | 952,216 | | |
South Korea—2.13% | |
Korea Treasury Bond
3.000%, due 09/10/24 | | KRW | 4,709,000,000 | | | | 4,210,227 | | |
5.750%, due 09/10/18 | | KRW | 7,924,710,000 | | | | 7,568,456 | | |
| | | | | | 11,778,683 | | |
Spain—8.34% | |
BBVA Senior Finance SAU
2.375%, due 01/22/191 | | EUR | 2,000,000 | | | | 2,319,619 | | |
Iberdrola Finanzas SAU
4.125%, due 03/23/20 | | EUR | 1,800,000 | | | | 2,270,152 | | |
Santander International
Debt SAU
4.000%, due 01/24/201 | | EUR | 1,900,000 | | | | 2,365,711 | | |
Spain Government Bond
1.600%, due 04/30/251 | | EUR | 5,600,000 | | | | 6,012,279 | | |
3.800%, due 04/30/241 | | EUR | 2,150,000 | | | | 2,746,947 | | |
105
PACE Select Advisors Trust
PACE International Fixed Income Investments
Portfolio of investments—July 31, 2015
| | | Face
amount | | Value | |
Long-term global debt securities—(continued) | |
Spain—(concluded) | |
4.250%, due 10/31/16 | | EUR | 7,600,000 | | | $ | 8,785,190 | | |
4.400%, due 10/31/231 | | EUR | 2,250,000 | | | | 2,986,034 | | |
4.900%, due 07/30/401 | | EUR | 1,250,000 | | | | 1,868,097 | | |
5.150%, due 10/31/441 | | EUR | 5,050,000 | | | | 7,963,961 | | |
5.850%, due 01/31/221 | | EUR | 6,350,000 | | | | 8,937,879 | | |
| | | | | | 46,255,869 | | |
Sweden—2.41% | |
Government of Sweden
3.500%, due 06/01/22 | | SEK | 18,225,000 | | | | 2,554,341 | | |
4.250%, due 03/12/19 | | SEK | 14,830,000 | | | | 1,992,576 | | |
Nordea Bank AB
3.125%, due 03/20/173 | | USD | 5,200,000 | | | | 5,353,312 | | |
Swedbank AB
2.125%, due 09/29/173 | | USD | 3,450,000 | | | | 3,484,655 | | |
| | | | | | 13,384,884 | | |
Switzerland—0.42% | |
Credit Suisse Group Funding
Guernsey Ltd.
2.750%, due 03/26/203 | | USD | 2,350,000 | | | | 2,337,061 | | |
United Kingdom—11.64% | |
Anglian Water Services
Finance PLC
6.250%, due 06/27/16 | | EUR | 1,900,000 | | | | 2,197,270 | | |
AngloGold Ashanti
Holdings PLC
8.500%, due 07/30/204 | | USD | 1,200,000 | | | | 1,227,418 | | |
Arkle Master Issuer PLC
3.986%, due 08/17/171 | | GBP | 1,050,000 | | | | 1,721,822 | | |
4.681%, due 02/17/171 | | GBP | 700,000 | | | | 1,145,517 | | |
Barclays Bank PLC
5.140%, due 10/14/20 | | USD | 1,100,000 | | | | 1,205,903 | | |
BAT International Finance PLC
3.625%, due 11/09/211 | | EUR | 1,050,000 | | | | 1,330,086 | | |
Coventry Building Society
2.250%, due 12/04/171 | | EUR | 4,200,000 | | | | 4,792,675 | | |
HSBC Holdings PLC
4.250%, due 03/14/24 | | USD | 2,700,000 | | | | 2,747,790 | | |
Hutchison Whampoa
International 14 Ltd.
1.625%, due 10/31/173 | | USD | 3,450,000 | | | | 3,424,223 | | |
Imperial Tobacco Finance PLC
2.950%, due 07/21/203 | | USD | 4,100,000 | | | | 4,082,546 | | |
Lloyds TSB Bank PLC
6.500%, due 03/24/201 | | EUR | 1,400,000 | | | | 1,864,034 | | |
Penarth Master Issuer PLC
0.588%, due 05/18/192,3 | | USD | 3,300,000 | | | | 3,290,582 | | |
Rio Tinto Finance USA PLC
2.000%, due 03/22/17 | | USD | 1,550,000 | | | | 1,559,915 | | |
Royal Bank of Scotland PLC
6.125%, due 01/11/21 | | USD | 1,500,000 | | | | 1,742,349 | | |
Silverstone Master Issuer PLC
0.953%, due 01/21/702,3 | | GBP | 1,400,000 | | | | 2,184,730 | | |
5.063%, due 10/21/161 | | GBP | 1,300,000 | | | | 2,118,301 | | |
| | | Face
amount | | Value | |
Long-term global debt securities—(continued) | |
United Kingdom—(concluded) | |
Taurus 2013 GMF1 PLC,
Class A
1.038%, due 05/21/241,2 | | EUR | 1,158,823 | | | $ | 1,277,132 | | |
United Kingdom Gilt
3.250%, due 01/22/441 | | GBP | 4,600,000 | | | | 8,178,694 | | |
4.500%, due 09/07/341 | | GBP | 6,800,000 | | | | 13,954,725 | | |
United Kingdom Treasury
Bonds
4.250%, due 12/07/551 | | GBP | 1,970,000 | | | | 4,494,697 | | |
| | | | | | 64,540,409 | | |
United States—22.60% | |
ABB Treasury Center USA, Inc.
2.500%, due 06/15/163 | | USD | 2,350,000 | | | | 2,381,882 | | |
Activision Blizzard, Inc.
5.625%, due 09/15/213 | | USD | 1,350,000 | | | | 1,417,500 | | |
AES Corp.
3.283%, due 06/01/192 | | USD | 1,450,000 | | | | 1,435,500 | | |
American Express Credit Corp.
2.375%, due 03/24/17 | | USD | 7,400,000 | | | | 7,529,034 | | |
American International
Group, Inc.
4.875%, due 06/01/22 | | USD | 1,150,000 | | | | 1,270,950 | | |
AT&T, Inc.
1.300%, due 09/05/23 | | EUR | 550,000 | | | | 590,877 | | |
2.400%, due 03/15/24 | | EUR | 900,000 | | | | 1,041,059 | | |
2.500%, due 03/15/23 | | EUR | 1,300,000 | | | | 1,523,669 | | |
Bank of America Corp.
2.000%, due 01/11/18 | | USD | 3,850,000 | | | | 3,863,032 | | |
Branch Banking & Trust Co.
3.800%, due 10/30/26 | | USD | 1,600,000 | | | | 1,629,582 | | |
Capital One NA/Mclean VA
1.500%, due 09/05/17 | | USD | 1,800,000 | | | | 1,787,429 | | |
Caterpillar Financial
Services Corp.
1.000%, due 03/03/174 | | USD | 2,900,000 | | | | 2,897,744 | | |
CCO Holdings LLC/CCO
Holdings Capital Corp.
6.625%, due 01/31/22 | | USD | 950,000 | | | | 1,003,438 | | |
CCO Safari II LLC
3.579%, due 07/23/203 | | USD | 1,150,000 | | | | 1,153,397 | | |
Cigna Corp.
3.250%, due 04/15/25 | | USD | 3,800,000 | | | | 3,599,254 | | |
Cisco Systems, Inc.
1.100%, due 03/03/17 | | USD | 2,800,000 | | | | 2,809,867 | | |
Citigroup Commercial
Mortgage Trust 2014-388G,
Class A
0.937%, due 06/15/332,3 | | USD | 1,800,000 | | | | 1,790,878 | | |
Citigroup, Inc.
2.150%, due 07/30/18 | | USD | 1,050,000 | | | | 1,053,524 | | |
Commercial Mortgage
Pass-Through Certificates,
Series 2012-9W57, Class A
2.365%, due 02/10/293 | | USD | 1,000,000 | | | | 1,015,329 | | |
106
PACE Select Advisors Trust
PACE International Fixed Income Investments
Portfolio of investments—July 31, 2015
| | | Face
amount | | Value | |
Long-term global debt securities—(continued) | |
United States—(continued) | |
Constellation Energy Group, Inc.
5.150%, due 12/01/20 | | USD | 2,600,000 | | | $ | 2,875,930 | | |
CVS Health Corp.
2.800%, due 07/20/20 | | USD | 4,150,000 | | | | 4,186,732 | | |
Daimler Finance North
America LLC
1.125%, due 03/10/173 | | USD | 2,850,000 | | | | 2,835,781 | | |
DB Master Finance LLC,
Series 2015-1A, Class A2I
3.262%, due 02/20/453 | | USD | 3,441,375 | | | | 3,466,814 | | |
Duke Energy Corp.
2.100%, due 06/15/18 | | USD | 550,000 | | | | 556,310 | | |
3.050%, due 08/15/22 | | USD | 1,150,000 | | | | 1,142,661 | | |
Ford Credit Auto Owner Trust,
Series 2014-2, Class A
2.310%, due 04/15/263 | | USD | 2,950,000 | | | | 2,975,184 | | |
Ford Motor Credit Co. LLC
1.684%, due 09/08/17 | | USD | 2,850,000 | | | | 2,834,804 | | |
5.000%, due 05/15/18 | | USD | 1,500,000 | | | | 1,610,496 | | |
General Electric Capital Corp.
6.000%, due 08/07/19 | | USD | 2,250,000 | | | | 2,584,303 | | |
Glencore Funding LLC
2.125%, due 04/16/183,4 | | USD | 1,200,000 | | | | 1,183,424 | | |
GRACE 2014-GRCE Mortgage
Trust, Class A
3.369%, due 06/10/283 | | USD | 2,200,000 | | | | 2,280,498 | | |
Hilton USA Trust,
Series 2013-HLT3
2.662%, due 11/05/30 | | USD | 2,980,000 | | | | 2,986,639 | | |
International Lease Finance
Corp.
8.875%, due 09/01/174 | | USD | 1,100,000 | | | | 1,225,125 | | |
Jarden Corp.
3.750%, due 10/01/211 | | EUR | 1,100,000 | | | | 1,242,578 | | |
JBS USA LLC/JBS USA
Finance, Inc.
7.250%, due 06/01/211 | | USD | 750,000 | | | | 785,625 | | |
JPMorgan Chase & Co.
1.350%, due 02/15/17 | | USD | 1,750,000 | | | | 1,751,619 | | |
3.125%, due 01/23/25 | | USD | 4,350,000 | | | | 4,181,742 | | |
Kraft Heinz Foods Co.
3.500%, due 07/15/223 | | USD | 1,000,000 | | | | 1,008,438 | | |
Morgan Stanley
2.800%, due 06/16/20 | | USD | 900,000 | | | | 904,915 | | |
5.500%, due 07/28/21 | | USD | 2,400,000 | | | | 2,702,669 | | |
Morgan Stanley Capital I
Trust 2014-CPT, Class A
3.350%, due 07/13/293 | | USD | 3,850,000 | | | | 3,982,471 | | |
New York Life Global Funding
1.650%, due 05/15/173 | | USD | 2,700,000 | | | | 2,726,430 | | |
OBP Depositor LLC Trust,
Series 2010-OBP, Class A
4.646%, due 07/15/453 | | USD | 1,348,000 | | | | 1,482,646 | | |
| | | Face
amount | | Value | |
Long-term global debt securities—(concluded) | |
United States—(concluded) | |
PPG Industries, Inc.
0.875%, due 03/13/22 | | EUR | 2,200,000 | | | $ | 2,350,896 | | |
PPL Capital Funding, Inc.
3.950%, due 03/15/24 | | USD | 700,000 | | | | 715,861 | | |
Prudential Financial, Inc.
3.500%, due 05/15/24 | | USD | 2,950,000 | | | | 2,931,542 | | |
Reliance Holding USA, Inc.
5.400%, due 02/14/223 | | USD | 2,300,000 | | | | 2,502,974 | | |
Reynolds American, Inc.
2.300%, due 06/12/18 | | USD | 350,000 | | | | 353,107 | | |
Roche Holdings, Inc.
6.500%, due 03/04/211 | | EUR | 2,000,000 | | | | 2,882,921 | | |
Sempra Energy
3.550%, due 06/15/24 | | USD | 2,900,000 | | | | 2,883,815 | | |
SunTrust Banks, Inc.
2.350%, due 11/01/18 | | USD | 1,900,000 | | | | 1,910,019 | | |
Synchrony Financial
1.875%, due 08/15/174 | | USD | 1,750,000 | | | | 1,749,832 | | |
2.700%, due 02/03/20 | | USD | 1,300,000 | | | | 1,280,711 | | |
The Coca-Cola Co
0.217%, due 09/09/192 | | EUR | 1,200,000 | | | | 1,317,425 | | |
The Goldman Sachs Group, Inc.
3.750%, due 05/22/25 | | USD | 600,000 | | | | 598,391 | | |
5.750%, due 01/24/22 | | USD | 2,350,000 | | | | 2,691,018 | | |
UnitedHealth Group, Inc.
2.700%, due 07/15/20 | | USD | 1,450,000 | | | | 1,466,913 | | |
2.750%, due 02/15/23 | | USD | 1,500,000 | | | | 1,444,857 | | |
Verizon Communications, Inc.
2.375%, due 02/17/22 | | EUR | 800,000 | | | | 939,607 | | |
Wells Fargo & Co.
4.100%, due 06/03/26 | | USD | 3,950,000 | | | | 3,971,950 | | |
| | | | | | 125,299,618 | | |
Total long-term global
debt securities
(cost—$559,230,530) | | | | | 530,054,586 | | |
US government obligations—1.92% | |
US Treasury Notes
2.125%, due 06/30/22 | | USD | 9,050,000 | | | | 9,161,713 | | |
2.125%, due 05/15/25 | | USD | 1,500,000 | | | | 1,489,688 | | |
Total US government
obligations
(cost—$10,525,900) | | | | | 10,651,401 | | |
107
PACE Select Advisors Trust
PACE International Fixed Income Investments
Portfolio of investments—July 31, 2015
| | | Face
amount | | Value | |
Repurchase agreement—0.74% | |
Repurchase agreement dated
07/31/15 with State Street Bank
and Trust Co., 0.000% due
08/03/15, collateralized by
$1,186,188 Federal Home
Loan Mortgage Corp. obligations,
2.080% due 10/17/22, $297,674
Federal National Mortgage
Association obligations, 2.170%
due 10/17/22 and $2,654,234
US Treasury Notes, 1.625% to
3.625% due 03/31/19 to
06/30/20; (value—$4,207,568);
proceeds: $4,125,000
(cost—$4,125,000) | | $ | 4,125,000 | | | $ | 4,125,000 | | |
| | | Number of
shares | | Value | |
Investment of cash collateral from securities loaned—0.56% | |
Money market fund—0.56% | |
UBS Private Money Market
Fund LLC6
(cost—$3,074,700) | | | 3,074,700 | | | $ | 3,074,700 | | |
Total investments
(cost—$576,956,130)—98.84% | | | | | 547,905,687 | | |
Other assets in excess of
liabilities—1.16% | | | | | 6,446,060 | | |
Net assets—100.00% | | $ | 554,351,747 | | |
For a listing of defined portfolio acronyms, counterparty acronyms and currency abbreviations that are used throughout the Portfolio of investments as well as the tables that follow, please refer to page 254.
Aggregate cost for federal income tax purposes was $582,767,540; and net unrealized depreciation consisted of:
Gross unrealized appreciation | | $ | 9,564,118 | | |
Gross unrealized depreciation | | | (44,425,971 | ) | |
Net unrealized depreciation | | $ | (34,861,853 | ) | |
Futures contracts
Number of
contracts | | Currency | | | | Expiration
date | | Cost | | Current
value | | Unrealized
appreciation
(depreciation) | |
Interest rate futures buy contracts: | | | |
| | 87 | | | AUD | | | | Australian Bond 10 Year Futures | | September 2015 | | $ | 7,905,361 | | | $ | 8,126,678 | | | $ | 221,317 | | |
| | 94 | | | CAD | | | | Canada Government Bond 10 Year Futures | | September 2015 | | | 10,005,777 | | | | 10,283,687 | | | | 277,910 | | |
| | 66 | | | EUR | | | | German Euro BOBL Futures | | September 2015 | | | 9,390,463 | | | | 9,445,460 | | | | 54,997 | | |
| | 3 | | | EUR | | | | German Euro Buxl 30 Year Futures | | September 2015 | | | 485,994 | | | | 513,981 | | | | 27,987 | | |
| | 609 | | | EUR | | | | German Euro Schatz Futures | | September 2015 | | | 74,382,449 | | | | 74,437,948 | | | | 55,499 | | |
| | 128 | | | GBP | | | | United Kingdom Long Gilt Bond Futures | | September 2015 | | | 23,402,451 | | | | 23,447,251 | | | | 44,800 | | |
| | 34 | | | JPY | | | | Japan Government Bond 10 Year Futures | | September 2015 | | | 40,314,286 | | | | 40,478,477 | | | | 164,191 | | |
| | | | | | | | | | | $ | 165,886,781 | | | $ | 166,733,482 | | | $ | 846,701 | | |
| | | | | | | | | Proceeds | | | | | |
Interest rate futures sell contracts: | | | |
| | 73 | | | EUR | | | | German Euro Bund Futures | | September 2015 | | $ | 12,075,241 | | | $ | 12,378,602 | | | $ | (303,361 | ) | |
US Treasury futures sell contracts: | | | |
| | 3 | | | USD | | | | US Long Bond Futures | | September 2015 | | | 464,093 | | | | 467,812 | | | | (3,719 | ) | |
| | 209 | | | USD | | | | US Treasury Note 2 Year Futures | | September 2015 | | | 45,682,109 | | | | 45,784,063 | | | | (101,954 | ) | |
| | 680 | | | USD | | | | US Treasury Note 5 Year Futures | | September 2015 | | | 81,113,843 | | | | 81,493,750 | | | | (379,907 | ) | |
| | 751 | | | USD | | | | US Treasury Note 10 Year Futures | | September 2015 | | | 95,241,134 | | | | 95,705,563 | | | | (464,429 | ) | |
| | | | | | | | | | | $ | 234,576,420 | | | $ | 235,829,790 | | | $ | (1,253,370 | ) | |
| | | | | | | | | | | | | | | $ | (406,669 | ) | |
108
PACE Select Advisors Trust
PACE International Fixed Income Investments
Portfolio of investments—July 31, 2015
Forward foreign currency contracts
Counterparty | | Contracts to
deliver | | In
exchange for | | Maturity
date | | Unrealized
appreciation
(depreciation) | |
CITI | | GBP | 1,005,860 | | | USD | 1,570,148 | | | 08/13/15 | | $ | (552 | ) | |
CITI | | USD | 187,470 | | | DKK | 1,266,774 | | | 08/13/15 | | | (1,002 | ) | |
CITI | | USD | 12,705,663 | | | GBP | 8,150,000 | | | 08/13/15 | | | 20,956 | | |
CITI | | USD | 1,569,468 | | | GBP | 1,005,860 | | | 10/14/15 | | | 573 | | |
CITI | | USD | 459,990 | | | NZD | 690,000 | | | 08/13/15 | | | (4,859 | ) | |
CITI | | USD | 1,075,050 | | | SEK | 9,230,000 | | | 08/13/15 | | | (4,967 | ) | |
CITI | | USD | 1,408,538 | | | SGD | 1,916,779 | | | 09/10/15 | | | (12,900 | ) | |
CSI | | CAD | 13,603,489 | | | USD | 10,495,710 | | | 08/13/15 | | | 94,985 | | |
CSI | | EUR | 834,302 | | | CZK | 22,900,000 | | | 09/10/15 | | | 12,179 | | |
CSI | | NZD | 1,784,421 | | | USD | 1,189,674 | | | 08/13/15 | | | 12,652 | | |
CSI | | USD | 10,495,710 | | | CAD | 13,609,367 | | | 10/14/15 | | | (94,383 | ) | |
CSI | | USD | 54,133,623 | | | JPY | 6,689,400,000 | | | 08/13/15 | | | (154,252 | ) | |
CSI | | USD | 1,183,981 | | | NZD | 1,784,421 | | | 10/14/15 | | | (12,697 | ) | |
DB | | EUR | 5,055,000 | | | NOK | 45,616,320 | | | 10/14/15 | | | 18,573 | | |
DB | | KRW | 7,839,094,000 | | | USD | 7,022,922 | | | 09/10/15 | | | 331,383 | | |
DB | | MYR | 2,770,000 | | | USD | 745,225 | | | 09/10/15 | | | 23,127 | | |
DB | | USD | 2,954,047 | | | CHF | 2,850,000 | | | 08/13/15 | | | (3,821 | ) | |
DB | | USD | 1,396,419 | | | EUR | 1,242,682 | | | 08/13/15 | | | (31,497 | ) | |
DB | | USD | 22,138,541 | | | GBP | 14,210,000 | | | 08/13/15 | | | 51,061 | | |
DB | | USD | 11,010,000 | | | JPY | 1,359,817,575 | | | 08/13/15 | | | (37,103 | ) | |
DB | | USD | 831,864 | | | MXN | 12,809,488 | | | 09/10/15 | | | (39,042 | ) | |
DB | | USD | 488,434 | | | NOK | 4,000,000 | | | 08/13/15 | | | 1,156 | | |
DB | | USD | 1,401,028 | | | TRY | 3,888,000 | | | 09/10/15 | | | (13,076 | ) | |
GSI | | AUD | 14,220,791 | | | USD | 10,381,178 | | | 08/13/15 | | | (8,961 | ) | |
GSI | | EUR | 17,132,545 | | | USD | 18,952,022 | | | 08/13/15 | | | 134,181 | | |
GSI | | GBP | 8,962,023 | | | USD | 13,989,718 | | | 08/13/15 | | | (4,914 | ) | |
GSI | | JPY | 10,371,952,156 | | | USD | 83,903,252 | | | 08/13/15 | | | 207,936 | | |
GSI | | MXN | 359,321,439 | | | USD | 23,043,766 | | | 09/10/15 | | | 804,160 | | |
GSI | | USD | 5,636,835 | | | AUD | 7,273,946 | | | 08/13/15 | | | (322,271 | ) | |
GSI | | USD | 114,385 | | | AUD | 156,846 | | | 08/13/15 | | | 211 | | |
GSI | | USD | 10,346,905 | | | AUD | 14,220,791 | | | 10/14/15 | | | 8,752 | | |
GSI | | USD | 403,541 | | | CAD | 524,333 | | | 08/13/15 | | | (2,655 | ) | |
GSI | | USD | 88,284,731 | | | EUR | 79,875,847 | | | 08/13/15 | | | (551,650 | ) | |
GSI | | USD | 18,968,126 | | | EUR | 17,132,545 | | | 10/14/15 | | | (133,659 | ) | |
GSI | | USD | 6,131,160 | | | GBP | 4,000,000 | | | 08/13/15 | | | 115,033 | | |
GSI | | USD | 13,983,893 | | | GBP | 8,962,023 | | | 10/14/15 | | | 4,874 | | |
GSI | | USD | 2,056,848 | | | GBP | 1,314,053 | | | 10/14/15 | | | (5,751 | ) | |
GSI | | USD | 83,903,252 | | | JPY | 10,361,967,669 | | | 10/14/15 | | | (211,075 | ) | |
GSI | | USD | 10,750,012 | | | MXN | 171,024,098 | | | 09/10/15 | | | (164,759 | ) | |
GSI | | USD | 1,007,583 | | | ZAR | 12,530,000 | | | 09/10/15 | | | (23,522 | ) | |
JPMCB | | CZK | 6,400,000 | | | EUR | 233,214 | | | 09/10/15 | | | (3,352 | ) | |
JPMCB | | DKK | 1,266,774 | | | EUR | 170,016 | | | 08/13/15 | | | 273 | | |
JPMCB | | EUR | 3,463,432 | | | CHF | 3,597,329 | | | 08/13/15 | | | (80,287 | ) | |
JPMCB | | EUR | 784,000 | | | USD | 865,009 | | | 08/13/15 | | | 3,889 | | |
JPMCB | | SEK | 14,450,026 | | | EUR | 1,539,989 | | | 08/13/15 | | | 16,207 | | |
109
PACE Select Advisors Trust
PACE International Fixed Income Investments
Portfolio of investments—July 31, 2015
Forward foreign currency contracts—(concluded)
Counterparty | | Contracts to
deliver | | In
exchange for | | Maturity
date | | Unrealized
appreciation
(depreciation) | |
JPMCB | | USD | 4,955,783 | | | AUD | 6,790,000 | | | 08/13/15 | | $ | 5,195 | | |
JPMCB | | USD | 10,110,645 | | | CAD | 13,079,156 | | | 08/13/15 | | | (110,806 | ) | |
JPMCB | | USD | 594,426 | | | GBP | 383,022 | | | 08/13/15 | | | 3,682 | | |
JPMCB | | USD | 563,515 | | | MXN | 9,200,000 | | | 09/10/15 | | | 5,904 | | |
JPMCB | | USD | 777,066 | | | NZD | 1,094,421 | | | 08/13/15 | | | (55,176 | ) | |
JPMCB | | USD | 957,106 | | | ZAR | 12,140,000 | | | 09/10/15 | | | (3,675 | ) | |
MSCI | | CHF | 6,447,329 | | | EUR | 6,056,673 | | | 08/13/15 | | | (21,607 | ) | |
MSCI | | EUR | 6,056,673 | | | CHF | 6,438,971 | | | 10/14/15 | | | 21,498 | | |
MSCI | | EUR | 576,006 | | | NOK | 5,018,924 | | | 08/13/15 | | | (18,362 | ) | |
MSCI | | EUR | 1,000,502 | | | NOK | 9,038,934 | | | 10/14/15 | | | 4,948 | | |
MSCI | | EUR | 550,287 | | | SEK | 5,220,026 | | | 08/13/15 | | | 767 | | |
MSCI | | EUR | 78,815,651 | | | USD | 87,678,471 | | | 08/13/15 | | | 1,109,875 | | |
MSCI | | GBP | 16,775,139 | | | USD | 25,589,887 | | | 08/13/15 | | | (605,303 | ) | |
MSCI | | NOK | 9,018,924 | | | EUR | 1,000,502 | | | 08/13/15 | | | (4,976 | ) | |
MSCI | | SEK | 5,217,798 | | | EUR | 550,287 | | | 10/14/15 | | | (736 | ) | |
MSCI | | USD | 12,751,292 | | | EUR | 11,436,212 | | | 08/13/15 | | | (190,122 | ) | |
MSCI | | USD | 1,215,181 | | | EUR | 1,100,000 | | | 10/14/15 | | | (5,909 | ) | |
MSCI | | USD | 18,697,803 | | | JPY | 2,322,734,581 | | | 08/13/15 | | | 45,246 | | |
MSCI | | USD | 4,513,092 | | | KRW | 5,256,850,000 | | | 09/10/15 | | | (25,786 | ) | |
MSCI | | USD | 1,841,933 | | | MYR | 7,050,000 | | | 09/10/15 | | | (4,105 | ) | |
MSCI | | USD | 709,683 | | | RUB | 43,610,000 | | | 09/10/15 | | | (9,988 | ) | |
| | | | | | | | | $ | 79,718 | | |
Fair valuation summary
The following is a summary of the fair valuations according to the inputs used as of July 31, 2015 in valuing the Portfolio's investments: | |
Assets
Description | | Unadjusted
quoted prices in
active markets for
identical investments
(Level 1) | | Other significant
observable inputs
(Level 2) | | Unobservable
inputs
(Level 3) | | Total | |
Long-term global debt securities | | $ | — | | | $ | 530,054,586 | | | $ | — | | | $ | 530,054,586 | | |
US government obligations | | | — | | | | 10,651,401 | | | | — | | | | 10,651,401 | | |
Repurchase agreement | | | — | | | | 4,125,000 | | | | — | | | | 4,125,000 | | |
Investment of cash collateral from securities loaned | | | — | | | | 3,074,700 | | | | — | | | | 3,074,700 | | |
Futures contracts | | | 846,701 | | | | — | | | | — | | | | 846,701 | | |
Forward foreign currency contracts | | | — | | | | 3,059,276 | | | | — | | | | 3,059,276 | | |
Total | | $ | 846,701 | | | $ | 550,964,963 | | | $ | — | | | $ | 551,811,664 | | |
Liabilities | |
Futures contracts | | $ | (1,253,370 | ) | | $ | — | | | $ | — | | | $ | (1,253,370 | ) | |
Forward foreign currency contracts | | | — | | | | (2,979,558 | ) | | | — | | | | (2,979,558 | ) | |
Total | | $ | (1,253,370 | ) | | $ | (2,979,558 | ) | | $ | — | | | $ | (4,232,928 | ) | |
At July 31, 2015, there were no transfers between Level 1 and Level 2.
110
PACE Select Advisors Trust
PACE International Fixed Income Investments
Portfolio of investments—July 31, 2015
Investments by type of issuer (unaudited)
| | | Percentage of total investments | |
| | | Long-term | | Short-term | |
Government and other public issuers | | | 48.64 | % | | | — | | |
Repurchase agreement | | | — | | | | 0.75 | % | |
Banks and other financial institutions | | | 35.39 | | | | — | | |
Industrial | | | 14.66 | | | | — | | |
Investment of cash collateral from securities loaned | | | — | | | | 0.56 | | |
| | | | 98.69 | % | | | 1.31 | % | |
Portfolio footnotes
1 Security exempt from registration pursuant to Regulation S under the Securities Act of 1933. Regulation S applies to securities offerings that are made outside of the United States and do not involve direct selling efforts in the United States. At July 31, 2015, the value of these securities amounted to 32.99% of net assets.
2 Variable or floating rate security. The interest rate shown is the current rate as of July 31, 2015 and changes periodically.
3 Security exempt from registration pursuant to Rule 144A under the Securities Act of 1933. These securities, which represent 14.90% of net assets as of July 31, 2015, are considered liquid and may be resold in transactions exempt from registration, normally to qualified institutional buyers.
4 Security, or portion thereof, was on loan at July 31, 2015.
5 Perpetual investment. The maturity date reflects the next call date.
6 The table below details the Portfolio's transaction activity in an affiliated issuer during the year ended July 31, 2015. The investment manager earns a management fee from UBS Private Money Market Fund LLC. Please see the Notes to financial statements for further information.
Security description | | Value at
07/31/14 | | Purchases
during the
year ended
07/31/15 | | Sales
during the
year ended
07/31/15 | | Value at
07/31/15 | | Net income
earned from
affiliate for the
year ended
07/31/15 | |
UBS Private Money Market Fund LLC | | $ | 1,325,980 | | | $ | 26,522,173 | | | $ | 24,773,453 | | | $ | 3,074,700 | | | $ | 66 | | |
See accompanying notes to financial statements.
111
PACE Select Advisors Trust
PACE High Yield Investments
Performance (unaudited)
For the 12 months ended July 31, 2015, the Portfolio's Class P shares declined 2.14% before the deduction of the maximum PACE Select program fee.1 In comparison, the BofA Merrill Lynch Global High Yield Index (Hedged in USD) (the "benchmark") gained 0.73%, and the Lipper High Yield Funds category posted a median return of 0.07%. (Returns for all share classes over various time periods are shown in the "Performance at a glance" table on page 115. Please note that the returns shown do not reflect the deduction of taxes that a shareholder would pay on Portfolio distributions or the redemption of Portfolio shares.) For a detailed commentary on the market environment in general during the reporting period, please refer to page 2.
Sub-advisor's comments2
Please note: MacKay Shields was terminated as a sub-advisor for the Portfolio effective as of the close of business on June 30, 2015. On July 1, 2015, Nomura Corporate Research and Asset Management began serving as a sub-advisor for this Portfolio.
MacKay Shields
For the period from August 1, 2014 through June 30, 2015, when MacKay Shields subadvised the Portfolio, we underperformed the benchmark. Our positioning emphasized credit risk and deemphasized interest rate risk. From a regional standpoint, we maintained an overweight position in US high yield and held underweight positions in European high yield and emerging markets high yield corporate securities. In terms of sectors, our exposure to automotive was helpful, particularly Fiat and Ford. Security selection within banking, primarily non-US dollar financials, also proved beneficial.
Conversely, our underweight to Russian issuers hindered returns. During the first quarter of 2015, Russian debt was downgraded to high yield and many Russian issuers entered the benchmark. On the whole, Russian issuers rose over 21% during the first half of 2015, as compared to a 3.3% rise in the benchmark. In addition, our exposure to several energy and metals & mining companies, including Samson, Arch Coal and Alpha Natural Resources, weighed on performance and were sold prior to the end of the reporting period. Lastly,
PACE Select Advisors Trust – PACE High Yield Investments
Investment Sub-Advisor:
MacKay Shields LLC ("MacKay Shields");
Nomura Corporate Research and Asset Management Inc. and Nomura Asset Management Management Singapore Limited ("NCRAM")
Portfolio Managers:
MacKay Shields: Dan Roberts, Taylor Wagenseil, Michael Kimble and Lou Cohen;
NCRAM: David Crall, CFA, Stephen Kotsen, CFA, Steven Rosenthal, CFA, Elizabeth Gunning, CFA, Simon Tan, CFA
Objective:
Total return
Investment process:
MacKay Shields attempts to deliver attractive risk-adjusted returns by avoiding most of the unusually large losses in the high yield market, even if it means giving up much of the large potential gains. MacKay Shields believes that there is a very small subset of bonds that delivers outsized gains in the market. Due to the limited upside inherent in most bonds, over time, outsized gains are expected to be smaller than unusually large losses. By attempting to limit the Portfolio's participation in the extremes of the market, MacKay Shields strives to add value over a market cycle with lower volatility. MacKay Shields seeks to do this through a rigorous process that attempts to screen out what it believes to be the riskiest issuers in the market.
NCRAM seeks to capture the global high yield bond market's attractive total returns
1 Class P shares held through the PACE Select Advisors Program are subject to a maximum Program fee of 2.50%, which, if included, would have reduced performance. Class P shares held through other advisory programs also may be subject to a program fee, which, if included, would have reduced performance.
2 All sub-advisors discuss performance on a gross-of-fees basis—meaning that no fees or expenses are reflected in their sleeves'/sleeve's performance. Alternately, Portfolio performance is shown net of fees, which does factor in fees and expenses associated with the Portfolio.
112
PACE Select Advisors Trust
PACE High Yield Investments
Sub-advisor's comments – concluded
issuer-specific risk in certain developing market holdings detracted from returns. Leading detractors included Virgolino, one of Brazil's oldest and largest sugar and ethanol producers, and OAS, a Brazilian engineering and infrastructure company. Virgolino and OAS were sold prior to the end of the reporting period.
We maintained a shorter duration posture than the benchmark through the use of US Treasury futures. This position had a negative impact on performance. As the carry cost of the futures position increased, we slightly pared back this exposure. Currency forwards were used during the reporting period to hedge the currency exposure of our portion of the Portfolio into US dollars.
Nomura Corporate Research and Asset Management
We began managing the Portfolio on July 1, 2015. From that day through July 31, 2015, we outperformed the benchmark. We increased our exposure to European high yield debt to roughly the market weight to reflect positive credit trends in that region. We reduced our overweight to US high yield debt and maintained an underweight to emerging markets high yield debt. From a sector perspective, an underweight and positive security selection in energy, and exploration and production contributed to results. Negative credit selection in the banking, steel producers, and oilfield equipment and services sectors were the largest detractors from performance, from an issuer perspective. In contrast, Linn Energy and AK Steel detracted the most from performance as oil and other commodity prices remained under pressure.
Except for the purpose of currency hedging, derivatives were not used in the portfolio during the reporting period.
Investment process (concluded)
while minimizing losses by identifying "Strong Horse" companies that can carry their debt load through the economic cycle. NCRAM invests in the debt of such companies to seek yield and capital appreciation while managing the overall risk of the portfolio.
Special considerations
The Portfolio may be appropriate for long-term investors seeking total return and who are able to withstand short-term fluctuations in the fixed income markets in return for potentially higher returns over the long term. The Portfolio seeks to achieve its objective by investing primarily in a professionally managed, diversified portfolio of fixed income securities rated below investment grade or considered to be of comparable quality (commonly referred to as "junk bonds"). These securities are subject to higher risks than investment grade securities, including greater price volatility and a greater risk of loss of principal and nonpayment of interest. Issuers of such securities are typically in poor financial health, and their ability to pay interest and principal is uncertain. The prices of such securities may be more vulnerable to bad economic news, or even the expectation of bad news, than higher rated or investment grade bonds and other fixed income securities. The value of the Portfolio changes every day and can be affected by changes in interest rates, general market conditions, and other political, social and economic developments, as well as specific matters relating to the issuers in which the Portfolio invests. In addition, investments in foreign bonds involve special risks. It is important to note that an investment in the Portfolio is only one component of a balanced investment plan.
113
PACE Select Advisors Trust
PACE High Yield Investments
Illustration of an assumed investment of $10,000 in Class P shares of the Portfolio (unaudited)
The following graph depicts the performance of PACE High Yield Investments Class P shares versus the BofA Merrill Lynch Global High Yield Index (Hedged in USD) from April 30, 2006, which is the month-end after the inception date of the Class P shares, through July 31, 2015. Class P shares held through advisory programs may be subject to a program fee, which, if included, would have reduced performance. The performance of the other classes will vary based upon the different class specific expenses and sales charges. The performance provided does not reflect the deduction of taxes that a shareholder would pay on Portfolio distributions or the redemption of Portfolio shares. Past performance is no guarantee of future results. Share price and returns will vary with market conditions; investors may realize a gain or loss upon redemption. It is important to note that PACE High Yield Investments is a professionally managed portfolio while the Index is not available for investment and is unmanaged. The comparison is shown for illustration purposes only.
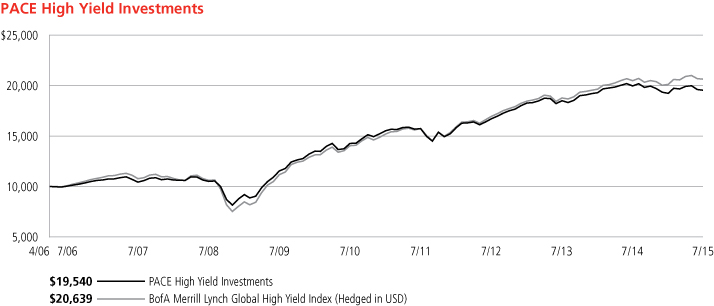
114
PACE Select Advisors Trust
PACE High Yield Investments
Performance at a glance (unaudited)
Average annual total returns for periods ended 07/31/15 | | 1 year | | 5 years | | Since
Inception1 | |
Before deducting maximum sales charge | |
Class A2 | | | (2.29 | )% | | | 6.25 | % | | | 7.24 | % | |
Class C3 | | | (2.83 | ) | | | 5.77 | | | | 11.53 | | |
Class Y4 | | | (2.13 | ) | | | 6.51 | | | | 13.79 | | |
Class P5 | | | (2.14 | ) | | | 6.49 | | | | 7.49 | | |
After deducting maximum sales charge | |
Class A2 | | | (6.68 | ) | | | 5.27 | | | | 6.71 | | |
Class C3 | | | (3.52 | ) | | | 5.77 | | | | 11.53 | | |
BofA Merrill Lynch Global High Yield Index (Hedged in USD)6 | | | 0.73 | | | | 8.00 | | | | 8.15 | | |
Lipper High Yield Funds median | | | 0.07 | | | | 6.80 | | | | 6.46 | | |
Most recent calendar quarter-end returns (unaudited)
Average annual total returns for periods ended 06/30/15 | | 1 year | | 5 years | | Since
Inception1 | |
Before deducting maximum sales charge | |
Class A2 | | | (3.15 | )% | | | 7.13 | % | | | 7.36 | % | |
Class C3 | | | (3.59 | ) | | | 6.65 | | | | 11.76 | | |
Class Y4 | | | (2.88 | ) | | | 7.42 | | | | 14.07 | | |
Class P5 | | | (2.90 | ) | | | 7.38 | | | | 7.60 | | |
After deducting maximum sales charge | |
Class A2 | | | (7.52 | ) | | | 6.16 | | | | 6.82 | | |
Class C3 | | | (4.27 | ) | | | 6.65 | | | | 11.76 | | |
The annualized gross and net expense ratios, respectively, for each class of shares as in the November 28, 2014 prospectuses, were as follows: Class A—1.26% and 1.26%; Class C—1.72% and 1.72%; Class Y—1.00% and 1.00%; and Class P—1.10% and 1.03%. Net expenses reflect fee waivers and/or expense reimbursements, if any, pursuant to an agreement that is in effect to cap the expenses. The Portfolio and UBS Global Asset Management (Americas) Inc. ("UBS Global AM") have entered into a written fee waiver/expense reimbursement agreement pursuant to which UBS Global AM is contractually obligated to waive its management fees and/or reimburse expenses so that the Portfolio's ordinary total operating expenses through November 30, 2015 (excluding dividend expense, borrowing costs, and interest expense relating to short sales, and expenses attributable to investment in other investment companies, interest, taxes, brokerage commissions and extraordinary expenses) would not exceed Class A—1.28%; Class C—1.78%; Class Y—1.03%; and Class P—1.03%. The Portfolio has agreed to repay UBS Global AM for any waived fees/reimbursed expenses to the extent that it can do so over the following three fiscal years without causing the Portfolio's expenses in any of those three years to exceed this expense cap. The fee waiver/expense reimbursement agreement may be terminated by the Portfolio's board at any time and also will terminate automatically upon the expiration or termination of the Portfolio's advisory contract with UBS Global AM. Upon termination of the agreement, however, UBS Global AM's three year recoupment rights will survive.
1 Since inception returns are calculated as of commencement of issuance on April 10, 2006 for Class P shares, May 1, 2006 for Class A shares and January 21, 2009 for Class C shares. Class Y shares commenced issuance on April 3, 2006 and had fully redeemed by July 24, 2006 remaining inactive through December 25, 2008. The inception return of Class Y shares is calculated from December 26, 2008, which is the date the Class Y shares recommenced investment operations. Since inception returns for the Index and Lipper median are shown as of April 30, 2006, which is the month-end after the inception date of the oldest share class (Class P).
2 Maximum sales charge for Class A shares is 4.5%. Class A shares bear ongoing 12b-1 service fees.
3 Maximum contingent deferred sales charge for Class C shares is 0.75% imposed on redemptions and is reduced to 0% after one year. Class C shares bear ongoing 12b-1 service and distribution fees.
4 The Portfolio offers Class Y shares to a limited group of eligible investors, including certain qualifying retirement plans. Class Y shares do not bear initial or contingent deferred sales charges or ongoing 12b-1 service and distribution fees.
5 Class P shares do not bear initial or contingent deferred sales charges or ongoing 12b-1 service and distribution fees, but Class P shares held through advisory programs may be subject to a program fee, which, if included, would have reduced performance
6 The BofA Merrill Lynch Global High Yield Index (Hedged in USD) is an unmanaged index which covers US dollar, Canadian dollar, sterling and euro-denominated fixed rate debt of corporate issuers domiciled in an investment grade rated country (i.e., BBB or higher foreign currency long-term debt rating). Individual bonds must be rated below investment grade (i.e., BB or lower based on a composite of Moody's and S&P) but not in default; and must have at least one year remaining term to maturity; a minimum face value outstanding of $100 million, C$100 million, 50 million pounds sterling or 100 million euros; and have available price quotations. New issues qualify for inclusion after they settle. Investors should note that indices do not reflect the deduction of fees and expenses.
Prior to February 17, 2015, if an investor sold or exchanged shares less than 90 days after purchase, a redemption fee of 1.00% of the amount sold or exchanged was deducted at the time of the transaction, except as noted otherwise in the prospectus. For sales or exchanges taking place on or after February 17, 2015 but prior to August 3, 2015, there is a reduction in the redemption holding period from 90 days to 30 days. Effective August 3, 2015, the 1.00% redemption fee imposed on sales or exchanges of any class of shares of the portfolios made during the holding periods specified in the prospectus was eliminated. Please refer to the prospectus for further information.
Past performance does not predict future performance, and the performance information provided does not reflect the deduction of taxes that a shareholder would pay on Portfolio distributions or the redemption of Portfolio shares. The return and principal value of an investment will fluctuate, so that an investor's shares, when redeemed, may be worth more or less than their original cost. Performance results assume reinvestment of all dividends and capital gain distributions at net asset value on the ex-dividend dates. Current performance may be higher or lower than the performance data quoted. For month-end performance figures, please visit http://globalam-us.ubs.com/corpweb/performance.do.
Lipper peer group data calculated by Lipper Inc.; used with permission. The Lipper median is the return of the fund that places in the middle of a Lipper peer group.
115
PACE Select Advisors Trust
PACE High Yield Investments
Portfolio statistics (unaudited)
Characteristics | | 07/31/15 | |
Weighted average duration | | | 4.4 yrs. | | |
Weighted average maturity | | | 7.5 yrs. | | |
Average coupon | | | 6.76 | % | |
Net assets (mm) | | $ | 438.4 | | |
Number of holdings | | | 407 | | |
Portfolio composition1 | | 07/31/15 | |
Bonds and loan assignments | | | 93.7 | % | |
Common stocks and warrants | | | 0.4 | | |
Forward foreign currency contracts | | | 0.1 | | |
Cash equivalents and other assets less liabilities | | | 5.8 | | |
Total | | | 100.0 | % | |
Quality diversification1,2 | | 07/31/15 | |
BB & higher | | | 42.0 | % | |
B | | | 33.1 | | |
CCC & lower | | | 12.2 | | |
Not rated | | | 6.8 | | |
Forward foreign currency contracts | | | 0.1 | | |
Cash equivalents and other assets less liabilities | | | 5.8 | | |
Total | | | 100.0 | % | |
Asset allocation1 | | 07/31/15 | |
Corporate bonds | | | 92.0 | % | |
Loan assignments | | | 1.7 | | |
Common stocks and warrants | | | 0.4 | | |
Forward foreign currency contracts | | | 0.1 | | |
Cash equivalents and other assets less liabilities | | | 5.8 | | |
Total | | | 100.0 | % | |
1 Weightings represent percentages of the Portfolio's net assets as of July 31, 2015. The Portfolio is actively managed and its composition will vary over time.
2 Credit quality ratings shown are based on the ratings assigned to portfolio holdings by Standard & Poor's Ratings Group, an independent rating agency.
116
PACE Select Advisors Trust
PACE High Yield Investments
Portfolio of investments—July 31, 2015
| | | Face
amount1 | | Value | |
Corporate bonds—91.96% | |
Aerospace & defense—2.03% | |
KLX, Inc.
5.875%, due 12/01/222,3 | | | 1,945,000 | | | $ | 1,954,725 | | |
Spirit AeroSystems, Inc.
5.250%, due 03/15/22 | | | 3,000,000 | | | | 3,082,500 | | |
TA MFG. Ltd.
3.625%, due 04/15/234 | | EUR | 1,000,000 | | | | 1,066,409 | | |
TransDigm, Inc.
6.000%, due 07/15/22 | | | 1,610,000 | | | | 1,605,975 | | |
6.500%, due 07/15/24 | | | 1,200,000 | | | | 1,206,000 | | |
| | | | 8,915,609 | | |
Airlines—1.20% | |
American Airlines Group, Inc.
4.625%, due 03/01/202 | | | 2,250,000 | | | | 2,199,375 | | |
Continental Airlines Pass
Through Trust 2003-ERJ1,
Series RJ03
7.875%, due 07/02/18 | | | 413,391 | | | | 432,511 | | |
Continental Airlines Pass
Through Trust 2004-ERJ1,
Series RJ04
9.558%, due 09/01/19 | | | 459,876 | | | | 497,816 | | |
Continental Airlines Pass
Through Trust 2005-ERJ1,
Series ERJ1
9.798%, due 04/01/21 | | | 1,397,003 | | | | 1,544,387 | | |
US Airways Pass Through
Trust 2012-1, Class B
8.000%, due 10/01/19 | | | 518,897 | | | | 582,462 | | |
| | | | 5,256,551 | | |
Auto & truck—1.41% | |
Autodis SA
6.500%, due 02/01/194 | | EUR | 625,000 | | | | 714,721 | | |
Faurecia
3.125%, due 06/15/224 | | EUR | 950,000 | | | | 1,013,864 | | |
GIE PSA Tresorerie
6.000%, due 09/19/33 | | EUR | 1,350,000 | | | | 1,763,109 | | |
Navistar International Corp.
8.250%, due 11/01/213 | | | 1,102,000 | | | | 1,040,718 | | |
Samvardhana Motherson
Automotive Systems Group BV
4.125%, due 07/15/214 | | EUR | 1,500,000 | | | | 1,671,098 | | |
| | | | 6,203,510 | | |
Automotive parts—0.51% | |
Goodyear Tire & Rubber Co.
6.500%, due 03/01/213 | | | 400,000 | | | | 423,500 | | |
8.250%, due 08/15/20 | | | 420,000 | | | | 438,900 | | |
MPG Holdco I, Inc.
7.375%, due 10/15/22 | | | 1,305,000 | | | | 1,386,628 | | |
| | | | 2,249,028 | | |
| | | Face
amount1 | | Value | |
Corporate bonds—(continued) | |
Banking-non-US—3.07% | |
Banco Bilbao Vizcaya Argentaria SA
6.750%, due 02/18/204,5,6 | | EUR | 800,000 | | | $ | 888,817 | | |
Banco Continental SAECA
8.875%, due 10/15/172 | | | 1,500,000 | | | | 1,549,500 | | |
Banco do Brasil SA
5.875%, due 01/26/222 | | | 450,000 | | | | 430,200 | | |
Banco Santander SA
6.250%, due 03/12/194,5,6 | | EUR | 700,000 | | | | 770,699 | | |
HBOS Capital Funding LP
6.461%, due 11/30/184,5,6 | | GBP | 450,000 | | | | 748,421 | | |
HBOS PLC
5.125%, due 10/14/155,6 | | EUR | 1,250,000 | | | | 1,378,304 | | |
ICICI Bank Ltd.
6.375%, due 04/30/224,5 | | | 1,300,000 | | | | 1,344,213 | | |
Royal Bank of Scotland Group PLC
7.092%, due 09/29/175,6 | | EUR | 600,000 | | | | 700,135 | | |
Royal Bank of Scotland PLC
9.500%, due 03/16/224,5 | | | 2,750,000 | | | | 3,034,320 | | |
Sberbank of Russia Via SB
Capital SA
5.125%, due 10/29/224 | | | 2,000,000 | | | | 1,740,000 | | |
UniCredit Bank Luxembourg SA
8.125%, due 12/10/194,5,6 | | EUR | 700,000 | | | | 876,404 | | |
| | | | 13,461,013 | | |
Banking-US—1.16% | |
ABN Amro Bank NV
4.310%, due 03/10/165,6 | | EUR | 830,000 | | | | 918,613 | | |
Dresdner Funding Trust I
8.151%, due 06/30/312 | | | 1,600,000 | | | | 2,008,000 | | |
Wachovia Capital Trust III
5.570%, due 08/31/153,5,6 | | | 750,000 | | | | 742,031 | | |
Wells Fargo & Co.
5.900%, due 06/15/245,6 | | | 1,430,000 | | | | 1,438,151 | | |
| | | | 5,106,795 | | |
Building & construction—2.49% | |
Beazer Homes USA, Inc.
5.750%, due 06/15/193 | | | 500,000 | | | | 497,500 | | |
8.125%, due 06/15/16 | | | 835,000 | | | | 870,488 | | |
K. Hovnanian Enterprises, Inc.
6.250%, due 01/15/16 | | | 315,000 | | | | 315,000 | | |
7.250%, due 10/15/202 | | | 1,240,000 | | | | 1,252,400 | | |
KB Home
7.500%, due 09/15/22 | | | 1,485,000 | | | | 1,536,975 | | |
Meritage Homes Corp.
6.000%, due 06/01/252 | | | 1,165,000 | | | | 1,176,650 | | |
Pulte Group, Inc.
6.375%, due 05/15/33 | | | 567,000 | | | | 575,505 | | |
7.875%, due 06/15/32 | | | 870,000 | | | | 1,000,500 | | |
Shea Homes LP/Shea Homes
Funding Corp.
6.125%, due 04/01/252,3 | | | 2,225,000 | | | | 2,275,062 | | |
Standard Pacific Corp.
6.250%, due 12/15/213 | | | 1,335,000 | | | | 1,425,112 | | |
| | | | 10,925,192 | | |
117
PACE Select Advisors Trust
PACE High Yield Investments
Portfolio of investments—July 31, 2015
| | | Face
amount1 | | Value | |
Corporate bonds—(continued) | |
Building products—1.72% | |
Associated Materials LLC
9.125%, due 11/01/17 | | | 1,810,000 | | | $ | 1,538,500 | | |
BMBG Bond Finance SCA
4.981%, due 10/15/204,5 | | EUR | 782,000 | | | | 863,126 | | |
Builders FirstSource, Inc.
10.750%, due 08/15/232,3 | | | 1,050,000 | | | | 1,081,500 | | |
Cemex SAB de CV
4.375%, due 03/05/234 | | EUR | 650,000 | | | | 689,378 | | |
Lafarge SA
6.750%, due 12/16/194 | | EUR | 925,000 | | | | 1,200,937 | | |
Nortek, Inc.
8.500%, due 04/15/21 | | | 550,000 | | | | 588,500 | | |
USG Corp.
9.750%, due 01/15/18 | | | 690,000 | | | | 784,875 | | |
Wienerberger AG
6.500%, due 02/09/215,6 | | EUR | 700,000 | | | | 802,240 | | |
| | | | 7,549,056 | | |
Building products-cement—0.12% | |
HeidelbergCement Finance BV
7.500%, due 04/03/204 | | EUR | 395,000 | | | | 537,403 | | |
Cable—2.08% | |
CCO Holdings LLC/CCO Holdings
Capital Corp.
5.125%, due 02/15/23 | | | 675,000 | | | | 669,094 | | |
5.250%, due 09/30/22 | | | 200,000 | | | | 202,500 | | |
5.750%, due 09/01/233 | | | 200,000 | | | | 204,750 | | |
5.750%, due 01/15/243 | | | 1,250,000 | | | | 1,272,656 | | |
6.500%, due 04/30/21 | | | 275,000 | | | | 287,547 | | |
Cequel Communications
Holdings I LLC/Cequel
Capital Corp.
6.375%, due 09/15/202 | | | 1,325,000 | | | | 1,334,937 | | |
Dish DBS Corp.
5.875%, due 07/15/22 | | | 730,000 | | | | 726,350 | | |
6.750%, due 06/01/21 | | | 835,000 | | | | 883,013 | | |
Numericable-SFR SAS
5.625%, due 05/15/244 | | EUR | 1,000,000 | | | | 1,126,256 | | |
6.000%, due 05/15/222,3 | | | 600,000 | | | | 610,500 | | |
Unitymedia Hessen GmbH & Co.
KG/Unitymedia NRW GmbH
4.000%, due 01/15/254 | | EUR | 1,000,000 | | | | 1,120,216 | | |
5.625%, due 04/15/234 | | EUR | 562,500 | | | | 667,360 | | |
| | | | 9,105,179 | | |
Car rental—1.42% | |
Avis Budget Car Rental LLC/Avis
Budget Finance, Inc.
5.125%, due 06/01/222 | | | 1,600,000 | | | | 1,592,000 | | |
5.500%, due 04/01/233 | | | 170,000 | | | | 170,850 | | |
Hertz Corp.
5.875%, due 10/15/203 | | | 450,000 | | | | 457,875 | | |
6.250%, due 10/15/223 | | | 1,500,000 | | | | 1,530,000 | | |
7.375%, due 01/15/213 | | | 885,000 | | | | 922,612 | | |
| | | Face
amount1 | | Value | |
Corporate bonds—(continued) | |
Car rental—(concluded) | |
Loxam SAS
7.000%, due 07/23/224 | | EUR | 500,000 | | | $ | 562,919 | | |
7.375%, due 01/24/204 | | EUR | 850,000 | | | | 991,858 | | |
| | | | 6,228,114 | | |
Chemicals—2.63% | |
Hexion, Inc.
8.875%, due 02/01/18 | | | 1,100,000 | | | | 957,000 | | |
Huntsman International LLC
5.125%, due 04/15/21 | | EUR | 675,000 | | | | 770,972 | | |
5.125%, due 11/15/222,3 | | | 3,450,000 | | | | 3,329,250 | | |
Ineos Finance PLC
4.000%, due 05/01/234 | | EUR | 575,000 | | | | 618,864 | | |
Momentive Performance
Materials, Inc.
4.690%, due 04/24/223 | | | 685,000 | | | | 561,700 | | |
Perstorp Holding AB
11.000%, due 08/15/174 | | | 1,750,000 | | | | 1,837,500 | | |
PSPC Escrow Corp.
6.000%, due 02/01/234 | | EUR | 625,000 | | | | 697,733 | | |
SPCM SA
6.000%, due 01/15/222 | | | 1,720,000 | | | | 1,758,700 | | |
The Chemours Co.
6.125%, due 05/15/234 | | EUR | 575,000 | | | | 573,207 | | |
7.000%, due 05/15/252 | | | 475,000 | | | | 416,665 | | |
| | | | 11,521,591 | | |
Coal—0.18% | |
Arch Coal, Inc.
7.000%, due 06/15/19 | | | 825,000 | | | | 92,813 | | |
7.250%, due 10/01/20 | | | 275,000 | | | | 63,250 | | |
7.250%, due 06/15/213 | | | 460,000 | | | | 50,600 | | |
8.000%, due 01/15/192 | | | 930,000 | | | | 134,850 | | |
Cloud Peak Energy Resources LLC/
Cloud Peak Energy Finance Corp.
6.375%, due 03/15/24 | | | 225,000 | | | | 137,250 | | |
Peabody Energy Corp.
6.000%, due 11/15/183 | | | 825,000 | | | | 301,125 | | |
| | | | 779,888 | | |
Commercial services—1.78% | |
Ancestry.com Holdings LLC
9.625%, due 10/15/182,7 | | | 800,000 | | | | 821,000 | | |
Iron Mountain Europe PLC
6.125%, due 09/15/224 | | GBP | 917,000 | | | | 1,482,155 | | |
Iron Mountain, Inc.
5.750%, due 08/15/24 | | | 1,465,000 | | | | 1,475,988 | | |
6.000%, due 08/15/23 | | | 1,025,000 | | | | 1,066,000 | | |
8.375%, due 08/15/213 | | | 258,000 | | | | 265,611 | | |
Stork Technical Services Holdco BV
11.000%, due 08/15/174 | | EUR | 1,000,000 | | | | 1,074,968 | | |
Waste Italia SpA
10.500%, due 11/15/194 | | EUR | 1,750,000 | | | | 1,614,428 | | |
| | | | 7,800,150 | | |
118
PACE Select Advisors Trust
PACE High Yield Investments
Portfolio of investments—July 31, 2015
| | | Face
amount1 | | Value | |
Corporate bonds—(continued) | |
Computer software & services—2.27% | |
Blue Coat Holdings, Inc.
8.375%, due 06/01/232 | | | 350,000 | | | $ | 357,875 | | |
Infor Software Parent LLC/Infor
Software Parent, Inc.
7.125%, due 05/01/212,3,7 | | | 875,000 | | | | 859,687 | | |
Infor US, Inc.
5.750%, due 05/15/224 | | EUR | 1,650,000 | | | | 1,820,268 | | |
InterXion Holding NV
6.000%, due 07/15/204 | | EUR | 500,000 | | | | 585,258 | | |
NCR Corp.
4.625%, due 02/15/213 | | | 1,870,000 | | | | 1,868,822 | | |
6.375%, due 12/15/233 | | | 905,000 | | | | 953,644 | | |
Oberthur Technologies Holding SAS
9.250%, due 04/30/204 | | EUR | 594,000 | | | | 698,842 | | |
Sungard Data Systems, Inc.
6.625%, due 11/01/19 | | | 2,225,000 | | | | 2,299,626 | | |
TeamSystem Holding SpA
7.375%, due 05/15/204 | | EUR | 450,000 | | | | 522,136 | | |
| | | | 9,966,158 | | |
Consumer products—1.89% | |
Albea Beauty Holdings SA
8.375%, due 11/01/192 | | | 1,800,000 | | | | 1,912,500 | | |
American Achievement Corp.
10.875%, due 04/15/162 | | | 175,000 | | | | 171,937 | | |
Cosan Luxembourg SA
5.000%, due 03/14/232 | | | 200,000 | | | | 174,000 | | |
Icon Health & Fitness, Inc.
11.875%, due 10/15/162 | | | 675,000 | | | | 671,625 | | |
Jarden Corp.
3.750%, due 10/01/214 | | EUR | 700,000 | | | | 790,732 | | |
Ontex Group NV
4.750%, due 11/15/214 | | EUR | 500,000 | | | | 580,975 | | |
Service Corp. International
5.375%, due 05/15/24 | | | 2,300,000 | | | | 2,438,000 | | |
TRI Pointe Holdings, Inc.
5.875%, due 06/15/24 | | | 1,575,000 | | | | 1,551,375 | | |
| | | | 8,291,144 | | |
Containers & packaging—3.02% | |
Ardagh Finance Holdings SA
8.375%, due 06/15/194,7 | | EUR | 900,000 | | | | 1,018,138 | | |
Ardagh Packaging Finance PLC
9.250%, due 10/15/204 | | EUR | 225,000 | | | | 260,697 | | |
Ardagh Packaging Finance PLC/
Ardagh Holdings USA, Inc.
6.750%, due 01/31/212,3 | | | 3,050,000 | | | | 3,126,250 | | |
Ardagh Packaging Finance PLC/
Ardagh Holdings USA, Inc.
7.000%, due 11/15/202 | | | 290,294 | | | | 293,197 | | |
Crown European Holdings SA
3.375%, due 05/15/254 | | EUR | 550,000 | | | | 564,775 | | |
4.000%, due 07/15/224 | | EUR | 500,000 | | | | 568,345 | | |
Horizon Holdings I SASU
7.250%, due 08/01/23 | | EUR | 700,000 | | | | 778,385 | | |
| | | Face
amount1 | | Value | |
Corporate bonds—(continued) | |
Containers & packaging—(concluded) | |
Horizon Holdings III SASU
5.125%, due 08/01/22 | | EUR | 1,150,000 | | | $ | 1,277,197 | | |
Kloeckner Pentaplast of
America, Inc.
7.125%, due 11/01/202 | | EUR | 870,000 | | | | 972,295 | | |
Owens-Brockway Glass
Container, Inc.
5.000%, due 01/15/222,3 | | | 985,000 | | | | 985,000 | | |
ProGroup AG
5.125%, due 05/01/224 | | EUR | 1,000,000 | | | | 1,135,701 | | |
Sealed Air Corp.
4.500%, due 09/15/234 | | EUR | 575,000 | | | | 659,911 | | |
5.250%, due 04/01/232 | | | 425,000 | | | | 431,375 | | |
SIG Combibloc Holdings SCA
7.750%, due 02/15/234 | | EUR | 1,000,000 | | | | 1,157,490 | | |
| | | | 13,228,756 | | |
Diversified financial services—2.41% | |
Alliance Automotive Finance PLC
6.250%, due 12/01/214 | | EUR | 350,000 | | | | 405,544 | | |
Ally Financial, Inc.
8.000%, due 11/01/31 | | | 335,000 | | | | 418,750 | | |
8.000%, due 11/01/31 | | | 767,000 | | | | 916,565 | | |
Audatex North America, Inc.
6.000%, due 06/15/212 | | | 725,000 | | | | 740,406 | | |
6.125%, due 11/01/232 | | | 850,000 | | | | 830,875 | | |
Bank of America Corp.
6.250%, due 09/05/245,6 | | | 275,000 | | | | 275,256 | | |
8.000%, due 01/30/185,6 | | | 345,000 | | | | 365,010 | | |
Barclays PLC
8.000%, due 12/15/205,6 | | EUR | 600,000 | | | | 719,081 | | |
First Data Corp.
10.625%, due 06/15/213 | | | 1,264,000 | | | | 1,409,360 | | |
12.625%, due 01/15/21 | | | 625,000 | | | | 723,438 | | |
GE Capital Trust III
6.500%, due 09/15/674,5 | | GBP | 1,750,000 | | | | 2,875,007 | | |
National Financial Partners Corp.
9.000%, due 07/15/212 | | | 900,000 | | | | 902,250 | | |
| | | | 10,581,542 | | |
Electric utilities—0.51% | |
Dynegy, Inc.
7.375%, due 11/01/222,3 | | | 1,150,000 | | | | 1,189,675 | | |
7.625%, due 11/01/242 | | | 125,000 | | | | 129,063 | | |
NRG Energy, Inc.
8.250%, due 09/01/20 | | | 865,000 | | | | 900,897 | | |
| | | | 2,219,635 | | |
Electric-generation—1.36% | |
Calpine Corp.
5.750%, due 01/15/253 | | | 3,150,000 | | | | 3,071,250 | | |
CE Energy AS
7.000%, due 02/01/214 | | EUR | 1,000,000 | | | | 1,146,299 | | |
Rapid Holding GmbH
6.625%, due 11/15/204 | | EUR | 890,000 | | | | 984,481 | | |
119
PACE Select Advisors Trust
PACE High Yield Investments
Portfolio of investments—July 31, 2015
| | | Face
amount1 | | Value | |
Corporate bonds—(continued) | |
Electric-generation—(concluded) | |
Tenaska Alabama Partners LP
7.000%, due 06/30/212 | | | 145,795 | | | $ | 152,720 | | |
TerraForm Power Operating LLC
6.125%, due 06/15/252 | | | 125,000 | | | | 125,312 | | |
9.750%, due 08/15/222 | | | 500,000 | | | | 493,765 | | |
| | | | 5,973,827 | | |
Electric-integrated—0.11% | |
Eskom Holdings SOC Ltd.
5.750%, due 01/26/214 | | | 500,000 | | | | 485,800 | | |
Electronics—1.26% | |
Advanced Micro Devices, Inc.
7.750%, due 08/01/20 | | | 700,000 | | | | 471,187 | | |
Freescale Semiconductor, Inc.
5.000%, due 05/15/212 | | | 1,875,000 | | | | 1,904,297 | | |
6.000%, due 01/15/222 | | | 757,000 | | | | 791,065 | | |
Micron Technology, Inc.
5.250%, due 01/15/242 | | | 2,450,000 | | | | 2,352,000 | | |
| | | | 5,518,549 | | |
Energy-exploration & production—0.21% | |
Antero Resources Corp.
5.375%, due 11/01/21 | | | 950,000 | | | | 923,875 | | |
Finance-captive automotive—3.20% | |
Ausdrill Finance Pty Ltd.
6.875%, due 11/01/192 | | | 880,000 | | | | 682,000 | | |
Cabot Financial Luxembourg SA
6.500%, due 04/01/214 | | GBP | 700,000 | | | | 1,058,262 | | |
Credit Agricole SA
6.500%, due 06/23/214,5,6 | | EUR | 700,000 | | | | 794,148 | | |
7.875%, due 01/23/242,3,5,6 | | | 2,000,000 | | | | 2,075,042 | | |
8.375%, due 10/13/192,5,6 | | | 765,000 | | | | 875,925 | | |
HT1 Funding GmbH
6.352%, due 06/30/175,6 | | EUR | 700,000 | | | | 779,731 | | |
Icahn Enterprises LP/Icahn
Enterprises Finance Corp.
5.875%, due 02/01/223 | | | 485,000 | | | | 501,975 | | |
6.000%, due 08/01/203 | | | 3,130,000 | | | | 3,294,325 | | |
Lock AS
7.000%, due 08/15/214 | | EUR | 750,000 | | | | 877,228 | | |
Schaeffler Finance BV
4.750%, due 05/15/212 | | | 2,020,000 | | | | 2,025,050 | | |
Schaeffler Holding Finance BV
5.750%, due 11/15/214,7 | | EUR | 575,000 | | | | 675,749 | | |
Trinseo Materials Operating SCA/
Trinseo Materials Finance, Inc.
6.375%, due 05/01/224 | | EUR | 350,000 | | | | 387,770 | | |
| | | | 14,027,205 | | |
Finance-noncaptive consumer—0.40% | |
CIT Group, Inc.
5.000%, due 08/15/22 | | | 1,740,000 | | | | 1,768,275 | | |
| | | Face
amount1 | | Value | |
Corporate bonds—(continued) | |
Finance-other—1.23% | |
Navient LLC
8.000%, due 03/25/203 | | | 2,000,000 | | | $ | 2,080,000 | | |
8.450%, due 06/15/18 | | | 600,000 | | | | 648,000 | | |
Springleaf Finance Corp.
5.250%, due 12/15/193 | | | 545,000 | | | | 549,741 | | |
6.000%, due 06/01/20 | | | 2,050,000 | | | | 2,096,125 | | |
| | | | 5,373,866 | | |
Financial services—1.31% | |
Assicurazioni Generali SpA
6.416%, due 02/08/225,6 | | GBP | 300,000 | | | | 483,909 | | |
Banco de Bogota SA
5.375%, due 02/19/232,3 | | | 1,200,000 | | | | 1,218,000 | | |
Cemex Finance LLC
6.000%, due 04/01/242,3 | | | 1,200,000 | | | | 1,203,180 | | |
Intesa Sanpaolo SpA
8.047%, due 06/20/185,6 | | EUR | 950,000 | | | | 1,170,104 | | |
Milacron LLC/Mcron Finance Corp.
7.750%, due 02/15/212 | | | 1,165,000 | | | | 1,202,862 | | |
VTB Bank OJSC Via VTB Capital SA
6.950%, due 10/17/224 | | | 500,000 | | | | 451,250 | | |
| | | | 5,729,305 | | |
Food products—2.21% | |
JBS USA LLC/JBS USA Finance, Inc.
8.250%, due 02/01/202,3 | | | 1,285,000 | | | | 1,362,100 | | |
Kraft Heinz Foods Co.
4.875%, due 02/15/252 | | | 588,000 | | | | 629,895 | | |
Minerva Luxembourg SA
7.750%, due 01/31/232,3 | | | 500,000 | | | | 499,850 | | |
7.750%, due 01/31/234 | | | 850,000 | | | | 849,745 | | |
Moy Park Bondco PLC
6.250%, due 05/29/214 | | GBP | 1,275,000 | | | | 2,060,794 | | |
Pilgrim's Pride Corp.
5.750%, due 03/15/252,3 | | | 1,535,000 | | | | 1,569,538 | | |
Smithfield Foods, Inc.
6.625%, due 08/15/223 | | | 2,530,000 | | | | 2,704,443 | | |
| | | | 9,676,365 | | |
Food-wholesale—0.40% | |
Barry Callebaut Services N.V.
5.500%, due 06/15/232 | | | 1,625,000 | | | | 1,737,970 | | |
Gaming—3.47% | |
Cirsa Funding Luxembourg SA
5.875%, due 05/15/234 | | EUR | 1,100,000 | | | | 1,141,752 | | |
Isle of Capri Casinos, Inc.
5.875%, due 03/15/213 | | | 340,000 | | | | 352,750 | | |
8.875%, due 06/15/203 | | | 3,295,000 | | | | 3,558,600 | | |
MGM Resorts International
6.750%, due 10/01/203 | | | 2,683,000 | | | | 2,870,810 | | |
7.750%, due 03/15/22 | | | 740,000 | | | | 821,400 | | |
8.625%, due 02/01/19 | | | 450,000 | | | | 507,375 | | |
Penn National Gaming, Inc.
5.875%, due 11/01/21 | | | 125,000 | | | | 127,500 | | |
120
PACE Select Advisors Trust
PACE High Yield Investments
Portfolio of investments—July 31, 2015
| | | Face
amount1 | | Value | |
Corporate bonds—(continued) | |
Gaming—(concluded) | |
Safari Holding Verwaltungs GmbH
8.250%, due 02/15/214 | | EUR | 575,000 | | | $ | 669,352 | | |
Scientific Games International, Inc.
10.000%, due 12/01/223 | | | 890,000 | | | | 864,413 | | |
Snai SpA
7.625%, due 06/15/18 | | EUR | 1,075,000 | | | | 1,211,115 | | |
William Hill PLC
4.250%, due 06/05/204 | | GBP | 575,000 | | | | 905,806 | | |
Wynn Las Vegas LLC/Wynn
Las Vegas Capital Corp.
5.500%, due 03/01/252 | | | 2,250,000 | | | | 2,165,625 | | |
| | | | 15,196,498 | | |
Health care providers & services—8.39% | |
Alere, Inc.
6.375%, due 07/01/232,3 | | | 1,820,000 | | | | 1,892,800 | | |
6.500%, due 06/15/20 | | | 675,000 | | | | 702,000 | | |
8.625%, due 10/01/18 | | | 1,240,000 | | | | 1,278,750 | | |
Almirall SA
4.625%, due 04/01/214 | | EUR | 700,000 | | | | 803,440 | | |
Auris Luxembourg II SA
8.000%, due 01/15/234 | | EUR | 325,000 | | | | 387,806 | | |
CHS/Community Health
Systems, Inc.
5.125%, due 08/01/21 | | | 1,805,000 | | | | 1,872,687 | | |
DaVita HealthCare Partners, Inc.
5.750%, due 08/15/223 | | | 2,535,000 | | | | 2,699,775 | | |
DJO Finco, Inc./DJO Finance LLC/
DJO Finance Corp.
8.125%, due 06/15/212 | | | 500,000 | | | | 513,750 | | |
Endo Ltd./Endo Finance LLC/
Endo Finco, Inc.
6.000%, due 07/15/232,3 | | | 1,025,000 | | | | 1,066,000 | | |
Ephios Bondco PLC
6.250%, due 07/01/222 | | EUR | 525,000 | | | | 587,392 | | |
Ephios Holdco II PLC
8.250%, due 07/01/23 | | EUR | 350,000 | | | | 388,308 | | |
HCA, Inc.
5.000%, due 03/15/24 | | | 3,295,000 | | | | 3,430,919 | | |
7.500%, due 02/15/22 | | | 2,750,000 | | | | 3,203,750 | | |
Holding Medi-Partenaires SAS
7.000%, due 05/15/204 | | EUR | 625,000 | | | | 732,574 | | |
HomeVi SAS
6.875%, due 08/15/214 | | EUR | 750,000 | | | | 863,596 | | |
Mallinckrodt International Finance
SA/Mallinkrodt CB LLC
5.750%, due 08/01/222 | | | 2,680,000 | | | | 2,793,900 | | |
Multiplan, Inc.
6.625%, due 04/01/222 | | | 2,745,000 | | | | 2,841,075 | | |
Tenet Healthcare Corp.
5.500%, due 03/01/192 | | | 1,700,000 | | | | 1,729,750 | | |
6.750%, due 06/15/232 | | | 100,000 | | | | 104,500 | | |
8.125%, due 04/01/22 | | | 2,445,000 | | | | 2,742,997 | | |
Universal Hospital Services, Inc.
7.625%, due 08/15/20 | | | 350,000 | | | | 327,250 | | |
| | | Face
amount1 | | Value | |
Corporate bonds—(continued) | |
Health care providers & services—(concluded) | |
Valeant Pharmaceuticals
International, Inc.
4.500%, due 05/15/234 | | EUR | 1,250,000 | | | $ | 1,352,221 | | |
5.625%, due 12/01/212 | | | 1,000,000 | | | | 1,026,250 | | |
6.125%, due 04/15/252 | | | 1,330,000 | | | | 1,389,850 | | |
7.000%, due 10/01/202 | | | 300,000 | | | | 311,625 | | |
7.500%, due 07/15/212 | | | 1,595,000 | | | | 1,730,575 | | |
| | | | 36,773,540 | | |
Hotels, restaurants & leisure—0.73% | |
Caesars Entertainment Resort
Properties LLC
8.000%, due 10/01/20 | | | 600,000 | | | | 573,000 | | |
Eldorado Resorts, Inc.
7.000%, due 08/01/232 | | | 525,000 | | | | 526,312 | | |
Golden Nugget Escrow, Inc.
8.500%, due 12/01/212 | | | 100,000 | | | | 104,000 | | |
LTF Merger Sub, Inc.
8.500%, due 06/15/232,3 | | | 1,200,000 | | | | 1,155,000 | | |
PortAventura Entertainment
Barcelona BV
7.250%, due 12/01/204 | | EUR | 725,000 | | | | 828,308 | | |
| | | | 3,186,620 | | |
Insurance—1.16% | |
A-S Co-Issuer Subsidiary, Inc./
A-S Merger Sub LLC
7.875%, due 12/15/202 | | | 125,000 | | | | 132,975 | | |
Liberty Mutual Group, Inc.
7.800%, due 03/15/372 | | | 2,000,000 | | | | 2,370,000 | | |
Lincoln National Corp.
7.000%, due 05/17/665 | | | 2,550,000 | | | | 2,295,000 | | |
Mapfre SA
5.921%, due 07/24/375 | | EUR | 250,000 | | | | 290,349 | | |
| | | �� | 5,088,324 | | |
Machinery—0.71% | |
Sensata Technologies BV
4.875%, due 10/15/232 | | | 1,835,000 | | | | 1,816,650 | | |
5.000%, due 10/01/252,3 | | | 650,000 | | | | 637,000 | | |
Terex Corp.
6.000%, due 05/15/213 | | | 650,000 | | | | 652,437 | | |
| | | | 3,106,087 | | |
Manufacturing-diversified—0.44% | |
Amsted Industries, Inc.
5.000%, due 03/15/222,3 | | | 1,320,000 | | | | 1,316,700 | | |
5.375%, due 09/15/242 | | | 600,000 | | | | 594,000 | | |
| | | | 1,910,700 | | |
Media—1.21% | |
Carmike Cinemas, Inc.
6.000%, due 06/15/232 | | | 150,000 | | | | 153,000 | | |
Clear Channel Worldwide
Holdings, Inc.
6.500%, due 11/15/22 | | | 278,000 | | | | 289,815 | | |
121
PACE Select Advisors Trust
PACE High Yield Investments
Portfolio of investments—July 31, 2015
| | | Face
amount1 | | Value | |
Corporate bonds—(continued) | |
Media—(concluded) | |
7.625%, due 03/15/203 | | | 127,000 | | | $ | 131,604 | | |
7.625%, due 03/15/20 | | | 1,423,000 | | | | 1,495,039 | | |
iHeartCommunications, Inc.
9.000%, due 09/15/22 | | | 1,100,000 | | | | 986,562 | | |
10.625%, due 03/15/232,3 | | | 165,000 | | | | 154,688 | | |
Myriad International Holdings BV
5.500%, due 07/21/252 | | | 500,000 | | | | 507,500 | | |
Sirius XM Radio, Inc.
6.000%, due 07/15/242,3 | | | 100,000 | | | | 104,250 | | |
Vougeot Bidco PLC
7.875%, due 07/15/204 | | GBP | 575,000 | | | | 957,214 | | |
VTR Finance BV
6.875%, due 01/15/244 | | | 500,000 | | | | 508,750 | | |
| | | | 5,288,422 | | |
Metals—1.56% | |
Aleris International, Inc.
6.000%, due 06/01/208,9 | | | 13,347 | | | | 11,689 | | |
7.625%, due 02/15/183 | | | 485,000 | | | | 489,183 | | |
7.875%, due 11/01/203 | | | 2,630,000 | | | | 2,663,138 | | |
Constellium NV
7.000%, due 01/15/234 | | EUR | 700,000 | | | | 757,244 | | |
First Quantum Minerals Ltd.
7.250%, due 10/15/192 | | | 200,000 | | | | 164,000 | | |
Novelis, Inc.
8.375%, due 12/15/17 | | | 1,250,000 | | | | 1,293,750 | | |
8.750%, due 12/15/203 | | | 935,000 | | | | 986,425 | | |
Vedanta Resources PLC
8.250%, due 06/07/212 | | | 500,000 | | | | 471,250 | | |
| | | | 6,836,679 | | |
Metals & mining—1.21% | |
Alcoa, Inc.
5.125%, due 10/01/24 | | | 450,000 | | | | 452,250 | | |
ArcelorMittal
7.500%, due 03/01/413 | | | 1,665,000 | | | | 1,585,912 | | |
7.750%, due 10/15/39 | | | 3,405,000 | | | | 3,285,825 | | |
| | | | 5,323,987 | | |
Oil & gas—9.75% | |
AmeriGas Partners LP/AmeriGas
Finance Corp.
6.500%, due 05/20/21 | | | 678,000 | | | | 705,120 | | |
Berry Petroleum Co.
6.750%, due 11/01/203 | | | 2,320,000 | | | | 1,600,800 | | |
Blue Racer Midstream LLC/Blue
Racer Finance Corp.
6.125%, due 11/15/222 | | | 125,000 | | | | 127,188 | | |
California Resources Corp.
6.000%, due 11/15/243 | | | 930,000 | | | | 753,300 | | |
CeramTec Group GmbH
8.250%, due 08/15/214 | | EUR | 1,000,000 | | | | 1,202,365 | | |
Chesapeake Energy Corp.
6.625%, due 08/15/203 | | | 3,040,000 | | | | 2,720,800 | | |
| | | Face
amount1 | | Value | |
Corporate bonds—(continued) | |
Oil & gas—(continued) | |
Concho Resources, Inc.
5.500%, due 10/01/22 | | | 270,000 | | | $ | 270,000 | | |
5.500%, due 04/01/23 | | | 290,000 | | | | 290,000 | | |
6.500%, due 01/15/223 | | | 300,000 | | | | 310,125 | | |
Crestwood Midstream Partners LP/
Crestwood Midstream
Finance Corp.
6.250%, due 04/01/232,3 | | | 1,345,000 | | | | 1,351,725 | | |
Denbury Resources, Inc.
5.500%, due 05/01/223 | | | 1,200,000 | | | | 951,000 | | |
6.375%, due 08/15/21 | | | 700,000 | | | | 588,000 | | |
Energy Transfer Equity LP
7.500%, due 10/15/20 | | | 1,650,000 | | | | 1,848,000 | | |
Energy XXI Gulf Coast, Inc.
11.000%, due 03/15/202 | | | 400,000 | | | | 302,000 | | |
EP Energy LLC/Everest Acquisition
Finance, Inc.
9.375%, due 05/01/203 | | | 1,035,000 | | | | 1,068,637 | | |
Ferrellgas LP/Ferrellgas Finance Corp.
6.500%, due 05/01/21 | | | 430,000 | | | | 431,075 | | |
Gazprom OAO Via Gaz Capital SA
3.600%, due 02/26/214 | | EUR | 1,000,000 | | | | 1,018,627 | | |
8.625%, due 04/28/342 | | | 1,800,000 | | | | 1,964,250 | | |
Halcon Resources Corp.
8.625%, due 02/01/202,3 | | | 700,000 | | | | 668,500 | | |
9.750%, due 07/15/20 | | | 75,000 | | | | 40,500 | | |
Hilcorp Energy I LP/Hilcorp
Finance Co.
7.625%, due 04/15/212,3 | | | 525,000 | | | | 540,750 | | |
Kinder Morgan Inc.
5.000%, due 02/15/212 | | | 3,370,000 | | | | 3,521,930 | | |
Laredo Petroleum, Inc.
6.250%, due 03/15/23 | | | 725,000 | | | | 719,563 | | |
Linn Energy LLC/Linn Energy
Finance Corp.
6.250%, due 11/01/19 | | | 800,000 | | | | 484,496 | | |
6.500%, due 05/15/193 | | | 800,000 | | | | 492,000 | | |
6.500%, due 09/15/21 | | | 435,000 | | | | 250,125 | | |
7.750%, due 02/01/21 | | | 500,000 | | | | 292,500 | | |
8.625%, due 04/15/203 | | | 80,000 | | | | 49,200 | | |
MarkWest Energy Partners LP/
MarkWest Energy Finance Corp.
5.500%, due 02/15/23 | | | 645,000 | | | | 661,125 | | |
Matador Resources Co.
6.875%, due 04/15/232 | | | 175,000 | | | | 177,625 | | |
Oasis Petroleum, Inc.
6.500%, due 11/01/213 | | | 100,000 | | | | 91,000 | | |
6.875%, due 03/15/223 | | | 100,000 | | | | 92,000 | | |
7.250%, due 02/01/193 | | | 175,000 | | | | 169,750 | | |
Offshore Group Investment Ltd.
7.500%, due 11/01/193 | | | 425,000 | | | | 227,375 | | |
Pacific Rubiales Energy Corp.
5.625%, due 01/19/254 | | | 500,000 | | | | 316,100 | | |
122
PACE Select Advisors Trust
PACE High Yield Investments
Portfolio of investments—July 31, 2015
| | | Face
amount1 | | Value | |
Corporate bonds—(continued) | |
Oil & gas—(concluded) | |
Parsley Energy LLC/Parsley
Finance Corp.
7.500%, due 02/15/222 | | | 100,000 | | | $ | 100,250 | | |
Petrobras Global Finance BV
6.250%, due 03/17/243 | | | 1,165,000 | | | | 1,079,955 | | |
7.250%, due 03/17/443 | | | 3,815,000 | | | | 3,347,128 | | |
Petroleos de Venezuela SA
9.000%, due 11/17/214 | | | 2,500,000 | | | | 996,875 | | |
Regency Energy Partners LP/
Regency Energy Finance Corp.
5.000%, due 10/01/22 | | | 500,000 | | | | 500,816 | | |
5.500%, due 04/15/23 | | | 1,230,000 | | | | 1,233,075 | | |
Sanchez Energy Corp.
6.125%, due 01/15/233 | | | 600,000 | | | | 486,000 | | |
SandRidge Energy, Inc.
7.500%, due 03/15/213 | | | 1,850,000 | | | | 555,000 | | |
8.750%, due 06/01/202,3 | | | 275,000 | | | | 213,125 | | |
Sunoco LP/Sunoco Finance Corp.
5.500%, due 08/01/202 | | | 1,000,000 | | | | 1,017,500 | | |
6.375%, due 04/01/232,3 | | | 1,095,000 | | | | 1,125,112 | | |
Targa Resources Partners LP/Targa
Resources Partners Finance Corp.
4.250%, due 11/15/233 | | | 900,000 | | | | 832,500 | | |
5.250%, due 05/01/23 | | | 1,465,000 | | | | 1,446,687 | | |
6.625%, due 10/01/202,3 | | | 400,000 | | | | 418,000 | | |
Transocean, Inc.
6.875%, due 12/15/213 | | | 850,000 | | | | 719,313 | | |
Whiting Petroleum Corp.
5.750%, due 03/15/21 | | | 1,925,000 | | | | 1,876,875 | | |
YPF SA
8.750%, due 04/04/244 | | | 500,000 | | | | 493,600 | | |
| | | | 42,739,362 | | |
Oil services—1.11% | |
Basic Energy Services, Inc.
7.750%, due 10/15/223 | | | 1,875,000 | | | | 1,354,687 | | |
Cie Generale de
Geophysique-Veritas
6.500%, due 06/01/213 | | | 1,750,000 | | | | 1,330,000 | | |
CITGO Petroleum Corp.
6.250%, due 08/15/222,3 | | | 2,205,000 | | | | 2,160,900 | | |
| | | | 4,845,587 | | |
Packaging—1.52% | |
Reynolds Group Issuer
8.250%, due 02/15/213 | | | 1,550,000 | | | | 1,608,125 | | |
8.500%, due 05/15/183 | | | 1,765,000 | | | | 1,793,681 | | |
9.875%, due 08/15/193 | | | 3,115,000 | | | | 3,276,591 | | |
| | | | 6,678,397 | | |
Paper & forest products—0.18% | |
Fibria Overseas Finance Ltd.
5.250%, due 05/12/243 | | | 800,000 | | | | 805,000 | | |
| | | Face
amount1 | | Value | |
Corporate bonds—(continued) | |
Pipelines—0.63% | |
Georgian Oil and Gas Corp.
6.875%, due 05/16/172 | | | 1,700,000 | | | $ | 1,721,250 | | |
Penn Virginia Resource Partners LP/
Penn Virginia Resource Finance
Corp. II
6.500%, due 05/15/21 | | | 500,000 | | | | 531,250 | | |
Sabine Pass Liquefaction LLC
5.625%, due 02/01/21 | | | 400,000 | | | | 408,000 | | |
6.250%, due 03/15/22 | | | 100,000 | | | | 103,000 | | |
| | | | 2,763,500 | | |
Real estate investment trusts—1.05% | |
Communications Sales &
Leasing, Inc.
8.250%, due 10/15/232 | | | 350,000 | | | | 334,250 | | |
MPT Operating Partnership LP/
MPT Finance Corp.
5.750%, due 10/01/20 | | EUR | 850,000 | | | | 989,524 | | |
Realogy Group LLC
7.625%, due 01/15/202 | | | 475,000 | | | | 501,719 | | |
Tesco Property Finance 3 PLC
5.744%, due 04/13/40 | | GBP | 492,164 | | | | 758,427 | | |
The Geo Group, Inc.
5.875%, due 10/15/243 | | | 1,960,000 | | | | 2,028,600 | | |
| | | 4,612,520 | | |
Rental auto/equipment—0.22% | |
United Rentals North America, Inc.
6.125%, due 06/15/23 | | | 670,000 | | | | 690,100 | | |
7.375%, due 05/15/203 | | | 275,000 | | | | 292,531 | | |
| | | | 982,631 | | |
Retail—1.67% | |
99 Cents Only Stores LLC
11.000%, due 12/15/19 | | | 225,000 | | | | 184,500 | | |
Caleres, Inc.
6.250%, due 08/15/232 | | | 100,000 | | | | 101,000 | | |
Dufry Finance SCA
4.500%, due 08/01/232 | | EUR | 1,150,000 | | | | 1,297,720 | | |
Neiman Marcus Group Ltd. LLC
8.000%, due 10/15/212 | | | 475,000 | | | | 503,500 | | |
Pizzaexpress Financing 1 PLC
8.625%, due 08/01/224 | | GBP | 100,000 | | | | 164,424 | | |
Pizzaexpress Financing 2 PLC
6.625%, due 08/01/214 | | GBP | 500,000 | | | | 806,285 | | |
Radio Systems Corp.
8.375%, due 11/01/192 | | | 300,000 | | | | 317,250 | | |
Rite Aid Corp.
6.125%, due 04/01/232 | | | 1,275,000 | | | | 1,324,406 | | |
rue21, Inc.
9.000%, due 10/15/212 | | | 425,000 | | | | 367,625 | | |
Suburban Propane Partners LP/
Suburban Energy Finance Corp.
5.500%, due 06/01/243 | | | 1,800,000 | | | | 1,791,000 | | |
7.375%, due 08/01/21 | | | 436,000 | | | | 467,610 | | |
| | | | 7,325,320 | | |
123
PACE Select Advisors Trust
PACE High Yield Investments
Portfolio of investments—July 31, 2015
| | | Face
amount1 | | Value | |
Corporate bonds—(continued) | |
Steel—1.28% | |
AK Steel Corp.
7.625%, due 05/15/20 | | | 1,850,000 | | | $ | 1,318,125 | | |
7.625%, due 10/01/21 | | | 1,025,000 | | | | 722,625 | | |
8.375%, due 04/01/223 | | | 400,000 | | | | 272,000 | | |
Severstal OAO Via Steel Capital SA
5.900%, due 10/17/222 | | | 1,500,000 | | | | 1,436,250 | | |
US Steel Corp.
7.000%, due 02/01/183 | | | 1,170,000 | | | | 1,205,463 | | |
7.500%, due 03/15/223 | | | 700,000 | | | | 665,000 | | |
| | | | 5,619,463 | | |
Telecom-integrated/services—1.31% | |
GCX Ltd.
7.000%, due 08/01/194 | | | 500,000 | | | | 505,016 | | |
Hughes Satellite Systems Corp.
7.625%, due 06/15/21 | | | 1,088,000 | | | | 1,203,600 | | |
Intelsat Luxembourg SA
8.125%, due 06/01/233 | | | 5,090,000 | | | | 4,046,550 | | |
| | | | 5,755,166 | | |
Telecommunication services—3.11% | |
Altice Financing SA
5.250%, due 02/15/234 | | EUR | 350,000 | | | | 394,958 | | |
Altice SA
7.250%, due 05/15/224 | | EUR | 743,000 | | | | 832,320 | | |
Altice US Finance SA
7.750%, due 07/15/252 | | | 200,000 | | | | 196,500 | | |
Avaya, Inc.
10.500%, due 03/01/212 | | | 775,000 | | | | 629,688 | | |
Colombia Telecomunicaciones
SA ESP
5.375%, due 09/27/222 | | | 1,500,000 | | | | 1,489,500 | | |
CommScope Technologies
Finance LLC
6.000%, due 06/15/252 | | | 800,000 | | | | 790,000 | | |
CommScope, Inc.
5.000%, due 06/15/212,3 | | | 1,370,000 | | | | 1,352,875 | | |
Digicel Ltd.
6.000%, due 04/15/214 | | | 500,000 | | | | 471,250 | | |
EarthLink Holdings Corp.
7.375%, due 06/01/20 | | | 475,000 | | | | 494,000 | | |
eircom Finance Ltd.
9.250%, due 05/15/204 | | EUR | 700,000 | | | | 834,121 | | |
Nortel Networks Ltd.
10.750%, due 07/15/1610 | | | 700,000 | | | | 642,250 | | |
Play Finance 1 SA
6.500%, due 08/01/194 | | EUR | 300,000 | | | | 344,714 | | |
Play Finance 2 SA
5.250%, due 02/01/194 | | EUR | 1,250,000 | | | | 1,413,998 | | |
Play Topco SA
7.750%, due 02/28/204,7 | | EUR | 450,000 | | | | 505,950 | | |
UPC Holding BV
6.375%, due 09/15/224 | | EUR | 700,000 | | | | 832,067 | | |
UPCB Finance IV Ltd.
4.000%, due 01/15/274 | | EUR | 625,000 | | | | 645,222 | | |
| | | Face
amount1 | | Value | |
Corporate bonds—(continued) | |
Telecommunication services—(concluded) | |
Wind Acquisition Finance SA
7.000%, due 04/23/214 | | EUR | 800,000 | | | $ | 935,710 | | |
7.375%, due 04/23/212 | | | 800,000 | | | | 848,000 | | |
| | | | 13,653,123 | | |
Telephone-integrated—2.60% | |
Frontier Communications Corp.
7.000%, due 11/01/25 | | | 500,000 | | | | 427,500 | | |
7.125%, due 01/15/233 | | | 700,000 | | | | 631,750 | | |
Level 3 Financing, Inc.
5.375%, due 08/15/223 | | | 150,000 | | | | 151,500 | | |
Sprint Capital Corp.
6.875%, due 11/15/28 | | | 2,160,000 | | | | 1,830,600 | | |
6.900%, due 05/01/19 | | | 3,225,000 | | | | 3,160,500 | | |
8.750%, due 03/15/323 | | | 2,970,000 | | | | 2,810,363 | | |
Telecom Italia Finance SA
7.750%, due 01/24/33 | | EUR | 450,000 | | | | 682,112 | | |
Virgin Media Finance PLC
6.375%, due 10/15/244 | | GBP | 450,000 | | | | 732,539 | | |
6.375%, due 10/15/242 | | GBP | 600,000 | | | | 976,719 | | |
| | | | 11,403,583 | | |
Transportation services—1.36% | |
Algeco Scotsman Global
Finance PLC
9.000%, due 10/15/184 | | EUR | 750,000 | | | | 775,980 | | |
Hapag-Lloyd AG
9.750%, due 10/15/172 | | | 1,280,000 | | | | 1,318,400 | | |
PHI, Inc.
5.250%, due 03/15/193 | | | 1,400,000 | | | | 1,270,500 | | |
Teekay Corp.
8.500%, due 01/15/203 | | | 195,000 | | | | 214,013 | | |
XPO Logistics, Inc.
6.500%, due 06/15/222 | | | 2,410,000 | | | | 2,370,837 | | |
| | | | 5,949,730 | | |
Wireless telecommunication services—3.70% | |
CenturyLink, Inc.
6.750%, due 12/01/23 | | | 350,000 | | | | 350,875 | | |
7.600%, due 09/15/393 | | | 650,000 | | | | 578,500 | | |
7.650%, due 03/15/42 | | | 650,000 | | | | 575,250 | | |
Comunicaciones Celulares SA
6.875%, due 02/06/242 | | | 1,500,000 | | | | 1,586,700 | | |
Digicel Group Ltd.
8.250%, due 09/30/202 | | | 400,000 | | | | 395,000 | | |
Sable Intrenational Finance Ltd.
6.875%, due 08/01/222 | | | 400,000 | | | | 394,576 | | |
Sprint Corp.
7.875%, due 09/15/23 | | | 1,150,000 | | | | 1,102,562 | | |
Sprint Nextel Corp.
6.000%, due 11/15/223 | | | 1,250,000 | | | | 1,098,125 | | |
T-Mobile USA, Inc.
6.125%, due 01/15/22 | | | 1,375,000 | | | | 1,436,875 | | |
6.375%, due 03/01/253 | | | 3,100,000 | | | | 3,251,125 | | |
6.625%, due 11/15/20 | | | 490,000 | | | | 509,600 | | |
124
PACE Select Advisors Trust
PACE High Yield Investments
Portfolio of investments—July 31, 2015
| | | Face
amount1 | | Value | |
Corporate bonds—(concluded) | |
Wireless telecommunication services—(concluded) | |
Telecom Italia Capital SA
7.200%, due 07/18/363 | | | 670,000 | | | $ | 740,350 | | |
United Group BV
7.875%, due 11/15/204 | | EUR | 225,000 | | | | 263,193 | | |
ViaSat, Inc.
6.875%, due 06/15/20 | | | 1,984,000 | | | | 2,098,080 | | |
Windstream Services LLC
6.375%, due 08/01/233 | | | 750,000 | | | | 581,250 | | |
7.750%, due 10/15/203 | | | 275,000 | | | | 251,797 | | |
Zayo Group LLC/Zayo Capital, Inc.
6.000%, due 04/01/232 | | | 1,000,000 | | | | 1,003,240 | | |
| | | | 16,217,098 | | |
Total corporate bonds
(cost—$408,766,890) | | | | | 403,202,688 | | |
Loan assignments5—1.76% | |
Airlines—0.44% | |
US Airways Group, Inc. New
Term Loan B1
3.500%, due 05/23/19 | | | 1,960,000 | | | | 1,954,610 | | |
Broadcast—0.15% | |
Asurion LLC Term Loan B4
0.000%, due 07/22/2213 | | | 650,000 | | | | 649,389 | | |
Computer software & services—0.26% | |
Sungard Data Systems, Inc.
Term Loan E
4.000%, due 03/08/20 | | | 1,127,229 | | | | 1,127,229 | | |
Gaming—0.41% | |
Scientific Games International
2014 Term Loan B1
6.000%, due 10/18/20 | | | 1,773,000 | | | | 1,779,649 | | |
Lodging—0.22% | |
Hilton Worldwide Finance LLC
USD Term Loan B2
0.000%, due 10/26/2013 | | | 950,000 | | | | 950,931 | | |
Retail—0.17% | |
The Neiman Marcus Group, Inc.
2020 Term Loan
0.000%, due 10/25/2013 | | | 750,000 | | | | 747,266 | | |
Support-services—0.11% | |
Kar Auction Services, Inc. Term
Loan B2
3.500%, due 03/11/21 | | | 492,775 | | | | 492,775 | | |
Total loan assignments
(cost—$7,670,014) | | | | | 7,701,849 | | |
| | | Number of
shares | | Value | |
Common stocks—0.01% | |
Automobiles—0.01% | |
Motors Liquidation Co. GUC Trust11
(cost—$16,698) | | | 3,014 | | | $ | 51,238 | | |
| | | Number of
warrants | | | |
Warrants*—0.37% | |
Automobiles—0.37% | |
General Motors Co., strike price
$10.00, expires 07/10/16 | | | 52,571 | | | | 1,156,562 | | |
General Motors Co., strike price
$18.33, expires 07/10/19 | | | 30,621 | | | | 450,435 | | |
Total Warrants
(cost—$1,449,555) | | | | | 1,606,997 | | |
| | | Face
amount1 | | | |
Repurchase agreement—3.20% | |
Repurchase agreement dated
07/31/15 with State Street Bank
and Trust Co., 0.000% due
08/03/15, collateralized by
$4,031,890 Federal Home Loan
Mortgage Corp. obligation,
2.080% due 10/17/22,
$1,011,803 Federal National
Mortgage Association obligation,
2.170% due 10/17/22 and
$9,021,822 US Treasury Notes,
1.625% to 3.625% due
03/31/19 to 06/30/20;
(value—$14,301,652); proceeds:
$14,021,000 (cost—$14,021,000) | | | 14,021,000 | | | | 14,021,000 | | |
| | | Number of
shares | | | |
Investment of cash collateral from securities loaned—19.38% | |
Money market fund—19.38% | |
UBS Private Money Market Fund LLC12
(cost—$84,978,673) | | | 84,978,673 | | | | 84,978,673 | | |
Total investments
(cost—$516,902,830)—116.68% | | | | | 511,562,445 | | |
Liabilities in excess of
other assets—(16.68)% | | | | | (73,139,141 | ) | |
Net assets—100.00% | | | | $ | 438,423,304 | | |
125
PACE Select Advisors Trust
PACE High Yield Investments
Portfolio of investments—July 31, 2015
For a listing of defined portfolio acronyms, counterparty acronyms and currency abbreviations that are used throughout the Portfolio of investments as well as the tables that follow, please refer to page 254.
Aggregate cost for federal income tax purposes was $517,087,858; and net unrealized depreciation consisted of:
Gross unrealized appreciation | | $ | 8,730,140 | | |
Gross unrealized depreciation | | | (14,255,553 | ) | |
Net unrealized depreciation | | $ | (5,525,413 | ) | |
Forward foreign currency contracts
Counterparty | | Contracts to
deliver | | In
exchange for | | Maturity
date | | Unrealized
appreciation
(depreciation) | |
SSC | | EUR | 49,169,723 | | | USD | 54,538,289 | | | 08/17/15 | | $ | 529,131 | | |
SSC | | EUR | 17,421,970 | | | USD | 18,954,134 | | | 08/17/15 | | | (182,560 | ) | |
SSC | | GBP | 20,755,110 | | | USD | 32,626,826 | | | 08/17/15 | | | 217,652 | | |
SSC | | USD | 17,517,163 | | | GBP | 11,250,000 | | | 08/17/15 | | | 49,750 | | |
| | | | | | | | | $ | 613,973 | | |
Fair valuation summary
The following is a summary of the fair valuations according to the inputs used as of July 31, 2015 in valuing the Portfolio's investments: | |
Assets
Description | | Unadjusted
quoted prices in
active markets for
identical investments
(Level 1) | | Other significant
observable inputs
(Level 2) | | Unobservable
inputs
(Level 3) | | Total | |
Corporate bonds | | $ | — | | | $ | 403,190,999 | | | $ | 11,689 | | | $ | 403,202,688 | | |
Loan assignments | | | — | | | | 7,701,849 | | | | — | | | | 7,701,849 | | |
Common stocks | | | 51,238 | | | | — | | | | — | | | | 51,238 | | |
Warrants | | | 1,606,997 | | | | — | | | | — | | | | 1,606,997 | | |
Repurchase agreement | | | — | | | | 14,021,000 | | | | — | | | | 14,021,000 | | |
Investment of cash collateral from securities loaned | | | — | | | | 84,978,673 | | | | — | | | | 84,978,673 | | |
Forward foreign currency contracts | | | — | | | | 796,533 | | | | — | | | | 796,533 | | |
Total | | $ | 1,658,235 | | | $ | 510,689,054 | | | $ | 11,689 | | | $ | 512,358,978 | | |
Liabilities | |
Forward foreign currency contracts | | $ | — | | | $ | (182,560 | ) | | $ | — | | | $ | (182,560 | ) | |
At July 31, 2015, there were no transfers between Level 1 and Level 2.
126
PACE Select Advisors Trust
PACE High Yield Investments
Portfolio of investments—July 31, 2015
The following is a rollforward of the Portfolio's investments that was valued using unobservable inputs (Level 3) for the year ended July 31, 2015:
| | Corporate
bonds | | Common
stocks | | Total | |
Beginning balance | | $ | 11,295 | | | $ | 91,132 | | | $ | 102,427 | | |
Purchases | | | — | | | | — | | | | — | | |
Sales | | | — | | | | (517,441 | ) | | | (517,441 | ) | |
Accrued discounts/(premiums) | | | (101 | ) | | | — | | | | (101 | ) | |
Total realized gain/(loss) | | | — | | | | (21,779 | ) | | | (21,779 | ) | |
Net change in unrealized appreciation/depreciation | | | 495 | | | | 448,088 | | | | 448,583 | | |
Transfers into Level 3 | | | — | | | | — | | | | — | | |
Transfers out of Level 3 | | | — | | | | — | | | | — | | |
Ending balance | | $ | 11,689 | | | $ | — | | | $ | 11,689 | | |
The change in net unrealized appreciation/depreciation relating to the Level 3 investments held at July 31, 2015, was $495.
Issuer breakdown by country or territory of origin (unaudited)
| | | Percentage of
total investments | |
United States | | | 71.2 | % | |
Luxembourg | | | 7.1 | | |
France | | | 4.0 | | |
United Kingdom | | | 3.5 | | |
Netherlands | | | 3.4 | | |
Germany | | | 1.5 | | |
Canada | | | 1.4 | | |
Ireland | | | 1.1 | | |
Italy | | | 1.0 | | |
Cayman Islands | | | 0.9 | | |
Spain | | | 0.5 | | |
Colombia | | | 0.5 | | |
Belgium | | | 0.5 | | |
Venezuela | | | 0.4 | | |
Sweden | | | 0.4 | | |
Georgia | | | 0.3 | | |
Paraguay | | | 0.3 | | |
Bermuda | | | 0.3 | | |
India | | | 0.3 | | |
Argentina | | | 0.3 | | |
Czech Republic | | | 0.2 | | |
Norway | | | 0.2 | | |
Austria | | | 0.2 | | |
Jersey | | | 0.1 | | |
Mexico | | | 0.1 | | |
Australia | | | 0.1 | | |
South Africa | | | 0.1 | | |
Brazil | | | 0.1 | | |
Marshall Islands | | | 0.0 | † | |
Total | | | 100.0 | % | |
† Amount represents less than 0.05%
127
PACE Select Advisors Trust
PACE High Yield Investments
Portfolio of investments—July 31, 2015
Portfolio footnotes
* Non-income producing security.
1 In US Dollars unless otherwise indicated.
2 Security exempt from registration pursuant to Rule 144A under the Securities Act of 1933. These securities, which represent 27.80% of net assets as of July 31, 2015, are considered liquid and may be resold in transactions exempt from registration, normally to qualified institutional buyers.
3 Security, or portion thereof, was on loan at July 31, 2015.
4 Security exempt from registration pursuant to Regulation S under the Securities Act of 1933. Regulation S applies to securities offerings that are made outside of the United States and do not involve direct selling efforts in the United States. At July 31, 2015, the value of these securities amounted to 17.64% of net assets.
5 Variable or floating rate security. The interest rate shown is the current rate as of July 31, 2015 and changes periodically.
6 Perpetual investment. Date shown reflects the next call date.
7 Payment-in-kind security for which interest may be paid in cash or additional principal, at the discretion of the issuer.
8 Security is being fair valued by a Valuation Committee under the direction of the Board of Directors.
9 Illiquid investment as of July 31, 2015.
10 Bond interest in default.
11 Security exchanged on 04/21/11; position represents remaining escrow balance expected to be received upon finalization of debt restructuring.
12 The table below details the Portfolio's transaction activity in an affiliated issuer during the year ended July 31, 2015. The investment manager earns a management fee from UBS Private Money Market Fund LLC. Please see the Notes to financial statements for further information.
| Security description | | Value at
07/31/14 | | Purchases
during the
year ended
07/31/15 | | Sales
during the
year ended
07/31/15 | | Value at
07/31/15 | | Net income
earned from
affiliate for the
year ended
07/31/15 | |
UBS Private Money Market Fund LLC | | $ | 34,618,990 | | | $ | 310,412,853 | | | $ | 260,053,170 | | | $ | 84,978,673 | | | $ | 5,753 | | |
13 Position is unsettled. Contract rate was not determined at July 31, 2015 and does not take effect until settlement.
See accompanying notes to financial statements.
128
PACE Select Advisors Trust
PACE Large Co Value Equity Investments
Performance (unaudited)
For the 12 months ended July 31, 2015, the Portfolio's Class P shares gained 6.48% before the deduction of the maximum PACE Select program fee.1 In comparison, the Russell 1000 Value Index (the "benchmark") rose 6.40%, and the Lipper Large-Cap Value Funds category posted a median return of 6.64%. (Returns for all share classes over various time periods are shown in the "Performance at a glance" table on page 134. Please note that the returns shown do not reflect the deduction of taxes that a shareholder would pay on Portfolio distributions or the redemption of Portfolio shares.) For a detailed commentary on the market environment in general during the reporting period, please refer to page 2.
Sub-advisors' Comments2
Please note: ICAP was terminated as a sub-advisor for the Portfolio effective at the close of business on February 3, 2015. River Road Asset Management, LLC began serving as a sub-advisor for this Portfolio effective on February 4, 2015.
ICAP
During the period when we managed a portion of the Portfolio from August 1, 2014 through February 3, 2015, we modestly outperformed the benchmark. Stock selection in the health care sector contributed to performance, led by strong returns from Valeant Pharmaceutical, UnitedHealth Group and Medtronic. In the capital goods sector, Boeing outperformed the benchmark. Elsewhere, an underweight to the energy sector was additive for relative performance.
Stock selection in the consumer services sector detracted from results, as Viacom underperformed. Stock selection in the energy sector was also negative as Halliburton and Cameron International underperformed. We exited our position in Halliburton prior to the end of the reporting period. Finally, underweights to the utilities and retail sectors detracted from relative results.
Derivatives were not used during the reporting period.
1 Class P shares held through the PACE Select Advisors Program are subject to a maximum Program fee of 2.50%, which, if included, would have reduced performance. Class P shares held through other advisory programs also may be subject to a program fee, which, if included, would have reduced performance.
2 All Sub-advisors discuss performance on a gross of fees basis—meaning that no fees or expenses are reflected in their sleeves'/sleeve's performance. Alternately, Portfolio performance is shown net of fees, which does factor in fees and expenses associated with the Portfolio.
PACE Select Advisors Trust – PACE Large Co Value Equity Investments
Investment Sub-Advisors:
Institutional Capital LLC ("ICAP"); Pzena Investment Management, LLC ("Pzena");
Robeco Investment Management, Inc., doing business as Boston Partners ("Robeco");
Los Angeles Capital Management and Equity Research, Inc. ("Los Angeles Capital");
River Road Asset Management, LLC ("River Road")
Portfolio Managers:
ICAP: Jerrold Senser, Thomas M. Cole, Andrew P. Starr and Matthew T. Swanson;
Pzena: Richard S. Pzena, John P. Goetz and Benjamin Silver;
Robeco: Martin P. MacDonnell, CFA and Mark Donovan, CFA;
Los Angeles Capital: Thomas D. Stevens, CFA, Hal W. Reynolds, CFA and Daniel E. Allen, CFA;
River Road: Henry W. Sanders III, Thomas S. Forsha, James C. Shircliff
Objective:
Capital appreciation and dividend income
Investment process:
ICAP uses its proprietary valuation model to identify large capitalization companies that it believes offer the best relative values and seeks to avoid companies that exhibit excessive deterioration in earnings trends. ICAP looks for companies where there is a catalyst for positive change with potential to produce stock appreciation of 15% or more relative to the market over a 12- to 18-month period.
ICAP also uses internally and externally generated research to evaluate the financial condition and business prospects of every company it considers. ICAP monitors each stock purchased and sells the stock when
129
PACE Select Advisors Trust
PACE Large Co Value Equity Investments
Sub-advisor's Comments – continued
Pzena
Our portion of the Portfolio modestly outperformed the benchmark during the reporting period. Our best performing holdings were in the health care, materials & processing, and financial services sectors. Cigna, a leader in managed care, was our largest contributor to results, as its earnings improved and the company received a buyout offer from Anthem. In the materials & processing sector, shares of building product company Masco Corp. strengthened due to strong results fueled by improvement in residential construction. A lack of exposure to agriculture and mining-related stocks also helped our performance. In financials, insurers Axis Capital Holdings, American International Group ("AIG") and Voya Financial, as well as money center banks Citigroup and Bank of America, were top contributors, as the prospect of rising interest rates propelled the entire group higher. AIG also benefited from a favorable litigation outcome. Another notable contributor to performance was Staples, Inc., which advanced as investors applauded its planned merger with Office Depot. On the downside, our energy holdings were the weakest performers as oil prices plunged. Elsewhere, our technology holdings suffered due to challenging foreign exchange rates and a slowdown in enterprise spending. Our portion of the Portfolio lacked exposure to the consumer staples sector, where we are not finding value. This was not rewarded, as investors bid up the sector in pursuit of earnings stability and dividend yield.
Our portion of the Portfolio continues to be skewed toward economically sensitive sectors where valuations are the most attractive, in our view. Our largest weights are in the financial services, energy, consumer discretionary and technology sectors. Exposure to the financial sector increased as valuations improved and given our purchase of Regions Financial. Our exposure to producer durables also rose, as we purchased Stanley Black and Decker. These were offset by reductions in the technology and health care sectors as TE Connectivity and Becton Dickinson were sold as they reached our estimate of fair value.
We view the US market as being fully valued, yet with areas of opportunity that we are able to exploit. The first is where both earnings and valuations are depressed, with the financial sector the most prominent. Here we see a path to earnings normalization through higher interest rates, a recovery in trading activity and rationalization of the expense structure. Advertising is another example. Volumes are below trend but they should normalize as the US economy gains momentum and Europe recovers. Mature technology companies are an example of where earnings are not depressed, but where
Investment process (continued)
its target price is achieved, the catalyst becomes inoperative, or ICAP identifies another stock with greater opportunity for appreciation.
Pzena follows a disciplined investment process to implement its value philosophy, focusing exclusively on companies that are underperforming their historically demonstrated earnings power. Pzena applies intensive fundamental research to these companies in an effort to determine whether the problems that caused the earnings shortfall are temporary or permanent. The research process incorporates perspectives on valuation, earnings, management strategy, and downside protection.
Robeco invests primarily in a diversified portfolio of common stocks of issuers identified as having attractive value characteristics with strong fundamentals and positive business momentum. Robeco establishes a sell discipline for each security in the portfolio based on its target price, and may also sell a security if business fundamentals weaken or if an expected catalyst fails to materialize. The short side of the portfolio is selected by identifying the contra-characteristics that we look for on the long portfolio and covering a short if the stock reaches its fair value or there is a positive change in fundamentals or business momentum.
Los Angeles Capital employs a "long/short" or "130/30" equity strategy. Los Angeles Capital buys securities "long" that it believes will outperform the market or decrease portfolio risk, and sells securities "short" that it believes will underperform the market. Los Angeles Capital uses a proprietary quantitative model that includes fundamental data inputs for a universe of equity securities and, through the use of statistical tools, estimates expected returns based on each security's risk characteristics and the
130
PACE Select Advisors Trust
PACE Large Co Value Equity Investments
Sub-advisor's Comments – continued
valuations reflect uncertainty about sustainability of their business franchises. Developing opportunities include energy, where a massive capital expenditure boom and plunging oil prices are creating opportunity, and industrials, which are decelerating after a decade-long boom fueled by the emerging markets.
Derivatives were not used during the reporting period.
Robeco (doing business as Boston Partners)
Our portion of the Portfolio outperformed the benchmark during the reporting period, driven by strong security selection. In particular, our holdings in the energy, technology and communications sectors added the most value. In the energy sector, our avoidance of poorly performing integrated majors, such as Exxon Mobil, was relatively beneficial. They performed poorly as the price of oil fell dramatically given an increase in supply and concerns about global growth. We were also significantly underweight oil service companies, which fell sharply during the reporting period. In the technology sector, our overweight position in NXP Semiconductors contributed to results as its share price moved significantly higher. Our avoidance of Intel Corp. was also relatively beneficial as its share price declined. Stock selection in the communications sector was also strong, as our out-of-benchmark position in Liberty Global performed well. Finally, we had a significant overweight position in Comcast which outperformed the benchmark during the reporting period.
Short positions in our portion of the Portfolio that did well also came from the energy sector. For example, we had short positions in some exploration and production companies that were down significantly. In the communications sector, we had a large short position in Sprint Corp., whose shares fell sharply during the reporting period.
Detractors from performance were several short positions in the consumer services, health care and consumer non-durables sectors. Several long positions in the finance sector were headwinds for results. For example, we had a large position in Discover Financial Services whose shares declined during the reporting period. We also lacked exposure to certain regional banks that performed well.
Derivatives were not used during the reporting period.
Los Angeles Capital
Our portion of the Portfolio outperformed the benchmark during the reporting period, with both fundamental factors and industry tilts contributing to results. In looking at fundamental factors, in general, our higher quality posture added value. A tilt toward stocks with low book-to-price multiples added significant value, as investors paid up for balance sheet strength. In addition, a tilt away from volatility contributed to performance, as that factor was penalized during the reporting period. Additionally, exposure to stocks with positive analyst sentiment added value. Conversely, exposure to stocks with strong earnings quality and away from highly levered companies detracted from results. Moreover, a tilt toward smaller cap stocks negatively impacted performance. Within industries, an underweight to energy and an overweight to insurance and health care equipment & services contributed to results relative to the benchmark. In contrast, an underweight to materials and an overweight to real estate were the primary detractors from relative performance.
Investment process (concluded)
expected return to each characteristic in the current market environment.
River Road utilizes a fundamentally driven research process to identify attractive purchase candidates from an all cap universe of high yielding equity securities. The firm invests in well-managed, financially strong companies with high and growing dividends, targeting companies that are also trading at a meaningful discount to River Road's assessed valuation. The stock selection process is complemented by a risk averse approach that employs balanced diversification and a structured sell discipline.
131
PACE Select Advisors Trust
PACE Large Co Value Equity Investments
Sub-advisor's Comments – concluded
As of the end of the reporting period, our portion of the Portfolio was overweight health care, financials and retail, and underweight energy, technology and capital goods. Our portion of the Portfolio exhibited a book-to-price multiple that was in line with the benchmark and a lower dividend yield. Additionally, our portion of the Portfolio displayed a lower beta and was tilted toward smaller companies. (Beta is a measure of volatility or risk relative to the market as a whole.)
Derivatives were not used during the reporting period.
River Road Asset Management
For the period from February 4, 2015 through July 31, 2015, when we were a sub-advisor for a portion of the Portfolio, we underperformed the benchmark. Stock selection and sector allocation were both responsible for our underperformance and resulted in a negative total effect in seven of 10 sectors within the benchmark. The most significant detractors from performance came from stock selection in financials and an underweight in health care. The underperformance among financials was driven by holdings in the real estate investment trust ("REIT") and banking industries. In the case of REITs, a modest overweight to an industry that generated negative results was a headwind for performance. Our position in Iron Mountain, Inc., a storage and information management services REIT, was our largest detractor from performance during the reporting period. Additionally, the large regional banks we own—U.S. Bancorp, PNC Financial Services Group and Wells Fargo—all failed to keep pace with the industry's overall strong return. Other large detractors from performance were Intel Corp. and National Fuel Gas Co.
On the upside, the most significant positive impacts on relative performance were an underweight to the energy sector and stock selection in information technology. While energy was the worst absolute performing sector in our portion of the Portfolio, we significantly outperformed the benchmark sector. The outperformance in information technology was driven by our positions in Microsoft Corp., j2 Global, Inc. and Western Union. These three stocks were among our top five contributors to performance during the reporting period. The three holdings with the highest contribution to Portfolio return were Hasbro, Microsoft Corp. and PNC Financial Services Group, Inc. Hasbro was sold from our portion of the Portfolio, as it was trading at a significant premium to its assessed valuation based on our Absolute Value® approach. Absolute Value® is River Road Asset Management's proprietary investment philosophy and process. The objective of Absolute Value® investing is to provide attractive, sustainable, low volatility returns over the long term.
We did not use derivatives during the reporting period.
Special considerations
The Portfolio may be appropriate for long-term investors seeking capital appreciation and dividend income and who are able to withstand short-term fluctuations in the equity markets in return for potentially higher returns over the long term. The value of the Portfolio changes every day and can be affected by changes in interest rates, general market conditions and other political, social and economic developments, as well as specific matters relating to the companies in whose securities the Portfolio invests. It is important to note that an investment in the Portfolio is only one component of a balanced investment plan.
132
PACE Select Advisors Trust
PACE Large Co Value Equity Investments
Illustration of an assumed investment of $10,000 in Class P shares of the Portfolio (unaudited)
The following graph depicts the performance of PACE Large Co Value Equity Investments Class P shares versus the Russell 1000 Value Index over the 10 years ended July 31, 2015. Class P shares held through advisory programs may be subject to a program fee, which, if included, would have reduced performance. The performance of the other classes will vary based upon the different class specific expenses and sales charges. The performance provided does not reflect the deduction of taxes that a shareholder would pay on Portfolio distributions or the redemption of Portfolio shares. Past performance is no guarantee of future results. Share price and returns will vary with market conditions; investors may realize a gain or loss upon redemption. It is important to note that PACE Large Co Value Equity Investments is a professionally managed portfolio while the Index is not available for investment and is unmanaged. The comparison is shown for illustration purposes only.
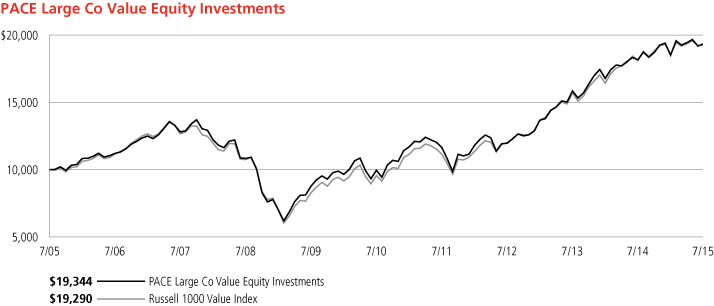
133
PACE Select Advisors Trust
PACE Large Co Value Equity Investments
Performance at a glance (unaudited)
Average annual total returns for periods ended 07/31/15 | | 1 year | | 5 years | | 10 years | |
Before deducting maximum sales charge | |
Class A1 | | | 6.23 | % | | | 13.94 | % | | | 6.56 | % | |
Class C2 | | | 5.44 | | | | 13.02 | | | | 5.71 | | |
Class Y3 | | | 6.51 | | | | 14.20 | | | | 6.87 | | |
Class P4 | | | 6.48 | | | | 14.20 | | | | 6.82 | | |
After deducting maximum sales charge | |
Class A1 | | | 0.39 | | | | 12.66 | | | | 5.96 | | |
Class C2 | | | 4.50 | | | | 13.02 | | | | 5.71 | | |
Russell 1000 Value Index5 | | | 6.40 | | | | 15.08 | | | | 6.79 | | |
Lipper Large-Cap Value Funds median | | | 6.64 | | | | 13.82 | | | | 6.17 | | |
Most recent calendar quarter-end returns (unaudited)
Average annual total returns for periods ended 06/30/15 | | 1 year | | 5 years | | 10 years | |
Before deducting maximum sales charge | |
Class A1 | | | 4.47 | % | | | 15.27 | % | | | 6.89 | % | |
Class C2 | | | 3.61 | | | | 14.34 | | | | 6.04 | | |
Class Y3 | | | 4.71 | | | | 15.53 | | | | 7.21 | | |
Class P4 | | | 4.67 | | | | 15.54 | | | | 7.16 | | |
After deducting maximum sales charge | |
Class A1 | | | (1.26 | ) | | | 13.98 | | | | 6.29 | | |
Class C2 | | | 2.69 | | | | 14.34 | | | | 6.04 | | |
The annualized gross and net expense ratios, respectively, for each class of shares as in the November 28, 2014 prospectuses, were as follows: Class A—1.32% and 1.32%; Class C—2.10% and 2.10%; Class Y—1.07% and 1.07%; and Class P—1.08% and 1.08%. Net expenses reflect fee waivers and/or expense reimbursements, if any, pursuant to an agreement that is in effect to cap the expenses. The Portfolio and UBS Global Asset Management (Americas) Inc. ("UBS Global AM") have entered into a written fee waiver/expense reimbursement agreement pursuant to which UBS Global AM is contractually obligated to waive its management fees and/or reimburse expenses so that the Portfolio's ordinary total operating expenses of each class through November 30, 2015 (excluding dividend expense, borrowing costs, and interest expense relating to short sales, and expenses attributable to investment in other investment companies, interest, taxes, brokerage commissions and extraordinary expenses) would not exceed Class A—1.27%; Class C—2.02%; Class Y—1.02%; and Class P—1.02%. The Portfolio has agreed to repay UBS Global AM for any waived fees/reimbursed expenses to the extent that it can do so over the following three fiscal years without causing the Portfolio's expenses in any of those three years to exceed these expense caps. The fee waiver/expense reimbursement agreement may be terminated by the Portfolio's board at any time and also will terminate automatically upon the expiration or termination of the Portfolio's advisory contract with UBS Global AM. Upon termination of the agreement, however, UBS Global AM's three year recoupment rights will survive.
1 Maximum sales charge for Class A shares is 5.5%. Class A shares bear ongoing 12b-1 service fees.
2 Maximum contingent deferred sales charge for Class C shares is 1% imposed on redemptions and is reduced to 0% after one year. Class C shares bear ongoing 12b-1 service and distribution fees.
3 The Portfolio offers Class Y shares to a limited group of eligible investors, including certain qualifying retirement plans. Class Y shares do not bear initial or contingent deferred sales charges or ongoing 12b-1 service and distribution fees.
4 Class P shares do not bear initial or contingent deferred sales charges or ongoing 12b-1 service and distribution fees, but Class P shares held through advisory programs may be subject to a program fee, which, if included, would have reduced performance.
5 The Russell 1000 Value Index measures the performance of the large-cap value segment of the US equity universe. It includes those Russell 1000 Index companies with lower price-to-book ratios and lower expected growth values. The Russell 1000 Value Index is constructed to provide a comprehensive and unbiased barometer for the large-cap value segment. The Index is completely reconstituted annually to ensure new and growing equities are included and that the represented companies continue to reflect value characteristics. Investors should note that indices do not reflect the deduction of fees and expenses.
Prior to February 17, 2015, if an investor sold or exchanged shares less than 90 days after purchase, a redemption fee of 1.00% of the amount sold or exchanged was deducted at the time of the transaction, except as noted otherwise in the prospectus. For sales or exchanges taking place on or after February 17, 2015 but prior to August 3, 2015, there is a reduction in the redemption holding period from 90 days to 30 days. Effective August 3, 2015, the 1.00% redemption fee imposed on sales or exchanges of any class of shares of the portfolios made during the holding periods specified in the prospectus was eliminated. Please refer to the prospectus for further information.
Past performance does not predict future performance, and the performance information provided does not reflect the deduction of taxes that a shareholder would pay on Portfolio distributions or the redemption of Portfolio shares. The return and principal value of an investment will fluctuate, so that an investor's shares, when redeemed, may be worth more or less than their original cost. Performance results assume reinvestment of all dividends and capital gain distributions at net asset value on the ex-dividend dates. Current performance may be higher or lower than the performance data quoted. For month-end performance figures, please visit http://globalam-us.ubs.com/corpweb/performance.do.
Lipper peer group data calculated by Lipper Inc.; used with permission. The Lipper median is the return of the fund that places in the middle of a Lipper peer group.
134
PACE Select Advisors Trust
PACE Large Co Value Equity Investments
Portfolio statistics (unaudited)
Characteristics | | 07/31/15 | |
Net assets (mm) | | $ | 1,406.6 | | |
Number of holdings | | | 531 | | |
Portfolio composition1 | | 07/31/15 | |
Common stocks, ADRs and rights | | | 111.2 | % | |
Investments sold short | | | (13.3 | ) | |
Cash equivalents and other assets less liabilities | | | 2.1 | | |
Total | | | 100.0 | % | |
Top five sectors (long holdings)1 | | 07/31/15 | |
Financials | | | 33.5 | % | |
Information Technology | | | 15.1 | | |
Consumer Discretionary | | | 12.9 | | |
Health Care | | | 12.5 | | |
Industrials | | | 11.0 | | |
Total | | | 85.0 | % | |
Top ten equity holdings (long holdings)1 | | 07/31/15 | |
Microsoft Corp. | | | 2.9 | % | |
Citigroup, Inc. | | | 2.5 | | |
Wells Fargo & Co. | | | 2.5 | | |
JPMorgan Chase & Co. | | | 2.4 | | |
Berkshire Hathaway, Inc., Class B | | | 1.9 | | |
The PNC Financial Services Group, Inc. | | | 1.6 | | |
Hewlett-Packard Co. | | | 1.6 | | |
Wal-Mart Stores, Inc. | | | 1.4 | | |
Intel Corp. | | | 1.4 | | |
American International Group, Inc. | | | 1.4 | | |
Total | | | 19.6 | % | |
Top five sectors (short holdings)1 | | 07/31/15 | |
Financials | | | (3.2 | )% | |
Consumer Discretionary | | | (2.2 | ) | |
Information Technology | | | (1.9 | ) | |
Industrials | | | (1.9 | ) | |
Energy | | | (1.0 | ) | |
Total | | | (10.2 | )% | |
Top ten equity holdings (short holdings)1 | | 07/31/15 | |
HCP, Inc. | | | (0.3 | )% | |
Twenty-First Century Fox, Inc., Class A | | | (0.3 | ) | |
Realty Income Corp. | | | (0.3 | ) | |
Macquarie Infrastructure Corp. | | | (0.2 | ) | |
Health Care REIT, Inc. | | | (0.2 | ) | |
Spectra Energy Corp. | | | (0.2 | ) | |
Zions Bancorporation | | | (0.2 | ) | |
Leucadia National Corp. | | | (0.2 | ) | |
The Chubb Corp. | | | (0.2 | ) | |
The Clorox Co. | | | (0.2 | ) | |
Total | | | (2.3 | )% | |
For a listing of defined portfolio acronyms that are used throughout the Portfolio statistics, please refer to page 254.
1 Weightings represent percentages of the Portfolio's net assets as of July 31, 2015. The Portfolio is actively managed and its composition will vary over time.
135
PACE Select Advisors Trust
PACE Large Co Value Equity Investments
Portfolio of investments—July 31, 2015
| | | Number of
shares | | Value | |
Common stocks—111.20% | |
Aerospace & defense—2.63% | |
General Dynamics Corp. | | | 46,541 | | | $ | 6,939,730 | | |
Honeywell International, Inc. | | | 16,880 | | | | 1,773,244 | | |
Huntington Ingalls Industries, Inc. | | | 6,774 | | | | 795,335 | | |
Lockheed Martin Corp. | | | 37,309 | | | | 7,726,694 | | |
Northrop Grumman Corp.1 | | | 24,630 | | | | 4,261,236 | | |
Raytheon Co. | | | 88,905 | | | | 9,698,647 | | |
Spirit Aerosystems Holdings, Inc.,
Class A* | | | 5,990 | | | | 337,237 | | |
United Technologies Corp. | | | 55,033 | | | | 5,520,360 | | |
| | | | 37,052,483 | | |
Air freight & logistics—0.66% | |
United Parcel Service, Inc., Class B | | | 90,995 | | | | 9,314,248 | | |
Airlines—0.84% | |
Delta Air Lines, Inc. | | | 161,835 | | | | 7,175,764 | | |
United Continental Holdings, Inc.* | | | 83,342 | | | | 4,699,655 | | |
| | | | 11,875,419 | | |
Auto components—0.27% | |
Gentex Corp.2 | | | 68,030 | | | | 1,093,922 | | |
Lear Corp. | | | 25,250 | | | | 2,627,768 | | |
| | | | 3,721,690 | | |
Automobiles—1.34% | |
Ford Motor Co. | | | 998,251 | | | | 14,804,062 | | |
General Motors Co.1 | | | 129,745 | | | | 4,088,265 | | |
| | | | 18,892,327 | | |
Banks—7.23% | |
BB&T Corp. | | | 159,531 | | | | 6,424,313 | | |
City National Corp. | | | 24,780 | | | | 2,227,970 | | |
East West Bancorp, Inc. | | | 71,022 | | | | 3,178,945 | | |
Fifth Third Bancorp | | | 179,825 | | | | 3,788,913 | | |
Huntington Bancshares, Inc. | | | 312,975 | | | | 3,652,418 | | |
People's United Financial, Inc.2 | | | 101,830 | | | | 1,656,774 | | |
Regions Financial Corp. | | | 891,700 | | | | 9,264,763 | | |
SunTrust Banks, Inc. | | | 32,258 | | | | 1,430,320 | | |
TCF Financial Corp. | | | 34,453 | | | | 567,097 | | |
The PNC Financial Services Group, Inc. | | | 234,117 | | | | 22,985,607 | | |
US Bancorp | | | 255,692 | | | | 11,559,835 | | |
Wells Fargo & Co.1 | | | 603,931 | | | | 34,949,487 | | |
| | | | 101,686,442 | | |
Beverages—0.99% | |
Constellation Brands, Inc., Class A | | | 4,068 | | | | 488,241 | | |
Molson Coors Brewing Co., Class B | | | 120,720 | | | | 8,588,021 | | |
PepsiCo, Inc. | | | 49,900 | | | | 4,807,865 | | |
| | | | 13,884,127 | | |
Biotechnology—0.61% | |
Baxalta, Inc.*,2 | | | 139,975 | | | | 4,595,380 | | |
Gilead Sciences, Inc. | | | 34,334 | | | | 4,046,605 | | |
| | | | 8,641,985 | | |
| | | Number of
shares | | Value | |
Common stocks—(continued) | |
Building products—0.39% | |
Masco Corp. | | | 171,428 | | | $ | 4,523,985 | | |
Owens Corning | | | 22,820 | | | | 1,023,477 | | |
| | | | 5,547,462 | | |
Capital markets—3.29% | |
Ameriprise Financial, Inc. | | | 5,780 | | | | 726,373 | | |
BlackRock, Inc. | | | 2,806 | | | | 943,714 | | |
Franklin Resources, Inc. | | | 175,199 | | | | 7,980,315 | | |
Invesco Ltd. | | | 21,080 | | | | 813,688 | | |
Legg Mason, Inc. | | | 36,136 | | | | 1,782,950 | | |
Morgan Stanley | | | 335,744 | | | | 13,040,297 | | |
Raymond James Financial, Inc.2 | | | 17,948 | | | | 1,058,932 | | |
State Street Corp. | | | 123,606 | | | | 9,463,275 | | |
The Goldman Sachs Group, Inc. | | | 51,158 | | | | 10,490,971 | | |
| | | | 46,300,515 | | |
Chemicals—1.27% | |
Air Products & Chemicals, Inc. | | | 20,900 | | | | 2,978,459 | | |
Ashland, Inc. | | | 31,300 | | | | 3,578,216 | | |
Eastman Chemical Co. | | | 7,670 | | | | 601,328 | | |
FMC Corp.2 | | | 8,992 | | | | 436,472 | | |
Huntsman Corp. | | | 141,814 | | | | 2,694,466 | | |
Innophos Holdings, Inc. | | | 33,700 | | | | 1,734,876 | | |
Methanex Corp. | | | 28,016 | | | | 1,263,241 | | |
The Mosaic Co. | | | 72,148 | | | | 3,098,035 | | |
The Valspar Corp. | | | 17,143 | | | | 1,427,669 | | |
| | | | 17,812,762 | | |
Commercial services & supplies—2.30% | |
Cintas Corp. | | | 11,410 | | | | 975,555 | | |
Corrections Corp. of America2 | | | 20,850 | | | | 733,294 | | |
KAR Auction Services, Inc. | | | 47,420 | | | | 1,846,061 | | |
Pitney Bowes, Inc.2 | | | 62,407 | | | | 1,305,554 | | |
R.R. Donnelley & Sons Co.2 | | | 45,556 | | | | 799,508 | | |
Republic Services, Inc. | | | 234,954 | | | | 9,992,594 | | |
Tetra Tech, Inc. | | | 42,262 | | | | 1,125,860 | | |
The ADT Corp.2 | | | 369,120 | | | | 12,745,713 | | |
Waste Connections, Inc. | | | 10,420 | | | | 522,355 | | |
Waste Management, Inc.2 | | | 45,118 | | | | 2,306,883 | | |
| | | | 32,353,377 | | |
Communications equipment—2.90% | |
Brocade Communications
Systems, Inc. | | | 520,091 | | | | 5,336,134 | | |
Cisco Systems, Inc.1 | | | 382,507 | | | | 10,870,849 | | |
Harris Corp. | | | 50,927 | | | | 4,223,885 | | |
Juniper Networks, Inc. | | | 64,559 | | | | 1,834,767 | | |
Motorola Solutions, Inc. | | | 160,535 | | | | 9,657,785 | | |
QUALCOMM, Inc. | | | 137,400 | | | | 8,847,186 | | |
| | | | 40,770,606 | | |
Construction & engineering—0.18% | |
AECOM*,2 | | | 42,129 | | | | 1,298,837 | | |
Fluor Corp. | | | 27,596 | | | | 1,290,113 | | |
| | | | 2,588,950 | | |
136
PACE Select Advisors Trust
PACE Large Co Value Equity Investments
Portfolio of investments—July 31, 2015
| | | Number of
shares | | Value | |
Common stocks—(continued) | |
Construction materials—0.05% | |
Vulcan Materials Co. | | | 7,550 | | | $ | 687,201 | | |
Consumer finance—2.02% | |
Ally Financial, Inc. | | | 160,210 | | | | 3,647,982 | | |
Capital One Financial Corp.1 | | | 206,274 | | | | 16,770,076 | | |
Discover Financial Services | | | 122,692 | | | | 6,847,441 | | |
Navient Corp. | | | 72,179 | | | | 1,133,210 | | |
| | | | 28,398,709 | | |
Containers & packaging—1.28% | |
Avery Dennison Corp. | | | 29,750 | | | | 1,810,287 | | |
Bemis Co., Inc. | | | 104,990 | | | | 4,679,404 | | |
Crown Holdings, Inc.* | | | 69,858 | | | | 3,598,386 | | |
Graphic Packaging Holding Co. | | | 97,405 | | | | 1,470,816 | | |
Sonoco Products Co. | | | 35,500 | | | | 1,465,440 | | |
WestRock Co.* | | | 79,248 | | | | 4,997,379 | | |
| | | | 18,021,712 | | |
Distributors—0.04% | |
Genuine Parts Co.2 | | | 5,570 | | | | 495,452 | | |
Diversified consumer services—0.06% | |
H&R Block, Inc. | | | 23,699 | | | | 788,940 | | |
Diversified financial services—7.93% | |
Bank of America Corp.1 | | | 1,064,386 | | | | 19,031,222 | | |
Citigroup, Inc.1 | | | 599,035 | | | | 35,019,586 | | |
CME Group, Inc.2 | | | 81,278 | | | | 7,805,939 | | |
Intercontinental Exchange, Inc. | | | 10,281 | | | | 2,344,479 | | |
JPMorgan Chase & Co.1 | | | 493,398 | | | | 33,812,565 | | |
The NASDAQ OMX Group, Inc. | | | 28,439 | | | | 1,451,242 | | |
Voya Financial, Inc. | | | 256,383 | | | | 12,037,182 | | |
| | | | 111,502,215 | | |
Diversified telecommunication services—1.77% | |
AT&T, Inc.2 | | | 164,424 | | | | 5,712,090 | | |
CenturyLink, Inc.2 | | | 105,856 | | | | 3,027,481 | | |
Verizon Communications, Inc. | | | 344,987 | | | | 16,141,942 | | |
| | | | 24,881,513 | | |
Electric utilities—0.37% | |
American Electric Power Co., Inc. | | | 18,286 | | | | 1,034,439 | | |
Duke Energy Corp.2 | | | 12,988 | | | | 963,969 | | |
Entergy Corp. | | | 7,510 | | | | 533,360 | | |
Exelon Corp. | | | 39,711 | | | | 1,274,326 | | |
FirstEnergy Corp. | | | 18,550 | | | | 629,958 | | |
Xcel Energy, Inc. | | | 20,825 | | | | 722,003 | | |
| | | | 5,158,055 | | |
Electrical equipment—0.51% | |
Emerson Electric Co. | | | 139,700 | | | | 7,229,475 | | |
Electronic equipment, instruments & components—0.86% | |
Arrow Electronics, Inc.* | | | 17,450 | | | | 1,014,717 | | |
Corning, Inc. | | | 305,282 | | | | 5,702,668 | | |
Dolby Laboratories, Inc., Class A2 | | | 12,230 | | | | 429,885 | | |
Flextronics International Ltd.* | | | 105,374 | | | | 1,160,168 | | |
| | | Number of
shares | | Value | |
Common stocks—(continued) | |
Electronic equipment, instruments & components—(concluded) | |
Ingram Micro, Inc., Class A*,2 | | | 56,790 | | | $ | 1,546,392 | | |
Jabil Circuit, Inc. | | | 109,461 | | | | 2,216,585 | | |
| | | | 12,070,415 | | |
Energy equipment & services—0.70% | |
Baker Hughes, Inc. | | | 120,938 | | | | 7,032,545 | | |
Cameron International Corp.* | | | 38,860 | | | | 1,960,875 | | |
Ensco PLC Class A2 | | | 22,100 | | | | 366,418 | | |
Superior Energy Services, Inc.2 | | | 31,497 | | | | 535,449 | | |
| | | | 9,895,287 | | |
Food & staples retailing—3.36% | |
CVS Health Corp.1 | | | 132,441 | | | | 14,895,640 | | |
Sysco Corp. | | | 333,255 | | | | 12,100,489 | | |
Wal-Mart Stores, Inc. | | | 272,292 | | | | 19,599,578 | | |
Whole Foods Market, Inc.2 | | | 16,520 | | | | 601,328 | | |
| | | | 47,197,035 | | |
Food products—1.06% | |
Bunge Ltd. | | | 16,496 | | | | 1,317,206 | | |
Mondelez International, Inc., Class A | | | 96,429 | | | | 4,351,841 | | |
The J.M. Smucker Co. | | | 3,984 | | | | 444,973 | | |
Tyson Foods, Inc., Class A | | | 199,541 | | | | 8,849,643 | | |
| | | | 14,963,663 | | |
Gas utilities—1.45% | |
AmeriGas Partners LP | | | 118,300 | | | | 5,431,153 | | |
Atmos Energy Corp. | | | 54,472 | | | | 3,012,301 | | |
National Fuel Gas Co. | | | 185,000 | | | | 10,002,950 | | |
Questar Corp.2 | | | 49,055 | | | | 1,086,078 | | |
UGI Corp. | | | 25,040 | | | | 914,962 | | |
| | | | 20,447,444 | | |
Health care equipment & supplies—1.59% | |
Baxter International, Inc.2 | | | 139,975 | | | | 5,610,198 | | |
Boston Scientific Corp.* | | | 135,683 | | | | 2,352,743 | | |
Hologic, Inc.*,2 | | | 43,601 | | | | 1,816,418 | | |
Medtronic PLC1 | | | 115,146 | | | | 9,026,295 | | |
Zimmer Holdings, Inc. | | | 33,770 | | | | 3,514,444 | | |
| | | | 22,320,098 | | |
Health care providers & services—5.50% | |
Anthem, Inc.2 | | | 42,898 | | | | 6,617,874 | | |
Cardinal Health, Inc.2 | | | 32,382 | | | | 2,751,822 | | |
Cigna Corp. | | | 76,696 | | | | 11,048,826 | | |
Community Health Systems, Inc.* | | | 35,900 | | | | 2,100,509 | | |
DaVita HealthCare Partners, Inc.* | | | 4,310 | | | | 340,619 | | |
Express Scripts Holding Co.* | | | 133,507 | | | | 12,024,976 | | |
HCA Holdings, Inc.* | | | 39,462 | | | | 3,670,361 | | |
Health Net, Inc.* | | | 44,363 | | | | 2,966,110 | | |
Humana, Inc. | | | 12,011 | | | | 2,187,083 | | |
Laboratory Corp. of America
Holdings* | | | 41,468 | | | | 5,278,462 | | |
MEDNAX, Inc.* | | | 20,770 | | | | 1,757,973 | | |
Omnicare, Inc. | | | 45,301 | | | | 4,387,402 | | |
Owens & Minor, Inc. | | | 160,100 | | | | 5,629,116 | | |
137
PACE Select Advisors Trust
PACE Large Co Value Equity Investments
Portfolio of investments—July 31, 2015
| | | Number of
shares | | Value | |
Common stocks—(continued) | |
Health care providers & services—(concluded) | |
Quest Diagnostics, Inc. | | | 189,020 | | | $ | 13,951,566 | | |
UnitedHealth Group, Inc. | | | 21,570 | | | | 2,618,598 | | |
| | | | 77,331,297 | | |
Hotels, restaurants & leisure—0.34% | |
Choice Hotels International, Inc.2 | | | 15,890 | | | | 804,988 | | |
Las Vegas Sands Corp.2 | | | 26,609 | | | | 1,491,168 | | |
MGM Resorts International*,2 | | | 15,850 | | | | 310,977 | | |
Six Flags Entertainment Corp. | | | 46,950 | | | | 2,189,748 | | |
| | | | 4,796,881 | | |
Household products—1.04% | |
Kimberly-Clark Corp. | | | 72,400 | | | | 8,323,828 | | |
The Clorox Co. | | | 11,230 | | | | 1,257,086 | | |
The Procter & Gamble Co.1 | | | 65,954 | | | | 5,058,672 | | |
| | | | 14,639,586 | | |
Independent power and renewable electricity
producers—0.40% | |
AES Corp. | | | 400,480 | | | | 5,126,144 | | |
Calpine Corp.* | | | 28,320 | | | | 518,256 | | |
| | | | 5,644,400 | | |
Industrial conglomerates—0.37% | |
General Electric Co.1 | | | 198,403 | | | | 5,178,318 | | |
Insurance—9.55% | |
ACE Ltd. | | | 59,048 | | | | 6,422,651 | | |
Allied World Assurance Co.
Holdings AG | | | 35,640 | | | | 1,506,146 | | |
American Financial Group, Inc. | | | 12,484 | | | | 860,772 | | |
American International Group, Inc. | | | 303,902 | | | | 19,486,196 | | |
Aon PLC | | | 27,806 | | | | 2,802,011 | | |
Arch Capital Group Ltd.*,2 | | | 11,490 | | | | 819,926 | | |
Aspen Insurance Holdings Ltd. | | | 35,180 | | | | 1,691,806 | | |
Assurant, Inc. | | | 38,520 | | | | 2,873,592 | | |
Assured Guaranty Ltd.2 | | | 87,580 | | | | 2,142,207 | | |
Axis Capital Holdings Ltd. | | | 211,831 | | | | 12,192,992 | | |
Berkshire Hathaway, Inc., Class B*,1 | | | 183,036 | | | | 26,126,559 | | |
Brown & Brown, Inc. | | | 22,740 | | | | 760,653 | | |
Cincinnati Financial Corp.2 | | | 11,065 | | | | 610,899 | | |
CNA Financial Corp. | | | 49,696 | | | | 1,968,955 | | |
Loews Corp.2 | | | 47,460 | | | | 1,808,701 | | |
Mercury General Corp.2 | | | 10,546 | | | | 595,322 | | |
MetLife, Inc. | | | 242,249 | | | | 13,502,959 | | |
Old Republic International Corp.2 | | | 147,780 | | | | 2,472,359 | | |
Prudential Financial, Inc. | | | 38,895 | | | | 3,436,762 | | |
RenaissanceRe Holdings Ltd.2 | | | 22,599 | | | | 2,424,873 | | |
The Allstate Corp.2 | | | 111,417 | | | | 7,682,202 | | |
The Hanover Insurance Group, Inc.2 | | | 17,732 | | | | 1,433,632 | | |
The Hartford Financial Services
Group, Inc. | | | 56,696 | | | | 2,695,895 | | |
The Travelers Cos., Inc. | | | 46,096 | | | | 4,891,707 | | |
Unum Group | | | 49,403 | | | | 1,770,604 | | |
Validus Holdings Ltd. | | | 30,967 | | | | 1,435,320 | | |
W.R. Berkley Corp.2 | | | 13,490 | | | | 751,663 | | |
| | | Number of
shares | | Value | |
Common stocks—(continued) | |
Insurance—(concluded) | |
Willis Group Holdings PLC | | | 135,371 | | | $ | 6,293,398 | | |
XL Group PLC | | | 74,730 | | | | 2,841,235 | | |
| | | | 134,301,997 | | |
Internet & catalog retail—0.15% | |
Expedia, Inc. | | | 10,901 | | | | 1,323,817 | | |
Liberty Interactive Corp., Class A* | | | 26,199 | | | | 761,081 | | |
| | | | 2,084,898 | | |
Internet software & services—0.46% | |
j2 Global, Inc.2 | | | 92,591 | | | | 6,518,406 | | |
IT services—1.68% | |
Automatic Data Processing, Inc. | | | 5,610 | | | | 447,510 | | |
Computer Sciences Corp.1 | | | 61,478 | | | | 4,022,505 | | |
DST Systems, Inc. | | | 3,000 | | | | 327,450 | | |
Fidelity National Information
Services, Inc. | | | 56,142 | | | | 3,673,371 | | |
Leidos Holdings, Inc. | | | 36,220 | | | | 1,477,776 | | |
Paychex, Inc.2 | | | 20,120 | | | | 933,568 | | |
The Western Union Co. | | | 418,700 | | | | 8,474,488 | | |
Total System Services, Inc. | | | 21,580 | | | | 997,428 | | |
Xerox Corp.2 | | | 297,187 | | | | 3,275,001 | | |
| | | | 23,629,097 | | |
Life sciences tools & services—0.13% | |
Charles River Laboratories
International, Inc.* | | | 4,630 | | | | 359,380 | | |
QIAGEN N.V.*,2 | | | 34,068 | | | | 953,223 | | |
Thermo Fisher Scientific, Inc. | | | 3,690 | | | | 514,866 | | |
| | | | 1,827,469 | | |
Machinery—2.33% | |
Crane Co. | | | 21,622 | | | | 1,150,291 | | |
Ingersoll-Rand PLC | | | 48,932 | | | | 3,004,425 | | |
Oshkosh Corp.2 | | | 37,969 | | | | 1,387,387 | | |
Parker-Hannifin Corp.2 | | | 142,563 | | | | 16,073,978 | | |
Stanley Black & Decker, Inc. | | | 103,503 | | | | 10,918,532 | | |
Trinity Industries, Inc.2 | | | 7,140 | | | | 208,916 | | |
| | | | 32,743,529 | | |
Media—6.40% | |
CBS Corp., Class B | | | 25,178 | | | | 1,346,268 | | |
Cinemark Holdings, Inc. | | | 116,955 | | | | 4,615,044 | | |
Comcast Corp., Class A | | | 102,984 | | | | 6,427,231 | | |
Liberty Broadband Corp., Class C* | | | 30,205 | | | | 1,616,874 | | |
Liberty Global PLC LiLAC, Class C* | | | 9,699 | | | | 412,692 | | |
Liberty Global PLC, Series C*,1 | | | 193,982 | | | | 9,532,275 | | |
Liberty Media Corp., Class A* | | | 22,852 | | | | 863,806 | | |
Liberty Media Corp., Class C* | | | 99,048 | | | | 3,734,110 | | |
News Corp., Class A* | | | 725,386 | | | | 10,684,936 | | |
Omnicom Group, Inc. | | | 263,628 | | | | 19,265,934 | | |
Scripps Networks Interactive, Inc.,
Class A2 | | | 30,925 | | | | 1,935,286 | | |
Shaw Communications, Inc., Class B | | | 164,168 | | | | 3,480,362 | | |
The Interpublic Group Cos., Inc. | | | 357,458 | | | | 7,613,855 | | |
138
PACE Select Advisors Trust
PACE Large Co Value Equity Investments
Portfolio of investments—July 31, 2015
| | | Number of
shares | | Value | |
Common stocks—(continued) | |
Media—(concluded) | |
Thomson Reuters Corp. | | | 237,886 | | | $ | 9,622,489 | | |
Time Warner, Inc.1 | | | 54,147 | | | | 4,767,102 | | |
Time, Inc. | | | 56,866 | | | | 1,269,249 | | |
Twenty-First Century Fox, Inc.,
Class A | | | 46,861 | | | | 1,616,236 | | |
Viacom, Inc., Class B | | | 22,281 | | | | 1,270,017 | | |
| | | | 90,073,766 | | |
Metals & mining—0.82% | |
Barrick Gold Corp. | | | 155,597 | | | | 1,098,515 | | |
Compass Minerals International, Inc. | | | 83,985 | | | | 6,718,800 | | |
Freeport-McMoRan, Inc.2 | | | 9,230 | | | | 108,452 | | |
Nucor Corp. | | | 80,100 | | | | 3,535,614 | | |
| | | | 11,461,381 | | |
Multi-utilities—0.56% | |
Ameren Corp. | | | 24,874 | | | | 1,021,824 | | |
Centerpoint Energy, Inc.2 | | | 72,508 | | | | 1,402,305 | | |
Dominion Resources, Inc.2 | | | 30,635 | | | | 2,196,529 | | |
Vectren Corp. | | | 78,002 | | | | 3,283,884 | | |
| | | | 7,904,542 | | |
Multiline retail—2.47% | |
Kohl's Corp.2 | | | 172,800 | | | | 10,596,096 | | |
Macy's, Inc. | | | 106,548 | | | | 7,358,205 | | |
Target Corp. | | | 205,479 | | | | 16,818,456 | | |
| | | | 34,772,757 | | |
Oil, gas & consumable fuels—9.32% | |
Anadarko Petroleum Corp. | | | 36,261 | | | | 2,696,005 | | |
Apache Corp.2 | | | 22,880 | | | | 1,049,277 | | |
| BP PLC, ADR | | | 352,316 | | | | 13,025,123 | | |
Canadian Natural Resources Ltd. | | | 131,193 | | | | 3,198,485 | | |
Cheniere Energy, Inc.*,2 | | | 23,740 | | | | 1,637,348 | | |
Chevron Corp.1 | | | 119,486 | | | | 10,572,121 | | |
ConocoPhillips | | | 18,218 | | | | 917,094 | | |
Continental Resources, Inc.*,2 | | | 19,800 | | | | 661,518 | | |
Devon Energy Corp. | | | 24,058 | | | | 1,188,946 | | |
Diamondback Energy, Inc.* | | | 30,274 | | | | 2,037,440 | | |
Energen Corp. | | | 40,085 | | | | 2,212,692 | | |
EOG Resources, Inc. | | | 66,911 | | | | 5,164,860 | | |
EQT Corp. | | | 18,392 | | | | 1,413,425 | | |
Exxon Mobil Corp.1 | | | 242,981 | | | | 19,246,525 | | |
Gulfport Energy Corp.* | | | 33,180 | | | | 1,086,977 | | |
Hess Corp. | | | 9,460 | | | | 558,235 | | |
Kinder Morgan, Inc. | | | 34,170 | | | | 1,183,649 | | |
Kosmos Energy Ltd.*,2 | | | 58,940 | | | | 424,368 | | |
Marathon Petroleum Corp. | | | 66,605 | | | | 3,641,295 | | |
Martin Midstream Partners LP | | | 75,600 | | | | 2,318,652 | | |
Murphy Oil Corp.2 | | | 166,650 | | | | 5,464,454 | | |
Occidental Petroleum Corp. | | | 265,128 | | | | 18,611,986 | | |
Parsley Energy, Inc., Class A*,2 | | | 53,500 | | | | 773,610 | | |
PBF Energy, Inc., Class A2 | | | 26,070 | | | | 823,030 | | |
Phillips 66 | | | 131,639 | | | | 10,465,300 | | |
QEP Resources, Inc. | | | 158,153 | | | | 2,195,164 | | |
Rice Energy, Inc.*,2 | | | 46,479 | | | | 838,946 | | |
| | | Number of
shares | | Value | |
Common stocks—(continued) | |
Oil, gas & consumable fuels—(concluded) | |
Royal Dutch Shell PLC, ADR | | | 264,525 | | | $ | 15,204,897 | | |
RSP Permian, Inc.* | | | 30,309 | | | | 751,663 | | |
Tesoro Corp. | | | 15,300 | | | | 1,489,302 | | |
WPX Energy, Inc.*,2 | | | 26,690 | | | | 232,203 | | |
| | | | 131,084,590 | | |
Paper & forest products—0.38% | |
International Paper Co.2 | | | 110,482 | | | | 5,288,773 | | |
Personal products—0.51% | |
Unilever PLC, ADR | | | 156,600 | | | | 7,098,678 | | |
Pharmaceuticals—4.63% | |
Abbott Laboratories | | | 159,621 | | | | 8,091,188 | | |
AbbVie, Inc. | | | 47,700 | | | | 3,339,477 | | |
Allergan PLC* | | | 2,780 | | | | 920,597 | | |
Johnson & Johnson1,2 | | | 192,919 | | | | 19,332,413 | | |
Merck & Co., Inc. | | | 172,408 | | | | 10,165,176 | | |
Pfizer, Inc.1 | | | 498,608 | | | | 17,979,804 | | |
Shire PLC, ADR | | | 7,821 | | | | 2,086,721 | | |
Teva Pharmaceutical Industries
Ltd., ADR | | | 47,225 | | | | 3,259,470 | | |
| | | | 65,174,846 | | |
Real estate investment trusts—3.62% | |
American Capital Agency Corp. | | | 40,470 | | | | 779,452 | | |
American Homes 4 Rent, Class A | | | 93,985 | | | | 1,555,452 | | |
Chimera Investment Corp. | | | 119,548 | | | | 1,701,168 | | |
Communications Sales & Leasing, Inc. | | | 170,118 | | | | 3,546,960 | | |
CyrusOne, Inc. | | | 147,900 | | | | 4,546,446 | | |
DDR Corp. | | | 92,130 | | | | 1,501,719 | | |
General Growth Properties, Inc. | | | 18,630 | | | | 505,618 | | |
Healthcare Trust of America, Inc.,
Class A | | | 17,625 | | | | 442,916 | | |
Hospitality Properties Trust2 | | | 25,870 | | | | 709,355 | | |
Host Hotels & Resorts, Inc. | | | 27,259 | | | | 528,279 | | |
Iron Mountain, Inc. | | | 384,700 | | | | 11,560,235 | | |
MFA Financial, Inc. | | | 203,623 | | | | 1,533,281 | | |
Post Properties, Inc.2 | | | 9,670 | | | | 550,610 | | |
Regency Centers Corp. | | | 20,910 | | | | 1,337,613 | | |
Retail Properties of America, Inc.,
Class A | | | 52,310 | | | | 761,634 | | |
Sunstone Hotel Investors, Inc. | | | 36,132 | | | | 508,377 | | |
The Geo Group, Inc. | | | 220,761 | | | | 8,333,728 | | |
UDR, Inc.2 | | | 17,980 | | | | 607,904 | | |
Vereit, Inc. | | | 57,180 | | | | 500,897 | | |
Weingarten Realty Investors | | | 34,920 | | | | 1,228,486 | | |
Weyerhaeuser Co. | | | 265,772 | | | | 8,156,543 | | |
| | | | 50,896,673 | | |
Real estate management & development—0.44% | |
Jones Lang LaSalle, Inc.2 | | | 18,527 | | | | 3,298,547 | | |
Realogy Holdings Corp.* | | | 26,820 | | | | 1,220,846 | | |
The Howard Hughes Corp.*,2 | | | 11,780 | | | | 1,601,609 | | |
| | | | 6,121,002 | | |
139
PACE Select Advisors Trust
PACE Large Co Value Equity Investments
Portfolio of investments—July 31, 2015
| | | Number of
shares | | Value | |
Common stocks—(concluded) | |
Road & rail—0.06% | |
Ryder System, Inc.2 | | | 9,870 | | | $ | 893,432 | | |
Semiconductors & semiconductor equipment—1.89% | |
Broadcom Corp., Class A | | | 22,400 | | | | 1,133,664 | | |
Intel Corp. | | | 675,950 | | | | 19,568,752 | | |
Lam Research Corp. | | | 23,711 | | | | 1,822,665 | | |
NXP Semiconductors N.V.* | | | 34,817 | | | | 3,376,901 | | |
ON Semiconductor Corp.* | | | 70,196 | | | | 745,481 | | |
| | | | 26,647,463 | | |
Software—4.40% | |
Activision Blizzard, Inc.2 | | | 190,822 | | | | 4,921,299 | | |
Microsoft Corp.1 | | | 869,621 | | | | 40,611,301 | | |
Oracle Corp. | | | 380,339 | | | | 15,190,740 | | |
Symantec Corp. | | | 51,936 | | | | 1,181,024 | | |
| | | | 61,904,364 | | |
Specialty retail—0.93% | |
Bed, Bath & Beyond, Inc.*,2 | | | 7,630 | | | | 497,705 | | |
Staples, Inc.2 | | | 575,074 | | | | 8,459,338 | | |
The Gap, Inc.2 | | | 114,414 | | | | 4,173,823 | | |
| | | | 13,130,866 | | |
Technology hardware, storage & peripherals—2.88% | |
Apple, Inc.1 | | | 74,591 | | | | 9,047,888 | | |
EMC Corp. | | | 79,736 | | | | 2,144,101 | | |
Hewlett-Packard Co.1 | | | 724,017 | | | | 22,096,999 | | |
Lexmark International, Inc., Class A | | | 16,190 | | | | 550,298 | | |
NCR Corp.* | | | 36,820 | | | | 1,014,023 | | |
NetApp, Inc.2 | | | 10,460 | | | | 325,829 | | |
Seagate Technology PLC2 | | | 34,024 | | | | 1,721,615 | | |
Western Digital Corp. | | | 42,553 | | | | 3,662,111 | | |
| | | | 40,562,864 | | |
Textiles, apparel & luxury goods—0.10% | |
Coach, Inc. | | | 43,310 | | | | 1,351,272 | | |
Tobacco—0.05% | |
Altria Group, Inc. | | | 12,510 | | | | 680,294 | | |
Trading companies & distributors—1.40% | |
Aircastle Ltd.2 | | | 182,300 | | | | 4,387,961 | | |
Fastenal Co.2 | | | 237,030 | | | | 9,922,076 | | |
MSC Industrial Direct Co., Inc.,
Class A | | | 75,643 | | | | 5,390,320 | | |
| | | | 19,700,357 | | |
Wireless telecommunication services—0.44% | |
Rogers Communications, Inc., Class B | | | 171,201 | | | | 6,005,730 | | |
Sprint Corp.*,2 | | | 47,230 | | | | 159,165 | | |
| | | | 6,164,895 | | |
Total common stocks
(cost—$1,442,293,712) | | | | | 1,564,108,300 | | |
| | | Number of
rights | | Value | |
Rights—0.00%† | |
Safeway Casa Ley CVR*,2,3,4 | | | 35,500 | | | $ | 36,029 | | |
Safeway PDC LLC CVR*,2,3,4 | | | 35,500 | | | | 1,733 | | |
Total rights
(cost—$37,630) | | | | | 37,762 | | |
| | | Face
amount | | | |
Repurchase agreement—2.13% | |
Repurchase agreement dated
07/31/15 with State Street Bank
and Trust Co., 0.000% due
08/03/15, collateralized by
$8,630,563 Federal Home Loan
Mortgage Corp. obligation,
2.080% due 10/17/22,
$2,165,840 Federal National
Mortgage Association obligation,
2.170% due 10/17/22 and
$19,311,884 US Treasury Notes,
1.625% to 3.625% due 03/31/19
to 06/30/20; (value—$30,613,758);
proceeds: $30,013,000
(cost—$30,013,000) | | $ | 30,013,000 | | | | 30,013,000 | | |
| | | Number of
shares | | | |
Investment of cash collateral from securities loaned—0.50% | |
Money market fund—0.50% | |
UBS Private Money Market Fund
LLC5 (cost—$6,993,833) | | | 6,993,833 | | | | 6,993,833 | | |
Total investments before
investments sold short
(cost—$1,479,338,175)—113.83% | | | | | 1,601,152,895 | | |
Investments sold short—(13.27)% | |
Common stocks—(13.27)% | |
Aerospace & defense—(0.13)% | |
BE Aerospace, Inc. | | | (13,356 | ) | | | (650,571 | ) | |
Orbital ATK, Inc. | | | (17,470 | ) | | | (1,239,496 | ) | |
| | | | (1,890,067 | ) | |
Air freight & logistics—(0.07)% | |
XPO Logistics, Inc. | | | (22,446 | ) | | | (973,034 | ) | |
Auto components—(0.11)% | |
Dorman Products, Inc. | | | (29,046 | ) | | | (1,533,048 | ) | |
Banks—(1.30)% | |
BancorpSouth, Inc. | | | (50,015 | ) | | | (1,263,879 | ) | |
Bank of Hawaii Corp. | | | (14,351 | ) | | | (968,262 | ) | |
Comerica, Inc. | | | (20,860 | ) | | | (989,390 | ) | |
Community Bank System, Inc. | | | (27,879 | ) | | | (1,065,814 | ) | |
CVB Financial Corp. | | | (53,609 | ) | | | (949,415 | ) | |
First Financial Bankshares, Inc. | | | (33,489 | ) | | | (1,137,956 | ) | |
First Republic Bank | | | (30,910 | ) | | | (1,971,749 | ) | |
Home Bancshares, Inc. | | | (26,706 | ) | | | (1,063,433 | ) | |
140
PACE Select Advisors Trust
PACE Large Co Value Equity Investments
Portfolio of investments—July 31, 2015
| | | Number of
shares | | Value | |
Investments sold short—(continued) | |
Common stocks—(continued) | |
Banks—(concluded) | |
PacWest Bancorp | | | (19,472 | ) | | $ | (901,359 | ) | |
Texas Capital Bancshares, Inc. | | | (17,710 | ) | | | (1,043,828 | ) | |
Trustmark Corp. | | | (24,675 | ) | | | (593,187 | ) | |
United Bankshares, Inc. | | | (42,227 | ) | | | (1,711,460 | ) | |
Valley National Bancorp | | | (111,388 | ) | | | (1,104,969 | ) | |
Westamerica BanCorp. | | | (25,873 | ) | | | (1,267,260 | ) | |
Zions Bancorporation | | | (70,400 | ) | | | (2,195,776 | ) | |
| | | | (18,227,737 | ) | |
Beverages—(0.05)% | |
Molson Coors Brewing Co., Class B | | | (9,360 | ) | | | (665,870 | ) | |
Biotechnology—(0.05)% | |
Alkermes PLC | | | (11,020 | ) | | | (771,620 | ) | |
Building products—(0.11)% | |
USG Corp. | | | (50,452 | ) | | | (1,563,003 | ) | |
Capital markets—(0.13)% | |
Franklin Resources, Inc. | | | (24,220 | ) | | | (1,103,221 | ) | |
TD Ameritrade Holding Corp. | | | (19,063 | ) | | | (700,184 | ) | |
| | | | (1,803,405 | ) | |
Chemicals—(0.57)% | |
Air Products & Chemicals, Inc. | | | (12,316 | ) | | | (1,755,153 | ) | |
Airgas, Inc. | | | (6,907 | ) | | | (704,652 | ) | |
Albemarle Corp. | | | (9,360 | ) | | | (507,312 | ) | |
Axalta Coating Systems Ltd. | | | (29,274 | ) | | | (931,206 | ) | |
Celanese Corp., Series A | | | (11,480 | ) | | | (756,762 | ) | |
E.I. du Pont de Nemours and Co. | | | (20,573 | ) | | | (1,147,150 | ) | |
FMC Corp. | | | (19,435 | ) | | | (943,375 | ) | |
W. R. Grace & Co. | | | (13,111 | ) | | | (1,323,293 | ) | |
| | | | (8,068,903 | ) | |
Commercial services & supplies—(0.22)% | |
Clean Harbors, Inc. | | | (8,770 | ) | | | (434,290 | ) | |
Mobile Mini, Inc. | | | (32,651 | ) | | | (1,212,332 | ) | |
Rollins, Inc. | | | (48,125 | ) | | | (1,395,625 | ) | |
| | | | (3,042,247 | ) | |
Communications equipment—(0.33)% | |
Arista Networks, Inc. | | | (24,181 | ) | | | (2,042,569 | ) | |
Cisco Systems, Inc. | | | (9,040 | ) | | | (256,917 | ) | |
JDS Uniphase Corp. | | | (126,530 | ) | | | (1,403,218 | ) | |
ViaSat, Inc. | | | (14,258 | ) | | | (883,996 | ) | |
| | | | (4,586,700 | ) | |
Construction & engineering—(0.14)% | |
Jacobs Engineering Group, Inc. | | | (10,584 | ) | | | (445,798 | ) | |
KBR, Inc. | | | (83,490 | ) | | | (1,458,570 | ) | |
| | | | (1,904,368 | ) | |
Construction materials—(0.09)% | |
Martin Marietta Materials, Inc. | | | (1,870 | ) | | | (293,253 | ) | |
Vulcan Materials Co. | | | (10,989 | ) | | | (1,000,219 | ) | |
| | | | (1,293,472 | ) | |
| | | Number of
shares | | Value | |
Investments sold short—(continued) | |
Common stocks—(continued) | |
Consumer finance—(0.10)% | |
Navient Corp. | | | (18,354 | ) | | $ | (288,158 | ) | |
Santander Consumer USA
Holdings, Inc. | | | (44,657 | ) | | | (1,079,806 | ) | |
| | | | (1,367,964 | ) | |
Containers & packaging—(0.03)% | |
Owens-Illinois, Inc. | | | (22,410 | ) | | | (478,454 | ) | |
Distributors—(0.05)% | |
LKQ Corp. | | | (24,320 | ) | | | (765,107 | ) | |
Diversified financial services—(0.15)% | |
Leucadia National Corp. | | | (89,948 | ) | | | (2,115,577 | ) | |
Diversified telecommunication services—(0.04)% | |
Frontier Communications Corp. | | | (106,210 | ) | | | (501,311 | ) | |
Electric utilities—(0.06)% | |
PPL Corp. | | | (24,870 | ) | | | (791,115 | ) | |
Electronic equipment, instruments & components—(0.35)% | |
Corning, Inc. | | | (64,352 | ) | | | (1,202,095 | ) | |
FLIR Systems, Inc. | | | (13,141 | ) | | | (404,612 | ) | |
Itron, Inc. | | | (25,383 | ) | | | (818,094 | ) | |
National Instruments Corp. | | | (29,481 | ) | | | (853,770 | ) | |
Trimble Navigation Ltd. | | | (68,572 | ) | | | (1,584,013 | ) | |
| | | | (4,862,584 | ) | |
Energy equipment & services—(0.15)% | |
Diamond Offshore Drilling, Inc. | | | (30,088 | ) | | | (660,432 | ) | |
Helmerich & Payne, Inc. | | | (11,950 | ) | | | (689,993 | ) | |
Rowan Cos., PLC, Class A | | | (48,005 | ) | | | (827,126 | ) | |
| | | | (2,177,551 | ) | |
Food & staples retailing—(0.07)% | |
Walgreens Boots Alliance, Inc. | | | (9,520 | ) | | | (919,918 | ) | |
Food products—(0.48)% | |
Campbell Soup Co. | | | (25,060 | ) | | | (1,235,709 | ) | |
McCormick & Co., Inc. | | | (14,565 | ) | | | (1,194,476 | ) | |
Mead Johnson Nutrition Co. | | | (12,101 | ) | | | (1,069,607 | ) | |
Mondelez International, Inc., Class A | | | (19,773 | ) | | | (892,355 | ) | |
Snyders-Lance, Inc. | | | (46,053 | ) | | | (1,497,644 | ) | |
The Hain Celestial Group, Inc. | | | (13,056 | ) | | | (887,547 | ) | |
| | | | (6,777,338 | ) | |
Health care equipment & supplies—(0.44)% | |
Alere, Inc. | | | (5,440 | ) | | | (264,439 | ) | |
Baxter International, Inc. | | | (26,490 | ) | | | (1,061,719 | ) | |
Medtronic PLC | | | (23,120 | ) | | | (1,812,377 | ) | |
The Cooper Cos., Inc. | | | (6,488 | ) | | | (1,148,376 | ) | |
West Pharmaceutical Services, Inc. | | | (32,498 | ) | | | (1,945,655 | ) | |
| | | | (6,232,566 | ) | |
Health care providers & services—(0.18)% | |
Diplomat Pharmacy, Inc. | | | (17,674 | ) | | | (816,185 | ) | |
Henry Schein, Inc. | | | (11,744 | ) | | | (1,737,877 | ) | |
| | | | (2,554,062 | ) | |
141
PACE Select Advisors Trust
PACE Large Co Value Equity Investments
Portfolio of investments—July 31, 2015
| | | Number of
shares | | Value | |
Investments sold short—(continued) | |
Common stocks—(continued) | |
Health care technology—(0.05)% | |
athenahealth, Inc. | | | (4,900 | ) | | $ | (685,804 | ) | |
Hotels, restaurants & leisure—(0.57)% | |
Aramark | | | (24,500 | ) | | | (779,590 | ) | |
Bob Evans Farms, Inc. | | | (12,995 | ) | | | (648,710 | ) | |
Carnival Corp. | | | (17,550 | ) | | | (935,240 | ) | |
Chipotle Mexican Grill, Inc. | | | (1,130 | ) | | | (838,720 | ) | |
Krispy Kreme Doughnuts, Inc. | | | (44,812 | ) | | | (835,296 | ) | |
Texas Roadhouse, Inc. | | | (22,855 | ) | | | (900,258 | ) | |
The Cheesecake Factory, Inc. | | | (16,865 | ) | | | (973,785 | ) | |
The Wendy's Co. | | | (158,338 | ) | | | (1,624,548 | ) | |
Wynn Resorts Ltd. | | | (5,140 | ) | | | (530,602 | ) | |
| | | | (8,066,749 | ) | |
Household durables—(0.23)% | |
D.R. Horton, Inc. | | | (63,400 | ) | | | (1,882,346 | ) | |
Lennar Corp., Class A | | | (26,227 | ) | | | (1,391,080 | ) | |
| | | | (3,273,426 | ) | |
Household products—(0.27)% | |
Colgate-Palmolive Co. | | | (25,366 | ) | | | (1,725,395 | ) | |
The Clorox Co. | | | (18,304 | ) | | | (2,048,950 | ) | |
| | | | (3,774,345 | ) | |
Independent power and renewable electricity
producers—(0.07)% | |
NRG Energy, Inc. | | | (39,700 | ) | | | (891,265 | ) | |
Talen Energy Corp. | | | (3,106 | ) | | | (48,857 | ) | |
| | | | (940,122 | ) | |
Insurance—(0.45)% | |
Aflac, Inc. | | | (19,740 | ) | | | (1,264,347 | ) | |
Axis Capital Holdings Ltd. | | | (16,140 | ) | | | (929,019 | ) | |
FNF Group | | | (26,660 | ) | | | (1,042,139 | ) | |
Genworth Financial, Inc., Class A | | | (80,508 | ) | | | (564,361 | ) | |
The Chubb Corp. | | | (16,680 | ) | | | (2,073,824 | ) | |
XL Group PLC | | | (11,380 | ) | | | (432,668 | ) | |
| | | | (6,306,358 | ) | |
Internet software & services—(0.11)% | |
LendingClub Corp. | | | (39,888 | ) | | | (578,775 | ) | |
Yahoo!, Inc. | | | (24,770 | ) | | | (908,316 | ) | |
| | | | (1,487,091 | ) | |
IT services—(0.15)% | |
VeriFone Systems, Inc. | | | (40,348 | ) | | | (1,298,399 | ) | |
Wipro Ltd., ADR | | | (68,125 | ) | | | (842,025 | ) | |
| | | | (2,140,424 | ) | |
Leisure products—(0.08)% | |
Mattel, Inc. | | | (50,795 | ) | | | (1,178,952 | ) | |
Machinery—(0.43)% | |
AGCO Corp. | | | (14,340 | ) | | | (788,843 | ) | |
Deere & Co. | | | (13,780 | ) | | | (1,303,175 | ) | |
Joy Global, Inc. | | | (7,330 | ) | | | (193,585 | ) | |
| | | Number of
shares | | Value | |
Investments sold short—(continued) | |
Common stocks—(continued) | |
Machinery—(concluded) | |
Kennametal, Inc. | | | (20,179 | ) | | $ | (639,473 | ) | |
Lincoln Electric Holdings, Inc. | | | (8,200 | ) | | | (496,510 | ) | |
Pentair PLC | | | (10,267 | ) | | | (624,336 | ) | |
The Timken Co. | | | (19,440 | ) | | | (648,907 | ) | |
Valmont Industries, Inc. | | | (12,630 | ) | | | (1,404,835 | ) | |
| | | | (6,099,664 | ) | |
Media—(0.40)% | |
DreamWorks Animation SKG, Inc.,
Class A | | | (27,207 | ) | | | (655,961 | ) | |
Liberty Broadband Corp., Class A | | | (14,370 | ) | | | (775,549 | ) | |
Liberty Broadband Corp., Class C | | | (9,100 | ) | | | (487,123 | ) | |
Twenty-First Century Fox, Inc.,
Class A | | | (107,362 | ) | | | (3,702,915 | ) | |
| | | | (5,621,548 | ) | |
Metals & mining—(0.14)% | |
Allegheny Technologies, Inc. | | | (61,580 | ) | | | (1,312,886 | ) | |
Royal Gold, Inc. | | | (12,634 | ) | | | (637,006 | ) | |
| | | | (1,949,892 | ) | |
Multi-utilities—(0.07)% | |
WEC Energy Group, Inc. | | | (19,830 | ) | | | (971,670 | ) | |
Oil, gas & consumable fuels—(0.62)% | |
Cabot Oil & Gas Corp. | | | (20,712 | ) | | | (541,826 | ) | |
Chevron Corp. | | | (15,535 | ) | | | (1,374,537 | ) | |
Concho Resources, Inc. | | | (9,527 | ) | | | (1,015,197 | ) | |
CVR Energy, Inc. | | | (13,576 | ) | | | (519,011 | ) | |
Golar LNG Ltd. | | | (16,060 | ) | | | (691,704 | ) | |
Matador Resources Co. | | | (46,557 | ) | | | (1,025,651 | ) | |
Newfield Exploration Co. | | | (13,413 | ) | | | (439,812 | ) | |
QEP Resources, Inc. | | | (24,130 | ) | | | (334,924 | ) | |
Spectra Energy Corp. | | | (93,043 | ) | | | (2,815,481 | ) | |
| | | | (8,758,143 | ) | |
Paper & forest products—(0.04)% | |
Domtar Corp. | | | (12,780 | ) | | | (519,635 | ) | |
Personal products—(0.03)% | |
Avon Products, Inc. | | | (73,360 | ) | | | (415,951 | ) | |
Pharmaceuticals—(0.03)% | |
Mylan NV | | | (7,010 | ) | | | (392,490 | ) | |
Professional services—(0.14)% | |
Manpowergroup, Inc. | | | (12,520 | ) | | | (1,132,810 | ) | |
Nielsen NV | | | (18,010 | ) | | | (872,764 | ) | |
| | | | (2,005,574 | ) | |
Real estate investment trusts—(1.25)% | |
AvalonBay Communities, Inc. | | | (7,462 | ) | | | (1,286,001 | ) | |
Corporate Office Properties Trust | | | (13,449 | ) | | | (311,075 | ) | |
Equinix, Inc. | | | (6,077 | ) | | | (1,694,936 | ) | |
HCP, Inc. | | | (102,681 | ) | | | (3,967,594 | ) | |
Health Care REIT, Inc. | | | (42,185 | ) | | | (2,926,374 | ) | |
Omega Healthcare Investors, Inc. | | | (49,445 | ) | | | (1,792,876 | ) | |
142
PACE Select Advisors Trust
PACE Large Co Value Equity Investments
Portfolio of investments—July 31, 2015
| | | Number of
shares | | Value | |
Investments sold short—(continued) | |
Common stocks—(continued) | |
Real estate investment trusts—(concluded) | |
Realty Income Corp. | | | (75,766 | ) | | $ | (3,658,740 | ) | |
Rouse Properties, Inc. | | | (25,389 | ) | | | (446,846 | ) | |
SL Green Realty Corp. | | | (7,784 | ) | | | (896,250 | ) | |
Ventas, Inc. | | | (8,770 | ) | | | (588,379 | ) | |
| | | | (17,569,071 | ) | |
Road & rail—(0.34)% | |
CSX Corp. | | | (12,100 | ) | | | (378,488 | ) | |
Genesee & Wyoming, Inc., Class A | | | (6,340 | ) | | | (451,535 | ) | |
Heartland Express, Inc. | | | (28,434 | ) | | | (606,497 | ) | |
J.B. Hunt Transport Services, Inc. | | | (9,012 | ) | | | (758,089 | ) | |
Norfolk Southern Corp. | | | (9,507 | ) | | | (801,725 | ) | |
Old Dominion Freight Line, Inc. | | | (12,220 | ) | | | (893,893 | ) | |
Ryder System, Inc. | | | (9,459 | ) | | | (856,229 | ) | |
| | | | (4,746,456 | ) | |
Semiconductors & semiconductor equipment—(0.38)% | |
Analog Devices, Inc. | | | (13,172 | ) | | | (768,323 | ) | |
Cavium, Inc. | | | (13,685 | ) | | | (927,843 | ) | |
Cree, Inc. | | | (22,300 | ) | | | (549,695 | ) | |
Cypress Semiconductor Corp. | | | (86,100 | ) | | | (988,428 | ) | |
Marvell Technology Group Ltd. | | | (75,470 | ) | | | (938,847 | ) | |
Micron Technology, Inc. | | | (6,940 | ) | | | (128,459 | ) | |
NVIDIA Corp. | | | (49,300 | ) | | | (983,535 | ) | |
| | | | (5,285,130 | ) | |
Software—(0.84)% | |
Activision Blizzard, Inc. | | | (41,520 | ) | | | (1,070,801 | ) | |
ANSYS, Inc. | | | (6,602 | ) | | | (621,578 | ) | |
Blackbaud, Inc. | | | (24,230 | ) | | | (1,481,907 | ) | |
Microsoft Corp. | | | (27,040 | ) | | | (1,262,768 | ) | |
NetSuite, Inc. | | | (16,789 | ) | | | (1,659,425 | ) | |
Proofpoint, Inc. | | | (21,522 | ) | | | (1,392,473 | ) | |
Salesforce.com, Inc. | | | (11,433 | ) | | | (838,039 | ) | |
The Ultimate Software Group, Inc. | | | (7,563 | ) | | | (1,393,180 | ) | |
Tyler Technologies, Inc. | | | (6,940 | ) | | | (968,408 | ) | |
Verint Systems, Inc. | | | (15,288 | ) | | | (890,067 | ) | |
Zynga, Inc., Class A | | | (114,500 | ) | | | (283,960 | ) | |
| | | | (11,862,606 | ) | |
| | | Number of
shares | | Value | |
Investments sold short—(concluded) | |
Common stocks—(concluded) | |
Specialty retail—(0.45)% | |
Cabela's, Inc.* | | | (12,881 | ) | | $ | (572,303 | ) | |
CarMax, Inc.* | | | (29,995 | ) | | | (1,934,977 | ) | |
Mattress Firm Holding Corp.* | | | (21,237 | ) | | | (1,313,509 | ) | |
Monro Muffler Brake, Inc. | | | (20,871 | ) | | | (1,320,091 | ) | |
Restoration Hardware Holdings, Inc. | | | (11,135 | ) | | | (1,129,757 | ) | |
| | | | (6,270,637 | ) | |
Technology hardware, storage & peripherals—(0.06)% | |
SanDisk Corp. | | | (4,640 | ) | | | (279,745 | ) | |
Western Digital Corp. | | | (6,780 | ) | | | (583,487 | ) | |
| | | | (863,232 | ) | |
Textiles, apparel & luxury goods—(0.10)% | |
Under Armour, Inc., Class A | | | (14,614 | ) | | | (1,451,609 | ) | |
Thrifts & mortgage finance—(0.09)% | |
New York Community Bancorp, Inc. | | | (67,080 | ) | | | (1,276,532 | ) | |
Tobacco—(0.06)% | |
Philip Morris International, Inc. | | | (10,600 | ) | | | (906,618 | ) | |
Trading companies & distributors—(0.06)% | |
Air Lease Corp. | | | (11,260 | ) | | | (398,041 | ) | |
W.W. Grainger, Inc. | | | (2,041 | ) | | | (466,797 | ) | |
| | | | (864,838 | ) | |
Transportation infrastructure—(0.23)% | |
Macquarie Infrastructure Corp. | | | (37,940 | ) | | | (3,222,244 | ) | |
Wireless telecommunication services—(0.13)% | |
Sprint Corp. | | | (138,761 | ) | | | (467,625 | ) | |
Telephone & Data Systems, Inc. | | | (39,000 | ) | | | (1,146,990 | ) | |
US Cellular Corp. | | | (7,560 | ) | | | (281,383 | ) | |
| | | | (1,895,998 | ) | |
Total investments sold short
(proceeds—$181,303,197) | | | | | (186,669,830 | ) | |
Liabilities in excess of
other assets—(0.56)% | | | | | (7,854,258 | ) | |
Net assets—100.00% | | | | $ | 1,406,628,807 | | |
For a listing of defined portfolio acronyms that are used throughout the Portfolio of investments as well as the tables that follow, please refer to page 254.
Aggregate cost for federal income tax purposes before investments sold short was $1,489,626,726 and net unrealized appreciation consisted of:
Gross unrealized appreciation | | $ | 173,829,676 | | |
Gross unrealized depreciation | | | (62,303,507 | ) | |
Net unrealized appreciation | | $ | 111,526,169 | | |
143
PACE Select Advisors Trust
PACE Large Co Value Equity Investments
Portfolio of investments—July 31, 2015
Fair valuation summary
The following is a summary of the fair valuations according to the inputs used as of July 31, 2015 in valuing the Portfolio's investments: | |
Assets
Description | | Unadjusted
quoted prices in
active markets for
identical investments
(Level 1) | | Other significant
observable inputs
(Level 2) | | Unobservable
inputs
(Level 3) | | Total | |
Common stocks | | $ | 1,564,108,300 | | | $ | — | | | $ | — | | | $ | 1,564,108,300 | | |
Rights | | | — | | | | — | | | | 37,762 | | | | 37,762 | | |
Repurchase agreement | | | — | | | | 30,013,000 | | | | — | | | | 30,013,000 | | |
Investment of cash collateral from securities loaned | | | — | | | | 6,993,833 | | | | — | | | | 6,993,833 | | |
Total | | $ | 1,564,108,300 | | | $ | 37,006,833 | | | $ | 37,762 | | | $ | 1,601,152,895 | | |
Liabilities | |
Investments sold short | | $ | (186,669,830 | ) | | $ | — | | | $ | — | | | $ | (186,669,830 | ) | |
At July 31, 2015, there were no transfers between Level 1 and Level 2. | |
The following is a rollforward of the Portfolio's investments that was valued using unobservable inputs (Level 3) for the year ended July 31, 2015:
| | | Rights | |
Beginning balance | | $ | — | | |
Purchases | | | — | | |
Issuances | | | 37,630 | | |
Sales | | | — | | |
Accrued discounts/(premiums) | | | — | | |
Total realized gain/(loss) | | | — | | |
Net change in unrealized appreciation/depreciation | | | 132 | | |
Transfers into Level 3 | | | — | | |
Transfers out of Level 3 | | | — | | |
Ending balance | | $ | 37,762 | | |
The change in net unrealized appreciation/depreciation relating to the Level 3 investments held at July 31, 2015, was $132.
Issuer breakdown by country or territory of origin (unaudited)
Investments before investments sold short | | Percentage of
total investments
before investments
sold short | |
United States | | | 91.1 | % | |
United Kingdom | | | 3.0 | | |
Bermuda | | | 1.7 | | |
Canada | | | 1.5 | | |
Ireland | | | 1.5 | | |
Switzerland | | | 0.5 | | |
Netherlands | | | 0.3 | | |
Israel | | | 0.2 | | |
Jersey | | | 0.1 | | |
Singapore | | | 0.1 | | |
Total | | | 100.0 | % | |
144
PACE Select Advisors Trust
PACE Large Co Value Equity Investments
Portfolio of investments—July 31, 2015
Investments sold short | | Percentage of
total investments
sold short | |
United States | | | (94.1 | )% | |
Bermuda | | | (1.9 | ) | |
Ireland | | | (1.9 | ) | |
Netherlands | | | (0.7 | ) | |
India | | | (0.5 | ) | |
Panama | | | (0.5 | ) | |
United Kingdom | | | (0.4 | ) | |
Total | | | (100.0 | )% | |
Portfolio footnotes
* Non-income producing security.
† Amount represents less than 0.005%.
1 Security, or portion thereof, pledged as collateral for investments sold short.
2 Security, or portion thereof, was on loan at July 31, 2015.
3 Security is being fair valued by a valuation committee under the direction of the board of trustees.
4 Illiquid investment as of July 31, 2015.
5 The table below details the Portfolio's transaction activity in an affiliated issuer during the year ended July 31, 2015. The investment manager earns a management fee from UBS Private Money Market Fund LLC. Please see the Notes to financial statements for further information.
Security description | | Value at
07/31/14 | | Purchases
during the
year ended
07/31/15 | | Sales
during the
year ended
07/31/15 | | Value at
07/31/15 | | Net income
earned from
affiliate for the
year ended
07/31/15 | |
UBS Private Money Market Fund LLC | | $ | 1,130,800 | | | $ | 75,238,258 | | | $ | 69,375,225 | | | $ | 6,993,833 | | | $ | 246 | | |
See accompanying notes to financial statements.
145
PACE Select Advisors Trust
PACE Large Co Growth Equity Investments
Performance (unaudited)
For the 12 months ended July 31, 2015, the Portfolio's Class P shares gained 14.88% before the deduction of the maximum PACE Select program fee.1 In comparison, the Russell 1000 Growth Index (the "benchmark") rose 16.08%, and the Lipper Large-Cap Growth Funds category posted a median return of 15.66%. (Returns for all share classes over various time periods are shown in the "Performance at a glance" table on page 150. Please note that the returns shown do not reflect the deduction of taxes that a shareholder would pay on Portfolio distributions or the redemption of Portfolio shares.) For a detailed commentary on the market environment in general during the reporting period, please refer to page 2.
As a result of a transaction resulting in Mar Vista owning a controlling interest in its affiliate, Roxbury, Mar Vista became responsible for Roxbury's portion of the Portfolio effective January 20, 2015.
Sub-advisors' Comments2
Jackson Square
Our portion of the Portfolio outperformed the benchmark during the reporting period. Strong performance in the health care and financial services sectors helped to overcome weak performance in the consumer discretionary and technology sectors.
In terms of individual holdings, top contributors to performance included Celgene, Allergan and Valeant Pharmaceuticals. Celgene experienced several positive developments during the fiscal year that led to strong share price appreciation. These included favorable regulatory approval and clinical trial developments for various drug offerings, as well as the regulatory overhang from the European patent office regarding their key drug offering, Revlimid, moving a step closer toward resolution. Additionally, the company has been diversifying its product offerings through recent acquisitions and strategic partnerships with other drug development companies, which helped lead to further stock price appreciation. Overall, Celgene continues to
1 Class P shares held through the PACE Select Advisors Program are subject to a maximum Program fee of 2.50%, which, if included, would have reduced performance. Class P shares held through other advisory programs also may be subject to a program fee, which, if included, would have reduced performance.
2 All Sub-advisors discuss performance on a gross-of-fees basis—meaning that no fees or expenses are reflected in their sleeves'/sleeve's performance. Alternately, Portfolio performance is shown net of fees, which does factor in fees and expenses associated with the Portfolio.
PACE Select Advisors Trust – PACE Large Co Growth Equity Investments
Investment Sub-Advisors:
Jackson Square Partners, LLC ("Jackson Square");
Mar Vista Investment Partners, which assumed Roxbury Capital Management's role in managing the fund ("Mar Vista");
J.P. Morgan Investment Management Inc. ("J.P. Morgan")
Portfolio Managers:
Jackson Square: Jeffrey Van Harte, Christopher Bonavico, Daniel Prislin and Christopher Ericksen;
Mar Vista: Brian L. Massey and Silas A. Myers;
J.P. Morgan: Gregory B. Luttrell
Objective:
Capital appreciation
Investment process:
Jackson Square invests primarily in common stocks of large capitalization growth-oriented companies that Jackson Square believes have long-term capital appreciation potential and are expected to grow faster than the US economy. Using a bottom-up approach, Jackson Square seeks to select securities of companies that it believes have attractive large end-market potential, dominant business models and strong free cash flow generation that are attractively priced compared to the intrinsic value of the securities. Jackson Square also considers a company's operational efficiencies, management's plans for capital allocation and the company's shareholder orientation.
Mar Vista employs a bottom-up approach to stock selection, seeking high quality growth companies whose stocks are trading at discounts to fair value. Mar Vista looks for companies with sustainable competitive advantages and opportunities to grow and
146
PACE Select Advisors Trust
PACE Large Co Growth Equity Investments
Sub-advisors' Comments – continued
be a leader in the treatment of blood cancers, with a growing pipeline of breast, lung and pancreatic cancer treatments. We believe the company appears poised to continue benefiting from large growth prospects, driven by additional indications for its drugs, by increased use of existing drugs and from international growth opportunities.
Our largest detractors from performance were EOG Resources, Discovery Communications and QUALCOMM. EOG Resources, along with others within the oil and natural gas industry, continued to experience weakness amid depressed oil and natural gas prices. We initially felt EOG Resources' management team and its unique capital allocation discipline relative to other energy companies could increase the company's potential to perform and add value through a variety of commodity prices and economic environments. However, it increasingly looked like persistently low oil and natural gas prices created an environment where the company would not be strong enough to overcome cyclical headwinds over the near term. We therefore decided to exit our position in EOG Resources to allocate to more attractive opportunities.
Derivatives were not used during the reporting period.
Mar Vista Investment Partners
Our portion of the Portfolio underperformed the benchmark during the reporting period. Energy was the only meaningful detractor from performance from a sector perspective. This negative overshadowed positive performance from our exposures in the health care, consumer discretionary, consumer staples and financials sectors.
In terms of individual holdings, Google, two of our industrials positions (B/E Aerospace and Union Pacific) and our position in Occidental Petroleum, detracted the most from performance during the reporting period. Both Google and Occidental Petroleum were sold prior to the end of the reporting period. Google was sold to accommodate the purchase of a new stock and Occidental Petroleum was sold so that capital could be reallocated to investments with more favorable risk-reward profiles. Our lack of biotechnology stocks was also a headwind for results. On the upside, stable interest rates, a modest US economic recovery and strong financial results for our businesses contributed to results. In particular, Starbucks, Allergan, Markel and TransDigm contributed the most to performance over the reporting period.
Our average discount to intrinsic value, at 12%, has improved but still remains compressed compared to the historical averages of 20%-35% discounts. Our expectations for future returns remain the same: with the discount between prices and intrinsic values unusually compressed, we would anticipate returns over our time horizon to more closely correlate with our companies' ability to compound per share intrinsic value (and only a modest return from discounted prices).
Derivatives were not a part of our investment strategy during the reporting period.
Investment process (concluded)
reinvest capital at higher rates than their cost of capital. Mar Vista also seeks to invest in companies with management teams with a proven ability to allocate capital in ways that maximize shareholder value. Mar Vista's investment approach seeks to balance both the protection of capital as well as the appreciation potential of a stock.
J.P. Morgan invests primarily in a focused portfolio of equity securities of large capitalization companies. J.P. Morgan considers large capitalization companies to be companies with market capitalizations equal to those within the universe of the Russell 1000 Growth Index at the time of purchase. Although J.P. Morgan will invest primarily in equity securities of U.S. companies, it may invest in foreign securities, including depositary receipts. J.P. Morgan utilizes a combination of qualitative analysis and quantitative metrics in order to seek to achieve target returns which are higher than those of the fund's benchmark while attempting to maintain a moderate risk profile.
147
PACE Select Advisors Trust
PACE Large Co Growth Equity Investments
Sub-advisors' Comments – concluded
J.P. Morgan
Our portion of the Portfolio underperformed the benchmark during the reporting period. Stock selection in the consumer discretionary and producer durables sectors were the largest detractors from performance during the reporting period. Stock selection within as well as the overweight to health care was the largest contributor, followed by stock selection within and an underweight to the materials and processing sector. At the individual stock level, overweight positions in luxury retailer Michael Kors and oilfield services company Schlumberger, were the largest detractors from performance. On the positive side, overweight positions in biopharmaceutical company Regeneron and online retailer Amazon.com were the largest contributors to performance. As of the end of the reporting period, our portion of the Portfolio no longer owned Michael Kors, as the company no longer met the fundamental criteria we look for in our holdings.
Our portion of the Portfolio continues to focus on identifying companies that possess these three key characteristics: 1) a large addressable market undergoing meaningful change, 2) a sustainable competitive advantage and is executing well, and 3) positive earnings revisions. We continue to find attractive opportunities in health care, which remains our largest overweight exposure. We are also overweight the technology sector, primarily through semiconductor and Internet software exposure. Our greatest underweights are in consumer staples and producer durables, areas where we are finding limited growth opportunities.
Derivatives were not a part of our investment strategy during the reporting period.
Special considerations
The Portfolio may be appropriate for long-term investors seeking capital appreciation who are able to withstand short-term fluctuations in the equity markets in return for potentially higher returns over the long term. The value of the Portfolio changes every day and can be affected by changes in interest rates, general market conditions, and other political, social and economic developments, as well as specific matters relating to the companies in whose securities the Portfolio invests. Also, to the extent the Portfolio invests a large portion of its assets in a particular sector, the Portfolio may experience greater volatility and risk of loss due to unfavorable developments in that sector. It is important to note that an investment in the Portfolio is only one component of a balanced investment plan.
148
PACE Select Advisors Trust
PACE Large Co Growth Equity Investments
Illustration of an assumed investment of $10,000 in Class P shares of the Portfolio (unaudited)
The following graph depicts the performance of PACE Large Co Growth Equity Investments Class P shares versus the Russell 1000 Growth Index over the 10 years ended July 31, 2015. Class P shares held through advisory programs may be subject to a program fee, which, if included, would have reduced performance. The performance of the other classes will vary based upon the different class specific expenses and sales charges. The performance provided does not reflect the deduction of taxes that a shareholder would pay on Portfolio distributions or the redemption of Portfolio shares. Past performance is no guarantee of future results. Share price and returns will vary with market conditions; investors may realize a gain or loss upon redemption. It is important to note that PACE Large Co Growth Equity Investments is a professionally managed portfolio while the Index is not available for investment and is unmanaged. The comparison is shown for illustration purposes only.
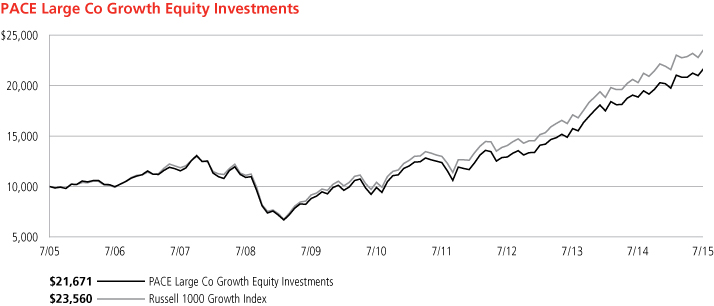
149
PACE Select Advisors Trust
PACE Large Co Growth Equity Investments
Performance at a glance (unaudited)
Average annual total returns for periods ended 07/31/15 | | 1 year | | 5 years | | 10 years | |
Before deducting maximum sales charge | |
Class A1 | | | 14.60 | % | | | 16.65 | % | | | 7.75 | % | |
Class C2 | | | 13.67 | | | | 15.68 | | | | 6.86 | | |
Class Y3 | | | 14.89 | | | | 16.94 | | | | 8.09 | | |
Class P4 | | | 14.88 | | | | 16.96 | | | | 8.04 | | |
After deducting maximum sales charge | |
Class A1 | | | 8.28 | | | | 15.34 | | | | 7.14 | | |
Class C2 | | | 12.67 | | | | 15.68 | | | | 6.86 | | |
Russell 1000 Growth Index5 | | | 16.08 | | | | 17.75 | | | | 8.95 | | |
Lipper Large-Cap Growth Funds median | | | 15.66 | | | | 16.53 | | | | 8.14 | | |
Most recent calendar quarter-end returns (unaudited)
Average annual total returns for periods ended 06/30/15 | | 1 year | | 5 years | | 10 years | |
Before deducting maximum sales charge | |
Class A1 | | | 9.82 | % | | | 17.58 | % | | | 7.92 | % | |
Class C2 | | | 8.99 | | | | 16.60 | | | | 7.03 | | |
Class Y3 | | | 10.14 | | | | 17.87 | | | | 8.27 | | |
Class P4 | | | 10.15 | | | | 17.88 | | | | 8.22 | | |
After deducting maximum sales charge | |
Class A1 | | | 3.80 | | | | 16.26 | | | | 7.31 | | |
Class C2 | | | 8.04 | | | | 16.60 | | | | 7.03 | | |
The annualized gross and net expense ratios, respectively, for each class of shares as in the November 28, 2014 prospectuses, were as follows: Class A—1.18% and 1.18%; Class C—2.00% and 2.00%; Class Y—0.93% and 0.93%; and Class P—0.93% and 0.93%. Net expenses reflect fee waivers and/or expense reimbursements, if any, pursuant to an agreement that is in effect to cap the expenses. The Portfolio and UBS Global Asset Management (Americas) Inc. ("UBS Global AM") have entered into a written fee waiver/expense reimbursement agreement pursuant to which UBS Global AM is contractually obligated to waive its management fees and/or reimburse expenses so that the Portfolio's ordinary total operating expenses of each class through November 30, 2015 (excluding dividend expense, borrowing costs, and interest expense relating to short sales, and expenses attributable to investment in other investment companies, interest, taxes, brokerage commissions and extraordinary expenses) would not exceed Class A—1.30%; Class C—2.05%; Class Y—1.05%; and Class P—1.05%. The Portfolio has agreed to repay UBS Global AM for any waived fees/reimbursed expenses to the extent that it can do so over the following three fiscal years without causing the Portfolio's expenses in any of those three years to exceed these expense caps. The fee waiver/expense reimbursement agreement may be terminated by the Portfolio's board at any time and also will terminate automatically upon the expiration or termination of the Portfolio's advisory contract with UBS Global AM. Upon termination of the agreement, however, UBS Global AM's three year recoupment rights will survive.
1 Maximum sales charge for Class A shares is 5.5%. Class A shares bear ongoing 12b-1 service fees.
2 Maximum contingent deferred sales charge for Class C shares is 1% imposed on redemptions and is reduced to 0% after one year. Class C shares bear ongoing 12b-1 service and distribution fees.
3 The Portfolio offers Class Y shares to a limited group of eligible investors, including certain qualifying retirement plans. Class Y shares do not bear initial or contingent deferred sales charges or ongoing 12b-1 service and distribution fees.
4 Class P shares do not bear initial or contingent deferred sales charges or ongoing 12b-1 service and distribution fees, but Class P shares held through advisory programs may be subject to a program fee, which, if included, would have reduced performance.
5 The Russell 1000 Growth Index measures the performance of the large-cap growth segment of the US equity universe. It includes those Russell 1000 Index companies with higher price-to-book ratios and higher forecasted growth values. The Russell 1000 Growth Index is constructed to provide a comprehensive and unbiased barometer for the large-cap growth segment. The Index is completely reconstituted annually to ensure new and growing equities are included and that the represented companies continue to reflect growth characteristics. Investors should note that indices do not reflect the deduction of fees and expenses.
Prior to February 17, 2015, if an investor sold or exchanged shares less than 90 days after purchase, a redemption fee of 1.00% of the amount sold or exchanged was deducted at the time of the transaction, except as noted otherwise in the prospectus. For sales or exchanges taking place on or after February 17, 2015 but prior to August 3, 2015, there is a reduction in the redemption holding period from 90 days to 30 days. Effective August 3, 2015, the 1.00% redemption fee imposed on sales or exchanges of any class of shares of the portfolios made during the holding periods specified in the prospectus was eliminated. Please refer to the prospectus for further information.
Past performance does not predict future performance, and the performance information provided does not reflect the deduction of taxes that a shareholder would pay on Portfolio distributions or the redemption of Portfolio shares. The return and principal value of an investment will fluctuate, so that an investor's shares, when redeemed, may be worth more or less than their original cost. Performance results assume reinvestment of all dividends and capital gain distributions at net asset value on the ex-dividend dates. Current performance may be higher or lower than the performance data quoted. For month-end performance figures, please visit http://globalam-us.ubs.com/corpweb/performance.do.
Lipper peer group data calculated by Lipper Inc.; used with permission. The Lipper median is the return of the fund that places in the middle of a Lipper peer group.
150
PACE Select Advisors Trust
PACE Large Co Growth Equity Investments
Portfolio statistics (unaudited)
Characteristics | | 07/31/15 | |
Net assets (mm) | | $ | 1,426.3 | | |
Number of holdings | | | 76 | | |
Portfolio composition1 | | 07/31/15 | |
Common stocks and ADRs | | | 99.4 | % | |
Cash equivalents and other assets less liabilities | | | 0.6 | | |
Total | | | 100.0 | % | |
Top five sectors1 | | 07/31/15 | |
Information technology | | | 29.1 | % | |
Consumer discretionary | | | 18.0 | | |
Financials | | | 13.6 | | |
Industrials | | | 11.6 | | |
Health Care | | | 10.8 | | |
Total | | | 83.1 | % | |
Top ten equity holdings1 | | 07/31/15 | |
Honeywell International, Inc. | | | 4.2 | % | |
Allergan, Inc. | | | 4.0 | | |
American Tower Corp. | | | 3.9 | | |
Berkshire Hathaway, Inc., Class B | | | 3.8 | | |
Oracle Corp. | | | 3.2 | | |
TransDigm Group, Inc. | | | 3.2 | | |
Markel Corp. | | | 3.1 | | |
Schlumberger Ltd. | | | 2.8 | | |
The TJX Cos., Inc. | | | 2.8 | | |
Celgene Corp. | | | 2.7 | | |
Total | | | 33.7 | % | |
For a listing of defined portfolio acronyms that are used throughout the Portfolio statistics, please refer to page 254.
1 Weightings represent percentages of the Portfolio's net assets as of July 31, 2015. The Portfolio is actively managed and its composition will vary over time.
151
PACE Select Advisors Trust
PACE Large Co Growth Equity Investments
Portfolio of investments—July 31, 2015
| | | Number of
shares | | Value | |
Common stocks—99.38% | |
Aerospace & defense—8.94% | |
B/E Aerospace, Inc. | | | 462,818 | | | $ | 22,543,865 | | |
Honeywell International, Inc. | | | 568,226 | | | | 59,692,141 | | |
TransDigm Group, Inc.*,1 | | | 199,850 | | | | 45,226,055 | | |
| | | | 127,462,061 | | |
Automobiles—0.33% | |
Tesla Motors, Inc.*,1 | | | 17,470 | | | | 4,649,641 | | |
Biotechnology—7.28% | |
Alexion Pharmaceuticals, Inc.* | | | 24,401 | | | | 4,817,733 | | |
Biogen, Inc.* | | | 38,287 | | | | 12,205,130 | | |
BioMarin Pharmaceutical, Inc.* | | | 47,640 | | | | 6,968,303 | | |
Celgene Corp.* | | | 288,573 | | | | 37,875,206 | | |
Gilead Sciences, Inc. | | | 122,292 | | | | 14,413,335 | | |
Incyte Corp.* | | | 40,550 | | | | 4,228,554 | | |
Regeneron Pharmaceuticals, Inc.*,1 | | | 26,209 | | | | 14,510,875 | | |
Vertex Pharmaceuticals, Inc.* | | | 65,799 | | | | 8,882,865 | | |
| | | | 103,902,001 | | |
Capital markets—0.92% | |
The Charles Schwab Corp.1 | | | 377,990 | | | | 13,184,291 | | |
Chemicals—2.79% | |
Air Products & Chemicals, Inc. | | | 62,331 | | | | 8,882,791 | | |
Ecolab, Inc.1 | | | 267,460 | | | | 30,974,542 | | |
| | | | 39,857,333 | | |
Communications equipment—1.82% | |
QUALCOMM, Inc. | | | 402,550 | | | | 25,920,195 | | |
Diversified financial services—0.85% | |
Intercontinental Exchange Group, Inc. | | | 53,010 | | | | 12,088,400 | | |
Energy equipment & services—2.80% | |
Schlumberger Ltd. | | | 481,941 | | | | 39,914,354 | | |
Food & staples retailing—2.01% | |
CVS Health Corp. | | | 69,457 | | | | 7,811,829 | | |
Walgreens Boots Alliance, Inc. | | | 215,824 | | | | 20,855,073 | | |
| | | | 28,666,902 | | |
Food products—2.17% | |
Mondelez International, Inc., Class A | | | 684,324 | | | | 30,883,542 | | |
Hotels, restaurants & leisure—2.76% | |
Starbucks Corp.1 | | | 588,273 | | | | 34,078,655 | | |
Wynn Resorts Ltd.1 | | | 51,606 | | | | 5,327,287 | | |
| | | | 39,405,942 | | |
Household durables—0.33% | |
Harman International Industries, Inc. | | | 43,301 | | | | 4,661,786 | | |
Insurance—6.86% | |
Berkshire Hathaway, Inc., Class B* | | | 375,310 | | | | 53,571,750 | | |
Markel Corp.*,1 | | | 49,827 | | | | 44,333,573 | | |
| | | | 97,905,323 | | |
| | | Number of
shares | | Value | |
Common stocks—(continued) | |
Internet & catalog retail—3.93% | |
Amazon.com, Inc.* | | | 27,403 | | | $ | 14,692,119 | | |
Liberty Interactive Corp. QVC
Group, Class A* | | | 551,625 | | | | 16,024,706 | | |
Netflix, Inc.* | | | 54,600 | | | | 6,241,326 | | |
priceline.com, Inc.*,1 | | | 5,727 | | | | 7,121,925 | | |
TripAdvisor, Inc.*,1 | | | 150,083 | | | | 11,913,589 | | |
| | | | 55,993,665 | | |
Internet software & services—7.96% | |
Baidu, Inc., ADR* | | | 64,479 | | | | 11,132,944 | | |
eBay, Inc.* | | | 493,560 | | | | 13,878,907 | | |
Equinix, Inc.1 | | | 70,617 | | | | 19,695,787 | | |
Facebook, Inc., Class A* | | | 252,078 | | | | 23,697,853 | | |
Google, Inc., Class A* | | | 43,785 | | | | 28,788,638 | | |
Google, Inc., Class C* | | | 15,342 | | | | 9,598,109 | | |
LinkedIn Corp., Class A*,1 | | | 23,038 | | | | 4,682,704 | | |
Yelp, Inc.*,1 | | | 77,450 | | | | 2,044,680 | | |
| | | | 113,519,622 | | |
IT services—5.25% | |
MasterCard, Inc., Class A | | | 366,492 | | | | 35,696,321 | | |
PayPal Holdings, Inc.* | | | 414,585 | | | | 16,044,439 | | |
Visa, Inc., Class A1 | | | 308,050 | | | | 23,208,487 | | |
| | | | 74,949,247 | | |
Life sciences tools & services—2.48% | |
Mettler-Toledo International, Inc.*,1 | | | 104,880 | | | | 35,407,488 | | |
Media—3.55% | |
Discovery Communications, Inc.,
Class A*,1 | | | 106,749 | | | | 3,524,852 | | |
Discovery Communications, Inc.,
Class C* | | | 288,657 | | | | 8,746,307 | | |
Liberty Global PLC LiLAC, Series C* | | | 30,448 | | | | 1,295,563 | | |
Liberty Global PLC, Series C* | | | 755,409 | | | | 37,120,798 | | |
| | | | 50,687,520 | | |
Oil, gas & consumable fuels—1.34% | |
Kinder Morgan, Inc.1 | | | 42,619 | | | | 1,476,322 | | |
Pioneer Natural Resources Co. | | | 51,320 | | | | 6,505,837 | | |
The Williams Cos., Inc. | | | 210,875 | | | | 11,066,720 | | |
| | | | 19,048,879 | | |
Pharmaceuticals—6.27% | |
Allergan PLC*,1 | | | 172,141 | | | | 57,004,492 | | |
Novo Nordisk A/S, ADR | | | 245,125 | | | | 14,452,570 | | |
Valeant Pharmaceuticals
International, Inc.* | | | 69,936 | | | | 18,010,618 | | |
| | | | 89,467,680 | | |
Real estate investment trusts—4.94% | |
American Tower Corp. | | | 587,208 | | | | 55,849,353 | | |
Crown Castle International Corp. | | | 178,175 | | | | 14,594,314 | | |
| | | | 70,443,667 | | |
152
PACE Select Advisors Trust
PACE Large Co Growth Equity Investments
Portfolio of investments—July 31, 2015
| | | Number of
shares | | Value | |
Common stocks—(concluded) | |
Road & rail—2.66% | |
Kansas City Southern1 | | | 87,675 | | | $ | 8,696,483 | | |
Union Pacific Corp. | | | 299,771 | | | | 29,254,652 | | |
| | | | 37,951,135 | | |
Semiconductors & semiconductor equipment—1.41% | |
ARM Holdings PLC, ADR1 | | | 143,412 | | | | 6,746,101 | | |
Avago Technologies Ltd. | | | 56,102 | | | | 7,020,604 | | |
Broadcom Corp., Class A | | | 125,302 | | | | 6,341,534 | | |
| | | | 20,108,239 | | |
Software—10.20% | |
Adobe Systems, Inc.* | | | 397,595 | | | | 32,598,814 | | |
Electronic Arts, Inc.* | | | 188,447 | | | | 13,483,383 | | |
Intuit, Inc. | | | 282,826 | | | | 29,914,506 | | |
Microsoft Corp. | | | 293,423 | | | | 13,702,854 | | |
Oracle Corp. | | | 1,135,180 | | | | 45,339,089 | | |
Salesforce.com, Inc.*,1 | | | 142,639 | | | | 10,455,439 | | |
| | | | 145,494,085 | | |
Specialty retail—5.91% | |
L Brands, Inc. | | | 139,175 | | | | 11,234,206 | | |
O'Reilly Automotive, Inc.*,1 | | | 68,254 | | | | 16,402,119 | | |
Sally Beauty Holdings, Inc.* | | | 185,975 | | | | 5,540,195 | | |
The Home Depot, Inc. | | | 97,016 | | | | 11,353,782 | | |
The TJX Cos., Inc.1 | | | 569,595 | | | | 39,769,123 | | |
| | | | 84,299,425 | | |
Technology hardware, storage & peripherals—2.46% | |
Apple, Inc. | | | 289,065 | | | | 35,063,584 | | |
Textiles, apparel & luxury goods—1.16% | |
Lululemon Athletica, Inc.*,1 | | | 86,710 | | | | 5,450,591 | | |
Nike, Inc., Class B | | | 96,225 | | | | 11,087,044 | | |
| | | | 16,537,635 | | |
Total common stocks
(cost—$1,097,639,567) | | | | | 1,417,473,642 | | |
| | | Face
amount | | Value | |
Repurchase agreement—0.47% | |
Repurchase agreement dated
07/31/15 with State Street
Bank and Trust Co., 0.000%
due 08/03/15, collateralized by
$1,918,031 Federal Home Loan
Mortgage Corp. obligations,
2.080% due 10/17/22, $481,330
Federal National Mortgage
Association obligations, 2.170%
due 10/17/22 and $4,291,816
US Treasury Notes, 1.625% to
3.625% due 03/31/19 to 06/30/20;
(value—$6,803,511);
proceeds: $6,670,000
(cost—$6,670,000) | | $ | 6,670,000 | | | $ | 6,670,000 | | |
| | | Number of
shares | | | |
Investment of cash collateral from securities loaned—0.26% | |
Money market fund—0.26% | |
UBS Private Money Market Fund LLC2
(cost—$3,716,848) | | | 3,716,848 | | | | 3,716,848 | | |
Total investments
(cost—$1,108,026,415)—100.11% | | | | | 1,427,860,490 | | |
Liabilities in excess of
other assets—(0.11)% | | | | | (1,581,571 | ) | |
Net assets—100.00% | | | | $ | 1,426,278,919 | | |
For a listing of defined portfolio acronyms that are used throughout the Portfolio of investments as well as the tables that follow, please refer to page 254.
Aggregate cost for federal income tax purposes was $1,111,335,113; and net unrealized appreciation consisted of:
Gross unrealized appreciation | | $ | 341,366,474 | | |
Gross unrealized depreciation | | | (24,841,097 | ) | |
Net unrealized appreciation | | $ | 316,525,377 | | |
153
PACE Select Advisors Trust
PACE Large Co Growth Equity Investments
Portfolio of investments—July 31, 2015
Fair valuation summary
The following is a summary of the fair valuations according to the inputs used as of July 31, 2015 in valuing the Portfolio's investments:
Assets
Description | | Unadjusted
quoted prices in
active markets for
identical investments
(Level 1) | | Other significant
observable inputs
(Level 2) | | Unobservable
inputs
(Level 3) | | Total | |
Common stocks | | $ | 1,417,473,642 | | | $ | — | | | $ | — | | | $ | 1,417,473,642 | | |
Repurchase agreement | | | — | | | | 6,670,000 | | | | — | | | | 6,670,000 | | |
Investment of cash collateral from securities loaned | | | — | | | | 3,716,848 | | | | — | | | | 3,716,848 | | |
Total | | $ | 1,417,473,642 | | | $ | 10,386,848 | | | $ | — | | | $ | 1,427,860,490 | | |
At July 31, 2015, there were no transfers between Level 1 and Level 2.
Issuer breakdown by country or territory of origin (unaudited)
| | | Percentage of
total investments | |
United States | | | 86.5 | % | |
Ireland | | | 4.0 | | |
United Kingdom | | | 3.2 | | |
Curacao | | | 2.8 | | |
Canada | | | 1.2 | | |
Denmark | | | 1.0 | | |
Cayman Islands | | | 0.8 | | |
Singapore | | | 0.5 | | |
Total | | | 100.0 | % | |
Portfolio footnotes
* Non-income producing security.
1 Security, or portion thereof, was on loan at July 31, 2015.
2 The table below details the Portfolio's transaction activity in an affiliated issuer during the year ended July 31, 2015. The investment manager earns a management fee from UBS Private Money Market Fund LLC. Please see the Notes to financial statements for further information.
| Security description | | Value at
07/31/14 | | Purchases
during the
year ended
07/31/15 | | Sales
during the
year ended
07/31/15 | | Value at
07/31/15 | | Net income
earned from
affiliate for the
year ended
07/31/15 | |
UBS Private Money Market Fund LLC | | $ | — | | | $ | 161,729,039 | | | $ | 158,012,191 | | | $ | 3,716,848 | | | $ | 733 | | |
See accompanying notes to financial statements.
154
PACE Select Advisors Trust
PACE Small/Medium Co Value Equity Investments
Performance (unaudited)
For the 12 months ended July 31, 2015, the Portfolio's Class P shares gained 7.49% before the deduction of the maximum PACE Select program fee.1 In comparison, the Russell 2500 Value Index (the "benchmark") rose 4.53% and the Lipper Small-Cap Core Funds category posted a median return of 9.64%. (Returns for all share classes over various time periods are shown in the "Performance at a glance" table on page 159. Please note that the returns shown do not reflect the deduction of taxes that a shareholder would pay on Portfolio distributions or the redemption of Portfolio shares.) For a detailed commentary on the market environment in general during the reporting period, please refer to page 2.
Sub-advisors' Comments2
MetWest Capital
Our portion of the Portfolio outperformed the benchmark during the reporting period. Strong stock selection accounted for all our outperformance during the period.
Security selection in industrials, information technology and health care were the largest contributors to results. An overweight to the top-performing health care sector further enhanced our performance. In the industrials sector, KAR Auction Services was the largest contributor. The company is benefiting from improved off-lease volumes in its physical auction segment and increased market share in its salvage vehicle division. Furthermore, its leverage ratio has been decreasing and is now at an optimal level, providing greater flexibility to return cash to shareholders. Within information technology, Avid Technology was our best performer. The company's stock price has continued to advance after the restatement of approximately five years of annual and quarterly financial statements. These restatements were a result of Avid Technology revising its revenue recognition methodology. Elsewhere, AMN Healthcare Services added the most value in the health care sector. The company continues to benefit from the surge in demand for health care professionals, largely due to the Affordable Care Act and cyclical improvement in employment.
1 Class P shares held through the PACE Select Advisors Program are subject to a maximum Program fee of 2.50%, which, if included, would have reduced performance. Class P shares held through other advisory programs also may be subject to a program fee, which, if included, would have reduced performance.
2 All Sub-advisors discuss performance on a gross-of-fees basis—meaning that no fees or expenses are reflected in their sleeves'/sleeve's performance. Alternately, Portfolio performance is shown net of fees, which does factor in fees and expenses associated with the Portfolio.
PACE Select Advisors Trust – PACE Small/Medium Co Value Equity Investments
Investment Sub-Advisors:
Metropolitan West Capital Management, LLC ("MetWest Capital");
Systematic Financial Management, L.P. ("Systematic");
Kayne Anderson Rudnick, LLC ("Kayne Anderson Rudnick")
Portfolio Managers:
MetWest Capital: Samir Sikka;
Systematic: Ronald M. Mushock and D. Kevin McCreesh;
Kayne Anderson Rudnick: Julie Kutasov and Craig Stone
Objective:
Capital appreciation
Investment process:
MetWest Capital utilizes a bottom-up, fundamental, research-driven style that it believes is well suited to the small cap market segment. MetWest Capital seeks to identify high-quality companies selling below intrinsic value with clear catalysts to realize full value within its investment time horizon and constructs a portfolio of its highest conviction ideas.
Systematic employs a two-pronged investment approach that utilizes both quantitative screening and fundamental research. Systematic's investment philosophy is predicated on its belief that stock prices reflect the market's estimates of earnings, and as revisions to those estimates are made by the market, stock prices will follow suit.
Systematic conducts a quantitative screening of all companies within the small/mid capitalization universe, and then uses fundamental research analysis to
155
PACE Select Advisors Trust
PACE Small/Medium Co Value Equity Investments
Sub-advisors' Comments – continued
Stock selection and an underweight in the financials sector detracted the most from relative performance during the reporting period. Within the sector, Ocwen Financial Corp. was the worst performer. The company faced regulatory and legal pressure from the New York Department of Financial Services. In addition, a consumer business oversight board in California installed a monitor to oversee the company's business practices. As a result, Ocwen Financial's margins were materially impacted by increased legal and compliance expenses, and a decline in new revenue, as there has been a mandated cessation of new business transfers. In the second half of the reporting period, the company's shares partially rebounded after reporting an unexpected operating profit for the first quarter of 2015. In addition, after some uncertainty, Ocwen Financial received a clean opinion from their auditor, which removed a portion of the negative overhang residing in the company's stock price. Ocwen Financial continues to take action to improve its business and, as always, we remain vigilant in monitoring this company.
Derivatives were not used during the reporting period.
Systematic
Our portion of the Portfolio outperformed the benchmark during the reporting period, driven by strong stock selection. In particular, our holdings in the energy and financials sectors were the largest contributors to performance, while our holdings in the materials and consumer discretionary sectors were the largest headwinds to results. In terms of sector allocation, our moderate overweight to the energy sector was magnified by the sector's extremely sharp pullback at the conclusion of 2014, reflecting the precipitous decline in oil prices. Conversely, an overweight to the health care sector added the most value during the fiscal year.
One of our holdings that outperformed during the reporting period was Electronic Arts, a firm that develops, publishes and distributes branded entertainment software for video game consoles, personal computers and handheld game players. The company's most recent earnings results exceeded expectations and it raised fiscal full year earnings guidance. Demand for the next generation consoles continues to exceed expectations and has led to strong growth in software video games. The company's margins are also benefiting from a gradual shift away from consumers purchasing packaged games to consumers downloading games digitally, significantly reducing costs for Electronic Arts. We expect these trends to continue. The company also generates strong cash flows and valuation remains attractive.
One stock that underperformed was Precision Drilling, a Canadian-based oilfield services company. As the price of crude oil fell dramatically from its peak during the summer of 2014, investors sold the stock aggressively due to forecasted declines in customer demand for its drilling services. We believe that Precision Drilling's top-tier rig fleet and strong balance sheet has been overlooked, as the stock has sold off at the same rate as lower-quality peers. We see management's plan to restrict capital spending and generate free cash flow to pay down debt as prudent in this environment. We also believe this will set up the company to deploy capital aggressively when their customers' outlooks improve. With Precision Drilling trading close to the low end of its historical multiple range, we continue to hold our position.
Derivatives were not used during the reporting period.
Investment process (concluded)
gauge investor expectations by focusing on key revenue and margin assumptions underlying earnings estimates.
Kayne Anderson Rudnick employs a fundamental, bottom-up, research-driven investment style and utilizes a disciplined investment process to identify high-quality companies that possess solid investment-grade balance sheets, generate positive cash flow and whose securities can be acquired at attractive valuations. Kayne Anderson Rudnick's first-hand fundamental research process involves carefully evaluating a company from a three-tiered perspective involving qualitative, financial and valuation analyses.
156
PACE Select Advisors Trust
PACE Small/Medium Co Value Equity Investments
Sub-advisors' Comments – concluded
Kayne Anderson Rudnick
Our portion of the Portfolio outperformed the benchmark during the reporting period. Stock selection in the energy and consumer discretionary sectors contributed the most to performance. Conversely, stock selection and an overweight in health care, along with stock selection and an underweight in utilities, detracted the most from relative performance.
The stocks that were the largest contributors to performance were Ross Stores and Snap-on. Ross Stores continued to deliver healthy gains in same-store sales and earnings, despite considerable challenges in the broader retail environment. The company's successful inventory management initiatives helped support healthy margin expansion. The retailer also appears to be making strides with its second concept, DD Discounts, which could expand its long-term growth opportunities. Snap-on, a manufacturer and marketer of high-end tools and equipment to professional tool users, continues to deliver gross and operating margin expansion, supported by the company's Rapid Continuous Improvement initiative. Lower gasoline prices tends to result in an increase in miles driven which, in turn, should support greater car service demand.
Our holdings that detracted the most from results were CARBO Ceramics and First Cash Financial Services. Shares of CARBO Ceramics lagged along with its energy sector peers, driven by a dramatic drop in crude oil prices. While we continued to admire the company's solid market positioning, with the near-to-medium term outlook for ceramic proppant demand highly challenging, we exited our remaining position in the company during the fourth quarter of 2014. Shares of First Cash Financial Services suffered due to gold and currency price fluctuations. With over half of its revenues from Mexican pawn operations, the company has an attractive sustainable top-line growth engine and profitability enhancement opportunity. Additionally, as the company continues to expand in Mexico (where the majority of loans are collateralized with hard goods), its overall exposure to gold prices will be further reduced.
Derivatives were not used during the reporting period.
Special considerations
The Portfolio may be appropriate for long-term investors seeking capital appreciation who are able to withstand short-term fluctuations in the equity markets in return for potentially higher returns over the long term. The value of the Portfolio changes every day and can be affected by changes in interest rates, general market conditions, and other political, social and economic developments, as well as specific matters relating to the companies in whose securities the Portfolio invests. It is important to note that an investment in the Portfolio is only one component of a balanced investment plan. In addition, small and mid cap companies are typically subject to a greater degree of change in earnings and business prospects than are larger, more established companies. Therefore, they are considered to have a higher level of volatility and risk.
157
PACE Select Advisors Trust
PACE Small/Medium Co Value Equity Investments
Illustration of an assumed investment of $10,000 in Class P shares of the Portfolio (unaudited)
The following graph depicts the performance of PACE Small/Medium Co Value Equity Investments Class P shares versus the Russell 2500 Value Index over the 10 years ended July 31, 2015. Class P shares held through advisory programs may be subject to a program fee, which, if included, would have reduced performance. The performance of the other classes will vary based upon the different class specific expenses and sales charges. The performance provided does not reflect the deduction of taxes that a shareholder would pay on Portfolio distributions or the redemption of Portfolio shares. Past performance is no guarantee of future results. Share price and returns will vary with market conditions; investors may realize a gain or loss upon redemption. It is important to note that PACE Small/Medium Co Value Equity Investments is a professionally managed portfolio while the Index is not available for investment and is unmanaged. The comparison is shown for illustration purposes only.
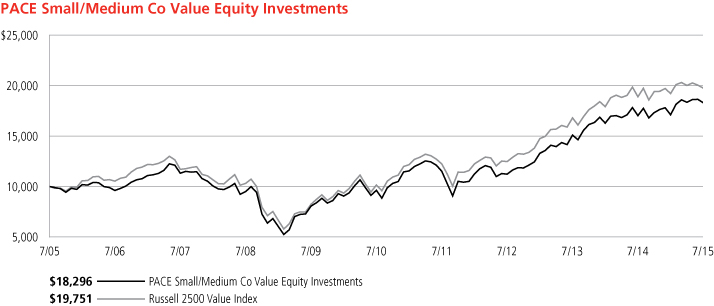
158
PACE Select Advisors Trust
PACE Small/Medium Co Value Equity Investments
Performance at a glance (unaudited)
Average annual total returns for periods ended 07/31/15 | | 1 year | | 5 years | | 10 years | |
Before deducting maximum sales charge | |
Class A1 | | | 7.35 | % | | | 13.57 | % | | | 6.07 | % | |
Class C2 | | | 6.59 | | | | 12.72 | | | | 5.27 | | |
Class Y3 | | | 7.47 | | | | 13.74 | | | | 6.34 | | |
Class P4 | | | 7.49 | | | | 13.72 | | | | 6.23 | | |
After deducting maximum sales charge | |
Class A1 | | | 1.46 | | | | 12.29 | | | | 5.47 | | |
Class C2 | | | 5.67 | | | | 12.72 | | | | 5.27 | | |
Russell 2500 Value Index5 | | | 4.53 | | | | 14.26 | | | | 7.04 | | |
Lipper Small-Cap Core Funds median | | | 9.64 | | | | 14.43 | | | | 7.30 | | |
Most recent calendar quarter-end returns (unaudited)
Average annual total returns for periods ended 06/30/15 | | 1 year | | 5 years | | 10 years | |
Before deducting maximum sales charge | |
Class A1 | | | 4.48 | % | | | 15.21 | % | | | 6.67 | % | |
Class C2 | | | 3.72 | | | | 14.37 | | | | 5.87 | | |
Class Y3 | | | 4.59 | | | | 15.39 | | | | 6.95 | | |
Class P4 | | | 4.59 | | | | 15.36 | | | | 6.83 | | |
After deducting maximum sales charge | |
Class A1 | | | (1.25 | ) | | | 13.91 | | | | 6.07 | | |
Class C2 | | | 2.82 | | | | 14.37 | | | | 5.87 | | |
The annualized gross and net expense ratios, respectively, for each class of shares as in the November 28, 2014 prospectuses, were as follows: Class A—1.29% and 1.29%; Class C—2.05% and 2.05%; Class Y—1.16% and 1.16%; and Class P—1.16% and 1.16%. Net expenses reflect fee waivers and/or expense reimbursements, if any, pursuant to an agreement that is in effect to cap the expenses. The Portfolio and UBS Global Asset Management (Americas) Inc. ("UBS Global AM") have entered into a written fee waiver/expense reimbursement agreement pursuant to which UBS Global AM is contractually obligated to waive its management fees and/or reimburse expenses so that the Portfolio's ordinary total operating expenses of each class through November 30, 2015 (excluding dividend expense, borrowing costs, and interest expense relating to short sales, and expenses attributable to investment in other investment companies, interest, taxes, brokerage commissions and extraordinary expenses) would not exceed Class A—1.41%; Class C—2.16%; Class Y—1.16%; and Class P—1.16%. The Portfolio has agreed to repay UBS Global AM for any waived fees/reimbursed expenses to the extent that it can do so over the following three fiscal years without causing the Portfolio's expenses in any of those three years to exceed these expense caps. The fee waiver/expense reimbursement agreement may be terminated by the Portfolio's board at any time and also will terminate automatically upon the expiration or termination of the Portfolio's advisory contract with UBS Global AM. Upon termination of the agreement, however, UBS Global AM's three year recoupment rights will survive.
1 Maximum sales charge for Class A shares is 5.5%. Class A shares bear ongoing 12b-1 service fees.
2 Maximum contingent deferred sales charge for Class C shares is 1% imposed on redemptions and is reduced to 0% after one year. Class C shares bear ongoing 12b-1 service and distribution fees.
3 The Portfolio offers Class Y shares to a limited group of eligible investors, including certain qualifying retirement plans. Class Y shares do not bear initial or contingent deferred sales charges or ongoing 12b-1 service and distribution fees.
4 Class P shares do not bear initial or contingent deferred sales charges or ongoing 12b-1 service and distribution fees, but Class P shares held through advisory programs may be subject to a program fee, which, if included, would have reduced performance.
5 The Russell 2500 Value Index measures the performance of the small to mid-cap value segment of the US equity universe. It includes those Russell 2500 Index companies with lower price-to-book ratios and lower forecasted growth values. The Russell 2500 Value Index is constructed to provide a comprehensive and unbiased barometer of the small to mid-cap value market. The Index is completely reconstituted annually to ensure larger stocks do not distort the performance and characteristics of the true small to mid-cap opportunity set and that the represented companies continue to reflect value characteristics. Investors should note that indices do not reflect the deduction of fees and expenses.
Prior to February 17, 2015, if an investor sold or exchanged shares less than 90 days after purchase, a redemption fee of 1.00% of the amount sold or exchanged was deducted at the time of the transaction, except as noted otherwise in the prospectus. For sales or exchanges taking place on or after February 17, 2015 but prior to August 3, 2015, there is a reduction in the redemption holding period from 90 days to 30 days. Effective August 3, 2015, the 1.00% redemption fee imposed on sales or exchanges of any class of shares of the portfolios made during the holding periods specified in the prospectus was eliminated. Please refer to the prospectus for further information.
Past performance does not predict future performance, and the performance information provided does not reflect the deduction of taxes that a shareholder would pay on Portfolio distributions or the redemption of Portfolio shares. The return and principal value of an investment will fluctuate, so that an investor's shares, when redeemed, may be worth more or less than their original cost. Performance results assume reinvestment of all dividends and capital gain distributions at net asset value on the ex-dividend dates. Current performance may be higher or lower than the performance data quoted. For month-end performance figures, please visit http://globalam-us.ubs.com/corpweb/performance.do.
Lipper peer group data calculated by Lipper Inc.; used with permission. The Lipper median is the return of the fund that places in the middle of a Lipper peer group.
159
PACE Select Advisors Trust
PACE Small/Medium Co Value Equity Investments
Portfolio statistics (unaudited)
Characteristics | | 07/31/15 | |
Net assets (mm) | | $ | 550.1 | | |
Number of holdings | | | 180 | | |
Portfolio composition1 | | 07/31/15 | |
Common stocks and ADRs | | | 97.2 | % | |
Cash equivalents and other assets less liabilities | | | 2.8 | | |
Total | | | 100.0 | % | |
Top five sectors1 | | 07/31/15 | |
Financials | | | 24.9 | % | |
Industrials | | | 19.0 | | |
Information Technology | | | 13.8 | | |
Consumer Discretionary | | | 13.1 | | |
Health Care | | | 8.4 | | |
Total | | | 79.2 | % | |
Top ten equity holdings1 | | 07/31/15 | |
KAR Auction Services, Inc. | | | 1.9 | % | |
AMN Healthcare Services, Inc. | | | 1.5 | | |
Snap-on, Inc. | | | 1.4 | | |
Office Depot, Inc. | | | 1.2 | | |
Landstar System, Inc. | | | 1.2 | | |
Jack Henry & Associates, Inc. | | | 1.1 | | |
CoreLogic, Inc. | | | 1.0 | | |
SeaWorld Entertainment, Inc. | | | 1.0 | | |
Allison Transmission Holdings, Inc. | | | 1.0 | | |
Patterson Cos., Inc. | | | 1.0 | | |
Total | | | 12.3 | % | |
For a listing of defined portfolio acronyms that are used throughout the Portfolio statistics, please refer to page 254.
1 Weightings represent percentages of the Portfolio's net assets as of July 31,2015. The Portfolio is actively managed and its composition will vary over time.
160
PACE Select Advisors Trust
PACE Small/Medium Co Value Equity Investments
Portfolio of investments—July 31, 2015
| | | Number of
shares | | Value | |
Common stocks—97.18% | |
Aerospace & defense—0.39% | |
Spirit Aerosystems Holdings,
Inc., Class A* | | | 38,165 | | | $ | 2,148,690 | | |
Air freight & logistics—1.01% | |
Expeditors International of
Washington, Inc. | | | 119,000 | | | | 5,577,530 | | |
Airlines—0.34% | |
JetBlue Airways Corp.*,1 | | | 80,935 | | | | 1,859,886 | | |
Auto components—0.21% | |
Tower International, Inc.* | | | 43,860 | | | | 1,146,062 | | |
Banks—5.48% | |
Bank of Hawaii Corp.1 | | | 81,200 | | | | 5,478,563 | | |
FirstMerit Corp.1 | | | 160,230 | | | | 3,002,710 | | |
Hancock Holding Co.1 | | | 114,650 | | | | 3,350,073 | | |
Huntington Bancshares, Inc.1 | | | 244,700 | | | | 2,855,649 | | |
Umpqua Holdings Corp.1 | | | 145,000 | | | | 2,572,300 | | |
United Community Banks, Inc. | | | 154,940 | | | | 3,233,598 | | |
Webster Financial Corp.1 | | | 144,750 | | | | 5,596,035 | | |
Zions Bancorporation1 | | | 130,390 | | | | 4,066,864 | | |
| | | | | | 30,155,792 | | |
Beverages—0.89% | |
Treasury Wine Estates Ltd., ADR | | | 1,152,590 | | | | 4,875,456 | | |
Building products—0.15% | |
Continental Building Products, Inc.* | | | 38,450 | | | | 816,678 | | |
Capital markets—4.08% | |
Artisan Partners Asset Management,
Inc., Class A1 | | | 100,000 | | | | 4,775,000 | | |
Cohen & Steers, Inc. | | | 56,200 | | | | 1,737,142 | | |
E*TRADE Financial Corp.* | | | 179,635 | | | | 5,105,227 | | |
Invesco Ltd. | | | 55,105 | | | | 2,127,053 | | |
Lazard Ltd., Class A | | | 40,820 | | | | 2,261,836 | | |
Raymond James Financial, Inc. | | | 53,225 | | | | 3,140,275 | | |
Virtus Investment Partners, Inc.1 | | | 27,400 | | | | 3,311,564 | | |
| | | | | | 22,458,097 | | |
Chemicals—0.94% | |
Albemarle Corp.1 | | | 36,885 | | | | 1,999,167 | | |
Celanese Corp., Series A1 | | | 48,220 | | | | 3,178,662 | | |
| | | | | | 5,177,829 | | |
Commercial services & supplies—3.26% | |
Essendant, Inc. | | | 90,700 | | | | 3,339,574 | | |
Herman Miller, Inc. | | | 37,582 | | | | 1,053,799 | | |
KAR Auction Services, Inc. | | | 268,625 | | | | 10,457,571 | | |
Meridian Waste Solutions, Inc.*,2 | | | 4,355 | | | | 2,091 | | |
Tetra Tech, Inc. | | | 115,800 | | | | 3,084,912 | | |
| | | | | | 17,937,947 | | |
Communications equipment—1.07% | |
Ciena Corp.* | | | 149,550 | | | | 3,806,048 | | |
Harris Corp. | | | 24,780 | | | | 2,055,253 | | |
| | | | | | 5,861,301 | | |
| | | Number of
shares | | Value | |
Common stocks—(continued) | |
Construction & engineering—1.30% | |
EMCOR Group, Inc. | | | 64,000 | | | $ | 3,061,120 | | |
KBR, Inc. | | | 234,275 | | | | 4,092,784 | | |
| | | | | | 7,153,904 | | |
Consumer finance—1.51% | |
Encore Capital Group, Inc.*,1 | | | 65,000 | | | | 2,795,650 | | |
First Cash Financial Services, Inc.* | | | 83,800 | | | | 3,408,146 | | |
Santander Consumer USA
Holdings, Inc.* | | | 86,050 | | | | 2,080,689 | | |
| | | | | | 8,284,485 | | |
Containers & packaging—1.93% | |
Berry Plastics Group, Inc.* | | | 113,970 | | | | 3,710,863 | | |
Crown Holdings, Inc.* | | | 43,100 | | | | 2,220,081 | | |
Silgan Holdings, Inc. | | | 53,000 | | | | 2,833,910 | | |
WestRock Co.* | | | 29,295 | | | | 1,847,343 | | |
| | | | | | 10,612,197 | | |
Diversified consumer services—0.67% | |
ServiceMaster Global Holdings, Inc.* | | | 94,695 | | | | 3,667,537 | | |
Diversified financial services—1.67% | |
MSCI, Inc., | | | 68,600 | | | | 4,675,776 | | |
Voya Financial, Inc. | | | 95,875 | | | | 4,501,331 | | |
| | | | | | 9,177,107 | | |
Diversified telecommunication services—0.33% | |
Level 3 Communications, Inc.* | | | 36,315 | | | | 1,833,908 | | |
Electric utilities—0.63% | |
Westar Energy, Inc.1 | | | 92,350 | | | | 3,476,978 | | |
Electrical equipment—0.04% | |
BWX Technologies, Inc. | | | 9,760 | | | | 239,706 | | |
Electronic equipment, instruments & components—1.15% | |
Cognex Corp. | | | 72,300 | | | | 3,273,021 | | |
Jabil Circuit, Inc.1 | | | 149,700 | | | | 3,031,425 | | |
| | | | | | 6,304,446 | | |
Energy equipment & services—2.55% | |
Core Laboratories N.V.1 | | | 25,200 | | | | 2,762,676 | | |
Dril-Quip, Inc.* | | | 100,600 | | | | 5,876,046 | | |
Forum Energy Technologies, Inc.*,1 | | | 148,000 | | | | 2,261,440 | | |
Precision Drilling Corp. | | | 620,395 | | | | 3,157,811 | | |
| | | | | | 14,057,973 | | |
Food & staples retailing—0.30% | |
Village Super Market, Inc., Class A | | | 57,999 | | | | 1,663,411 | | |
Food products—2.51% | |
Dean Foods Co. | | | 228,000 | | | | 4,058,400 | | |
Flowers Foods, Inc.1 | | | 91,500 | | | | 1,981,890 | | |
J&J Snack Foods Corp.1 | | | 17,800 | | | | 2,106,808 | | |
Pilgrim's Pride Corp.1 | | | 74,490 | | | | 1,611,964 | | |
Pinnacle Foods, Inc. | | | 26,425 | | | | 1,187,804 | | |
Post Holdings, Inc.* | | | 52,960 | | | | 2,846,070 | | |
| | | | | | 13,792,936 | | |
161
PACE Select Advisors Trust
PACE Small/Medium Co Value Equity Investments
Portfolio of investments—July 31, 2015
| | | Number of
shares | | Value | |
Common stocks—(continued) | |
Gas utilities—1.62% | |
Atmos Energy Corp. | | | 64,530 | | | $ | 3,568,509 | | |
Questar Corp. | | | 242,500 | | | | 5,368,950 | | |
| | | | | | 8,937,459 | | |
Health care equipment & supplies—3.81% | |
Anika Therapeutics, Inc.* | | | 122,000 | | | | 4,623,800 | | |
Globus Medical, Inc., Class A* | | | 116,980 | | | | 3,282,459 | | |
Haemonetics Corp.* | | | 92,200 | | | | 3,688,922 | | |
Hologic, Inc.*,1 | | | 54,805 | | | | 2,283,176 | | |
Integra LifeSciences Holdings*,1 | | | 49,300 | | | | 3,161,609 | | |
STERIS Corp. | | | 56,600 | | | | 3,912,758 | | |
| | | | | | 20,952,724 | | |
Health care providers & services—3.76% | |
AMN Healthcare Services, Inc.* | | | 109,280 | | | | 3,216,110 | | |
AmSurg Corp.*,1 | | | 35,500 | | | | 2,546,770 | | |
Centene Corp.* | | | 21,010 | | | | 1,473,431 | | |
Kindred Healthcare, Inc. | | | 87,625 | | | | 1,807,704 | | |
Laboratory Corp. of America Holdings* | | | 12,485 | | | | 1,589,216 | | |
Patterson Cos., Inc. | | | 107,000 | | | | 5,367,120 | | |
Universal Health Services, Inc., Class B | | | 14,660 | | | | 2,129,072 | | |
VCA, Inc.* | | | 41,750 | | | | 2,568,877 | | |
| | | | | | 20,698,300 | | |
Hotels, restaurants & leisure—2.90% | |
Bloomin' Brands, Inc. | | | 38,820 | | | | 904,118 | | |
Interval Leisure Group, Inc. | | | 127,150 | | | | 2,710,838 | | |
SeaWorld Entertainment, Inc.1 | | | 249,200 | | | | 4,321,128 | | |
Six Flags Entertainment Corp.1 | | | 34,300 | | | | 1,599,752 | | |
The Cheesecake Factory, Inc.1 | | | 111,000 | | | | 6,409,140 | | |
| | | | | | 15,944,976 | | |
Household durables—0.72% | |
Taylor Morrison Home Corp., Class A* | | | 33,953 | | | | 653,595 | | |
Tupperware Brands Corp.1 | | | 56,340 | | | | 3,294,200 | | |
| | | | | | 3,947,795 | | |
Household products—0.54% | |
WD-40 Co.1 | | | 33,000 | | | | 2,957,790 | | |
Independent power and renewable electricity
producers—0.85% | |
Dynegy, Inc.* | | | 124,535 | | | | 3,244,137 | | |
NRG Energy, Inc. | | | 62,865 | | | | 1,411,319 | | |
| | | | | | 4,655,456 | | |
Insurance—2.16% | |
Endurance Specialty Holdings Ltd. | | | 51,750 | | | | 3,596,107 | | |
RenaissanceRe Holdings Ltd.1 | | | 14,285 | | | | 1,532,781 | | |
RLI Corp.1 | | | 69,600 | | | | 3,844,008 | | |
XL Group PLC | | | 76,095 | | | | 2,893,132 | | |
| | | | | | 11,866,028 | | |
IT services—5.78% | |
Amdocs Ltd. | | | 26,155 | | | | 1,533,991 | | |
Cass Information Systems, Inc. | | | 92,800 | | | | 4,881,280 | | |
Computer Services, Inc. | | | 72,400 | | | | 2,924,960 | | |
| | | Number of
shares | | Value | |
Common stocks—(continued) | |
IT services—(concluded) | |
CoreLogic, Inc.* | | | 109,510 | | | $ | 4,319,074 | | |
Endurance International Group
Holdings, Inc.*,1 | | | 169,900 | | | | 3,433,679 | | |
EVERTEC, Inc. | | | 227,000 | | | | 4,272,140 | | |
Jack Henry & Associates, Inc. | | | 90,400 | | | | 6,315,344 | | |
Syntel, Inc.* | | | 94,900 | | | | 4,146,181 | | |
| | | | | | 31,826,649 | | |
Life sciences tools & services—0.88% | |
Bio-Rad Laboratories, Inc., Class A* | | | 12,450 | | | | 1,876,713 | | |
Cambrex Corp.* | | | 22,750 | | | | 1,120,437 | | |
Charles River Laboratories
International, Inc.*,1 | | | 23,635 | | | | 1,834,549 | | |
| | | | | | 4,831,699 | | |
Machinery—8.02% | |
Actuant Corp., Class A1 | | | 126,000 | | | | 2,905,560 | | |
Allison Transmission Holdings, Inc. | | | 172,605 | | | | 5,036,614 | | |
Donaldson Co., Inc.1 | | | 96,000 | | | | 3,225,600 | | |
Graco, Inc.1 | | | 52,000 | | | | 3,717,480 | | |
Harsco Corp. | | | 42,917 | | | | 589,680 | | |
IDEX Corp.1 | | | 40,300 | | | | 3,064,009 | | |
ITT Corp. | | | 113,635 | | | | 4,318,130 | | |
RBC Bearings, Inc.*,1 | | | 79,500 | | | | 5,386,125 | | |
Snap-on, Inc.1 | | | 46,200 | | | | 7,613,760 | | |
Stanley Black & Decker, Inc. | | | 10,800 | | | | 1,139,292 | | |
The Manitowoc Co., Inc.1 | | | 232,300 | | | | 4,104,741 | | |
Trinity Industries, Inc.1 | | | 102,363 | | | | 2,995,141 | | |
| | | | | | 44,096,132 | | |
Media—1.56% | |
Cinemark Holdings, Inc., Class A | | | 122,000 | | | | 4,814,120 | | |
Gray Television, Inc.* | | | 91,850 | | | | 1,551,347 | | |
TEGNA, Inc.1 | | | 76,625 | | | | 2,232,086 | | |
| | | | | | 8,597,553 | | |
Metals & mining—0.51% | |
Nucor Corp.1 | | | 19,205 | | | | 847,709 | | |
United States Steel Corp.1 | | | 100,275 | | | | 1,952,354 | | |
| | | | | | 2,800,063 | | |
Multi-utilities—0.61% | |
Ameren Corp. | | | 61,085 | | | | 2,509,372 | | |
DTE Energy Co. | | | 10,240 | | | | 823,910 | | |
| | | | | | 3,333,282 | | |
Multiline retail—0.47% | |
Big Lots, Inc.1 | | | 59,360 | | | | 2,563,165 | | |
Oil, gas & consumable fuels—3.91% | |
Abraxas Petroleum Corp.*,1 | | | 154,675 | | | | 290,789 | | |
Diamondback Energy, Inc.* | | | 55,300 | | | | 3,721,690 | | |
Energen Corp. | | | 60,810 | | | | 3,356,712 | | |
Laredo Petroleum Holdings, Inc.*,1 | | | 251,929 | | | | 2,159,031 | | |
Newfield Exploration Co.* | | | 107,625 | | | | 3,529,024 | | |
Oasis Petroleum, Inc.*,1 | | | 191,500 | | | | 1,844,145 | | |
PBF Energy, Inc., Class A1 | | | 51,275 | | | | 1,618,752 | | |
162
PACE Select Advisors Trust
PACE Small/Medium Co Value Equity Investments
Portfolio of investments—July 31, 2015
| | | Number of
shares | | Value | |
Common stocks—(continued) | |
Oil, gas & consumable fuels—(concluded) | |
RSP Permian, Inc.*,1 | | | 102,800 | | | $ | 2,549,440 | | |
Tsakos Energy Navigation Ltd. | | | 128,555 | | | | 1,172,422 | | |
WPX Energy, Inc.*,1 | | | 147,925 | | | | 1,286,947 | | |
| | | | | | 21,528,952 | | |
Professional services—2.17% | |
CEB, Inc. | | | 66,500 | | | | 5,088,580 | | |
Korn/Ferry International | | | 118,480 | | | | 3,966,710 | | |
Resources Connection, Inc. | | | 183,500 | | | | 2,904,805 | | |
| | | | | | 11,960,095 | | |
Real estate investment trusts—7.99% | |
BioMed Realty Trust, Inc.1 | | | 217,100 | | | | 4,676,334 | | |
Chesapeake Lodging Trust | | | 50,855 | | | | 1,630,920 | | |
DuPont Fabros Technology, Inc. | | | 112,450 | | | | 3,390,367 | | |
Equity Commonwealth* | | | 89,000 | | | | 2,331,800 | | |
Ladder Capital Corp. Class A | | | 154,700 | | | | 2,430,337 | | |
Liberty Property Trust | | | 134,260 | | | | 4,568,868 | | |
Mack-Cali Realty Corp.1 | | | 153,790 | | | | 3,204,984 | | |
New Residential Investment Corp. | | | 203,080 | | | | 3,186,325 | | |
Parkway Properties, Inc. | | | 239,000 | | | | 4,287,660 | | |
PennyMac Mortgage Investment Trust | | | 201,120 | | | | 3,571,891 | | |
Physicians Realty Trust | | | 119,425 | | | | 1,915,577 | | |
Redwood Trust, Inc. | | | 225,000 | | | | 3,487,500 | | |
SL Green Realty Corp. | | | 23,015 | | | | 2,649,947 | | |
Sunstone Hotel Investors, Inc.1 | | | 186,232 | | | | 2,620,284 | | |
| | | | | | 43,952,794 | | |
Real estate management & development—0.85% | |
CBRE Group, Inc., Class A* | | | 122,585 | | | | 4,654,552 | | |
Road & rail—2.10% | |
Landstar System, Inc.1 | | | 115,500 | | | | 8,319,465 | | |
Ryder System, Inc.1 | | | 35,900 | | | | 3,249,668 | | |
| | | | | | 11,569,133 | | |
Semiconductors & semiconductor equipment—2.15% | |
Integrated Device Technology, Inc.* | | | 106,750 | | | | 2,039,993 | | |
Linear Technology Corp.1 | | | 107,600 | | | | 4,411,600 | | |
Mellanox Technologies Ltd.* | | | 42,215 | | | | 1,775,141 | | |
Skyworks Solutions, Inc.1 | | | 31,175 | | | | 2,982,512 | | |
Synaptics, Inc.*,1 | | | 7,635 | | | | 606,066 | | |
| | | | | | 11,815,312 | | |
Software—2.58% | |
American Software, Inc., Class A | | | 418,700 | | | | 3,860,414 | | |
Electronic Arts, Inc.* | | | 58,620 | | | | 4,194,261 | | |
FactSet Research Systems, Inc.1 | | | 28,800 | | | | 4,771,008 | | |
PTC, Inc.* | | | 7,900 | | | | 287,165 | | |
Synopsys, Inc.* | | | 21,680 | | | | 1,102,211 | | |
| | | | | | 14,215,059 | | |
Specialty retail—4.47% | |
Abercrombie & Fitch Co., Class A1 | | | 83,480 | | | | 1,677,113 | | |
American Eagle Outfitters, Inc.1 | | | 255,211 | | | | 4,529,995 | | |
Ascena Retail Group, Inc.*,1 | | | 221,650 | | | | 2,775,058 | | |
| | | Number of
shares | | Value | |
Common stocks—(concluded) | |
Specialty retail—(concluded) | |
DSW, Inc., Class A | | | 101,800 | | | $ | 3,310,536 | | |
Foot Locker, Inc.1 | | | 28,835 | | | | 2,034,309 | | |
Group1 Automotive, Inc. | | | 11,975 | | | | 1,161,216 | | |
Pier 1 Imports, Inc.1 | | | 246,800 | | | | 2,914,708 | | |
Ross Stores, Inc. | | | 102,000 | | | | 5,422,320 | | |
The Children's Place, Inc. | | | 13,420 | | | | 777,018 | | |
| | | | | | 24,602,273 | | |
Technology hardware, storage & peripherals—1.07% | |
Avid Technology, Inc.*,1 | | | 195,650 | | | | 2,398,669 | | |
SanDisk Corp.1 | | | 20,770 | | | | 1,252,223 | | |
Wincor Nixdorf AG | | | 272,550 | | | | 2,264,891 | | |
| | | | | | 5,915,783 | | |
Textiles, apparel & luxury goods—0.62% | |
PVH Corp. | | | 29,340 | | | | 3,404,614 | | |
Thrifts & mortgage finance—1.51% | |
BofI Holding, Inc.*,1 | | | 5,375 | | | | 660,319 | | |
Essent Group Ltd.* | | | 115,650 | | | | 3,385,075 | | |
Ocwen Financial Corp.*,1 | | | 335,667 | | | | 2,829,673 | | |
Walker & Dunlop, Inc.* | | | 8,305 | | | | 198,905 | | |
Washington Federal, Inc.1 | | | 53,240 | | | | 1,239,427 | | |
| | | | | | 8,313,399 | | |
Trading companies & distributors—1.16% | |
AerCap Holdings N.V.* | | | 53,215 | | | | 2,492,591 | | |
Beacon Roofing Supply, Inc.*,1 | | | 86,450 | | | | 3,025,750 | | |
GATX Corp.1 | | | 16,460 | | | | 873,038 | | |
| | | | | | 6,391,379 | | |
Total common stocks
(cost—$489,834,310) | | | | | 534,612,272 | | |
| | | Face
amount | | | |
Repurchase agreement—1.99% | |
Repurchase agreement dated
07/31/15 with State Street Bank
and Trust Co., 0.000% due
08/03/15, collateralized by
$3,139,589 Federal Home Loan
Mortgage Corp. obligations,
2.080% due 10/17/22, $787,880
Federal National Mortgage
Association obligations, 2.170%
due 10/17/22 and $7,025,194
US Treasury Notes, 1.625% to
3.625% due 03/31/19 to 06/30/20;
(value—$11,136,541);
proceeds: $10,918,000
(cost—$10,918,000) | | $ | 10,918,000 | | | | 10,918,000 | | |
163
PACE Select Advisors Trust
PACE Small/Medium Co Value Equity Investments
Portfolio of investments—July 31, 2015
| | | Number of
shares | | Value | |
Investment of cash collateral from securities loaned—5.57% | |
Money market fund—5.57% | |
UBS Private Money Market Fund LLC3
(cost—$30,655,405) | | | 30,655,405 | | | $ | 30,655,405 | | |
Total investments
(cost—$531,407,715)—104.74% | | | | | 576,185,677 | | |
Liabilities in excess of
other assets—(4.74)% | | | | | (26,052,733 | ) | |
Net assets—100.00% | | | | $ | 550,132,944 | | |
For a listing of defined portfolio acronyms that are used throughout the Portfolio of investments as well as the tables that follow, please refer to page 254.
Aggregate cost for federal income tax purposes was $532,811,009; and net unrealized appreciation consisted of:
Gross unrealized appreciation | | $ | 75,295,940 | | |
Gross unrealized depreciation | | | (31,921,272 | ) | |
Net unrealized appreciation | | $ | 43,374,668 | | |
Fair valuation summary
The following is a summary of the fair valuations according to the inputs used as of July 31, 2015 in valuing the Portfolio's investments:
Assets
Description | | Unadjusted
quoted prices in
active markets for
identical investments
(Level 1) | | Other significant
observable inputs
(Level 2) | | Unobservable
inputs
(Level 3) | | Total | |
Common stocks | | $ | 534,610,181 | | | $ | 2,091 | | | $ | — | | | $ | 534,612,272 | | |
Repurchase agreement | | | — | | | | 10,918,000 | | | | — | | | | 10,918,000 | | |
Investment of cash collateral from securities loaned | | | — | | | | 30,655,405 | | | | — | | | | 30,655,405 | | |
Total | | $ | 534,610,181 | | | $ | 41,575,496 | | | $ | — | | | $ | 576,185,677 | | |
At July 31, 2015, there were no transfers between Level 1 and Level 2.
| | Common
stocks | |
Beginning balance | | $ | 2,613 | | |
Purchases | | | — | | |
Sales | | | — | | |
Accrued discounts/(premiums) | | | — | | |
Total realized gain/(loss) | | | — | | |
Net change in unrealized appreciation/depreciation | | | (522 | ) | |
Transfers into Level 3 | | | — | | |
Transfers out of Level 3 | | | (2,091 | ) | |
Ending balance | | $ | — | | |
At July 31, 2015, a security was transferred from Level 3 to Level 2 as the valuation is based on observable inputs from an established pricing source. The transfer out of Level 3 represents the value at the end of the year.
164
PACE Select Advisors Trust
PACE Small/Medium Co Value Equity Investments
Portfolio of investments—July 31, 2015
Issuer breakdown by country or territory of origin (unaudited)
| | | Percentage of
total investments | |
United States | | | 93.3 | % | |
Bermuda | | | 2.4 | | |
Netherlands | | | 0.9 | | |
Australia | | | 0.9 | | |
Puerto Rico | | | 0.7 | | |
Canada | | | 0.6 | | |
Ireland | | | 0.5 | | |
Denmark | | | 0.4 | | |
Israel | | | 0.3 | | |
Total | | | 100.0 | % | |
Portfolio footnotes
* Non-income producing security.
1 Security, or portion thereof, was on loan at July 31, 2015.
2 Illiquid investment as of July 31, 2015.
3 The table below details the Portfolio's transaction activity in an affiliated issuer during the year ended July 31, 2015. The investment manager earns a management fee from UBS Private Money Market Fund LLC. Please see the Notes to financial statements for further information.
Security description | | Value at
07/31/14 | | Purchases
during the
year ended
07/31/15 | | Sales
during the
year ended
07/31/15 | | Value at
07/31/15 | | Net income
earned from
affiliate for the
year ended
07/31/15 | |
UBS Private Money Market Fund LLC | | $ | 31,962,048 | | | $ | 257,678,566 | | | $ | 258,985,209 | | | $ | 30,655,405 | | | $ | 3,269 | | |
See accompanying notes to financial statements.
165
PACE Select Advisors Trust
PACE Small/Medium Co Growth Equity Investments
Performance (unaudited)
For the 12 months ended July 31, 2015, the Portfolio's Class P shares gained 20.93% before the deduction of the maximum PACE Select program fee.1 In comparison, the Russell 2500 Growth Index (the "benchmark") rose 18.59%, and the Lipper Small-Cap Growth Funds category posted a median return of 17.45%. (Returns for all share classes over various time periods are shown in the "Performance at a glance" table on page 171. Please note that the returns shown do not reflect the deduction of taxes that a shareholder would pay on Portfolio distributions or the redemption of Portfolio shares.) For a detailed commentary on the market environment in general during the reporting period, please refer to page 2.
Sub-advisors' comments2
Please note: Palisade Capital Management, LLC was terminated as a sub-advisor for the Portfolio effective on February 23, 2015.
Riverbridge Partners
Our portion of the Portfolio underperformed the benchmark during the period. Over the last 12 months, our conservative growth investment philosophy was out-of-favor in the marketplace. In vogue were more speculative areas of the market. Generally speaking, companies more sensitive to interest rates performed the best. Additionally, there was a clear preference for companies expected to benefit from improved economic growth. In addition to a highly accommodative Federal Reserve Board, strong corporate earnings, an improving US economy, lower energy prices and continued low interest rates contributed to this market strength.
Biotechnology stocks may serve as the best indicator of investor preference for increased equity risk during the fiscal year. The biotechnology industry of the Russell 2500® Growth Index was up over 60% over the reporting period. We seldom invest in biotechnology companies, as they do not possess the investment characteristics we seek. In particular, they have uneven revenue streams and oftentimes nonexistent earnings based on an all-or-nothing drug discovery process.
PACE Select Advisors Trust – PACE Small/Medium Co Growth Equity Investments
Investment Sub-Advisors:
Riverbridge Partners, LLC ("Riverbridge"); Palisade Capital Management, L.L.C. ("Palisade");
LMCG Investments, LLC, formerly Lee Munder Capital Group ("LMCG");
Timpani Capital Management LLC ("Timpani")
Portfolio Managers:
Riverbridge: Mark Thompson;
Palisade: Sammy Oh;
LMCG: Andrew Morey;
Timpani: Brandon Nelson
Objective:
Capital appreciation
Investment process:
Riverbridge believes that earnings power determines the value of a franchise. Riverbridge focuses on companies that are viewed as building their earnings power and building the intrinsic value of the company over long periods of time. Riverbridge looks to invest in high-quality growth companies that demonstrate the ability to sustain strong secular earnings growth, regardless of overall economic conditions.
Palisade seeks fundamentally strong and dynamic small- and mid-cap companies that
1 Class P shares held through the PACE Select Advisors Program are subject to a maximum Program fee of 2.50%, which, if included, would have reduced performance. Class P shares held through other advisory programs also may be subject to a program fee, which, if included, would have reduced performance.
2 All sub-advisors discuss performance on a gross-of-fees basis—meaning that no fees or expenses are reflected in their sleeves'/sleeve's performance. Alternately, Portfolio performance is shown net of fees, which does factor in fees and expenses associated with the Portfolio.
166
PACE Select Advisors Trust
PACE Small/Medium Co Growth Equity Investments
Sub-advisors' comments – continued
As we look forward, we feel confident about our relative return prospects. Fueling this optimism is the strong fundamental performance of our holdings, combined with our portion of the Portfolio's historically attractive relative valuation. In aggregate, we have a greater percentage of our companies experiencing increasing revenue estimates from the beginning of 2015 versus the benchmark. In addition, a far smaller percentage of companies are guiding their projected revenue growth lower. Ultimately, we believe that this fundamental strength disparity should manifest itself into superior performance.
We understand that our style will rotate out-of-favor during a market cycle. We will not, however, succumb to near-term market emotions and alter our investment philosophy and style. The consistent application of our process has enabled our portfolios to consistently recover following periods of relative underperformance.
Derivatives were not used during the reporting period.
Palisade
For the period from August 1, 2014 through February 23, 2015, when we were a sub-advisor for a portion of the Portfolio, we underperformed the benchmark. Our worst performing sectors were energy and health care, whereas our best performing sectors were information technology and materials.
We had a neutral weighing to the energy sector versus the benchmark during the period we managed a portion of the Portfolio. However, we were primarily invested in exploration and production companies with exposure to North American shale. Our exposure to companies with lower market capitalizations and higher leverage was the primary cause of the underperformance. We also underperformed in health care, primarily due to our underweight in biotechnology. We have historically been underweight biotechnology stocks because of their binary and difficult to predict nature.
On the positive side, within information technology two security software companies, Imperva and Proofpoint, were our biggest contributors to results. Both stocks underperformed during the first half of 2014, as software companies broadly experienced weakness. Moreover, Imperva experienced execution issues. We added to both positions significantly. Both companies subsequently reported strong second-half 2014 results as security threats intensified. In materials, Berry Plastics and Boise Cascade were strong performers for our portion of the Portfolio.
Derivatives were not used during the reporting period.
Investment process (concluded)
are trading at a discount to their growth rates. Palisade's goal is to ascertain a dynamic of change before it manifests in consensus estimates. Palisade believes that the small- and mid-cap market is inherently less efficient than the large-cap market, and attempts to gain an information advantage through fundamental research.
LMCG seeks to achieve competitive returns in small/medium capitalization companies by identifying unrecognized growth potential, wherever it exists across all industry sectors. Revenue growth, margin expansion, and the ability to positively surprise and revise earnings estimates are key characteristics LMCG seeks in its holdings.
Timpani seeks to invest in small cap companies where growth is robust, sustainable and underestimated by the market. Timpani uses fundamental research, focusing on companies that it believes have superior management and whose business models have a high potential for earnings upside. Timpani forms an investment decision based on this reasearch and an assessment of the market's perception of these companies.
167
PACE Select Advisors Trust
PACE Small/Medium Co Growth Equity Investments
Sub-advisors' comments – continued
LMCG Investments, LLC (formerly, Lee Munder Capital Group)
Our portion of the Portfolio outperformed the benchmark during the reporting period. Stock selection has been the key driver of our results over time and continued to be the primary source of performance over the fiscal year. In particular, our results were the strongest in the information technology and materials sectors. Individual holdings in financials and industrials also contributed meaningfully to performance, as did our overweight to the health care sector. On the negative side, we underperformed in the energy and consumer discretionary sectors.
Dealertrack Technologies and MAXIMUS, Inc. were among our strongest performers within the information technology sector. Dealertrack Technologies is a web-based software provider to the automotive retail industry. Its shares spiked earlier this summer following the company's agreement to be purchased by privately held Cox Automotive. The company is seen as a complement to other Cox holdings, including Kelley Blue Book and AutoTrader. MAXIMUS provides business processing services to government health and human services agencies and its shares have posted steady gains throughout the past year. Additional contributors in the information technology sector included Vantiv and Heartland Payment Systems, both of which provide electronic payment processing services to merchants and other end clients. Boise Cascade (wood products, lumber) and Martin Marietta Materials (aggregates, building materials) drove our outperformance in the materials sector. We sold our position in Boise Cascade, as the stock approached our price target.
On average, we had only a modest allocation to the energy sector during the reporting period. However, the decline in oil prices and attendant weakness in the sector as a whole was a drag on our performance. Among individual holdings, Goodrich Petroleum and Halcon Resources were key detractors from results, and we eliminated both companies from our portion of the Portfolio, as the outlook for oil prices weakened. In the consumer discretionary sector, online photo publisher Shutterfly was a headwind for performance, and we sold the stock given a change in the fundamental outlook for the company.
Derivatives were not used during the reporting period.
Timpani Capital Management
Our portion of the Portfolio significantly outperformed the benchmark during the reporting period. Strong stock selection was the major driver of our outperformance. The beginning of the reporting period marked the end of a correction in high growth, small-capitalization stocks that began earlier that spring. The rest of 2014 could be characterized as a mostly neutral stylistic environment. However, during that portion of the reporting period we outperformed, as strong company-specific fundamental drivers produced positive earnings revisions that were embraced by investors. Thus far in 2015, we have seen the neutral style environment turn positive, as the macro environment has been benign for growth stocks overall. Stock selection within health care and financial services were the most positive for results, while our holdings in technology and energy were modestly negative. Sector allocation also had a positive impact on performance. In particular, an overweight in health care and underweight in materials & processing contributed to results.
One standout individual contributor was financial services company LendingTree, a holding of ours for over three years. Consumers are increasingly using the Internet to shop for money and LendingTree is efficiently connecting those consumers to various financial lenders. Other strong performers included health care companies Horizon
168
PACE Select Advisors Trust
PACE Small/Medium Co Growth Equity Investments
Sub-advisors' comments – concluded
Pharma and Adeptus Health. Horizon Pharma investors are excited about a recent acquisition, as well as continued strength in its base business and product pipeline. Adeptus Health has numerous growth engines, including a substantial unit growth opportunity and an increasing addressable market. Consumer discretionary companies Skechers and Jack in the Box were also additive for returns during the reporting period.
The most negative company-specific holdings included consumer discretionary company Marchex and energy companies Diamondback Energy and Sanchez Energy. All three stocks were sold from our portion on the Portfolio given a fundamentally deteriorating outlook.
Derivatives were not used during the reporting period.
Special considerations
The Portfolio may be appropriate for long-term investors seeking capital appreciation who are able to withstand short-term fluctuations in the equity markets in return for potentially higher returns over the long term. The value of the Portfolio changes every day and can be affected by changes in interest rates, general market conditions, and other political, social and economic developments, as well as specific matters relating to the companies in whose securities the Portfolio invests. It is important to note that an investment in the Portfolio is only one component of a balanced investment plan. In addition, small and mid cap companies are typically subject to a greater degree of change in earnings and business prospects than are larger, more established companies. Therefore, they are considered to have a higher level of volatility and risk. Also, to the extent the Portfolio invests a large portion of its assets in a particular sector, the Portfolio may experience greater volatility and risk of loss due to unfavorable developments in that sector.
169
PACE Select Advisors Trust
PACE Small/Medium Co Growth Equity Investments
Illustration of an assumed investment of $10,000 in Class P shares of the Portfolio (unaudited)
The following graph depicts the performance of PACE Small/Medium Co Growth Equity Investments Class P shares versus the Russell 2500 Growth Index over the 10 years ended July 31, 2015. Class P shares held through advisory programs may be subject to a program fee, which, if included, would have reduced performance. The performance of the other classes will vary based upon the different class specific expenses and sales charges. The performance provided does not reflect the deduction of taxes that a shareholder would pay on Portfolio distributions or the redemption of Portfolio shares. Past performance is no guarantee of future results. Share price and returns will vary with market conditions; investors may realize a gain or loss upon redemption. It is important to note that PACE Small/Medium Co Growth Equity Investments is a professionally managed portfolio while the Index is not available for investment and is unmanaged. The comparison is shown for illustration purposes only.
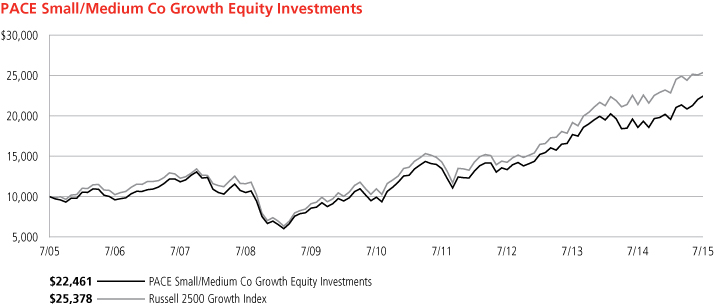
170
PACE Select Advisors Trust
PACE Small/Medium Co Growth Equity Investments
Performance at a glance (unaudited)
Average annual total returns for periods ended 07/31/15 | | 1 year | | 5 years | | 10 years | |
Before deducting maximum sales charge | |
Class A1 | | | 20.82 | % | | | 17.60 | % | | | 8.24 | % | |
Class C2 | | | 19.93 | | | | 16.69 | | | | 7.42 | | |
Class Y3 | | | 20.89 | | | | 17.76 | | | | 8.50 | | |
Class P4 | | | 20.93 | | | | 17.76 | | | | 8.43 | | |
After deducting maximum sales charge | |
Class A1 | | | 14.17 | | | | 16.28 | | | | 7.63 | | |
Class C2 | | | 18.93 | | | | 16.69 | | | | 7.42 | | |
Russell 2500 Growth Index5 | | | 18.59 | | | | 18.29 | | | | 9.76 | | |
Lipper Small-Cap Growth Funds median | | | 17.45 | | | | 17.13 | | | | 8.49 | | |
Most recent calendar quarter-end returns (unaudited)
Average annual total returns for periods ended 06/30/15 | | 1 year | | 5 years | | 10 years | |
Before deducting maximum sales charge | |
Class A1 | | | 12.42 | % | | | 18.23 | % | | | 8.77 | % | |
Class C2 | | | 11.55 | | | | 17.31 | | | | 7.93 | | |
Class Y3 | | | 12.52 | | | | 18.40 | | | | 9.02 | | |
Class P4 | | | 12.52 | | | | 18.38 | | | | 8.95 | | |
After deducting maximum sales charge | |
Class A1 | | | 6.25 | | | | 16.90 | | | | 8.16 | | |
Class C2 | | | 10.62 | | | | 17.31 | | | | 7.93 | | |
The annualized gross and net expense ratios, respectively, for each class of shares as in the November 28, 2014 prospectuses, were as follows: Class A—1.25% and 1.25%; Class C—2.01% and 2.01%; Class Y—1.14% and 1.13%; and Class P—1.13% and 1.13%. Net expenses reflect fee waivers and/or expense reimbursements, if any, pursuant to an agreement that is in effect to cap the expenses. The Portfolio and UBS Global Asset Management (Americas) Inc. ("UBS Global AM") have entered into a written fee waiver/expense reimbursement agreement pursuant to which UBS Global AM is contractually obligated to waive its management fees and/or reimburse expenses so that the Portfolio's ordinary total operating expenses of each class through November 30, 2015 (excluding dividend expense, borrowing costs, and interest expense relating to short sales, and expenses attributable to investment in other investment companies, interest, taxes, brokerage commissions and extraordinary expenses) would not exceed Class A—1.38%; Class C—2.13%; Class Y—1.13%; and Class P—1.13%. The Portfolio has agreed to repay UBS Global AM for any waived fees/reimbursed expenses to the extent that it can do so over the following three fiscal years without causing the Portfolio's expenses in any of those three years to exceed these expense caps. The fee waiver/expense reimbursement agreement may be terminated by the Portfolio's board at any time and also will terminate automatically upon the expiration or termination of the Portfolio's advisory contract with UBS Global AM. Upon termination of the agreement, however, UBS Global AM's three year recoupment rights will survive.
1 Maximum sales charge for Class A shares is 5.5%. Class A shares bear ongoing 12b-1 service fees.
2 Maximum contingent deferred sales charge for Class C shares is 1% imposed on redemptions and is reduced to 0% after one year. Class C shares bear ongoing 12b-1 service and distribution fees.
3 The Portfolio offers Class Y shares to a limited group of eligible investors, including certain qualifying retirement plans. Class Y shares do not bear initial or contingent deferred sales charges or ongoing 12b-1 service and distribution fees.
4 Class P shares do not bear initial or contingent deferred sales charges or ongoing 12b-1 service and distribution fees, but Class P shares held through advisory programs may be subject to a program fee, which, if included, would have reduced performance.
5 The Russell 2500 Growth Index measures the performance of the small to mid-cap growth segment of the US equity universe. It includes those Russell 2500 Index companies with higher price-to-book ratios and higher forecasted growth values. The Russell 2500 Growth Index is constructed to provide a comprehensive and unbiased barometer of the small to mid-cap growth market. The Index is completely reconstituted annually to ensure larger stocks do not distort the performance and characteristics of the true small to mid-cap opportunity set and that the represented companies continue to reflect growth characteristics. Investors should note that indices do not reflect the deduction of fees and expenses.
Prior to February 17, 2015, if an investor sold or exchanged shares less than 90 days after purchase, a redemption fee of 1.00% of the amount sold or exchanged was deducted at the time of the transaction, except as noted otherwise in the prospectus. For sales or exchanges taking place on or after February 17, 2015 but prior to August 3, 2015, there is a reduction in the redemption holding period from 90 days to 30 days. Effective August 3, 2015, the 1.00% redemption fee imposed on sales or exchanges of any class of shares of the portfolios made during the holding periods specified in the prospectus was eliminated. Please refer to the prospectus for further information.
Past performance does not predict future performance, and the performance information provided does not reflect the deduction of taxes that a shareholder would pay on Portfolio distributions or the redemption of Portfolio shares. The return and principal value of an investment will fluctuate, so that an investor's shares, when redeemed, may be worth more or less than their original cost. Performance results assume reinvestment of all dividends and capital gain distributions at net asset value on the ex-dividend dates. Current performance may be higher or lower than the performance data quoted. For month-end performance figures, please visit http://globalam-us.ubs.com/corpweb/performance.do.
Lipper peer group data calculated by Lipper Inc.; used with permission. The Lipper median is the return of the fund that places in the middle of a Lipper peer group.
171
PACE Select Advisors Trust
PACE Small/Medium Co Growth Equity Investments
Portfolio statistics (unaudited)
Characteristics | | 07/31/15 | |
Net assets (mm) | | $ | 578.9 | | |
Number of holdings | | | 194 | | |
Portfolio composition1 | | 07/31/15 | |
Common stocks, ADRs and warrants | | | 97.7 | % | |
Cash equivalents and other assets less liabilities | | | 2.3 | | |
Total | | | 100.0 | % | |
Top five sectors1 | | 07/31/15 | |
Information technology | | | 24.6 | % | |
Health care | | | 24.0 | | |
Industrials | | | 17.1 | | |
Consumer discretionary | | | 13.0 | | |
Financials | | | 9.8 | | |
Total | | | 88.5 | % | |
Top ten equity holdings1 | | 07/31/15 | |
Ultimate Software Group, Inc. | | | 2.7 | % | |
athenahealth, Inc. | | | 2.6 | | |
The Advisory Board Co. | | | 2.2 | | |
Cepheid, Inc. | | | 2.0 | | |
MAXIMUS, Inc. | | | 1.9 | | |
CoStar Group, Inc. | | | 1.9 | | |
Synchronoss Technologies, Inc. | | | 1.7 | | |
PRA Group, Inc. | | | 1.6 | | |
Grand Canyon Education, Inc. | | | 1.5 | | |
Martin Marietta Materials, Inc. | | | 1.4 | | |
Total | | | 19.5 | % | |
For a listing of defined portfolio acronyms that are used throughout the Portfolio statistics, please refer to page 254.
1 Weightings represent percentages of the Portfolio's net assets as of July 31, 2015. The Portfolio is actively managed and its composition will vary over time.
172
PACE Select Advisors Trust
PACE Small/Medium Co Growth Equity Investments
Portfolio of investments—July 31, 2015
| | | Number of
shares | | Value | |
Common stocks—97.66% | |
Aerospace & defense—1.88% | |
HEICO Corp.1 | | | 107,806 | | | $ | 5,911,003 | | |
Hexcel Corp. | | | 67,771 | | | | 3,516,637 | | |
TransDigm Group, Inc.* | | | 6,313 | | | | 1,428,632 | | |
| | | | 10,856,272 | | |
Air freight & logistics—0.89% | |
Forward Air Corp. | | | 54,940 | | | | 2,667,337 | | |
Radiant Logistics, Inc.* | | | 117,989 | | | | 749,230 | | |
XPO Logistics, Inc.*,1 | | | 40,025 | | | | 1,735,084 | | |
| | | | 5,151,651 | | |
Airlines—0.30% | |
Allegiant Travel Co. | | | 8,101 | | | | 1,723,326 | | |
Auto components—2.40% | |
Dorman Products, Inc.*,1 | | | 106,960 | | | | 5,645,349 | | |
Gentex Corp. | | | 349,744 | | | | 5,623,883 | | |
Gentherm, Inc.* | | | 13,418 | | | | 675,328 | | |
Motorcar Parts of America, Inc.* | | | 41,330 | | | | 1,224,608 | | |
Tenneco, Inc.* | | | 14,490 | | | | 721,747 | | |
| | | | 13,890,915 | | |
Biotechnology—5.10% | |
Aduro Biotech, Inc.*,1 | | | 38,506 | | | | 1,009,627 | | |
AMAG Pharmaceuticals, Inc.*,1 | | | 30,593 | | | | 1,954,893 | | |
Cepheid, Inc.*,1 | | | 203,562 | | | | 11,316,011 | | |
Dyax Corp.* | | | 33,979 | | | | 836,223 | | |
Eagle Pharmaceuticals, Inc.*,1 | | | 16,050 | | | | 1,550,751 | | |
Esperion Therapeutics, Inc.*,1 | | | 12,104 | | | | 750,448 | | |
Flexion Therapeutics, Inc.* | | | 14,585 | | | | 341,289 | | |
Intercept Pharmaceuticals, Inc.*,1 | | | 7,128 | | | | 1,880,438 | | |
Intrexon Corp.*,1 | | | 20,572 | | | | 1,342,323 | | |
Ligand Pharmaceuticals, Inc.*,1 | | | 24,043 | | | | 2,602,895 | | |
Neurocrine Biosciences, Inc.* | | | 43,858 | | | | 2,198,163 | | |
Osiris Therapeutics, Inc.*,1 | | | 25,760 | | | | 549,461 | | |
Puma Biotechnology, Inc.* | | | 10,285 | | | | 931,821 | | |
Receptos, Inc.* | | | 5,579 | | | | 1,271,231 | | |
Retrophin, Inc.* | | | 31,459 | | | | 998,509 | | |
| | | | 29,534,083 | | |
Building products—1.64% | |
American Woodmark Corp.* | | | 5,719 | | | | 376,081 | | |
Apogee Enterprises, Inc. | | | 30,834 | | | | 1,701,420 | | |
Builders FirstSource, Inc.* | | | 131,670 | | | | 1,980,317 | | |
PGT, Inc.* | | | 8,683 | | | | 139,536 | | |
USG Corp.*,1 | | | 170,798 | | | | 5,291,322 | | |
| | | | 9,488,676 | | |
Capital markets—2.21% | |
Evercore Partners, Inc., Class A | | | 31,323 | | | | 1,841,792 | | |
Financial Engines, Inc.1 | | | 143,325 | | | | 6,572,884 | | |
Lazard Ltd., Class A | | | 46,719 | | | | 2,588,700 | | |
WisdomTree Investments, Inc.1 | | | 71,183 | | | | 1,772,457 | | |
| | | | 12,775,833 | | |
| | | Number of
shares | | Value | |
Common stocks—(continued) | |
Commercial services & supplies—4.37% | |
Healthcare Services Group, Inc.1 | | | 198,120 | | | $ | 6,916,369 | | |
Innerworkings, Inc.* | | | 218,637 | | | | 1,639,778 | | |
Mobile Mini, Inc.1 | | | 96,635 | | | | 3,588,058 | | |
Ritchie Brothers Auctioneers, Inc.1 | | | 232,963 | | | | 6,294,660 | | |
Rollins, Inc.1 | | | 235,811 | | | | 6,838,519 | | |
| | | | 25,277,384 | | |
Communications equipment—0.44% | |
Digi International, Inc.* | | | 214,177 | | | | 2,167,471 | | |
Radware Ltd.* | | | 20,953 | | | | 398,945 | | |
| | | | 2,566,416 | | |
Construction materials—2.81% | |
Eagle Materials, Inc. | | | 55,051 | | | | 4,246,634 | | |
Martin Marietta Materials, Inc. | | | 52,026 | | | | 8,158,717 | | |
Summit Materials, Inc., Class A* | | | 139,070 | | | | 3,489,266 | | |
US Concrete, Inc.* | | | 8,098 | | | | 342,789 | | |
| | | | 16,237,406 | | |
Consumer finance—2.26% | |
Cardtronics, Inc.* | | | 109,668 | | | | 4,065,393 | | |
PRA Group, Inc.*,1 | | | 142,023 | | | | 9,025,561 | | |
| | | | 13,090,954 | | |
Diversified consumer services—2.84% | |
Grand Canyon Education, Inc.* | | | 198,208 | | | | 8,608,173 | | |
Outerwall, Inc.1 | | | 5,319 | | | | 376,692 | | |
Sotheby's | | | 178,910 | | | | 7,483,805 | | |
| | | | 16,468,670 | | |
Diversified telecommunication services—0.56% | |
Cogent Communications Holdings, Inc. | | | 60,118 | | | | 1,911,151 | | |
inContact, Inc.* | | | 144,206 | | | | 1,338,232 | | |
| | | | 3,249,383 | | |
Electronic equipment, instruments & components—1.21% | |
CUI Global, Inc.*,1 | | | 32,112 | | | | 185,286 | | |
National Instruments Corp. | | | 235,690 | | | | 6,825,583 | | |
| | | | 7,010,869 | | |
Food & staples retailing—1.44% | |
Rite Aid Corp.* | | | 155,861 | | | | 1,388,722 | | |
United Natural Foods, Inc.*,1 | | | 151,978 | | | | 6,919,558 | | |
| | | | 8,308,280 | | |
Health care equipment & supplies—4.42% | |
Abaxis, Inc.1 | | | 59,728 | | | | 2,989,984 | | |
Align Technology, Inc.* | | | 49,120 | | | | 3,079,824 | | |
Cantel Medical Corp. | | | 24,534 | | | | 1,346,426 | | |
Cardiovascular Systems, Inc.* | | | 47,844 | | | | 1,427,665 | | |
Cynosure, Inc., Class A* | | | 18,083 | | | | 701,620 | | |
ICU Medical, Inc.* | | | 9,122 | | | | 911,470 | | |
Inogen, Inc.* | | | 38,855 | | | | 1,727,493 | | |
Insulet Corp.* | | | 77,644 | | | | 2,631,355 | | |
LDR Holding Corp.* | | | 35,156 | | | | 1,598,192 | | |
173
PACE Select Advisors Trust
PACE Small/Medium Co Growth Equity Investments
Portfolio of investments—July 31, 2015
| | | Number of
shares | | Value | |
Common stocks—(continued) | |
Health care equipment & supplies—(concluded) | |
Neogen Corp.*,1 | | | 106,427 | | | $ | 6,192,987 | | |
Novadaq Technologies, Inc.*,1 | | | 166,195 | | | | 1,906,257 | | |
Zeltiq Aesthetics, Inc.* | | | 31,155 | | | | 1,070,174 | | |
| | | | 25,583,447 | | |
Health care providers & services—10.92% | |
AAC Holdings, Inc.*,1 | | | 50,409 | | | | 1,916,046 | | |
Adeptus Health, Inc., Class A*,1 | | | 31,657 | | | | 3,478,788 | | |
AMN Healthcare Services, Inc.* | | | 51,127 | | | | 1,504,668 | | |
Amsurg Corp.* | | | 45,067 | | | | 3,233,107 | | |
BioTelemetry, Inc.* | | | 48,809 | | | | 596,934 | | |
Chemed Corp.1 | | | 47,035 | | | | 6,982,816 | | |
Community Health Systems, Inc.* | | | 131,456 | | | | 7,691,491 | | |
Diplomat Pharmacy, Inc.*,1 | | | 18,348 | | | | 847,311 | | |
Envision Healthcare Holdings, Inc.* | | | 65,421 | | | | 2,930,861 | | |
ExamWorks Group, Inc.*,1 | | | 132,306 | | | | 4,641,294 | | |
HealthSouth Corp. | | | 62,249 | | | | 2,844,779 | | |
IPC Hospitalist Co.* | | | 77,045 | | | | 4,272,145 | | |
LifePoint Health, Inc.* | | | 22,254 | | | | 1,843,966 | | |
MEDNAX, Inc.*,1 | | | 82,100 | | | | 6,948,944 | | |
Nobilis Health Corp.* | | | 41,869 | | | | 246,608 | | |
Premier, Inc., Class A* | | | 113,989 | | | | 4,076,247 | | |
Team Health Holdings, Inc.* | | | 30,134 | | | | 2,031,333 | | |
Tenet Healthcare Corp.* | | | 126,917 | | | | 7,145,427 | | |
| | | | 63,232,765 | | |
Health care technology—3.31% | |
athenahealth, Inc.*,1 | | | 106,577 | | | | 14,916,517 | | |
HealthStream, Inc.* | | | 88,385 | | | | 2,480,083 | | |
Veeva Systems, Inc., Class A*,1 | | | 64,646 | | | | 1,740,270 | | |
| | | | 19,136,870 | | |
Hotels, restaurants & leisure—2.96% | |
BJ's Restaurants, Inc.* | | | 14,431 | | | | 744,062 | | |
Buffalo Wild Wings, Inc.* | | | 6,824 | | | | 1,334,638 | | |
Dunkin' Brands Group, Inc.1 | | | 27,218 | | | | 1,466,778 | | |
Jack in the Box, Inc. | | | 27,919 | | | | 2,652,305 | | |
Kona Grill, Inc.*,1 | | | 15,737 | | | | 299,632 | | |
Noodles & Co.*,1 | | | 148,965 | | | | 2,305,978 | | |
Red Lion Hotels Corp.* | | | 73,606 | | | | 599,153 | | |
Sonic Corp. | | | 30,958 | | | | 920,072 | | |
The Cheesecake Factory, Inc.1 | | | 75,990 | | | | 4,387,663 | | |
The Habit Restaurants, Inc., Class A* | | | 25,008 | | | | 742,988 | | |
Zoe's Kitchen, Inc.*,1 | | | 37,984 | | | | 1,703,582 | | |
| | | | 17,156,851 | | |
Household durables—0.22% | |
The Ryland Group, Inc. | | | 28,090 | | | | 1,277,252 | | |
Internet software & services—5.12% | |
Autobytel, Inc.* | | | 28,791 | | | | 441,654 | | |
ChannelAdvisor Corp.*,1 | | | 93,200 | | | | 940,388 | | |
Criteo SA, ADR* | | | 19,453 | | | | 1,035,483 | | |
Cvent, Inc.* | | | 132,565 | | | | 3,568,650 | | |
DealerTrack Holdings, Inc.* | | | 126,979 | | | | 7,881,587 | | |
GTT Communications, Inc.* | | | 43,025 | | | | 999,471 | | |
| | | Number of
shares | | Value | |
Common stocks—(continued) | |
Internet software & services—(concluded) | |
Internap Corp.* | | | 426,362 | | | $ | 3,926,794 | | |
Q2 Holdings, Inc.* | | | 59,608 | | | | 1,620,741 | | |
SciQuest, Inc.*,1 | | | 218,275 | | | | 2,595,290 | | |
SPS Commerce, Inc.* | | | 92,121 | | | | 6,646,530 | | |
| | | | 29,656,588 | | |
IT services—6.50% | |
Cass Information Systems, Inc.1 | | | 63,223 | | | | 3,325,530 | | |
Echo Global Logistics, Inc.* | | | 123,511 | | | | 3,989,405 | | |
EPAM Systems, Inc.* | | | 17,383 | | | | 1,288,254 | | |
Euronet Worldwide, Inc.* | | | 22,842 | | | | 1,564,677 | | |
ExlService Holdings, Inc.* | | | 71,195 | | | | 2,760,230 | | |
Heartland Payment Systems, Inc. | | | 87,626 | | | | 5,459,100 | | |
MAXIMUS, Inc. | | | 159,603 | | | | 10,886,521 | | |
PFSweb, Inc.*,1 | | | 73,064 | | | | 922,068 | | |
Vantiv, Inc., Class A* | | | 169,220 | | | | 7,445,680 | | |
| | | | 37,641,465 | | |
Leisure products—0.28% | |
Nautilus, Inc.* | | | 76,530 | | | | 1,617,079 | | |
Life sciences tools & services—1.96% | |
Bio-Techne Corp.1 | | | 51,920 | | | | 5,679,010 | | |
INC Research Holdings, Inc., Class A* | | | 39,845 | | | | 1,993,445 | | |
PAREXEL International Corp.* | | | 53,334 | | | | 3,677,913 | | |
| | | | 11,350,368 | | |
Machinery—1.59% | |
Middleby Corp.* | | | 17,421 | | | | 2,137,557 | | |
Proto Labs, Inc.*,1 | | | 93,690 | | | | 7,061,415 | | |
| | | | 9,198,972 | | |
Media—0.75% | |
IMAX Corp.* | | | 16,217 | | | | 606,678 | | |
Nexstar Broadcasting Group, Inc.,
Class A | | | 34,003 | | | | 1,950,412 | | |
Sinclair Broadcast Group, Inc., Class A1 | | | 61,848 | | | | 1,794,829 | | |
| | | | 4,351,919 | | |
Oil, gas & consumable fuels—0.62% | |
Memorial Resource Development Corp.* | | | 95,234 | | | | 1,457,080 | | |
Rice Energy, Inc.*,1 | | | 77,903 | | | | 1,406,149 | | |
Scorpio Tankers, Inc. | | | 66,367 | | | | 712,782 | | |
| | | | 3,576,011 | | |
Pharmaceuticals—3.01% | |
Akorn, Inc.* | | | 57,933 | | | | 2,671,290 | | |
ANI Pharmaceuticals, Inc.*,1 | | | 50,826 | | | | 3,610,171 | | |
BioDelivery Sciences International, Inc.*,1 | | | 47,233 | | | | 384,949 | | |
Depomed, Inc.* | | | 49,602 | | | | 1,562,463 | | |
Dipexium Pharmaceuticals, Inc.* | | | 60,459 | | | | 1,009,665 | | |
Heska Corp.*,1 | | | 31,737 | | | | 1,071,124 | | |
Horizon Pharma PLC* | | | 98,941 | | | | 3,645,976 | | |
Intersect ENT, Inc.* | | | 38,830 | | | | 1,152,086 | | |
Lannett Co., Inc.*,1 | | | 39,333 | | | | 2,344,247 | | |
| | | | 17,451,971 | | |
174
PACE Select Advisors Trust
PACE Small/Medium Co Growth Equity Investments
Portfolio of investments—July 31, 2015
| | | Number of
shares | | Value | |
Common stocks—(continued) | |
Professional services—5.42% | |
CoStar Group, Inc.*,1 | | | 53,079 | | | $ | 10,684,272 | | |
Kelly Services, Inc., Class A | | | 95,522 | | | | 1,427,099 | | |
Kforce, Inc. | | | 164,802 | | | | 3,851,423 | | |
Korn/Ferry International | | | 72,926 | | | | 2,441,562 | | |
The Advisory Board Co.*,1 | | | 216,266 | | | | 12,954,333 | | |
| | | | 31,358,689 | | |
Real estate management & development—0.30% | |
Marcus & Millichap, Inc.* | | | 34,056 | | | | 1,745,029 | | |
Road & rail—0.09% | |
Old Dominion Freight Line, Inc.* | | | 6,893 | | | | 504,223 | | |
Semiconductors & semiconductor equipment—1.75% | |
Cabot Microelectronics Corp.* | | | 102,191 | | | | 4,633,340 | | |
Cavium, Inc.* | | | 9,266 | | | | 628,235 | | |
CEVA, Inc.* | | | 21,641 | | | | 405,336 | | |
Mellanox Technologies Ltd.* | | | 16,007 | | | | 673,095 | | |
Power Integrations, Inc.1 | | | 79,495 | | | | 3,081,226 | | |
Qorvo, Inc.* | | | 12,014 | | | | 696,211 | | |
| | | | 10,117,443 | | |
Software—10.05% | |
Attunity Ltd.* | | | 102,174 | | | | 1,465,175 | | |
Barracuda Networks, Inc.* | | | 10,243 | | | | 281,068 | | |
FireEye, Inc.*,1 | | | 28,136 | | | | 1,251,771 | | |
FleetMatics Group PLC*,1 | | | 44,853 | | | | 2,147,113 | | |
Globant SA* | | | 29,295 | | | | 931,581 | | |
Imperva, Inc.* | | | 5,273 | | | | 346,436 | | |
NetScout Systems, Inc.* | | | 38,458 | | | | 1,533,705 | | |
Pegasystems, Inc. | | | 186,514 | | | | 5,052,664 | | |
Proofpoint, Inc.* | | | 23,875 | | | | 1,544,713 | | |
PROS Holdings, Inc.*,1 | | | 130,037 | | | | 2,843,909 | | |
Qualys, Inc.*,1 | | | 19,086 | | | | 705,419 | | |
SS&C Technologies Holdings, Inc. | | | 46,390 | | | | 3,155,912 | | |
Synchronoss Technologies, Inc.* | | | 204,709 | | | | 9,785,090 | | |
The Rubicon Project, Inc.* | | | 73,859 | | | | 1,287,362 | | |
TubeMogul, Inc.* | | | 82,226 | | | | 1,161,854 | | |
Tyler Technologies, Inc.* | | | 11,245 | | | | 1,569,127 | | |
Ultimate Software Group, Inc.* | | | 84,333 | | | | 15,534,982 | | |
VASCO Data Security
International, Inc.*,1 | | | 18,959 | | | | 386,574 | | |
Verint Systems, Inc.* | | | 123,887 | | | | 7,212,701 | | |
| | | | 58,197,156 | | |
Specialty retail—3.40% | |
Asbury Automotive Group, Inc.* | | | 12,089 | | | | 1,067,459 | | |
Big 5 Sporting Goods Corp. | | | 16,927 | | | | 186,366 | | |
Five Below, Inc.*,1 | | | 120,535 | | | | 4,444,125 | | |
Group 1 Automotive, Inc. | | | 25,508 | | | | 2,473,511 | | |
Lithia Motors, Inc., Class A | | | 47,245 | | | | 5,654,754 | | |
Party City Holdco, Inc.* | | | 122,580 | | | | 2,527,600 | | |
Tile Shop Holdings, Inc.*,1 | | | 232,770 | | | | 3,323,955 | | |
| | | | 19,677,770 | | |
| | | Number of
shares | | Value | |
Common stocks—(concluded) | |
Technology hardware, storage & peripherals—0.94% | |
Stratasys Ltd.*,1 | | | 156,725 | | | $ | 4,816,159 | | |
Super Micro Computer, Inc.* | | | 23,434 | | | | 624,985 | | |
| | | | 5,441,144 | | |
Textiles, apparel & luxury goods—1.35% | |
G-III Apparel Group Ltd.* | | | 31,970 | | | | 2,309,193 | | |
Lululemon Athletica, Inc.* | | | 19,602 | | | | 1,232,182 | | |
Skechers USA, Inc., Class A* | | | 24,231 | | | | 3,645,554 | | |
Steven Madden Ltd.* | | | 15,428 | | | | 643,039 | | |
| | | | 7,829,968 | | |
Thrifts & mortgage finance—0.90% | |
LendingTree, Inc.* | | | 62,942 | | | | 5,219,151 | | |
Trading companies & distributors—1.16% | |
Beacon Roofing Supply, Inc.*,1 | | | 191,360 | | | | 6,697,600 | | |
Wireless telecommunication services—0.29% | |
Boingo Wireless, Inc.* | | | 174,249 | | | | 1,695,443 | | |
Total common stocks
(cost—$464,947,181) | | | | | 565,345,292 | | |
| | | Number of
warrants | | | |
Warrants—0.00%†† | |
Oil, gas & consumable fuels—0.00%†† | |
Magnum Hunter Resources Corp.,
strike price $8.50,
expires 04/15/16*,1,2
(cost—$0) | | | 53,494 | | | | 0 | | |
| | | Face
amount | | | |
Repurchase agreement—2.22% | |
Repurchase agreement dated
07/31/15 with State Street Bank and
Trust Co., 0.000% due 08/03/15,
collateralized by $3,693,144
Federal Home Loan Mortgage Corp.
obligations, 2.080% due 10/17/22,
$926,795 Federal National
Mortgage Association obligations,
2.170% due 10/17/22 and
$8,263,837 US Treasury Notes,
1.625% to 3.625% due 03/31/19
to 06/30/20; (value—$13,100,073);
proceeds: $12,843,000
(cost—$12,843,000) | | $ | 12,843,000 | | | | 12,843,000 | | |
175
PACE Select Advisors Trust
PACE Small/Medium Co Growth Equity Investments
Portfolio of investments—July 31, 2015
| | | Number of
shares | | Value | |
Investment of cash collateral from securities loaned—16.18% | |
Money market fund—16.18% | |
UBS Private Money Market Fund LLC3
(cost—$93,660,105) | | | 93,660,105 | | | $ | 93,660,105 | | |
Total investments
(cost—$571,450,286)—116.06% | | | | | 671,848,397 | | |
Liabilities in excess of
other assets—(16.06)% | | | | | (92,984,878 | ) | |
Net assets—100.00% | | | | $ | 578,863,519 | | |
For a listing of defined portfolio acronyms that are used throughout the Portfolio of investments as well as the tables that follow, please refer to page 254.
Aggregate cost for federal income tax purposes was $573,211,795; and net unrealized appreciation consisted of:
Gross unrealized appreciation | | $ | 114,916,207 | | |
Gross unrealized depreciation | | | (16,279,605 | ) | |
Net unrealized appreciation | | $ | 98,636,602 | | |
Fair valuation summary
The following is a summary of the fair valuations according to the inputs used as of July 31, 2015 in valuing the Portfolio's investments:
Assets
Description | | Unadjusted
quoted prices in
active markets for
identical investments
(Level 1) | | Other significant
observable inputs
(Level 2) | | Unobservable
inputs
(Level 3) | | Total | |
Common stocks | | $ | 565,345,292 | | | $ | — | | | $ | — | | | $ | 565,345,292 | | |
Warrants | | | — | | | | — | | | | 0 | | | | 0 | | |
Repurchase agreement | | | — | | | | 12,843,000 | | | | — | | | | 12,843,000 | | |
Investment of cash collateral from securities loaned | | | — | | | | 93,660,105 | | | | — | | | | 93,660,105 | | |
Total | | $ | 565,345,292 | | | $ | 106,503,105 | | | $ | 0 | | | $ | 671,848,397 | | |
At July 31, 2015, there were no transfers between Level 1 and Level 2.
The following is a rollforward of the Portfolio's investments that was fair valued using unobservable inputs (Level 3) for the year ended July 31, 2015:
| | Warrants | |
Beginning balance | | $ | 0 | | |
Purchases | | | — | | |
Issuance | | | — | | |
Sales | | | — | | |
Accrued discounts/(premiums) | | | — | | |
Total realized gain/(loss) | | | — | | |
Net change in unrealized appreciation/depreciation | | | 0 | | |
Transfers into Level 3 | | | — | | |
Transfers out of Level 3 | | | — | | |
Ending balance | | $ | 0 | | |
The change in net unrealized appreciation/depreciation relating to the Level 3 investment held at July 31, 2015 was $0.
176
PACE Select Advisors Trust
PACE Small/Medium Co Growth Equity Investments
Portfolio of investments—July 31, 2015
Issuer breakdown by country or territory of origin (unaudited)
| | | Percentage of
total investments | |
United States | | | 96.0 | % | |
Canada | | | 1.3 | | |
Israel | | | 1.1 | | |
Ireland | | | 0.9 | | |
Bermuda | | | 0.4 | | |
France | | | 0.1 | | |
Luxembourg | | | 0.1 | | |
Marshall Islands | | | 0.1 | | |
Total | | | 100.0 | % | |
Portfolio footnotes
* Non-income producing security.
†† Amount represents less than 0.005%.
1 Security, or portion thereof, was on loan at July 31, 2015.
2 Illiquid investment as of July 31, 2015.
3 The table below details the Portfolio's transaction activity in an affiliated issuer during the year ended July 31, 2015. The investment manager earns a management fee from UBS Private Money Market Fund LLC. Please see the Notes to financial statements for further information.
Security description | | Value at
07/31/14 | | Purchases
during the
year ended
07/31/15 | | Sales
during the
year ended
07/31/15 | | Value at
07/31/15 | | Net income
earned from
affiliate for the
year ended
07/31/15 | |
UBS Private Money Market Fund LLC | | $ | 70,777,816 | | | $ | 332,894,761 | | | $ | 310,012,472 | | | $ | 93,660,105 | | | $ | 8,354 | | |
See accompanying notes to financial statements.
177
PACE Select Advisors Trust
PACE International Equity Investments
Performance (unaudited)
For the 12 months ended July 31, 2015, the Portfolio's Class P shares declined 1.11% before the deduction of the maximum PACE Select program fee.1 In comparison, the MSCI EAFE Index (net) (the "benchmark") fell 0.27%, and the Lipper International Large-Cap Core Funds category posted a median return of 0.02%. (Returns for all share classes over various time periods are shown in the "Performance at a glance" table on page 182. Please note that the returns shown do not reflect the deduction of taxes that a shareholder would pay on Portfolio distributions or the redemption of Portfolio shares.) For a detailed commentary on the market environment in general during the reporting period, please refer to page 2.
Sub-advisors' Comments2
Mondrian
Our portion of the Portfolio modestly outperformed the benchmark during the reporting period. Stock selection within markets was approximately neutral for performance. Positive stock selection in Japan and Spain was offset by weak stock selection in France and Italy. Strong performing individual security holdings included Kao, Hoya and Novartis. Weak performing individual security holdings included Vallourec and Eni. Allocation between sectors detracted from returns. We benefited from an overweight in the telecommunication services sector and from an underweight in the materials sector. This was more than offset, however, by an overweight in the weak energy sector, given the precipitous decline in oil prices. Stock selection within sectors weighed slightly on returns, driven by our holdings in the industrials sector.
Country allocation was a headwind for performance, led by an underweight in the strong Japanese equity market and an overweight in the weak Singaporean equity market. Currency allocation made a positive contribution to returns, helped by an overweight in the strong Swiss franc and by our exposure to the Australian dollar.
1 Class P shares held through the PACE Select Advisors Program are subject to a maximum Program fee of 2.50%, which, if included, would have reduced performance. Class P shares held through other advisory programs also may be subject to a program fee, which, if included, would have reduced performance.
2 All sub-advisors discuss performance on a gross-of-fees basis—meaning that no fees or expenses are reflected in their sleeves'/sleeve's performance. Alternately, Portfolio performance is shown net of fees, which does factor in fees and expenses associated with the Portfolio.
PACE Select Advisors Trust –
PACE International Equity Investments
Investment Sub-Advisors:
Mondrian Investment Partners Limited ("Mondrian");
Chautauqua Capital Management, LLC ("Chautauqua");
Los Angeles Capital Management and Equity Research, Inc. ("Los Angeles Capital")
Portfolio Managers:
Mondrian: Elizabeth A. Desmond, Nigel Bliss, Andrew Porter and Steve Dutaut;
Chautauqua: Brian M. Beitner, CFA;
Los Angeles Capital: Thomas D. Stevens, CFA, Hal W. Reynolds, CFA and Daniel E. Allen, CFA
Objective:
Capital appreciation
Investment process:
Mondrian conducts research on a global basis in an effort to identify securities that have the potential for capital appreciation over a market cycle. The center of its research effort is a value-oriented dividend discount methodology toward individual securities and market analysis that attempts to identify value across country boundaries. This approach focuses on future anticipated dividends, and discounts the value of those dividends back to what they would be worth if they were being paid today.
Comparisons of the values of different possible investments are then made. In an international portfolio, currency returns can be an integral component of an investment's total return. Mondrian uses a purchasing power parity approach to assess the value of individual currencies. Purchasing power parity attempts to identify the amount of goods and services that a dollar will buy in the United States,
178
PACE Select Advisors Trust
PACE International Equity Investments
Sub-advisors' Comments – continued
The main highlights of the strategy being adopted for our portion of the Portfolio are an overweight in selected European markets, overweights in the telecommunications services, consumer staples and health care sectors, and underweights in the materials and financials sectors.
The Australian dollar weakened approximately 13% relative to the US dollar between July 31, 2014 and December 4, 2014, converging toward our estimate of fair value for the currency. During the reporting period, our defensive currency hedge added to returns.
We had no derivative exposure as of July 31, 2015.
Chautauqua Capital Management
Our portion of the Portfolio outperformed the benchmark during the reporting period. Security selection by region contributed to performance, whereas sector allocation detracted from results. While we were underweight in Europe and North America, we generated better returns than the benchmark in those regions. By sector, we benefited from security selection in the materials and consumer discretionary sectors. An underweight to the underperforming materials sector and an overweight to the superior performing consumer discretionary sector also aided our results, relative to the benchmark. Specifically, Croda, a specialty chemical company, added value in materials and Lululemon added value in consumer discretionary.
Conversely, our allocation to the energy sector detracted from performance, even though our exposure was substantially reduced ahead of the greatest reduction in oil prices. Energy-related holdings represented three of our five worst performers overall during the reporting period. Conviction weighting bias was evidenced during the period, as our five best performers carried more than twice the average weight compared to our five worst performers. Our portion of the Portfolio ended the reporting period well positioned, in our view, with a broadly diversified set of companies which are more profitable and growing more rapidly than the broad market, yet trade at what we believe is an attractive relative valuation.
Derivatives were not used during the review period.
Investment process (concluded)
and compares that to the amount of a foreign currency required to buy the same amount of goods and services in another country.
Chautauqua seeks to achieve consistent risk adjusted excess returns by managing a concentrated portfolio of 25-35 quality, growth companies generally headquartered outside of the United States. The portfolio consists of a carefully diversified set of best idea equities that Chautauqua believes will benefit from long-term trends, have sustainable competitive advantages and exhibit growth that should outpace the market. Companies are valued based on a forward looking cash flow analysis. When selecting investments, Chautauqua has a long-term horizon.
Los Angeles Capital employs a "long/short" or "130/30" equity strategy. Los Angeles Capital buys securities "long" that it believes will outperform the market or decrease portfolio risk, and sells securities "short" that it believes will underperform the market. Los Angeles Capital uses a proprietary quantitative model that includes fundamental data inputs for a universe of equity securities and, through the use of statistical tools, estimates expected returns based on each security's risk characteristics and the expected return to each characteristic in the current market environment.
179
PACE Select Advisors Trust
PACE International Equity Investments
Sub-advisors' Comments – concluded
Los Angeles Capital
Our portion of the Portfolio underperformed the benchmark during the reporting period. Fundamental factor exposures contributed to performance, but this was offset by currency and sector tilts. Elsewhere, country position was flat during the reporting period.
Looking at fundamental factors, exposure to small cap stocks added value in the Pacific ex-Japan and Europe regions but detracted from results in Japan. In Europe, exposure to stocks with strong three-year momentum added value, as did a tilt toward stocks with strong analyst sentiment. Conversely, an underweight to volatility and an overweight to yield detracted from relative results.
A quality tilt in Japan toward stocks with superior profitability and high earnings quality contributed to performance, as did a tilt toward companies with strong earnings yield. In the Pacific ex-Japan region, exposure to stocks with solid one-year price momentum and to companies with lower book-to-price multiples added value. In contrast, overweights to stocks with strong short sentiment and short-term price momentum negatively impacted performance. Within sectors, an underweight to European energy was the largest contributor to results relative to the benchmark, whereas an overweight to European utilities and an underweight to health care detracted from relative performance. In Japan, tilts toward consumer discretionary and away from utilities and telecommunications added value, while an overweight to basic materials and energy detracted from results. In the Pacific ex Japan region, overweights to industrials, health care and information technology contributed to performance. Within countries, overweights to Finland and Denmark added value, but underweights to the Netherlands and France detracted from relative performance.
At the end of the reporting period, our portion of the Portfolio exhibited tilts toward consumer discretionary, financials and utilities, and away from energy, consumer staples and telecommunications relative to the benchmark. Our portion of the Portfolio exhibited higher price-to-earnings and price-to-book ratios, as well as a higher yield, relative to the benchmark. Our portion of the Portfolio also exhibited a lower beta and weighted average market capitalization. (Beta is a measure of volatility or risk relative to the market as a whole.)
Derivatives were not used during the review period.
Special considerations
The Portfolio may be appropriate for long-term investors seeking capital appreciation who are able to withstand short-term fluctuations in the equity markets in return for potentially higher returns over the long term. The value of the Portfolio changes every day and can be affected by changes in interest rates, general market conditions, and other political, social and economic developments, as well as specific matters relating to the companies in whose securities the Portfolio invests. It is important to note that an investment in the Portfolio is only one component of a balanced investment plan. The value of the Portfolio's investments in foreign securities may fall due to adverse political, social, and economic developments abroad and due to decreases in foreign currency values relative to the US dollar. These risks are greater for investments in emerging market issuers than for issuers in more developed countries.
180
PACE Select Advisors Trust
PACE International Equity Investments
Illustration of an assumed investment of $10,000 in Class P shares of the Portfolio (unaudited)
The following graph depicts the performance of PACE International Equity Investments Class P shares versus the MSCI EAFE Index (net) over the 10 years ended July 31, 2015. Class P shares held through advisory programs may be subject to a program fee, which, if included, would have reduced performance. The performance of the other classes will vary based upon the different class specific expenses and sales charges. The performance provided does not reflect the deduction of taxes that a shareholder would pay on Portfolio distributions or the redemption of Portfolio shares. Past performance is no guarantee of future results. Share price and returns will vary with market conditions; investors may realize a gain or loss upon redemption. It is important to note that PACE International Equity Investments is a professionally managed portfolio while the Index is not available for investment and is unmanaged. The comparison is shown for illustration purposes only.
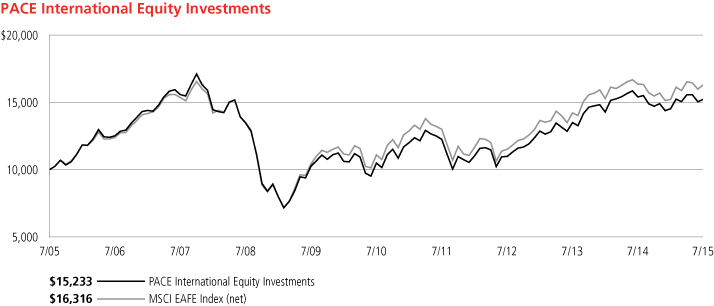
181
PACE Select Advisors Trust
PACE International Equity Investments
Performance at a glance (unaudited)
Average annual total returns for periods ended 07/31/15 | | 1 year | | 5 years | | 10 years | |
Before deducting maximum sales charge | |
Class A1 | | | (1.38 | )% | | | 7.44 | % | | | 4.02 | % | |
Class C2 | | | (2.14 | ) | | | 6.59 | | | | 3.16 | | |
Class Y3 | | | (1.09 | ) | | | 7.73 | | | | 4.36 | | |
Class P4 | | | (1.11 | ) | | | 7.74 | | | | 4.30 | | |
After deducting maximum sales charge | |
Class A1 | | | (6.82 | ) | | | 6.24 | | | | 3.44 | | |
Class C2 | | | (3.10 | ) | | | 6.59 | | | | 3.16 | | |
MSCI EAFE Index (net)5 | | | (0.27 | ) | | | 8.01 | | | | 5.02 | | |
Lipper International Large-Cap Growth Funds median6 | | | 2.57 | | | | 7.52 | | | | 6.07 | | |
Lipper International Large-Cap Core Funds median6 | | | 0.02 | | | | 7.28 | | | | 5.06 | | |
Most recent calendar quarter-end returns (unaudited)
Average annual total returns for periods ended 06/30/15 | | 1 year | | 5 years | | 10 years | |
Before deducting maximum sales charge | |
Class A1 | | | (5.35 | )% | | | 9.31 | % | | | 4.24 | % | |
Class C2 | | | (6.09 | ) | | | 8.42 | | | | 3.38 | | |
Class Y3 | | | (5.13 | ) | | | 9.59 | | | | 4.57 | | |
Class P4 | | | (5.10 | ) | | | 9.59 | | | | 4.51 | | |
After deducting maximum sales charge | |
Class A1 | | | (10.58 | ) | | | 8.08 | | | | 3.65 | | |
Class C2 | | | (7.01 | ) | | | 8.42 | | | | 3.38 | | |
The annualized gross and net expense ratios, respectively, for each class of shares as in the November 28, 2014 prospectuses, were as follows: Class A—1.70% and 1.70%; Class C—2.51% and 2.51%; Class Y—1.42% and 1.42%; and Class P—1.45% and 1.45%. Net expenses reflect fee waivers and/or expense reimbursements, if any, pursuant to an agreement that is in effect to cap the expenses. The Portfolio and UBS Global Asset Management (Americas) Inc. ("UBS Global AM") have entered into a written fee waiver/expense reimbursement agreement pursuant to which UBS Global AM is contractually obligated to waive its management fees and/or reimburse expenses so that the Portfolio's ordinary total operating expenses of each class through November 30, 2015 (excluding dividend expense, borrowing costs, and interest expense relating to short sales, and expenses attributable to investment in other investment companies, interest, taxes, brokerage commissions and extraordinary expenses) would not exceed Class A—1.55%; Class C—2.30%; Class Y—1.30%; and Class P—1.30%. The Portfolio has agreed to repay UBS Global AM for any waived fees/reimbursed expenses to the extent that it can do so over the following three fiscal years without causing the Portfolio's expenses in any of those three years to exceed these expense caps. The fee waiver/expense reimbursement agreement may be terminated by the Portfolio's board at any time and also will terminate automatically upon the expiration or termination of the Portfolio's advisory contract with UBS Global AM. Upon termination of the agreement, however, UBS Global AM's three year recoupment rights will survive.
1 Maximum sales charge for Class A shares is 5.5%. Class A shares bear ongoing 12b-1 service fees.
2 Maximum contingent deferred sales charge for Class C shares is 1% imposed on redemptions and is reduced to 0% after one year. Class C shares bear ongoing 12b-1 service and distribution fees.
3 The Portfolio offers Class Y shares to a limited group of eligible investors, including certain qualifying retirement plans. Class Y shares do not bear initial or contingent deferred sales charges or ongoing 12b-1 service and distribution fees.
4 Class P shares do not bear initial or contingent deferred sales charges or ongoing 12b-1 service and distribution fees, but Class P shares held through advisory programs may be subject to a program fee, which, if included, would have reduced performance.
5 The MSCI EAFE Index (net) is an index of stocks designed to measure the investment returns of developed economies outside of North America. Net total return indices reinvest dividends after the deduction of withholding taxes, using a tax rate applicable to non-resident institutional investors who do not benefit from double taxation treaties. The Index is constructed and managed with a view to being fully investable from the perspective of international institutional investors. Investors should note that indices do not reflect the deduction of fees and expenses.
6 On June 22, 2015, Lipper changed the peer group classification for PACE International Equity Investments from the International Large-Cap Core Funds category to the International Large-Cap Growth Funds category.
Prior to February 17, 2015, if an investor sold or exchanged shares less than 90 days after purchase, a redemption fee of 1.00% of the amount sold or exchanged was deducted at the time of the transaction, except as noted otherwise in the prospectus. For sales or exchanges taking place on or after February 17, 2015 but prior to August 3, 2015, there is a reduction in the redemption holding period from 90 days to 30 days. Effective August 3, 2015, the 1.00% redemption fee imposed on sales or exchanges of any class of shares of the portfolios made during the holding periods specified in the prospectus was eliminated. Please refer to the prospectus for further information.
Past performance does not predict future performance, and the performance information provided does not reflect the deduction of taxes that a shareholder would pay on Portfolio distributions or the redemption of Portfolio shares. The return and principal value of an investment will fluctuate, so that an investor's shares, when redeemed, may be worth more or less than their original cost. Performance results assume reinvestment of all dividends and capital gain distributions at net asset value on the ex-dividend dates. Current performance may be higher or lower than the performance data quoted. For month-end performance figures, please visit http://globalam-us.ubs.com/corpweb/performance.do.
Lipper peer group data calculated by Lipper Inc.; used with permission. The Lipper median is the return of the fund that places in the middle of a Lipper peer group.
182
PACE Select Advisors Trust
PACE International Equity Investments
Portfolio statistics (unaudited)
Characteristics | | 07/31/15 | |
Net assets (mm) | | $ | 1,072.2 | | |
Number of holdings | | | 558 | | |
Portfolio composition1 | | 07/31/15 | |
Common stocks, ADRs, SDRs and preferred stocks | | | 110.7 | % | |
Investments sold short | | | (12.0 | ) | |
Cash equivalents and other assets less liabilities | | | 1.3 | | |
Total | | | 100.0 | % | |
Regional allocation (equity investments)1 | | 07/31/15 | |
Europe and European territories | | | 70.6 | % | |
Asia | | | 32.5 | | |
Oceania | | | 4.3 | | |
The Americas | | | 2.2 | | |
Curacao | | | 1.1 | | |
Total | | | 110.7 | % | |
Top five countries
(equity investments-long holdings)1 | | 07/31/15 | |
Japan | | | 22.4 | % | |
United Kingdom | | | 19.8 | | |
Switzerland | | | 11.2 | | |
France | | | 7.8 | | |
Germany | | | 6.6 | | |
Total | | | 67.8 | % | |
Top five sectors (long holdings)1 | | 07/31/15 | |
Financials | | | 24.0 | % | |
Health Care | | | 14.9 | | |
Consumer Discretionary | | | 14.5 | | |
Industrial | | | 10.7 | | |
Information Technology | | | 9.9 | | |
Total | | | 74.0 | % | |
Top ten equity holdings (long holdings)1 | | 07/31/15 | |
Sanofi SA | | | 1.9 | % | |
Roche Holdong Ag | | | 1.8 | | |
Lululemon Athletica, Inc. | | | 1.8 | | |
Nestle SA | | | 1.7 | | |
Novartis AG | | | 1.5 | | |
GalxoSmithKline PLC | | | 1.5 | | |
Hargraves Lansdown PLC | | | 1.5 | | |
AIA Group Ltd. | | | 1.4 | | |
ARM Holdings PLC | | | 1.4 | | |
Julius Baer Group Ltd. | | | 1.3 | | |
Total | | | 15.8 | % | |
Top five countries
(equity investments-short holdings)1 | | 07/31/15 | |
Japan | | | (6.1 | )% | |
Sweden | | | (1.0 | ) | |
Australia | | | (0.7 | ) | |
Germany | | | (0.6 | ) | |
Hong Kong | | | (0.5 | ) | |
Total | | | (8.9 | )% | |
Top five sectors (short holdings)1 | | 07/31/15 | |
Financials | | | (3.1 | )% | |
Industrials | | | (1.9 | ) | |
Consumer Discretionary | | | (1.6 | ) | |
Materials | | | (1.3 | ) | |
Information Technology | | | (1.3 | ) | |
Total | | | (9.2 | )% | |
Top ten equity holdings (short holdings)1 | | 07/31/15 | |
Mitsubishi Estate Co. Ltd. | | | (0.5 | )% | |
NIDIC Corp. | | | (0.5 | ) | |
Nintendo Co. Ltd. | | | (0.4 | ) | |
Svenska Cellulosa AB SCA, Class B | | | (0.3 | ) | |
Tokyu Corp. | | | (0.3 | ) | |
Fast Retailing Co. Ltd. | | | (0.3 | ) | |
Fresenius Mdeical Care AG & Co, KGaA | | | (0.3 | ) | |
SoftBank Group Corp. | | | (0.2 | ) | |
CK Hutchison Holdings Ltd. | | | (0.2 | ) | |
Koninklijke KPN N.V. | | | (0.2 | ) | |
Total | | | (3.2 | )% | |
For a listing of defined portfolio acronyms that are used throughout the Portfolio statistics, please refer to page 254.
1 Weightings represent percentages of the Portfolio's net assets as of July 31, 2015. The Portfolio is actively managed and its composition will vary over time.
183
PACE Select Advisors Trust
PACE International Equity Investments
Industry diversification—(unaudited)
As a percentage of net assets as of July 31, 2015
Common stocks
Aerospace & defense | | | 0.32 | % | |
Air freight & logistics | | | 0.05 | | |
Airlines | | | 0.35 | | |
Auto components | | | 2.46 | | |
Automobiles | | | 2.76 | | |
Banks | | | 9.64 | | |
Beverages | | | 0.89 | | |
Biotechnology | | | 1.26 | | |
Building products | | | 1.50 | | |
Capital markets | | | 3.84 | | |
Chemicals | | | 3.13 | | |
Commercial services & supplies | | | 1.13 | | |
Communications equipment | | | 0.92 | | |
Construction & engineering | | | 0.70 | | |
Construction materials | | | 0.40 | | |
Containers & packaging | | | 0.06 | | |
Diversified financial services | | | 0.93 | | |
Diversified telecommunication services | | | 6.27 | | |
Electric utilities | | | 2.99 | | |
Electrical equipment | | | 1.52 | | |
Electronic equipment, instruments & components | | | 1.05 | | |
Energy equipment & services | | | 2.68 | | |
Food & staples retailing | | | 2.70 | | |
Food products | | | 3.55 | | |
Gas utilities | | | 0.57 | | |
Health care equipment & supplies | | | 1.68 | | |
Health care providers & services | | | 1.43 | | |
Hotels, restaurants & leisure | | | 1.65 | | |
Household durables | | | 1.32 | | |
Household products | | | 0.50 | | |
Independent power and renewable electricity producers | | | 0.15 | | |
Industrial conglomerates | | | 1.25 | | |
Insurance | | | 7.89 | | |
Internet software & services | | | 1.21 | | |
IT services | | | 0.89 | | |
Leisure products | | | 0.44 | | |
Life sciences tools & services | | | 0.11 | | |
Machinery | | | 1.30 | | |
Marine | | | 0.19 | | |
Media | | | 2.45 | | |
Metals & mining | | | 1.37 | | |
Multi-utilities | | | 2.44 | | |
Common stocks—(concluded)
Multiline retail | | | 0.54 | % | |
Oil, gas & consumable fuels | | | 4.83 | | |
Paper & forest products | | | 0.72 | | |
Personal products | | | 1.33 | | |
Pharmaceuticals | | | 10.37 | | |
Professional services | | | 0.28 | | |
Real estate investment trusts | | | 1.21 | | |
Real estate management & development | | | 0.49 | | |
Road & rail | | | 0.15 | | |
Semiconductors & semiconductor equipment | | | 3.96 | | |
Software | | | 0.87 | | |
Specialty retail | | | 0.20 | | |
Technology hardware, storage & peripherals | | | 1.01 | | |
Textiles, apparel & luxury goods | | | 2.49 | | |
Tobacco | | | 0.54 | | |
Trading companies & distributors | | | 0.59 | | |
Transportation infrastructure | | | 1.41 | | |
Wireless telecommunication services | | | 1.60 | | |
Total common stocks | | | 110.53 | | |
Preferred stocks
Automobiles | | | 0.17 | | |
Chemicals | | | 0.03 | | |
Total preferred stocks | | | 0.20 | | |
Repurchase agreement | | | 1.05 | | |
Investment of cash collateral from securities loaned | | | 2.78 | | |
Investments sold short
Common stocks
Aerospace & defense | | | (0.18 | ) | |
Auto components | | | (0.04 | ) | |
Automobiles | | | (0.08 | ) | |
Banks | | | (0.28 | ) | |
Beverages | | | (0.28 | ) | |
Building products | | | (0.10 | ) | |
Capital markets | | | (0.25 | ) | |
Chemicals | | | (0.41 | ) | |
Commercial services & supplies | | | (0.05 | ) | |
Construction & engineering | | | (0.16 | ) | |
Construction materials | | | (0.06 | ) | |
Consumer finance | | | (0.29 | ) | |
Distributors | | | (0.14 | ) | |
184
PACE Select Advisors Trust
PACE International Equity Investments
Industry diversification—(unaudited) (concluded)
As a percentage of net assets as of July 31, 2015
Investments sold short—(concluded)
Common stocks—(concluded)
Diversified financial services | | | (0.73 | )% | |
Diversified telecommunication services | | | (0.42 | ) | |
Electric utilities | | | (0.18 | ) | |
Electrical equipment | | | (0.06 | ) | |
Electronic equipment, instruments & components | | | (0.70 | ) | |
Energy equipment & services | | | (0.01 | ) | |
Food & staples retailing | | | (0.05 | ) | |
Food products | | | (0.22 | ) | |
Gas utilities | | | (0.08 | ) | |
Health care providers & services | | | (0.30 | ) | |
Hotels, restaurants & leisure | | | (0.18 | ) | |
Independent power and renewable electricity producers | | | (0.06 | ) | |
Industrial conglomerates | | | (0.10 | ) | |
Insurance | | | (0.23 | ) | |
Internet software & services | | | (0.02 | ) | |
Leisure products | | | (0.20 | ) | |
Machinery | | | (0.37 | ) | |
Media | | | (0.30 | ) | |
Metals & mining | | | (0.47 | ) | |
Multiline retail | | | (0.04 | ) | |
Oil, gas & consumable fuels | | | (0.14 | ) | |
Paper & forest products | | | (0.34 | ) | |
Personal products | | | (0.22 | ) | |
Pharmaceuticals | | | (0.21 | ) | |
Real estate investment trusts | | | (0.05 | ) | |
Real estate management & development | | | (1.49 | ) | |
Road & rail | | | (0.58 | ) | |
Semiconductors & semiconductor equipment | | | (0.02 | ) | |
Software | | | (0.47 | ) | |
Specialty retail | | | (0.43 | ) | |
Technology hardware, storage & peripherals | | | (0.04 | ) | |
Textiles, apparel & luxury goods | | | (0.16 | ) | |
Tobacco | | | (0.18 | ) | |
Trading companies & distributors | | | (0.06 | ) | |
Transportation infrastructure | | | (0.04 | ) | |
Wireless telecommunication services | | | (0.51 | ) | |
Total investments sold short | | | (11.98 | ) | |
Liabilities in excess of other assets | | | (2.58 | ) | |
Net assets | | | 100.00 | % | |
185
PACE Select Advisors Trust
PACE International Equity Investments
Portfolio of investments—July 31, 2015
| | | Number of
shares | | Value | |
Common stocks—110.53% | |
Australia—4.05% | |
AS | X | Ltd.1 | | | 20,486 | | | $ | 665,605 | | |
AusNet Services | | | 683,897 | | | | 694,853 | | |
Australia & New Zealand Banking
Group Ltd. | | | 10,532 | | | | 251,583 | | |
Coca-Cola Amatil Ltd. | | | 147,748 | | | | 1,002,206 | | |
Cochlear Ltd. | | | 24,859 | | | | 1,658,438 | | |
Commonwealth Bank of Australia | | | 19,109 | | | | 1,223,014 | | |
Computershare Ltd. | | | 301,175 | | | | 2,720,978 | | |
Federation Centres Ltd. | | | 514,419 | | | | 1,128,043 | | |
GPT Group | | | 636,470 | | | | 2,144,699 | | |
Iluka Resources Ltd.1 | | | 267,522 | | | | 1,540,896 | | |
Macquarie Group Ltd. | | | 15,100 | | | | 906,718 | | |
Medibank Pvt Ltd.* | | | 266,813 | | | | 407,606 | | |
Mirvac Group | | | 209,900 | | | | 289,976 | | |
Newcrest Mining Ltd.* | | | 280,591 | | | | 2,311,454 | | |
QBE Insurance Group Ltd.1 | | | 473,201 | | | | 5,049,938 | | |
Ramsay Health Care Ltd. | | | 9,575 | | | | 468,083 | | |
Scentre Group | | | 1,185,587 | | | | 3,431,754 | | |
Seek Ltd.1 | | | 36,198 | | | | 399,530 | | |
Sonic Healthcare Ltd. | | | 198,528 | | | | 2,999,506 | | |
Stockland | | | 1,154,097 | | | | 3,585,245 | | |
Sydney Airport | | | 629,269 | | | | 2,580,398 | | |
Telstra Corp. Ltd. | | | 15,097 | | | | 71,618 | | |
Transurban Group | | | 844,409 | | | | 6,153,689 | | |
Westpac Banking Corp. | | | 63,800 | | | | 1,625,682 | | |
Woodside Petroleum Ltd. | | | 3,513 | | | | 91,543 | | |
Total Australia common stocks | | | | | 43,403,055 | | |
Austria—0.06% | |
Andritz AG2 | | | 2,861 | | | | 159,870 | | |
OMV AG | | | 16,777 | | | | 446,354 | | |
Raiffeisen Bank International AG* | | | 4,554 | | | | 66,519 | | |
Total Austria common stocks | | | | | 672,743 | | |
Belgium—0.78% | |
Ageas | | | 5,126 | | | | 211,083 | | |
Colruyt SA2 | | | 9,946 | | | | 482,696 | | |
Delhaize Group | | | 3,449 | | | | 310,946 | | |
Groupe Bruxelles Lambert SA | | | 6,266 | | | | 517,293 | | |
KBC Groep N.V.2 | | | 81,465 | | | | 5,677,702 | | |
Proximus | | | 5,267 | | | | 198,350 | | |
Solvay SA | | | 4,509 | | | | 602,907 | | |
Telenet Group Holding N.V.* | | | 7,463 | | | | 420,959 | | |
Total Belgium common stocks | | | | | 8,421,936 | | |
Bermuda—0.76% | |
First Pacific Co. Ltd. | | | 244,000 | | | | 195,457 | | |
Jardine Matheson Holdings Ltd., ADR | | | 59,500 | | | | 3,228,470 | | |
Kerry Properties Ltd.2 | | | 308,500 | | | | 1,152,055 | | |
Kunlun Energy Co. Ltd.1 | | | 2,881,410 | | | | 2,746,749 | | |
Seadrill Ltd.1 | | | 914 | | | | 8,263 | | |
Shangri-La Asia Ltd. | | | 598,000 | | | | 771,384 | | |
Total Bermuda common stocks | | | | | 8,102,378 | | |
Brazil—0.49% | |
BB Seguridade Participacoes SA | | | 553,842 | | | | 5,216,608 | | |
| | | Number of
shares | | Value | |
Common stocks—(continued) | |
Cayman Islands—2.21% | |
Alibaba Group Holding Ltd., ADR* | | | 69,049 | | | $ | 5,409,298 | | |
Ctrip.com International Ltd., ADR* | | | 140,936 | | | | 10,088,199 | | |
Hengan International Group Co. Ltd. | | | 729,291 | | | | 8,151,525 | | |
Total Cayman Islands common stocks | | | | | 23,649,022 | | |
China—0.84% | |
Sinopharm Group Co., Class H | | | 2,340,763 | | | | 8,997,941 | | |
Curacao—1.04% | |
Schlumberger Ltd. | | | 134,294 | | | | 11,122,229 | | |
Denmark—3.55% | |
AP Moller—Maersk A/S, Class B | | | 105 | | | | 178,790 | | |
Coloplast A/S, Class B | | | 95,800 | | | | 6,908,467 | | |
Danske Bank A/S | | | 31,852 | | | | 994,723 | | |
DSV A/S | | | 40,893 | | | | 1,397,434 | | |
ISS A/S | | | 14,123 | | | | 486,366 | | |
Novo Nordisk A/S, ADR | | | 235,621 | | | | 13,892,214 | | |
Novo Nordisk A/S, Class B | | | 1,806 | | | | 105,891 | | |
Novozymes A/S, B Shares | | | 23,964 | | | | 1,250,952 | | |
Pandora A/S2 | | | 45,828 | | | | 5,152,813 | | |
TDC A/S | | | 273,963 | | | | 2,066,360 | | |
Tryg A/S1 | | | 16,695 | | | | 336,364 | | |
Vestas Wind Systems A/S2 | | | 96,712 | | | | 5,279,069 | | |
Total Denmark common stocks | | | | | 38,049,443 | | |
Finland—1.17% | |
Neste Oyj | | | 70,888 | | | | 1,970,454 | | |
Nokia Oyj | | | 131,940 | | | | 931,728 | | |
Orion Oyj, Class B | | | 17,157 | | | | 716,587 | | |
Sampo Oyj, A Shares | | | 40,822 | | | | 2,017,475 | | |
Stora Enso Oyj, R Shares | | | 138,902 | | | | 1,305,058 | | |
UPM-Kymmene Oyj2 | | | 301,003 | | | | 5,553,689 | | |
Wartsila Oyj Abp | | | 2,278 | | | | 104,626 | | |
Total Finland common stocks | | | | | 12,599,617 | | |
France—7.76% | |
Alcatel-Lucent* | | | 747,361 | | | | 2,821,054 | | |
AXA SA | | | 56,448 | | | | 1,487,857 | | |
Bureau Veritas SA | | | 17,047 | | | | 398,308 | | |
Carrefour SA | | | 46,599 | | | | 1,599,549 | | |
Casino Guichard Perrachon SA | | | 20,845 | | | | 1,547,798 | | |
Cie de Saint-Gobain | | | 178,546 | | | | 8,464,149 | | |
Cie Generale des Etablissements
Michelin | | | 5,522 | | | | 540,957 | | |
CNP Assurances | | | 41,028 | | | | 690,079 | | |
Electricite de France (EDF)2 | | | 122,771 | | | | 2,924,535 | | |
Essilor International SA | | | 7,618 | | | | 975,531 | | |
Eurazeo SA | | | 2,083 | | | | 135,361 | | |
France Telecom SA | | | 213,809 | | | | 3,506,975 | | |
Groupe Eurotunnel SA | | | 21,859 | | | | 314,127 | | |
Iliad SA1 | | | 58,617 | | | | 13,908,468 | | |
L'Oreal SA | | | 2,418 | | | | 452,376 | | |
Lagardere SCA | | | 21,926 | | | | 655,344 | | |
LVMH Moet Hennessy Louis Vuitton SE | | | 2,315 | | | | 433,996 | | |
Natixis SA | | | 392,201 | | | | 2,882,048 | | |
186
PACE Select Advisors Trust
PACE International Equity Investments
Portfolio of investments—July 31, 2015
| | | Number of
shares | | Value | |
Common stocks—(continued) | |
France—(concluded) | |
Peugeot SA* | | | 74,798 | | | $ | 1,498,771 | | |
Publicis Groupe SA | | | 13,199 | | | | 999,341 | | |
Renault SA | | | 5,440 | | | | 500,542 | | |
Rexel SA | | | 8,459 | | | | 133,359 | | |
Sanofi SA2 | | | 184,029 | | | | 19,800,713 | | |
Societe Generale SA | | | 85,896 | | | | 4,226,223 | | |
Sodexo | | | 7,024 | | | | 654,620 | | |
Technip SA | | | 12,399 | | | | 705,644 | | |
Total SA | | | 26,754 | | | | 1,324,421 | | |
Unibail-Rodamco SE | | | 570 | | | | 151,680 | | |
Valeo SA | | | 4,852 | | | | 647,438 | | |
Vallourec SA1 | | | 143,202 | | | | 2,353,571 | | |
Veolia Environnement SA2 | | | 181,750 | | | | 4,057,013 | | |
Wendel SA | | | 18,148 | | | | 2,416,640 | | |
Total France common stocks | | | | | 83,208,488 | | |
Germany—6.44% | |
adidas AG | | | 4,698 | | | | 384,234 | | |
Allianz SE2 | | | 36,103 | | | | 5,911,836 | | |
Axel Springer SE | | | 2,993 | | | | 167,509 | | |
Bayer AG | | | 2,601 | | | | 383,635 | | |
Continental AG2 | | | 5,494 | | | | 1,228,178 | | |
Daimler AG | | | 78,255 | | | | 6,994,950 | | |
Deutsche Bank AG | | | 93,378 | | | | 3,283,729 | | |
Deutsche Boerse AG | | | 5,707 | | | | 517,901 | | |
Deutsche Lufthansa AG* | | | 108,323 | | | | 1,469,227 | | |
Deutsche Telekom AG | | | 636,849 | | | | 11,505,455 | | |
Kabel Deutschland Holding AG* | | | 1,924 | | | | 260,960 | | |
Metro AG | | | 53,413 | | | | 1,686,500 | | |
ProSiebenSat.1 Media SE2 | | | 98,318 | | | | 5,026,367 | | |
RWE AG1,2 | | | 409,835 | | | | 8,529,424 | | |
SAP SE | | | 97,788 | | | | 7,008,645 | | |
Siemens AG2 | | | 50,894 | | | | 5,446,347 | | |
ThyssenKrupp AG1 | | | 171,122 | | | | 4,338,476 | | |
TUI AG | | | 19,560 | | | | 336,616 | | |
United Internet AG | | | 8,875 | | | | 438,955 | | |
Wirecard AG | | | 103,898 | | | | 4,119,228 | | |
Total Germany common stocks | | | | | 69,038,172 | | |
Hong Kong—3.55% | |
AIA Group Ltd. | | | 2,271,060 | | | | 14,794,130 | | |
BOC Hong Kong Holdings Ltd.2 | | | 394,000 | | | | 1,588,238 | | |
China Mobile Ltd. | | | 476,500 | | | | 6,238,761 | | |
| CLP Holdings Ltd.2 | | | 439,000 | | | | 3,728,977 | | |
Hang Lung Properties Ltd. | | | 580,000 | | | | 1,657,186 | | |
Hang Seng Bank Ltd.2 | | | 339,823 | | | | 6,965,401 | | |
HKT Trust/HKT Ltd. | | | 615,000 | | | | 748,888 | | |
Hong Kong & China Gas Co. Ltd. | | | 373,120 | | | | 761,420 | | |
Hysan Development Co. Ltd. | | | 189,000 | | | | 809,411 | | |
New World Development Co. Ltd. | | | 150,620 | | | | 182,050 | | |
Sino Land Co. Ltd. | | | 228,000 | | | | 354,104 | | |
Swire Properties Ltd. | | | 86,400 | | | | 278,070 | | |
Total Hong Kong common stocks | | | | | 38,106,636 | | |
| | | Number of
shares | | Value | |
Common stocks—(continued) | |
Israel—1.08% | |
Bezeq The Israeli Telecommunication
Corp. Ltd. | | | 906,673 | | | $ | 1,671,784 | | |
Delek Group Ltd. | | | 3,016 | | | | 891,279 | | |
Mizrahi Tefahot Bank Ltd. | | | 89,204 | | | | 1,142,165 | | |
Teva Pharmaceutical Industries
Ltd., ADR | | | 109,400 | | | | 7,550,788 | | |
The Israel Corp. Ltd. | | | 827 | | | | 291,517 | | |
Total Israel common stocks | | | | | 11,547,533 | | |
Italy—2.97% | |
Assicurazioni Generali SpA | | | 234,812 | | | | 4,623,832 | | |
Atlantia SpA | | | 127,948 | | | | 3,417,421 | | |
ENI SpA | | | 628,487 | | | | 11,016,170 | | |
EXOR SpA | | | 47,262 | | | | 2,380,387 | | |
Mediobanca SpA | | | 61,131 | | | | 665,665 | | |
Snam SpA | | | 913,266 | | | | 4,493,417 | | |
Telecom Italia SpA* | | | 1,455,129 | | | | 1,925,706 | | |
Terna Rete Elettrica Nazionale SpA | | | 725,363 | | | | 3,382,493 | | |
Total Italy common stocks | | | | | 31,905,091 | | |
Japan—22.36% | |
ABC-Mart, Inc.1 | | | 16,500 | | | | 991,851 | | |
Aeon Co. Ltd. | | | 16,500 | | | | 252,489 | | |
Air Water, Inc. | | | 35,000 | | | | 607,738 | | |
Alfresa Holdings Corp. | | | 9,800 | | | | 164,394 | | |
Astellas Pharma, Inc. | | | 55,100 | | | | 830,046 | | |
Bridgestone Corp.2 | | | 129,100 | | | | 4,872,956 | | |
Calbee, Inc. | | | 21,100 | | | | 941,485 | | |
Canon, Inc. | | | 311,400 | | | | 9,980,077 | | |
Central Japan Railway Co. | | | 1,000 | | | | 175,253 | | |
Chubu Electric Power Co., Inc. | | | 49,100 | | | | 833,949 | | |
Citizen Holdings Co. Ltd.1 | | | 44,400 | | | | 296,633 | | |
Dai Nippon Printing Co. Ltd. | | | 63,000 | | | | 699,972 | | |
Daicel Corp. | | | 105,300 | | | | 1,429,093 | | |
Daikin Industries Ltd.2 | | | 15,200 | | | | 983,612 | | |
Daito Trust Construction Co. Ltd. | | | 7,600 | | | | 803,018 | | |
Electric Power Development Co. Ltd.1 | | | 45,300 | | | | 1,566,228 | | |
FamilyMart Co. Ltd.1 | | | 23,800 | | | | 1,152,217 | | |
Fuji Electric Holdings Co. Ltd. | | | 147,000 | | | | 608,472 | | |
Fuji Heavy Industries Ltd.2 | | | 140,600 | | | | 5,201,525 | | |
Fujitsu Ltd. | | | 215,000 | | | | 1,128,648 | | |
Hamamatsu Photonics KK | | | 15,400 | | | | 401,356 | | |
Hino Motors Ltd.1 | | | 124,200 | | | | 1,610,436 | | |
Hirose Electric Co. Ltd.1 | | | 16,700 | | | | 1,998,314 | | |
Hisamitsu Pharmaceutical Co., Inc. | | | 5,000 | | | | 181,950 | | |
Hitachi Construction Machinery
Co. Ltd.1 | | | 5,800 | | | | 96,639 | | |
Hitachi Metals Ltd. | | | 62,000 | | | | 922,984 | | |
Hokuhoku Financial Group, Inc. | | | 784,000 | | | | 1,853,488 | | |
Hokuriku Electric Power Co.1 | | | 8,700 | | | | 133,868 | | |
Honda Motor Co. Ltd. | | | 325,000 | | | | 10,435,611 | | |
Hoya Corp. | | | 98,500 | | | | 4,170,961 | | |
Idemitsu Kosan Co. Ltd.2 | | | 56,500 | | | | 1,039,872 | | |
IHI Corp.1,2 | | | 317,000 | | | | 1,260,992 | | |
Iida Group Holdings Co. Ltd. | | | 18,300 | | | | 321,304 | | |
187
PACE Select Advisors Trust
PACE International Equity Investments
Portfolio of investments—July 31, 2015
| | | Number of
shares | | Value | |
Common stocks—(continued) | |
Japan—(continued) | |
Inpex Corp.1 | | | 262,700 | | | $ | 2,862,600 | | |
Isuzu Motors Ltd.2 | | | 116,500 | | | | 1,614,935 | | |
Itochu Corp. | | | 49,100 | | | | 602,583 | | |
Japan Airlines Co. Ltd. | | | 66,700 | | | | 2,518,707 | | |
Japan Display, Inc.*,1 | | | 229,900 | | | | 714,177 | | |
Japan Exchange Group, Inc.1 | | | 44,100 | | | | 1,537,193 | | |
JFE Holdings, Inc.1 | | | 16,307 | | | | 305,982 | | |
JX Holdings, Inc.1 | | | 277,300 | | | | 1,183,842 | | |
Kajima Corp. | | | 79,000 | | | | 392,657 | | |
Kamigumi Co. Ltd. | | | 20,000 | | | | 188,325 | | |
Kaneka Corp. | | | 88,000 | | | | 635,494 | | |
Kao Corp. | | | 111,500 | | | | 5,659,793 | | |
Kawasaki Heavy Industries Ltd. | | | 19,000 | | | | 83,399 | | |
Keyence Corp. | | | 3,400 | | | | 1,714,608 | | |
Kirin Holdings Co. Ltd.1 | | | 540,200 | | | | 8,320,828 | | |
Kobe Steel Ltd. | | | 1,667,000 | | | | 2,582,515 | | |
Koito Manufacturing Co. Ltd. | | | 3,200 | | | | 125,872 | | |
Kuraray Co. Ltd. | | | 116,000 | | | | 1,368,395 | | |
Kurita Water Industries Ltd. | | | 45,400 | | | | 993,096 | | |
Kyushu Electric Power Co., Inc.*,1 | | | 88,300 | | | | 1,252,523 | | |
Lawson, Inc.1,2 | | | 13,800 | | | | 1,027,748 | | |
Makita Corp. | | | 7,900 | | | | 436,640 | | |
Marubeni Corp.1 | | | 588,900 | | | | 3,278,662 | | |
Mazda Motor Corp1 | | | 46,200 | | | | 907,896 | | |
Medipal Holdings Corp. | | | 73,000 | | | | 1,300,553 | | |
Minebea Co. Ltd.1,2 | | | 60,000 | | | | 940,654 | | |
Miraca Holdings, Inc. | | | 23,700 | | | | 1,091,919 | | |
Mitsubishi Chemical Holdings Corp. | | | 13,200 | | | | 86,271 | | |
Mitsubishi Logistics Corp.1 | | | 61,000 | | | | 887,917 | | |
Mitsubishi Materials Corp.1 | | | 128,000 | | | | 463,727 | | |
Mitsubishi Tanabe Pharma Corp. | | | 61,000 | | | | 1,016,872 | | |
Mitsubishi UFJ Financial Group, Inc. | | | 544,900 | | | | 3,956,994 | | |
Mizuho Financial Group, Inc. | | | 993,800 | | | | 2,148,215 | | |
MS&AD Insurance Group
Holdings, Inc. | | | 18,300 | | | | 576,900 | | |
Murata Manufacturing Co. Ltd. | | | 10,400 | | | | 1,544,035 | | |
Nabtesco Corp.1 | | | 48,400 | | | | 1,064,968 | | |
Namco Bandai Holdings, Inc. | | | 82,900 | | | | 1,838,803 | | |
NGK Insulators Ltd.1 | | | 9,000 | | | | 230,928 | | |
NGK Spark Plug Co. Ltd.1 | | | 15,200 | | | | 402,889 | | |
Nippon Prologis REIT, Inc. | | | 552 | | | | 1,088,990 | | |
Nippon Yusen Kabushiki Kaisha | | | 696,000 | | | | 1,903,772 | | |
Nissin Foods Holdings Co. Ltd.1 | | | 32,600 | | | | 1,470,400 | | |
Nitori Holdings Co. Ltd. | | | 2,700 | | | | 242,474 | | |
Nitto Denko Corp.1 | | | 9,498 | | | | 719,621 | | |
Nomura Research Institute Ltd. | | | 39,400 | | | | 1,618,155 | | |
NSK Ltd. | | | 40,000 | | | | 517,045 | | |
NTT DOCOMO, Inc.1 | | | 237,700 | | | | 5,014,456 | | |
Obayashi Corp.1 | | | 192,000 | | | | 1,479,485 | | |
Odakyu Electric Railway Co. Ltd.1 | | | 8,000 | | | | 80,107 | | |
OJI Paper Corp.1 | | | 185,000 | | | | 809,053 | | |
Olympus Corp. | | | 206,125 | | | | 7,900,058 | | |
Oracle Corp. Japan | | | 3,000 | | | | 126,357 | | |
Oriental Land Co. Ltd.1 | | | 38,700 | | | | 2,457,178 | | |
Resona Holdings, Inc. | | | 602,400 | | | | 3,315,910 | | |
| | | Number of
shares | | Value | |
Common stocks—(continued) | |
Japan—(concluded) | |
Rinnai Corp.1 | | | 17,700 | | | $ | 1,252,503 | | |
Santen Pharmaceutical Co. Ltd. | | | 110,600 | | | | 1,628,636 | | |
Secom Co. Ltd. | | | 11,700 | | | | 789,031 | | |
Seiko Epson Corp. | | | 8,500 | | | | 150,405 | | |
Sekisui Chemical Co. Ltd. | | | 84,000 | | | | 933,296 | | |
Sekisui House Ltd. | | | 18,700 | | | | 278,157 | | |
Seven & I Holdings Co. Ltd. | | | 49,400 | | | | 2,281,564 | | |
Shimadzu Corp. | | | 25,000 | | | | 372,776 | | |
Shimano, Inc.1,2 | | | 21,000 | | | | 2,916,125 | | |
Shimizu Corp. | | | 37,000 | | | | 324,815 | | |
Shinsei Bank Ltd.1 | | | 974,000 | | | | 2,129,778 | | |
Shionogi & Co. Ltd. | | | 14,800 | | | | 590,519 | | |
Showa Shell Sekiyu K.K.1 | | | 120,300 | | | | 1,130,831 | | |
Sompo Japan Nipponkoa
Holdings, Inc. | | | 8,900 | | | | 313,961 | | |
Sony Corp.*,2 | | | 248,200 | | | | 7,075,407 | | |
Sumitomo Corp.2 | | | 186,000 | | | | 2,116,860 | | |
Sumitomo Mitsui Financial
Group, Inc.2 | | | 66,400 | | | | 2,970,280 | | |
Sumitomo Mitsui Trust Holdings, Inc.1 | | | 385,000 | | | | 1,788,704 | | |
Sumitomo Rubber Industries Ltd.1 | | | 109,200 | | | | 1,647,670 | | |
Suruga Bank Ltd. | | | 71,700 | | | | 1,540,623 | | |
T&D Holdings, Inc.2 | | | 370,000 | | | | 5,640,981 | | |
Taiheiyo Cement Corp.1 | | | 747,000 | | | | 2,465,187 | | |
Taisei Corp.2 | | | 275,000 | | | | 1,617,582 | | |
Takashimaya Co. Ltd. | | | 60,000 | | | | 574,656 | | |
Takeda Pharmaceutical Co. Ltd. | | | 221,200 | | | | 11,137,193 | | |
The Bank of Kyoto Ltd. | | | 50,000 | | | | 590,229 | | |
The Bank of Yokohama Ltd. | | | 54,000 | | | | 343,428 | | |
The Chiba Bank Ltd. | | | 108,000 | | | | 861,839 | | |
The Chugoku Bank Ltd. | | | 89,500 | | | | 1,399,532 | | |
The Dai-ichi Life Insurance Co. Ltd.1,2 | | | 347,400 | | | | 7,069,373 | | |
The Gunma Bank Ltd. | | | 58,000 | | | | 431,484 | | |
The Hachijuni Bank Ltd. | | | 52,000 | | | | 404,051 | | |
The Hiroshima Bank Ltd.1 | | | 88,000 | | | | 516,206 | | |
The Iyo Bank Ltd. | | | 11,400 | | | | 145,150 | | |
The Kansai Electric Power Co., Inc.* | | | 158,100 | | | | 2,145,675 | | |
The Shizuoka Bank Ltd.1 | | | 12,000 | | | | 135,749 | | |
The Yokohama Rubber Co. Ltd.1 | | | 66,000 | | | | 1,306,846 | | |
Toho Gas Co. Ltd. | | | 93,000 | | | | 556,041 | | |
Tohoku Electric Power Co., Inc.2 | | | 265,100 | | | | 3,890,886 | | |
Tokio Marine Holdings, Inc. | | | 239,400 | | | | 9,977,012 | | |
Tokyo Electron Ltd. | | | 46,100 | | | | 2,544,641 | | |
Toppan Printing Co. Ltd. | | | 11,000 | | | | 95,768 | | |
Toshiba Corp.1 | | | 229,000 | | | | 702,142 | | |
TOTO Ltd.1 | | | 5,000 | | | | 81,494 | | |
Toyo Seikan Group Holdings, Ltd.1 | | | 41,800 | | | | 651,950 | | |
Toyo Suisan Kaisha Ltd. | | | 38,500 | | | | 1,456,933 | | |
Toyoda Gosei Co. Ltd. | | | 40,400 | | | | 893,830 | | |
Trend Micro, Inc.1 | | | 44,900 | | | | 1,644,782 | | |
USS Co. Ltd. | | | 53,900 | | | | 947,659 | | |
Yahoo Japan Corp.1 | | | 222,600 | | | | 975,284 | | |
Yamaguchi Financial Group, Inc.1 | | | 128,000 | | | | 1,711,349 | | |
Total Japan common stocks | | | | | 239,697,480 | | |
188
PACE Select Advisors Trust
PACE International Equity Investments
Portfolio of investments—July 31, 2015
| | | Number of
shares | | Value | |
Common stocks—(continued) | |
Jersey—1.04% | |
Delphi Automotive PLC | | | 131,131 | | | $ | 10,238,708 | | |
Experian PLC | | | 31,110 | | | | 583,481 | | |
Glencore PLC* | | | 90,905 | | | | 295,281 | | |
Total Jersey common stocks | | | | | 11,117,470 | | |
Luxembourg—0.06% | |
Millicom International Cellular
SA, SDR | | | 8,603 | | | | 629,263 | | |
Netherlands—4.37% | |
Aegon N.V. | | | 167,313 | | | | 1,286,996 | | |
Airbus Group SE | | | 9,142 | | | | 648,597 | | |
ASML Holding N.V. | | | 8,913 | | | | 887,248 | | |
ASML Holding N.V., NY Registered
Shares1 | | | 117,949 | | | | 11,697,002 | | |
Core Laboratories N.V.1 | | | 94,273 | | | | 10,335,149 | | |
Delta Lloyd N.V. | | | 82,429 | | | | 1,463,380 | | |
Fiat Chrysler Automobiles N.V.* | | | 157,913 | | | | 2,480,021 | | |
ING Groep N.V. | | | 72,023 | | | | 1,225,248 | | |
Koninklijke Ahold N.V. | | | 464,370 | | | | 9,243,653 | | |
Koninklijke Vopak N.V. | | | 2,436 | | | | 127,346 | | |
NN Group N.V. | | | 12,214 | | | | 376,867 | | |
OCI NV* | | | 2,129 | | | | 71,466 | | |
RELX N.V. | | | 111,741 | | | | 1,861,657 | | |
STMicroelectronics N.V. | | | 261,760 | | | | 2,044,832 | | |
Unilever N.V.2 | | | 58,686 | | | | 2,630,284 | | |
Wolters Kluwer N.V. | | | 14,370 | | | | 476,297 | | |
Total Netherlands common stocks | | | | | 46,856,043 | | |
New Zealand—0.26% | |
Auckland International Airport Ltd. | | | 165,349 | | | | 590,485 | | |
Fletcher Building Ltd.1 | | | 347,803 | | | | 1,818,311 | | |
Ryman Healthcare Ltd. | | | 63,727 | | | | 353,356 | | |
Total New Zealand common stocks | | | | | 2,762,152 | | |
Norway—0.61% | |
DnB NOR ASA2 | | | 284,874 | | | | 4,645,339 | | |
Norsk Hydro ASA | | | 138,217 | | | | 515,578 | | |
Orkla ASA | | | 105,691 | | | | 843,618 | | |
Yara International ASA | | | 11,770 | | | | 585,874 | | |
Total Norway common stocks | | | | | 6,590,409 | | |
Portugal—0.07% | |
Banco Comercial Portugues SA*,1 | | | 6,002,758 | | | | 461,477 | | |
EDP-Electricidade de Portugal SA | | | 30,611 | | | | 113,227 | | |
Galp Energia, SGPS SA | | | 17,943 | | | | 207,898 | | |
Total Portugal common stocks | | | | | 782,602 | | |
Singapore—2.18% | |
Ascendas Real Estate Investment Trust | | | 388,000 | | | | 684,448 | | |
CapitaLand Mall Trust | | | 152,800 | | | | 222,765 | | |
Hutchison Port Holdings Trust1 | | | 1,629,000 | | | | 977,400 | | |
Oversea-Chinese Banking Corp. Ltd. | | | 85,000 | | | | 637,570 | | |
Sembcorp Industries Ltd.1 | | | 1,327,200 | | | | 3,453,806 | | |
Singapore Exchange Ltd. | | | 84,000 | | | | 488,012 | | |
Singapore Press Holdings Ltd.1 | | | 624,000 | | | | 1,901,316 | | |
| | | Number of
shares | | Value | |
Common stocks—(continued) | |
Singapore—(concluded) | |
Singapore Telecommunications Ltd. | | | 2,457,900 | | | $ | 7,327,923 | | |
StarHub Ltd. | | | 360,300 | | | | 1,005,904 | | |
United Overseas Bank Ltd. | | | 413,632 | | | | 6,693,611 | | |
Total Singapore common stocks | | | | | 23,392,755 | | |
South Korea—0.58% | |
NAVER Corp. | | | 13,813 | | | | 6,173,738 | | |
Spain—4.89% | |
ACS Actividades de Contruccion y
Servicios SA2 | | | 109,178 | | | | 3,663,092 | | |
Banco Bilbao Vizcaya Argentaria SA | | | 35,936 | | | | 363,647 | | |
Banco Santander SA2 | | | 1,485,750 | | | | 10,253,765 | | |
Bankinter SA | | | 160,212 | | | | 1,237,477 | | |
Distribuidora Internacional de
Alimentacion SA*,1 | | | 168,514 | | | | 1,054,717 | | |
Gas Natural SDG, SA | | | 13,784 | | | | 299,511 | | |
Grifols SA, ADR | | | 361,998 | | | | 11,746,835 | | |
Iberdrola SA | | | 1,724,388 | | | | 12,165,836 | | |
Red Electrica Corp. SA | | | 10,111 | | | | 808,068 | | |
Repsol SA | | | 5,296 | | | | 88,990 | | |
Telefonica SA | | | 700,628 | | | | 10,726,344 | | |
Total Spain common stocks | | | | | 52,408,282 | | |
Sweden—3.62% | |
Alfa Laval AB1 | | | 65,290 | | | | 1,201,092 | | |
Assa Abloy AB | | | 13,110 | | | | 266,098 | | |
Atlas Copco AB | | | 1,854 | | | | 50,677 | | |
Electrolux AB, Series B2 | | | 49,066 | | | | 1,411,108 | | |
Husqvarna AB, B Shares | | | 226,702 | | | | 1,654,260 | | |
ICA Gruppen AB1 | | | 2,370 | | | | 86,484 | | |
Nordea Bank AB | | | 42,531 | | | | 529,989 | | |
Securitas AB, B Shares | | | 92,290 | | | | 1,323,357 | | |
Skandinaviska Enskilda Banken AB,
Class A2 | | | 189,903 | | | | 2,289,380 | | |
Svenska Handelsbanken AB2 | | | 367,254 | | | | 5,619,443 | | |
Swedbank AB, A Shares2 | | | 231,981 | | | | 5,437,338 | | |
Swedish Match AB2 | | | 52,419 | | | | 1,605,975 | | |
Telefonaktiebolaget LM Ericsson,
B Shares | | | 568,415 | | | | 6,081,630 | | |
TeliaSonera AB | | | 1,853,001 | | | | 11,266,109 | | |
Total Sweden common stocks | | | | | 38,822,940 | | |
Switzerland—11.22% | |
ABB Ltd.* | | | 514,076 | | | | 10,443,249 | | |
Actelion Ltd.* | | | 3,312 | | | | 489,791 | | |
Adecco SA* | | | 16,750 | | | | 1,398,000 | | |
Aryzta AG*,2 | | | 40,505 | | | | 2,056,898 | | |
Cie Financiere Richemont SA | | | 2,969 | | | | 256,250 | | |
Credit Suisse Group AG* | | | 127,222 | | | | 3,749,646 | | |
EMS-Chemie Holding AG | | | 1,545 | | | | 753,873 | | |
Geberit AG2 | | | 18,190 | | | | 6,296,756 | | |
Julius Baer Group Ltd.* | | | 255,259 | | | | 14,119,418 | | |
Lonza Group AG*,2 | | | 8,417 | | | | 1,220,347 | | |
Nestle SA2 | | | 239,764 | | | | 18,162,811 | | |
Novartis AG2 | | | 157,842 | | | | 16,400,017 | | |
189
PACE Select Advisors Trust
PACE International Equity Investments
Portfolio of investments—July 31, 2015
| | | Number of
shares | | Value | |
Common stocks—(continued) | |
Switzerland—(concluded) | |
Roche Holding AG2 | | | 66,711 | | | $ | 19,268,385 | | |
Schindler Holding AG | | | 3,866 | | | | 622,929 | | |
Sika AG | | | 511 | | | | 1,852,461 | | |
Sonova Holding AG | | | 4,274 | | | | 608,613 | | |
Swiss Life Holding AG* | | | 1,455 | | | | 343,611 | | |
Swiss Re AG | | | 10,204 | | | | 918,708 | | |
Swisscom AG | | | 1,817 | | | | 1,056,767 | | |
Syngenta AG | | | 25,980 | | | | 10,700,652 | | |
Zurich Insurance Group AG* | | | 31,623 | | | | 9,631,221 | | |
Total Switzerland common stocks | | | | | 120,350,403 | | |
Taiwan—0.98% | |
Taiwan Semiconductor
Manufacturing Co. Ltd. | | | 845,000 | | | | 3,733,668 | | |
Taiwan Semiconductor
Manufacturing Co. Ltd., ADR | | | 307,089 | | | | 6,789,738 | | |
Total Taiwan common stocks | | | | | 10,523,406 | | |
United Kingdom—19.79% | |
| | 3 | i Group PLC | | | 95,719 | | | | 827,370 | | |
Aberdeen Asset Management PLC | | | 25,341 | | | | 144,049 | | |
Admiral Group PLC2 | | | 86,338 | | | | 1,996,830 | | |
AMEC PLC | | | 515,485 | | | | 6,601,062 | | |
ARM Holdings PLC | | | 940,301 | | | | 14,787,008 | | |
Ashtead Group PLC | | | 15,334 | | | | 235,033 | | |
Associated British Foods PLC | | | 10,692 | | | | 538,317 | | |
AstraZeneca PLC | | | 24,429 | | | | 1,648,061 | | |
BAE Systems PLC | | | 29,680 | | | | 222,572 | | |
Barclays PLC | | | 299,457 | | | | 1,351,267 | | |
Barratt Developments PLC | | | 73,656 | | | | 730,408 | | |
BG Group PLC | | | 512,974 | | | | 8,751,868 | | |
| BP PLC | | | 1,277,016 | | | | 7,886,274 | | |
British American Tobacco PLC | | | 70,572 | | | | 4,189,037 | | |
BT Group PLC | | | 146,686 | | | | 1,063,926 | | |
Burberry Group PLC | | | 65,614 | | | | 1,648,681 | | |
Capita PLC | | | 12,983 | | | | 264,385 | | |
Centrica PLC | | | 512,410 | | | | 2,132,548 | | |
Compass Group PLC2 | | | 60,240 | | | | 964,257 | | |
Croda International PLC | | | 290,760 | | | | 13,803,594 | | |
Diageo PLC | | | 9,513 | | | | 265,848 | | |
Direct Line Insurance Group PLC | | | 267,190 | | | | 1,526,745 | | |
easyJet PLC | | | 87,868 | | | | 2,255,883 | | |
G4S PLC | | | 2,034,381 | | | | 8,727,199 | | |
GKN PLC | | | 887,753 | | | | 4,415,557 | | |
GlaxoSmithKline PLC | | | 733,026 | | | | 15,980,440 | | |
Hargreaves Lansdown PLC | | | 835,209 | | | | 15,625,572 | | |
HSBC Holdings PLC2 | | | 512,458 | | | | 4,639,226 | | |
ICAP PLC | | | 186,712 | | | | 1,506,005 | | |
IMI PLC2 | | | 100,093 | | | | 1,658,452 | | |
Inmarsat PLC | | | 16,089 | | | | 223,114 | | |
InterContinental Hotels Group PLC2 | | | 19,384 | | | | 816,713 | | |
Investec PLC | | | 40,054 | | | | 366,232 | | |
Land Securities Group PLC | | | 11,667 | | | | 236,493 | | |
Legal & General Group PLC | | | 603,817 | | | | 2,458,274 | | |
Lloyds Banking Group PLC | | | 3,892,577 | | | | 5,057,600 | | |
| | | Number of
shares | | Value | |
Common stocks—(concluded) | |
United Kingdom—(concluded) | |
London Stock Exchange Group PLC | | | 27,976 | | | $ | 1,140,713 | | |
Lonmin PLC*,1 | | | 980 | | | | 798 | | |
National Grid PLC | | | 856,534 | | | | 11,411,126 | | |
Next PLC2 | | | 41,406 | | | | 5,166,471 | | |
Pearson PLC | | | 241,559 | | | | 4,538,087 | | |
Persimmon PLC* | | | 15,963 | | | | 510,289 | | |
Prudential PLC | | | 13,410 | | | | 315,697 | | |
Reckitt Benckiser Group PLC2 | | | 56,287 | | | | 5,405,010 | | |
RELX PLC2 | | | 258,184 | | | | 4,507,701 | | |
Rio Tinto PLC | | | 21,719 | | | | 843,359 | | |
Royal Dutch Shell PLC, A Shares3 | | | 66,346 | | | | 1,906,411 | | |
Royal Dutch Shell PLC, A Shares4 | | | 282,090 | | | | 8,110,708 | | |
Royal Mail PLC | | | 64,061 | | | | 505,207 | | |
Sky PLC2 | | | 303,144 | | | | 5,396,818 | | |
Smiths Group PLC | | | 25,721 | | | | 453,488 | | |
Tesco PLC | | | 2,445,254 | | | | 8,236,791 | | |
The Sage Group PLC | | | 66,093 | | | | 537,746 | | |
The Weir Group PLC | | | 21,675 | | | | 520,256 | | |
Unilever PLC | | | 248,746 | | | | 11,292,370 | | |
Vodafone Group PLC | | | 1,114,741 | | | | 4,210,212 | | |
Whitbread PLC | | | 19,692 | | | | 1,596,030 | | |
Total United Kingdom common stocks | | | | | 212,151,188 | | |
United States—1.75% | |
Lululemon Athletica, Inc.* | | | 299,037 | | | | 18,797,466 | | |
Total common stocks
(cost—$1,126,872,154) | | | | | 1,185,096,489 | | |
Preferred stocks—0.20% | |
Germany—0.20% | |
Fuchs Petrolub SE | | | 7,959 | | | | 345,924 | | |
Porsche Automobil Holding SE | | | 24,343 | | | | 1,831,061 | | |
Total preferred stocks
(cost—$2,393,703) | | | | | 2,176,985 | | |
| | | Face
amount | | | |
Repurchase agreement—1.05% | |
Repurchase agreement dated
07/31/15 with State Street
Bank and Trust Co., 0.000%
due 08/03/15, collateralized by
$3,238,510 Federal Home Loan
Mortgage Corp. obligations,
2.080% due 10/17/22, $812,704
Federal National Mortgage
Association obligations, 2.170%
due 10/17/22 and $7,246,541
US Treasury Notes, 1.625% to
3.625% due 03/31/19 to 06/30/20;
(value—$11,487,427); proceeds:
$11,262,000
(cost—$11,262,000) | | $ | 11,262,000 | | | | 11,262,000 | | |
190
PACE Select Advisors Trust
PACE International Equity Investments
Portfolio of investments—July 31, 2015
| | | Number of
shares | | Value | |
Investment of cash collateral from securities loaned—2.78% | |
Money market fund—2.78% | |
UBS Private Money Market Fund LLC5
(cost—$29,746,054) | | | 29,746,054 | | | $ | 29,746,054 | | |
Total investments before
investments sold short
(cost—$1,170,273,911)—114.56% | | | | | 1,228,281,528 | | |
Investments sold short—(11.98)% | |
Common stocks—(11.98)% | |
Australia—(0.67)% | |
Bendigo and Adelaide Bank Ltd. | | | (34,457 | ) | | | (330,948 | ) | |
BHP Billiton Ltd. | | | (47,942 | ) | | | (926,893 | ) | |
Brambles Ltd. | | | (37,628 | ) | | | (299,246 | ) | |
CIMIC Group Ltd. | | | (45,655 | ) | | | (794,242 | ) | |
Flight Centre Travel Group Ltd. | | | (13,479 | ) | | | (350,945 | ) | |
Harvey Norman Holdings Ltd. | | | (114,609 | ) | | | (373,630 | ) | |
Incitec Pivot Ltd. | | | (111,980 | ) | | | (296,303 | ) | |
Insurance Australia Group Ltd. | | | (212,655 | ) | | | (915,542 | ) | |
Origin Energy Ltd. | | | (24,554 | ) | | | (203,527 | ) | |
Platinum Asset Management Ltd. | | | (149,104 | ) | | | (826,126 | ) | |
QBE Insurance Group Ltd. | | | (144,138 | ) | | | (1,538,222 | ) | |
Santos Ltd. | | | (38,081 | ) | | | (205,981 | ) | |
South32 Ltd. | | | (81,836 | ) | | | (106,775 | ) | |
WorleyParsons Ltd. | | | (11,435 | ) | | | (76,897 | ) | |
Total Australia common stocks | | | | | (7,245,277 | ) | |
Bermuda—(0.08)% | |
Cheung Kong Infrastructure
Holdings Ltd. | | | (101,000 | ) | | | (878,765 | ) | |
Cayman Islands—(0.35)% | |
Cheung Kong Property Holdings Ltd. | | | (160,624 | ) | | | (1,338,481 | ) | |
CK Hutchison Holdings Ltd. | | | (160,624 | ) | | | (2,384,818 | ) | |
Total Cayman Islands common stocks | | | | | (3,723,299 | ) | |
Finland—(0.03)% | |
Metso Oyj | | | (11,062 | ) | | | (303,843 | ) | |
France—(0.46)% | |
Arkema SA | | | (3,343 | ) | | | (260,600 | ) | |
Dassault Systemes | | | (4,128 | ) | | | (311,774 | ) | |
Iliad SA | | | (4,468 | ) | | | (1,060,154 | ) | |
Numericable-SFR | | | (3,830 | ) | | | (208,822 | ) | |
Vivendi SA | | | (41,208 | ) | | | (1,083,219 | ) | |
Zodiac SA | | | (66,265 | ) | | | (1,975,857 | ) | |
Total France common stocks | | | | | (4,900,426 | ) | |
Germany—(0.65)% | |
E.ON SE | | | (12,949 | ) | | | (170,797 | ) | |
Fraport AG Frankfurt Airport Services
Worldwide | | | (7,079 | ) | | | (464,838 | ) | |
Fresenius Medical Care AG &
Co. KGaA | | | (35,347 | ) | | | (2,885,480 | ) | |
Infineon Technologies AG | | | (15,931 | ) | | | (178,549 | ) | |
K+S AG | | | (22,148 | ) | | | (908,747 | ) | |
Lanxess AG | | | (2,791 | ) | | | (161,016 | ) | |
MAN SE | | | (14,737 | ) | | | (1,536,596 | ) | |
| | | Number of
shares | | Value | |
Investments sold short—(continued) | |
Common stocks—(continued) | |
Germany—(concluded) | |
Merck KGaA | | | (6,404 | ) | | $ | (651,415 | ) | |
Total Germany common stocks | | | | | (6,957,438 | ) | |
Hong Kong—(0.50)% | |
Galaxy Entertainment Group Ltd. | | | (10,000 | ) | | | (46,051 | ) | |
Hong Kong Exchanges & Clearing Ltd. | | | (48,810 | ) | | | (1,323,460 | ) | |
PCCW Ltd. | | | (866,000 | ) | | | (518,329 | ) | |
Power Assets Holdings Ltd. | | | (66,500 | ) | | | (626,630 | ) | |
SJM Holdings Ltd. | | | (1,277,000 | ) | | | (1,482,528 | ) | |
The Bank of East Asia Ltd. | | | (151,200 | ) | | | (612,422 | ) | |
Wheelock & Co. Ltd. | | | (138,000 | ) | | | (714,717 | ) | |
Total Hong Kong common stocks | | | | | (5,324,137 | ) | |
Ireland—(0.06)% | |
James Hardie Industries PLC | | | (43,889 | ) | | | (609,212 | ) | |
Italy—(0.22)% | |
Enel Green Power SpA | | | (310,502 | ) | | | (644,848 | ) | |
Luxottica Group SpA | | | (24,313 | ) | | | (1,763,652 | ) | |
Total Italy common stocks | | | | | (2,408,500 | ) | |
Japan—(6.07)% | |
Advantest. Corp. | | | (9,400 | ) | | | (82,293 | ) | |
Aeon Financial Service Co. Ltd. | | | (59,600 | ) | | | (1,553,298 | ) | |
Asahi Glass Co. Ltd. | | | (186,000 | ) | | | (1,091,072 | ) | |
Asahi Group Holdings Ltd. | | | (3,000 | ) | | | (100,625 | ) | |
Brother Industries Ltd. | | | (4,700 | ) | | | (65,000 | ) | |
Canon, Inc. | | | (12,500 | ) | | | (400,613 | ) | |
Chiyoda Corp. | | | (36,000 | ) | | | (290,475 | ) | |
Credit Saison Co. Ltd. | | | (68,800 | ) | | | (1,524,386 | ) | |
Daihatsu Motor Co. Ltd. | | | (62,300 | ) | | | (885,727 | ) | |
Dentsu, Inc. | | | (8,200 | ) | | | (465,131 | ) | |
Fast Retailing Co. Ltd. | | | (6,400 | ) | | | (3,169,145 | ) | |
Hikari Tsushin, Inc. | | | (1,900 | ) | | | (132,763 | ) | |
Ibiden Co. Ltd. | | | (69,400 | ) | | | (1,149,620 | ) | |
Japan Tobacco, Inc. | | | (48,300 | ) | | | (1,875,919 | ) | |
JGC Corp. | | | (38,000 | ) | | | (649,712 | ) | |
Kakaku.com, Inc. | | | (11,600 | ) | | | (184,668 | ) | |
Kao Corp. | | | (18,500 | ) | | | (939,069 | ) | |
Keikyu Corp. | | | (65,000 | ) | | | (535,482 | ) | |
Keio Corp. | | | (76,000 | ) | | | (633,461 | ) | |
Kirin Holdings Co. Ltd. | | | (83,800 | ) | | | (1,290,791 | ) | |
Komatsu Ltd. | | | (51,400 | ) | | | (951,814 | ) | |
Kyowa Hakko Kirin Co. Ltd. | | | (25,000 | ) | | | (407,068 | ) | |
Mabuchi Motor Co. Ltd. | | | (10,800 | ) | | | (647,468 | ) | |
Mitsubishi Estate Co. Ltd. | | | (244,000 | ) | | | (5,423,972 | ) | |
Mitsubishi Gas Chemical Co., Inc. | | | (247,000 | ) | | | (1,371,170 | ) | |
Mitsubishi UFJ Lease & Finance
Co. Ltd. | | | (290,700 | ) | | | (1,559,814 | ) | |
Mitsui & Co. Ltd. | | | (53,400 | ) | | | (694,349 | ) | |
NIDEC Corp. | | | (58,400 | ) | | | (5,232,840 | ) | |
Nikon Corp. | | | (71,300 | ) | | | (847,995 | ) | |
Nintendo Co. Ltd. | | | (27,100 | ) | | | (4,769,040 | ) | |
NTT DOCOMO, Inc. | | | (103,900 | ) | | | (2,191,847 | ) | |
NTT Urban Development Corp. | | | (72,400 | ) | | | (712,112 | ) | |
191
PACE Select Advisors Trust
PACE International Equity Investments
Portfolio of investments—July 31, 2015
| | | Number of
shares | | Value | |
Investments sold short—(continued) | |
Common stocks—(continued) | |
Japan—(concluded) | |
Ono Pharmaceutical Co. Ltd. | | | (1,600 | ) | | $ | (193,004 | ) | |
Osaka Gas Co. Ltd. | | | (208,000 | ) | | | (832,269 | ) | |
Otsuka Holdings Co. Ltd. | | | (27,000 | ) | | | (970,113 | ) | |
Sankyo Co. Ltd. | | | (31,400 | ) | | | (1,193,319 | ) | |
Sega Sammy Holdings, Inc. | | | (10,400 | ) | | | (129,984 | ) | |
Shin-Etsu Chemical Co. Ltd. | | | (12,200 | ) | | | (730,120 | ) | |
Shiseido Co. Ltd. | | | (56,700 | ) | | | (1,372,722 | ) | |
SoftBank Group Corp. | | | (45,700 | ) | | | (2,537,312 | ) | |
Sumitomo Metal Mining Co. Ltd. | | | (70,000 | ) | | | (942,954 | ) | |
Sumitomo Realty & Development
Co. Ltd. | | | (67,000 | ) | | | (2,351,095 | ) | |
Suntory Beverage & Food Ltd. | | | (37,200 | ) | | | (1,572,825 | ) | |
Suzuken Co. Ltd. | | | (8,310 | ) | | | (294,355 | ) | |
Taiyo Nippon Sanso Corp. | | | (61,200 | ) | | | (719,971 | ) | |
TDK Corp. | | | (16,700 | ) | | | (1,170,961 | ) | |
The Chugoku Electric Power Co., Inc. | | | (15,600 | ) | | | (233,493 | ) | |
Tobu Railway Co. Ltd. | | | (270,000 | ) | | | (1,300,601 | ) | |
Tokyu Corp. | | | (487,000 | ) | | | (3,583,685 | ) | |
Tokyu Fudosan Holdings Corp. | | | (234,700 | ) | | | (1,772,536 | ) | |
Toyota Industries Corp. | | | (7,200 | ) | | | (399,113 | ) | |
Yakult Honsha Co. Ltd. | | | (14,100 | ) | | | (936,322 | ) | |
Total Japan common stocks | | | | | (65,065,493 | ) | |
Jersey—(0.17)% | |
Randgold Resources Ltd. | | | (30,888 | ) | | | (1,862,885 | ) | |
Luxembourg—(0.14)% | |
Altice SA | | | (11,786 | ) | | | (1,488,558 | ) | |
Mauritius—(0.06)% | |
Golden Agri-Resources Ltd. | | | (2,799,400 | ) | | | (642,790 | ) | |
Netherlands—(0.22)% | |
Koninklijke KPN N.V. | | | (599,149 | ) | | | (2,368,857 | ) | |
New Zealand—(0.05)% | |
Spark New Zealand Ltd. | | | (273,747 | ) | | | (534,873 | ) | |
Norway—(0.06)% | |
Statoil ASA | | | (37,559 | ) | | | (635,451 | ) | |
Singapore—(0.41)% | |
CapitaLand Commercial Trust | | | (378,800 | ) | | | (393,476 | ) | |
CapitaLand Ltd. | | | (221,100 | ) | | | (518,965 | ) | |
City Developments Ltd. | | | (79,700 | ) | | | (542,042 | ) | |
| | | Number of
shares | | Value | |
Investments sold short—(concluded) | |
Common stocks—(concluded) | |
Singapore—(concluded) | |
ComfortDelGro Corp. Ltd. | | | (87,600 | ) | | $ | (192,205 | ) | |
Jardine Cycle & Carriage Ltd. | | | (67,900 | ) | | | (1,462,583 | ) | |
Keppel Corp. Ltd. | | | (183,000 | ) | | | (1,000,474 | ) | |
Sembcorp Industries Ltd. | | | (15,100 | ) | | | (39,295 | ) | |
UOL Group Ltd. | | | (49,500 | ) | | | (241,754 | ) | |
Total Singapore common stocks | | | | | (4,390,794 | ) | |
Spain—(0.32)% | |
Banco Popular Espanol SA | | | (446,693 | ) | | | (2,050,138 | ) | |
Industria de Diseno Textil SA | | | (39,230 | ) | | | (1,343,155 | ) | |
Total Spain common stocks | | | | | (3,393,293 | ) | |
Sweden—(0.98)% | |
Boliden AB | | | (14,756 | ) | | | (272,482 | ) | |
Industrivarden AB, C Shares | | | (105,035 | ) | | | (1,985,824 | ) | |
Investment AB Kinnevik, B Shares | | | (49,238 | ) | | | (1,575,867 | ) | |
Investor AB, B Shares | | | (36,012 | ) | | | (1,389,677 | ) | |
Lundin Petroleum AB | | | (30,212 | ) | | | (438,116 | ) | |
Sandvik AB | | | (49,002 | ) | | | (495,317 | ) | |
Svenska Cellulosa AB SCA, Class B | | | (126,910 | ) | | | (3,613,075 | ) | |
Tele2 AB, B Shares | | | (71,204 | ) | | | (740,784 | ) | |
Total Sweden common stocks | | | | | (10,511,142 | ) | |
Switzerland—(0.23)% | |
Partners Group Holding AG | | | (5,399 | ) | | | (1,807,489 | ) | |
Sulzer AG | | | (6,143 | ) | | | (630,638 | ) | |
Total Switzerland common stocks | | | | | (2,438,127 | ) | |
United Kingdom—(0.25)% | |
Aggreko PLC | | | (13,588 | ) | | | (254,635 | ) | |
Fresnillo PLC | | | (92,977 | ) | | | (939,429 | ) | |
Hammerson PLC | | | (16,010 | ) | | | (164,513 | ) | |
J Sainsbury PLC | | | (137,805 | ) | | | (570,073 | ) | |
Tate & Lyle PLC | | | (95,624 | ) | | | (813,856 | ) | |
Total United Kingdom common stocks | | | | | (2,742,506 | ) | |
Total investments sold short
(proceeds—$124,090,046) | | | | | (128,425,666 | ) | |
Liabilities in excess of
other assets—(2.58)% | | | | | (27,660,111 | ) | |
Net assets—100.00% | | | | $ | 1,072,195,751 | | |
For a listing of defined portfolio acronyms that are used throughout the Portfolio of investments as well as the tables that follow please refer to page 254.
Aggregate cost for federal income tax purposes before investments sold short was $1,180,948,283; and net unrealized appreciation consisted of:
Gross unrealized appreciation | | $ | 110,403,617 | | |
Gross unrealized depreciation | | | (63,070,372 | ) | |
Net unrealized appreciation | | $ | 47,333,245 | | |
192
PACE Select Advisors Trust
PACE International Equity Investments
Portfolio of investments—July 31, 2015
Fair valuation summary
The following is a summary of the fair valuations according to the inputs used as of July 31, 2015 in valuing the Portfolio's investments:
Assets
Description | | Unadjusted
quoted prices in
active markets for
identical investments
(Level 1) | | Other significant
observable inputs
(Level 2) | | Unobservable
inputs
(Level 3) | | Total | |
Common stocks | | $ | 1,185,096,489 | | | $ | — | | | $ | — | | | $ | 1,185,096,489 | | |
Preferred stocks | | | 2,176,985 | | | | — | | | | — | | | | 2,176,985 | | |
Repurchase agreement | | | — | | | | 11,262,000 | | | | — | | | | 11,262,000 | | |
Investment of cash collateral from securities loaned | | | — | | | | 29,746,054 | | | | — | | | | 29,746,054 | | |
Total | | $ | 1,187,273,474 | | | $ | 41,008,054 | | | $ | — | | | $ | 1,228,281,528 | | |
Liabilities | |
Investments sold short | | $ | (128,425,666 | ) | | $ | — | | | $ | — | | | $ | (128,425,666 | ) | |
At July 31, 2015, there were no transfers between Level 1 and Level 2. At July 31, 2014, $1,102,127,389 of foreign invetments and $(132,265,689) of foreign investment sold short were classified within Level 2 of the fair value hierarchy pursuant to the Portfolio's fair valuation procedures for foreign portfolio holdings.
The following is a rollforward of the Portfolio's investments that was valued using unobservable inputs (Level 3) for the year ended July 31, 2015:
| | Common
stocks | |
Beginning balance | | $ | 41 | | |
Purchases | | | — | | |
Sales | | | 0 | | |
Accrued discounts/(premiums) | | | — | | |
Total realized gain/(loss) | | | (286 | ) | |
Net change in unrealized appreciation/depreciation | | | 245 | | |
Transfers into Level 3 | | | — | | |
Transfers out of Level 3 | | | — | | |
Ending balance | | $ | — | | |
The change in net unrealized appreciation/depreciation relating to the Level 3 investments held at July 31, 2015, was $0.
Portfolio footnotes
* Non-income producing security.
1 Security, or portion thereof, was on loan at July 31, 2015.
2 Security, or portion thereof, pledged as collateral for investments sold short.
3 Security is traded on the London Exchange.
4 Security is traded on the Amsterdam Exchange.
5 The table below details the Portfolio's transaction activity in an affiliated issuer during the year ended July 31, 2015. The investment manager earns a management fee from UBS Private Money Market Fund LLC. Please see the Notes to financial statements for further information.
Security description | | Value at
07/31/14 | | Purchases
during the
year ended
07/31/15 | | Sales
during the
year ended
07/31/15 | | Value at
07/31/15 | | Net income
earned from
affiliate for the
year ended
07/31/15 | |
UBS Private Money Market Fund LLC | | $ | 24,717,606 | | | $ | 605,580,450 | | | $ | 600,552,002 | | | $ | 29,746,054 | | | $ | 4,152 | | |
See accompanying notes to financial statements.
193
PACE Select Advisors Trust
PACE International Emerging Markets Equity Investments
Performance (unaudited)
For the 12 months ended July 31, 2015, the Portfolio's Class P shares declined 12.33% before the deduction of the maximum PACE Select program fee.1 In comparison, the MSCI Emerging Markets Index (net) (the "benchmark") fell 13.38% and the Lipper Emerging Markets Funds category posted a median return of -12.76%. (Returns for all share classes over various time periods are shown in the "Performance at a glance" table on page 198. Please note that the returns shown do not reflect the deduction of taxes that a shareholder would pay on Portfolio distributions or the redemption of Portfolio shares.) For a detailed commentary on the market environment in general during the reporting period, please refer to page 2.
Sub-advisors' Comments2
Mondrian
Our portion of the Portfolio outperformed the benchmark during the reporting period. Top-down allocation from a country, currency and sector basis contributed to performance, while stock selection detracted somewhat from results. The reporting period was marked by weakness in emerging market currencies—particularly in countries running current account deficits or with significant commodity exposure. Speculation surrounding the timing of Federal Reserve Board interest rate hikes drove down interest rate-exposed currencies. In addition, an apparent shift in Saudi oil production policy, coupled with protracted economic weakness in China, left most commodity prices (i.e. oil and gas, to iron ore and gold) down sharply. Regardless of the slowing pace of long-term Chinese growth, a protracted rally in Chinese equities—spurred by looser monetary policy and stimulus measures and a raft of reforms in the financial sector—took hold from late 2014. The rally sharply reversed, however, leaving the Chinese component of the benchmark only marginally up over the period.
Positioning in India was a positive driver of performance in our portion of the Portfolio. In particular, our exposure to Axis Bank, mortgage lender Housing Development Finance Corporation (HDFC), technology consultant Infosys and
1 Class P shares held through the PACE Select Advisors Program are subject to a maximum Program fee of 2.50%, which, if included, would have reduced performance. Class P shares held through other advisory programs also may be subject to a program fee, which, if included, would have reduced performance.
2 All Sub-advisors discuss performance on a gross-of-fees basis—meaning that no fees or expenses are reflected in their sleeves'/sleeve's performance. Alternately, Portfolio performance is shown net of fees, which does factor in fees and expenses associated with the Portfolio.
PACE Select Advisors Trust – PACE International Emerging Markets Equity Investments
Investment Sub-Advisors:
Mondrian Investment Partners Limited ("Mondrian"); William Blair & Company L.L.C. ("William Blair");
LMCG Investments, LLC, formerly Lee Munder Capital Group ("LMCG")
Portfolio Managers:
Mondrian: Ginny Chong, Gregory Halton and Andrew Miller;
William Blair: Todd M. McClone and Jeffrey A. Urbina;
LMCG: Gordon Johnson, Shannon Ericson and Vikram Srimurthy
Objective:
Capital appreciation
Investment process:
Mondrian conducts research on a global basis in an effort to identify securities that have the potential for capital appreciation over a market cycle. The center of its research effort is a value-oriented dividend discount methodology toward individual securities and market analysis that attempts to identify value across country boundaries. This approach focuses on future anticipated dividends and discounts the value of those dividends back to what they would be worth if they were being paid today. Comparisons of the values of different possible investments are then made. In an international portfolio, currency returns can be an integral component of an investment's total return. Mondrian uses a purchasing power parity approach to assess the value of individual currencies. Purchasing power parity attempts to identify the amount of goods and services that a dollar will buy in the United States,
194
PACE Select Advisors Trust
PACE International Emerging Markets Equity Investments
Sub-advisors' Comments – continued
engineering company Larsen & Toubro all contributed to performance. An overall overweight exposure to the rising Indian market was also additive for results. Elsewhere in Asia, positioning in Thailand added value as energy company PTT outperformed. Positioning in China was the most significant detractor from relative results given our underweight exposure. Stock selection was also negative in China, primarily due to the outperformance of the financials and technology sectors, to which we had no exposure. Stock selection was also weak in Taiwan, as technology stocks Teco, Mediatek and Quanta underperformed given the continuation of a sustained period of weakness in their respective end-markets. In the Europe, Middle East and Africa (EMEA) region, strong stock selection in Turkey and Qatar aided returns. In particular, Turkish refiner Tupras and utility Qatar Electricity & Water Co. both outperformed. Positioning in Latin America had a neutral impact on returns, although Brazilian miner Vale and toll road operators CCR and Ecorodovias underperformed. Out-of-benchmark positions in global consumer goods company Unilever and US-listed fast food chain operator Yum! Brands also aided returns.
Derivatives were not used during the review period.
William Blair
Our portion of the Portfolio significantly outperformed the benchmark during the reporting period. Despite pronounced style headwinds earlier in the period when lower quality/valuation stocks led the market, strong stock selection across regions and most sectors drove our outperformance. Sectoral top-down positioning was also a contributor.
Stock selection and an overweight to India was the biggest driver of outperformance. The weighting has since been decreased, as valuation sensitivity in April supported a rotation out of India—as corporate earnings fell short of lofty expectations—and into China, where a variety of stimulus measures were being unleashed by the government to quell the economic downturn. From a sector perspective, our performance was bolstered by a combination of consumer discretionary and industrials stock selection and overall positioning, notably underweights to energy and materials and overweights to health care and industrials.
The Chinese machinery company China CNR Corp. was our top contributor to results. China CNR is one of two leading rolling stock manufacturers in China. The company focuses
Investment process (concluded)
and compares that to the amount of a foreign currency required to buy the same amount of goods and services in another country.
William Blair invests in a portfolio of mid cap and large cap equity securities issued by companies in emerging markets worldwide, according to a quality growth philosophy. William Blair's primary focus is on identifying such companies whose growth characteristics (rate and durability) are underestimated by the market and supported by quality management and strong competitive positioning. After screening the universe of emerging country issuers for certain quality, growth and liquidity characteristics to create a prospective list of investible securities, William Blair undertakes detailed fundamental analysis of these companies, focusing attention on areas where short- to intermediate-term earnings trends and overall operating performance are improving or are strong. Key considerations are the sustainability of a company's competitive advantage relative to peers, its industry and market conditions, a sound financial structure and high reinvestment rates that combine to create favorable conditions for prospective growth.
LMCG uses a bottom-up quantitative approach to investing in emerging markets equity securities. Inefficiencies in the market create opportunities, and LMCG believes that a quantitative process, which relies on sophisticated mathematical or statistical models in selecting investments, is well-suited to capture these inefficiencies and provide an opportunity to outperform the market. LMCG's stock selection model groups factors used to select investments into three major categories: market dynamics, value and quality.
195
PACE Select Advisors Trust
PACE International Emerging Markets Equity Investments
Sub-advisors' Comments – concluded
primarily on high speed trains, locomotives, passenger coaches, freight wagons, rapid transit vehicles, railway engineering machinery/equipment and core system/components for rolling stock. Its share price surged higher on China CNR and CSR Corp's merger approval by China Securities Regulatory Commission. The stock was delisted on June 8, 2015 after the merger, which resulted in the creation of CRRC Corporation Limited.
The only meaningful detractors from relative performance were stock selection in Telecommunication Services, Information Technology and Energy, along with an underweight to emerging market Asia.
From a positioning perspective, we have added to our emerging market Asia exposure, while reducing our allocation to Latin America. In terms of sectors, we added to consumer staples and industrials, while reducing our consumer discretionary and health care exposure.
Derivatives were not used during the reporting period.
LMCG Investments, LLC (formerly, Lee Munder Capital Group)
Our portion of the Portfolio modestly underperformed the benchmark during the reporting period. The overall stock selection model and its three major components (Market Dynamics, Quality and Valuation) were less effective and more volatile during the reporting period, as investors focused less on company fundamentals and more on macroeconomic drivers and concerns. However, there was a particularly strong payoff to Market Dynamics, which ranks stocks versus their peers on earnings growth prospects and relative price strength. Quality, which assesses a company's earnings quality, as well as its operating efficiency and use of capital, was modestly positive. Our Valuation factor, which evaluates stocks on several relative value measures, consistently detracted from results. During periods of uncertainty, investors tend to favor stocks that have performed well and have good earnings growth prospects over those with good valuations. In this environment, cheapness is viewed as more risky.
Viewed on a market-by-market basis, stock selection detracted modestly from performance. Positive stock selection, particularly in China and Brazil, was offset by negative stock selection in Korea and South Africa. Country allocation provided a modest tailwind to performance, with underweight positions in Brazil, Greece and Colombia responsible for the majority of the positive contribution from country allocation. In terms of sectors, there was a slight positive from stock selection led by selections in financials, energy and materials. Sector allocation was a slight drag on performance during the fiscal year.
Derivatives were not used during the reporting period.
Special considerations
The Portfolio may be appropriate for long-term investors seeking capital appreciation who are able to withstand short-term fluctuations in the equity markets in return for potentially higher returns over the long term. The value of the Portfolio changes every day and can be affected by changes in interest rates, general market conditions, and other political, social and economic developments, as well as specific matters relating to the companies in whose securities the Portfolio invests. It is important to note that an investment in the Portfolio is only one component of a balanced investment plan. The value of the Portfolio's investments in foreign securities may fall due to adverse political, social and economic developments abroad, and due to decreases in foreign currency values relative to the US dollar. These risks are greater for investments in emerging market issuers than for issuers in more developed countries.
196
PACE Select Advisors Trust
PACE International Emerging Markets Equity Investments
Illustration of an assumed investment of $10,000 in Class P shares of the Portfolio (unaudited)
The following graph depicts the performance of PACE International Emerging Markets Equity Investments Class P shares versus the MSCI Emerging Markets Index (net) and the MSCI Emerging Markets Index over the 10 years ended July 31, 2015. Class P shares held through advisory programs may be subject to a program fee, which, if included, would have reduced performance. The performance of the other classes will vary based upon the different class specific expenses and sales charges. The performance provided does not reflect the deduction of taxes that a shareholder would pay on Portfolio distributions or the redemption of Portfolio shares. Past performance is no guarantee of future results. Share price and returns will vary with market conditions; investors may realize a gain or loss upon redemption. It is important to note that PACE International Emerging Markets Equity Investments is a professionally managed portfolio while the Indices are not available for investment and are unmanaged. The comparison is shown for illustration purposes only.

197
PACE Select Advisors Trust
PACE International Emerging Markets Equity Investments
Performance at a glance (unaudited)
Average annual total returns for periods ended 07/31/15 | | 1 year | | 5 years | | 10 years | |
Before deducting maximum sales charge | |
Class A1 | | | (12.50 | )% | | | 0.25 | % | | | 5.12 | % | |
Class C2 | | | (13.17 | ) | | | (0.49 | ) | | | 4.34 | | |
Class Y3 | | | (12.30 | ) | | | 0.47 | | | | 5.45 | | |
Class P4 | | | (12.33 | ) | | | 0.34 | | | | 5.19 | | |
After deducting maximum sales charge | |
Class A1 | | | (17.31 | ) | | | (0.88 | ) | | | 4.53 | | |
Class C2 | | | (14.04 | ) | | | (0.49 | ) | | | 4.34 | | |
MSCI Emerging Markets Index (net)5,7 | | | (13.38 | ) | | | 0.58 | | | | 6.62 | | |
MSCI Emerging Markets Index6,7 | | | (13.07 | ) | | | 0.92 | | | | 6.95 | | |
Lipper Emerging Markets Funds median | | | (12.76 | ) | | | 0.52 | | | | 6.21 | | |
Most recent calendar quarter-end returns (unaudited)
Average annual total returns for periods ended 06/30/15 | | 1 year | | 5 years | | 10 years | |
Before deducting maximum sales charge | |
Class A1 | | | (6.31 | )% | | | 3.54 | % | | | 6.44 | % | |
Class C2 | | | (7.01 | ) | | | 2.77 | | | | 5.64 | | |
Class Y3 | | | (6.11 | ) | | | 3.79 | | | | 6.77 | | |
Class P4 | | | (6.18 | ) | | | 3.63 | | | | 6.49 | | |
After deducting maximum sales charge | |
Class A1 | | | (11.44 | ) | | | 2.38 | | | | 5.84 | | |
Class C2 | | | (7.94 | ) | | | 2.77 | | | | 5.64 | | |
The annualized gross and net expense ratios, respectively, for each class of shares as in the November 28, 2014 prospectuses, were as follows: Class A—1.83% and 1.83%; Class C—2.58% and 2.58%; Class Y—1.58% and 1.58%; and Class P—1.67% and 1.67%. Net expenses reflect fee waivers and/or expense reimbursements, if any, pursuant to an agreement that is in effect to cap the expenses. The Portfolio and UBS Global Asset Management (Americas) Inc. ("UBS Global AM") have entered into a written fee waiver/expense reimbursement agreement pursuant to which UBS Global AM is contractually obligated to waive its management fees and/or reimburse expenses so that the Portfolio's ordinary total operating expenses of each class through November 30, 2015 (excluding dividend expense, borrowing costs, and interest expense relating to short sales, and expenses attributable to investment in other investment companies, interest, taxes, brokerage commissions and extraordinary expenses) would not exceed Class A—1.95%; Class C—2.70%; Class Y—1.70%; and Class P—1.70%. The Portfolio has agreed to repay UBS Global AM for any waived fees/reimbursed expenses to the extent that it can do so over the following three fiscal years without causing the Portfolio's expenses in any of those three years to exceed these expense caps. The fee waiver/expense reimbursement agreement may be terminated by the Portfolio's board at any time and also will terminate automatically upon the expiration or termination of the Portfolio's advisory contract with UBS Global AM. Upon termination of the agreement, however, UBS Global AM's three year recoupment rights will survive.
1 Maximum sales charge for Class A shares is 5.5%. Class A shares bear ongoing 12b-1 service fees.
2 Maximum contingent deferred sales charge for Class C shares is 1% imposed on redemptions and is reduced to 0% after one year. Class C shares bear ongoing 12b-1 service and distribution fees.
3 The Portfolio offers Class Y shares to a limited group of eligible investors, including certain qualifying retirement plans. Class Y shares do not bear initial or contingent deferred sales charges or ongoing 12b-1 service and distribution fees.
4 Class P shares do not bear initial or contingent deferred sales charges or ongoing 12b-1 service and distribution fees, but Class P shares held through advisory programs may be subject to a program fee, which, if included, would have reduced performance.
5 The MSCI Emerging Markets Index (net) is a market capitalization-weighted index composed of different emerging market countries in Europe, Latin America, and the Pacific Basin. Net total return indices reinvest dividends after the deduction of withholding taxes, using a tax rate applicable to non-resident institutional investors who do not benefit from double taxation treaties. The index is constructed and managed with a view to being fully investable from the perspective of international institutional investors. Investors should note that indices do not reflect the deduction of fees and expenses.
6 The MSCI Emerging Markets Index is a market capitalization-weighted index composed of different emerging market countries in Europe, Latin America, and the Pacific Basin. The index is constructed and managed with a view to being fully investable from the perspective of international institutional investors. Investors should note that indices do not reflect the deduction of fees and expenses.
7 Effective November 28, 2014, MSCI Emerging Markets Index (net) replaced MSCI Emerging Markets Index as the portfolio's primary benchmark because it more closely aligns the portfolio with the majority of peers which comprise the portfolio's peer group.
Prior to February 17, 2015, if an investor sold or exchanged shares less than 90 days after purchase, a redemption fee of 1.00% of the amount sold or exchanged was deducted at the time of the transaction, except as noted otherwise in the prospectus. For sales or exchanges taking place on or after February 17, 2015 but prior to August 3, 2015, there is a reduction in the redemption holding period from 90 days to 30 days. Effective August 3, 2015, the 1.00% redemption fee imposed on sales or exchanges of any class of shares of the portfolios made during the holding periods specified in the prospectus was eliminated. Please refer to the prospectus for further information.
Past performance does not predict future performance, and the performance information provided does not reflect the deduction of taxes that a shareholder would pay on Portfolio distributions or the redemption of Portfolio shares. The return and principal value of an investment will fluctuate, so that an investor's shares, when redeemed, may be worth more or less than their original cost. Performance results assume reinvestment of all dividends and capital gain distributions at net asset value on the ex-dividend dates. Current performance may be higher or lower than the performance data quoted. For month-end performance figures, please visit http://globalam-us.ubs.com/corpweb/performance.do.
Lipper peer group data calculated by Lipper Inc.; used with permission. The Lipper median is the return of the fund that places in the middle of a Lipper peer group.
198
PACE Select Advisors Trust
PACE International Emerging Markets Equity Investments
Portfolio statistics (unaudited)
Characteristics | | 07/31/15 | |
Net assets (mm) | | $ | 432.9 | | |
Number of holdings | | | 236 | | |
Portfolio composition1 | | 07/31/15 | |
Common stocks, ADRs, GDRs and preferred stocks | | | 96.0 | % | |
Investment company | | | 1.6 | | |
Cash equivalents and other assets less liabilities | | | 2.4 | | |
Total | | | 100.0 | % | |
Regional allocation (equity investments)1 | | 07/31/15 | |
Asia | | | 59.9 | % | |
The Americas | | | 16.5 | | |
Europe and European territories | | | 10.4 | | |
Africa | | | 6.3 | | |
Russia | | | 2.0 | | |
Total | | | 95.1 | % | |
Top five countries (equity investments)1,2 | | 07/31/15 | |
Taiwan | | | 12.7 | % | |
South Korea | | | 11.0 | | |
India | | | 10.6 | | |
Brazil | | | 8.9 | | |
China | | | 8.3 | | |
Total | | | 51.5 | % | |
Top five sectors1,2 | | 07/31/15 | |
Financials | | | 25.2 | % | |
Information Technology | | | 18.2 | | |
Consumer Staples | | | 11.1 | | |
Consumer Discretionary | | | 9.2 | | |
Industrials | | | 9.1 | | |
Total | | | 72.8 | % | |
Top ten equity holdings1,2 | | 07/31/15 | |
Samsung Electronics Co. Ltd. | | | 3.0 | % | |
Taiwan Semiconductor Manufacturing Co. Ltd. | | | 1.9 | | |
China Mobile Ltd. | | | 1.6 | | |
Tencent Holdings Ltd. | | | 1.5 | | |
Housing Development Finance Corp. | | | 1.3 | | |
Wal-Mart de Mexico SAB de CV | | | 1.0 | | |
Fubon Financial Holding Co. Ltd. | | | 1.0 | | |
Industrial & Commercial Bank of China Ltd., Class H | | | 1.0 | | |
Itau Unibanco Holding SA | | | 1.0 | | |
FirstRand Ltd. | | | 1.0 | | |
Total | | | 14.3 | % | |
For a listing of defined portfolio acronyms that are used throughout the Portfolio statistics, please refer to page 254.
1 Weightings represent percentages of the Portfolio's net assets as of July 31, 2015. The Portfolio is actively managed and its composition will vary over time.
2 Figures represent the breakdown of direct investments of PACE International Emerging Markets Equity Investments. Figures would be different if a breakdown of the underlying investment company was included.
199
PACE Select Advisors Trust
PACE International Emerging Markets Equity Investments
Industry diversification—(unaudited)
As a percentage of net assets as of July 31, 2015
Common stocks
Aerospace & defense | | | 0.29 | % | |
Airlines | | | 1.35 | | |
Auto components | | | 1.01 | | |
Automobiles | | | 1.91 | | |
Banks | | | 13.78 | | |
Beverages | | | 2.45 | | |
Capital markets | | | 0.28 | | |
Chemicals | | | 1.53 | | |
Construction & engineering | | | 1.05 | | |
Construction materials | | | 0.16 | | |
Consumer finance | | | 0.50 | | |
Diversified financial services | | | 2.43 | | |
Diversified telecommunication services | | | 1.54 | | |
Electric utilities | | | 1.84 | | |
Electrical equipment | | | 0.31 | | |
Electronic equipment, instruments & components | | | 2.74 | | |
Food & staples retailing | | | 1.84 | | |
Food products | | | 4.29 | | |
Gas utilities | | | 0.83 | | |
Health care equipment & supplies | | | 0.50 | | |
Health care providers & services | | | 1.77 | | |
Hotels, restaurants & leisure | | | 1.55 | | |
Household durables | | | 0.67 | | |
Household products | | | 1.40 | | |
Independent power and renewable electricity producers | | | 0.74 | | |
Industrial conglomerates | | | 1.77 | | |
Insurance | | | 2.56 | | |
Internet & catalog retail | | | 0.21 | | |
Internet software & services | | | 2.92 | | |
IT services | | | 2.32 | | |
Machinery | | | 0.63 | | |
Media | | | 0.79 | | |
Metals & mining | | | 1.24 | | |
Multi-utilities | | | 0.54 | | |
Common stocks—(concluded)
Multiline retail | | | 0.90 | % | |
Oil, gas & consumable fuels | | | 5.20 | | |
Paper & forest products | | | 0.66 | | |
Personal products | | | 0.69 | | |
Pharmaceuticals | | | 0.38 | | |
Real estate investment trusts | | | 1.38 | | |
Real estate management & development | | | 1.50 | | |
Semiconductors & semiconductor equipment | | | 8.35 | | |
Specialty retail | | | 1.27 | | |
Technology hardware, storage & peripherals | | | 1.85 | | |
Textiles, apparel & luxury goods | | | 0.68 | | |
Thrifts & mortgage finance | | | 1.33 | | |
Tobacco | | | 0.40 | | |
Trading companies & distributors | | | 0.49 | | |
Transportation infrastructure | | | 3.22 | | |
Wireless telecommunication services | | | 5.24 | | |
Total common stocks | | | 93.28 | | |
Preferred stocks
Automobiles | | | 0.17 | | |
Banks | | | 1.45 | | |
Chemicals | | | 0.18 | | |
Metals & mining | | | 0.36 | | |
Paper & forest products | | | 0.51 | | |
Total preferred stocks | | | 2.67 | | |
Warrants | | | 0.001 | | |
Investment company | | | 1.62 | | |
Repurchase agreement | | | 2.10 | | |
Investment of cash collateral from securities loaned | | | 5.58 | | |
Liabilities in excess of other assets | | | (5.25 | ) | |
Net assets | | | 100.00 | % | |
1 Weightings represent less than 0.005% of the Portfolio's net assets as of July 31, 2015.
200
PACE Select Advisors Trust
PACE International Emerging Markets Equity Investments
Portfolio of investments—July 31, 2015
| | | Number of
shares | | Value | |
Common stocks—93.28% | |
Bermuda—1.20% | |
China Gas Holdings Ltd. | | | 656,000 | | | $ | 1,150,832 | | |
Credicorp Ltd. | | | 21,922 | | | | 2,891,512 | | |
Huabao International Holdings Ltd. | | | 2,372,000 | | | | 1,153,521 | | |
Total Bermuda common stocks | | | | | 5,195,865 | | |
Brazil—6.43% | |
AMBEV SA | | | 315,400 | | | | 1,792,574 | | |
AMBEV SA, ADR | | | 668,026 | | | | 3,794,388 | | |
Banco do Brasil SA | | | 186,400 | | | | 1,200,403 | | |
BB Seguridade Participacoes SA | | | 222,800 | | | | 2,098,541 | | |
| BRF SA | | | 66,200 | | | | 1,389,563 | | |
Cielo SA | | | 179,820 | | | | 2,296,625 | | |
Companhia de Concessoes
Rodoviarias (CCR) | | | 512,800 | | | | 2,279,477 | | |
| CPFL Energia SA | | | 180,608 | | | | 1,016,990 | | |
EcoRodovias Infraestrutura e
Logistica SA | | | 227,100 | | | | 460,309 | | |
Embraer SA | | | 181,500 | | | | 1,266,914 | | |
Fibria Celulose SA | | | 108,100 | | | | 1,437,776 | | |
JBS SA | | | 639,600 | | | | 2,878,616 | | |
Lojas Renner SA | | | 59,419 | | | | 1,889,670 | | |
Porto Seguro SA | | | 123,000 | | | | 1,398,499 | | |
Transmissora Alianca de Energia
Eletrica SA | | | 167,500 | | | | 1,024,876 | | |
Ultrapar Participacoes SA | | | 37,100 | | | | 761,406 | | |
Vale SA, ADR1 | | | 46,200 | | | | 243,012 | | |
Weg SA | | | 114,160 | | | | 626,822 | | |
Total Brazil common stocks | | | | | 27,856,461 | | |
British Virgin Islands—0.28% | |
Mail.ru Group Ltd., GDR* | | | 63,852 | | | | 1,200,418 | | |
Cayman Islands—6.74% | |
Alibaba Group Holding Ltd., ADR* | | | 23,228 | | | | 1,819,681 | | |
Baidu, Inc., ADR* | | | 1,914 | | | | 330,471 | | |
Belle International Holdings Ltd. | | | 3,115,976 | | | | 3,239,654 | | |
China Mengniu Dairy Co. Ltd. | | | 271,000 | | | | 1,225,256 | | |
ENN Energy Holdings Ltd. | | | 170,000 | | | | 1,129,342 | | |
Evergrande Real Estate Group Ltd.1 | | | 3,226,000 | | | | 2,134,770 | | |
Geely Automobile Holdings Ltd. | | | 3,520,000 | | | | 1,480,232 | | |
Golden Eagle Retail Group Ltd.1 | | | 997,000 | | | | 1,232,055 | | |
Hengan International Group Co. Ltd. | | | 188,000 | | | | 2,101,338 | | |
Mindray Medical International Ltd., ADR | | | 79,300 | | | | 2,164,097 | | |
NetEase, Inc., ADR | | | 19,067 | | | | 2,643,258 | | |
Sands China Ltd. | | | 419,200 | | | | 1,854,748 | | |
Tencent Holdings Ltd. | | | 355,100 | | | | 6,628,094 | | |
Vipshop Holdings Ltd., ADR* | | | 45,899 | | | | 894,571 | | |
Want Want China Holdings Ltd. | | | 288,000 | | | | 299,060 | | |
Total Cayman Islands common stocks | | | | | 29,176,627 | | |
Chile—1.09% | |
Banco Santander Chile, ADR | | | 76,277 | | | | 1,540,032 | | |
Cia Cervecerias Unidas SA | | | 94,147 | | | | 991,602 | | |
Enersis SA, ADR | | | 143,800 | | | | 2,172,818 | | |
Total Chile common stocks | | | | | 4,704,452 | | |
| | | Number of
shares | | Value | |
Common stocks—(continued) | |
China—8.29% | |
Agricultural Bank of China, Class H | | | 3,515,000 | | | $ | 1,586,948 | | |
Air China Ltd., Class H | | | 3,154,000 | | | | 3,169,338 | | |
Bank of China Ltd., Class H | | | 6,913,000 | | | | 3,780,958 | | |
Bank of Communications Co. Ltd.,
Class H | | | 2,348,000 | | | | 2,065,627 | | |
China Bluechemical Ltd., Class H | | | 2,272,000 | | | | 738,547 | | |
China CITIC Bank, Class H* | | | 2,755,000 | | | | 1,965,243 | | |
China Construction Bank Corp.,
Class H | | | 2,807,000 | | | | 2,292,005 | | |
China Merchants Bank Co. Ltd.,
Class H | | | 827,000 | | | | 2,138,894 | | |
China Railway Group Ltd., Class H | | | 1,814,000 | | | | 1,549,047 | | |
China Shenhua Energy Co. Ltd.,
Class H | | | 705,500 | | | | 1,343,238 | | |
Chongqing Rural Commercial Bank,
Class H1 | | | 2,291,000 | | | | 1,640,165 | | |
CRRC Corp. Ltd., Series H*,1 | | | 1,073,666 | | | | 1,354,495 | | |
Industrial & Commercial Bank of
China Ltd., Class H | | | 6,250,000 | | | | 4,305,174 | | |
Jiangsu Expressway Co. Ltd., Class H | | | 1,764,000 | | | | 2,200,364 | | |
Ping An Insurance (Group) Co. of
China Ltd., Class H | | | 276,000 | | | | 1,587,864 | | |
Shanghai Pharmaceuticals Holding
Co. Ltd. | | | 465,200 | | | | 1,101,747 | | |
Sinopharm Group Co., Class H | | | 483,200 | | | | 1,857,431 | | |
Zhejiang Expressway Co. Ltd., Class H | | | 1,062,000 | | | | 1,223,335 | | |
Total China common stocks | | | | | 35,900,420 | | |
Colombia—0.10% | |
Bancolombia SA, ADR1 | | | 10,800 | | | | 416,880 | | |
Czech Republic—0.24% | |
CEZ A.S. | | | 42,914 | | | | 1,038,602 | | |
Egypt—0.37% | |
Commercial International Bank Egypt
SAE, GDR | | | 241,414 | | | | 1,619,888 | | |
Hong Kong—3.90% | |
Beijing Enterprises Holdings Ltd. | | | 216,000 | | | | 1,589,567 | | |
China Mobile Ltd. | | | 543,000 | | | | 7,109,438 | | |
China Overseas Land & Investment
Ltd. | | | 832,000 | | | | 2,624,047 | | |
China Resources Power Holdings
Co. Ltd. | | | 1,242,000 | | | | 3,194,598 | | |
CITIC Ltd. | | | 1,008,000 | | | | 1,804,760 | | |
Lenovo Group Ltd.1 | | | 502,000 | | | | 544,589 | | |
Total Hong Kong common stocks | | | | | 16,866,999 | | |
India—10.63% | |
Adani Ports & Special Economic
Zone Ltd. | | | 227,182 | | | | 1,151,532 | | |
Amtek Auto Ltd. | | | 314,162 | | | | 831,484 | | |
Asian Paints Ltd. | | | 21,509 | | | | 296,143 | | |
Axis Bank Ltd. | | | 420,926 | | | | 3,764,938 | | |
Bajaj Auto Ltd. | | | 75,445 | | | | 2,971,407 | | |
Bharti Infratel Ltd. | | | 264,534 | | | | 1,846,880 | | |
201
PACE Select Advisors Trust
PACE International Emerging Markets Equity Investments
Portfolio of investments—July 31, 2015
| | | Number of
shares | | Value | |
Common stocks—(continued) | |
India—(concluded) | |
Cairn India Ltd. | | | 697,640 | | | $ | 1,881,788 | | |
HCL Technologies Ltd. | | | 72,924 | | | | 1,135,347 | | |
HDFC Bank Ltd. | | | 106,784 | | | | 1,851,369 | | |
Hindustan Petroleum Corp. Ltd. | | | 192,670 | | | | 2,769,484 | | |
Hindustan Unilever Ltd. | | | 163,715 | | | | 2,353,278 | | |
Housing Development Finance Corp. | | | 275,149 | | | | 5,752,029 | | |
ICICI Bank Ltd., ADR | | | 214,328 | | | | 2,158,283 | | |
Infosys Ltd. | | | 202,594 | | | | 3,403,150 | | |
Infosys Ltd., ADR1 | | | 88,600 | | | | 1,498,226 | | |
Larsen & Toubro Ltd. | | | 106,588 | | | | 2,977,715 | | |
Maruti Suzuki India Ltd. | | | 39,737 | | | | 2,684,399 | | |
Reliance Industries Ltd., GDR2 | | | 84,748 | | | | 2,639,900 | | |
Rural Electrification Corp. Ltd. | | | 121,712 | | | | 514,424 | | |
Tata Motors Ltd.* | | | 190,314 | | | | 1,139,334 | | |
Ultratech Cement Ltd. | | | 13,851 | | | | 680,288 | | |
Wipro Ltd., ADR1 | | | 137,890 | | | | 1,704,320 | | |
Total India common stocks | | | | | 46,005,718 | | |
Indonesia—2.51% | |
PT Bank Mandiri (Persero) Tbk | | | 2,408,700 | | | | 1,696,017 | | |
PT Bank Negara Indonesia
(Persero) Tbk | | | 4,992,900 | | | | 1,756,881 | | |
PT Bank Rakyat Indonesia
(Persero) Tbk | | | 5,562,600 | | | | 4,112,068 | | |
PT Indofood Sukses Makmur Tbk | | | 2,717,500 | | | | 1,225,411 | | |
PT Kalbe Farma Tbk | | | 6,022,500 | | | | 776,881 | | |
PT Perusahaan Gas Negara | | | 4,424,700 | | | | 1,308,357 | | |
Total Indonesia common stocks | | | | | 10,875,615 | | |
Kazakhstan—0.13% | |
KazMunaiGas Exploration
Production, GDR3 | | | 34,093 | | | | 300,359 | | |
KazMunaiGas Exploration
Production, GDR4 | | | 28,996 | | | | 255,455 | | |
Total Kazakhstan common stocks | | | | | 555,814 | | |
Malaysia—2.50% | |
AMMB Holdings Berhad | | | 1,015,600 | | | | 1,484,430 | | |
Genting Malaysia Berhad | | | 1,291,900 | | | | 1,442,388 | | |
IHH Healthcare Berhad | | | 1,182,600 | | | | 1,858,394 | | |
Malayan Banking Berhad | | | 963,281 | | | | 2,317,214 | | |
Telekom Malaysia Berhad | | | 584,038 | | | | 1,000,248 | | |
Tenaga Nasional Berhad | | | 855,800 | | | | 2,729,967 | | |
Total Malaysia common stocks | | | | | 10,832,641 | | |
Mexico—5.74% | |
America Movil SA de C.V., Series L1 | | | 3,513,600 | | | | 3,417,106 | | |
Arca Continental SAB de C.V. | | | 369,100 | | | | 2,216,776 | | |
Compartamos SAB de C.V.1 | | | 1,263,500 | | | | 2,175,298 | | |
Fibra Uno Administracion SA de C.V. | | | 1,437,800 | | | | 3,454,289 | | |
Fomento Economico Mexicano
SAB de C.V., ADR | | | 5,373 | | | | 487,009 | | |
Gruma SAB de C.V., Series B | | | 109,400 | | | | 1,431,281 | | |
Grupo Aeroportuario del Pacifico
SA de C.V., ADR* | | | 16,800 | | | | 1,325,184 | | |
| | | Number of
shares | | Value | |
Common stocks—(continued) | |
Mexico—(concluded) | |
Grupo Aeroportuario del Pacifico
SAB de C.V.* | | | 280,200 | | | $ | 2,211,167 | | |
Grupo Financiero Inbursa SAB de
C.V., Class O1 | | | 396,600 | | | | 898,427 | | |
Grupo Financiero Santander Mexico
SAB de C.V., Class B, ADR | | | 170,300 | | | | 1,524,185 | | |
Kimberly-Clark de Mexico SA de
C.V., Series A | | | 544,500 | | | | 1,264,220 | | |
Wal-Mart de Mexico SAB de CV | | | 1,842,582 | | | | 4,466,796 | | |
Total Mexico common stocks | | | | | 24,871,738 | | |
Philippines—1.17% | |
BDO Unibank, Inc. | | | 640,720 | | | | 1,406,544 | | |
Philippine Long Distance Telephone
Co., ADR | | | 46,550 | | | | 2,995,492 | | |
Universal Robina Corp. | | | 158,720 | | | | 663,893 | | |
Total Philippines common stocks | | | | | 5,065,929 | | |
Poland—0.67% | |
KGHM Polska Miedz SA | | | 50,578 | | | | 1,273,802 | | |
Polski Koncern Naftowy Orlen SA | | | 80,563 | | | | 1,626,168 | | |
Total Poland common stocks | | | | | 2,899,970 | | |
Qatar—0.86% | |
Qatar Electricity & Water Co. | | | 38,842 | | | | 2,356,388 | | |
Qatar National Bank | | | 27,452 | | | | 1,375,898 | | |
Total Qatar common stocks | | | | | 3,732,286 | | |
Romania—0.15% | |
Societatea Nationala de Gaze Naturale
ROMGAZ SA5 | | | 77,461 | | | | 662,292 | | |
Russia—1.99% | |
Gazprom PAO, ADR3 | | | 193,927 | | | | 901,760 | | |
Gazprom PAO, ADR4 | | | 600,847 | | | | 2,757,888 | | |
Lukoil PJSC, ADR4 | | | 4,713 | | | | 195,118 | | |
Lukoil PJSC, ADR3 | | | 27,722 | | | | 1,133,830 | | |
Magnit PJSC | | | 26,603 | | | | 1,443,213 | | |
MMC Norilsk Nickel PJSC, ADR | | | 48,766 | | | | 753,922 | | |
Tatneft, ADR | | | 48,260 | | | | 1,420,292 | | |
Total Russia common stocks | | | | | 8,606,023 | | |
South Africa—6.76% | |
Aspen Pharmacare Holdings Ltd.* | | | 29,354 | | | | 860,925 | | |
Barloworld Ltd. | | | 165,738 | | | | 1,179,140 | | |
Discovery Ltd. | | | 67,753 | | | | 727,594 | | |
FirstRand Ltd.1 | | | 951,128 | | | | 4,115,709 | | |
Growthpoint Properties Ltd. | | | 864,260 | | | | 1,893,819 | | |
Liberty Holdings Ltd. | | | 117,298 | | | | 1,318,533 | | |
MTN Group Ltd.1 | | | 102,305 | | | | 1,706,398 | | |
Naspers Ltd., N Shares | | | 24,444 | | | | 3,420,160 | | |
Netcare Ltd. | | | 655,443 | | | | 2,092,713 | | |
Redefine Properties Ltd. | | | 690,309 | | | | 627,541 | | |
Sanlam Ltd. | | | 186,753 | | | | 986,450 | | |
Sappi Ltd.* | | | 435,757 | | | | 1,430,908 | | |
Steinhoff International Holdings Ltd.1 | | | 307,840 | | | | 1,863,308 | | |
202
PACE Select Advisors Trust
PACE International Emerging Markets Equity Investments
Portfolio of investments—July 31, 2015
| | | Number of
shares | | Value | |
Common stocks—(continued) | |
South Africa—(concluded) | |
The Bidvest Group Ltd. | | | 110,701 | | | $ | 2,694,400 | | |
The Foschini Group Ltd.1 | | | 96,884 | | | | 1,103,154 | | |
Truworths International Ltd.1 | | | 171,173 | | | | 1,157,594 | | |
Vodacom Group Ltd. | | | 113,969 | | | | 1,320,393 | | |
Woolworths Holdings Ltd. | | | 97,757 | | | | 767,435 | | |
Total South Africa common stocks | | | | | 29,266,174 | | |
South Korea—10.88% | |
Amorepacific Corp. | | | 2,469 | | | | 867,204 | | |
CJ CheilJedang Corp. | | | 4,481 | | | | 1,573,893 | | |
Coway Co. Ltd. | | | 12,597 | | | | 1,052,845 | | |
Daesang Corp. | | | 31,467 | | | | 955,990 | | |
Dongbu Insurance Co. Ltd. | | | 31,487 | | | | 1,493,423 | | |
Doosan Infracore Co. Ltd.* | | | 115,650 | | | | 752,123 | | |
E-Mart Co. Ltd. | | | 7,240 | | | | 1,478,751 | | |
Hyosung Corp. | | | 15,821 | | | | 1,926,670 | | |
Hyundai Mobis | | | 16,691 | | | | 3,045,360 | | |
Industrial Bank of Korea | | | 136,703 | | | | 1,618,029 | | |
Kangwon Land, Inc. | | | 19,750 | | | | 719,854 | | |
KT&G Corp. | | | 18,544 | | | | 1,743,230 | | |
LG Display Co. Ltd. | | | 60,362 | | | | 1,140,025 | | |
LG Household & Health Care Ltd. | | | 3,361 | | | | 2,461,545 | | |
LG International Corp. | | | 39,019 | | | | 960,345 | | |
Lotte Chemical Corp. | | | 5,915 | | | | 1,316,803 | | |
Nexen Tire Corp. | | | 41,372 | | | | 494,986 | | |
Samsung Electro-Mechanics Co. Ltd. | | | 29,431 | | | | 1,365,725 | | |
Samsung Electronics Co. Ltd. | | | 12,867 | | | | 13,030,291 | | |
Samsung Fire & Marine Insurance
Co. Ltd. | | | 6,090 | | | | 1,457,249 | | |
Samsung Securities Co. Ltd. | | | 27,026 | | | | 1,214,859 | | |
SK Energy Co. Ltd.* | | | 13,533 | | | | 1,150,736 | | |
SK Hynix, Inc. | | | 123,101 | | | | 3,902,959 | | |
SK Telecom Co. Ltd. | | | 6,390 | | | | 1,362,479 | | |
Total South Korea common stocks | | | | | 47,085,374 | | |
Taiwan—12.67% | |
Advanced Semiconductor
Engineering, Inc. | | | 1,728,000 | | | | 1,997,751 | | |
Asustek Computer, Inc. | | | 182,000 | | | | 1,642,938 | | |
AU Optronics Corp. | | | 3,924,000 | | | | 1,255,322 | | |
Catcher Technology Co. Ltd. | | | 219,000 | | | | 2,413,949 | | |
Cheng Uei Precision Industry Co. Ltd. | | | 611,000 | | | | 853,463 | | |
China Airlines Ltd.* | | | 2,732,000 | | | | 1,215,799 | | |
Chinatrust Financial Holding Co. Ltd. | | | 1,050,000 | | | | 761,605 | | |
Chunghwa Telecom Co. Ltd. | | | 473,000 | | | | 1,468,223 | | |
Compal Electronics, Inc. | | | 1,610,000 | | | | 1,086,201 | | |
Delta Electronics, Inc. | | | 158,000 | | | | 778,202 | | |
Eclat Textile Co. Ltd. | | | 122,000 | | | | 1,791,077 | | |
FLEXium Interconnect, Inc. | | | 262,000 | | | | 875,505 | | |
Fubon Financial Holding Co. Ltd. | | | 2,417,000 | | | | 4,409,648 | | |
HON Hai Precision Industry Co. Ltd. | | | 1,237,560 | | | | 3,555,317 | | |
King Yuan Electronics Co. Ltd. | | | 1,566,000 | | | | 1,056,516 | | |
Largan Precision Co. Ltd. | | | 20,000 | | | | 2,030,312 | | |
MediaTek, Inc. | | | 268,000 | | | | 2,818,238 | | |
Mega Financial Holding Co. Ltd. | | | 1,900,000 | | | | 1,624,883 | | |
| | | Number of
shares | | Value | |
Common stocks—(concluded) | |
Taiwan—(concluded) | |
Novatek Microelectronics Corp. | | | 194,000 | | | $ | 703,578 | | |
Pegatron Corp. | | | 383,000 | | | | 1,077,250 | | |
POU Chen Corp. | | | 805,000 | | | | 1,142,296 | | |
Quanta Computer, Inc. | | | 633,000 | | | | 1,223,034 | | |
Taiwan Mobile Co. Ltd. | | | 884,000 | | | | 2,925,993 | | |
Taiwan Semiconductor Manufacturing
Co. Ltd. | | | 1,828,156 | | | | 8,077,784 | | |
Taiwan Semiconductor Manufacturing
Co. Ltd., ADR | | | 98,365 | | | | 2,174,850 | | |
Teco Electric and Machinery Co. Ltd. | | | 1,698,000 | | | | 1,331,121 | | |
Uni-President Enterprises Corp. | | | 1,231,718 | | | | 2,169,156 | | |
United Microelectronics Corp. | | | 4,053,000 | | | | 1,444,222 | | |
Win Semiconductors Corp. | | | 870,000 | | | | 931,410 | | |
Total Taiwan common stocks | | | | | 54,835,643 | | |
Thailand—1.71% | |
Airports of Thailand PCL | | | 188,700 | | | | 1,574,062 | | |
Bangkok Dusit Medical Services PCL | | | 1,310,700 | | | | 747,484 | | |
| CP ALL PCL | | | 427,700 | | | | 582,483 | | |
Jasmine International PCL | | | 7,082,300 | | | | 1,004,724 | | |
Kasikornbank Public Co. Ltd. | | | 83,300 | | | | 421,877 | | |
PTT Global Chemical PCL | | | 673,400 | | | | 1,179,811 | | |
PTT Public Co. Ltd.6 | | | 81,600 | | | | 754,762 | | |
Thai Union Frozen Products PCL | | | 2,091,200 | | | | 1,121,398 | | |
Total Thailand common stocks | | | | | 7,386,601 | | |
Turkey—3.10% | |
Eregli Demir ve Celik Fabrikalari TAS
(Erdemir) | | | 1,072,767 | | | | 1,610,447 | | |
Koc Holding A.S. | | | 359,084 | | | | 1,593,856 | | |
Koza Altin Isletmeleri AS | | | 175,704 | | | | 1,474,186 | | |
TAV Havalimanlari Holding A.S. | | | 86,053 | | | | 655,234 | | |
Tupras-Turkiye Petrol Rafinerileri A.S.* | | | 75,240 | | | | 1,954,921 | | |
Turk Hava Yollari Anonim
Ortakligi (THY)* | | | 447,591 | | | | 1,458,535 | | |
Turk Telekomunikasyon A.S. | | | 1,279,230 | | | | 3,176,032 | | |
Turkiye Garanti Bankasi A.S. | | | 163,504 | | | | 483,827 | | |
Turkiye Vakiflar Bankasi T.A.O., Class D | | | 659,108 | | | | 994,216 | | |
Total Turkey common stocks | | | | | 13,401,254 | | |
United Arab Emirates—1.40% | |
DP World Ltd. | | | 38,193 | | | | 868,891 | | |
Emaar Malls Group PJSC* | | | 676,325 | | | | 598,477 | | |
Emaar Properties PJSC | | | 523,050 | | | | 1,125,068 | | |
First Gulf Bank PJSC | | | 820,816 | | | | 3,464,066 | | |
Total United Arab Emirates common stocks | | | | | 6,056,502 | | |
United Kingdom—1.15% | |
SABMiller PLC | | | 25,694 | | | | 1,343,536 | | |
Unilever PLC | | | 80,380 | | | | 3,649,026 | | |
Total United Kingdom common stocks | | | | | 4,992,562 | | |
United States—0.62% | |
Yum! Brands, Inc. | | | 30,543 | | | | 2,680,454 | | |
Total common stocks
(cost—$423,133,171) | | | | | 403,789,202 | | |
203
PACE Select Advisors Trust
PACE International Emerging Markets Equity Investments
Portfolio of investments—July 31, 2015
| | | Number of
shares | | Value | |
Preferred stocks—2.67% | |
Brazil—2.50% | |
Banco Bradesco SA | | | 258,840 | | | $ | 2,062,283 | | |
Braskem SA | | | 217,000 | | | | 794,749 | | |
Itau Unibanco Holding SA | | | 479,415 | | | | 4,211,745 | | |
Metalurgica Gerdau SA | | | 279,600 | | | | 285,810 | | |
Suzano Papel e Celulose SA | | | 449,300 | | | | 2,203,229 | | |
Vale SA, ADR1 | | | 296,600 | | | | 1,272,414 | | |
Total Brazil preferred stocks | | | | | 10,830,230 | | |
South Korea—0.17% | |
Hyundai Motor Co. | | | 8,280 | | | | 728,830 | | |
Total preferred stocks
(cost—$18,525,189) | | | | | 11,559,060 | | |
| | | Number of
warrants | | | |
Warrants—0.00%†† | |
Thailand—0.00%†† | |
Jasmine International PCL,
strike price $4.30, expires 07/05/20*
(cost—$0) | | | 1 | | | | 0 | | |
| | | Number of
shares | | | |
Investment company—1.62% | |
United States—1.62% | |
iShares MSCI Emerging
Markets Index Fund1
(cost—$7,414,020) | | | 188,247 | | | | 6,987,729 | | |
| | | Face
amount | | Value | |
Repurchase agreement—2.10% | |
Repurchase agreement dated
07/31/15 with State Street Bank
and Trust Co., 0.000% due
08/03/15, collateralized by
$2,617,379 Federal Home
Loan Mortgage Corp. obligations,
2.080% due 10/17/22, $656,831
Federal National Mortgage
Association obligations, 2.170%
due 10/17/22 and $5,856,688
US Treasury Notes, 1.625% to
3.625% due 03/31/19 to
06/30/20; (value—$9,284,191);
proceeds: $9,102,000
(cost—$9,102,000) | | $ | 9,102,000 | | | $ | 9,102,000 | | |
| | | Number of
shares | | | |
Investment of cash collateral from securities loaned—5.58% | |
Money market fund—5.58% | |
UBS Private Money Market Fund LLC7
(cost—$24,172,620) | | | 24,172,620 | | | | 24,172,620 | | |
Total investments
(cost—$482,347,000)—105.25% | | | | | 455,610,611 | | |
Liabilities in excess of
other assets—(5.25)% | | | | | (22,725,599 | ) | |
Net assets—100.00% | | $ | 432,885,012 | | |
For a listing of defined portfolio acronyms and currency abbreviations that are used throughout the Portfolio of investments as well as the tables that follow, please refer to page 254.
Aggregate cost for federal income tax purposes was $485,921,030; and net unrealized depreciation consisted of:
Gross unrealized appreciation | | $ | 28,437,520 | | |
Gross unrealized depreciation | | | (58,747,939 | ) | |
Net unrealized depreciation | | $ | (30,310,419 | ) | |
Fair valuation summary
The following is a summary of the fair valuations according to the inputs used as of July 31, 2015 in valuing the Portfolio's investments:
Assets
Description | | Unadjusted
quoted prices in
active markets for
identical investments
(Level 1) | | Other significant
observable inputs
(Level 2) | | Unobservable
inputs
(Level 3) | | Total | |
Common stocks | | $ | 398,346,721 | | | $ | 5,442,481 | | | $ | — | | | $ | 403,789,202 | | |
Preferred stocks | | | 11,559,060 | | | | — | | | | — | | | | 11,559,060 | | |
Warrants | | | — | | | | — | | | | — | | | | — | | |
Investment company | | | 6,987,729 | | | | — | | | | — | | | | 6,987,729 | | |
Repurchase agreement | | | — | | | | 9,102,000 | | | | — | | | | 9,102,000 | | |
Investment of cash collateral from securities loaned | | | — | | | | 24,172,620 | | | | — | | | | 24,172,620 | | |
Total | | $ | 416,893,510 | | | $ | 38,717,101 | | | $ | — | | | $ | 455,610,611 | | |
204
PACE Select Advisors Trust
PACE International Emerging Markets Equity Investments
Portfolio of investments—July 31, 2015
At July 31, 2015, there were no transfers between Level 1 and Level 2. At July 31, 2014, $336,369,253 of foreign investments were classified within Level 2 of the fair value hierarchy pursuant to the Portfolio's fair valuation procedures for foreign portfolio holdings.
The following is a rollforward of the Portfolio's investments that was fair valued using unobservable inputs (Level 3) for the year ended July 31, 2015:
| | Common
stocks | |
Beginning balance | | $ | 1,339 | | |
Purchases | | | — | | |
Sales | | | (53,458 | ) | |
Accrued discounts/(premiums) | | | — | | |
Total realized gain/(loss) | | | (834,661 | ) | |
Net change in unrealized appreciation/depreciation | | | 886,780 | | |
Transfers into Level 3 | | | — | | |
Transfers out of Level 3 | | | — | | |
Ending balance | | $ | — | | |
The change in net unrealized appreciation/depreciation relating to the Level 3 investments held at July 31, 2015, was $0.
Portfolio footnotes
* Non-income producing security.
†† Amount represents less than 0.005%.
1 Security, or portion thereof, was on loan at July 31, 2015.
2 Security exempt from registration pursuant to Rule 144A under the Securities Act of 1933. This security, which represent 0.61% of net assets as of July 31, 2015, are considered liquid and may be resold in transactions exempt from registration, normally to qualified institutional buyers.
3 Security is traded on the Turquoise Exchange.
4 Security is traded on the over-the-counter ("OTC") market.
5 Illiquid investment as of July 31, 2015.
6 Security is being fair valued by a valuation committee under the direction of the board of trustees.
7 The table below details the Portfolio's transaction activity in an affiliated issuer during the year ended July 31, 2015. The investment manager earns a management fee from UBS Private Money Market Fund LLC. Please see the Notes to financial statements for further information.
Security description | | Value at
07/31/14 | | Purchases
during the
year ended
07/31/15 | | Sales
during the
year ended
07/31/15 | | Value at
07/31/15 | | Net income
earned from
affiliate for the
year ended
07/31/15 | |
UBS Private Money Market Fund LLC | | $ | 32,623,715 | | | $ | 161,629,799 | | | $ | 170,080,894 | | | $ | 24,172,620 | | | $ | 2,894 | | |
See accompanying notes to financial statements.
205
PACE Select Advisors Trust
PACE Global Real Estate Securities Investments
Performance (unaudited)
For the 12 months ended July 31, 2015, the Portfolio's Class P shares gained 2.59% before the deduction of the maximum PACE Select program fee.1 In comparison, the FTSE EPRA/NAREIT Developed Index (the "benchmark") rose 3.55%, while the Lipper Global Real Estate Funds category posted a median return of 3.46%. (Returns for all share classes over various time periods are shown in the "Performance at a glance" table on page 209. Please note that the returns shown do not reflect the deduction of taxes that a shareholder would pay on Portfolio distributions or the redemption of Portfolio shares.) For a detailed commentary on the market environment in general during the reporting period, please refer to page 2.
Sub-advisors' comments2
Please note: CBRE Clarion was terminated as a sub-advisor for the Portfolio effective on May 31, 2015.
CBRE Clarion
For the period from August 1, 2014 through May 31, 2015, when CBRE Clarion was a sub-advisor for a portion of the Portfolio, we modestly underperformed the benchmark. This was primarily due to our stock selection in the Americas and Asia-Pacific regions. We had several positives from our US positioning, including strong performance from investments in the health care, apartment and mall sectors. However, these positives were entirely offset by the poor performance of several of our investments in the retail shopping center, hotels and net lease sectors. The shopping center and net lease sectors do not have the same earnings acceleration potential to offset the concerns about the impact of higher rates on property values. We were underweight these sectors, but some of the few securities we choose to hold were a drag on performance.
In Asia-Pacific, stock selection was challenged in Japan and Singapore, more than offsetting the positive contribution from positions in Hong Kong. European stock selection was positive as a result of UK positions. Asset allocation generally helped performance, as we benefited from being overweight three of
1 Class P shares held through the PACE Select Advisors Program are subject to a maximum Program fee of 2.50%, which, if included, would have reduced performance. Class P shares held through other advisory programs also may be subject to a program fee, which, if included, would have reduced performance.
2 All sub-advisors discuss performance on a gross-of-fees basis—meaning that no fees or expenses are reflected in their sleeves'/sleeve's performance. Alternately, Portfolio performance is shown net of fees, which does factor in fees and expenses associated with the Portfolio.
PACE Select Advisors Trust –
PACE Global Real Estate Securities Investments
Investment Sub-Advisors:
CBRE Clarion Securities, LLC ("CBRE Clarion");
Brookfield Investment Management Inc. ("Brookfield")
Portfolio Managers:
CBRE Clarion: T. Ritson Ferguson, Steven D. Burton & Joseph P. Smith;
Brookfield: Jason Baine and Bernhard Krieg
Objective:
Total Return
Investment process:
CBRE Clarion (formerly, ING Clarion Real Estate Securities) uses a multi-step investment process for constructing the investment portfolio. This process combines top-down region and sector allocation with bottom-up individual stock selection. First, CBRE Clarion selects property sectors and geographic regions in which to invest and determines the degree of representation of such sectors and regions, through a systematic evaluation of public and private real estate market trends and conditions. Second, CBRE Clarion uses a proprietary valuation process in an effort to identify investments with superior current income and growth potential relative to their peers.
Brookfield invests in a diversified portfolio of global securities of companies primarily in the real estate industry, including real estate investment trusts, real estate operating companies, companies whose value is significantly affected by the value of such companies' real estate holdings, and related entities and structures. Brookfield utilizes a fundamental, bottom-up, value-based stock selection methodology.
206
PACE Select Advisors Trust
PACE Global Real Estate Securities Investments
Sub-advisors' comments – concluded
the best performing countries—Hong Kong, the UK and the US—and underweight Canada, a laggard during the period.
Derivatives were not used during the reporting period.
Brookfield
Our portion of the Portfolio outperformed the benchmark during the reporting period, primarily driven by stock selection. By sector, residential and office were our largest contributors to performance, due to positive stock selection. An underweight to the underperforming net lease sector was also a top contributor to performance. In contrast, underweights to the self storage and manufactured home sectors were top detractors from relative results, along with an out-of-benchmark exposure to the communications sector.
By region, Continental Europe was the leading contributor to performance, led by Germany and France. This was driven by a combination of positive stock selection and an overweight allocation to the outperforming region. Japan was another strong contributor to relative results, due to positive stock selection and an underweight allocation to the underperforming region. Finally, positive stock selection in Singapore was a top contributor. Conversely, the UK was the largest detractor from performance, driven by a combination of negative stock selection and an underweight allocation to the outperforming region. Negative stock selection in the US and New Zealand were also top detractors from results.
By security, Deutsche Annington Immobilien SE (residential, Germany), Westfield Corp. Ltd. (retail, US) and an out-of-benchmark allocation to Iron Mountain, Inc. (self storage, US) were the leading contributors to performance. We exited our position in Iron Mountain after strong performance. The largest detractors from results included an out-of-benchmark position in OUTFRONT Media, Inc. (specialty, US), as well as WP GLIMCHER, Inc. (retail, US) and Wharf (Holdings) Ltd. (diversified, Hong Kong).
Derivatives were not used during the reporting period.
Special considerations
The Portfolio may be appropriate for long-term investors seeking to diversify a portion of their assets into real estate related investments. Investors should be willing to withstand short-term fluctuations in the equity and real estate markets in return for potentially higher returns over the long term. The value of the Portfolio changes every day and can be affected by changes in interest rates, general market conditions, and other political, social and economic developments, as well as specific matters relating to the companies or issuers in whose securities the Portfolio invests. The value of the Portfolio's investments in foreign securities may fall due to adverse political, social and economic developments abroad, and due to decreases in foreign currency values relative to the US dollar. These risks are greater for investments in emerging market issuers than for issuers in more developed countries. There are certain risks associated with investing in real estate-related investments, including sensitivity to economic downturns, interest rates, declines in property values and variation in property management.
207
PACE Select Advisors Trust
PACE Global Real Estate Securities Investments
Illustration of an assumed investment of $10,000 in Class A shares of the Portfolio (unaudited)
The following graph depicts the performance of PACE Global Real Estate Securities Investments Class A shares versus the FTSE EPRA/NAREIT Developed Index from December 31, 2006, the month-end after the inception date of the Class A shares, through July 31, 2015. Class P shares held through advisory programs may be subject to a program fee, which, if included, would have reduced performance. The performance of the other classes will vary based upon the different class specific expenses and sales charges. The performance provided does not reflect the deduction of taxes that a shareholder would pay on Portfolio distributions or the redemption of Portfolio shares. Past performance is no guarantee of future results. Share price and returns will vary with market conditions; investors may realize a gain or loss upon redemption. It is important to note that PACE Global Real Estate Securities Investments is a professionally managed portfolio while the Index is not available for investment and is unmanaged. The comparison is shown for illustration purposes only.
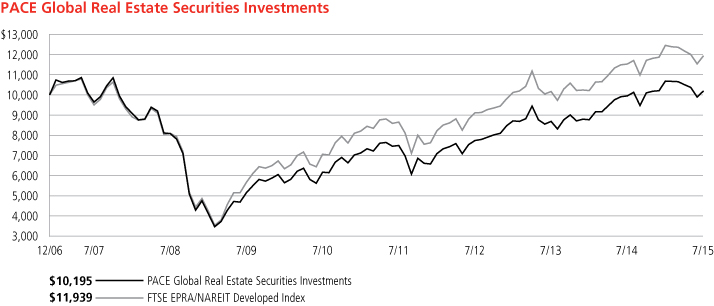
208
PACE Select Advisors Trust
PACE Global Real Estate Securities Investments
Performance at a glance (unaudited)
Average annual total returns for periods ended 07/31/15 | | 1 year | | 5 years | | Since
Inception1 | |
Before deducting maximum sales charge | |
Class A2 | | | 2.46 | % | | | 10.57 | % | | | 0.33 | % | |
Class C3 | | | 1.58 | | | | 9.73 | | | | (0.44 | ) | |
Class Y4 | | | 2.58 | | | | 10.84 | | | | 13.08 | | |
Class P5 | | | 2.59 | | | | 10.84 | | | | 0.05 | | |
After deducting maximum sales charge | |
Class A2 | | | (3.22 | ) | | | 9.33 | | | | (0.32 | ) | |
Class C3 | | | 0.59 | | | | 9.73 | | | | (0.44 | ) | |
FTSE EPRA/NAREIT Developed Index6 | | | 3.55 | | | | 11.08 | | | | 2.09 | | |
Lipper Global Real Estate Funds median | | | 3.46 | | | | 9.73 | | | | 1.34 | | |
Most recent calendar quarter-end returns (unaudited)
Average annual total returns for periods ended 06/30/15 | | 1 year | | 5 years | | Since
Inception1 | |
Before deducting maximum sales charge | |
Class A2 | | | (0.14 | )% | | | 11.97 | % | | | (0.01 | )% | |
Class C3 | | | (0.98 | ) | | | 11.13 | | | | (0.79 | ) | |
Class Y4 | | | 0.03 | | | | 12.26 | | | | 12.73 | | |
Class P5 | | | 0.03 | | | | 12.26 | | | | (0.31 | ) | |
After deducting maximum sales charge | |
Class A2 | | | (5.57 | ) | | | 10.72 | | | | (0.67 | ) | |
Class C3 | | | (1.94 | ) | | | 11.13 | | | | (0.79 | ) | |
The annualized gross and net expense ratios, respectively, for each class of shares as in the November 28, 2014 prospectuses, were as follows: Class A—1.59% and 1.45%; Class C—2.30% and 2.20%; Class Y—1.38% and 1.20%; and Class P—1.63% and 1.20%. Net expenses reflect fee waivers and/or expense reimbursements, if any, pursuant to an agreement that is in effect to cap the expenses. The Portfolio and UBS Global Asset Management (Americas) Inc. ("UBS Global AM") have entered into a written fee waiver/expense reimbursement agreement pursuant to which UBS Global AM is contractually obligated to waive its management fees and/or reimburse expenses so that the Portfolio's ordinary total operating expenses of each class through November 30, 2015 (excluding dividend expense, borrowing costs, and interest expense relating to short sales, and expenses attributable to investment in other investment companies, interest, taxes, brokerage commissions and extraordinary expenses) would not exceed Class A—1.45%; Class C—2.20%; Class Y—1.20%; and Class P—1.20%. The Portfolio has agreed to repay UBS Global AM for any waived fees/reimbursed expenses to the extent that it can do so over the following three fiscal years without causing the Portfolio's expenses in any of those three years to exceed these expense caps. The fee waiver/expense reimbursement agreement may be terminated by the Portfolio's board at any time and also will terminate automatically upon the expiration or termination of the Portfolio's advisory contract with UBS Global AM. Upon termination of the agreement, however, UBS Global AM's three year recoupment rights will survive.
1 Since inception returns are calculated as of commencement of issuance on December 18, 2006 for Class A and C shares, and January 22, 2007 for Class P shares. Class Y shares commenced issuance on November 30, 2006 and had fully redeemed by February 15, 2007 remaining inactive through December 25, 2008. The inception return of Class Y shares is calculated from December 26, 2008, which is the date the Class Y shares recommenced investment operations. Since inception returns for the Index and Lipper median are shown as of December 31, 2006, which is the month-end after the inception date of the oldest share classes (Class A and Class C).
2 Maximum sales charge for Class A shares is 5.5%. Class A shares bear ongoing 12b-1 service fees.
3 Maximum contingent deferred sales charge for Class C shares is 1% imposed on redemptions and is reduced to 0% after one year. Class C shares bear ongoing 12b-1 service and distribution fees.
4 The Portfolio offers Class Y shares to a limited group of eligible investors, including certain qualifying retirement plans. Class Y shares do not bear initial or contingent deferred sales charges or ongoing 12b-1 service and distribution fees.
5 Class P shares do not bear initial or contingent deferred sales charges or ongoing 12b-1 service and distribution fees, but Class P shares held through advisory programs may be subject to a program fee, which, if included, would have reduced performance.
6 The FTSE EPRA/NAREIT Developed Index is designed to track the performance of listed real estate companies and real estate investment trusts ("REITs") worldwide. By making the index constituents free-float adjusted, liquidity, size and revenue screened, the series is suitable for use as the basis for investment products, such as derivatives and exchange traded funds. Investors should note that indices do not reflect the deduction of fees and expenses.
Prior to February 17, 2015, if an investor sold or exchanged shares less than 90 days after purchase, a redemption fee of 1.00% of the amount sold or exchanged was deducted at the time of the transaction, except as noted otherwise in the prospectus. For sales or exchanges taking place on or after February 17, 2015 but prior to August 3, 2015, there is a reduction in the redemption holding period from 90 days to 30 days. Effective August 3, 2015, the 1.00% redemption fee imposed on sales or exchanges of any class of shares of the portfolios made during the holding periods specified in the prospectus was eliminated. Please refer to the prospectus for further information.
Past performance does not predict future performance, and the performance information provided does not reflect the deduction of taxes that a shareholder would pay on Portfolio distributions or the redemption of Portfolio shares. The return and principal value of an investment will fluctuate, so that an investor's shares, when redeemed, may be worth more or less than their original cost. Performance results assume reinvestment of all dividends and capital gain distributions at net asset value on the ex-dividend dates. Current performance may be higher or lower than the performance data quoted. For month-end performance figures, please visit http://globalam-us.ubs.com/corpweb/performance.do.
Lipper peer group data calculated by Lipper Inc.; used with permission. The Lipper median is the return of the fund that places in the middle of a Lipper peer group.
209
PACE Select Advisors Trust
PACE Global Real Estate Securities Investments
Portfolio statistics (unaudited)
Characteristics | | 07/31/15 | |
Net assets (mm) | | $ | 149.1 | | |
Number of holdings | | | 49 | | |
Portfolio composition1 | | 07/31/15 | |
Common stocks | | | 98.6 | % | |
Cash equivalents and other assets less liabilities | | | 1.4 | | |
Total | | | 100.0 | % | |
Top five countries (equity investments)1 | | 07/31/15 | |
United States | | | 54.6 | % | |
Australia | | | 8.1 | | |
Germany | | | 6.1 | | |
France | | | 5.5 | | |
Japan | | | 5.5 | | |
Total | | | 79.8 | % | |
Top ten equity holdings1 | | 07/31/15 | |
Simon Property Group, Inc. | | | 7.7 | % | |
ProLogis, Inc. | | | 4.3 | | |
Dexus Property Group | | | 3.6 | | |
Ventas, Inc. | | | 3.3 | | |
Mid-America Apartment Communities, Inc. | | | 3.3 | | |
Mitsubishi Estate Co. Ltd. | | | 3.3 | | |
Alstria Office REIT-AG | | | 3.2 | | |
Hongkong Land Holdings Ltd. | | | 3.2 | | |
Hammerson PLC | | | 3.1 | | |
Unibail Rodamco | | | 3.0 | | |
Total | | | 38.0 | % | |
For a listing of defined portfolio acronyms that are used throughout the Portfolio statistics, please refer to page 254.
1 Weightings represent percentages of the Portfolio's net assets as of July 31, 2015. The Portfolio is actively managed and its composition will vary over time.
210
PACE Select Advisors Trust
PACE Global Real Estate Securities Investments
Industry diversification—(unaudited)
As a percentage of net assets as of July 31, 2015
Common stocks
Apartments | | | 9.14 | % | |
Diversified | | | 17.60 | | |
Diversified operations | | | 1.86 | | |
Health care | | | 5.89 | | |
Hotels | | | 1.89 | | |
Hotels&motels | | | 2.65 | | |
Mortgage | | | 1.14 | | |
Office property | | | 15.40 | | |
Real estate management/service | | | 9.69 | | |
Real estate operations/development | | | 12.62 | | |
Regional malls | | | 9.54 | | |
Shopping centers | | | 4.80 | | |
Warehouse/industrial | | | 6.40 | | |
Total common stocks | | | 98.62 | | |
Repurchase agreement | | | 0.84 | | |
Investment of cash collateral from securities loaned | | | 1.26 | | |
Liabilities in excess of other assets | | | (0.72 | ) | |
Net assets | | | 100.00 | % | |
211
PACE Select Advisors Trust
PACE Global Real Estate Securities Investments
Portfolio of investments—July 31, 2015
| | | Number of
shares | | Value | |
Common stocks—98.62% | |
Australia—8.11% | |
Dexus Property Group | | | 954,896 | | | $ | 5,430,293 | | |
Federation Centres | | | 160,881 | | | | 352,788 | | |
Scentre Group | | | 1,137,055 | | | | 3,291,275 | | |
Westfield Corp. | | | 410,900 | | | | 3,012,483 | | |
Total Australia common stocks | | | | | 12,086,839 | | |
Austria—1.94% | |
CA Immobilien Anlagen AG* | | | 160,800 | | | | 2,887,389 | | |
Bermuda—3.17% | |
Hongkong Land Holdings Ltd. | | | 614,700 | | | | 4,733,190 | | |
Cayman Islands—2.24% | |
Cheung Kong Property Holdings Ltd.* | | | 401,100 | | | | 3,342,371 | | |
France—5.51% | |
Gecina SA | | | 29,335 | | | | 3,758,134 | | |
Unibail Rodamco | | | 16,752 | | | | 4,457,810 | | |
Total France common stocks | | | | | 8,215,944 | | |
Germany—6.05% | |
Alstria Office REIT-AG*,1 | | | 348,892 | | | | 4,818,373 | | |
Deutsche Annington Immobilien SE | | | 134,748 | | | | 4,202,833 | | |
Total Germany common stocks | | | | | 9,021,206 | | |
Hong Kong—1.85% | |
Wharf (Holdings) Ltd. | | | 436,000 | | | | 2,767,076 | | |
Japan—5.49% | |
Mitsubishi Estate Co. Ltd. | | | 221,089 | | | | 4,914,675 | | |
Mitsui Fudosan Co. Ltd. | | | 53,400 | | | | 1,520,328 | | |
Nippon Building Fund, Inc. | | | 392 | | | | 1,752,273 | | |
Total Japan common stocks | | | | | 8,187,276 | | |
Jersey—1.64% | |
Atrium European Real Estate Ltd.* | | | 524,555 | | | | 2,439,753 | | |
Luxembourg—0.50% | |
Grand City Properties SA1 | | | 43,300 | | | | 749,217 | | |
New Zealand—0.78% | |
Precinct Properties New Zealand Ltd. | | | 1,532,557 | | | | 1,158,329 | | |
Singapore—2.70% | |
CapitaLand Ltd. | | | 1,132,300 | | | | 2,657,730 | | |
Global Logistic Properties Ltd.*,1 | | | 813,500 | | | | 1,363,888 | | |
Total Singapore common stocks | | | | | 4,021,618 | | |
United Kingdom—4.09% | |
Hammerson PLC | | | 445,585 | | | | 4,578,681 | | |
Hansteen Holdings PLC | | | 801,200 | | | | 1,523,955 | | |
Total United Kingdom common stocks | | | | | 6,102,636 | | |
United States—54.55% | |
AvalonBay Communities, Inc. | | | 22,200 | | | | 3,825,948 | | |
Brandywine Realty Trust | | | 186,800 | | | | 2,572,236 | | |
Brixmor Property Group, Inc. | | | 94,100 | | | | 2,302,627 | | |
Camden Property Trust | | | 33,200 | | | | 2,643,716 | | |
CBL & Associates Properties, Inc. | | | 171,388 | | | | 2,800,480 | | |
Corporate Office Properties Trust | | | 103,400 | | | | 2,391,642 | | |
| | | Number of
shares | | Value | |
Common stocks—(concluded) | |
United States—(concluded) | |
DCT Industrial Trust, Inc. | | | 46,625 | | | $ | 1,620,685 | | |
Douglas Emmett, Inc.1 | | | 112,300 | | | | 3,291,513 | | |
Equity Residential | | | 29,600 | | | | 2,214,376 | | |
HCP, Inc. | | | 98,400 | | | | 3,802,176 | | |
Hersha Hospitality Trust | | | 52,800 | | | | 1,431,936 | | |
Highwoods Properties, Inc.1 | | | 63,800 | | | | 2,700,654 | | |
Host Hotels & Resorts, Inc. | | | 203,783 | | | | 3,949,315 | | |
Hudson Pacific Properties, Inc. | | | 38,600 | | | | 1,188,108 | | |
Mid-America Apartment
Communities, Inc.1 | | | 61,600 | | | | 4,948,944 | | |
NorthStar Realty Finance Corp.1 | | | 106,000 | | | | 1,696,000 | | |
OUTFRONT Media, Inc. | | | 155,973 | | | | 3,919,601 | | |
Parkway Properties, Inc. | | | 90,500 | | | | 1,623,570 | | |
ProLogis, Inc. | | | 157,361 | | | | 6,390,430 | | |
Simon Property Group, Inc. | | | 61,002 | | | | 11,420,794 | | |
SL Green Realty Corp. | | | 22,800 | | | | 2,625,192 | | |
Sunstone Hotel Investors, Inc. | | | 98,500 | | | | 1,385,895 | | |
Ventas, Inc. | | | 74,300 | | | | 4,984,787 | | |
Vornado Realty Trust | | | 41,991 | | | | 4,096,222 | | |
WP GLIMCHER, Inc. | | | 110,220 | | | | 1,492,379 | | |
Total United States common stocks | | | | | 81,319,226 | | |
Total common stocks
(cost—$145,245,207) | | | | | 147,032,070 | | |
| | | Face
amount | | | |
Repurchase agreement—0.84% | |
Repurchase agreement dated
07/31/15 with State Street
Bank and Trust Co., 0.000%
due 08/03/15, collateralized
by $358,588 Federal Home
Loan Mortgage Corp. obligations,
2.080% due 10/17/22, $89,988
Federal National Mortgage
Association obligations, 2.170%
due 10/17/22 and $802,383
US Treasury Notes, 1.625% to
3.625% due 03/31/19 to
06/30/20; (value—$1,271,961);
proceeds: $1,247,000
(cost—$1,247,000) | | $ | 1,247,000 | | | | 1,247,000 | | |
| | | Number of
shares | | | |
Investment of cash collateral from securities loaned—1.26% | |
Money market fund—1.26% | |
UBS Private Money Market Fund LLC2
(cost—$1,874,653) | | | 1,874,653 | | | | 1,874,653 | | |
Total investments
(cost—$148,366,860)—100.72% | | | | | 150,153,723 | | |
Liabilities in excess of
other assets—(0.72)% | | | | | (1,073,546 | ) | |
Net assets—100.00% | | $ | 149,080,177 | | |
212
PACE Select Advisors Trust
PACE Global Real Estate Securities Investments
Portfolio of investments—July 31, 2015
For a listing of defined portfolio acronyms that are used throughout the Portfolio of investments as well as the tables that follow, please refer to page 254.
Aggregate cost for federal income tax purposes was $149,787,059; and net unrealized appreciation consisted of:
Gross unrealized appreciation | | $ | 5,372,490 | | |
Gross unrealized depreciation | | | (5,005,826 | ) | |
Net unrealized appreciation | | $ | 366,664 | | |
Fair valuation summary
The following is a summary of the fair valuations according to the inputs used as of July 31, 2015 in valuing the Portfolio's investments:
Assets
Description | | Unadjusted
quoted prices in
active markets for
identical investments
(Level 1) | | Other significant
observable inputs
(Level 2) | | Unobservable
inputs
(Level 3) | | Total | |
Common stocks | | $ | 147,032,070 | | | $ | — | | | $ | — | | | $ | 147,032,070 | | |
Repurchase agreement | | | — | | | | 1,247,000 | | | | — | | | | 1,247,000 | | |
Investment of cash collateral from securities loaned | | | — | | | | 1,874,653 | | | | — | | | | 1,874,653 | | |
Total | | $ | 147,032,070 | | | $ | 3,121,653 | | | $ | — | | | $ | 150,153,723 | | |
At July 31, 2015, there were no transfers between Level 1 and Level 2.
Portfolio footnotes
* Non-income producing security.
1 Security, or portion thereof, was on loan at July 31, 2015.
2 The table below details the Portfolio's transaction activity in an affiliated issuer during the year ended July 31, 2015. The investment manager earns a management fee from UBS Private Money Market Fund LLC. Please see the Notes to financial statements for further information.
Security description | | Value at
07/31/14 | | Purchases
during the
year ended
07/31/15 | | Sales
during the
year ended
07/31/15 | | Value at
07/31/15 | | Net income
earned from
affiliate for the
year ended
07/31/15 | |
UBS Private Money Market Fund LLC | | $ | 3,424,337 | | | $ | 37,940,238 | | | $ | 39,489,922 | | | $ | 1,874,653 | | | $ | 272 | | |
See accompanying notes to financial statements.
213
PACE Select Advisors Trust
PACE Alternative Strategies Investments
Performance (unaudited)
For the 12 months ended July 31, 2015, the Portfolio's Class P shares gained 4.79% before the deduction of the maximum PACE Select program fee.1 In comparison, the Citigroup Three-Month US Treasury Bill Index (the "benchmark") returned 0.02%, the Barclays Global Aggregate Index declined 6.04%, the MSCI World Free Index (net) rose 4.93%, the HFRI Fund of Funds Composite Index (net) returned 4.61%, the Lipper Alternative Multi-Strategy Funds category posted a median return of 2.50%. (Returns for all share classes over various time periods are shown in the "Performance at a glance" table on page 222. Please note that the returns shown do not reflect the deduction of taxes that a shareholder would pay on Portfolio distributions or the redemption of Portfolio shares.) For a detailed commentary on the market environment in general during the reporting period, please refer to page 2.
Sub-advisors' comments2
Please note: UBS Global Asset Management was granted authority to manage a portion of the Portfolio effective March 31, 2014 and made its first investment in October 2014. On May 19, 2015, First Quadrant's Equitized Global Macro sleeve was eliminated from the Portfolio. On May 20, 2015, Sirios Capital Management began serving as a sub-advisor for this Portfolio.
Analytic Investors
Our portion of the Portfolio consists of long/short equity positions.3 Our process is based on the premise that investor behavior changes—although slowly—and is fairly persistent from month to month. To support this premise, our model is driven by specific security characteristics within seven groups (such as valuation, quality and liquidity) to help us identify potential investment opportunities.
1 Class P shares held through the PACE Select Advisors Program are subject to a maximum Program fee of 2.50%, which, if included, would have reduced performance. Class P shares held through other advisory programs also may be subject to a program fee, which, if included, would have reduced performance.
2 All sub-advisors discuss performance on a gross-of-fees basis—meaning that no fees or expenses are reflected in their sleeves'/sleeve's performance. Alternately, Portfolio performance is shown net of fees, which does factor in fees and expenses associated with the Portfolio.
3 When a long position is taken, a security is purchased with the expectation that it will rise in value. A short position is taken when we believe, based on our research, that securities are overpriced, and, therefore, we hope to make a profit when the security falls in value. When shorting an investment, we borrow the security, sell it and then buy an equal number of shares later—hopefully at a lower price—to replace those we borrowed.
PACE Select Advisors Trust –
PACE Alternative Strategies Investments
Investment Advisor:
UBS Global Asset Management ("UBS Global AM")
Investment Sub-Advisors:
Analytic Investors, LLC ("Analytic Investors"); First Quadrant L.P. ("First Quadrant");
Standard Life Investments (Corporate Funds) Limited ("Standard Life Investments");
AQR Capital Management, LLC ("AQR");
Sirios Capital Management, L.P. ("Sirios")
Portfolio Managers:
Analytic Investors: Dennis Bein, David Krider and Harindra de Silva;
First Quadrant: Dori Levanoni and Ed Peters
Standard Life Investments: Guy Stern and Roger Sadewsky;
AQR: Clifford Asness, John Liew, Brian Hurst, Yao Hua Ooi and Ari Levine;
UBS Global AM: Mabel Lung, Gina Toth and Fred Lee;
Sirios: John F. Brennan, Jr.
Objective:
Long-term capital appreciation
Investment process:
Analytic Investors primarily employs a long/short global equity strategy. This strategy is implemented by taking long and short positions of equity securities publicly traded in the United States and in foreign markets both by direct equity investment and through derivatives. Analytic Investors' strategy may also employ the use of derivatives, such as swaps, futures, non-deliverable forwards ("NDFs"), and forward contracts.
First Quadrant employs a "global macro strategy" which is implemented by combining several different complex investment techniques. It uses a "tactical
214
PACE Select Advisors Trust
PACE Alternative Strategies Investments
Sub-advisors' comments – continued
Positioning based on these characteristics was strong in the majority of categories, with the exception of the valuation category (historical earnings-to-price and sales-to-price), which underperformed. Specifically, an overweight to companies with favorable sales and earnings-to-price underperformed as investors focused more on growth traits. This was more than offset by strong results within the revisions category (earning estimate revisions), technical category (supply/demand) and quality category (asset utilization and return on assets). An emphasis on companies with positive earnings estimate revisions added value, as did emphasizing companies with positive price momentum.
An emphasis on low-beta stocks also helped performance during the period, as low-beta securities outperformed high-beta securities. (Beta is a measure of volatility or risk relative to the market as a whole.)
During the reporting period, we experienced positive results in the majority of regions, led by North America. While an overweight position to Canada was a modest drag on performance, stock selection within Canada and the US was particularly strong. Sector positioning was also positive, led by underweight positions to energy and materials. While an overweight to information technology also helped, stock selection within this sector negatively impacted results.
The top performing equities were short positions in Canadian materials company Yamana Gold and US-based Cobalt Energy. The worst performing positions were a long position in US-based Helmerich & Payne and a short position in Vertex Pharmaceuticals, Inc. The position in Vertex Pharmaceuticals was closed prior to the end of the reporting period due to the changing risk profile of the company.
Derivatives were not used during the reporting period.
First Quadrant: Global Macro
The FQ Global Macro sleeve has a targeted volatility of 6% and a benchmark of US Treasury bills. During the reporting period, positive performance from global asset class selection and stock country selection were more than offset by losses from currency selection and volatility alpha (which seeks to profit from the difference between prices of options), as well as bond country selection.
After a strong period, currency selection began to struggle when our Norwegian krone position was negatively impacted
Investment process (continued)
risk allocation" approach across global markets, which increases investment risk, where it believes opportunities for risk-adjusted profit are high and attempts to lower market risks when it believes gains have been realized and future gains are unlikely. First Quadrant also assesses the combination of local market and economic factors as well as global equity, fixed income or currency market factors and attempts to capture inefficiencies in those markets. First Quadrant's strategy is primarily implemented through the use of derivatives. First Quadrant presently manages two separate portions of the Fund's assets, using the aforementioned strategies and investments. With respect to the first portion, First Quadrant seeks positive absolute returns from its global macro strategy, and the returns of this portion are not expected to be closely correlated with those of global equity markets. With respect to the second portion, First Quadrant combines its global macro strategy with passive exposure to global equity markets while targeting a specific level of risk, which is expected to result in returns more closely correlated with those of global equity markets.
Standard Life Investments employs a "global multi-asset strategy" and seeks to achieve a total return by delivering a diversified global portfolio that makes use of multiple strategies across various asset classes. Standard Life Investments aims to exploit market cyclicality and a diverse array of inefficiencies across and within global markets to maximize risk adjusted absolute return. Standard Life Investments' portion of the Portfolio consists of listed equity, equity-related and debt securities, including exchange traded funds, and will routinely make use of derivatives or other instruments both for investment and hedging purposes. Standard Life
215
PACE Select Advisors Trust
PACE Alternative Strategies Investments
Sub-advisors' comments – continued
by tumbling oil prices. In addition, the Bank of Japan's decision to add further stimulus to the economy despite signs of success of the past rounds of policy initiatives negatively impacted our long Japanese yen position. The surprise decision by the Swiss National Bank to abandon the established floor against the euro led to an immediate and sharp loss in January 2015. Since then, currency selection has delivered basically flat returns.
Stock country selection benefited from heightened equity market volatility. Well-timed long Australian, UK and Italian equity positions were notable performers. The notable detractor was our long German equity position.
Bond country selection suffered throughout the reporting period, as the sustained divergence in economies and central bank policies drove sovereign bond flows against our relative value model. In particular, we were hurt by our US Treasury long and our short on the German bund.
Global asset class selection was long stocks against bonds throughout the period which benefited performance.
Volatility alpha, which seeks to profit from the differences between the prices of options, was negative for the reporting period. Losses incurred in the fourth quarter of 2014 following dramatic spikes in market volatility brought the sleeve into negative territory. 2015 saw a moderate recovery, as our hedging strategies were adjusted in an effort to better protect against sudden drawdowns.
As a general rule, derivatives are the primary instrument used to implement our portion of the Portfolio. Specifically, we used futures to implement stock and bond country selection and global asset class selection strategies. We used currency forwards to implement currency selection. Futures and forwards were used to gain economic exposure in a more cost-efficient manner relative to traditional instruments (e.g., physical stocks, bonds and currencies). The volatility alpha sleeve was implemented using options on futures and indices. Options were used to exploit structural characteristics of options pricing. Overall, the liquidity and low transaction cost of these instruments offers the investment team the ability to be more nimble and to implement at a lower cost.
Investment process (continued)
Investments may take long and/or short positions, and its derivative investments may include, but are not restricted to, futures, options, swaps, and forward currency contracts.
AQR employs a Managed Futures strategy, which is an active trend-following strategy. Trend-following involves going long assets that have been rising in price and short assets that have been declining in price. The managed futures strategy is primarily implemented through the use of derivatives and invests across three major asset classes: equities, fixed income and currencies. The AQR Managed Futures strategy seeks to generate returns that are uncorrelated to traditional asset classes and may improve portfolio diversification.
UBS Global AM allocates a portion of the fund's assets primarily to unaffiliated actively- and passively-managed pooled investment vehicles, including ETFs, that it believes are suitable for return generation, risk management (e.g., increased portfolio diversification), or both. In addition, UBS Global AM may invest in index futures primarily for cash management (i.e., to obtain certain market exposures in the fund and reduce cash holdings) and risk management purposes. UBS Global AM generally invests in other unaffiliated pooled investment vehicles and index futures that have risk and return objectives that are deemed to be complementary to the other investments and strategies within the fund overall.
Sirios Capital Management employs a fundamental, bottom-up, long/short strategy that is focused primarily on U.S. equities. For long positions, the investment team concentrates on mid/large cap companies where we see unrecognized growth over a 3-5 year period and a
216
PACE Select Advisors Trust
PACE Alternative Strategies Investments
Sub-advisors' comments – continued
First Quadrant: Equitized Global Macro
The FQ Equitized Global Macro sleeve had a targeted volatility of 4% and is benchmarked to the MSCI World Monthly Price Index (Unhedged). During the period from August 1, 2014 through May 19, 2015, positive performance from global asset class selection and stock country selection were more than offset by losses from currency selection and volatility alpha (which seeks to profit from the difference between prices of options). The underlying benchmark was up over the period, and the benchmark replication produced excess returns versus the benchmark.
After a strong period, currency selection began to struggle when our Norwegian krone position was negatively impacted by tumbling oil prices. In addition, the Bank of Japan's decision to add further stimulus to the economy, despite signs of success of the past rounds of policy initiatives, negatively impacted our long Japanese yen position. The surprise decision by the Swiss National Bank to abandon the established floor against the euro led to an immediate and sharp loss in January 2015. Since then, currency selection has delivered basically flat returns.
Stock country selection benefited from heightened equity market volatility. Bond country selection detracted modestly due to our US Treasury long and our short view on the German bund.
Volatility alpha, which seeks to profit from the differences between the prices of options, was negative for the reporting period. Losses incurred in the fourth quarter of 2014 following dramatic spikes in market volatility brought the sleeve into negative territory. 2015 saw a moderate recovery as our hedging strategies were adjusted to better protect against sudden drawdowns.
As a general rule, derivatives are the primary instrument used to implement all of the sleeves in our portion of the Portfolio. Specifically, we used futures to implement stock and bond country selection and global asset class selection strategies. We used currency forwards to implement currency selection. Futures and forwards were used to gain economic exposure in a more cost-efficient manner relative to traditional instruments (e.g., physical stocks, bonds and currencies). The volatility alpha sleeve was implemented using options on futures and indices. Options were used to exploit structural characteristics of options pricing. Overall, the liquidity and low transaction cost of these instruments offers the investment team the ability to be more nimble and to implement at a lower cost.
Standard Life Investments
The largest contributors to performance during the reporting period were currency positions (which use foreign exchange forwards and options to gain exposure to moves between currencies), driven by the strong US dollar and a weaker euro. The improving economic landscape in the US, combined with expectations that the Federal Reserve Board will begin to raise rates, provided support for the US dollar. In contrast, the expectation of quantitative easing from the European Central Bank and its eventual delivery weighed on the euro. Consequently, our long US dollar versus euro, long US dollar versus Canadian dollar and Indian rupee versus euro positions delivered strong returns. The long US dollar versus Canadian dollar was closed after reaching its performance target.
Commodity prices declined during the reporting period as demand from China, the most significant consumer of metals and energy, remained weak amid expanding commodity inventories. As a result, our global equity miners and global equity oil majors positions detracted from performance. A Swiss equity short, which had been part of the global miners position, was closed following a decline in Swiss equities after the removal of the mechanism
Investment process (concluded)
favorable valuation. The short positions generally include a selection of liquid large cap companies, sector hedges and index put options.
217
PACE Select Advisors Trust
PACE Alternative Strategies Investments
Sub-advisors' comments – continued
that limited the strength of the Swiss franc against the euro. The global equity oil majors position was closed following significant changes in fundamentals. The Swiss equity short of global miners versus Swiss equity strategy was implemented through equity futures.
An Australian short-term interest rate position delivered positive returns after Australia cut interest rates to stimulate economic growth and to facilitate the depreciation of the currency. Conversely, a short US duration position detracted from performance, as interest rates fell in the US. This position seeks to benefit from increasing Treasury interest rates. These strategies are implemented through forward interest rate swaps.
We made extensive use of derivatives in implementing our portion of the Portfolio. We typically utilized futures to gain long and short exposure to equity and bond markets, to vary our overall exposure and to create relative value positions. We used currency forwards to take explicit currency positions or to hedge unwanted currency risk on other strategies. Swaps were used primarily to express our views on interest rates, equity variance and credit default risk, as they can provide an efficient and direct way of accessing these asset classes. Swaps also allowed us to take risk exposures by targeting specific markets and/or points on a curve. We used options positions where we wanted to combine a view on volatility with a view on another asset class, typically equities or currencies. Options were also used to mitigate risks within a strategy. Overall, derivatives were instrumental to the performance and operating efficiency of the Portfolio.
AQR
Our managed futures strategy is an active trend-following strategy that employs a diverse portfolio of derivative instruments (primarily futures, swaps and forwards) to achieve exposure to various global markets. Our portion of the Portfolio generated strong positive absolute returns during the reporting period. By signal horizon, long-term trend signals contributed meaningfully to performance, while short-term signals contributed a small amount and overextended signals detracted from results.
Trend following in currencies was the largest contributor to performance over the period. During the second half of 2014, the US dollar rallied against most major developed and emerging currencies, driven by central bank divergences. The Federal Reserve Board (the "Fed") ended quantitative easing ("QE"), while the Bank of Japan launched massive stimulus measures and the European Central Bank ("ECB") commenced stimulus, starting with its covered bond purchase program and ultimately its version of QE. These divergences helped create a strong trend in the US dollar. 2015 began with a continuation of the trends which benefited in late 2014. During the first quarter of 2015, the Fund continued to benefit from central bank policy divergences, prompting a sell-off in the euro, with the US remaining on course for an eventual rate hike, supporting the US dollar. However, these trends sharply reversed in April 2015, as currency markets broadly experienced significant reversals and choppiness leading to losses in US dollar, euro and Japanese yen crosses.
Trend following in fixed income also contributed to performance. During the second half of 2014, central bank activities and falling oil prices pressured bond yields, which led to flattening yield curves globally. We entered 2015 long developed bonds and short-term interest rate futures markets, with over-extended signals mitigating the sizes of those positions. Central banks' policies provided tailwinds to trend following in fixed income in the first quarter of 2015, prompted by the ECB's QE program and surprise rate cuts in Canada and Australia. Bond markets globally suffered a significant reversal in the second quarter of 2015, led by European bond markets. Over-extended signals' reduction of our portfolio's fixed income positions during most of 2014 and through the beginning of 2015 was beneficial during the recent sell-off.
218
PACE Select Advisors Trust
PACE Alternative Strategies Investments
Sub-advisors' comments – continued
Equities detracted from performance over the reporting period. Toward the end of 2014, global equities experienced a sharp correction, as QE ended in the US and the possibility of a spreading Ebola virus and weakening global growth increased risk aversion. When equity markets snapped back, long-term signals did not respond as quickly as short-term signals, causing them to hold onto their losses. In early 2015, developed equities experienced historic rallies as the ECB launched its QE program. However, a pullback in the second quarter of 2015 on worries over a Greek exit from the eurozone led to reversals and losses.
Most positions in our portion of the Portfolio are implemented through derivative instruments. The Portfolio uses global developed and emerging market exchange traded futures, futures-related instruments, forward contracts and swaps across three major asset classes: equities, fixed income and currencies. The portfolio is, with the exception of cash holdings, exclusively implemented via derivative instruments. As a result, performance of the fund is primarily from the performance of derivatives-based positions.
UBS Global Asset Management
UBS Global Asset Management was granted authority to manage a portion of the Portfolio effective March 31, 2014 and made its first investment in October 2014. During the reporting period, the US Treasury yield curve flattened, producing positive returns in all maturities, particularly in the 10-20 year part of the curve. Meanwhile, global developed market sovereign bonds generally outperformed US Treasuries on a currency-hedged basis. Given the pressure on risk assets, investment grade credit underperformed Treasuries as spreads widened, with longer-dated corporates underperforming more significantly. While high yield credit also underperformed Treasuries overall, this was mostly driven by lower-quality segments of the market, as higher-quality BB-rated issues produced positive excess returns versus US Treasuries. The US dollar strengthened against most other major currencies.
Our portion of the Portfolio consists primarily of third-party funds. During the reporting period, positive performance from Scout Unconstrained Bond Fund was more than offset by negative performance from Legg Mason BW Absolute Return Opportunities Fund. Scout Unconstrained Bond Fund produced positive returns primarily due to having exposure to the higher-quality portions of the high yield corporate market and an underexposure to German bunds.
Legg Mason BW Absolute Return Opportunities Fund underperformed, primarily due to exposures to investment grade corporate bonds and B-rated corporate high yield bonds, as well as an overexposure to short-duration securities during a period when yield curves flattened. Currency exposures contributed to performance, which was partially offset by underperformance elsewhere, as our portion of the Portfolio was largely long the US dollar over the period.
We did not use derivatives during the reporting period.
Sirios Capital Management
We began managing a portion of the Portfolio on May 20, 2015. We seek to buy attractively valued, growth-oriented stocks of mid- to large-capitalization companies and short stocks of companies with deteriorating fundamentals and vulnerable balance sheets. The investment team utilizes a fundamental, bottom-up research approach. The team seeks to identify longer-term investment opportunities (3-5 years for core longs) and will adjust weightings based on valuation and fundamentals. We combine the flexibility of a multi-sector, diversified long/short hedge fund with the focus of an individual sector fund. This allows us to potentially benefit from portfolio management skill, as we invest across sectors on a global basis, as well as the fundamental advantage of our focus within each sector.
219
PACE Select Advisors Trust
PACE Alternative Strategies Investments
Sub-advisors' comments – concluded
From May 20, 2015 through July 31, 2015, our long positions contributed to performance, whereas our short exposures were largely flat. Geographically, the US added the most value, whereas Europe modestly detracted from results. The most significant individual long contributors to performance were Allergan, Bank of America, Carnival, Google and T-Mobile US. The largest long detractors were Commvault Systems, DISH Network, Monsanto, NorthStar Realty Finance and Precision Castparts. All but Precision Castparts remained in our portion of the Portfolio at the end of the reporting period.
Exposure to the US market continues to be our primary focus in 2015. Recent events in Europe, particularly the turmoil in Greece, highlight the long-term instability of the euro and the difficult choices that constituents will face in the years ahead. China continues to attempt to play the middle ground between a market-based economy and central government control. With the economy over-stimulated and the rampant misallocation of capital resources, a significant economic correction is likely over the mid-term. We are striving to insulate our exposure and benefit as the excessive investment cycle unwinds.
The stock-picking environment has been much improved this year, and we expect that trend to continue. Higher interest rates, a stronger dollar, lower commodity and energy prices, and a mixed global GDP outlook create numerous cross-winds from a macro standpoint and highlight the importance of company-specific factors to drive stock performance.
During the reporting period we used forward currency contracts to hedge the currency exposure on our non-US dollar positions. The currency hedges modestly contributed to performance.
Special considerations
The Portfolio may be appropriate for investors seeking long-term capital appreciation who are able to withstand short-term fluctuations in the equity markets and fixed income markets in return for potentially higher returns over the long term. The Portfolio may employ investment strategies that involve greater risks than the strategies used by many other mutual funds, including increased use of short sales (which involve the risk of an unlimited increase in the market value of the security sold short, which could result in a theoretically unlimited loss), leverage and derivative transactions, and hedging strategies. The value of the Portfolio changes every day and can be affected by changes in interest rates, general market conditions, and other political, social and economic developments, as well as specific matters relating to the issuers of securities in which the Portfolio invests. The value of the Portfolio's investments in foreign securities may fall due to adverse political, social and economic developments abroad, and due to decreases in foreign currency values relative to the US dollar. It is important to note that an investment in the Portfolio is only one component of a balanced investment plan.
220
PACE Select Advisors Trust
PACE Alternative Strategies Investments
Illustration of an assumed investment of $10,000 in Class P shares of the Portfolio (unaudited)
The following graph depicts the performance of PACE Alternative Strategies Investments Class P shares versus the Citigroup Three-Month US Treasury Bill Index, the Barclays Global Aggregate Index, the MSCI World Free Index (net) and the HFRI Fund of Funds Composite Index (net) from April 30, 2006, the month-end after the inception date of the Class P shares, through July 31, 2015. Class P shares held through advisory programs may be subject to a program fee, which, if included, would have reduced performance. The performance of the other classes will vary based upon the different class specific expenses and sales charges. The performance provided does not reflect the deduction of taxes that a shareholder would pay on Portfolio distributions or the redemption of Portfolio shares. Past performance is no guarantee of future results. Share price and returns will vary with market conditions; investors may realize a gain or loss upon redemption. It is important to note that PACE Alternative Strategies Investments is a professionally managed portfolio while the Indices are not available for investment and are unmanaged. The comparison is shown for illustration purposes only.
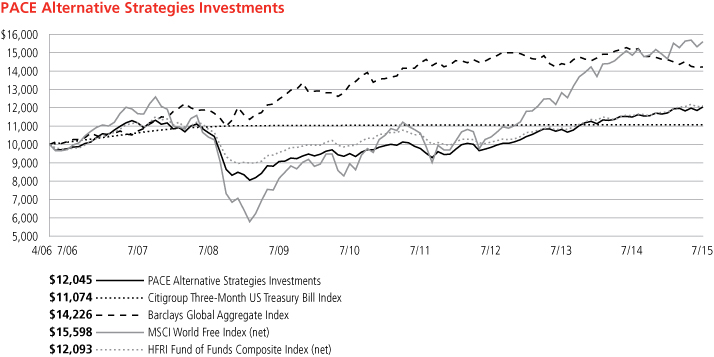
221
PACE Select Advisors Trust
PACE Alternative Strategies Investments
Performance at a glance (unaudited)
Average annual total returns for periods ended 07/31/15 | | 1 year | | 5 years | | Since Inception1 | |
Before deducting maximum sales charge | |
Class A2 | | | 4.52 | % | | | 4.59 | % | | | 1.94 | % | |
Class C3 | | | 3.81 | | | | 3.85 | | | | 1.25 | | |
Class Y4 | | | 4.82 | | | | 4.83 | | | | 1.74 | | |
Class P5 | | | 4.79 | | | | 4.87 | | | | 2.20 | | |
After deducting maximum sales charge | |
Class A2 | | | (1.25 | ) | | | 3.42 | | | | 1.32 | | |
Class C3 | | | 2.81 | | | | 3.85 | | | | 1.25 | | |
Citigroup Three-Month US Treasury Bill Index6 | | | 0.02 | | | | 0.06 | | | | 1.11 | | |
Barclays Global Aggregate Index7 | | | (6.04 | ) | | | 1.44 | | | | 3.88 | | |
MSCI World Free Index (net)8 | | | 4.93 | | | | 11.74 | | | | 4.92 | | |
HFRI Fund of Funds Composite Index (net)9 | | | 4.61 | | | | 4.00 | | | | 2.08 | | |
Lipper Alternative Multi-Strategy Funds median | | | 2.50 | | | | 4.55 | | | | 2.03 | | |
Most recent calendar quarter-end returns (unaudited)
Average annual total returns for periods ended 06/30/15 | | 1 year | | 5 years | | Since Inception1 | |
Before deducting maximum sales charge | |
Class A2 | | | 2.44 | % | | | 4.57 | % | | | 1.78 | % | |
Class C3 | | | 1.85 | | | | 3.84 | | | | 1.10 | | |
Class Y4 | | | 2.74 | | | | 4.78 | | | | 1.53 | | |
Class P5 | | | 2.80 | | | | 4.85 | | | | 2.04 | | |
After deducting maximum sales charge | |
Class A2 | | | (3.19 | ) | | | 3.40 | | | | 1.16 | | |
Class C3 | | | 0.85 | | | | 3.84 | | | | 1.10 | | |
The annualized gross and net expense ratios, respectively, for each class of shares as in the November 28, 2014 prospectuses, were as follows: Class A—2.02% and 1.95%; Class C—2.76% and 2.69%; Class Y—1.80% and 1.73%; and Class P—1.79% and 1.72%. Net expenses reflect fee waivers and/or expense reimbursements, if any, pursuant to an agreement that is in effect to cap the expenses. The Portfolio and UBS Global Asset Management (Americas) Inc. ("UBS Global AM") have entered into a written fee waiver/expense reimbursement agreement pursuant to which UBS Global AM is contractually obligated to waive its management fees and/or reimburse expenses so that the Portfolio's ordinary total operating expenses of each class through November 30, 2015 (excluding dividend expense, borrowing costs, and interest expense relating to short sales, and expenses attributable to investment in other investment companies, interest, taxes, brokerage commissions and extraordinary expenses) would not exceed Class A—1.88%; Class C—2.63%; Class Y—1.63%; and Class P—1.63%. The Portfolio has agreed to repay UBS Global AM for any waived fees/reimbursed expenses to the extent that it can do so over the following three fiscal years without causing the Portfolio's expenses in any of those three years to exceed these expense caps. The fee waiver/expense reimbursement agreement may be terminated by the Portfolio's board at any time and also will terminate automatically upon the expiration or termination of the Portfolio's advisory contract with UBS Global AM. Upon termination of the agreement, however, UBS Global AM's three year recoupment rights will survive.
1 Since inception returns are calculated as of commencement of issuance on April 10, 2006 for Class P and Class A shares, and April 11, 2006 for Class C shares. Class Y shares commenced issuance on April 3, 2006, and had fully redeemed by July 27, 2006 remaining inactive through July 22, 2008. The inception return of Class Y shares is calculated from July 23, 2008, which is the date the Class Y shares recommenced investment operations. Since inception returns for the Indices and Lipper median are shown as of April 30, 2006, which is the month-end after the inception date of the oldest share classes (Class P and Class A).
2 Maximum sales charge for Class A shares is 5.5%. Class A shares bear ongoing 12b-1 service fees.
3 Maximum contingent deferred sales charge for Class C shares is 1% imposed on redemptions and is reduced to 0% after one year. Class C shares bear ongoing 12b-1 service and distribution fees.
4 The Portfolio offers Class Y shares to a limited group of eligible investors, including certain qualifying retirement plans. Class Y shares do not bear initial or contingent deferred sales charges or ongoing 12b-1 service and distribution fees.
5 Class P shares do not bear initial or contingent deferred sales charges or ongoing 12b-1 service and distribution fees, but Class P shares held through advisory programs may be subject to a program fee, which, if included, would have reduced performance.
6 The Citigroup Three-Month US Treasury Bill Index is an unmanaged index reflecting monthly return equivalents of yield averages that are not marked to the market and an average of the last three 3-month T-bill month-end rates. 3-month T-bills are the short-term debt obligations of the US government. Investors should note that indices do not reflect the deduction of fees and expenses.
7 The Barclays Global Aggregate Index is an unmanaged broad-based, market capitalization weighted index which is designed to measure the broad global markets for US and non US corporate, government, governmental agency, supranational, mortgage-backed and asset-backed fixed income securities. Investors should note that indices do not reflect the deduction of fees and expenses.
8 The MSCI World Free Index (net) is a free float-adjusted market capitalization weighted index that is designed to measure the equity market performance of developed markets. Net total return indices reinvest dividends after the deduction of withholding taxes, using a tax rate applicable to non-resident institutional investors who do not benefit from double taxation treaties. The index is constructed and managed with a view to being fully investable from the perspective of international institutional investors. Investors should note that indices do not reflect the deduction of fees and expenses.
9 The HFRI Fund of Funds Composite Index is a Fund of Funds index with multiple managers through funds or managed accounts. The strategy designs a diversified portfolio of managers with the objective of significantly lowering the risk (volatility) of investing with an individual manager. The Fund of Funds manager has discretion in choosing which strategies to invest in for the portfolio. A manager may allocate funds to numerous managers within a single strategy, or with numerous managers in multiple strategies. The minimum investment in a Fund of Funds may be lower than an investment in an individual hedge fund or managed account. The investor has the advantage of diversification among managers and styles with significantly less capital than investing with separate managers. Investors should note that indices do not reflect the deduction of fees and expenses.
Prior to February 17, 2015, if an investor sold or exchanged shares less than 90 days after purchase, a redemption fee of 1.00% of the amount sold or exchanged was deducted at the time of the transaction, except as noted otherwise in the prospectus. For sales or exchanges taking place on or after February 17, 2015 but prior to August 3, 2015, there is a reduction in the redemption holding period from 90 days to 30 days. Effective August 3, 2015, the 1.00% redemption fee imposed on sales or exchanges of any class of shares of the portfolios made during the holding periods specified in the prospectus was eliminated. Please refer to the prospectus for further information.
Past performance does not predict future performance, and the performance information provided does not reflect the deduction of taxes that a shareholder would pay on Portfolio distributions or the redemption of Portfolio shares. The return and principal value of an investment will fluctuate, so that an investor's shares, when redeemed, may be worth more or less than their original cost. Performance results assume reinvestment of all dividends and capital gain distributions at net asset value on the ex-dividend dates. Current performance may be higher or lower than the performance data quoted. For month-end performance figures, please visit http://globalam-us.ubs.com/corpweb/performance.do.
Lipper peer group data calculated by Lipper Inc.; used with permission. The Lipper median is the return of the fund that places in the middle of a Lipper peer group.
222
PACE Select Advisors Trust
PACE Alternative Strategies Investments
Portfolio statistics (unaudited)
Characteristics | | 07/31/15 | |
Net assets (mm) | | $ | 801.9 | | |
Number of holdings | | | 588 | | |
Portfolio composition1 | | 07/31/15 | |
Common stocks, ADRs, preferred stocks, rights, and warrants | | | 36.6 | % | |
Investment companies | | | 7.5 | | |
Bonds and notes | | | 6.4 | | |
Options, futures, swaps, and forward foreign currency contracts | | | 1.0 | | |
Investments sold short | | | (6.6 | ) | |
Cash equivalents and other assets less liabilities | | | 55.1 | | |
Total | | | 100.0 | % | |
Top five countries (long holdings)1 | | 07/31/15 | |
United States | | | 30.6 | % | |
United Kingdom | | | 2.6 | | |
Japan | | | 2.5 | | |
Mexico | | | 2.2 | | |
Brazil | | | 1.7 | | |
Total | | | 39.6 | % | |
Top five equity sectors (long holdings)1 | | 07/31/15 | |
Financials | | | 7.3 | % | |
Consumer Discretionary | | | 6.3 | | |
Health Care | | | 6.1 | | |
Information Technology | | | 5.0 | | |
Industrials | | | 4.4 | | |
Total | | | 29.1 | % | |
Top five countries (short holdings)1 | | 07/31/15 | |
United States | | | (4.5 | )% | |
Canada | | | (0.9 | ) | |
France | | | (0.3 | ) | |
Japan | | | (0.2 | ) | |
Curacao | | | (0.2 | ) | |
Total | | | (6.1 | )% | |
Top five equity sectors (short holdings)1 | | 07/31/15 | |
Energy | | | (2.2 | )% | |
Financials | | | (1.4 | ) | |
Industrials | | | (0.8 | ) | |
Materials | | | (0.7 | ) | |
Consumer Discretionary | | | (0.5 | ) | |
Total | | | (5.6 | )% | |
223
PACE Select Advisors Trust
PACE Alternative Strategies Investments
Portfolio statistics (unaudited) (concluded)
Top ten equity holdings (long holdings)1,2 | | 07/31/15 | |
Time Warner, Inc. | | | 0.6 | % | |
Constellation Brands, Inc., Class A | | | 0.6 | | |
Cardinal Health, Inc. | | | 0.6 | | |
Gilead Sciences, Inc. | | | 0.5 | | |
Raytheon Co. | | | 0.5 | | |
Amgen, Inc. | | | 0.5 | | |
Bank of America Corp. | | | 0.5 | | |
Merck & Co., Inc. | | | 0.5 | | |
DISH Network Corp., Class A | | | 0.4 | | |
Hewlett-Packard Co. | | | 0.4 | | |
Total | | | 5.1 | % | |
Top ten equity holdings (short holdings)1,2 | | 07/31/15 | |
Cheniere Energy, Inc. | | | (0.3 | )% | |
Alstom SA | | | (0.3 | ) | |
Nabors Industries Ltd. | | | (0.2 | ) | |
Halliburton Co. | | | (0.2 | ) | |
American Airlines Group, Inc. | | | (0.2 | ) | |
The Williams Cos., Inc. | | | (0.2 | ) | |
Restaurant Brands International, Inc. | | | (0.2 | ) | |
Whiting Petroleum Corp. | | | (0.2 | ) | |
NRG Energy, Inc. | | | (0.2 | ) | |
Fresnillo PLC | | | (0.2 | ) | |
Total | | | (2.2 | )% | |
Top ten long-term fixed income holdings
(long holdings)1,2 | | 07/31/15 | |
Mexican Bonos, 8.500%, due 05/31/29 | | | 0.6 | % | |
Mexican Bonos, 7.500%, due 06/03/27 | | | 0.6 | | |
Mexican Bonos, 10.000%, due 12/05/24 | | | 0.5 | | |
Mexican Bonos, 6.500%, due 06/10/21 | | | 0.5 | | |
Brazil Notas do Tesouro Nacional Series B,
6.000%, due 08/15/22 | | | 0.4 | | |
Brazil Notas do Tesouro Nacional Series F,
10.000%, due 01/01/23 | | | 0.4 | | |
Brazil Notas do Tesouro Nacional Series B,
6.000%, due 08/15/50 | | | 0.4 | | |
Brazil Notas do Tesouro Nacional Series F,
10.000%, due 01/01/25 | | | 0.3 | | |
Bundesrepublik Deutschland, 0.500%, due 02/15/25 | | | 0.1 | | |
Telefonica Europe BV, 4.200%, due 12/04/19 | | | 0.1 | | |
Total | | | 3.9 | % | |
For a listing of defined portfolio acronyms that are used throughout the Portfolio statistics, please refer to page 254.
1 Weightings represent percentages of the Portfolio's net assets as of July 31, 2015. The Portfolio is actively managed and its composition will vary over time.
2 Figures represent the breakdown of direct investments of PACE Alternative Strategies Investments. Figures would be different if a breakdown of the underlying investment companies was included.
224
PACE Select Advisors Trust
PACE Alternative Strategies Investments
Industry diversification—(unaudited)
As a percentage of net assets as of July 31, 2015
Common stocks
Aerospace & defense | | | 0.80 | % | |
Air freight & logistics | | | 0.35 | | |
Airlines | | | 0.61 | | |
Auto components | | | 0.68 | | |
Automobiles | | | 0.26 | | |
Banks | | | 2.09 | | |
Beverages | | | 1.03 | | |
Biotechnology | | | 1.98 | | |
Building products | | | 0.35 | | |
Capital markets | | | 1.11 | | |
Chemicals | | | 0.82 | | |
Commercial services & supplies | | | 0.17 | | |
Communications equipment | | | 0.24 | | |
Construction & engineering | | | 0.15 | | |
Construction materials | | | 0.27 | | |
Consumer finance | | | 0.25 | | |
Containers & packaging | | | 0.15 | | |
Diversified financial services | | | 1.24 | | |
Diversified telecommunication services | | | 0.94 | | |
Electric utilities | | | 0.19 | | |
Electrical equipment | | | 0.19 | | |
Electronic equipment, instruments & components | | | 0.36 | | |
Energy equipment & services | | | 0.16 | | |
Food & staples retailing | | | 0.68 | | |
Food products | | | 0.73 | | |
Health care equipment & supplies | | | 0.52 | | |
Health care providers & services | | | 1.94 | | |
Hotels, restaurants & leisure | | | 0.59 | | |
Household durables | | | 0.47 | | |
Industrial conglomerates | | | 0.01 | | |
Insurance | | | 0.46 | | |
Internet & catalog retail | | | 0.24 | | |
Internet software & services | | | 0.81 | | |
IT services | | | 0.44 | | |
Life sciences tools & services | | | 0.19 | | |
Machinery | | | 0.35 | | |
Marine | | | 0.02 | | |
Media | | | 1.37 | | |
Metals & mining | | | 1.30 | | |
Multi-utilities | | | 0.08 | | |
Multiline retail | | | 0.71 | | |
Oil, gas & consumable fuels | | | 0.40 | | |
Personal products | | | 0.14 | | |
Common stocks—(concluded)
Pharmaceuticals | | | 1.48 | % | |
Professional services | | | 0.35 | | |
Real estate investment trusts | | | 1.43 | | |
Real estate management & development | | | 0.75 | | |
Road & rail | | | 0.67 | | |
Semiconductors & semiconductor equipment | | | 0.43 | | |
Software | | | 1.45 | | |
Specialty retail | | | 1.72 | | |
Technology hardware, storage & peripherals | | | 1.27 | | |
Textiles, apparel & luxury goods | | | 0.19 | | |
Trading companies & distributors | | | 0.001 | | |
Transportation infrastructure | | | 0.38 | | |
Wireless telecommunication services | | | 0.44 | | |
Total common stocks | | | 36.40 | | |
Investment companies | | | 7.55 | | |
Preferred stock | | | 0.03 | | |
Rights | | | 0.001 | | |
Warrants | | | 0.13 | | |
Corporate notes
Agriculture | | | 0.08 | | |
Apparel | | | 0.01 | | |
Auto manufacturers | | | 0.18 | | |
Banks | | | 0.55 | | |
Biotechnology | | | 0.02 | | |
Building materials | | | 0.01 | | |
Chemicals | | | 0.03 | | |
Commercial services | | | 0.14 | | |
Diversified financial services | | | 0.08 | | |
Electric | | | 0.14 | | |
Electric utilities | | | 0.07 | | |
Engineering & construction | | | 0.08 | | |
Entertainment | | | 0.01 | | |
Finance-captive automotive | | | 0.01 | | |
Financial services | | | 0.05 | | |
Food | | | 0.06 | | |
Forest products & paper | | | 0.01 | | |
Gas | | | 0.04 | | |
Healthcare-services | | | 0.01 | | |
Holding companies-divers | | | 0.07 | | |
225
PACE Select Advisors Trust
PACE Alternative Strategies Investments
Industry diversification—(unaudited) (concluded)
As a percentage of net assets as of July 31, 2015
Corporate notes—(concluded)
Insurance | | | 0.23 | % | |
Machinery-diversified | | | 0.01 | | |
Media | | | 0.03 | | |
Mining | | | 0.06 | | |
Oil & gas | | | 0.06 | | |
Pharmaceuticals | | | 0.03 | | |
Real estate | | | 0.09 | | |
REITS | | | 0.04 | | |
Retail | | | 0.01 | | |
Savings & loans | | | 0.06 | | |
Sovereign | | | 0.03 | | |
Telecommunications | | | 0.21 | | |
Transportation | | | 0.02 | | |
Total corporate notes | | | 2.53 | | |
Non-US government obligations | | | 3.82 | | |
Time deposits | | | 21.47 | | |
Short-term US government obligations | | | 17.54 | | |
Repurchase agreement | | | 7.75 | | |
Options purchased
Call options purchased | | | 0.001 | | |
Put options & swaptions purchased | | | 0.19 | | |
Total options purchased | | | 0.19 | | |
Investments sold short
Common stocks
Aerospace & defense | | | (0.14 | ) | |
Air freight & logistics | | | (0.02 | ) | |
Investments sold short—(concluded)
Common stocks—(concluded)
Airlines | | | (0.22 | )% | |
Automobiles | | | (0.02 | ) | |
Biotechnology | | | (0.00 | ) | |
Consumer finance | | | (0.01 | ) | |
Diversified consumer services | | | (0.04 | ) | |
Diversified telecommunication services | | | (0.14 | ) | |
Electrical equipment | | | (0.26 | ) | |
Energy equipment & services | | | (0.47 | ) | |
Food & staples retailing | | | (0.08 | ) | |
Food products | | | (0.01 | ) | |
Hotels, restaurants & leisure | | | (0.31 | ) | |
Independent power and renewable electricity producers | | | (0.17 | ) | |
Internet & catalog retail | | | (0.10 | ) | |
Internet software & services | | | (0.16 | ) | |
Leisure products | | | (0.01 | ) | |
Machinery | | | (0.20 | ) | |
Metals & mining | | | (0.75 | ) | |
Oil, gas & consumable fuels | | | (1.78 | ) | |
Real estate investment trusts | | | (0.13 | ) | |
Semiconductors & semiconductor equipment | | | (0.16 | ) | |
Software | | | (0.05 | ) | |
Wireless telecommunication services | | | (0.00 | )1 | |
Total common stocks | | | (5.23 | ) | |
Investment companies | | | (1.36 | ) | |
Total investments sold short | | | (6.59 | ) | |
Other assets in excess of liabilities | | | 9.18 | | |
Net assets | | | 100.00 | % | |
1 Weighting represents less than 0.005% of the Portfolio's net assets as of July 31, 2015.
226
PACE Select Advisors Trust
PACE Alternative Strategies Investments
Portfolio of investments—July 31, 2015
| | | Number of
shares | | Value | |
Common stocks—36.40% | |
Australia—0.27% | |
Aristocrat Leisure Ltd. | | | 42,377 | | | $ | 265,460 | | |
Caltex Australia Ltd. | | | 9,340 | | | | 235,875 | | |
CIMIC Group Ltd. | | | 1,196 | | | | 20,806 | | |
Federation Centres Ltd. | | | 4,424 | | | | 9,701 | | |
Fortescue Metals Group Ltd. | | | 95,700 | | | | 129,761 | | |
Harvey Norman Holdings Ltd. | | | 3 | | | | 10 | | |
Lend Lease Group | | | 97,553 | | | | 1,111,666 | | |
Metcash Ltd. | | | 309,818 | | | | 260,430 | | |
Stockland | | | 19,502 | | | | 60,584 | | |
Sydney Airport | | | 4,542 | | | | 18,625 | | |
TABCORP Holdings Ltd. | | | 10,316 | | | | 36,571 | | |
Wesfarmers Ltd. | | | 684 | | | | 21,224 | | |
Total Australia common stocks | | | | | 2,170,713 | | |
Bermuda—0.23% | |
Bunge Ltd. | | | 1,488 | | | | 118,817 | | |
Kerry Properties Ltd. | | | 68,500 | | | | 255,805 | | |
Lazard Ltd., Class A | | | 22,911 | | | | 1,269,498 | | |
Noble Group Ltd. | | | 100 | | | | 33 | | |
NWS Holdings Ltd. | | | 48,000 | | | | 72,195 | | |
PartnerRe Ltd.1 | | | 804 | | | | 109,312 | | |
Total Bermuda common stocks | | | | | 1,825,660 | | |
Brazil—0.10% | |
Vale SA, ADR | | | 152,100 | | | | 800,046 | | |
British Virgin Islands—0.02% | |
Michael Kors Holdings Ltd.* | | | 4,426 | | | | 185,848 | | |
Canada—1.55% | |
Africa Oil Corp.* | | | 59,271 | | | | 89,799 | | |
Alimentation Couche Tard, Inc., Class B | | | 41,121 | | | | 1,835,251 | | |
BCE, Inc. | | | 23,400 | | | | 963,124 | | |
Canadian Pacific Railway Ltd. | | | 1,500 | | | | 241,473 | | |
Constellation Software, Inc. | | | 3,100 | | | | 1,378,378 | | |
Element Financial Corp.* | | | 61,799 | | | | 936,542 | | |
Empire Co. Ltd. | | | 3,900 | | | | 263,608 | | |
Fairfax Financial Holdings Ltd. | | | 2,300 | | | | 1,109,226 | | |
First Capital Realty, Inc. | | | 2,200 | | | | 31,137 | | |
First Quantum Minerals Ltd. | | | 21,230 | | | | 169,632 | | |
H&R Real Estate Investment Trust | | | 71,300 | | | | 1,217,364 | | |
Magna International, Inc. | | | 3,400 | | | | 184,734 | | |
Open Text Corp. | | | 24,300 | | | | 1,102,915 | | |
RioCan Real Estate Investment Trust | | | 43,000 | | | | 880,812 | | |
Shaw Communications, Inc., Class B | | | 2,700 | | | | 57,289 | | |
Sun Life Financial, Inc. | | | 3,400 | | | | 110,981 | | |
Teck Resources Ltd., Class B | | | 17,750 | | | | 130,285 | | |
The Bank of Nova Scotia | | | 400 | | | | 19,632 | | |
Valeant Pharmaceuticals
International, Inc.* | | | 6,510 | | | | 1,676,520 | | |
Total Canada common stocks | | | | | 12,398,702 | | |
| | | Number of
shares | | Value | |
Common stocks—(continued) | |
Cayman Islands—0.42% | |
China Metal Recycling Holdings Ltd.*,2,3 | | | 352,200 | | | $ | 0 | | |
Geely Automobile Holdings Ltd. | | | 2,525,000 | | | | 1,061,814 | | |
JD.com, Inc., ADR* | | | 26,300 | | | | 868,689 | | |
Sands China Ltd. | | | 179,600 | | | | 794,639 | | |
Vipshop Holdings Ltd., ADR* | | | 34,000 | | | | 662,660 | | |
Total Cayman Islands common stocks | | | | | 3,387,802 | | |
Denmark—0.29% | |
Coloplast A/S, Class B | | | 7,056 | | | | 508,832 | | |
Danske Bank A/S | | | 57,275 | | | | 1,788,672 | | |
Total Denmark common stocks | | | | | 2,297,504 | | |
Finland—0.15% | |
Nokia Oyj | | | 165,500 | | | | 1,168,720 | | |
France—0.44% | |
JCDecaux SA | | | 49,443 | | | | 1,892,654 | | |
Korian SA | | | 20,806 | | | | 741,946 | | |
Orpea | | | 11,896 | | | | 898,335 | | |
Total France common stocks | | | | | 3,532,935 | | |
Germany—0.31% | |
Deutsche Telekom AG | | | 100,086 | | | | 1,808,176 | | |
Evonik Industries AG | | | 442 | | | | 17,687 | | |
GEA Group AG | | | 14,609 | | | | 618,509 | | |
Merck KGaA | | | 326 | | | | 33,161 | | |
Total Germany common stocks | | | | | 2,477,533 | | |
Hong Kong—0.61% | |
Hang Lung Properties Ltd. | | | 96,000 | | | | 274,293 | | |
New World Development Co. Ltd. | | | 714,000 | | | | 862,993 | | |
PCCW Ltd. | | | 900,000 | | | | 538,679 | | |
Sino Land Co. Ltd. | | | 22,000 | | | | 34,168 | | |
Swire Pacific Ltd., Class A | | | 30,000 | | | | 384,466 | | |
The Link REIT | | | 464,500 | | | | 2,732,247 | | |
Wheelock & Co. Ltd. | | | 21,000 | | | | 108,761 | | |
Total Hong Kong common stocks | | | | | 4,935,607 | | |
Ireland—1.09% | |
Allegion PLC | | | 15,692 | | | | 992,048 | | |
Allergan PLC* | | | 8,371 | | | | 2,772,057 | | |
Endo International PLC* | | | 7,737 | | | | 677,297 | | |
Glanbia PLC | | | 46,798 | | | | 977,551 | | |
Ryanair Holdings PLC, ADR | | | 12,200 | | | | 904,142 | | |
Seagate Technology PLC1 | | | 47,292 | | | | 2,392,975 | | |
Total Ireland common stocks | | | | | 8,716,070 | | |
Israel—0.04% | |
Radware Ltd.* | | | 16,989 | | | | 323,470 | | |
Italy—0.58% | |
Atlantia SpA | | | 2,100 | | | | 56,090 | | |
Intesa Sanpaolo SpA | | | 900,131 | | | | 3,146,052 | | |
Mediobanca SpA | | | 133,190 | | | | 1,450,327 | | |
Total Italy common stocks | | | | | 4,652,469 | | |
227
PACE Select Advisors Trust
PACE Alternative Strategies Investments
Portfolio of investments—July 31, 2015
| | | Number of
shares | | Value | |
Common stocks—(continued) | |
Japan—2.50% | |
Calbee, Inc. | | | 1,700 | | | $ | 75,854 | | |
Casio Computer Co. Ltd. | | | 47,500 | | | | 947,815 | | |
Citizen Holdings Co. Ltd. | | | 8,800 | | | | 58,792 | | |
Fuji Heavy Industries Ltd. | | | 27,800 | | | | 1,028,467 | | |
Fukuoka Financial Group, Inc. | | | 44,000 | | | | 226,506 | | |
Hitachi Chemical Co. Ltd. | | | 34,500 | | | | 611,026 | | |
Hitachi High-Technologies Corp. | | | 22,100 | | | | 516,234 | | |
Japan Airport Terminal Co. Ltd. | | | 16,700 | | | | 889,337 | | |
Japan Display, Inc.* | | | 175,800 | | | | 546,117 | | |
JTEKT Corp. | | | 6,900 | | | | 119,310 | | |
Konica Minolta Holdings, Inc. | | | 24,000 | | | | 299,576 | | |
Kumagai Gumi Co. Ltd. | | | 109,000 | | | | 307,823 | | |
Minebea Co. Ltd. | | | 46,000 | | | | 721,168 | | |
Mitsubishi Chemical Holdings Corp. | | | 206,900 | | | | 1,352,233 | | |
Mitsubishi Gas Chemical Co., Inc. | | | 27,000 | | | | 149,885 | | |
Mitsubishi UFJ Financial Group, Inc. | | | 157,200 | | | | 1,141,566 | | |
Mitsui Fudosan Co. Ltd. | | | 36,000 | | | | 1,024,941 | | |
Mixi, Inc. | | | 26,600 | | | | 1,152,556 | | |
NEC Corp. | | | 21,000 | | | | 67,100 | | |
Nippon Express Co. Ltd. | | | 82,000 | | | | 434,034 | | |
NOK Corp. | | | 31,900 | | | | 935,624 | | |
Oracle Corp. Japan | | | 18,000 | | | | 758,139 | | |
Resorttrust, Inc. | | | 60,700 | | | | 1,501,154 | | |
SBI Holdings, Inc. | | | 20,200 | | | | 280,829 | | |
Seven & I Holdings Co. Ltd. | | | 22,000 | | | | 1,016,081 | | |
Sompo Japan Nipponkoa Holdings, Inc. | | | 1,000 | | | | 35,277 | | |
Sumitomo Heavy Industries Ltd. | | | 79,000 | | | | 399,032 | | |
Taiheiyo Cement Corp. | | | 223,000 | | | | 735,926 | | |
Taisei Corp. | | | 155,000 | | | | 911,728 | | |
The Dai-ichi Life Insurance Co. Ltd. | | | 8,600 | | | | 175,005 | | |
TonenGeneral Sekiyu KK | | | 43,000 | | | | 430,572 | | |
Trend Micro, Inc. | | | 30,500 | | | | 1,117,279 | | |
USS Co. Ltd. | | | 5,900 | | | | 103,733 | | |
West Japan Railway Co. | | | 300 | | | | 21,565 | | |
Total Japan common stocks | | | | | 20,092,284 | | |
Jersey—0.16% | |
Glencore PLC* | | | 402,000 | | | | 1,305,790 | | |
Netherlands—0.62% | |
Airbus Group SE | | | 24,573 | | | | 1,743,380 | | |
LyondellBasell Industries N.V., Class A | | | 11,060 | | | | 1,037,760 | | |
Mobileye N.V.* | | | 10,300 | | | | 619,030 | | |
Randstad Holding N.V. | | | 69 | | | | 4,724 | | |
Unilever N.V. | | | 31,378 | | | | 1,406,350 | | |
Wolters Kluwer N.V. | | | 5,048 | | | | 167,317 | | |
Total Netherlands common stocks | | | | | 4,978,561 | | |
New Zealand—0.06% | |
Spark New Zealand Ltd. | | | 234,757 | | | | 458,691 | | |
Panama—0.26% | |
Carnival Corp.1 | | | 39,265 | | | | 2,092,432 | | |
Papua New Guinea—0.07% | |
Oil Search Ltd. | | | 108,647 | | | | 593,234 | | |
| | | Number of
shares | | Value | |
Common stocks—(continued) | |
Portugal—0.16% | |
Galp Energia, SGPS SA | | | 108,413 | | | $ | 1,256,132 | | |
Russia—0.09% | |
MMC Norilsk Nickel PJSC, ADR | | | 48,640 | | | | 751,974 | | |
Singapore—0.32% | |
Ascendas Real Estate Investment Trust | | | 30,800 | | | | 54,332 | | |
Avago Technologies Ltd. | | | 14,722 | | | | 1,842,311 | | |
CapitaLand Commercial Trust | | | 258,700 | | | | 268,723 | | |
CapitaLand Mall Trust | | | 13,900 | | | | 20,265 | | |
ComfortDelGro Corp. Ltd. | | | 183,100 | | | | 401,743 | | |
Yangzijiang Shipbuilding Holdings Ltd. | | | 4,600 | | | | 4,325 | | |
Total Singapore common stocks | | | | | 2,591,699 | | |
Spain—0.66% | |
Abertis Infraestructuras SA | | | 127,751 | | | | 2,091,210 | | |
Bankinter SA | | | 204,039 | | | | 1,575,997 | | |
Cellnex Telecom SAU* | | | 45,286 | | | | 750,507 | | |
Endesa SA | | | 1,554 | | | | 32,666 | | |
International Consolidated Airlines
Group SA* | | | 97,606 | | | | 811,687 | | |
Red Electrica Corp. SA | | | 20 | | | | 1,598 | | |
Total Spain common stocks | | | | | 5,263,665 | | |
Sweden—0.25% | |
Industrivarden AB, C Shares | | | 35,927 | | | | 679,247 | | |
Investor AB, B Shares | | | 17,556 | | | | 677,473 | | |
Lundin Petroleum AB* | | | 29,035 | | | | 421,049 | | |
Tele2 AB, B Shares | | | 24,777 | | | | 257,772 | | |
Total Sweden common stocks | | | | | 2,035,541 | | |
Switzerland—0.35% | |
Garmin Ltd.1 | | | 3,547 | | | | 148,655 | | |
Kuehne & Nagel International AG | | | 1,125 | | | | 155,309 | | |
Pargesa Holding SA | | | 959 | | | | 64,559 | | |
Roche Holding AG | | | 5,734 | | | | 1,656,172 | | |
Sunrise Communications Group AG* | | | 9,528 | | | | 749,382 | | |
Total Switzerland common stocks | | | | | 2,774,077 | | |
United Kingdom—2.12% | |
Anglo American PLC | | | 43,090 | | | | 545,869 | | |
Antofagasta PLC | | | 30,300 | | | | 268,293 | | |
ARM Holdings PLC | | | 54,088 | | | | 850,578 | | |
Babcock International Group PLC | | | 52,100 | | | | 806,704 | | |
Barclays PLC | | | 453,778 | | | | 2,047,623 | | |
Bellway PLC | | | 20,660 | | | | 777,878 | | |
BHP Billiton PLC | | | 165,700 | | | | 3,059,903 | | |
BT Group PLC | | | 220,262 | | | | 1,597,580 | | |
DS Smith PLC | | | 110,562 | | | | 691,500 | | |
InterContinental Hotels Group PLC | | | 216 | | | | 9,101 | | |
Meggitt PLC | | | 12,201 | | | | 88,504 | | |
Next PLC | | | 1,031 | | | | 128,644 | | |
OM Asset Management PLC | | | 20,910 | | | | 369,480 | | |
Persimmon PLC* | | | 56,004 | | | | 1,790,280 | | |
Rio Tinto PLC | | | 55,865 | | | | 2,169,263 | | |
Royal Dutch Shell PLC, A Shares | | | 7,653 | | | | 219,904 | | |
Royal Mail PLC | | | 63,135 | | | | 497,904 | | |
228
PACE Select Advisors Trust
PACE Alternative Strategies Investments
Portfolio of investments—July 31, 2015
| | | Number of
shares | | Value | |
Common stocks—(continued) | |
United Kingdom—(concluded) | |
Taylor Wimpey PLC | | | 22,771 | | | $ | 69,129 | | |
The Sage Group PLC | | | 119,731 | | | | 974,155 | | |
Unilever PLC | | | 301 | | | | 13,665 | | |
Total United Kingdom common stocks | | | | | 16,975,957 | | |
United States—22.68% | |
Activision Blizzard, Inc. | | | 22,455 | | | | 579,114 | | |
Acuity Brands, Inc. | | | 7,626 | | | | 1,534,275 | | |
Advance Auto Parts, Inc. | | | 5,869 | | | | 1,022,438 | | |
Alliance Data Systems Corp.* | | | 6,019 | | | | 1,655,466 | | |
Ally Financial, Inc.* | | | 7,872 | | | | 179,245 | | |
American Tower Corp. | | | 17,014 | | | | 1,618,202 | | |
Ameriprise Financial, Inc.1 | | | 20,260 | | | | 2,546,074 | | |
AmerisourceBergen Corp.1 | | | 28,980 | | | | 3,064,635 | | |
Amgen, Inc.1 | | | 23,325 | | | | 4,118,962 | | |
Anthem, Inc. | | | 1,645 | | | | 253,774 | | |
Archer-Daniels-Midland Co. | | | 517 | | | | 24,516 | | |
Arrow Electronics, Inc.*,1 | | | 13,296 | | | | 773,162 | | |
Avery Dennison Corp.1 | | | 9,053 | | | | 550,875 | | |
Bank of America Corp.1 | | | 213,418 | | | | 3,815,914 | | |
Bank of the Ozarks, Inc.1 | | | 28,671 | | | | 1,264,965 | | |
Becton, Dickinson and Co.1 | | | 5,607 | | | | 853,105 | | |
Best Buy Co., Inc.1 | | | 82,008 | | | | 2,648,038 | | |
Biogen, Inc.*,1 | | | 3,877 | | | | 1,235,910 | | |
Blackhawk Network Holdings, Inc.* | | | 18,676 | | | | 857,789 | | |
Blue Buffalo Pet Products, Inc.* | | | 7,474 | | | | 208,824 | | |
Boston Scientific Corp.* | | | 51,347 | | | | 890,357 | | |
Bristol-Myers Squibb Co. | | | 17,383 | | | | 1,141,020 | | |
Brown-Forman Corp., Class B | | | 12,380 | | | | 1,342,116 | | |
CA, Inc.1 | | | 734 | | | | 21,385 | | |
Cardinal Health, Inc.1 | | | 54,144 | | | | 4,601,157 | | |
Celgene Corp.* | | | 17,037 | | | | 2,236,106 | | |
Centene Corp.* | | | 299 | | | | 20,969 | | |
CenturyLink, Inc.1 | | | 22,695 | | | | 649,077 | | |
Citigroup, Inc. | | | 35,475 | | | | 2,073,869 | | |
Citizens Financial Group, Inc. | | | 23,784 | | | | 620,049 | | |
Citrix Systems, Inc.*,1 | | | 12,236 | | | | 925,164 | | |
CME Group, Inc.1 | | | 7,810 | | | | 750,072 | | |
CMS Energy Corp. | | | 19,267 | | | | 660,087 | | |
CommVault Systems, Inc.* | | | 18,454 | | | | 691,471 | | |
Computer Sciences Corp.1 | | | 15,316 | | | | 1,002,126 | | |
Constellation Brands, Inc., Class A | | | 39,116 | | | | 4,694,702 | | |
CSX Corp. | | | 15,120 | | | | 472,954 | | |
CVS Health Corp. | | | 18,048 | | | | 2,029,859 | | |
Delta Air Lines, Inc. | | | 21,203 | | | | 940,141 | | |
DISH Network Corp., Class A* | | | 54,192 | | | | 3,501,345 | | |
Dollar Tree, Inc.*,1 | | | 24,056 | | | | 1,877,090 | | |
Dr. Pepper Snapple Group, Inc.1 | | | 7,804 | | | | 626,037 | | |
Duke Energy Corp. | | | 243 | | | | 18,035 | | |
Edison International | | | 372 | | | | 22,324 | | |
Edwards Lifesciences Corp.*,1 | | | 12,410 | | | | 1,888,306 | | |
Electronic Arts, Inc.*,1 | | | 41,604 | | | | 2,976,766 | | |
Eli Lilly & Co. | | | 3,233 | | | | 273,221 | | |
EMC Corp.1 | | | 74,948 | | | | 2,015,352 | | |
Entergy Corp.1 | | | 20,759 | | | | 1,474,304 | | |
| | | Number of
shares | | Value | |
Common stocks—(continued) | |
United States—(continued) | |
Evercore Partners, Inc., Class A | | | 8,620 | | | $ | 506,856 | | |
Facebook, Inc., Class A* | | | 15,966 | | | | 1,500,964 | | |
FedEx Corp.1 | | | 13,359 | | | | 2,290,000 | | |
FEI Co. | | | 11,433 | | | | 982,895 | | |
First Republic Bank | | | 33,129 | | | | 2,113,299 | | |
FNF Group | | | 900 | | | | 35,181 | | |
Foot Locker, Inc.1 | | | 32,013 | | | | 2,258,517 | | |
Fortune Brands Home & Security, Inc. | | | 37,539 | | | | 1,792,487 | | |
Freeport-McMoRan, Inc. | | | 31,970 | | | | 375,648 | | |
GameStop Corp., Class A1 | | | 35,139 | | | | 1,611,123 | | |
General Dynamics Corp. | | | 3,245 | | | | 483,862 | | |
Gilead Sciences, Inc.1 | | | 35,924 | | | | 4,234,003 | | |
Google, Inc., Class A*,1 | | | 3,120 | | | | 2,051,400 | | |
Google, Inc., Class C* | | | 1,166 | | | | 729,461 | | |
Halliburton Co. | | | 29,832 | | | | 1,246,679 | | |
Hanesbrands, Inc. | | | 43,895 | | | | 1,362,062 | | |
HCA Holdings, Inc.*,1 | | | 13,228 | | | | 1,230,336 | | |
Hewlett-Packard Co.1 | | | 114,056 | | | | 3,480,989 | | |
Hilton Worldwide Holdings, Inc.* | | | 535 | | | | 14,365 | | |
Illumina, Inc.* | | | 6,813 | | | | 1,494,091 | | |
J.B. Hunt Transport Services, Inc. | | | 10,186 | | | | 856,846 | | |
JPMorgan Chase & Co.1 | | | 14,010 | | | | 960,105 | | |
Kohl's Corp.1 | | | 27,426 | | | | 1,681,762 | | |
Laboratory Corp. of America
Holdings*,1 | | | 15,145 | | | | 1,927,807 | | |
Lamar Advertising Co., Class A1 | | | 21,023 | | | | 1,262,431 | | |
Lear Corp.1 | | | 28,242 | | | | 2,939,145 | | |
Legg Mason, Inc. | | | 15,656 | | | | 772,467 | | |
Liberty Interactive Corp. QVC Group,
Class A* | | | 14,841 | | | | 431,131 | | |
Lowe's Cos., Inc. | | | 15,009 | | | | 1,041,024 | | |
Martin Marietta Materials, Inc. | | | 9,385 | | | | 1,471,756 | | |
McKesson Corp. | | | 4,517 | | | | 996,315 | | |
Merck & Co., Inc.1 | | | 62,437 | | | | 3,681,286 | | |
MetLife, Inc.1 | | | 37,849 | | | | 2,109,703 | | |
Micron Technology, Inc.*,1 | | | 12,902 | | | | 238,816 | | |
Monsanto Co.1 | | | 17,759 | | | | 1,809,465 | | |
Monster Beverage Corp.* | | | 10,329 | | | | 1,586,018 | | |
Navient Corp.1 | | | 113,988 | | | | 1,789,612 | | |
NorthStar Realty Finance Corp. | | | 206,670 | | | | 3,306,720 | | |
Old Dominion Freight Line, Inc.*,1 | | | 25,247 | | | | 1,846,818 | | |
PACCAR, Inc.1 | | | 15,151 | | | | 982,391 | | |
Packaging Corp. of America | | | 7,081 | | | | 501,264 | | |
PTC, Inc.* | | | 20,751 | | | | 754,299 | | |
Raytheon Co.1 | | | 37,953 | | | | 4,140,293 | | |
Realogy Holdings Corp.*,1 | | | 41,587 | | | | 1,893,040 | | |
Regeneron Pharmaceuticals, Inc.*,1 | | | 3,875 | | | | 2,145,432 | | |
Regions Financial Corp.1 | | | 79,808 | | | | 829,205 | | |
Robert Half International, Inc.1 | | | 51,283 | | | | 2,822,103 | | |
Ross Stores, Inc.1 | | | 62,826 | | | | 3,339,830 | | |
Ruckus Wireless, Inc.* | | | 36,098 | | | | 445,088 | | |
Saia, Inc.* | | | 11,061 | | | | 480,269 | | |
Scripps Networks Interactive Inc.,
Class A | | | 194 | | | | 12,141 | | |
Signature Bank*,1 | | | 13,467 | | | | 1,960,661 | | |
229
PACE Select Advisors Trust
PACE Alternative Strategies Investments
Portfolio of investments—July 31, 2015
| | | Number of
shares | | Value | |
Common stocks—(concluded) | |
United States—(concluded) | |
Sirius XM Holdings, Inc.* | | | 108,691 | | | $ | 430,416 | | |
Skyworks Solutions, Inc.1 | | | 5,504 | | | | 526,568 | | |
Southwest Airlines Co.1 | | | 62,811 | | | | 2,273,758 | | |
Stillwater Mining Co.* | | | 79,472 | | | | 756,573 | | |
Symantec Corp. | | | 33,738 | | | | 767,202 | | |
T-Mobile US, Inc.*,1 | | | 80,836 | | | | 3,286,792 | | |
Target Corp.1 | | | 24,120 | | | | 1,974,222 | | |
The Charles Schwab Corp. | | | 48,521 | | | | 1,692,412 | | |
The Dow Chemical Co. | | | 586 | | | | 27,577 | | |
The Estee Lauder Cos., Inc., Class A | | | 12,999 | | | | 1,158,341 | | |
The J.M. Smucker Co.1 | | | 12,943 | | | | 1,445,604 | | |
The Kraft Heinz Co. | | | 19,167 | | | | 1,523,201 | | |
The Sherwin-Williams Co.1 | | | 5,577 | | | | 1,549,068 | | |
Time Warner, Inc.1 | | | 56,184 | | | | 4,946,439 | | |
TJX Cos., Inc. | | | 14,314 | | | | 999,403 | | |
Tyson Foods, Inc., Class A | | | 1,479 | | | | 65,594 | | |
Ulta Salon, Cosmetics &
Fragrance, Inc.* | | | 4,428 | | | | 735,181 | | |
Union Pacific Corp. | | | 6,053 | | | | 590,712 | | |
United Therapeutics Corp.*,1 | | | 11,101 | | | | 1,880,065 | | |
UnitedHealth Group, Inc. | | | 203 | | | | 24,644 | | |
Universal Health Services, Inc., Class B1 | | | 12,457 | | | | 1,809,130 | | |
Visteon Corp.* | | | 14,005 | | | | 1,393,918 | | |
VMware, Inc., Class A*,1 | | | 712 | | | | 63,461 | | |
Western Digital Corp. | | | 22,432 | | | | 1,930,498 | | |
Total United States common stocks | | | | | 181,900,984 | | |
Total common stocks
(cost—$279,508,406) | | | | | 291,944,100 | | |
Investment companies—7.55% | |
Legg Mason BW Absolute Return
Opportunities Fund | | | 2,464,929 | | | | 29,998,184 | | |
Scout Unconstrained Bond Fund | | | 2,695,085 | | | | 30,535,316 | | |
Total investment companies
(cost—$62,450,000) | | | | | 60,533,500 | | |
Preferred stock—0.03% | |
Germany—0.03% | |
Porsche Automobil Holding SE
(cost—$254,255) | | | 2,842 | | | | 213,773 | | |
| | | Number of
rights | | | |
Rights—0.00%†† | |
Canada—0.00%†† | |
Constellation Software, Inc.,
expiring 09/15/15*
(cost—$521) | | | 1,800 | | | | 323 | | |
| | | Number of
warrants | | Value | |
Warrants—0.13% | |
United States—0.13% | |
JPMorgan Chase & Co.,
expiring 10/28/18*
(cost—$974,064) | | | 39,087 | | | $ | 1,023,298 | | |
| | | Face
amount | | | |
Corporate notes—2.53% | |
Australia—0.06% | |
National Australia Bank Ltd.
2.000%, due 11/12/244,5 | | EUR | 100,000 | | | | 109,835 | | |
Santos Finance Ltd.
8.250%, due 09/22/704 | | EUR | 100,000 | | | | 116,140 | | |
Scentre Group Trust 1
1.500%, due 07/16/205 | | EUR | 100,000 | | | | 112,070 | | |
Scentre Group Trust 2
3.250%, due 09/11/235 | | EUR | 100,000 | | | | 123,210 | | |
Total Australia corporate notes | | | | | 461,255 | | |
Austria—0.01% | |
UniCredit Bank Austria AG
2.625%, due 01/30/185 | | EUR | 100,000 | | | | 113,460 | | |
Canada—0.04% | |
Great-West Lifeco, Inc.
2.500%, due 04/18/235 | | EUR | 250,000 | | | | 295,689 | | |
Cayman Islands—0.06% | |
Hutchison Whampoa
Finance 09 Ltd.
4.750%, due 11/14/165 | | EUR | 100,000 | | | | 115,891 | | |
Hutchison Whampoa
Finance 14 Ltd.
1.375%, due 10/31/215 | | EUR | 200,000 | | | | 219,578 | | |
IPIC GMTN Ltd.
5.875%, due 03/14/215 | | EUR | 100,000 | | | | 135,359 | | |
Total Cayman Islands corporate notes | | | | | 470,828 | | |
Curacao—0.01% | |
Teva Pharmaceutical
Finance IV BV
2.875%, due 04/15/195 | | EUR | 100,000 | | | | 117,605 | | |
Denmark—0.01% | |
DONG Energy A/S
6.250%, due 06/26/301,3,4,5 | | EUR | 78,000 | | | | 97,442 | | |
Finland—0.02% | |
Fortum OYJ
6.000%, due 03/20/195 | | EUR | 100,000 | | | | 130,216 | | |
France—0.36% | |
Alstom SA
4.500%, due 03/18/20 | | EUR | 50,000 | | | | 62,270 | | |
ASF
7.375%, due 03/20/195 | | EUR | 150,000 | | | | 204,118 | | |
230
PACE Select Advisors Trust
PACE Alternative Strategies Investments
Portfolio of investments—July 31, 2015
| | | Face
amount | | Value | |
Corporate notes—(continued) | |
France—(concluded) | |
BNP Paribas SA
2.250%, due 01/13/215 | | EUR | 100,000 | | | $ | 116,720 | | |
2.875%, due 09/26/23 | | EUR | 60,000 | | | | 73,021 | | |
BPCE SA
2.125%, due 03/17/215 | | EUR | 100,000 | | | | 116,192 | | |
Carrefour SA
1.250%, due 06/03/255 | | EUR | 100,000 | | | | 106,075 | | |
Casino Guichard-Perrachon SA
3.311%, due 01/25/235 | | EUR | 200,000 | | | | 239,928 | | |
Christian Dior SE
4.000%, due 05/12/16 | | EUR | 100,000 | | | | 112,784 | | |
Credit Agricole SA
2.625%, due 03/17/275 | | EUR | 100,000 | | | | 104,757 | | |
Credit Logement SA
1.136%, due 09/16/154,5,6 | | EUR | 100,000 | | | | 91,457 | | |
Electricite de France
4.625%, due 04/26/30 | | EUR | 50,000 | | | | 71,161 | | |
Electricite de France SA
4.125%, due 01/22/224,5,6 | | EUR | 100,000 | | | | 117,337 | | |
5.625%, due 02/21/33 | | EUR | 60,000 | | | | 94,237 | | |
Engie
3.875%, due 06/02/244,5,6 | | EUR | 100,000 | | | | 114,967 | | |
Holding d'Infrastructures de
Transport SAS
2.250%, due 03/24/255 | | EUR | 100,000 | | | | 110,923 | | |
Infra Foch SAS
1.250%, due 10/16/205 | | EUR | 100,000 | | | | 110,519 | | |
Lafarge SA
5.375%, due 06/26/175 | | EUR | 50,000 | | | | 59,686 | | |
Lagardere SCA
4.125%, due 10/31/175 | | EUR | 100,000 | | | | 116,331 | | |
Orange SA
5.250%, due 02/07/244,5,6 | | EUR | 100,000 | | | | 120,808 | | |
8.125%, due 01/28/33 | | EUR | 70,000 | | | | 128,438 | | |
RCI Banque SA
4.000%, due 03/16/165 | | EUR | 100,000 | | | | 112,278 | | |
4.250%, due 04/27/175 | | EUR | 30,000 | | | | 35,059 | | |
Societe Des Autoroutes
Paris-Rhin-Rhone
1.125%, due 01/15/215 | | EUR | 200,000 | | | | 219,816 | | |
Societe Fonciere Lyonnaise SA
1.875%, due 11/26/215 | | EUR | 100,000 | | | | 110,851 | | |
Societe Generale SA
9.375%, due 09/04/194,5,6 | | EUR | 50,000 | | | | 67,817 | | |
Vinci SA
6.250%, due 11/13/154,6 | | EUR | 50,000 | | | | 55,599 | | |
Total France corporate notes | | | | | 2,873,149 | | |
Germany—0.07% | |
Aareal Bank AG
4.250%, due 03/18/264 | | EUR | 50,000 | | | | 57,999 | | |
Allianz SE
3.375%, due 09/18/244,5,6 | | EUR | 200,000 | | | | 219,556 | | |
4.750%, due 10/24/234,5,6 | | EUR | 100,000 | | | | 120,666 | | |
| | | Face
amount | | Value | |
Corporate notes—(continued) | |
Germany—(concluded) | |
Commerzbank AG
7.750%, due 03/16/21 | | EUR | 100,000 | | | $ | 134,701 | | |
Muenchener
Rueckversicherungs AG
5.767%, due 06/12/174,5,6 | | EUR | 50,000 | | | | 59,085 | | |
Total Germany corporate notes | | | | | 592,007 | | |
Guernsey—0.01% | |
Credit Suisse Group
Guernsey I Ltd.
7.875%, due 02/24/414,5 | | USD | 100,000 | | | | 104,750 | | |
Ireland—0.15% | |
Bank of Ireland
1.250%, due 04/09/205 | | EUR | 100,000 | | | | 109,793 | | |
2.000%, due 05/08/175 | | EUR | 200,000 | | | | 223,924 | | |
ERVIA
3.625%, due 12/04/175 | | EUR | 100,000 | | | | 117,839 | | |
ESB Finance Ltd.
3.494%, due 01/12/245 | | EUR | 100,000 | | | | 126,761 | | |
4.375%, due 11/21/195 | | EUR | 100,000 | | | | 126,839 | | |
FGA Capital Ireland PLC
4.000%, due 10/17/185 | | EUR | 100,000 | | | | 119,251 | | |
GE Capital European Funding
2.625%, due 03/15/235 | | EUR | 200,000 | | | | 240,562 | | |
Willow No.2 Ireland PLC for
Zurich Insurance Co. Ltd.
3.375%, due 06/27/225 | | EUR | 100,000 | | | | 124,130 | | |
Total Ireland corporate notes | | | | | 1,189,099 | | |
Italy—0.15% | |
2i Rete Gas SpA
1.125%, due 01/02/205 | | EUR | 100,000 | | | | 109,996 | | |
Assicurazioni Generali SpA
Assicurazioni Generali SpA
7.750%, due 12/12/424,5 | | EUR | 100,000 | | | | 135,560 | | |
Assicurazioni Generali SpA MTN
5.125%, due 09/16/245 | | EUR | 75,000 | | | | 103,015 | | |
Intesa Sanpaolo SpA
1.125%, due 03/04/225 | | EUR | 130,000 | | | | 137,993 | | |
3.000%, due 01/28/195 | | EUR | 100,000 | | | | 117,058 | | |
3.928%, due 09/15/265 | | EUR | 100,000 | | | | 112,979 | | |
4.125%, due 01/14/165 | | EUR | 100,000 | | | | 111,617 | | |
4.375%, due 10/15/195 | | EUR | 100,000 | | | | 123,888 | | |
5.000%, due 02/28/175 | | EUR | 100,000 | | | | 117,075 | | |
UniCredit Banca SpA
5.650%, due 08/24/18 | | EUR | 100,000 | | | | 123,015 | | |
Total Italy corporate notes | | | | | 1,192,196 | | |
Japan—0.02% | |
Sumitomo Mitsui Banking Corp.
1.000%, due 01/19/225 | | EUR | 150,000 | | | | 161,099 | | |
231
PACE Select Advisors Trust
PACE Alternative Strategies Investments
Portfolio of investments—July 31, 2015
| | | Face
amount | | Value | |
Corporate notes—(continued) | |
Jersey—0.08% | |
AA Bond Co. Ltd.
4.720%, due 07/31/185 | | GBP | 100,000 | | | $ | 165,236 | | |
Heathrow Funding Ltd.
1.875%, due 05/23/225 | | EUR | 200,000 | | | | 228,165 | | |
4.600%, due 02/15/185 | | EUR | 100,000 | | | | 120,956 | | |
Prosecure Funding
4.668%, due 06/30/16 | | EUR | 100,000 | | | | 112,296 | | |
Total Jersey corporate notes | | | | | 626,653 | | |
Luxembourg—0.12% | |
CNH Industrial Finance Europe SA
2.750%, due 03/18/195 | | EUR | 100,000 | | | | 110,362 | | |
Dufry Finance SCA
4.500%, due 07/15/225 | | EUR | 100,000 | | | | 114,536 | | |
Fiat Chrysler Finance Europe
Fiat Finance & Trade SA
7.000%, due 03/23/175 | | EUR | 100,000 | | | | 117,974 | | |
FMC Finance VIII SA
6.500%, due 09/15/185 | | EUR | 44,000 | | | | 55,813 | | |
Glencore Finance Europe SA
4.625%, due 04/03/185,7 | | EUR | 200,000 | | | | 240,192 | | |
Prologis International
Funding II SA
2.875%, due 04/04/225 | | EUR | 125,000 | | | | 145,837 | | |
Talanx Finanz Luxembourg SA
8.367%, due 06/15/424,5 | | EUR | 100,000 | | | | 141,674 | | |
Total Luxembourg corporate notes | | | | | 926,388 | | |
Mexico—0.03% | |
America Movil SAB de CV
4.750%, due 06/28/22 | | EUR | 100,000 | | | | 133,300 | | |
Petroleos Mexicanos
3.125%, due 11/27/205 | | EUR | 100,000 | | | | 115,646 | | |
Total Mexico corporate notes | | | | | 248,946 | | |
Netherlands—0.37% | |
Achmea BV
2.500%, due 11/19/205 | | EUR | 100,000 | | | | 116,476 | | |
Bharti Airtel International
Netherlands BV
4.000%, due 12/10/185 | | EUR | 100,000 | | | | 117,787 | | |
BMW Finance N.V.
2.625%, due 01/17/245 | | EUR | 100,000 | | | | 121,473 | | |
Deutsche Annington Finance BV
3.125%, due 07/25/19 | | EUR | 200,000 | | | | 238,043 | | |
4.000%, due 12/17/214,5,6 | | EUR | 100,000 | | | | 110,731 | | |
Deutsche Bahn Finance BV
3.000%, due 03/08/24 | | EUR | 60,000 | | | | 75,875 | | |
EDP Finance BV
4.125%, due 01/20/215 | | EUR | 100,000 | | | | 122,614 | | |
ELM BV (Swiss Reinsurance Co.)
5.252%, due 05/25/164,5,6 | | EUR | 50,000 | | | | 56,285 | | |
Enel Finance International N.V.
5.750%, due 10/24/18 | | EUR | 100,000 | | | | 128,045 | | |
| | | Face
amount | | Value | |
Corporate notes—(continued) | |
Netherlands—(concluded) | |
Gas Natural Fenosa Finance BV
3.875%, due 04/11/225 | | EUR | 100,000 | | | $ | 127,447 | | |
4.125%, due 11/18/224,5,6 | | EUR | 100,000 | | | | 111,884 | | |
General Motors Financial
International BV
1.875%, due 10/15/195 | | EUR | 100,000 | | | | 111,990 | | |
ING Bank N.V.
3.500%, due 11/21/234,5 | | EUR | 100,000 | | | | 116,094 | | |
JAB Holdings BV
1.500%, due 11/24/215 | | EUR | 100,000 | | | | 109,649 | | |
Linde Finance BV
7.375%, due 07/14/664 | | EUR | 100,000 | | | | 116,401 | | |
Petrobras Global Finance BV
2.750%, due 01/15/18 | | EUR | 100,000 | | | | 102,000 | | |
Repsol International Finance BV
4.250%, due 02/12/165 | | EUR | 100,000 | | | | 112,088 | | |
Telefonica Europe BV
4.200%, due 12/04/194,5,6 | | EUR | 400,000 | | | | 453,578 | | |
5.875%, due 02/14/335 | | EUR | 50,000 | | | | 78,449 | | |
Volkswagen International
Finance N.V.
0.875%, due 01/16/235 | | EUR | 127,000 | | | | 136,849 | | |
3.500%, due 03/20/304,5,6 | | EUR | 200,000 | | | | 205,896 | | |
3.875%, due 09/04/184,5,6 | | EUR | 50,000 | | | | 57,933 | | |
Total Netherlands corporate notes | | | | | 2,927,587 | | |
Norway—0.01% | |
Statkraft AS
2.500%, due 11/28/225 | | EUR | 100,000 | | | | 119,955 | | |
Spain—0.12% | |
Banco Bilbao Vizcaya
Argentaria SA
6.750%, due 02/18/204,5,6 | | EUR | 200,000 | | | | 222,204 | | |
BBVA Subordinated Capital SAU
3.500%, due 04/11/244,5 | | EUR | 100,000 | | | | 114,620 | | |
Ferrovial Emisiones SA
3.375%, due 01/30/185 | | EUR | 100,000 | | | | 117,064 | | |
Gas Natural Capital Markets SA
4.125%, due 01/26/185 | | EUR | 100,000 | | | | 119,561 | | |
Inmobiliaria Colonial SA
1.863%, due 06/05/195 | | EUR | 100,000 | | | | 110,413 | | |
Telefonica Emisiones SAU
4.710%, due 01/20/205 | | EUR | 100,000 | | | | 128,082 | | |
4.797%, due 02/21/185 | | EUR | 100,000 | | | | 121,494 | | |
Total Spain corporate notes | | | | | 933,438 | | |
United Arab Emirates—0.01% | |
Xstrata Finance Dubai Ltd.
1.750%, due 05/19/165,7 | | EUR | 100,000 | | | | 110,803 | | |
United Kingdom—0.47% | |
Abbey National Treasury
Services PLC
1.125%, due 01/14/225 | | EUR | 100,000 | | | | 108,460 | | |
2.625%, due 07/16/205 | | EUR | 100,000 | | | | 118,029 | | |
232
PACE Select Advisors Trust
PACE Alternative Strategies Investments
Portfolio of investments—July 31, 2015
| | | Face
amount | | Value | |
Corporate notes—(continued) | |
United Kingdom—(continued) | |
Anglo American Capital PLC
3.250%, due 04/03/235 | | EUR | 100,000 | | | $ | 113,644 | | |
Aviva PLC
6.125%, due 07/05/434,5 | | EUR | 100,000 | | | | 131,266 | | |
Babcock International Group PLC
1.750%, due 10/06/225 | | EUR | 100,000 | | | | 110,752 | | |
Barclays Bank PLC
6.625%, due 03/30/225 | | EUR | 70,000 | | | | 97,115 | | |
BAT International Finance PLC
3.625%, due 11/09/215 | | EUR | 100,000 | | | | 126,675 | | |
Brambles Finance PLC
4.625%, due 04/20/185 | | EUR | 100,000 | | | | 121,487 | | |
Coventry Building Society
2.500%, due 11/18/205 | | EUR | 100,000 | | | | 117,075 | | |
FCE Bank PLC
1.875%, due 04/18/195 | | EUR | 100,000 | | | | 113,266 | | |
1.875%, due 06/24/215 | | EUR | 200,000 | | | | 225,779 | | |
G4S International Finance PLC
2.625%, due 12/06/185 | | EUR | 100,000 | | | | 116,160 | | |
Hammerson PLC
2.750%, due 09/26/195 | | EUR | 100,000 | | | | 117,310 | | |
Heathrow Finance PLC
7.125%, due 03/01/175 | | GBP | 50,000 | | | | 83,160 | | |
Imperial Tobacco Finance PLC
2.250%, due 02/26/215 | | EUR | 100,000 | | | | 115,121 | | |
5.000%, due 12/02/195 | | EUR | 100,000 | | | | 128,274 | | |
International Game
Technology PLC
6.625%, due 02/02/185,7 | | EUR | 50,000 | | | | 60,472 | | |
LBG Capital No. 2 PLC, Series 22
15.000%, due 12/21/195 | | EUR | 50,000 | | | | 82,369 | | |
Leeds Building Society
2.625%, due 04/01/215 | | EUR | 200,000 | | | | 231,969 | | |
Lloyds Bank PLC
7.625%, due 04/22/255 | | GBP | 50,000 | | | | 99,488 | | |
Lloyds TSB Bank PLC
10.375%, due 02/12/244,5 | | EUR | 50,000 | | | | 70,002 | | |
Mondi Finance PLC
3.375%, due 09/28/205 | | EUR | 100,000 | | | | 120,665 | | |
Motability Operations Group PLC
3.250%, due 11/30/185 | | EUR | 100,000 | | | | 119,702 | | |
NGG Finance PLC
4.250%, due 06/18/764,5 | | EUR | 100,000 | | | | 118,605 | | |
Rentokil Initial PLC
3.250%, due 10/07/215 | | EUR | 100,000 | | | | 122,108 | | |
Royal Bank of Scotland PLC
4.625%, due 09/22/214 | | EUR | 65,000 | | | | 73,135 | | |
4.875%, due 01/20/17 | | EUR | 170,000 | | | | 198,393 | | |
5.375%, due 09/30/195 | | EUR | 50,000 | | | | 64,575 | | |
SSE PLC
5.025%, due 10/01/154,5,6 | | EUR | 100,000 | | | | 110,407 | | |
Stagecoach Group PLC
5.750%, due 12/16/16 | | GBP | 50,000 | | | | 82,131 | | |
Tesco PLC
3.375%, due 11/02/185 | | EUR | 100,000 | | | | 115,465 | | |
| | | Face
amount | | Value | |
Corporate notes—(concluded) | |
United Kingdom—(concluded) | |
Vodafone Group PLC
5.375%, due 06/06/22 | | EUR | 50,000 | | | $ | 68,460 | | |
Yorkshire Building Society
2.125%, due 03/18/195 | | EUR | 100,000 | | | | 114,116 | | |
Total United Kingdom corporate notes | | | | | 3,795,635 | | |
United States—0.35% | |
Amgen, Inc.
4.375%, due 12/05/185 | | EUR | 100,000 | | | | 123,395 | | |
AT&T, Inc.
2.500%, due 03/15/23 | | EUR | 200,000 | | | | 234,411 | | |
Bank of America Corp.
1.375%, due 09/10/215 | | EUR | 100,000 | | | | 110,269 | | |
4.750%, due 04/03/175 | | EUR | 100,000 | | | | 117,747 | | |
Citigroup, Inc.
0.666%, due 05/31/174 | | EUR | 100,000 | | | | 108,960 | | |
1.375%, due 10/27/215 | | EUR | 220,000 | | | | 242,413 | | |
DIRECTV Holdings LLC/DIRECTV
Financing Co., Inc.
2.750%, due 05/19/23 | | EUR | 100,000 | | | | 117,613 | | |
GE Capital Trust II
5.500%, due 09/15/674,5 | | EUR | 100,000 | | | | 116,489 | | |
JPMorgan Chase & Co.
1.375%, due 09/16/215 | | EUR | 300,000 | | | | 332,400 | | |
Merck & Co., Inc.
1.875%, due 10/15/26 | | EUR | 100,000 | | | | 112,467 | | |
Merrill Lynch & Co., Inc.
4.625%, due 09/14/18 | | EUR | 50,000 | | | | 60,891 | | |
Metropolitan Life Global
Funding I
0.875%, due 01/20/225 | | EUR | 200,000 | | | | 214,415 | | |
2.375%, due 09/30/195 | | EUR | 200,000 | | | | 233,294 | | |
Morgan Stanley
1.875%, due 03/30/23 | | EUR | 100,000 | | | | 111,696 | | |
5.500%, due 10/02/17 | | EUR | 50,000 | | | | 60,809 | | |
Pemex Project Funding
Master Trust
6.375%, due 08/05/165 | | EUR | 50,000 | | | | 58,015 | | |
Philip Morris International, Inc.
1.875%, due 03/03/21 | | EUR | 100,000 | | | | 115,178 | | |
2.875%, due 03/03/26 | | EUR | 100,000 | | | | 121,215 | | |
Praxair, Inc.
1.625%, due 12/01/25 | | EUR | 100,000 | | | | 110,135 | | |
Verizon Communications, Inc.
2.375%, due 02/17/22 | | EUR | 100,000 | | | | 117,451 | | |
Total United States corporate notes | | | | | 2,819,263 | | |
Total corporate notes
(cost—$22,300,133) | | | | | 20,307,463 | | |
233
PACE Select Advisors Trust
PACE Alternative Strategies Investments
Portfolio of investments—July 31, 2015
| | | Face
amount | | Value | |
Non-US government obligations—3.82% | |
Brazil—1.55% | |
Brazil Notas do Tesouro Nacional
Series B 6.000%, due 08/15/22 | | BRL | 4,282,000 | | | $ | 3,243,740 | | |
Series B 6.000%, due 05/15/23 | | BRL | 492,000 | | | | 370,818 | | |
Series B 6.000%, due 05/15/45 | | BRL | 542,000 | | | | 397,309 | | |
Series B 6.000%, due 08/15/50 | | BRL | 3,867,000 | | | | 2,833,455 | | |
Series F 10.000%, due 01/01/23 | | BRL | 12,108,000 | | | | 3,076,965 | | |
Series F 10.000%, due 01/01/25 | | BRL | 10,273,000 | | | | 2,545,538 | | |
Total Brazil | | | | | 12,467,825 | | |
Germany—0.10% | |
Bundesrepublik Deutschland
0.500%, due 02/15/255 | | EUR | 570,000 | | | | 619,505 | | |
1.000%, due 08/15/245 | | EUR | 80,000 | | | | 91,396 | | |
4.750%, due 07/04/345 | | EUR | 70,000 | | | | 124,359 | | |
Total Germany | | | | | 835,260 | | |
Mexico—2.17% | |
Mexican Bonos
6.500%, due 06/10/21 | | MXN | 66,580,000 | | | | 4,318,887 | | |
7.500%, due 06/03/27 | | MXN | 63,640,000 | | | | 4,356,180 | | |
8.500%, due 05/31/29 | | MXN | 58,800,000 | | | | 4,362,870 | | |
10.000%, due 12/05/24 | | MXN | 54,320,000 | | | | 4,322,463 | | |
Total Mexico | | | | | 17,360,400 | | |
Total non-US government
obligations
(cost—$38,349,601) | | | | | 30,663,485 | | |
Time deposits—21.47% | |
ABN Amro Bank N.V.
0.310%, due 10/26/15 | | USD | 10,000,000 | | | | 9,992,601 | | |
Bank of China, Ltd.
0.010%, due 10/01/15 | | USD | 10,000,000 | | | | 9,994,075 | | |
Banque Nationale De Paris
0.090%, due 08/03/15 | | USD | 7,176,841 | | | | 7,176,841 | | |
Credit Agricole
0.270%, due 08/10/15 | | USD | 10,000,000 | | | | 10,000,000 | | |
DBS Bank Ltd.
0.300%, due 10/27/15 | | USD | 5,000,000 | | | | 5,000,000 | | |
Den Danske Bank
0.100%, due 08/03/15 | | USD | 7,000,078 | | | | 7,000,078 | | |
DZ Bank AG
0.060%, due 08/03/15 | | USD | 15,282,036 | | | | 15,282,036 | | |
Goldman Sachs International BA
0.375%, due 08/07/15 | | USD | 7,500,000 | | | | 7,500,000 | | |
ING Bank N.V.
0.290%, due 08/10/15 | | USD | 10,000,000 | | | | 10,000,000 | | |
KBC Bank N.V.
0.100%, due 08/03/15 | | USD | 14,202,575 | | | | 14,202,575 | | |
Landeskreditbank Baden Wurtt
0.160%, due 08/03/15 | | USD | 10,000,000 | | | | 9,999,911 | | |
Mizuho Corporate Bank
0.340%, due 10/30/15 | | USD | 10,000,000 | | | | 10,000,000 | | |
National Building Society
0.310%, due 10/14/15 | | USD | 6,000,000 | | | | 6,000,000 | | |
Natixis
0.390%, due 12/01/15 | | USD | 10,000,000 | | | | 10,000,000 | | |
| | | Face
amount | | Value | |
Time deposits—(concluded) | |
Nomura International PLC
0.470%, due 09/16/15 | | USD | 10,000,000 | | | $ | 9,994,002 | | |
NRW Bank
0.170%, due 08/04/15 | | USD | 10,000,000 | | | | 9,999,858 | | |
Societe Generale
0.280%, due 09/01/15 | | USD | 10,000,000 | | | | 10,000,000 | | |
Standard Chartered Bank
0.290%, due 10/29/15 | | USD | 10,000,000 | | | | 10,000,000 | | |
Total time deposits
(cost—$172,141,977) | | | | | 172,141,977 | | |
Short-term US government obligations8—17.54% | |
US Treasury Bills
0.110%, due 09/24/151 | | USD | 9,560,000 | | | | 9,559,273 | | |
0.082%, due 10/01/15 | | USD | 24,039,500 | | | | 24,037,721 | | |
0.020%, due 10/08/15 | | USD | 29,539,500 | | | | 29,536,664 | | |
0.090%, due 10/22/151 | | USD | 32,100,000 | | | | 32,095,538 | | |
0.031%, due 11/05/15 | | USD | 7,500,000 | | | | 7,498,313 | | |
0.085%, due 11/27/151 | | USD | 14,163,000 | | | | 14,159,054 | | |
0.065%, due 12/03/151 | | USD | 23,756,000 | | | | 23,749,752 | | |
Total short-term
US government obligations
(cost—$140,632,364) | | | | | 140,636,315 | | |
Repurchase agreement—7.75% | |
Repurchase agreement dated
07/31/15 with State Street
Bank and Trust Co., 0.000%
due 08/03/15, collateralized
by $17,862,703 Federal Home
Loan Mortgage Corp.
obligations, 2.080%
due 10/17/22, $4,482,647
Federal National Mortgage
Association obligations,
2.170% due 10/17/22 and
$39,969,868 US Treasury
Notes, 1.625% to 3.625%
due 03/31/19 to 06/30/20;
(value—$63,361,390);
proceeds: $62,118,000
(cost—$62,118,000) | | | 62,118,000 | | | | 62,118,000 | | |
| | | Number of
contracts/
Notional
amount | | | |
Options purchased—0.19% | |
Call options purchased—0.00%†† | |
Euro STOXX 50 Index,
strike @ 3,925, expires 08/21/15 | | | 194 | | | | 639 | | |
Euro STOXX 50 Index,
strike @ 3,950, expires 08/21/15 | | | 146 | | | | 321 | | |
JPY Currency Futures,
strike @ 84.5, expires 08/07/15 | | | 94 | | | | 588 | | |
JPY Currency Futures,
strike @ 85, expires 08/07/15 | | | 73 | | | | 456 | | |
234
PACE Select Advisors Trust
PACE Alternative Strategies Investments
Portfolio of investments—July 31, 2015
| | | Number of
contracts/
Notional
amount | | Value | |
Options purchased—(continued) | |
Call options purchased—(concluded) | |
JPY Currency Futures,
strike @ 86, expires 08/07/15 | | | 97 | | | $ | 606 | | |
S&P 500 Index,
strike @ 2,200, expires 08/21/15 | | | 264 | | | | 7,920 | | |
S&P 500 Index,
strike @ 2,210, expires 08/21/15 | | | 36 | | | | 900 | | |
S&P 500 Index,
strike @ 2,240, expires 08/21/15 | | | 48 | | | | 816 | | |
S&P 500 Index,
strike @ 2,250, expires 08/21/15 | | | 94 | | | | 1,410 | | |
US Treasury Note 10 Year Futures,
strike @ 129.5, expires 08/21/15 | | | 144 | | | | 13,500 | | |
Total call options purchased | | | | | 27,156 | | |
Put options & swaptions purchased—0.19% | |
Apple Inc., Flex,
strike @ 125, expires 06/17/16 | | | 117 | | | | 165,438 | | |
Euro STOXX 50 Index,
strike @ 2,850, expires 08/21/15 | | | 97 | | | | 533 | | |
Euro STOXX 50 Index,
strike @ 2,900, expires 08/21/15 | | | 73 | | | | 481 | | |
Euro STOXX 50 Index,
strike @ 2,950, expires 08/21/15 | | | 97 | | | | 852 | | |
Euro STOXX 50 Index,
strike @ 3,000, expires 06/17/16 | | | 279 | | | | 262,289 | | |
Euro STOXX 50 Index,
strike @ 3,000, expires 12/16/16 | | | 150 | | | | 220,913 | | |
Euro STOXX 50 Index,
strike @ 3,050, expires 08/21/15 | | | 73 | | | | 1,042 | | |
JPY Currency Futures,
strike @ 77, expires 08/07/15 | | | 97 | | | | 606 | | |
JPY Currency Futures,
strike @ 78, expires 08/07/15 | | | 191 | | | | 3,581 | | |
S&P 500 Index,
strike @ 1,760, expires 08/21/15 | | | 84 | | | | 840 | | |
S&P 500 Index,
strike @ 1,780, expires 08/21/15 | | | 36 | | | | 540 | | |
S&P 500 Index,
strike @ 1,800, expires 08/21/15 | | | 36 | | | | 1,116 | | |
S&P 500 Index,
strike @ 1,820, expires 08/21/15 | | | 97 | | | | 3,977 | | |
S&P 500 Index,
strike @ 1,860, expires 08/21/15 | | | 13 | | | | 650 | | |
S&P 500 Index,
strike @ 1,900, expires 08/21/15 | | | 198 | | | | 13,860 | | |
US Treasury Note 10 Year Futures,
strike @ 122.5, expires 08/21/15 | | | 144 | | | | 2,250 | | |
6 Month EURIBOR Interest Rate
Swap, strike @ 4.000%,
expires 01/09/34 (counterparty:
RBS; receive floating rate);
underlying swap terminates
01/11/54 3 | | EUR | 10,000,000 | | | | 392,845 | | |
| | | Number of
contracts/
Notional
amount | | Value | |
Options purchased—(concluded) | |
Put options & swaptions purchased—(concluded) | |
6 Month EURIBOR Interest Rate
Swap, strike @ 4.000%,
expires 05/08/34 (counterparty:
CITI; receive floating rate);
underlying swap terminates
05/10/54 3 | | EUR | 11,500,000 | | | $ | 461,509 | | |
Total put options &
swaptions purchased | | | | | 1,533,322 | | |
Total options purchased
(cost—$3,224,339) | | | | | 1,560,478 | | |
Total investments before
investments sold short
(cost—$781,953,660)—97.41% | | | | | 781,142,712 | | |
| | | Number of
shares | | | |
Investments sold short—(6.59)%
Common stocks—(5.23)% | |
Australia—(0.09)% | |
Westfield Corp. | | | (96,398 | ) | | | (706,735 | ) | |
Bermuda—(0.24)% | |
Nabors Industries Ltd. | | | (166,181 | ) | | | (1,929,361 | ) | |
Canada—(0.90)% | |
Agnico-Eagle Mines Ltd. | | | (800 | ) | | | (17,702 | ) | |
Athabasca Oil Corp. | | | (58,400 | ) | | | (67,427 | ) | |
Barrick Gold Corp. | | | (109,900 | ) | | | (777,287 | ) | |
Baytex Energy Corp. | | | (64,100 | ) | | | (551,872 | ) | |
First Quantum Minerals Ltd. | | | (13,500 | ) | | | (107,868 | ) | |
Goldcorp, Inc. | | | (56,500 | ) | | | (753,852 | ) | |
Kinross Gold Corp. | | | (97,400 | ) | | | (178,736 | ) | |
MEG Energy Corp. | | | (74,300 | ) | | | (796,487 | ) | |
Paramount Resources Ltd., Class A | | | (33,200 | ) | | | (500,088 | ) | |
Restaurant Brands International, Inc. | | | (35,700 | ) | | | (1,544,448 | ) | |
Silver Wheaton Corp. | | | (54,800 | ) | | | (717,342 | ) | |
Turquoise Hill Resources Ltd. | | | (138,600 | ) | | | (471,591 | ) | |
Yamana Gold, Inc. | | | (370,000 | ) | | | (732,729 | ) | |
Total Canada common stocks | | | | | (7,217,429 | ) | |
Cayman Islands—(0.12)% | |
MGM China Holdings Ltd. | | | (357,200 | ) | | | (758,422 | ) | |
Sands China Ltd. | | | (41,200 | ) | | | (182,289 | ) | |
Total Cayman Islands common stocks | | | | | (940,711 | ) | |
France—(0.27)% | |
Alstom SA | | | (69,900 | ) | | | (2,054,304 | ) | |
Vallourec SA | | | (6,710 | ) | | | (110,281 | ) | |
Total France common stocks | | | | | (2,164,585 | ) | |
235
PACE Select Advisors Trust
PACE Alternative Strategies Investments
Portfolio of investments—July 31, 2015
| | | Number of
shares | | Value | |
Investments sold short—(continued) | |
Common stocks—(continued) | |
Germany—(0.09)% | |
SAP SE | | | (5,828 | ) | | $ | (417,703 | ) | |
Telefonica Deutschland Holding AG | | | (45,977 | ) | | | (285,545 | ) | |
Total Germany common stocks | | | | | (703,248 | ) | |
Ireland—(0.01)% | |
Weatherford International PLC | | | (8,117 | ) | | | (86,690 | ) | |
Japan—(0.07)% | |
ACOM Co. Ltd. | | | (10,000 | ) | | | (47,525 | ) | |
Benesse Holdings, Inc. | | | (11,500 | ) | | | (310,385 | ) | |
Nikon Corp. | | | (4,500 | ) | | | (53,520 | ) | |
Toyo Suisan Kaisha Ltd. | | | (3,000 | ) | | | (113,527 | ) | |
Total Japan common stocks | | | | | (524,957 | ) | |
Jersey—0.00%†† | |
Randgold Resources Ltd. | | | (528 | ) | | | (31,844 | ) | |
Sweden—(0.13)% | |
Lundin Petroleum AB | | | (73,268 | ) | | | (1,062,489 | ) | |
United Kingdom—(0.17)% | |
Antofagasta PLC | | | (5,641 | ) | | | (49,949 | ) | |
Fresnillo PLC | | | (131,430 | ) | | | (1,327,953 | ) | |
Total United Kingdom common stocks | | | | | (1,377,902 | ) | |
United States—(3.14)% | |
American Airlines Group, Inc. | | | (43,197 | ) | | | (1,732,200 | ) | |
Anadarko Petroleum Corp. | | | (1,162 | ) | | | (86,395 | ) | |
Apache Corp. | | | (24,543 | ) | | | (1,125,542 | ) | |
AT&T, Inc. | | | (24,174 | ) | | | (839,805 | ) | |
Cabot Oil & Gas Corp. | | | (39,144 | ) | | | (1,024,007 | ) | |
Caterpillar, Inc. | | | (13,951 | ) | | | (1,096,967 | ) | |
Cheniere Energy, Inc. | | | (35,205 | ) | | | (2,428,089 | ) | |
Cimarex Energy Co. | | | (1,229 | ) | | | (127,963 | ) | |
Cobalt International Energy, Inc. | | | (129,461 | ) | | | (998,144 | ) | |
Columbia Pipeline Group, Inc. | | | (25,900 | ) | | | (755,762 | ) | |
Crown Castle International Corp. | | | (4,345 | ) | | | (355,899 | ) | |
Deere & Co. | | | (4,290 | ) | | | (405,705 | ) | |
Energen Corp. | | | (1,285 | ) | | | (70,932 | ) | |
Freeport-McMoRan, Inc. | | | (71,390 | ) | | | (838,832 | ) | |
Halliburton Co. | | | (41,837 | ) | | | (1,748,368 | ) | |
| | | Number of
shares | | Value | |
Investments sold short—(concluded) | |
Common stocks—(concluded) | |
United States—(concluded) | |
Helmerich & Payne, Inc. | | | (263 | ) | | $ | (15,186 | ) | |
Incyte Corp. | | | (138 | ) | | | (14,391 | ) | |
Netflix, Inc. | | | (6,846 | ) | | | (782,566 | ) | |
NRG Energy, Inc. | | | (59,342 | ) | | | (1,332,228 | ) | |
Occidental Petroleum Corp. | | | (7,149 | ) | | | (501,860 | ) | |
QEP Resources, Inc. | | | (35,417 | ) | | | (491,588 | ) | |
SBA Communications Corp., Class A | | | (128 | ) | | | (15,452 | ) | |
Southwestern Energy Co. | | | (33,932 | ) | | | (631,135 | ) | |
SunEdison, Inc. | | | (56,239 | ) | | | (1,309,244 | ) | |
Tesla Motors, Inc. | | | (720 | ) | | | (191,628 | ) | |
The Boeing Co. | | | (7,649 | ) | | | (1,102,756 | ) | |
The Williams Cos., Inc. | | | (31,895 | ) | | | (1,673,850 | ) | |
Twitter, Inc. | | | (41,769 | ) | | | (1,295,257 | ) | |
United Parcel Service, Inc., Class B | | | (2,027 | ) | | | (207,484 | ) | |
Wal-Mart Stores, Inc. | | | (8,743 | ) | | | (629,321 | ) | |
Whiting Petroleum Corp. | | | (66,393 | ) | | | (1,360,392 | ) | |
Total United States common stocks | | | | | (25,188,948 | ) | |
Total common stocks
(proceeds—$51,072,423) | | | | | (41,934,899 | ) | |
Investment companies—(1.36)% | |
Consumer Discretionary Select
Sector SPDR Fund | | | (16,481 | ) | | | (1,322,106 | ) | |
Health Care Select Sector SPDR Fund | | | (11,303 | ) | | | (865,697 | ) | |
Industrial Select Sector SPDR Fund | | | (22,248 | ) | | | (1,206,287 | ) | |
SPDR S&P 500 ETF Trust | | | (27,651 | ) | | | (5,820,535 | ) | |
SPDR S&P Regional Banking ETF | | | (29,293 | ) | | | (1,277,761 | ) | |
Technology Select Sector SPDR Fund | | | (9,187 | ) | | | (391,182 | ) | |
Total Investment companies
(proceeds—$10,860,356) | | | | | (10,883,568 | ) | |
Total investments sold short
(proceeds—$61,932,779) | | | | | (52,818,467 | ) | |
Other assets in excess
of liabilities—9.18% | | | | | 73,600,033 | | |
Net assets—100.00% | | | | $ | 801,924,278 | | |
For a listing of defined portfolio acronyms, counterparty acronyms and currency abbreviations that are used throughout the Portfolio of investments as well as the tables that follow, please refer to page 254.
Aggregate cost for federal income tax purposes before investments sold short was $781,864,775; and net unrealized depreciation consisted of:
Gross unrealized appreciation | | $ | 27,878,687 | | |
Gross unrealized depreciation | | | (28,600,750 | ) | |
Net unrealized depreciation | | $ | (722,063 | ) | |
236
PACE Select Advisors Trust
PACE Alternative Strategies Investments
Portfolio of investments—July 31, 2015
Written options
Number of
contracts | | Call options written | | Expiration
date | | Premiums
received | | Current
value | | Unrealized
appreciation
(depreciation) | |
| | 117 | | | Apple Inc., Flex, strike @ 125 | | 06/17/16 | | $ | 140,178 | | | $ | (111,735 | ) | | $ | 28,443 | | |
| | 73 | | | Euro STOXX 50 Index, strike @ 3,800 | | 08/21/15 | | | 16,086 | | | | (2,405 | ) | | | 13,681 | | |
| | 168 | | | Euro STOXX 50 Index, strike @ 3,825 | | 08/21/15 | | | 29,227 | | | | (3,321 | ) | | | 25,906 | | |
| | 73 | | | Euro STOXX 50 Index, strike @ 3,850 | | 08/21/15 | | | 9,708 | | | | (882 | ) | | | 8,826 | | |
| | 94 | | | JPY Currency Futures, strike @ 82.5 | | 08/07/15 | | | 11,467 | | | | (2,938 | ) | | | 8,529 | | |
| | 73 | | | JPY Currency Futures, strike @ 83.5 | | 08/07/15 | | | 14,692 | | | | (912 | ) | | | 13,780 | | |
| | 97 | | | JPY Currency Futures, strike @ 84 | | 08/07/15 | | | 19,482 | | | | (606 | ) | | | 18,876 | | |
| | 47 | | | S&P 500 Index, strike @ 2,145 | | 08/21/15 | | | 14,001 | | | | (13,442 | ) | | | 559 | | |
| | 47 | | | S&P 500 Index, strike @ 2,150 | | 08/21/15 | | | 10,711 | | | | (10,199 | ) | | | 512 | | |
| | 94 | | | S&P 500 Index, strike @ 2,160 | | 08/21/15 | | | 53,752 | | | | (9,870 | ) | | | 43,882 | | |
| | 47 | | | S&P 500 Index, strike @ 2,170 | | 08/21/15 | | | 14,471 | | | | (3,243 | ) | | | 11,228 | | |
| | 36 | | | S&P 500 Index, strike @ 2,175 | | 08/21/15 | | | 14,244 | | | | (2,340 | ) | | | 11,904 | | |
| | 171 | | | S&P 500 Index, strike @ 2,180 | | 08/21/15 | | | 59,209 | | | | (9,405 | ) | | | 49,804 | | |
| | 144 | | | US Treasury Note 10 Year Futures,
strike @ 128.5 | | 08/21/15 | | | 28,812 | | | | (36,000 | ) | | | (7,188 | ) | |
| | | | | | | | | $ | 436,040 | | | $ | (207,298 | ) | | $ | 228,742 | | |
| | | Put options written | | | | | | | | | |
| | 97 | | | Euro STOXX 50 Index, strike @ 3,000 | | 08/21/15 | | $ | 25,303 | | | $ | (1,065 | ) | | $ | 24,238 | | |
| | 170 | | | Euro STOXX 50 Index, strike @ 3,150 | | 08/21/15 | | | 63,059 | | | | (3,921 | ) | | | 59,138 | | |
| | 73 | | | Euro STOXX 50 Index, strike @ 3,250 | | 08/21/15 | | | 15,168 | | | | (3,207 | ) | | | 11,961 | | |
| | 97 | | | JPY Currency Futures, strike @ 78.5 | | 08/07/15 | | | 23,145 | | | | (2,425 | ) | | | 20,720 | | |
| | 191 | | | JPY Currency Futures, strike @ 79.5 | | 08/07/15 | | | 33,342 | | | | (16,713 | ) | | | 16,629 | | |
| | 36 | | | S&P 500 Index, strike @ 1,880 | | 08/21/15 | | | 37,784 | | | | (2,088 | ) | | | 35,696 | | |
| | 97 | | | S&P 500 Index, strike @ 1,970 | | 08/21/15 | | | 80,945 | | | | (18,915 | ) | | | 62,030 | | |
| | 94 | | | S&P 500 Index, strike @ 1,990 | | 08/21/15 | | | 93,802 | | | | (26,038 | ) | | | 67,764 | | |
| | 95 | | | S&P 500 Index, strike @ 2,000 | | 08/21/15 | | | 70,949 | | | | (30,210 | ) | | | 40,739 | | |
| | 47 | | | S&P 500 Index, strike @ 2,010 | | 08/21/15 | | | 46,901 | | | | (15,510 | ) | | | 31,391 | | |
| | 144 | | | US Treasury Note 10 Year Futures,
strike @ 123.5 | | 08/21/15 | | | 27,109 | | | | (2,250 | ) | | | 24,859 | | |
| | | | | | | | | $ | 517,507 | | | $ | (122,342 | ) | | $ | 395,165 | | |
| | | | | | | | | $ | 953,547 | | | $ | (329,640 | ) | | $ | 623,907 | | |
Written options activity for the year ended July 31, 2015 was as follows:
| | | Number of
Contracts | | Premiums
received | |
Options outstanding at July 31, 2014 | | | 22,133 | | | $ | 5,984,108 | | |
Options written | | | 263,667 | | | | 75,804,233 | | |
Options exercised | | | (611 | ) | | | (3,463,181 | ) | |
Options terminated in closing purchase transactions | | | (228,703 | ) | | | (63,160,157 | ) | |
Options expired prior to exercise | | | (54,064 | ) | | | (14,211,456 | ) | |
Options outstanding at July 31, 2015 | | | 2,422 | | | $ | 953,547 | | |
237
PACE Select Advisors Trust
PACE Alternative Strategies Investments
Portfolio of investments—July 31, 2015
Written options—(concluded)
| | | Notional
amount | | Premiums
received | |
Options outstanding at July 31, 2014 | | KRW | 36,512,204 | | | $ | 509,272 | | |
Options written | | | 42,012,204 | | | | 672,408 | | |
Options terminated in closing purchase transactions | | | (78,524,408 | ) | | | (1,181,680 | ) | |
Options expired prior to exercise | | | — | | | | — | | |
Options outstanding at July 31, 2015 | | KRW | — | | | $ | — | | |
| | | Notional
amount | | Premiums
received | |
Options outstanding at July 31, 2014 | | EUR | — | | | $ | — | | |
Options written | | | 22,358 | | | | 280,375 | | |
Options terminated in closing purchase transactions | | | (22,358 | ) | | | (280,375 | ) | |
Options expired prior to exercise | | | — | | | | — | | |
Options outstanding at July 31, 2015 | | EUR | — | | | $ | — | | |
Foreign exchange written options
Notional
amount
(000) | | Puts written | | Counterparty | | Expiration
date | | Premiums
received | | Current
value | | Unrealized
appreciation | |
EUR | 4,400 | | | EUR Put/USD Call,
strike @ USD 1.05 | | BNP | | 03/29/16 | | $ | 133,654 | | | $ | (75,877 | ) | | $ | 57,777 | | |
EUR | 4,400 | | | EUR Put/USD Call,
strike @ USD 1.05 | | BNP | | 03/30/16 | | | 133,653 | | | | (76,224 | ) | | | 57,429 | | |
EUR | 4,400 | | | EUR Put/USD Call,
strike @ USD 1.05 | | BNP | | 03/31/16 | | | 133,654 | | | | (76,515 | ) | | | 57,139 | | |
EUR | 4,400 | | | EUR Put/USD Call,
strike @ USD 1.05 | | BNP | | 04/01/16 | | | 133,653 | | | | (76,862 | ) | | | 56,791 | | |
EUR | 4,400 | | | EUR Put/USD Call,
strike @ USD 1.05 | | BNP | | 04/04/16 | | | 133,654 | | | | (77,211 | ) | | | 56,443 | | |
| | | | | | | | | | | $ | 668,268 | | | $ | (382,689 | ) | | $ | 285,579 | | |
Foreign exchange written options activity for the year ended July 31, 2015 was as follows:
| | | Premiums
received | |
Foreign exchange options outstanding at July 31, 2014 | | $ | 507,275 | | |
Foreign exchange options written | | | 1,842,530 | | |
Foreign exchange options terminated in closing purchase transactions | | | (1,258,537 | ) | |
Foreign exchange options expired prior to exercise | | | (423,000 | ) | |
Foreign exchange options outstanding at July 31, 2015 | | $ | 668,268 | | |
Futures contracts
Number of
contracts | | Currency | |
| | Expiration
date | | Cost | | Current
value | | Unrealized
appreciation
(depreciation) | |
US Treasury futures buy contracts: | |
| | 7 | | | USD | | | | Ultra Long US Treasury Bond Futures | | September 2015 | | $ | 1,102,589 | | | $ | 1,116,719 | | | $ | 14,130 | | |
| | 11 | | | USD | | | | US Long Bond Futures | | September 2015 | | | 1,695,854 | | | | 1,715,313 | | | | 19,459 | | |
238
PACE Select Advisors Trust
PACE Alternative Strategies Investments
Portfolio of investments—July 31, 2015
Futures contracts—(continued)
Number of
contracts | | Currency | |
| | Expiration
date | | Cost | | Current
value | | Unrealized
appreciation
(depreciation) | |
US Treasury futures buy contracts—(concluded) | | | |
| | 38 | | | USD | | | | US Treasury Note 10 Year Futures | | September 2015 | | $ | 4,826,081 | | | $ | 4,842,625 | | | $ | 16,544 | | |
| | 169 | | | USD | | | | US Treasury Note 10 Year Futures** | | September 2015 | | | 21,420,595 | | | | 21,536,937 | | | | 116,342 | | |
| | 22 | | | USD | | | | US Treasury Note 2 Year Futures | | September 2015 | | | 4,816,944 | | | | 4,819,375 | | | | 2,431 | | |
| | 148 | | | USD | | | | US Treasury Note 2 Year Futures** | | September 2015 | | | 32,334,359 | | | | 32,421,250 | | | | 86,891 | | |
| | 52 | | | USD | | | | US Treasury Note 5 Year Futures | | September 2015 | | | 6,216,408 | | | | 6,231,875 | | | | 15,467 | | |
| | 45 | | | USD | | | | US Treasury Note 5 Year Futures** | | September 2015 | | | 5,358,947 | | | | 5,392,969 | | | | 34,022 | | |
Index futures buy contracts: | | | |
| | 4 | | | AUD | | | | ASX SPI 200 Index Futures | | September 2015 | | | 411,953 | | | | 413,060 | | | | 1,107 | | |
| | 41 | | | CHF | | | | Swiss Market Index Futures** | | September 2015 | | | 3,917,794 | | | | 3,992,652 | | | | 74,858 | | |
| | 36 | | | EUR | | | | Amsterdam Index Futures | | August 2015 | | | 3,896,002 | | | | 3,891,629 | | | | (4,373 | ) | |
| | 65 | | | EUR | | | | CAC 40 Index Futures | | August 2015 | | | 3,633,476 | | | | 3,629,279 | | | | (4,197 | ) | |
| | 18 | | | EUR | | | | DAX Index Futures | | September 2015 | | | 5,528,270 | | | | 5,587,569 | | | | 59,299 | | |
| | 1,701 | | | EUR | | | | EURO STOXX 50 Index Futures | | September 2015 | | | 14,110,090 | | | | 14,683,457 | | | | 573,367 | | |
| | 502 | | | EUR | | | | EURO STOXX 50 Index Futures | | September 2015 | | | 19,243,630 | | | | 19,836,558 | | | | 592,928 | | |
| | 43 | | | EUR | | | | FTSE MIB Index Futures | | September 2015 | | | 5,361,759 | | | | 5,555,995 | | | | 194,236 | | |
| | 37 | | | EUR | | | | IBEX 35 Index Futures | | August 2015 | | | 4,613,224 | | | | 4,538,513 | | | | (74,711 | ) | |
| | 17 | | | HKD | | | | Hang Seng Index Futures | | August 2015 | | | 2,664,402 | | | | 2,689,150 | | | | 24,748 | | |
| | 46 | | | JPY | | | | NIKKEI 225 Index Futures | | September 2015 | | | 7,599,778 | | | | 7,634,809 | | | | 35,031 | | |
| | 58 | | | JPY | | | | TOPIX Index Futures | | September 2015 | | | 7,670,919 | | | | 7,768,588 | | | | 97,669 | | |
| | 43 | | | SEK | | | | OMX 30 Index Futures | | August 2015 | | | 816,762 | | | | 804,498 | | | | (12,264 | ) | |
| | 13 | | | USD | | | | Dow Jones E-Mini Index Futures | | September 2015 | | | 1,156,106 | | | | 1,144,910 | | | | (11,196 | ) | |
| | 504 | | | USD | | | | NASDAQ 100 E-Mini Index Futures | | September 2015 | | | 45,152,309 | | | | 46,216,800 | | | | 1,064,491 | | |
| | 9 | | | USD | | | | Russell 2000 Mini Index Futures | | September 2015 | | | 1,134,224 | | | | 1,111,680 | | | | (22,544 | ) | |
| | 30 | | | USD | | | | S&P 500 E-Mini Index Futures | | September 2015 | | | 3,147,895 | | | | 3,147,600 | | | | (295 | ) | |
| | 1 | | | USD | | | | S&P Midcap 400 E-Mini Index Futures | | September 2015 | | | 150,236 | | | | 149,930 | | | | (306 | ) | |
| | 39 | | | USD | | | | SGX CNX NIFTY Index Futures | | August 2015 | | | 664,814 | | | | 668,694 | | | | 3,880 | | |
| | 2 | | | USD | | | | SGX FTSE China A50 Index Future | | August 2015 | | | 21,326 | | | | 21,120 | | | | (206 | ) | |
Interest rate futures buy contracts: | | | |
| | 22 | | | AUD | | | | Australian Bond 10 Year Futures | | September 2015 | | | 2,046,528 | | | | 2,055,022 | | | | 8,494 | | |
| | 185 | | | AUD | | | | Australian Bond 3 Year Futures | | September 2015 | | | 15,129,315 | | | | 15,127,714 | | | | (1,601 | ) | |
| | 67 | | | CAD | | | | Canada Government Bond 10 Year Futures | | September 2015 | | | 7,287,658 | | | | 7,329,862 | | | | 42,204 | | |
| | 106 | | | CAD | | | | Canadian Bankers Acceptance Futures | | December 2015 | | | 20,121,853 | | | | 20,134,610 | | | | 12,757 | | |
| | 102 | | | CAD | | | | Canadian Bankers Acceptance Futures | | March 2016 | | | 19,357,385 | | | | 19,376,763 | | | | 19,378 | | |
| | 4 | | | CHF | | | | 3 month Euroswiss Interest Rate Futures | | December 2015 | | | 1,044,469 | | | | 1,043,465 | | | | (1,004 | ) | |
| | 6 | | | CHF | | | | 3 month Euroswiss Interest Rate Futures | | March 2016 | | | 1,566,599 | | | | 1,565,352 | | | | (1,247 | ) | |
| | 8 | | | CHF | | | | 3 month Euroswiss Interest Rate Futures | | June 2016 | | | 2,088,168 | | | | 2,086,723 | | | | (1,445 | ) | |
| | 30 | | | EUR | | | | 3 Month EURIBOR Futures | | December 2015 | | | 8,238,532 | | | | 8,238,939 | | | | 407 | | |
| | 27 | | | EUR | | | | 3 Month EURIBOR Futures | | March 2016 | | | 7,414,531 | | | | 7,414,674 | | | | 143 | | |
| | 28 | | | EUR | | | | 3 Month EURIBOR Futures | | June 2016 | | | 7,687,955 | | | | 7,688,907 | | | | 952 | | |
| | 34 | | | EUR | | | | 3 Month EURIBOR Futures | | September 2016 | | | 9,332,791 | | | | 9,334,663 | | | | 1,872 | | |
| | 46 | | | EUR | | | | 3 Month EURIBOR Futures | | December 2016 | | | 12,622,882 | | | | 12,626,093 | | | | 3,211 | | |
| | 51 | | | EUR | | | | 3 Month EURIBOR Futures | | March 2017 | | | 13,989,164 | | | | 13,993,593 | | | | 4,429 | | |
| | 53 | | | EUR | | | | 3 Month EURIBOR Futures | | June 2017 | | | 14,532,637 | | | | 14,536,541 | | | | 3,904 | | |
| | 293 | | | EUR | | | | German Euro BOBL Futures | | September 2015 | | | 41,857,238 | | | | 41,932,119 | | | | 74,881 | | |
239
PACE Select Advisors Trust
PACE Alternative Strategies Investments
Portfolio of investments—July 31, 2015
Futures contracts—(continued)
Number of
contracts | | Currency | |
| | Expiration
date | | Cost | | Current
value | | Unrealized
appreciation
(depreciation) | |
Interest rate futures buy contracts—(concluded) | | | |
| | 4 | | | EUR | | | | German Euro Bund Futures | | September 2015 | | $ | 670,790 | | | $ | 678,280 | | | $ | 7,490 | | |
| | 3 | | | EUR | | | | German Euro Buxl 30 Year Futures | | September 2015 | | | 498,352 | | | | 513,981 | | | | 15,629 | | |
| | 57 | | | EUR | | | | German Euro Schatz Futures | | September 2015 | | | 6,968,499 | | | | 6,967,099 | | | | (1,400 | ) | |
| | 6 | | | EUR | | | | Italian Government Bond Futures | | September 2015 | | | 875,624 | | | | 900,785 | | | | 25,161 | | |
| | 6 | | | EUR | | | | Mid-Term Euro-OAT Futures | | September 2015 | | | 968,174 | | | | 986,449 | | | | 18,275 | | |
| | 114 | | | GBP | | | | 90-Day Sterling Pound Futures | | December 2015 | | | 22,095,893 | | | | 22,097,750 | | | | 1,857 | | |
| | 90 | | | GBP | | | | 90-Day Sterling Pound Futures | | March 2016 | | | 17,420,758 | | | | 17,424,510 | | | | 3,752 | | |
| | 62 | | | GBP | | | | 90-Day Sterling Pound Futures | | June 2016 | | | 11,987,179 | | | | 11,985,397 | | | | (1,782 | ) | |
| | 91 | | | GBP | | | | 90-Day Sterling Pound Futures | | September 2016 | | | 17,560,954 | | | | 17,563,048 | | | | 2,094 | | |
| | 76 | | | GBP | | | | 90-Day Sterling Pound Futures | | December 2016 | | | 14,638,765 | | | | 14,644,303 | | | | 5,538 | | |
| | 59 | | | GBP | | | | 90-Day Sterling Pound Futures | | March 2017 | | | 11,346,561 | | | | 11,352,479 | | | | 5,918 | | |
| | 50 | | | GBP | | | | 90-Day Sterling Pound Futures | | June 2017 | | | 9,604,415 | | | | 9,608,057 | | | | 3,642 | | |
| | 8 | | | GBP | | | | United Kingdom Long Gilt Bond Futures | | September 2015 | | | 1,460,643 | | | | 1,465,453 | | | | 4,810 | | |
| | 9 | | | JPY | | | | Japan Government Bond 10 Year Futures | | September 2015 | | | 10,697,124 | | | | 10,714,891 | | | | 17,767 | | |
| | 16 | | | JPY | | | | JGB MINI 10 Year Futures | | September 2015 | | | 1,894,827 | | | | 1,904,999 | | | | 10,172 | | |
| | 81 | | | USD | | | | 90-Day Eurodollar Futures | | December 2015 | | | 20,143,192 | | | | 20,143,688 | | | | 496 | | |
| | 89 | | | USD | | | | 90-Day Eurodollar Futures | | March 2016 | | | 22,093,330 | | | | 22,095,362 | | | | 2,032 | | |
| | 97 | | | USD | | | | 90-Day Eurodollar Futures | | June 2016 | | | 24,030,606 | | | | 24,035,387 | | | | 4,781 | | |
| | 90 | | | USD | | | | 90-Day Eurodollar Futures | | September 2016 | | | 22,241,935 | | | | 22,254,750 | | | | 12,815 | | |
| | 79 | | | USD | | | | 90-Day Eurodollar Futures | | December 2016 | | | 19,481,129 | | | | 19,495,225 | | | | 14,096 | | |
| | 71 | | | USD | | | | 90-Day Eurodollar Futures | | March 2017 | | | 17,478,301 | | | | 17,491,738 | | | | 13,437 | | |
| | 63 | | | USD | | | | 90-Day Eurodollar Futures | | June 2017 | | | 15,484,283 | | | | 15,494,850 | | | | 10,567 | | |
| | | | | | | | | | | $ | 662,625,785 | | | $ | 665,867,075 | | | $ | 3,241,290 | | |
| | | | | | | | | Proceeds | | | | | |
Index futures sell contracts: | | | |
| | 43 | | | AUD | | | | ASX SPI 200 Index Futures | | September 2015 | | $ | 4,347,338 | | | $ | 4,440,392 | | | $ | (93,054 | ) | |
| | 140 | | | BRL | | | | Ibovespa Index Futures** | | August 2015 | | | 2,059,643 | | | | 2,081,508 | | | | (21,865 | ) | |
| | 37 | | | CAD | | | | S&P TSX 60 Index Futures | | September 2015 | | | 4,734,406 | | | | 4,816,210 | | | | (81,804 | ) | |
| | 36 | | | CHF | | | | Swiss Market Index Futures | | September 2015 | | | 3,351,045 | | | | 3,505,744 | | | | (154,699 | ) | |
| | 1,075 | | | EUR | | | | EURO STOXX Insurance Index Futures | | September 2015 | | | 14,374,082 | | | | 14,911,223 | | | | (537,141 | ) | |
| | 149 | | | GBP | | | | FTSE 100 Index Futures | | September 2015 | | | 15,498,353 | | | | 15,482,925 | | | | 15,428 | | |
| | 3 | | | HKD | | | | H-Shares Index Futures | | August 2015 | | | 216,340 | | | | 214,910 | | | | 1,430 | | |
| | 13 | | | HKD | | | | Hang Seng Index Futures | | August 2015 | | | 2,057,053 | | | | 2,056,409 | | | | 644 | | |
| | 50 | | | KRW | | | | Kospi 200 Index Futures | | September 2015 | | | 5,324,473 | | | | 5,200,188 | | | | 124,285 | | |
| | 24 | | | KRW | | | | Kospi 200 Index Futures** | | September 2015 | | | 2,511,797 | | | | 2,496,090 | | | | 15,707 | | |
| | 93 | | | SEK | | | | OMX 30 Index Futures | | August 2015 | | | 1,733,503 | | | | 1,739,960 | | | | (6,457 | ) | |
| | 7 | | | SGD | | | | MSCI Singapore Index Future | | August 2015 | | | 373,439 | | | | 362,285 | | | | 11,154 | | |
| | 5 | | | TWD | | | | Taiex Futures Index Futures** | | August 2015 | | | 276,619 | | | | 271,606 | | | | 5,013 | | |
| | 61 | | | USD | | | | Mini MSCI Emerging Markets (EM) Index Futures | | September 2015 | | | 2,818,697 | | | | 2,745,000 | | | | 73,697 | | |
| | 4 | | | USD | | | | MSCI EAFE Mini Index Futures | | September 2015 | | | 369,417 | | | | 374,400 | | | | (4,983 | ) | |
| | 43 | | | USD | | | | MSCI Taiwan Index Futures | | August 2015 | | | 1,368,542 | | | | 1,383,740 | | | | (15,198 | ) | |
| | 23 | | | USD | | | | MSCI Taiwan Index Futures** | | August 2015 | | | 734,318 | | | | 740,140 | | | | (5,822 | ) | |
| | 395 | | | USD | | | | Russell 2000 Mini Index Futures | | September 2015 | | | 49,684,420 | | | | 48,790,400 | | | | 894,020 | | |
| | 370 | | | USD | | | | S&P 500 E-Mini Index Futures | | September 2015 | | | 38,556,497 | | | | 38,820,400 | | | | (263,903 | ) | |
| | 4 | | | ZAR | | | | FTSE/JSE Africa Top 40 Tradeable Index Futures | | September 2015 | | | 147,310 | | | | 147,124 | | | | 186 | | |
240
PACE Select Advisors Trust
PACE Alternative Strategies Investments
Portfolio of investments—July 31, 2015
Futures contracts—(concluded)
Number of
contracts | | Currency | |
| | Expiration
date | | Proceeds | | Current
value | | Unrealized
appreciation
(depreciation) | |
Interest rate futures sell contracts: | | | |
| | 68 | | | AUD | | | | Australian Bond 10 Year Futures | | September 2015 | | $ | 6,202,967 | | | $ | 6,351,886 | | | $ | (148,919 | ) | |
| | 89 | | | CAD | | | | Canada Government Bond 10 Year Futures* | | September 2015 | | | 9,477,424 | | | | 9,736,682 | | | | (259,258 | ) | |
| | 51 | | | EUR | | | | German Euro Bund Futures* | | September 2015 | | | 8,435,333 | | | | 8,648,065 | | | | (212,732 | ) | |
| | 12 | | | GBP | | | | United Kingdom Long Gilt Bond Futures* | | September 2015 | | | 2,171,315 | | | | 2,198,180 | | | | (26,865 | ) | |
| | 2 | | | JPY | | | | JGB MINI 10 Year Futures | | September 2015 | | | 236,712 | | | | 238,125 | | | | (1,413 | ) | |
| | | | | | | | | | | $ | 177,061,043 | | | $ | 177,753,592 | | | $ | (692,549 | ) | |
| | | | | | | | | | | | | | | $ | 2,548,741 | | |
* Exposure to Futures Contracts is achieved through the use of a swap contract with Barclays Bank PLC.
** Exposure to Futures Contracts is achieved through the use of a swap contract with Bank of America N.A..
Forward foreign currency contracts
Counterparty | |
Contracts to
deliver | |
In
exchange for | |
Maturity
date | | Unrealized
appreciation
(depreciation) | |
BB | | AUD | 15,454,334 | | | USD | 11,818,370 | | | 09/16/15 | | $ | 547,709 | | |
BB | | BRL | 14,000,000 | | | USD | 4,383,356 | | | 08/04/15 | | | 294,511 | | |
BB | | BRL | 53,666,000 | | | USD | 16,596,678 | | | 10/02/15 | | | 1,240,458 | | |
BB | | CAD | 15,452,309 | | | USD | 12,305,643 | | | 09/16/15 | | | 493,873 | | |
BB | | CHF | 3,000,000 | | | GBP | 2,048,261 | | | 09/18/15 | | | 88,371 | | |
BB | | CHF | 3,500,000 | | | GBP | 2,376,671 | | | 09/22/15 | | | 82,234 | | |
BB | | CLP | 10,000,000 | | | USD | 15,632 | | | 09/16/15 | | | 861 | | |
BB | | EUR | 3,759,490 | | | USD | 4,181,689 | | | 09/16/15 | | | 50,521 | | |
BB | | GBP | 8,298,104 | | | USD | 12,706,679 | | | 09/16/15 | | | (248,130 | ) | |
BB | | JPY | 708,689,585 | | | USD | 5,765,765 | | | 09/16/15 | | | 44,568 | | |
BB | | KRW | 3,995,000,000 | | | USD | 3,587,991 | | | 09/03/15 | | | 177,146 | | |
BB | | KRW | 5,665,000,000 | | | USD | 5,094,866 | | | 09/18/15 | | | 260,224 | | |
BB | | KRW | 5,000,000,000 | | | USD | 4,454,301 | | | 09/25/15 | | | 188,007 | | |
BB | | KRW | 5,000,000,000 | | | USD | 4,447,916 | | | 10/06/15 | | | 182,881 | | |
BB | | NOK | 8,415,550 | | | USD | 1,082,105 | | | 09/16/15 | | | 52,833 | | |
BB | | NZD | 42,093,242 | | | USD | 29,409,355 | | | 09/16/15 | | | 1,720,784 | | |
BB | | SEK | 222,664,638 | | | USD | 26,713,446 | | | 09/16/15 | | | 882,434 | | |
BB | | SEK | 24,733,999 | | | USD | 2,865,726 | | | 09/16/15 | | | (3,630 | ) | |
BB | | SGD | 18,635,534 | | | USD | 13,790,513 | | | 09/16/15 | | | 223,909 | | |
BB | | USD | 17,319,703 | | | AUD | 22,827,717 | | | 09/16/15 | | | (671,722 | ) | |
BB | | USD | 4,255,319 | | | BRL | 14,000,000 | | | 08/04/15 | | | (166,474 | ) | |
BB | | USD | 8,414,721 | | | CAD | 10,553,134 | | | 09/16/15 | | | (347,889 | ) | |
BB | | USD | 5,986,416 | | | CHF | 5,566,056 | | | 09/16/15 | | | (218,016 | ) | |
BB | | USD | 24,746,600 | | | EUR | 22,020,931 | | | 09/16/15 | | | (548,590 | ) | |
BB | | USD | 582,076 | | | EUR | 534,599 | | | 09/16/15 | | | 5,376 | | |
BB | | USD | 490,799 | | | JPY | 60,035,550 | | | 08/28/15 | | | (6,281 | ) | |
BB | | USD | 31,446,921 | | | JPY | 3,918,351,046 | | | 09/16/15 | | | 185,629 | | |
BB | | USD | 2,109,348 | | | JPY | 259,451,422 | | | 09/16/15 | | | (14,816 | ) | |
BB | | USD | 7,426,979 | | | MXN | 113,000,000 | | | 08/26/15 | | | (425,070 | ) | |
241
PACE Select Advisors Trust
PACE Alternative Strategies Investments
Portfolio of investments—July 31, 2015
Forward foreign currency contracts—(continued)
Counterparty | |
Contracts to
deliver | |
In
exchange for | |
Maturity
date | | Unrealized
appreciation
(depreciation) | |
BB | | USD | 37,865,609 | | | NOK | 298,675,134 | | | 09/16/15 | | $ | (1,335,879 | ) | |
BB | | USD | 3,153,949 | | | NOK | 26,010,907 | | | 09/16/15 | | | 27,339 | | |
BB | | USD | 1,349,162 | | | NZD | 2,053,429 | | | 09/16/15 | | | 1,565 | | |
BB | | USD | 660,938 | | | SEK | 5,705,308 | | | 09/16/15 | | | 927 | | |
BB | | USD | 2,965,582 | | | SEK | 24,762,840 | | | 09/16/15 | | | (92,880 | ) | |
BB | | USD | 3,993,296 | | | SGD | 5,378,870 | | | 09/16/15 | | | (77,497 | ) | |
BNP | | AUD | 7,272,192 | | | USD | 5,366,296 | | | 10/29/15 | | | 74,791 | | |
BNP | | CAD | 1,550,000 | | | USD | 1,277,317 | | | 08/14/15 | | | 92,252 | | |
BNP | | CAD | 686,080 | | | USD | 569,789 | | | 08/19/15 | | | 45,258 | | |
BNP | | CHF | 1,030,000 | | | USD | 1,103,246 | | | 08/14/15 | | | 36,990 | | |
BNP | | DKK | 2,700,000 | | | USD | 410,645 | | | 09/16/15 | | | 12,908 | | |
BNP | | EUR | 6,235,465 | | | USD | 6,928,474 | | | 08/14/15 | | | 79,553 | | |
BNP | | EUR | 435,930 | | | USD | 475,754 | | | 10/09/15 | | | (3,440 | ) | |
BNP | | EUR | 555,882 | | | USD | 615,411 | | | 10/09/15 | | | 4,360 | | |
BNP | | EUR | 511,000 | | | USD | 564,718 | | | 10/13/15 | | | 2,965 | | |
BNP | | GBP | 3,551,523 | | | USD | 5,365,822 | | | 08/14/15 | | | (180,013 | ) | |
BNP | | JPY | 475,000,000 | | | USD | 3,953,908 | | | 08/14/15 | | | 120,912 | | |
BNP | | NOK | 1,000,000 | | | USD | 128,060 | | | 09/16/15 | | | 5,754 | | |
BNP | | RUB | 13,595,425 | | | USD | 257,929 | | | 08/20/15 | | | 38,375 | | |
BNP | | SEK | 2,400,000 | | | USD | 286,581 | | | 08/14/15 | | | 8,332 | | |
BNP | | SEK | 3,800,000 | | | USD | 467,032 | | | 09/16/15 | | | 26,199 | | |
BNP | | USD | 3,199,509 | | | CAD | 4,000,000 | | | 08/07/15 | | | (141,124 | ) | |
BNP | | USD | 203,271 | | | EUR | 183,880 | | | 10/09/15 | | | (1,141 | ) | |
BNP | | USD | 1,794,611 | | | EUR | 1,639,643 | | | 10/09/15 | | | 7,759 | | |
BNP | | USD | 14,677,630 | | | INR | 955,000,000 | | | 08/21/15 | | | 168,835 | | |
BNP | | USD | 1,707,955 | | | INR | 111,000,000 | | | 09/15/15 | | | 9,452 | | |
BNP | | USD | 1,224,237 | | | INR | 79,000,000 | | | 10/13/15 | | | (8,466 | ) | |
BNP | | USD | 245,896 | | | JPY | 30,000,000 | | | 08/28/15 | | | (3,780 | ) | |
BNP | | USD | 5,988,046 | | | MXN | 91,500,000 | | | 08/27/15 | | | (318,778 | ) | |
BOA | | EUR | 205,628 | | | USD | 226,998 | | | 10/09/15 | | | 963 | | |
BOA | | GBP | 282,377 | | | USD | 440,770 | | | 10/09/15 | | | (5 | ) | |
BOA | | USD | 904,327 | | | GBP | 583,000 | | | 08/14/15 | | | 6,049 | | |
CITI | | AUD | 15,046,561 | | | USD | 11,959,323 | | | 08/10/15 | | | 964,052 | | |
CITI | | AUD | 860,000 | | | USD | 673,426 | | | 08/14/15 | | | 45,118 | | |
CITI | | AUD | 22,505,500 | | | USD | 16,995,322 | | | 09/16/15 | | | 582,330 | | |
CITI | | AUD | 1,023,000 | | | USD | 743,934 | | | 09/16/15 | | | (2,127 | ) | |
CITI | | AUD | 11,163,372 | | | USD | 8,276,033 | | | 10/22/15 | | | 150,199 | | |
CITI | | AUD | 3,230,000 | | | USD | 2,347,080 | | | 10/28/15 | | | (3,306 | ) | |
CITI | | BRL | 7,310,000 | | | USD | 2,228,695 | | | 09/16/15 | | | 126,362 | | |
CITI | | CAD | 14,448,421 | | | USD | 12,000,907 | | | 08/07/15 | | | 953,701 | | |
CITI | | CAD | 4,600,000 | | | USD | 3,669,684 | | | 09/14/15 | | | 153,395 | | |
CITI | | CAD | 17,742,000 | | | USD | 14,001,999 | | | 09/16/15 | | | 439,986 | | |
CITI | | CHF | 5,000 | | | USD | 5,366 | | | 09/16/15 | | | 184 | | |
CITI | | CLP | 270,637,066 | | | USD | 423,148 | | | 09/16/15 | | | 23,373 | | |
CITI | | COP | 635,000,000 | | | USD | 239,697 | | | 09/16/15 | | | 19,685 | | |
242
PACE Select Advisors Trust
PACE Alternative Strategies Investments
Portfolio of investments—July 31, 2015
Forward foreign currency contracts—(continued)
Counterparty | |
Contracts to
deliver | |
In
exchange for | |
Maturity
date | | Unrealized
appreciation
(depreciation) | |
CITI | | CZK | 8,800,000 | | | USD | 351,568 | | | 09/16/15 | | $ | (5,426 | ) | |
CITI | | CZK | 9,850,000 | | | USD | 403,806 | | | 09/16/15 | | | 4,217 | | |
CITI | | EUR | 4,015,000 | | | USD | 4,398,364 | | | 09/04/15 | | | (12,798 | ) | |
CITI | | EUR | 26,367,043 | | | USD | 29,604,066 | | | 09/16/15 | | | 630,269 | | |
CITI | | EUR | 8,010,457 | | | USD | 8,739,750 | | | 09/16/15 | | | (62,654 | ) | |
CITI | | EUR | 18,953,266 | | | USD | 21,036,021 | | | 10/09/15 | | | 201,734 | | |
CITI | | EUR | 8,327,804 | | | USD | 9,217,954 | | | 10/13/15 | | | 63,034 | | |
CITI | | EUR | 4,200,000 | | | USD | 4,617,761 | | | 10/14/15 | | | 540 | | |
CITI | | GBP | 6,509,257 | | | USD | 9,871,383 | | | 08/19/15 | | | (292,696 | ) | |
CITI | | GBP | 456,000 | | | USD | 714,278 | | | 09/16/15 | | | 2,382 | | |
CITI | | GBP | 7,224,500 | | | USD | 11,145,244 | | | 09/16/15 | | | (133,479 | ) | |
CITI | | HUF | 193,500,000 | | | USD | 683,730 | | | 09/16/15 | | | (7,555 | ) | |
CITI | | HUF | 266,000,000 | | | USD | 958,766 | | | 09/16/15 | | | 8,473 | | |
CITI | | IDR | 4,577,668,177 | | | USD | 334,835 | | | 09/16/15 | | | (746 | ) | |
CITI | | IDR | 6,172,331,823 | | | USD | 455,484 | | | 09/16/15 | | | 3,000 | | |
CITI | | ILS | 1,495,000 | | | USD | 390,366 | | | 09/16/15 | | | (5,953 | ) | |
CITI | | INR | 4,000,000 | | | USD | 61,890 | | | 09/16/15 | | | 14 | | |
CITI | | INR | 40,100,000 | | | USD | 616,702 | | | 09/16/15 | | | (3,612 | ) | |
CITI | | JPY | 1,632,696,655 | | | USD | 13,221,417 | | | 09/16/15 | | | 40,781 | | |
CITI | | JPY | 2,709,500,345 | | | USD | 21,795,842 | | | 09/16/15 | | | (77,748 | ) | |
CITI | | KRW | 5,695,000,000 | | | USD | 5,035,812 | | | 09/16/15 | | | 175,300 | | |
CITI | | MXN | 58,450,000 | | | USD | 3,739,380 | | | 09/17/15 | | | 123,705 | | |
CITI | | MYR | 3,565,000 | | | USD | 951,924 | | | 09/17/15 | | | 23,105 | | |
CITI | | NOK | 18,236,000 | | | USD | 2,216,196 | | | 09/16/15 | | | (14,174 | ) | |
CITI | | NOK | 65,790,500 | | | USD | 8,335,752 | | | 09/16/15 | | | 289,186 | | |
CITI | | NZD | 20,533,500 | | | USD | 14,164,435 | | | 09/16/15 | | | 657,676 | | |
CITI | | PHP | 4,700,000 | | | USD | 102,388 | | | 09/16/15 | | | (113 | ) | |
CITI | | PHP | 64,950,000 | | | USD | 1,430,872 | | | 09/16/15 | | | 14,399 | | |
CITI | | PLN | 4,950,000 | | | USD | 1,299,867 | | | 09/16/15 | | | (10,721 | ) | |
CITI | | PLN | 6,625,000 | | | USD | 1,770,338 | | | 09/16/15 | | | 16,268 | | |
CITI | | SEK | 129,224,000 | | | USD | 15,244,830 | | | 09/16/15 | | | 253,736 | | |
CITI | | SEK | 9,193,500 | | | USD | 1,063,848 | | | 09/16/15 | | | (2,677 | ) | |
CITI | | SGD | 6,175,000 | | | USD | 4,542,072 | | | 09/16/15 | | | 46,693 | | |
CITI | | TRY | 4,666,848 | | | USD | 1,674,659 | | | 09/16/15 | | | 11,470 | | |
CITI | | TRY | 2,753,152 | | | USD | 977,158 | | | 09/16/15 | | | (4,021 | ) | |
CITI | | TWD | 111,350,000 | | | USD | 3,587,837 | | | 09/16/15 | | | 59,664 | | |
CITI | | USD | 8,202,070 | | | AUD | 10,758,500 | | | 09/16/15 | | | (356,024 | ) | |
CITI | | USD | 1,234,607 | | | BRL | 3,965,000 | | | 09/16/15 | | | (94,285 | ) | |
CITI | | USD | 8,869,629 | | | CAD | 11,063,000 | | | 09/16/15 | | | (413,054 | ) | |
CITI | | USD | 84,571 | | | CHF | 80,000 | | | 09/16/15 | | | (1,663 | ) | |
CITI | | USD | 138,916 | | | COP | 355,000,000 | | | 09/16/15 | | | (15,917 | ) | |
CITI | | USD | 3,448,805 | | | CZK | 83,750,000 | | | 09/16/15 | | | (51,284 | ) | |
CITI | | USD | 20,189 | | | CZK | 500,000 | | | 09/16/15 | | | 94 | | |
CITI | | USD | 9,029,061 | | | EUR | 8,232,000 | | | 09/16/15 | | | 16,788 | | |
CITI | | USD | 33,532,572 | | | EUR | 29,915,000 | | | 09/16/15 | | | (660,053 | ) | |
243
PACE Select Advisors Trust
PACE Alternative Strategies Investments
Portfolio of investments—July 31, 2015
Forward foreign currency contracts—(continued)
Counterparty | |
Contracts to
deliver | |
In
exchange for | |
Maturity
date | | Unrealized
appreciation
(depreciation) | |
CITI | | USD | 8,257,275 | | | GBP | 5,251,500 | | | 09/16/15 | | $ | (58,754 | ) | |
CITI | | USD | 8,416,298 | | | GBP | 5,491,500 | | | 09/16/15 | | | 156,905 | | |
CITI | | USD | 169,633 | | | HKD | 1,315,000 | | | 09/16/15 | | | (13 | ) | |
CITI | | USD | 43,388 | | | HKD | 336,500 | | | 09/16/15 | | | 16 | | |
CITI | | USD | 1,597,863 | | | HUF | 450,524,150 | | | 09/16/15 | | | 11,649 | | |
CITI | | USD | 287,256 | | | HUF | 79,975,850 | | | 09/16/15 | | | (1,539 | ) | |
CITI | | USD | 3,656 | | | IDR | 50,000,000 | | | 09/16/15 | | | 9 | | |
CITI | | USD | 221,245 | | | IDR | 3,000,000,000 | | | 09/16/15 | | | (1,320 | ) | |
CITI | | USD | 290,431 | | | ILS | 1,115,000 | | | 09/16/15 | | | 5,151 | | |
CITI | | USD | 1,261,234 | | | INR | 81,000,000 | | | 09/16/15 | | | (8,231 | ) | |
CITI | | USD | 850,781 | | | INR | 55,350,000 | | | 09/16/15 | | | 5,437 | | |
CITI | | USD | 3,581,358 | | | JPY | 445,235,500 | | | 09/16/15 | | | 12,994 | | |
CITI | | USD | 34,114,815 | | | JPY | 4,180,403,000 | | | 09/16/15 | | | (366,739 | ) | |
CITI | | USD | 3,494,148 | | | KRW | 3,880,000,000 | | | 09/16/15 | | | (182,683 | ) | |
CITI | | USD | 1,466,305 | | | MXN | 22,500,000 | | | 08/21/15 | | | (71,603 | ) | |
CITI | | USD | 451,310 | | | MXN | 7,350,000 | | | 09/17/15 | | | 3,355 | | |
CITI | | USD | 1,537,574 | | | MXN | 24,200,000 | | | 09/17/15 | | | (40,579 | ) | |
CITI | | USD | 2,533,067 | | | MXN | 41,500,000 | | | 10/28/15 | | | 25,800 | | |
CITI | | USD | 365,212 | | | MYR | 1,380,000 | | | 09/17/15 | | | (5,669 | ) | |
CITI | | USD | 142,980 | | | MYR | 550,000 | | | 09/17/15 | | | 317 | | |
CITI | | USD | 2,152,050 | | | NOK | 16,904,000 | | | 09/16/15 | | | (84,591 | ) | |
CITI | | USD | 126,167 | | | NOK | 1,032,500 | | | 09/16/15 | | | 114 | | |
CITI | | USD | 4,391,330 | | | NZD | 6,597,500 | | | 09/16/15 | | | (51,551 | ) | |
CITI | | USD | 1,726,678 | | | NZD | 2,627,000 | | | 09/16/15 | | | 1,340 | | |
CITI | | USD | 638,082 | | | PHP | 28,900,000 | | | 09/16/15 | | | (7,812 | ) | |
CITI | | USD | 2,280,911 | | | PLN | 8,525,981 | | | 09/16/15 | | | (23,528 | ) | |
CITI | | USD | 445,373 | | | PLN | 1,689,019 | | | 09/16/15 | | | 1,820 | | |
CITI | | USD | 9,713,110 | | | SEK | 79,529,500 | | | 09/16/15 | | | (487,005 | ) | |
CITI | | USD | 4,474,543 | | | SGD | 6,045,000 | | | 09/16/15 | | | (73,804 | ) | |
CITI | | USD | 50,892 | | | SGD | 70,000 | | | 09/16/15 | | | 67 | | |
CITI | | USD | 2,675,249 | | | TRY | 7,265,000 | | | 09/16/15 | | | (86,120 | ) | |
CITI | | USD | 2,757,744 | | | TWD | 85,000,000 | | | 09/16/15 | | | (64,482 | ) | |
CITI | | USD | 1,309,617 | | | ZAR | 16,350,000 | | | 09/16/15 | | | (26,892 | ) | |
CITI | | ZAR | 950,000 | | | USD | 74,336 | | | 09/16/15 | | | (195 | ) | |
CITI | | ZAR | 18,200,000 | | | USD | 1,441,622 | | | 09/16/15 | | | 13,757 | | |
CSI | | AUD | 18,395,500 | | | USD | 13,822,361 | | | 09/16/15 | | | 406,743 | | |
CSI | | AUD | 1,023,000 | | | USD | 743,950 | | | 09/16/15 | | | (2,111 | ) | |
CSI | | BRL | 7,310,000 | | | USD | 2,228,849 | | | 09/16/15 | | | 126,515 | | |
CSI | | CAD | 17,742,000 | | | USD | 14,002,328 | | | 09/16/15 | | | 440,315 | | |
CSI | | CHF | 247,000 | | | USD | 265,006 | | | 09/16/15 | | | 9,027 | | |
CSI | | CLP | 289,500,000 | | | USD | 452,876 | | | 09/16/15 | | | 25,237 | | |
CSI | | COP | 645,000,000 | | | USD | 243,465 | | | 09/16/15 | | | 19,987 | | |
CSI | | CZK | 8,800,000 | | | USD | 351,609 | | | 09/16/15 | | | (5,384 | ) | |
CSI | | CZK | 13,350,000 | | | USD | 546,674 | | | 09/16/15 | | | 5,099 | | |
CSI | | EUR | 26,379,543 | | | USD | 29,618,173 | | | 09/16/15 | | | 630,640 | | |
244
PACE Select Advisors Trust
PACE Alternative Strategies Investments
Portfolio of investments—July 31, 2015
Forward foreign currency contracts—(continued)
Counterparty | |
Contracts to
deliver | |
In
exchange for | |
Maturity
date | | Unrealized
appreciation
(depreciation) | |
CSI | | EUR | 8,010,457 | | | USD | 8,739,933 | | | 09/16/15 | | $ | (62,471 | ) | |
CSI | | GBP | 456,000 | | | USD | 714,285 | | | 09/16/15 | | | 2,389 | | |
CSI | | GBP | 7,224,500 | | | USD | 11,145,331 | | | 09/16/15 | | | (133,392 | ) | |
CSI | | HKD | 843,000 | | | USD | 108,732 | | | 09/16/15 | | | (5 | ) | |
CSI | | HKD | 2,000,000 | | | USD | 257,997 | | | 09/16/15 | | | 20 | | |
CSI | | HUF | 193,500,000 | | | USD | 683,852 | | | 09/16/15 | | | (7,433 | ) | |
CSI | | HUF | 272,000,000 | | | USD | 980,435 | | | 09/16/15 | | | 8,707 | | |
CSI | | IDR | 5,477,668,176 | | | USD | 400,769 | | | 09/16/15 | | | (790 | ) | |
CSI | | IDR | 6,172,331,824 | | | USD | 455,484 | | | 09/16/15 | | | 3,000 | | |
CSI | | ILS | 1,495,000 | | | USD | 390,390 | | | 09/16/15 | | | (5,929 | ) | |
CSI | | INR | 4,000,000 | | | USD | 61,891 | | | 09/16/15 | | | 14 | | |
CSI | | INR | 40,100,000 | | | USD | 616,717 | | | 09/16/15 | | | (3,596 | ) | |
CSI | | JPY | 1,632,696,655 | | | USD | 13,221,645 | | | 09/16/15 | | | 41,009 | | |
CSI | | JPY | 2,709,500,345 | | | USD | 21,795,852 | | | 09/16/15 | | | (77,738 | ) | |
CSI | | KRW | 5,695,000,000 | | | USD | 5,035,668 | | | 09/16/15 | | | 175,155 | | |
CSI | | MXN | 58,450,000 | | | USD | 3,739,732 | | | 09/17/15 | | | 124,057 | | |
CSI | | MYR | 3,565,000 | | | USD | 951,909 | | | 09/17/15 | | | 23,089 | | |
CSI | | NOK | 18,236,000 | | | USD | 2,216,302 | | | 09/16/15 | | | (14,068 | ) | |
CSI | | NOK | 65,790,500 | | | USD | 8,336,178 | | | 09/16/15 | | | 289,612 | | |
CSI | | NZD | 20,533,500 | | | USD | 14,166,603 | | | 09/16/15 | | | 659,844 | | |
CSI | | PHP | 4,700,000 | | | USD | 102,388 | | | 09/16/15 | | | (113 | ) | |
CSI | | PHP | 69,650,000 | | | USD | 1,533,900 | | | 09/16/15 | | | 14,926 | | |
CSI | | PLN | 4,950,000 | | | USD | 1,299,910 | | | 09/16/15 | | | (10,677 | ) | |
CSI | | PLN | 6,625,000 | | | USD | 1,770,410 | | | 09/16/15 | | | 16,340 | | |
CSI | | SEK | 5,108,500 | | | USD | 590,004 | | | 09/16/15 | | | (2,626 | ) | |
CSI | | SEK | 133,309,000 | | | USD | 15,721,140 | | | 09/16/15 | | | 256,150 | | |
CSI | | SGD | 340,000 | | | USD | 247,485 | | | 09/16/15 | | | (33 | ) | |
CSI | | SGD | 5,895,000 | | | USD | 4,339,226 | | | 09/16/15 | | | 47,686 | | |
CSI | | TRY | 4,856,848 | | | USD | 1,743,391 | | | 09/16/15 | | | 12,488 | | |
CSI | | TRY | 2,753,152 | | | USD | 977,151 | | | 09/16/15 | | | (4,028 | ) | |
CSI | | TWD | 111,350,000 | | | USD | 3,587,862 | | | 09/16/15 | | | 59,689 | | |
CSI | | USD | 8,201,849 | | | AUD | 10,758,500 | | | 09/16/15 | | | (355,803 | ) | |
CSI | | USD | 1,250,142 | | | BRL | 4,015,000 | | | 09/16/15 | | | (95,440 | ) | |
CSI | | USD | 8,869,987 | | | CAD | 11,063,000 | | | 09/16/15 | | | (413,413 | ) | |
CSI | | USD | 87,682 | | | CHF | 83,000 | | | 09/16/15 | | | (1,665 | ) | |
CSI | | USD | 150,481 | | | COP | 385,000,000 | | | 09/16/15 | | | (17,088 | ) | |
CSI | | USD | 3,448,800 | | | CZK | 83,750,000 | | | 09/16/15 | | | (51,280 | ) | |
CSI | | USD | 20,190 | | | CZK | 500,000 | | | 09/16/15 | | | 94 | | |
CSI | | USD | 9,028,861 | | | EUR | 8,232,000 | | | 09/16/15 | | | 16,988 | | |
CSI | | USD | 33,545,870 | | | EUR | 29,927,500 | | | 09/16/15 | | | (659,615 | ) | |
CSI | | USD | 8,257,210 | | | GBP | 5,251,500 | | | 09/16/15 | | | (58,689 | ) | |
CSI | | USD | 8,416,266 | | | GBP | 5,491,500 | | | 09/16/15 | | | 156,937 | | |
CSI | | USD | 169,628 | | | HKD | 1,315,000 | | | 09/16/15 | | | (7 | ) | |
CSI | | USD | 63,242 | | | HKD | 490,500 | | | 09/16/15 | | | 27 | | |
245
PACE Select Advisors Trust
PACE Alternative Strategies Investments
Portfolio of investments—July 31, 2015
Forward foreign currency contracts—(continued)
Counterparty | |
Contracts to
deliver | |
In
exchange for | |
Maturity
date | | Unrealized
appreciation
(depreciation) | |
CSI | | USD | 1,597,718 | | | HUF | 450,524,150 | | | 09/16/15 | | $ | 11,794 | | |
CSI | | USD | 287,214 | | | HUF | 79,975,850 | | | 09/16/15 | | | (1,497 | ) | |
CSI | | USD | 3,656 | | | IDR | 50,000,000 | | | 09/16/15 | | | 9 | | |
CSI | | USD | 221,245 | | | IDR | 3,000,000,000 | | | 09/16/15 | | | (1,320 | ) | |
CSI | | USD | 293,047 | | | ILS | 1,125,000 | | | 09/16/15 | | | 5,186 | | |
CSI | | USD | 1,394,220 | | | INR | 89,500,000 | | | 09/16/15 | | | (9,730 | ) | |
CSI | | USD | 850,736 | | | INR | 55,350,000 | | | 09/16/15 | | | 5,482 | | |
CSI | | USD | 3,581,254 | | | JPY | 445,235,500 | | | 09/16/15 | | | 13,098 | | |
CSI | | USD | 34,113,308 | | | JPY | 4,180,403,000 | | | 09/16/15 | | | (365,233 | ) | |
CSI | | USD | 3,494,120 | | | KRW | 3,880,000,000 | | | 09/16/15 | | | (182,656 | ) | |
CSI | | USD | 451,252 | | | MXN | 7,350,000 | | | 09/17/15 | | | 3,414 | | |
CSI | | USD | 1,537,431 | | | MXN | 24,200,000 | | | 09/17/15 | | | (40,436 | ) | |
CSI | | USD | 365,300 | | | MYR | 1,380,000 | | | 09/17/15 | | | (5,757 | ) | |
CSI | | USD | 142,980 | | | MYR | 550,000 | | | 09/17/15 | | | 317 | | |
CSI | | USD | 2,151,997 | | | NOK | 16,904,000 | | | 09/16/15 | | | (84,538 | ) | |
CSI | | USD | 126,160 | | | NOK | 1,032,500 | | | 09/16/15 | | | 121 | | |
CSI | | USD | 4,390,373 | | | NZD | 6,597,500 | | | 09/16/15 | | | (50,594 | ) | |
CSI | | USD | 1,726,430 | | | NZD | 2,627,000 | | | 09/16/15 | | | 1,588 | | |
CSI | | USD | 638,090 | | | PHP | 28,900,000 | | | 09/16/15 | | | (7,819 | ) | |
CSI | | USD | 2,280,878 | | | PLN | 8,525,981 | | | 09/16/15 | | | (23,495 | ) | |
CSI | | USD | 445,372 | | | PLN | 1,689,019 | | | 09/16/15 | | | 1,822 | | |
CSI | | USD | 9,708,825 | | | SEK | 79,529,500 | | | 09/16/15 | | | (482,719 | ) | |
CSI | | USD | 4,474,461 | | | SGD | 6,045,000 | | | 09/16/15 | | | (73,722 | ) | |
CSI | | USD | 50,891 | | | SGD | 70,000 | | | 09/16/15 | | | 69 | | |
CSI | | USD | 2,675,498 | | | TRY | 7,265,000 | | | 09/16/15 | | | (86,369 | ) | |
CSI | | USD | 2,897,244 | | | TWD | 89,300,000 | | | 09/16/15 | | | (67,735 | ) | |
CSI | | USD | 1,309,632 | | | ZAR | 16,350,000 | | | 09/16/15 | | | (26,908 | ) | |
CSI | | ZAR | 950,000 | | | USD | 74,336 | | | 09/16/15 | | | (195 | ) | |
CSI | | ZAR | 18,600,000 | | | USD | 1,474,125 | | | 09/16/15 | | | 14,880 | | |
DB | | CHF | 3,500,000 | | | GBP | 2,389,243 | | | 09/02/15 | | | 104,950 | | |
DB | | CHF | 757,000 | | | USD | 811,100 | | | 08/20/15 | | | 27,301 | | |
DB | | EUR | 4,313,000 | | | USD | 4,791,094 | | | 08/20/15 | | | 53,418 | | |
DB | | EUR | 116,000 | | | USD | 126,260 | | | 08/20/15 | | | (1,162 | ) | |
DB | | EUR | 600,000 | | | USD | 653,798 | | | 09/16/15 | | | (5,521 | ) | |
DB | | EUR | 105,305 | | | USD | 116,803 | | | 10/09/15 | | | 1,048 | | |
DB | | EUR | 20,776,221 | | | USD | 23,051,071 | | | 10/20/15 | | | 208,645 | | |
DB | | MXN | 139,101,630 | | | USD | 9,108,398 | | | 09/17/15 | | | 503,671 | | |
DB | | USD | 5,999,130 | | | CAD | 7,448,421 | | | 08/07/15 | | | (304,096 | ) | |
DB | | USD | 3,776,769 | | | CAD | 4,700,000 | | | 08/12/15 | | | (183,300 | ) | |
DB | | USD | 3,701,022 | | | CAD | 4,600,000 | | | 09/14/15 | | | (184,733 | ) | |
DB | | USD | 348,611 | | | EUR | 318,000 | | | 08/20/15 | | | 701 | | |
DB | | USD | 600,012 | | | EUR | 541,000 | | | 08/20/15 | | | (5,743 | ) | |
DB | | USD | 875,998 | | | KRW | 971,000,000 | | | 09/09/15 | | | (47,119 | ) | |
DB | | USD | 3,559,008 | | | MXN | 54,700,000 | | | 08/20/15 | | | (168,083 | ) | |
MSCI | | AUD | 8,147,832 | | | USD | 6,145,419 | | | 09/16/15 | | | 203,303 | | |
246
PACE Select Advisors Trust
PACE Alternative Strategies Investments
Portfolio of investments—July 31, 2015
Forward foreign currency contracts—(concluded)
Counterparty | |
Contracts to
deliver | |
In
exchange for | |
Maturity
date | | Unrealized
appreciation
(depreciation) | |
MSCI | | AUD | 1,274,744 | | | USD | 926,416 | | | 09/16/15 | | $ | (3,240 | ) | |
MSCI | | CAD | 25,567,854 | | | USD | 20,441,985 | | | 09/16/15 | | | 897,877 | | |
MSCI | | CHF | 5,566,056 | | | USD | 5,998,444 | | | 09/16/15 | | | 230,044 | | |
MSCI | | CLP | 8,862,934 | | | USD | 14,110 | | | 09/16/15 | | | 1,018 | | |
MSCI | | EUR | 275,096 | | | USD | 300,155 | | | 09/16/15 | | | (2,138 | ) | |
MSCI | | EUR | 4,099,370 | | | USD | 4,592,893 | | | 09/16/15 | | | 88,243 | | |
MSCI | | GBP | 11,623,866 | | | USD | 17,919,446 | | | 09/16/15 | | | (227,466 | ) | |
MSCI | | GBP | 329,660 | | | USD | 519,658 | | | 09/16/15 | | | 5,001 | | |
MSCI | | JPY | 290,440,353 | | | USD | 2,335,793 | | | 09/16/15 | | | (8,910 | ) | |
MSCI | | JPY | 249,838,457 | | | USD | 2,031,905 | | | 09/16/15 | | | 14,978 | | |
MSCI | | NOK | 178,315,438 | | | USD | 22,618,321 | | | 09/16/15 | | | 809,291 | | |
MSCI | | NZD | 8,342,300 | | | USD | 5,711,348 | | | 09/16/15 | | | 223,856 | | |
MSCI | | SEK | 44,371,105 | | | USD | 5,284,813 | | | 09/16/15 | | | 137,383 | | |
MSCI | | SGD | 21,841,149 | | | USD | 16,119,393 | | | 09/16/15 | | | 219,113 | | |
MSCI | | USD | 15,351,246 | | | AUD | 20,017,646 | | | 09/16/15 | | | (752,616 | ) | |
MSCI | | USD | 3,834,469 | | | CAD | 4,884,606 | | | 09/16/15 | | | (100,669 | ) | |
MSCI | | USD | 14,129,253 | | | EUR | 12,578,358 | | | 09/16/15 | | | (307,347 | ) | |
MSCI | | USD | 1,028,912 | | | GBP | 653,266 | | | 09/16/15 | | | (9,049 | ) | |
MSCI | | USD | 1,162,333 | | | GBP | 749,092 | | | 09/16/15 | | | 7,132 | | |
MSCI | | USD | 723,790 | | | JPY | 90,408,384 | | | 09/16/15 | | | 6,070 | | |
MSCI | | USD | 1,455,671 | | | JPY | 179,228,659 | | | 09/16/15 | | | (8,771 | ) | |
MSCI | | USD | 6,476,161 | | | NOK | 51,009,269 | | | 09/16/15 | | | (237,427 | ) | |
MSCI | | USD | 10,480,742 | | | NZD | 15,327,282 | | | 09/16/15 | | | (398,589 | ) | |
MSCI | | USD | 1,019,478 | | | NZD | 1,550,273 | | | 09/16/15 | | | 278 | | |
MSCI | | USD | 21,730,094 | | | SEK | 179,475,329 | | | 09/16/15 | | | (909,414 | ) | |
MSCI | | USD | 10,878,485 | | | SGD | 14,778,913 | | | 09/16/15 | | | (119,487 | ) | |
RBS | | CAD | 4,700,000 | | | USD | 3,879,798 | | | 08/12/15 | | | 286,329 | | |
RBS | | CAD | 1,660,000 | | | USD | 1,355,790 | | | 09/16/15 | | | 86,883 | | |
RBS | | CHF | 1,700,000 | | | USD | 1,848,736 | | | 09/16/15 | | | 86,935 | | |
RBS | | EUR | 11,700,000 | | | USD | 13,139,718 | | | 08/11/15 | | | 289,133 | | |
RBS | | EUR | 3,493,794 | | | USD | 3,957,375 | | | 09/16/15 | | | 118,170 | | |
RBS | | EUR | 100,999 | | | USD | 110,983 | | | 10/09/15 | | | (40 | ) | |
RBS | | GBP | 500,000 | | | USD | 781,406 | | | 08/14/15 | | | 637 | | |
RBS | | HKD | 4,000,000 | | | USD | 516,009 | | | 08/14/15 | | | 37 | | |
RBS | | JPY | 1,318,035,550 | | | USD | 10,915,331 | | | 08/28/15 | | | 278,090 | | |
RBS | | SGD | 450,000 | | | USD | 335,892 | | | 09/16/15 | | | 8,293 | | |
RBS | | USD | 2,400,937 | | | CAD | 3,000,000 | | | 08/07/15 | | | (107,149 | ) | |
RBS | | USD | 953,516 | | | GBP | 600,000 | | | 08/14/15 | | | (16,594 | ) | |
RBS | | USD | 7,721,231 | | | JPY | 959,000,000 | | | 08/28/15 | | | 18,404 | | |
RBS | | USD | 2,175,383 | | | JPY | 269,000,000 | | | 08/28/15 | | | (4,411 | ) | |
RBS | | USD | 7,414,881 | | | MXN | 113,100,000 | | | 08/24/15 | | | (405,739 | ) | |
| | | $ | 5,677,560 | | |
247
PACE Select Advisors Trust
PACE Alternative Strategies Investments
Portfolio of investments—July 31, 2015
Variance swaps3,9
Counterparty | | Notional
amount
(000) | | Termination
date | | Pay/
receive
variance | | Reference
entity | | Volatility
strike
price | | Upfront
payments
received
(made) | | Value | | Unrealized
appreciation
(depreciation) | |
BNP | | GBP | 7 | | | 10/16/15 | | Receive | | FTSE 100 Index | | | 14.71 | % | | $ | — | | | $ | (4,780 | ) | | $ | (4,780 | ) | |
BNP | | GBP | 38 | | | 12/18/15 | | Pay | | FTSE 100 Index | | | 16.60 | | | | — | | | | 141,476 | | | | 141,476 | | |
BNP | | GBP | 3 | | | 12/18/15 | | Pay | | FTSE 100 Index | | | 16.85 | | | | — | | | | 13,516 | | | | 13,516 | | |
BNP | | GBP | 17 | | | 12/18/15 | | Pay | | FTSE 100 Index | | | 17.00 | | | | — | | | | 84,621 | | | | 84,621 | | |
BNP | | GBP | 14 | | | 12/16/16 | | Pay | | FTSE 100 Index | | | 18.60 | | | | — | | | | 46,857 | | | | 46,857 | | |
BNP | | GBP | 19 | | | 12/16/16 | | Pay | | FTSE 100 Index | | | 19.20 | | | | — | | | | 69,210 | | | | 69,210 | | |
BNP | | GBP | 18 | | | 12/16/16 | | Pay | | FTSE 100 Index | | | 19.60 | | | | — | | | | 71,398 | | | | 71,398 | | |
BNP | | HKD | 500 | | | 12/30/15 | | Receive | | China Enterprises Index (Hang Seng) | | | 25.60 | | | | — | | | | 13,600 | | | | 13,600 | | |
BNP | | HKD | 40 | | | 12/30/15 | | Receive | | China Enterprises Index (Hang Seng) | | | 25.85 | | | | — | | | | (4,432 | ) | | | (4,432 | ) | |
BNP | | HKD | 220 | | | 12/30/15 | | Receive | | China Enterprises Index (Hang Seng) | | | 26.00 | | | | — | | | | (38,364 | ) | | | (38,364 | ) | |
BNP | | HKD | 75 | | | 12/29/16 | | Receive | | China Enterprises Index (Hang Seng) | | | 27.40 | | | | — | | | | (321 | ) | | | (321 | ) | |
BNP | | HKD | 100 | | | 12/29/16 | | Receive | | China Enterprises Index (Hang Seng) | | | 27.50 | | | | — | | | | (2,594 | ) | | | (2,594 | ) | |
BNP | | HKD | 225 | | | 12/29/16 | | Receive | | China Enterprises Index (Hang Seng) | | | 28.20 | | | | — | | | | (1,245 | ) | | | (1,245 | ) | |
BNP | | HKD | 160 | | | 12/29/16 | | Receive | | China Enterprises Index (Hang Seng) | | | 28.35 | | | | — | | | | 6,598 | | | | 6,598 | | |
BNP | | HKD | 500 | | | 12/29/16 | | Receive | | Hang Seng Index | | | 25.20 | | | | — | | | | (229,629 | ) | | | (229,629 | ) | |
BNP | | KRW | 16,400 | | | 10/08/15 | | Receive | | Kospi 200 Index | | | 14.90 | | | | — | | | | (13,279 | ) | | | (13,279 | ) | |
BNP | | KRW | 2,500 | | | 12/10/15 | | Receive | | Kospi 200 Index | | | 19.50 | | | | — | | | | (12,098 | ) | | | (12,098 | ) | |
BNP | | KRW | 6,000 | | | 12/10/15 | | Receive | | Kospi 200 Index | | | 19.70 | | | | — | | | | (29,556 | ) | | | (29,556 | ) | |
BNP | | KRW | 55,000 | | | 12/10/15 | | Receive | | Kospi 200 Index | | | 20.05 | | | | — | | | | (291,977 | ) | | | (291,977 | ) | |
BNP | | KRW | 43,000 | | | 12/10/15 | | Receive | | Kospi 200 Index | | | 22.50 | | | | — | | | | (293,068 | ) | | | (293,068 | ) | |
BNP | | KRW | 20,000 | | | 12/08/16 | | Receive | | Kospi 200 Index | | | 19.80 | | | | — | | | | (18,673 | ) | | | (18,673 | ) | |
BNP | | KRW | 20,000 | | | 12/08/16 | | Receive | | Kospi 200 Index | | | 19.90 | | | | — | | | | (21,349 | ) | | | (21,349 | ) | |
BNP | | KRW | 40,000 | | | 12/08/16 | | Receive | | Kospi 200 Index | | | 21.00 | | | | — | | | | (147,072 | ) | | | (147,072 | ) | |
BNP | | KRW | 30,000 | | | 12/08/16 | | Receive | | Kospi 200 Index | | | 21.40 | | | | — | | | | (106,536 | ) | | | (106,536 | ) | |
BNP | | USD | 6 | | | 12/18/15 | | Pay | | S&P 500 Index | | | 17.85 | | | | — | | | | 23,561 | | | | 23,561 | | |
BNP | | USD | 52 | | | 12/18/15 | | Pay | | S&P 500 Index | | | 18.20 | | | | — | | | | 238,268 | | | | 238,268 | | |
BNP | | USD | 40 | | | 12/18/15 | | Pay | | S&P 500 Index | | | 20.60 | | | | — | | | | 259,844 | | | | 259,844 | | |
BNP | | USD | 26 | | | 12/16/16 | | Pay | | S&P 500 Index | | | 19.20 | | | | — | | | | 65,610 | | | | 65,610 | | |
BNP | | USD | 18 | | | 12/16/16 | | Pay | | S&P 500 Index | | | 19.95 | | | | — | | | | (19,555 | ) | | | (19,555 | ) | |
BNP | | USD | 18 | | | 12/16/16 | | Pay | | S&P 500 Index | | | 20.25 | | | | — | | | | 25,326 | | | | 25,326 | | |
BNP | | USD | 28 | | | 12/16/16 | | Pay | | S&P 500 Index | | | 21.10 | | | | — | | | | 100,396 | | | | 100,396 | | |
BNP | | USD | 50 | | | 12/16/16 | | Pay | | S&P 500 Index | | | 22.55 | | | | — | | | | 239,880 | | | | 239,880 | | |
BOA | | GBP | 7 | | | 10/16/15 | | Receive | | FTSE 100 Index | | | 14.60 | | | | — | | | | (4,637 | ) | | | (4,637 | ) | |
CITI | | HKD | 43 | | | 12/30/15 | | Receive | | Hang Seng Index | | | 20.80 | | | | — | | | | (13,874 | ) | | | (13,874 | ) | |
CITI | | USD | 32 | | | 12/18/15 | | Pay | | S&P 500 Index | | | 18.00 | | | | — | | | | 134,224 | | | | 134,224 | | |
| | | | | | | | | | | | | $ | — | | | $ | 281,346 | | | $ | 281,346 | | |
Centrally cleared interest rate swap agreements
Notional
amount
(000) | | Termination
date | | Payments made by
the Portfolio10 | | Payments received by
the Portfolio10 | | Value | | Unrealized
appreciation
(depreciation) | |
AUD | 40,000 | | | 04/04/18 | | 6 Month AUD Bank Bill Rate | | | 4.078 | % | | $ | 1,015,667 | | | $ | 1,015,667 | | |
AUD | 20,000 | | | 04/04/18 | | | 4.078 | % | | 6 Month AUD Bank Bill Rate | | | (507,834 | ) | | | (32,300 | ) | |
AUD | 20,000 | | | 10/27/18 | | 6 Month AUD Bank Bill Rate | | | 3.275 | % | | | 245,413 | | | | 245,413 | | |
AUD | 20,000 | | | 10/31/18 | | 6 Month AUD Bank Bill Rate | | | 3.278 | | | | 244,843 | | | | 244,843 | | |
AUD | 10,000 | | | 11/14/18 | | 6 Month AUD Bank Bill Rate | | | 3.265 | | | | 119,335 | | | | 119,335 | | |
AUD | 15,000 | | | 11/21/18 | | 6 Month AUD Bank Bill Rate | | | 3.235 | | | | 171,080 | | | | 171,080 | | |
AUD | 5,931 | | | 05/08/19 | | 6 Month AUD Bank Bill Rate | | | 2.890 | | | | 27,459 | | | | 27,459 | | |
AUD | 5,931 | | | 05/08/19 | | 6 Month AUD Bank Bill Rate | | | 2.908 | | | | 28,880 | | | | 28,880 | | |
AUD | 3,954 | | | 05/08/19 | | 6 Month AUD Bank Bill Rate | | | 2.775 | | | | 10,905 | | | | 10,905 | | |
AUD | 3,954 | | | 05/11/19 | | 6 Month AUD Bank Bill Rate | | | 2.833 | | | | 15,013 | | | | 15,013 | | |
248
PACE Select Advisors Trust
PACE Alternative Strategies Investments
Portfolio of investments—July 31, 2015
Centrally cleared interest rate swap agreements—(continued)
Notional
amount
(000) | | Termination
date | | Payments made by
the Portfolio10 | | Payments received by
the Portfolio10 | | Value | | Unrealized
appreciation
(depreciation) | |
AUD | 1,977 | | | 05/11/19 | | 6 Month AUD Bank Bill Rate | | | 2.835 | % | | $ | 7,574 | | | $ | 7,574 | | |
AUD | 1,977 | | | 05/12/19 | | 6 Month AUD Bank Bill Rate | | | 2.823 | | | | 7,218 | | | | 7,218 | | |
AUD | 3,276 | | | 05/15/19 | | 6 Month AUD Bank Bill Rate | | | 2.961 | | | | 18,072 | | | | 18,072 | | |
| 1,648 | | 07/10/21 | | | 2.383 | % | | | 6 Month GBP LIBOR | | | | (11,530 | ) | | | (11,530 | ) | |
| 1,648 | | 07/17/21 | | | 2.380 | | | | 6 Month GBP LIBOR | | | | (11,139 | ) | | | (11,139 | ) | |
| 1,648 | | 07/23/21 | | | 2.388 | | | | 6 Month GBP LIBOR | | | | (11,503 | ) | | | (11,503 | ) | |
| 5,000 | | 07/23/21 | | | 2.361 | | | | 6 Month GBP LIBOR | | | | (29,026 | ) | | | (29,026 | ) | |
| 9,133 | | 07/24/21 | | | 2.315 | | | | 6 Month GBP LIBOR | | | | (34,213 | ) | | | (34,213 | ) | |
| 8,882 | | 07/27/21 | | | 2.271 | | | | 6 Month GBP LIBOR | | | | (15,783 | ) | | | (15,783 | ) | |
| 7,106 | | 07/30/21 | | | 2.346 | | | | 6 Month GBP LIBOR | | | | (35,824 | ) | | | (35,824 | ) | |
USD | 2,567 | | | 12/11/16 | | | 1.240 | | | | 3 Month USD LIBOR | | | | (11,332 | ) | | | (11,332 | ) | |
USD | 6,506 | | | 12/14/16 | | | 1.273 | | | | 3 Month USD LIBOR | | | | (30,395 | ) | | | (30,395 | ) | |
USD | 6,506 | | | 12/14/16 | | | 1.273 | | | | 3 Month USD LIBOR | | | | (30,395 | ) | | | (30,395 | ) | |
USD | 13,012 | | | 12/16/16 | | | 1.228 | | | | 3 Month USD LIBOR | | | | (54,462 | ) | | | (54,462 | ) | |
USD | 6,506 | | | 12/16/16 | | | 1.228 | | | | 3 Month USD LIBOR | | | | (27,231 | ) | | | (27,231 | ) | |
USD | 6,506 | | | 12/17/16 | | | 1.225 | | | | 3 Month USD LIBOR | | | | (26,914 | ) | | | (26,914 | ) | |
USD | 6,506 | | | 12/17/16 | | | 1.225 | | | | 3 Month USD LIBOR | | | | (26,914 | ) | | | (26,914 | ) | |
USD | 6,506 | | | 12/18/16 | | | 1.185 | | | | 3 Month USD LIBOR | | | | (24,152 | ) | | | (24,152 | ) | |
USD | 6,506 | | | 12/18/16 | | | 1.158 | | | | 3 Month USD LIBOR | | | | (22,367 | ) | | | (22,367 | ) | |
USD | 6,506 | | | 12/21/16 | | | 1.205 | | | | 3 Month USD LIBOR | | | | (25,044 | ) | | | (25,044 | ) | |
USD | 6,506 | | | 12/22/16 | | | 1.285 | | | | 3 Month USD LIBOR | | | | (30,083 | ) | | | (30,083 | ) | |
USD | 6,415 | | | 12/23/16 | | | 1.300 | | | | 3 Month USD LIBOR | | | | (30,483 | ) | | | (30,483 | ) | |
USD | 6,415 | | | 12/23/16 | | | 1.285 | | | | 3 Month USD LIBOR | | | | (29,526 | ) | | | (29,526 | ) | |
USD | 12,830 | | | 12/24/16 | | | 1.330 | | | | 3 Month USD LIBOR | | | | (64,629 | ) | | | (64,629 | ) | |
USD | 7,170 | | | 01/12/17 | | | 1.270 | | | | 3 Month USD LIBOR | | | | (28,933 | ) | | | (28,933 | ) | |
USD | 7,170 | | | 01/12/17 | | | 1.245 | | | | 3 Month USD LIBOR | | | | (27,151 | ) | | | (27,151 | ) | |
USD | 8,812 | | | 01/15/17 | | | 1.148 | | | | 3 Month USD LIBOR | | | | (24,236 | ) | | | (24,236 | ) | |
USD | 16,188 | | | 01/19/17 | | | 1.076 | | | | 3 Month USD LIBOR | | | | (31,854 | ) | | | (31,854 | ) | |
USD | 7,224 | | | 01/20/17 | | | 1.038 | | | | 3 Month USD LIBOR | | | | (11,304 | ) | | | (11,304 | ) | |
USD | 7,224 | | | 01/22/17 | | | 1.043 | | | | 3 Month USD LIBOR | | | | (11,293 | ) | | | (11,293 | ) | |
USD | 4,816 | | | 01/25/17 | | | 1.058 | | | | 3 Month USD LIBOR | | | | (7,980 | ) | | | (7,980 | ) | |
USD | 4,816 | | | 01/26/17 | | | 1.125 | | | | 3 Month USD LIBOR | | | | (11,114 | ) | | | (11,114 | ) | |
USD | 2,783 | | | 02/08/17 | | | 1.083 | | | | 3 Month USD LIBOR | | | | (4,521 | ) | | | (4,521 | ) | |
USD | 2,783 | | | 02/22/17 | | | 1.410 | | | | 3 Month USD LIBOR | | | | (12,775 | ) | | | (12,775 | ) | |
USD | 13,010 | | | 02/22/17 | | | 1.370 | | | | 3 Month USD LIBOR | | | | (54,550 | ) | | | (54,550 | ) | |
USD | 10,408 | | | 02/23/17 | | | 1.308 | | | | 3 Month USD LIBOR | | | | (36,994 | ) | | | (36,994 | ) | |
USD | 2,270 | | | 02/25/17 | | | 1.325 | | | | 3 Month USD LIBOR | | | | (8,370 | ) | | | (8,370 | ) | |
USD | 1,900 | | | 02/25/17 | | | 1.317 | | | | 3 Month USD LIBOR | | | | (6,854 | ) | | | (6,854 | ) | |
USD | 3,800 | | | 02/26/17 | | | 1.285 | | | | 3 Month USD LIBOR | | | | (12,411 | ) | | | (12,411 | ) | |
USD | 3,800 | | | 03/02/17 | | | 1.262 | | | | 3 Month USD LIBOR | | | | (11,291 | ) | | | (11,291 | ) | |
USD | 5,700 | | | 03/04/17 | | | 1.307 | | | | 3 Month USD LIBOR | | | | (19,254 | ) | | | (19,254 | ) | |
USD | 7,600 | | | 03/07/17 | | | 1.348 | | | | 3 Month USD LIBOR | | | | (28,335 | ) | | | (28,335 | ) | |
USD | 3,800 | | | 03/09/17 | | | 1.330 | | | | 3 Month USD LIBOR | | | | (13,333 | ) | | | (13,333 | ) | |
USD | 3,800 | | | 03/10/17 | | | 1.411 | | | | 3 Month USD LIBOR | | | | (16,283 | ) | | | (16,283 | ) | |
USD | 3,800 | | | 03/14/17 | | | 1.407 | | | | 3 Month USD LIBOR | | | | (15,856 | ) | | | (15,856 | ) | |
USD | 5,930 | | | 03/16/17 | | | 1.352 | | | | 3 Month USD LIBOR | | | | (21,246 | ) | | | (21,246 | ) | |
USD | 9,450 | | | 06/16/17 | | | 1.415 | | | | 3 Month USD LIBOR | | | | (21,698 | ) | | | (21,698 | ) | |
USD | 1,175 | | | 12/11/24 | | | 3 Month USD LIBOR | | | | 2.965 | % | | | 2,732 | | | | 2,732 | | |
USD | 2,989 | | | 12/12/24 | | | 3 Month USD LIBOR | | | | 2.976 | | | | 8,377 | | | | 8,377 | | |
USD | 2,989 | | | 12/12/24 | | | 3 Month USD LIBOR | | | | 2.978 | | | | 8,541 | | | | 8,541 | | |
USD | 5,978 | | | 12/16/24 | | | 3 Month USD LIBOR | | | | 2.875 | | | | (10,137 | ) | | | (10,137 | ) | |
USD | 2,989 | | | 12/16/24 | | | 3 Month USD LIBOR | | | | 2.875 | | | | (5,068 | ) | | | (5,068 | ) | |
USD | 2,989 | | | 12/17/24 | | | 3 Month USD LIBOR | | | | 2.860 | | | | (7,082 | ) | | | (7,082 | ) | |
249
PACE Select Advisors Trust
PACE Alternative Strategies Investments
Portfolio of investments—July 31, 2015
Centrally cleared interest rate swap agreements—(continued)
Notional
amount
(000) | | Termination
date | | Payments made by
the Portfolio10 | | Payments received by
the Portfolio10 | | Value | | Unrealized
appreciation
(depreciation) | |
USD | 2,989 | | | 12/17/24 | | | 3 Month USD LIBOR | | | | 2.855 | % | | $ | (7,738 | ) | | $ | (7,738 | ) | |
USD | 2,989 | | | 12/18/24 | | | 3 Month USD LIBOR | | | | 2.780 | | | | (17,622 | ) | | | (17,622 | ) | |
USD | 2,989 | | | 12/18/24 | | | 3 Month USD LIBOR | | | | 2.780 | | | | (17,622 | ) | | | (17,622 | ) | |
USD | 2,989 | | | 12/19/24 | | | 3 Month USD LIBOR | | | | 2.785 | | | | (17,015 | ) | | | (17,015 | ) | |
USD | 2,989 | | | 12/23/24 | | | 3 Month USD LIBOR | | | | 2.900 | | | | (2,077 | ) | | | (2,077 | ) | |
USD | 3,023 | | | 12/23/24 | | | 3 Month USD LIBOR | | | | 2.920 | | | | 553 | | | | 553 | | |
USD | 3,023 | | | 12/23/24 | | | 3 Month USD LIBOR | | | | 2.910 | | | | (773 | ) | | | (773 | ) | |
USD | 6,046 | | | 12/24/24 | | | 3 Month USD LIBOR | | | | 2.880 | | | | (9,602 | ) | | | (9,602 | ) | |
USD | 2,954 | | | 01/13/25 | | | 3 Month USD LIBOR | | | | 2.650 | | | | (35,232 | ) | | | (35,232 | ) | |
USD | 2,954 | | | 01/13/25 | | | 3 Month USD LIBOR | | | | 2.665 | | | | (33,290 | ) | | | (33,290 | ) | |
USD | 1,904 | | | 03/16/25 | | | 3 Month USD LIBOR | | | | 2.715 | | | | (18,622 | ) | | | (18,622 | ) | |
USD | 2,450 | | | 06/16/25 | | | 3 Month USD LIBOR | | | | 3.154 | | | | 20,197 | | | | 20,197 | | |
USD | 3,247 | | | 07/14/25 | | | 3 Month USD LIBOR | | | | 3.284 | | | | 43,905 | | | | 43,905 | | |
USD | 4,342 | | | 07/15/25 | | | 3 Month USD LIBOR | | | | 3.314 | | | | 64,206 | | | | 64,206 | | |
USD | 6,512 | | | 07/16/25 | | | 3 Month USD LIBOR | | | | 3.291 | | | | 89,750 | | | | 89,750 | | |
USD | 5,427 | | | 07/17/25 | | | 3 Month USD LIBOR | | | | 3.256 | | | | 66,566 | | | | 66,566 | | |
USD | 2,202 | | | 07/20/25 | | | 3 Month USD LIBOR | | | | 3.206 | | | | 22,203 | | | | 22,203 | | |
USD | 2,125 | | | 07/22/25 | | | 3 Month USD LIBOR | | | | 3.161 | | | | 17,237 | | | | 17,237 | | |
USD | 8,683 | | | 07/23/25 | | | 3 Month USD LIBOR | | | | 3.177 | | | | 76,166 | | | | 76,166 | | |
USD | 3,290 | | | 09/18/44 | | | 3.698 | % | | | 3 Month USD LIBOR | | | | (121,014 | ) | | | (121,014 | ) | |
USD | 3,290 | | | 09/18/44 | | | 3.715 | | | | 3 Month USD LIBOR | | | | (124,119 | ) | | | (124,119 | ) | |
USD | 1,645 | | | 09/18/44 | | | 3.735 | | | | 3 Month USD LIBOR | | | | (63,833 | ) | | | (63,833 | ) | |
USD | 3,290 | | | 09/18/44 | | | 3.736 | | | | 3 Month USD LIBOR | | | | (127,844 | ) | | | (127,844 | ) | |
USD | 1,645 | | | 09/19/44 | | | 3.755 | | | | 3 Month USD LIBOR | | | | (65,588 | ) | | | (65,588 | ) | |
USD | 3,290 | | | 09/19/44 | | | 3.745 | | | | 3 Month USD LIBOR | | | | (129,313 | ) | | | (129,313 | ) | |
USD | 8,225 | | | 09/22/44 | | | 3.736 | | | | 3 Month USD LIBOR | | | | (319,377 | ) | | | (319,377 | ) | |
USD | 6,580 | | | 09/25/44 | | | 3.741 | | | | 3 Month USD LIBOR | | | | (257,482 | ) | | | (257,482 | ) | |
USD | 3,290 | | | 09/25/44 | | | 3.645 | | | | 3 Month USD LIBOR | | | | (111,675 | ) | | | (111,675 | ) | |
USD | 1,645 | | | 09/25/44 | | | 3.645 | | | | 3 Month USD LIBOR | | | | (55,837 | ) | | | (55,837 | ) | |
USD | 3,290 | | | 09/25/44 | | | 3.650 | | | | 3 Month USD LIBOR | | | | (112,473 | ) | | | (112,473 | ) | |
USD | 4,935 | | | 09/26/44 | | | 3.619 | | | | 3 Month USD LIBOR | | | | (160,604 | ) | | | (160,604 | ) | |
USD | 4,935 | | | 09/29/44 | | | 3.632 | | | | 3 Month USD LIBOR | | | | (164,214 | ) | | | (164,214 | ) | |
USD | 1,500 | | | 10/06/44 | | | 3.508 | | | | 3 Month USD LIBOR | | | | (39,781 | ) | | | (39,781 | ) | |
USD | 1,500 | | | 10/06/44 | | | 3.475 | | | | 3 Month USD LIBOR | | | | (37,156 | ) | | | (37,156 | ) | |
USD | 302 | | | 12/11/44 | | | 3.205 | | | | 3 Month USD LIBOR | | | | (4,133 | ) | | | (4,133 | ) | |
USD | 786 | | | 12/12/44 | | | 3.200 | | | | 3 Month USD LIBOR | | | | (10,416 | ) | | | (10,416 | ) | |
USD | 786 | | | 12/12/44 | | | 3.200 | | | | 3 Month USD LIBOR | | | | (10,416 | ) | | | (10,416 | ) | |
USD | 1,572 | | | 12/17/44 | | | 3.122 | | | | 3 Month USD LIBOR | | | | (10,251 | ) | | | (10,251 | ) | |
USD | 786 | | | 12/17/44 | | | 3.122 | | | | 3 Month USD LIBOR | | | | (5,125 | ) | | | (5,125 | ) | |
USD | 786 | | | 12/17/44 | | | 3.085 | | | | 3 Month USD LIBOR | | | | (2,609 | ) | | | (2,609 | ) | |
USD | 786 | | | 12/17/44 | | | 3.085 | | | | 3 Month USD LIBOR | | | | (2,609 | ) | | | (2,609 | ) | |
USD | 786 | | | 12/18/44 | | | 2.990 | | | | 3 Month USD LIBOR | | | | 3,851 | | | | 3,851 | | |
USD | 786 | | | 12/18/44 | | | 3.015 | | | | 3 Month USD LIBOR | | | | 2,151 | | | | 2,151 | | |
USD | 786 | | | 12/19/44 | | | 3.000 | | | | 3 Month USD LIBOR | | | | 3,169 | | | | 3,169 | | |
USD | 786 | | | 12/24/44 | | | 3.040 | | | | 3 Month USD LIBOR | | | | 433 | | | | 433 | | |
USD | 714 | | | 12/24/44 | | | 3.070 | | | | 3 Month USD LIBOR | | | | (1,459 | ) | | | (1,459 | ) | |
USD | 714 | | | 12/24/44 | | | 3.095 | | | | 3 Month USD LIBOR | | | | (3,003 | ) | | | (3,003 | ) | |
USD | 1,428 | | | 12/24/44 | | | 3.040 | | | | 3 Month USD LIBOR | | | | 787 | | | | 787 | | |
USD | 572 | | | 01/14/45 | | | 2.800 | | | | 3 Month USD LIBOR | | | | 12,126 | | | | 12,126 | | |
USD | 572 | | | 01/14/45 | | | 2.815 | | | | 3 Month USD LIBOR | | | | 11,385 | | | | 11,385 | | |
USD | 353 | | | 01/15/45 | | | 2.717 | | | | 3 Month USD LIBOR | | | | 10,011 | | | | 10,011 | | |
USD | 647 | | | 01/16/45 | | | 2.648 | | | | 3 Month USD LIBOR | | | | 22,189 | | | | 22,189 | | |
USD | 516 | | | 01/21/45 | | | 2.655 | | | | 3 Month USD LIBOR | | | | 17,366 | | | | 17,366 | | |
250
PACE Select Advisors Trust
PACE Alternative Strategies Investments
Portfolio of investments—July 31, 2015
Centrally cleared interest rate swap agreements—(concluded)
Notional
amount
(000) | | Termination
date | | Payments made by
the Portfolio10 | | Payments received by
the Portfolio10 | | Value | | Unrealized
appreciation
(depreciation) | |
USD | 516 | | | 01/22/45 | | | 2.599 | % | | 3 Month USD LIBOR | | $ | 19,874 | | | $ | 19,874 | | |
USD | 344 | | | 01/25/45 | | | 2.575 | | | 3 Month USD LIBOR | | | 13,949 | | | | 13,949 | | |
USD | 344 | | | 01/28/45 | | | 2.703 | | | 3 Month USD LIBOR | | | 10,147 | | | | 10,147 | | |
USD | 216 | | | 02/06/45 | | | 2.527 | | | 3 Month USD LIBOR | | | 9,636 | | | | 9,636 | | |
USD | 215 | | | 02/20/45 | | | 2.820 | | | 3 Month USD LIBOR | | | 4,149 | | | | 4,149 | | |
USD | 1,173 | | | 02/20/45 | | | 2.820 | | | 3 Month USD LIBOR | | | 22,637 | | | | 22,637 | | |
USD | 938 | | | 02/25/45 | | | 2.889 | | | 3 Month USD LIBOR | | | 12,533 | | | | 12,533 | | |
USD | 213 | | | 02/25/45 | | | 2.850 | | | 3 Month USD LIBOR | | | 3,556 | | | | 3,556 | | |
USD | 333 | | | 02/25/45 | | | 2.827 | | | 3 Month USD LIBOR | | | 6,219 | | | | 6,219 | | |
USD | 666 | | | 02/26/45 | | | 2.820 | | | 3 Month USD LIBOR | | | 12,836 | | | | 12,836 | | |
USD | 999 | | | 03/04/45 | | | 2.776 | | | 3 Month USD LIBOR | | | 23,027 | | | | 23,027 | | |
USD | 666 | | | 03/04/45 | | | 2.764 | | | 3 Month USD LIBOR | | | 16,044 | | | | 16,044 | | |
USD | 1,332 | | | 03/05/45 | | | 2.836 | | | 3 Month USD LIBOR | | | 23,803 | | | | 23,803 | | |
USD | 666 | | | 03/11/45 | | | 2.863 | | | 3 Month USD LIBOR | | | 10,339 | | | | 10,339 | | |
USD | 666 | | | 03/11/45 | | | 2.956 | | | 3 Month USD LIBOR | | | 5,028 | | | | 5,028 | | |
USD | 10,200 | | | 03/12/45 | | | 2.855 | | | 3 Month USD LIBOR | | | 83,826 | | | | 83,826 | | |
USD | 666 | | | 03/13/45 | | | 2.830 | | | 3 Month USD LIBOR | | | 12,263 | | | | 12,263 | | |
USD | 793 | | | 03/18/45 | | | 2.766 | | | 3 Month USD LIBOR | | | 18,946 | | | | 18,946 | | |
USD | 2,763 | | | 06/08/45 | | | 3.100 | | | 3 Month USD LIBOR | | | (13,695 | ) | | | (13,695 | ) | |
USD | 2,763 | | | 06/08/45 | | | 3.093 | | | 3 Month USD LIBOR | | | (12,600 | ) | | | (12,600 | ) | |
USD | 2,763 | | | 06/11/45 | | | 3.083 | | | 3 Month USD LIBOR | | | (11,161 | ) | | | (11,161 | ) | |
USD | 5,525 | | | 06/11/45 | | | 3.098 | | | 3 Month USD LIBOR | | | (26,702 | ) | | | (26,702 | ) | |
USD | 4,144 | | | 06/11/45 | | | 3.138 | | | 3 Month USD LIBOR | | | (28,854 | ) | | | (28,854 | ) | |
USD | 4,144 | | | 06/12/45 | | | 3.226 | | | 3 Month USD LIBOR | | | (48,138 | ) | | | (48,138 | ) | |
USD | 1,500 | | | 06/15/45 | | | 3.180 | | | 3 Month USD LIBOR | | | (13,791 | ) | | | (13,791 | ) | |
USD | 4,930 | | | 06/17/45 | | | 3.187 | | | 3 Month USD LIBOR | | | (61,779 | ) | | | (61,779 | ) | |
USD | 3,700 | | | 06/25/45 | | | 3.236 | | | 3 Month USD LIBOR | | | (44,904 | ) | | | (44,904 | ) | |
USD | 3,800 | | | 06/26/45 | | | 3.252 | | | 3 Month USD LIBOR | | | (49,501 | ) | | | (49,501 | ) | |
USD | 1,900 | | | 06/29/45 | | | 3.245 | | | 3 Month USD LIBOR | | | (24,207 | ) | | | (24,207 | ) | |
USD | 500 | | | 07/02/45 | | | 3.250 | | | 3 Month USD LIBOR | | | (6,453 | ) | | | (6,453 | ) | |
USD | 1,400 | | | 07/02/45 | | | 3.208 | | | 3 Month USD LIBOR | | | (14,990 | ) | | | (14,990 | ) | |
USD | 2,300 | | | 07/02/45 | | | 3.223 | | | 3 Month USD LIBOR | | | (26,357 | ) | | | (26,357 | ) | |
USD | 1,400 | | | 07/09/45 | | | 3.170 | | | 3 Month USD LIBOR | | | (12,170 | ) | | | (12,170 | ) | |
| | | | | | | | | | | $ | (1,321,756 | ) | | $ | (846,222 | ) | |
Centrally cleared credit default swaps—buy protection12
Referenced obligations11 | | Notional
amount
(000) | | Termination
date | | Payments
made by
the Portfolio10 | | Upfront
payments
received | | Value | | Unrealized
depreciation | |
CDX North America High
Yield Series 24 Index | | USD | 7,178 | | | 06/20/20 | | | 5.000 | % | | $ | 485,512 | | | $ | (490,227 | ) | | $ | (4,715 | ) | |
251
PACE Select Advisors Trust
PACE Alternative Strategies Investments
Portfolio of investments—July 31, 2015
Centrally cleared credit default swap agreements—sell protection13
Referenced obligations11 | | Notional
amount
(000) | | Termination
date | | Payments
received
by the
Portfolio10 | | Upfront
payments
received
(made) | | Value | | Unrealized
appreciation
(depreciation) | | Credit
spread14 | |
CDX North America High Yield
Series 24 Index | | USD | 14,741 | | | 06/20/20 | | | 5.000 | % | | $ | (963,473 | ) | | $ | 1,006,826 | | | $ | 43,353 | | | | 3.42 | % | |
CDX North America High Yield
Series 24 Index | | USD | 990 | | | 06/20/20 | | | 5.000 | | | | (70,535 | ) | | | 67,617 | | | | (2,918 | ) | | | 3.42 | | |
| | | | | | | | | $ | (1,034,008 | ) | | $ | 1,074,443 | | | $ | 40,435 | | | | | | |
Total return swap agreements3
Counterparty | | Notional
amount
(000) | | Termination
date | | Payments
made
by the
Portfolio10 | | Payments
received
by the
Portfolio10,15 | | Upfront
payments
received
(made) | | Value | | Unrealized
appreciation | |
BNP | | | 5,016 | | | 06/17/16 | | | 3 Month USD LIBOR | | | | 1.00 | % | | $ | — | | | $ | 178,580 | | | $ | 178,580 | | |
Fair valuation summary
The following is a summary of the fair valuations according to the inputs used as of July 31, 2015 in valuing the Portfolio's investments:
Assets
Description | | Unadjusted
quoted prices in
active markets for
identical investments
(Level 1) | | Other significant
observable inputs
(Level 2) | | Unobservable
inputs
(Level 3) | | Total | |
Common stocks | | $ | 291,944,100 | | | $ | — | | | $ | 0 | | | $ | 291,944,100 | | |
Investment companies | | | — | | | | 60,533,500 | | | | — | | | | 60,533,500 | | |
Preferred stock | | | 213,773 | | | | — | | | | — | | | | 213,773 | | |
Rights | | | 323 | | | | — | | | | — | | | | 323 | | |
Warrants | | | 1,023,298 | | | | — | | | | — | | | | 1,023,298 | | |
Corporate notes | | | — | | | | 20,307,463 | | | | — | | | | 20,307,463 | | |
Non-US government obligations | | | — | | | | 30,663,485 | | | | — | | | | 30,663,485 | | |
Time deposits | | | — | | | | 172,141,977 | | | | — | | | | 172,141,977 | | |
Short-term US government obligations | | | — | | | | 140,636,315 | | | | — | | | | 140,636,315 | | |
Repurchase agreement | | | — | | | | 62,118,000 | | | | — | | | | 62,118,000 | | |
Options and swaptions purchased | | | 706,124 | | | | 854,354 | | | | — | | | | 1,560,478 | | |
Futures contracts | | | 4,521,425 | | | | — | | | | — | | | | 4,521,425 | | |
Forward foreign currency contracts | | | — | | | | 22,379,307 | | | | — | | | | 22,379,307 | | |
Swap agreements | | | — | | | | 5,511,580 | | | | — | | | | 5,511,580 | | |
Total | | $ | 298,409,043 | | | $ | 515,145,981 | | | $ | 0 | | | $ | 813,555,024 | | |
Liabilities | |
Investments sold short | | $ | (52,818,467 | ) | | $ | — | | | $ | — | | | $ | (52,818,467 | ) | |
Written options | | | (329,640 | ) | | | — | | | | — | | | | (329,640 | ) | |
Foreign exchange written options | | | — | | | | (382,689 | ) | | | — | | | | (382,689 | ) | |
Futures contracts | | | (1,972,684 | ) | | | — | | | | — | | | | (1,972,684 | ) | |
Forward foreign currency contracts | | | — | | | | (16,701,747 | ) | | | — | | | | (16,701,747 | ) | |
Swap agreements | | | — | | | | (5,789,194 | ) | | | — | | | | (5,789,194 | ) | |
Total | | $ | (55,120,791 | ) | | $ | (22,873,630 | ) | | $ | — | | | $ | (77,994,421 | ) | |
At July 31, 2015, there was a transfer from Level 2 to Level 1 of $(111,735) due to valuation being based upon an unadjusted quoted price from a US exchange rather than over-the-counter pricing. At July 31, 2014, $89,943,029 of foreign investments and $(20,520,490) of foreign investments sold short were classified within Level 2 of the fair value hierarchy pursuant to the Portfolio's fair valuation procedures for foreign portfolio holdings.
252
PACE Select Advisors Trust
PACE Alternative Strategies Investments
Portfolio of investments—July 31, 2015
The following is a rollforward of the Portfolio's investments that was valued using unobservable inputs (Level 3) for the year ended July 31, 2015:
| | Common
stocks ($) | |
Beginning balance | | $ | 0 | | |
Purchases | | | — | | |
Sales | | | — | | |
Accrued discounts/(premiums) | | | — | | |
Total realized gain/(loss) | | | — | | |
Net change in unrealized appreciation/depreciation | | | — | | |
Transfers into Level 3 | | | — | | |
Transfers out of Level 3 | | | — | | |
Ending balance | | $ | 0 | | |
The change in net unrealized appreciation/depreciation relating to the Level 3 investments held at July 31, 2015, was $0.
Portfolio footnotes
* Non-income producing security.
†† Amount represents less than 0.005%.
1 Security, or portion thereof, pledged as collateral for investments sold short, written options or futures.
2 Security is being fair valued by a valuation committee under the direction of the board of trustees.
3 Illiquid investments as of July 31, 2015.
4 Variable or floating rate security. The interest rate shown is the current rate as of July 31, 2015 and changes periodically.
5 Security exempt from registration pursuant to Regulation S under the Securities Act of 1933. Regulation S applies to securities offerings that are made outside of the United States and do not involve direct selling efforts in the United States. At July 31, 2015, the value of these securities amounted to 2.18% of net assets.
6 Perpetual investment. Date shown reflects the next call date.
7 Step bond that converts to the noted fixed rate at a designated future date.
8 Rates shown is the discount rate at date of purchase.
9 At the maturity date, a net cash flow is exchanged, where the payoff amount is equivalent to the difference between the realized price variance of the reference entity and the strike price multiplied by the notional amount. As a receiver of the realized price variance, the Portfolio would receive the payoff amount when the realized price variance of the reference entity is greater than the strike price and would owe the payoff amount when the variance is less than the strike price. As a payer of the realized price variance, the Portfolio would owe the payoff amount when the realized price variance of the reference entity is greater than the strike price and would receive the payoff amount when the variance is less than the strike price.
10 Payments made/received are based on the notional amount.
11 Payments from/to the counterparty will be received/made upon the occurrence of a failure to pay, obligation acceleration, repudiation or restructuring of the referenced obligation.
12 If the Portfolio is a buyer of protection and a credit event occurs, as defined under the terms of that particular swap agreement, the Portfolio will either (i) receive from the seller of protection an amount equal to the notional value of the swap and deliver the referenced obligation or underlying securities comprising the referenced index or (ii) receive a net settlement amount in the form of cash or securities equal to the notional amount of the swap less the recovery value of the referenced obligation or underlying securities comprising the referenced index.
13 If the Portfolio is a seller of protection and a credit event occurs, as defined under the terms of that particular swap agreement, the Portfolio will either (i) pay to the buyer of protection an amount equal to the notional amount of the swap and take delivery of the referenced obligation or underlying securities comprising the referenced index or (ii) pay a net settlement amount in the form of cash or securities equal to the notional amount of the swap less the recovery value of the referenced obligation or underlying securities comprising the referenced index.
14 Credit spreads, represented in absolute terms, utilized in determining the market value as of period end serve as an indicator of the current status of the payment/performance risk and represent the likelihood or risk of default for the credit derivative. The credit spread of a particular referenced entity reflects the cost of buying/selling protection and may include upfront payments required to be made to enter into the agreement. Wider credit spreads represent a deterioration of the referenced entity's credit soundness and a greater likelihood or risk of default or other credit event occurring as defined under the terms of the agreement. A credit spread identified as "Defaulted" indicates a credit event has occurred for the referenced entity. Credit spreads are unaudited.
15 Payment is based on the performance of the underlying 3 Month USD LIBOR.
See accompanying notes to financial statements.
253
PACE Select Advisors Trust
Portfolio acronyms:
ABS Asset-backed Security
ADR American Depositary Receipt
ALM Application Lifecycle Management
AGM Assured Guaranty Municipal Corporation
AMBAC American Municipal Bond Assurance Corporation
ARM Adjustable Rate Mortgage—The interest rate shown is the current rate as of July 31, 2015.
ASX Australian Securities Exchange
BHAC Berkshire Hathaway Assurance Corporation
BOBL Bundesobligationen
CAC French Stock Market Index
CDO Collateralized Debt Obligation
CDX Compound Index
CLO Collateralized Loan Obligation
COFI Cost of Funds Index
CVR Contingent Value Right
DAX German Stock Index
EURIBOR Euro Interbank Offered Rate
FHA Federal Housing Administration
FHLB Federal Home Loan Bank
FHLMC Federal Home Loan Mortgage Corporation
FNMA Federal National Mortgage Association
FREMF Finnish Real Estate Management Federation
FTSE London Stock Exchange Index
FTSE MIB Italian National Stock Exchange Index
FTSE/JSE South Africa Stock Market Index
GDR Global Depositary Receipt
GMAC General Motors Acceptance Corporation
GMTN Global Medium Term Note
GNMA Government National Mortgage Association
GSAMP Goldman Sachs Asset Mortgage Passthrough
GTD Guaranteed
IBEX Spanish Exchange Index
iTraxx Credit default swap index products covering regions of Europe, Australia, Japan and non-Japan Asia
JGB Japan Government Bond
KOSPI Korea Composite Stock Price Index
LIBOR London Interbank Offered Rate
MTN Medium Term Note
NATL-RE National Reinsurance
NIKKEI Tokyo Stock Exchange Index
OJSC Open Joint Stock Company
OMX Stockholm Stock Exchange
OMX 30 Stockholm Stock Exchange
PSF Permanent School Fund
RASC Retirement Administration Service Center
REIT Real Estate Investment Trust
REMIC Real Estate Mortgage Investment Conduit
SBA Small Business Administration
SDR Special Drawing Rights
S&P Standard and Poor's
SCSDE South Carolina School District Enhancement
SGX Singapore Stock eXchange
SPDR Standard and Poor's Depository Receipts
SPI Swiss Performance Index
STOXX A series of market indexes that are representative of the European and global markets.
STRIP Separate Trading of Registered Interest and Principal of Securities
TBA (To Be Announced) Security is purchased on a forward commitment basis with an approximate principal amount (generally +/- 1.0%) and no definite maturity date. The actual principal amount and maturity date will be determined upon settlement when the specific mortgage pools are assigned.
TIPS Treasury inflation protected securities are debt securities issued by the US Treasury whose principal and/or interest payments are adjusted for inflation, unlike debt securities that make fixed principal and interest payments. The interest rate paid by the TIPS is fixed, while the principal value rises or falls based on changes in a published Consumer Price Index ("CPI"). Thus, if inflation occurs, the principal and interest payments on TIPS are adjusted accordingly to protect investors from inflationary loss. During a deflationary period, the principal and interest payments decrease, although the TIPS principal amounts will not drop below their face amounts at maturity. In exchange for the inflation protection, the TIPS generally pay lower interest rates than typical US Treasury securities. Only if inflation occurs will TIPS offer a higher real yield than a conventional Treasury bond of the same maturity.
TOPIX Tokyo Stock Price Index
See accompanying notes to financial statements.
254
PACE Select Advisors Trust
Currency type abbreviations:
AUD Australian Dollar
BRL Brazilian Real
CAD Canadian Dollar
CHF Swiss Franc
CLP Chilean Peso
CNY Chinese Yuan Renminbi
COP Colombian Peso
CZK Czech Koruna
DKK Danish Krone
EUR Euro
GBP Great Britain Pound
HKD Hong Kong Dollar
HUF Hungarian Forint
IDR Indonesian Rupiah
ILS Israeli Shekel
INR Indian Rupee
JPY Japanese Yen
KRW South Korean Won
MXN Mexican Peso
MYR Malaysian Ringgit
NOK Norwegian Krone
NZD New Zealand Dollar
PHP Philippine Peso
PLN Polish Zloty
RUB Russian Ruble
SEK Swedish Krona
SGD Singapore Dollar
TRY Turkish Lira
TWD Taiwan Dollar
USD United States Dollar
ZAR South African Rand
Counterparty acronyms:
BB Barclays Bank PLC
BNP BNP Paribas
BOA Bank of America
CITI Citibank NA
CSI Credit Suisse International
DB Deutsche Bank AG
GSB Goldman Sachs Bank USA
GSI Goldman Sachs International
GSCM Goldman Sachs Capital Management
JPMCB JPMorgan Chase Bank
MSCI Morgan Stanley & Co. International PLC
RBC Royal Bank of Canada
RBS Royal Bank of Scotland PLC
SCB Standard Chartered Bank
SG Societe Generale
SSC State Street Bank and Trust Co.
WBC Westpac Banking Corp.
See accompanying notes to financial statements.
255
PACE Select Advisors Trust
Understanding your Portfolio's expenses (unaudited)
As a shareholder of a Portfolio, you incur two types of costs: (1) transactional costs (as applicable), including sales charges (loads), or ongoing program fees; and (2) ongoing Portfolio costs, including management fees; service and/or distribution (12b-1) fees (if applicable); and other Portfolio expenses. These examples are intended to help you understand your ongoing costs (in dollars) of investing in each Portfolio and to compare these costs with the ongoing costs of investing in other mutual funds.
The examples below are based on an investment of $1,000 invested at the beginning of the period and held for the entire period, February 1, 2015 to July 31, 2015.
Actual expenses (unaudited)
The first line for each class of shares in the table below for each Portfolio provides information about its actual account values and actual expenses. You may use the information in this line, together with the amount you invested, to estimate the expenses that you paid over a period. Simply divide your account value by $1,000 (for example, an $8,600 account value divided by $1,000 = 8.6), then multiply the result by the number in the first line for each class of shares for each respective Portfolio under the heading entitled "Expenses paid during period" to estimate the expenses you paid on your account during the period.
Hypothetical example for comparison purposes (unaudited)
The second line for each class of shares in the table below for each Portfolio provides information about hypothetical account values and hypothetical expenses based on that Portfolio's actual expense ratios for each class of shares and an assumed rate of return of 5% per year before expenses, which is not that Portfolio's actual return for each class of shares. The hypothetical account values and expenses may not be used to estimate the actual ending account balance or expenses you paid for the period. You may use this information to compare the ongoing costs of investing in a Portfolio and other funds. To do so, compare this 5% hypothetical example with the 5% hypothetical examples that appear in the shareholder reports of other funds.
Please note that the expenses shown in the table are meant to highlight your ongoing Portfolio costs only and do not reflect any transactional costs (as applicable), such as sales charges (loads), or program fees. Therefore, the second line in the table for each class of shares for each Portfolio is useful in comparing ongoing Portfolio costs only, and will not help you determine the relative total costs of owning different funds. In addition, if these transactional costs or program fees were included, your costs would have been higher.
256
PACE Select Advisors Trust
| | | | | Beginning
account value
February 1, 2015 | | Ending
account value
July 31, 2015 | | Expenses paid
during period1
02/01/15 to 07/31/15 | | Expense
ratio during
the period | |
PACE Money Market Investments | |
Class P | | Actual | | $ | 1,000.00 | | | $ | 1,000.00 | | | $ | 0.79 | | | | 0.16 | % | |
| | | Hypothetical
(5% annual return before expenses) | | | 1,000.00 | | | | 1,024.00 | | | | 0.80 | | | | 0.16 | | |
PACE Mortgage-Backed Securities Fixed Income Investments | |
Class A | | Actual | | | 1,000.00 | | | | 1,000.00 | | | | 4.81 | | | | 0.97 | | |
| | | Hypothetical
(5% annual return before expenses) | | | 1,000.00 | | | | 1,019.98 | | | | 4.86 | | | | 0.97 | | |
Class C | | Actual | | | 1,000.00 | | | | 997.50 | | | | 7.28 | | | | 1.47 | | |
| | | Hypothetical
(5% annual return before expenses) | | | 1,000.00 | | | | 1,017.51 | | | | 7.35 | | | | 1.47 | | |
Class Y | | Actual | | | 1,000.00 | | | | 1,001.20 | | | | 3.57 | | | | 0.72 | | |
| | | Hypothetical
(5% annual return before expenses) | | | 1,000.00 | | | | 1,021.22 | | | | 3.61 | | | | 0.72 | | |
Class P | | Actual | | | 1,000.00 | | | | 1,001.20 | | | | 3.57 | | | | 0.72 | | |
| | | Hypothetical
(5% annual return before expenses) | | | 1,000.00 | | | | 1,021.22 | | | | 3.61 | | | | 0.72 | | |
PACE Intermediate Fixed Income Investments | |
Class A | | Actual | | | 1,000.00 | | | | 1,000.10 | | | | 4.61 | | | | 0.93 | | |
| | | Hypothetical
(5% annual return before expenses) | | | 1,000.00 | | | | 1,020.18 | | | | 4.66 | | | | 0.93 | | |
Class C | | Actual | | | 1,000.00 | | | | 996.80 | | | | 7.08 | | | | 1.43 | | |
| | | Hypothetical
(5% annual return before expenses) | | | 1,000.00 | | | | 1,017.70 | | | | 7.15 | | | | 1.43 | | |
Class Y | | Actual | | | 1,000.00 | | | | 1,001.40 | | | | 3.37 | | | | 0.68 | | |
| | | Hypothetical
(5% annual return before expenses) | | | 1,000.00 | | | | 1,021.42 | | | | 3.41 | | | | 0.68 | | |
Class P | | Actual | | | 1,000.00 | | | | 1,001.40 | | | | 3.37 | | | | 0.68 | | |
| | | Hypothetical
(5% annual return before expenses) | | | 1,000.00 | | | | 1,021.42 | | | | 3.41 | | | | 0.68 | | |
PACE Strategic Fixed Income Investments | |
Class A | | Actual | | | 1,000.00 | | | | 982.80 | | | | 4.67 | | | | 0.95 | | |
| | | Hypothetical
(5% annual return before expenses) | | | 1,000.00 | | | | 1,020.33 | | | | 4.76 | | | | 0.95 | | |
Class C | | Actual | | | 1,000.00 | | | | 979.80 | | | | 7.41 | | | | 1.51 | | |
| | | Hypothetical
(5% annual return before expenses) | | | 1,000.00 | | | | 1,017.31 | | | | 7.55 | | | | 1.51 | | |
Class Y | | Actual | | | 1,000.00 | | | | 982.40 | | | | 4.03 | | | | 0.82 | | |
| | | Hypothetical
(5% annual return before expenses) | | | 1,000.00 | | | | 1,020.73 | | | | 4.11 | | | | 0.82 | | |
Class P | | Actual | | | 1,000.00 | | | | 983.30 | | | | 3.93 | | | | 0.80 | | |
| | | Hypothetical
(5% annual return before expenses) | | | 1,000.00 | | | | 1,020.83 | | | | 4.01 | | | | 0.80 | | |
257
PACE Select Advisors Trust
| | | | | Beginning
account value
February 1, 2015 | | Ending
account value
July 31, 2015 | | Expenses paid
during period1
02/01/15 to 07/31/15 | | Expense
ratio during
the period | |
PACE Municipal Fixed Income Investments | |
Class A | | Actual | | $ | 1,000.00 | | | $ | 986.10 | | | $ | 4.43 | | | | 0.90 | % | |
| | | Hypothetical
(5% annual return before expenses) | | | 1,000.00 | | | | 1,020.33 | | | | 4.51 | | | | 0.90 | | |
Class C | | Actual | | | 1,000.00 | | | | 983.60 | | | | 6.89 | | | | 1.40 | | |
| | | Hypothetical
(5% annual return before expenses) | | | 1,000.00 | | | | 1,017.85 | | | | 7.00 | | | | 1.40 | | |
Class Y | | Actual | | | 1,000.00 | | | | 987.30 | | | | 3.20 | | | | 0.65 | | |
| | | Hypothetical
(5% annual return before expenses) | | | 1,000.00 | | | | 1,021.57 | | | | 3.26 | | | | 0.65 | | |
Class P | | Actual | | | 1,000.00 | | | | 988.00 | | | | 3.20 | | | | 0.65 | | |
| | | Hypothetical
(5% annual return before expenses) | | | 1,000.00 | | | | 1,021.57 | | | | 3.26 | | | | 0.65 | | |
PACE International Fixed Income Investments | |
Class A | | Actual | | | 1,000.00 | | | | 966.40 | | | | 5.66 | | | | 1.16 | | |
| | | Hypothetical
(5% annual return before expenses) | | | 1,000.00 | | | | 1,019.04 | | | | 5.81 | | | | 1.16 | | |
Class C | | Actual | | | 1,000.00 | | | | 964.00 | | | | 8.03 | | | | 1.65 | | |
| | | Hypothetical
(5% annual return before expenses) | | | 1,000.00 | | | | 1,016.61 | | | | 8.25 | | | | 1.65 | | |
Class Y | | Actual | | | 1,000.00 | | | | 967.10 | | | | 4.93 | | | | 1.01 | | |
| | | Hypothetical
(5% annual return before expenses) | | | 1,000.00 | | | | 1,019.79 | | | | 5.06 | | | | 1.01 | | |
Class P | | Actual | | | 1,000.00 | | | | 967.20 | | | | 4.93 | | | | 1.01 | | |
| | | Hypothetical
(5% annual return before expenses) | | | 1,000.00 | | | | 1,019.79 | | | | 5.06 | | | | 1.01 | | |
PACE High Yield Investments | |
Class A | | Actual | | | 1,000.00 | | | | 1,015.00 | | | | 6.15 | | | | 1.23 | | |
| | | Hypothetical
(5% annual return before expenses) | | | 1,000.00 | | | | 1,018.70 | | | | 6.16 | | | | 1.23 | | |
Class C | | Actual | | | 1,000.00 | | | | 1,012.40 | | | | 8.58 | | | | 1.72 | | |
| | | Hypothetical
(5% annual return before expenses) | | | 1,000.00 | | | | 1,016.27 | | | | 8.60 | | | | 1.72 | | |
Class Y | | Actual | | | 1,000.00 | | | | 1,016.00 | | | | 5.05 | | | | 1.01 | | |
| | | Hypothetical
(5% annual return before expenses) | | | 1,000.00 | | | | 1,019.79 | | | | 5.06 | | | | 1.01 | | |
Class P | | Actual | | | 1,000.00 | | | | 1,015.90 | | | | 5.15 | | | | 1.03 | | |
| | | Hypothetical
(5% annual return before expenses) | | | 1,000.00 | | | | 1,019.69 | | | | 5.16 | | | | 1.03 | | |
258
PACE Select Advisors Trust
| | | | | Beginning
account value
February 1, 2015 | | Ending
account value
July 31, 2015 | | Expenses paid
during period1
02/01/15 to 07/31/15 | | Expense
ratio during
the period | |
PACE Large Co Value Equity Investments | |
Class A | | Actual | | $ | 1,000.00 | | | $ | 1,044.00 | | | $ | 7.30 | | | | 1.44 | % | |
| | | Hypothetical
(5% annual return before expenses) | | | 1,000.00 | | | | 1,017.65 | | | | 7.20 | | | | 1.44 | | |
Class C | | Actual | | | 1,000.00 | | | | 1,039.90 | | | | 11.23 | | | | 2.22 | | |
| | | Hypothetical
(5% annual return before expenses) | | | 1,000.00 | | | | 1,013.79 | | | | 11.08 | | | | 2.22 | | |
Class Y | | Actual | | | 1,000.00 | | | | 1,045.30 | | | | 6.09 | | | | 1.20 | | |
| | | Hypothetical
(5% annual return before expenses) | | | 1,000.00 | | | | 1,018.84 | | | | 6.01 | | | | 1.20 | | |
Class P | | Actual | | | 1,000.00 | | | | 1,045.00 | | | | 6.14 | | | | 1.21 | | |
| | | Hypothetical
(5% annual return before expenses) | | | 1,000.00 | | | | 1,018.79 | | | | 6.06 | | | | 1.21 | | |
PACE Large Co Growth Equity Investments | |
Class A | | Actual | | | 1,000.00 | | | | 1,095.60 | | | | 6.08 | | | | 1.17 | | |
| | | Hypothetical
(5% annual return before expenses) | | | 1,000.00 | | | | 1,018.99 | | | | 5.86 | | | | 1.17 | | |
Class C | | Actual | | | 1,000.00 | | | | 1,091.50 | | | | 10.27 | | | | 1.98 | | |
| | | Hypothetical
(5% annual return before expenses) | | | 1,000.00 | | | | 1,014.98 | | | | 9.89 | | | | 1.98 | | |
Class Y | | Actual | | | 1,000.00 | | | | 1,097.20 | | | | 4.78 | | | | 0.92 | | |
| | | Hypothetical
(5% annual return before expenses) | | | 1,000.00 | | | | 1,020.23 | | | | 4.61 | | | | 0.92 | | |
Class P | | Actual | | | 1,000.00 | | | | 1,097.30 | | | | 4.73 | | | | 0.91 | | |
| | | Hypothetical
(5% annual return before expenses) | | | 1,000.00 | | | | 1,020.28 | | | | 4.56 | | | | 0.91 | | |
PACE Small/Medium Co Value Equity Investments | |
Class A | | Actual | | | 1,000.00 | | | | 1,068.80 | | | | 6.21 | | | | 1.21 | | |
| | | Hypothetical
(5% annual return before expenses) | | | 1,000.00 | | | | 1,018.79 | | | | 6.06 | | | | 1.21 | | |
Class C | | Actual | | | 1,000.00 | | | | 1,065.10 | | | | 10.14 | | | | 1.98 | | |
| | | Hypothetical
(5% annual return before expenses) | | | 1,000.00 | | | | 1,014.98 | | | | 9.89 | | | | 1.98 | | |
Class Y | | Actual | | | 1,000.00 | | | | 1,069.20 | | | | 5.64 | | | | 1.10 | | |
| | | Hypothetical
(5% annual return before expenses) | | | 1,000.00 | | | | 1,019.34 | | | | 5.51 | | | | 1.10 | | |
Class P | | Actual | | | 1,000.00 | | | | 1,069.30 | | | | 5.54 | | | | 1.08 | | |
| | | Hypothetical
(5% annual return before expenses) | | | 1,000.00 | | | | 1,019.44 | | | | 5.41 | | | | 1.08 | | |
259
PACE Select Advisors Trust
| | | | | Beginning
account value
February 1, 2015 | | Ending
account value
July 31, 2015 | | Expenses paid
during period1
02/01/15 to 07/31/15 | | Expense
ratio during
the period | |
PACE Small/Medium Co Growth Equity Investments | |
Class A | | Actual | | $ | 1,000.00 | | | $ | 1,148.20 | | | $ | 6.23 | | | | 1.17 | % | |
| | | Hypothetical
(5% annual return before expenses) | | | 1,000.00 | | | | 1,018.99 | | | | 5.86 | | | | 1.17 | | |
Class C | | Actual | | | 1,000.00 | | | | 1,143.70 | | | | 10.31 | | | | 1.94 | | |
| | | Hypothetical
(5% annual return before expenses) | | | 1,000.00 | | | | 1,015.17 | | | | 9.69 | | | | 1.94 | | |
Class Y | | Actual | | | 1,000.00 | | | | 1,148.40 | | | | 5.86 | | | | 1.10 | | |
| | | Hypothetical
(5% annual return before expenses) | | | 1,000.00 | | | | 1,019.34 | | | | 5.51 | | | | 1.10 | | |
Class P | | Actual | | | 1,000.00 | | | | 1,148.10 | | | | 5.81 | | | | 1.09 | | |
| | | Hypothetical
(5% annual return before expenses) | | | 1,000.00 | | | | 1,019.39 | | | | 5.46 | | | | 1.09 | | |
PACE International Equity Investments | |
Class A | | Actual | | | 1,000.00 | | | | 1,046.60 | | | | 9.39 | | | | 1.85 | | |
| | | Hypothetical
(5% annual return before expenses) | | | 1,000.00 | | | | 1,015.62 | | | | 9.25 | | | | 1.85 | | |
Class C | | Actual | | | 1,000.00 | | | | 1,043.20 | | | | 13.42 | | | | 2.65 | | |
| | | Hypothetical
(5% annual return before expenses) | | | 1,000.00 | | | | 1,011.65 | | | | 13.22 | | | | 2.65 | | |
Class Y | | Actual | | | 1,000.00 | | | | 1,048.20 | | | | 8.07 | | | | 1.59 | | |
| | | Hypothetical
(5% annual return before expenses) | | | 1,000.00 | | | | 1,016.91 | | | | 7.95 | | | | 1.59 | | |
Class P | | Actual | | | 1,000.00 | | | | 1,048.30 | | | | 8.08 | | | | 1.59 | | |
| | | Hypothetical
(5% annual return before expenses) | | | 1,000.00 | | | | 1,016.91 | | | | 7.95 | | | | 1.59 | | |
PACE International Emerging Markets Equity Investments | |
Class A | | Actual | | | 1,000.00 | | | | 925.50 | | | | 7.64 | | | | 1.60 | | |
| | | Hypothetical
(5% annual return before expenses) | | | 1,000.00 | | | | 1,016.86 | | | | 8.00 | | | | 1.60 | | |
Class C | | Actual | | | 1,000.00 | | | | 922.40 | | | | 11.34 | | | | 2.38 | | |
| | | Hypothetical
(5% annual return before expenses) | | | 1,000.00 | | | | 1,012.99 | | | | 11.88 | | | | 2.38 | | |
Class Y | | Actual | | | 1,000.00 | | | | 926.50 | | | | 6.83 | | | | 1.43 | | |
| | | Hypothetical
(5% annual return before expenses) | | | 1,000.00 | | | | 1,017.70 | | | | 7.15 | | | | 1.43 | | |
Class P | | Actual | | | 1,000.00 | | | | 926.10 | | | | 6.88 | | | | 1.44 | | |
| | | Hypothetical
(5% annual return before expenses) | | | 1,000.00 | | | | 1,017.65 | | | | 7.20 | | | | 1.44 | | |
260
PACE Select Advisors Trust
| | | | | Beginning
account value
February 1, 2015 | | Ending
account value
July 31, 2015 | | Expenses paid
during period1
02/01/15 to 07/31/15 | | Expense
ratio during
the period | |
PACE Global Real Estate Securities Investments | |
Class A | | Actual | | $ | 1,000.00 | | | $ | 954.30 | | | $ | 7.03 | | | | 1.45 | % | |
| | | Hypothetical
(5% annual return before expenses) | | | 1,000.00 | | | | 1,017.60 | | | | 7.25 | | | | 1.45 | | |
Class C | | Actual | | | 1,000.00 | | | | 951.20 | | | | 10.64 | | | | 2.20 | | |
| | | Hypothetical
(5% annual return before expenses) | | | 1,000.00 | | | | 1,013.89 | | | | 10.99 | | | | 2.20 | | |
Class Y | | Actual | | | 1,000.00 | | | | 955.50 | | | | 5.82 | | | | 1.20 | | |
| | | Hypothetical
(5% annual return before expenses) | | | 1,000.00 | | | | 1,018.84 | | | | 6.01 | | | | 1.20 | | |
Class P | | Actual | | | 1,000.00 | | | | 955.40 | | | | 5.82 | | | | 1.20 | | |
| | | Hypothetical
(5% annual return before expenses) | | | 1,000.00 | | | | 1,018.84 | | | | 6.01 | | | | 1.20 | | |
PACE Alternative Strategies Investments | |
Class A | | Actual | | | 1,000.00 | | | | 1,026.80 | | | | 9.80 | | | | 1.95 | | |
| | | Hypothetical
(5% annual return before expenses) | | | 1,000.00 | | | | 1,015.13 | | | | 9.74 | | | | 1.95 | | |
Class C | | Actual | | | 1,000.00 | | | | 1,023.00 | | | | 13.09 | | | | 2.61 | | |
| | | Hypothetical
(5% annual return before expenses) | | | 1,000.00 | | | | 1,011.85 | | | | 13.02 | | | | 2.61 | | |
Class Y | | Actual | | | 1,000.00 | | | | 1,027.70 | | | | 8.40 | | | | 1.67 | | |
| | | Hypothetical
(5% annual return before expenses) | | | 1,000.00 | | | | 1,016.51 | | | | 8.35 | | | | 1.67 | | |
Class P | | Actual | | | 1,000.00 | | | | 1,027.80 | | | | 8.15 | | | | 1.62 | | |
| | | Hypothetical
(5% annual return before expenses) | | | 1,000.00 | | | | 1,016.76 | | | | 8.10 | | | | 1.62 | | |
1 Expenses are equal to the Portfolios' annualized net expense ratios, multiplied by the average account value over the period, multiplied by 181 divided by 365 (to reflect the one-half year period).
261
PACE Select Advisors Trust
Statement of assets and liabilities
July 31, 2015
| | | PACE
Money Market
Investments | | PACE
Mortgage-Backed
Securities
Fixed Income
Investments | | PACE
Intermediate
Fixed Income
Investments | | PACE
Strategic
Fixed Income
Investments | |
Assets: | |
Investments in unaffiliated securities, at value (cost—$130,996,901; $813,886,965; $414,717,444;
$1,022,187,413; $393,461,914; $569,756,430 and $417,903,157, respectively)1 | | $ | 130,996,901 | | | $ | 821,133,743 | | | $ | 414,905,493 | | | $ | 1,021,473,045 | | |
Investments of cash collateral in affiliated issuer from securities loaned, at value (cost—$0; $0;
$15,390,673; $14,444,243; $0; $3,074,700 and $84,978,673, respectively) | | | — | | | | — | | | | 15,390,673 | | | | 14,444,243 | | |
Repurchase agreements, at value (cost—$37,441,000; $254,000; $5,394,000; $8,790,000;
$0; $4,125,000 and $14,021,000, respectively) | | | 37,441,000 | | | | 254,000 | | | | 5,394,000 | | | | 8,790,000 | | |
Total investments in securities, at value (cost—$168,437,901; $814,140,965;
$435,502,117; $1,045,421,656; $393,461,914; $576,956,130 and $516,902,830,
respectively) | | $ | 168,437,901 | | | $ | 821,387,743 | | | $ | 435,690,166 | | | $ | 1,044,707,288 | | |
Cash | | | 83 | | | | 7,130 | | | | 1,139 | | | | 197,358 | | |
Cash collateral on futures | | | — | | | | — | | | | 243,064 | | | | 2,441,247 | | |
Cash collateral for forward foreign currency contracts | | | — | | | | — | | | | — | | | | — | | |
Cash collateral on swap agreements | | | — | | | | 781,000 | | | | 451,600 | | | | 2,840,000 | | |
Cash collateral on investments sold short | | | — | | | | — | | | | — | | | | — | | |
Foreign currency, at value (cost—$0; $0; $458,665; $3,477,231; $0; $998,815 and $7,022,660,
respectively) | | | — | | | | — | | | | 395,264 | | | | 3,472,260 | | |
Receivable for investments sold | | | — | | | | 29,894,347 | | | | 33,052,312 | | | | 3,043,664 | | |
Receivable for investments sold short | | | — | | | | 184,706,094 | | | | — | | | | — | | |
Receivable for shares of beneficial interest sold | | | 447,855 | | | | 662,604 | | | | 490,274 | | | | 938,564 | | |
Receivable from affiliate | | | 38,707 | | | | — | | | | — | | | | — | | |
Receivable for when issued TBA securities | | | — | | | | 270,285,305 | | | | — | | | | 1,052,734 | | |
Receivable for interest | | | 33,416 | | | | 1,386,024 | | | | 2,076,462 | | | | 7,022,839 | | |
Swap agreements, at value2 | | | — | | | | — | | | | — | | | | 116,149 | | |
Due from broker | | | — | | | | — | | | | 112,211 | | | | 1,256,791 | | |
Unrealized appreciation on forward foreign currency contracts | | | — | | | | — | | | | 98,868 | | | | 2,860,832 | | |
Receivable for variation margin on futures contracts | | | — | | | | — | | | | 107,386 | | | | 28,215 | | |
Receivable for foreign tax reclaims | | | — | | | | — | | | | 222 | | | | — | | |
Receivable for variation margin on centrally cleared swap agreements | | | — | | | | 84,310 | | | | — | | | | — | | |
Other assets | | | 17,062 | | | | 31,657 | | | | 30,348 | | | | 37,998 | | |
Total assets | | | 168,975,024 | | | | 1,309,226,214 | | | | 472,749,316 | | | | 1,070,015,939 | | |
Liabilities: | |
Payable for shares of beneficial interest repurchased | | | 232,650 | | | | 712,082 | | | | 601,798 | | | | 968,630 | | |
Payable to custodian | | | 1,590 | | | | 19,734 | | | | 17,852 | | | | 44,446 | | |
Dividends payable to shareholders | | | 790 | | | | — | | | | — | | | | — | | |
Payable for when issued TBA securities | | | — | | | | 596,137,996 | | | | — | | | | 7,766,180 | | |
Investments sold short, at value (proceeds—$0; $171,712,656; $3,168,734; $0; $0; $0 and
$0, respectively) | | | — | | | | 173,397,996 | | | | 3,191,484 | | | | — | | |
Payable for investments purchased | | | — | | | | 6,612,504 | | | | 26,608,404 | | | | 6,876,722 | | |
Options and swaptions written, at value (premiums received $0; $2,083,101; $847,243;
$951,017; $0; $0 and $0, respectively) | | | — | | | | 1,649,132 | | | | 599,595 | | | | 560,949 | | |
Due to broker | | | — | | | | 619,986 | | | | 11,541 | | | | 1,540,216 | | |
Payable to affiliate | | | — | | | | 240,045 | | | | 115,946 | | | | 466,181 | | |
Swap agreements, at value2 | | | — | | | | 33,147 | | | | 250 | | | | 818,996 | | |
Payable for cash collateral from securities loaned | | | — | | | | — | | | | 15,390,673 | | | | 14,444,243 | | |
Payable for variation margin on centrally cleared swap agreements | | | — | | | | — | | | | 180,738 | | | | 197,995 | | |
Unrealized depreciation on forward foreign currency contracts | | | — | | | | — | | | | 41,452 | | | | 1,639,760 | | |
Payable for variation margin on futures contracts | | | — | | | | — | | | | 17,401 | | | | 601,509 | | |
Payable for dividend and interest expense on investments sold short | | | — | | | | — | | | | 4,000 | | | | — | | |
Payable for treasury roll transactions | | | — | | | | — | | | | — | | | | 112,349,754 | | |
Deferred payable for treasury roll transactions | | | — | | | | — | | | | — | | | | 28,563 | | |
Payable for foreign withholding taxes and foreign capital gains taxes | | | — | | | | — | | | | — | | | | — | | |
Accrued expenses and other liabilities | | | 236,877 | | | | 381,267 | | | | 302,257 | | | | 344,306 | | |
Total liabilities | | | 471,907 | | | | 779,803,889 | | | | 47,083,391 | | | | 148,648,450 | | |
1 Includes $0; $0; $15,107,314; $14,189,978; $0; $3,012,751 and $83,055,927, respectively, of investments in securities on loan, at value plus accrued interest and dividends, if any.
2 Net upfront payments received by PACE Mortgage-Backed Securities Fixed Income Investments, PACE Intermediate Fixed Income Investments and PACE Strategic Fixed Income Investments were $18,289, $393 and $991,766, respectively.
262
| | | PACE
Municipal
Fixed Income
Investments | | PACE
International
Fixed Income
Investments | | PACE
High Yield
Investments | |
Assets: | |
Investments in unaffiliated securities, at value (cost—$130,996,901; $813,886,965; $414,717,444;
$1,022,187,413; $393,461,914; $569,756,430 and $417,903,157, respectively)1 | | $ | 407,473,219 | | | $ | 540,705,987 | | | $ | 412,562,772 | | |
Investments of cash collateral in affiliated issuer from securities loaned, at value (cost—$0; $0;
$15,390,673; $14,444,243; $0; $3,074,700 and $84,978,673, respectively) | | | — | | | | 3,074,700 | | | | 84,978,673 | | |
Repurchase agreements, at value (cost—$37,441,000; $254,000; $5,394,000; $8,790,000;
$0; $4,125,000 and $14,021,000, respectively) | | | — | | | | 4,125,000 | | | | 14,021,000 | | |
Total investments in securities, at value (cost—$168,437,901; $814,140,965;
$435,502,117; $1,045,421,656; $393,461,914; $576,956,130 and $516,902,830,
respectively) | | $ | 407,473,219 | | | $ | 547,905,687 | | | $ | 511,562,445 | | |
Cash | | | — | | | | 337 | | | | 273,829 | | |
Cash collateral on futures | | | — | | | | 2,883,613 | | | | — | | |
Cash collateral for forward foreign currency contracts | | | — | | | | — | | | | — | | |
Cash collateral on swap agreements | | | — | | | | — | | | | — | | |
Cash collateral on investments sold short | | | — | | | | — | | | | — | | |
Foreign currency, at value (cost—$0; $0; $458,665; $3,477,231; $0; $998,815 and $7,022,660,
respectively) | | | — | | | | 960,829 | | | | 7,042,129 | | |
Receivable for investments sold | | | 1,805,982 | | | | — | | | | 11,341,229 | | |
Receivable for investments sold short | | | — | | | | — | | | | — | | |
Receivable for shares of beneficial interest sold | | | 208,157 | | | | 584,574 | | | | 519,601 | | |
Receivable from affiliate | | | — | | | | — | | | | — | | |
Receivable for when issued TBA securities | | | — | | | | — | | | | — | | |
Receivable for interest | | | 4,597,486 | | | | 5,555,220 | | | | 7,762,687 | | |
Swap agreements, at value2 | | | — | | | | — | | | | — | | |
Due from broker | | | — | | | | 1,180,801 | | | | — | | |
Unrealized appreciation on forward foreign currency contracts | | | — | | | | 3,059,276 | | | | 796,533 | | |
Receivable for variation margin on futures contracts | | | — | | | | — | | | | — | | |
Receivable for foreign tax reclaims | | | — | | | | 5,906 | | | | — | | |
Receivable for variation margin on centrally cleared swap agreements | | | — | | | | — | | | | — | | |
Other assets | | | 29,215 | | | | 32,566 | | | | 32,996 | | |
Total assets | | | 414,114,059 | | | | 562,168,809 | | | | 539,331,449 | | |
Liabilities: | |
Payable for shares of beneficial interest repurchased | | | 232,105 | | | | 596,483 | | | | 407,374 | | |
Payable to custodian | | | 11,730 | | | | 42,710 | | | | 15,965 | | |
Dividends payable to shareholders | | | — | | | | — | | | | — | | |
Payable for when issued TBA securities | | | — | | | | — | | | | — | | |
Investments sold short, at value (proceeds—$0; $171,712,656; $3,168,734; $0; $0; $0 and
$0, respectively) | | | — | | | | — | | | | — | | |
Payable for investments purchased | | | 3,989,003 | | | | — | | | | 14,764,974 | | |
Options and swaptions written, at value (premiums received $0; $2,083,101; $847,243;
$951,017; $0; $0 and $0, respectively) | | | — | | | | — | | | | — | | |
Due to broker | | | — | | | | — | | | | — | | |
Payable to affiliate | | | 192,494 | | | | 328,043 | | | | 257,310 | | |
Swap agreements, at value2 | | | — | | | | — | | | | — | | |
Payable for cash collateral from securities loaned | | | — | | | | 3,074,700 | | | | 84,978,673 | | |
Payable for variation margin on centrally cleared swap agreements | | | — | | | | — | | | | — | | |
Unrealized depreciation on forward foreign currency contracts | | | — | | | | 2,979,558 | | | | 182,560 | | |
Payable for variation margin on futures contracts | | | — | | | | 401,703 | | | | — | | |
Payable for dividend and interest expense on investments sold short | | | — | | | | — | | | | — | | |
Payable for treasury roll transactions | | | — | | | | — | | | | — | | |
Deferred payable for treasury roll transactions | | | — | | | | — | | | | — | | |
Payable for foreign withholding taxes and foreign capital gains taxes | | | — | | | | 6,594 | | | | — | | |
Accrued expenses and other liabilities | | | 140,108 | | | | 387,271 | | | | 301,289 | | |
Total liabilities | | | 4,565,440 | | | | 7,817,062 | | | | 100,908,145 | | |
See accompanying notes to financial statements.
263
PACE Select Advisors Trust
Statement of assets and liabilities (continued)
July 31, 2015
| | | PACE
Money Market
Investments | | PACE
Mortgage-Backed
Securities
Fixed Income
Investments | | PACE
Intermediate
Fixed Income
Investments | | PACE
Strategic
Fixed Income
Investments | |
Net assets: | |
Beneficial interest shares of $0.001 par value (unlimited amount authorized) | | $ | 168,502,451 | | | $ | 537,925,111 | | | $ | 421,507,538 | | | $ | 919,108,767 | | |
Accumulated undistributed (distributions in excess of) net investment income | | | — | | | | 395,813 | | | | 1,930,867 | | | | 10,481,898 | | |
Accumulated net realized gain (loss) | | | 666 | | | | (14,745,686 | ) | | | 1,656,763 | | | | (3,851,089 | ) | |
Net unrealized appreciation (depreciation) | | | — | | | | 5,847,087 | | | | 570,757 | | | | (4,372,087 | ) | |
Net assets | | $ | 168,503,117 | | | $ | 529,422,325 | | | $ | 425,665,925 | | | $ | 921,367,489 | | |
Class A | |
Net assets | | $ | — | | | $ | 47,860,355 | | | $ | 19,932,275 | | | $ | 13,699,286 | | |
Shares outstanding | | | — | | | | 3,693,370 | | | | 1,613,166 | | | | 983,310 | | |
Net asset value per share | | $ | — | | | $ | 12.96 | | | $ | 12.36 | | | $ | 13.93 | | |
Maximum offering price per share | | $ | — | | | $ | 13.57 | | | $ | 12.94 | | | $ | 14.60 | | |
Class C | |
Net assets | | $ | — | | | $ | 12,886,608 | | | $ | 1,930,889 | | | $ | 11,752,376 | | |
Shares outstanding | | | — | | | | 993,202 | | | | 156,046 | | | | 843,380 | | |
Net asset value and offering price per share | | $ | — | | | $ | 12.97 | | | $ | 12.37 | | | $ | 13.93 | | |
Class Y | |
Net assets | | $ | — | | | $ | 46,071,249 | | | $ | 444,461 | | | $ | 2,543,303 | | |
Shares outstanding | | | — | | | | 3,554,695 | | | | 35,972 | | | | 182,841 | | |
Net asset value, offering price and redemption value per share1 | | $ | — | | | $ | 12.96 | | | $ | 12.36 | | | $ | 13.91 | | |
Class P | |
Net assets | | $ | 168,503,117 | | | $ | 422,604,113 | | | $ | 403,358,300 | | | $ | 893,372,524 | | |
Shares outstanding | | | 168,501,249 | | | | 32,595,865 | | | | 32,640,319 | | | | 64,156,564 | | |
Net asset value, offering price and redemption value per share1 | | $ | 1.00 | | | $ | 12.96 | | | $ | 12.36 | | | $ | 13.92 | | |
1 Assumes shares were held a sufficient period or are otherwise not subject to a redemption fee.
264
| | | PACE
Municipal
Fixed Income
Investments | | PACE
International
Fixed Income
Investments | | PACE
High Yield
Investments | |
Net assets: | |
Beneficial interest shares of $0.001 par value (unlimited amount authorized) | | $ | 393,774,820 | | | $ | 612,569,975 | | | $ | 454,813,066 | | |
Accumulated undistributed (distributions in excess of) net investment income | | | 1,551 | | | | (10,592,878 | ) | | | (2,903,233 | ) | |
Accumulated net realized gain (loss) | | | 1,760,943 | | | | (18,135,768 | ) | | | (8,789,422 | ) | |
Net unrealized appreciation (depreciation) | | | 14,011,305 | | | | (29,489,582 | ) | | | (4,697,107 | ) | |
Net assets | | $ | 409,548,619 | | | $ | 554,351,747 | | | $ | 438,423,304 | | |
Class A | |
Net assets | | $ | 53,922,551 | | | $ | 44,725,116 | | | $ | 5,330,173 | | |
Shares outstanding | | | 4,103,468 | | | | 4,497,471 | | | | 549,673 | | |
Net asset value per share | | $ | 13.14 | | | $ | 9.94 | | | $ | 9.70 | | |
Maximum offering price per share | | $ | 13.76 | | | $ | 10.41 | | | $ | 10.16 | | |
Class C | |
Net assets | | $ | 10,388,313 | | | $ | 2,994,289 | | | $ | 3,913,490 | | |
Shares outstanding | | | 790,381 | | | | 300,897 | | | | 403,983 | | |
Net asset value and offering price per share | | $ | 13.14 | | | $ | 9.95 | | | $ | 9.69 | | |
Class Y | |
Net assets | | $ | 80,631 | | | $ | 4,510,277 | | | $ | 1,118,558 | | |
Shares outstanding | | | 6,131 | | | | 454,999 | | | | 114,975 | | |
Net asset value, offering price and redemption value per share1 | | $ | 13.15 | | | $ | 9.91 | | | $ | 9.73 | | |
Class P | |
Net assets | | $ | 345,157,124 | | | $ | 502,122,065 | | | $ | 428,061,083 | | |
Shares outstanding | | | 26,256,692 | | | | 50,500,716 | | | | 44,050,131 | | |
Net asset value, offering price and redemption value per share1 | | $ | 13.15 | | | $ | 9.94 | | | $ | 9.72 | | |
See accompanying notes to financial statements.
265
PACE Select Advisors Trust
Statement of assets and liabilities (continued)
July 31, 2015
| | | PACE
Large Co
Value Equity
Investments | | PACE
Large Co
Growth Equity
Investments | | PACE
Small/Medium Co
Value Equity
Investments | | PACE
Small/Medium Co
Growth Equity
Investments | |
Assets: | |
Investments in unaffiliated securities, at value (cost—$1,442,331,342; $1,097,639,567;
$489,834,310; $464,947,181; $1,129,265,857; $449,072,380; $145,245,207 and
$719,835,660, respectively)1 | | $ | 1,564,146,062 | | | $ | 1,417,473,642 | | | $ | 534,612,272 | | | $ | 565,345,292 | | |
Investments of cash collateral in affiliated issuer from securities loaned, at value
(cost—$6,993,833; $3,716,848; $30,655,405; $93,660,105; $29,746,054; $24,172,620;
$1,874,653 and $0, respectively) | | | 6,993,833 | | | | 3,716,848 | | | | 30,655,405 | | | | 93,660,105 | | |
Repurchase agreements, at value (cost—$30,013,000; $6,670,000; $10,918,000; $12,843,000;
$11,262,000; $9,102,000; $1,247,000 and $62,118,000, respectively) | | | 30,013,000 | | | | 6,670,000 | | | | 10,918,000 | | | | 12,843,000 | | |
Total investments in securities, at value (cost—$1,479,338,175; $1,108,026,415;
$531,407,715; $571,450,286; $1,170,273,911; $482,347,000; $148,366,860 and
$781,953,660, respectively) | | $ | 1,601,152,895 | | | $ | 1,427,860,490 | | | $ | 576,185,677 | | | $ | 671,848,397 | | |
Cash | | | — | | | | — | | | | 1,439 | | | | 159,017 | | |
Cash collateral on futures | | | — | | | | — | | | | — | | | | — | | |
Cash collateral for forward foreign currency contracts | | | — | | | | — | | | | — | | | | — | | |
Cash collateral on swap agreements | | | — | | | | — | | | | — | | | | — | | |
Cash collateral on options written | | | — | | | | — | | | | — | | | | — | | |
Cash collateral on investments sold short | | | 18,140,679 | | | | — | | | | — | | | | — | | |
Foreign currency, at value (cost—$0; $0; $0; $0; $123,462; $2,536,952; $43,910 and
$874,925, respectively) | | | — | | | | — | | | | — | | | | — | | |
Receivable for investments sold | | | 4,287,080 | | | | 5,550,192 | | | | 10,374,239 | | | | 10,436,249 | | |
Receivable for investments sold short | | | 2,706,369 | | | | — | | | | — | | | | — | | |
Receivable for shares of beneficial interest sold | | | 673,044 | | | | 640,708 | | | | 402,534 | | | | 333,732 | | |
Receivable for dividends | | | 1,291,782 | | | | 214,549 | | | | 161,331 | | | | 65,216 | | |
Swap agreements, at value2 | | | — | | | | — | | | | — | | | | — | | |
Receivable for variation margin on futures contracts | | | — | | | | — | | | | — | | | | — | | |
Receivable for variation margin on swap agreements | | | — | | | | — | | | | — | | | | — | | |
Due from broker | | | — | | | | — | | | | — | | | | — | | |
Unrealized appreciation on forward foreign currency contracts | | | — | | | | — | | | | — | | | | — | | |
Receivable for foreign tax reclaims | | | 2,282 | | | | 55,970 | | | | — | | | | — | | |
Other assets | | | 44,772 | | | | 44,013 | | | | 30,565 | | | | 30,095 | | |
Total assets | | | 1,628,298,903 | | | | 1,434,365,922 | | | | 587,155,785 | | | | 682,872,706 | | |
Liabilities: | |
Investments sold short, at value (proceeds—$181,303,197; $0; $0; $0; $124,090,046; $0; $0
and $61,932,779, respectively) | | | 186,669,830 | | | | — | | | | — | | | | — | | |
Payable for investments purchased | | | 7,101,773 | | | | 1,530,990 | | | | 5,077,102 | | | | 9,011,975 | | |
Payable for cash collateral from securities loaned | | | 25,134,512 | | | | 3,716,848 | | | | 30,655,405 | | | | 93,660,105 | | |
Payable for shares of beneficial interest repurchased | | | 1,122,981 | | | | 1,114,580 | | | | 520,671 | | | | 578,050 | | |
Payable to affiliate | | | 909,883 | | | | 937,700 | | | | 385,513 | | | | 375,726 | | |
Payable for dividend and interest expense on investments sold short | | | 154,629 | | | | — | | | | — | | | | — | | |
Payable to custodian | | | 49,431 | | | | 395,893 | | | | 18,324 | | | | 18,844 | | |
Payable for foreign withholding taxes and foreign capital gains taxes | | | — | | | | — | | | | 2,361 | | | | — | | |
Deferred foreign capital gain taxes payable | | | — | | | | — | | | | — | | | | — | | |
Unrealized depreciation on forward foreign currency contracts | | | — | | | | — | | | | — | | | | — | | |
Due to broker | | | — | | | | — | | | | — | | | | — | | |
Options and swaptions written, at value (premiums received $0; $0; $0; $0; $0; $0; $0 and
$1,621,815, respectively) | | | — | | | | — | | | | — | | | | — | | |
Payable for variation margin on futures contracts | | | — | | | | — | | | | — | | | | — | | |
Accrued expenses and other liabilities | | | 527,057 | | | | 390,992 | | | | 363,465 | | | | 364,487 | | |
Total liabilities | | | 221,670,096 | | | | 8,087,003 | | | | 37,022,841 | | | | 104,009,187 | | |
1 Includes $35,148,808; $76,061,339; $120,693,659; $143,430,284; $74,548,307; $24,407,378; $9,544,975 and $0, respectively, of investments in securities on loan, at value plus accrued interest and dividends, if any.
2 Net upfront payments made by PACE Alternative Strategies Investments were $0.
266
| | | PACE
International
Equity
Investments | | PACE
International
Emerging
Markets Equity
Investments | | PACE
Global
Real Estate
Securities
Investments | | PACE
Alternative
Strategies
Investments | |
Assets: | |
Investments in unaffiliated securities, at value (cost—$1,442,331,342; $1,097,639,567;
$489,834,310; $464,947,181; $1,129,265,857; $449,072,380; $145,245,207 and
$719,835,660, respectively)1 | | $ | 1,187,273,474 | | | $ | 422,335,991 | | | $ | 147,032,070 | | | $ | 719,024,712 | | |
Investments of cash collateral in affiliated issuer from securities loaned, at value
(cost—$6,993,833; $3,716,848; $30,655,405; $93,660,105; $29,746,054; $24,172,620;
$1,874,653 and $0, respectively) | | | 29,746,054 | | | | 24,172,620 | | | | 1,874,653 | | | | — | | |
Repurchase agreements, at value (cost—$30,013,000; $6,670,000; $10,918,000; $12,843,000;
$11,262,000; $9,102,000; $1,247,000 and $62,118,000, respectively) | | | 11,262,000 | | | | 9,102,000 | | | | 1,247,000 | | | | 62,118,000 | | |
Total investments in securities, at value (cost—$1,479,338,175; $1,108,026,415;
$531,407,715; $571,450,286; $1,170,273,911; $482,347,000; $148,366,860 and
$781,953,660, respectively) | | $ | 1,228,281,528 | | | $ | 455,610,611 | | | $ | 150,153,723 | | | $ | 781,142,712 | | |
Cash | | | 1,786 | | | | 2,137 | | | | 632,988 | | | | 197,898 | | |
Cash collateral on futures | | | — | | | | — | | | | — | | | | 6,382,853 | | |
Cash collateral for forward foreign currency contracts | | | — | | | | — | | | | — | | | | 950,429 | | |
Cash collateral on swap agreements | | | — | | | | — | | | | — | | | | 1,637,402 | | |
Cash collateral on options written | | | — | | | | — | | | | — | | | | 444,115 | | |
Cash collateral on investments sold short | | | 42,534,764 | | | | — | | | | — | | | | 51,445,503 | | |
Foreign currency, at value (cost—$0; $0; $0; $0; $123,462; $2,536,952; $43,910 and
$874,925, respectively) | | | 123,445 | | | | 2,527,496 | | | | 43,745 | | | | 870,401 | | |
Receivable for investments sold | | | 1,437,762 | | | | 2,689,105 | | | | 1,080,418 | | | | 4,877,969 | | |
Receivable for investments sold short | | | — | | | | — | | | | — | | | | — | | |
Receivable for shares of beneficial interest sold | | | 848,524 | | | | 632,894 | | | | 123,753 | | | | 1,094,240 | | |
Receivable for dividends | | | 1,773,413 | | | | 1,404,303 | | | | 200,513 | | | | 850,622 | | |
Swap agreements, at value2 | | | — | | | | — | | | | — | | | | 459,926 | | |
Receivable for variation margin on futures contracts | | | — | | | | — | | | | — | | | | 2,959,648 | | |
Receivable for variation margin on swap agreements | | | — | | | | — | | | | — | | | | 7,329 | | |
Due from broker | | | — | | | | — | | | | — | | | | 8,010,671 | | |
Unrealized appreciation on forward foreign currency contracts | | | — | | | | — | | | | — | | | | 22,379,307 | | |
Receivable for foreign tax reclaims | | | 1,360,622 | | | | — | | | | 11,709 | | | | 48,164 | | |
Other assets | | | 39,737 | | | | 30,752 | | | | 18,444 | | | | 43,954 | | |
Total assets | | | 1,276,401,581 | | | | 462,897,298 | | | | 152,265,293 | | | | 883,803,143 | | |
Liabilities: | |
Investments sold short, at value (proceeds—$181,303,197; $0; $0; $0; $124,090,046; $0; $0
and $61,932,779, respectively) | | | 128,425,666 | | | | — | | | | — | | | | 52,818,467 | | |
Payable for investments purchased | | | 705,756 | | | | 3,794,061 | | | | 708,520 | | | | 2,374,855 | | |
Payable for cash collateral from securities loaned | | | 72,280,818 | | | | 24,172,620 | | | | 1,874,653 | | | | — | | |
Payable for shares of beneficial interest repurchased | | | 965,000 | | | | 417,960 | | | | 148,548 | | | | 1,611,165 | | |
Payable to affiliate | | | 782,893 | | | | 383,192 | | | | 58,624 | | | | 885,520 | | |
Payable for dividend and interest expense on investments sold short | | | 155,502 | | | | — | | | | — | | | | 55,956 | | |
Payable to custodian | | | 84,915 | | | | 70,065 | | | | 9,417 | | | | 47,243 | | |
Payable for foreign withholding taxes and foreign capital gains taxes | | | 231,344 | | | | 525,233 | | | | 81,915 | | | | 4,156 | | |
Deferred foreign capital gain taxes payable | | | — | | | | 246,716 | | | | — | | | | — | | |
Unrealized depreciation on forward foreign currency contracts | | | — | | | | — | | | | — | | | | 16,701,747 | | |
Due to broker | | | — | | | | — | | | | — | | | | 5,946,306 | | |
Options and swaptions written, at value (premiums received $0; $0; $0; $0; $0; $0; $0 and
$1,621,815, respectively) | | | — | | | | — | | | | — | | | | 712,329 | | |
Payable for variation margin on futures contracts | | | — | | | | — | | | | — | | | | 410,907 | | |
Accrued expenses and other liabilities | | | 573,936 | | | | 402,439 | | | | 303,439 | | | | 310,214 | | |
Total liabilities | | | 204,205,830 | | | | 30,012,286 | | | | 3,185,116 | | | | 81,878,865 | | |
See accompanying notes to financial statements.
267
PACE Select Advisors Trust
Statement of assets and liabilities (concluded)
July 31, 2015
| | | PACE
Large Co
Value Equity
Investments | | PACE
Large Co
Growth Equity
Investments | | PACE
Small/Medium Co
Value Equity
Investments | | PACE
Small/Medium Co
Growth Equity
Investments | |
Net assets: | |
Beneficial interest shares of $0.001 par value (unlimited amount authorized) | | $ | 1,155,929,583 | | | $ | 932,471,129 | | | $ | 461,432,323 | | | $ | 406,963,142 | | |
Accumulated undistributed (distributions in excess of) net investment income | | | 10,191,229 | | | | 1,878,487 | | | | 1,948,504 | | | | 158,706 | | |
Accumulated net realized gain (loss) | | | 124,059,908 | | | | 172,095,228 | | | | 41,974,155 | | | | 71,343,560 | | |
Net unrealized appreciation (depreciation) | | | 116,448,087 | | | | 319,834,075 | | | | 44,777,962 | | | | 100,398,111 | | |
Net assets | | $ | 1,406,628,807 | | | $ | 1,426,278,919 | | | $ | 550,132,944 | | | $ | 578,863,519 | | |
Class A | |
Net assets | | $ | 124,197,574 | | | $ | 46,777,014 | | | $ | 18,334,067 | | | $ | 28,386,433 | | |
Shares outstanding | | | 5,236,791 | | | | 1,782,726 | | | | 881,044 | | | | 1,388,064 | | |
Net asset value per share | | $ | 23.72 | | | $ | 26.24 | | | $ | 20.81 | | | $ | 20.45 | | |
Maximum offering price per share | | $ | 25.10 | | | $ | 27.77 | | | $ | 22.02 | | | $ | 21.64 | | |
Class C | |
Net assets | | $ | 14,500,111 | | | $ | 4,104,473 | | | $ | 4,842,534 | | | $ | 4,116,290 | | |
Shares outstanding | | | 612,146 | | | | 180,099 | | | | 269,238 | | | | 240,647 | | |
Net asset value and offering price per share | | $ | 23.69 | | | $ | 22.79 | | | $ | 17.99 | | | $ | 17.11 | | |
Class Y | |
Net assets | | $ | 19,592,963 | | | $ | 16,173,841 | | | $ | 997,523 | | | $ | 843,788 | | |
Shares outstanding | | | 824,030 | | | | 599,479 | | | | 46,435 | | | | 38,936 | | |
Net asset value, offering price and redemption value per share1 | | $ | 23.78 | | | $ | 26.98 | | | $ | 21.48 | | | $ | 21.67 | | |
Class P | |
Net assets | | $ | 1,248,338,159 | | | $ | 1,359,223,591 | | | $ | 525,958,820 | | | $ | 545,517,008 | | |
Shares outstanding | | | 52,707,544 | | | | 50,666,767 | | | | 24,697,669 | | | | 25,489,384 | | |
Net asset value, offering price and redemption value per share1 | | $ | 23.68 | | | $ | 26.83 | | | $ | 21.30 | | | $ | 21.40 | | |
1 Assumes shares were held a sufficient period or are otherwise not subject to a redemption fee.
268
| | | PACE
International
Equity
Investments | | PACE
International
Emerging
Markets Equity
Investments | | PACE
Global
Real Estate
Securities
Investments | | PACE
Alternative
Strategies
Investments | |
Net assets: | |
Beneficial interest shares of $0.001 par value (unlimited amount authorized) | | $ | 1,163,263,982 | | | $ | 483,395,432 | | | $ | 151,963,013 | | | $ | 804,742,599 | | |
Accumulated undistributed (distributions in excess of) net investment income | | | 11,988,150 | | | | 4,022,237 | | | | 1,526,729 | | | | 20,453,216 | | |
Accumulated net realized gain (loss) | | | (156,664,121 | ) | | | (27,571,368 | ) | | | (6,192,001 | ) | | | (40,283,603 | ) | |
Net unrealized appreciation (depreciation) | | | 53,607,740 | | | | (26,961,289 | ) | | | 1,782,436 | | | | 17,012,066 | | |
Net assets | | $ | 1,072,195,751 | | | $ | 432,885,012 | | | $ | 149,080,177 | | | $ | 801,924,278 | | |
Class A | |
Net assets | | $ | 33,881,578 | | | $ | 4,706,900 | | | $ | 362,917 | | | $ | 7,407,863 | | |
Shares outstanding | | | 2,252,441 | | | | 398,713 | | | | 48,350 | | | | 667,619 | | |
Net asset value per share | | $ | 15.04 | | | $ | 11.81 | | | $ | 7.51 | | | $ | 11.10 | | |
Maximum offering price per share | | $ | 15.92 | | | $ | 12.50 | | | $ | 7.95 | | | $ | 11.75 | | |
Class C | |
Net assets | | $ | 2,744,157 | | | $ | 1,660,661 | | | $ | 340,075 | | | $ | 9,384,550 | | |
Shares outstanding | | | 186,450 | | | | 152,000 | | | | 47,186 | | | | 880,182 | | |
Net asset value and offering price per share | | $ | 14.72 | | | $ | 10.93 | | | $ | 7.21 | | | $ | 10.66 | | |
Class Y | |
Net assets | | $ | 19,149,942 | | | $ | 8,766,501 | | | $ | 281,044 | | | $ | 2,449,135 | | |
Shares outstanding | | | 1,276,915 | | | | 732,570 | | | | 38,500 | | | | 220,247 | | |
Net asset value, offering price and redemption value per share1 | | $ | 15.00 | | | $ | 11.97 | | | $ | 7.30 | | | $ | 11.12 | | |
Class P | |
Net assets | | $ | 1,016,420,074 | | | $ | 417,750,950 | | | $ | 148,096,141 | | | $ | 782,682,730 | | |
Shares outstanding | | | 67,915,152 | | | | 35,079,577 | | | | 20,350,060 | | | | 70,573,041 | | |
Net asset value, offering price and redemption value per share1 | | $ | 14.97 | | | $ | 11.91 | | | $ | 7.28 | | | $ | 11.09 | | |
See accompanying notes to financial statements.
269
PACE Select Advisors Trust
Statement of operations
For the year ended July 31, 2015
| | | PACE
Money Market
Investments | | PACE
Mortgage-Backed
Securities
Fixed Income
Investments | | PACE
Intermediate
Fixed Income
Investments | | PACE
Strategic
Fixed Income
Investments | |
Investment income: | |
Dividends | | $ | — | | | $ | — | | | $ | 92,524 | | | $ | 603,986 | | |
Interest (net of foreign withholding taxes of $0; $1,225; $0; $8,221; $0; $10,534 and
$0, respectively) | | $ | 319,012 | | | $ | 10,207,901 | | | $ | 9,488,454 | | | | 32,447,781 | | |
Securities lending income (includes $0; $0; $2,762; $825; $0; $66 and $5,753, respectively
earned from an affiliated entity) | | | — | | | | — | | | | 121,657 | | | | 12,083 | | |
| | | | 319,012 | | | | 10,207,901 | | | | 9,702,635 | | | | 33,063,850 | | |
Expenses: | |
Investment management and administration fees | | | 734,053 | | | | 3,429,807 | | | | 2,338,491 | | | | 5,636,026 | | |
Service fees–Class A | | | — | | | | 133,553 | | | | 59,098 | | | | 62,792 | | |
Service and distribution fees–Class C | | | — | | | | 100,170 | | | | 15,464 | | | | 102,860 | | |
Transfer agency and related services fees | | | 888,603 | | | | 872,995 | | | | 687,226 | | | | 972,078 | | |
Professional fees | | | 116,055 | | | | 199,965 | | | | 251,357 | | | | 223,469 | | |
Reports and notices to shareholders | | | 94,667 | | | | 48,934 | | | | 49,394 | | | | 60,341 | | |
State registration fees | | | 30,071 | | | | 58,289 | | | | 54,813 | | | | 62,900 | | |
Trustees' fees | | | 26,200 | | | | 32,622 | | | | 30,305 | | | | 40,274 | | |
Custody and accounting fees | | | 20,391 | | | | 233,806 | | | | 217,792 | | | | 515,963 | | |
Insurance expense | | | 6,339 | | | | 14,887 | | | | 11,760 | | | | 24,868 | | |
Interest expense | | | — | | | | — | | | | 3,112 | | | | 187,353 | | |
Other expenses | | | 27,969 | | | | 41,023 | | | | 22,977 | | | | 38,300 | | |
| | | | 1,944,348 | | | | 5,166,051 | | | | 3,741,789 | | | | 7,927,224 | | |
Fee waivers and/or expense reimbursements | | | (1,646,346 | ) | | | (950,844 | ) | | | (663,625 | ) | | | (189,928 | ) | |
Recoupment of fees waived or expenses previously reimbursed | | | — | | | | — | | | | — | | | | — | | |
Net expenses | | | 298,002 | | | | 4,215,207 | | | | 3,078,164 | | | | 7,737,296 | | |
Net investment income | | | 21,010 | | | | 5,992,694 | | | | 6,624,471 | | | | 25,326,554 | | |
Net realized and unrealized gains (losses) from investment activities: | |
Net realized gains (losses) from: | |
Investments | | | 1,868 | | | | 8,942,280 | | | | 2,110,998 | | | | 13,102,774 | | |
Futures | | | — | | | | (19,173 | ) | | | 310,505 | | | | (6,041,243 | ) | |
Options and swaptions written | | | — | | | | 1,244,707 | | | | 203,356 | | | | 545,287 | | |
Investments sold short | | | — | | | | (467,772 | ) | | | — | | | | — | | |
Swap agreements | | | — | | | | (958,073 | ) | | | (201,546 | ) | | | 8,442,554 | | |
Forward foreign currency contracts | | | — | | | | — | | | | 529,749 | | | | 21,562,285 | | |
Foreign currency transactions | | | — | | | | — | | | | (40,041 | ) | | | 130,174 | | |
Net realized gain (loss) | | | 1,868 | | | | 8,741,969 | | | | 2,913,021 | | | | 37,741,831 | | |
Net change in unrealized appreciation/depreciation of: | |
Investments in unaffiliated issuers | | | — | | | | 3,507,406 | | | | (1,622,995 | ) | | | (30,752,063 | ) | |
Futures | | | — | | | | — | | | | 276,792 | | | | 1,042,920 | | |
Options and swaptions written | | | — | | | | 387,659 | | | | (20,400 | ) | | | 117,336 | | |
Investments sold short | | | — | | | | (1,671,340 | ) | | | (22,750 | ) | | | (1,179 | ) | |
Swap agreements | | | — | | | | (165,312 | ) | | | 13,222 | | | | (7,598,726 | ) | |
Forward foreign currency contracts | | | — | | | | — | | | | 8,477 | | | | 1,033,438 | | |
Other assets and liabilities denominated in foreign currency | | | — | | | | — | | | | (70,549 | ) | | | (45,069 | ) | |
Net change in unrealized appreciation/depreciation | | | — | | | | 2,058,413 | | | | (1,438,203 | ) | | | (36,203,343 | ) | |
Net realized and unrealized gain (loss) from investment activities | | | 1,868 | | | | 10,800,382 | | | | 1,474,818 | | | | 1,538,488 | | |
Net increase in net assets resulting from operations | | $ | 22,878 | | | $ | 16,793,076 | | | $ | 8,099,289 | | | $ | 26,865,042 | | |
270
| | | PACE
Municipal
Fixed Income
Investments | | PACE
International
Fixed Income
Investments | | PACE
High Yield
Investments | |
Investment income: | |
Dividends | | $ | — | | | $ | — | | | $ | 53,217 | | |
Interest (net of foreign withholding taxes of $0; $1,225; $0; $8,221; $0; $10,534 and
$0, respectively) | | | 13,636,746 | | | | 15,710,653 | | | | 28,681,630 | | |
Securities lending income (includes $0; $0; $2,762; $825; $0; $66 and $5,753, respectively
earned from an affiliated entity) | | | — | | | | 1,105 | | | | 171,672 | | |
| | | | 13,636,746 | | | | 15,711,758 | | | | 28,906,519 | | |
Expenses: | |
Investment management and administration fees | | | 2,180,487 | | | | 4,316,267 | | | | 3,600,276 | | |
Service fees–Class A | | | 146,215 | | | | 131,078 | | | | 29,608 | | |
Service and distribution fees–Class C | | | 81,816 | | | | 29,532 | | | | 35,066 | | |
Transfer agency and related services fees | | | 153,991 | | | | 984,509 | | | | 744,328 | | |
Professional fees | | | 149,664 | | | | 192,006 | | | | 164,597 | | |
Reports and notices to shareholders | | | 17,669 | | | | 57,291 | | | | 48,718 | | |
State registration fees | | | 53,955 | | | | 58,847 | | | | 56,763 | | |
Trustees' fees | | | 29,762 | | | | 33,043 | | | | 30,570 | | |
Custody and accounting fees | | | 138,525 | | | | 524,012 | | | | 194,399 | | |
Insurance expense | | | 10,526 | | | | 15,187 | | | | 11,542 | | |
Interest expense | | | — | | | | 17,834 | | | | — | | |
Other expenses | | | 31,025 | | | | 34,859 | | | | 31,973 | | |
| | | | 2,993,635 | | | | 6,394,465 | | | | 4,947,840 | | |
Fee waivers and/or expense reimbursements | | | (96,259 | ) | | | (612,159 | ) | | | (254,272 | ) | |
Recoupment of fees waived or expenses previously reimbursed | | | 2,788 | | | | 127,756 | | | | — | | |
Net expenses | | | 2,900,164 | | | | 5,910,062 | | | | 4,693,568 | | |
Net investment income | | | 10,736,582 | | | | 9,801,696 | | | | 24,212,951 | | |
Net realized and unrealized gains (losses) from investment activities: | |
Net realized gains (losses) from: | |
Investments | | | 2,565,096 | | | | (5,857,065 | ) | | | (10,743,708 | ) | |
Futures | | | — | | | | 1,683,637 | | | | (1,202,691 | ) | |
Options and swaptions written | | | — | | | | — | | | | — | | |
Investments sold short | | | — | | | | — | | | | — | | |
Swap agreements | | | — | | | | — | | | | — | | |
Forward foreign currency contracts | | | — | | | | 17,798,465 | | | | 9,799,408 | | |
Foreign currency transactions | | | — | | | | (2,842,254 | ) | | | (471,554 | ) | |
Net realized gain (loss) | | | 2,565,096 | | | | 10,782,783 | | | | (2,618,545 | ) | |
Net change in unrealized appreciation/depreciation of: | |
Investments in unaffiliated issuers | | | (3,970,786 | ) | | | (45,903,668 | ) | | | (30,857,628 | ) | |
Futures | | | — | | | | (2,363,561 | ) | | | (245,048 | ) | |
Options and swaptions written | | | — | | | | — | | | | — | | |
Investments sold short | | | — | | | | — | | | | — | | |
Swap agreements | | | — | | | | — | | | | — | | |
Forward foreign currency contracts | | | — | | | | (1,762,307 | ) | | | (557,435 | ) | |
Other assets and liabilities denominated in foreign currency | | | — | | | | 4,597 | | | | 47,026 | | |
Net change in unrealized appreciation/depreciation | | | (3,970,786 | ) | | | (50,024,939 | ) | | | (31,613,085 | ) | |
Net realized and unrealized gain (loss) from investment activities | | | (1,405,690 | ) | | | (39,242,156 | ) | | | (34,231,630 | ) | |
Net increase in net assets resulting from operations | | $ | 9,330,892 | | | $ | (29,440,460 | ) | | $ | (10,018,679 | ) | |
See accompanying notes to financial statements.
271
PACE Select Advisors Trust
Statement of operations (concluded)
For the year ended July 31, 2015
| | | PACE
Large Co
Value Equity
Investments | | PACE
Large Co
Growth Equity
Investments | | PACE
Small/Medium Co
Value Equity
Investments | | PACE
Small/Medium Co
Growth Equity
Investments | |
Investment income: | |
Dividends (net of foreign withholding taxes of $167,784; $26,137; $28,863; $19,329;
$3,107,729; $1,319,218; $81,226 and $141,133, respectively) | | $ | 35,109,182 | | | $ | 8,340,437 | | | $ | 9,448,160 | | | $ | 2,160,088 | | |
Interest (net of foreign withholding taxes of $0; $0; $0; $0; $0; $0; $0 and
$0, respectively) | | | — | | | | — | | | | — | | | | — | | |
Securities lending income (includes $246; $733; $3,269; $8,354; $4,152; $2,894; $272 and
$0, respectively earned from an affiliated entity) | | | 51,844 | | | | 63,513 | | | | 229,321 | | | | 558,156 | | |
| | | | 35,161,026 | | | | 8,403,950 | | | | 9,677,481 | | | | 2,718,244 | | |
Expenses: | |
Investment management and administration fees | | | 10,761,752 | | | | 10,931,604 | | | | 4,440,700 | | | | 4,364,812 | | |
Service fees–Class A | | | 347,259 | | | | 135,006 | | | | 58,730 | | | | 80,220 | | |
Service and distribution fees–Class C | | | 153,581 | | | | 41,576 | | | | 50,996 | | | | 40,324 | | |
Dividend expense, interest expense and other borrowing costs for investments sold short | | | 5,021,766 | | | | — | | | | — | | | | — | | |
Transfer agency and related services fees | | | 1,151,381 | | | | 1,086,761 | | | | 1,031,570 | | | | 1,036,814 | | |
Custody and accounting fees | | | 563,119 | | | | 544,662 | | | | 215,481 | | | | 211,697 | | |
Professional fees | | | 211,135 | | | | 158,219 | | | | 148,419 | | | | 152,819 | | |
Reports and notices to shareholders | | | 101,209 | | | | 76,865 | | | | 55,676 | | | | 80,440 | | |
State registration fees | | | 66,327 | | | | 66,642 | | | | 55,931 | | | | 55,517 | | |
Trustees' fees | | | 49,978 | | | | 49,089 | | | | 32,685 | | | | 32,865 | | |
Insurance expense | | | 38,498 | | | | 36,696 | | | | 14,417 | | | | 14,409 | | |
Interest expense | | | 436 | | | | 2,318 | | | | — | | | | — | | |
Other expenses | | | 46,152 | | | | 45,736 | | | | 31,145 | | | | 28,686 | | |
| | | | 18,512,593 | | | | 13,175,174 | | | | 6,135,750 | | | | 6,098,603 | | |
Fee waivers and/or expense reimbursements | | | (126,640 | ) | | | (51,423 | ) | | | — | | | | (183,285 | ) | |
Recoupment of fees waived or expenses previously reimbursed | | | — | | | | — | | | | — | | | | 216,274 | | |
Net expenses | | | 18,385,953 | | | | 13,123,751 | | | | 6,135,750 | | | | 6,131,592 | | |
Net investment income (loss) | | | 16,775,073 | | | | (4,719,801 | ) | | | 3,541,731 | | | | (3,413,348 | ) | |
Net realized and unrealized gains (losses) from investment activities: | |
Net realized gains from: | |
Investments (net of foreign tax expense of $0; $0; $0; $0; $0; $450,157; $0 and
$0, respectively) | | | 165,854,367 | | | | 235,265,227 | | | | 48,484,216 | | | | 79,663,110 | | |
Futures | | | — | | | | — | | | | — | | | | — | | |
Options and swaptions written | | | — | | | | — | | | | — | | | | — | | |
Investments sold short | | | (860,746 | ) | | | — | | | | — | | | | — | | |
Swap agreements | | | — | | | | — | | | | — | | | | — | | |
Forward foreign currency contracts | | | — | | | | — | | | | — | | | | — | | |
Foreign currency transactions | | | (1,930 | ) | | | — | | | | (998 | ) | | | (4 | ) | |
Net realized gain (loss) | | | 164,991,691 | | | | 235,265,227 | | | | 48,483,218 | | | | 79,663,106 | | |
Net change in unrealized appreciation/depreciation of: | |
Investments in unaffiliated issuers(net of change in deferred foreign capital gains taxes of
$0; $0; $0; $0; $0; $579,100; $0 and $0, respectively) | | | (81,925,741 | ) | | | (35,032,795 | ) | | | (11,509,145 | ) | | | 28,257,828 | | |
Futures | | | — | | | | — | | | | — | | | | — | | |
Options and swaptions written | | | — | | | | — | | | | — | | | | — | | |
Investments sold short | | | (7,362,935 | ) | | | — | | | | — | | | | — | | |
Swaps | | | — | | | | — | | | | — | | | | — | | |
Forward foreign currency contracts | | | — | | | | — | | | | — | | | | — | | |
Other assets and liabilities denominated in foreign currency | | | — | | | | — | | | | — | | | | — | | |
Net change in unrealized appreciation/depreciation | | | (89,288,676 | ) | | | (35,032,795 | ) | | | (11,509,145 | ) | | | 28,257,828 | | |
Net realized and unrealized gain (loss) from investment activities | | | 75,703,015 | | | | 200,232,432 | | | | 36,974,073 | | | | 107,920,934 | | |
Net increase in net assets resulting from operations | | $ | 92,478,088 | | | $ | 195,512,631 | | | $ | 40,515,804 | | | $ | 104,507,586 | | |
272
| | | PACE
International
Equity
Investments | | PACE
International
Emerging
Markets Equity
Investments | | PACE
Global
Real Estate
Securities
Investments | | PACE
Alternative
Strategies
Investments | |
Investment income: | |
Dividends (net of foreign withholding taxes of $167,784; $26,137; $28,863; $19,329;
$3,107,729; $1,319,218; $81,226 and $141,133, respectively) | | $ | 33,442,360 | | | $ | 12,205,504 | | | $ | 4,605,066 | | | $ | 5,803,274 | | |
Interest (net of foreign withholding taxes of $0; $0; $0; $0; $0; $0; $0 and
$0, respectively) | | | — | | | | — | | | | — | | | | 3,400,371 | | |
Securities lending income (includes $246; $733; $3,269; $8,354; $4,152; $2,894; $272 and
$0, respectively earned from an affiliated entity) | | | 579,496 | | | | 190,520 | | | | 24,750 | | | | — | | |
| | | | 34,021,856 | | | | 12,396,024 | | | | 4,629,816 | | | | 9,203,645 | | |
Expenses: | |
Investment management and administration fees | | | 9,482,652 | | | | 5,155,232 | | | | 1,219,634 | | | | 10,281,282 | | |
Service fees–Class A | | | 104,075 | | | | 25,142 | | | | 5,989 | | | | 88,178 | | |
Service and distribution fees–Class C | | | 27,560 | | | | 18,998 | | | | 3,163 | | | | 72,570 | | |
Dividend expense, interest expense and other borrowing costs for investments sold short | | | 4,204,310 | | | | — | | | | — | | | | 457,307 | | |
Transfer agency and related services fees | | | 1,054,276 | | | | 968,280 | | | | 698,397 | | | | 548,961 | | |
Custody and accounting fees | | | 1,010,476 | | | | 867,004 | | | | 114,341 | | | | 524,551 | | |
Professional fees | | | 223,946 | | | | 136,810 | | | | 170,646 | | | | 352,519 | | |
Reports and notices to shareholders | | | 130,858 | | | | 51,000 | | | | 41,284 | | | | 66,168 | | |
State registration fees | | | 67,394 | | | | 59,487 | | | | 51,509 | | | | 73,662 | | |
Trustees' fees | | | 42,466 | | | | 30,874 | | | | 24,730 | | | | 36,059 | | |
Insurance expense | | | 27,943 | | | | 11,932 | | | | 3,760 | | | | 17,853 | | |
Interest expense | | | 963 | | | | 618 | | | | — | | | | 115,591 | | |
Other expenses | | | 60,055 | | | | 39,943 | | | | 42,363 | | | | 86,695 | | |
| | | | 16,436,974 | | | | 7,365,320 | | | | 2,375,816 | | | | 12,721,396 | | |
Fee waivers and/or expense reimbursements | | | (321,447 | ) | | | (445,225 | ) | | | (537,214 | ) | | | (521,735 | ) | |
Recoupment of fees waived or expenses previously reimbursed | | | — | | | | — | | | | — | | | | 626 | | |
Net expenses | | | 16,115,527 | | | | 6,920,095 | | | | 1,838,602 | | | | 12,200,287 | | |
Net investment income (loss) | | | 17,906,329 | | | | 5,475,929 | | | | 2,791,214 | | | | (2,996,642 | ) | |
Net realized and unrealized gains (losses) from investment activities: | |
Net realized gains from: | |
Investments (net of foreign tax expense of $0; $0; $0; $0; $0; $450,157; $0 and
$0, respectively) | | | 4,508,882 | | | | (5,824,888 | ) | | | 19,031,328 | | | | 10,976,673 | | |
Futures | | | — | | | | — | | | | — | | | | 7,296,598 | | |
Options and swaptions written | | | — | | | | — | | | | — | | | | (9,971,636 | ) | |
Investments sold short | | | (3,683,443 | ) | | | — | | | | — | | | | (555,834 | ) | |
Swap agreements | | | — | | | | — | | | | — | | | | 515,484 | | |
Forward foreign currency contracts | | | 707,563 | | | | — | | | | — | | | | 35,552,044 | | |
Foreign currency transactions | | | (1,389,452 | ) | | | (535,856 | ) | | | 49,545 | | | | 2,146,962 | | |
Net realized gain (loss) | | | 143,550 | | | | (6,360,744 | ) | | | 19,080,873 | | | | 45,960,291 | | |
Net change in unrealized appreciation/depreciation of: | |
Investments in unaffiliated issuers(net of change in deferred foreign capital gains taxes of
$0; $0; $0; $0; $0; $579,100; $0 and $0, respectively) | | | (30,113,019 | ) | | | (60,467,756 | ) | | | (17,828,621 | ) | | | (23,294,183 | ) | |
Futures | | | — | | | | — | | | | — | | | | 4,382,185 | | |
Options and swaptions written | | | — | | | | — | | | | — | | | | 1,203,834 | | |
Investments sold short | | | (692,672 | ) | | | — | | | | — | | | | 9,777,791 | | |
Swaps | | | — | | | | — | | | | — | | | | (3,914,707 | ) | |
Forward foreign currency contracts | | | (78,260 | ) | | | — | | | | — | | | | 3,802,339 | | |
Other assets and liabilities denominated in foreign currency | | | 8,573 | | | | 815,388 | | | | (1,244 | ) | | | (78,038 | ) | |
Net change in unrealized appreciation/depreciation | | | (30,875,378 | ) | | | (59,652,368 | ) | | | (17,829,865 | ) | | | (8,120,779 | ) | |
Net realized and unrealized gain (loss) from investment activities | | | (30,731,828 | ) | | | (66,013,112 | ) | | | 1,251,008 | | | | 37,839,512 | | |
Net increase in net assets resulting from operations | | $ | (12,825,499 | ) | | $ | (60,537,183 | ) | | $ | 4,042,222 | | | $ | 34,842,870 | | |
See accompanying notes to financial statements.
273
PACE Select Advisors Trust
Statement of changes in net assets
| | | PACE
Money Market
Investments | | PACE
Mortgage-Backed Securities
Fixed Income Investments | | PACE
Intermediate Fixed Income
Investments | |
| | | For the years ended July 31, | | For the years ended July 31, | | For the years ended July 31, | |
| | | 2015 | | 2014 | | 2015 | | 2014 | | 2015 | | 2014 | |
From operations: | |
Net investment income | | $ | 21,010 | | | $ | 27,332 | | | $ | 5,992,694 | | | $ | 7,761,989 | | | $ | 6,624,471 | | | $ | 6,301,354 | | |
Net realized gain (loss) | | | 1,868 | | | | — | | | | 8,741,969 | | | | 7,925,094 | | | | 2,913,021 | | | | 2,868,319 | | |
Net change in unrealized appreciation/depreciation | | | — | | | | — | | | | 2,058,413 | | | | 6,328,559 | | | | (1,438,203 | ) | | | 1,829,571 | | |
Net increase in net assets resulting from operations | | | 22,878 | | | | 27,332 | | | | 16,793,076 | | | | 22,015,642 | | | | 8,099,289 | | | | 10,999,244 | | |
Dividends and distributions to shareholders from: | |
Net investment income–Class A | | | — | | | | — | | | | (917,339 | ) | | | (1,312,855 | ) | | | (300,471 | ) | | | (355,486 | ) | |
Net investment income–Class C | | | — | | | | — | | | | (164,106 | ) | | | (233,826 | ) | | | (16,086 | ) | | | (17,962 | ) | |
Net investment income–Class Y | | | — | | | | — | | | | (959,832 | ) | | | (1,221,484 | ) | | | (8,135 | ) | | | (9,032 | ) | |
Net investment income–Class P | | | (21,010 | ) | | | (27,332 | ) | | | (8,706,791 | ) | | | (10,322,100 | ) | | | (6,417,370 | ) | | | (6,061,851 | ) | |
Net realized gains–Class A | | | — | | | | — | | | | — | | | | — | | | | (20,543 | ) | | | — | | |
Net realized gains–Class C | | | — | | | | — | | | | — | | | | — | | | | (1,929 | ) | | | — | | |
Net realized gains–Class Y | | | — | | | | — | | | | — | | | | — | | | | (533 | ) | | | — | | |
Net realized gains–Class P | | | — | | | | (664 | ) | | | — | | | | — | | | | (393,490 | ) | | | — | | |
Return of capital–Class A | | | — | | | | — | | | | — | | | | — | | | | — | | | | — | | |
Return of capital–Class C | | | — | | | | — | | | | — | | | | — | | | | — | | | | — | | |
Return of capital–Class Y | | | — | | | | — | | | | — | | | | — | | | | — | | | | — | | |
Return of capital–Class P | | | — | | | | — | | | | — | | | | — | | | | — | | | | — | | |
| | | | (21,010 | ) | | | (27,996 | ) | | | (10,748,068 | ) | | | (13,090,265 | ) | | | (7,158,557 | ) | | | (6,444,331 | ) | |
From beneficial interest transactions: | |
Net proceeds from shares sold | | | 183,206,846 | | | | 228,597,765 | | | | 101,122,463 | | | | 112,353,502 | | | | 73,336,307 | | | | 92,027,450 | | |
Cost of shares repurchased | | | (226,742,570 | ) | | | (326,432,653 | ) | | | (144,471,645 | ) | | | (165,018,741 | ) | | | (103,080,896 | ) | | | (105,261,785 | ) | |
Proceeds from dividends reinvested | | | 11,852 | | | | 16,299 | | | | 9,890,764 | | | | 12,128,536 | | | | 6,563,326 | | | | 5,926,805 | | |
Net increase (decrease) in net assets from beneficial interest
transactions | | | (43,523,872 | ) | | | (97,818,589 | ) | | | (33,458,418 | ) | | | (40,536,703 | ) | | | (23,181,263 | ) | | | (7,307,530 | ) | |
Redemption fees | | | — | | | | — | | | | 22,140 | | | | 34,876 | | | | 11,937 | | | | 38,890 | | |
Cash payment from investment advisor | | | — | | | | 2,430 | | | | — | | | | — | | | | — | | | | — | | |
Net increase (decrease) in net assets | | | (43,522,004 | ) | | | (97,816,823 | ) | | | (27,391,270 | ) | | | (31,576,450 | ) | | | (22,228,594 | ) | | | (2,713,727 | ) | |
Net assets: | |
Beginning of year | | | 212,025,121 | | | | 309,841,944 | | | | 556,813,595 | | | | 588,390,045 | | | | 447,894,519 | | | | 450,608,246 | | |
End of year | | $ | 168,503,117 | | | $ | 212,025,121 | | | $ | 529,422,325 | | | $ | 556,813,595 | | | $ | 425,665,925 | | | $ | 447,894,519 | | |
Accumulated undistributed (distributions in excess of) net investment income | | $ | — | | | $ | — | | | $ | 395,813 | | | $ | 322,900 | | | $ | 1,930,867 | | | $ | 1,527,813 | | |
274
| | | PACE
Strategic Fixed Income
Investments | | PACE
Municipal Fixed Income
Investments | |
| | | For the years ended July 31, | | For the years ended July 31, | |
| | | 2015 | | 2014 | | 2015 | | 2014 | |
From operations: | |
Net investment income | | $ | 25,326,554 | | | $ | 26,690,206 | | | $ | 10,736,582 | | | $ | 10,708,966 | | |
Net realized gain (loss) | | | 37,741,831 | | | | (51,668,368 | ) | | | 2,565,096 | | | | (211,790 | ) | |
Net change in unrealized appreciation/depreciation | | | (36,203,343 | ) | | | 58,741,670 | | | | (3,970,786 | ) | | | 11,172,886 | | |
Net increase in net assets resulting from operations | | | 26,865,042 | | | | 33,763,508 | | | | 9,330,892 | | | | 21,670,062 | | |
Dividends and distributions to shareholders from: | |
Net investment income–Class A | | | (583,597 | ) | | | (1,093,304 | ) | | | (1,412,028 | ) | | | (1,629,590 | ) | |
Net investment income–Class C | | | (261,237 | ) | | | (284,606 | ) | | | (208,822 | ) | | | (242,152 | ) | |
Net investment income–Class Y | | | (76,482 | ) | | | (64,062 | ) | | | (2,202 | ) | | | (2,344 | ) | |
Net investment income–Class P | | | (23,904,856 | ) | | | (18,535,802 | ) | | | (9,111,979 | ) | | | (8,835,545 | ) | |
Net realized gains–Class A | | | — | | | | (1,489,110 | ) | | | — | | | | (470,526 | ) | |
Net realized gains–Class C | | | — | | | | (461,758 | ) | | | — | | | | (87,525 | ) | |
Net realized gains–Class Y | | | — | | | | (68,122 | ) | | | — | | | | (611 | ) | |
Net realized gains–Class P | | | — | | | | (22,126,780 | ) | | | — | | | | (2,253,307 | ) | |
Return of capital–Class A | | | — | | | | (325,239 | ) | | | — | | | | — | | |
Return of capital–Class C | | | — | | | | (86,293 | ) | | | — | | | | — | | |
Return of capital–Class Y | | | — | | | | (21,117 | ) | | | — | | | | — | | |
Return of capital–Class P | | | — | | | | (6,271,593 | ) | | | — | | | | — | | |
| | | | (24,826,172 | ) | | | (50,827,786 | ) | | | (10,735,031 | ) | | | (13,521,600 | ) | |
From beneficial interest transactions: | |
Net proceeds from shares sold | | | 154,923,974 | | | | 192,427,019 | | | | 85,015,800 | | | | 104,146,434 | | |
Cost of shares repurchased | | | (210,830,699 | ) | | | (196,510,676 | ) | | | (92,511,215 | ) | | | (91,324,849 | ) | |
Proceeds from dividends reinvested | | | 23,047,188 | | | | 47,858,156 | | | | 9,095,650 | | | | 11,528,562 | | |
Net increase (decrease) in net assets from beneficial interest
transactions | | | (32,859,537 | ) | | | 43,774,499 | | | | 1,600,235 | | | | 24,350,147 | | |
Redemption fees | | | 20,193 | | | | 58,134 | | | | 13,231 | | | | 44,631 | | |
Cash payment from investment advisor | | | — | | | | — | | | | — | | | | — | | |
Net increase (decrease) in net assets | | | (30,800,474 | ) | | | 26,768,355 | | | | 209,327 | | | | 32,543,240 | | |
Net assets: | |
Beginning of year | | | 952,167,963 | | | | 925,399,608 | | | | 409,339,292 | | | | 376,796,052 | | |
End of year | | $ | 921,367,489 | | | $ | 952,167,963 | | | $ | 409,548,619 | | | $ | 409,339,292 | | |
Accumulated undistributed (distributions in excess of) net investment income | | $ | 10,481,898 | | | $ | 1,992,690 | | | $ | 1,551 | | | $ | — | | |
See accompanying notes to financial statements.
275
PACE Select Advisors Trust
Statement of changes in net assets (continued)
| | | PACE
International Fixed Income
Investments | | PACE
High Yield
Investments | | PACE
Large Co Value Equity
Investments | |
| | | For the years ended July 31, | | For the years ended July 31, | | For the years ended July 31, | |
| | | 2015 | | 2014 | | 2015 | | 2014 | | 2015 | | 2014 | |
From operations: | |
Net investment income (loss) | | $ | 9,801,696 | | | $ | 11,201,652 | | | $ | 24,212,951 | | | $ | 23,440,037 | | | $ | 16,775,073 | | | $ | 20,273,624 | | |
Net realized gain (loss) | | | 10,782,783 | | | | (4,577,908 | ) | | | (2,618,545 | ) | | | (1,047,006 | ) | | | 164,991,691 | | | | 198,807,800 | | |
Net change in unrealized appreciation/depreciation | | | (50,024,939 | ) | | | 22,284,778 | | | | (31,613,085 | ) | | | 9,567,277 | | | | (89,288,676 | ) | | | (30,152,444 | ) | |
Net increase (decrease) in net assets resulting from operations | | | (29,440,460 | ) | | | 28,908,522 | | | | (10,018,679 | ) | | | 31,960,308 | | | | 92,478,088 | | | | 188,928,980 | | |
Dividends and distributions to shareholders from: | |
Net investment income–Class A | | | (1,135,389 | ) | | | (833,795 | ) | | | (597,629 | ) | | | (1,268,377 | ) | | | (1,525,090 | ) | | | (1,315,722 | ) | |
Net investment income–Class C | | | (78,518 | ) | | | (54,066 | ) | | | (220,431 | ) | | | (280,907 | ) | | | (66,854 | ) | | | (19,938 | ) | |
Net investment income–Class Y | | | (115,532 | ) | | | (71,009 | ) | | | (65,184 | ) | | | (92,661 | ) | | | (293,672 | ) | | | (207,331 | ) | |
Net investment income–Class P | | | (11,525,447 | ) | | | (6,550,277 | ) | | | (23,460,551 | ) | | | (21,950,316 | ) | | | (18,788,240 | ) | | | (13,005,353 | ) | |
Net realized gains–Class A | | | — | | | | — | | | | (95,677 | ) | | | — | | | | (14,137,477 | ) | | | (1,838,160 | ) | |
Net realized gains–Class C | | | — | | | | — | | | | (69,906 | ) | | | — | | | | (1,652,069 | ) | | | (180,129 | ) | |
Net realized gains–Class Y | | | — | | | | — | | | | (17,723 | ) | | | — | | | | (2,152,081 | ) | | | (227,508 | ) | |
Net realized gains–Class P | | | — | | | | — | | | | (6,529,594 | ) | | | — | | | | (138,591,954 | ) | | | (14,281,952 | ) | |
Return of capital–Class A | | | (495,088 | ) | | | (806,051 | ) | | | — | | | | — | | | | — | | | | — | | |
Return of capital–Class C | | | (28,081 | ) | | | (49,250 | ) | | | — | | | | — | | | | — | | | | — | | |
Return of capital–Class Y | | | (54,520 | ) | | | (72,295 | ) | | | — | | | | — | | | | — | | | | — | | |
Return of capital–Class P | | | (5,859,791 | ) | | | (6,947,465 | ) | | | — | | | | — | | | | — | | | | — | | |
| | | | (19,292,366 | ) | | | (15,384,208 | ) | | | (31,056,695 | ) | | | (23,592,261 | ) | | | (177,207,437 | ) | | | (31,076,093 | ) | |
From beneficial interest transactions: | |
Net proceeds from shares sold | | | 95,553,557 | | | | 125,801,209 | | | | 90,672,586 | | | | 112,560,344 | | | | 136,265,977 | | | | 162,005,183 | | |
Cost of shares repurchased | | | (109,511,562 | ) | | | (102,673,820 | ) | | | (102,686,648 | ) | | | (68,545,516 | ) | | | (267,096,055 | ) | | | (215,055,013 | ) | |
Proceeds from dividends reinvested | | | 17,870,563 | | | | 14,273,058 | | | | 28,870,493 | | | | 21,936,286 | | | | 168,243,107 | | | | 29,528,230 | | |
Net increase (decrease) in net assets from beneficial interest
transactions | | | 3,912,558 | | | | 37,400,447 | | | | 16,856,431 | | | | 65,951,114 | | | | 37,413,029 | | | | (23,521,600 | ) | |
Redemption fees | | | 13,889 | | | | 27,701 | | | | 16,853 | | | | 20,704 | | | | 23,523 | | | | 21,338 | | |
Net increase (decrease) in net assets | | | (44,806,379 | ) | | | 50,952,462 | | | | (24,202,090 | ) | | | 74,339,865 | | | | (47,292,797 | ) | | | 134,352,625 | | |
Net assets: | |
Beginning of year | | | 599,158,126 | | | | 548,205,664 | | | | 462,625,394 | | | | 388,285,529 | | | | 1,453,921,604 | | | | 1,319,568,979 | | |
End of year | | $ | 554,351,747 | | | $ | 599,158,126 | | | $ | 438,423,304 | | | $ | 462,625,394 | | | $ | 1,406,628,807 | | | $ | 1,453,921,604 | | |
Accumulated undistributed (distributions in excess of) net investment income | | $ | (10,592,878 | ) | | $ | (19,812,550 | ) | | $ | (2,903,233 | ) | | $ | 239,635 | | | $ | 10,191,229 | | | $ | 14,041,734 | | |
276
| | | PACE
Large Co Growth Equity
Investments | | PACE
Small/Medium Co Value
Equity Investments | |
| | | For the years ended July 31, | | For the years ended July 31, | |
| | | 2015 | | 2014 | | 2015 | | 2014 | |
From operations: | |
Net investment income (loss) | | $ | (4,719,801 | ) | | $ | 6,794,441 | | | $ | 3,541,731 | | | $ | 1,652,729 | | |
Net realized gain (loss) | | | 235,265,227 | | | | 135,121,323 | | | | 48,483,218 | | | | 81,410,116 | | |
Net change in unrealized appreciation/depreciation | | | (35,032,795 | ) | | | 92,163,332 | | | | (11,509,145 | ) | | | (20,855,506 | ) | |
Net increase (decrease) in net assets resulting from operations | | | 195,512,631 | | | | 234,079,096 | | | | 40,515,804 | | | | 62,207,339 | | |
Dividends and distributions to shareholders from: | |
Net investment income–Class A | | | — | | | | (93,180 | ) | | | (24,600 | ) | | | (123,184 | ) | |
Net investment income–Class C | | | — | | | | — | | | | — | | | | — | | |
Net investment income–Class Y | | | (35,724 | ) | | | (56,520 | ) | | | (4,681 | ) | | | (4,125 | ) | |
Net investment income–Class P | | | (2,888,553 | ) | | | (4,519,165 | ) | | | (2,389,968 | ) | | | (2,270,922 | ) | |
Net realized gains–Class A | | | (5,095,957 | ) | | | (5,660,146 | ) | | | (2,280,425 | ) | | | (3,844,514 | ) | |
Net realized gains–Class C | | | (525,244 | ) | | | (411,158 | ) | | | (685,859 | ) | | | (678,374 | ) | |
Net realized gains–Class Y | | | (1,776,075 | ) | | | (1,274,197 | ) | | | (113,176 | ) | | | (98,053 | ) | |
Net realized gains–Class P | | | (147,942,352 | ) | | | (100,636,569 | ) | | | (62,244,809 | ) | | | (55,352,971 | ) | |
Return of capital–Class A | | | — | | | | — | | | | — | | | | — | | |
Return of capital–Class C | | | — | | | | — | | | | — | | | | — | | |
Return of capital–Class Y | | | — | | | | — | | | | — | | | | — | | |
Return of capital–Class P | | | — | | | | — | | | | — | | | | — | | |
| | | | (158,263,905 | ) | | | (112,650,935 | ) | | | (67,743,518 | ) | | | (62,372,143 | ) | |
From beneficial interest transactions: | |
Net proceeds from shares sold | | | 132,259,675 | | | | 161,742,711 | | | | 68,158,767 | | | | 82,288,030 | | |
Cost of shares repurchased | | | (272,549,191 | ) | | | (208,911,465 | ) | | | (104,177,834 | ) | | | (80,325,500 | ) | |
Proceeds from dividends reinvested | | | 151,450,541 | | | | 108,102,059 | | | | 64,935,600 | | | | 60,066,647 | | |
Net increase (decrease) in net assets from beneficial interest
transactions | | | 11,161,025 | | | | 60,933,305 | | | | 28,916,533 | | | | 62,029,177 | | |
Redemption fees | | | 23,600 | | | | 15,144 | | | | 9,886 | | | | 9,880 | | |
Net increase (decrease) in net assets | | | 48,433,351 | | | | 182,376,610 | | | | 1,698,705 | | | | 61,874,253 | | |
Net assets: | |
Beginning of year | | | 1,377,845,568 | | | | 1,195,468,958 | | | | 548,434,239 | | | | 486,559,986 | | |
End of year | | $ | 1,426,278,919 | | | $ | 1,377,845,568 | | | $ | 550,132,944 | | | $ | 548,434,239 | | |
Accumulated undistributed (distributions in excess of) net investment income | | $ | 1,878,487 | | | $ | 5,976,682 | | | $ | 1,948,504 | | | $ | 845,212 | | |
See accompanying notes to financial statements.
277
PACE Select Advisors Trust
Statement of changes in net assets (concluded)
| | | PACE
Small/Medium Co Growth
Equity Investments | | PACE
International Equity
Investments | | PACE
International Emerging Markets
Equity Investments | |
| | | For the years ended July 31, | | For the years ended July 31, | | For the years ended July 31, | |
| | | 2015 | | 2014 | | 2015 | | 2014 | | 2015 | | 2014 | |
From operations: | |
Net investment gain (loss) | | $ | (3,413,348 | ) | | $ | (3,584,493 | ) | | $ | 17,906,329 | | | $ | 27,480,414 | | | $ | 5,475,929 | | | $ | 5,687,687 | | |
Net realized gain (loss) | | | 79,663,106 | | | | 95,557,895 | | | | 143,550 | | | | 121,876,378 | | | | (6,360,744 | ) | | | 2,879,849 | | |
Net change in unrealized appreciation/depreciation | | | 28,257,828 | | | | (66,221,815 | ) | | | (30,875,378 | ) | | | (15,024,293 | ) | | | (59,652,368 | ) | | | 36,570,988 | | |
Net increase (decrease) in net assets resulting from operations | | | 104,507,586 | | | | 25,751,587 | | | | (12,825,499 | ) | | | 134,332,499 | | | | (60,537,183 | ) | | | 45,138,524 | | |
Dividends and distributions to shareholders from: | |
Net investment income–Class A | | | — | | | | — | | | | (775,097 | ) | | | (1,012,743 | ) | | | (31,788 | ) | | | (56,842 | ) | |
Net investment income–Class C | | | — | | | | — | | | | (43,304 | ) | | | (29,289 | ) | | | (4,650 | ) | | | — | | |
Net investment income–Class Y | | | — | | | | — | | | | (574,833 | ) | | | (450,709 | ) | | | (130,682 | ) | | | (71,062 | ) | |
Net investment income–Class P | | | — | | | | — | | | | (26,674,739 | ) | | | (19,226,294 | ) | | | (5,205,232 | ) | | | (2,015,608 | ) | |
Net realized gains–Class A | | | (3,951,907 | ) | | | (5,458,589 | ) | | | — | | | | — | | | | — | | | | — | | |
Net realized gains–Class C | | | (684,644 | ) | | | (647,674 | ) | | | — | | | | — | | | | — | | | | — | | |
Net realized gains–Class Y | | | (102,429 | ) | | | (80,208 | ) | | | — | | | | — | | | | — | | | | — | | |
Net realized gains–Class P | | | (70,594,409 | ) | | | (59,054,952 | ) | | | — | | | | — | | | | — | | | | — | | |
| | | | (75,333,389 | ) | | | (65,241,423 | ) | | | (28,067,973 | ) | | | (20,719,035 | ) | | | (5,372,352 | ) | | | (2,143,512 | ) | |
From beneficial interest transactions: | |
Net proceeds from shares sold | | | 64,464,065 | | | | 77,387,031 | | | | 155,528,359 | | | | 181,513,316 | | | | 97,397,616 | | | | 131,706,820 | | |
Cost of shares repurchased | | | (106,447,993 | ) | | | (84,716,724 | ) | | | (178,023,630 | ) | | | (148,140,850 | ) | | | (85,432,969 | ) | | | (61,459,183 | ) | |
Proceeds from dividends reinvested | | | 72,340,950 | | | | 62,774,773 | | | | 26,584,568 | | | | 19,763,258 | | | | 5,120,906 | | | | 2,057,646 | | |
Net increase (decrease) in net assets from beneficial interest
transactions | | | 30,357,022 | | | | 55,445,080 | | | | 4,089,297 | | | | 53,135,724 | | | | 17,085,553 | | | | 72,305,283 | | |
Redemption fees | | | 10,275 | | | | 9,429 | | | | 20,422 | | | | 22,296 | | | | 13,777 | | | | 23,103 | | |
Net increase (decrease) in net assets | | | 59,541,494 | | | | 15,964,673 | | | | (36,783,753 | ) | | | 166,771,484 | | | | (48,810,205 | ) | | | 115,323,398 | | |
Net assets: | |
Beginning of year | | | 519,322,025 | | | | 503,357,352 | | | | 1,108,979,504 | | | | 942,208,020 | | | | 481,695,217 | | | | 366,371,819 | | |
End of year | | $ | 578,863,519 | | | $ | 519,322,025 | | | $ | 1,072,195,751 | | | $ | 1,108,979,504 | | | $ | 432,885,012 | | | $ | 481,695,217 | | |
Accumulated undistributed (distributions in excess of) net investment income | | $ | 158,706 | | | $ | 68,773 | | | $ | 11,988,150 | | | $ | 22,091,154 | | | $ | 4,022,237 | | | $ | 4,764,967 | | |
278
| | | PACE
Global Real Estate Securities
Investments | | PACE
Alternative Strategies
Investments | |
| | | For the years ended July 31, | | For the years ended July 31, | |
| | | 2015 | | 2014 | | 2015 | | 2014 | |
From operations: | |
Net investment gain (loss) | | $ | 2,791,214 | | | $ | 2,392,334 | | | $ | (2,996,642 | ) | | $ | (4,228,385 | ) | |
Net realized gain (loss) | | | 19,080,873 | | | | 7,802,754 | | | | 45,960,291 | | | | 34,549,034 | | |
Net change in unrealized appreciation/depreciation | | | (17,829,865 | ) | | | 9,097,795 | | | | (8,120,779 | ) | | | 6,765,019 | | |
Net increase (decrease) in net assets resulting from operations | | | 4,042,222 | | | | 19,292,883 | | | | 34,842,870 | | | | 37,085,668 | | |
Dividends and distributions to shareholders from: | |
Net investment income–Class A | | | — | | | | (94,946 | ) | | | — | | | | (1,162,407 | ) | |
Net investment income–Class C | | | (7,950 | ) | | | (2,423 | ) | | | (13,698 | ) | | | (59,766 | ) | |
Net investment income–Class Y | | | (9,820 | ) | | | (5,667 | ) | | | (37,288 | ) | | | (101,008 | ) | |
Net investment income–Class P | | | (5,232,448 | ) | | | (2,570,365 | ) | | | (7,024,459 | ) | | | (10,975,679 | ) | |
Net realized gains–Class A | | | — | | | | — | | | | — | | | | — | | |
Net realized gains–Class C | | | — | | | | — | | | | — | | | | — | | |
Net realized gains–Class Y | | | — | | | | — | | | | — | | | | — | | |
Net realized gains–Class P | | | — | | | | — | | | | — | | | | — | | |
| | | | (5,250,218 | ) | | | (2,673,401 | ) | | | (7,075,445 | ) | | | (12,298,860 | ) | |
From beneficial interest transactions: | |
Net proceeds from shares sold | | | 26,400,418 | | | | 30,881,013 | | | | 280,363,346 | | | | 197,094,073 | | |
Cost of shares repurchased | | | (32,397,785 | ) | | | (21,004,857 | ) | | | (212,517,090 | ) | | | (88,629,959 | ) | |
Proceeds from dividends reinvested | | | 4,972,531 | | | | 2,551,689 | | | | 6,583,602 | | | | 11,607,572 | | |
Net increase (decrease) in net assets from beneficial interest
transactions | | | (1,024,836 | ) | | | 12,427,845 | | | | 74,429,858 | | | | 120,071,686 | | |
Redemption fees | | | 2,727 | | | | 4,868 | | | | 21,748 | | | | 37,185 | | |
Net increase (decrease) in net assets | | | (2,230,105 | ) | | | 29,052,195 | | | | 102,219,031 | | | | 144,895,679 | | |
Net assets: | |
Beginning of year | | | 151,310,282 | | | | 122,258,087 | | | | 699,705,247 | | | | 554,809,568 | | |
End of year | | $ | 149,080,177 | | | $ | 151,310,282 | | | $ | 801,924,278 | | | $ | 699,705,247 | | |
Accumulated undistributed (distributions in excess of) net investment income | | $ | 1,526,729 | | | $ | 75,386 | | | $ | 20,453,216 | | | $ | (9,175,530 | ) | |
See accompanying notes to financial statements.
279
PACE Select Advisors Trust
Statement of cash flows
For the year ended July 31, 2015
| | PACE Strategic Fixed
Income Investments | |
Cash flows from operating activities | |
Net increase in net assets resulting from operations | | $ | 26,865,042 | | |
Adjustments to reconcile net decrease in net assets resulting from
operations to net cash provided by operating activities: | |
Purchases of long-term investments | | | (1,564,790,888 | ) | |
Proceeds from disposition of long-term investments | | | 1,639,788,180 | | |
Net purchases of short-term investments | | | (29,537,905 | ) | |
Net realized (gains) from investments in securities | | | (13,102,774 | ) | |
Net accretion of bond discount and amortization of bond premium | | | 2,492,482 | | |
Net change in unrealized appreciation/depreciation of investments in securities | | | 30,752,063 | | |
Net change in unrealized appreciation/depreciation of investments sold short | | | 1,179 | | |
Net change in unrealized appreciation/depreciation of forward foreign currency contracts | | | (1,033,438 | ) | |
Changes in operating assets and liabilities: | |
(Increase) decrease in assets: | |
Cash collateral on futures | | | (1,256,437 | ) | |
Cash collateral on swap agreements | | | (2,840,000 | ) | |
Due from broker | | | 291,873 | | |
Receivable for interest | | | 574,519 | | |
Swap agreements, at value | | | 2,264,947 | | |
Receivable for variation margin on futures contracts | | | (28,215 | ) | |
Receivable for variation margin on swap agreements | | | 551,652 | | |
Receivable for foreign tax reclaims | | | 9,649 | | |
Other assets | | | (7,256 | ) | |
Increase (decrease) in liabilities: | |
Due to broker | | | (1,392,223 | ) | |
Payable for cash collateral from securities loaned | | | 13,318,478 | | |
Payable for variation margin on swap agreements | | | 197,995 | | |
Options and swaptions written, at value | | | 539,266 | | |
Swap agreements, at value | | | 340,767 | | |
Payable for variation margin on futures contracts | | | (1,039,813 | ) | |
Payable to affiliate | | �� | (38,018 | ) | |
Payable to custodian | | | (37,911 | ) | |
Deferrred payable for dollar roll transactions | | | (19,589 | ) | |
Payable for foreign withholding taxes and foreign capital gain taxes | | | (8,221 | ) | |
Accrued expenses and other liabilities | | | 31,453 | | |
Net cash provided by operating activities | | | 102,886,857 | | |
Cash flows from financing activities | |
Proceeds from dollar roll transactions | | | 6,759,856,524 | | |
Repayments of dollar roll transactions | | | (6,805,462,926 | ) | |
Proceeds from shares sold | | | 155,215,377 | | |
Cost of shares repurchased | | | (211,072,295 | ) | |
Dividends paid to shareholders | | | (1,778,984 | ) | |
Redemption fees | | | 20,193 | | |
Net cash used in financing activities | | | (103,222,111 | ) | |
Net decrease in cash and foreign currency | | | (335,254 | ) | |
Cash and foreign currency, beginning of year | | | 4,004,872 | | |
Cash and foreign currency, end of year | | $ | 3,669,618 | | |
Supplemental disclosure of cash flow information: | |
Reinvestment of dividends | | $ | (23,047,188 | ) | |
Cash paid during the year for interest | | $ | 187,353 | | |
See accompanying notes to financial statements.
280
PACE Select Advisors Trust
Statement of cash flows (continued)
For the year ended July 31, 2015
| | PACE Large Co Value
Equity Investments | |
Cash flows from operating activities | |
Net increase in net assets resulting from operations | | $ | 92,478,088 | | |
Adjustments to reconcile net increase in net assets resulting from
operations to net cash provided by operating activities: | |
Purchases of long-term investments | | | (1,200,425,160 | ) | |
Purchases to cover investments sold short | | | (192,145,920 | ) | |
Proceeds from disposition of long-term investments | | | 1,343,222,802 | | |
Sales of investments sold short | | | 176,739,371 | | |
Net sales of short-term investments | | | (10,437,033 | ) | |
Net realized (gains) from investments in securities | | | (165,854,367 | ) | |
Net realized losses from investments sold short | | | 860,746 | | |
Net change in unrealized appreciation/depreciation of investments in securities | | | 81,925,741 | | |
Net change in unrealized appreciation/depreciation of investments sold short | | | 7,362,935 | | |
Changes in operating assets and liabilities: | |
(Increase) decrease in assets: | |
Cash collateral on investments sold short | | | (18,140,679 | ) | |
Receivable for interest | | | 772,562 | | |
Receivable for foreign tax reclaims | | | 49,584 | | |
Other assets | | | (8,690 | ) | |
Increase (decrease) in liabilities: | |
Payable for cash collateral from securities loaned | | | 24,003,712 | | |
Payable to affiliate | | | (73,349 | ) | |
Payable for dividends and interest on investments sold short | | | (38,923 | ) | |
Payable to custodian | | | (79,679 | ) | |
Accrued expenses and other liabilities | | | 65,730 | | |
Net cash provided by operating activities | | | 140,277,471 | | |
Cash flows from financing activities | |
Proceeds from shares sold | | | 136,603,408 | | |
Cost of shares repurchased | | | (267,940,072 | ) | |
Dividends paid to shareholders | | | (8,964,330 | ) | |
Redemption fees | | | 23,523 | | |
Net cash used in financing activities | | | (140,277,471 | ) | |
Net increase in cash and foreign currency | | | — | | |
Cash and foreign currency, beginning of year | | | — | | |
Cash and foreign currency, end of year | | $ | — | | |
Supplemental disclosure of cash flow information: | |
Reinvestment of dividends | | $ | (168,243,107 | ) | |
Cash paid during the year for interest | | $ | 436 | | |
See accompanying notes to financial statements.
281
PACE Select Advisors Trust
Statement of cash flows (concluded)
For the year ended July 31, 2015
| | PACE International
Equity Investments | |
Cash flows from operating activities | |
Net decrease in net assets resulting from operations | | $ | (12,825,499 | ) | |
Adjustments to reconcile net decrease in net assets resulting from
operations to net cash provided by operating activities: | |
Purchases of long-term investments | | | (646,985,858 | ) | |
Purchases to cover investments sold short | | | (183,981,243 | ) | |
Proceeds from disposition of long-term investments | | | 661,557,033 | | |
Proceeds from investments sold short | | | 175,765,105 | | |
Net purchases from short-term investments | | | (8,539,448 | ) | |
Net realized (gains) from investments in securities | | | (4,508,882 | ) | |
Net realized losses from investments sold short | | | 3,683,443 | | |
Net change in unrealized appreciation/depreciation of investments in securities | | | 30,113,019 | | |
Net change in unrealized appreciation/depreciation of investments sold short | | | 692,672 | | |
Changes in operating assets and liabilities: | |
(Increase) decrease in assets: | |
Cash collateral on investments sold short | | | (42,534,764 | ) | |
Receivable for interest and dividends | | | 340,567 | | |
Unrealized appreciation on forward foreign currency contracts | | | 78,260 | | |
Receivable for foreign tax reclaims | | | (510,348 | ) | |
Other assets | | | (7,619 | ) | |
Increase (decrease) in liabilities: | |
Payable for cash collateral from securities loaned | | | 47,563,212 | | |
Payable for foreign withholding taxes and foreign capital gains taxes | | | (55,548 | ) | |
Payable to affiliate | | | (56,807 | ) | |
Payable for dividends and interest on investments sold short | | | 89,270 | | |
Payable to custodian | | | (92,724 | ) | |
Accrued expenses and other liabilities | | | 167,930 | | |
Net cash provided by operating activities | | | 19,951,771 | | |
Cash flows from financing activities | |
Proceeds from shares sold | | | 155,916,870 | | |
Cost of shares repurchased | | | (179,186,009 | ) | |
Dividends paid to shareholders | | | (1,483,405 | ) | |
Redemption fees | | | 20,422 | | |
Net cash used in financing activities | | | (24,732,122 | ) | |
Net decrease in cash and foreign currency | | | (4,780,351 | ) | |
Cash and foreign currency, beginning of year | | | 4,905,582 | | |
Cash and foreign currency, end of year | | $ | 125,231 | | |
Supplemental disclosure of cash flow information: | |
Reinvestment of dividends | | $ | (26,584,568 | ) | |
Cash paid during the year for interest | | $ | 963 | | |
See accompanying notes to financial statements.
282
PACE Select Advisors Trust
PACE Money Market Investments
Financial highlights
Selected financial data throughout each year is presented below:
| | | Class P | |
| | | Years ended July 31, | |
| | | 2015 | | 2014 | | 2013 | | 2012 | | 2011 | |
Net asset value, beginning of year | | $ | 1.00 | | | $ | 1.00 | | | $ | 1.00 | | | $ | 1.00 | | | $ | 1.00 | | |
Net investment income | | | 0.0001 | | | | 0.0001 | | | | 0.0001 | | | | 0.0001 | | | | 0.0001 | | |
Dividends from net investment income | | | (0.000 | )1 | | | (0.000 | )1 | | | (0.000 | )1 | | | (0.000 | )1 | | | (0.000 | )1 | |
Distributions from net realized gains | | | — | | | | (0.000 | )1 | | | — | | | | — | | | | (0.000 | )1 | |
Total dividends and distributions | | | (0.000 | )1 | | | (0.000 | )1 | | | (0.000 | )1 | | | (0.000 | )1 | | | (0.000 | )1 | |
Net asset value, end of year | | $ | 1.00 | | | $ | 1.00 | | | $ | 1.00 | | | $ | 1.00 | | | $ | 1.00 | | |
Total investment return2 | | | 0.01 | % | | | 0.01 | %3 | | | 0.01 | % | | | 0.01 | % | | | 0.01 | % | |
Ratios to average net assets: | |
Expenses before fee waivers and/or expense reimbursements | | | 0.93 | % | | | 0.91 | % | | | 0.88 | % | | | 0.89 | % | | | 0.88 | % | |
Expenses after fee waivers and/or expense reimbursements | | | 0.14 | % | | | 0.14 | % | | | 0.19 | % | | | 0.19 | % | | | 0.25 | % | |
Net investment income | | | 0.01 | % | | | 0.01 | % | | | 0.01 | % | | | 0.01 | % | | | 0.01 | % | |
Supplemental data: | |
Net assets, end of year (000's) | | $ | 168,503 | | | $ | 212,025 | | | $ | 309,842 | | | $ | 337,091 | | | $ | 365,844 | | |
1 Amount represents less than $0.0005 per share.
2 Total investment return is calculated assuming a $10,000 investment on the first day of each year reported, reinvestment of all dividends and other distributions, if any, at net asset value on the payable dates, and a sale at net asset value on the last day of each year reported. The figures do not include program fees; results would be lower if these were included. Returns do not reflect the deduction of taxes that a shareholder would pay on Portfolio distributions.
3 Payment from investment advisor as disclosed on page 338 had no impact on the Portfolio's Total investment return and represents less than $0.0005 per share.
See accompanying notes to financial statements.
283
PACE Select Advisors Trust
PACE Mortgage-Backed Securities Fixed Income Investments
Financial highlights
Selected data for a share of beneficial interest outstanding throughout each year is presented below:
| | | Class A | |
| | | Years ended July 31, | |
| | | 2015 | | 2014 | | 2013 | | 2012 | | 2011 | |
Net asset value, beginning of year | | $ | 12.82 | | | $ | 12.62 | | | $ | 13.46 | | | $ | 13.31 | | | $ | 13.71 | | |
Net investment income1 | | | 0.11 | | | | 0.15 | | | | 0.11 | | | | 0.22 | | | | 0.29 | | |
Net realized and unrealized gains (losses) | | | 0.26 | | | | 0.32 | | | | (0.39 | ) | | | 0.34 | | | | 0.20 | | |
Net increase (decrease) from operations | | | 0.37 | | | | 0.47 | | | | (0.28 | ) | | | 0.56 | | | | 0.49 | | |
Dividends from net investment income | | | (0.23 | ) | | | (0.27 | ) | | | (0.31 | ) | | | (0.34 | ) | | | (0.38 | ) | |
Distributions from net realized gains | | | — | | | | — | | | | (0.25 | ) | | | (0.07 | ) | | | (0.51 | ) | |
Total dividends and distributions | | | (0.23 | ) | | | (0.27 | ) | | | (0.56 | ) | | | (0.41 | ) | | | (0.89 | ) | |
Net asset value, end of year | | $ | 12.96 | | | $ | 12.82 | | | $ | 12.62 | | | $ | 13.46 | | | $ | 13.31 | | |
Total investment return2 | | | 2.86 | % | | | 3.74 | % | | | (2.29 | )% | | | 4.34 | % | | | 3.74 | % | |
Ratios to average net assets: | |
Expenses before fee waivers and/or expense reimbursements | | | 1.07 | % | | | 1.07 | % | | | 1.05 | % | | | 1.05 | % | | | 1.06 | %3 | |
Expenses after fee waivers and/or expense reimbursements | | | 0.97 | % | | | 0.97 | % | | | 0.99 | % | | | 1.02 | % | | | 1.02 | %3 | |
Net investment income | | | 0.87 | % | | | 1.17 | % | | | 0.83 | % | | | 1.68 | % | | | 2.16 | % | |
Supplemental data: | |
Net assets, end of year (000's) | | $ | 47,860 | | | $ | 59,834 | | | $ | 66,554 | | | $ | 78,764 | | | $ | 80,727 | | |
Portfolio turnover | | | 1,360 | % | | | 1,117 | % | | | 1,336 | % | | | 1,046 | % | | | 1,105 | % | |
| | | Class Y | |
| | | Years ended July 31, | |
| | | 2015 | | 2014 | | 2013 | | 2012 | | 2011 | |
Net asset value, beginning of year | | $ | 12.82 | | | $ | 12.62 | | | $ | 13.47 | | | $ | 13.31 | | | $ | 13.71 | | |
Net investment income1 | | | 0.15 | | | | 0.18 | | | | 0.14 | | | | 0.26 | | | | 0.32 | | |
Net realized and unrealized gains (losses) | | | 0.25 | | | | 0.32 | | | | (0.40 | ) | | | 0.35 | | | | 0.20 | | |
Net increase (decrease) from operations | | | 0.40 | | | | 0.50 | | | | (0.26 | ) | | | 0.61 | | | | 0.52 | | |
Dividends from net investment income | | | (0.26 | ) | | | (0.30 | ) | | | (0.34 | ) | | | (0.38 | ) | | | (0.41 | ) | |
Distributions from net realized gains | | | — | | | | — | | | | (0.25 | ) | | | (0.07 | ) | | | (0.51 | ) | |
Total dividends and distributions | | | (0.26 | ) | | | (0.30 | ) | | | (0.59 | ) | | | (0.45 | ) | | | (0.92 | ) | |
Net asset value, end of year | | $ | 12.96 | | | $ | 12.82 | | | $ | 12.62 | | | $ | 13.47 | | | $ | 13.31 | | |
Total investment return2 | | | 3.12 | % | | | 4.00 | % | | | (2.05 | )% | | | 4.60 | % | | | 4.00 | % | |
Ratios to average net assets: | |
Expenses before fee waivers and/or expense reimbursements | | | 0.86 | % | | | 0.87 | % | | | 0.85 | % | | | 0.86 | % | | | 0.88 | %3 | |
Expenses after fee waivers and/or expense reimbursements | | | 0.72 | % | | | 0.72 | % | | | 0.74 | % | | | 0.77 | % | | | 0.77 | %3 | |
Net investment income | | | 1.13 | % | | | 1.42 | % | | | 1.08 | % | | | 1.92 | % | | | 2.42 | % | |
Supplemental data: | |
Net assets, end of year (000's) | | $ | 46,071 | | | $ | 47,959 | | | $ | 57,567 | | | $ | 61,428 | | | $ | 50,830 | | |
Portfolio turnover | | | 1,360 | % | | | 1,117 | % | | | 1,336 | % | | | 1,046 | % | | | 1,105 | % | |
1 Calculated using the average shares method.
2 Total investment return is calculated assuming a $10,000 investment on the first day of each year reported, reinvestment of all dividends and other distributions, if any, at net asset value on the ex-dividend dates, and a sale at net asset value on the last day of each year reported. The figures do not include any applicable sales charges, redemption fees or program fees; results would be lower if they were included. Returns do not reflect the deduction of taxes that a shareholder would pay on Portfolio distributions or the redemption of Portfolio shares.
3 Includes interest expense representing less than 0.005%.
284
| | | Class C | |
| | | Years ended July 31, | |
| | | 2015 | | 2014 | | 2013 | | 2012 | | 2011 | |
Net asset value, beginning of year | | $ | 12.84 | | | $ | 12.63 | | | $ | 13.48 | | | $ | 13.32 | | | $ | 13.72 | | |
Net investment income1 | | | 0.05 | | | | 0.09 | | | | 0.04 | | | | 0.16 | | | | 0.22 | | |
Net realized and unrealized gains (losses) | | | 0.24 | | | | 0.32 | | | | (0.40 | ) | | | 0.34 | | | | 0.20 | | |
Net increase (decrease) from operations | | | 0.29 | | | | 0.41 | | | | (0.36 | ) | | | 0.50 | | | | 0.42 | | |
Dividends from net investment income | | | (0.16 | ) | | | (0.20 | ) | | | (0.24 | ) | | | (0.27 | ) | | | (0.31 | ) | |
Distributions from net realized gains | | | — | | | | — | | | | (0.25 | ) | | | (0.07 | ) | | | (0.51 | ) | |
Total dividends and distributions | | | (0.16 | ) | | | (0.20 | ) | | | (0.49 | ) | | | (0.34 | ) | | | (0.82 | ) | |
Net asset value, end of year | | $ | 12.97 | | | $ | 12.84 | | | $ | 12.63 | | | $ | 13.48 | | | $ | 13.32 | | |
Total investment return2 | | | 2.27 | % | | | 3.29 | % | | | (2.78 | )% | | | 3.81 | % | | | 3.22 | % | |
Ratios to average net assets: | |
Expenses before fee waivers and/or expense reimbursements | | | 1.59 | % | | | 1.59 | % | | | 1.56 | % | | | 1.56 | % | | | 1.58 | %3 | |
Expenses after fee waivers and/or expense reimbursements | | | 1.47 | % | | | 1.47 | % | | | 1.49 | % | | | 1.52 | % | | | 1.52 | %3 | |
Net investment income | | | 0.37 | % | | | 0.67 | % | | | 0.33 | % | | | 1.19 | % | | | 1.66 | % | |
Supplemental data: | |
Net assets, end of year (000's) | | $ | 12,887 | | | $ | 13,958 | | | $ | 16,907 | | | $ | 20,710 | | | $ | 22,064 | | |
Portfolio turnover | | | 1,360 | % | | | 1,117 | % | | | 1,336 | % | | | 1,046 | % | | | 1,105 | % | |
| | | Class P | |
| | | Years ended July 31, | |
| | | 2015 | | 2014 | | 2013 | | 2012 | | 2011 | |
Net asset value, beginning of year | | $ | 12.83 | | | $ | 12.63 | | | $ | 13.47 | | | $ | 13.32 | | | $ | 13.71 | | |
Net investment income1 | | | 0.15 | | | | 0.18 | | | | 0.14 | | | | 0.26 | | | | 0.32 | | |
Net realized and unrealized gains (losses) | | | 0.24 | | | | 0.32 | | | | (0.39 | ) | | | 0.34 | | | | 0.21 | | |
Net increase (decrease) from operations | | | 0.39 | | | | 0.50 | | | | (0.25 | ) | | | 0.60 | | | | 0.53 | | |
Dividends from net investment income | | | (0.26 | ) | | | (0.30 | ) | | | (0.34 | ) | | | (0.38 | ) | | | (0.41 | ) | |
Distributions from net realized gains | | | — | | | | — | | | | (0.25 | ) | | | (0.07 | ) | | | (0.51 | ) | |
Total dividends and distributions | | | (0.26 | ) | | | (0.30 | ) | | | (0.59 | ) | | | (0.45 | ) | | | (0.92 | ) | |
Net asset value, end of year | | $ | 12.96 | | | $ | 12.83 | | | $ | 12.63 | | | $ | 13.47 | | | $ | 13.32 | | |
Total investment return2 | | | 3.04 | % | | | 4.00 | % | | | (1.97 | )% | | | 4.52 | % | | | 4.08 | % | |
Ratios to average net assets: | |
Expenses before fee waivers and/or expense reimbursements | | | 0.91 | % | | | 0.90 | % | | | 0.86 | % | | | 0.85 | % | | | 0.86 | %3 | |
Expenses after fee waivers and/or expense reimbursements | | | 0.72 | % | | | 0.72 | % | | | 0.74 | % | | | 0.77 | % | | | 0.77 | %3 | |
Net investment income | | | 1.13 | % | | | 1.41 | % | | | 1.08 | % | | | 1.93 | % | | | 2.41 | % | |
Supplemental data: | |
Net assets, end of year (000's) | | $ | 422,604 | | | $ | 435,063 | | | $ | 447,362 | | | $ | 453,841 | | | $ | 453,931 | | |
Portfolio turnover | | | 1,360 | % | | | 1,117 | % | | | 1,336 | % | | | 1,046 | % | | | 1,105 | % | |
See accompanying notes to financial statements.
285
PACE Select Advisors Trust
PACE Intermediate Fixed Income Investments
Financial highlights
Selected data for a share of beneficial interest outstanding throughout each year is presented below:
| | Class A | |
| | Years ended July 31, | |
| | 2015 | | 2014 | | 2013 | | 2012 | | 2011 | |
Net asset value, beginning of year | | $ | 12.33 | | | $ | 12.20 | | | $ | 12.42 | | | $ | 12.15 | | | $ | 12.02 | | |
Net investment income1 | | | 0.16 | | | | 0.14 | | | | 0.12 | | | | 0.21 | | | | 0.26 | | |
Net realized and unrealized gains (losses) | | | 0.04 | | | | 0.14 | | | | (0.22 | ) | | | 0.28 | | | | 0.12 | | |
Net increase (decrease) from operations | | | 0.20 | | | | 0.28 | | | | (0.10 | ) | | | 0.49 | | | | 0.38 | | |
Dividends from net investment income | | | (0.16 | ) | | | (0.15 | ) | | | (0.12 | ) | | | (0.22 | ) | | | (0.25 | ) | |
Distributions from net realized gains | | | (0.01 | ) | | | — | | | | — | | | | — | | | | — | | |
Total dividends and distributions | | | (0.17 | ) | | | (0.15 | ) | | | (0.12 | ) | | | (0.22 | ) | | | (0.25 | ) | |
Net asset value, end of year | | $ | 12.36 | | | $ | 12.33 | | | $ | 12.20 | | | $ | 12.42 | | | $ | 12.15 | | |
Total investment return2 | | | 1.64 | % | | | 2.30 | % | | | (0.93 | )% | | | 4.16 | % | | | 3.24 | % | |
Ratios to average net assets: | |
Expenses before fee waivers and/or expense reimbursements | | | 1.03 | %3 | | | 1.03 | % | | | 0.99 | %3 | | | 1.00 | % | | | 0.99 | %3 | |
Expenses after fee waivers and/or expense reimbursements | | | 0.93 | %3 | | | 0.93 | % | | | 0.93 | %3 | | | 0.93 | % | | | 0.93 | %3 | |
Net investment income | | | 1.26 | % | | | 1.18 | % | | | 0.98 | % | | | 1.73 | % | | | 2.18 | % | |
Supplemental data: | |
Net assets, end of year (000's) | | $ | 19,932 | | | $ | 28,080 | | | $ | 31,355 | | | $ | 36,665 | | | $ | 39,022 | | |
Portfolio turnover | | | 476 | % | | | 827 | % | | | 818 | % | | | 398 | % | | | 664 | % | |
| | Class Y | |
| | Years ended July 31, | |
| | 2015 | | 2014 | | 2013 | | 2012 | | 2011 | |
Net asset value, beginning of year | | $ | 12.33 | | | $ | 12.20 | | | $ | 12.43 | | | $ | 12.15 | | | $ | 12.02 | | |
Net investment income1 | | | 0.19 | | | | 0.18 | | | | 0.15 | | | | 0.24 | | | | 0.29 | | |
Net realized and unrealized gains (losses) | | | 0.04 | | | | 0.13 | | | | (0.23 | ) | | | 0.29 | | | | 0.12 | | |
Net increase (decrease) from operations | | | 0.23 | | | | 0.31 | | | | (0.08 | ) | | | 0.53 | | | | 0.41 | | |
Dividends from net investment income | | | (0.19 | ) | | | (0.18 | ) | | | (0.15 | ) | | | (0.25 | ) | | | (0.28 | ) | |
Distributions from net realized gains | | | (0.01 | ) | | | — | | | | — | | | | — | | | | — | | |
Total dividends and distributions | | | (0.20 | ) | | | (0.18 | ) | | | (0.15 | ) | | | (0.25 | ) | | | (0.28 | ) | |
Net asset value, end of year | | $ | 12.36 | | | $ | 12.33 | | | $ | 12.20 | | | $ | 12.43 | | | $ | 12.15 | | |
Total investment return2 | | | 1.90 | % | | | 2.56 | % | | | (0.68 | )% | | | 4.42 | % | | | 3.49 | % | |
Ratios to average net assets: | |
Expenses before fee waivers and/or expense reimbursements | | | 0.86 | %3 | | | 1.05 | % | | | 0.89 | %3 | | | 0.88 | % | | | 0.83 | %3 | |
Expenses after fee waivers and/or expense reimbursements | | | 0.68 | %3 | | | 0.68 | % | | | 0.68 | %3 | | | 0.68 | % | | | 0.68 | %3 | |
Net investment income | | | 1.51 | % | | | 1.43 | % | | | 1.24 | % | | | 1.99 | % | | | 2.42 | % | |
Supplemental data: | |
Net assets, end of year (000's) | | $ | 444 | | | $ | 543 | | | $ | 674 | | | $ | 990 | | | $ | 1,277 | | |
Portfolio turnover | | | 476 | % | | | 827 | % | | | 818 | % | | | 398 | % | | | 664 | % | |
1 Calculated using the average shares method.
2 Total investment return is calculated assuming a $10,000 investment on the first day of each year reported, reinvestment of all dividends and other distributions, if any, at net asset value on the ex-dividend dates, and a sale at net asset value on the last day of each year reported. The figures do not include any applicable sales charges, redemption fees or program fees; results would be lower if they were included. Returns do not reflect the deduction of taxes that a shareholder would pay on Portfolio distributions or the redemption of Portfolio shares.
3 Includes interest expense representing less than 0.005%.
286
| | Class C | |
| | Years ended July 31, | |
| | 2015 | | 2014 | | 2013 | | 2012 | | 2011 | |
Net asset value, beginning of year | | $ | 12.35 | | | $ | 12.22 | | | $ | 12.44 | | | $ | 12.17 | | | $ | 12.03 | | |
Net investment income1 | | | 0.09 | | | | 0.08 | | | | 0.06 | | | | 0.15 | | | | 0.20 | | |
Net realized and unrealized gains (losses) | | | 0.04 | | | | 0.14 | | | | (0.23 | ) | | | 0.28 | | | | 0.13 | | |
Net increase (decrease) from operations | | | 0.13 | | | | 0.22 | | | | (0.17 | ) | | | 0.43 | | | | 0.33 | | |
Dividends from net investment income | | | (0.10 | ) | | | (0.09 | ) | | | (0.05 | ) | | | (0.16 | ) | | | (0.19 | ) | |
Distributions from net realized gains | | | (0.01 | ) | | | — | | | | — | | | | — | | | | — | | |
Total dividends and distributions | | | (0.11 | ) | | | (0.09 | ) | | | (0.05 | ) | | | (0.16 | ) | | | (0.19 | ) | |
Net asset value, end of year | | $ | 12.37 | | | $ | 12.35 | | | $ | 12.22 | | | $ | 12.44 | | | $ | 12.17 | | |
Total investment return2 | | | 1.05 | % | | | 1.78 | % | | | (1.34 | )% | | | 3.55 | % | | | 2.80 | % | |
Ratios to average net assets: | |
Expenses before fee waivers and/or expense reimbursements | | | 1.53 | %3 | | | 1.52 | % | | | 1.49 | %3 | | | 1.51 | % | | | 1.49 | %3 | |
Expenses after fee waivers and/or expense reimbursements | | | 1.43 | %3 | | | 1.43 | % | | | 1.43 | %3 | | | 1.43 | % | | | 1.43 | %3 | |
Net investment income | | | 0.76 | % | | | 0.68 | % | | | 0.48 | % | | | 1.23 | % | | | 1.67 | % | |
Supplemental data: | |
Net assets, end of year (000's) | | $ | 1,931 | | | $ | 2,260 | | | $ | 2,685 | | | $ | 3,270 | | | $ | 3,474 | | |
Portfolio turnover | | | 476 | % | | | 827 | % | | | 818 | % | | | 398 | % | | | 664 | % | |
| | Class P | |
| | Years ended July 31, | |
| | 2015 | | 2014 | | 2013 | | 2012 | | 2011 | |
Net asset value, beginning of year | | $ | 12.33 | | | $ | 12.20 | | | $ | 12.43 | | | $ | 12.16 | | | $ | 12.02 | | |
Net investment income1 | | | 0.19 | | | | 0.18 | | | | 0.15 | | | | 0.24 | | | | 0.29 | | |
Net realized and unrealized gains (losses) | | | 0.04 | | | | 0.13 | | | | (0.23 | ) | | | 0.28 | | | | 0.13 | | |
Net increase (decrease) from operations | | | 0.23 | | | | 0.31 | | | | (0.08 | ) | | | 0.52 | | | | 0.42 | | |
Dividends from net investment income | | | (0.19 | ) | | | (0.18 | ) | | | (0.15 | ) | | | (0.25 | ) | | | (0.28 | ) | |
Distributions from net realized gains | | | (0.01 | ) | | | — | | | | — | | | | — | | | | — | | |
Total dividends and distributions | | | (0.20 | ) | | | (0.18 | ) | | | (0.15 | ) | | | (0.25 | ) | | | (0.28 | ) | |
Net asset value, end of year | | $ | 12.36 | | | $ | 12.33 | | | $ | 12.20 | | | $ | 12.43 | | | $ | 12.16 | | |
Total investment return2 | | | 1.90 | % | | | 2.56 | % | | | (0.68 | )% | | | 4.33 | % | | | 3.58 | % | |
Ratios to average net assets: | |
Expenses before fee waivers and/or expense reimbursements | | | 0.83 | %3 | | | 0.82 | % | | | 0.74 | %3 | | | 0.74 | % | | | 0.72 | %3 | |
Expenses after fee waivers and/or expense reimbursements | | | 0.68 | %3 | | | 0.68 | % | | | 0.68 | %3 | | | 0.68 | % | | | 0.68 | %3 | |
Net investment income | | | 1.51 | % | | | 1.43 | % | | | 1.22 | % | | | 1.97 | % | | | 2.43 | % | |
Supplemental data: | |
Net assets, end of year (000's) | | $ | 403,358 | | | $ | 417,011 | | | $ | 415,894 | | | $ | 421,822 | | | $ | 411,723 | | |
Portfolio turnover | | | 476 | % | | | 827 | % | | | 818 | % | | | 398 | % | | | 664 | % | |
See accompanying notes to financial statements.
287
PACE Select Advisors Trust
PACE Strategic Fixed Income Investments
Financial highlights
Selected data for a share of beneficial interest outstanding throughout each year is presented below:
| | Class A | |
| | Years ended July 31, | |
| | 2015 | | 2014 | | 2013 | | 2012 | | 2011 | |
Net asset value, beginning of year | | $ | 13.90 | | | $ | 14.16 | | | $ | 15.29 | | | $ | 14.55 | | | $ | 14.56 | | |
Net investment income1 | | | 0.35 | | | | 0.37 | | | | 0.41 | | | | 0.42 | | | | 0.48 | | |
Net realized and unrealized gains (losses) | | | 0.01 | | | | 0.11 | | | | (0.78 | ) | | | 1.11 | | | | 0.43 | | |
Net increase (decrease) from operations | | | 0.36 | | | | 0.48 | | | | (0.37 | ) | | | 1.53 | | | | 0.91 | | |
Dividends from net investment income | | | (0.33 | ) | | | (0.28 | ) | | | (0.43 | ) | | | (0.52 | ) | | | (0.51 | ) | |
Distributions from net realized gains | | | — | | | | (0.37 | ) | | | (0.33 | ) | | | (0.27 | ) | | | (0.41 | ) | |
Return of capital | | | — | | | | (0.09 | ) | | | — | | | | — | | | | — | | |
Total dividends, distributions and return of capital | | | (0.33 | ) | | | (0.74 | ) | | | (0.76 | ) | | | (0.79 | ) | | | (0.92 | ) | |
Net asset value, end of year | | $ | 13.93 | | | $ | 13.90 | | | $ | 14.16 | | | $ | 15.29 | | | $ | 14.55 | | |
Total investment return2 | | | 2.69 | % | | | 3.51 | % | | | (2.60 | )% | | | 10.86 | % | | | 6.54 | % | |
Ratios to average net assets: | |
Expenses before fee waivers and/or expense reimbursements/recoupments,
including interest expense | | | 1.07 | % | | | 1.06 | %3 | | | 1.03 | %3 | | | 1.04 | %3 | | | 1.09 | % | |
Expenses after fee waivers and/or expense reimbursements/recoupments,
including interest expense | | | 1.05 | % | | | 1.06 | %3 | | | 1.06 | %3,4 | | | 1.06 | %3,4 | | | 1.06 | % | |
Expenses after fee waivers and/or expense reimbursement/recoupments,
excluding interest expense | | | 1.03 | % | | | 1.05 | % | | | 1.05 | %4 | | | 1.06 | %4 | | | 1.06 | % | |
Net investment income | | | 2.52 | % | | | 2.63 | % | | | 2.72 | % | | | 2.85 | % | | | 3.38 | % | |
Supplemental data: | |
Net assets, end of year (000's) | | $ | 13,699 | | | $ | 44,465 | | | $ | 67,417 | | | $ | 85,571 | | | $ | 56,151 | | |
Portfolio turnover | | | 154 | % | | | 154 | % | | | 186 | % | | | 162 | % | | | 444 | % | |
| | Class Y | |
| | Years ended July 31, | |
| | 2015 | | 2014 | | 2013 | | 2012 | | 2011 | |
Net asset value, beginning of year | | $ | 13.89 | | | $ | 14.15 | | | $ | 15.28 | | | $ | 14.54 | | | $ | 14.54 | | |
Net investment income1 | | | 0.37 | | | | 0.40 | | | | 0.42 | | | | 0.46 | | | | 0.52 | | |
Net realized and unrealized gains (losses) | | | 0.02 | | | | 0.12 | | | | (0.76 | ) | | | 1.10 | | | | 0.44 | | |
Net increase (decrease) from operations | | | 0.39 | | | | 0.52 | | | | (0.34 | ) | | | 1.56 | | | | 0.96 | | |
Dividends from net investment income | | | (0.37 | ) | | | (0.31 | ) | | | (0.46 | ) | | | (0.55 | ) | | | (0.55 | ) | |
Distributions from net realized gains | | | — | | | | (0.37 | ) | | | (0.33 | ) | | | (0.27 | ) | | | (0.41 | ) | |
Return of capital | | | — | | | | (0.10 | ) | | | — | | | | — | | | | — | | |
Total dividends, distributions and return of capital | | | (0.37 | ) | | | (0.78 | ) | | | (0.79 | ) | | | (0.82 | ) | | | (0.96 | ) | |
Net asset value, end of year | | $ | 13.91 | | | $ | 13.89 | | | $ | 14.15 | | | $ | 15.28 | | | $ | 14.54 | | |
Total investment return2 | | | 2.81 | % | | | 3.82 | % | | | (2.38 | )% | | | 11.10 | % | | | 6.80 | % | |
Ratios to average net assets: | |
Expenses before fee waivers and/or expense reimbursements/recoupments,
including interest expense | | | 0.93 | % | | | 0.93 | %3 | | | 0.90 | %3 | | | 0.89 | %3 | | | 0.96 | % | |
Expenses after fee waivers and/or expense reimbursements/recoupments,
including interest expense | | | 0.83 | % | | | 0.81 | %3 | | | 0.81 | %3 | | | 0.81 | %3 | | | 0.81 | % | |
Expenses after fee waivers and/or expense reimbursements/recoupments,
excluding interest expenses | | | 0.81 | % | | | 0.81 | % | | | 0.81 | % | | | 0.81 | % | | | 0.81 | % | |
Net investment income | | | 2.66 | % | | | 2.90 | % | | | 2.80 | % | | | 3.09 | % | | | 3.62 | % | |
Supplemental data: | |
Net assets, end of year (000's) | | $ | 2,543 | | | $ | 3,158 | | | $ | 3,638 | | | $ | 5,907 | | | $ | 2,810 | | |
Portfolio turnover | | | 154 | % | | | 154 | % | | | 186 | % | | | 162 | % | | | 444 | % | |
1 Calculated using the average shares method.
2 Total investment return is calculated assuming a $10,000 investment on the first day of each year reported, reinvestment of all dividends and other distributions, if any, at net asset value on the ex-dividend dates, and a sale at net asset value on the last day of each year reported. The figures do not include any applicable sales charges or program fees; results would be lower if they were included. Returns do not reflect the deduction of taxes that a shareholder would pay on Portfolio distributions or the redemption of Portfolio shares.
3 Includes interest expense representing less than 0.005%.
288
| | Class C | |
| | Years ended July 31, | |
| | 2015 | | 2014 | | 2013 | | 2012 | | 2011 | |
Net asset value, beginning of year | | $ | 13.91 | | | $ | 14.17 | | | $ | 15.29 | | | $ | 14.56 | | | $ | 14.56 | | |
Net investment income1 | | | 0.28 | | | | 0.30 | | | | 0.34 | | | | 0.35 | | | | 0.42 | | |
Net realized and unrealized gains (losses) | | | 0.01 | | | | 0.11 | | | | (0.78 | ) | | | 1.10 | | | | 0.43 | | |
Net increase (decrease) from operations | | | 0.29 | | | | 0.41 | | | | (0.44 | ) | | | 1.45 | | | | 0.85 | | |
Dividends from net investment income | | | (0.27 | ) | | | (0.23 | ) | | | (0.35 | ) | | | (0.45 | ) | | | (0.44 | ) | |
Distributions from net realized gains | | | — | | | | (0.37 | ) | | | (0.33 | ) | | | (0.27 | ) | | | (0.41 | ) | |
Return of capital | | | — | | | | (0.07 | ) | | | — | | | | — | | | | — | | |
Total dividends, distributions and return of capital | | | (0.27 | ) | | | (0.67 | ) | | | (0.68 | ) | | | (0.72 | ) | | | (0.85 | ) | |
Net asset value, end of year | | $ | 13.93 | | | $ | 13.91 | | | $ | 14.17 | | | $ | 15.29 | | | $ | 14.56 | | |
Total investment return2 | | | 2.16 | % | | | 3.03 | % | | | (2.99 | )% | | | 10.25 | % | | | 6.10 | % | |
Ratios to average net assets: | |
Expenses before fee waivers and/or expense reimbursements/recoupments,
including interest expense | | | 1.54 | % | | | 1.53 | %3 | | | 1.51 | %3 | | | 1.52 | %3 | | | 1.53 | % | |
Expenses after fee waivers and/or expense reimbursements/recoupments,
including interest expense | | | 1.52 | % | | | 1.53 | %3 | | | 1.51 | %3 | | | 1.52 | %3 | | | 1.55 | %3 | |
Expenses after fee waivers and/or expense reimbursement/recoupments,
excluding interest expense | | | 1.50 | % | | | 1.52 | % | | | 1.51 | % | | | 1.52 | % | | | 1.55 | %4 | |
Net investment income | | | 1.98 | % | | | 2.17 | % | | | 2.26 | % | | | 2.38 | % | | | 2.88 | % | |
Supplemental data: | |
Net assets, end of year (000's) | | $ | 11,752 | | | $ | 15,143 | | | $ | 20,992 | | | $ | 21,193 | | | $ | 12,856 | | |
Portfolio turnover | | | 154 | % | | | 154 | % | | | 186 | % | | | 162 | % | | | 444 | % | |
| | Class P | |
| | Years ended July 31, | |
| | 2015 | | 2014 | | 2013 | | 2012 | | 2011 | |
Net asset value, beginning of year | | $ | 13.90 | | | $ | 14.16 | | | $ | 15.29 | | | $ | 14.55 | | | $ | 14.55 | | |
Net investment income1 | | | 0.38 | | | | 0.40 | | | | 0.44 | | | | 0.46 | | | | 0.52 | | |
Net realized and unrealized gains (losses) | | | 0.01 | | | | 0.11 | | | | (0.78 | ) | | | 1.10 | | | | 0.44 | | |
Net increase (decrease) from operations | | | 0.39 | | | | 0.51 | | | | (0.34 | ) | | | 1.56 | | | | 0.96 | | |
Dividends from net investment income | | | (0.37 | ) | | | (0.30 | ) | | | (0.46 | ) | | | (0.55 | ) | | | (0.55 | ) | |
Distributions from net realized gains | | | — | | | | (0.37 | ) | | | (0.33 | ) | | | (0.27 | ) | | | (0.41 | ) | |
Return of capital | | | — | | | | (0.10 | ) | | | — | | | | — | | | | — | | |
Total dividends, distributions and return of capital | | | (0.37 | ) | | | (0.77 | ) | | | (0.79 | ) | | | (0.82 | ) | | | (0.96 | ) | |
Net asset value, end of year | | $ | 13.92 | | | $ | 13.90 | | | $ | 14.16 | | | $ | 15.29 | | | $ | 14.55 | | |
Total investment return2 | | | 2.91 | % | | | 3.77 | % | | | (2.37 | )% | | | 11.09 | % | | | 6.88 | % | |
Ratios to average net assets: | |
Expenses before fee waivers and/or expense reimbursements/recoupments,
including interest expense | | | 0.82 | % | | | 0.81 | %3 | | | 0.81 | %3 | | | 0.82 | %3 | | | 0.84 | % | |
Expenses after fee waivers and/or expense reimbursements/recoupments,
including interest expense | | | 0.80 | % | | | 0.81 | %3,4 | | | 0.81 | %3 | | | 0.81 | %3 | | | 0.81 | % | |
Expenses after fee waivers and/or expense reimbursements/recoupments,
excluding interest expenses | | | 0.78 | % | | | 0.81 | %4 | | | 0.81 | % | | | 0.81 | % | | | 0.81 | % | |
Net investment income | | | 2.69 | % | | | 2.90 | % | | | 2.96 | % | | | 3.10 | % | | | 3.63 | % | |
Supplemental data: | |
Net assets, end of year (000's) | | $ | 893,373 | | | $ | 889,402 | | | $ | 833,352 | | | $ | 795,829 | | | $ | 746,653 | | |
Portfolio turnover | | | 154 | % | | | 154 | % | | | 186 | % | | | 162 | % | | | 444 | % | |
4 The investment manager recouped expenses previously reimbursed by the investment manager on behalf of the Portfolio, not to exceed the expense cap.
See accompanying notes to financial statements.
289
PACE Select Advisors Trust
PACE Municipal Fixed Income Investments
Financial highlights
Selected data for a share of beneficial interest outstanding throughout each year is presented below:
| | | Class A | |
| | | Years ended July 31, | |
| | | 2015 | | 2014 | | 2013 | | 2012 | | 2011 | |
Net asset value, beginning of year | | $ | 13.19 | | | $ | 12.91 | | | $ | 13.56 | | | $ | 13.00 | | | $ | 12.94 | | |
Net investment income1 | | | 0.32 | | | | 0.34 | | | | 0.33 | | | | 0.37 | | | | 0.38 | | |
Net realized and unrealized gains (losses) | | | (0.05 | ) | | | 0.38 | | | | (0.59 | ) | | | 0.56 | | | | 0.06 | | |
Net increase (decrease) from operations | | | 0.27 | | | | 0.72 | | | | (0.26 | ) | | | 0.93 | | | | 0.44 | | |
Dividends from net investment income | | | (0.32 | ) | | | (0.34 | ) | | | (0.33 | ) | | | (0.37 | ) | | | (0.38 | ) | |
Distributions from net realized gains | | | — | | | | (0.10 | ) | | | (0.06 | ) | | | — | | | | — | | |
Total dividends and distributions | | | (0.32 | ) | | | (0.44 | ) | | | (0.39 | ) | | | (0.37 | ) | | | (0.38 | ) | |
Net asset value, end of year | | $ | 13.14 | | | $ | 13.19 | | | $ | 12.91 | | | $ | 13.56 | | | $ | 13.00 | | |
Total investment return2 | | | 2.07 | % | | | 5.64 | % | | | (1.99 | )% | | | 7.21 | % | | | 3.49 | % | |
Ratios to average net assets: | |
Expenses before fee waivers and/or expense reimbursements/recoupments | | | 0.92 | % | | | 0.92 | % | | | 0.93 | % | | | 0.95 | % | | | 0.94 | % | |
Expenses after fee waivers and/or expense reimbursements/recoupments | | | 0.90 | %3 | | | 0.90 | % | | | 0.91 | % | | | 0.93 | % | | | 0.93 | % | |
Net investment income | | | 2.42 | % | | | 2.59 | % | | | 2.47 | % | | | 2.75 | % | | | 2.96 | % | |
Supplemental data: | |
Net assets, end of year (000's) | | $ | 53,923 | | | $ | 63,225 | | | $ | 63,540 | | | $ | 71,639 | | | $ | 73,528 | | |
Portfolio turnover | | | 21 | % | | | 30 | % | | | 69 | % | | | 32 | % | | | 34 | % | |
| | | Class Y | |
| | | Years ended July 31, | |
| | | 2015 | | 2014 | | 2013 | | 2012 | | 2011 | |
Net asset value, beginning of year | | $ | 13.20 | | | $ | 12.92 | | | $ | 13.57 | | | $ | 13.00 | | | $ | 12.95 | | |
Net investment income1 | | | 0.35 | | | | 0.37 | | | | 0.37 | | | | 0.40 | | | | 0.41 | | |
Net realized and unrealized gains (losses) | | | (0.05 | ) | | | 0.38 | | | | (0.60 | ) | | | 0.57 | | | | 0.05 | | |
Net increase (decrease) from operations | | | 0.30 | | | | 0.75 | | | | (0.23 | ) | | | 0.97 | | | | 0.46 | | |
Dividends from net investment income | | | (0.35 | ) | | | (0.37 | ) | | | (0.36 | ) | | | (0.40 | ) | | | (0.41 | ) | |
Distributions from net realized gains | | | — | | | | (0.10 | ) | | | (0.06 | ) | | | — | | | | — | | |
Total dividends and distributions | | | (0.35 | ) | | | (0.47 | ) | | | (0.42 | ) | | | (0.40 | ) | | | (0.41 | ) | |
Net asset value, end of year | | $ | 13.15 | | | $ | 13.20 | | | $ | 12.92 | | | $ | 13.57 | | | $ | 13.00 | | |
Total investment return2 | | | 2.32 | % | | | 5.89 | % | | | (1.74 | )% | | | 7.56 | % | | | 3.67 | % | |
Ratios to average net assets: | |
Expenses before fee waivers and/or expense reimbursements/recoupments | | | 0.70 | % | | | 0.72 | % | | | 0.72 | % | | | 0.73 | % | | | 0.74 | % | |
Expenses after fee waivers and/or expense reimbursements/recoupments | | | 0.65 | % | | | 0.65 | % | | | 0.66 | % | | | 0.68 | % | | | 0.68 | % | |
Net investment income | | | 2.67 | % | | | 2.84 | % | | | 2.72 | % | | | 3.00 | % | | | 3.21 | % | |
Supplemental data: | |
Net assets, end of year (000's) | | $ | 81 | | | $ | 83 | | | $ | 82 | | | $ | 121 | | | $ | 118 | | |
Portfolio turnover | | | 21 | % | | | 30 | % | | | 69 | % | | | 32 | % | | | 34 | % | |
1 Calculated using the average shares method.
2 Total investment return is calculated assuming a $10,000 investment on the first day of each year reported, reinvestment of all dividends and other distributions, if any, at net asset value on the ex-dividend dates, and a sale at net asset value on the last day of each year reported. The figures do not include any applicable sales charges, redemption fees or program fees; results would be lower if they were included. Returns do not reflect the deduction of taxes that a shareholder could pay on Portfolio distributions or the redemption of Portfolio shares.
3 The investment manager recouped expenses previously reimbursed by the investment manager on behalf of the Portfolio, not to exceed the expense cap.
290
| | | Class C | |
| | | Years ended July 31, | |
| | | 2015 | | 2014 | | 2013 | | 2012 | | 2011 | |
Net asset value, beginning of year | | $ | 13.19 | | | $ | 12.91 | | | $ | 13.57 | | | $ | 13.00 | | | $ | 12.94 | | |
Net investment income1 | | | 0.25 | | | | 0.27 | | | | 0.26 | | | | 0.30 | | | | 0.32 | | |
Net realized and unrealized gains (losses) | | | (0.05 | ) | | | 0.38 | | | | (0.60 | ) | | | 0.57 | | | | 0.06 | | |
Net increase (decrease) from operations | | | 0.20 | | | | 0.65 | | | | (0.34 | ) | | | 0.87 | | | | 0.38 | | |
Dividends from net investment income | | | (0.25 | ) | | | (0.27 | ) | | | (0.26 | ) | | | (0.30 | ) | | | (0.32 | ) | |
Distributions from net realized gains | | | — | | | | (0.10 | ) | | | (0.06 | ) | | | — | | | | — | | |
Total dividends and distributions | | | (0.25 | ) | | | (0.37 | ) | | | (0.32 | ) | | | (0.30 | ) | | | (0.32 | ) | |
Net asset value, end of year | | $ | 13.14 | | | $ | 13.19 | | | $ | 12.91 | | | $ | 13.57 | | | $ | 13.00 | | |
Total investment return2 | | | 1.55 | % | | | 5.10 | % | | | (2.56 | )% | | | 6.76 | % | | | 2.97 | % | |
Ratios to average net assets: | |
Expenses before fee waivers and/or expense reimbursements/recoupments | | | 1.42 | % | | | 1.43 | % | | | 1.44 | % | | | 1.45 | % | | | 1.45 | % | |
Expenses after fee waivers and/or expense reimbursements/recoupments | | | 1.40 | % | | | 1.40 | % | | | 1.41 | % | | | 1.43 | % | | | 1.43 | % | |
Net investment income | | | 1.92 | % | | | 2.09 | % | | | 1.97 | % | | | 2.25 | % | | | 2.46 | % | |
Supplemental data: | |
Net assets, end of year (000's) | | $ | 10,388 | | | $ | 11,033 | | | $ | 12,336 | | | $ | 13,684 | | | $ | 13,943 | | |
Portfolio turnover | | | 21 | % | | | 30 | % | | | 69 | % | | | 32 | % | | | 34 | % | |
| | | Class P | |
| | | Years ended July 31, | |
| | | 2015 | | 2014 | | 2013 | | 2012 | | 2011 | |
Net asset value, beginning of year | | $ | 13.19 | | | $ | 12.91 | | | $ | 13.57 | | | $ | 13.00 | | | $ | 12.95 | | |
Net investment income1 | | | 0.35 | | | | 0.37 | | | | 0.36 | | | | 0.40 | | | | 0.41 | | |
Net realized and unrealized gains (losses) | | | (0.04 | ) | | | 0.38 | | | | (0.60 | ) | | | 0.57 | | | | 0.05 | | |
Net increase (decrease) from operations | | | 0.31 | | | | 0.75 | | | | (0.24 | ) | | | 0.97 | | | | 0.46 | | |
Dividends from net investment income | | | (0.35 | ) | | | (0.37 | ) | | | (0.36 | ) | | | (0.40 | ) | | | (0.41 | ) | |
Distributions from net realized gains | | | — | | | | (0.10 | ) | | | (0.06 | ) | | | — | | | | — | | |
Total dividends and distributions | | | (0.35 | ) | | | (0.47 | ) | | | (0.42 | ) | | | (0.40 | ) | | | (0.41 | ) | |
Net asset value, end of year | | $ | 13.15 | | | $ | 13.19 | | | $ | 12.91 | | | $ | 13.57 | | | $ | 13.00 | | |
Total investment return2 | | | 2.39 | % | | | 5.90 | % | | | (1.82 | )% | | | 7.56 | % | | | 3.67 | % | |
Ratios to average net assets: | |
Expenses before fee waivers and/or expense reimbursements/recoupments | | | 0.67 | % | | | 0.68 | % | | | 0.70 | % | | | 0.72 | % | | | 0.72 | % | |
Expenses after fee waivers and/or expense reimbursements/recoupments | | | 0.65 | % | | | 0.65 | % | | | 0.66 | % | | | 0.68 | % | | | 0.68 | % | |
Net investment income | | | 2.67 | % | | | 2.84 | % | | | 2.70 | % | | | 3.00 | % | | | 3.21 | % | |
Supplemental data: | |
Net assets, end of year (000's) | | $ | 345,157 | | | $ | 334,999 | | | $ | 300,838 | | | $ | 231,010 | | | $ | 229,062 | | |
Portfolio turnover | | | 21 | % | | | 30 | % | | | 69 | % | | | 32 | % | | | 34 | % | |
See accompanying notes to financial statements.
291
PACE Select Advisors Trust
PACE International Fixed Income Investments
Financial highlights
Selected data for a share of beneficial interest outstanding throughout each year is presented below:
| | | Class A | |
| | | Years ended July 31, | |
| | | 2015 | | 2014 | | 2013 | | 2012 | | 2011 | |
Net asset value, beginning of year | | $ | 10.82 | | | $ | 10.56 | | | $ | 11.40 | | | $ | 12.52 | | | $ | 11.43 | | |
Net investment income1 | | | 0.16 | | | | 0.19 | | | | 0.19 | | | | 0.25 | | | | 0.26 | | |
Net realized and unrealized gains (losses) | | | (0.71 | ) | | | 0.34 | | | | (0.72 | ) | | | (0.56 | ) | | | 1.13 | | |
Net increase (decrease) from operations | | | (0.55 | ) | | | 0.53 | | | | (0.53 | ) | | | (0.31 | ) | | | 1.39 | | |
Dividends from net investment income | | | (0.23 | ) | | | (0.14 | ) | | | (0.16 | ) | | | (0.81 | ) | | | (0.30 | ) | |
Return of capital | | | (0.10 | ) | | | (0.13 | ) | | | (0.15 | ) | | | — | | | | — | | |
Total dividends and return of capital | | | (0.33 | ) | | | (0.27 | ) | | | (0.31 | ) | | | (0.81 | ) | | | (0.30 | ) | |
Net asset value, end of year | | $ | 9.94 | | | $ | 10.82 | | | $ | 10.56 | | | $ | 11.40 | | | $ | 12.52 | | |
Total investment return2 | | | (5.17 | )% | | | 5.08 | % | | | (4.80 | )% | | | (2.33 | )% | | | 12.36 | % | |
Ratios to average net assets: | |
Expenses before fee waivers and/or expense reimbursements/recoupments | | | 1.27 | %3 | | | 1.28 | %3 | | | 1.27 | %3 | | | 1.27 | % | | | 1.26 | % | |
Expenses after fee waivers and/or expense reimbursements/recoupments | | | 1.17 | %3 | | | 1.22 | %3 | | | 1.22 | %3 | | | 1.21 | %4 | | | 1.22 | %4 | |
Net investment income | | | 1.56 | % | | | 1.79 | % | | | 1.65 | % | | | 2.16 | % | | | 2.16 | % | |
Supplemental data: | |
Net assets, end of year (000's) | | $ | 44,725 | | | $ | 62,808 | | | $ | 70,052 | | | $ | 84,661 | | | $ | 98,636 | | |
Portfolio turnover | | | 40 | % | | | 46 | % | | | 63 | % | | | 40 | % | | | 66 | % | |
| | | Class Y | |
| | | Years ended July 31, | |
| | | 2015 | | 2014 | | 2013 | | 2012 | | 2011 | |
Net asset value, beginning of year | | $ | 10.79 | | | $ | 10.54 | | | $ | 11.37 | | | $ | 12.49 | | | $ | 11.40 | | |
Net investment income1 | | | 0.18 | | | | 0.21 | | | | 0.21 | | | | 0.28 | | | | 0.28 | | |
Net realized and unrealized gains (losses) | | | (0.71 | ) | | | 0.33 | | | | (0.71 | ) | | | (0.57 | ) | | | 1.14 | | |
Net increase (decrease) from operations | | | (0.53 | ) | | | 0.54 | | | | (0.50 | ) | | | (0.29 | ) | | | 1.42 | | |
Dividends from net investment income | | | (0.24 | ) | | | (0.14 | ) | | | (0.17 | ) | | | (0.83 | ) | | | (0.33 | ) | |
Return of capital | | | (0.11 | ) | | | (0.15 | ) | | | (0.16 | ) | | | — | | | | — | | |
Total dividends and return of capital | | | (0.35 | ) | | | (0.29 | ) | | | (0.33 | ) | | | (0.83 | ) | | | (0.33 | ) | |
Net asset value, end of year | | $ | 9.91 | | | $ | 10.79 | | | $ | 10.54 | | | $ | 11.37 | | | $ | 12.49 | | |
Total investment return2 | | | (5.00 | )% | | | 5.23 | % | | | (4.60 | )% | | | (2.04 | )% | | | 12.54 | % | |
Ratios to average net assets: | |
Expenses before fee waivers and/or expense reimbursements/recoupments | | | 1.09 | %3 | | | 1.07 | %3 | | | 1.09 | %3 | | | 1.11 | % | | | 1.11 | % | |
Expenses after fee waivers and/or expense reimbursements/recoupments | | | 1.00 | %3,4 | | | 1.00 | %3 | | | 1.00 | %3 | | | 1.00 | % | | | 1.00 | % | |
Net investment income | | | 1.72 | % | | | 2.01 | % | | | 1.88 | % | | | 2.37 | % | | | 2.38 | % | |
Supplemental data: | |
Net assets, end of year (000's) | | $ | 4,510 | | | $ | 5,479 | | | $ | 5,171 | | | $ | 4,720 | | | $ | 5,216 | | |
Portfolio turnover | | | 40 | % | | | 46 | % | | | 63 | % | | | 40 | % | | | 66 | % | |
1 Calculated using the average shares method.
2 Total investment return is calculated assuming a $10,000 investment on the first day of each year reported, reinvestment of all dividends and other distributions, if any, at net asset value on the ex-dividend dates, and a sale at net asset value on the last day of each year reported. The figures do not include any applicable sales charges, redemption fees or program fees; results would be lower if they were included. Returns do not reflect the deduction of taxes that a shareholder would pay on Portfolio distributions or the redemption of Portfolio shares.
3 Includes interest expense representing less than 0.005%.
4 The investment manager recouped expenses previously reimbursed by the investment manager on behalf of the Portfolio, not to exceed the expense cap.
292
| | | Class C | |
| | | Years ended July 31, | |
| | | 2015 | | 2014 | | 2013 | | 2012 | | 2011 | |
Net asset value, beginning of year | | $ | 10.82 | | | $ | 10.57 | | | $ | 11.41 | | | $ | 12.52 | | | $ | 11.43 | | |
Net investment income1 | | | 0.11 | | | | 0.14 | | | | 0.13 | | | | 0.20 | | | | 0.20 | | |
Net realized and unrealized gains (losses) | | | (0.70 | ) | | | 0.33 | | | | (0.72 | ) | | | (0.56 | ) | | | 1.14 | | |
Net increase (decrease) from operations | | | (0.59 | ) | | | 0.47 | | | | (0.59 | ) | | | (0.36 | ) | | | 1.34 | | |
Dividends from net investment income | | | (0.22 | ) | | | (0.12 | ) | | | (0.13 | ) | | | (0.75 | ) | | | (0.25 | ) | |
Return of capital | | | (0.06 | ) | | | (0.10 | ) | | | (0.12 | ) | | | — | | | | — | | |
Total dividends and return of capital | | | (0.28 | ) | | | (0.22 | ) | | | (0.25 | ) | | | (0.75 | ) | | | (0.25 | ) | |
Net asset value, end of year | | $ | 9.95 | | | $ | 10.82 | | | $ | 10.57 | | | $ | 11.41 | | | $ | 12.52 | | |
Total investment return2 | | | (5.55 | )% | | | 4.47 | % | | | (5.26 | )% | | | (2.72 | )% | | | 11.83 | % | |
Ratios to average net assets: | |
Expenses before fee waivers and/or expense reimbursements/recoupments | | | 1.76 | %3 | | | 1.76 | %3 | | | 1.75 | %3 | | | 1.75 | % | | | 1.74 | % | |
Expenses after fee waivers and/or expense reimbursements/recoupments | | | 1.65 | %3 | | | 1.70 | %3 | | | 1.69 | %3 | | | 1.69 | % | | | 1.69 | % | |
Net investment income | | | 1.07 | % | | | 1.31 | % | | | 1.17 | % | | | 1.68 | % | | | 1.69 | % | |
Supplemental data: | |
Net assets, end of year (000's) | | $ | 2,994 | | | $ | 4,559 | | | $ | 5,862 | | | $ | 6,949 | | | $ | 8,034 | | |
Portfolio turnover | | | 40 | % | | | 46 | % | | | 63 | % | | | 40 | % | | | 66 | % | |
| | | Class P | |
| | | Years ended July 31, | |
| | | 2015 | | 2014 | | 2013 | | 2012 | | 2011 | |
Net asset value, beginning of year | | $ | 10.82 | | | $ | 10.56 | | | $ | 11.40 | | | $ | 12.52 | | | $ | 11.43 | | |
Net investment income1 | | | 0.18 | | | | 0.21 | | | | 0.21 | | | | 0.28 | | | | 0.28 | | |
Net realized and unrealized gains (losses) | | | (0.71 | ) | | | 0.34 | | | | (0.72 | ) | | | (0.57 | ) | | | 1.14 | | |
Net increase (decrease) from operations | | | (0.53 | ) | | | 0.55 | | | | (0.51 | ) | | | (0.29 | ) | | | 1.42 | | |
Dividends from net investment income | | | (0.23 | ) | | | (0.14 | ) | | | (0.17 | ) | | | (0.83 | ) | | | (0.33 | ) | |
Return of capital | | | (0.12 | ) | | | (0.15 | ) | | | (0.16 | ) | | | — | | | | — | | |
Total dividends and return of capital | | | (0.35 | ) | | | (0.29 | ) | | | (0.33 | ) | | | (0.83 | ) | | | (0.33 | ) | |
Net asset value, end of year | | $ | 9.94 | | | $ | 10.82 | | | $ | 10.56 | | | $ | 11.40 | | | $ | 12.52 | | |
Total investment return2 | | | (4.99 | )% | | | 5.31 | % | | | (4.59 | )% | | | (2.12 | )% | | | 12.60 | % | |
Ratios to average net assets: | |
Expenses before fee waivers and/or expense reimbursements/recoupments | | | 1.08 | %3 | | | 1.10 | %3 | | | 1.10 | %3 | | | 1.11 | % | | | 1.11 | % | |
Expenses after fee waivers and/or expense reimbursements/recoupments | | | 1.00 | %3,4 | | | 1.00 | %3 | | | 1.00 | %3 | | | 1.00 | % | | | 1.00 | % | |
Net investment income | | | 1.71 | % | | | 2.01 | % | | | 1.88 | % | | | 2.37 | % | | | 2.38 | % | |
Supplemental data: | |
Net assets, end of year (000's) | | $ | 502,122 | | | $ | 526,312 | | | $ | 467,121 | | | $ | 430,268 | | | $ | 465,625 | | |
Portfolio turnover | | | 40 | % | | | 46 | % | | | 63 | % | | | 40 | % | | | 66 | % | |
See accompanying notes to financial statements.
293
PACE Select Advisors Trust
PACE High Yield Investments
Financial highlights
Selected data for a share of beneficial interest outstanding throughout each year is presented below:
| | | Class A | |
| | | Years ended July 31, | |
| | | 2015 | | 2014 | | 2013 | | 2012 | | 2011 | |
Net asset value, beginning of year | | $ | 10.62 | | | $ | 10.41 | | | $ | 10.15 | | | $ | 10.39 | | | $ | 10.17 | | |
Net investment income1 | | | 0.54 | | | | 0.56 | | | | 0.64 | | | | 0.69 | | | | 0.75 | | |
Net realized and unrealized gains (losses) | | | (0.78 | ) | | | 0.21 | | | | 0.41 | | | | (0.12 | ) | | | 0.25 | | |
Net increase (decrease) from operations | | | (0.24 | ) | | | 0.77 | | | | 1.05 | | | | 0.57 | | | | 1.00 | | |
Dividends from net investment income | | | (0.53 | ) | | | (0.56 | ) | | | (0.63 | ) | | | (0.70 | ) | | | (0.73 | ) | |
Distributions from net realized gains | | | (0.15 | ) | | | — | | | | (0.15 | ) | | | (0.11 | ) | | | (0.05 | ) | |
Return of capital | | | — | | | | — | | | | (0.01 | ) | | | — | | | | — | | |
Total dividends, distributions and return of capital | | | (0.68 | ) | | | (0.56 | ) | | | (0.79 | ) | | | (0.81 | ) | | | (0.78 | ) | |
Net asset value, end of year | | $ | 9.70 | | | $ | 10.62 | | | $ | 10.41 | | | $ | 10.15 | | | $ | 10.39 | | |
Total investment return2 | | | (2.29 | )% | | | 7.59 | % | | | 10.48 | % | | | 5.97 | % | | | 10.00 | % | |
Ratios to average net assets: | |
Expenses before fee waivers and/or expense reimbursements/recoupments | | | 1.26 | % | | | 1.26 | % | | | 1.27 | % | | | 1.32 | % | | | 1.31 | % | |
Expenses after fee waivers and/or expense reimbursements/recoupments | | | 1.25 | % | | | 1.26 | % | | | 1.27 | % | | | 1.33 | %3 | | | 1.33 | %3 | |
Net investment income | | | 5.20 | % | | | 5.28 | % | | | 6.07 | % | | | 7.01 | % | | | 7.11 | % | |
Supplemental data: | |
Net assets, end of year (000's) | | $ | 5,330 | | | $ | 23,516 | | | $ | 23,400 | | | $ | 22,405 | | | $ | 25,550 | | |
Portfolio turnover | | | 57 | % | | | 20 | % | | | 26 | % | | | 20 | % | | | 36 | % | |
| | | Class Y | |
| | | Years ended July 31, | |
| | | 2015 | | 2014 | | 2013 | | 2012 | | 2011 | |
Net asset value, beginning of year | | $ | 10.66 | | | $ | 10.44 | | | $ | 10.18 | | | $ | 10.42 | | | $ | 10.20 | | |
Net investment income1 | | | 0.55 | | | | 0.59 | | | | 0.66 | | | | 0.72 | | | | 0.74 | | |
Net realized and unrealized gains (losses) | | | (0.78 | ) | | | 0.22 | | | | 0.41 | | | | (0.12 | ) | | | 0.28 | | |
Net increase from operations | | | (0.23 | ) | | | 0.81 | | | | 1.07 | | | | 0.60 | | | | 1.02 | | |
Dividends from net investment income | | | (0.55 | ) | | | (0.59 | ) | | | (0.65 | ) | | | (0.73 | ) | | | (0.75 | ) | |
Distributions from net realized gains | | | (0.15 | ) | | | — | | | | (0.15 | ) | | | (0.11 | ) | | | (0.05 | ) | |
Return of capital | | | — | | | | — | | | | (0.01 | ) | | | — | | | | — | | |
Total dividends, distributions and return of capital | | | (0.70 | ) | | | (0.59 | ) | | | (0.81 | ) | | | (0.84 | ) | | | (0.80 | ) | |
Net asset value, end of year | | $ | 9.73 | | | $ | 10.66 | | | $ | 10.44 | | | $ | 10.18 | | | $ | 10.42 | | |
Total investment return2 | | | (2.13 | )% | | | 7.94 | % | | | 10.74 | % | | | 6.29 | % | | | 10.24 | % | |
Ratios to average net assets: | |
Expenses before fee waivers and/or expense reimbursements/recoupments | | | 1.03 | % | | | 1.00 | % | | | 1.02 | % | | | 1.03 | % | | | 1.03 | % | |
Expenses after fee waivers and/or expense reimbursements/recoupments | | | 1.02 | % | | | 1.00 | % | | | 1.02 | % | | | 1.03 | % | | | 1.05 | %3 | |
Net investment income | | | 5.40 | % | | | 5.54 | % | | | 6.26 | % | | | 7.25 | % | | | 7.86 | % | |
Supplemental data: | |
Net assets, end of year (000's) | | $ | 1,119 | | | $ | 1,692 | | | $ | 1,552 | | | $ | 572 | | | $ | 385 | | |
Portfolio turnover | | | 57 | % | | | 20 | % | | | 26 | % | | | 20 | % | | | 36 | % | |
1 Calculated using the average shares method.
2 Total investment return is calculated assuming a $10,000 investment on the first day of each year reported, reinvestment of all dividends and other distributions, if any, at net asset value on the ex-dividend dates, and a sale at net asset value on the last day of each year reported. The figures do not include any applicable sales charges, redemption fees or program fees; results would be lower if they were included. Returns do not reflect the deduction of taxes that a shareholder would pay on Portfolio distributions or the redemption of Portfolio shares.
3 The investment manager recouped expenses previously reimbursed by the investment manager on behalf of the Portfolio, not to exceed the expense cap.
294
| | | Class C | |
| | | Years ended July 31, | |
| | | 2015 | | 2014 | | 2013 | | 2012 | | 2011 | |
Net asset value, beginning of year | | $ | 10.62 | | | $ | 10.40 | | | $ | 10.14 | | | $ | 10.38 | | | $ | 10.16 | | |
Net investment income1 | | | 0.48 | | | | 0.51 | | | | 0.59 | | | | 0.64 | | | | 0.71 | | |
Net realized and unrealized gains (losses) | | | (0.78 | ) | | | 0.22 | | | | 0.41 | | | | (0.12 | ) | | | 0.24 | | |
Net increase (decrease) from operations | | | (0.30 | ) | | | 0.73 | | | | 1.00 | | | | 0.52 | | | | 0.95 | | |
Dividends from net investment income | | | (0.48 | ) | | | (0.51 | ) | | | (0.58 | ) | | | (0.65 | ) | | | (0.68 | ) | |
Distributions from net realized gains | | | (0.15 | ) | | | — | | | | (0.15 | ) | | | (0.11 | ) | | | (0.05 | ) | |
Return of capital | | | — | | | | — | | | | (0.01 | ) | | | — | | | | — | | |
Total dividends, distributions and return of capital | | | (0.63 | ) | | | (0.51 | ) | | | (0.74 | ) | | | (0.76 | ) | | | (0.73 | ) | |
Net asset value, end of year | | $ | 9.69 | | | $ | 10.62 | | | $ | 10.40 | | | $ | 10.14 | | | $ | 10.38 | | |
Total investment return2 | | | (2.83 | )% | | | 7.20 | % | | | 9.98 | % | | | 5.51 | % | | | 9.50 | % | |
Ratios to average net assets: | |
Expenses before fee waivers and/or expense reimbursements/recoupments | | | 1.73 | % | | | 1.72 | % | | | 1.73 | % | | | 1.77 | % | | | 1.77 | % | |
Expenses after fee waivers and/or expense reimbursements/recoupments | | | 1.72 | % | | | 1.72 | % | | | 1.73 | % | | | 1.77 | % | | | 1.77 | % | |
Net investment income | | | 4.71 | % | | | 4.82 | % | | | 5.61 | % | | | 6.49 | % | | | 6.69 | % | |
Supplemental data: | |
Net assets, end of year (000's) | | $ | 3,913 | | | $ | 5,607 | | | $ | 5,607 | | | $ | 5,832 | | | $ | 3,791 | | |
Portfolio turnover | | | 57 | % | | | 20 | % | | | 26 | % | | | 20 | % | | | 36 | % | |
| | | Class P | |
| | | Years ended July 31, | |
| | | 2015 | | 2014 | | 2013 | | 2012 | | 2011 | |
Net asset value, beginning of year | | $ | 10.65 | | | $ | 10.43 | | | $ | 10.17 | | | $ | 10.41 | | | $ | 10.18 | | |
Net investment income1 | | | 0.55 | | | | 0.58 | | | | 0.66 | | | | 0.72 | | | | 0.77 | | |
Net realized and unrealized gains (losses) | | | (0.78 | ) | | | 0.23 | | | | 0.41 | | | | (0.14 | ) | | | 0.26 | | |
Net increase from operations | | | (0.23 | ) | | | 0.81 | | | | 1.07 | | | | 0.58 | | | | 1.03 | | |
Dividends from net investment income | | | (0.55 | ) | | | (0.59 | ) | | | (0.65 | ) | | | (0.71 | ) | | | (0.75 | ) | |
Distributions from net realized gains | | | (0.15 | ) | | | — | | | | (0.15 | ) | | | (0.11 | ) | | | (0.05 | ) | |
Return of capital | | | — | | | | — | | | | (0.01 | ) | | | — | | | | — | | |
Total dividends, distributions and return of capital | | | (0.70 | ) | | | (0.59 | ) | | | (0.81 | ) | | | (0.82 | ) | | | (0.80 | ) | |
Net asset value, end of year | | $ | 9.72 | | | $ | 10.65 | | | $ | 10.43 | | | $ | 10.17 | | | $ | 10.41 | | |
Total investment return2 | | | (2.14 | )% | | | 7.92 | % | | | 10.70 | % | | | 6.19 | % | | | 10.30 | % | |
Ratios to average net assets: | |
Expenses before fee waivers and/or expense reimbursements/recoupments | | | 1.09 | % | | | 1.10 | % | | | 1.11 | % | | | 1.15 | % | | | 1.15 | % | |
Expenses after fee waivers and/or expense reimbursements/recoupments | | | 1.03 | % | | | 1.03 | % | | | 1.05 | % | | | 1.10 | % | | | 1.10 | % | |
Net investment income | | | 5.39 | % | | | 5.50 | % | | | 6.28 | % | | | 7.21 | % | | | 7.36 | % | |
Supplemental data: | |
Net assets, end of year (000's) | | $ | 428,061 | | | $ | 431,812 | | | $ | 357,726 | | | $ | 271,352 | | | $ | 248,197 | | |
Portfolio turnover | | | 57 | % | | | 20 | % | | | 26 | % | | | 20 | % | | | 36 | % | |
See accompanying notes to financial statements.
295
PACE Select Advisors Trust
PACE Large Co Value Equity Investments
Financial highlights
Selected data for a share of beneficial interest outstanding throughout each year is presented below:
| | | Class A | |
| | | Years ended July 31, | |
| | | 2015 | | 2014 | | 2013 | | 2012 | | 2011 | |
Net asset value, beginning of year | | $ | 25.25 | | | $ | 22.53 | | | $ | 17.27 | | | $ | 17.10 | | | $ | 14.76 | | |
Net investment income1 | | | 0.23 | | | | 0.30 | | | | 0.23 | | | | 0.24 | | | | 0.16 | | |
Net realized and unrealized gains | | | 1.34 | | | | 2.92 | | | | 5.27 | | | | 0.15 | | | | 2.31 | | |
Net increase from operations | | | 1.57 | | | | 3.22 | | | | 5.50 | | | | 0.39 | | | | 2.47 | | |
Dividends from net investment income | | | (0.30 | ) | | | (0.21 | ) | | | (0.24 | ) | | | (0.22 | ) | | | (0.13 | ) | |
Distributions from net realized gains | | | (2.80 | ) | | | (0.29 | ) | | | — | | | | — | | | | — | | |
Total dividends and distributions | | | (3.10 | ) | | | (0.50 | ) | | | (0.24 | ) | | | (0.22 | ) | | | (0.13 | ) | |
Net asset value, end of year | | $ | 23.72 | | | $ | 25.25 | | | $ | 22.53 | | | $ | 17.27 | | | $ | 17.10 | | |
Total investment return2 | | | 6.23 | % | | | 14.39 | % | | | 32.12 | % | | | 2.41 | % | | | 16.79 | % | |
Ratios to average net assets: | |
Expenses before fee waivers and/or expense reimbursements/recoupments, including dividend
expense, interest expense and other borrowing costs for investments sold short | | | 1.48 | % | | | 1.32 | % | | | 1.16 | % | | | 1.18 | % | | | 1.17 | % | |
Expenses after fee waivers and/or expense reimbursements/recoupments, including
dividend expense, interest expense and other borrowing costs for investments sold short | | | 1.47 | % | | | 1.31 | % | | | 1.15 | % | | | 1.18 | % | | | 1.17 | % | |
Expenses after fee waivers and/or expense reimbursements/recoupments, excluding
dividend expense, interest expense and other borrowing costs for investments sold short | | | 1.13 | % | | | 1.13 | % | | | 1.15 | % | | | 1.18 | % | | | 1.17 | % | |
Net investment income | | | 0.94 | % | | | 1.25 | % | | | 1.16 | % | | | 1.43 | % | | | 0.94 | % | |
Supplemental data: | |
Net assets, end of year (000's) | | $ | 124,198 | | | $ | 155,480 | | | $ | 151,583 | | | $ | 132,417 | | | $ | 147,471 | | |
Portfolio turnover | | | 97 | % | | | 71 | % | | | 71 | % | | | 62 | % | | | 49 | % | |
| | | Class Y | |
| | | Years ended July 31, | |
| | | 2015 | | 2014 | | 2013 | | 2012 | | 2011 | |
Net asset value, beginning of year | | $ | 25.32 | | | $ | 22.60 | | | $ | 17.32 | | | $ | 17.15 | | | $ | 14.81 | | |
Net investment income1 | | | 0.29 | | | | 0.36 | | | | 0.27 | | | | 0.28 | | | | 0.20 | | |
Net realized and unrealized gains | | | 1.35 | | | | 2.91 | | | | 5.29 | | | | 0.15 | | | | 2.31 | | |
Net increase from operations | | | 1.64 | | | | 3.27 | | | | 5.56 | | | | 0.43 | | | | 2.51 | | |
Dividends from net investment income | | | (0.38 | ) | | | (0.26 | ) | | | (0.28 | ) | | | (0.26 | ) | | | (0.17 | ) | |
Distributions from net realized gains | | | (2.80 | ) | | | (0.29 | ) | | | — | | | | — | | | | — | | |
Total dividends and distributions | | | (3.18 | ) | | | (0.55 | ) | | | (0.28 | ) | | | (0.26 | ) | | | (0.17 | ) | |
Net asset value, end of year | | $ | 23.78 | | | $ | 25.32 | | | $ | 22.60 | | | $ | 17.32 | | | $ | 17.15 | | |
Total investment return2 | | | 6.51 | % | | | 14.62 | % | | | 32.46 | % | | | 2.68 | % | | | 17.00 | % | |
Ratios to average net assets: | |
Expenses before fee waivers and/or expense reimbursements/recoupments, including dividend
expense, interest expense and other borrowing costs for investments sold short | | | 1.23 | % | | | 1.07 | % | | | 0.92 | % | | | 0.94 | % | | | 0.94 | % | |
Expenses after fee waivers and/or expense reimbursements/recoupments, including
dividend expense, interest expense and other borrowing costs for investments sold short | | | 1.23 | % | | | 1.06 | % | | | 0.91 | % | | | 0.94 | % | | | 0.94 | % | |
Expenses after fee waivers and/or expense reimbursements/recoupments, excluding
dividend expense, interest expense and other borrowing costs for investments sold short | | | 0.88 | % | | | 0.89 | % | | | 0.91 | % | | | 0.94 | % | | | 0.94 | % | |
Net investment income | | | 1.19 | % | | | 1.50 | % | | | 1.40 | % | | | 1.66 | % | | | 1.17 | % | |
Supplemental data: | |
Net assets, end of year (000's) | | $ | 19,593 | | | $ | 19,765 | | | $ | 18,536 | | | $ | 15,642 | | | $ | 16,984 | | |
Portfolio turnover | | | 97 | % | | | 71 | % | | | 71 | % | | | 62 | % | | | 49 | % | |
1 Calculated using the average shares method.
2 Total investment return is calculated assuming a $10,000 investment on the first day of each year reported, reinvestment of all dividends and other distributions, if any, at net asset value on the ex-dividend dates, and a sale at net asset value on the last day of each year reported. The figures do not include any applicable sales charges, redemption fees or program fees; results would be lower if they were included. Returns do not reflect the deduction of taxes that a shareholder would pay on Portfolio distributions or the redemption of Portfolio shares.
3 The investment manager recouped expenses previously reimbursed by the investment manager on behalf of the Portfolio, not to exceed the expense cap.
296
| | | Class C | |
| | | Years ended July 31, | |
| | | 2015 | | 2014 | | 2013 | | 2012 | | 2011 | |
Net asset value, beginning of year | | $ | 25.23 | | | $ | 22.53 | | | $ | 17.26 | | | $ | 17.07 | | | $ | 14.73 | | |
Net investment income1 | | | 0.04 | | | | 0.11 | | | | 0.07 | | | | 0.10 | | | | 0.02 | | |
Net realized and unrealized gains | | | 1.33 | | | | 2.91 | | | | 5.29 | | | | 0.16 | | | | 2.32 | | |
Net increase from operations | | | 1.37 | | | | 3.02 | | | | 5.36 | | | | 0.26 | | | | 2.34 | | |
Dividends from net investment income | | | (0.11 | ) | | | (0.03 | ) | | | (0.09 | ) | | | (0.07 | ) | | | — | | |
Distributions from net realized gains | | | (2.80 | ) | | | (0.29 | ) | | | — | | | | — | | | | — | | |
Total dividends and distributions | | | (2.91 | ) | | | (0.32 | ) | | | (0.09 | ) | | | (0.07 | ) | | | — | | |
Net asset value, end of year | | $ | 23.69 | | | $ | 25.23 | | | $ | 22.53 | | | $ | 17.26 | | | $ | 17.07 | | |
Total investment return2 | | | 5.44 | % | | | 13.43 | % | | | 31.13 | % | | | 1.55 | % | | | 15.81 | % | |
Ratios to average net assets: | |
Expenses before fee waivers and/or expense reimbursements/recoupments, including dividend
expense, interest expense and other borrowing costs for investments sold short | | | 2.25 | % | | | 2.10 | % | | | 1.95 | % | | | 1.98 | % | | | 1.96 | % | |
Expenses after fee waivers and/or expense reimbursements/recoupments, including
dividend expense, interest expense and other borrowing costs for investments sold short | | | 2.25 | % | | | 2.09 | % | | | 1.95 | % | | | 1.98 | % | | | 1.98 | %3 | |
Expenses after fee waivers and/or expense reimbursements/recoupments, excluding
dividend expense, interest expense and other borrowing costs for investments sold short | | | 1.90 | % | | | 1.92 | % | | | 1.95 | % | | | 1.98 | % | | | 1.98 | %3 | |
Net investment income | | | 0.17 | % | | | 0.47 | % | | | 0.36 | % | | | 0.63 | % | | | 0.13 | % | |
Supplemental data: | |
Net assets, end of year (000's) | | $ | 14,500 | | | $ | 15,380 | | | $ | 14,437 | | | $ | 12,439 | | | $ | 14,807 | | |
Portfolio turnover | | | 97 | % | | | 71 | % | | | 71 | % | | | 62 | % | | | 49 | % | |
| | | Class P | |
| | | Years ended July 31, | |
| | | 2015 | | 2014 | | 2013 | | 2012 | | 2011 | |
Net asset value, beginning of year | | $ | 25.24 | | | $ | 22.52 | | | $ | 17.26 | | | $ | 17.10 | | | $ | 14.76 | | |
Net investment income1 | | | 0.29 | | | | 0.36 | | | | 0.27 | | | | 0.28 | | | | 0.20 | | |
Net realized and unrealized gains | | | 1.33 | | | | 2.91 | | | | 5.27 | | | | 0.14 | | | | 2.31 | | |
Net increase from operations | | | 1.62 | | | | 3.27 | | | | 5.54 | | | | 0.42 | | | | 2.51 | | |
Dividends from net investment income | | | (0.38 | ) | | | (0.26 | ) | | | (0.28 | ) | | | (0.26 | ) | | | (0.17 | ) | |
Distributions from net realized gains | | | (2.80 | ) | | | (0.29 | ) | | | — | | | | — | | | | — | | |
Total dividends and distributions | | | (3.18 | ) | | | (0.55 | ) | | | (0.28 | ) | | | (0.26 | ) | | | (0.17 | ) | |
Net asset value, end of year | | $ | 23.68 | | | $ | 25.24 | | | $ | 22.52 | | | $ | 17.26 | | | $ | 17.10 | | |
Total investment return2 | | | 6.48 | % | | | 14.62 | % | | | 32.47 | % | | | 2.64 | % | | | 17.07 | % | |
Ratios to average net assets: | |
Expenses before fee waivers and/or expense reimbursements/recoupments, including dividend
expense, interest expense and other borrowing costs for investments sold short | | | 1.24 | % | | | 1.08 | % | | | 0.91 | % | | | 0.93 | % | | | 0.93 | % | |
Expenses after fee waivers and/or expense reimbursements/recoupments, including
dividend expense, interest expense and other borrowing costs for investments sold short | | | 1.23 | % | | | 1.07 | % | | | 0.91 | % | | | 0.93 | % | | | 0.93 | % | |
Expenses after fee waivers and/or expense reimbursements/recoupments, excluding
dividend expense, interest expense and other borrowing costs for investments sold short | | | 0.88 | % | | | 0.90 | % | | | 0.91 | % | | | 0.93 | % | | | 0.93 | % | |
Net investment income | | | 1.19 | % | | | 1.49 | % | | | 1.40 | % | | | 1.66 | % | | | 1.18 | % | |
Supplemental data: | |
Net assets, end of year (000's) | | $ | 1,248,338 | | | $ | 1,263,296 | | | $ | 1,135,014 | | | $ | 991,824 | | | $ | 1,020,412 | | |
Portfolio turnover | | | 97 | % | | | 71 | % | | | 71 | % | | | 62 | % | | | 49 | % | |
See accompanying notes to financial statements.
297
PACE Select Advisors Trust
PACE Large Co Growth Equity Investments
Financial highlights
Selected data for a share of beneficial interest outstanding throughout each year is presented below:
| | | Class A | |
| | | Years ended July 31, | |
| | | 2015 | | 2014 | | 2013 | | 2012 | | 2011 | |
Net asset value, beginning of year | | $ | 25.75 | | | $ | 23.52 | | | $ | 19.40 | | | $ | 18.62 | | | $ | 14.95 | | |
Net investment income (loss)1 | | | (0.15 | ) | | | 0.07 | | | | 0.08 | | | | (0.00 | )2 | | | (0.00 | )2 | |
Net realized and unrealized gains | | | 3.70 | | | | 4.39 | | | | 4.08 | | | | 0.78 | | | | 3.67 | | |
Net increase from operations | | | 3.55 | | | | 4.46 | | | | 4.16 | | | | 0.78 | | | | 3.67 | | |
Dividends from net investment income | | | — | | | | (0.04 | ) | | | (0.04 | ) | | | — | | | | — | | |
Distributions from net realized gains | | | (3.06 | ) | | | (2.19 | ) | | | — | | | | — | | | | — | | |
Total dividends and distributions | | | (3.06 | ) | | | (2.23 | ) | | | (0.04 | ) | | | — | | | | — | | |
Net asset value, end of year | | $ | 26.24 | | | $ | 25.75 | | | $ | 23.52 | | | $ | 19.40 | | | $ | 18.62 | | |
Total investment return3 | | | 14.60 | % | | | 19.60 | % | | | 21.45 | % | | | 4.19 | % | | | 24.55 | % | |
Ratios to average net assets: | |
Expenses before fee waivers and/or expense reimbursements/recoupments | | | 1.18 | %5 | | | 1.18 | % | | | 1.21 | % | | | 1.23 | % | | | 1.23 | % | |
Expenses after fee waivers and/or expense reimbursements/recoupments | | | 1.18 | %5 | | | 1.18 | % | | | 1.21 | % | | | 1.23 | % | | | 1.22 | % | |
Net investment income (loss) | | | (0.57 | )% | | | 0.28 | % | | | 0.40 | % | | | (0.02 | )% | | | (0.02 | )% | |
Supplemental data: | |
Net assets, end of year (000's) | | $ | 46,777 | | | $ | 68,207 | | | $ | 63,108 | | | $ | 59,435 | | | $ | 64,315 | | |
Portfolio turnover | | | 48 | % | | | 40 | % | | | 76 | % | | | 54 | % | | | 84 | % | |
| | | Class Y | |
| | | Years ended July 31, | |
| | | 2015 | | 2014 | | 2013 | | 2012 | | 2011 | |
Net asset value, beginning of year | | $ | 26.39 | | | $ | 24.06 | | | $ | 19.86 | | | $ | 19.05 | | | $ | 15.29 | | |
Net investment income (loss)1 | | | (0.09 | ) | | | 0.14 | | | | 0.14 | | | | 0.04 | | | | 0.04 | | |
Net realized and unrealized gains | | | 3.80 | | | | 4.48 | | | | 4.17 | | | | 0.81 | | | | 3.75 | | |
Net increase from operations | | | 3.71 | | | | 4.62 | | | | 4.31 | | | | 0.85 | | | | 3.79 | | |
Dividends from net investment income | | | (0.06 | ) | | | (0.10 | ) | | | (0.11 | ) | | | (0.04 | ) | | | (0.03 | ) | |
Distributions from net realized gains | | | (3.06 | ) | | | (2.19 | ) | | | — | | | | — | | | | — | | |
Total dividends and distributions | | | (3.12 | ) | | | (2.29 | ) | | | (0.11 | ) | | | (0.04 | ) | | | (0.03 | ) | |
Net asset value, end of year | | $ | 26.98 | | | $ | 26.39 | | | $ | 24.06 | | | $ | 19.86 | | | $ | 19.05 | | |
Total investment return3 | | | 14.89 | % | | | 19.86 | % | | | 21.77 | % | | | 4.49 | % | | | 24.83 | % | |
Ratios to average net assets: | |
Expenses before fee waivers and/or expense reimbursements/recoupments | | | 0.92 | %5 | | | 0.93 | % | | | 0.96 | % | | | 0.97 | % | | | 0.99 | % | |
Expenses after fee waivers and/or expense reimbursements/recoupments | | | 0.92 | %5 | | | 0.93 | % | | | 0.96 | % | | | 0.97 | % | | | 0.98 | % | |
Net investment income (loss) | | | (0.32 | )% | | | 0.53 | % | | | 0.66 | % | | | 0.23 | % | | | 0.22 | % | |
Supplemental data: | |
Net assets, end of year (000's) | | $ | 16,174 | | | $ | 15,858 | | | $ | 14,814 | | | $ | 13,258 | | | $ | 13,858 | | |
Portfolio turnover | | | 48 | % | | | 40 | % | | | 76 | % | | | 54 | % | | | 84 | % | |
1 Calculated using the average shares method.
2 Amount represents less than $0.005 per share.
3 Total investment return is calculated assuming a $10,000 investment on the first day of each year reported, reinvestment of all dividends and other distributions, if any, at net asset value on the ex-dividend dates, and a sale at net asset value on the last day of each year reported. The figures do not include any applicable sales charges, redemption fees or program fees; results would be lower if they were included. Returns do not reflect the deduction of taxes that a shareholder would pay on Portfolio distributions or the redemption of Portfolio shares.
4 The investment manager recouped expenses previously reimbursed by the investment manager on behalf of the Portfolio, not to exceed the expense cap.
5 Includes interest expense representing less than 0.005%.
298
| | | Class C | |
| | | Years ended July 31, | |
| | | 2015 | | 2014 | | 2013 | | 2012 | | 2011 | |
Net asset value, beginning of year | | $ | 22.91 | | | $ | 21.29 | | | $ | 17.67 | | | $ | 17.10 | | | $ | 13.84 | | |
Net investment income (loss)1 | | | (0.31 | ) | | | (0.13 | ) | | | (0.08 | ) | | | (0.14 | ) | | | (0.14 | ) | |
Net realized and unrealized gains | | | 3.25 | | | | 3.94 | | | | 3.70 | | | | 0.71 | | | | 3.40 | | |
Net increase from operations | | | 2.94 | | | | 3.81 | | | | 3.62 | | | | 0.57 | | | | 3.26 | | |
Dividends from net investment income | | | — | | | | — | | | | — | | | | — | | | | — | | |
Distributions from net realized gains | | | (3.06 | ) | | | (2.19 | ) | | | — | | | | — | | | | — | | |
Total dividends and distributions | | | (3.06 | ) | | | (2.19 | ) | | | — | | | | — | | | | — | | |
Net asset value, end of year | | $ | 22.79 | | | $ | 22.91 | | | $ | 21.29 | | | $ | 17.67 | | | $ | 17.10 | | |
Total investment return3 | | | 13.67 | % | | | 18.54 | % | | | 20.49 | % | | | 3.33 | % | | | 23.47 | % | |
Ratios to average net assets: | |
Expenses before fee waivers and/or expense reimbursements/recoupments | | | 1.99 | %5 | | | 2.00 | % | | | 2.04 | % | | | 2.07 | % | | | 2.07 | % | |
Expenses after fee waivers and/or expense reimbursements/recoupments | | | 1.99 | %5 | | | 2.03 | %4 | | | 2.05 | %4 | | | 2.05 | % | | | 2.05 | % | |
Net investment income (loss) | | | (1.39 | )% | | | (0.57 | )% | | | (0.43 | )% | | | (0.84 | )% | | | (0.84 | )% | |
Supplemental data: | |
Net assets, end of year (000's) | | $ | 4,104 | | | $ | 4,204 | | | $ | 4,033 | | | $ | 3,720 | | | $ | 4,209 | | |
Portfolio turnover | | | 48 | % | | | 40 | % | | | 76 | % | | | 54 | % | | | 84 | % | |
| | | Class P | |
| | | Years ended July 31, | |
| | | 2015 | | 2014 | | 2013 | | 2012 | | 2011 | |
Net asset value, beginning of year | | $ | 26.26 | | | $ | 23.95 | | | $ | 19.77 | | | $ | 18.97 | | | $ | 15.21 | | |
Net investment income (loss)1 | | | (0.08 | ) | | | 0.14 | | | | 0.14 | | | | 0.05 | | | | 0.04 | | |
Net realized and unrealized gains | | | 3.77 | | | | 4.46 | | | | 4.15 | | | | 0.79 | | | | 3.75 | | |
Net increase from operations | | | 3.69 | | | | 4.60 | | | | 4.29 | | | | 0.84 | | | | 3.79 | | |
Dividends from net investment income | | | (0.06 | ) | | | (0.10 | ) | | | (0.11 | ) | | | (0.04 | ) | | | (0.03 | ) | |
Distributions from net realized gains | | | (3.06 | ) | | | (2.19 | ) | | | — | | | | — | | | | — | | |
Total dividends and distributions | | | (3.12 | ) | | | (2.29 | ) | | | (0.11 | ) | | | (0.04 | ) | | | (0.03 | ) | |
Net asset value, end of year | | $ | 26.83 | | | $ | 26.26 | | | $ | 23.95 | | | $ | 19.77 | | | $ | 18.97 | | |
Total investment return3 | | | 14.88 | % | | | 19.87 | % | | | 21.79 | % | | | 4.48 | % | | | 24.92 | % | |
Ratios to average net assets: | |
Expenses before fee waivers and/or expense reimbursements/recoupments | | | 0.92 | %5 | | | 0.93 | % | | | 0.95 | % | | | 0.96 | % | | | 0.97 | % | |
Expenses after fee waivers and/or expense reimbursements/recoupments | | | 0.92 | %5 | | | 0.93 | % | | | 0.95 | % | | | 0.96 | % | | | 0.96 | % | |
Net investment income (loss) | | | (0.32 | )% | | | 0.53 | % | | | 0.65 | % | | | 0.24 | % | | | 0.24 | % | |
Supplemental data: | |
Net assets, end of year (000's) | | $ | 1,359,224 | | | $ | 1,289,577 | | | $ | 1,113,514 | | | $ | 1,036,636 | | | $ | 1,068,052 | | |
Portfolio turnover | | | 48 | % | | | 40 | % | | | 76 | % | | | 54 | % | | | 84 | % | |
See accompanying notes to financial statements.
299
PACE Select Advisors Trust
PACE Small/Medium Co Value Equity Investments
Financial highlights
Selected data for a share of beneficial interest outstanding throughout each year is presented below:
| | | Class A | |
| | | Years ended July 31, | |
| | | 2015 | | 2014 | | 2013 | | 2012 | | 2011 | |
Net asset value, beginning of year | | $ | 22.05 | | | $ | 22.19 | | | $ | 16.61 | | | $ | 17.05 | | | $ | 14.28 | | |
Net investment income (loss)1 | | | 0.11 | | | | 0.05 | | | | 0.13 | | | | 0.03 | | | | (0.03 | ) | |
Net realized and unrealized gains (losses) | | | 1.41 | | | | 2.67 | | | | 5.55 | | | | (0.47 | ) | | | 2.80 | | |
Net increase (decrease) from operations | | | 1.52 | | | | 2.72 | | | | 5.68 | | | | (0.44 | ) | | | 2.77 | | |
Dividends from net investment income | | | (0.03 | ) | | | (0.09 | ) | | | (0.10 | ) | | | — | | | | — | | |
Distributions from net realized gains | | | (2.73 | ) | | | (2.77 | ) | | | — | | | | — | | | | — | | |
Total dividends and distributions | | | (2.76 | ) | | | (2.86 | ) | | | (0.10 | ) | | | — | | | | — | | |
Net asset value, end of year | | $ | 20.81 | | | $ | 22.05 | | | $ | 22.19 | | | $ | 16.61 | | | $ | 17.05 | | |
Total investment return2 | | | 7.35 | % | | | 12.74 | % | | | 34.23 | % | | | (2.58 | )% | | | 19.40 | % | |
Ratios to average net assets: | |
Expenses before fee waivers and/or expense reimbursements/recoupments | | | 1.24 | % | | | 1.24 | % | | | 1.28 | % | | | 1.32 | % | | | 1.29 | % | |
Expenses after fee waivers and/or expense reimbursements/recoupments | | | 1.24 | % | | | 1.24 | % | | | 1.28 | % | | | 1.32 | % | | | 1.29 | % | |
Net investment income (loss) | | | 0.53 | % | | | 0.24 | % | | | 0.68 | % | | | 0.21 | % | | | (0.18 | )% | |
Supplemental data: | |
Net assets, end of year (000's) | | $ | 18,334 | | | $ | 32,039 | | | $ | 31,930 | | | $ | 27,101 | | | $ | 32,166 | | |
Portfolio turnover | | | 66 | % | | | 86 | % | | | 97 | % | | | 72 | % | | | 70 | % | |
| | | Class Y | |
| | | Years ended July 31, | |
| | | 2015 | | 2014 | | 2013 | | 2012 | | 2011 | |
Net asset value, beginning of year | | $ | 22.73 | | | $ | 22.79 | | | $ | 17.06 | | | $ | 17.51 | | | $ | 14.63 | | |
Net investment income (loss)1 | | | 0.14 | | | | 0.08 | | | | 0.16 | | | | 0.06 | | | | 0.01 | | |
Net realized and unrealized gains (losses) | | | 1.45 | | | | 2.75 | | | | 5.70 | | | | (0.50 | ) | | | 2.88 | | |
Net increase (decrease) from operations | | | 1.59 | | | | 2.83 | | | | 5.86 | | | | (0.44 | ) | | | 2.89 | | |
Dividends from net investment income | | | (0.11 | ) | | | (0.12 | ) | | | (0.13 | ) | | | (0.01 | ) | | | (0.01 | ) | |
Distributions from net realized gains | | | (2.73 | ) | | | (2.77 | ) | | | — | | | | — | | | | — | | |
Total dividends and distributions | | | (2.84 | ) | | | (2.89 | ) | | | (0.13 | ) | | | (0.01 | ) | | | (0.01 | ) | |
Net asset value, end of year | | $ | 21.48 | | | $ | 22.73 | | | $ | 22.79 | | | $ | 17.06 | | | $ | 17.51 | | |
Total investment return2 | | | 7.47 | % | | | 12.84 | % | | | 34.41 | % | | | (2.45 | )% | | | 19.74 | % | |
Ratios to average net assets: | |
Expenses before fee waivers and/or expense reimbursements/recoupments | | | 1.10 | % | | | 1.11 | % | | | 1.19 | % | | | 1.16 | % | | | 1.08 | % | |
Expenses after fee waivers and/or expense reimbursements/recoupments | | | 1.10 | % | | | 1.13 | %4 | | | 1.16 | % | | | 1.16 | % | | | 1.08 | % | |
Net investment income (loss) | | | 0.63 | % | | | 0.35 | % | | | 0.80 | % | | | 0.36 | % | | | 0.03 | % | |
Supplemental data: | |
Net assets, end of year (000's) | | $ | 998 | | | $ | 912 | | | $ | 768 | | | $ | 443 | | | $ | 371 | | |
Portfolio turnover | | | 66 | % | | | 86 | % | | | 97 | % | | | 72 | % | | | 70 | % | |
1 Calculated using the average shares method.
2 Total investment return is calculated assuming a $10,000 investment on the first day of each year reported, reinvestment of all dividends and other distributions, if any, at net asset value on the ex-dividend dates, and a sale at net asset value on the last day of each year reported. The figures do not include any applicable sales charges, redemption fees or program fees; results would be lower if they were included. Returns do not reflect the deduction of taxes that a shareholder would pay on Portfolio distributions or the redemption of Portfolio shares.
3 Amount represents less than $0.005 per share.
4 The investment manager recouped expenses previously reimbursed by the investment manager on behalf of the Portfolio, not to exceed the expense cap.
300
| | | Class C | |
| | | Years ended July 31, | |
| | | 2015 | | 2014 | | 2013 | | 2012 | | 2011 | |
Net asset value, beginning of year | | $ | 19.52 | | | $ | 20.00 | | | $ | 15.00 | | | $ | 15.53 | | | $ | 13.10 | | |
Net investment income (loss)1 | | | (0.05 | ) | | | (0.10 | ) | | | (0.01 | ) | | | (0.08 | ) | | | (0.14 | ) | |
Net realized and unrealized gains (losses) | | | 1.25 | | | | 2.39 | | | | 5.01 | | | | (0.45 | ) | | | 2.57 | | |
Net increase (decrease) from operations | | | 1.20 | | | | 2.29 | | | | 5.00 | | | | (0.53 | ) | | | 2.43 | | |
Dividends from net investment income | | | — | | | | — | | | | — | | | | — | | | | — | | |
Distributions from net realized gains | | | (2.73 | ) | | | (2.77 | ) | | | — | | | | — | | | | — | | |
Total dividends and distributions | | | (2.73 | ) | | | (2.77 | ) | | | — | | | | — | | | | — | | |
Net asset value, end of year | | $ | 17.99 | | | $ | 19.52 | | | $ | 20.00 | | | $ | 15.00 | | | $ | 15.53 | | |
Total investment return2 | | | 6.59 | % | | | 11.84 | % | | | 33.24 | % | | | (3.35 | )% | | | 18.55 | % | |
Ratios to average net assets: | |
Expenses before fee waivers and/or expense reimbursements/recoupments | | | 1.98 | % | | | 2.00 | % | | | 2.03 | % | | | 2.07 | % | | | 2.05 | % | |
Expenses after fee waivers and/or expense reimbursements/recoupments | | | 1.98 | % | | | 2.00 | % | | | 2.03 | % | | | 2.07 | % | | | 2.05 | % | |
Net investment income (loss) | | | (0.24 | )% | | | (0.51 | )% | | | (0.08 | )% | | | (0.54 | )% | | | (0.93 | )% | |
Supplemental data: | |
Net assets, end of year (000's) | | $ | 4,843 | | | $ | 5,106 | | | $ | 4,983 | | | $ | 4,325 | | | $ | 5,109 | | |
Portfolio turnover | | | 66 | % | | | 86 | % | | | 97 | % | | | 72 | % | | | 70 | % | |
| | | Class P | |
| | | Years ended July 31, | |
| | | 2015 | | 2014 | | 2013 | | 2012 | | 2011 | |
Net asset value, beginning of year | | $ | 22.54 | | | $ | 22.63 | | | $ | 16.94 | | | $ | 17.38 | | | $ | 14.53 | | |
Net investment income (loss)1 | | | 0.14 | | | | 0.07 | | | | 0.15 | | | | 0.06 | | | | (0.01 | ) | |
Net realized and unrealized gains (losses) | | | 1.46 | | | | 2.72 | | | | 5.67 | | | | (0.50 | ) | | | 2.87 | | |
Net increase (decrease) from operations | | | 1.60 | | | | 2.79 | | | | 5.82 | | | | (0.44 | ) | | | 2.86 | | |
Dividends from net investment income | | | (0.11 | ) | | | (0.11 | ) | | | (0.13 | ) | | | (0.00 | )3 | | | (0.01 | ) | |
Distributions from net realized gains | | | (2.73 | ) | | | (2.77 | ) | | | — | | | | — | | | | — | | |
Total dividends and distributions | | | (2.84 | ) | | | (2.88 | ) | | | (0.13 | ) | | | (0.00 | )3 | | | (0.01 | ) | |
Net asset value, end of year | | $ | 21.30 | | | $ | 22.54 | | | $ | 22.63 | | | $ | 16.94 | | | $ | 17.38 | | |
Total investment return2 | | | 7.49 | % | | | 12.77 | % | | | 34.51 | % | | | (2.51 | )% | | | 19.66 | % | |
Ratios to average net assets: | |
Expenses before fee waivers and/or expense reimbursements/recoupments | | | 1.09 | % | | | 1.11 | % | | | 1.15 | % | | | 1.22 | % | | | 1.17 | % | |
Expenses after fee waivers and/or expense reimbursements/recoupments | | | 1.09 | % | | | 1.16 | %4 | | | 1.16 | %4 | | | 1.16 | % | | | 1.16 | % | |
Net investment income (loss) | | | 0.65 | % | | | 0.32 | % | | | 0.79 | % | | | 0.37 | % | | | (0.05 | )% | |
Supplemental data: | |
Net assets, end of year (000's) | | $ | 525,959 | | | $ | 510,377 | | | $ | 448,879 | | | $ | 354,936 | | | $ | 387,634 | | |
Portfolio turnover | | | 66 | % | | | 86 | % | | | 97 | % | | | 72 | % | | | 70 | % | |
See accompanying notes to financial statements.
301
PACE Select Advisors Trust
PACE Small/Medium Co Growth Equity Investments
Financial highlights
Selected data for a share of beneficial interest outstanding throughout each year is presented below:
| | | Class A | |
| | | Years ended July 31, | |
| | | 2015 | | 2014 | | 2013 | | 2012 | | 2011 | |
Net asset value, beginning of year | | $ | 19.72 | | | $ | 21.42 | | | $ | 16.45 | | | $ | 16.66 | | | $ | 12.28 | | |
Net investment loss1 | | | (0.14 | ) | | | (0.16 | ) | | | (0.08 | ) | | | (0.12 | ) | | | (0.13 | ) | |
Net realized and unrealized gains (losses) | | | 3.90 | | | | 1.34 | | | | 5.35 | | | | (0.09 | ) | | | 4.51 | | |
Net increase (decrease) from operations | | | 3.76 | | | | 1.18 | | | | 5.27 | | | | (0.21 | ) | | | 4.38 | | |
Distributions from net realized gains | | | (3.03 | ) | | | (2.88 | ) | | | (0.30 | ) | | | — | | | | — | | |
Net asset value, end of year | | $ | 20.45 | | | $ | 19.72 | | | $ | 21.42 | | | $ | 16.45 | | | $ | 16.66 | | |
Total investment return2 | | | 20.82 | % | | | 4.92 | % | | | 32.44 | % | | | (1.26 | )% | | | 35.67 | % | |
Ratios to average net assets: | |
Expenses before fee waivers and/or expense reimbursements/recoupments | | | 1.24 | % | | | 1.25 | % | | | 1.26 | % | | | 1.30 | % | | | 1.28 | % | |
Expenses after fee waivers and/or expense reimbursements/recoupments | | | 1.21 | %3 | | | 1.25 | % | | | 1.26 | % | | | 1.30 | % | | | 1.28 | % | |
Net investment loss | | | (0.70 | )% | | | (0.77 | )% | | | (0.43 | )% | | | (0.73 | )% | | | (0.83 | )% | |
Supplemental data: | |
Net assets, end of year (000's) | | $ | 28,386 | | | $ | 40,210 | | | $ | 41,721 | | | $ | 36,620 | | | $ | 40,992 | | |
Portfolio turnover | | | 88 | % | | | 94 | % | | | 60 | % | | | 94 | % | | | 103 | % | |
| | | Class Y | |
| | | Years ended July 31, | |
| | | 2015 | | 2014 | | 2013 | | 2012 | | 2011 | |
Net asset value, beginning of year | | $ | 20.72 | | | $ | 22.34 | | | $ | 17.13 | | | $ | 17.31 | | | $ | 12.74 | | |
Net investment loss1 | | | (0.13 | ) | | | (0.15 | ) | | | (0.07 | ) | | | (0.10 | ) | | | (0.10 | ) | |
Net realized and unrealized gains (losses) | | | 4.11 | | | | 1.41 | | | | 5.58 | | | | (0.08 | ) | | | 4.67 | | |
Net increase (decrease) from operations | | | 3.98 | | | | 1.26 | | | | 5.51 | | | | (0.18 | ) | | | 4.57 | | |
Distributions from net realized gains | | | (3.03 | ) | | | (2.88 | ) | | | (0.30 | ) | | | — | | | | — | | |
Net asset value, end of year | | $ | 21.67 | | | $ | 20.72 | | | $ | 22.34 | | | $ | 17.13 | | | $ | 17.31 | | |
Total investment return2 | | | 20.89 | % | | | 5.09 | % | | | 32.55 | % | | | (1.04 | )% | | | 35.87 | % | |
Ratios to average net assets: | |
Expenses before fee waivers and/or expense reimbursements/recoupments | | | 1.13 | % | | | 1.14 | % | | | 1.25 | % | | | 1.25 | % | | | 1.08 | % | |
Expenses after fee waivers and/or expense reimbursements/recoupments | | | 1.11 | %3 | | | 1.13 | % | | | 1.13 | % | | | 1.13 | % | | | 1.08 | % | |
Net investment loss | | | (0.62 | )% | | | (0.65 | )% | | | (0.33 | )% | | | (0.59 | )% | | | (0.61 | )% | |
Supplemental data: | |
Net assets, end of year (000's) | | $ | 844 | | | $ | 667 | | | $ | 588 | | | $ | 224 | | | $ | 98 | | |
Portfolio turnover | | | 88 | % | | | 94 | % | | | 60 | % | | | 94 | % | | | 103 | % | |
1 Calculated using the average shares method.
2 Total investment return is calculated assuming a $10,000 investment on the first day of each year reported, reinvestment of all dividends and other distributions, if any, at net asset value on the ex-dividend dates, and a sale at net asset value on the last day of each year reported. The figures do not include any applicable sales charges, redemption fees or program fees; results would be lower if they were included. Returns do not reflect the deduction of taxes that a shareholder would pay on Portfolio distributions or the redemption of Portfolio shares.
3 The investment manager recouped expenses previously reimbursed by the investment manager on behalf of the Portfolio, not to exceed the expense cap.
302
| | | Class C | |
| | | Years ended July 31, | |
| | | 2015 | | 2014 | | 2013 | | 2012 | | 2011 | |
Net asset value, beginning of year | | $ | 17.07 | | | $ | 19.02 | | | $ | 14.75 | | | $ | 15.05 | | | $ | 11.19 | | |
Net investment loss1 | | | (0.24 | ) | | | (0.28 | ) | | | (0.20 | ) | | | (0.21 | ) | | | (0.23 | ) | |
Net realized and unrealized gains (losses) | | | 3.31 | | | | 1.21 | | | | 4.77 | | | | (0.09 | ) | | | 4.09 | | |
Net increase (decrease) from operations | | | 3.07 | | | | 0.93 | | | | 4.57 | | | | (0.30 | ) | | | 3.86 | | |
Distributions from net realized gains | | | (3.03 | ) | | | (2.88 | ) | | | (0.30 | ) | | | — | | | | — | | |
Net asset value, end of year | | $ | 17.11 | | | $ | 17.07 | | | $ | 19.02 | | | $ | 14.75 | | | $ | 15.05 | | |
Total investment return2 | | | 19.93 | % | | | 4.16 | % | | | 31.42 | % | | | (1.99 | )% | | | 34.50 | % | |
Ratios to average net assets: | |
Expenses before fee waivers and/or expense reimbursements/recoupments | | | 1.99 | % | | | 2.01 | % | | | 2.02 | % | | | 2.05 | % | | | 2.05 | % | |
Expenses after fee waivers and/or expense reimbursements/recoupments | | | 1.96 | % | | | 2.00 | % | | | 2.02 | % | | | 2.05 | % | | | 2.09 | %3 | |
Net investment loss | | | (1.46 | )% | | | (1.52 | )% | | | (1.19 | )% | | | (1.49 | )% | | | (1.63 | )% | |
Supplemental data: | |
Net assets, end of year (000's) | | $ | 4,116 | | | $ | 3,977 | | | $ | 4,038 | | | $ | 3,529 | | | $ | 4,158 | | |
Portfolio turnover | | | 88 | % | | | 94 | % | | | 60 | % | | | 94 | % | | | 103 | % | |
| | | Class P | |
| | | Years ended July 31, | |
| | | 2015 | | 2014 | | 2013 | | 2012 | | 2011 | |
Net asset value, beginning of year | | $ | 20.49 | | | $ | 22.13 | | | $ | 16.97 | | | $ | 17.14 | | | $ | 12.62 | | |
Net investment loss1 | | | (0.13 | ) | | | (0.14 | ) | | | (0.06 | ) | | | (0.09 | ) | | | (0.11 | ) | |
Net realized and unrealized gains (losses) | | | 4.07 | | | | 1.38 | | | | 5.52 | | | | (0.08 | ) | | | 4.63 | | |
Net increase (decrease) from operations | | | 3.94 | | | | 1.24 | | | | 5.46 | | | | (0.17 | ) | | | 4.52 | | |
Distributions from net realized gains | | | (3.03 | ) | | | (2.88 | ) | | | (0.30 | ) | | | — | | | | — | | |
Net asset value, end of year | | $ | 21.40 | | | $ | 20.49 | | | $ | 22.13 | | | $ | 16.97 | | | $ | 17.14 | | |
Total investment return2 | | | 20.93 | % | | | 5.04 | % | | | 32.57 | % | | | (0.99 | )% | | | 35.82 | % | |
Ratios to average net assets: | |
Expenses before fee waivers and/or expense reimbursements/recoupments | | | 1.10 | % | | | 1.12 | % | | | 1.14 | % | | | 1.18 | % | | | 1.16 | % | |
Expenses after fee waivers and/or expense reimbursements/recoupments | | | 1.11 | % | | | 1.13 | %3 | | | 1.13 | % | | | 1.13 | % | | | 1.13 | % | |
Net investment loss | | | (0.61 | )% | | | (0.65 | )% | | | (0.30 | )% | | | (0.56 | )% | | | (0.67 | )% | |
Supplemental data: | |
Net assets, end of year (000's) | | $ | 545,517 | | | $ | 474,468 | | | $ | 457,011 | | | $ | 383,330 | | | $ | 423,310 | | |
Portfolio turnover | | | 88 | % | | | 94 | % | | | 60 | % | | | 94 | % | | | 103 | % | |
See accompanying notes to financial statements.
303
PACE Select Advisors Trust
PACE International Equity Investments
Financial highlights
Selected data for a share of beneficial interest outstanding throughout each year is presented below:
| | | Class A | |
| | | Years ended July 31, | |
| | | 2015 | | 2014 | | 2013 | | 2012 | | 2011 | |
Net asset value, beginning of year | | $ | 15.60 | | | $ | 13.96 | | | $ | 11.63 | | | $ | 13.41 | | | $ | 11.72 | | |
Net investment income1 | | | 0.20 | | | | 0.35 | | | | 0.24 | | | | 0.26 | | | | 0.25 | | |
Net realized and unrealized gains (losses) | | | (0.43 | ) | | | 1.56 | | | | 2.36 | | | | (1.71 | ) | | | 1.66 | | |
Net increase (decrease) from operations | | | (0.23 | ) | | | 1.91 | | | | 2.60 | | | | (1.45 | ) | | | 1.91 | | |
Dividends from net investment income | | | (0.33 | ) | | | (0.27 | ) | | | (0.27 | ) | | | (0.33 | ) | | | (0.22 | ) | |
Net asset value, end of year | | $ | 15.04 | | | $ | 15.60 | | | $ | 13.96 | | | $ | 11.63 | | | $ | 13.41 | | |
Total investment return2 | | | (1.38 | )% | | | 13.78 | % | | | 22.63 | % | | | (10.58 | )% | | | 16.37 | % | |
Ratios to average net assets: | |
Expenses before fee waivers and/or expense reimbursements/recoupments, including
dividend expense, interest expense and other borrowing costs for investments sold short | | | 1.78 | %3 | | | 1.70 | % | | | 1.42 | % | | | 1.43 | %3 | | | 1.40 | % | |
Expenses after fee waivers and/or expense reimbursements/recoupments, including
dividend expense, interest expense and other borrowing costs for investments sold short | | | 1.75 | %3 | | | 1.68 | % | | | 1.42 | %4 | | | 1.43 | %3 | | | 1.40 | %4 | |
Expenses after fee waivers and/or expense reimbursements/recoupments, excluding
dividend expense, interest expense and other borrowing costs for investments sold short | | | 1.37 | % | | | 1.37 | % | | | 1.42 | %4 | | | 1.43 | % | | | 1.40 | %4 | |
Net investment income | | | 1.31 | % | | | 2.33 | % | | | 1.84 | % | | | 2.27 | % | | | 1.91 | % | |
Supplemental data: | |
Net assets, end of year (000's) | | $ | 33,882 | | | $ | 57,389 | | | $ | 55,533 | | | $ | 51,294 | | | $ | 66,904 | | |
Portfolio turnover | | | 79 | % | | | 86 | % | | | 36 | % | | | 44 | % | | | 66 | % | |
| | | Class Y | |
| | | Years ended July 31, | |
| | | 2015 | | 2014 | | 2013 | | 2012 | | 2011 | |
Net asset value, beginning of year | | $ | 15.59 | | | $ | 13.95 | | | $ | 11.63 | | | $ | 13.41 | | | $ | 11.71 | | |
Net investment income1 | | | 0.25 | | | | 0.40 | | | | 0.28 | | | | 0.29 | | | | 0.28 | | |
Net realized and unrealized gains (losses) | | | (0.44 | ) | | | 1.55 | | | | 2.35 | | | | (1.70 | ) | | | 1.67 | | |
Net increase (decrease) from operations | | | (0.19 | ) | | | 1.95 | | | | 2.63 | | | | (1.41 | ) | | | 1.95 | | |
Dividends from net investment income | | | (0.40 | ) | | | (0.31 | ) | | | (0.31 | ) | | | (0.37 | ) | | | (0.25 | ) | |
Net asset value, end of year | | $ | 15.00 | | | $ | 15.59 | | | $ | 13.95 | | | $ | 11.63 | | | $ | 13.41 | | |
Total investment return2 | | | (1.09 | )% | | | 14.10 | % | | | 22.97 | % | | | (10.37 | )% | | | 16.65 | % | |
Ratios to average net assets: | |
Expenses before fee waivers and/or expense reimbursements/recoupments, including
dividend expense, interest expense and other borrowing costs for investments sold short | | | 1.51 | %3 | | | 1.42 | % | | | 1.16 | % | | | 1.18 | %3 | | | 1.16 | % | |
Expenses after fee waivers and/or expense reimbursements/recoupments, including
dividend expense, interest expense and other borrowing costs for investments sold short | | | 1.48 | %3 | | | 1.40 | % | | | 1.16 | %4 | | | 1.18 | %3 | | | 1.16 | %4 | |
Expenses after fee waivers and/or expense reimbursements/recoupments, excluding
dividend expense, interest expense and other borrowing costs for investments sold short | | | 1.10 | % | | | 1.09 | % | | | 1.16 | %4 | | | 1.18 | % | | | 1.16 | %4 | |
Net investment income | | | 1.64 | % | | | 2.63 | % | | | 2.13 | % | | | 2.51 | % | | | 2.14 | % | |
Supplemental data: | |
Net assets, end of year (000's) | | $ | 19,150 | | | $ | 22,915 | | | $ | 20,865 | | | $ | 18,004 | | | $ | 21,046 | | |
Portfolio turnover | | | 79 | % | | | 86 | % | | | 36 | % | | | 44 | % | | | 66 | % | |
1 Calculated using the average shares method.
2 Total investment return is calculated assuming a $10,000 investment on the first day of each year reported, reinvestment of all dividends and other distributions, if any, at net asset value on the ex-dividend dates, and a sale at net asset value on the last day of each year reported. The figures do not include any applicable sales charges, redemption fees or program fees; results would be lower if they were included. Returns do not reflect the deduction of taxes that a shareholder would pay on Portfolio distributions or the redemption of Portfolio shares.
3 Includes interest expense representing less than 0.005%.
4 The ratios after and before fee waivers and/or expense reimbursements are the same since the fee waiver/reimbursement represents less than 0.01%.
304
| | | Class C | |
| | | Years ended July 31, | |
| | | 2015 | | 2014 | | 2013 | | 2012 | | 2011 | |
Net asset value, beginning of year | | $ | 15.29 | | | $ | 13.68 | | | $ | 11.41 | | | $ | 13.14 | | | $ | 11.47 | | |
Net investment income1 | | | 0.09 | | | | 0.23 | | | | 0.13 | | | | 0.16 | | | | 0.14 | | |
Net realized and unrealized gains (losses) | | | (0.43 | ) | | | 1.53 | | | | 2.31 | | | | (1.67 | ) | | | 1.64 | | |
Net increase (decrease) from operations | | | (0.34 | ) | | | 1.76 | | | | 2.44 | | | | (1.51 | ) | | | 1.78 | | |
Dividends from net investment income | | | (0.23 | ) | | | (0.15 | ) | | | (0.17 | ) | | | (0.22 | ) | | | (0.11 | ) | |
Net asset value, end of year | | $ | 14.72 | | | $ | 15.29 | | | $ | 13.68 | | | $ | 11.41 | | | $ | 13.14 | | |
Total investment return2 | | | (2.14 | )% | | | 12.93 | % | | | 21.50 | % | | | (11.35 | )% | | | 15.57 | % | |
Ratios to average net assets: | |
Expenses before fee waivers and/or expense reimbursements/recoupments, including
dividend expense, interest expense and other borrowing costs for investments sold short | | | 2.58 | %3 | | | 2.51 | % | | | 2.26 | % | | | 2.27 | %3 | | | 2.23 | % | |
Expenses after fee waivers and/or expense reimbursements/recoupments, including
dividend expense, interest expense and other borrowing costs for investments sold short | | | 2.55 | %3 | | | 2.49 | % | | | 2.25 | % | | | 2.27 | %3 | | | 2.23 | %4 | |
Expenses after fee waivers and/or expense reimbursements/recoupments, excluding
dividend expense, interest expense and other borrowing costs for investments sold short | | | 2.16 | % | | | 2.18 | % | | | 2.25 | % | | | 2.27 | % | | | 2.23 | %4 | |
Net investment income | | | 0.62 | % | | | 1.52 | % | | | 1.01 | % | | | 1.41 | % | | | 1.08 | % | |
Supplemental data: | |
Net assets, end of year (000's) | | $ | 2,744 | | | $ | 2,919 | | | $ | 2,746 | | | $ | 2,573 | | | $ | 3,601 | | |
Portfolio turnover | | | 79 | % | | | 86 | % | | | 36 | % | | | 44 | % | | | 66 | % | |
| | | Class P | |
| | | Years ended July 31, | |
| | | 2015 | | 2014 | | 2013 | | 2012 | | 2011 | |
Net asset value, beginning of year | | $ | 15.56 | | | $ | 13.92 | | | $ | 11.60 | | | $ | 13.39 | | | $ | 11.69 | | |
Net investment income1 | | | 0.25 | | | | 0.40 | | | | 0.28 | | | | 0.29 | | | | 0.29 | | |
Net realized and unrealized gains (losses) | | | (0.44 | ) | | | 1.54 | | | | 2.35 | | | | (1.71 | ) | | | 1.66 | | |
Net increase (decrease) from operations | | | (0.19 | ) | | | 1.94 | | | | 2.63 | | | | (1.42 | ) | | | 1.95 | | |
Dividends from net investment income | | | (0.40 | ) | | | (0.30 | ) | | | (0.31 | ) | | | (0.37 | ) | | | (0.25 | ) | |
Net asset value, end of year | | $ | 14.97 | | | $ | 15.56 | | | $ | 13.92 | | | $ | 11.60 | | | $ | 13.39 | | |
Total investment return2 | | | (1.11 | )% | | | 14.12 | % | | | 22.92 | % | | | (10.39 | )% | | | 16.79 | % | |
Ratios to average net assets: | |
Expenses before fee waivers and/or expense reimbursements/recoupments, including
dividend expense, interest expense and other borrowing costs for investments sold short | | | 1.52 | %3 | | | 1.45 | % | | | 1.17 | % | | | 1.18 | %3 | | | 1.16 | % | |
Expenses after fee waivers and/or expense reimbursements/recoupments, including
dividend expense, interest expense and other borrowing costs for investments sold short | | | 1.49 | %3 | | | 1.43 | % | | | 1.17 | %4 | | | 1.18 | %3 | | | 1.16 | %4 | |
Expenses after fee waivers and/or expense reimbursements/recoupments, excluding
dividend expense, interest expense and other borrowing costs for investments sold short | | | 1.10 | % | | | 1.11 | % | | | 1.17 | %4 | | | 1.18 | % | | | 1.16 | %4 | |
Net investment income | | | 1.69 | % | | | 2.63 | % | | | 2.12 | % | | | 2.54 | % | | | 2.20 | % | |
Supplemental data: | |
Net assets, end of year (000's) | | $ | 1,016,420 | | | $ | 1,025,757 | | | $ | 863,063 | | | $ | 698,255 | | | $ | 817,011 | | |
Portfolio turnover | | | 79 | % | | | 86 | % | | | 36 | % | | | 44 | % | | | 66 | % | |
See accompanying notes to financial statements.
305
PACE Select Advisors Trust
PACE International Emerging Markets Equity Investments
Financial highlights
Selected data for a share of beneficial interest outstanding throughout each year is presented below:
| | | Class A | |
| | | Years ended July 31, | |
| | | 2015 | | 2014 | | 2013 | | 2012 | | 2011 | |
Net asset value, beginning of year | | $ | 13.56 | | | $ | 12.29 | | | $ | 11.81 | | | $ | 13.80 | | | $ | 12.19 | | |
Net investment income (loss)1 | | | 0.09 | | | | 0.14 | | | | 0.09 | | | | 0.11 | | | | 0.12 | | |
Net realized and unrealized gains (losses) | | | (1.78 | ) | | | 1.17 | | | | 0.49 | | | | (1.86 | ) | | | 1.59 | | |
Net increase (decrease) from operations | | | (1.69 | ) | | | 1.31 | | | | 0.58 | | | | (1.75 | ) | | | 1.71 | | |
Dividends from net investment income | | | (0.06 | ) | | | (0.04 | ) | | | (0.10 | ) | | | (0.11 | ) | | | (0.10 | ) | |
Distributions from net realized gains | | | — | | | | — | | | | — | | | | (0.13 | ) | | | — | | |
Total dividends and distributions | | | (0.06 | ) | | | (0.04 | ) | | | (0.10 | ) | | | (0.24 | ) | | | (0.10 | ) | |
Net asset value, end of year | | $ | 11.81 | | | $ | 13.56 | | | $ | 12.29 | | | $ | 11.81 | | | $ | 13.80 | | |
Total investment return3 | | | (12.50 | )% | | | 10.71 | % | | | 4.81 | % | | | (12.52 | )% | | | 14.01 | % | |
Ratios to average net assets: | |
Expenses before fee waivers and/or expense reimbursements/recoupments | | | 1.77 | %5 | | | 1.80 | % | | | 1.82 | % | | | 1.90 | % | | | 1.84 | % | |
Expenses after fee waivers and/or expense reimbursements/recoupments | | | 1.67 | %5 | | | 1.69 | % | | | 1.75 | % | | | 1.90 | % | | | 1.84 | %4 | |
Net investment income (loss) | | | 0.67 | % | | | 1.14 | % | | | 0.72 | % | | | 0.93 | % | | | 0.87 | % | |
Supplemental data: | |
Net assets, end of year (000's) | | $ | 4,707 | | | $ | 17,200 | | | $ | 16,810 | | | $ | 17,559 | | | $ | 22,648 | | |
Portfolio turnover | | | 63 | % | | | 74 | % | | | 158 | % | | | 30 | % | | | 111 | % | |
| | | Class Y | |
| | | Years ended July 31, | |
| | | 2015 | | 2014 | | 2013 | | 2012 | | 2011 | |
Net asset value, beginning of year | | $ | 13.82 | | | $ | 12.53 | | | $ | 12.03 | | | $ | 14.06 | | | $ | 12.41 | | |
Net investment income1 | | | 0.15 | | | | 0.18 | | | | 0.12 | | | | 0.14 | | | | 0.15 | | |
Net realized and unrealized gains (losses) | | | (1.84 | ) | | | 1.18 | | | | 0.51 | | | | (1.90 | ) | | | 1.61 | | |
Net increase (decrease) from operations | | | (1.69 | ) | | | 1.36 | | | | 0.63 | | | | (1.76 | ) | | | 1.76 | | |
Dividends from net investment income | | | (0.16 | ) | | | (0.07 | ) | | | (0.13 | ) | | | (0.14 | ) | | | (0.11 | ) | |
Distributions from net realized gains | | | — | | | | — | | | | — | | | | (0.13 | ) | | | — | | |
Total dividends and distributions | | | (0.16 | ) | | | (0.07 | ) | | | (0.13 | ) | | | (0.27 | ) | | | (0.11 | ) | |
Net asset value, end of year | | $ | 11.97 | | | $ | 13.82 | | | $ | 12.53 | | | $ | 12.03 | | | $ | 14.06 | | |
Total investment return3 | | | (12.30 | )% | | | 10.94 | % | | | 5.13 | % | | | (12.35 | )% | | | 14.22 | % | |
Ratios to average net assets: | |
Expenses before fee waivers and/or expense reimbursements/recoupments | | | 1.53 | %5 | | | 1.55 | % | | | 1.58 | % | | | 1.67 | % | | | 1.61 | % | |
Expenses after fee waivers and/or expense reimbursements/recoupments | | | 1.44 | %5 | | | 1.44 | % | | | 1.51 | % | | | 1.67 | % | | | 1.61 | %4 | |
Net investment income | | | 1.15 | % | | | 1.37 | % | | | 0.94 | % | | | 1.17 | % | | | 1.08 | % | |
Supplemental data: | |
Net assets, end of year (000's) | | $ | 8,767 | | | $ | 11,978 | | | $ | 12,835 | | | $ | 13,835 | | | $ | 17,808 | | |
Portfolio turnover | | | 63 | % | | | 74 | % | | | 158 | % | | | 30 | % | | | 111 | % | |
1 Calculated using the average shares method.
2 Amount represents less than $0.005 per share.
3 Total investment return is calculated assuming a $10,000 investment on the first day of each year reported, reinvestment of all dividends and other distributions, if any, at net asset value on the ex-dividend dates, and a sale at net asset value on the last day of each year reported. The figures do not include any applicable sales charges, redemption fees or program fees; results would be lower if they were included. Returns do not reflect the deduction of taxes that a shareholder would pay on Portfolio distributions or the redemption of Portfolio shares.
4 The ratios after and before fee waivers and/or expense reimbursements are the same since the fee waiver/reimbursement represents less than 0.01%.
5 Includes interest expense representing less than 0.005%.
306
| | | Class C | |
| | | Years ended July 31, | |
| | | 2015 | | 2014 | | 2013 | | 2012 | | 2011 | |
Net asset value, beginning of year | | $ | 12.61 | | | $ | 11.48 | | | $ | 11.04 | | | $ | 12.87 | | | $ | 11.38 | | |
Net investment income (loss)1 | | | 0.03 | | | | 0.04 | | | | (0.00 | )2 | | | 0.02 | | | | 0.01 | | |
Net realized and unrealized gains (losses) | | | (1.68 | ) | | | 1.09 | | | | 0.44 | | | | (1.72 | ) | | | 1.48 | | |
Net increase (decrease) from operations | | | (1.65 | ) | | | 1.13 | | | | 0.44 | | | | (1.70 | ) | | | 1.49 | | |
Dividends from net investment income | | | (0.03 | ) | | | — | | | | — | | | | — | | | | — | | |
Distributions from net realized gains | | | — | | | | — | | | | — | | | | (0.13 | ) | | | — | | |
Total dividends and distributions | | | (0.03 | ) | | | — | | | | — | | | | (0.13 | ) | | | — | | |
Net asset value, end of year | | $ | 10.93 | | | $ | 12.61 | | | $ | 11.48 | | | $ | 11.04 | | | $ | 12.87 | | |
Total investment return3 | | | (13.17 | )% | | | 9.93 | % | | | 3.99 | % | | | (13.13 | )% | | | 13.19 | % | |
Ratios to average net assets: | |
Expenses before fee waivers and/or expense reimbursements/recoupments | | | 2.50 | %5 | | | 2.55 | % | | | 2.57 | % | | | 2.65 | % | | | 2.58 | % | |
Expenses after fee waivers and/or expense reimbursements/recoupments | | | 2.41 | %5 | | | 2.44 | % | | | 2.49 | % | | | 2.65 | % | | | 2.58 | %4 | |
Net investment income (loss) | | | 0.21 | % | | | 0.37 | % | | | (0.04 | )% | | | 0.16 | % | | | 0.11 | % | |
Supplemental data: | |
Net assets, end of year (000's) | | $ | 1,661 | | | $ | 2,079 | | | $ | 2,201 | | | $ | 2,396 | | | $ | 3,373 | | |
Portfolio turnover | | | 63 | % | | | 74 | % | | | 158 | % | | | 30 | % | | | 111 | % | |
| | | Class P | |
| | | Years ended July 31, | |
| | | 2015 | | 2014 | | 2013 | | 2012 | | 2011 | |
Net asset value, beginning of year | | $ | 13.75 | | | $ | 12.47 | | | $ | 11.98 | | | $ | 14.00 | | | $ | 12.36 | | |
Net investment income1 | | | 0.16 | | | | 0.18 | | | | 0.12 | | | | 0.12 | | | | 0.13 | | |
Net realized and unrealized gains (losses) | | | (1.85 | ) | | | 1.17 | | | | 0.47 | | | | (1.89 | ) | | | 1.60 | | |
Net increase (decrease) from operations | | | (1.69 | ) | | | 1.35 | | | | 0.59 | | | | (1.77 | ) | | | 1.73 | | |
Dividends from net investment income | | | (0.15 | ) | | | (0.07 | ) | | | (0.10 | ) | | | (0.12 | ) | | | (0.09 | ) | |
Distributions from net realized gains | | | — | | | | — | | | | — | | | | (0.13 | ) | | | — | | |
Total dividends and distributions | | | (0.15 | ) | | | (0.07 | ) | | | (0.10 | ) | | | (0.25 | ) | | | (0.09 | ) | |
Net asset value, end of year | | $ | 11.91 | | | $ | 13.75 | | | $ | 12.47 | | | $ | 11.98 | | | $ | 14.00 | | |
Total investment return3 | | | (12.33 | )% | | | 10.86 | % | | | 4.87 | % | | | (12.49 | )% | | | 14.04 | % | |
Ratios to average net assets: | |
Expenses before fee waivers and/or expense reimbursements/recoupments | | | 1.56 | %5 | | | 1.64 | % | | | 1.75 | % | | | 1.88 | % | | | 1.79 | % | |
Expenses after fee waivers and/or expense reimbursements/recoupments | | | 1.47 | %5 | | | 1.53 | % | | | 1.67 | % | | | 1.88 | % | | | 1.79 | %4 | |
Net investment income | | | 1.18 | % | | | 1.37 | % | | | 0.92 | % | | | 0.97 | % | | | 0.95 | % | |
Supplemental data: | |
Net assets, end of year (000's) | | $ | 417,751 | | | $ | 450,438 | | | $ | 334,525 | | | $ | 218,196 | | | $ | 264,991 | | |
Portfolio turnover | | | 63 | % | | | 74 | % | | | 158 | % | | | 30 | % | | | 111 | % | |
See accompanying notes to financial statements.
307
PACE Select Advisors Trust
PACE Global Real Estate Securities Investments
Financial highlights
Selected data for a share of beneficial interest outstanding throughout each year is presented below:
| | | Class A | |
| | | Years ended July 31, | |
| | | 2015 | | 2014 | | 2013 | | 2012 | | 2011 | |
Net asset value, beginning of year | | $ | 7.33 | | | $ | 6.52 | | | $ | 6.05 | | | $ | 6.02 | | | $ | 5.31 | | |
Net investment income1 | | | 0.16 | | | | 0.10 | | | | 0.08 | | | | 0.09 | | | | 0.09 | | |
Net realized and unrealized gains | | | 0.02 | | | | 0.83 | | | | 0.65 | | | | 0.08 | | | | 1.01 | | |
Net increase from operations | | | 0.18 | | | | 0.93 | | | | 0.73 | | | | 0.17 | | | | 1.10 | | |
Dividends from net investment income | | | — | | | | (0.12 | ) | | | (0.26 | ) | | | (0.14 | ) | | | (0.39 | ) | |
Net asset value, end of year | | $ | 7.51 | | | $ | 7.33 | | | $ | 6.52 | | | $ | 6.05 | | | $ | 6.02 | | |
Total investment return2 | | | 2.46 | % | | | 14.56 | % | | | 12.24 | % | | | 3.28 | % | | | 21.49 | % | |
Ratios to average net assets: | |
Expenses before fee waivers and/or expense reimbursements/recoupments | | | 1.59 | % | | | 1.59 | % | | | 1.56 | % | | | 1.69 | % | | | 1.68 | % | |
Expenses after fee waivers and/or expense reimbursements/recoupments | | | 1.45 | % | | | 1.45 | % | | | 1.45 | % | | | 1.45 | % | | | 1.45 | % | |
Net investment income | | | 2.21 | % | | | 1.55 | % | | | 1.19 | % | | | 1.61 | % | | | 1.54 | % | |
Supplemental data: | |
Net assets, end of year (000's) | | $ | 363 | | | $ | 5,692 | | | $ | 5,233 | | | $ | 4,838 | | | $ | 4,566 | | |
Portfolio turnover | | | 102 | % | | | 53 | % | | | 92 | % | | | 66 | % | | | 51 | % | |
| | | Class Y | |
| | | Years ended July 31, | |
| | | 2015 | | 2014 | | 2013 | | 2012 | | 2011 | |
Net asset value, beginning of year | | $ | 7.37 | | | $ | 6.55 | | | $ | 6.08 | | | $ | 6.05 | | | $ | 5.33 | | |
Net investment income1 | | | 0.14 | | | | 0.12 | | | | 0.09 | | | | 0.11 | | | | 0.10 | | |
Net realized and unrealized gains | | | 0.05 | | | | 0.84 | | | | 0.66 | | | | 0.07 | | | | 1.02 | | |
Net increase from operations | | | 0.19 | | | | 0.96 | | | | 0.75 | | | | 0.18 | | | | 1.12 | | |
Dividends from net investment income | | | (0.26 | ) | | | (0.14 | ) | | | (0.28 | ) | | | (0.15 | ) | | | (0.40 | ) | |
Net asset value, end of year | | $ | 7.30 | | | $ | 7.37 | | | $ | 6.55 | | | $ | 6.08 | | | $ | 6.05 | | |
Total investment return2 | | | 2.58 | % | | | 14.94 | % | | | 12.53 | % | | | 3.46 | % | | | 21.89 | % | |
Ratios to average net assets: | |
Expenses before fee waivers and/or expense reimbursements/recoupments | | | 1.27 | % | | | 1.38 | % | | | 1.39 | % | | | 1.39 | % | | | 1.34 | % | |
Expenses after fee waivers and/or expense reimbursements/recoupments | | | 1.20 | % | | | 1.20 | % | | | 1.20 | % | | | 1.20 | % | | | 1.20 | % | |
Net investment income | | | 1.84 | % | | | 1.81 | % | | | 1.43 | % | | | 1.90 | % | | | 1.74 | % | |
Supplemental data: | |
Net assets, end of year (000's) | | $ | 281 | | | $ | 280 | | | $ | 294 | | | $ | 210 | | | $ | 195 | | |
Portfolio turnover | | | 102 | % | | | 53 | % | | | 92 | % | | | 66 | % | | | 51 | % | |
1 Calculated using the average shares method.
2 Total investment return is calculated assuming a $10,000 investment on the first day of each year reported, reinvestment of all dividends and other distributions, if any, at net asset value on the ex-dividend dates, and a sale at net asset value on the last day of each year reported. The figures do not include any applicable sales charges, redemption fees or program fees; results would be lower if they were included. Returns do not reflect the deduction of taxes that a shareholder would pay on Portfolio distributions or the redemption of Portfolio shares.
308
| | | Class C | |
| | | Years ended July 31, | |
| | | 2015 | | 2014 | | 2013 | | 2012 | | 2011 | |
Net asset value, beginning of year | | $ | 7.29 | | | $ | 6.48 | | | $ | 6.00 | | | $ | 5.99 | | | $ | 5.29 | | |
Net investment income1 | | | 0.06 | | | | 0.05 | | | | 0.03 | | | | 0.05 | | | | 0.05 | | |
Net realized and unrealized gains | | | 0.06 | | | | 0.83 | | | | 0.65 | | | | 0.07 | | | | 1.00 | | |
Net increase from operations | | | 0.12 | | | | 0.88 | | | | 0.68 | | | | 0.12 | | | | 1.05 | | |
Dividends from net investment income | | | (0.20 | ) | | | (0.07 | ) | | | (0.20 | ) | | | (0.11 | ) | | | (0.35 | ) | |
Net asset value, end of year | | $ | 7.21 | | | $ | 7.29 | | | $ | 6.48 | | | $ | 6.00 | | | $ | 5.99 | | |
Total investment return2 | | | 1.58 | % | | | 13.77 | % | | | 11.52 | % | | | 2.42 | % | | | 20.51 | % | |
Ratios to average net assets: | |
Expenses before fee waivers and/or expense reimbursements/recoupments | | | 2.24 | % | | | 2.30 | % | | | 2.27 | % | | | 2.44 | % | | | 2.45 | % | |
Expenses after fee waivers and/or expense reimbursements/recoupments | | | 2.20 | % | | | 2.20 | % | | | 2.20 | % | | | 2.20 | % | | | 2.20 | % | |
Net investment income | | | 0.79 | % | | | 0.78 | % | | | 0.40 | % | | | 0.92 | % | | | 0.79 | % | |
Supplemental data: | |
Net assets, end of year (000's) | | $ | 340 | | | $ | 272 | | | $ | 222 | | | $ | 172 | | | $ | 220 | | |
Portfolio turnover | | | 102 | % | | | 53 | % | | | 92 | % | | | 66 | % | | | 51 | % | |
| | | Class P | |
| | | Years ended July 31, | |
| | | 2015 | | 2014 | | 2013 | | 2012 | | 2011 | |
Net asset value, beginning of year | | $ | 7.35 | | | $ | 6.53 | | | $ | 6.06 | | | $ | 6.03 | | | $ | 5.32 | | |
Net investment income1 | | | 0.14 | | | | 0.12 | | | | 0.10 | | | | 0.10 | | | | 0.10 | | |
Net realized and unrealized gains | | | 0.05 | | | | 0.84 | | | | 0.65 | | | | 0.08 | | | | 1.01 | | |
Net increase from operations | | | 0.19 | | | | 0.96 | | | | 0.75 | | | | 0.18 | | | | 1.11 | | |
Dividends from net investment income | | | (0.26 | ) | | | (0.14 | ) | | | (0.28 | ) | | | (0.15 | ) | | | (0.40 | ) | |
Net asset value, end of year | | $ | 7.28 | | | $ | 7.35 | | | $ | 6.53 | | | $ | 6.06 | | | $ | 6.03 | | |
Total investment return2 | | | 2.59 | % | | | 15.00 | % | | | 12.57 | % | | | 3.47 | % | | | 21.74 | % | |
Ratios to average net assets: | |
Expenses before fee waivers and/or expense reimbursements/recoupments | | | 1.56 | % | | | 1.63 | % | | | 1.52 | % | | | 1.65 | % | | | 1.65 | % | |
Expenses after fee waivers and/or expense reimbursements/recoupments | | | 1.20 | % | | | 1.20 | % | | | 1.20 | % | | | 1.20 | % | | | 1.20 | % | |
Net investment income | | | 1.83 | % | | | 1.79 | % | | | 1.47 | % | | | 1.88 | % | | | 1.77 | % | |
Supplemental data: | |
Net assets, end of year (000's) | | $ | 148,096 | | | $ | 145,067 | | | $ | 116,509 | | | $ | 108,101 | | | $ | 101,008 | | |
Portfolio turnover | | | 102 | % | | | 53 | % | | | 92 | % | | | 66 | % | | | 51 | % | |
See accompanying notes to financial statements.
309
PACE Select Advisors Trust
PACE Alternative Strategies Investments
Financial highlights
Selected data for a share of beneficial interest outstanding throughout each year is presented below:
| | Class A | |
| | Years ended July 31, | |
| | 2015 | | 2014 | | 2013 | | 2012 | | 2011 | |
Net asset value, beginning of year | | $ | 10.62 | | | $ | 10.21 | | | $ | 9.35 | | | $ | 9.32 | | | $ | 9.16 | | |
Net investment loss1 | | | (0.08 | ) | | | (0.09 | ) | | | (0.05 | ) | | | (0.02 | ) | | | (0.00 | )2 | |
Net realized and unrealized gains | | | 0.56 | | | | 0.70 | | | | 0.95 | | | | 0.05 | | | | 0.25 | | |
Net increase from operations | | | 0.48 | | | | 0.61 | | | | 0.90 | | | | 0.03 | | | | 0.25 | | |
Dividends from net investment income | | | — | | | | (0.20 | ) | | | (0.04 | ) | | | — | | | | (0.09 | ) | |
Net asset value, end of year | | $ | 11.10 | | | $ | 10.62 | | | $ | 10.21 | | | $ | 9.35 | | | $ | 9.32 | | |
Total investment return3 | | | 4.52 | % | | | 5.99 | % | | | 9.54 | % | | | 0.43 | % | | | 2.69 | % | |
Ratios to average net assets: | |
Expenses before fee waivers and/or expense reimbursements/recoupments, including
dividend expense, interest expense and other borrowing costs for investments sold short | | | 1.93 | % | | | 1.97 | % | | | 2.01 | % | | | 2.12 | % | | | 2.08 | % | |
Expenses after fee waivers and/or expense reimbursements/recoupments, including
dividend expense, interest expense and other borrowing costs for investments sold short | | | 1.88 | % | | | 1.99 | %5 | | | 1.98 | %5 | | | 2.10 | %5 | | | 2.05 | % | |
Expenses after fee waivers and/or expense reimbursements/recoupments, excluding
dividend expense, interest expense and other borrowing costs for investments sold short | | | 1.81 | % | | | 1.88 | %5 | | | 1.90 | %5 | | | 1.95 | %5 | | | 1.95 | % | |
Net investment loss | | | (0.74 | )% | | | (0.89 | )% | | | (0.49 | )% | | | (0.23 | )% | | | (0.02 | )% | |
Supplemental data: | |
Net assets, end of year (000's) | | $ | 7,408 | | | $ | 77,331 | | | $ | 53,728 | | | $ | 43,644 | | | $ | 63,767 | | |
Portfolio turnover | | | 165 | % | | | 114 | % | | | 140 | % | | | 242 | % | | | 295 | % | |
| | Class Y | |
| | Years ended July 31, | |
| | 2015 | | 2014 | | 2013 | | 2012 | | 2011 | |
Net asset value, beginning of year | | $ | 10.71 | | | $ | 10.30 | | | $ | 9.43 | | | $ | 9.38 | | | $ | 9.19 | | |
Net investment income (loss)1 | | | (0.05 | ) | | | (0.07 | ) | | | (0.03 | ) | | | 0.002 | | | | 0.02 | | |
Net realized and unrealized gains | | | 0.56 | | | | 0.70 | | | | 0.97 | | | | 0.05 | | | | 0.25 | | |
Net increase from operations | | | 0.51 | | | | 0.63 | | | | 0.94 | | | | 0.05 | | | | 0.27 | | |
Dividends from net investment income | | | (0.10 | ) | | | (0.22 | ) | | | (0.07 | ) | | | — | | | | (0.08 | ) | |
Net asset value, end of year | | $ | 11.12 | | | $ | 10.71 | | | $ | 10.30 | | | $ | 9.43 | | | $ | 9.38 | | |
Total investment return3 | | | 4.82 | % | | | 6.18 | % | | | 9.89 | % | | | 0.64 | % | | | 2.84 | % | |
Ratios to average net assets: | |
Expenses before fee waivers and/or reimbursements/recoupments, including
dividend expense, interest expense and other borrowing costs for investments sold short | | | 1.72 | % | | | 1.74 | % | | | 1.77 | % | | | 1.91 | % | | | 1.85 | % | |
Expenses after fee waivers and/or expense reimbursements/recoupments, including
dividend expense, interest expense and other borrowing costs for investments sold short | | | 1.68 | %5 | | | 1.75 | %5 | | | 1.73 | %5 | | | 1.86 | %5 | | | 1.80 | % | |
Expenses after fee waivers and/or expense reimbursements/recoupments, excluding
dividend expense, interest expense and other borrowing costs for investments sold short | | | 1.60 | %5 | | | 1.63 | %5 | | | 1.65 | %5 | | | 1.70 | %5 | | | 1.70 | % | |
Net investment income (loss) | | | (0.43 | )% | | | (0.65 | )% | | | (0.25 | )% | | | 0.00 | %6 | | | 0.21 | % | |
Supplemental data: | |
Net assets, end of year (000's) | | $ | 2,449 | | | $ | 4,629 | | | $ | 2,732 | | | $ | 1,668 | | | $ | 1,565 | | |
Portfolio turnover | | | 165 | % | | | 114 | % | | | 140 | % | | | 242 | % | | | 295 | % | |
1 Calculated using the average shares method.
2 Amount represents less than $0.005 per share.
3 Total investment return is calculated assuming a $10,000 investment on the first day of each year reported, reinvestment of all dividends and other distributions, if any, at net asset value on the ex-dividend dates, and a sale at net asset value on the last day of each year reported. The figures do not include any applicable sales charges, redemption fees or program fees; results would be lower if they were included. Returns do not reflect the deduction of taxes that a shareholder would pay on Portfolio distributions or the redemption of Portfolio shares.
4 The ratios after and before fee waivers and/or expense reimbursements by and recoupments to manager are the same since the recoupments to manager represent less than 0.01%.
5 The investment manager recouped expenses previously reimbursed by the investment manager on behalf of the Portfolio, not to exceed the expense cap.
6 Amount represents less than 0.005%.
310
| | Class C | |
| | Years ended July 31, | |
| | 2015 | | 2014 | | 2013 | | 2012 | | 2011 | |
Net asset value, beginning of year | | $ | 10.29 | | | $ | 9.90 | | | $ | 9.09 | | | $ | 9.13 | | | $ | 8.97 | | |
Net investment loss1 | | | (0.14 | ) | | | (0.16 | ) | | | (0.11 | ) | | | (0.08 | ) | | | (0.07 | ) | |
Net realized and unrealized gains | | | 0.53 | | | | 0.67 | | | | 0.92 | | | | 0.04 | | | | 0.25 | | |
Net increase from operations | | | 0.39 | | | | 0.51 | | | | 0.81 | | | | (0.04 | ) | | | 0.18 | | |
Dividends from net investment income | | | (0.02 | ) | | | (0.12 | ) | | | — | | | | — | | | | (0.02 | ) | |
Net asset value, end of year | | $ | 10.66 | | | $ | 10.29 | | | $ | 9.90 | | | $ | 9.09 | | | $ | 9.13 | | |
Total investment return3 | | | 3.81 | % | | | 5.18 | % | | | 8.79 | % | | | (0.22 | )% | | | 1.93 | % | |
Ratios to average net assets: | |
Expenses before fee waivers and/or expense reimbursements/recoupments, including
dividend expense, interest expense and other borrowing costs for investments sold short | | | 2.67 | % | | | 2.71 | % | | | 2.72 | % | | | 2.82 | % | | | 2.78 | %4 | |
Expenses after fee waivers and/or expense reimbursements/recoupments, including
dividend expense, interest expense and other borrowing costs for investments sold short | | | 2.60 | % | | | 2.70 | % | | | 2.70 | % | | | 2.78 | % | | | 2.78 | %4,5 | |
Expenses after fee waivers and/or expense reimbursements/recoupments, excluding
dividend expense, interest expense and other borrowing costs for investments sold short | | | 2.52 | % | | | 2.58 | % | | | 2.62 | % | | | 2.63 | % | | | 2.68 | %5 | |
Net investment loss | | | (1.37 | )% | | | (1.60 | )% | | | (1.20 | )% | | | (0.91 | )% | | | (0.77 | )% | |
Supplemental data: | |
Net assets, end of year (000's) | | $ | 9,385 | | | $ | 6,346 | | | $ | 4,827 | | | $ | 4,989 | | | $ | 6,479 | | |
Portfolio turnover | | | 165 | % | | | 114 | % | | | 140 | % | | | 242 | % | | | 295 | % | |
| | Class P | |
| | Years ended July 31, | |
| | 2015 | | 2014 | | 2013 | | 2012 | | 2011 | |
Net asset value, beginning of year | | $ | 10.69 | | | $ | 10.27 | | | $ | 9.41 | | | $ | 9.36 | | | $ | 9.19 | | |
Net investment income (loss)1 | | | (0.04 | ) | | | (0.07 | ) | | | (0.02 | ) | | | 0.002 | | | | 0.02 | | |
Net realized and unrealized gains | | | 0.55 | | | | 0.71 | | | | 0.95 | | | | 0.05 | | | | 0.26 | | |
Net increase from operations | | | 0.51 | | | | 0.64 | | | | 0.93 | | | | 0.05 | | | | 0.28 | | |
Dividends from net investment income | | | (0.11 | ) | | | (0.22 | ) | | | (0.07 | ) | | | — | | | | (0.11 | ) | |
Net asset value, end of year | | $ | 11.09 | | | $ | 10.69 | | | $ | 10.27 | | | $ | 9.41 | | | $ | 9.36 | | |
Total investment return3 | | | 4.79 | % | | | 6.27 | % | | | 9.93 | % | | | 0.64 | % | | | 2.94 | % | |
Ratios to average net assets: | |
Expenses before fee waivers and/or reimbursements/recoupments, including
dividend expense, interest expense and other borrowing costs for investments sold short | | | 1.69 | % | | | 1.74 | %4 | | | 1.74 | % | | | 1.85 | % | | | 1.81 | % | |
Expenses after fee waivers and/or expense reimbursements/recoupments, including
dividend expense, interest expense and other borrowing costs for investments sold short | | | 1.62 | % | | | 1.74 | %4,5 | | | 1.71 | % | | | 1.85 | %5 | | | 1.80 | % | |
Expenses after fee waivers and/or expense reimbursements/recoupments, excluding
dividend expense, interest expense and other borrowing costs for investments sold short | | | 1.54 | % | | | 1.62 | %5 | | | 1.63 | % | | | 1.69 | %5 | | | 1.70 | % | |
Net investment income (loss) | | | (0.38 | )% | | | (0.64 | )% | | | (0.21 | )% | | | 0.02 | % | | | 0.22 | % | |
Supplemental data: | |
Net assets, end of year (000's) | | $ | 782,683 | | | $ | 611,399 | | | $ | 493,524 | | | $ | 449,925 | | | $ | 476,544 | | |
Portfolio turnover | | | 165 | % | | | 114 | % | | | 140 | % | | | 242 | % | | | 295 | % | |
See accompanying notes to financial statements.
311
PACE Select Advisors Trust
Notes to financial statements
Organization and significant accounting policies
PACE Select Advisors Trust (the "Trust") is registered with the US Securities and Exchange Commission ("SEC") under the Investment Company Act of 1940 (the "1940 Act"), as amended, as an open-end management investment company currently composed of fifteen separate investment portfolios and was organized as a Delaware statutory trust under the laws of the State of Delaware by Certificate of Trust dated September 9, 1994, as amended June 9, 1995 and thereafter. The trustees of the Trust have authority to issue an unlimited number of shares of beneficial interest, par value $0.001 per share.
The Trust has fifteen portfolios available for investment, each having its own investment objectives and policies: PACE Money Market Investments, PACE Mortgage-Backed Securities Fixed Income Investments, PACE Intermediate Fixed Income Investments, PACE Strategic Fixed Income Investments, PACE Municipal Fixed Income Investments, PACE International Fixed Income Investments, PACE High Yield Investments, PACE Large Co Value Equity Investments, PACE Large Co Growth Equity Investments, PACE Small/Medium Co Value Equity Investments, PACE Small/Medium Co Growth Equity Investments, PACE International Equity Investments, PACE International Emerging Markets Equity Investments, PACE Global Real Estate Securities Investments and PACE Alternative Strategies Investments (each a "Portfolio" and collectively, the "Portfolios").
Each of the Portfolios is classified as a diversified investment company with the exception of PACE Intermediate Fixed Income Investments, PACE International Fixed Income Investments, PACE Global Real Estate Securities Investments and PACE Alternative Strategies Investments. With the exception of PACE Money Market Investments (which currently offers Class P shares only) each Portfolio currently offers Class A, Class C, Class Y and Class P shares. Each class represents interests in the same assets of the applicable Portfolio and the classes are identical except for differences in their sales charge structures, ongoing service and distribution charges and certain transfer agency and related services expenses. All classes of shares have equal voting privileges except that each class has exclusive voting rights with respect to its service and/or distribution plan, if any. Class Y and Class P shares have no service or distribution plan. The Portfolios' Class P shares currently are available for purchase only to participants in the PACESM Select Advisors Program, except that PACE Money Market Investments shares are also available to participants in the PACESM Multi Advisor Program.
The Trust accounts separately for the assets, liabilities and operations of each Portfolio. Expenses directly attributable to each Portfolio are charged to that Portfolio's operations; expenses which are applicable to all Portfolios are allocated among them on a pro rata basis.
In the normal course of business, the Portfolios may enter into contracts that contain a variety of representations or that provide indemnification for certain liabilities. The Portfolios' maximum exposure under these arrangements is unknown, as this would involve future claims that may be made against the Portfolios that have not yet occurred. However, the Portfolios have not had such claims or losses through July 31, 2015 pursuant to these contracts and expect the risk of loss to be remote.
PACE Money Market Investments attempts to maintain a stable net asset value of $1.00 per share; the Portfolio has adopted certain investment, portfolio valuation and dividend/distribution policies in an attempt to enable it to do so. As with any money market portfolio, there is no assurance, however, that the Portfolio will be able to maintain a stable net asset value of $1.00 per share.
The Financial Accounting Standards Board ("FASB") Accounting Standards Codification ("ASC") is the exclusive reference of authoritative US generally accepted accounting principles ("US GAAP") recognized by the FASB to be applied by nongovernmental entities. Rules and interpretive releases of the SEC under authority of federal laws are also sources of authoritative US GAAP for SEC registrants. The Portfolios' financial statements are prepared in
312
PACE Select Advisors Trust
Notes to financial statements
accordance with US GAAP, which may require the use of management estimates and assumptions. Actual results could differ from those estimates. The following is a summary of significant accounting policies:
Valuation of investments
Each Portfolio calculates its net asset value on days that the New York Stock Exchange ("NYSE") is open. A Portfolio calculates net asset value separately for each class as of the close of regular trading on the NYSE (generally, 4:00 p.m., Eastern time). If trading on the NYSE is halted for the day before 4:00 p.m., Eastern time, a Portfolio's net asset value per share will be calculated as of the time trading was halted.
PACE Money Market Investments' net asset value per share is expected to be $1.00 per share, although this value is not guaranteed. PACE Money Market Investments values its securities at amortized cost. This method uses a constant amortization to maturity of the difference between the cost of the instrument to the fund and the amount due at maturity.
Each Portfolio (other than PACE Money Market Investments) calculates its net asset value based on the current market value, where available, for its portfolio securities. The Portfolios normally obtain market values for their investments from independent pricing sources and broker-dealers. Independent pricing sources may use reported last sale prices, official market closing prices, current market quotations or valuations from computerized evaluation systems that derive values based on comparable investments. An evaluation system incorporates parameters such as security quality, maturity and coupon, and/or research and evaluations by its staff, including review of broker-dealer market price quotations, if available, in determining the valuation of the portfolio investments. If a market value is not readily available from an independent pricing source for a particular investment, that investment is valued at fair value as determined in good faith by or under the direction of the board of trustees (the "board").
The amortized cost method of valuation, which approximates market value, generally is used to value short-term debt instruments with 60 days or less remaining to maturity, unless the board determines that this does not represent fair value. Investments in open-end investment companies are valued at the daily closing net asset value of the respective investment company. Pursuant to the Portfolios' use of the practical expedient within ASC Topic 820, investments in non-registered investment companies are also valued at the daily closing net asset value. All investments quoted in foreign currencies will be valued daily in US dollars on the basis of the foreign currency exchange rates prevailing at the time such valuation is determined by the Portfolios' custodian and accounting agent. Foreign currency exchange rates are generally determined as of the close of the NYSE.
Investments traded in the over-the-counter ("OTC") market and listed on The NASDAQ Stock Market, Inc. ("NASDAQ") normally are valued at the NASDAQ Official Closing Price. Other OTC securities are valued at the last bid price on the valuation date available prior to valuation. Investments which are listed on US and foreign stock exchanges are normally valued at the market closing price, the last sale price on the day the securities are valued or, lacking any sales on such day, at the last available bid price.
The board has delegated to the UBS Global Asset Management (Americas) Inc. Global Valuation Committee ("GVC") the responsibility for making fair value determinations with respect to the Portfolios' holdings. The GVC is comprised of representatives of management. The GVC provides reports to the board at each quarterly meeting regarding any investments that have been fair valued, valued pursuant to standing instructions approved by the GVC, or where non-vendor pricing sources had been used to make fair value determinations when sufficient information exists during the prior quarter. Fair valuation determinations are subject to review at least monthly by the GVC during scheduled meetings. Pricing decisions, processes, and controls over fair value determinations are subject to internal and external reviews, including annual internal compliance reviews and periodic internal audit reviews of securities valuations.
313
PACE Select Advisors Trust
Notes to financial statements
The types of investments for which such fair value pricing may be necessary include, but are not limited to: foreign investments under some circumstances, as discussed below; securities of an issuer that has entered into a restructuring; investments whose trading has been halted or suspended; fixed income securities that are in default and for which there is no current market value quotation; and investments that are restricted as to transfer or resale. Various factors may be reviewed in order to make a good faith determination of an investment's fair value. These factors include, but are not limited to, fundamental analytical data relating to the investment; the nature and duration of restrictions on disposition of the investments; and the evaluation of forces which influence the market in which the investments are purchased and sold. Valuing investments at fair value involves greater reliance on judgment than valuing investments that have readily available market quotations. Fair value determinations can also involve reliance on quantitative models employed by an independent third party.
Each Portfolio expects to price most of its portfolio holdings based on current market value, as discussed previously. Investments for which market quotations are not readily available may be valued based upon appraisals received from a pricing service using a computerized evaluation system or formula method that takes into consideration market indices, matrices, yield curves and other specific adjustments. Investments also may be valued based on appraisals derived from information concerning the investment or similar investments received from recognized dealers in those holdings. If a Portfolio concludes that a market quotation is not readily available for a portfolio investment for any number of reasons, including the occurrence of a "significant event" (e.g., natural disaster or governmental action), after the close of trading in its principal domestic or foreign market but before the close of regular trading on the NYSE, the Portfolio will use fair value methods to reflect those events. This policy is intended to assure that each Portfolio's net asset value fairly reflects the value of its portfolio holdings as of the time of pricing. PACE International Equity Investments, PACE International Emerging Markets Equity Investments, PACE Global Real Estate Securities Investments and PACE Alternative Strategies Investments may use a systematic fair valuation model provided by an independent third party to value investments principally traded in foreign markets in order to adjust for possible stale pricing that may occur between the close of the foreign exchanges and the time for valuation. If an investment is valued at a "fair value," that value is likely to be different from the last quoted market price for the investment. The use of the fair valuation model may result in investments being transferred between Level 1 and Level 2 of the fair value hierarchy at reporting period ends. In cases where investments are traded on more than one exchange, the investments are valued on the exchange designated as the primary market by UBS Global Asset Management (Americas) Inc. ("UBS Global AM"), the investment manager of the Portfolios.
Futures contracts are generally valued at the settlement price established each day on the exchange on which they are traded. Forward foreign currency contracts are valued daily using forward exchange rates quoted by independent pricing services. Swaps and other OTC derivatives are marked to market daily based upon values from third party vendors or quotations from market makers to the extent available. In the event that market quotations are not readily available or deemed unreliable, the swap is valued at fair value as determined in good faith by or under the direction of the board.
US GAAP requires disclosure regarding the various inputs that are used in determining the value of each Portfolio's investments. These inputs are summarized into the three broad levels listed below:
Level 1—Unadjusted quoted prices in active markets for identical investments.
Level 2—Other significant observable inputs, including but not limited to, quoted prices for similar investments, interest rates, prepayment speeds and credit risks.
Level 3—Unobservable inputs inclusive of each Portfolio's own assumptions in determining the fair value of investments.
314
PACE Select Advisors Trust
Notes to financial statements
In accordance with the requirements of US GAAP, a fair value hierarchy has been included near the end of each Portfolio's Portfolio of investments.
In June 2014, the Financial Accounting Standards Board ("FASB") issued Accounting Standards Update ("ASU") No. 2014-11, Transfers & Servicing (Topic 860): "Repurchase-to-Maturity Transactions, Repurchase Financings, and Disclosures" ("ASU 2014-11") to improve the financial reporting of reverse repurchase agreements and other similar transactions. ASU 2014-11 includes expanded disclosure requirements for entities that enter into reverse repurchase agreements and similar transactions accounted for as secured borrowings. ASU 2014-11 is effective for annual reporting periods beginning after December 15, 2014 and interim periods within those fiscal periods. Management is currently evaluating the implications of these changes and their impact on the financial statements and disclosures.
In May 2015, the FASB issued Accounting Standards Update No. 2015-07, Fair Value Measurement (Topic 820): "Disclosures for Investments in Certain Entities That Calculate Net Asset Value per Share (or Its Equivalent)" ("ASU 2015-07"). The modification removes the requirement to categorize within the fair value hierarchy all investments for which fair value is measured using the NAV per share practical expedient. ASU 2015-07 is effective for annual reporting periods beginning after December 15, 2015 and interim periods within those fiscal periods. Management is currently evaluating the implications of these changes and their impact on the financial statements and disclosures.
The provisions of ASC Topic 815 "Derivatives and Hedging" ("ASC Topic 815") require qualitative disclosures about objectives and strategies for using derivatives, quantitative disclosures about fair value amounts of gains and losses on derivative instruments and disclosures about credit-risk related contingent features in derivative agreements. Since investment companies value their derivatives at fair value and recognize changes in fair value through the Statement of operations, they do not qualify for hedge accounting under ASC Topic 815. Accordingly, even though a Portfolio's investments in derivatives may represent economic hedges, they are considered to be non-hedge transactions for purposes of disclosure under ASC Topic 815. ASC Topic 815 requires (1) objectives for using derivative instruments be disclosed in terms of underlying risk and accounting designation, (2) the fair values of derivative instruments and their gains and losses be disclosed in a tabular format, and (3) information be disclosed about credit-risk contingent features of derivatives contracts. Details of this disclosure can be found below as well as in the Portfolio of investments. Swap agreements, forward foreign currency contracts, swaptions and options written entered into by the Portfolios may contain credit-risk related contingent features that could be triggered subject to certain circumstances. Such circumstances include agreed upon net asset value thresholds. If triggered, the derivative counterparty could request additional cash margin and/or terminate the derivative contract. The aggregate fair value of the derivative contracts that are in a net liability position that contain these triggers can be found in the applicable Portfolio of investments. The aggregate fair value of assets that are already posted as collateral as of July 31, 2015 is reflected in the Statement of assets and liabilities. If the applicable credit-risk related contingent features were triggered as of July 31, 2015, a Portfolio would be required to post additional collateral or may be required to terminate the contract and settle any amounts outstanding. The Portfolios are not aware of any additional credit-risk contingent features on other derivative contracts held by the Portfolios (other than those described earlier). The volume of derivatives that is presented in the Portfolio of investments of each Portfolio is consistent with the derivative activity during the year ended July 31, 2015.
315
PACE Select Advisors Trust
Notes to financial statements
At July 31, 2015, the Portfolios had the following derivatives categorized by underlying risk:
Asset derivatives1
| | | Interest
rate risk | | Foreign
exchange
risk | | Credit risk | | Equity risk | | Total | |
PACE Mortgage-Backed Securities Fixed Income Investments | |
Options and swaptions purchased | | $ | 593 | | | $ | — | | | $ | — | | | $ | — | | | $ | 593 | | |
Swap agreements | | | 54,915 | | | | — | | | | — | | | | — | | | | 54,915 | | |
Total value | | $ | 55,508 | | | $ | — | | | $ | — | | | $ | — | | | $ | 55,508 | | |
PACE Intermediate Fixed Income Investments | |
Futures contracts | | $ | 407,096 | | | $ | — | | | $ | — | | | $ | — | | | $ | 407,096 | | |
Options and swaptions purchased | | | 42,974 | | | | 14,083 | | | | — | | | | — | | | | 57,057 | | |
Forward foreign currency contracts | | | — | | | | 98,868 | | | | — | | | | — | | | | 98,868 | | |
Swap agreements | | | 90,085 | | | | — | | | | — | | | | — | | | | 90,085 | | |
Total value | | $ | 540,155 | | | $ | 112,951 | | | $ | — | | | $ | — | | | $ | 653,106 | | |
PACE Strategic Fixed Income Investments | |
Futures contracts | | $ | 1,570,108 | | | $ | — | | | $ | — | | | $ | — | | | $ | 1,570,108 | | |
Swaptions purchased | | | 512,040 | | | | — | | | | — | | | | — | | | | 512,040 | | |
Forward foreign currency contracts | | | — | | | | 2,860,832 | | | | — | | | | — | | | | 2,860,832 | | |
Swap agreements | | | 908,066 | | | | — | | | | 801,018 | | | | — | | | | 1,709,084 | | |
Total value | | $ | 2,990,214 | | | $ | 2,860,832 | | | $ | 801,018 | | | $ | — | | | $ | 6,652,064 | | |
PACE International Fixed Income Investments | |
Futures contracts | | $ | 846,701 | | | $ | — | | | $ | — | | | $ | — | | | $ | 846,701 | | |
Forward foreign currency contracts | | | — | | | | 3,059,276 | | | | — | | | | — | | | | 3,059,276 | | |
Total value | | $ | 846,701 | | | $ | 3,059,276 | | | $ | — | | | $ | — | | | $ | 3,905,977 | | |
PACE High Yield Investments | |
Forward foreign currency contracts | | $ | — | | | $ | 796,533 | | | $ | — | | | $ | — | | | $ | 796,533 | | |
Total value | | $ | — | | | $ | 796,533 | | | $ | — | | | $ | — | | | $ | 796,533 | | |
PACE Alternative Strategies Investments | |
Futures contracts | | $ | 658,247 | | | $ | — | | | $ | — | | | $ | 3,863,178 | | | $ | 4,521,425 | | |
Options and swaptions purchased | | | 870,104 | | | | 5,837 | | | | — | | | | 684,537 | | | | 1,560,478 | | |
Forward foreign currency contracts | | | — | | | | 22,379,307 | | | | — | | | | — | | | | 22,379,307 | | |
Swap agreements | | | 2,902,752 | | | | — | | | | 1,074,443 | | | | 1,534,385 | | | | 5,511,580 | | |
Total value | | $ | 4,431,103 | | | $ | 22,385,144 | | | $ | 1,074,443 | | | $ | 6,082,100 | | | $ | 33,972,790 | | |
316
PACE Select Advisors Trust
Notes to financial statements
Liability derivatives2
| | | Interest
rate risk | | Foreign
exchange
risk | | Credit risk | | Equity risk | | Total | |
PACE Mortgage-Backed Securities Fixed Income Investments | |
Swap agreements | | $ | (221,524 | ) | | $ | — | | | $ | — | | | $ | — | | | $ | (221,524 | ) | |
Options and swaptions written | | | (1,649,132 | ) | | | — | | | | — | | | | — | | | | (1,649,132 | ) | |
Total value | | $ | (1,870,656 | ) | | $ | — | | | $ | — | | | $ | — | | | $ | (1,870,656 | ) | |
PACE Intermediate Fixed Income Investments | |
Futures contracts | | $ | (319,164 | ) | | $ | — | | | $ | — | | | $ | — | | | $ | (319,164 | ) | |
Forward foreign currency contracts | | | — | | | | (41,452 | ) | | | — | | | | — | | | | (41,452 | ) | |
Swap agreements | | | (14,048 | ) | | | — | | | | (250 | ) | | | — | | | | (14,298 | ) | |
Options and swaptions written | | | (586,759 | ) | | | (12,836 | ) | | | — | | | | — | | | | (599,595 | ) | |
Total value | | $ | (919,971 | ) | | $ | (54,288 | ) | | $ | (250 | ) | | $ | — | | | $ | (974,509 | ) | |
PACE Strategic Fixed Income Investments | |
Futures contracts | | $ | (2,169,037 | ) | | $ | — | | | $ | — | | | $ | — | | | $ | (2,169,037 | ) | |
Options and swaptions written | | | (477,821 | ) | | | (83,128 | ) | | | — | | | | — | | | | (560,949 | ) | |
Forward foreign currency contracts | | | — | | | | (1,639,760 | ) | | | — | | | | — | | | | (1,639,760 | ) | |
Swap agreements | | | (1,149,523 | ) | | | — | | | | (818,996 | ) | | | — | | | | (1,968,519 | ) | |
Total value | | $ | (3,796,381 | ) | | $ | (1,722,888 | ) | | $ | (818,996 | ) | | $ | — | | | $ | (6,338,265 | ) | |
PACE International Fixed Income Investments | |
Futures contracts | | $ | (1,253,370 | ) | | $ | — | | | $ | — | | | $ | — | | | $ | (1,253,370 | ) | |
Forward foreign currency contracts | | | — | | | | (2,979,558 | ) | | | — | | | | — | | | | (2,979,558 | ) | |
Total value | | $ | (1,253,370 | ) | | $ | (2,979,558 | ) | | $ | — | | | $ | — | | | $ | (4,232,928 | ) | |
PACE High Yield Investments | |
Forward foreign currency contracts | | $ | — | | | $ | (182,560 | ) | | $ | — | | | $ | — | | | $ | (182,560 | ) | |
Total value | | $ | — | | | $ | (182,560 | ) | | $ | — | | | $ | — | | | $ | (182,560 | ) | |
PACE Alternative Strategies Investments | |
Futures contracts | | $ | (657,666 | ) | | $ | — | | | $ | — | | | $ | (1,315,018 | ) | | $ | (1,972,684 | ) | |
Written options and foreign
exchange options | | | (38,250 | ) | | | (406,283 | ) | | | — | | | | (267,796 | ) | | | (712,329 | ) | |
Forward foreign currency contracts | | | — | | | | (16,701,747 | ) | | | — | | | | — | | | | (16,701,747 | ) | |
Swap agreements | | | (4,045,928 | ) | | | — | | | | (490,227 | ) | | | (1,253,039 | ) | | | (5,789,194 | ) | |
Total value | | $ | (4,741,844 | ) | | $ | (17,108,030 | ) | | $ | (490,227 | ) | | $ | (2,835,853 | ) | | $ | (25,175,954 | ) | |
1 In the Statement of assets and liabilities, options and swaptions purchased are shown within Investments in unaffiliated securities, at value, swap agreements (except centrally cleared swaps) are shown within swap agreements at value while forward foreign currency contracts are shown within unrealized appreciation on forward foreign currency contracts. Futures contracts are reported in the table above using cumulative appreciation of futures contracts and centrally cleared swaps are reported at value as detailed in the futures contracts and centrally cleared swaps tables at the end of the Portfolio of investments, respectively, but only the variation margin to be received, if any, is reported within the Statement of assets and liabilities.
2 In the Statement of assets and liabilities, options and swaptions written are shown within options and swaptions written, at value and swap agreements (except centrally cleared swaps) are shown within swap agreements at value while forward foreign currency contracts are shown within unrealized depreciation on forward foreign currency contracts. Futures contracts are reported in the table above using cumulative depreciation of futures contracts and centrally cleared swaps are reported at value as detailed in the futures contracts and centrally cleared swaps tables at the end of the Portfolio of investments, respectively, but only the variation margin to be paid, if any, is reported within the Statement of assets and liabilities.
317
PACE Select Advisors Trust
Notes to financial statements
Net realized and change in unrealized gains (losses) from derivatives instruments during the year ended July 31,2015, were as follows:
| | | Interest
rate risk | | Foreign
exchange
risk | | Credit risk | | Equity risk | | Total | |
PACE Mortgage-Backed Securities Fixed Income Investments | |
Net realized gain (loss)3 | |
Futures contracts | | $ | (19,173 | ) | | $ | — | | | $ | — | | | $ | — | | | $ | (19,173 | ) | |
Options and swaptions purchased4 | | | (568,275 | ) | | | — | | | | — | | | | — | | | | (568,275 | ) | |
Swap agreements | | | (958,073 | ) | | | — | | | | — | | | | — | | | | (958,073 | ) | |
Options and swaptions written | | | 1,244,707 | | | | — | | | | — | | | | — | | | | 1,244,707 | | |
Total net realized gain (loss) | | $ | (300,814 | ) | | $ | — | | | $ | — | | | $ | — | | | $ | (300,814 | ) | |
Net change in unrealized appreciation/depreciation5 | |
Options and swaptions purchased4 | | $ | (180,485 | ) | | $ | — | | | $ | — | | | $ | — | | | $ | (180,485 | ) | |
Swap agreements | | | (165,312 | ) | | | — | | | | — | | | | — | | | | (165,312 | ) | |
Options and swaptions written | | | 387,659 | | | | — | | | | — | | | | — | | | | 387,659 | | |
Total net change in unrealized
appreciation/depreciation | | $ | 41,862 | | | $ | — | | | $ | — | | | $ | — | | | $ | 41,862 | | |
PACE Intermediate Fixed Income Investments | |
Net realized gain (loss)3 | |
Futures contracts | | $ | 310,505 | | | $ | — | | | $ | — | | | $ | — | | | $ | 310,505 | | |
Options and swaptions purchased4 | | | 183,839 | | | | — | | | | — | | | | — | | | | 183,839 | | |
Forward foreign currency contracts | | | — | | | | 529,749 | | | | — | | | | — | | | | 529,749 | | |
Swap agreements | | | (370,911 | ) | | | — | | | | 169,365 | | | | — | | | | (201,546 | ) | |
Options and swaptions written | | | 203,356 | | | | — | | | | — | | | | — | | | | 203,356 | | |
Total net realized gain (loss) | | $ | 326,789 | | | $ | 529,749 | | | $ | 169,365 | | | $ | — | | | $ | 1,025,903 | | |
Net change in unrealized appreciation/depreciation5 | |
Futures contracts | | $ | 276,792 | | | $ | — | | | $ | — | | | $ | — | | | $ | 276,792 | | |
Options and swaptions purchased4 | | | (99,554 | ) | | | (2,535 | ) | | | — | | | | — | | | | (102,089 | ) | |
Forward foreign currency contracts | | | — | | | | 8,477 | | | | — | | | | — | | | | 8,477 | | |
Swap agreements | | | 13,079 | | | | — | | | | 143 | | | | — | | | | 13,222 | | |
Options and swaptions written | | | (31,461 | ) | | | 11,061 | | | | — | | | | — | | | | (20,400 | ) | |
Total net change in unrealized
appreciation/depreciation | | $ | 158,856 | | | $ | 17,003 | | | $ | 143 | | | $ | — | | | $ | 176,002 | | |
318
PACE Select Advisors Trust
Notes to financial statements
| | | Interest
rate risk | | Foreign
exchange
risk | | Credit risk | | Equity risk | | Total | |
PACE Strategic Fixed Income Investments | |
Net realized gain (loss)3 | |
Futures contracts | | $ | (6,041,243 | ) | | $ | — | | | $ | — | | | $ | — | | | $ | (6,041,243 | ) | |
Options and swaptions purchased4 | | | — | | | | 3,608 | | | | — | | | | — | | | | 3,608 | | |
Forward foreign currency contracts | | | — | | | | 21,562,285 | | | | — | | | | — | | | | 21,562,285 | | |
Swap agreements | | | 7,116,998 | | | | — | | | | 1,325,556 | | | | — | | | | 8,442,554 | | |
Options and swaptions written | | | 1,458,903 | | | | (913,616 | ) | | | — | | | | — | | | | 545,287 | | |
Total net realized gain (loss) | | $ | 2,534,658 | | | $ | 20,652,277 | | | $ | 1,325,556 | | | $ | — | | | $ | 24,512,491 | | |
Net change in unrealized appreciation/depreciation5 | |
Futures contracts | | $ | 1,042,920 | | | $ | — | | | $ | — | | | $ | — | | | $ | 1,042,920 | | |
Options and swaptions purchased4 | | | (223,260 | ) | | | — | | | | — | | | | — | | | | (223,260 | ) | |
Forward foreign currency contracts | | | — | | | | 1,033,438 | | | | — | | | | — | | | | 1,033,438 | | |
Swap agreements | | | (6,259,788 | ) | | | — | | | | (1,338,938 | ) | | | — | | | | (7,598,726 | ) | |
Options and swaptions written | | | 53,011 | | | | 64,325 | | | | — | | | | — | | | | 117,336 | | |
Total net change in unrealized
appreciation/depreciation | | $ | (5,387,117 | ) | | $ | 1,097,763 | | | $ | (1,338,938 | ) | | $ | — | | | $ | (5,628,292 | ) | |
PACE International Fixed Income Investments | |
Net realized gain (loss)3 | |
Futures contracts | | $ | 1,683,637 | | | $ | — | | | $ | — | | | $ | — | | | $ | 1,683,637 | | |
Forward foreign currency contracts | | | — | | | | 17,798,465 | | | | — | | | | — | | | | 17,798,465 | | |
Total net realized gain (loss) | | $ | 1,683,637 | | | $ | 17,798,465 | | | $ | — | | | $ | — | | | $ | 19,482,102 | | |
Net change in unrealized appreciation/depreciation5 | |
Futures contracts | | $ | (2,363,561 | ) | | $ | — | | | $ | — | | | $ | — | | | $ | (2,363,561 | ) | |
Forward foreign currency contracts | | | — | | | | (1,762,307 | ) | | | — | | | | — | | | | (1,762,307 | ) | |
Total net change in unrealized
appreciation/depreciation | | $ | (2,363,561 | ) | | $ | (1,762,307 | ) | | $ | — | | | $ | — | | | $ | (4,125,868 | ) | |
PACE High Yield Investments | |
Net realized gain (loss)3 | |
Futures contracts | | $ | (1,202,691 | ) | | $ | — | | | $ | — | | | $ | — | | | $ | (1,202,691 | ) | |
Forward foreign currency contracts | | | — | | | | 9,799,408 | | | | — | | | | — | | | | 9,799,408 | | |
Total net realized gain (loss) | | $ | (1,202,691 | ) | | $ | 9,799,408 | | | $ | — | | | $ | — | | | $ | 8,596,717 | | |
Net change in unrealized appreciation/depreciation5 | |
Futures contracts | | $ | (245,048 | ) | | $ | | | | $ | | | | $ | | | | $ | (245,048 | ) | |
Forward foreign currency contracts | | | — | | | | (557,435 | ) | | | — | | | | — | | | | (557,435 | ) | |
Total net change in unrealized
appreciation/depreciation | | $ | (245,048 | ) | | $ | (557,435 | ) | | $ | — | | | $ | — | | | $ | (802,483 | ) | |
PACE International Equity Investments | |
Net realized gain (loss)3 | |
Forward foreign currency contracts | | $ | — | | | $ | 707,563 | | | $ | — | | | $ | — | | | $ | 707,563 | | |
Total net realized gain (loss) | | $ | — | | | $ | 707,563 | | | $ | — | | | $ | — | | | $ | 707,563 | | |
Net change in unrealized appreciation/depreciation5 | |
Forward foreign currency contracts | | $ | — | | | $ | (78,260 | ) | | $ | — | | | $ | — | | | $ | (78,260 | ) | |
Total net change in unrealized
appreciation/depreciation | | $ | — | | | $ | (78,260 | ) | | $ | — | | | $ | — | | | $ | (78,260 | ) | |
319
PACE Select Advisors Trust
Notes to financial statements
| | | Interest
rate risk | | Foreign
exchange
risk | | Credit risk | | Equity risk | | Total | |
PACE Alternative Strategies Investments | |
Net realized gain (loss)3 | |
Futures contracts | | $ | 509,028 | | | $ | 193,669 | | | $ | — | | | $ | 6,593,901 | | | $ | 7,296,598 | | |
Options and swaptions purchased4 | | | 3,050,474 | | | | 390,118 | | | | — | | | | (2,896,911 | ) | | | 543,681 | | |
Forward foreign currency contracts | | | — | | | | 35,552,044 | | | | — | | | | — | | | | 35,552,044 | | |
Swap agreements | | | (534,553 | ) | | | — | | | | 1,358,647 | | | | (308,610 | ) | | | 515,484 | | |
Options and swaptions written | | | (2,911,656 | ) | | | (2,017,448 | ) | | | — | | | | (5,042,532 | ) | | | (9,971,636 | ) | |
Total net realized gain (loss) | | $ | 113,293 | | | $ | 34,118,383 | | | $ | 1,358,647 | | | $ | (1,654,152 | ) | | $ | 33,936,171 | | |
Net change in unrealized appreciation/depreciation5 | |
Futures contracts | | $ | 2,389,582 | | | $ | — | | | $ | — | | | $ | 1,992,603 | | | $ | 4,382,185 | | |
Options and swaptions purchased4 | | | (229,326 | ) | | | (1,355,525 | ) | | | — | | | | (1,591,245 | ) | | | (3,176,096 | ) | |
Forward foreign currency contracts | | | — | | | | 3,802,339 | | | | — | | | | — | | | | 3,802,339 | | |
Swap agreements | | | (4,000,746 | ) | | | — | | | | (756,486 | ) | | | 842,525 | | | | (3,914,707 | ) | |
Options and swaptions written | | | (32,373 | ) | | | (357,437 | ) | | | — | | | | 1,593,644 | | | | 1,203,834 | | |
Total net change in unrealized
appreciation/depreciation | | $ | (1,872,863 | ) | | $ | 2,089,377 | | | $ | (756,486 | ) | | $ | 2,837,527 | | | $ | 2,297,555 | | |
3 The net realized gains (losses) are shown in the Statement of operations in net realized gains (losses) from futures, options and swaptions written, swap agreements and forward foreign currency contracts, unless otherwise noted.
4 Realized and unrealized gain (loss) is included in net realized gain (loss) from investments and net change in unrealized appreciation/depreciation on investments in the Statement of operations.
5 The net change in unrealized appreciation/depreciation is shown in the Statement of operations in net change in unrealized appreciation/depreciation on futures, options and swaptions written, swap agreements and forward foreign currency contracts, unless otherwise noted.
In January 2013, Accounting Standards Update 2013-01 ("ASU 2013-01"), "Clarifying the Scope of Disclosures about Offsetting Assets and Liabilities", replaced Accounting Standards Update 2011-11 ("ASU 2011-11"), "Disclosures about Offsetting Assets and Liabilities". ASU 2013-01 is effective for fiscal years beginning on or after January 1, 2013, and interim periods within those annual periods. ASU 2011-11 was intended to enhance disclosure requirements on the offsetting of financial assets and liabilities. ASU 2013-01 limits the scope of the new balance sheet offsetting disclosures to derivatives, repurchase and reverse repurchase agreements, and securities lending and borrowing transactions to the extent that they are (1) offset in the financial statements or (2) subject to an enforceable master netting arrangement or similar agreement.
The Portfolios typically enter into International Swaps and Derivatives Association, Inc. Master Agreements ("ISDA Master Agreements") or similar master agreements (collectively, "Master Agreements") with its OTC derivative contract counterparties in order to, among other things, reduce its credit risk to counterparties. ISDA Master Agreements include provisions for general obligations, representations, collateral and events of default or termination. Under an ISDA Master Agreement, the Portfolios typically may offset with the counterparty certain derivative financial instrument's payables and/or receivables with collateral held and/or posted and create one single net payment (close-out netting) in the event of default or termination.
320
PACE Select Advisors Trust
Notes to financial statements
At July 31, 2015, derivative assets and liabilities (by type) on a gross basis were as follows:
PACE Mortgage-Backed Securities Fixed Income Investments
Derivative Financial Instruments: | | Assets ($) | | Liabilities ($) | |
Options and swaptions purchased | | | 593 | | | | — | | |
Options and swaptions written | | | — | | | | (1,649,132 | ) | |
Swap agreements1 | | | 54,915 | | | | (221,524 | ) | |
Total gross amount of derivative assets and liabilities in the Statement of Assets and Liabilities | | | 55,508 | | | | (1,870,656 | ) | |
Derivatives not subject to a master netting agreement or similar agreements ("MNA") | | | (54,915 | ) | | | 188,377 | | |
Total gross amount of assets and liabilities subject to MNA or similar agreements | | | 593 | | | | (1,682,279 | ) | |
1 Includes cumulative appreciation/depreciation of centrally cleared swaps as reported in the centrally cleared swaps tables in the Portfolio of investments but only the unpaid variation margin is reported within the Statement of assets and liabilities within variation margin on centrally cleared swap agreements.
The following tables present the Portfolio's derivative assets and liabilities by counterparty net of amounts available for offset under a MNA and net of the related collateral received/pledged by the Portfolio as of July 31, 2015.
PACE Mortgage-Backed Securities Fixed Income Investments
| Counterparty | | Gross Amount of
Assets ($) | | Financial
Instruments
and
Derivatives
Available for
Offset ($) | | Collateral
Received ($)* | | Net Amount
of
Assets ($) | |
GSB | | | 446 | | | | (446 | ) | | | — | | | | 0 | | |
MSCI | | | 147 | | | | — | | | | (147 | ) | | | 0 | | |
Total | | | 593 | | | | (446 | ) | | | (147 | ) | | | 0 | | |
| Counterparty | | Gross Amount of
Liabilities ($) | | Financial
Instruments
and
Derivatives
Available for
Offset ($) | | Collateral
Pledged ($)* | | Net Amount
of
Liabilities ($) | |
CSI | | | (86,079 | ) | | | — | | | | 86,079 | | | | 0 | | |
GSI | | | (17,264 | ) | | | 446 | | | | — | | | | (16,818 | ) | |
JPMCB | | | (1,578,936 | ) | | | — | | | | 1,578,936 | | | | 0 | | |
Total | | | (1,682,279 | ) | | | 446 | | | | 1,665,015 | | | | (16,818 | ) | |
* In some instances, the actual collateral received and/or pledged may be more than the amount shown and may be comprised of cash collateral, non-cash collateral or combination of both.
321
PACE Select Advisors Trust
Notes to financial statements
PACE Intermediate Fixed Income Investments
Derivative Financial Instruments: | | Assets ($) | | Liabilities ($) | |
Forward foreign currency contracts | | | 98,868 | | | | (41,452 | ) | |
Futures contracts1 | | | 407,096 | | | | (319,164 | ) | |
Options and swaptions purchased | | | 57,057 | | | | — | | |
Options and swaptions written | | | — | | | | (599,595 | ) | |
Swap agreements1 | | | 90,085 | | | | (14,298 | ) | |
Total gross amount of derivative assets and liabilities in the Statement of Assets and Liabilities | | | 653,106 | | | | (974,509 | ) | |
Derivatives not subject to a master netting agreement or similar agreement ("MNA") | | | (499,269 | ) | | | 335,299 | | |
Total gross amount of assets and liabilities subject to MNA or similar agreements | | | 153,837 | | | | (639,210 | ) | |
1 Includes cumulative appreciation/depreciation of futures contracts and centrally cleared swaps as reported in the futures contracts and centrally cleared swaps tables in the Portfolio of investments but only the unpaid variation margin is reported within the Statement of assets and liabilities within variation margin on futures contracts and centrally cleared swap agreements, respectively.
The following tables present the Portfolio's derivative assets and liabilities by counterparty net of amounts available for offset under a MNA and net of the related collateral received/pledged by the Portfolio as of July 31, 2015.
PACE Intermediate Fixed Income Investments
| Counterparty | | Gross Amount of
Assets ($) | | Financial
Instruments
and
Derivatives
Available for
Offset ($) | | Collateral
Received ($)* | | Net Amount
of
Assets ($) | |
BB | | | 46,972 | | | | — | | | | — | | | | 46,972 | | |
BNP | | | 1,909 | | | | (1,909 | ) | | | — | | | | — | | |
BOA | | | 12,186 | | | | (301 | ) | | | — | | | | 11,885 | | |
CSI | | | 92,770 | | | | (92,770 | ) | | | — | | | | — | | |
Total | | | 153,837 | | | | (94,980 | ) | | | — | | | | 58,857 | | |
| Counterparty | | Gross Amount of
Liabilities ($) | | Financial
Instruments
and
Derivatives
Available for
Offset ($) | | Collateral
Pledged ($)* | | Net Amount
of
Liabilities ($) | |
BNP | | | (12,535 | ) | | | 1,909 | | | | — | | | | (10,626 | ) | |
BOA | | | (301 | ) | | | 301 | | | | — | | | | — | | |
CSI | | | (595,339 | ) | | | 92,770 | | | | 502,569 | | | | — | | |
DB | | | (16,809 | ) | | | — | | | | — | | | | (16,809 | ) | |
JPMCB | | | (14,226 | ) | | | — | | | | 14,226 | | | | — | | |
Total | | | (639,210 | ) | | | 94,980 | | | | 516,795 | | | | (27,435 | ) | |
* In some instances, the actual collateral received and/or pledged may be more than the amount shown and may be comprised of cash collateral, non-cash collateral or combination of both.
322
PACE Select Advisors Trust
Notes to financial statements
PACE Strategic Fixed Income Investments
Derivative Financial Instruments: | | Assets ($) | | Liabilities ($) | |
Forward foreign currency contracts | | | 2,860,832 | | | | (1,639,760 | ) | |
Futures contracts1 | | | 1,570,108 | | | | (2,169,037 | ) | |
Options and swaptions purchased | | | 512,040 | | | | — | | |
Options and swaptions written | | | — | | | | (560,949 | ) | |
Swap agreements1 | | | 1,709,084 | | | | (1,968,519 | ) | |
Total gross amount of derivative assets and liabilities in the Statement of Assets and Liabilities | | | 6,652,064 | | | | (6,338,265 | ) | |
Derivatives not subject to a master netting agreement or similar agreement ("MNA") | | | (3,163,043 | ) | | | 3,338,951 | | |
Total gross amount of assets and liabilities subject to MNA or similar agreements | | | 3,489,021 | | | | (2,999,314 | ) | |
1 Includes cumulative appreciation/depreciation of futures contracts and centrally cleared swaps as reported in the futures contracts and centrally cleared swaps tables in the Portfolio of investments but only the unpaid variation margin is reported within the Statement of assets and liabilities within variation margin on futures contracts and centrally cleared swap agreements, respectively.
The following tables present the Portfolio's derivative assets and liabilities by counterparty net of amounts available for offset under a MNA and net of the related collateral received/pledged by the Portfolio as of July 31, 2015.
PACE Strategic Fixed Income Investments
| Counterparty | | Gross Amount of
Assets ($) | | Financial
Instruments
and
Derivatives
Available for
Offset ($) | | Collateral
Received ($)* | | Net Amount
of
Assets ($) | |
BNP | | | 68,751 | | | | (68,751 | ) | | | — | | | | — | | |
BOA | | | 216,192 | | | | (216,192 | ) | | | — | | | | — | | |
CITI | | | 467,754 | | | | (467,754 | ) | | | — | | | | — | | |
CSI | | | 21,342 | | | | — | | | | — | | | | 21,342 | | |
DB | | | 155,743 | | | | (102,600 | ) | | | (53,143 | ) | | | — | | |
GSCM | | | 692,756 | | | | (86,221 | ) | | | — | | | | 606,535 | | |
HSBC | | | 71,642 | | | | (20,999 | ) | | | — | | | | 50,643 | | |
JPMCB | | | 865,266 | | | | (773,365 | ) | | | — | | | | 91,901 | | |
MSCI | | | 368,333 | | | | (368,333 | ) | | | — | | | | — | | |
RBC | | | 524,861 | | | | (99,170 | ) | | | — | | | | 425,691 | | |
SG | | | 18,737 | | | | (11,482 | ) | | | — | | | | 7,255 | | |
SSC | | | 17,644 | | | | (17,644 | ) | | | — | | | | — | | |
Total | | | 3,489,021 | | | | (2,232,511 | ) | | | (53,143 | ) | | | 1,203,367 | | |
323
PACE Select Advisors Trust
Notes to financial statements
| Counterparty | | Gross Amount of
Liabilities ($) | | Financial
Instruments
and
Derivatives
Available for
Offset ($) | | Collateral
Pledged ($)* | | Net Amount
of
Liabilities ($) | |
BB | | | (29,511 | ) | | | — | | | | — | | | | (29,511 | ) | |
BOA | | | (323,955 | ) | | | 216,192 | | | | — | | | | (107,763 | ) | |
BNP | | | (214,697 | ) | | | 68,751 | | | | 145,946 | | | | — | | |
CITI | | | (570,761 | ) | | | 467,754 | | | | — | | | | (103,007 | ) | |
DB | | | (102,600 | ) | | | 102,600 | | | | — | | | | — | | |
GSCM | | | (86,221 | ) | | | 86,221 | | | | — | | | | — | | |
GSI | | | (263,551 | ) | | | — | | | | 263,551 | | | | — | | |
HSBC | | | (20,999 | ) | | | 20,999 | | | | — | | | | — | | |
JPMCB | | | (773,365 | ) | | | 773,365 | | | | — | | | | — | | |
MSCI | | | (484,032 | ) | | | 368,333 | | | | 115,699 | | | | — | | |
RBC | | | (99,170 | ) | | | 99,170 | | | | — | | | | — | | |
SG | | | (11,482 | ) | | | 11,482 | | | | — | | | | — | | |
SSC | | | (18,409 | ) | | | 17,644 | | | | — | | | | (765 | ) | |
WBC | | | (561 | ) | | | — | | | | — | | | | (561 | ) | |
Total | | | (2,999,314 | ) | | | 2,232,511 | | | | 525,196 | | | | (241,607 | ) | |
* In some instances, the actual collateral received and/or pledged may be more than the amount shown and may be comprised of cash collateral, non-cash collateral or combination of both.
PACE International Fixed Income Investments
Derivative Financial Instruments: | | Assets ($) | | Liabilities ($) | |
Forward foreign currency contracts | | | 3,059,276 | | | | (2,979,558 | ) | |
Futures contracts1 | | | 846,701 | | | | (1,253,370 | ) | |
Total gross amount of derivative assets and liabilities in the Statement of Assets and Liabilities | | | 3,905,977 | | | | (4,232,928 | ) | |
Derivatives not subject to a master netting agreement or similar agreement ("MNA") | | | (3,905,977 | ) | | | 4,232,928 | | |
Total gross amount of assets and liabilities subject to MNA or similar agreements | | | — | | | | — | | |
PACE High Yield Investments
Derivative Financial Instruments: | | Assets ($) | | Liabilities ($) | |
Forward foreign currency contracts | | | 796,533 | | | | (182,560 | ) | |
Total gross amount of derivative assets and liabilities in the Statement of Assets and Liabilities | | | 796,533 | | | | (182,560 | ) | |
Derivatives not subject to a master netting agreement or similar agreement ("MNA") | | | (796,533 | ) | | | 182,560 | | |
Total gross amount of assets and liabilities subject to MNA or similar agreements | | | — | | | | — | | |
PACE Alternative Strategies Investments
Derivative Financial Instruments: | | Assets ($) | | Liabilities ($) | |
Forward foreign currency contracts | | | 22,379,307 | | | | (16,701,747 | ) | |
Futures contracts1 | | | 4,521,425 | | | | (1,972,684 | ) | |
Options and swaptions purchased | | | 1,560,478 | | | | — | | |
Options and swaptions written | | | — | | | | (712,329 | ) | |
Swap agreements1 | | | 5,511,580 | | | | (5,789,194 | ) | |
Total gross amount of derivative assets and liabilities in the Statement of Assets and Liabilities | | | 33,972,790 | | | | (25,175,954 | ) | |
Derivatives not subject to a master netting agreement or similar agreement ("MNA") | | | (8,693,070 | ) | | | 6,311,937 | | |
Total gross amount of assets and liabilities subject to MNA or similar agreements | | | 25,279,720 | | | | (18,864,017 | ) | |
1 Includes cumulative appreciation/depreciation of futures contracts and centrally cleared swaps as reported in the futures contracts and centrally cleared swaps tables in the Portfolio of investments but only the unpaid variation margin is reported within the Statement of assets and liabilities within variation margin on futures contracts and centrally cleared swap agreements, respectively.
324
PACE Select Advisors Trust
Notes to financial statements
The following tables present the Portfolio's derivative assets and liabilities by counterparty net of amounts available for offset under a MNA and net of the related collateral received/pledged by the Portfolio as of July 31, 2015.
PACE Alternative Strategies Investments
Counterparty | | Gross Amount of
Assets ($) | | Financial
Instruments
and
Derivatives
Available for
Offset ($) | | Collateral
Received ($)* | | Net Amount
of
Assets ($) | |
BB | | | 6,752,160 | | | | (4,655,729 | ) | | | — | | | | 2,096,431 | | |
BOA | | | 340,106 | | | | (32,329 | ) | | | (59,900 | ) | | | 247,877 | | |
BNP | | | 2,313,436 | | | | (2,273,959 | ) | | | — | | | | 39,477 | | |
CITI | | | 6,935,377 | | | | (3,889,070 | ) | | | — | | | | 3,046,307 | | |
CSI | | | 3,629,564 | | | | (3,494,117 | ) | | | — | | | | 135,447 | | |
DB | | | 899,734 | | | | (899,734 | ) | | | — | | | | — | | |
MSCI | | | 2,843,587 | | | | (2,843,587 | ) | | | — | | | | — | | |
RBS | | | 1,565,756 | | | | (533,933 | ) | | | — | | | | 1,031,823 | | |
Total | | | 25,279,720 | | | | (18,622,458 | ) | | | (59,900 | ) | | | 6,597,362 | | |
| Counterparty | | Gross Amount of
Liabilities ($) | | Financial
Instruments
and
Derivatives
Available for
Offset ($) | | Collateral
Pledged ($)* | | Net Amount
of
Liabilities ($) | |
BB | | | (4,655,729 | ) | | | 4,655,729 | | | | — | | | | — | | |
BOA | | | (32,329 | ) | | | 32,329 | | | | — | | | | — | | |
BNP | | | (2,273,959 | ) | | | 2,273,959 | | | | — | | | | — | | |
CITI | | | (3,889,070 | ) | | | 3,889,070 | | | | — | | | | — | | |
CSI | | | (3,494,117 | ) | | | 3,494,117 | | | | — | | | | — | | |
DB | | | (899,757 | ) | | | 899,734 | | | | — | | | | (23 | ) | |
MSCI | | | (3,085,123 | ) | | | 2,843,587 | | | | 241,536 | | | | — | | |
RBS | | | (533,933 | ) | | | 533,933 | | | | — | | | | — | | |
Total | | | (18,864,017 | ) | | | 18,622,458 | | | | 241,536 | | | | (23 | ) | |
* In some instances, the actual collateral received and/or pledged may be more than the amount shown and may be comprised of cash collateral, non-cash collateral or combination of both.
Repurchase agreements—The Portfolios may purchase securities or other obligations from a bank or securities dealer (or its affiliate), subject to the seller's agreement to repurchase them at an agreed upon date (or upon demand) and price. The Portfolios maintain custody of the underlying obligations prior to their repurchase, either through its regular custodian or through a special "tri-party" custodian or sub-custodian that maintains a separate account for both the Portfolios and their counterparty. The underlying collateral is valued daily in an effort to ensure that the value, including accrued interest, is at least equal to the repurchase price. In the event of default of the obligation to repurchase, the Portfolios generally have the right to liquidate the collateral and apply the proceeds in satisfaction of the obligation. Repurchase agreements involving obligations other than US government securities (such as commercial paper, corporate bonds, equities and mortgage loans) may be subject to special risks and may not have the benefit of certain protections in the event of counterparty insolvency. Moreover, repurchase agreements secured by obligations that are not eligible for direct investment under Rule 2a-7 under the Investment Company Act or a Portfolio's investment strategies and limitations, may require the Portfolio to promptly dispose of such collateral if the seller or guarantor becomes insolvent. If the seller (or seller's guarantor, if any) becomes insolvent, the Portfolios may suffer delays, costs and possible losses in connection with the disposition or retention
325
PACE Select Advisors Trust
Notes to financial statements
of the collateral. Under certain circumstances, in the event of default or bankruptcy by the other party to the agreement, realization and/or retention of the collateral may be subject to legal proceedings. Each Portfolio (with the exception of PACE Municipal Fixed Income Investments) may participate in joint repurchase agreement transactions with other funds managed, advised or sub-advised by UBS Global AM.
Under certain circumstances, the Portfolios may engage in a repurchase agreement transaction with a yield of zero in order to invest cash amounts remaining in its portfolio at the end of the day in order to avoid having the Portfolios potentially assessed to a fee for uninvested cash held in a business account at a bank.
Restricted securities—The Portfolios may invest in securities that are subject to legal or contractual restrictions on resale. These securities generally may be resold in transactions exempt from registration or to the public if the securities are registered. Disposal of these securities may involve time-consuming negotiations and expense, and prompt sale at an acceptable price may be difficult. Information regarding restricted securities, if any, is included at the end of each Portfolio's Portfolio of investments.
Investment transactions, investment income and expenses—Investment transactions are recorded on the trade date. Realized gains and losses from investment transactions and foreign exchange transactions are calculated using the identified cost method. Dividend income is recorded net of withholding taxes on the ex-dividend date ("ex-date") (except in the case of certain dividends from foreign securities which are recorded as soon after the ex-date as the respective Portfolio, using reasonable diligence, becomes aware of such dividends). Interest income is recorded on an accrual basis. Discounts are accreted and premiums are amortized as adjustments to interest income and the identified cost of investments.
Income, expenses (excluding class-specific expenses) and realized/unrealized gains/losses are allocated proportionately to each class of shares based upon the relative net asset value of outstanding shares (or the value of dividend-eligible shares, as appropriate) of each class at the beginning of the day (after adjusting for current capital share activity of the respective classes). Class-specific expenses are charged directly to the applicable class of shares.
Foreign currency translation—The books and records of the Portfolios are maintained in US dollars. Foreign currency amounts are translated into US dollars as follows: (1) the foreign currency market value of investment securities and other assets and liabilities stated in foreign currencies are translated into US dollars based on the current exchange rates each business day; and (2) purchases, sales, income and expenses are translated at the rate of exchange prevailing on the respective dates of such transactions. The resulting exchange gains and losses are included in the Statement of operations.
The Portfolios do not generally isolate the effects of fluctuations in foreign exchange rates from the effects of fluctuations in the market prices of securities. However, the Portfolios do isolate the effects of fluctuations in foreign exchange rates when determining the realized gain or loss upon the sale or maturity of foreign currency-denominated debt obligations pursuant to US federal income tax regulations. Net realized foreign currency transaction gain (loss) is treated as ordinary income (loss) for income tax reporting purposes.
Forward foreign currency contracts—Certain Portfolios may enter into forward foreign currency contracts ("forward contracts") as part of their investment strategies, in connection with planned purchases or sales of securities or to hedge the US dollar value of portfolio securities denominated in a particular currency. The Portfolios may also engage in cross-hedging by using forward contracts in one currency to hedge fluctuations in the value of securities denominated in a different currency if the applicable investment sub-advisor anticipates that there is a correlation between the two currencies. Forward contracts may also be used to shift a Portfolio's exposure to foreign currency fluctuations from one country to another.
326
PACE Select Advisors Trust
Notes to financial statements
The Portfolios have no specific limitation on the percentage of assets which may be committed to such contracts; however, the value of all forward contracts will not exceed the value of a Portfolio's total assets. The Portfolios may enter into forward contracts or maintain a net exposure to forward contracts only if (1) the consummation of the contracts would not obligate the Portfolios to deliver an amount of foreign currency in excess of the value of the positions being hedged by such contracts or (2) the Portfolios maintain cash or liquid securities in a segregated account in an amount determined pursuant to the Portfolios' segregation policies as disclosed in the Trust's Statement of Additional Information.
Risks may arise upon entering into forward contracts from the potential inability of counterparties to meet the terms of their contracts and from unanticipated movements in the value of foreign currencies relative to the US dollar or each other.
Fluctuations in the value of open forward contracts are recorded for book purposes as unrealized gains or losses on forward foreign currency contracts by the Portfolios. Realized gains and losses on forward foreign currency contracts include net gains or losses recognized by the Portfolios on contracts which have matured.
Securities traded on to-be-announced basis—The Portfolios may from time to time purchase securities on a to-be-announced ("TBA") basis. In a TBA transaction, the Portfolio commits to purchasing or selling securities for which all specific information is not yet known at the time of the trade, particularly the face amount and maturity date of the underlying security transactions. Securities purchased on a TBA basis are not settled until they are delivered to the Portfolio, normally 15 to 45 days later. Beginning on the date the Portfolio enters into a TBA transaction, cash, US government securities or other liquid securities are segregated in an amount equal in value to the purchase price of the TBA security. These transactions are subject to market fluctuations, and their current value is determined in the same manner as for other securities.
Option writing—Certain Portfolios may write (sell) put and call options on securities or derivative instruments in order to gain exposure to or protect against changes in the markets. When a Portfolio writes a call or a put option, an amount equal to the premium received by the Portfolio is included on the Portfolio's Statement of assets and liabilities as an asset and as an equivalent liability. The amount of the liability is subsequently marked-to-market to reflect the current market value of the option written. If an option which the Portfolio has written either expires on its stipulated expiration date or the Portfolio enters into a closing purchase transaction, the Portfolio realizes a gain (or loss if the cost of a closing purchase transaction exceeds the premium received when the option was written) without regard to any unrealized gain or loss on the underlying security or derivative instrument, and the liability related to such option is extinguished. If a call option which the Portfolio has written is exercised, the Portfolio recognizes a realized gain or loss (long-term or short-term, depending on the holding period of the underlying security) from the sale of the underlying security or derivative instrument and the proceeds from the sale are increased by the premium originally received. If a put option which the Portfolio has written is exercised, the amount of the premium originally received reduces the cost of the security or derivative instrument which the Portfolio purchases upon exercise of the option.
In writing an option, the Portfolios bear the market risk of an unfavorable change in the price of the derivative instrument, security or currency underlying the written option. Exercise of an option written by a Portfolio could result in the Portfolio selling or buying a derivative instrument, security or currency at a price different from current market value.
In the normal course of trading activities, the Portfolios trade and hold certain fair valued derivative contracts that constitute guarantees. Such contracts include written put options, where the Portfolios would be obligated to purchase securities at specified prices (i.e. the options are exercised by the counterparties). The maximum payout for these contracts is limited to the number of put option contracts written and the related strike prices,
327
PACE Select Advisors Trust
Notes to financial statements
respectively. At July 31, 2015, PACE Mortgage-Backed Securities Fixed Income Investments, PACE Intermediate Fixed Income Investments, PACE Strategic Fixed Income Investments and PACE Alternative Strategies Investments had maximum payout amounts of approximately $18,329,700, $3,419,228, $6,864,442 and $136,489,231, respectively, relating to written put option contracts. Maximum payout amounts could be offset by the subsequent sale, if any, of assets obtained via the execution of a payout event.
Purchased options—Certain Portfolios may also purchase put and call options. Purchasing call options tends to increase exposure to the underlying instrument. Purchasing put options tends to decrease exposure to the underlying instrument. The Portfolio pays a premium which is included on the Statement of assets and liabilities as an investment and subsequently marked to market to reflect the current value of the option. Premiums paid for purchasing options which expire are treated as realized losses. The risk associated with purchasing put and call options is limited to the premium paid. Premiums paid for purchasing options which are exercised or closed are added to the amounts paid or offset against the proceeds on the underlying future, security or currency transaction to determine the realized gain or loss. Purchased options are shown as portfolio holdings within the Portfolio of investments and are included in the Statement of assets and liabilities in investments in unaffiliated securities, at value.
Futures contracts—Certain Portfolios may purchase or sell futures contracts to increase or reduce their exposure to an asset class without purchasing or selling the underlying securities. They may do this to enhance or realize gains, as a hedge and/or to manage the average duration of the Portfolio. Using futures contracts involves various market risks, including interest rate and equity risk as well as the risks that there may be an illiquid market or that a change in the value of the contract may not correlate with changes in the value of the underlying securities.
Upon entering into a futures contract, a Portfolio is required to deliver to a broker an amount of cash and/or government securities equal to a certain percentage of the contract amount. This amount is known as the "initial margin". Subsequent payments, known as "variation margin", generally are made or received by the Portfolio each day depending on the fluctuations in the value of the underlying futures contracts, except that in the case of certain futures contracts that are held through swap contracts, payments may be made or received at settlement. Such variation margin is recorded for financial statement purposes on a daily basis as an unrealized gain or loss on futures until the futures contract is closed or expires, at which time the net gain or loss is reclassified to realized gain or loss on futures.
Loan assignments and participations—Certain Portfolios may invest in secured or unsecured fixed or floating rate loans ("Loans") arranged through private negotiations between a borrowing corporation, government or other entity and one or more financial institutions ("Lenders") which may be in the form of participations ("Participations") in Loans or assignments ("Assignments") of all or a portion of Loans from third parties. A Portfolio may invest in multiple series or tranches of a Loan, which may have varying terms and carry different associated risks. Participations typically result in a Portfolio having a contractual relationship only with the Lender, not with the borrower. A Portfolio has the right to receive payments of principal, interest and any fees to which it is entitled only from the Lender selling the Participation and only upon receipt by the Lender of the payments from the borrower. In connection with purchasing Participations, a Portfolio generally has no direct right to enforce compliance by the borrower with the terms of the loan agreement relating to the Loan, or any rights of set-off against the borrower, and a Portfolio may not directly benefit from any collateral supporting the Loan in which it has purchased the Participation. As a result, a Portfolio assumes the credit risk of both the borrower and the Lender that is selling the Participation. In the event of the insolvency of the selling Lender, the Portfolio may be treated as a general creditor of that Lender and may not benefit from any set-off between the Lender and the borrower. A Portfolio will acquire Participations only if its sub-advisor determines that the selling Lender is creditworthy. When a Portfolio purchases Assignments from Lenders, it acquires direct rights against the borrower on the Loan. In an Assignment, the Portfolio is entitled to receive payments directly from the borrower and, therefore, does not
328
PACE Select Advisors Trust
Notes to financial statements
depend on the selling bank to pass these payments onto the Portfolio. However, because Assignments are arranged through private negotiations between potential assignees and assignors, the rights and obligations acquired by a Portfolio as the purchaser of an Assignment may differ from, and be more limited than, those held by the assigning Lender.
Short sales "Against the Box"—Each Portfolio (other than PACE Money Market Investments and PACE Municipal Fixed Income Investments) may engage in short sales of securities it owns or has the right to acquire at no added cost through conversion or exchange of other securities it owns (short sales "against the box"). To make delivery to the purchaser in a short sale, the executing broker borrows the securities being sold short on behalf of a Portfolio, and that Portfolio is obligated to replace the securities borrowed at a date in the future. When a Portfolio sells short, it establishes a margin account with the broker effecting the short sale and deposits collateral with the broker. In addition, the Portfolio maintains, in a segregated account with its custodian, the securities that could be used to cover the short sale. Each Portfolio may incur transaction costs, including dividend and interest expense, in connection with opening, maintaining and closing short sales "against the box".
A Portfolio might make a short sale "against the box" to hedge against market risks when its sub-advisor believes that the price of a security may decline, thereby causing a decline in the value of a security owned by the Portfolio or a security convertible into or exchangeable for a security owned by the Portfolio. In such case, any loss in the Portfolio's long position after the short sale should be reduced by a corresponding gain in the short position. Conversely, any gain in the long position after the short sale should be reduced by a corresponding loss in the short position. The extent to which gains or losses in the long position are reduced will depend upon the amount of the securities sold short relative to the amount of the securities a Portfolio owns, either directly or indirectly, and in the case where the Portfolio owns convertible securities, changes in the investment values or conversion premiums of such securities.
Uncovered short sales—PACE Mortgage-Backed Securities Fixed Income Investments (with respect to securities issued by the US Treasury and TBA securities coupon trades), PACE International Equity Investments, PACE Large Co Value Equity Investments, PACE Global Real Estate Securities Investments and PACE Alternative Strategies Investments may engage in short sale transactions in which the Portfolio sells a security it does not own (or does not have the right to acquire at no added cost). The Portfolio must borrow the security to make delivery to the buyer. In a short sale where a Portfolio is not holding a position in the same security (or convertible into the same security), the Portfolio will maintain an account containing cash or liquid assets at such a level that the amount deposited in the account plus that amount deposited with the broker as collateral will, at minimum, equal the current value of the investment sold short. The initial amount of a short sale is recorded as a liability which is marked to market daily. Fluctuations in the value of this liability are recorded as unrealized gains or losses on the Statement of operations. A Portfolio incurs transaction costs, including interest expense, in connection with opening, maintaining and closing short sales. Because PACE Large Co Value Equity Investments, PACE International Equity Investments, PACE Global Real Estate Securities Investments and PACE Alternative Strategies Investments are multi-managed and have the ability to engage in short sales, one investment advisor may take a short position and another advisor may take a long position in the same security. A Portfolio will be required to pay the buyer for any dividends or other corporate actions and interest payable on securities while those securities are in a short position. These dividends and interest are booked as an expense or liability to the Portfolio on an accrual basis. A Portfolio will incur a loss as a result of the short sale if the price of the security increases between the date of the short sale and the date on which the Portfolio replaces the borrowed security, and a Portfolio will realize a gain if the security declines in price between those same dates. Because a Portfolio's loss on a short sale arises from increases in the value of the investment sold short, such loss, like the potential increase in price of the security sold short, is theoretically unlimited. In addition, a Portfolio's investments held long could decline in value at the same time the value of the investment sold short increases, thereby increasing the Portfolio's potential for loss. PACE Global Real Estate Securities Investments did not engage in uncovered short sales during the year ended July 31, 2015.
329
PACE Select Advisors Trust
Notes to financial statements
Treasury roll transactions—Certain Portfolios may enter into treasury roll transactions. In a treasury roll transaction, a Portfolio sells a Treasury security to a counterparty with a simultaneous agreement to repurchase the same security at an agreed upon price and date. The Portfolio receives cash from the sale of the Treasury security to use for other investment purposes. For US GAAP purposes, a treasury roll transaction is accounted for as a secured borrowing and not as a purchase and sale. The difference between the sale price and repurchase price represents net interest income or net interest expense reflective of an agreed upon rate between the Portfolio and the counterparty over the term of the borrowing. The Portfolio will benefit from the transaction if the income earned on the investment purchased with the cash received in the treasury roll transaction exceeds the interest expense incurred by the Portfolio. If the interest expense exceeds the income earned, the Portfolio's net investment income and dividends to shareholders may be adversely impacted. Treasury roll transactions involve the risk that the market value of the securities that the Portfolio is required to repurchase may decline below the agreed upon repurchase price of those securities. During the year ended July 31, 2015, only PACE Mortgage-Backed Securities Fixed Income Investments and PACE Strategic Fixed Income Investments utilized treasury roll transactions.
Reverse repurchase agreements—Certain Portfolios may enter into reverse repurchase agreements with qualified third party banks, securities dealers or their affiliates. Interest on the value of reverse repurchase agreements issued and outstanding is based upon competitive market rates at the time of issuance. At the time a Portfolio enters into a reverse repurchase agreement, the Portfolio establishes and maintains a segregated account with the Portfolio's custodian containing liquid securities having a value not less than the repurchase price, including accrued interest, of the reverse repurchase agreement.
There were no reverse repurchase agreements outstanding at the year ended July 31, 2015.
Swap agreements—Certain Portfolios may enter into interest rate swap agreements. This type of swap is an agreement that obligates two parties to exchange a series of cash flows at specified intervals based upon or calculated by reference to a specified interest rate(s) for a specified amount. The payment flows are usually netted against each other, with the difference being paid by one party to the other.
Risks may arise as a result of the failure of the counterparty to the swap agreement to comply with the terms of the agreement. The loss incurred by the failure of a counterparty is generally limited to the net interest payment to be received by the Portfolio. Therefore, the Portfolio considers the creditworthiness of the counterparty to a swap agreement in evaluating potential credit risk.
The Portfolios accrue for interim payments on swap agreements on a daily basis, with the net amount recorded within swap agreements on the Statement of assets and liabilities. Once interim payments are settled in cash, the net amount is recorded as realized gain/loss on swaps, in addition to realized gain/loss recorded upon the termination of swap contracts on the Statement of operations. Fluctuations in the value of swap agreements are recorded for financial statement purposes as unrealized appreciation or depreciation of swaps within the Statement of operations.
Inflation swap agreements are used to hedge inflation risk by transferring inflation risk from one party to another through an exchange of cash flows. In an inflation swap, one party pays a fixed rate on a notional principal amount while the other party pays a floating rate linked to an inflation index on that same notional amount. The party paying the floating rate pays the inflation adjusted rate multiplied by the notional principal amount. If the average inflation rate over the term of the swap is the same as the fixed rate of the swap, the two legs will have the same value and the swap will break even.
Credit default swap agreements involve commitments to make or receive payments in the event of a default of a security or a credit event. As a buyer, the Portfolio would make periodic payments to the counterparty, and the
330
PACE Select Advisors Trust
Notes to financial statements
Portfolio would receive payments only upon the occurrence of a credit event. If no credit event occurs, the Portfolio will lose its periodic stream of payments over the term of the contract. However, if a credit event does occur, the Portfolio typically would receive full notional value for a reference obligation that may have little or no value. As a seller, the Portfolio would receive periodic payments from the counterparty, and the Portfolio would make payments only upon the occurrence of a credit event. If no default or credit event occurs, the Portfolio will gain the periodic stream of payments it received over the term of the contract and the counterparty will lose its periodic stream of payments over the term of the contract. However, if a default or credit event occurs, the Portfolio typically pays full notional value for a reference obligation that may have little or no value. Credit default swaps may involve greater risks than if the Portfolio had invested in the reference obligation directly and are subject to general market risk, liquidity risk and credit risk.
Credit default swap agreements on credit indices involve one party making a stream of payments to another party in exchange for the right to receive a specified return in the event of a write-down, principal shortfall, interest shortfall or default of all or part of the referenced entities comprising the credit index. A credit index is a list of a basket of credit instruments or exposures designed to be representative of some part of the credit market as a whole. These indices are made up of referenced credits that are judged by a poll of dealers to be the most liquid entities in the credit default swap market based on the sector of the index. Components of the indices may include, but are not limited to, investment grade securities, high yield securities, asset backed securities, emerging markets, and/or various credit ratings within each sector. Credit indices are traded using credit default swaps with standardized terms including a fixed spread and standard maturity dates. An index credit default swap references all the names in the index, and if there is a default, the credit event is settled based on that name's weight in the index. The composition of the indices changes periodically, usually every six months, and for most indices, each name has an equal weight in the index. A Portfolio may use credit default swaps on credit indices to hedge a portfolio of credit default swaps or bonds with a credit default swap on indices which is less expensive than it would be to buy many credit default swaps to achieve a similar effect. Credit default swaps on indices are benchmarks for protecting investors owning bonds against default, and traders use them to speculate on changes in credit quality.
Credit default swap agreements on corporate issues or sovereign issues of an emerging country involve one party making a stream of payments to another party in exchange for the right to receive a specified return in the event of a default or other credit event. If a credit event occurs and cash settlement is not elected, a variety of other deliverable obligations may be delivered in lieu of the specific referenced obligation. The ability to deliver other obligations may result in a cheapest-to-deliver option (the buyer of protection's right to choose the deliverable obligation with the lowest value following a credit event). The Portfolio may use credit default swaps on corporate issues or sovereign issues of an emerging country to provide a measure of protection against defaults of the issuers (i.e., to reduce risk where the Portfolio owns or has exposure to the referenced obligation) or to take an active long or short position with respect to the likelihood of a particular issuer's default.
The maximum potential amount of future payments (undiscounted) that a Portfolio as a seller of protection could be required to make under a credit default swap agreement would be an amount equal to the notional amount of the agreement which may exceed the amount of the value reflected on the Statement of assets and liabilities. Notional amounts of all credit default swap agreements outstanding as of July 31, 2015 for which a Portfolio is the seller of protection are disclosed under the sections "Credit default swaps on credit indices—sell protection" and "Credit default swaps on corporate and sovereign issues—sell protection" in the Portfolios of investments. These potential amounts would be partially offset by any recovery values of the respective referenced obligations, upfront payments received upon entering into the agreement, or net amounts received from the settlement of buy protection credit default swap agreements entered into, if any, by a Portfolio for the same referenced entity or entities.
331
PACE Select Advisors Trust
Notes to financial statements
Total return swap contracts involve commitments to pay interest in exchange for a market-linked return both based on notional amounts. To the extent the total return of the security or index underlying the transactions exceeds or falls short of the offsetting interest rate obligation, the Portfolio will receive a payment from or make a payment to the counterparty.
Variance swap agreements involve two parties agreeing to exchange cash flows based on the measured variance (or square of volatility) of a specified underlying asset. One party agrees to exchange a "fixed rate" or strike price payment for the "floating rate" or realized price variance on the underlying asset with respect to the notional amount. At inception, the strike price is generally chosen such that the fair value of the swap is zero. At the maturity date, a net cash flow is exchanged, where the payoff amount is equivalent to the difference between the realized price variance of the underlying asset and the strike price multiplied by the notional amount. As a receiver of the realized price variance, the Portfolio would receive the payoff amount when the realized price variance of the underlying asset is greater than the strike price and would owe the payoff amount when the variance is less than the strike price. As a payer of the realized price variance the Portfolio would owe the payoff amount when the realized price variance of the underlying asset is greater than the strike price and would receive the payoff amount when the variance is less than the strike price.
Certain clearinghouses currently offer clearing for limited types of derivatives transactions, such as interest and credit derivatives. In a cleared derivative transaction, a Portfolio typically enters into the transaction with a financial institution counterparty, and performance of the transaction is effectively guaranteed by a central clearinghouse, thereby reducing or eliminating the Portfolio's exposure to the credit risk of its original counterparty. The Portfolio will be required to post specified levels of margin with the clearinghouse or at the instruction of the clearinghouse; the margin required by a clearinghouse may be greater than the margin the Portfolio would be required to post in an uncleared transaction. Only a limited number of transactions are currently eligible for clearing. Centrally cleared swaps, if any, are reported on the Statement of assets and liabilities based on variation margin received or paid, if any.
The use of swaps involves investment techniques and risks different from those associated with ordinary portfolio security transactions. If a Portfolio's sub-adviser is incorrect in its forecast of market values, interest rates and other applicable factors, the investment performance of the Portfolios will be less favorable than it would have been if this investment technique was never used. Swaps do not involve the delivery of securities and are subject to counterparty risk. If the other party to a swap defaults and fails to consummate the transaction, a Portfolio's risk of loss will consist of the net amount of interest or other payments that the Portfolio is contractually entitled to receive. Therefore, the Portfolio would consider the creditworthiness of the counterparty to a swap agreement in evaluating potential credit risk.
Dividends and distributions—Dividends and distributions to shareholders are recorded on the ex-dividend date. The amounts of dividends and distributions are determined in accordance with federal income tax regulations, which may differ from US GAAP. These "book/tax" differences are either considered temporary or permanent in nature. To the extent these differences are permanent in nature, such amounts are reclassified within the capital accounts based on their federal tax-basis treatment; temporary differences do not require reclassification.
Concentration of risk—Investing in securities of foreign issuers and currency transactions may involve certain considerations and risks not typically associated with investments in the United States. These risks include revaluation of currencies, adverse fluctuations in foreign currency values and possible adverse political, social and economic developments, including those particular to a specific industry, country or region, which could cause the securities and their markets to be less liquid and prices more volatile than those of comparable US companies and US government securities. These risks are greater with respect to securities of issuers located in emerging market countries in which PACE International Fixed Income Investments, PACE High Yield Investments, PACE International
332
PACE Select Advisors Trust
Notes to financial statements
Equity Investments, PACE International Emerging Markets Equity Investments, PACE Global Real Estate Securities Investments and PACE Alternative Strategies Investments are authorized to invest.
Small capitalization ("small cap") companies may be more vulnerable than larger capitalization companies to adverse business or economic developments. Small cap companies may also have limited product lines, markets or financial resources, and may be dependent on a relatively small management group. Securities of such companies may be less liquid and more volatile than securities of larger capitalization companies or the market averages in general and therefore may involve greater risk than investing in larger capitalization companies. In addition, small cap companies may not be well-known to the investing public, may not have institutional ownership and may have only cyclical, static or moderate growth prospects. These risks are greater with respect to the securities in which PACE Small/Medium Co Value Equity Investments and PACE Small/Medium Co Growth Equity Investments tend to invest.
Investments in bonds with ratings of BB (Standard & Poor's Ratings Group) or Ba (Moody's Investors Service, Inc.) or below (commonly referred to as "high yield" bonds), or deemed of equivalent quality, have an increased risk of defaulting or otherwise being unable to honor a financial obligation. These securities are considered to be predominantly speculative with respect to an issuer's capacity to pay interest and repay principal in accordance with the terms of the obligations. Lower-quality bonds are more likely to be subject to an issuer's default or downgrade than investment grade (higher-quality) bonds.
The ability of the issuers of debt securities held by the Portfolios to meet their obligations may be affected by economic and political developments particular to a specific industry, country, state or region.
Investment management and administration fees and other transactions with affiliates
The Trust has entered into an investment management and administration contract ("Management Contract") with UBS Global AM. In accordance with the Management Contract, each Portfolio paid UBS Global AM investment management and administration fees, which were accrued daily and paid monthly, in accordance with the following schedule as of July 31, 2015:
Portfolio | | Annual rate as a percentage of
each Portfolio's average daily net assets | |
PACE Money Market Investments | | 0.350% | |
PACE Mortgage-Backed Securities Fixed Income Investments | | 0.650% up to $250 million
0.600% above $250 million up to $500 million
0.575% above $500 million up to $750 million
0.550% above $750 million up to $1 billion
0.525% above $1 billion | |
PACE Intermediate Fixed Income Investments | | 0.550% up to $250 million
0.500% above $250 million up to $500 million
0.475% above $500 million up to $750 million
0.450% above $750 million up to $1 billion
0.425% above $1 billion | |
PACE Strategic Fixed Income Investments | | 0.650% up to $250 million
0.600% above $250 million up to $500 million
0.575% above $500 million up to $750 million
0.550% above $750 million up to $1 billion
0.525% above $1 billion up to $1.25 billion
0.500% above $1.25 billion | |
333
PACE Select Advisors Trust
Notes to financial statements
Portfolio | | Annual rate as a percentage of
each Portfolio's average daily net assets | |
PACE Municipal Fixed Income Investments | | 0.550% up to $250 million
0.500% above $250 million up to $500 million
0.475% above $500 million up to $750 million
0.450% above $750 million up to $1 billion
0.425% above $1 billion | |
PACE International Fixed Income Investments | | 0.750% up to $500 million
0.725% above $500 million up to $1 billion
0.700% above $1 billion | |
PACE High Yield Investments | | 0.800% up to $500 million
0.750% above $500 million up to $1 billion
0.725% above $1 billion up to $1.5 billion
0.700% above $1.5 billion up to $2 billion
0.675% above $2 billion | |
PACE Large Co Value Equity Investments | | 0.800% up to $250 million
0.770% above $250 million up to $500 million
0.730% above $500 million up to $1 billion
0.700% above $1 billion | |
PACE Large Co Growth Equity Investments | | 0.800% up to $500 million
0.775% above $500 million up to $1 billion
0.750% above $1 billion up to $1.5 billion
0.725% above $1.5 billion up to $2 billion
0.700% above $2 billion | |
PACE Small/Medium Co Value Equity Investments | | 0.800% up to $500 million
0.775% above $500 million | |
PACE Small/Medium Co Growth Equity Investments | | 0.800% up to $500 million
0.775% above $500 million | |
PACE International Equity Investments | | 0.900% up to $500 million
0.875% above $500 million up to $1 billion
0.850% above $1 billion up to $1.5 billion
0.825% above $1.5 billion up to $2 billion
0.800% above $2 billion | |
PACE International Emerging Markets Equity Investments | | 1.100% up to $500 million
1.075% above $500 million up to $1 billion
1.050% above $1 billion up to $1.5 billion
1.025% above $1.5 billion up to $2 billion
1.000% above $2 billion | |
PACE Global Real Estate Securities Investments | | 0.800% up to $500 million
0.750% above $500 million up to $1 billion
0.725% above $1 billion up to $1.5 billion
0.700% above $1.5 billion up to $2 billion
0.675% above $2 billion | |
PACE Alternative Strategies Investments | | 1.400% up to $500 million
1.350% above $500 million up to $1 billion
1.300% above $1 billion up to $1.5 billion
1.275% above $1.5 billion up to $2 billion
1.250% above $2 billion | |
334
PACE Select Advisors Trust
Notes to financial statements
Under separate Sub-Advisory Agreements, with the exception of PACE Money Market Investments, UBS Global AM (not the Portfolios) pays the following investment sub-advisors a fee from the investment management and administration fees which UBS Global AM receives, which is accrued daily and paid monthly:
Portfolio | | Investment sub-advisor | |
PACE Mortgage-Backed Securities Fixed Income Investments | | Pacific Investment Management Company LLC | |
PACE Intermediate Fixed Income Investments | | Babson Capital Management LLC
BlackRock Financial Management, Inc. | |
PACE Strategic Fixed Income Investments | | Pacific Investment Management Company LLC
Neuberger Berman Fixed Income LLC1 | |
PACE Municipal Fixed Income Investments | | Standish Mellon Asset Management Company LLC | |
PACE International Fixed Income Investments | | Rogge Global Partners plc | |
PACE High Yield Investments | | MacKay Shields LLC2
Nomura Corporate Research and Asset Management, Inc.2 | |
PACE Large Co Value Equity Investments | | Institutional Capital LLC3
Los Angeles Capital Management and Equity
Research, Inc.
River Road Asset Management, LLC3
Pzena Investment Management, LLC
Robeco Investment Management | |
PACE Large Co Growth Equity Investments | | Jackson Square Partners, LLC
J.P. Morgan Investment Management
Mar Vista Investment Partners, LLC (formerly known as
Roxbury Capital Management, LLC) | |
PACE Small/Medium Co Value Equity Investments | | Kayne Anderson Rudnick Investment Management, LLC
Metropolitan West Capital Management, LLC
Systematic Financial Management, L.P. | |
PACE Small/Medium Co Growth Equity Investments | | LMCG Investments, LLC (formerly known as
Lee Munder Capital Group, LLC)
Palisade Capital Management, LLC4
Riverbridge Partners, LLC
Timpani Capital Management LLC | |
PACE International Equity Investments | | Chautauqua Capital Management, LLC
Los Angeles Capital Management and Equity
Research, Inc.
Mondrian Investment Partners Ltd. | |
PACE International Emerging Markets Equity Investments | | LMCG Investments, LLC (formerly known as
Lee Munder Capital Group, LLC)
Mondrian Investment Partners Ltd.
William Blair & Company L.L.C | |
PACE Global Real Estate Securities Investments | | Brookfield Investment Management Inc.
CBRE Clarion Securities, LLC5 | |
PACE Alternative Strategies Investments.6 | | Analytic Investors, LLC
AQR Capital Management LLC
First Quadrant L.P.
Sirios Capital Management, L.P.7
Standard Life investments (Corporate Funds) Limited | |
1 As of the close of business, January 20, 2015, Neuberger Berman Fixed Income LLC became an investment sub-advisor of the Portfolio.
2 As of the close of business, June 30, 2015, MacKay Shields LLC was terminated as investment sub-advisor to the Portfolio and Nomura Corporate Research and Asset Management Inc. became investment sub-advisor to the Portfolio effective July 1, 2015.
3 As of the close of business, February 3, 2015, Institutional Capital LLC was terminated as an investment sub-advisor to the Portfolio and River Road Asset Management, LLC was appointed as an additional sub-advisor of the Portfolio effective on February 4, 2015.
335
PACE Select Advisors Trust
Notes to financial statements
4 As of the close of business, February 23, 2015, Palisade Capital Management, LLC was terminated as an investment sub-advisor to the Portfolio. Cash from the sale of securities previously managed by Palisade Capital Management, LLC was transferred to LMCG Investments, LLC (formerly known as Lee Munder Capital Group, LLC), Riverbridge Partners, LLC and Timpani Cazpital Management, LLC.
5 As of the close of business, May 31, 2015, CBRE Clarion Securities LLC was terminated as an investment sub-advisor to the Portfolio.
6 As of the close of business, March 31, 2014, UBS Global Asset Management (Americas) Inc. has the authority to allocate a portion of the Portfolio's assets to unaffiliated actively-and passively-managed pooled investment vehicles and index futures.
7 Effective May 20, 2015, Sirios Capital Management L.P. became an investment sub-advisor to the Portfolio.
At July 31, 2015, certain Portfolios owe or are owed by UBS Global AM for investment management and administration fees, net of fee waivers/expense reimbursements and/or recoupments as follows:
Portfolio | | Amounts due
to (owed by)
UBS Global AM | |
PACE Money Market Investments | | $ | (38,707 | ) | |
PACE Mortgage-Backed Securities Fixed Income Investments | | | 221,679 | | |
PACE Intermediate Fixed Income Investments | | | 110,397 | | |
PACE Strategic Fixed Income Investments | | | 450,884 | | |
PACE Municipal Fixed Income Investments | | | 174,418 | | |
PACE International Fixed Income Investments | | | 316,628 | | |
PACE High Yield Investments | | | 253,463 | | |
PACE Large Co Value Equity Investments | | | 870,886 | | |
PACE Large Co Growth Equity Investments | | | 924,355 | | |
PACE Small/Medium Co Value Equity Investments | | | 377,276 | | |
PACE Small/Medium Co Growth Equity Investments | | | 366,269 | | |
PACE International Equity Investments | | | 773,416 | | |
PACE International Emerging Markets Equity Investments | | | 380,692 | | |
PACE Global Real Estate Securities Investments | | | 58,214 | | |
PACE Alternative Strategies Investments | | | 875,437 | | |
UBS Global AM has entered into a written fee waiver agreement with each of PACE Mortgage-Backed Securities Fixed Income Investments and PACE International Fixed Income Investments, under which UBS Global AM is contractually obligated to waive its management fees to the extent necessary to reflect the lower sub-advisory fees paid by UBS Global AM to each of these Portfolio's sub-advisors: Pacific Investment Management Company LLC and Rogge Global Partners plc. For the year ended July 31, 2015, UBS Global AM was contractually obligated to waive $138,253 and $323,106 in investment management and administration fees for PACE Mortgage-Backed Securities Fixed Income Investments and PACE International Fixed Income Investments respectively. These management fee waivers will not be subject to future recoupment.
Additionally, PACE Alternative Strategies Investments and UBS Global AM have entered into a written fee waiver agreement pursuant to which UBS Global AM is contractually obligated to waive its management fees to the extent necessary to offset the cost savings to UBS Global AM for allocating a portion of the fund's assets to other unaffiliated pooled investment vehicles and index futures. The fee waiver agreement may be terminated by the Portfolio's board at any time and also will terminated automatically upon the expiration or termination of the Portfolio's advisory contract with UBS Global AM. For the year ended July 31, 2015, UBS Global AM was contractually obligated to waive $410,276 in investment management and administration fees. This management fee waiver will not be subject to future recoupment.
With respect to the following Portfolios, UBS Global AM may voluntarily waive its management fees to the extent necessary to reflect lower sub-advisory fees paid. This management fee waiver will not be subject to future
336
PACE Select Advisors Trust
Notes to financial statements
recoupment. Once started, there is no guarantee that UBS Global AM would continue to voluntarily waive a portion of its management fees. For the year ended July 31, 2015, UBS Global AM voluntarily waived fees of:
| | | Management fees
waived | |
PACE Strategic Fixed Income Investments | | $ | 187,501 | | |
PACE Municipal Fixed Income Investments | | | 85,549 | | |
PACE International Fixed Income Investments | | | 289,053 | | |
PACE High Yield Investments | | | 37,839 | | |
PACE Large Co Value Equity Investments | | | 126,640 | | |
PACE Large Co Growth Equity Investments | | | 51,423 | | |
PACE Small/Medium Co Growth Equity Investments | | | 183,285 | | |
PACE International Equity Investments | | | 321,447 | | |
PACE International Emerging Markets Equity Investments | | | 445,225 | | |
PACE Alternative Strategies Investments | | | 111,459 | | |
Additionally, with respect to PACE Money Market Investments, UBS Global AM may voluntarily waive fees and/or reimburse expenses from time to time in the event that the Portfolio's yield falls below a certain level. Once started, there is no guarantee that UBS Global AM would continue to voluntarily waive an additional portion of its fees and/or reimburse expenses. This management fee waiver will not be subject to future recoupment. For the year ended July 31, 2015, UBS Global AM voluntarily waived and/or reimbursed expenses of $666,737 for PACE Money Market Investments for that purpose.
UBS Global AM is contractually obligated to waive all or a portion of its investment management and administration fees and/or to reimburse the Portfolios for certain operating expenses in order to maintain the total annual ordinary operating expenses of each class (with certain exclusions such as dividend expense, borrowing costs and interest expense, if any) through November 30, 2015 at a level not to exceed the amounts in the table below.
Each Portfolio will repay UBS Global AM for any such waived fees/reimbursed expenses during a three-year period following July 31, 2012, to the extent that ordinary operating expenses (with certain exclusions such as dividend expense, borrowing costs and interest expense) are otherwise below the applicable expense cap in effect at the time the fees or expenses were waived/reimbursed. For the year ended July 31, 2015, UBS Global AM had the following contractual fee waivers/expense reimbursements, and recoupments. The fee waivers/expense reimbursements, portions of which are subject to repayment by the Portfolios through July 31, 2018, and recoupments for the year ended July 31, 2015, were as follows:
| Portfolio | | Class A
expense
cap | | Class C
expense
cap | | Class Y
expense
cap | | Class P
expense
cap | | Fee waivers/
expense
reimbursements | | Recoupments | |
PACE Money Market Investments | | | N/A | | | | N/A | | | | N/A | | | | 0.60 | % | | $ | 685,972 | | | $ | — | | |
PACE Mortgage-Backed Securities Fixed Income Investments | | | 0.97 | % | | | 1.47 | % | | | 0.72 | % | | | 0.72 | | | | 812,591 | | | | — | | |
PACE Intermediate Fixed Income Investments | | | 0.93 | | | | 1.43 | | | | 0.68 | | | | 0.68 | | | | 663,625 | | | | — | | |
PACE Strategic Fixed Income Investments | | | 1.06 | | | | 1.56 | | | | 0.81 | | | | 0.81 | | | | 2,427 | | | | — | | |
PACE Municipal Fixed Income Investments | | | 0.90 | | | | 1.40 | | | | 0.65 | | | | 0.65 | | | | 10,710 | | | | 2,788 | | |
PACE International Fixed Income Investments | | | 1.25 | | | | 1.75 | | | | 1.00 | | | | 1.00 | | | | — | | | | 127,756 | | |
PACE High Yield Investments | | | 1.28 | | | | 1.78 | | | | 1.03 | | | | 1.03 | | | | 216,433 | | | | — | | |
PACE Large Co Value Equity Investments | | | 1.27 | | | | 2.02 | | | | 1.02 | | | | 1.02 | | | | — | | | | — | | |
PACE Large Co Growth Equity Investments | | | 1.30 | | | | 2.05 | | | | 1.05 | | | | 1.05 | | | | — | | | | — | | |
PACE Small/Medium Co Value Equity Investments | | | 1.41 | | | | 2.16 | | | | 1.16 | | | | 1.16 | | | | — | | | | — | | |
PACE Small/Medium Co Growth Equity Investments | | | 1.38 | | | | 2.13 | | | | 1.13 | | | | 1.13 | | | | — | | | | 216,274 | | |
337
PACE Select Advisors Trust
Notes to financial statements
Portfolio | | Class A
expense
cap | | Class C
expense
cap | | Class Y
expense
cap | | Class P
expense
cap | | Fee waivers/
expense
reimbursements | | Recoupments | |
PACE International Equity Investments | | | 1.55 | % | | | 2.30 | % | | | 1.30 | % | | | 1.30 | % | | $ | — | | | $ | — | | |
PACE International Emerging Markets Equity Investments | | | 1.95 | | | | 2.70 | | | | 1.70 | | | | 1.70 | | | | — | | | | — | | |
PACE Global Real Estate Securities Investments | | | 1.45 | | | | 2.20 | | | | 1.20 | | | | 1.20 | | | | 537,214 | | | | — | | |
PACE Alternative Strategies Investments | | | 1.88 | | | | 2.63 | | | | 1.63 | | | | 1.63 | | | | — | | | | 626 | | |
At July 31, 2015, the following Portfolios had remaining fee waivers/expense reimbursements subject to repayment to UBS Global AM and respective dates of expiration as follows:
Portfolio | | Fee waivers/
expense
reimbursements
subject to
repayment | | Expires
July 31,
2016 | | Expires
July 31,
2017 | | Expires
July 31,
2018 | |
PACE Money Market Investments | | $ | 2,459,718 | | | $ | 918,256 | | | $ | 855,490 | | | $ | 685,972 | | |
PACE Mortgage-Backed Securities Fixed Income Investments—Class A | | | 118,126 | | | | 27,848 | | | | 49,829 | | | | 40,449 | | |
PACE Mortgage-Backed Securities Fixed Income Investments—Class C | | | 36,517 | | | | 9,140 | | | | 14,845 | | | | 12,532 | | |
PACE Mortgage-Backed Securities Fixed Income Investments—Class Y | | | 179,929 | | | | 54,177 | | | | 68,311 | | | | 57,441 | | |
PACE Mortgage-Backed Securities Fixed Income Investments—Class P | | | 1,819,918 | | | | 431,220 | | | | 686,529 | | | | 702,169 | | |
PACE Intermediate Fixed Income Investments—Class A | | | 72,662 | | | | 20,670 | | | | 27,819 | | | | 24,173 | | |
PACE Intermediate Fixed Income Investments—Class C | | | 6,313 | | | | 1,853 | | | | 2,283 | | | | 2,177 | | |
PACE Intermediate Fixed Income Investments—Class Y | | | 4,996 | | | | 1,707 | | | | 2,292 | | | | 997 | | |
PACE Intermediate Fixed Income Investments—Class P | | | 1,432,623 | | | | 230,478 | | | | 565,867 | | | | 636,278 | | |
PACE Strategic Fixed Income Investments—Class Y | | | 10,748 | | | | 5,086 | | | | 3,235 | | | | 2,427 | | |
PACE Municipal Fixed Income Investments—Class A | | | 17,934 | | | | 14,740 | | | | 3,194 | | | | — | | |
PACE Municipal Fixed Income Investments—Class C | | | 5,125 | | | | 3,528 | | | | 1,355 | | | | 242 | | |
PACE Municipal Fixed Income Investments—Class Y | | | 132 | | | | 69 | | | | 40 | | | | 23 | | |
PACE Municipal Fixed Income Investments—Class P | | | 162,969 | | | | 103,670 | | | | 48,854 | | | | 10,445 | | |
PACE International Fixed Income Investments—Class Y | | | 2,581 | | | | 1,946 | | | | 635 | | | | — | | |
PACE International Fixed Income Investments—Class P | | | 427,629 | | | | 230,791 | | | | 196,838 | | | | — | | |
PACE High Yield Investments—Class P | | | 644,992 | | | | 172,704 | | | | 255,855 | | | | 216,433 | | |
PACE Small/Medium Co Growth Equity Investments—Class Y | | | 441 | | | | 403 | | | | 38 | | | | — | | |
PACE Global Real Estate Securities Investments—Class A | | | 16,535 | | | | 5,638 | | | | 7,544 | | | | 3,353 | | |
PACE Global Real Estate Securities Investments—Class C | | | 528 | | | | 157 | | | | 229 | | | | 142 | | |
PACE Global Real Estate Securities Investments—Class Y | | | 1,226 | | | | 519 | | | | 497 | | | | 210 | | |
PACE Global Real Estate Securities Investments—Class P | | | 1,461,824 | | | | 381,126 | | | | 547,189 | | | | 533,509 | | |
Under normal conditions, the Portfolios invest cash collateral from securities lending activities into an affiliated private money market fund, UBS Private Money Market Fund LLC ("Private Money Market"), which operates in compliance with most of the substantive provisions of Rule 2a-7 of the 1940 Act. Private Money Market is managed by UBS Global AM and is currently offered as a cash management option to mutual funds and certain other accounts managed by the Portfolios' Investment Manager. UBS Global AM acts as managing member and receives a management fee from Private Money Market payable monthly in arrears at the annual rate of 0.10% of Private Money Market's average daily members' equity, minus the aggregate operating expenses of, and incurred by, Private Money Market during each such related month, not including investment expenses (including brokerage commissions, taxes, interest charges and other costs with respect to transactions in securities) and extraordinary expenses including litigation expenses, if any. UBS Global AM may, in its sole discretion, waive all or any portion of the management fee to which it may be entitled from time to time in order to maintain operating expenses at a
338
PACE Select Advisors Trust
Notes to financial statements
certain level. Distributions received from Private Money Market, net of fee rebates paid to borrowers, are reflected as securities lending income in the Statement of operations.
In August 2013, UBS Global AM made a voluntary cash payment of $2,430 to PACE Money Market Investments in order to address a differential between the number of shares outstanding and the Portfolio's net assets. The differential was attributable to historical, embedded capital losses that were experienced by the Portfolio over several years prior to the credit crisis of 2008. The voluntary payment to the Portfolio was not required to maintain a stable net asset value per share. The payment has removed a small, historical deviation that was reflected in the Portfolio's market price based and amortized cost net asset value per share.
During the year ended July 31, 2015, the Portfolios listed below paid broker commissions to affiliates of the investment manager as follows:
Affiliated broker | | PACE
Large Co
Value
Equity
Investments | | PACE
Small/Medium Co
Growth Equity
Investments | | PACE
International
Equity
Investments | | PACE
International
Emerging
Markets
Equity
Investments | | PACE
Alternative
Strategies
Investments | |
UBS AG | | $ | — | | | $ | — | | | $ | 6,005 | | | $ | 4,538 | | | $ | 6,362 | | |
UBS Securities Asia Ltd. | | | — | | | | — | | | | 119 | | | | 5,961 | | | | — | | |
UBS Securities Private Ltd. | | | — | | | | — | | | | — | | | | 582 | | | | — | | |
UBS Securities LLC | | | 6,499 | | | | 1,722 | | | | — | | | | 1,309 | | | | — | | |
UBS Securities Pte Ltd. | | | — | | | | — | | | | 83 | | | | 4,241 | | | | — | | |
UBS Warburg LLC | | | — | | | | — | | | | 7,040 | | | | 4,545 | | | | — | | |
Additional information regarding compensation to affiliate of a board member
Professor Meyer Feldberg serves as a senior advisor to Morgan Stanley, a financial services firm with which the Portfolios may conduct transactions, resulting in him being an interested trustee of the Portfolios. The Portfolios have been informed that Professor Feldberg's role at Morgan Stanley does not involve matters directly affecting any UBS funds. Portfolio transactions are executed through Morgan Stanley based on that firm's ability to provide best execution of the transactions. For the year ended July 31, 2015, the following Portfolios paid brokerage commissions to Morgan Stanley in the amounts as follows:
PACE Intermediate Fixed Income Investments | | $ | 2,634 | | |
PACE Strategic Fixed Income Investments | | | 2,086 | | |
PACE Large Co Value Equity Investments | | | 26,654 | | |
PACE Large Co Growth Equity Investments | | | 45,486 | | |
PACE Small/Medium Co Value Equity Investments | | | 13,021 | | |
PACE Small/Medium Co Growth Equity Investments | | | 12,223 | | |
PACE International Equity Investments | | | 51,785 | | |
PACE International Emerging Markets Equity Investments | | | 31,191 | | |
PACE Global Real Estate Securities Investments | | | 16,401 | | |
PACE Alternative Strategies Investments | | | 985,515 | | |
339
PACE Select Advisors Trust
Notes to financial statements
During the year ended July 31, 2015, the following Portfolios purchased and sold certain securities (e.g., fixed income securities) in principal trades with Morgan Stanley having aggregate values as follows:
PACE Money Market Investments | | $ | 103,083,241 | | |
PACE Mortgage-Backed Securities Fixed Income Investments | | | 1,594,352,297 | | |
PACE Intermediate Fixed Income Investments | | | 460,583,029 | | |
PACE Strategic Fixed Income Investments | | | 6,886,236,362 | | |
PACE Municipal Fixed Income Investments | | | 5,070,447 | | |
PACE International Fixed Income Investments | | | 24,460,729 | | |
PACE High Yield Investments | | | 35,413,764 | | |
PACE Small/Medium Co Growth Equity Investments | | | 473,434 | | |
PACE International Emerging Markets Equity Investments | | | 201,824 | | |
PACE Global Real Estate Securities Investments | | | 70,805 | | |
PACE Alternative Strategies Investments | | | 114,943,328 | | |
Morgan Stanley received compensation in connection with these trades, which may have been in the form of a "mark-up" or "mark-down" of the price of the securities, a fee from the issuer for maintaining a commercial paper program, or some other form of compensation. Although the precise amount of this compensation is not generally known by the investment manager, it is believed that under normal circumstances it represents a small portion of the total value of the transactions.
Service and distribution plans
UBS Global Asset Management (US) Inc. ("UBS Global AM (US)") is the principal underwriter of each Portfolio's shares. Under separate plans of service and/or distribution pertaining to Class A and Class C shares, the Portfolios (with the exception of PACE Money Market Investments, which only offers Class P shares), pay UBS Global AM (US) monthly service fees at the annual rate of 0.25% of the average daily net assets of Class A and Class C shares and monthly distribution fees (1) at the annual rate of 0.75% of the average daily net assets of Class C shares for PACE Large Co Value Equity Investments, PACE Large Co Growth Equity Investments, PACE Small/Medium Co Value Equity Investments, PACE Small/Medium Co Growth Equity Investments, PACE International Equity Investments, PACE International Emerging Markets Equity Investments, PACE Global Real Estate Securities Investments and PACE Alternative Strategies Investments and (2) at the annual rate of 0.50% of the average daily net assets of Class C shares for PACE Mortgage-Backed Securities Fixed Income Investments, PACE Intermediate Fixed Income Investments, PACE Strategic Fixed Income Investments, PACE Municipal Fixed Income Investments, PACE International Fixed Income Investments and PACE High Yield Investments.
UBS Global AM (US) also receives the proceeds of the initial sales charges paid upon the purchase of Class A shares and the contingent deferred sales charges paid by shareholders upon certain redemptions of Class A and Class C shares.
340
PACE Select Advisors Trust
Notes to financial statements
At July 31, 2015, certain Portfolios owed UBS Global AM (US) service and distribution fees, and for the year ended July 31, 2015, certain Portfolios were informed by UBS Global AM (US) that it had earned sales charges as follows:
Portfolio | | Service and distribution
fees owed | | Sales charges earned
by distributor | |
PACE Mortgage-Backed Securities Fixed Income Investments—Class A | | $ | 10,175 | | | $ | 506 | | |
PACE Mortgage-Backed Securities Fixed Income Investments—Class C | | | 8,191 | | | | — | | |
PACE Intermediate Fixed Income Investments—Class A | | | 4,321 | | | | 4,518 | | |
PACE Intermediate Fixed Income Investments—Class C | | | 1,228 | | | | — | | |
PACE Strategic Fixed Income Investments—Class A | | | 2,939 | | | | 3,210 | | |
PACE Strategic Fixed Income Investments—Class C | | | 7,574 | | | | — | | |
PACE Municipal Fixed Income Investments—Class A | | | 11,426 | | | | 12,585 | | |
PACE Municipal Fixed Income Investments—Class C | | | 6,650 | | | | 135 | | |
PACE International Fixed Income Investments—Class A | | | 9,481 | | | | 368 | | |
PACE International Fixed Income Investments—Class C | | | 1,934 | | | | — | | |
PACE High Yield Investments—Class A | | | 1,149 | | | | 1,023 | | |
PACE High Yield Investments—Class C | | | 2,569 | | | | 217 | | |
PACE Large Co Value Equity Investments—Class A | | | 26,540 | | | | 6,866 | | |
PACE Large Co Value Equity Investments—Class C | | | 12,457 | | | | 23 | | |
PACE Large Co Growth Equity Investments—Class A | | | 9,852 | | | | 3,762 | | |
PACE Large Co Growth Equity Investments—Class C | | | 3,487 | | | | 49 | | |
PACE Small/Medium Co Value Equity Investments—Class A | | | 3,967 | | | | 2,011 | | |
PACE Small/Medium Co Value Equity Investments—Class C | | | 4,243 | | | | — | | |
PACE Small/Medium Co Growth Equity Investments—Class A | | | 5,989 | | | | 1,014 | | |
PACE Small/Medium Co Growth Equity Investments—Class C | | | 3,468 | | | | — | | |
PACE International Equity Investments—Class A | | | 7,161 | | | | 1,452 | | |
PACE International Equity Investments—Class C | | | 2,316 | | | | — | | |
PACE International Emerging Markets Equity Investments—Class A | | | 1,043 | | | | 1,563 | | |
PACE International Emerging Markets Equity Investments—Class C | | | 1,457 | | | | — | | |
PACE Global Real Estate Securities Investments—Class A | | | 125 | | | | 148 | | |
PACE Global Real Estate Securities Investments—Class C | | | 285 | | | | — | | |
PACE Alternative Strategies Investments—Class A | | | 1,780 | | | | 39,228 | | |
PACE Alternative Strategies Investments—Class C | | | 7,700 | | | | 505 | | |
Transfer agency and related services fees
UBS Financial Services Inc. provides certain services to the Portfolios pursuant to a delegation of authority from BNY Mellon Investment Servicing (US) Inc. ("BNY Mellon"), the Portfolios' transfer agent, and is compensated for these services by BNY Mellon, not the Portfolios.
Effective July 1, 2013, UBS Financial Services Inc. voluntarily agreed to waive a portion of the fee that it would otherwise have received from BNY Mellon with respect to PACE Money Market Investments so that BNY Mellon would correspondingly reduce the fees it would have charged to that Portfolio. Given that UBS Global AM has voluntarily undertaken to reduce its fees and/or reimburse expenses to keep the Portfolio's yield at or above a certain level, and that such amount exceeds the reduction in BNY Mellon's fees, the net effect of BNY Mellon's pass through of the waiver by UBS Financial Services Inc. is to partially reduce the amount that UBS Global AM would have otherwise voluntarily waived/reimbursed. For the year ended July 31, 2015, the amount of the reduction in transfer agency and related services fees charged by BNY Mellon to the Portfolio was $293,637, which reflected an equal amount of compensation that was voluntarily waived by UBS Financial Services Inc. Voluntary fee waiver/expense reimbursement arrangements may end at any time.
341
PACE Select Advisors Trust
Notes to financial statements
For the year ended July 31, 2015, UBS Financial Services Inc. received from BNY Mellon, not the Portfolios, total delegated services fees as follows:
Portfolio | | Delegated
services fees
earned | |
PACE Money Market Investments | | $ | 149,000 | | |
PACE Mortgage-Backed Securities Fixed Income Investments | | | 453,739 | | |
PACE Intermediate Fixed Income Investments | | | 388,591 | | |
PACE Strategic Fixed Income Investments | | | 538,551 | | |
PACE Municipal Fixed Income Investments | | | 82,615 | | |
PACE International Fixed Income Investments | | | 550,485 | | |
PACE High Yield Investments | | | 424,539 | | |
PACE Large Co Value Equity Investments | | | 637,327 | | |
PACE Large Co Growth Equity Investments | | | 613,214 | | |
PACE Small/Medium Co Value Equity Investments | | | 593,099 | | |
PACE Small/Medium Co Growth Equity Investments | | | 594,730 | | |
PACE International Equity Investments | | | 591,156 | | |
PACE International Emerging Markets Equity Investments | | | 547,896 | | |
PACE Global Real Estate Securities Investments | | | 404,655 | | |
PACE Alternative Strategies Investments | | | 315,199 | | |
For the year ended July 31, 2015, each Portfolio accrued transfer agency and related services fees payable to BNY Mellon on each class as follows:
Portfolio | | Class A | | Class C | | Class Y | | Class P | |
PACE Money Market Investments | | $ | — | | | $ | — | | | $ | — | | | $ | 888,603 | | |
PACE Mortgage-Backed Securities Fixed Income Investments | | | 46,077 | | | | 13,987 | | | | 62,717 | | | | 750,214 | | |
PACE Intermediate Fixed Income Investments | | | 25,714 | | | | 2,295 | | | | 1,030 | | | | 658,187 | | |
PACE Strategic Fixed Income Investments | | | 26,127 | | | | 9,942 | | | | 6,302 | | | | 929,707 | | |
PACE Municipal Fixed Income Investments | | | 18,064 | | | | 4,123 | | | | 53 | | | | 131,751 | | |
PACE International Fixed Income Investments | | | 60,182 | | | | 3,903 | | | | 9,082 | | | | 911,342 | | |
PACE High Yield Investments | | | 10,731 | | | | 2,651 | | | | 1,366 | | | | 729,580 | | |
PACE Large Co Value Equity Investments | | | 99,053 | | | | 14,629 | | | | 15,443 | | | | 1,022,256 | | |
PACE Large Co Growth Equity Investments | | | 44,834 | | | | 5,975 | | | | 12,427 | | | | 1,023,525 | | |
PACE Small/Medium Co Value Equity Investments | | | 21,183 | | | | 4,411 | | | | 1,810 | | | | 1,004,166 | | |
PACE Small/Medium Co Growth Equity Investments | | | 27,863 | | | | 3,624 | | | | 1,550 | | | | 1,003,777 | | |
PACE International Equity Investments | | | 49,629 | | | | 4,451 | | | | 19,695 | | | | 980,500 | | |
PACE International Emerging Markets Equity Investments | | | 15,376 | | | | 2,800 | | | | 18,155 | | | | 931,949 | | |
PACE Global Real Estate Securities Investments | | | 5,883 | | | | 476 | | | | 514 | | | | 691,524 | | |
PACE Alternative Strategies Investments | | | 26,241 | | | | 3,939 | | | | 3,537 | | | | 515,245 | | |
Securities lending
Each Portfolio may lend securities up to 331/3% of its total assets to qualified broker-dealers or institutional investors. The loans are secured at all times by cash, US government securities or irrevocable letters of credit in an amount at least equal to the market value of the securities loaned, plus accrued interest and dividends, determined on a daily basis and adjusted accordingly. The Portfolio will regain ownership of loaned securities to exercise certain beneficial rights; however, each Portfolio may bear the risk of delay in recovery of, or even loss of rights in, the securities loaned should the borrower fail financially. Each Portfolio receives compensation for lending its securities from interest or dividends earned on the cash, US government securities or irrevocable letters of credit held as collateral,
342
PACE Select Advisors Trust
Notes to financial statements
net of fee rebates paid to the borrower plus reasonable administrative and custody fees. State Street Bank and Trust Company serves as the Portfolios' lending agent.
In addition, PACE Large Co Value Equity Investments and PACE International Equity Investments participate in State Street's enhanced custody program. Through this program, State Street is capable of facilitating the Portfolios' short selling activity at a lower cost. A portion of the cash collateral received in connection with the Portfolios' securities lending activity is pledged back to State Street for the financing of short sales. This amount is shown as cash collateral on investments sold short in the Statement of assets and liabilities.
At July 31, 2015, the following Portfolios had securities on loan at value, cash collateral and non-cash collateral as follows:
Portfolio | | Value of
securities
on loan | | Cash
collateral | | Non-cash
collateral* | | Total
collateral | | Security types
held as non-cash collateral | |
PACE Intermediate Fixed
Income Investments | | $ | 15,107,314 | | | $ | 15,390,673 | | | $ | — | | | $ | 15,390,673 | | | | |
PACE Strategic Fixed
Income Investments | | | 14,189,978 | | | | 14,444,243 | | | | — | | | | 14,444,243 | | | | |
PACE International Fixed
Income Investments | | | 3,012,751 | | | | 3,074,700 | | | | — | | | | 3,074,700 | | | | |
PACE High Yield Investments | | | 83,055,927 | | | | 84,978,673 | | | | — | | | | 84,978,673 | | | | |
PACE Large Co Value Equity
Investments | | | 35,148,808 | | | | 25,134,512 | | | | 10,639,578 | | | | 35,774,090 | | | US Treasury Notes and US Treasury Bills | |
PACE Large Co Growth
Equity Investments | | | 76,061,339 | | | | 3,716,848 | | | | 74,303,643 | | | | 78,020,491 | | | US Treasury Notes | |
PACE Small/Medium Co Value
Equity Investments | | | 120,693,659 | | | | 30,655,405 | | | | 94,215,711 | | | | 124,871,116 | | | | |
PACE Small/Medium Co
Growth Equity Investments | | | 143,430,284 | | | | 93,660,105 | | | | 52,196,300 | | | | 145,856,405 | | | US Treasury Notes and US Treasury Bills | |
PACE International Equity
Investments** | | | 74,548,307 | | | | 72,280,818 | | | | 907,042 | | | | 73,187,860 | | | US Treasury Notes | |
PACE International Emerging
Markets Investments | | | 24,407,378 | | | | 24,172,620 | | | | 1,307,331 | | | | 25,479,951 | | | US Treasury Notes and US Treasury Bills | |
PACE Global Real Estate
Securities Investments | | | 9,544,975 | | | | 1,874,653 | | | | 7,831,122 | | | | 9,705,775 | | | US Treasury Notes and US Treasury Bills | |
* These securities are held for the benefit of the Portfolio's custodian. The Portfolio cannot repledge or resell this collateral. As such, this collateral is excluded from the Statement of assets and liabilities.
** This Portfolio participates in the enhanced custody program which permits self-borrow transactions that does not require any collateral for the securities on loan under those transactions.
343
PACE Select Advisors Trust
Notes to financial statements
Bank line of credit
Each Portfolio, other than PACE Money Market Investments, participates with other funds managed, advised or sub-advised by UBS Global AM in a $75 million committed credit facility with State Street Bank and Trust Company ("Committed Credit Facility"), to be utilized for temporary financing until the settlement of sales or purchases of portfolio securities, the repurchase or redemption of shares of each Portfolio at the request of shareholders and other temporary or emergency purposes. Under the Committed Credit Facility arrangement, each Portfolio has agreed to pay commitment fees, pro rata, based on the relative asset size of the funds in the Committed Credit Facility. Each Portfolio borrows at prevailing rates in effect at the time of borrowings. For the year ended July 31, 2015, the following Portfolios had borrowings as follows:
Portfolio | | Average daily
amount of
borrowing
outstanding | | Days
outstanding | | Interest
expense | | Weighted average
annualized
interest rate | |
PACE Large Co Value Equity Investments | | $ | 1,745,648 | | | | 8 | | | $ | 436 | | | | 1.123 | % | |
PACE Large Co Growth Equity Investments | | | 2,555,023 | | | | 29 | | | | 2,318 | | | | 1.126 | | |
PACE International Equity Investments | | | 1,703,867 | | | | 18 | | | | 963 | | | | 1.130 | | |
PACE International Emerging Markets Equity Investments | | | 3,255,291 | | | | 6 | | | | 618 | | | | 1.140 | | |
PACE Strategic Fixed Income Investments | | | 1,690,396 | | | | 2 | | | | 106 | | | | 1.130 | | |
PACE Alternative Strategies Investments | | | 1,520,567 | | | | 2 | | | | 93 | | | | 1.100 | | |
At July 31, 2015, there were no borrowings outstanding.
Purchases and sales of securities
For the year ended July 31, 2015, aggregate purchases and sales of portfolio securities, excluding short-term securities and US Government and agency securities, were as follows:
Portfolio | | Purchases | | Sales | |
PACE Mortgage-Backed Securities Fixed Income Investments | | $ | 23,377,827 | | | $ | 29,252,356 | | |
PACE Intermediate Fixed Income Investments | | | 172,195,399 | | | | 134,451,099 | | |
PACE Strategic Fixed Income Investments | | | 484,967,453 | | | | 401,741,293 | | |
PACE Municipal Fixed Income Investments | | | 88,131,993 | | | | 85,852,684 | | |
PACE International Fixed Income Investments | | | 238,595,230 | | | | 211,710,709 | | |
PACE High Yield Investments | | | 250,862,725 | | | | 246,701,901 | | |
PACE Large Co Value Equity Investments (long transactions) | | | 1,190,974,757 | | | | 1,326,501,244 | | |
PACE Large Co Value Equity Investments (short transactions) | | | 192,397,993 | | | | 180,357,611 | | |
PACE Large Co Growth Equity Investments | | | 643,973,594 | | | | 710,586,846 | | |
PACE Small/Medium Co Value Equity Investments | | | 354,068,357 | | | | 390,072,682 | | |
PACE Small/Medium Co Growth Equity Investments | | | 470,407,349 | | | | 519,343,923 | | |
PACE International Equity Investments (long transactions) | | | 644,346,504 | | | | 660,786,523 | | |
PACE International Equity Investments (short Transactions) | | | 181,219,887 | | | | 175,765,105 | | |
PACE International Emerging Markets Equity Investments | | | 303,591,423 | | | | 287,868,883 | | |
PACE Global Real Estate Securities Investments | | | 153,945,042 | | | | 155,722,248 | | |
PACE Alternative Strategies Investments (long transactions) | | | 523,397,142 | | | | 378,322,152 | | |
PACE Alternative Strategies Investments (short transactions) | | | 77,975,593 | | | | 111,576,029 | | |
344
PACE Select Advisors Trust
Notes to financial statements
For the year ended July 31, 2015, aggregate purchases and sales of US Government and agency securities, excluding short-term securities, were as follows:
Portfolio | | Purchases | | Sales | |
PACE Mortgage-Backed Securities Fixed Income Investments | | $ | 9,400,155,669 | | | $ | 9,260,675,041 | | |
PACE Intermediate Fixed Income Investments | | | 1,871,781,921 | | | | 1,909,184,235 | | |
PACE Strategic Fixed Income Investments | | | 1,066,743,799 | | | | 1,173,714,323 | | |
PACE International Fixed Income Investments | | | 10,525,792 | | | | 6,122,150 | | |
Commission recapture program
The following Portfolios participate in a brokerage commission recapture program: PACE Large Co Value Equity Investments, PACE Large Co Growth Equity Investments, PACE Small/Medium Co Value Equity Investments, PACE Small/Medium Co Growth Equity Investments, PACE International Equity Investments, PACE International Emerging Markets Equity Investments, PACE Global Real Estate Securities Investments and PACE Alternative Strategies Investments. These Portfolios have established commission recapture arrangements with certain participating brokers or dealers. If a Portfolio's investment sub-advisor chooses to execute a transaction through a participating broker subject to best price and execution, the broker will rebate a portion of the commission back to the Portfolio. Any collateral benefit received through participation in the commission recapture program is directed exclusively to the Portfolio. For the year ended July 31, 2015, the following Portfolios recorded recaptured commissions which are reflected in the Statement of operations within the net realized gains (losses) on investment activities:
Portfolio | | Amount | |
PACE Strategic Fixed Income Investments | | $ | 106,098 | | |
PACE Large Co Value Equity Investments | | | 28,455 | | |
PACE Large Co Growth Equity Investments | | | 68,517 | | |
PACE Small/Medium Co Value Equity Investments | | | 118,127 | | |
PACE Small/Medium Co Growth Equity Investments | | | 29,925 | | |
PACE International Equity Investments | | | 43,205 | | |
PACE International Emerging Markets Equity Investments | | | 10,040 | | |
PACE Global Real Estate Securities Investments | | | 40,901 | | |
345
PACE Select Advisors Trust
Notes to financial statements
Shares of beneficial interest
There is an unlimited amount of $0.001 par value shares of beneficial interest authorized. Transactions in shares of beneficial interest for each of the Portfolios, except PACE Money Market Investments, about which similar information is provided on the Statement of changes in net assets, were as follows:
PACE Mortgage-Backed Securities Fixed Income Investments
For the year ended July 31, 2015:
| | | Class A | | Class C | |
| | | Shares | | Amount | | Shares | | Amount | |
Shares sold | | | 137,182 | | | $ | 1,775,921 | | | | 93 | | | $ | 1,207 | | |
Shares repurchased | | | (1,164,818 | ) | | | (15,109,274 | ) | | | (104,446 | ) | | | (1,354,903 | ) | |
Dividends reinvested | | | 54,159 | | | | 701,732 | | | | 10,235 | | | | 132,812 | | |
Net decrease | | | (973,477 | ) | | $ | (12,631,621 | ) | | | (94,118 | ) | | $ | (1,220,884 | ) | |
| | | Class Y | | Class P | |
| | | Shares | | Amount | | Shares | | Amount | |
Shares sold | | | 1,043,229 | | | $ | 13,549,103 | | | | 6,610,190 | | | $ | 85,796,232 | | |
Shares repurchased | | | (1,302,502 | ) | | | (16,912,832 | ) | | | (8,554,215 | ) | | | (111,094,636 | ) | |
Dividends reinvested | | | 74,052 | | | | 959,832 | | | | 624,418 | | | | 8,096,388 | | |
Net decrease | | | (185,221 | ) | | $ | (2,403,897 | ) | | | (1,319,607 | ) | | $ | (17,202,016 | ) | |
For the year ended July 31, 2014:
| | | Class A | | Class C | |
| | | Shares | | Amount | | Shares | | Amount | |
Shares sold | | | 135,760 | | | $ | 1,727,928 | | | | 4,500 | | | $ | 57,462 | | |
Shares repurchased | | | (822,783 | ) | | | (10,448,463 | ) | | | (270,214 | ) | | | (3,425,556 | ) | |
Dividends reinvested | | | 79,799 | | | | 1,012,888 | | | | 14,748 | | | | 187,371 | | |
Net decrease | | | (607,224 | ) | | $ | (7,707,647 | ) | | | (250,966 | ) | | $ | (3,180,723 | ) | |
| | | Class Y | | Class P | |
| | | Shares | | Amount | | Shares | | Amount | |
Shares sold | | | 862,458 | | | $ | 10,944,560 | | | | 7,828,428 | | | $ | 99,623,552 | | |
Shares repurchased | | | (1,779,838 | ) | | | (22,579,962 | ) | | | (10,110,106 | ) | | | (128,564,760 | ) | |
Dividends reinvested | | | 96,240 | | | | 1,221,484 | | | | 764,291 | | | | 9,706,793 | | |
Net decrease | | | (821,140 | ) | | $ | (10,413,918 | ) | | | (1,517,387 | ) | | $ | (19,234,415 | ) | |
346
PACE Select Advisors Trust
Notes to financial statements
PACE Intermediate Fixed Income Investments
For the year ended July 31, 2015:
| | | Class A | | Class C | |
| | | Shares | | Amount | | Shares | | Amount | |
Shares sold | | | 117,921 | | | $ | 1,461,000 | | | | 7,733 | | | $ | 95,207 | | |
Shares repurchased | | | (800,462 | ) | | | (9,875,333 | ) | | | (35,771 | ) | | | (443,227 | ) | |
Dividends reinvested | | | 18,251 | | | | 225,391 | | | | 1,032 | | | | 12,760 | | |
Net decrease | | | (664,290 | ) | | $ | (8,188,942 | ) | | | (27,006 | ) | | $ | (335,260 | ) | |
| | | Class Y | | Class P | |
| | | Shares | | Amount | | Shares | | Amount | |
Shares sold | | | 9,975 | | | $ | 123,047 | | | | 5,795,445 | | | $ | 71,657,053 | | |
Shares repurchased | | | (18,745 | ) | | | (231,866 | ) | | | (7,481,396 | ) | | | (92,530,470 | ) | |
Dividends reinvested | | | 701 | | | | 8,662 | | | | 511,388 | | | | 6,316,513 | | |
Net decrease | | | (8,069 | ) | | $ | (100,157 | ) | | | (1,174,563 | ) | | $ | (14,556,904 | ) | |
For the year ended July 31, 2014:
| | | Class A | | Class C | |
| | | Shares | | Amount | | Shares | | Amount | |
Shares sold | | | 137,367 | | | $ | 1,685,157 | | | | 5,955 | | | $ | 72,869 | | |
Shares repurchased | | | (450,475 | ) | | | (5,520,593 | ) | | | (43,809 | ) | | | (538,955 | ) | |
Dividends reinvested | | | 20,669 | | | | 253,651 | | | | 1,106 | | | | 13,588 | | |
Net decrease | | | (292,439 | ) | | $ | (3,581,785 | ) | | | (36,748 | ) | | $ | (452,498 | ) | |
| | | Class Y | | Class P | |
| | | Shares | | Amount | | Shares | | Amount | |
Shares sold | | | 407 | | | $ | 5,012 | | | | 7,348,586 | | | $ | 90,264,412 | | |
Shares repurchased | | | (12,355 | ) | | | (152,052 | ) | | | (8,070,814 | ) | | | (99,050,185 | ) | |
Dividends reinvested | | | 736 | | | | 9,032 | | | | 460,327 | | | | 5,650,534 | | |
Net decrease | | | (11,212 | ) | | $ | (138,008 | ) | | | (261,901 | ) | | $ | (3,135,239 | ) | |
PACE Strategic Fixed Income Investments
For the year ended July 31, 2015:
| | | Class A | | Class C | |
| | | Shares | | Amount | | Shares | | Amount | |
Shares sold | | | 242,517 | | | $ | 3,404,619 | | | | 33,395 | | | $ | 473,464 | | |
Shares repurchased | | | (2,490,629 | ) | | | (34,910,266 | ) | | | (291,622 | ) | | | (4,091,148 | ) | |
Dividends reinvested | | | 32,528 | | | | 454,650 | | | | 12,760 | | | | 178,854 | | |
Net decrease | | | (2,215,584 | ) | | $ | (31,050,997 | ) | | | (245,467 | ) | | $ | (3,438,830 | ) | |
| | | Class Y | | Class P | |
| | | Shares | | Amount | | Shares | | Amount | |
Shares sold | | | 26,584 | | | $ | 371,990 | | | | 10,724,618 | | | $ | 150,673,901 | | |
Shares repurchased | | | (76,471 | ) | | | (1,073,964 | ) | | | (12,153,437 | ) | | | (170,755,321 | ) | |
Dividends reinvested | | | 5,301 | | | | 74,186 | | | | 1,594,516 | | | | 22,339,498 | | |
Net increase (decrease) | | | (44,586 | ) | | $ | (627,788 | ) | | | 165,697 | | | $ | 2,258,078 | | |
347
PACE Select Advisors Trust
Notes to financial statements
For the year ended July 31, 2014:
| | | Class A | | Class C | |
| | | Shares | | Amount | | Shares | | Amount | |
Shares sold | | | 457,256 | | | $ | 6,368,555 | | | | 56,627 | | | $ | 785,975 | | |
Shares repurchased | | | (2,195,550 | ) | | | (30,574,747 | ) | | | (491,046 | ) | | | (6,842,706 | ) | |
Dividends reinvested | | | 176,412 | | | | 2,429,917 | | | | 41,632 | | | | 573,431 | | |
Net decrease | | | (1,561,882 | ) | | $ | (21,776,275 | ) | | | (392,787 | ) | | $ | (5,483,300 | ) | |
| | | Class Y | | Class P | |
| | | Shares | | Amount | | Shares | | Amount | |
Shares sold | | | 78,466 | | | $ | 1,087,674 | | | | 13,195,775 | | | $ | 184,184,815 | | |
Shares repurchased | | | (118,643 | ) | | | (1,657,906 | ) | | | (11,296,836 | ) | | | (157,435,317 | ) | |
Dividends reinvested | | | 10,522 | | | | 145,050 | | | | 3,243,921 | | | | 44,709,758 | | |
Net increase (decrease) | | | (29,655 | ) | | $ | (425,182 | ) | | | 5,142,860 | | | $ | 71,459,256 | | |
PACE Municipal Fixed Income Investments
For the year ended July 31, 2015:
| | | Class A | | Class C | |
| | | Shares | | Amount | | Shares | | Amount | |
Shares sold | | | 329,924 | | | $ | 4,402,100 | | | | 12,673 | | | $ | 168,222 | | |
Shares repurchased | | | (1,093,172 | ) | | | (14,509,502 | ) | | | (68,591 | ) | | | (907,833 | ) | |
Dividends reinvested | | | 72,096 | | | | 954,159 | | | | 9,743 | | | | 128,984 | | |
Net decrease | | | (691,152 | ) | | $ | (9,153,243 | ) | | | (46,175 | ) | | $ | (610,627 | ) | |
| | | Class Y | | Class P | |
| | | Shares | | Amount | | Shares | | Amount | |
Shares sold | | | — | | | $ | — | | | | 6,067,924 | | | $ | 80,445,478 | | |
Shares repurchased | | | (176 | ) | | | (2,341 | ) | | | (5,813,544 | ) | | | (77,091,539 | ) | |
Dividends reinvested | | | 38 | | | | 509 | | | | 605,267 | | | | 8,011,998 | | |
Net increase (decrease) | | | (138 | ) | | $ | (1,832 | ) | | | 859,647 | | | $ | 11,365,937 | | |
For the year ended July 31, 2014:
| | | Class A | | Class C | |
| | | Shares | | Amount | | Shares | | Amount | |
Shares sold | | | 519,213 | | | $ | 6,731,389 | | | | 28,522 | | | $ | 373,050 | | |
Shares repurchased | | | (759,265 | ) | | | (9,828,293 | ) | | | (162,906 | ) | | | (2,117,828 | ) | |
Dividends reinvested | | | 113,061 | | | | 1,463,462 | | | | 15,503 | | | | 200,476 | | |
Net decrease | | | (126,991 | ) | | $ | (1,633,442 | ) | | | (118,881 | ) | | $ | (1,544,302 | ) | |
| | | Class Y | | Class P | |
| | | Shares | | Amount | | Shares | | Amount | |
Shares sold | | | — | | | $ | — | | | | 7,457,402 | | | $ | 97,041,995 | | |
Shares repurchased | | | (162 | ) | | | (2,129 | ) | | | (6,116,730 | ) | | | (79,376,599 | ) | |
Dividends reinvested | | | 56 | | | | 729 | | | | 761,107 | | | | 9,863,895 | | |
Net increase (decrease) | | | (106 | ) | | $ | (1,400 | ) | | | 2,101,779 | | | $ | 27,529,291 | | |
348
PACE Select Advisors Trust
Notes to financial statements
PACE International Fixed Income Investments
For the year ended July 31, 2015:
| | | Class A | | Class C | |
| | | Shares | | Amount | | Shares | | Amount | |
Shares sold | | | 99,492 | | | $ | 1,061,483 | | | | 54 | | | $ | 561 | | |
Shares repurchased | | | (1,532,678 | ) | | | (16,077,340 | ) | | | (127,766 | ) | | | (1,312,547 | ) | |
Dividends reinvested | | | 124,511 | | | | 1,294,923 | | | | 7,357 | | | | 76,557 | | |
Net decrease | | | (1,308,675 | ) | | $ | (13,720,934 | ) | | | (120,355 | ) | | $ | (1,235,429 | ) | |
| | | Class Y | | Class P | |
| | | Shares | | Amount | | Shares | | Amount | |
Shares sold | | | 28,739 | | | $ | 300,166 | | | | 9,056,130 | | | $ | 94,191,347 | | |
Shares repurchased | | | (97,885 | ) | | | (1,017,792 | ) | | | (8,779,005 | ) | | | (91,103,883 | ) | |
Dividends reinvested | | | 16,271 | | | | 168,562 | | | | 1,573,276 | | | | 16,330,521 | | |
Net increase (decrease) | | | (52,875 | ) | | $ | (549,064 | ) | | | 1,850,401 | | | $ | 19,417,985 | | |
For the year ended July 31, 2014:
| | | Class A | | Class C | |
| | | Shares | | Amount | | Shares | | Amount | |
Shares sold | | | 149,342 | | | $ | 1,590,209 | | | | 953 | | | $ | 10,078 | | |
Shares repurchased | | | (1,096,763 | ) | | | (11,639,665 | ) | | | (140,871 | ) | | | (1,495,348 | ) | |
Dividends reinvested | | | 121,991 | | | | 1,297,893 | | | | 6,458 | | | | 68,740 | | |
Net decrease | | | (825,430 | ) | | $ | (8,751,563 | ) | | | (133,460 | ) | | $ | (1,416,530 | ) | |
| | | Class Y | | Class P | |
| | | Shares | | Amount | | Shares | | Amount | |
Shares sold | | | 64,369 | | | $ | 688,660 | | | | 11,602,434 | | | $ | 123,512,262 | | |
Shares repurchased | | | (60,676 | ) | | | (644,084 | ) | | | (8,367,262 | ) | | | (88,894,723 | ) | |
Dividends reinvested | | | 13,381 | | | | 142,063 | | | | 1,198,732 | | | | 12,764,362 | | |
Net increase | | | 17,074 | | | $ | 186,639 | | | | 4,433,904 | | | $ | 47,381,901 | | |
PACE High Yield Investments
For the year ended July 31, 2015:
| | | Class A | | Class C | |
| | | Shares | | Amount | | Shares | | Amount | |
Shares sold | | | 105,042 | | | $ | 1,092,150 | | | | 23,927 | | | $ | 239,283 | | |
Shares repurchased | | | (1,819,626 | ) | | | (18,433,419 | ) | | | (163,087 | ) | | | (1,643,569 | ) | |
Dividends reinvested | | | 50,955 | | | | 520,616 | | | | 14,965 | | | | 150,212 | | |
Net decrease | | | (1,663,629 | ) | | $ | (16,820,653 | ) | | | (124,195 | ) | | $ | (1,254,074 | ) | |
| | | Class Y | | Class P | |
| | | Shares | | Amount | | Shares | | Amount | |
Shares sold | | | 4,115 | | | $ | 41,953 | | | | 8,808,856 | | | $ | 89,299,200 | | |
Shares repurchased | | | (56,044 | ) | | | (582,854 | ) | | | (8,110,133 | ) | | | (82,026,806 | ) | |
Dividends reinvested | | | 8,222 | | | | 82,907 | | | | 2,796,767 | | | | 28,116,758 | | |
Net increase (decrease) | | | (43,707 | ) | | $ | (457,994 | ) | | | 3,495,490 | | | $ | 35,389,152 | | |
349
PACE Select Advisors Trust
Notes to financial statements
For the year ended July 31, 2014:
| | | Class A | | Class C | |
| | | Shares | | Amount | | Shares | | Amount | |
Shares sold | | | 257,770 | | | $ | 2,726,554 | | | | 39,000 | | | $ | 408,882 | | |
Shares repurchased | | | (384,449 | ) | | | (4,073,314 | ) | | | (64,010 | ) | | | (675,675 | ) | |
Dividends reinvested | | | 91,121 | | | | 963,515 | | | | 13,934 | | | | 147,176 | | |
Net decrease | | | (35,558 | ) | | $ | (383,245 | ) | | | (11,076 | ) | | $ | (119,617 | ) | |
| | | Class Y | | Class P | |
| | | Shares | | Amount | | Shares | | Amount | |
Shares sold | | | 21,256 | | | $ | 225,559 | | | | 10,287,549 | | | $ | 109,199,349 | | |
Shares repurchased | | | (20,033 | ) | | | (214,471 | ) | | | (5,997,261 | ) | | | (63,582,056 | ) | |
Dividends reinvested | | | 8,733 | | | | 92,661 | | | | 1,955,256 | | | | 20,732,934 | | |
Net increase | | | 9,956 | | | $ | 103,749 | | | | 6,245,544 | | | $ | 66,350,227 | | |
PACE Large Co Value Equity Investments
For the year ended July 31, 2015:
| | | Class A | | Class C | |
| | | Shares | | Amount | | Shares | | Amount | |
Shares sold | | | 49,759 | | | $ | 1,230,771 | | | | 14,977 | | | $ | 357,072 | | |
Shares repurchased | | | (1,559,905 | ) | | | (40,248,888 | ) | | | (77,145 | ) | | | (1,871,036 | ) | |
Dividends reinvested | | | 588,967 | | | | 13,976,182 | | | | 64,603 | | | | 1,538,181 | | |
Net increase (decrease) | | | (921,179 | ) | | $ | (25,041,935 | ) | | | 2,435 | | | $ | 24,217 | | |
| | | Class Y | | Class P | |
| | | Shares | | Amount | | Shares | | Amount | |
Shares sold | | | 57,411 | | | $ | 1,389,489 | | | | 5,374,499 | | | $ | 133,288,645 | | |
Shares repurchased | | | (112,816 | ) | | | (2,738,307 | ) | | | (9,083,798 | ) | | | (222,237,824 | ) | |
Dividends reinvested | | | 98,943 | | | | 2,349,895 | | | | 6,355,826 | | | | 150,378,849 | | |
Net increase | | | 43,538 | | | $ | 1,001,077 | | | | 2,646,527 | | | $ | 61,429,670 | | |
For the year ended July 31, 2014:
| | | Class A | | Class C | |
| | | Shares | | Amount | �� | Shares | | Amount | |
Shares sold | | | 138,875 | | | $ | 3,313,455 | | | | 15,073 | | | $ | 349,412 | | |
Shares repurchased | | | (825,664 | ) | | | (19,618,213 | ) | | | (53,717 | ) | | | (1,281,114 | ) | |
Dividends reinvested | | | 117,852 | | | | 2,796,627 | | | | 7,485 | | | | 178,312 | | |
Net decrease | | | (568,937 | ) | | $ | (13,508,131 | ) | | | (31,159 | ) | | $ | (753,390 | ) | |
| | | Class Y | | Class P | |
| | | Shares | | Amount | | Shares | | Amount | |
Shares sold | | | 21,406 | | | $ | 512,965 | | | | 6,611,809 | | | $ | 157,829,351 | | |
Shares repurchased | | | (78,848 | ) | | | (1,885,982 | ) | | | (8,051,978 | ) | | | (192,269,704 | ) | |
Dividends reinvested | | | 17,655 | | | | 419,481 | | | | 1,103,624 | | | | 26,133,810 | | |
Net decrease | | | (39,787 | ) | | $ | (953,536 | ) | | | (336,545 | ) | | $ | (8,306,543 | ) | |
350
PACE Select Advisors Trust
Notes to financial statements
PACE Large Co Growth Equity Investments
For the year ended July 31, 2015:
| | | Class A | | Class C | |
| | | Shares | | Amount | | Shares | | Amount | |
Shares sold | | | 69,175 | | | $ | 1,781,382 | | | | 3,016 | | | $ | 67,414 | | |
Shares repurchased | | | (1,126,391 | ) | | | (30,494,869 | ) | | | (29,232 | ) | | | (666,505 | ) | |
Dividends reinvested | | | 191,398 | | | | 4,698,831 | | | | 22,858 | | | | 489,833 | | |
Net decrease | | | (865,818 | ) | | $ | (24,014,656 | ) | | | (3,358 | ) | | $ | (109,258 | ) | |
| | | Class Y | | Class P | |
| | | Shares | | Amount | | Shares | | Amount | |
Shares sold | | | 36,339 | | | $ | 927,224 | | | | 4,888,745 | | | $ | 129,483,655 | | |
Shares repurchased | | | (109,571 | ) | | | (2,847,112 | ) | | | (9,096,942 | ) | | | (238,540,705 | ) | |
Dividends reinvested | | | 71,897 | | | | 1,811,799 | | | | 5,764,169 | | | | 144,450,078 | | |
Net increase (decrease) | | | (1,335 | ) | | $ | (108,089 | ) | | | 1,555,972 | | | $ | 35,393,028 | | |
For the year ended July 31, 2014:
| | | Class A | | Class C | |
| | | Shares | | Amount | | Shares | | Amount | |
Shares sold | | | 100,924 | | | $ | 2,521,260 | | | | 7,604 | | | $ | 167,300 | | |
Shares repurchased | | | (357,271 | ) | | | (8,893,628 | ) | | | (31,255 | ) | | | (711,299 | ) | |
Dividends reinvested | | | 222,204 | | | | 5,346,236 | | | | 17,667 | | | | 380,192 | | |
Net decrease | | | (34,143 | ) | | $ | (1,026,132 | ) | | | (5,984 | ) | | $ | (163,807 | ) | |
| | | Class Y | | Class P | |
| | | Shares | | Amount | | Shares | | Amount | |
Shares sold | | | 15,807 | | | $ | 397,993 | | | | 6,259,563 | | | $ | 158,656,158 | | |
Shares repurchased | | | (84,881 | ) | | | (2,146,436 | ) | | | (7,775,654 | ) | | | (197,160,102 | ) | |
Dividends reinvested | | | 54,050 | | | | 1,330,717 | | | | 4,125,967 | | | | 101,044,914 | | |
Net increase (decrease) | | | (15,024 | ) | | $ | (417,726 | ) | | | 2,609,876 | | | $ | 62,540,970 | | |
PACE Small/Medium Co Value Equity Investments
For the year ended July 31, 2015:
| | | Class A | | Class C | |
| | | Shares | | Amount | | Shares | | Amount | |
Shares sold | | | 32,700 | | | $ | 720,456 | | | | 9,720 | | | $ | 177,405 | | |
Shares repurchased | | | (708,111 | ) | | | (15,958,419 | ) | | | (38,169 | ) | | | (710,298 | ) | |
Dividends reinvested | | | 103,313 | | | | 2,077,634 | | | | 36,147 | | | | 631,485 | | |
Net increase (decrease) | | | (572,098 | ) | | $ | (13,160,329 | ) | | | 7,698 | | | $ | 98,592 | | |
| | | Class Y | | Class P | |
| | | Shares | | Amount | | Shares | | Amount | |
Shares sold | | | 13,356 | | | $ | 298,268 | | | | 3,037,901 | | | $ | 66,962,638 | | |
Shares repurchased | | | (12,677 | ) | | | (268,980 | ) | | | (4,001,151 | ) | | | (87,240,137 | ) | |
Dividends reinvested | | | 5,605 | | | | 116,309 | | | | 3,019,454 | | | | 62,110,172 | | |
Net increase | | | 6,284 | | | $ | 145,597 | | | | 2,056,204 | | | $ | 41,832,673 | | |
351
PACE Select Advisors Trust
Notes to financial statements
For the year ended July 31, 2014:
| | | Class A | | Class C | |
| | | Shares | | Amount | | Shares | | Amount | |
Shares sold | | | 63,212 | | | $ | 1,427,365 | | | | 7,742 | | | $ | 154,808 | | |
Shares repurchased | | | (218,356 | ) | | | (4,888,494 | ) | | | (29,357 | ) | | | (579,750 | ) | |
Dividends reinvested | | | 169,018 | | | | 3,608,529 | | | | 33,980 | | | | 645,613 | | |
Net increase | | | 13,874 | | | $ | 147,400 | | | | 12,365 | | | $ | 220,671 | | |
| | | Class Y | | Class P | |
| | | Shares | | Amount | | Shares | | Amount | |
Shares sold | | | 5,929 | | | $ | 135,231 | | | | 3,528,915 | | | $ | 80,570,626 | | |
Shares repurchased | | | (4,046 | ) | | | (92,686 | ) | | | (3,278,447 | ) | | | (74,764,570 | ) | |
Dividends reinvested | | | 4,575 | | | | 100,610 | | | | 2,553,249 | | | | 55,711,895 | | |
Net increase | | | 6,458 | | | $ | 143,155 | | | | 2,803,717 | | | $ | 61,517,951 | | |
PACE Small/Medium Co Growth Equity Investments
For the year ended July 31, 2015:
| | | Class A | | Class C | |
| | | Shares | | Amount | | Shares | | Amount | |
Shares sold | | | 23,316 | | | $ | 457,839 | | | | 12,220 | | | $ | 218,245 | | |
Shares repurchased | | | (871,234 | ) | | | (17,994,667 | ) | | | (44,080 | ) | | | (735,030 | ) | |
Dividends reinvested | | | 197,173 | | | | 3,614,189 | | | | 39,519 | | | | 608,598 | | |
Net increase (decrease) | | | (650,745 | ) | | $ | (13,922,639 | ) | | | 7,659 | | | $ | 91,813 | | |
| | | Class Y | | Class P | |
| | | Shares | | Amount | | Shares | | Amount | |
Shares sold | | | 14,835 | | | $ | 313,895 | | | | 3,071,887 | | | $ | 63,474,086 | | |
Shares repurchased | | | (13,390 | ) | | | (265,433 | ) | | | (4,284,782 | ) | | | (87,452,863 | ) | |
Dividends reinvested | | | 5,277 | | | | 102,429 | | | | 3,548,030 | | | | 68,015,734 | | |
Net increase | | | 6,722 | | | $ | 150,891 | | | | 2,335,135 | | | $ | 44,036,957 | | |
For the year ended July 31, 2014:
| | | Class A | | Class C | |
| | | Shares | | Amount | | Shares | | Amount | |
Shares sold | | | 112,552 | | | $ | 2,436,630 | | | | 15,563 | | | $ | 310,048 | | |
Shares repurchased | | | (267,342 | ) | | | (5,685,945 | ) | | | (26,534 | ) | | | (470,702 | ) | |
Dividends reinvested | | | 245,623 | | | | 5,069,662 | | | | 31,669 | | | | 568,452 | | |
Net increase | | | 90,833 | | | $ | 1,820,347 | | | | 20,698 | | | $ | 407,798 | | |
| | | Class Y | | Class P | |
| | | Shares | | Amount | | Shares | | Amount | |
Shares sold | | | 7,083 | | | $ | 158,288 | | | | 3,380,210 | | | $ | 74,482,065 | | |
Shares repurchased | | | (4,874 | ) | | | (108,202 | ) | | | (3,543,072 | ) | | | (78,451,875 | ) | |
Dividends reinvested | | | 3,701 | | | | 80,208 | | | | 2,662,457 | | | | 57,056,451 | | |
Net increase | | | 5,910 | | | $ | 130,294 | | | | 2,499,595 | | | $ | 53,086,641 | | |
352
PACE Select Advisors Trust
Notes to financial statements
PACE International Equity Investments
For the year ended July 31, 2015:
| | | Class A | | Class C | |
| | | Shares | | Amount | | Shares | | Amount | |
Shares sold | | | 49,147 | | | $ | 742,749 | | | | 10,551 | | | $ | 155,200 | | |
Shares repurchased | | | (1,522,846 | ) | | | (22,647,840 | ) | | | (17,958 | ) | | | (263,196 | ) | |
Dividends reinvested | | | 48,015 | | | | 690,936 | | | | 2,940 | | | | 41,568 | | |
Net decrease | | | (1,425,684 | ) | | $ | (21,214,155 | ) | | | (4,467 | ) | | $ | (66,428 | ) | |
| | | Class Y | | Class P | |
| | | Shares | | Amount | | Shares | | Amount | |
Shares sold | | | 58,254 | | | $ | 877,495 | | | | 10,321,301 | | | $ | 153,752,915 | | |
Shares repurchased | | | (290,859 | ) | | | (4,282,881 | ) | | | (10,109,594 | ) | | | (150,829,713 | ) | |
Dividends reinvested | | | 39,843 | | | | 570,555 | | | | 1,769,175 | | | | 25,281,509 | | |
Net increase (decrease) | | | (192,762 | ) | | $ | (2,834,831 | ) | | | 1,980,882 | | | $ | 28,204,711 | | |
For the year ended July 31, 2014:
| | | Class A | | Class C | |
| | | Shares | | Amount | | Shares | | Amount | |
Shares sold | | | 155,807 | | | $ | 2,361,902 | | | | 11,841 | | | $ | 175,923 | | |
Shares repurchased | | | (519,389 | ) | | | (7,823,421 | ) | | | (23,585 | ) | | | (350,027 | ) | |
Dividends reinvested | | | 62,442 | | | | 911,655 | | | | 1,960 | | | | 28,185 | | |
Net decrease | | | (301,140 | ) | | $ | (4,549,864 | ) | | | (9,784 | ) | | $ | (145,919 | ) | |
| | | Class Y | | Class P | |
| | | Shares | | Amount | | Shares | | Amount | |
Shares sold | | | 110,070 | | | $ | 1,632,704 | | | | 11,779,394 | | | $ | 177,342,787 | | |
Shares repurchased | | | (167,314 | ) | | | (2,544,663 | ) | | | (9,125,315 | ) | | | (137,422,739 | ) | |
Dividends reinvested | | | 30,704 | | | | 447,047 | | | | 1,264,719 | | | | 18,376,371 | | |
Net increase (decrease) | | | (26,540 | ) | | $ | (464,912 | ) | | | 3,918,798 | | | $ | 58,296,419 | | |
PACE International Emerging Markets Equity Investments
For the year ended July 31, 2015:
| | | Class A | | Class C | |
| | | Shares | | Amount | | Shares | | Amount | |
Shares sold | | | 48,175 | | | $ | 638,691 | | | | 11,434 | | | $ | 135,323 | | |
Shares repurchased | | | (920,629 | ) | | | (11,827,983 | ) | | | (24,645 | ) | | | (292,330 | ) | |
Dividends reinvested | | | 2,316 | | | | 28,948 | | | | 331 | | | | 3,841 | | |
Net decrease | | | (870,138 | ) | | $ | (11,160,344 | ) | | | (12,880 | ) | | $ | (153,166 | ) | |
| | | Class Y | | Class P | |
| | | Shares | | Amount | | Shares | | Amount | |
Shares sold | | | 38,127 | | | $ | 497,223 | | | | 7,342,129 | | | $ | 96,126,379 | | |
Shares repurchased | | | (182,776 | ) | | | (2,403,151 | ) | | | (5,418,163 | ) | | | (70,909,505 | ) | |
Dividends reinvested | | | 10,330 | | | | 130,670 | | | | 393,761 | | | | 4,957,447 | | |
Net increase (decrease) | | | (134,319 | ) | | $ | (1,775,258 | ) | | | 2,317,727 | | | $ | 30,174,321 | | |
353
PACE Select Advisors Trust
Notes to financial statements
For the year ended July 31, 2014:
| | | Class A | | Class C | |
| | | Shares | | Amount | | Shares | | Amount | |
Shares sold | | | 123,262 | | | $ | 1,571,651 | | | | 3,592 | | | $ | 44,328 | | |
Shares repurchased | | | (226,329 | ) | | | (2,875,805 | ) | | | (30,455 | ) | | | (357,357 | ) | |
Dividends reinvested | | | 4,158 | | | | 52,505 | | | | — | | | | — | | |
Net decrease | | | (98,909 | ) | | $ | (1,251,649 | ) | | | (26,863 | ) | | $ | (313,029 | ) | |
| | | Class Y | | Class P | |
| | | Shares | | Amount | | Shares | | Amount | |
Shares sold | | | 46,210 | | | $ | 587,917 | | | | 10,101,508 | | | $ | 129,502,924 | | |
Shares repurchased | | | (209,590 | ) | | | (2,682,375 | ) | | | (4,318,210 | ) | | | (55,543,646 | ) | |
Dividends reinvested | | | 5,520 | | | | 70,938 | | | | 151,110 | | | | 1,934,203 | | |
Net increase (decrease) | | | (157,860 | ) | | $ | (2,023,520 | ) | | | 5,934,408 | | | $ | 75,893,481 | | |
PACE Global Real Estate Securities Investments
For the year ended July 31, 2015:
| | | Class A | | Class C | |
| | | Shares | | Amount | | Shares | | Amount | |
Shares sold | | | 82,338 | | | $ | 644,489 | | | | 8,793 | | | $ | 66,048 | | |
Shares repurchased | | | (810,131 | ) | | | (6,069,751 | ) | | | — | | | | — | | |
Dividends reinvested | | | — | | | | — | | | | 1,101 | | | | 7,950 | | |
Net increase (decrease) | | | (727,793 | ) | | $ | (5,425,262 | ) | | | 9,894 | | | $ | 73,998 | | |
| | | Class Y | | Class P | |
| | | Shares | | Amount | | Shares | | Amount | |
Shares sold | | | 1,076 | | | $ | 7,783 | | | | 3,458,079 | | | $ | 25,682,098 | | |
Shares repurchased | | | (1,893 | ) | | | (14,140 | ) | | | (3,538,992 | ) | | | (26,313,892 | ) | |
Dividends reinvested | | | 1,351 | | | | 9,819 | | | | 683,416 | | | | 4,954,762 | | |
Net increase | | | 534 | | | $ | 3,462 | | | | 602,503 | | | $ | 4,322,968 | | |
For the year ended July 31, 2014:
| | | Class A | | Class C | |
| | | Shares | | Amount | | Shares | | Amount | |
Shares sold | | | 103,095 | | | $ | 692,811 | | | | 4,337 | | | $ | 29,972 | | |
Shares repurchased | | | (143,242 | ) | | | (960,149 | ) | | | (1,759 | ) | | | (11,990 | ) | |
Dividends reinvested | | | 13,786 | | | | 88,095 | | | | 380 | | | | 2,423 | | |
Net increase (decrease) | | | (26,361 | ) | | $ | (179,243 | ) | | | 2,958 | | | $ | 20,405 | | |
| | | Class Y | | Class P | |
| | | Shares | | Amount | | Shares | | Amount | |
Shares sold | | | 3,653 | | | $ | 24,378 | | | | 4,483,611 | | | $ | 30,133,852 | | |
Shares repurchased | | | (11,372 | ) | | | (77,968 | ) | | | (2,953,321 | ) | | | (19,954,750 | ) | |
Dividends reinvested | | | 884 | | | | 5,667 | | | | 384,273 | | | | 2,455,504 | | |
Net increase (decrease) | | | (6,835 | ) | | $ | (47,923 | ) | | | 1,914,563 | | | $ | 12,634,606 | | |
354
PACE Select Advisors Trust
Notes to financial statements
PACE Alternative Strategies Investments
For the year ended July 31, 2015:
| | | Class A | | Class C | |
| | | Shares | | Amount | | Shares | | Amount | |
Shares sold | | | 1,737,629 | | | $ | 18,561,745 | | | | 343,497 | | | $ | 3,614,059 | | |
Shares repurchased | | | (8,352,327 | ) | | | (89,919,893 | ) | | | (81,081 | ) | | | (847,604 | ) | |
Dividends reinvested | | | — | | | | — | | | | 1,210 | | | | 12,551 | | |
Net increase (decrease) | | | (6,614,698 | ) | | $ | (71,358,148 | ) | | | 263,626 | | | $ | 2,779,006 | | |
| | | Class Y | | Class P | |
| | | Shares | | Amount | | Shares | | Amount | |
Shares sold | | | 30,635 | | | $ | 331,470 | | | | 23,708,618 | | | $ | 257,856,072 | | |
Shares repurchased | | | (245,039 | ) | | | (2,641,470 | ) | | | (10,956,193 | ) | | | (119,108,123 | ) | |
Dividends reinvested | | | 2,614 | | | | 28,134 | | | | 609,778 | | | | 6,542,917 | | |
Net increase (decrease) | | | (211,790 | ) | | $ | (2,281,866 | ) | | | 13,362,203 | | | $ | 145,290,866 | | |
For the year ended July 31, 2014:
| | | Class A | | Class C | |
| | | Shares | | Amount | | Shares | | Amount | |
Shares sold | | | 2,877,286 | | | $ | 30,020,983 | | | | 187,052 | | | $ | 1,916,702 | | |
Shares repurchased | | | (947,453 | ) | | | (9,905,664 | ) | | | (63,673 | ) | | | (648,893 | ) | |
Dividends reinvested | | | 90,328 | | | | 934,895 | | | | 5,488 | | | | 55,321 | | |
Net increase | | | 2,020,161 | | | $ | 21,050,214 | | | | 128,867 | | | $ | 1,323,130 | | |
| | | Class Y | | Class P | |
| | | Shares | | Amount | | Shares | | Amount | |
Shares sold | | | 350,112 | | | $ | 3,704,129 | | | | 15,396,469 | | | $ | 161,452,259 | | |
Shares repurchased | | | (189,146 | ) | | | (1,990,288 | ) | | | (7,260,819 | ) | | | (76,085,114 | ) | |
Dividends reinvested | | | 5,742 | | | | 59,887 | | | | 1,015,142 | | | | 10,557,469 | | |
Net increase | | | 166,708 | | | $ | 1,773,728 | | | | 9,150,792 | | | $ | 95,924,614 | | |
Redemption fees
Each class of each series of the Trust, with the exception of PACE Money Market Investments, will impose a 1% redemption fee on shares sold or exchanged within 90 days of their purchase date, subject to limited exemptions as noted in the prospectuses. This amount is paid to the applicable Portfolio. The redemption fees retained by the Portfolios are disclosed in the Statement of changes in net assets. For the year ended July 31, 2015, redemption fees represent less than $0.005 per share.
Effective February 17, 2015, for purchases of shares on or after that date, the redemption fee will be calculated as a percentage of the amount redeemed within 30 days of purchase, if applicable. Effective August 3, 2015, for purchases of shares on or after that date, the redemption fee was eliminated.
Federal tax status
Each of the Portfolios intends to distribute substantially all of its income and to comply with the other requirements of the Internal Revenue Code applicable to regulated investment companies. Accordingly, no provision for federal income taxes is required. In addition, by distributing during each calendar year substantially all of its net investment income, net realized capital gains and certain other amounts, if any, each Portfolio intends not to be subject to a federal excise tax.
355
PACE Select Advisors Trust
Notes to financial statements
The tax character of distributions paid during the fiscal years ended July 31, 2015 and July 31, 2014 were as follows:
| | | 2015 | | 2014 | |
Portfolio | | Tax-
exempt
income | | Ordinary
Income | | Long term
realized
capital gains | | Return
of
capital | | Tax-
exempt
income | | Ordinary
Income | | Long term
realized
capital gains | | Return
of
capital | |
PACE Money Market
Investments | | $ | — | | | $ | 21,010 | | | $ | — | | | $ | — | | | $ | — | | | $ | 27,996 | | | $ | — | | | $ | — | | |
PACE Mortgage-Backed
Securities Fixed Income
Investments | | | — | | | | 10,748,068 | | | | — | | | | — | | | | — | | | | 13,090,265 | | | | — | | | | — | | |
PACE Intermediate Fixed
Income Investments | | | — | | | | 6,742,062 | | | | 416,495 | | | | — | | | | — | | | | 6,444,331 | | | | — | | | | — | | |
PACE Strategic Fixed
Income Investments | | | — | | | | 24,826,172 | | | | — | | | | — | | | | — | | | | 20,937,737 | | | | 23,185,807 | | | | 6,704,242 | | |
PACE Municipal Fixed
Income Investments | | | 10,727,697 | | | | 7,334 | | | | — | | | | — | | | | 10,689,173 | | | | 20,458 | | | | 2,811,969 | | | | — | | |
PACE International
Fixed Income Investments | | | — | | | | 12,854,886 | | | | — | | | | 6,437,480 | | | | — | | | | 7,509,147 | | | | — | | | | 7,875,061 | | |
PACE High Yield
Investments | | | — | | | | 24,450,100 | | | | 6,606,595 | | | | — | | | | — | | | | 23,592,261 | | | | — | | | | — | | |
PACE Large Co Value
Equity Investments | | | — | | | | 33,018,522 | | | | 144,188,915 | | | | — | | | | — | | | | 14,548,344 | | | | 16,527,749 | | | | — | | |
PACE Large Co Growth
Equity Investments | | | — | | | | 18,702,626 | | | | 139,561,279 | | | | — | | | | — | | | | 14,515,044 | | | | 98,135,891 | | | | — | | |
PACE Small/Medium Co
Value Equity Investments | | | — | | | | 24,250,226 | | | | 43,493,292 | | | | — | | | | — | | | | 13,484,554 | | | | 48,887,589 | | | | — | | |
PACE Small/Medium Co
Growth Equity
Investments | | | — | | | | 10,967,318 | | | | 64,366,071 | | | | — | | | | — | | | | 10,730,601 | | | | 54,510,822 | | | | — | | |
PACE International Equity
Investments | | | — | | | | 28,067,973 | | | | — | | | | — | | | | — | | | | 20,719,035 | | | | — | | | | — | | |
PACE International
Emerging Markets Equity
Investments | | | — | | | | 5,372,352 | | | | — | | | | — | | | | — | | | | 2,143,512 | | | | — | | | | — | | |
PACE Global Real Estate
Securities Investments | | | — | | | | 5,250,218 | | | | — | | | | — | | | | — | | | | 2,673,401 | | | | — | | | | — | | |
PACE Alternative
Strategies Investments | | | — | | | | 7,075,445 | | | | — | | | | — | | | | — | | | | 12,298,860 | | | | — | | | | — | | |
356
PACE Select Advisors Trust
Notes to financial statements
At July 31, 2015, the components of accumulated earnings (deficit) on a tax basis were as follows:
Portfolio | | Undistributed
tax exempt
income | | Undistributed
ordinary
income | | Undistributed
long-term
capital gains | | Accumulated
realized
capital and
other losses | | Unrealized
appreciation
(depreciation) | | Total | |
PACE Money Market Investments | | $ | — | | | $ | 1,456 | | | $ | — | | | $ | — | | | $ | — | | | $ | 1,456 | | |
PACE Mortgage-Backed Securities
Fixed Income Investments | | | — | | | | 326,608 | | | | — | | | | (14,403,870 | ) | | | 5,574,476 | | | | (8,502,786 | ) | |
PACE Intermediate Fixed Income Investments | | | — | | | | 3,289,179 | | | | 720,188 | | | | (116,946 | ) | | | 265,966 | | | | 4,158,387 | | |
PACE Strategic Fixed Income Investments | | | — | | | | 7,323,824 | | | | 5,882,857 | | | | (74,487 | ) | | | (10,873,472 | ) | | | 2,258,722 | | |
PACE Municipal Fixed Income Investments | | | 1,551 | | | | — | | | | 1,760,943 | | | | — | | | | 14,011,305 | | | | 15,773,799 | | |
PACE International Fixed Income Investments | | | — | | | | — | | | | — | | | | (23,913,729 | ) | | | (34,304,499 | ) | | | (58,218,228 | ) | |
PACE High Yield Investments | | | — | | | | — | | | | — | | | | (10,893,653 | ) | | | (5,496,109 | ) | | | (16,389,762 | ) | |
PACE Large Co Value Equity Investments | | | — | | | | 34,746,884 | | | | 110,239,137 | | | | (158,046 | ) | | | 105,871,249 | | | | 250,699,224 | | |
PACE Large Co Growth Equity Investments | | | — | | | | — | | | | 177,631,133 | | | | (348,728 | ) | | | 316,525,385 | | | | 493,807,790 | | |
PACE Small/Medium Co Value
Equity Investments | | | — | | | | 4,681,925 | | | | 40,644,033 | | | | — | | | | 43,374,663 | | | | 88,700,621 | | |
PACE Small/Medium Co Growth
Equity Investments | | | — | | | | 13,553,204 | | | | 59,710,571 | | | | — | | | | 98,636,602 | | �� | | 171,900,377 | | |
PACE International Equity Investments | | | — | | | | 12,341,091 | | | | — | | | | (146,205,833 | ) | | | 42,796,511 | | | | (91,068,231 | ) | |
PACE International Emerging Markets
Equity Investments | | | — | | | | 4,024,331 | | | | — | | | | (23,682,286 | ) | | | (30,852,465 | ) | | | (50,510,420 | ) | |
PACE Global Real Estate Securities Investments | | | — | | | | 2,187,385 | | | | — | | | | (5,432,457 | ) | | | 362,236 | | | | (2,882,836 | ) | |
PACE Alternative Strategies Investments | | | — | | | | 26,204,495 | | | | — | | | | (37,227,184 | ) | | | 8,204,368 | | | | (2,818,321 | ) | |
Under the Regulated Investment Company Modernization Act of 2010 (the "Act"), net capital losses recognized by the Portfolios after December 22, 2010, may be carried forward indefinitely, and retain their character as short-term and/or long-term losses. The Act requires that post-enactment net capital losses be used before pre-enactment net capital losses. Post enactment losses incurred that will be carried forward indefinitely are as following:
| | Short-term | | Long-term | | Net | |
PACE Mortgage-Backed Securities Fixed Income Investments | | $ | 555,692 | | | $ | 13,848,178 | | | $ | 14,403,870 | | |
PACE International Fixed Income Investments | | | 6,503,051 | | | | 2,343,899 | | | | 8,846,950 | | |
PACE International Emerging Markets Equity Investments | | | 21,218,151 | | | | 2,464,135 | | | | 23,682,286 | | |
At July 31, 2015, the following Portfolios had pre-enactment capital loss carryforwards for federal income tax purposes available to offset future capital gains through the indicated expiration dates.
| | July 31,
2016 | | July 31,
2017 | | July 31,
2018 | | July 31,
2019 | | July 31,
2020 | | Total | |
PACE International Fixed Income Investments | | $ | 2,354,563 | | | $ | 765,140 | | | $ | 7,784,695 | | | $ | — | | | $ | — | | | $ | 10,904,398 | | |
PACE International Equity Investments | | | — | | | | — | | | | 135,459,001 | | | | — | | | | — | | | | 135,459,001 | | |
PACE Global Real Estate Securities Investments | | | — | | | | — | | | | 5,432,457 | | | | — | | | | — | | | | 5,432,457 | | |
PACE Alternative Strategies Investments | | | — | | | | — | | | | 37,080,401 | | | | — | | | | — | | | | 37,080,401 | | |
357
PACE Select Advisors Trust
Notes to financial statements
To the extent that such losses are used to offset future net realized capital gains, it is probable these gains will not be distributed.
During the fiscal year, the following Portfolios utilized capital loss carryforwards to offset current year realized gains:
| | Capital loss
carryforwards
utilized | |
PACE Money Market Investments | | $ | 215 | | |
PACE Mortgage-Backed Securities Fixed Income Investments | | | 3,922,403 | | |
PACE Strategic Fixed Income Investments | | | 25,957,637 | | |
PACE High Yield Investments | | | 1,977,398 | | |
PACE International Equity Investments | | | 12,804,097 | | |
PACE Global Real Estate Securities Investments | | | 15,404,968 | | |
PACE Alternative Strategies Investments | | | 9,486,100 | | |
During the fiscal year, the following Portfolio had capital loss carryforwards expired un-utilized:
| | Capital loss
carryforwards
expired | |
PACE International Fixed Income Investments | | $ | 1,422,528 | | |
Qualified late year losses are deemed to arise on the first business day of a Portfolio's next taxable year. For the year ended July 31, 2015, the following Portfolios incurred, and elected to defer losses of the following:
| | Late year
ordinary | | Post-October capital losses | |
| | losses | | Short-term | | Long-term | |
PACE International Fixed Income Investments | | $ | 2,426,877 | | | $ | — | | | $ | — | | |
PACE International Equity Investments | | | — | | | | 10,746,832 | | | | — | | |
PACE High Yield Investments | | | 2,903,233 | | | | 3,514,463 | | | | 4,475,957 | | |
PACE Large Co Growth Equity Investments | | | 348,728 | | | | — | | | | — | | |
At July 31, 2015, the effect of permanent "book/tax" reclassifications resulted in increases and decreases to components of the Portfolios' net assets as follows:
| | Accumulated
net investment
income/
(distributions
in excess of) | | Accumulated
net realized
gain/loss | | Beneficial
interest | |
PACE Mortgage-Backed Securities Fixed Income Investments | | $ | 4,828,287 | | | $ | (4,828,287 | ) | | $ | — | | |
PACE Intermediate Fixed Income Investments | | | 520,645 | | | | (520,645 | ) | | | — | | |
PACE Strategic Fixed Income Investments | | | 7,988,826 | | | | (7,988,826 | ) | | | — | | |
PACE International Fixed Income Investments | | | 12,272,862 | | | | (10,850,334 | ) | | | (1,422,528 | ) | |
PACE High Yield Investments | | | (3,012,024 | ) | | | 3,935,878 | | | | (923,854 | ) | |
PACE Large Co Value Equity Investments | | | 48,278 | | | | (48,278 | ) | | | — | | |
PACE Large Co Growth Equity Investments | | | 3,545,883 | | | | (2,017,404 | ) | | | (1,528,479 | ) | |
PACE Small/Medium Co Value Equity Investments | | | (19,190 | ) | | | 19,190 | | | | — | | |
358
PACE Select Advisors Trust
Notes to financial statements
| | | Accumulated
net investment
income/
(distributions
in excess of) | | Accumulated
net realized
gain/loss | | Beneficial
interest | |
PACE Small/Medium Co Growth Equity Investments | | | 3,503,281 | | | | (3,503,281 | ) | | | — | | |
PACE International Equity Investments | | | 58,640 | | | | (58,640 | ) | | | — | | |
PACE International Emerging Markets Equity Investments | | | (846,307 | ) | | | 846,307 | | | | — | | |
PACE Global Real Estate Securities Investments | | | 3,910,347 | | | | (3,910,347 | ) | | | — | | |
PACE Alternative Strategies Investments | | | 39,700,833 | | | | (40,262,733 | ) | | | 561,900 | | |
These differences are primarily due to tax treatment of foreign currency and futures transactions, net operating losses, paydown gains and losses, distributions in excess of net investment income, disposition of PFIC investments, swap adjustments, REIT adjustments, tax character of distributions and adjustments for certain debt obligations.
ASC 740-10 "Income Taxes—Overall" sets forth a minimum threshold for financial statement recognition of the benefit of a tax position taken or expected to be taken. The Portfolios have conducted an analysis and concluded as of July 31, 2015 that, other than PACE International Emerging Markets Equity Investments, there are no significant uncertain tax positions taken or expected to be taken that would require recognition in the financial statements. As of July 31, 2015, PACE International Emerging Markets Equity Investments has recognized a liability of $358,667 related to uncertain tax positions of which $325,095 is included in payable foreign withholding taxes and foreign capital gains taxes and $33,572 is included in deferred foreign capital gain taxes payable in the Statement of assets and liabilities. The Portfolios recognize interest and penalties, if any, related to uncertain tax positions as income tax expense in the Statement of operations. During the year ended July 31, 2015, the Portfolios did not incur any interest or penalties.
Under the applicable foreign tax laws, gains on certain securities held in certain foreign countries may be subject to taxes that will be paid by the Portfolios.
Each of the tax years in the four year period ended July 31, 2015, remains subject to examination by the Internal Revenue Service and state taxing authorities.
Regulatory Developments
On July 23, 2014, the SEC amended certain regulations that govern money market funds registered under the 1940 Act. The most significant changes will not become mandatory until October 2016. The most significant change is a requirement that institutional prime and institutional municipal money market funds move to a floating net asset value and change an accounting methodology that had been used for decades. In addition, all prime and municipal money market funds will be subject to potential redemption fees/gates under limited circumstances prescribed in the new regulations. Government, Treasury, retail prime and retail municipal money market funds will continue to be permitted to transact at a stable $1.00 share price. UBS Global AM is currently evaluating the potential impact of these changes on PACE Money Markey Investments and expects to update shareholders further in advance of the October 2016 deadline.
Subsequent event
On September 22, 2015, the Board of Trustees approved of a new policy on behalf of PACE Money Market Investments (the "Portfolio") to invest at least 99.5% of its total assets in cash, government securities and/or repurchase agreements that are collateralized fully by cash or government securities to allow the Portfolio to qualify as a government money market fund. In addition, UBS Global AM is changing the name of the Portfolio to PACE Government Money Market Investments to ensure that the Portfolio is understood to be a government money
359
PACE Select Advisors Trust
Notes to financial statements
market fund. In connection with the change to the Portfolio's name, the Portfolio will also adopt a non-fundamental investment policy that the Portfolio invests, under normal circumstances, at least 80% of its net assets (plus the amount of any borrowing for investment purposes) in government securities, including government securities subject to repurchase agreements. UBS Global AM expects to have the changes become effective on or about November 28, 2015.
360
PACE Select Advisors Trust
Report of Ernst & Young LLP, independent registered public
accounting firm
The Board of Trustees and Shareholders of
PACE Select Advisors Trust
We have audited the accompanying statements of assets and liabilities, including the portfolios of investments, of PACE Select Advisors Trust (comprising, respectively, PACE Money Market Investments, PACE Mortgage-Backed Securities Fixed Income Investments, PACE Intermediate Fixed Income Investments, PACE Strategic Fixed Income Investments, PACE Municipal Fixed Income Investments, PACE International Fixed Income Investments, PACE High Yield Investments, PACE Large Co Value Equity Investments, PACE Large Co Growth Equity Investments, PACE Small/Medium Co Value Equity Investments, PACE Small/Medium Co Growth Equity Investments, PACE International Equity Investments, PACE International Emerging Markets Equity Investments, PACE Global Real Estate Securities Investments and PACE Alternative Strategies Investments, collectively the "Trust") as of July 31, 2015, and the related statements of operations and the statements of cash flows of PACE Strategic Fixed Income Investments, PACE Large Co Value Equity Investments and PACE International Equity Investments for the year then ended, the statements of changes in net assets for each of the two years in the period then ended, and the financial highlights for each of the five years in the period then ended. These financial statements and financial highlights are the responsibility of the Trust's management. Our responsibility is to express an opinion on these financial statements and financial highlights based on our audits.
We conducted our audits in accordance with the standards of the Public Company Accounting Oversight Board (United States). Those standards require that we plan and perform the audit to obtain reasonable assurance about whether the financial statements and financial highlights are free of material misstatement. We were not engaged to perform an audit of the Trust's internal control over financial reporting. Our audits included consideration of internal control over financial reporting as a basis for designing audit procedures that are appropriate in the circumstances, but not for the purpose of expressing an opinion on the effectiveness of the Trust's internal control over financial reporting. Accordingly, we express no such opinion. An audit also includes examining, on a test basis, evidence supporting the amounts and disclosures in the financial statements and financial highlights, assessing the accounting principles used and significant estimates made by management, and evaluating the overall financial statement presentation. Our procedures included confirmation of securities owned as of July 31, 2015, by correspondence with the custodian and others, or by other appropriate auditing procedures where replies from others were not received. We believe that our audits provide a reasonable basis for our opinion.
In our opinion, the financial statements and financial highlights referred to above present fairly, in all material respects, the financial position of each of the respective series constituting PACE Select Advisors Trust at July 31, 2015, the results of their operations and the cash flows of PACE Strategic Fixed Income Investments, PACE Large Co Value Equity Investments and PACE International Equity Investments for the year then ended, the changes in their net assets for each of the two years in the period then ended, and the financial highlights for each of the five years in the period then ended, in conformity with US generally accepted accounting principles.

New York, New York
September 29, 2015
361
PACE Select Advisors Trust
Tax information (unaudited)
We are required by Subchapter M of the Internal Revenue Code of 1986, as amended, to advise you in writing as to the federal tax status of distributions received by shareholders during the fiscal year. Accordingly, the percentage of ordinary dividends paid that qualify for the dividends received deduction for corporate shareholders and the amount of foreign tax credit to be passed through to shareholders are as follows:
| Portfolio | | Dividends
received
deduction | | Foreign tax
credit | |
PACE Large Co Value Equity Investments | | | 80.47 | % | | | — | | |
PACE Large Co Growth Equity Investments | | | 55.84 | | | | — | | |
PACE Small/Medium Co Value Equity Investments | | | 29.43 | | | | — | | |
PACE Small/Medium Co Growth Equity Investments | | | 18.80 | | | | |
PACE International Equity Investments | | | — | | | $ | 1,469,276 | | |
PACE International Emerging Markets Equity Investments | | | — | | | | 1,604,153 | | |
PACE Global Real Estate Securities Investments | | | 1.07 | | | | — | | |
PACE Alternative Strategies Investments | | | 4.48 | | | | — | | |
Also, for the fiscal year ended July 31, 2015, the foreign source income for information reporting purposes for PACE International Equity Investments and PACE International Emerging Markets Equity Investments is $25,254,566 and $12,632,664, respectively.
For the period ended July 31, 2015, certain dividends paid by the Portfolios below may be subject to a maximum tax rate of 15%, as provided for by the Jobs and Growth Tax Relief Reconciliation Act of 2003. Of the distributions paid during the period, the amounts below represent the maximum amount that may be considered qualified dividend income.
| Portfolio | | Maximum amount
considered qualified
dividend income | |
PACE Large Co Value Equity Investments | | $ | 30,196,505 | | |
PACE Large Co Growth Equity Investments | | | 9,662,465 | | |
PACE Small/Medium Co Value Equity Investments | | | 7,420,990 | | |
PACE Small/Medium Co Growth Equity Investments | | | 1,537,538 | | |
PACE International Equity Investments | | | 29,537,249 | | |
PACE International Emerging Markets Equity Investments | | | 6,976,505 | | |
PACE Global Real Estate Securities Investments | | | 185,683 | | |
PACE Alternative Strategies Investments | | | 5,361,011 | | |
Dividends received by tax-exempt recipients (e.g., IRAs and Keoghs) need not be reported as taxable income. Some retirement trusts (e.g., corporate, Keogh and 403(b)(7) plans) may need this information for their annual information reporting.
Shareholders should not use the above information to prepare their tax returns. Since each Portfolio's fiscal year is not the calendar year, another notification will be sent with respect to calendar year 2015. Such notification, which will reflect the amount to be used by calendar year taxpayers on their federal income tax returns, will be made in conjunction with Form 1099 DIV and will be mailed in February 2016. Shareholders are advised to consult their own tax advisers with respect to the tax consequences of their investment in each of the Portfolios.
362
PACE Select Advisors Trust
General information (unaudited)
Monthly and quarterly portfolio holdings disclosure
Each Portfolio will file its complete schedule of portfolio holdings with the Securities and Exchange Commission ("SEC") for the first and third quarters of each fiscal year on Form N-Q. The Portfolios' Forms N-Q are available on the SEC's Web site at http://www.sec.gov. The Portfolios' Forms N-Q may be reviewed and copied at the SEC's Public Reference Room in Washington, D.C. Information on the operation of the SEC's Public Reference Room may be obtained by calling 1-800-SEC 0330. Additionally, you may obtain copies of Forms N-Q from the Portfolios upon request by calling 1-800-647 1568.
In addition, PACE Money Market Investments discloses, on a monthly basis: (a) a complete schedule of its portfolio holdings; and (b) information regarding its weighted average maturity and weighted average life on UBS's Web site at the following internet address: www.ubs.com/usmoneymarketfundsholdings. In addition, at this location, you will find a link to more detailed Portfolio information appearing in filings with the SEC on Form N-MFP.
Proxy voting policies, procedures and record
You may obtain a description of each Portfolio's (1) proxy voting policies, (2) proxy voting procedures and (3) information regarding how a Portfolio voted any proxies related to portfolio securities during the most recent 12-month period ended June 30 for which an SEC filing has been made, without charge, upon request by contacting a Portfolio directly at 1-800-647 1568, online on a Portfolio's Web site: www.ubs.com/ubsglobalam-proxy, or on the EDGAR Database on the SEC's Web site (http://www.sec.gov).
363
PACE Select Advisors Trust
Board approvals of sub-advisory agreements (unaudited)
February 2015 Board Meeting
Sirios Capital Management, L.P.
Trustees' considerations
Background—At a meeting of the board of PACE Select Advisors Trust (the "Trust") on February 10-11, 2015, the members of the board, including the trustees who are not "interested persons" of the Trust (the "Independent Trustees") as defined in the Investment Company Act of 1940, as amended, considered and approved the proposed sub-advisory agreement between UBS Global Asset Management (Americas) Inc. ("UBS Global AM") and Sirios Capital Management, L.P. ("Sirios") (the "Sub-Advisory Agreement") with respect to PACE Alternative Strategies Investments (the "Portfolio"). Management discussed with the board its proposal to terminate one of the two strategies provided to the Portfolio by First Quadrant, L.P. (i.e., the equitized portion of First Quadrant's global macro strategy) and to reallocate the portion of assets managed by First Quadrant using that strategy to Sirios. In considering the approval of the Sub-Advisory Agreement, the board was able to draw on its knowledge of the Trust, its portfolios and UBS Global AM. The board recognized its familiarity with UBS Global AM and the investment management and sub-advisory agreements for this and the other portfolios of the Trust, including the extensive materials the board had previously reviewed in connection with the annual reconsideration of the contracts for the portfolios. The board also received a memorandum from UBS Global AM discussing UBS Global AM's reasons for recommending Sirios as a sub-advisor to the Portfolio.
In its consideration of the approval of the Sub-Advisory Agreement, the board considered the following factors:
Nature, extent and quality of the services under the Sub-Advisory Agreement—The board's evaluation of the services to be provided by Sirios to the Portfolio took into account the board's knowledge and familiarity gained as board members of funds in the UBS New York fund complex, including the Trust and its portfolios. It reviewed the purposes and investment objective of the Portfolio and UBS Global AM's overall plan to meet the Portfolio's stated purposes and objective. The board considered management's reasons for recommending the appointment of Sirios as a sub-advisor to the Portfolio, including its "due diligence" concerning Sirios and its belief that Sirios's liquid alternative long-short equity strategy would benefit the Portfolio by, among other reasons, reducing the Portfolio's systematic risk, improving the Portfolio's ability to generate risk-adjusted returns and reducing "downside capture" over full business cycles and complementing the strategies provided by other sub-advisors to the Portfolio. The board also received materials from Sirios detailing its investment philosophy and met with a representative of Sirios, who discussed with the board that investment philosophy and process and the backgrounds and qualifications of the portfolio management team. The board concluded that, overall, it was satisfied with the nature, extent and quality of services expected to be provided to the Portfolio under the proposed Sub-Advisory Agreement.
Sub-advisory fee—The board reviewed and considered the proposed contractual sub-advisory fee to be payable by UBS Global AM to Sirios in light of the nature, extent and quality of the sub-advisory services anticipated to be provided by Sirios. The board noted that although the proposed contractual sub-advisory fee would result in a net increase in the sub-advisory fees paid by UBS Global AM with respect to the Portfolio, the net increase in the sub-advisory fees would have no impact on the fees paid by the Portfolio's investors as the additional cost would be borne by UBS Global AM. The board determined that the proposed sub-advisory fee was reasonable in light of the nature, extent and quality of the services proposed to be provided to the Portfolio under the Sub-Advisory Agreement.
364
PACE Select Advisors Trust
Board approvals of sub-advisory agreements (unaudited)
Fund performance—The board received and considered composite performance information provided by Sirios. The board also noted that, as Sirios would be a new sub-advisor to the Portfolio, the current performance of the Portfolio was not a significant factor in the consideration of the approval of the Sub-Advisory Agreement.
Advisor profitability—Profitability of Sirios or its affiliates or UBS Global AM or its affiliates in providing services to the Portfolio was not a significant factor considered by the board, as the sub-advisory fee would be paid by UBS Global AM out of the management fee paid to it by the Portfolio, and not by the Portfolio.
Economies of scale—The board noted that, as the sub-advisory fee for the Portfolio would be paid by UBS Global AM, not by the Portfolio, consideration of economies of scale with respect specifically to the sub-advisory fee was not relevant.
Other benefits to Sirios—The board was informed by management that Sirios' relationship with the Portfolio would be limited to its provision of sub-advisory services to the Portfolio and that therefore management believed that Sirios would not receive tangible ancillary benefits as a result of its relationship with the Portfolio, with the exception of possible benefits from soft dollars (e.g., research credits related to transaction commissions) for the Portfolio (which would also potentially benefit the Portfolio). The board recognized that Sirios could receive intangible benefits from its association with the Portfolio, such as increased name recognition or publicity from being selected as a sub-advisor to the Portfolio after an extensive review process. Similarly, the Portfolio could benefit from having a sub-advisor with an established or well-regarded reputation.
In light of all of the foregoing, the board, including a majority of the Independent Trustees, approved the proposed Sub-Advisory Agreement for the Portfolio. No single factor reviewed by the board was identified by the board as the principal factor in determining whether to approve the Sub-Advisory Agreement. The Independent Trustees were advised by separate independent legal counsel throughout the process.
365
PACE Select Advisors Trust
Board approvals of sub-advisory agreements (unaudited)
May 2015 Board Meeting
Nomura Corporate Research and Asset Management Inc. and Nomura Asset Management Singapore Limited
Trustees' considerations
Background—At a meeting of the board of PACE Select Advisors Trust (the "Trust") on May 19-20, 2015, the members of the board, including the trustees who are not "interested persons" of the Trust (the "Independent Trustees") as defined in the Investment Company Act of 1940, as amended, considered and approved the proposed sub-advisory agreement between UBS Global Asset Management (Americas) Inc. ("UBS Global AM") and Nomura Corporate Research and Asset Management Inc. ("NCRAM") (the "Sub-Advisory Agreement") and sub-management agreement between NCRAM and its affiliate, Nomura Asset Management Singapore Limited ("NAM Singapore") (the "Sub-Management Agreement" and, together with the Sub-Advisory Agreement, the "Agreements"), with respect to PACE High Yield Investments (the "Portfolio"). Management discussed with the board its proposal to terminate MacKay Shields LLC ("MacKay") as the sole sub-advisor to the Portfolio and to reallocate the assets managed by MacKay to NCRAM, with the Asian high yield allocation of the strategy to be managed by NAM Singapore in its role as sub-manager to NCRAM. In considering the approval of the Agreements, the board was able to draw on its knowledge of the Trust, its portfolios and UBS Global AM. The board recognized its familiarity with UBS Global AM and the investment management and sub-advisory agreements for this and the other portfolios of the Trust, including the extensive materials the board had previously reviewed in connection with the annual reconsideration of the contracts for the portfolios. The board also received a memorandum from UBS Global AM discussing UBS Global AM's reasons for recommending NCRAM and NAM Singapore as the sub-advisor and sub-manager, respectively, to the Portfolio.
In its consideration of the approval of the Agreements, the board considered the following factors:
Nature, extent and quality of the services under the Agreements—The board's evaluation of the services to be provided by NCRAM and NAM Singapore to the Portfolio took into account the board's knowledge and familiarity gained as board members of funds in the UBS New York fund complex, including the Trust and its portfolios. It reviewed the purposes and investment objective of the Portfolio and UBS Global AM's overall plan to meet the Portfolio's stated purposes and objective. The board considered management's reasons for recommending the appointment of NCRAM and NAM Singapore as the sub-advisor and sub-manager, respectively, to the Portfolio, including its "due diligence" concerning NCRAM and NAM Singapore and its belief that NCRAM's global high yield fixed income strategy would benefit the Portfolio by, among other reasons, potentially improving the Portfolio's ability to generate risk-adjusted returns and potentially enhancing downside protection. The board also received materials from NCRAM detailing its investment philosophy and met with representatives of NCRAM, who discussed with the board their investment philosophy and process and the backgrounds and qualifications of the portfolio management team. The board concluded that, overall, it was satisfied with the nature, extent and quality of services expected to be provided to the Portfolio under the proposed Agreements.
Sub-advisory and sub-management fees—The board reviewed and considered the proposed contractual sub-advisory fee to be payable by UBS Global AM to NCRAM and sub-management fee to be payable by NCRAM to NAM Singapore in light of the nature, extent and quality of the sub-advisory services and sub-management services anticipated to be provided by NCRAM and NAM Singapore, respectively. The board noted that the proposed contractual sub-advisory fee, with its breakpoints, was more favorable than the sub-advisory fee currently charged by MacKay and was expected to result in a lower sub-advisory fee to be paid by UBS Global AM. The board also noted that UBS Global AM voluntarily offered to pass onto the shareholders (via a corresponding voluntary waiver of its management fee charged to the Portfolio) any sub-advisory fee savings that UBS Global AM experienced as a result
366
PACE Select Advisors Trust
Board approvals of sub-advisory agreements (unaudited)
of engaging NCRAM as a sub-advisor. The board determined that the proposed sub-advisory fee and sub-management fee were reasonable in light of the nature, extent and quality of the services proposed to be provided to the Portfolio under the Sub-Advisory Agreement and Sub-Management Agreement, respectively.
Fund performance—The board received and considered composite performance information provided by NCRAM with respect to various investment strategies, including its global high yield fixed income strategy and NAM Singapore's Asian high yield fixed income strategy. The board also noted that, as NCRAM and NAM Singapore would be a new sub-advisor and sub-manager, respectively, to the Portfolio, the current performance of the Portfolio was not a significant factor in the consideration of the approval of the Agreements.
Advisor profitability—Profitability of NCRAM, NAM Singapore or their affiliates, or UBS Global AM or its affiliates, in providing services to the Portfolio was not a significant factor considered by the board, as the sub-advisory fee would be paid by UBS Global AM out of the management fee paid to it by the Portfolio and the sub-management fee payable to NAM Singapore would be paid by NCRAM out of the sub-advisory fee paid to it by UBS Global AM, and not by the Portfolio. As noted above, the board observed that the contractual sub-advisory fee payable by UBS Global AM to NCRAM would be lower than the fee paid by UBS Global AM to the Portfolio's current sub-advisor. The board indicated that it would further consider the implications, if any, of this lower sub-advisory expense to UBS Global AM and the fee waiver noted above, among other matters, when it engages in its next full UBS Global AM management contract review, or before if appropriate. In this regard, it was noted that UBS Global AM provides updated profitability data on the Portfolio on an ongoing quarterly basis, which provides the board with other opportunities to monitor the impact of the proposed changes on profitability going forward.
Economies of scale—The board noted that, as the sub-advisory fee and sub-management fee for the Portfolio would be paid by UBS Global AM and NCRAM, respectively, not by the Portfolio, consideration of economies of scale with respect specifically to the sub-advisory fee and sub-management fee was not relevant.
Other benefits to NCRAM and NAM Singapore—The board was informed by management that the relationships of NCRAM and NAM Singapore with the Portfolio would be limited to their provision of sub-advisory services and sub-management services, respectively, to the Portfolio and that therefore management believed that NCRAM and NAM Singapore would not receive tangible ancillary benefits as a result of their respective relationships with the Portfolio. The board recognized that NCRAM and NAM Singapore could receive intangible benefits from their association with the Portfolio, such as increased name recognition or publicity from being selected as a sub-advisor and sub-manager, respectively, to the Portfolio after an extensive review process. Similarly, the Portfolio could benefit from having a sub-advisor and sub-manager with an established or well-regarded reputation.
In light of all of the foregoing, the board, including a majority of the Independent Trustees, approved the proposed Agreements for the Portfolio. No single factor reviewed by the board was identified by the board as the principal factor in determining whether to approve the Agreements. The Independent Trustees were advised by separate independent legal counsel throughout the process.
367
PACE Select Advisors Trust
Board approvals of sub-advisory agreements (unaudited)
May 2015 Board Meeting
Timpani Capital Management LLC
Trustees' considerations
Background—At a meeting of the board of PACE Select Advisors Trust (the "Trust") on May 19-20, 2015, the members of the board, including the trustees who are not "interested persons" of the Trust (the "Independent Trustees") as defined in the Investment Company Act of 1940, as amended, considered and approved the proposed sub-advisory agreement between UBS Global Asset Management (Americas) Inc. ("UBS Global AM") and Timpani Capital Management LLC ("Timpani") (the "Sub-Advisory Agreement") with respect to PACE Small/Medium Co Growth Equity Investments (the "Portfolio"). Management explained to the board that Timpani was owned by Growth Investment Managers LLC ("GIM"), an entity made up of the Timpani investment team and Frontier One LLC ("Frontier One"), with GIM and Frontier One owning 60% and 40%, respectively, of the voting equity shares of Timpani. Management further explained that, as of April 1, 2015, a window opened for an equity acquisition event, and GIM advised that it intended to exercise its option to acquire up to 15% of the voting equity shares of Timpani from Frontier One. This transfer is expected to take place on or about August 19, 2015. Following the transaction, and assuming that GIM exercises the full option as expected, GIM will own 75% of Timpani's voting equity shares and Frontier One will own 25%. Management explained that, pursuant to Timpani's operating agreement, if GIM elects to acquire 15% of the equity of Timpani in the transaction, GIM will control the composition of Timpani's board of directors. Management noted that, even if GIM elects to acquire less than 15% of the equity of Timpani, GIM nevertheless will control the composition of Timpani's board of directors as of October 1, 2015 due to the provisions of Timpani's operating agreement. Management stated that because the expected change in ownership constitutes an "assignment," the current sub-advisory agreement with Timpani (the "Current Sub-Advisory Agreement") would terminate automatically upon consummation of the transaction and, if approved, the proposed Sub-Advisory Agreement would become effective. Management stated that the proposed Sub-Advisory Agreement has substantially the same terms as the Current Sub-Advisory Agreement. The board recognized its familiarity with UBS Global AM and the investment management and sub-advisory agreements for this and the other portfolios of the Trust, including the extensive materials the board had previously reviewed in connection with the annual reconsideration of the contracts for the portfolios. The board also received a memorandum from UBS Global AM discussing UBS Global AM's reasons for recommending that Timpani continue serving as a sub-advisor to the Portfolio.
In its consideration of the approval of the Sub-Advisory Agreement, the board considered the following factors:
Nature, extent and quality of the services under the Sub-Advisory Agreement—The board's evaluation of the services to be provided by Timpani to the Portfolio took into account the board's knowledge and familiarity gained as board members of funds in the UBS New York fund complex, including the Trust and its portfolios. The board considered management's reasons for recommending that Timpani continue as a sub-advisor to the Portfolio, including that the Timpani investment team currently manages a portion of the Portfolio's assets and would continue to manage those assets in a materially similar manner, with no expected changes to investment personnel. Management noted that it did not expect the investment team, philosophy or process to be affected by this change in ownership structure. In considering the approval of the Sub-Advisory Agreement, the board was able to draw on its knowledge of the Trust, its portfolios and UBS Global AM. The board concluded that, overall, it was satisfied with the nature, extent and quality of services expected to be provided to the Portfolio under the proposed Sub-Advisory Agreement.
Sub-advisory fee—The board reviewed and considered the proposed contractual sub-advisory fee to be payable by UBS Global AM to Timpani in light of the nature, extent and quality of the sub-advisory services anticipated to
368
PACE Select Advisors Trust
Board approvals of sub-advisory agreements (unaudited)
be provided by Timpani. The board noted that the sub-advisory fee rate in the Sub-Advisory Agreement was the same as that in the Current Sub-Advisory Agreement. The board determined that the proposed sub-advisory fee was reasonable in light of the nature, extent and quality of the services proposed to be provided to the Portfolio under the Sub-Advisory Agreement.
Fund performance—The board received and considered performance information provided by UBS Global AM. The board also noted that UBS Global AM believes that the investment team will continue to perform at its current level after the transaction. The board concluded that, overall, it was satisfied with the performance of the Portfolio.
Advisor profitability—Profitability of Timpani or its affiliates or UBS Global AM or its affiliates in providing services to the Portfolio was not a significant factor considered by the board, as the sub-advisory fee would be paid by UBS Global AM out of the management fee paid to it by the Portfolio, and not by the Portfolio.
Economies of scale—The board noted that, as the sub-advisory fee for the Portfolio would be paid by UBS Global AM, not by the Portfolio, consideration of economies of scale with respect specifically to the sub-advisory fee was not relevant.
Other benefits to Timpani—The board was informed by management that Timpani's relationship with the Portfolio would be limited to its provision of sub-advisory services to the Portfolio and that therefore management believed that Timpani would not receive tangible ancillary benefits as a result of its relationship with the Portfolio, with the exception of possible benefits from soft dollars (e.g., research credits related to transaction commissions) for the Portfolio (which would also potentially benefit the Portfolio). The board recognized that Timpani could receive intangible benefits from its association with the Portfolio, such as increased name recognition or publicity from being selected as a sub-advisor to the Portfolio after an extensive review process. Similarly, the Portfolio could benefit from having a sub-advisor with an established or well-regarded reputation.
In light of all of the foregoing, the board, including a majority of the Independent Trustees, approved the proposed Sub-Advisory Agreement for the Portfolio. No single factor reviewed by the board was identified by the board as the principal factor in determining whether to approve the Sub-Advisory Agreement. The Independent Trustees were advised by separate independent legal counsel throughout the process.
369
PACE Select Advisors Trust
Board approvals of investment management and administration agreement and sub-advisory agreements (unaudited)
Background—At a meeting of the board of PACE Select Advisors Trust (the "Trust") on July 14-15, 2015, the members of the board, including the trustees who are not "interested persons," as defined in the Investment Company Act of 1940, as amended, of the Trust (the "Independent Trustees"), considered and approved the continuance of the investment management and administration agreement (the "Investment Management and Administration Agreement") between UBS Global Asset Management (Americas) Inc. ("UBS Global AM") and the Trust, on behalf of each series of the Trust (each a "Portfolio" and together the "Portfolios"), and, for those Portfolios with sub-advisors/sub-manager(s), the sub-advisory/sub-management agreements for the Portfolios. (Throughout this discussion, each sub-advisor/sub-manager(s) to a Portfolio is referred to as a "Sub-Advisor" and each sub-advisory/sub-management agreement is referred to as a "Sub-Advisory Agreement.") In preparing for the meeting, the board members had requested and received extensive information from UBS Global AM to assist them, including information about UBS Global AM and the Portfolios' Sub-Advisors, as well as the management, sub-advisory, administrative and distribution arrangements for the Portfolios. The Independent Trustees discussed the materials initially provided by management on several occasions prior to the scheduled board meeting. The Independent Trustees also met in executive session after management's presentation was completed to review the disclosure that had been made to them at the meeting. At these sessions the Independent Trustees were joined by their independent legal counsel. The Independent Trustees also received a memorandum from their independent legal counsel discussing the duties of board members in considering the approval of management, sub-advisory/sub-management, administration and distribution agreements.
In its consideration of the approval of the Investment Management and Administration Agreement and the Sub-Advisory Agreements, the board considered the following factors:
Nature, extent and quality of the services under the Investment Management and Administration Agreement and the Sub-Advisory Agreements—The board received and considered information regarding the nature, extent and quality of management services provided to the Portfolios by UBS Global AM and, for those Portfolios with Sub-Advisor(s), sub-advisory services provided by each Sub-Advisor during the past year. The board also considered the nature, extent and quality of administrative, distribution and shareholder services performed by UBS Global AM and its affiliates for the Portfolios and the resources devoted to, and the record of compliance with, each Portfolio's compliance policies and procedures. The board noted that it received information at regular meetings throughout the year regarding the services rendered by UBS Global AM concerning the management of each Portfolio's affairs and UBS Global AM's role in coordinating and overseeing providers of other services to the Portfolios. The board noted the complexity of this process for the Portfolios, given their broad range of investment strategies. The board noted that UBS Global AM provided extensive oversight of the Sub-Advisors for the Portfolios and reported to the board at each regular meeting on the Sub-Advisors' performance and compliance with applicable requirements and made recommendations with respect to Sub-Advisor changes (both in terms of the allocation of Portfolio assets to Sub-Advisors and their hiring and termination) from time to time based on the performance of the Sub-Advisors and other relevant factors. The board's evaluation of the services provided by UBS Global AM and the Sub-Advisors took into account the board's knowledge and familiarity gained as board members of funds in the UBS New York fund complex, including the scope and quality of UBS Global AM's investment management and other capabilities and the quality of its administrative and other services. The board observed that the scope of services provided by UBS Global AM had expanded over time as a result of regulatory and other developments, including (i) maintaining and monitoring its own and the Portfolios' expanded compliance programs and (ii) hiring and replacing Sub-Advisors, monitoring current Sub-Advisors (including adjusting their Portfolio asset allocations) and coordinating strategies among Sub-Advisors to continue to optimize the implementation and effectuation of the Portfolios' investment strategies. It also was noted that the Investment Management and Administration Agreement under consideration had been approved by shareholders at a special meeting of shareholders of the Trust held in 2008.
370
PACE Select Advisors Trust
Board approvals of investment management and administration agreement and sub-advisory agreements (unaudited)
The board had available to it the qualifications, backgrounds and responsibilities of the senior personnel at UBS Global AM responsible for the Portfolios and had previously met with and received information regarding the person(s) or portfolio management team from each Sub-Advisor primarily responsible for the day-to-day management of each Portfolio. The board recognized that the Portfolios' senior personnel at UBS Global AM report to the board regularly, and that at each regular meeting the board receives a detailed report from UBS Global AM on each Portfolio's performance and receives more extensive information periodically from each Sub-Advisor. The board also considered, based on its knowledge of UBS Global AM and its affiliates, the financial resources available to UBS Global AM and its parent organization, UBS Group AG. In that regard, the board received extensive financial information regarding UBS Global AM and noted that it was a wholly owned, indirect subsidiary of one of the largest financial services firms in the world. It also was noted that UBS Global AM had approximately $154 billion in assets under management as of March 31, 2015 and was part of the UBS Global Asset Management Division, which had approximately $680 billion in assets under management worldwide as of March 31, 2015. The board also was cognizant of, and considered, the regulatory and litigation actions and investigations occurring in the past few years involving UBS Group AG, UBS Global AM and certain of their affiliates.
The board concluded that, overall, it was satisfied with the nature, extent and quality of services provided (and expected to be provided) to the Portfolios under the Investment Management and Administration Agreement as well as under the Sub-Advisory Agreements.
Management and sub-advisory fees and expense ratios—For each Portfolio, the board reviewed and considered the contractual management fee (the "Contractual Management Fee") payable by the Portfolio to UBS Global AM in light of the nature, extent and quality of the services provided by UBS Global AM pursuant to the Investment Management and Administration Agreement. The board also reviewed and considered the fee waiver and/or expense reimbursement arrangements for each Portfolio (if any) and considered the actual fee rate (after taking any waivers and reimbursements into account) (the "Actual Management Fee") payable by the Portfolio. The board considered whether UBS Global AM had entered into one or more fee waiver and/or expense reimbursement agreements with a Portfolio under which UBS Global AM was contractually obligated to waive its management fees and/or reimburse the Portfolio so that the total ordinary operating expenses of certain or all classes of that Portfolio through November 30, 2015 (excluding dividend expense, borrowing costs, interest expense relating to short sales, expenses attributable to investment in other investment companies, interest, taxes, brokerage commissions and extraordinary expenses) would not exceed specified limits for each class (or, with respect to certain Portfolios, an agreement to waive a portion of its management fee). The board also considered that each Portfolio with such a fee waiver/reimbursement agreement had agreed to repay UBS Global AM for those waived fees and/or reimbursed expenses if the Portfolio can do so over the following three fiscal years without causing its expenses in any of those years to exceed the expense caps. Moreover, the board considered that, in addition to continuing to waive certain fees and/or reimbursing certain expenses as in past years, UBS Global AM also offered specific new waivers or expense caps for certain Portfolios as discussed below. Additionally, the board received and considered information comparing each Portfolio's Contractual Management Fee, Actual Management Fee and overall expenses with those of funds in a group of funds selected and provided by Lipper, an independent provider of investment company data (the "Expense Group"). The board also received from Lipper comparative data on a supplemental expense group of sub-advised peers (which may include certain of the sub-advised peers contained within the primary Expense Group) (the "Supplemental Expense Group"). A discussion of the board's considerations with respect to each Portfolio's fees is set forth below.
In connection with its consideration of each Portfolio's management fees, the board also received information on UBS Global AM's standard institutional account fees for accounts of a similar investment type to each of the Portfolios. The board noted management's explanation that comparisons with such accounts may be of limited relevance given the different structures and regulatory requirements of mutual funds, such as the Portfolios, versus those accounts and the differences in the levels of services required by the Portfolios and those accounts. The
371
PACE Select Advisors Trust
Board approvals of investment management and administration agreement and sub-advisory agreements (unaudited)
board also received information on fees charged to other mutual funds managed by UBS Global AM. The board observed that it had received certain information regarding fees, profitability, compensation from other similar funds, and economies of scale from certain Sub-Advisors as part of the summary of each Sub-Advisor's responses to requests for due diligence materials in connection with the board's annual reconsideration of the Sub-Advisory Agreements; however, the board also observed that the compensation paid to a Sub-Advisor is paid by UBS Global AM, not by the particular Portfolio, and, accordingly, that the retention of a Sub-Advisor generally does not increase the fees otherwise incurred by a Portfolio's shareholders (unless a management fee waiver level was affected by a sub-advisory fee increase or a reallocation of assets).
Portfolio performance—For each Portfolio, the board received and considered (a) annualized total return information of the Portfolio compared to other funds (the "Performance Universe") selected by Lipper over the one-, three-, five-, ten-year (or shorter for newer Portfolios) and since inception periods ended April 30, 2015, and (b) annualized performance information for each year in the ten-year (or shorter) period ended April 30, 2015. Although the board received information for the ten-year and since inception periods, in its analysis, it generally placed greater emphasis on the one-, three- and five-year periods. The board was provided with a description of the methodology Lipper used to determine the similarity of a Portfolio with the funds included in its Performance Universe. The board also received updated supplemental data showing each Portfolio's performance through May 31, 2015. The board also considered UBS Global AM's statement that while management believed that the Lipper peer groups were useful in evaluating Portfolio expenses relative to peers, they were less useful in evaluating performance, as in many cases they were broad-based and consisted of funds that did not necessarily have similar investment parameters to the applicable Portfolio. The board also noted that it had received information throughout the year at periodic intervals with respect to each Portfolio's performance, in most cases with respect to certain benchmark indices, including with respect to each Sub-Advisor's performance. Further discussion of the board's considerations with respect to each Portfolio's performance is set forth below.
Advisor profitability—The board received and considered a profitability analysis of UBS Global AM and its affiliates in providing services to each Portfolio. The board also received profitability information with respect to the UBS New York fund complex as a whole. UBS Global AM's profitability was considered not excessive in light of the nature, extent and quality of the services provided to the Portfolios. To the extent provided by a Sub-Advisor, the board also reviewed information with respect to the Sub-Advisor's profitability in providing services to a Portfolio. The board did not consider such Sub-Advisor profitability information highly relevant as the sub-advisory fees are paid by UBS Global AM, not by the relevant Portfolio.
Economies of scale—The board received and considered information from management regarding whether UBS Global AM realized economies of scale as the Portfolios' assets grew, whether the Portfolios have appropriately benefited from any economies of scale, and whether there is potential for realization of any further economies of scale for the Portfolios. The board considered whether economies of scale in the provision of services to the Portfolios were being passed along to the shareholders. The board noted that each Portfolio's Contractual Management Fee contained breakpoints, with the exception of PACE Money Market Investments. The board also noted that as of April 30, 2015, with the exception of PACE International Emerging Markets Equity Investments, PACE Global Real Estate Securities Investments and PACE High Yield Investments, for those Portfolios having breakpoints, each Portfolio's asset level exceeded at least its first breakpoint. Accordingly, the board determined that actual economies of scale existed for those Portfolios whose assets had reached the first breakpoint level and potential economies of scale existed for those Portfolios whose assets had not yet reached their first breakpoint level. The board also noted that to the extent a Portfolio's assets have increased over time, it has realized other economies of scale as certain expenses, such as fees for Trustees, auditor and legal fees and printing and postage, become a smaller percentage of overall assets. The board also took note of the relationship between any breakpoints in a sub-advisory fee and the breakpoints in fees paid by the Portfolios to UBS Global AM.
372
PACE Select Advisors Trust
Board approvals of investment management and administration agreement and sub-advisory agreements (unaudited)
Generally, in light of UBS Global AM's profitability data, the Actual Management Fees, the Contractual Management Fees, the breakpoints currently in place for the Portfolios and the current assets of the Portfolios, the board believed that UBS Global AM's sharing of potential and current economies of scale with the Portfolios was acceptable.
Other benefits to UBS Global AM and the Sub-Advisors—The board was informed by management that the Sub-Advisors' relationships with the Portfolios were limited to their provision of sub-advisory services to these Portfolios, and that therefore, management believed that the Sub-Advisors and their affiliates did not receive tangible ancillary benefits as a result of the Sub-Advisors' relationships with the Portfolios, with the exception of possible benefits from soft dollars (e.g., research credits related to transaction commissions) for the equity Portfolios (which also would potentially benefit such Portfolios) and possible limited benefits to certain affiliates of a Sub-Advisor, such as broker-dealers (e.g., an affiliate's execution of portfolio transactions subject to detailed restrictions in SEC rules and board oversight procedures). The board recognized that certain Sub-Advisors could receive intangible benefits from their association with the Trust, such as increased name recognition or publicity from being selected as Sub-Advisors to the Trust after an extensive review process. Similarly, a Portfolio could benefit from having a Sub-Advisor with an established or well-regarded reputation. In light of the costs of providing investment management, administrative and other services to the Portfolios and UBS Global AM's ongoing commitment to the Portfolios, the profits and other ancillary benefits that UBS Global AM and its affiliates received were considered reasonable.
In the discussions that follow, reference is made to the "median" in the Lipper Expense Group, Supplemental Expense Group and Lipper Performance Universe categories. With respect to fees or expenses, below median fees or expenses represent fees or expenses, respectively, that are lower relative to the median, and above median fees or expenses represent fees or expenses, respectively, that are higher relative to the median of the funds in the relevant Expense Group. With respect to performance, below median performance represents performance that is worse relative to the median, and above median performance represents performance that is better relative to the median of the funds in the relevant Performance Universe. Lipper information is calculated on a share class basis. References appearing below relate to Class A shares; the board also had information relevant to other share classes (e.g., Class P shares) during its considerations.
PACE Large Co Growth Equity Investments
In approving the Investment Management and Administration Agreement and the Sub-Advisory Agreements with each of Jackson Square Partners, LLC, J.P. Morgan Investment Management Inc. and Mar Vista Investment Partners, LLC, the board, including the Independent Trustees, also considered the following factors:
Portfolio performance—The comparative Lipper information showed that the Portfolio's performance was at the Performance Universe median for the three-year period and above the Performance Universe median for the five-year period, but that the Portfolio's performance was below the Performance Universe median for each of the one- and ten-year periods and since inception. Management explained that the majority of the Portfolio's underperformance over the one-year period, which also negatively impacted performance rankings for the other periods referenced above, stemmed from the underperformance of one of the Sub-Advisors due to higher momentum growth stocks facing headwinds over this time period. Management noted that the Sub-Advisor had outperformed by a wide margin in 2013 and that the Sub-Advisor's weight in the Portfolio was reduced towards the end of 2013 to lock in those gains. Management explained that, over the last three years, the Portfolio has taken less risk versus its peer group and that the Portfolio outperformed the peer group on a risk-adjusted basis for six of the nine last quarterly trailing one-year periods.
373
PACE Select Advisors Trust
Board approvals of investment management and administration agreement and sub-advisory agreements (unaudited)
Management and sub-advisory fees and expense ratios—The comparative Lipper information showed that the Portfolio's Contractual Management Fee, Actual Management Fee and total expenses were above the median in the Portfolio's Expense Group for the comparison periods utilized in the Lipper report. Management noted that the Portfolio's total expenses were within a few basis points (that is, hundredths of a percent) of the median. Management stated that, effective February 6, 2015, a voluntary fee waiver was implemented in connection with the board's approval of an asset allocation change amongst Sub-Advisors, which resulted in fee savings of approximately $100,000 that UBS Global AM passed through to the Portfolio in its entirety. Management stated that if this new fee waiver were reflected in the Portfolio's total expenses in the Lipper report, those expenses would be within one basis point (i.e., of 0.01%) of the Expense Group median. Management also noted that, compared to the Supplemental Expense Group, consisting of seven other sub-advised funds, the Portfolio's Contractual Management Fee and Actual Management Fee were more closely aligned with its peers, and the Portfolio's total expenses were below the median.
PACE Large Co Value Equity Investments
In approving the Investment Management and Administration Agreement and the Sub-Advisory Agreements with each of Los Angeles Capital Management and Equity Research, Inc. ("Los Angeles Capital"), Pzena Investment Management, LLC, River Road Asset Management, LLC and Robeco Investment Management, Inc., the board, including the Independent Trustees, also considered the following factors:
Portfolio performance—The comparative Lipper information showed that the Portfolio's performance was above the Performance Universe median for the one-, three-, five- and ten-year periods, but that the Portfolio's performance was one basis point (i.e., of 0.01%) below the median for the Performance Universe since inception.
Management and sub-advisory fees and expense ratios—The comparative Lipper information showed that the Portfolio's Contractual Management Fee, Actual Management Fee and total expenses were above the median in the Portfolio's Expense Group for the comparison periods utilized in the Lipper report. Management noted that, effective November 1, 2014, a voluntary fee waiver of one basis point (i.e., of 0.01%) was implemented, which was only minimally factored into the data presented in the Lipper report, that more closely aligns the Portfolio's total expenses to those of its peers. Management also noted that, compared to the Supplemental Expense Group, consisting of six other sub-advised funds, the Portfolio's Contractual Management Fee and Actual Management Fee were both at the respective medians.
PACE Small/Medium Co Growth Equity Investments
In approving the Investment Management and Administration Agreement and the Sub-Advisory Agreements with each of LMCG Investments, LLC ("LMCG"), Riverbridge Partners, LLC and Timpani Capital Management LLC, the board, including the Independent Trustees, also considered the following factors:
Portfolio performance—The comparative Lipper information showed that the Portfolio's performance was below the Performance Universe median for the three-, five- and ten-year periods and since inception, but that the Portfolio's performance was above the Performance Universe median for the one-year period.
Management and sub-advisory fees and expense ratios—The comparative Lipper information showed that the Portfolio's Contractual Management Fee, Actual Management Fee and total expenses were below the median in the Portfolio's Expense Group, as well as the Supplemental Expense Group, for the comparison periods utilized in the Lipper report.
374
PACE Select Advisors Trust
Board approvals of investment management and administration agreement and sub-advisory agreements (unaudited)
PACE Small/Medium Co Value Equity Investments
In approving the Investment Management and Administration Agreement and the Sub-Advisory Agreements with each of Kayne Anderson Rudnick Investment Management, LLC, Metropolitan West Capital Management, LLC and Systematic Financial Management, L.P., the board, including the Independent Trustees, also considered the following factors:
Portfolio performance—The comparative Lipper information showed that the Portfolio's performance was above the Performance Universe median for the one- and three-year periods, but that the Portfolio's performance was below the Performance Universe median for the five- and ten-year periods and since inception.
Management and sub-advisory fees and expense ratios—The comparative Lipper information showed that the Portfolio's Contractual Management Fee, Actual Management Fee and total expenses were below the median in the Portfolio's Expense Group, as well as the Supplemental Expense Group, for the comparison periods utilized in the Lipper report.
PACE International Equity Investments
In approving the Investment Management and Administration Agreement and the Sub-Advisory Agreements with each of Chautauqua Capital Management, LLC, Los Angeles Capital and Mondrian Investment Partners Limited ("Mondrian"), the board, including the Independent Trustees, also considered the following factors:
Portfolio performance—The comparative Lipper information showed that the Portfolio's performance was below the Performance Universe median for the one-, five- and ten-year periods and since inception, but that the Portfolio's performance was above the Performance Universe median for the three-year period. Management explained that a portion of the Portfolio's underperformance versus its peers was driven by poor stock selection in certain sectors. Management noted that over the one-year period the Portfolio outperformed its benchmark index on a gross basis and its relative performance was within 50 basis points (i.e., of 0.50%) of the median.
Management and sub-advisory fees and expense ratios—The comparative Lipper information showed that the Portfolio's Contractual Management Fee, Actual Management Fee and total expenses were above the median in the Portfolio's Expense Group for the comparison periods utilized in the Lipper report. Management noted that, compared to the Supplemental Expense Group, consisting of two other sub-advised funds, the Portfolio's Contractual Management Fee and total expenses were at the respective medians and the Portfolio's Actual Management Fee was below the median. Management also noted that the manager of one of the other sub-advised funds utilizes affiliated sub-advisors, which may result in that fund having lower overall expenses.
PACE International Emerging Markets Equity Investments
In approving the Investment Management and Administration Agreement and the Sub-Advisory Agreements with each of LMCG, Mondrian and William Blair & Company L.L.C., the board, including the Independent Trustees, also considered the following factors:
Portfolio performance—The comparative Lipper information showed that the Portfolio's performance was above the Performance Universe median for the one-year period and at the median for the five-year period, but that the Portfolio's performance for the three- and ten-year periods and since inception was below the Performance Universe median. Management noted that the Portfolio's performance ranked near or above the Performance Universe median for the trailing one-, three- and five-year periods.
375
PACE Select Advisors Trust
Board approvals of investment management and administration agreement and sub-advisory agreements (unaudited)
Management and sub-advisory fees and expense ratios—The comparative Lipper information showed that the Portfolio's Contractual Management Fee was at the median and its Actual Management Fee and total expenses were above the median in the Portfolio's Expense Group for the comparison periods utilized in the Lipper report. Management noted that part of the variance in the Portfolio's total expenses relative to the Expense Group median was attributable to custody fees, driven mainly by fees charged for the safekeeping of assets in local markets. Management explained that these sub-custody fees can vary widely based on the countries of the investments within the respective funds in the peer group (as evidenced by the wide range of fees across them), and that investments in less developed or frontier-type markets are more costly than investments in developing or developed countries. Management stated that it reviews sub-custody fees relative to the markets the Portfolio invests in on an annual basis and will seek to make changes to the "all in" basis point custody fee if warranted. Management also stated that it anticipates conducting a thorough review of custody fees for all Portfolios to ensure that the fees paid by the Portfolios are competitive and appropriate. Management also noted that there are two funds within the Supplemental Expense Group, consisting of six other sub-advised funds, that utilize affiliated sub-advisors and that if these two funds were excluded from the group, it would increase the Actual Management Fee and total expense medians to within a few basis points (that is, hundredths of a percentage point) of the Portfolio's Actual Management Fee and total expenses, respectively.
PACE Alternative Strategies Investments
In approving the Investment Management and Administration Agreement and the Sub-Advisory Agreements with each of Analytic Investors, LLC, AQR Capital Management, LLC, First Quadrant L.P., Sirios Capital Management, L.P. and Standard Life Investments (Corporate Funds) Limited, the board, including the Independent Trustees, also considered the following factors:
Portfolio performance—The comparative Lipper information showed that the Portfolio's performance was below the Performance Universe median for the one- and five-year periods and since inception, but the Portfolio's performance was above the Performance Universe median for the three-year period.
Management and sub-advisory fees and expense ratios—Management noted that, at the request of the board and UBS Global AM, Lipper applied additional criteria in compiling the Portfolio's Expense Group in order to select those peer funds whose investment objectives and general asset allocation were more similar to those of the Portfolio. The comparative Lipper information showed that the Portfolio's Contractual Management Fee, Actual Management Fee and total expenses were below the median in the Portfolio's Expense Group, as well as the Supplemental Expense Group, for the comparison periods utilized in the Lipper report.
PACE Global Real Estate Securities Investments
In approving the Investment Management and Administration Agreement and the Sub-Advisory Agreement with Brookfield Investment Management Inc., the board, including the Independent Trustees, also considered the following factors:
Portfolio performance—The comparative Lipper information showed that the Portfolio's performance was above the Performance Universe median for the one-, three- and five-year periods, but the Portfolio's performance was below the Performance Universe median since inception.
Management and sub-advisory fees and expense ratios—The comparative Lipper information showed that the Portfolio's Contractual Management Fee and Actual Management Fee were below the median and its total expenses were above the median in the Portfolio's Expense Group for the comparison periods utilized in the Lipper
376
PACE Select Advisors Trust
Board approvals of investment management and administration agreement and sub-advisory agreements (unaudited)
report. Management noted that the Portfolio's total expenses were within a few basis points (that is, hundredths of a percentage point) of the median of the Supplemental Expense Group, consisting of three other sub-advised funds. Management further noted that the Portfolio's Contractual Management Fee and Actual Management Fee were well below the respective medians of the Expense Group and Supplemental Expense Group. Management explained that the Portfolio's high transfer agent fees are the main driver of the Portfolio's higher total expenses, which are a result of the very small average shareholder account sizes within the Portfolio.
PACE Mortgage-Backed Securities Fixed Income Investments
In approving the Investment Management and Administration Agreement and the Sub-Advisory Agreement with Pacific Investment Management Company LLC ("PIMCO"), the board, including the Independent Trustees, also considered the following factors:
Portfolio performance—The comparative Lipper information showed that the Portfolio's performance was below the Performance Universe median for the one-, three- and five-year periods and above the median for the ten-year period and since inception. Management observed that the Portfolio tends to invest in higher-rated securities than its peer funds due to historic and current investment guidelines. Management stated that prior to September 2013 the Portfolio was restricted to investing only in investment grade securities and, since that time, the Portfolio is permitted to invest up to 5% of its assets in non-investment grade securities. Management stated that since the financial crisis mortgage-backed securities funds generally have added value by owning non-agency mortgage-backed securities, the majority of which are non-investment grade. Management also stated that any exposure to non-investment grade securities would have benefited the Portfolio's relative performance as spreads have narrowed considerably on all higher-yielding securities. Management explained that, until September 2013, the Portfolio could not invest in such securities and that, even after the change, the Portfolio's 5% limitation on investing in non-investment securities places the Portfolio at a disadvantage versus its peers during periods when lower grade, higher-yielding investments outperform.
Management and sub-advisory fees and expense ratios—The comparative Lipper information showed that the Portfolio's Contractual Management Fee and total expenses were above the median (with the Portfolio's Contractual Management Fee and total expenses the highest in the Expense Group) and its Actual Management Fee was below the median in the Portfolio's Expense Group for the comparison periods utilized in the Lipper report. Management stated that, while the Portfolio's Contractual Management Fee was above the median, its Actual Management Fee was below the median of the Expense Group. Management explained that the Portfolio's total expenses, although above the median, were reasonably close to the Expense Group median (within two basis points—i.e., 0.02%). Management also noted that, compared to the Supplemental Expense Group, consisting of two other sub-advised funds, both of which utilize affiliated sub-advisors, the Portfolio's Actual Management Fee was at the median.
PACE High Yield Investments
In approving the Investment Management and Administration Agreement and the Sub-Advisory Agreements with each of Nomura Corporate Research and Asset Management Inc. ("NCRAM") and Nomura Asset Management Singapore Limited (the later being a sub-manager to NCRAM for Asia), the board, including the Independent Trustees, also considered the following factors:
Portfolio performance—The comparative Lipper information showed that the Portfolio's performance was below the Performance Universe median for the one-, three- and five-year periods but above the median since inception. Management noted that at the May 2015 board meeting, the board approved replacing the Portfolio's former sub-
377
PACE Select Advisors Trust
Board approvals of investment management and administration agreement and sub-advisory agreements (unaudited)
advisor with NCRAM and its sub-manager, which management expects to be beneficial to the Portfolio's performance going forward. The transition to the new Sub-Advisors occurred on July 1, 2015.
Management and sub-advisory fees and expense ratios—Management noted that, at the request of the board and UBS Global AM, Lipper applied additional criteria in compiling the Portfolio's Expense Group in order to select those peer funds whose investment objectives and general asset allocation were more similar to those of the Portfolio. The comparative Lipper information showed that the Portfolio's Contractual Management Fee, Actual Management Fee and total expenses were above the median in the Portfolio's Expense Group (with the Portfolio's total expenses the highest in the Expense Group) for the comparison periods utilized in the Lipper report. Management noted that, effective July 1, 2015, a voluntary fee waiver of 7.5 basis points was implemented in connection with the board's approval of replacing the Portfolio's former sub-advisor, which is expected to result in lower total expenses. In addition, as a result of discussions with the board prior to the meeting, management proposed a fee waiver of ten basis points (i.e., 0.10%) effective August 1, 2015 for a set time period. Management stated that the new waiver will bring the Portfolio's Actual Management Fee within approximately two basis points (i.e., 0.02%) of the Expense Group median and approximately four basis points (i.e., 0.04%) below the median of the Supplemental Expense Group, consisting of eight other sub-advised funds. In addition, the new waiver will bring the Portfolio's total expenses within approximately six basis points (i.e., 0.06%) and four basis points (i.e., 0.04%) of the medians of the Expense Group and Supplemental Expense Group, respectively. Management also proposed to waive the right to recoup any amounts currently allowable within the terms and conditions of the expense cap agreement in place for the Portfolio.
PACE Intermediate Fixed Income Investments
In approving the Investment Management and Administration Agreement and the Sub-Advisory Agreement with Babson Capital Management LLC and BlackRock Financial Management, Inc., the board, including the Independent Trustees, also considered the following factors:
Portfolio performance—The comparative Lipper information showed that the Portfolio's performance was below the Performance Universe median for the one-, three-, five- and ten-year periods and since inception. Management noted that the duration of the Portfolio is approximately two years shorter than that of the peer funds in the Performance Universe. Management explained that a short duration manager was added as a Sub-Advisor to the Portfolio in June 2014 in anticipation of higher interest rates. Management explained that as yields have fallen, particularly in longer-dated US Treasury securities, the Portfolio has produced lower returns versus longer-duration peers over the one-, three- and five-year periods. Management stated that the Portfolio's ranking has improved as interest rates have risen due to its shorter duration (i.e., lower interest rate sensitivity) relative to its peers.
Management and sub-advisory fees and expense ratios—The comparative Lipper information showed that the Portfolio's Contractual Management Fee and total expenses were above the median and its Actual Management Fee was below the median in the Portfolio's Expense Group for the comparison periods utilized in the Lipper report. Management noted that the Portfolio's total expenses, although above the median, were reasonably close to the Expense Group median (within four basis points—i.e., 0.04%).
PACE International Fixed Income Investments
In approving the Investment Management and Administration Agreement and the Sub-Advisory Agreement with Rogge Global Partners plc, the board, including the Independent Trustees, also considered the following factors:
Portfolio performance—The comparative Lipper information showed that the Portfolio's performance was below the Performance Universe median for the three-, five- and ten-year periods and since inception, but above the
378
PACE Select Advisors Trust
Board approvals of investment management and administration agreement and sub-advisory agreements (unaudited)
Performance Universe median for the one-year period. Management explained that the Portfolio's relative performance has improved since the Portfolio's secondary benchmark index was changed to an index that is half-hedged to the US dollar on July 1, 2013. Management stated that since that time the US dollar has appreciated and the Portfolio's overall performance has been strong. Management noted that the Portfolio outperformed its primary (unhedged) benchmark by approximately 800 basis points (i.e., 8.00%) for the one-year period.
Management and sub-advisory fees and expense ratios—Management noted that, at the request of the board and UBS Global AM, Lipper applied additional criteria in compiling the Portfolio's Expense Group in order to select those peer funds whose investment objectives and general asset allocation were more similar to those of the Portfolio. The comparative Lipper information showed that the Portfolio's Contractual Management Fee, Actual Management Fee and total expenses were above the median in the Portfolio's Expense Group for the comparison periods utilized in the Lipper report. Management stated that the peer group expense analysis continued to be problematic, noting that the Portfolio's high transfer agent fees are the main driver of the Portfolio's higher total expenses and that such expenses are a result of the average Shareholder account sizes with the Portfolio. Management noted that the Lipper International Fixed Income category is very broad, which makes it difficult to select a pure set of peers to properly compare the Portfolio's performance, fees and expenses. As a result of discussions with the board prior to the meeting, management proposed a voluntary fee waiver of ten basis points (0.10%) effective August 1, 2015 for a set time period. Management stated that, as a result of the new waiver, the Portfolio's Actual Management Fee would be approximately 11 basis points (i.e., 0.11%) below the Expense Group median, and the Portfolio's total expenses would be at the Expense Group median. Management also proposed to waive the right to recoup any amounts currently allowable within the terms and conditions of the expense cap agreement in place for the Portfolio.
PACE Municipal Fixed Income Investments
In approving the Investment Management and Administration Agreement and the Sub-Advisory Agreement with Standish Mellon Asset Management Company LLC, the board, including the Independent Trustees, also considered the following factors:
Portfolio performance—The comparative Lipper information showed that the Portfolio's performance was below the Performance Universe median for the one-, three-, five- and ten-year periods and since inception. Management stated that the Portfolio is a higher quality municipal fund in a Performance Universe of peer funds that hold lower quality investments, including sub-investment grade debt. Management explained that lower quality issuance has generally outperformed in recent years, which has lowered the Portfolio's ranking, but noted that on a risk-adjusted basis the Portfolio has outperformed the median over five of the seven last quarterly periods.
Management and sub-advisory fees and expense ratios—The comparative Lipper information showed that the Portfolio's Contractual Management Fee, Actual Management Fee and total expenses were above the median in the Portfolio's Expense Group for the comparison periods utilized in the Lipper report. Management explained that it appears that other funds in the Expense Group have large fee waivers in place. Management noted that when comparing the Portfolio's Contractual Management Fee, Actual Management Fee and total expenses to the Supplemental Expense Group, consisting of six funds of which three funds use affiliated sub-advisors and do not pay a sub-advisor fee, the Portfolio is more in line with the medians. As a result of discussions with the board prior to the meeting, management proposed a voluntary fee waiver of five basis points (0.05%) effective August 1, 2015 for a set time period. Management stated that the new waiver will bring the Portfolio's Actual Management Fee within five basis points (i.e., 0.05%) of the Expense Group median and approximately four basis points (i.e., 0.04%) below the Supplemental Expense Group median, and the Portfolio's total expenses will be in line with the medians of both the Expense Group and Supplemental Expense Group. Management also proposed to waive the
379
PACE Select Advisors Trust
Board approvals of investment management and administration agreement and sub-advisory agreements (unaudited)
right to recoup any amounts currently allowable within the terms and conditions of the expense cap agreement in place for the Portfolio.
PACE Strategic Fixed Income Investments
In approving the Investment Management and Administration Agreement and the Sub-Advisory Agreement with PIMCO and Neuberger Berman Fixed Income LLC, the board, including the Independent Trustees, also considered the following factors:
Portfolio performance—The comparative Lipper information showed that the Portfolio's performance was above the Performance Universe median for the one-, five- and ten-year periods and since inception, but below the Performance Universe median for the three-year period. Management noted that in January 2015 the Portfolio added a new Sub-Advisor that applies a more dynamic and flexible approach, particularly with respect to sector rotation, which is expected to complement and diversify away from the other Sub-Advisor's more long-term investment style and to aid the Portfolio should volatile markets arise.
Management and sub-advisory fees and expense ratios—Management noted that, at the request of the board and UBS Global AM, Lipper applied additional criteria in compiling the Portfolio's Expense Group in order to select those peer funds whose investment objectives and general asset allocation were more similar to those of the Portfolio. The comparative Lipper information showed that the Portfolio's Contractual Management Fee, Actual Management Fee and total expenses were above the median in the Portfolio's Expense Group for the comparison periods utilized in the Lipper report. Management noted that the Lipper Core Plus Bond category has a particularly low actual management fee median and that some peer funds have large fee waivers in place due to their smaller size. Management also noted that, compared to the Supplemental Expense Group, consisting of three other sub-advised funds, the Portfolio's Contractual Management Fee and Actual Management Fee were below the respective medians. Management stated that the Portfolio is more dynamic and flexible in its investment approach than the other funds in the Expense Group and that such an approach generally correlates with higher management fees. As a result of discussions with the board prior to the meeting, management proposed a voluntary fee waiver of seven basis points (0.07%) effective August 1, 2015 for a set time period. Management stated that the new waiver would bring the Portfolio's expenses within approximately seven basis points (i.e., 0.07%) of the Supplemental Expense Group median, and the Portfolio's Actual Management Fee would be well below the Supplemental Expense Group median. In addition to the new fee waiver, management also proposed to waive the right to recoup any amounts currently allowable within the terms and conditions of the expense cap agreement in place for the Portfolio.
PACE Money Market Investments
In approving the Investment Management and Administration Agreement, the board, including the Independent Trustees, also considered the following factors:
Portfolio performance—The comparative Lipper information showed that the Portfolio's performance was at or above the Performance Universe median for the one-, three-, five- and ten-year periods and since inception.
Management fees and expense ratios—The comparative Lipper information showed that the Portfolio's Contractual Management Fee and total expenses were below the median and its Actual Management Fee was at the median in the Portfolio's Expense Group for the comparison periods utilized in the Lipper report.
380
PACE Select Advisors Trust
Board approvals of investment management and administration agreement and sub-advisory agreements (unaudited)
Conclusion
Based on its review and, in certain instances, management's explanations upon further questioning, the board concluded that each Portfolio's investment performance was satisfactory or acceptable and that each management fee and sub-advisory fee, as proposed by management after questions and/or suggestions posed by the board, was reasonable in light of the nature, extent and quality of the services provided to the Portfolio under the applicable Investment Management and Administration Agreement and Sub-Advisory Agreement or Sub-Advisory Agreements, respectively. However, there were certain Portfolios that the board determined to continue to closely monitor over the next year.
In light of all of the foregoing, the board approved the Investment Management and Administration Agreement for each Portfolio and, for those Portfolios with Sub-Advisors, the Sub-Advisory Agreement(s). No single factor reviewed by the board was identified by the board as the principal factor in determining whether to approve the Investment Management and Administration Agreement or, for the sub-advised Portfolios, the Sub-Advisory Agreement(s). The Independent Trustees were advised by separate independent legal counsel throughout the process. The board discussed the proposed continuance of the Investment Management and Administration Agreement and the Sub-Advisory Agreements in private sessions with their independent legal counsel at which no representatives of UBS Global AM or the Sub-Advisors were present.
381
PACE Select Advisors Trust
Supplemental information (unaudited)
Board of Trustees & Officers
The Trust is governed by a Board of Trustees which oversees the Portfolios' operations. Each Trustee serves an indefinite term of office. Officers are appointed by the trustees and serve at the pleasure of the Board. The table below shows, for each trustee and officer, his or her name, address and age, the position held with the Trust, the length of time served as a trustee or officer of the Trust, the trustee's or officer's principal occupations during the last five years, the number of portfolios in the UBS fund complex overseen by the trustee or for which a person served as an officer, and other directorships held by the trustee.
The Trust's Statement of Additional Information contains additional information about the trustees and is available, without charge, upon request by calling 1-800-647 1568.
Interested Trustees:
Name,
address,
and age | | Position(s)
held with
Trust | | Term of office1
and length of
time served | | Principal
occupation(s)
during past
5 years | | Number of
portfolios in fund
complex overseen
by trustee | | Other
directorships
held by
trustee | |
Meyer Feldberg2; 73
Morgan Stanley
1585 Broadway
36th Floor
New York, NY
10036 | | Trustee | | Since 2001 | | Professor Feldberg is Dean Emeritus and Professor of Leadership and Ethics at Columbia Business School, although on an extended leave of absence. He is also a senior advisor to Morgan Stanley (financial services) (since 2005). Professor Feldberg also serves as president of New York City Global Partners (an organization located in part of the Office of the Mayor of the City of New York that promotes interaction with other cities around the world) (2007-2014). Prior to 2004, he was Dean and Professor of Management and Ethics of the Graduate School of Business at Columbia University (since 1989). | | Professor Feldberg is a director or trustee of 18 investment companies (consisting of 50 portfolios) for which UBS Global AM or one of its affiliates serves as investment advisor or manager. | | Professor Feldberg is also a director of Macy's, Inc. (operator of department stores), Revlon, Inc. (cosmetics), and the New York City Ballet. | |
382
PACE Select Advisors Trust
Supplemental information (unaudited)
Name,
address,
and age | | Position(s)
held with
Trust | | Term of office1
and length of
time served | | Principal
occupation(s)
during past
5 years | | Number of
portfolios in fund
complex overseen
by trustee | | Other
directorships
held by
trustee | |
Richard Q. Armstrong; 80
c/o Keith Weller
Assistant Fund Secretary
UBS Global Asset Management (Americas) Inc.
1285 Avenue of the Americas
New York, NY 10019 | | Trustee and Chairman of the Board of Trustees | | Since 2001 (Trustee) Since 2004 (Chairman of the Board of Trustees) | | Mr. Armstrong is chairman and principal of R.Q.A. Enterprises (management consulting firm) (since 1991 and principal occupation since 1995). Mr. Armstrong was president or chairman of a number of packaged goods companies (responsible for such brands as Canada Dry, Dr. Pepper, Adirondack Beverages and Moët Hennessy, among many others) (from 1982 until 1995). | | Mr. Armstrong is a director or trustee of 10 investment companies (consisting of 42 portfolios) for which UBS Global AM serves as investment advisor or manager. | | None | |
Alan S. Bernikow;
74
207 Benedict Ave.
Staten Island, NY
10314 | | Trustee | | Since 2005 | | Mr. Bernikow is retired. He was a consultant on non-management matters for the firm of Deloitte & Touche (international accounting and consulting firm) (from 2003 to 2007). Previously, he was deputy chief executive officer at Deloitte & Touche. | | Mr. Bernikow is a director or trustee of 10 investment companies (consisting of 42 portfolios) for which UBS Global AM serves as investment advisor or manager. | | Mr. Bernikow is also a director of Revlon, Inc. (cosmetics) (and serves as the chair of its audit committee and as the chair of its compensation committee), a director of Mack-Cali Realty Corporation (real estate investment trust) (and serves as the chair of its audit committee); and a director of the Destination XL Group, Inc. (menswear) (and serves as a member of its nominating and corporate governance committee). He is also a director of Florida Community Bank, N.A. (and serves as the chair of its audit committee). | |
383
PACE Select Advisors Trust
Supplemental information (unaudited)
Independent Trustees (continued):
Name,
address,
and age | | Position(s)
held with
Trust | | Term of office1
and length of
time served | | Principal
occupation(s)
during past
5 years | | Number of
portfolios in fund
complex overseen
by trustee | | Other
directorships
held by
trustee | |
Richard R. Burt; 68
McLarty Associates
900 17th Street
Washington, D.C.
20006 | | Trustee | | Since 2001 | | Mr. Burt is a managing director to McLarty Associates (a consulting firm) with which he has been employed since 2007. He was chairman of IEP Advisors (international investments and consulting firm) until 2009. Prior to 2007, he was chairman of Diligence Inc. (information and risk management firm). | | Mr. Burt is a director or trustee of 10 investment companies (consisting of 42 portfolios) for which UBS Global AM serves as investment advisor or manager. | | Mr. Burt is also a director of Central Europe & Russia Fund, Inc., European Equity Fund, Inc. and The New Germany Fund, Inc. (and serves as a member of each such fund's audit, nominating and governance committees). | |
Bernard H. Garil; 75
6754 Casa Grande Way
Delray Beach, FL
33446 | | Trustee | | Since 2005 | | Mr. Garil is retired (since 2001). He was a managing director at PIMCO Advisory Services (from 1999 to 2001) where he served as president of closed-end funds and vice-president of the variable insurance product funds advised by OpCap Advisors (until 2001). | | Mr. Garil is a director or trustee of 10 investment companies (consisting of 42 portfolios) for which UBS Global AM serves as investment advisor or manager. | | Mr. Garil is also a director of OFI Global Trust Company (commercial trust company), The Leukemia and Lymphoma Society (voluntary health organization) and a trustee for the Brooklyn College Foundation, Inc. (charitable foundation). | |
Heather R. Higgins; 55
c/o Keith A. Weller
Assistant Fund Secretary
UBS Global Asset Management (Americas) Inc.
1285 Avenue of the Americas
New York, NY 10019 | | Trustee | | Since 2005 | | Ms. Higgins is the president and director of The Randolph Foundation (charitable foundation) (since 1991). Ms. Higgins also serves (or had served) on the boards of several non-profit charitable groups, including the Independent Women's Forum (chairman) and the Philanthropy Roundtable (vice chairman). She also serves on the board of the Hoover Institution (from 2001 to 2007 and since 2009). | | Ms. Higgins is a director or trustee of 10 investment companies (consisting of 42 portfolios) for which UBS Global AM serves as investment advisor or manager. | | None | |
384
PACE Select Advisors Trust
Supplemental information (unaudited)
Independent Trustees (concluded):
Name,
address,
and age | | Position(s)
held with
Trust | | Term of office1
and length of
time served | | Principal
occupation(s)
during past
5 years | | Number of
portfolios in fund
complex overseen
by trustee | | Other
directorships
held by
trustee | |
David Malpass*; 59
Encima Global, LLC
645 Madison Avenue,
5th Floor,
New York, NY 10022 | | Trustee | | Since 2014 | | Mr. Malpass is the president and founder of Encima Global, LLC (economic research and consulting) (since 2008). From 1993 until 2008, he was Chief Economist and Senior Managing Director of Bear, Stearns & Co. (financial services firm). | | Mr. Malpass is a director or trustee of 10 investment companies (consisting of 42 portfolios) for which UBS Global AM serves as investment advisor or manager. | | Mr. Malpass is also a director of New Mountain Finance Corp. (business development company and serves as a member of its audit committee). | |
385
PACE Select Advisors Trust
Supplemental information (unaudited)
Name,
address,
and age | | Position(s)
held with
Trust | | Term of office1
and length of
time served | | Principal occupation(s) during past 5 years;
number of portfolios in fund complex
for which person serves as officer | |
Joseph Allessie*; 50 | | Vice President, Assistant Secretary and Chief Compliance Officer | | Since 2005 (Vice President and Assistant Secretary) Since July 2014 (Chief Compliance Officer) | | Mr. Allessie is a managing director (since 2015) (prior to which he was an executive director) at UBS Global AM—Americas region. Mr. Allessie is head of compliance and operational risk control for the UBS Global Asset Management Division in the Americas with oversight for traditional and alternative investment businesses in Canada, the US and Cayman Islands. Prior to that he served as deputy general counsel (from 2005 to 2014). Mr. Allessie is a vice president, assistant secretary and chief compliance officer (prior to which he was interim chief compliance officer) (from January to July 2014) of 14 investment companies (consisting of 73 portfolios) for which UBS Global AM serves as investment advisor or manager. | |
Rose Ann Bubloski*; 47 | | Vice President and Assistant Treasurer | | Since 2011 | | Ms. Bubloski is a director (since 2012) (prior to which she was an associate director) and senior manager of the US mutual fund treasury administration department of UBS Global AM—Americas region. She is vice president and assistant treasurer of 14 investment companies (consisting of 73 portfolios) for which UBS Global AM serves as investment advisor or manager. | |
Mark E. Carver*; 51 | | President | | Since 2010 | | Mr. Carver is a managing director and Head of Product Development and Management-Americas for UBS Global AM—Americas region (since 2008). In this role, he oversees product development and management for both wholesale and institutional businesses. He is a member of the Americas Management Committee (since 2008) and the Regional Operating Committee (since 2008). Prior to 2008, Mr. Carver held a number of product-related or sales responsibilities with respect to funds, advisory programs and separately managed accounts. Mr. Carver joined a predecessor of an affiliated firm in 1985 and has been with UBS Global AM—Americas region (or its affiliates) since 1996. Mr. Carver is president of 14 investment companies (consisting of 73 portfolios) for which UBS Global AM serves as investment advisor or manager. | |
Thomas Disbrow*; 49 | | Vice President and Treasurer | | Since 2000
(Vice President)
Since 2004
(Treasurer) | | Mr. Disbrow is a managing director (since 2011) (prior to which he was an executive director) (since 2007) and head of North America Fund Treasury (since 2011) of UBS Global AM—Americas region. Mr. Disbrow is a vice president and treasurer and/or principal accounting officer of 14 investment companies (consisting of 73 portfolios) for which UBS Global AM serves as investment advisor or manager. | |
Christopher S. Ha*; 35 | | Vice President and Assistant Secretary | | Since 2012 | | Mr. Ha is a director and associate general counsel (since September 2012) at UBS Global AM—Americas region. Prior to joining UBS Global AM—Americas region, Mr. Ha was of counsel at Buhler, Duggal & Henry LLP (law firm) (from March 2012 to July 2012) and an associate attorney at Dechert LLP (law firm) (from 2007 to 2009). Mr. Ha is a vice president and assistant secretary of 14 investment companies (consisting of 73 portfolios) for which UBS Global AM serves as investment advisor or manager. | |
386
PACE Select Advisors Trust
Supplemental information (unaudited)
Name,
address,
and age | | Position(s)
held with
Trust | | Term of office1
and length of
time served | | Principal occupation(s) during past 5 years;
number of portfolios in fund complex
for which person serves as officer | |
Mark F. Kemper**; 57 | | Vice President and Secretary | | Since 2004 | | Mr. Kemper is a managing director (since 2006) and head of the legal department of UBS Global AM—Americas region (since 2004). He has been secretary of UBS Global AM—Americas region (since 2004), and assistant secretary of UBS Global Asset Management Trust Company (since 1993). Mr. Kemper is vice president and secretary of 14 investment companies (consisting of 73 portfolios) for which UBS Global AM serves as investment advisor or manager. | |
Joanne M. Kilkeary*; 47 | | Vice President and Assistant Treasurer | | Since 1999 | | Ms. Kilkeary is an executive director (since March 2013) (prior to which she was a director) (since 2008) and a senior manager (since 2004) of the US mutual fund treasury administration department of UBS Global AM—Americas region. Ms. Kilkeary is a vice president and assistant treasurer of 14 investment companies (consisting of 73 portfolios) for which UBS Global AM serves as investment advisor or manager. | |
Cindy Lee*; 40 | | Vice President and Assistant Treasurer | | Since November 2014 | | Ms. Lee is an associate director (since 2009) prior to which she was a fund treasury manager (from 2007 to 2009) of the US mutual fund treasury administration department of UBS Global AM—Americas region. Ms. Lee is a vice president and assistant treasurer of 14 investment companies (consisting of 73 portfolios) for which UBS Global AM serves as investment advisor or manager. | |
Tammie Lee*; 44 | | Vice President and Assistant Secretary | | Since 2005 | | Ms. Lee is an executive director (since 2010) (prior to which she was a director) and associate general counsel of UBS Global AM—Americas region (since 2005). Ms. Lee is a vice president and assistant secretary of 14 investment companies (consisting of 73 portfolios) for which UBS Global AM serves as investment advisor or manager. | |
Nancy D. Osborn*; 49 | | Vice President and Assistant Treasurer | | Since 2007 | | Mrs. Osborn is a director (since 2010) (prior to which she was an associate director) and a senior manager of the US mutual fund treasury administration department of UBS Global AM—Americas region (since 2006). Mrs. Osborn is a vice president and assistant treasurer of 14 investment companies (consisting of 73 portfolios) for which UBS Global AM serves as investment advisor or manager. | |
Robert Sabatino**; 41 | | Vice President | | Since 2001 | | Mr. Sabatino is a managing director (since 2010) (prior to which he was an executive director) (since 2007), head of US taxable money markets (since 2009), and portfolio manager of UBS Global AM—Americas region in the short duration fixed income group (since 2001). Mr. Sabatino is a vice president of six investment companies (consisting of 36 portfolios) for which UBS Global AM serves as investment advisor or manager. | |
Eric Sanders*; 49 | | Vice President and Assistant Secretary | | Since 2005 | | Mr. Sanders is a director and associate general counsel of UBS Global AM—Americas region (since 2005). Mr. Sanders is a vice president and assistant secretary of 14 investment companies (consisting of 73 portfolios) for which UBS Global AM serves as investment advisor or manager. | |
387
PACE Select Advisors Trust
Supplemental information (unaudited)
Name,
address,
and age | | Position(s)
held with
Trust | | Term of office1
and length of
time served | | Principal occupation(s) during past 5 years;
number of portfolios in fund complex
for which person serves as officer | |
Andrew Shoup*; 59 | | Vice President and Chief Operating Officer | | Since 2006 | | Mr. Shoup is a managing director and global head of the treasury administration department of UBS Global AM—Americas region (since 2006). Mr. Shoup is also a director of UBS (IRL) Fund p.l.c. (since 2008). Mr. Shoup is a vice president and chief operating officer of 14 investment companies (consisting of 73 portfolios) for which UBS Global AM serves as investment advisor or manager. | |
Keith A. Weller*; 54 | | Vice President and Assistant Secretary | | Since 2000 | | Mr. Weller is an executive director and senior associate general counsel of UBS Global AM—Americas region (since 2005) and has been an attorney with affiliated entities since 1995. Mr. Weller is a vice president and assistant secretary of 14 investment companies (consisting of 73 portfolios) for which UBS Global AM serves as investment advisor or manager. | |
Mandy Yu*; 31 | | Vice President | | Since February 2013 | | Ms. Yu is an authorized officer (since 2012) and tax compliance manager (since March 2013) of the US mutual fund treasury administration department of UBS Global AM—Americas region. She was a Fund Treasury Manager (from 2012 to March 2013) and a Mutual Fund Administrator (from 2007 to 2012) for UBS Global AM—Americas region. Ms. Yu is a vice president of 14 investment companies (consisting of 73 portfolios) for which UBS Global AM serves as investment advisor or manager. | |
1 Each trustee holds office for an indefinite term. Officers are appointed by the trustees and serve at the pleasure of the Board.
2 Professor Feldberg is deemed an "interested person" of the Trust as defined in the Investment Company Act of 1940, as amended, because he is a senior advisor to Morgan Stanley, a financial services firm with which the Trust may conduct transactions.
* This person's business address is 1285 Avenue of the Americas, New York, New York 10019-6028.
** This person's business address is One North Wacker Drive, Chicago, Illinois 60606.
388
Trustees
Richard Q. Armstrong
Chairman
Alan S. Bernikow
Richard R. Burt | | Meyer Feldberg
Bernard H. Garil
Heather R. Higgins
David Malpass | |
Principal Officers
Mark E. Carver
President | | Thomas Disbrow
Vice President and Treasurer | |
Mark F. Kemper
Vice President and Secretary | | | |
Investment Manager and
Administrator
UBS Global Asset Management (Americas) Inc.
1285 Avenue of the Americas
New York, New York 10019-6028
Principal Underwriter
UBS Global Asset Management (US) Inc.
1285 Avenue of the Americas
New York, New York 10019-6028
This report is not to be used in connection with the offering of shares of the Portfolios unless accompanied or preceded by an effective prospectus.
© UBS 2015. All rights reserved.
UBS Global Asset Management (Americas) Inc.
PRESORTED
STANDARD
U.S. POSTAGE
PAID
COMPUTERSHARE

UBS Global Asset Management (Americas) Inc.
1285 Avenue of the Americas
New York, NY 10019-6028
Item 2. Code of Ethics.
The registrant has adopted a code of ethics that applies to its principal executive officer, principal financial officer, principal accounting officer or controller, or persons performing similar functions pursuant to Section 406 of the Sarbanes-Oxley Act of 2002. (The registrant has designated the code of ethics adopted pursuant to Sarbanes-Oxley as a “Code of Conduct” to lessen the risk of confusion with its separate code of ethics adopted pursuant to Rule 17j-1 under the Investment Company Act of 1940, as amended.)
Item 3. Audit Committee Financial Expert.
The registrant’s Board has determined that the following person serving on the registrant’s Audit Committee is an “audit committee financial expert” as defined in item 3 of Form N-CSR: Alan S. Bernikow. Mr. Bernikow is independent as defined in item 3 of Form N-CSR.
Item 4. Principal Accountant Fees and Services.
(a) Audit Fees:
For the fiscal years ended July 31, 2015 and July 31, 2014, the aggregate Ernst & Young LLP (EY) audit fees for professional services rendered to the registrant were approximately $977,940 and $989,940, respectively.
Fees included in the audit fees category are those associated with the annual audits of financial statements and services that are normally provided in connection with statutory and regulatory filings.
(b) Audit-Related Fees:
In each of the fiscal years ended July 31, 2015 and July 31, 2014, the aggregate audit-related fees billed by EY for services rendered to the registrant that are reasonably related to the performance of the audits of the financial statements, but not reported as audit fees, were approximately $44,150 and $66,505, respectively.
Fees included in the audit-related fees category are those associated with (1) the reading and providing of comments on the 2015 and 2014 semiannual financial statements and (2) review of the consolidated 2013 report on the profitability of the UBS Funds to UBS Global Asset Management (Americas) Inc. and its affiliates to assist the board members in their annual advisory/administration contract and service/distribution plan reviews.
There were no audit-related fees required to be approved pursuant to paragraph (c)(7)(ii) of Rule 2-01 of Regulation S-X during the fiscal years indicated above.
(c) Tax Fees:
In each of the fiscal years ended July 31, 2015 and July 31, 2014, the aggregate tax fees billed by EY for professional services rendered to the registrant were approximately $358,813 and $312,822, respectively.
Fees included in the tax fees category comprise all services performed by professional staff in the independent accountant’s tax division except those services related to the audits. This category comprises fees for review of tax compliance, tax return preparation and excise tax calculations.
There were no tax fees required to be approved pursuant to paragraph (c)(7)(ii) of Rule 2-01 of Regulation S-X during the fiscal years indicated above.
(d) All Other Fees:
In each of the fiscal years ended July 31, 2015 and July 31, 2014, there were no fees billed by EY for products and services, other than the services reported in Item 4(a)-(c) above, rendered to the registrant.
Fees included in the all other fees category would consist of services related to internal control reviews, strategy and other consulting, financial information systems design and implementation, consulting on other information systems, and other tax services unrelated to the registrant.
There were no “all other fees” required to be approved pursuant to paragraph (c)(7)(ii) of Rule 2-01 of Regulation S-X during the fiscal years indicated above.
(e) (1) Audit Committee Pre-Approval Policies and Procedures:
The registrant’s Audit Committee (“audit committee”) has adopted an “Audit Committee Charter (Amended and Restated as of May 12, 2004 — with revisions through July 2008)” (the “charter”). The charter contains the audit committee’s pre-approval policies and procedures. Reproduced below is an excerpt from the charter regarding pre-approval policies and procedures:
The [audit] Committee shall:
…
2. Pre-approve (a) all audit and permissible non-audit services(1) to be provided to the Fund and (b) all permissible non-audit services to be provided by the Fund’s independent auditors to UBS Global [Asset Management (Americas) Inc. (“UBS Global AM”)] and any Covered Service Providers, if the engagement relates directly to the operations and financial reporting of the Fund. In carrying out this responsibility, the Committee shall seek periodically from UBS Global [AM] and from the independent auditors a list of such audit and permissible non-audit services that can be expected to be rendered to the Fund, UBS Global [AM] or any Covered Service Providers by the Fund’s independent auditors, and an estimate of the fees sought to be paid in connection with such services. The Committee may delegate its responsibility to pre-approve any such audit and permissible non-audit services to a sub-committee consisting of the Chairperson of the Committee
and two other members of the Committee as the Chairperson, from time to time, may determine and appoint, and such sub-committee shall report to the Committee, at its next regularly scheduled meeting after the sub-committee’s meeting, its decision(s). From year to year, the Committee shall report to the Board whether this system of pre-approval has been effective and efficient or whether this Charter should be amended to allow for pre-approval pursuant to such policies and procedures as the Committee shall approve, including the delegation of some or all of the Committee’s pre-approval responsibilities to other persons (other than UBS Global [AM] or the Fund’s officers).
(1) The Committee will not approve non-audit services that the Committee believes may taint the independence of the auditors. Currently, permissible non-audit services include any professional services (including tax services) that are not prohibited services as described below, provided to the Fund by the independent auditors, other than those provided to the Fund in connection with an audit or a review of the financial statements of the Fund. Permissible non-audit services may not include: (i) bookkeeping or other services related to the accounting records or financial statements of the Fund; (ii) financial information systems design and implementation; (iii) appraisal or valuation services, fairness opinions or contribution-in-kind reports; (iv) actuarial services; (v) internal audit outsourcing services; (vi) management functions or human resources; (vii) broker or dealer, investment adviser or investment banking services; (viii) legal services and expert services unrelated to the audit; and (ix) any other service the Public Company Accounting Oversight Board determines, by regulation, is impermissible.
Pre-approval by the Committee of any permissible non-audit services is not required so long as: (i) the aggregate amount of all such permissible non-audit services provided to the Fund, UBS Global [AM] and any service providers controlling, controlled by or under common control with UBS Global [AM] that provide ongoing services to the Fund (“Covered Service Providers”) constitutes not more than 5% of the total amount of revenues paid to the independent auditors (during the fiscal year in which the permissible non-audit services are provided) by (a) the Fund, (b) its investment adviser and (c) any entity controlling, controlled by, or under common control with the investment adviser that provides ongoing services to the Fund during the fiscal year in which the services are provided that would have to be approved by the Committee; (ii) the permissible non-audit services were not recognized by the Fund at the time of the engagement to be non-audit services; and (iii) such services are promptly brought to the attention of the Committee and approved by the Committee (or its delegate(s)) prior to the completion of the audit.
(e) (2) Services approved pursuant to paragraph (c)(7)(i)(C) of Rule 2-01 of Regulation S-X:
Audit-Related Fees:
There were no amounts that were approved by the audit committee pursuant to the de minimis exception for the fiscal years ended July 31, 2015 and July 31, 2014 on behalf of the registrant.
There were no amounts that were required to be approved by the audit committee pursuant to the de minimis exception for the fiscal years ended July 31, 2015 and July 31, 2014 on behalf of the registrant’s service providers that relate directly to the operations and financial reporting of the registrant.
Tax Fees:
There were no amounts that were approved by the audit committee pursuant to the de minimis exception for the fiscal years ended July 31, 2015 and July 31, 2014 on behalf of the registrant.
There were no amounts that were required to be approved by the audit committee pursuant to the de minimis exception for the fiscal years ended July 31, 2015 and July 31, 2014 on behalf of the registrant’s service providers that relate directly to the operations and financial reporting of the registrant.
All Other Fees:
There were no amounts that were approved by the audit committee pursuant to the de minimis exception for the fiscal years ended July 31, 2015 and July 31, 2014 on behalf of the registrant.
There were no amounts that were required to be approved by the audit committee pursuant to the de minimis exception for the fiscal years ended July 31, 2015 and July 31, 2014 on behalf of the registrant’s service providers that relate directly to the operations and financial reporting of the registrant.
(f) According to EY, for the fiscal year ended July 31, 2015, the percentage of hours spent on the audit of the registrant’s financial statements for the most recent fiscal year that were attributed to work performed by persons who are not full-time, permanent employees of EY was 0%.
(g) For the fiscal years ended July 31, 2015 and July 31, 2014, the aggregate fees billed by EY of $590,690 and $557,667, respectively, for non-audit services rendered on behalf of the registrant (“covered”), its investment adviser (not including any sub-adviser whose role is primarily portfolio management and is subcontracted with or overseen by another investment adviser) and any entity controlling, controlled by, or under common control with the adviser (“non-covered”) that provides ongoing services to the registrant for each of the last two fiscal years of the registrant is shown in the table below:
| | 2015 | | 2014 | |
Covered Services | | $ | 402,963 | | $ | 379,327 | |
Non-Covered Services | | 187,727 | | 178,340 | |
| | | | | | | |
(h) The registrant’s audit committee was required to consider whether the provision of non-audit services that were rendered to the registrant’s investment adviser (not including any sub-adviser whose role is primarily portfolio management and is subcontracted with or
overseen by another investment adviser), and any entity controlling, controlled by, or under common control with the investment adviser that provides ongoing services to the registrant that were not pre-approved pursuant to paragraph (c)(7)(ii) of Rule 2-01 of Regulation S-X is compatible with maintaining the principal accountant’s independence.
Item 5. Audit Committee of Listed Registrants.
Not applicable to the registrant.
Item 6. Investments.
(a) Included as part of the report to shareholders filed under Item 1 of this form.
(b) Not applicable.
Item 7. Disclosure of Proxy Voting Policies and Procedures for Closed-End Management Investment Companies.
Not applicable to the registrant.
Item 8. Portfolio Managers of Closed-End Management Investment Companies.
Not applicable to the registrant.
Item 9. Purchases of Equity Securities by Closed-End Management Investment Company and Affiliated Purchasers.
Not applicable to the registrant.
Item 10. Submission of Matters to a Vote of Security Holders.
The registrant’s Board has established a Nominating and Corporate Governance Committee. The Nominating and Corporate Governance Committee will consider nominees recommended by shareholders if a vacancy occurs among those board members who are not “interested persons” as defined in Section 2(a)(19) of the Investment Company Act of 1940, as amended. In order to recommend a nominee, a shareholder should send a letter to the chairperson of the Nominating and Corporate Governance Committee, Richard R. Burt, care of the Secretary of the registrant at UBS Global Asset Management, UBS Building, One North Wacker Drive, Chicago, IL 60606, Attn: Mark Kemper, Secretary, and indicate on the envelope “Nominating and Corporate Governance Committee.” The shareholder’s letter should state the nominee’s name and should include the nominee’s resume or curriculum vitae, and must be accompanied by a written consent of the individual to stand for election if nominated for the Board and to serve if elected by shareholders.
Item 11. Controls and Procedures.
(a) The registrant’s principal executive officer and principal financial officer have concluded that the registrant’s disclosure controls and procedures (as defined in Rule 30a-3(c) under the Investment Company Act of 1940, as amended) are effective based on their evaluation of these controls and procedures as of a date within 90 days of the filing date of this document.
(b) The registrant’s principal executive officer and principal financial officer are aware of no changes in the registrant’s internal control over financial reporting that occurred during the second fiscal quarter of the period covered by this report that has materially affected, or is reasonably likely to materially affect, the registrant’s internal control over financial reporting.
Item 12. Exhibits.
(a) (1) Code of Ethics as required pursuant to Section 406 of the Sarbanes-Oxley Act of 2002 (and designated by registrant as a “Code of Conduct”) is filed herewith as Exhibit EX-99.CODE ETH.
(a) (2) Certifications of principal executive officer and principal financial officer pursuant to Section 302 of the Sarbanes-Oxley Act of 2002 are attached hereto as Exhibit EX-99.CERT.
(a) (3) Written solicitation to purchase securities under Rule 23c-1 under the Investment Company Act of 1940 sent or given during the period covered by the report by or on behalf of the registrant to 10 or more persons — not applicable to the registrant.
(b) Certifications of principal executive officer and principal financial officer pursuant to Section 906 of the Sarbanes-Oxley Act of 2002 are attached hereto as Exhibit EX-99.906CERT.
(c) Disclosure pursuant to Section 13(r) of the Securities Exchange Act of 1934, as amended, is attached hereto as Exhibit EX-99.IRANNOTICE.
SIGNATURES
Pursuant to the requirements of the Securities Exchange Act of 1934 and the Investment Company Act of 1940, the registrant has duly caused this report to be signed on its behalf by the undersigned, thereunto duly authorized.
PACE Select Advisors Trust | |
| |
By: | /s/ Mark E. Carver | |
| Mark E. Carver | |
| President | |
| |
Date: | October 9, 2015 | |
Pursuant to the requirements of the Securities Exchange Act of 1934 and the Investment Company Act of 1940, this report has been signed below by the following persons on behalf of the registrant and in the capacities and on the dates indicated.
By: | /s/ Mark E. Carver | |
| Mark E. Carver | |
| President | |
| |
Date: | October 9, 2015 | |
| |
By: | /s/ Thomas Disbrow | |
| Thomas Disbrow | |
| Vice President and Treasurer | |
| |
Date: | October 9, 2015 | |